1. Introduction
Glazed façades represent a critical component in the energy performance of buildings, as their technological configuration directly determines both thermal behavior and indoor environmental quality [
1]. Scientific evidence shows that the use of conventional or inefficient glazing substantially increases cooling and heating loads, leading to higher electricity consumption and, consequently, greater operating costs [
2,
3].
In contrast, the implementation of high-performance glazed envelopes has demonstrated a transformative potential for energy efficiency, achieving reductions of up to 64% in CO
2 emissions and 35% in operating costs [
4]. This impact is explained by the integration of advanced technologies such as low-emissivity (Low-E) coatings, solar-control systems, and hermetically sealed cavities filled with inert gases, along with highly innovative emerging materials. Among these, aerogel stands out due to its extremely low thermal conductivity, making it a highly efficient insulator, while phase-change materials (PCM) are capable of passively storing and releasing heat, thereby increasing the building’s thermal inertia and moderating indoor temperature fluctuations [
5].
Incorporating these solutions into the architectural envelope not only reduces infrared transmission and the associated heating and cooling demand but also strengthens long-term energy resilience and contributes to CO
2 emissions mitigation [
6].
The adoption of high-performance glazing is therefore essential for advancing sustainable buildings. These systems efficiently regulate the entry of heat, light, and ventilation, resulting in lower energy consumption, greater indoor comfort [
7], and reduced operating costs. At the same time, they decrease carbon emissions, which means that their integration into public buildings would generate comprehensive benefits across environmental, economic, and institutional dimensions.
Although high-performance glazing requires a considerable initial investment, scientific evidence shows that it is a cost-effective alternative in contemporary construction [
8,
9]. This is because return-on-investment (ROI) periods are generally favorable when assessed over the life cycle of buildings. In other words, when considered within a multi-decade horizon, the energy savings achieved offset the initial cost [
10,
11].
In European countries, ROI for these technologies is estimated between 18 and 25 years, which was estimated between a 3–5-year payback period [
12]. These payback periods are financially reasonable and particularly attractive in contexts where energy is expensive and environmental regulations are strict [
13,
14,
15]. In such contexts, technical efficiency translates not only into lower Heating Ventilation and Air Conditioning (HVAC) expenditures but also into sustained economic benefits, which has motivated the development of policies and incentives that promote large-scale adoption [
16].
However, this evidence cannot be automatically extrapolated to contexts where electricity tariffs are subsidized. This situation, common in Africa, Asia, and Latin America, derives from public policies aimed at ensuring universal access, maintaining economic competitiveness, and mitigating social inequalities. While these measures are often presented as mechanisms of inclusion, they generate a significant fiscal burden and, by artificially lowering energy prices, distort actual cost signals. Consequently, the incentive to invest in energy efficiency is diminished [
17].
Ecuador offers a particularly illustrative case: the average electricity price is only USD 0.10/kWh, well below neighboring countries such as Colombia (USD 0.18/kWh), Peru (USD 0.21/kWh), and Brazil (USD 0.23/kWh). The gap is even more pronounced compared to Europe, where tariffs reach USD 0.40/kWh in Germany [
18,
19].
This tariff gradient suggests that while European markets more transparently reflect generation and distribution costs, in much of Latin America the prevalence of subsidies may pose additional challenges to the adoption of sustainable measures. By artificially easing the economic pressure of energy consumption, these policies likely reduce the perceived urgency of improving efficiency and, as a result, may become a structural obstacle to advancing sustainable construction [
20,
21].
In this scenario, ROI periods for high-performance glazing are likely to be significantly extended, reducing the economic motivation for their adoption and delaying their incorporation into construction practice, even when their technical and environmental benefits are evident [
22,
23].
This tension between subsidized energy costs and envelope performance directly affects economic incentives, potentially slowing the widespread adoption of efficient technologies while at the same time exacerbating inequalities between those who can afford advanced solutions and those who are structurally dependent on subsidies [
24]. This raises a central question: to what extent can energy subsidy policies condition the ROI of high-performance glazed envelopes? This remains an underexplored issue in the specialized literature of such contexts [
25].
In this context, it is essential to examine concrete cases that reveal how economic frameworks interact with architectural design decisions, particularly in developing cities where investment incentives are distorted. This study analyzes the Plataforma Gubernamental Norte in Quito (Ecuador) through the evaluation of three envelope scenarios, comparing ROI according to the type of glazing employed [
26]. The analysis integrates thermal and daylighting performance variables, allowing each scenario to be contrasted with its ROI in order to assess the relationship between technical performance and profitability. Innovatively, the study also incorporates the specific climatic conditions of Andean economy, where the combination of altitude and latitude generates unique challenges for building energy efficiency [
27].
This research contributes to narrowing the gap between proven technical performance and perceived economic profitability, providing evidence to support public policy and energy efficiency strategies [
28,
29,
30]. The central contribution of this study lies in demonstrating that the main barrier to innovation is not technical, but political and economic.
2. Materials and Methods
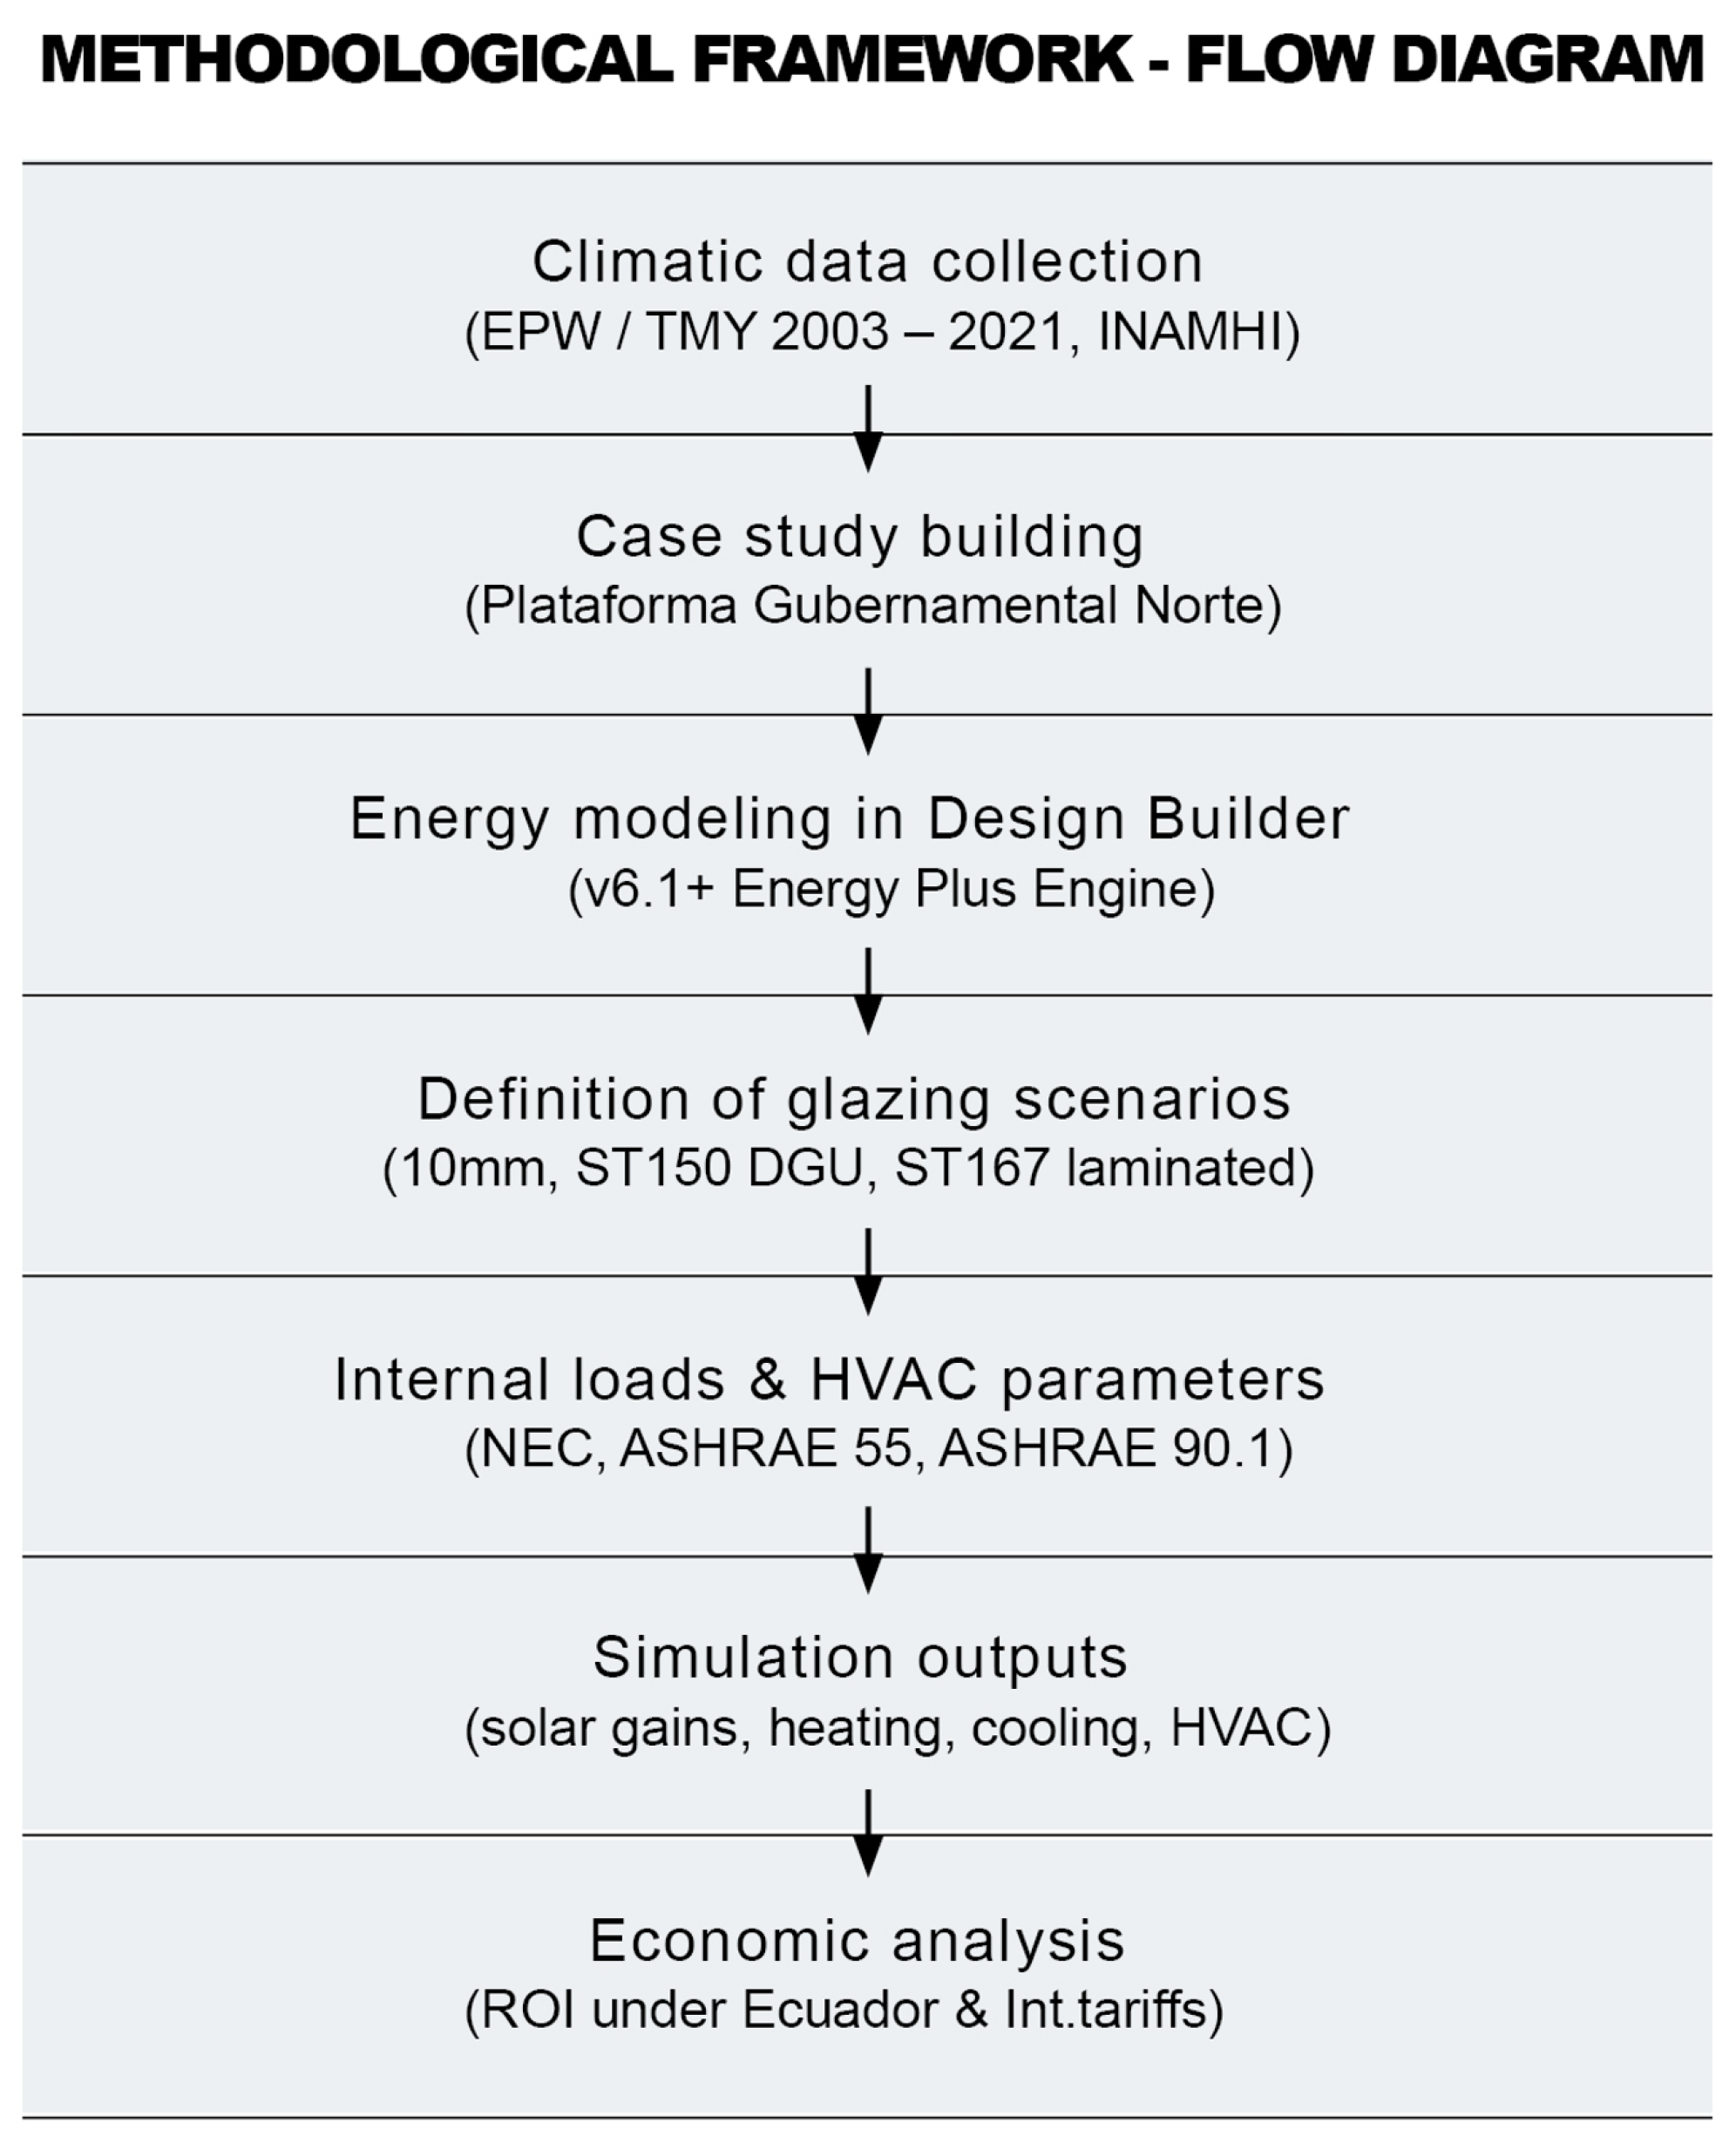
The methodology employed in this study integrates dynamic energy simulations with a comparative economic analysis, following a quantitative approach that enables the simultaneous evaluation of both thermal performance and financial feasibility of different glazing configurations. The methodological process was structured into five main phases: (i) collection and characterization of climatic data, (ii) selection and modeling of the case study building, (iii) definition of glazing scenarios, (iv) execution of energy simulations incorporating internal loads and operational parameters, and (v) economic evaluation of the obtained results.
Figure 1 graphically summarizes the methodological sequence and the interrelation among the components of the research.
2.1. Case Study, Thermal Zoning and Input Data
Location: The city of Quito, located in Ecuador at an altitude of approximately 2812.00 m above sea level, features a high-altitude temperate climate. According to the Köppen classification, it corresponds to the Cfb category (temperate oceanic climate). It is characterized by moderate daily thermal oscillations that reduce dependency on mechanical HVAC systems [
31]. The average annual temperature is approximately 13.9 °C, with maximum temperatures reaching around 21.2 °C and minimums dropping to about 8.7 °C. Relative humidity averages 81.05%. The city experiences a distinct seasonal pattern: a dry season (April to September) and a rainy season (October to March), though seasonal thermal variation remains modest. These climatic conditions, combined with the high solar radiation typical of equatorial latitudes, define the environmental context to which the building must respond [
32,
33].
For the simulations, an EPW (EnergyPlus Weather) file corresponding to the Inaquito weather station was used. This file, provided by Ecuador’s National Institute of Meteorology and Hydrology (INAMHI), represents a Typical Meteorological Year (TMY), based on hourly data collected between 2003 and 2021. It includes records of temperature, humidity, solar radiation, wind speed, and precipitation. This data ensures the model reflects long-term averages while minimizing the influence of outliers.
Due to Quito’s near-equatorial location, solar angles remain high year-round with minimal seasonal variation, resulting in consistent solar exposure on all building façades [
34]. During equinoxes,
Figure 2, the sun strikes east and west façades almost perpendicularly, while in solstices, solar incidence shifts northward in June mornings and southward in December afternoons. This pattern leads to high direct solar gains,
Figure 3, particularly on the east and west façades, which receive over 730.00 kWh/m
2 annually, with peaks up to 400.00 kWh/m
2. UV indices frequently exceed extreme thresholds, with up to 76% of days per month registering values above 11 [
35]. This continuous and intense solar exposure imposes significant thermal loads on buildings. Solar gain analysis emphasizes the need for high-performance glazing with low Solar Heat Gain Coefficients (SHGC) and low U-values. Implementing passive design strategies is essential to reduce heat gains and improve energy efficiency in Quito’s climatic context.
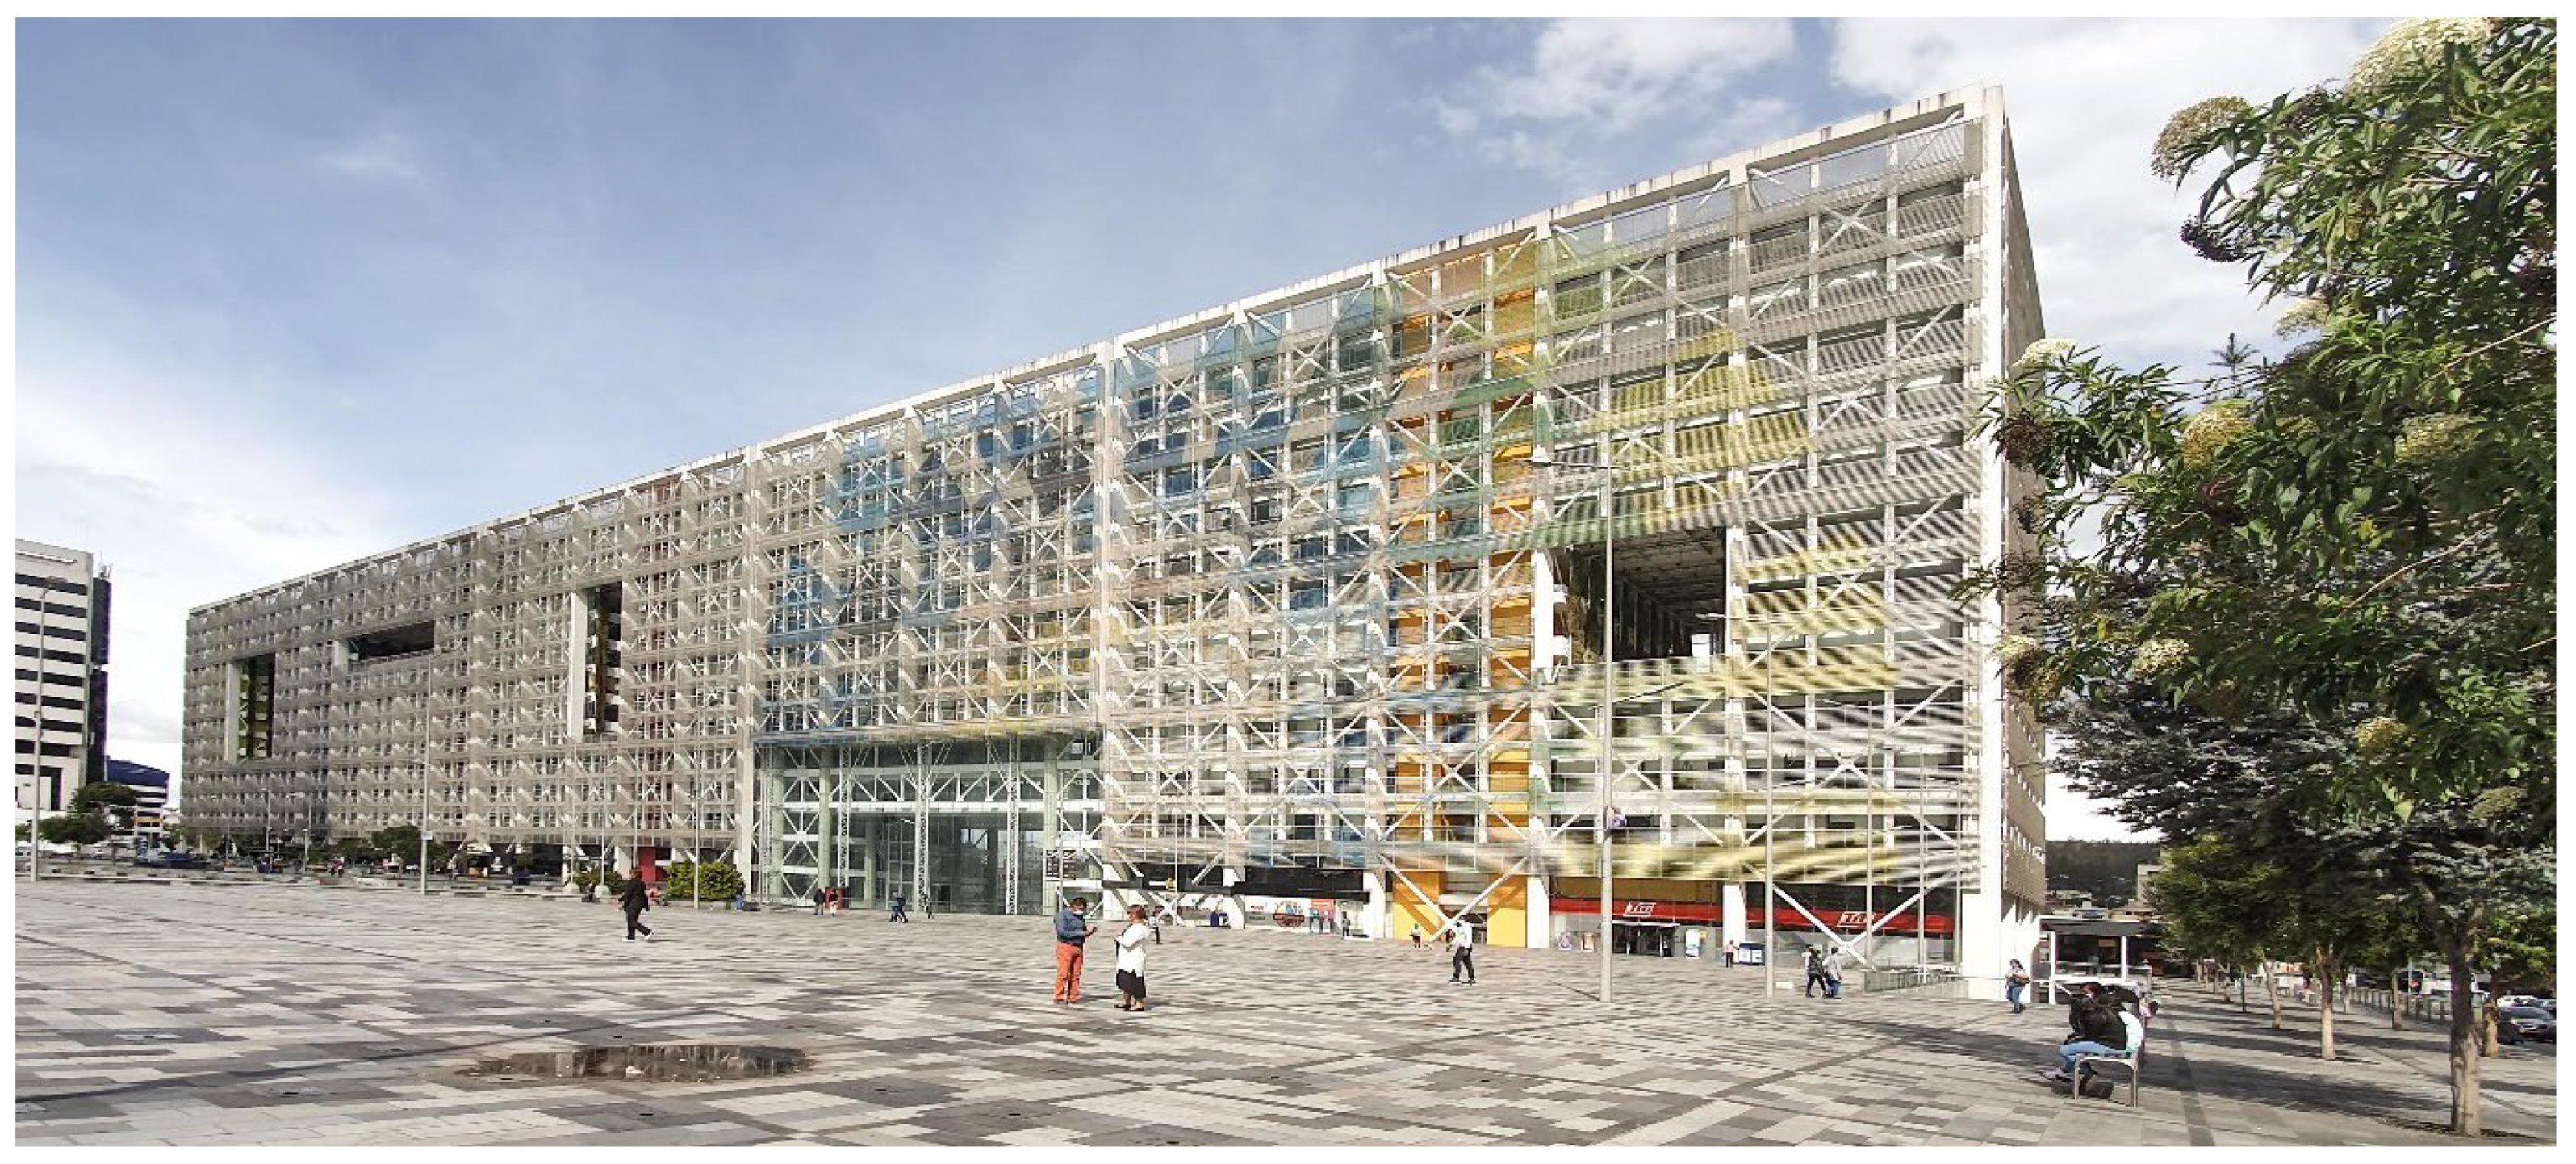
Case Study Building. The Plataforma Gubernamental Norte (
Figure 4), inaugurated in 2017, is the largest institutional building in Ecuador and a landmark of public architecture in Quito. Designed as a 14-story rectangular prism, it accommodates administrative offices and public service areas and has the following characteristics summarized in
Table 1.
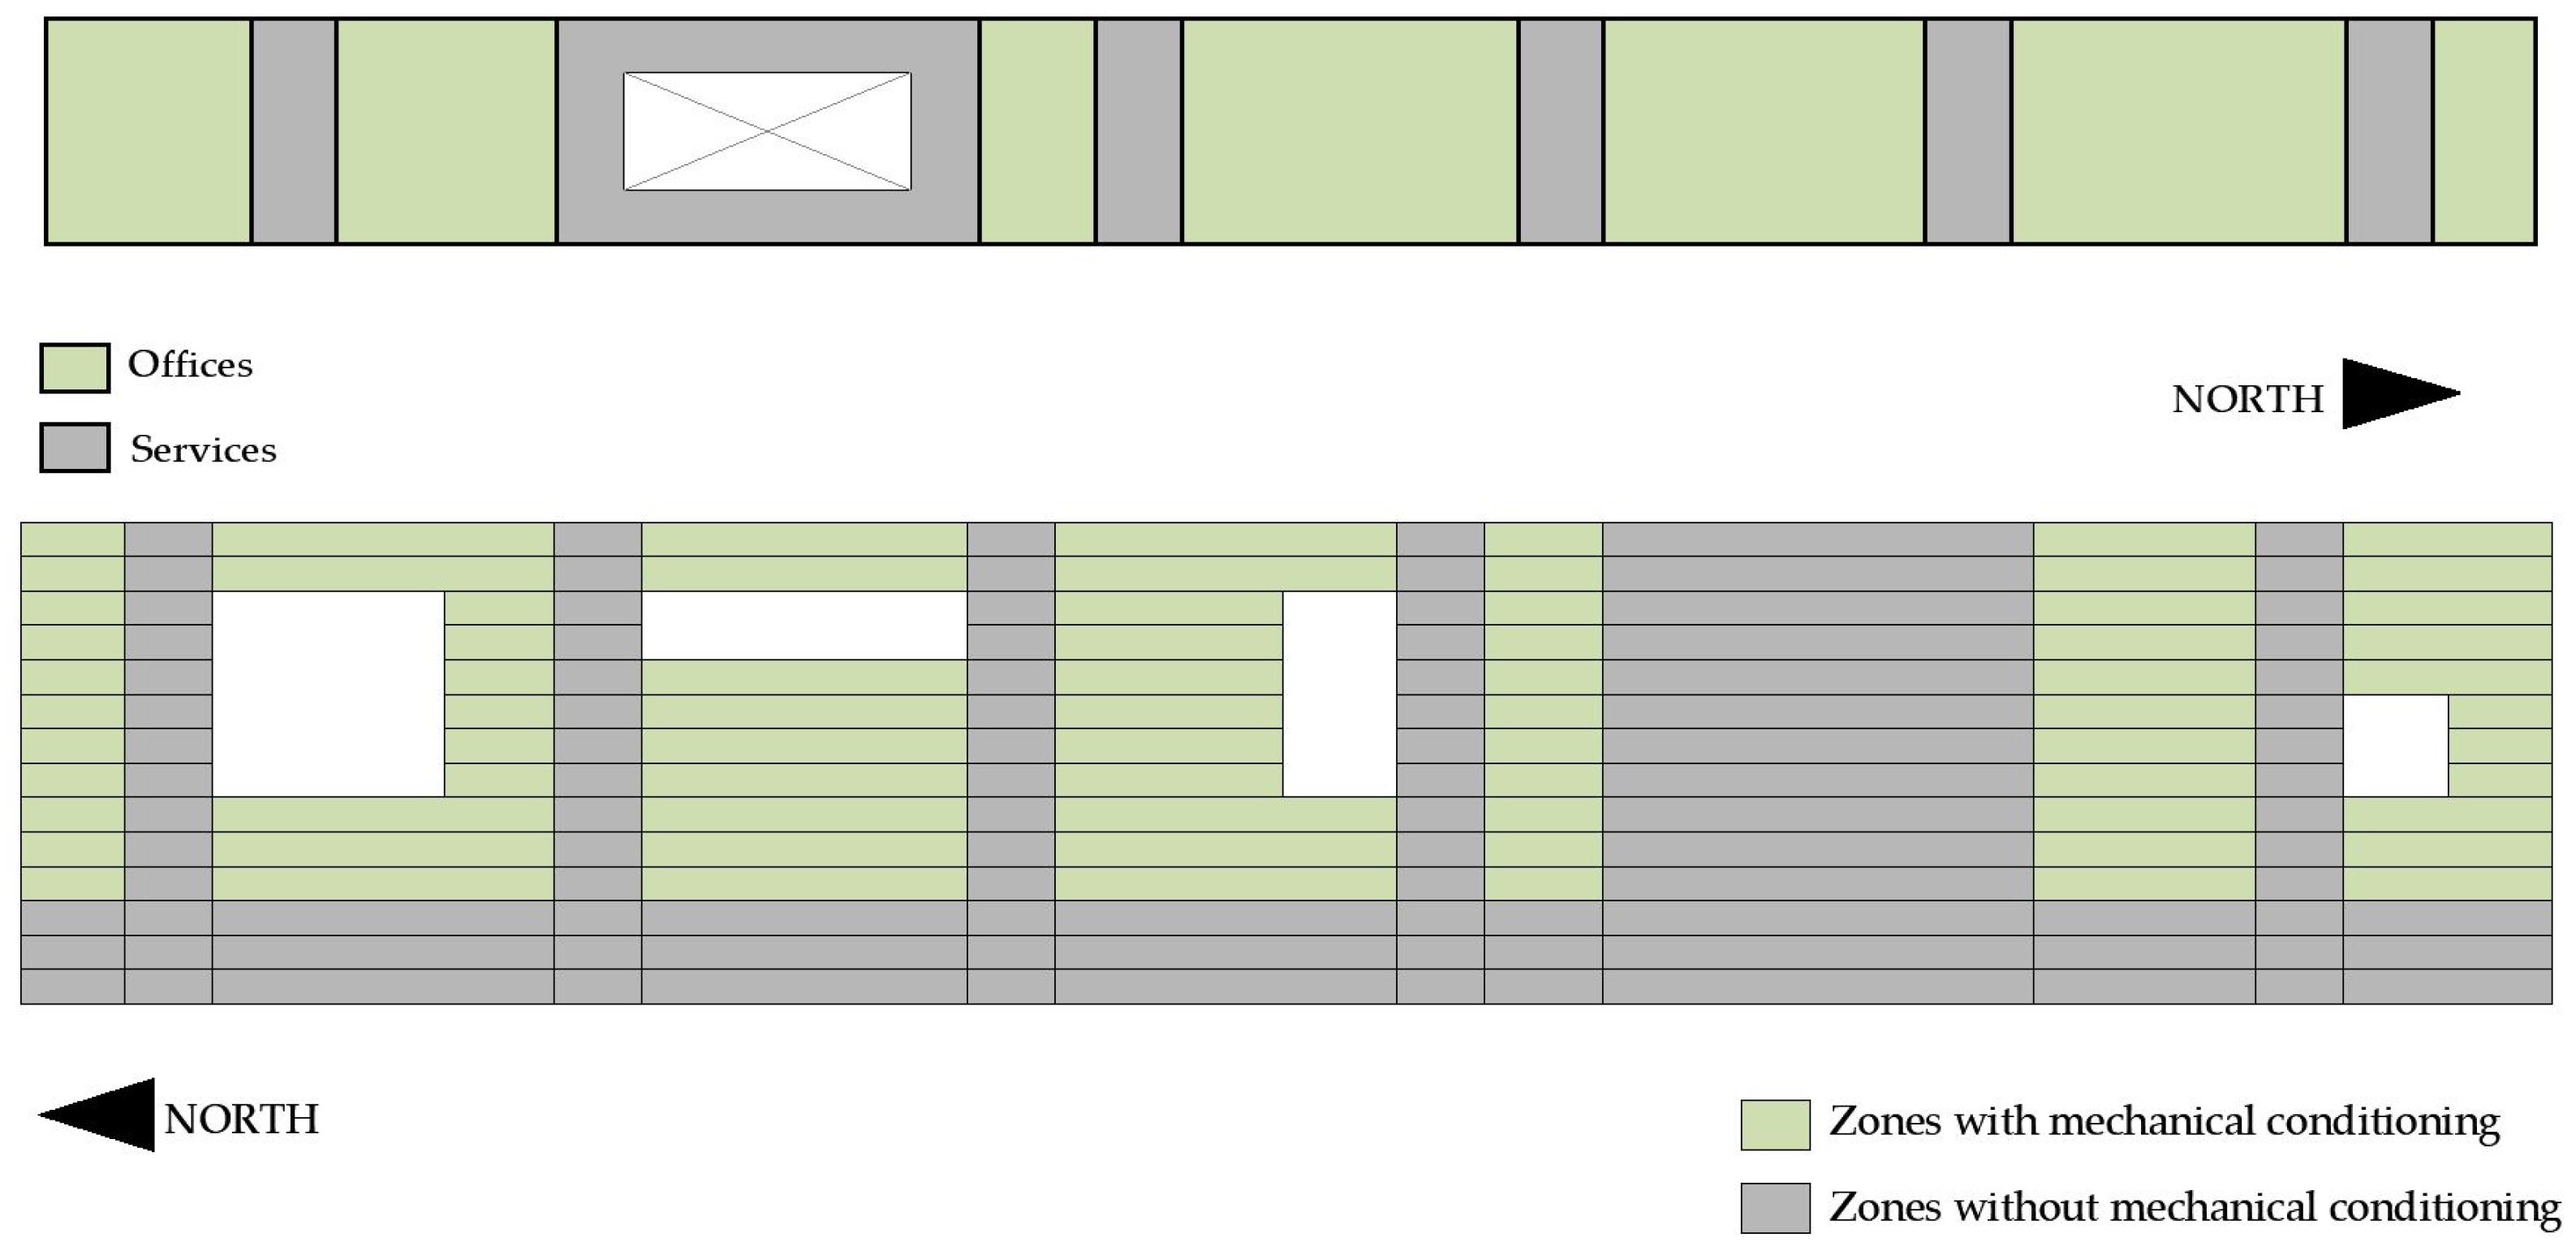
Thermal Zoning. As part of the modeling process, the internal distribution of the building was reproduced, distinguishing between conditioned and unconditioned zones. As shown in
Figure 5, two main areas were defined:
Office Zone: Accounting for 65.8% of each floor (~5413.8 m2), this includes open workspaces, executive offices, meeting rooms, and public service areas. These spaces were modeled as thermally conditioned, reflecting the actual presence of a mechanical VRF system.
Service Zone: Representing the remaining 34.2% (~2818.2 m2 per floor), this comprises circulation areas, restrooms, archives, and technical rooms. Since these spaces are not mechanically conditioned in practice, they were modeled as unconditioned zones.
Figure 5.
Schematical Floor Plan and Section displaying the division between areas with HVAC systems and without it of the actual building. Source: Author’s elaboration in AutoCAD 2023.
Figure 5.
Schematical Floor Plan and Section displaying the division between areas with HVAC systems and without it of the actual building. Source: Author’s elaboration in AutoCAD 2023.
Of the total built area of 108,857.85 m2, 59,551.80 m2 (54.7%) are conditioned and 49,306.05 m2 (45.3%) remain unconditioned. This zoning strategy enabled a more accurate representation of actual energy demand and was incorporated in DesignBuilder version 6.1 to replicate real usage conditions and thermal loads, thereby ensuring a more reliable simulation of the building’s energy performance. The analysis concentrated on conditioned spaces, as they account for the largest share of HVAC-related energy consumption.
2.2. Simulation Tool and Modeling Framework
For the development of the energy model, DesignBuilder v6.1 was used with the EnergyPlus simulation engine. A three-dimensional model of the building was created, into which envelope properties, mechanical systems, internal loads, and climatic data were incorporated to simulate hourly thermal behavior over a typical year, as noted in previous studies [
36]. This predictive tool makes it possible to quantify energy demands and evaluate the sensitivity of construction parameters to different façade design configurations, following methodologies applied in recent research.
Based on design information and technical datasheets, thermal and optical properties were assigned to walls, roofs, and glazing. Occupancy patterns, internal loads, and HVAC systems were also incorporated into the model in accordance with the conditions described in
Section 2.1 and local regulatory requirements. Office-use templates were applied, with key parameters adjusted to align with the Ecuadorian Building Code (NEC) and equivalent international standards of American Society of Heating, Refrigerating and Air-Conditioning Engineers (ASHRAE 90.1, 55) and International Association for Standarization (ISO) to reflect the local context.
Table 2 and
Table 3 summarize the main thermal and optical properties of the glazing used in the model, along with the parameters adopted for the simulations.
2.3. Glazing Scenarios
To assess the variability of the thermal and luminous performance of the building envelope according to the glazing type, three alternatives were proposed in compliance with the Ecuadorian Building Code NEC-HH Glazing and international standards EN 410 for optical properties and EN 673 for thermal properties. The selection considered both Quito’s climatic conditions, characterized by intense daytime solar radiation and cool nighttime temperatures, with typical oscillations between 6 °C and 27 °C, and the glazing types currently available in the local market.
Alternative selection. Based on these criteria, three representative glazing options shown in
Table 3 were defined according to their thermal–optical properties, local availability, and initial economic feasibility:
10 mm clear monolithic glass (as installed in the building).
Double-glazed unit (DGU) Cool Lite ST 150, composed of two 6 mm panes, a 12 mm air gap, and a selective solar control coating.
Laminated glass Cool Lite ST 167, 8.76 mm thick (two 4 mm panes with a 0.76 mm solar-control interlayer).
These configurations cover a spectrum ranging from a conventional solution (clear monolithic glass without solar control) to higher-performance options available in the local market (selective coatings and double glazing). More complex systems—such as triple glazing with inert gas, next-generation low-E coatings with ultra-low U-values, or active technologies like electrochromic glazing—were deliberately excluded due to their high cost in Ecuador and the limited need for extreme thermal insulation in Quito’s moderate climate. The selection therefore aimed to balance improved façade thermal performance with practical and economic feasibility for similar contexts [
10,
23,
37].
Table 3.
Properties of the Simulated Glazing Options.
Table 3.
Properties of the Simulated Glazing Options.
| Option | Glass Type | Dimensions | TVIS (Visible Transmittance) | SHGC
(Solar Heat Gain Coefficient) | U-Value (W/m2·K) (Thermal Transmittance) |
|---|
| Original | Clear monolithic glass | 10 mm | 0.88 | 0.82 | 5.60 |
| Alternative 1 | Double Glazing Unit (DGU)
Saint-Gobain Cool Lite ST 150 with Solar Control Coating | 24 mm
(6 mm glass + 12 mm air gap + 6 mm coated glass) | 0.45 | 0.45 | 2.80 |
| Alternative 2 | Laminated Glass
Saint-Gobain Cool Lite ST 167 with
Solar Control Coating | 8.76 mm
(4 mm + 0.76 mm interlayer + 4 mm) | 0.70 | 0.65 | 5.50 |
The thermal and optical properties used in the model for each glazing type were obtained from certified technical datasheets provided by a national manufacturer (Cedal) and an international supplier (Saint-Gobain), both meeting ISO quality standards.
Table 3 summarizes the main parameters of visible transmittance (Tvis), solar heat gain coefficient (SHGC), and thermal transmittance (U-value) for the three simulated glazing systems.
Figure 6 illustrates schematic cross-sections of the three façade scenarios modeled in DesignBuilder: the original façade with clear monolithic glass, Alternative 1 with a double-glazing unit, and Alternative 2 with laminated solar-control glass. These diagrams compare the glazing systems and served as the geometric basis for the thermal and energy simulations.
2.4. Variables Analyzed
The variables considered to evaluate the performance of each glazing scenario focused on solar heat transmission and energy consumption for climate control, as these are the aspects most affected by changes in glass properties. Based on annual hourly simulations, results were obtained regarding solar gains through façades (monthly and annual), heating and cooling energy demands required to maintain indoor conditions within the setpoints, and the total annual HVAC energy consumption (sum of heating and cooling) for the building.
These indicators allow for quantifying the impact of each glass type on both passive thermal balance (solar gains entering the building) and active energy performance (electricity consumed by climate control systems to offset these loads and maintain comfort). All results were calculated under consistent operating conditions: an indoor temperature of 18 °C for heating mode and 26 °C for cooling mode, maintained in conditioned zones during occupied hours. This temperature range was adopted as the thermal comfort criterion, in accordance with Ecuadorian regulations NEC for office buildings and international comfort standards ASHRAE 55.
Additionally, a parametric sensitivity analysis was conducted to understand the relative influence of glazing properties. This analysis examined which of the fundamental glazing parameters—solar heat gain coefficient (SHGC), U-value, or visible transmittance (Tvis)—has the greatest impact on the building’s energy demand. These parameters were systematically varied within typical ranges (while keeping the others constant), and the resulting changes in HVAC energy consumption were observed to identify the most critical factor. Overall, this exercise helped determine which glass property plays the most significant role in Quito’s climatic context, complementing the direct comparison between scenarios.
2.5. Cost Analysis and Return on Investment (ROI)
This economic analysis focused on calculating the Return on Investment (ROI), expressed as the ratio between the additional investment required for each alternative and the annual energy savings, based on the following formula:
First, the annual HVAC energy consumption obtained from the simulations (in kWh/year) was converted into operating cost using the average electricity rate currently in effect in Ecuador, approximately USD 0.10 per kWh (regulated commercial/institutional tariff, with a state subsidy). This value, provided by the local utility company, is considered representative and remains virtually constant within the consumption range of the studied building (Plataforma), which simplifies the analysis.
Energy savings were calculated by comparing each alternative scenario with the baseline, both in terms of energy use and cost. The additional investment required for each glazing option included supply and installation costs over the façade area. Dividing this incremental cost by the annual economic savings provided the ROI or simple payback period for each option, allowing for a straightforward comparison of financial viability.
Given Ecuador’s low electricity rates, relatively long payback periods were expected. To assess the sensitivity of the ROI to electricity prices, the analysis was replicated using higher tariffs found in other countries. These included three Latin American nations—Colombia, Peru, and Brazil—with average rates between USD 0.18 and 0.23/kWh, and Germany as a high-cost reference case (~USD 0.40/kWh). These comparisons provided insight into how energy pricing affects the financial attractiveness of efficient glazing solutions in different regional and global contexts.
3. Results
The following section results obtained from the thermal and energy simulations applied to the different glazing alternatives. Building on the data, parameters, and inputs detailed in the previous methodology chapter, this section integrates the analysis of environmental and comfort variables with energy consumption indicators and economic evaluation, providing a clear understanding of how each glazing system influences the building’s thermal performance, energy efficiency, and the feasibility of its implementation within a sustainable architectural approach.
3.1. Zone Operative Temperature During Summer and Winter
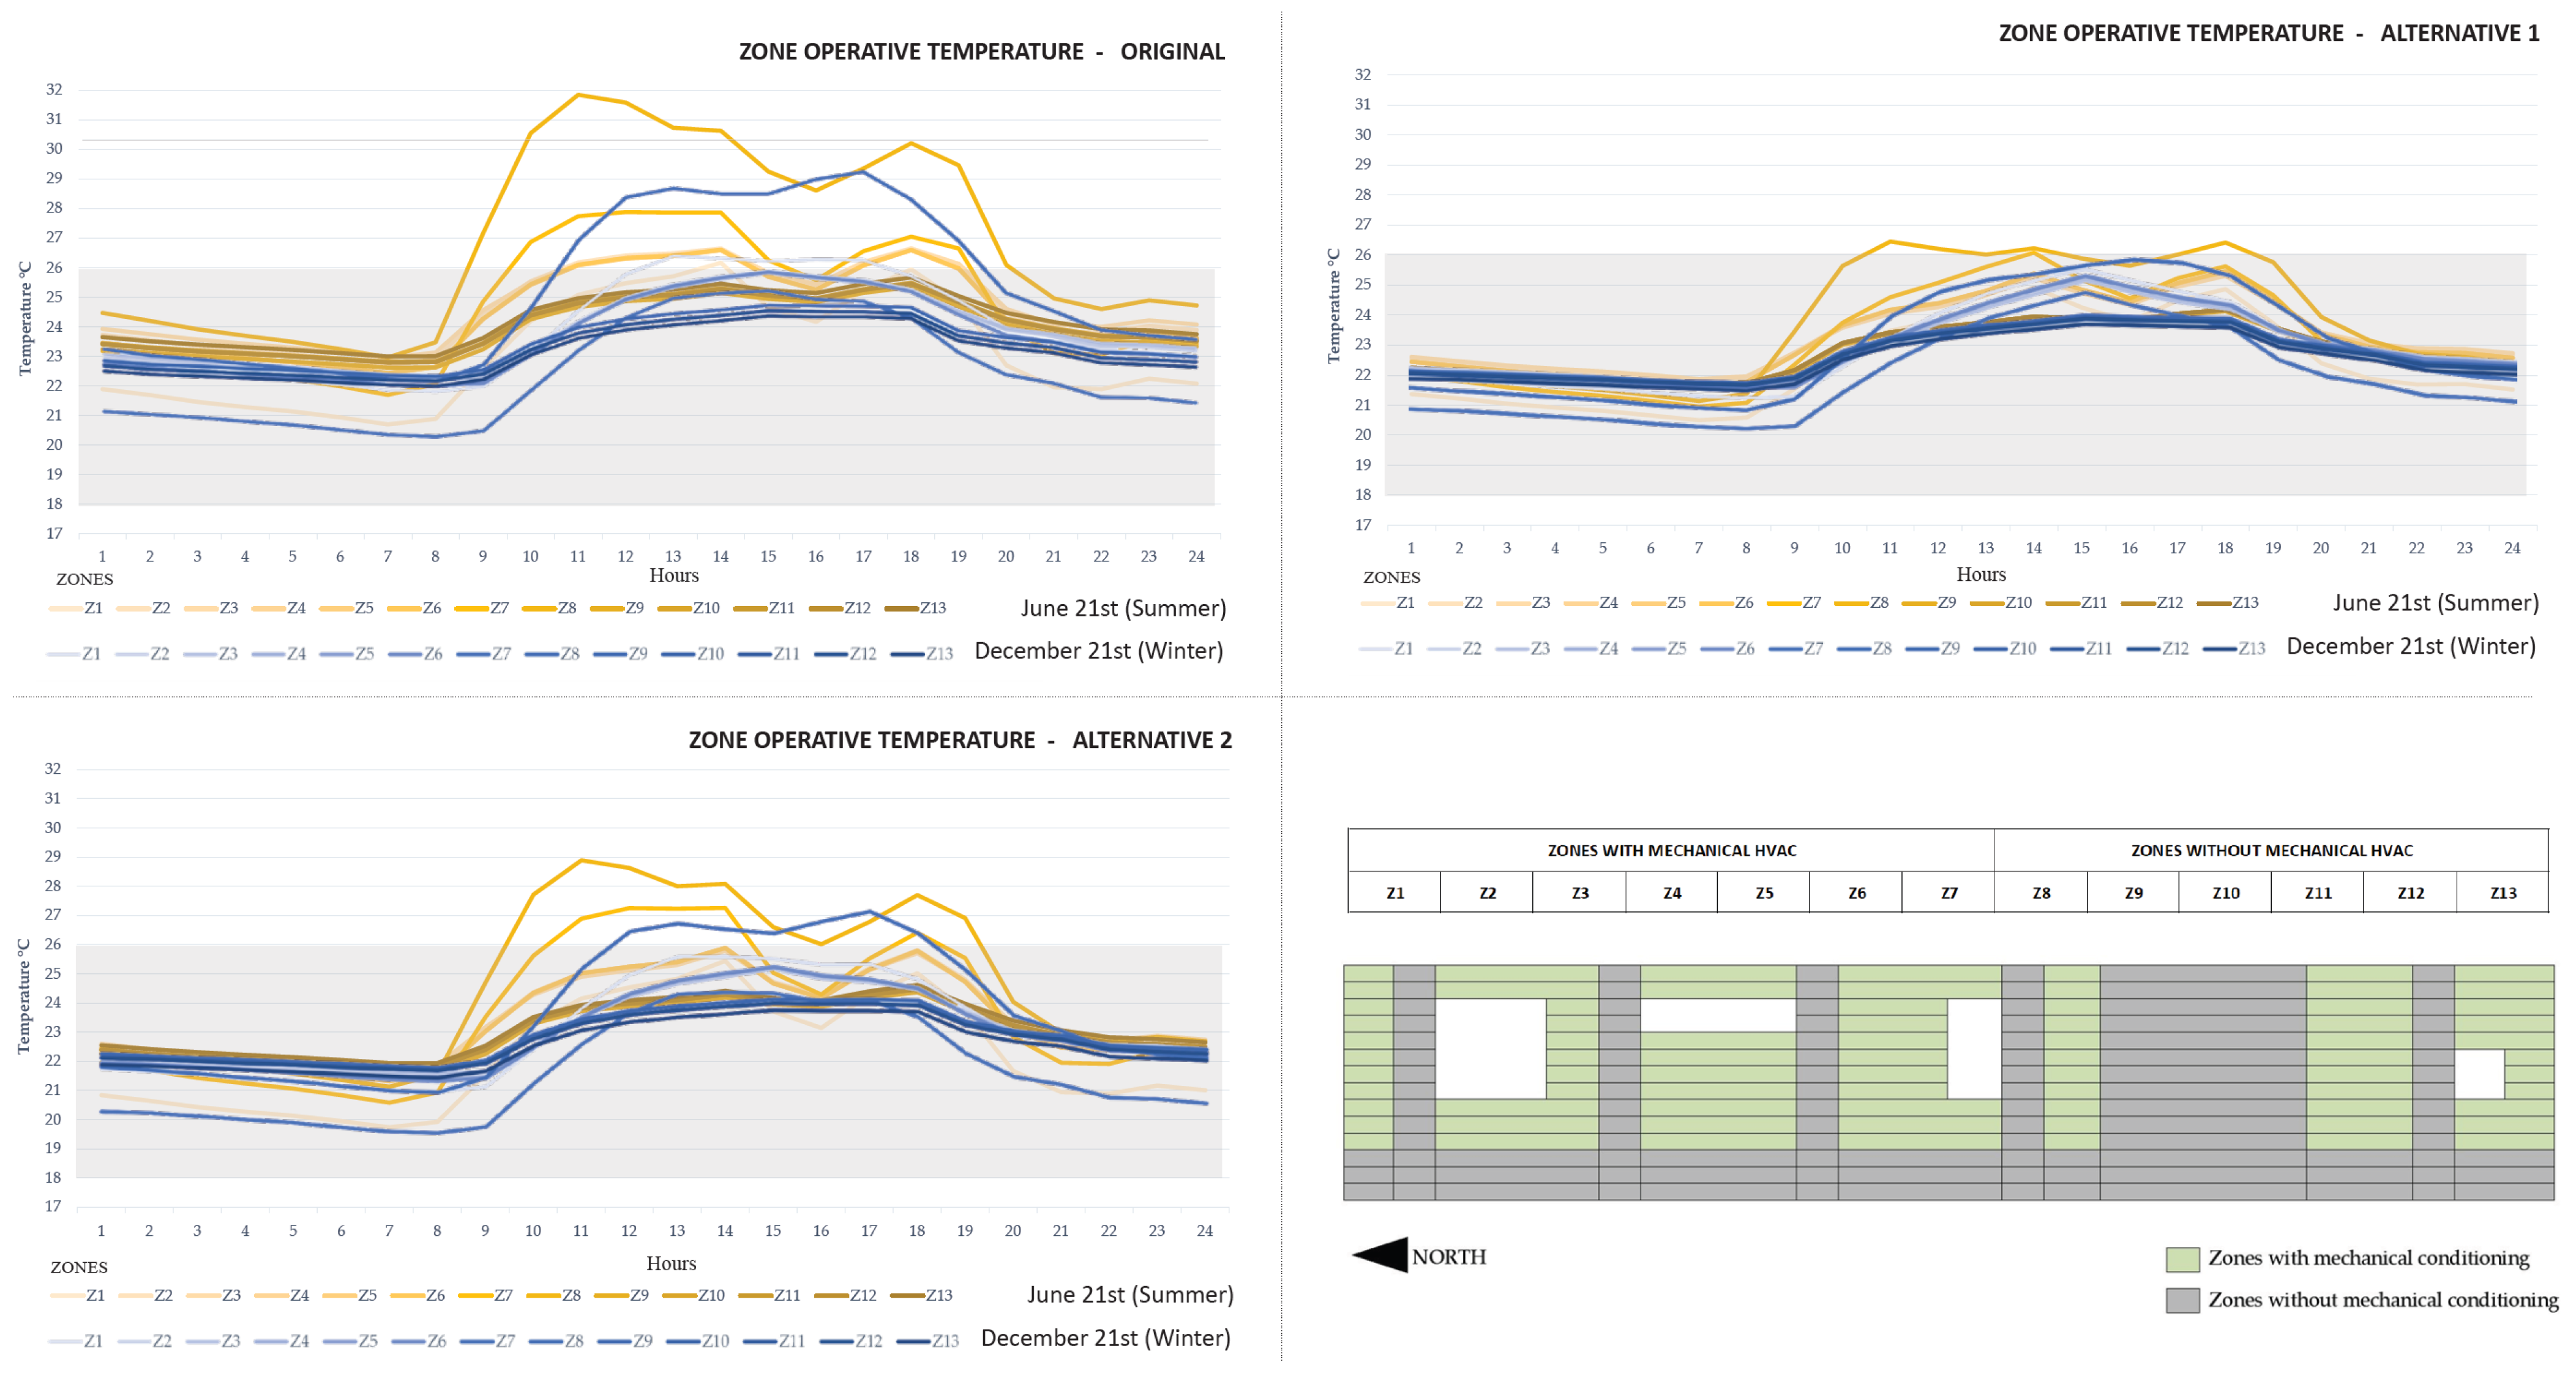
The operative temperature was calculated through hourly dynamic simulations in DesignBuilder, applied to three glazing alternatives: the baseline (10 mm clear glass), Alternative 1 (24 mm double glazing with a selective coating), and Alternative 2 (8.76 mm laminated solar-control glass). The model incorporated the building’s thermal zoning, HVAC schedules, occupancy patterns, and climatic data from the Inaquito area in Quito, as described in the methodology and input loads. In addition to the annual cycle, the analysis specifically considered the winter solstice (21 December) and summer solstice (21 June) as representative extreme days to assess thermal performance under the coldest and warmest conditions. This approach ensured a precise evaluation of hourly operative temperatures within the NEC and ASHRAE 55 comfort range (18–26 °C).
Figure 7 shows that the baseline 10 mm clear glass generated the most critical thermal imbalance, with operative temperatures exceeding 26 °C for up to 6–7 h during summer solstice days, keeping several zones outside the comfort band for more than 40% of occupied hours. Alternative 2 (laminated solar-control glass) reduced this problem moderately, limiting overheating to about 3–4 h per day but still leaving certain east–west oriented zones above the upper threshold for nearly 25–30% of the occupied period. In contrast, Alternative 1 (double glazing with selective coating) demonstrated the most effective regulation: operative temperatures remained within the 18–26 °C range for over 85–90% of the day, with only minor exceedances during the hottest hours. This option also minimized fluctuations between conditioned and non-conditioned zones, ensuring more homogeneous comfort conditions. Overall, Alternative 1 provided superior performance by maximizing the proportion of hours in comfort, thereby offering a reliable passive strategy for Quito’s high-radiation context.
3.2. Solar Gains
The analysis of monthly and annual solar gains reveals significant differences in the thermal behavior of the three glazing configurations applied to the Plataforma Gubernamental Norte. These differences are primarily attributed to the SHGC value of each glass type and its capacity to filter incident solar radiation on the façades. The influence of SHGC on annual solar gains has been confirmed through validated reduced-scale models of office buildings, where SHGC is identified as the main variable for estimating monthly and annual solar gains [
38].
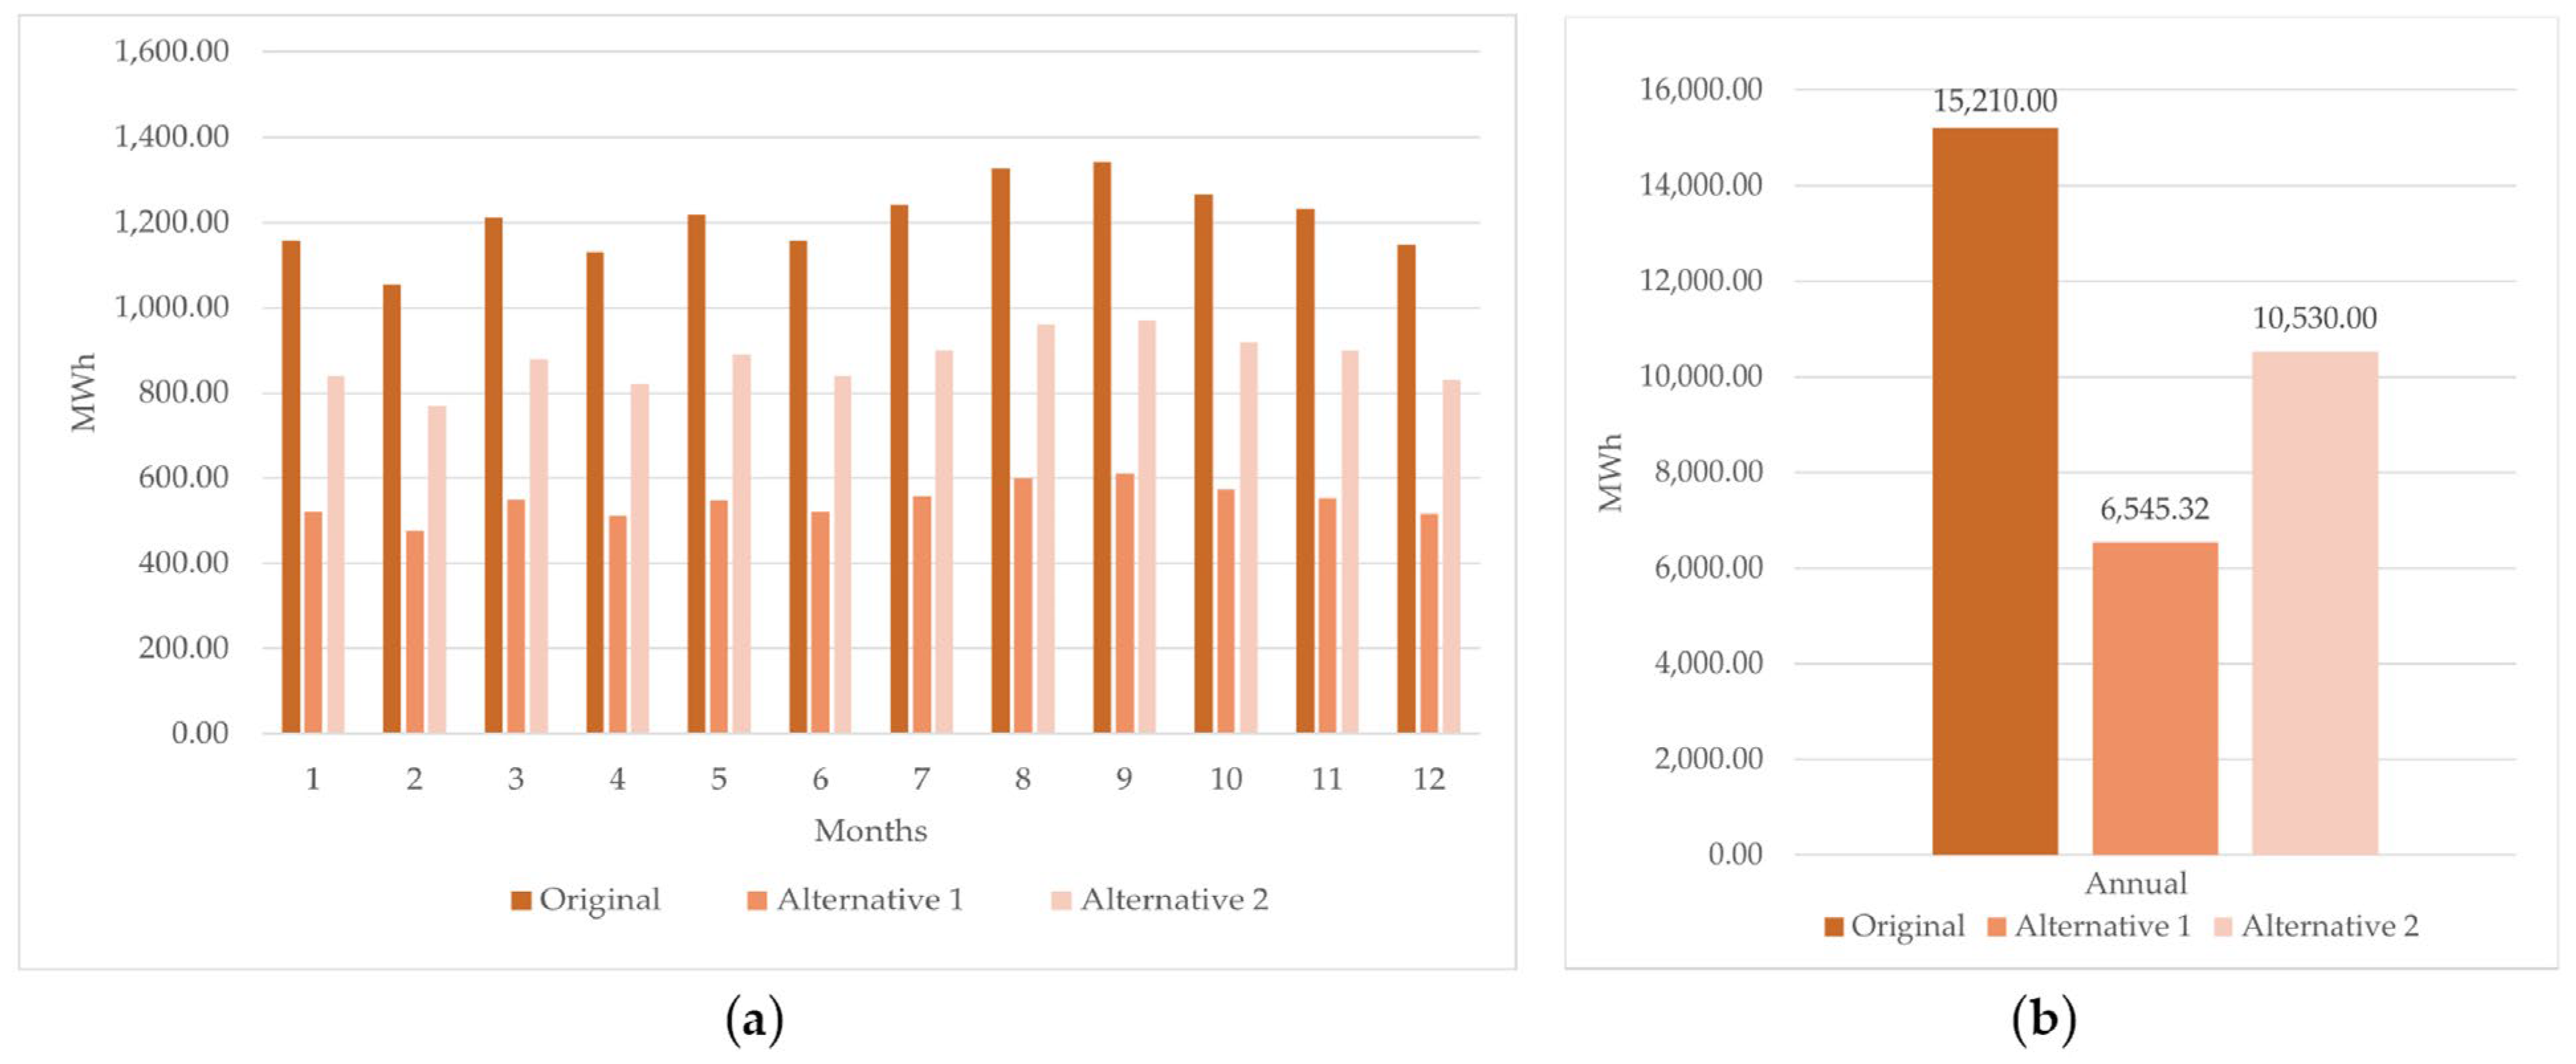
Figure 8 demonstrates marked contrasts among the three alternatives. The baseline 10 mm clear glass (SHGC = 0.82) admitted the highest solar gains (15,210.00 kWh/year), intensifying cooling loads. The double-glazing unit with selective coating (SHGC = 0.45, U = 2.80 W/m
2·K) achieved a 57% reduction, limiting annual gains to 6545.00 kWh and cutting cooling demand by more than 80%, positioning it as the most efficient option. Laminated glass (SHGC = 0.65, U = 5.50 W/m
2·K) yielded intermediate results (10,530.00 kWh/year, 31% reduction), offering partial improvement but allowing significant residual heat ingress.
Interestingly, the baseline 10 mm clear glass presented the lowest annual heating demand due to a pronounced passive greenhouse effect, where daytime solar gains outweighed nighttime losses—an effect particularly relevant in Quito’s diurnal temperature profile. This behavior is driven by the glass’s high Solar Heat Gain Coefficient (SHGC ≈ 0.82), which allows abundant solar radiation to enter during the day, effectively compensating for nocturnal heat losses. Despite its poor insulation performance (U-value: 5.60 W/m2·K), this glazing performs best in terms of heating demand, highlighting the critical role of solar gains in high-altitude equatorial climates like Quito’s, where cold mornings and strong daytime irradiance make passive heating especially advantageous.
However, when evaluated globally, Alternative 1 (double-glazing unit with selective coating, SHGC = 0.45, U = 2.80 W/m2·K) provides a more balanced performance by effectively controlling excessive cooling loads while still offering reasonable insulation, thus positioning it as the most efficient solution for reducing thermal ingress under high-radiation conditions for Quito’s climatic conditions.
3.3. Heating Energy Demand
The thermal behavior of the glazing systems in relation to heating demand reveals a direct correlation with each system’s insulating capacity, represented by the thermal transmittance coefficient, U-value (W/m
2·K). In this regard, the annual results presented in
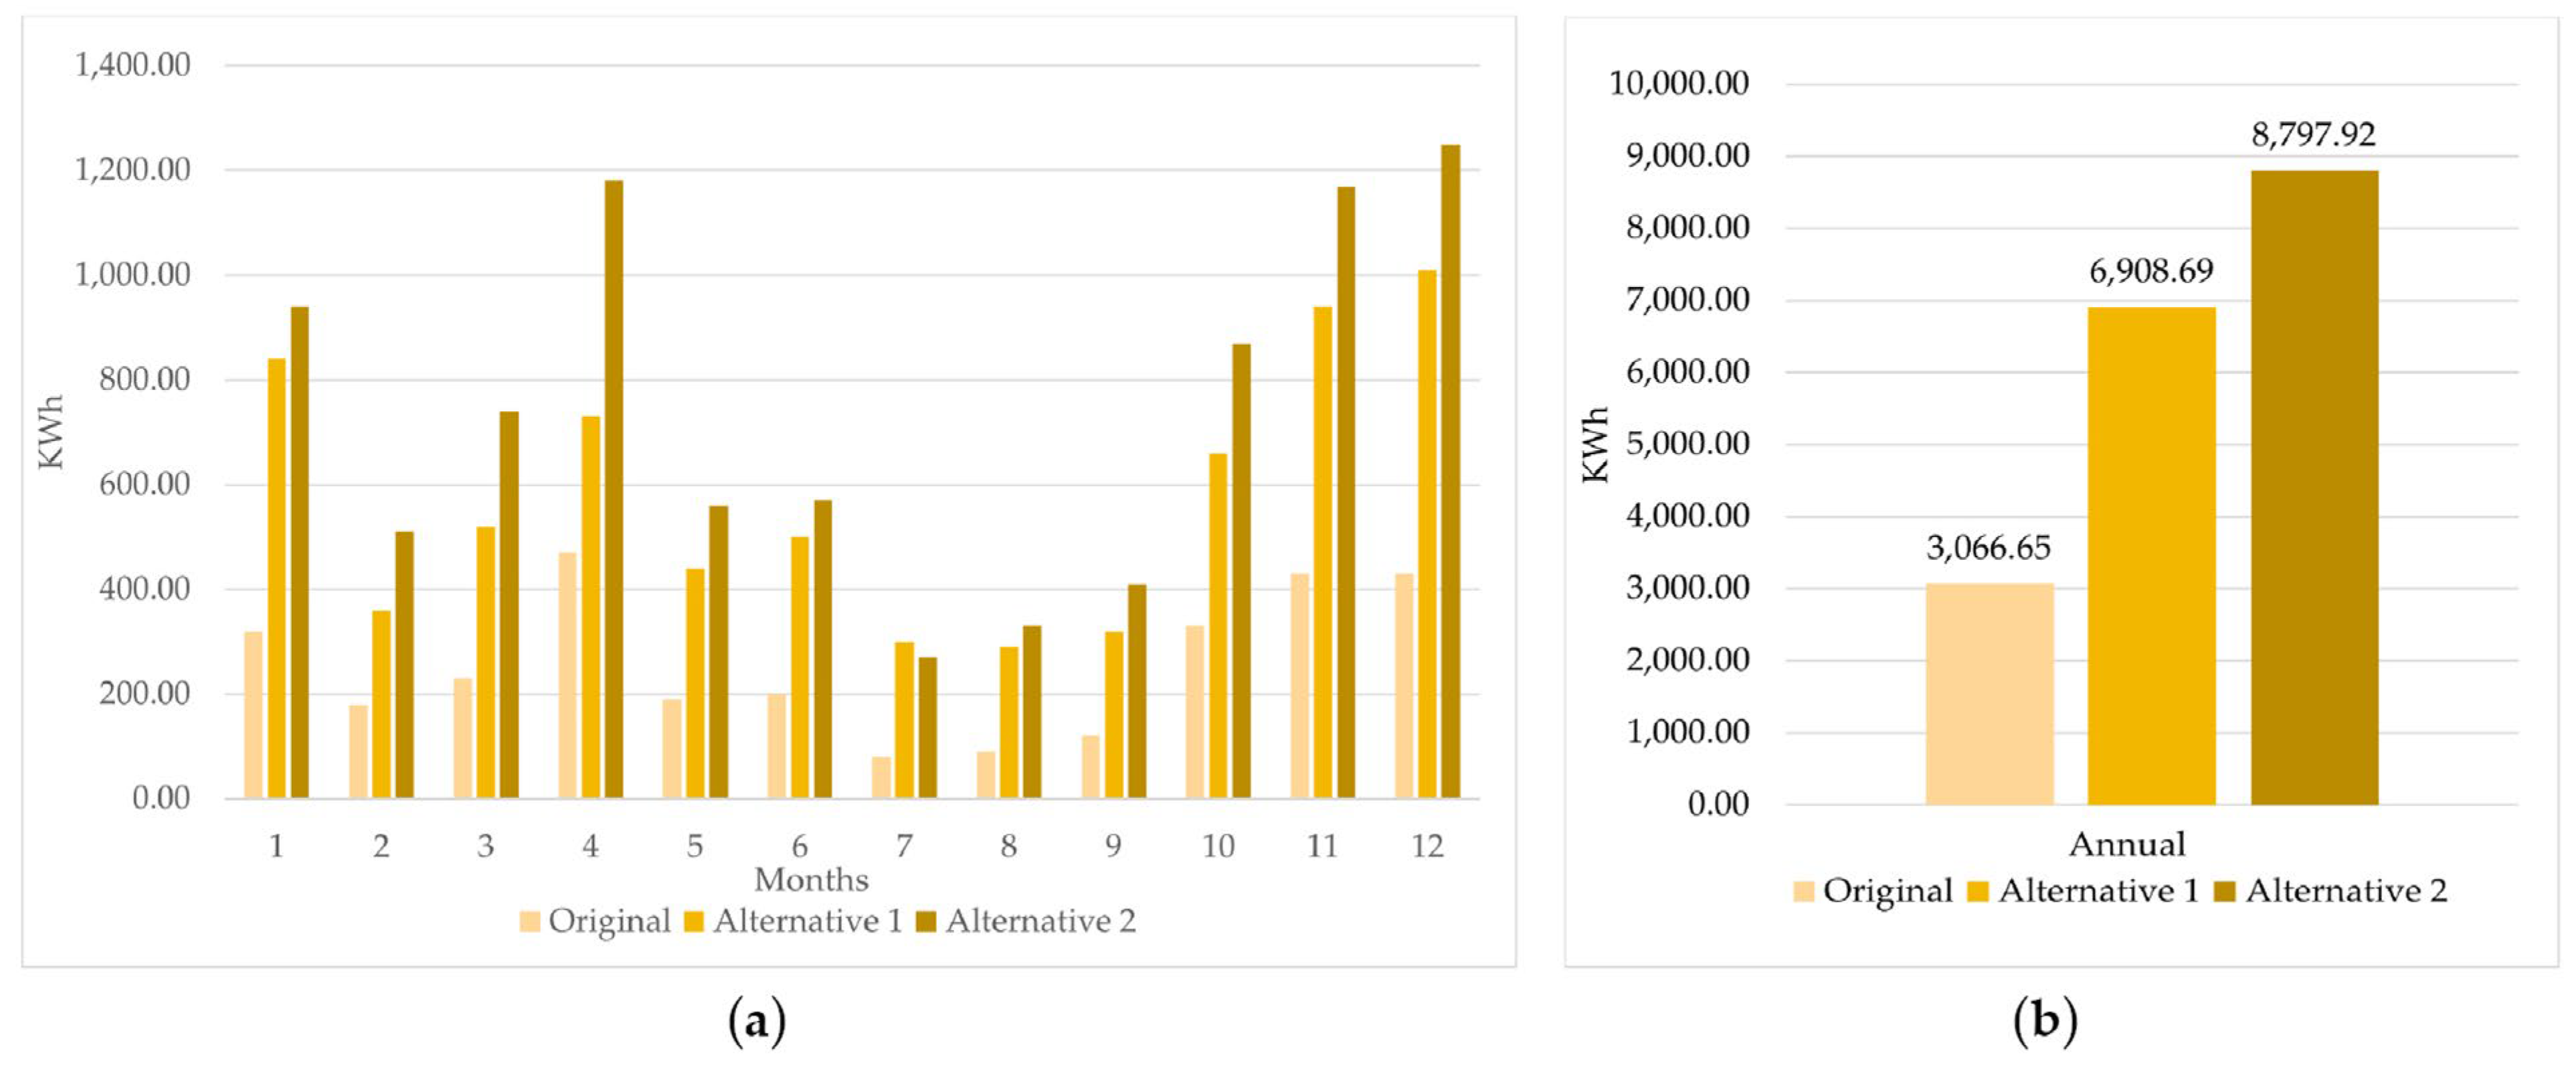
Figure 9 show that the most efficient solution in terms of heat loss is not necessarily the one with the most advanced solar control technology, but rather the one that offers a balanced combination of thermal insulation and controlled solar transmittance.
The baseline 10 mm clear glass (U = 5.60 W/m2·K; SHGC = 0.82) exhibited the lowest heating energy demand (3066.65 kWh/year), a result that, while counterintuitive, is explained by the greenhouse effect it generates: high daytime solar transmittance compensates for nocturnal losses. In contrast, Alternative 1 (DGU ST 150), with better insulation (U = 2.80 W/m2·K) but a low SHGC (0.45), restricted solar ingress and therefore relied more on mechanical heating. Alternative 2 (laminated ST 167) performed worst (8797.92 kWh/year), as its high U-value (5.50 W/m2·K) enabled substantial heat losses, while its moderate SHGC (0.65) provided insufficient passive gains.
When comparing the three alternatives, clear differences emerged. The original glass achieved the lowest heating demand due to its passive solar effect, while Alternative 1 more than doubled this requirement (6908.69 kWh/year) as a consequence of excessive solar control. Although this outcome seems negative, it is marginal when contrasted with its significant cooling savings (82.7% reduction) and reflects the expected trade-off in Quito’s high-radiation context. Alternative 2 combined poor insulation with limited passive solar capture, resulting in the highest heating consumption among all scenarios. These results confirm that heating efficiency does not rely solely on the thermal insulation of the glass neither solar control nor insulation alone but rather on the balance between U-value and SHGC.
3.4. Cooling Energy Demand
The evaluation of cooling energy demand, as shown in
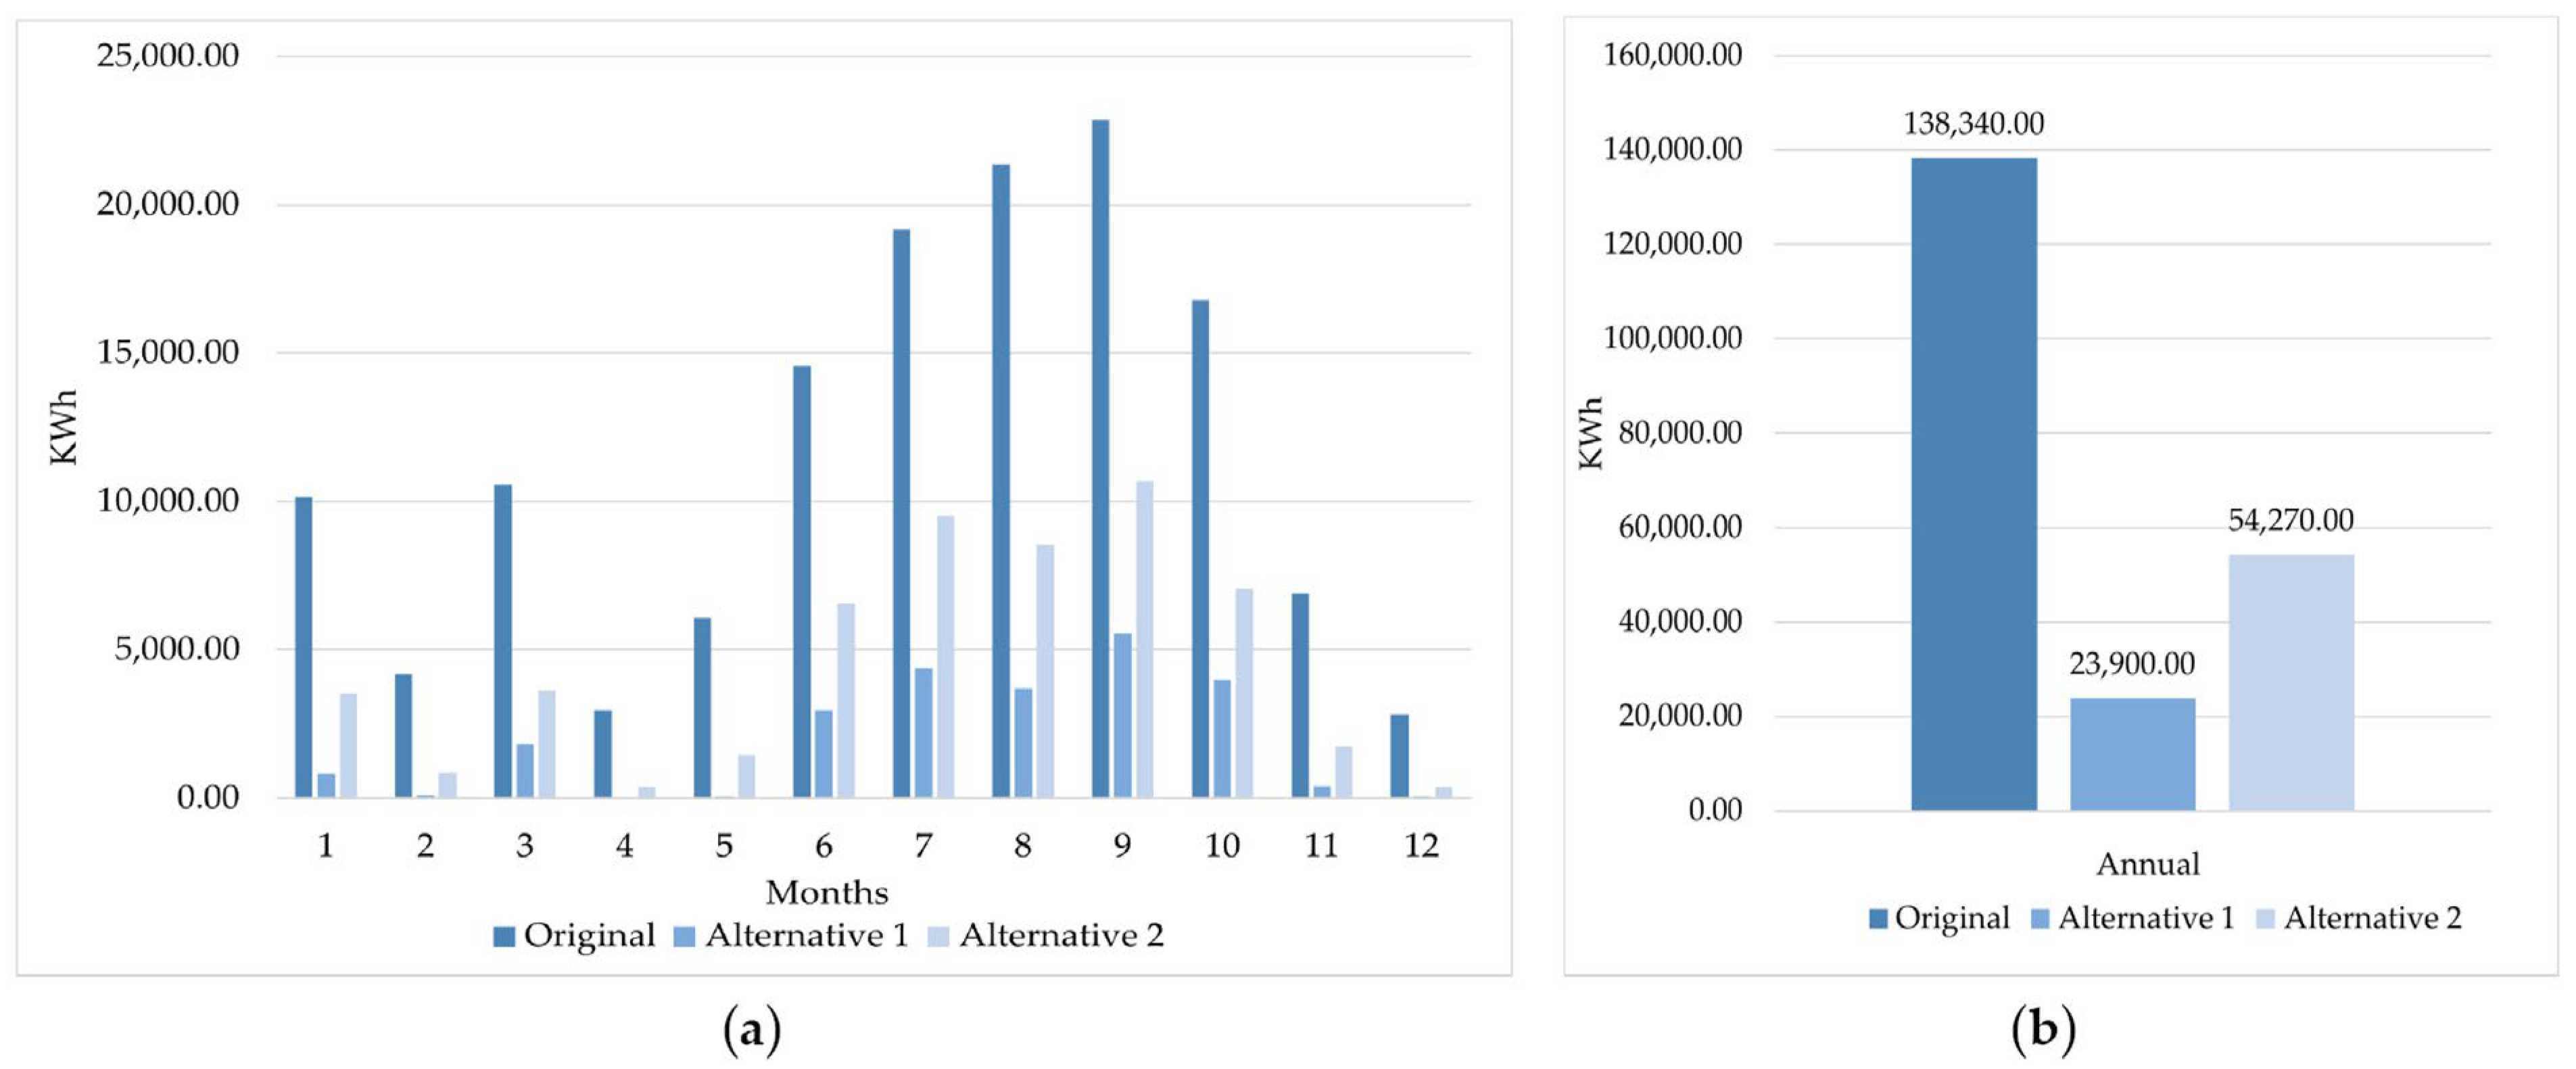
Figure 10, highlights the significant impact of the Solar Heat Gain Coefficient (SHGC) on the thermal performance of glazed façades in Quito’s climate. Given the city’s high solar radiation throughout the year and its relatively mild average temperatures (6–27 °C), excessive solar gains become the dominant factor driving cooling requirements. The analysis reveals that façades with insufficient solar control lead to substantial overheating, particularly on east and west orientations that receive intense direct solar exposure during morning and afternoon hours. In this context, glazing with low SHGC values and high spectral selectivity emerges as a critical passive strategy, directly reducing peak internal loads and mitigating the reliance on mechanical cooling systems.
The baseline configuration, represented by 10 mm clear glass (SHGC = 0.82; U = 5.60 W/m2·K), presented the highest cooling energy demand at 138,340.00 kWh/year, with monthly peaks exceeding 20,000 kWh during periods of intense radiation (July–October). Alternative 1, a selective double-glazing unit (Saint-Gobain ST 150; SHGC = 0.45; U = 2.80), achieved an 82.70% reduction, lowering annual cooling demand to 23,900.00 kWh. This performance is attributable to its selective spectral coating and insulated cavity, which effectively block both direct and diffuse solar radiation. Alternative 2, laminated glass ST 167 (SHGC = 0.65; U = 5.50), achieved intermediate results with 54,270.00 kWh/year—better than the baseline but still inadequate for full mitigation of solar gains in Quito’s high-radiation environment. These outcomes confirm that SHGC exerts a greater influence on cooling loads than U-value improvements, as corroborated by the literature and reviewer remarks.
3.5. Mechanical Conditioning Energy Demand
The integrated analysis of mechanical conditioning energy demand combines both heating and cooling requirements to evaluate the overall performance of the three glazing alternatives tested in the Plataforma Gubernamental Norte. This indicator reflects the combined influence of the Solar Heat Gain Coefficient (SHGC), U-value, and visible transmittance (Tvis) under Quito’s climatic conditions, which are characterized by high solar radiation, mild daytime temperatures, and significant nocturnal cooling. Unlike partial evaluations of heating or cooling loads, this approach enables a comprehensive understanding of how glazing systems interact with external climate, internal loads, and operational schedules to shape the building’s total HVAC consumption.
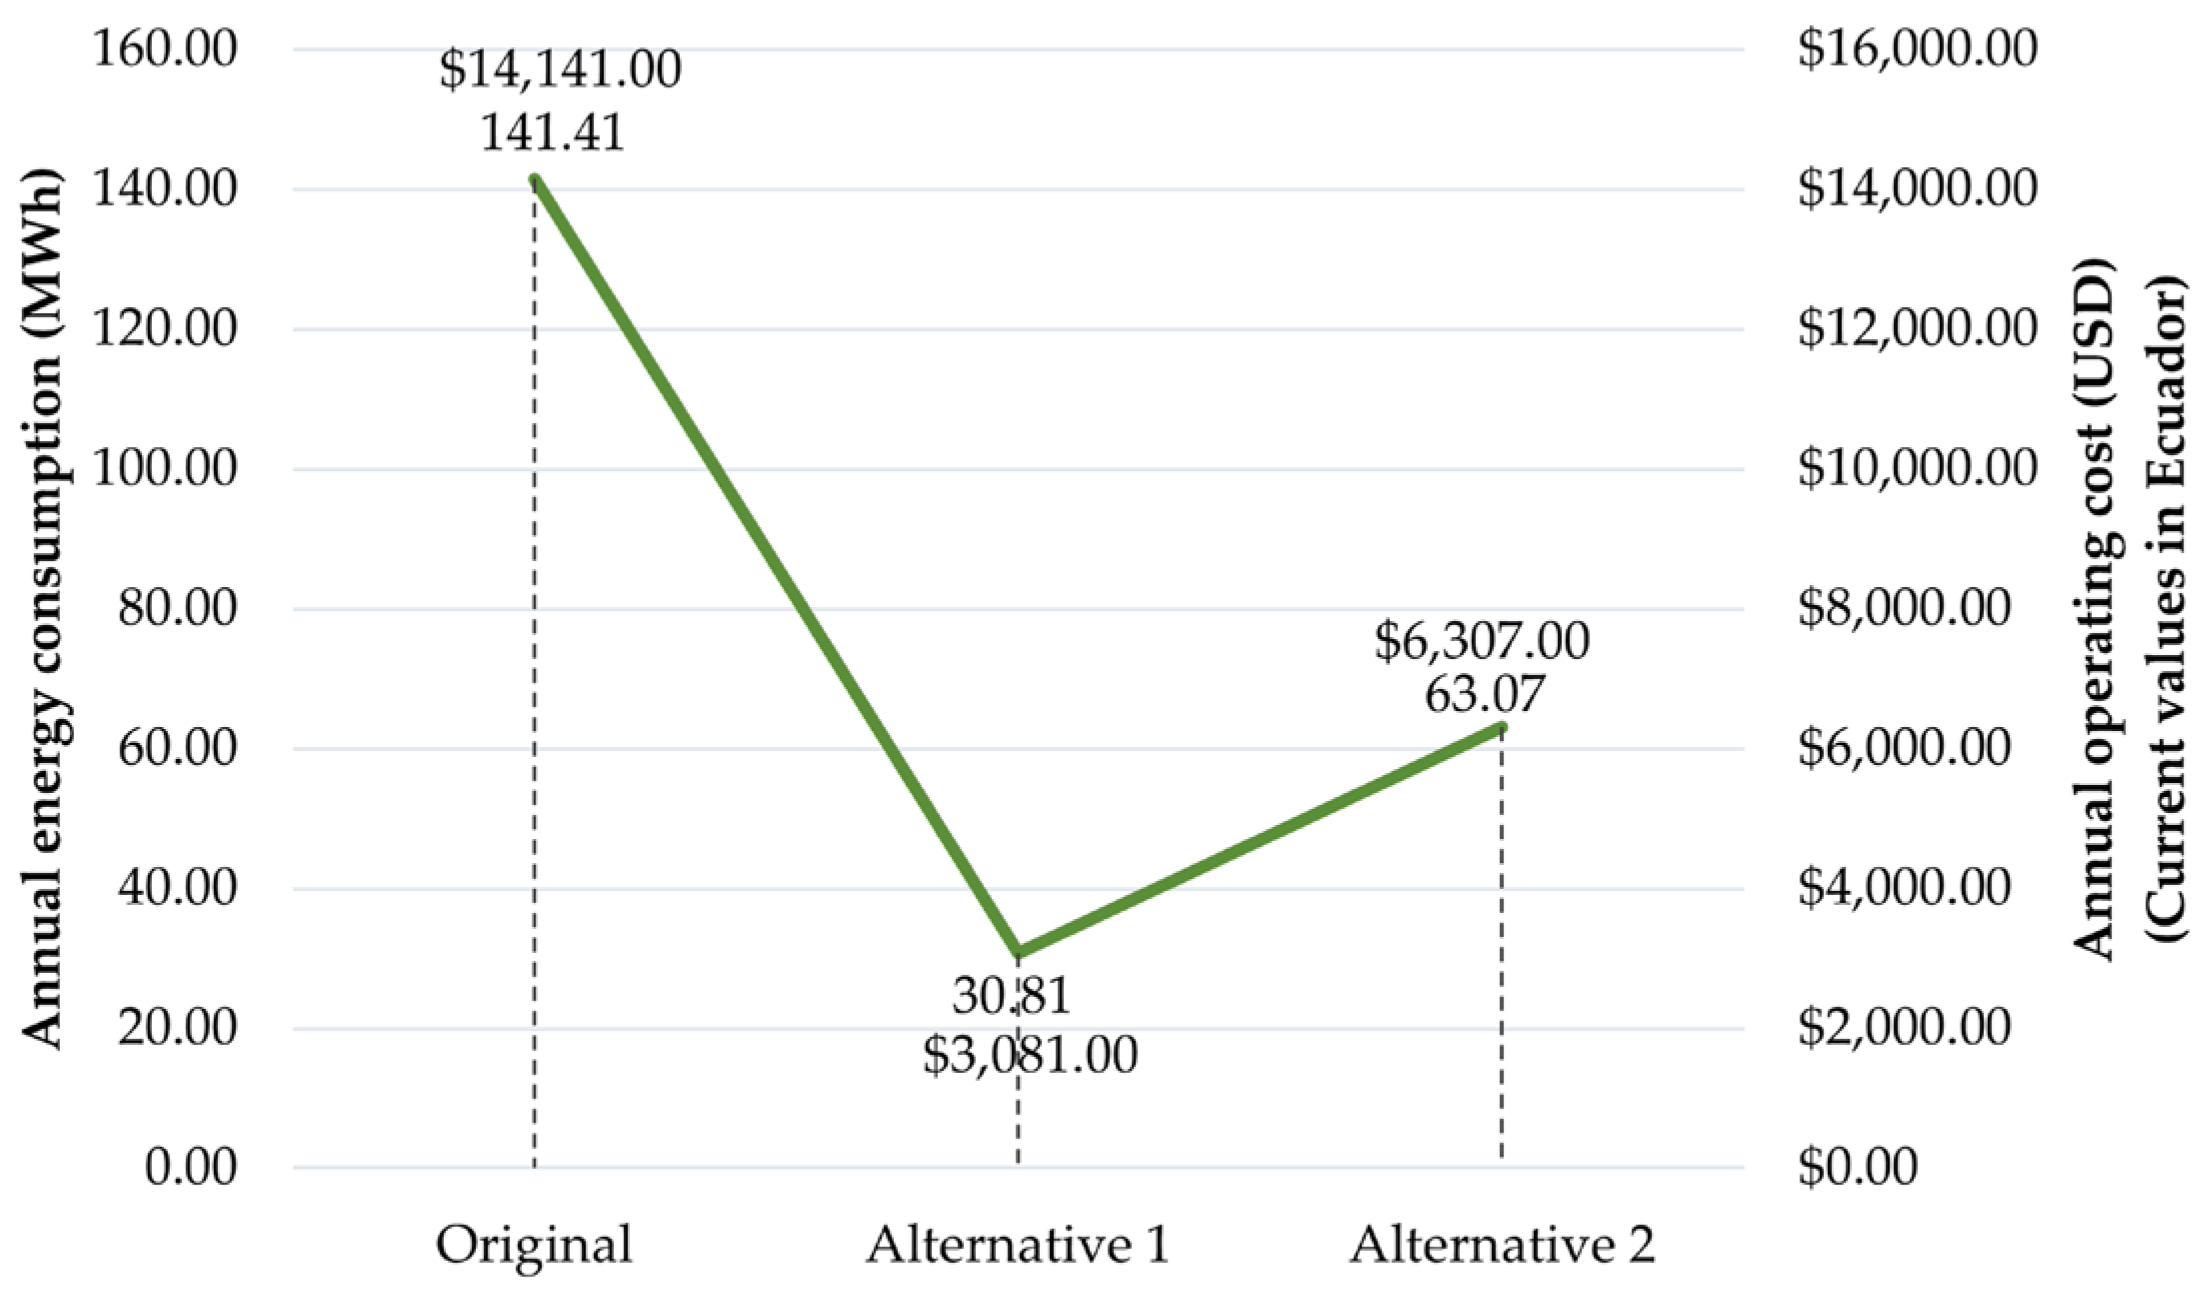
As shown in
Figure 11, the baseline case, a 10 mm monolithic clear glass (SHGC = 0.82; U = 5.60 W/m
2·K), recorded the highest annual HVAC energy consumption, with 141.41 MWh. This outcome stems from the glass’s inability to prevent excessive solar gains during daytime hours and its low resistance to nocturnal heat loss, thereby generating continuous dependence on both heating and cooling. Alternative 1, the double-glazing unit with selective coating (SHGC = 0.45; U = 2.80 W/m
2·K), achieved the most efficient performance, reducing annual mechanical conditioning to 30.81 MWh, equivalent to a 78.21% decrease compared to the baseline. This was primarily attributed to its effective control of solar ingress combined with improved insulation, which minimized reliance on HVAC systems. Alternative 2, laminated glass with solar-control film (SHGC = 0.65; U = 5.50 W/m
2·K), registered intermediate results, with 63.07 MWh/year, reflecting a 55.40% reduction but limited by poor insulation capacity.
Comparative multilayer glazing studies reveal that optimized DGU systems can reduce total HVAC energy demand by more than 30–33% [
39], reinforcing the effectiveness of Alternative 1. The analysis confirms that advanced glazing technologies can substantially enhance a building’s overall energy efficiency, achieving reductions exceeding 70% in HVAC-related electricity use. These findings underscore the importance of integrating envelope design as a core strategy within a bioclimatic architectural approach.
From a bioclimatic perspective, these results confirm that the combined optimization of SHGC and U-value is essential to reduce HVAC loads in Quito’s context, where daytime radiation is intense while nocturnal temperatures drop significantly. Although the baseline glass benefits from a passive greenhouse effect that reduces heating demand, its overall inefficiency is evident when both cooling and heating are considered together. The superior performance of Alternative 1 demonstrates that advanced glazing with selective coatings and air gaps can transform the façade into a passive energy regulator, lowering annual HVAC energy. This highlights the strategic role of glazing as an active component in bioclimatic design, enabling long-term operational savings, reducing indirect CO2 emissions, and ensuring thermal comfort in equatorial high-radiation conditions.
3.6. Annual HVAC Energy Consumption in Relation to Glazing Alternatives and Their Cost
The comparative analysis of annual HVAC energy consumption against the baseline glazing system quantifies the impact of improved glazing performance on building efficiency. This assessment identifies not only absolute reductions but also the relative savings potential of each alternative. It reveals that not all “solar control” glazing solutions deliver comprehensive energy efficiency; only those that effectively balance thermal insulation and solar selectivity achieve substantial energy reductions. In this context, Alternative 1 reduces consumption to less than 25% of the original demand, redefining the façade as a high-performance passive system.
To translate energy consumption into operational costs, the study applied a reference tariff of USD 0.10/kWh, based on the average rate for commercial and institutional sectors in Quito. This fixed value ensures comparability despite minor tariff variations. Real utility bills were not used, as they represent total consumption without isolating HVAC demand. Instead, energy simulations using DesignBuilder enabled the precise estimation of thermal loads attributable exclusively to HVAC systems under representative conditions. This methodology supports a consistent economic comparison of each glazing alternative.
Figure 12 illustrates annual HVAC consumption and associated costs. The baseline case, with 10 mm clear monolithic glass (SHGC = 0.82; U = 5.60 W/m
2·K), results in 141.41 MWh/year, equivalent to USD 14,141.00, highlighting the cost of inefficient façades in high-radiation equatorial climates. In contrast, Alternative 1—a selective double-glazing unit (SHGC = 0.45; U = 2.80 W/m
2·K)—reduces demand to 30.81 MWh/year (21.79% of baseline), with an annual cost of USD 3081, yielding savings of USD 11,060.00. Alternative 2, laminated glass (SHGC = 0.65; U = 5.50 W/m
2·K), performs moderately better than the baseline, reaching 63.07 MWh/year (44.60%), with a cost of USD 6307.00 and savings of USD 7834.00. However, its limited insulation constrains its overall efficiency.
In Quito’s climatic context, where high solar radiation coincides with significant nocturnal cooling, these results confirm that optimal glazing design requires a balanced relationship between SHGC and U-value. The normalized energy demand and cost analysis demonstrate that Alternative 1 not only reduces HVAC consumption to less than one-quarter of the original case but also ensures long-term operational savings and resilience in institutional buildings.
3.7. Return on Investment (ROI) from the Implementation of the Analyzed Glazing Systems
The return on investment (ROI) is a widely used tool in energy efficiency studies for buildings to evaluate the economic impact of improvement measures [
40]. However, its interpretation must be contextualized within the framework of bioclimatic architecture and sustainable design. Some technologies, such as solar control glazing with selective coatings, offer benefits that are not directly monetizable, including enhanced thermal comfort, reduced indirect CO
2 emissions, and increased durability of HVAC systems.
Researchers such as Ürge-Vorsatz et al. and the International Energy Agency (IEA) have emphasized that conventional ROI calculations tend to underestimate the actual value of energy efficiency improvements when environmental, social, and health-related externalities are excluded from the analysis [
30,
31].
In this study, ROI serves as a key criterion for assessing the economic feasibility of glazing solutions applied to the building envelope, particularly those involving materials with high thermal and optical performance. ROI is calculated as the ratio between the additional investment required to implement a high-performance glazing alternative and the estimated annual energy savings from mechanical HVAC consumption. This ratio provides an estimate of the number of years needed to recover the initial investment solely through energy cost savings.
This ROI analysis quantifies the economic feasibility of adopting advanced glazing alternatives by comparing the additional implementation costs to the annual operational savings in HVAC energy consumption. The baseline system, modeled through a simulation of a 33,590.00 m
2 glazed façade using 10 mm monolithic glass, represents the current condition, incurring no additional investment and generating no energy savings. Alternative 1, a double-glazing unit with a selective coating (SHGC = 0.45; U = 2.80 W/m
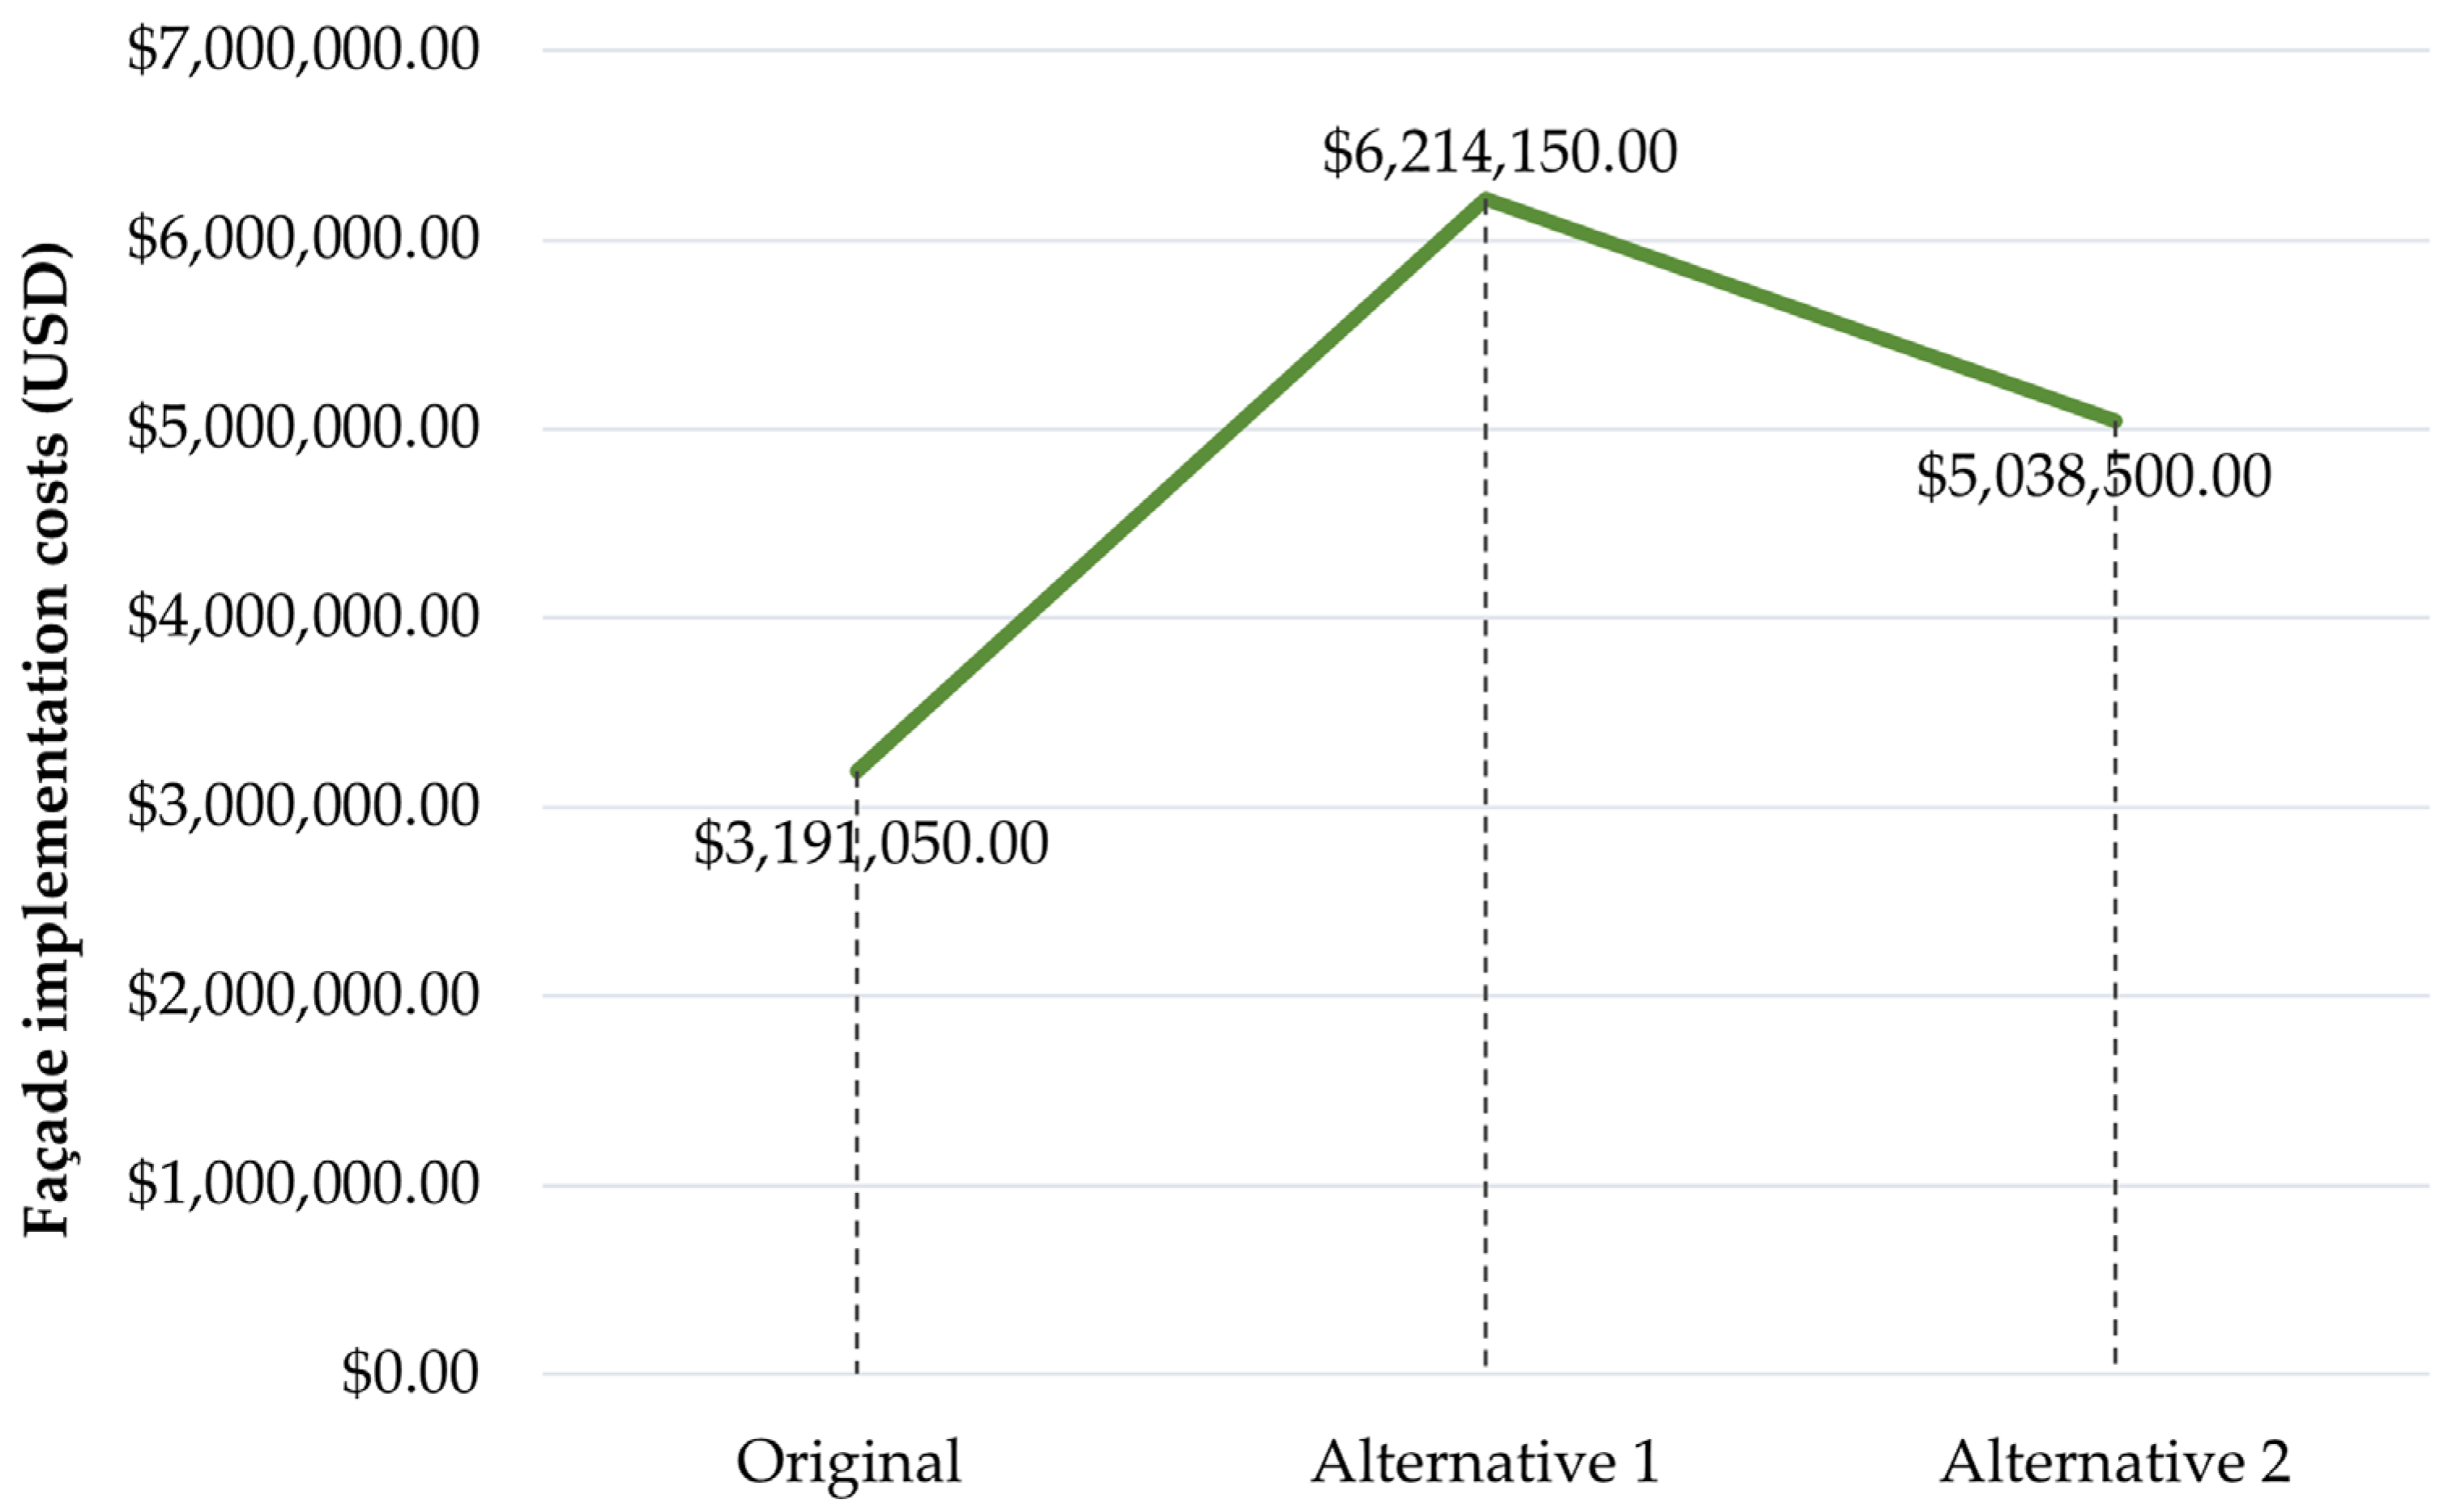
2·K), required an incremental investment of USD 3,023,100.00 In comparison, Alternative 2, consisting of laminated glass (SHGC = 0.65; U = 5.50 W/m
2·K), involved an additional cost of USD 1,847,450.00, as illustrated in
Figure 13. These investment levels, as shown in
Table 4 were evaluated against estimated annual energy savings of USD 11,060.00 and USD 7834.00, respectively. The results highlight the inherent trade-off between technical efficiency and financial return.
The ROI results in
Table 5 show extremely extended payback periods under the prevailing local tariff of USD 0.10/kWh: 273.30 years for Alternative 1 and 235.80 years for Alternative 2. These figures, although mathematically correct, illustrate the distortion created by energy subsidies rather than the inefficiency of the glazing systems themselves. When recalculated under international tariff scenarios, ROI improves significantly: in Colombia, Peru, and Brazil, with tariffs between USD 0.18 and 0.23/kWh, payback periods fall to a range of 118 to 151 years; in Germany, with tariffs of USD 0.40/kWh, ROI for Alternative 1 drops drastically to 18 years. This contrast underscores how tariff structures and policy frameworks directly influence the financial viability of façade technologies, making them feasible in high-tariff contexts but unattractive in heavily subsidized markets.
Comparing the three glazing options in terms of ROI highlights their differentiated potential. The baseline system, while requiring no investment, imposes consistently high operational costs of over USD 14,000.00 per year, which accumulate significantly across the building’s lifecycle. Alternative 2 demonstrates a shorter payback period than Alternative 1 but offers smaller absolute savings and limited technical performance, given its high U-value and moderate SHGC. By contrast, Alternative 1 achieves both the greatest annual energy reduction (78.21%) and the largest cost savings (USD 11,060.00/year), even though its ROI remains the longest due to higher upfront investment. This comparative balance confirms that ROI, while essential, cannot be interpreted in isolation from technical and environmental benefits.
In addition, given Ecuador’s low electricity prices and the importance of implementing advanced glazing alternatives in façades, this study presents a comparative analysis using regional electricity prices from countries with varying tariff structures and regulatory frameworks—namely, Ecuador, Colombia, Peru, and Brazil—as well as high-tariff countries such as Germany. This comparative assessment highlights how energy pricing contexts influence the financial viability of envelope technologies and underscores the strategic relevance of policy and economic incentives for sustainable building design.
The comparison with Latin American and European countries highlights how different tariff structures and policy frameworks shape the economic feasibility of glazing alternatives. In subsidy-driven contexts, ROI tends to be extended, while in higher-tariff environments like Germany, payback periods are significantly shorter. This contrast underscores the sensitivity of investment decisions to local energy pricing schemes.
These findings confirm that in high-tariff environments with active sustainability policies, solar control and thermal insulation glazing solutions can achieve both environmental and economic viability. Furthermore, the analysis underscores that ROI must be interpreted as a contextual indicator, rather than an absolute metric. While in some countries the financial return may not be compelling under a strictly economic rationale, the complementary benefits, such as improved thermal comfort, reduced emissions, and extended lifespan of HVAC systems, can justify their implementation as part of a sustainable and resilient design strategy aligned with global energy efficiency commitments.
3.8. Trade-Off Between U-Value vs. SHGC: Combined Parametrization
Figure 14 presents a performance matrix of glazing systems, where the two critical variables—U-value (thermal transmittance, W/m
2·K) and Solar Heat Gain Coefficient (SHGC)—are plotted to evaluate energy efficiency under Quito’s climate. Lower U-values indicate better insulation against heat losses, while lower SHGC values reduce unwanted solar gains. The color gradient represents a relative efficiency index, highlighting the areas where glazing systems achieve superior balance between insulation and solar control. Within this framework, the three alternatives studied—Monolithic 10 mm, Laminated ST 167, and DGU ST 150—are positioned according to their specific thermal and optical properties, allowing a direct comparison of their performance.
The results show clear differences in efficiency: the Monolithic 10 mm glass (U = 5.60, SHGC = 0.82) is located in the least efficient zone, allowing high solar gains and exhibiting poor insulation, which results in the highest HVAC demand (141.41 MWh/year). The Laminated ST 167 glass (U = 5.50, SHGC = 0.65) provides moderate improvement, reducing consumption to 63.07 MWh/year, yet its high U-value prevents optimal performance. By contrast, the DGU ST 150 system (U = 2.80, SHGC = 0.45) falls within the optimal region of the matrix, achieving the lowest energy demand (30.81 MWh/year) and delivering a 78.21% reduction in HVAC consumption compared to the baseline. This analysis confirms that the best-performing solution is the double-glazed unit with selective coating, as it balances thermal insulation and solar control to meet Quito’s high-radiation, high-altitude conditions.
3.9. Trade-Off Between U-Value, SHGC, and TVIS: Individual Parameterization
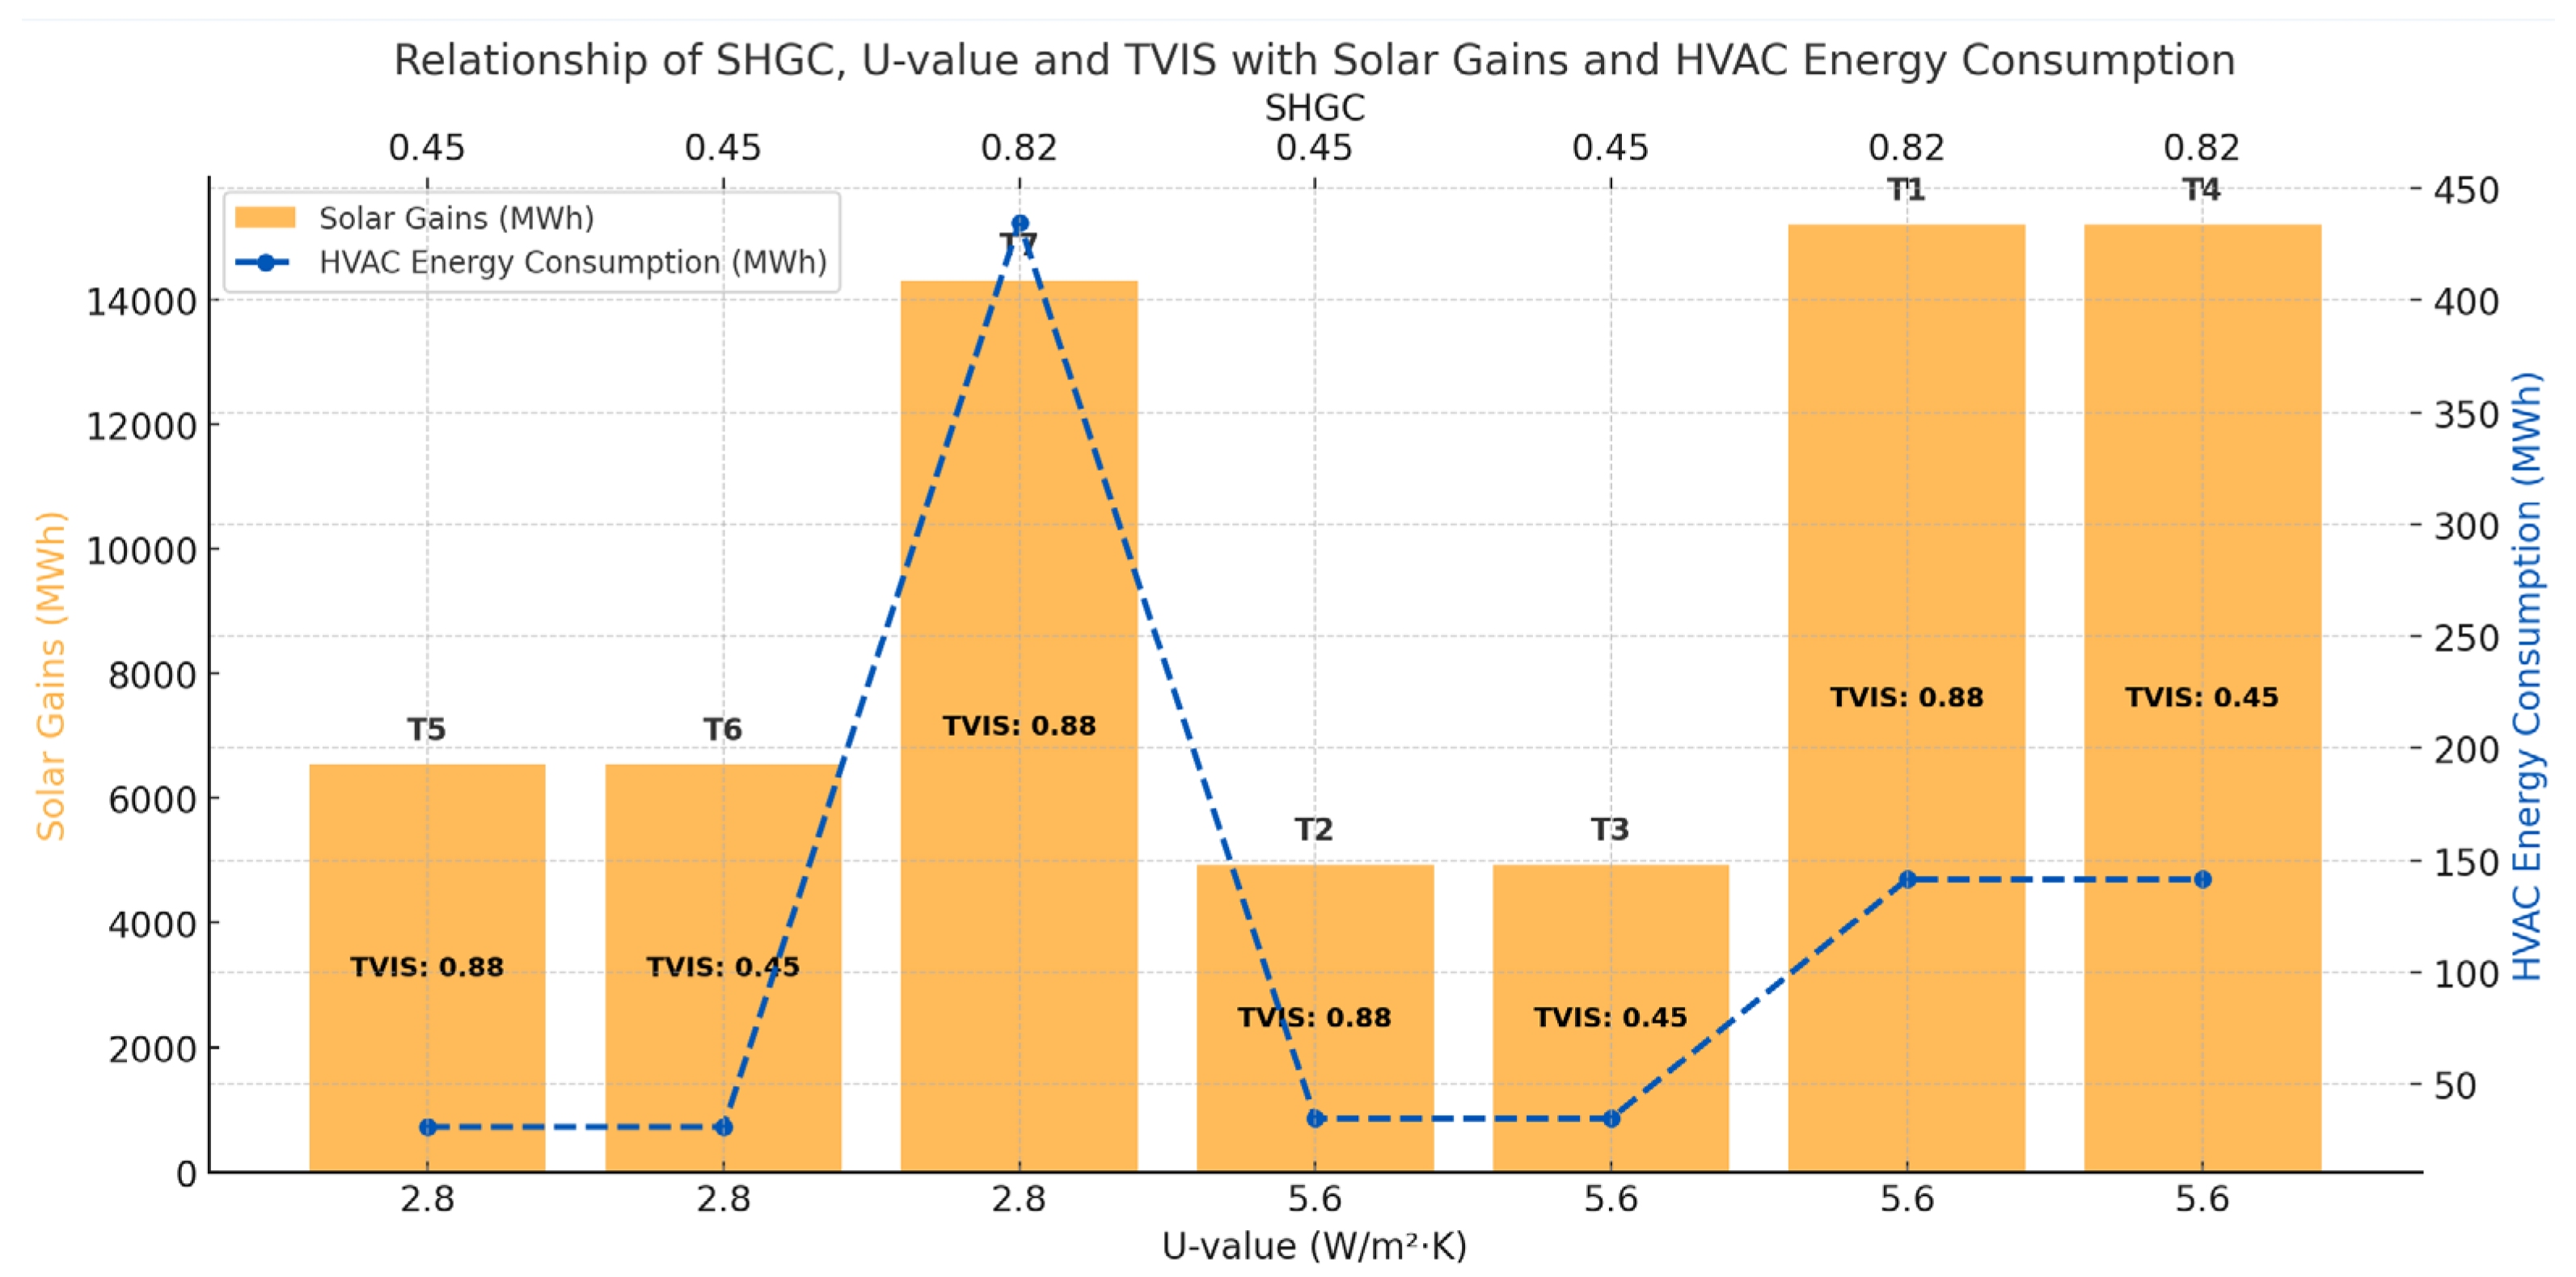
Figure 15 illustrates a trade-off analysis that evaluates the relationship between solar gains and HVAC energy consumption for glazing alternatives T1 to T7. The methodology consists of varying only one parameter at a time—TVIS (Visible Transmittance), SHGC (Solar Heat Gain Coefficient), or U-value (thermal transmittance)—while keeping the other two fixed. This approach makes it possible to isolate the effect of each parameter and better understand how changes in visible light transmission, solar heat admission, or thermal insulation individually influence the building’s energy performance.
The results confirm that TVIS has no influence at all on solar gains or thermal load control, since the HVAC demand remains unchanged when TVIS varies from 0.88 to 0.45. In contrast, SHGC shows a decisive effect: alternatives with SHGC = 0.82 (T1, T4) reach solar gains of ~15,210.00 MWh/year and HVAC consumption of ~141.00 MWh/year, whereas reducing SHGC to 0.45 (T2, T3, T5, T6) lowers HVAC demand drastically to between 34.6 and 50.60 MWh/year. The best-performing cases are T3 and T6, both at ~34.60 MWh/year, while the worst performers are T1 and T4. These findings highlight that the key driver of thermal loads is SHGC, whereas TVIS does not alter the energy demand.
5. Conclusions
This study demonstrated that glazing configuration is a decisive factor in the thermal and energy performance of large-scale institutional buildings in high-radiation equatorial climates. The simulations applied to the Plataforma Gubernamental Norte in Quito confirmed that replacing the baseline 10 mm monolithic glass with advanced alternatives can drastically improve building efficiency. Selective double glazing reduced HVAC demand by 78.21% (110.60 MWh/year savings), while laminated solar-control glass achieved a 55.40% reduction. The parametric analysis revealed that Solar Heat Gain Coefficient (SHGC) and U-value are the two parameters that significantly influence thermal gains and HVAC energy demand, whereas Visible Transmittance (TVIS) had no effect. This means that in each specific case, priority must be given either to solar control (SHGC) or thermal insulation (U-value), depending on whether overheating or heat loss is the dominant problem.
Beyond technical performance, the findings underscore that the primary barrier to adopting high-performance glazing in Ecuador lies in the economic and policy domain. Under the current subsidized tariff of USD 0.10/kWh, payback periods extended to 273 years for selective double glazing and 236 years for laminated glass, making financial viability unattainable despite significant energy savings. However, in international contexts such as Germany, where tariffs reach USD 0.40/kWh, the ROI for selective double glazing shortened drastically to only 18 years, revealing the strong dependence of economic feasibility on local tariff structures. This “efficiency paradox” illustrates that building envelopes in subsidized markets are technically efficient but economically discouraged, demanding structural reforms to align policy with sustainability goals
The practical implications of these findings are especially relevant given Ecuador’s recent electricity crisis. In 2024, the country experienced rolling blackouts lasting more than 14 h per day due to hydropower shortages [
54]. These disruptions have accelerated discussions on diversifying the energy matrix, phasing out subsidies, and incentivizing efficiency measures. In this context, the present research becomes directly applicable, providing quantified evidence on how façade technologies can reduce operational loads, extend HVAC equipment lifespan, and contribute to national strategies for energy resilience and CO
2 mitigation. By reducing annual HVAC energy consumption from 141.40 MWh to as little as 30.80 MWh, advanced glazing systems can play a critical role in alleviating peak demand during supply crises.
Future research should expand the scope of this study by incorporating life-cycle assessments, embodied carbon analysis, and hybrid economic metrics that account for externalities such as emission reductions and health co-benefits. Exploring the integration of high-performance glazing with complementary strategies—such as shading devices, photovoltaic-integrated façades, and adaptive envelopes—would provide a more holistic vision for energy-resilient buildings. Moreover, as Ecuador redefines its energy policy framework, evidence-based studies like this one can serve as decision-making tools for policymakers, ensuring that architectural design, technology, and tariff reforms converge toward sustainable and resilient urban development.
