Article

Investigation on the Mechanical Response of a Prefabricated Underground Pipe Gallery with a Flexible Energy Dissipation Node: An Experimental Study

1
Hebei Key Laboratory of Green Construction and Intelligent Maintenance for Civil Engineering, Hebei Province Engineering Research Center for Harmless Synergistic Treatment and Recycling of Municipal Solid Waste, School of Civil Engineering and Mechanics, Yanshan University, Qinhuangdao 066004, China
2
Shen Kan Qinhuangdao General Engineering Design & Research Institute Corporation, Mcc, Qinhuangdao 066000, China
*
Author to whom correspondence should be addressed.
Buildings 2025, 15(19), 3521; https://doi.org/10.3390/buildings15193521
Submission received: 13 August 2025 / Revised: 20 September 2025 / Accepted: 24 September 2025 / Published: 30 September 2025
(This article belongs to the Special Issue Advances in Vibration Control of Civil Structures)

Abstract

Prefabricated pipe galleries have received increasing attention attributed to their advantages of a convenient construction, short cycle, and high intensification. In this study, a flexible-connection node structure for underground pipe galleries is proposed. The structure made by a polyurea grouting slurry is adopted as the “outer skin” of the node, and the spring vibration isolation bearing is adopted as the “inner rib” of the node. By conducting a series of model tests, the influence of the node types on the mechanical behavior of underground pipe galleries under dynamic compaction and mechanical vibration is studied. The results show that the acceleration and dynamic strain attenuation rates of the flexible-connection node under dynamic compaction are 2.33–3.13 times and 2.63–3.83 times as that of the rigid-connection node, respectively. The acceleration and dynamic strain attenuation rate of the flexible-connection node under machine vibration are 3.01–3.53 times and 4.5–14.73 times as that of the rigid-connection node, respectively. Although residual dynamic earth pressure is monitored in the pipe gallery structure under both connection modes, a reduction on the pressure is achieved by the flexible-connection node. This study would be helpful for the design, operation, and maintenance of underground pipe gallery structures.

1. Introduction

Underground pipe galleries can concentrate a variety of pipelines in their structures, which is of positive significance in improving the efficiency of urban infrastructure management and reducing the interference of repeated road excavations on urban traffic [1]. As the lifeline project of the city, the safety of the underground pipe gallery under vibration load is receiving more and more attention [2]. In the past, researchers mainly focused on the stability of underground pipe galleries under seismic load [3,4,5]. However, there is less attention paid to weak vibrations, e.g., vehicle vibration, dynamic compaction, and machine vibration. Although the amplitude of these weak vibrations is small, it has the characteristics characterized by long-term repeated action, among them, the connection nodes between two pipe gallery sections are the weakest components of the gallery structures; failure of the connection nodes will result in the damage of the underground pipe gallery structure [6,7,8]. At present, underground pipe galleries are mainly connected by rigid nodes rigid nodes have weak energy dissipation and vibration reduction effects on external loads, which are not conducive to the long-term operation of pipe gallery systems. Therefore, optimizing and innovating the connection nodes of underground pipe galleries has important engineering significance.
In the past, many studies have focused on the underground pipe gallery structure using different methods. In numerical simulation, Li et al. [9] proposed a multi-scale model for the longitudinal seismic response analysis of an underground prefabricated pipe gallery and obtained the multi-point constraint equation between the structural model and the refined joint model. Wu et al. [10] conducted numerical studies on the prefabricated underground pipe gallery under the action of reverse faults. It was found that the change in the friction coefficient of the trench soil had little effect on the deformation of the overall structure and the splicing joints. Wang et al. [11], Yang et al. [12], and Zhao et al. [13] analyzed the underground pipe gallery structure under the action of soil settlement. It is concluded that local tensile damage of the pipe gallery will occur under the influence of the uneven settlement of the soil, which contributes to the large difference between the pipe gallery structure and the soil stiffness; Yang et al. [14] studied the deformation characteristics of the pipe gallery at different depths. The results show that the maximum deformation is inversely proportional to the buried depth, and increasing the buried depth can reduce the influence of the disturbance on the pipe gallery. Deng et al. [15] analyzed the mechanical behavior of the underground pipe gallery in the ground fissure area in detail by numerical simulation. The stress and strain characteristics of the pipe gallery structure and the surrounding soil under static and dynamic conditions were obtained. Ma et al. [16] analyzed the deformation, stress, internal force, and safety factors of the urban underground pipe gallery by the finite difference method. It is concluded that the overall buffer layer scheme is more suitable for the existing seismic design of the pipe gallery. In the aspect of model testing, Zhao et al. [17] proposed a double-layer pre-supporting system to protect the underground pipe gallery and discussed the mechanism from the perspective of passive protection and active reinforcement. Tian et al. [18] studied the influence of groundwater on the stress of the underground pipe gallery. The results show that the stress on the top and bottom of the underground pipe gallery increases continuously with the increase in the groundwater level, and the stress on the side wall decreases gradually. Duan et al. [19], Liang et al. [20], and Li et al. [21] studied the seismic response of an underground pipe gallery by using a shaking table test. It is found that the failure mechanism of a shallow buried underground pipe gallery mainly depends on the inhomogeneity of foundation soil conditions; the closer to the interface of soft and hard soil layers, the greater the axial compressive strain. In the aspect of theoretical analysis, Liu et al. [22] and Wei et al. [23] modeled the soil–structure interaction by a discrete soil spring element, analyzed the seismic response of the pipe gallery, and evaluated the seismic performance of the pipe gallery under two working conditions. Xiang et al. [24] proposed an analytical calculation method to predict the deformation of the underground pipe gallery caused by adjacent deep foundation pit excavation. It concluded that the most effective method to simplify the pipe gallery as an elastic beam on a Winkler foundation was to calculate its deformation. Based on the heat conduction equation, Liu et al. [25] established a temperature evaluation propagation model of the pipe gallery and revealed the evolution process of the temperature of the pipe gallery structure in both time and space.
The above-mentioned scholars have studied the overall structure of the pipe gallery, and other scholars have also studied the nodes of the pipe gallery. Zhang et al. [26] discussed the deformation mechanism of the underground pipe gallery through the theoretical analysis of ground fissures. It shows that ground fissure movement is the main factor affecting the change in underground pipe gallery connection nodes. Dong et al. [27], Liang et al. [28], and Xu et al. [29] conducted research on pipe gallery nodes and found that under the same load displacement, the greater the load distance and bending moment of the connecting node, the greater the opening deformation of the connecting node. Chen et al. [30] established a load structure analysis model for the underground pipe gallery. The results show that under the action of a strong earthquake, the maximum inter-story displacement angle of the pipe gallery connection node exceeds the standard limit by about 184%, and the tensile failure can reach 0.985, which exceeds the tensile failure limit. Zhu et al. [31] completed the quasi-static test of the connection joint specimen of the four-chamber large-section pipe gallery. They found that the load curve tends to be horizontal after the overall structure of the pipe gallery reaches the ultimate load. The test results show that the greater the foundation stiffness, the greater the bending moment of the connection node under the same load displacement, resulting in a greater opening deformation of the connection node. However, stress concentration is prone to occur at the nodes of rigidly connected pipe galleries, leading to the failure of the underground pipe gallery system. Therefore, flexible-connection nodes with vibration reduction and energy dissipation functions have more potential for the long-term operation and maintenance of underground pipe gallery structures.
Drawing on the principle of human bionics, this study presents a “skin-tendon” flexible-connection node structure for prefabricated underground pipe galleries. In the design, the polyurea elastic connector serves as the “outer skin”, and the spring vibration isolation bearing acts as the “inner rib”. During on-site construction, prefabricated pipe gallery sections are first transported to the location. At the connection nodes between adjacent sections of the pipe gallery, a series of construction steps are carried out sequentially: the spring vibration isolation support is assembled through an insertion method, followed by the installation of formwork and the pouring of a polyurea grouting slurry. A series of model tests are conducted to further understand the performance of this structure, and the force transmission characteristics of the “skin-tendon” flexible-connection joint structure under weak vibrations (e.g., dynamic compaction and machine operation) are explored. The results of this study are expected to offer valuable insights and references for the practical engineering applications of connection nodes in prefabricated underground pipe galleries.

2. The Concept of a “Skin-Tendon” Flexible-Connection Structure

2.1. Source of Inspiration

The human limb joint features a comprehensive damping–buffering joint structure, encompassing skin and internal tendon tissues [32], as depicted in Figure 1a. The outer skin exhibits excellent tensile behavior and a remarkable sealing performance, offering robust protection to the inner tendon tissue. At the same time, the inner tendon tissue is characterized by high toughness and good scalability, effectively buffering external loads. The unique structural form holds a significant reference value for practical engineering applications. Materials with high tensile strength and waterproof capabilities are used in engineering practices. It can be employed to mimic the skin tissue, e.g., rubber, polyurethane, and polyurea grouting. Meanwhile, structures with damping and buffering effects can be used to simulate the internal tendon tissue, e.g., springs and dampers. So, inspired by human bionics, a “skin-tendon” flexible-connection node structure for prefabricated underground pipe galleries is proposed. In this study, a polyurea elastic connector fabricated from a polyurea grouting slurry serves as the “outer skin”, and a spring vibration isolation bearing acts as the “inner rib”. As depicted in Figure 1b, both spring vibration isolation bearings and polyurea elastic connectors are characterized by high toughness and high energy dissipation. The synergistic effect of them can dissipate energy by their own elastic deformation, reducing the damage of the pipe gallery structure caused by vibration loads. In contrast, traditional rigid-connection node structures lack the buffering and energy dissipation capabilities. It is hypothesized that the mechanical behavior of the flexible-connection node structure proposed in this study may outperform that of traditional rigid-connection node structures.

2.2. Construction of Rigid-Connection and Flexible-Connection Nodes

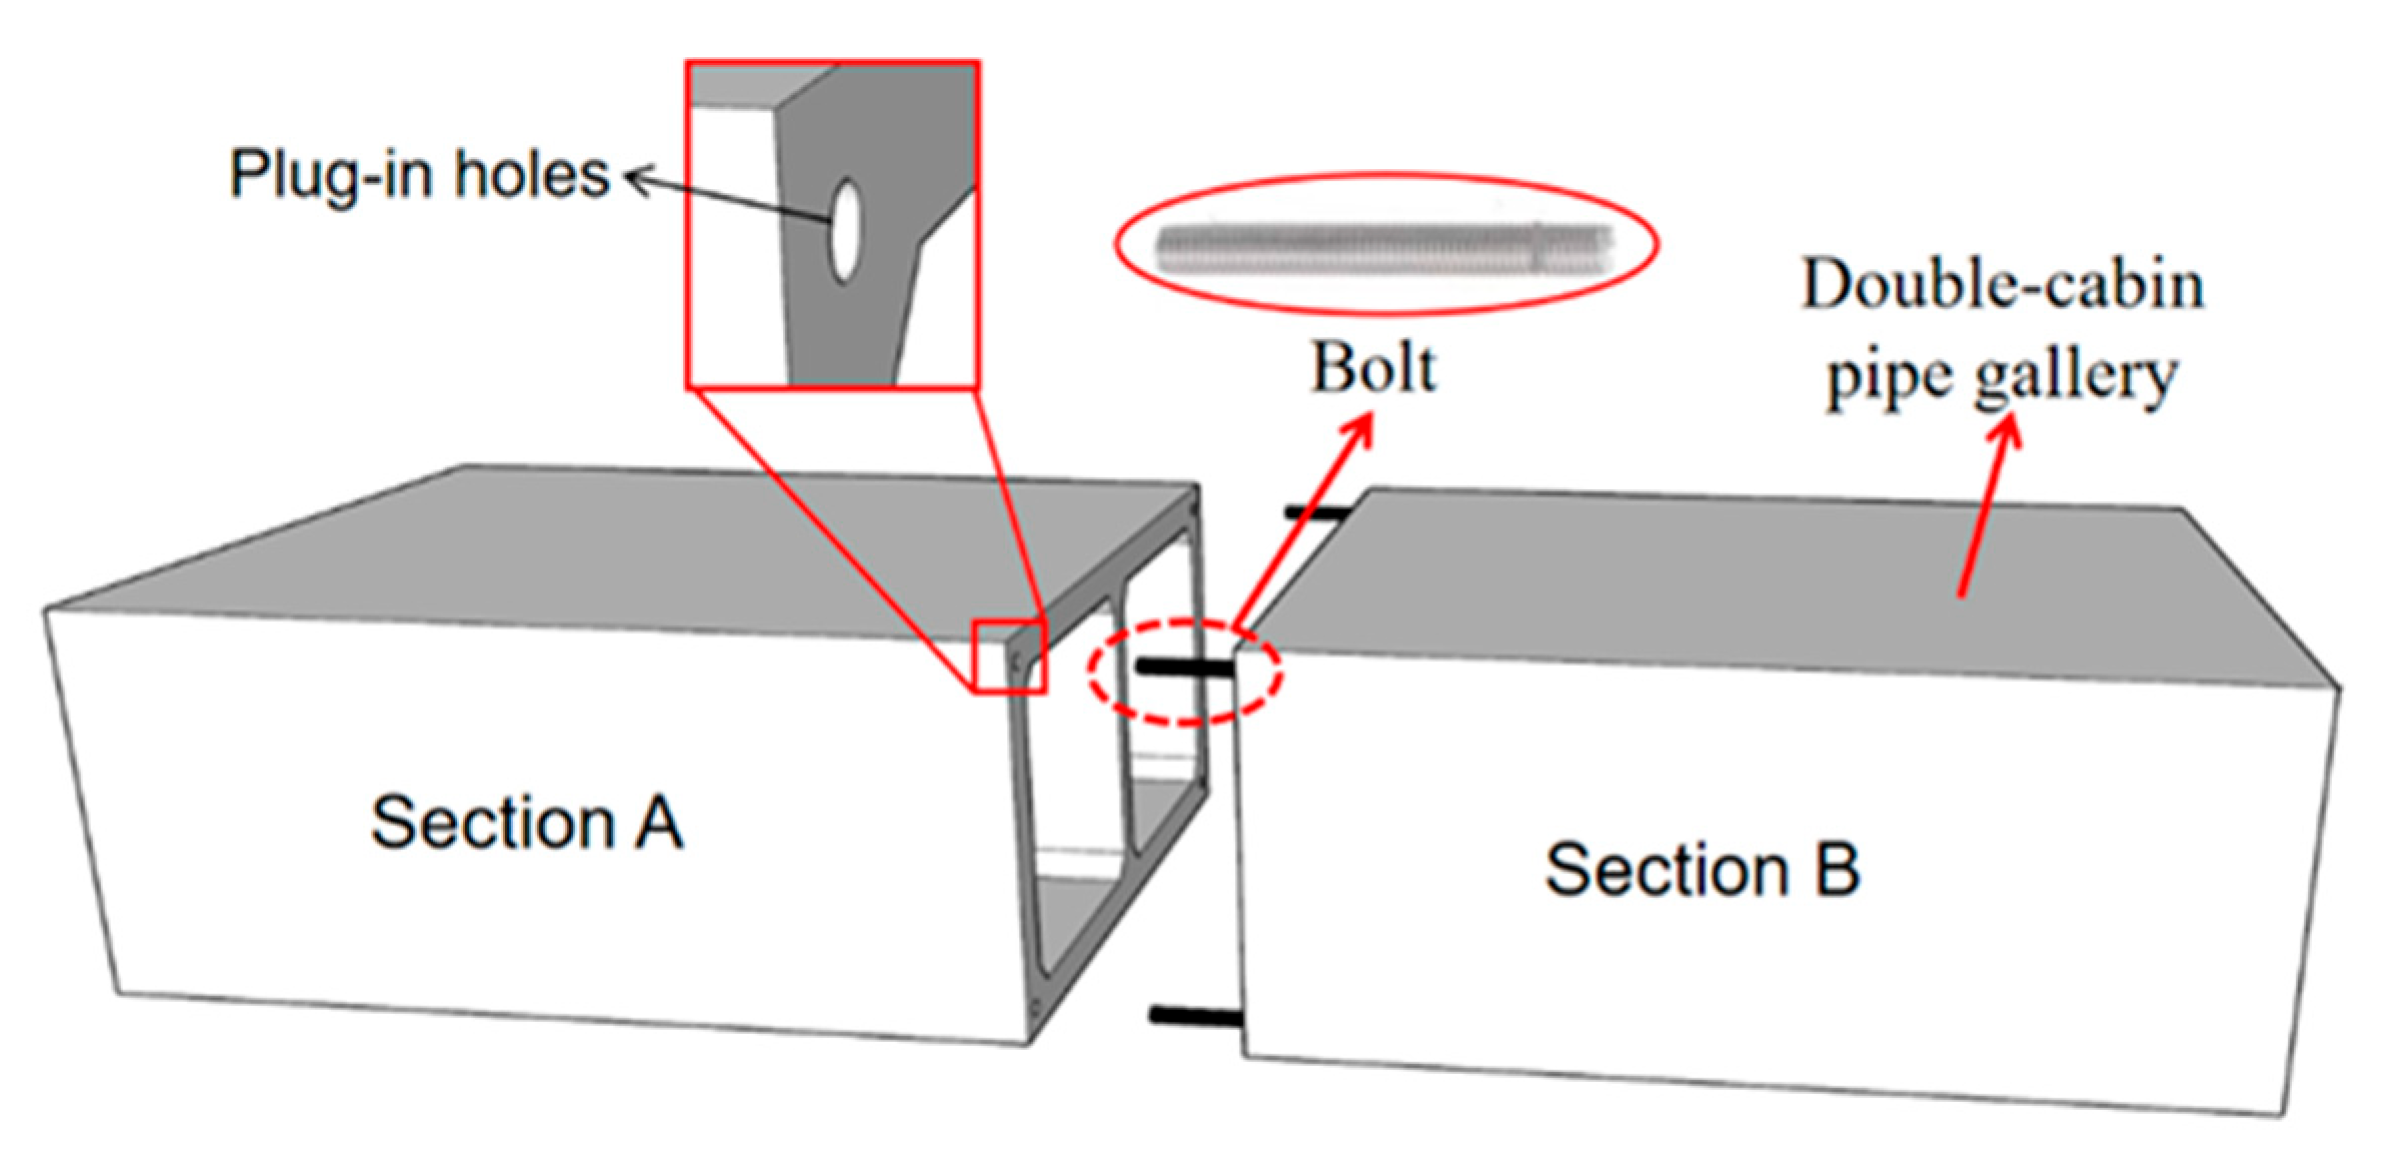
In this study, the underground pipe gallery employs two connection methods, i.e., a rigid-connection node and flexible-connection node, and the double-cabin pipe gallery is designed. As depicted in Figure 2, the typical rigid-connection node structure of the underground pipe gallery section utilizes the embedded bolt plug-in connection approach. The detailed construction steps are as follows: firstly, holes are drilled at the four vertices of section A. Subsequently, planting glue is injected into these holes. Finally, the embedded bolts of section B are inserted into the holes, thus finalizing the construction process of the rigid-connection node structure.
The “skin-tendon” flexible-connection node structure proposed in this study is presented in Figure 3. The flexible-connection pipe gallery consists of a pipe gallery section, spring vibration isolation bearings, and a polyurea elastic connector. The detailed construction steps are as follows: firstly, plug-in holes are drilled at the four corners of section A. Subsequently, the spring vibration isolation bearings pre-embedded in section B are inserted into these jack-in holes. Next, a template is installed at the joint between sections A and B, and the polyurea grouting slurry is poured. It should be noted that the joint width of the experimental model adopted in this study is 20 mm. After the polyurea grouting slurry is solidified, the template is removed, thus finalizing the construction process of the flexible-connection node structure. To investigate the mechanical behavior of the “skin-tendon” flexible-connection pipe gallery structure, this study will adopt two external excitation methods, i.e., machine vibration and dynamic compaction.

2.3. Joint Connection Material

(1)
Polyurea elastic connector material
The cured polyurea elastomer material is a polymer material formed by the reaction of isocyanate (component A) and an amino compound (component R). The polyurea grouting slurry transforms into a polyurea elastic connector [33]. The connector exhibits excellent tensile behavior and high elongation at the break. Properties are presented in Table 1. It demonstrates a strong bonding strength with the concrete material of the underground pipe gallery [34]. Remarkably, it can rapidly solidify within a short period and tightly adhere to the surface of the grouted concrete in the underground pipe gallery. Moreover, compared to materials (e.g., rubber and polyurethane) with a similar performance, such as rubber and polyurethane, polyurea elastic connectors possess superior wear resistance [35].
(2)
Spring vibration isolation bearing
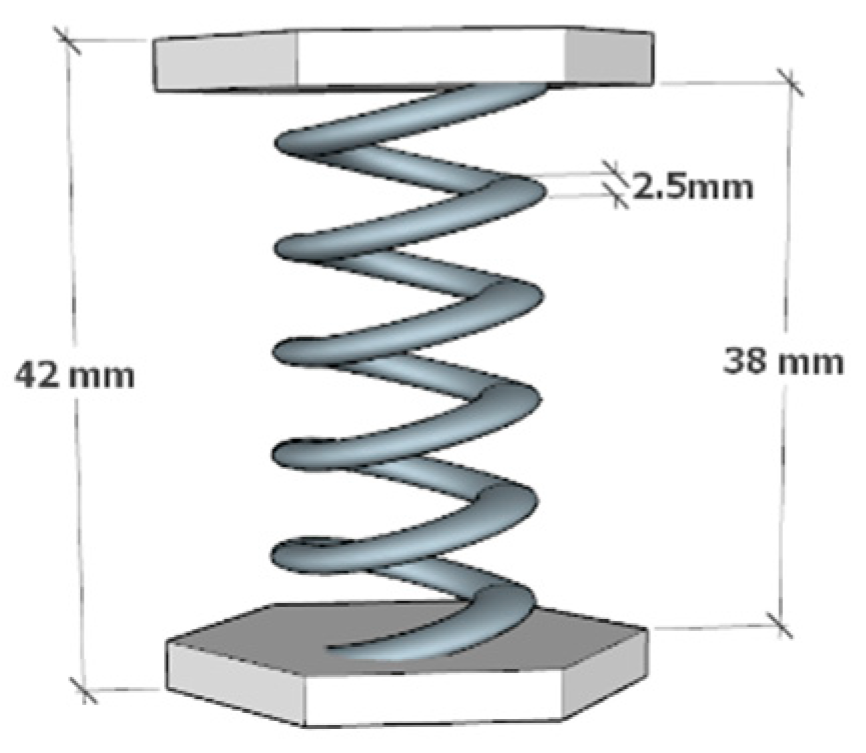
As depicted in Figure 4, the spring vibration isolation bearing exhibits an excellent self-centering capability. Owing to the elastic deformation of the spring, it can effectively decelerate vibrations. Specifically, the vibration energy induced by the external load is efficiently transformed into the elastic potential energy of the spring, which in turn mitigates the vibration transmitted to the support structure. During the design stage, the numbers and properties of the springs are meticulously determined based on the magnitude of the external load. Moreover, the bearing is equipped with a sufficient lateral support capacity. This feature is crucial, as it prevents experiencing the offset or tipping of the bearing during the vibration process. The detailed specification parameters of the springs used in this study are presented in Table 2.
(3)
Material behavior of embedded bolt
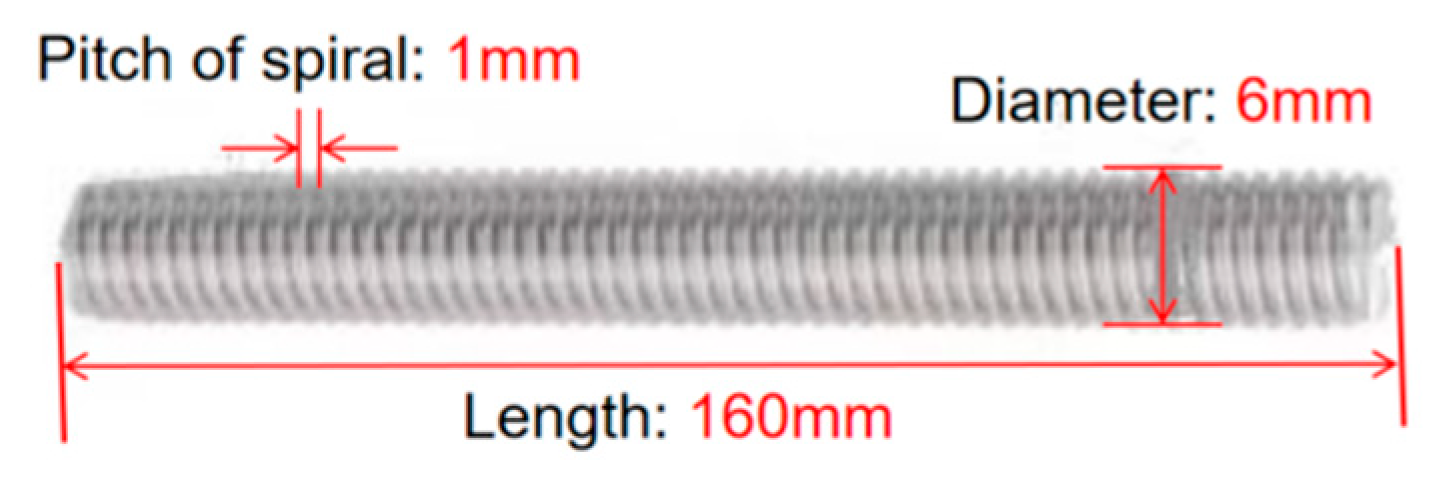
In this study, the M6 bolt is well-suited for simulating the rigid-connection node structure [36]. As shown in Figure 5, the M6 bolt is employed in the rigid-connection joint structure of the model test. The nominal diameter of an M6 bolt is 6 mm, the standard thread pitch is 1 mm, the tensile strength is approximately 400 MPa, and the shear strength is around 320 MPa. Made of stainless steel, the M6 bolt measures 160 mm long, and the embedding depth is about 60 mm within the pipe section. During the test, the M6 bolt can effectively withstand the vibration effects, guaranteeing the connection’s reliability and safety.

3. Design of Model Test

3.1. Similarity Relation of Physical Quantity in Model Test

According to the Buckingham π theorem, the similarity relationship between the prototype and the model is determined based on the similarity ratio of each physical quantity, as presented in Table 3. The underground pipe gallery model adopts a commonly used double-cabin structure. According to the Technical standard for urban pipe gallery engineering [37], the prototype of the pipe section has a cross-sectional size of 9.0 m × 6.0 m × 3.0 m (length × width × height) and is buried at a depth of 2.25 m. The pipe gallery model’s cross-sectional size is 60 cm × 40 cm × 20 cm (length × width × height), and the pipe section’s buried depth is 15 cm. Consequently, the geometric similarity ratio Cl between the model and the prototype is set to 15. The prototype is made of C35 concrete, and the double-cabin pipe gallery model is fabricated using cement mortar (water–mud–sand = 0.65:1:3) through prefabricated technology, as shown in Table 4a. The process of adjusting the material ratio of the cement mortar is crucial in achieving the desired similarity ratios. By this process, the elastic modulus similarity ratio to the prototype’s C35 concrete material is achieved as 3, the strain similarity ratio is 1, the stress similarity ratio is 3, and the density similarity ratio is 1.2. The soil used in the experiment is natural clay taken from Qinhuangdao, China. After remolding and screening, the clay is filled layer by layer into the model box. Using direct shear tests, the performance parameters of the clay are determined. Physical and mechanical parameters are shown in Table 4b.

3.2. Model Test System and Sensor Layout

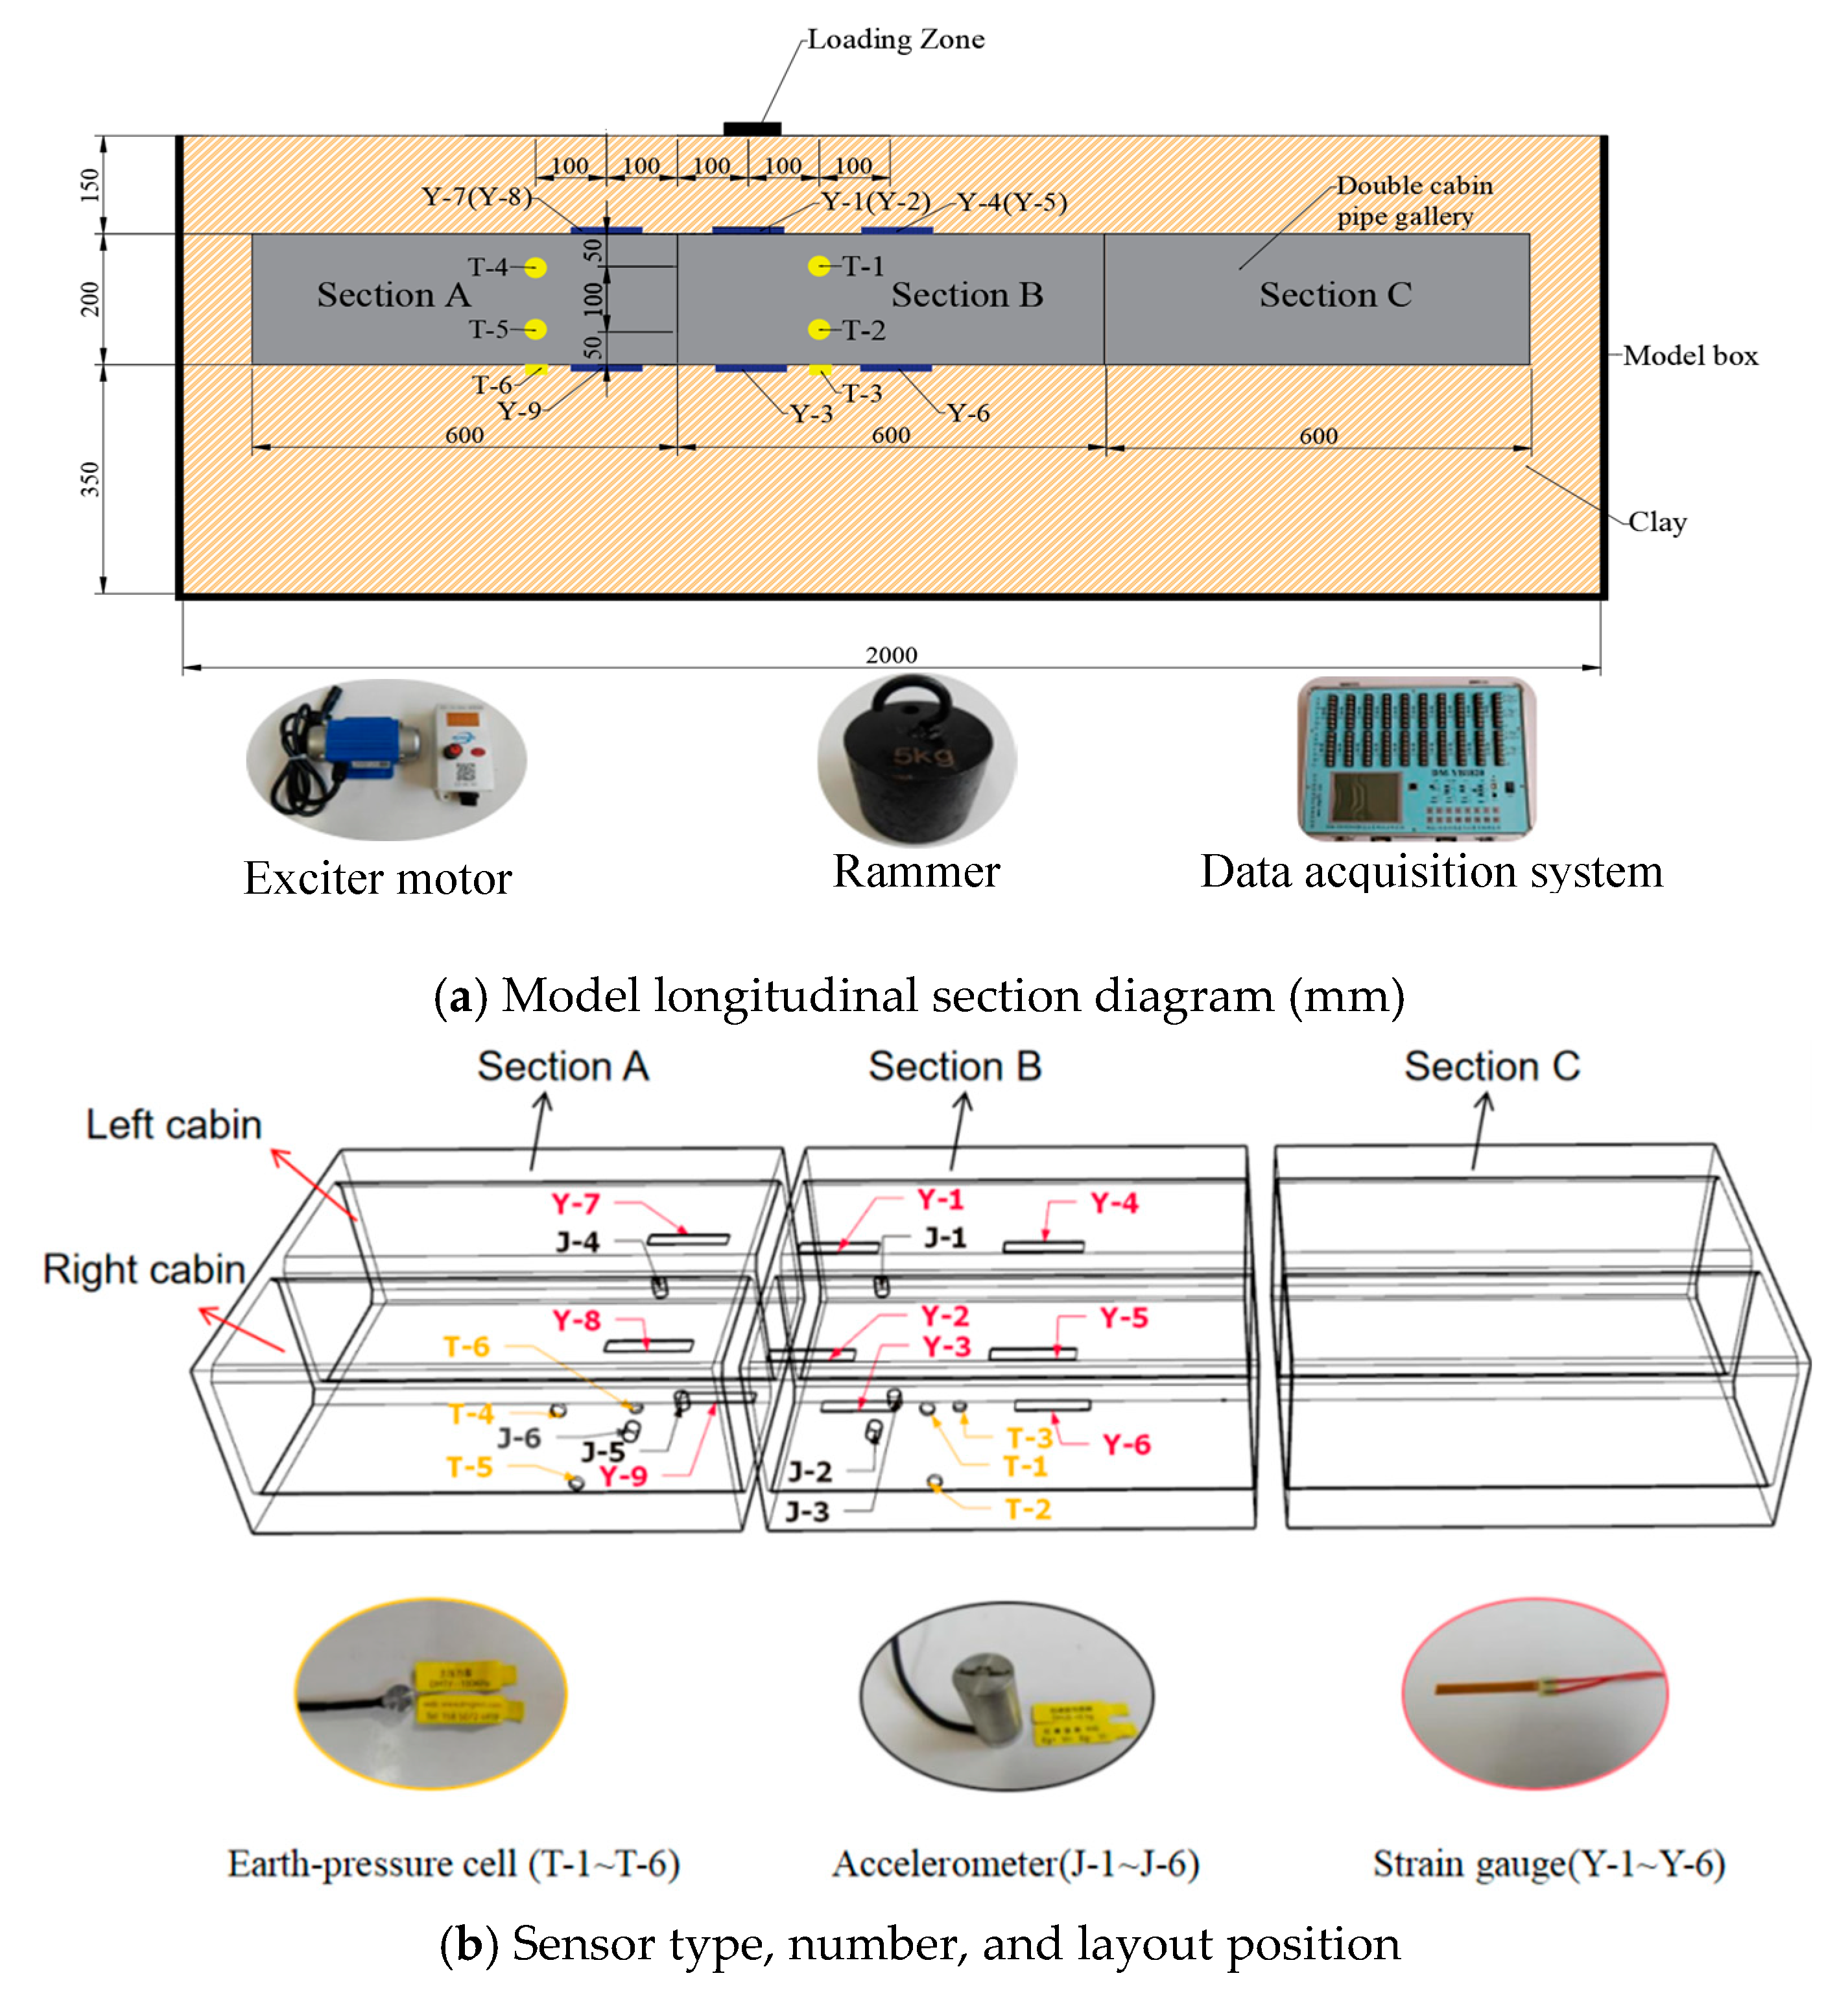
As presented in Figure 6a, the model test system is composed of a model box, two-compartment pipe gallery sections, sensors, external excitation sources (rammer and vibration motor), and a data acquisition system. The model box has dimensions of 2 m × 1.2 m × 0.7 m (length × width × height). The data acquisition system employs the DM-YB1820 dynamic and static strain test system along with its accompanying software, the frequency of which ranged from 0 to 1 kHz. Regarding the vibration load, the horizontal and vertical distances between the loading zone and the section B node are 10 cm and 15 cm, respectively.
This study employed three sensor types: DMJS accelerometers, DMTY100 earth pressure cells, and 120-5-AA weld-free strain gauges. These instruments are strategically deployed to capture dynamic responses of the double-cabin pipe gallery model during machine vibration and dynamic compaction processes.
As shown in Figure 6, the double-cabin pipe gallery model exhibits a symmetrical structure. Sensors are solely installed in pipe gallery section A and pipe gallery section B. Accelerometers are positioned at the following locations: on the roof (J-1), side wall (J-2), and floor (J-3) of the right cabin in pipe gallery section B. And on the roof (J-4), side wall (J-5), and floor (J-6) of the right cabin in the pipe gallery section A. Regarding the earth pressure cells, T-1 to T-3 are arranged vertically from top to bottom on the side wall of pipe gallery section B, while T-4 to T-6 are placed in the same vertical order on the side wall of pipe gallery section A, then buried at depths of 20 cm, 30 cm, and 35 cm, respectively. For the strain gauges, Y-1, Y-2, Y-4, and Y-5 are installed on the roof of pipe gallery section B; Y-3 and Y-6 are located on the floor of pipe gallery section B. Y-7 and Y-8 are set on the roof of pipe gallery section A, and Y-9 is arranged on the floor of pipe gallery section A.
According to the Technical code for building foundation treatment [38], the range of the tamping weight is 10–60 t, and the height is 40 m. In this study, the height similarity ratio is adopted as 15, and heights are 0.6 m, 0.8 m, and 1 m, respectively. It corresponds to the drop heights in the field of 9 m, 12 m, and 15 m, respectively, which are in the range of the field height. The quality similarity ratio is adopted as 4050, and the rammer quality is 5 kg (as depicted in Figure 6a). It corresponds to the quality in the field of 20,250 kg; the detailed information can be found in Table 5. The machine vibration parameters are shown in Table 6. In this study, vibration loads are 0.134 kN and 0.207 kN, the similarity ratio of concentrated load is 675, and the corresponding field vibration loads are 90 kN and 140 kN. Vibration frequencies are 220 Hz and 330 Hz, the similarity ratio of the vibration frequency is 0.11, and the corresponding field vibration frequencies are 20 Hz and 30 Hz. The machine vibration is generated by an excitation motor, which is connected to a 10 mm thick steel plate at the bottom, Figure 6a. The detailed information can be found in Table 6.

3.3. Installation Steps of the Pipe Gallery

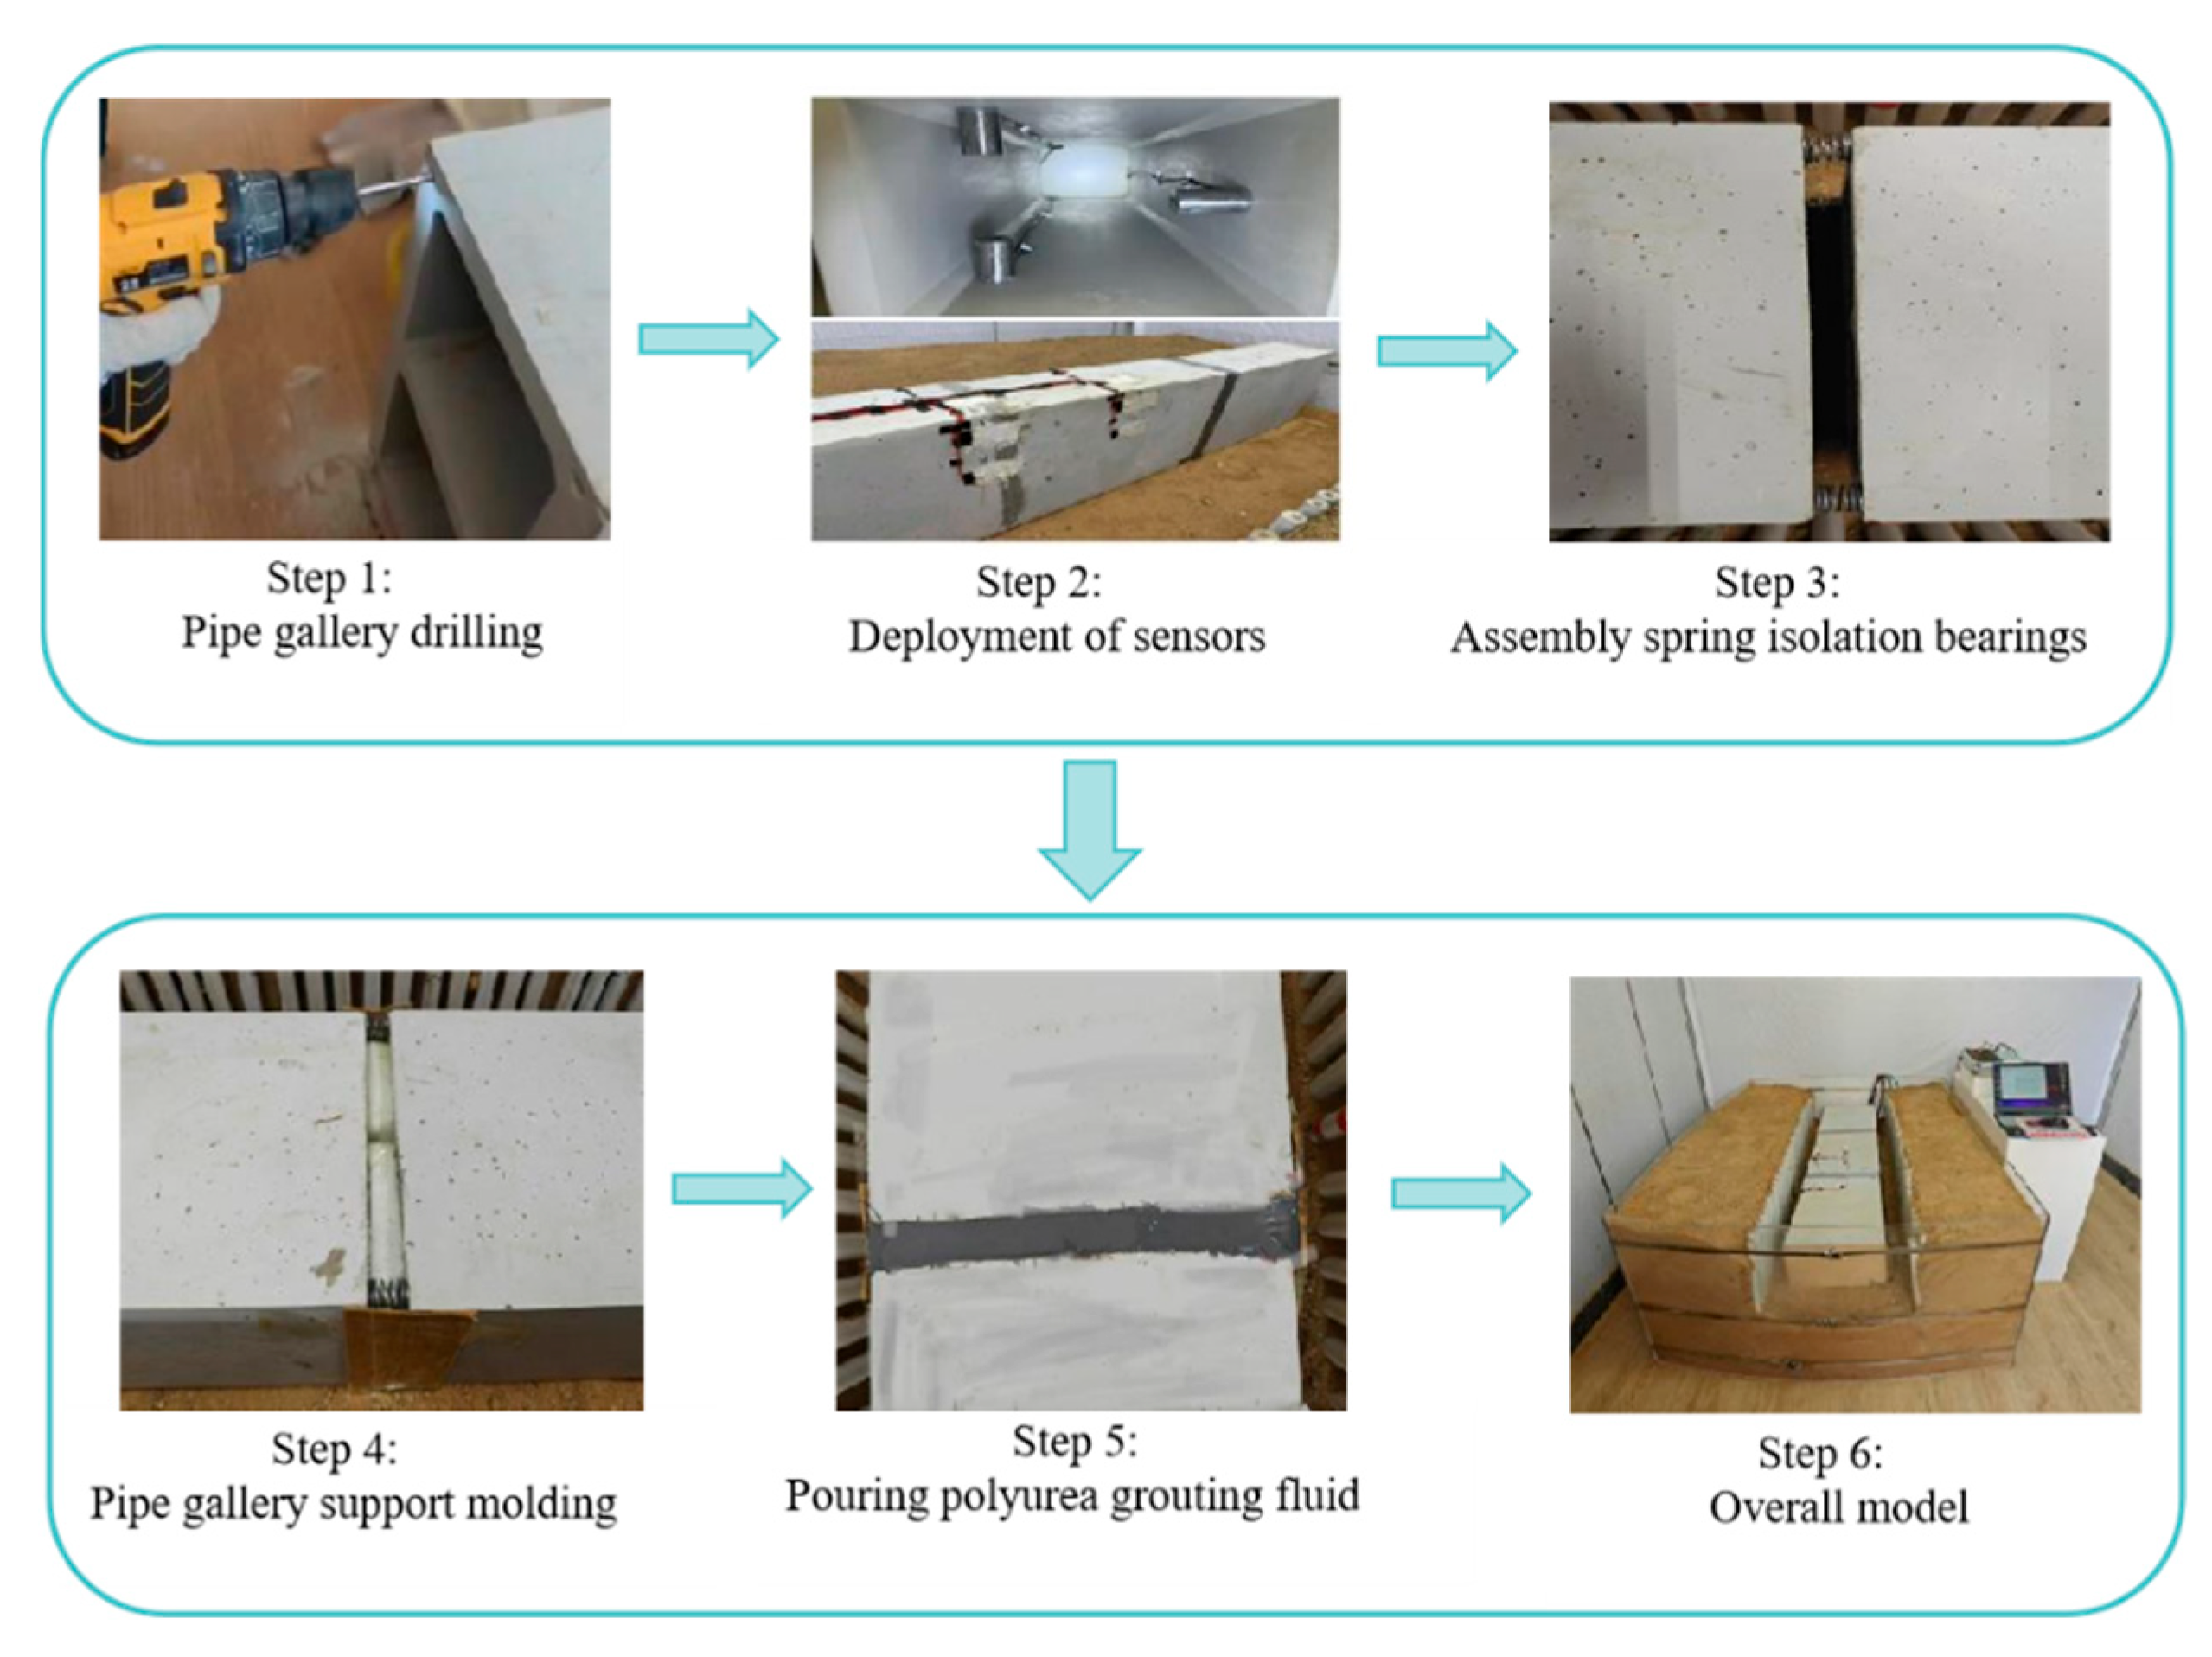
The installation processes of the flexible-connection pipe gallery model are shown in Figure 7; the detailed steps are as follows: (1) the hand-held electric drill is used to drill the four corners on the double-cabin pipe gallery section, and then the high-pressure air pump is used to clean the residue in the hole. (2) The acceleration sensors are installed in the right cabin of the double-cabin pipe gallery section, and the strain gauge and earth pressure cell are installed on the outer wall of the pipe gallery section. (3) Fill the gap in the plug-in hole with the help of planting glue, and then the spring vibration isolation bearings are installed at the connection node of the two pipe gallery sections. (4) The connection nodes of the pipe gallery section are formed with wooden boards, and the cabin is sealed with pearl cotton foam. (5) The polyurea grouting slurry is injected into the joint of the pipe gallery section, and the formwork is demolded after curing. (6) After demolding, the integral model of the connected pipe gallery is placed in the model box. In addition, steps 1 and 2 of the rigid-connection pipe gallery model are the same as those of the flexible-connection pipe gallery model. The spring vibration isolation bearings in step 3 are replaced by bolts, which are filled with planting glue and then plugged. Moreover, in steps 4 and 5, the template is not installed. After the connection is completed, the whole model of the pipe gallery is placed in the model box.

3.4. Test Scheme

In the test, six double-cabin pipe gallery sections of the same size are designed. Among them, three are employed for fabricating the rigid-connection pipe gallery model, while the others are used for the flexible-connection pipe gallery model. The test scheme is presented in Table 7. Here, RG denotes the rigid-connection pipe gallery, FG represents the flexible-connection pipe gallery, DC represents the dynamic compaction effect, and VA indicates the machine vibration effect. For the rigid-connection pipe gallery model, three groups of dynamic compaction tests (RG-DC-1, RG-DC-2, and RG-DC-3) and two groups of vibration tests (RG-VA-1, RG-VA-2) are conducted. Similarly, for the flexible-connection pipe gallery model, three groups of dynamic compaction tests (FG-DC-1, FG-DC-2, and FG-DC-3) and two groups of vibration tests (FG-VA-1, FG-VA-2) are carried out. In the dynamic compaction tests, the weight and drop distance of the hammer are taken as variables, and each group’s dynamic compaction test includes seven compactions. Regarding the vibration tests, the vibration frequency and vibration load are used as variables, and the vibration duration for each group’s vibration test is 20 s.

4. Results

In this section, the mechanical behavior of the flexible-connection pipe gallery and rigid-connection pipe gallery under dynamic compaction and machine vibration is studied. The evolution of acceleration, dynamic strain, and dynamic earth pressure are analyzed.

4.1. Response Analysis of the Pipe Gallery Under Machine Vibration

4.1.1. Acceleration

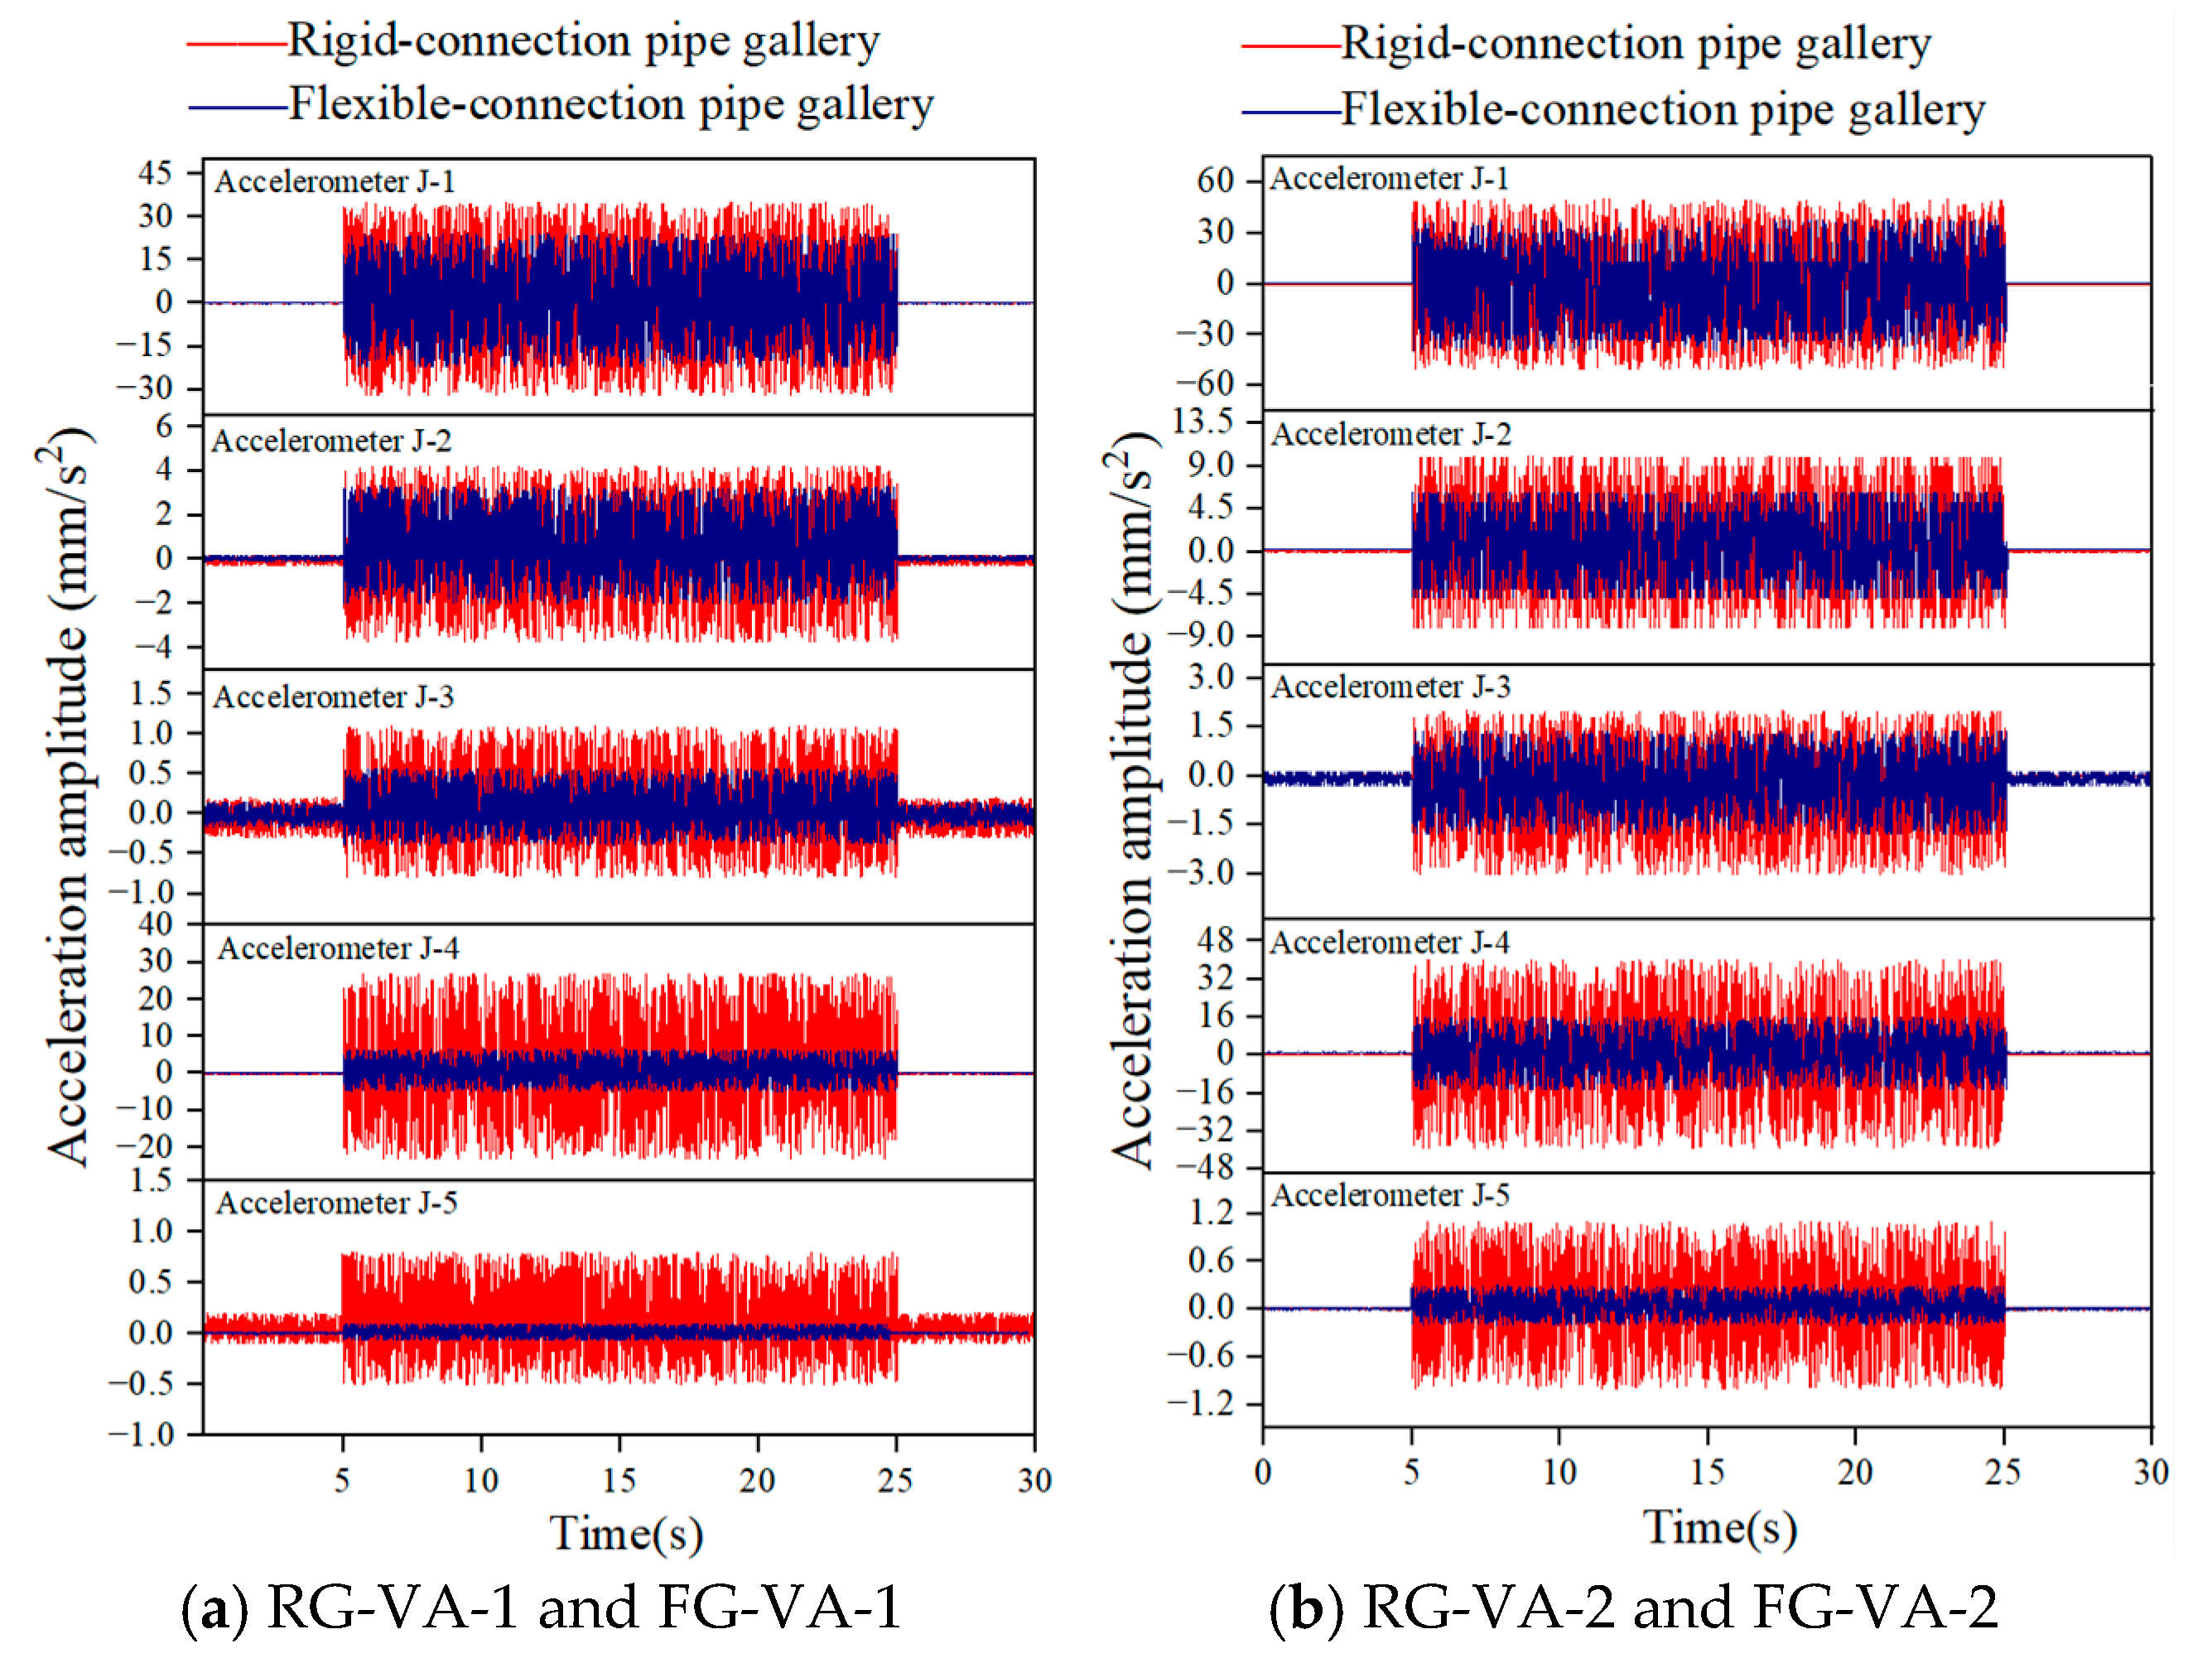
As depicted in Figure 8, the vibration acceleration curves of the rigid-connection and flexible-connection pipe galleries are similar, but their amplitudes are significantly different. The vibration load area of the machine and the acceleration measuring points J-1 to J-3 are situated on the same side of the connection node (in section B of the pipe gallery). In this case, the vibration acceleration generated by the vibration load does not propagate across the connection node. Owing to the elastic support buffering effect of the flexible-connection node at the boundary of section B of the pipe gallery, the acceleration amplitude of the flexible-connection pipe gallery at measuring points J-1 to J-3 is slightly lower than that of the rigid-connection pipe gallery. Conversely, the machine vibration load area (in section B of the pipe gallery) and the acceleration measuring points J-4 and J-5 (in section A of the pipe gallery) are located on opposite sides of the connection node. Here, the vibration acceleration produced by the machine vibration load propagates horizontally through the connection node. The flexible-connection node exhibits a better energy dissipation effect than the rigid-connection node, which leads to a notable reduction in the amplitudes at measuring points J-4 and J-5. From the above comparison, it is evident that the flexible-connection node effectively mitigates the adverse impact of the machine vibration load on the pipe gallery structure. It should be noted that, due to the inherent geometric height of the accelerometer, the acceleration time–history curve is asymmetric about the horizontal time axis (the positive acceleration amplitude is slightly larger than the negative one). However, the analysis of test results is not affected by it.
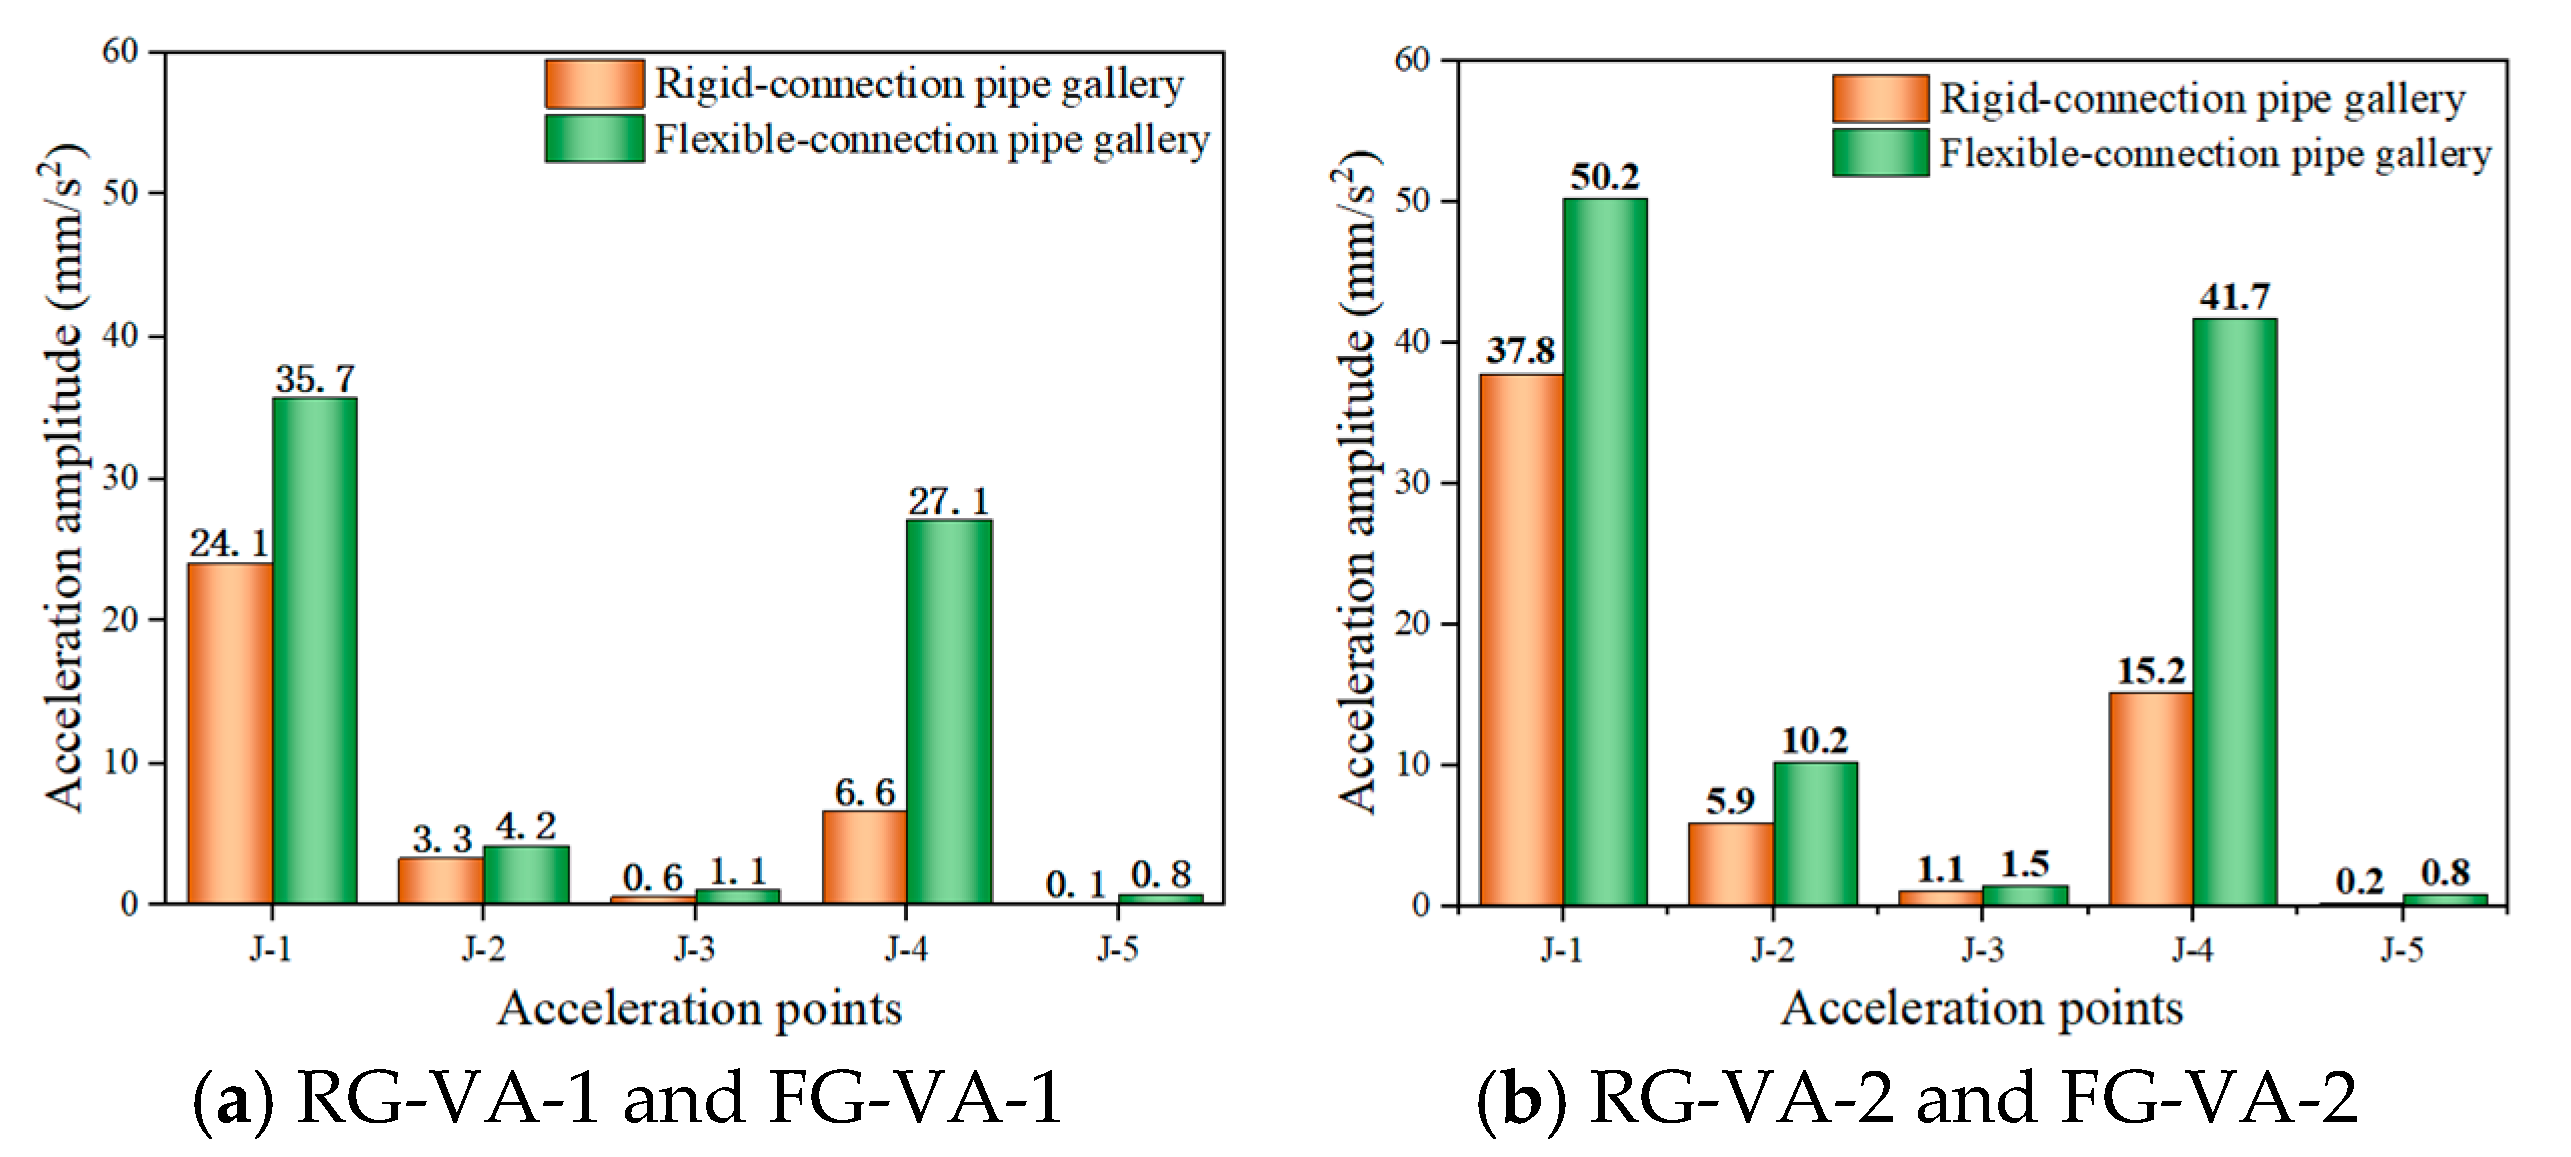
The y-axis data in Figure 9 represents the peak acceleration in Figure 8. Under the machine vibration load of 220 Hz/0.134 kN, it could be found that the acceleration peak values of the flexible-connection pipe gallery exhibit a notable reduction. Specifically, at the acceleration measuring points J-1 to J-3, the reduction ranges from 21.4% to 45.5%. And at points J-4 and J-5, the reduction spans from 74.5% to 87.5%. Similarly, under the machine vibration load of 330 Hz/0.207 kN, the flexible-connection pipe gallery also outperforms the rigid-connection one regarding the vibration acceleration. At points J-1 to J-3, the peak values of the vibration acceleration are reduced by 24.7% to 42.1%, and at points J-4 and J-5, the reduction is between 63.5% and 75.5%. The attenuation of the vibration acceleration of the flexible-connection nodes under machine vibration loads is more significant than that of the rigid-connection nodes. (Note: The accelerometer J-6 was damaged, and thus no data were obtained).

4.1.2. Dynamic Strain Response

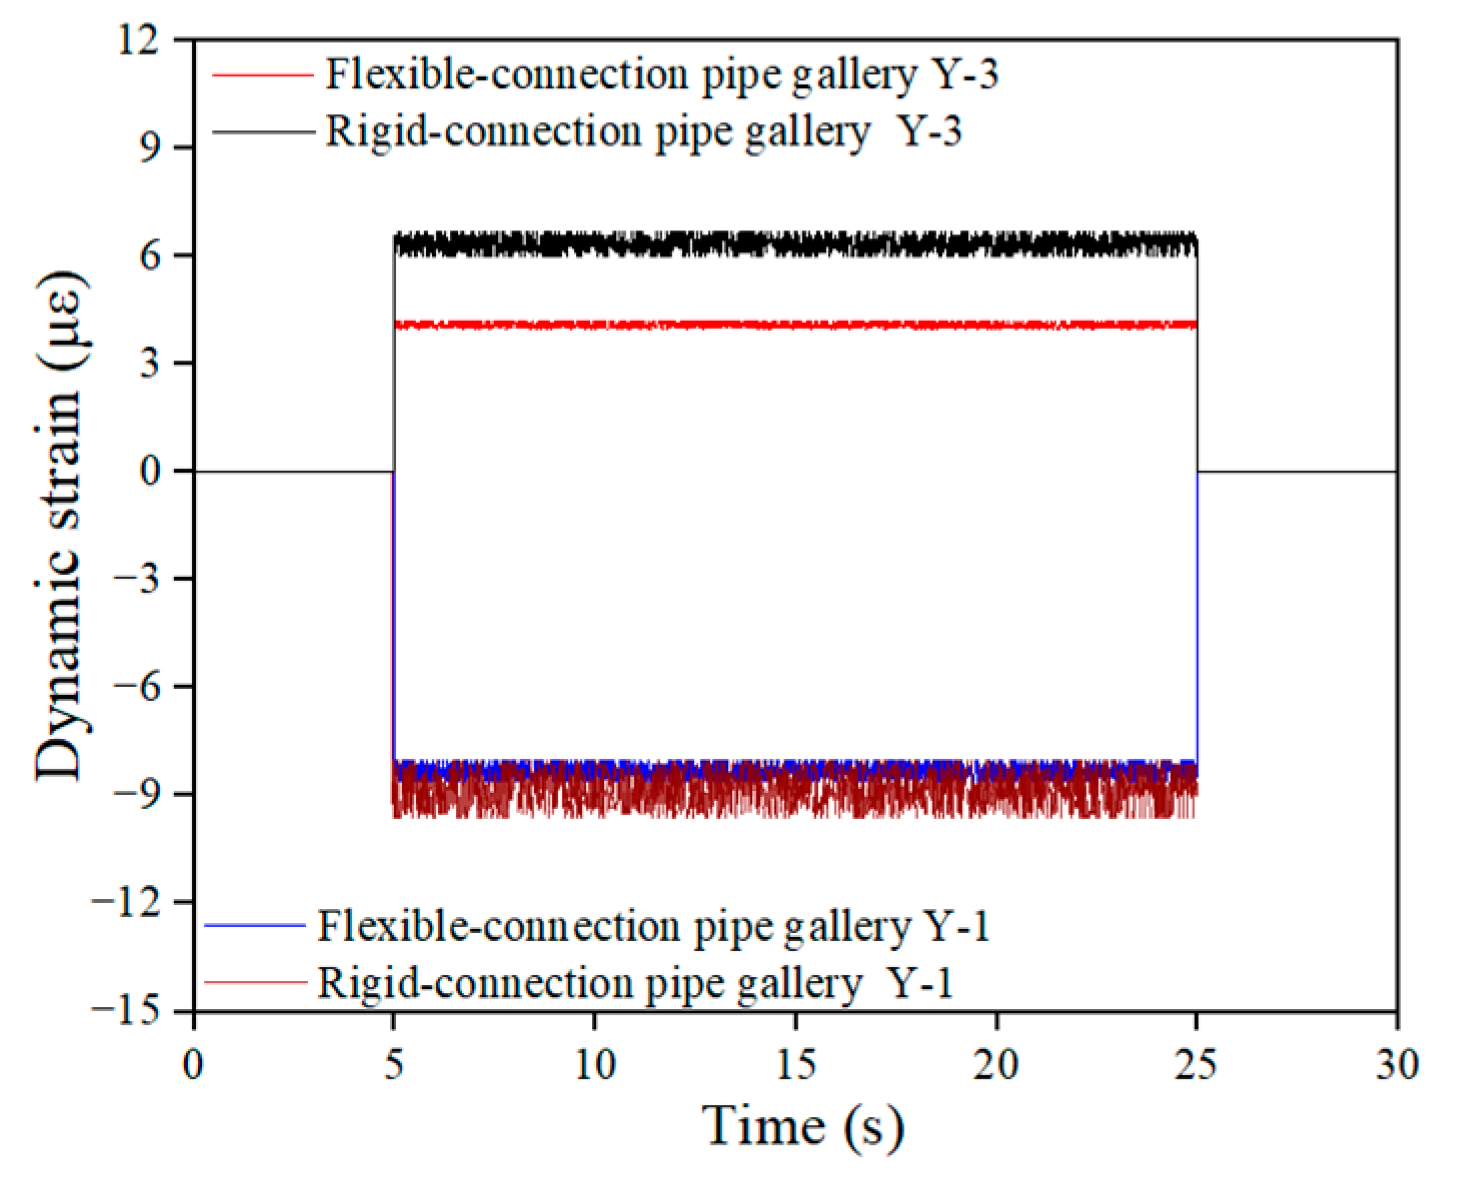
As shown in Figure 10, the monitoring data of dynamic strain measuring points Y-1 to Y-9 under the influence of the machine vibration load exhibit a fluctuating time–history curve. Taking dynamic strain measuring points Y-1 and Y-3 as examples, the dynamic strain of point Y-1 in both the flexible and rigid-connection pipe galleries presents a fluctuating curve with negative values. This indicates that the dynamic strain measuring point Y-1 is compressed. Conversely, the dynamic strain of point Y-3 in the flexible- and rigid-connection pipe galleries shows a wave-like curve with positive values, suggesting that point Y-3 is in a tensile state. Moreover, the monitoring results reveal that the dynamic strain measuring points Y-6 and Y-9 (they are situated at the bottom plate of the pipe section) have positive dynamic strain values, indicating a tensile state. In contrast, the dynamic strain measuring points Y-2, Y-4, Y-5, Y-7, and Y-8 (located at the top plate of the pipe section) display negative dynamic strain values, suggesting a compression state.
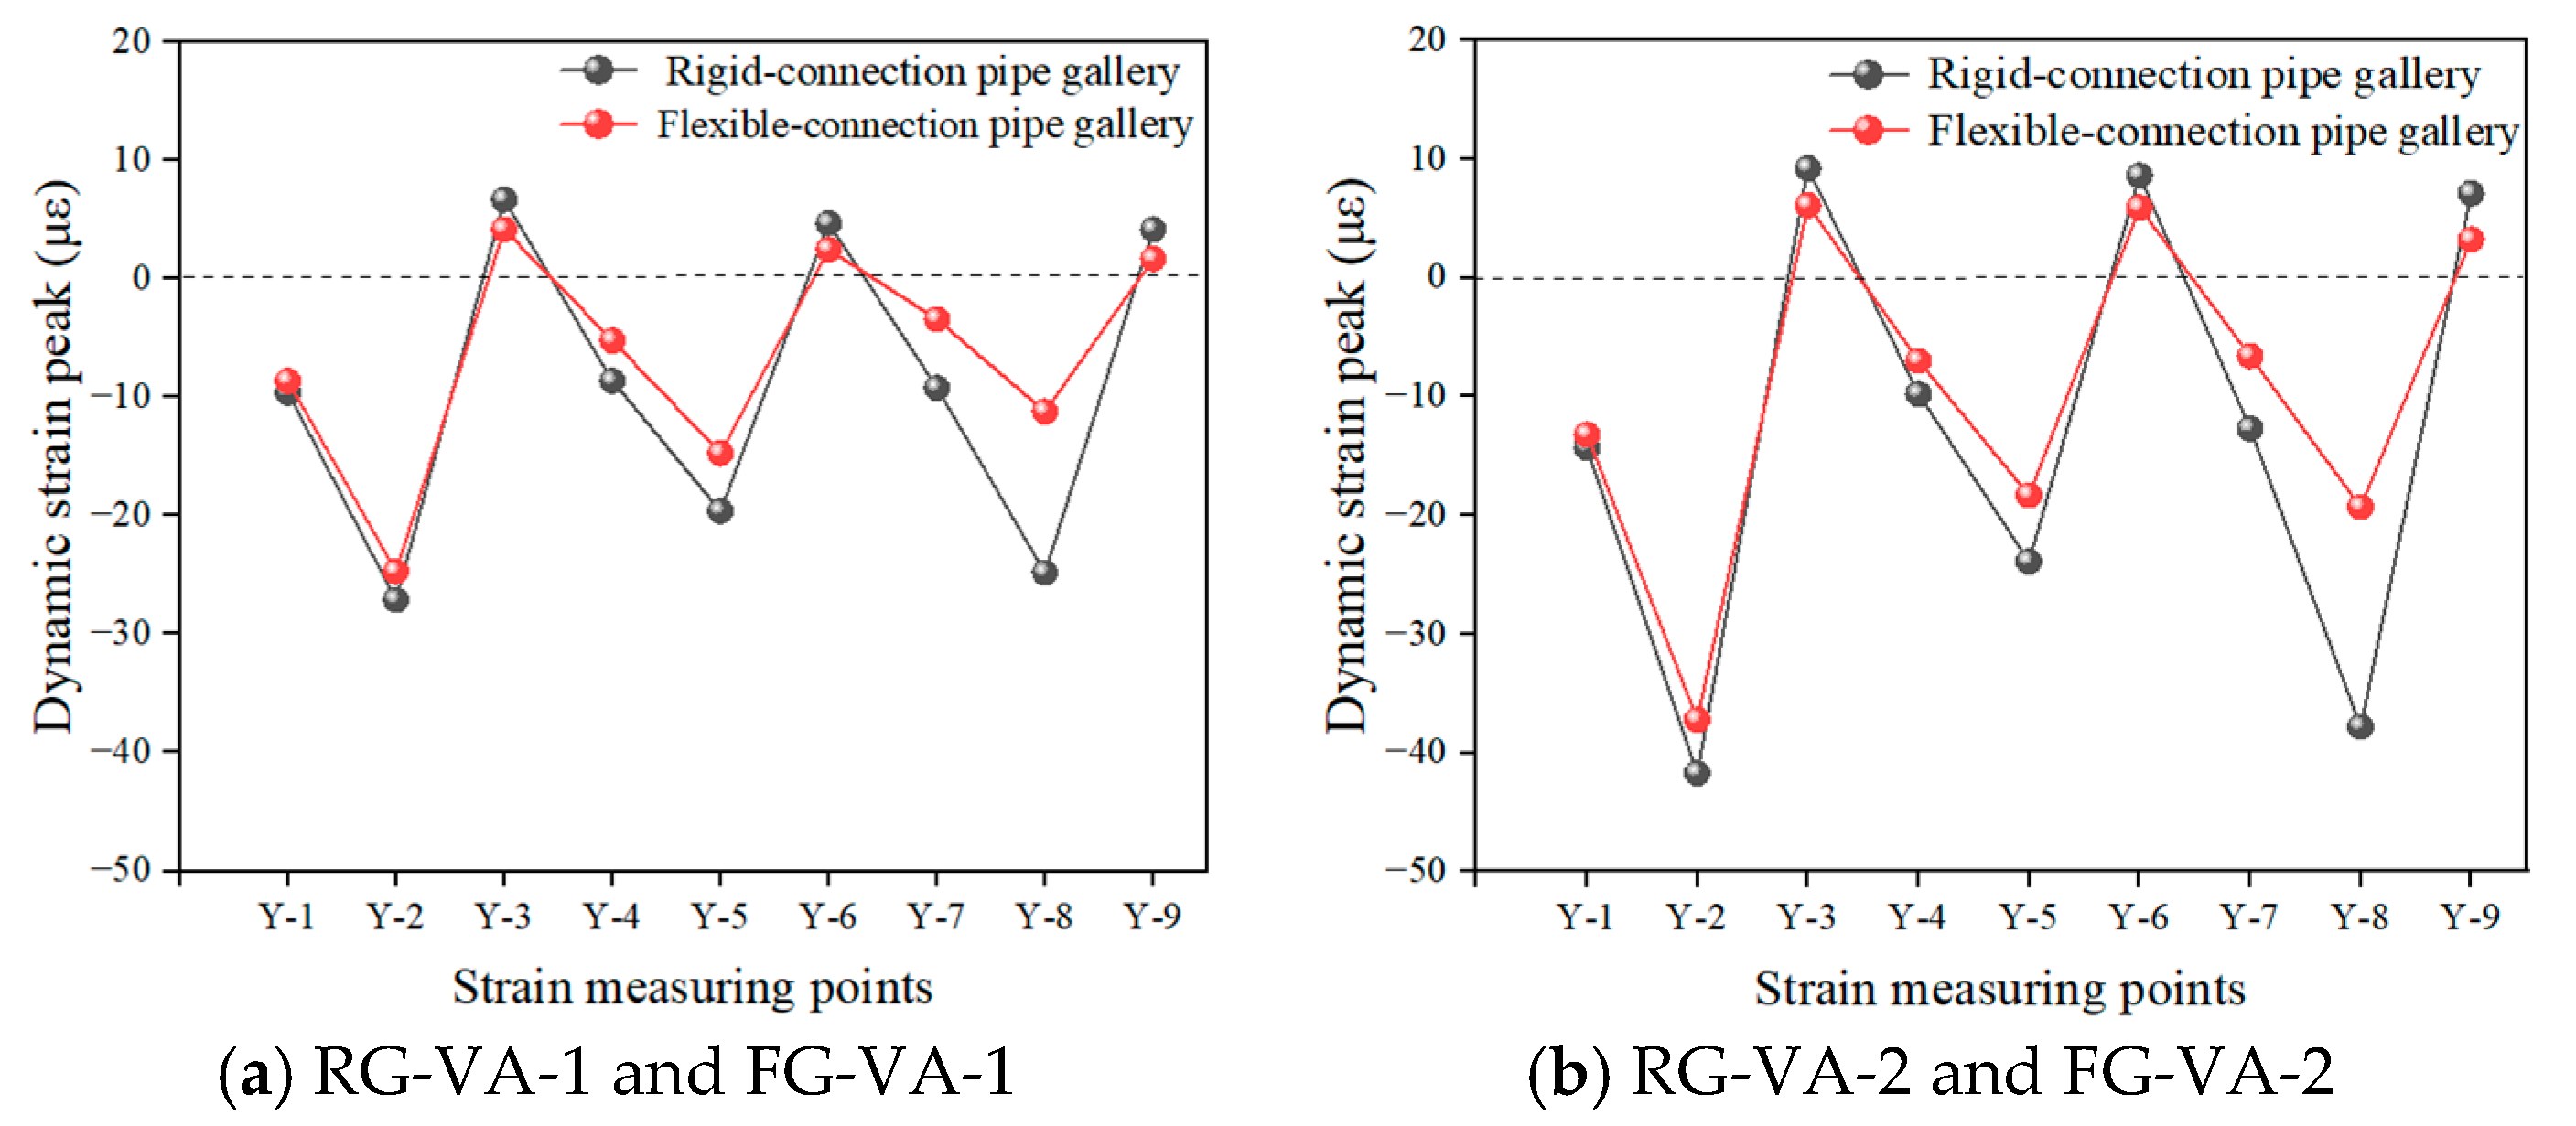
As depicted in Figure 11, the action area of the machine vibration load and the dynamic strain measurement points Y-1 to Y-6 are situated on the same side of the connection node (in section B of the pipe gallery). In this case, the force induced by the machine vibration load does not traverse the connection node. Notably, the flexible-connection node exerts an elastic support and cushioning effect on the boundary of section B of the pipe gallery. Consequently, at the measurement points Y-1 to Y-6, the flexible-connection pipe gallery shows a lower structural stiffness compared to the rigid-connection one. This results in a slight reduction in the dynamic strain at the corresponding positions. Conversely, the action area of the machine vibration load (in section B of the pipe gallery) and the dynamic strain measurement points Y-7 to Y-9 (in section A of the pipe gallery) are located on opposite sides of the connection node. The force generated by the machine vibration load propagates horizontally through the connection node. Compared to the rigid-connection node, the flexible-connection node exhibits a remarkable energy dissipation effect. This causes significant attenuation of the force at the connection node. As a result, the dynamic strain at the measurement points Y-7 to Y-9 is substantially weakened.
As depicted in Figure 11a, when subjected to a machine vibration load of 220 Hz/0.134 kN, the dynamic strain peaks of the flexible-connection pipe gallery at the dynamic strain measuring points Y-1 to Y-6 are 8.8–46.8% lower than those of the rigid-connection pipe gallery. Moreover, at the measuring points Y-7 to Y-9, the reduction in the dynamic strain peak ranges from 54.8% to 63%. Figure 11b shows that under a machine vibration load of 330 Hz/0.207 kN, the dynamic strain peaks of the flexible-connection pipe gallery at the measuring points Y-1 to Y-6 are reduced by 7.6–33.7% compared to the rigid-connection one. At the measuring points Y-7 to Y-9, the reduction in the dynamic strain peak lies between 48% and 54.9%. The connection nodes of the flexible-connection pipe gallery exhibit a more significant weakening effect on the machine vibration load than those of the rigid-connection pipe gallery. Additionally, the absolute value of the maximum dynamic strain of the pipe gallery structure models with these two node connection types does not exceed 100 με, indicating that the strains remain within the elastic range.

4.1.3. Dynamic Earth Pressure

Dynamic earth pressures during machine vibration are presented in Figure 12. It should be noted that static pressure at rest induced by the soil itself is not considered. Once the machine vibration stopped for 20 s, the dynamic earth pressure decayed to zero.
As presented in Figure 12a, under a machine vibration load of 220 Hz/0.134 kN, the peak earth pressures at the dynamic earth pressure measuring points T-1 to T-3 for the rigid-connection pipe gallery are 1.15 kPa, 1.75 kPa, and 0.51 kPa, respectively. In comparison, the peak earth pressures of the flexible-connection pipe gallery at these three points are 4.3%, 2.2%, and 5.8%, which is lower than those of the rigid-connection one. Similarly, in Figure 12b, when the machine vibration load is 330 Hz/0.207 kN, the peak values of the dynamic earth pressure at measuring points T-1 to T-3 for the rigid-connection pipe gallery are 2.65 kPa, 3.81 kPa, and 0.63 kPa, respectively. The corresponding values for the flexible-connection pipe gallery are reduced by 2.6%, 2.8%, and 7.9%, respectively. The machine’s vibration load leads to an unremarkable squeezing effect between the pipe gallery and the soil, resulting in a relatively small dynamic earth pressure. Owing to the energy dissipation characteristic of the flexible-connection node, the lower dynamic earth pressure is obtained.
In addition, no measurable dynamic soil pressure data are recorded at monitoring points T-4 to T-6. This phenomenon can be attributed to the vibration propagation path exceeding the effective transmission range, resulting in the complete dissipation of energy-induced machine vibrations.

4.2. Response Analysis of Pipe Gallery Under Dynamic Compaction

4.2.1. Acceleration

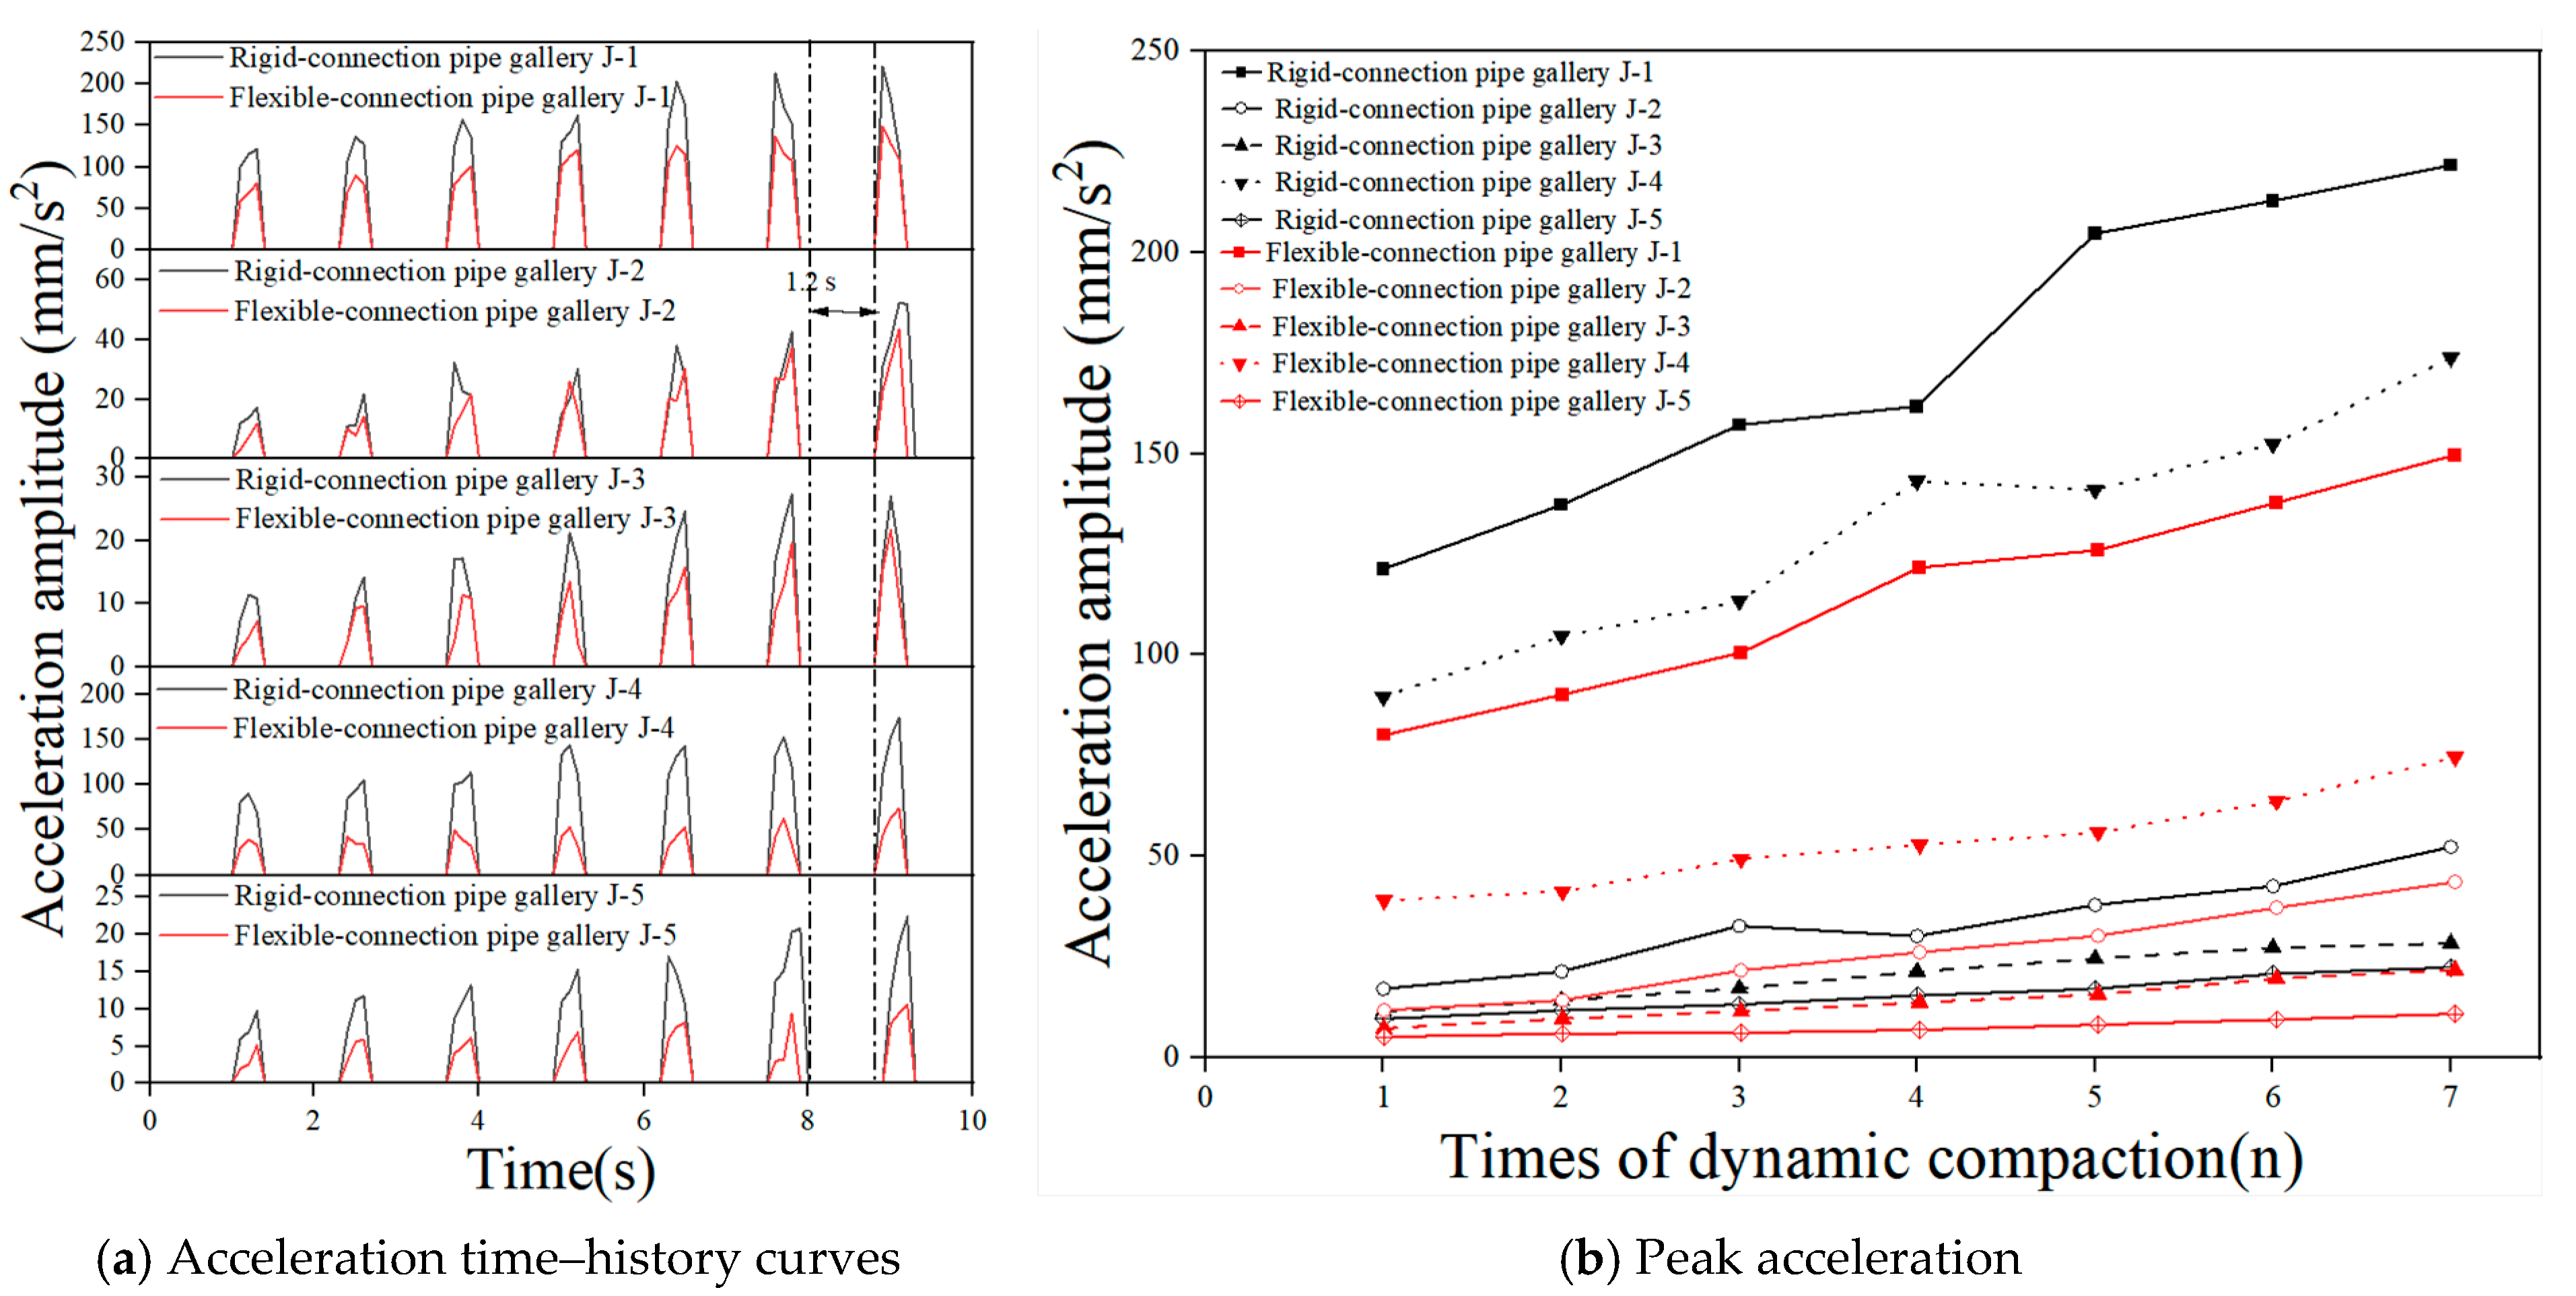
Taking the 50 N·m dynamic compaction energy level as an illustration, the seven waveform curves at each acceleration measuring point are depicted in Figure 13a. The time interval between adjacent waveform curves is 1.2 s, corresponding to the intermittent time between two consecutive tampings. For each acceleration measuring point (J-1 to J-5), as the number of tamping operations increases, the upper soil layer above the pipe gallery gradually becomes more compacted. This compaction subsequently leads to a progressive increase in the peak acceleration. The ordinate data in Figure 13a represent the peak values of each waveform curve in Figure 13b. After the first dynamic compaction, the peak acceleration of the flexible-connection pipe gallery at measuring points J-1 to J-3 decreased by 31.5–36.8% compared to that of the rigid-connection pipe gallery. When the propagation path of the dynamic compaction load traverses the connection node, the peak acceleration at measuring points J-4 and J-5 decreased by 46.8–56.4%. After the seventh dynamic compaction, the peak acceleration of the flexible-connection pipe gallery at measuring points J-1 to J-3 decreased by 16.6–32.4% relative to the rigid-connection pipe gallery. Once the dynamic compaction load propagation path passes through the connection node, the peak acceleration at measuring points J-4 and J-5 decreased by 51.8–57.1%. These results demonstrate that the flexible-connection node has significant advantages in dissipating the vibration energy generated by the dynamic compaction load. Moreover, the energy-dissipation effect of the flexible-connection node remains stable as the number of tamping operations increases. Since the acceleration curve characteristics and evolutionary patterns under the 30 N·m and 40 N·m energy levels are similar to those under 50 N·m, the corresponding data are not presented here. (Note: The accelerometer J-6 was damaged, and thus no data are obtained).

4.2.2. Dynamic Strain Response

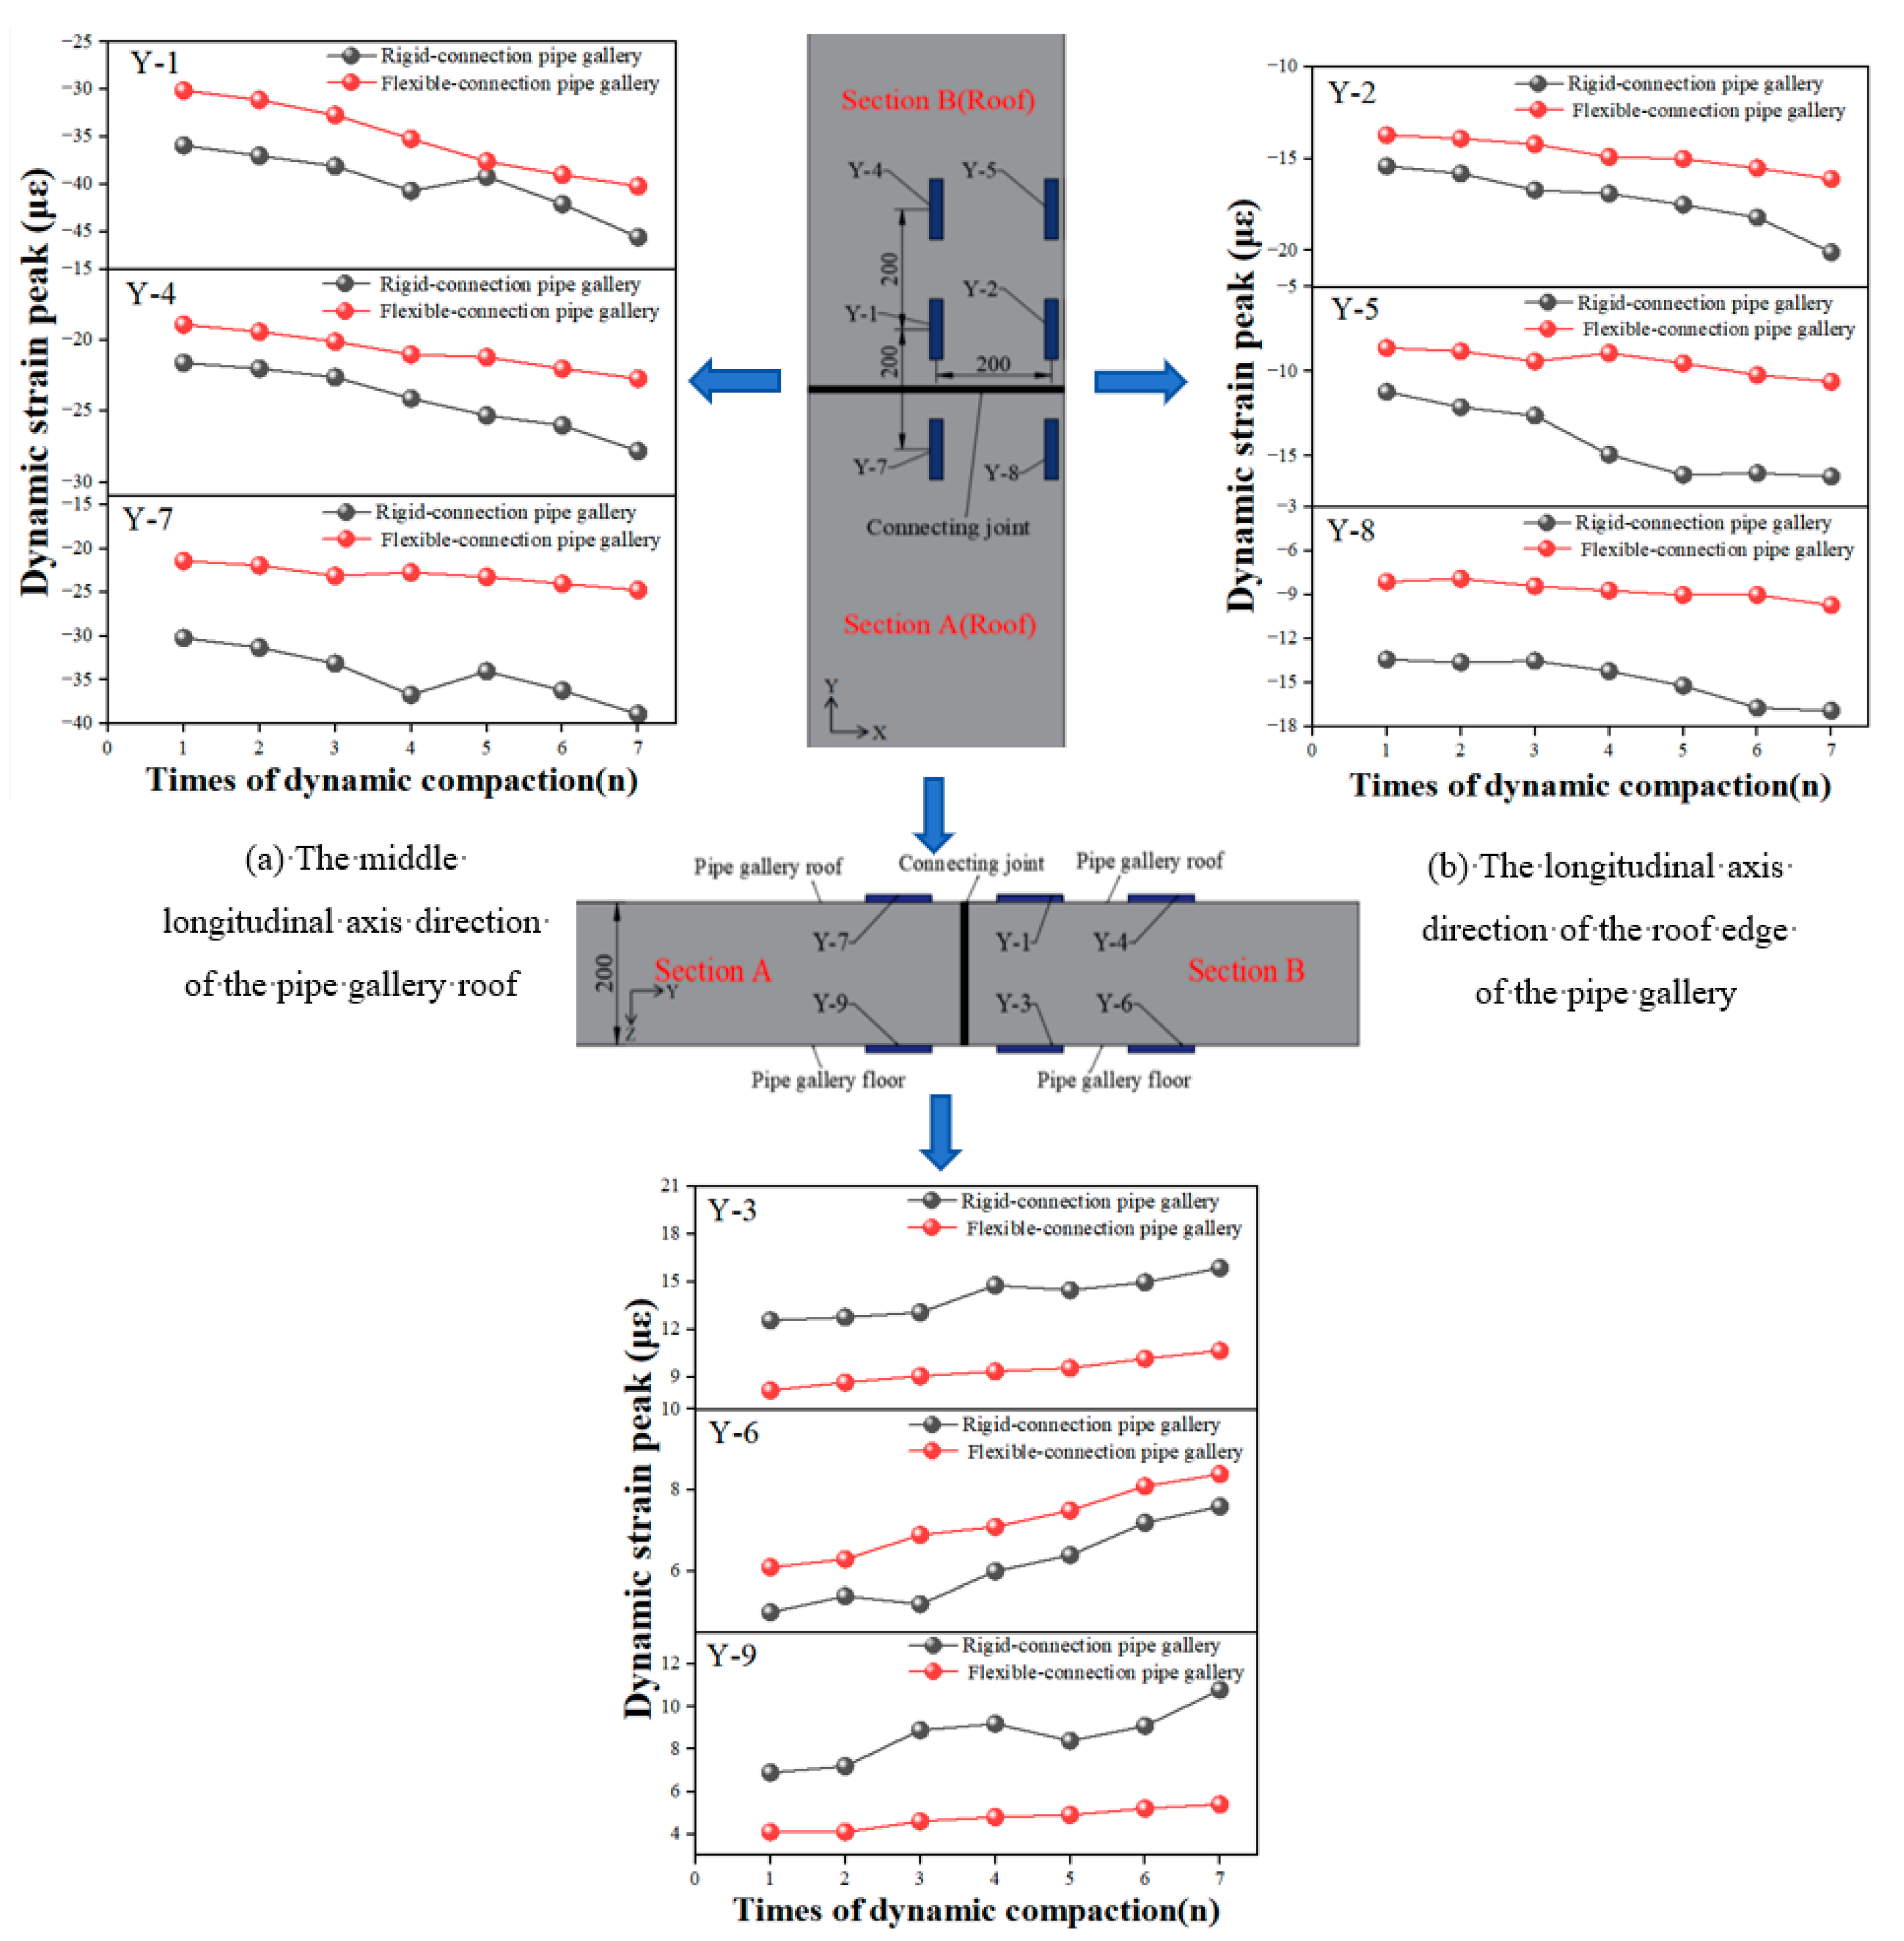
As depicted in Figure 14, consider a dynamic compaction energy level of 50 N·m as an illustrative case. After the first tamping operation, at the dynamic strain measuring points Y-1 to Y-6, the peak dynamic strain of the flexible-connection pipe gallery is 11.0% to 34.9%, which is lower than that of the rigid-connection pipe gallery. Once the propagation path of the dynamic compaction load traverses the connection node, the peak dynamic strain at the measuring points Y-7 to Y-9 experiences a reduction ranging from 29.1% to 40.5%. After the seventh tamping, at the dynamic strain measuring points Y-1 to Y-6, the peak dynamic strain of the flexible-connection pipe gallery decreased by 9.5% to 34.5% compared with the rigid-connection one. Moreover, after the dynamic compaction load propagates through the connection node, the peak vibration acceleration at the measuring points Y-7 to Y-9 decreased by 36.5% to 50.0%. These results indicate that the flexible-connection node significantly mitigates the dynamic compaction energy, offering valuable insights into optimizing the pipe gallery design under dynamic compaction conditions.
The dynamic strain measuring points Y-1, Y-4, and Y-7 are situated along the longitudinal axis in the middle of the pipe gallery roof. Meanwhile, Y-2, Y-5, and Y-8 are located along the longitudinal axis on the right-hand side of the roof, and Y-3, Y-6, and Y-9 are positioned along the longitudinal axis in the middle of the pipe gallery floor. The dynamic compaction load propagates from measuring point Y-1 to Y-4 in the longitudinal direction. For the rigidly connected pipe gallery, the average reduction in dynamic strain is 39%, while for the flexibly connected pipe gallery, the value reaches 40.8%. In contrast, when the dynamic compaction load is transmitted from measuring point Y-1 to Y-2 in the transverse direction, a more significant reduction in the dynamic strain is observed in both types of pipe gallery structures. Specifically, the average dynamic strain reduction in the rigidly connected pipe gallery is 56.6%, and in the flexibly connected pipe gallery, it is 58.1%. Two primary factors contribute to these phenomena. Firstly, the energy of the compression wave (P-wave) generated by dynamic compaction is predominantly concentrated in the vertical direction, with a notable attenuation in the horizontal direction. Secondly, a “compaction core” is formed in the soil during the downward transfer of dynamic compaction energy. This core facilitates efficient energy transfer in the vertical direction. In the horizontal direction, the soil impedance differs significantly from the “compaction core”, causing a wave reflection at the interface and hindering efficient energy transfer. The absolute value ranges of the dynamic strain for Y-1, Y-4, and Y-7 on the roofs of the rigidly connected and flexibly connected pipe galleries are 35.9 με–45.6 με and 30.1 με–40.2 με, respectively. For Y-3, Y-6, and Y-9 on the floors of the corresponding pipe galleries, the ranges are 12.6 με–15.9 με and 8.2 με–10.7 με. The dynamic compaction load is transferred from the top plate to the bottom plate via the middle partition wall of the pipe gallery, resulting in a distinct attenuation of the dynamic strain. The pipe gallery structure exhibits a certain energy dissipation effect on the vertical transmission of the dynamic compaction load.

4.2.3. Dynamic Earth Pressure

The burial depths of the dynamic earth pressure measuring points T-1 to T-3 are 20 cm, 30 cm, and 35 cm, respectively. T-1 and T-2 are positioned on the side wall of section B of the pipe gallery, while T-3 is located on the floor of the same section. Taking the dynamic earth pressure measuring point T-1 under a dynamic compaction energy level of 50 N·m as an illustrative case, after a zero-balance adjustment, the waveform curve (Figure 15) of the dynamic earth pressure at T-1 under dynamic compaction is obtained. Each dynamic compaction event generates a peak in the dynamic earth pressure. As the number of dynamic compactions increases, the peak value of the dynamic earth pressure also gradually increases. During the interval time (1.2 s) between two consecutive tamping operations, the residual dynamic earth pressure is captured. Moreover, this residual earth pressure slightly increases with the increasing number of dynamic compactions, indicating a more pronounced extrusion effect between the pipe section and the side wall soil. Under the dynamic compaction energy level of 50 N·m, the residual earth pressure values for the rigid-connection pipe gallery range from 0.17 kPa to 0.37 kPa. For the flexible-connection pipe gallery, they range from 0.17 kPa to 0.3 kPa. The presence of residual earth pressure exerts an adverse influence on the stress state of the pipe gallery.
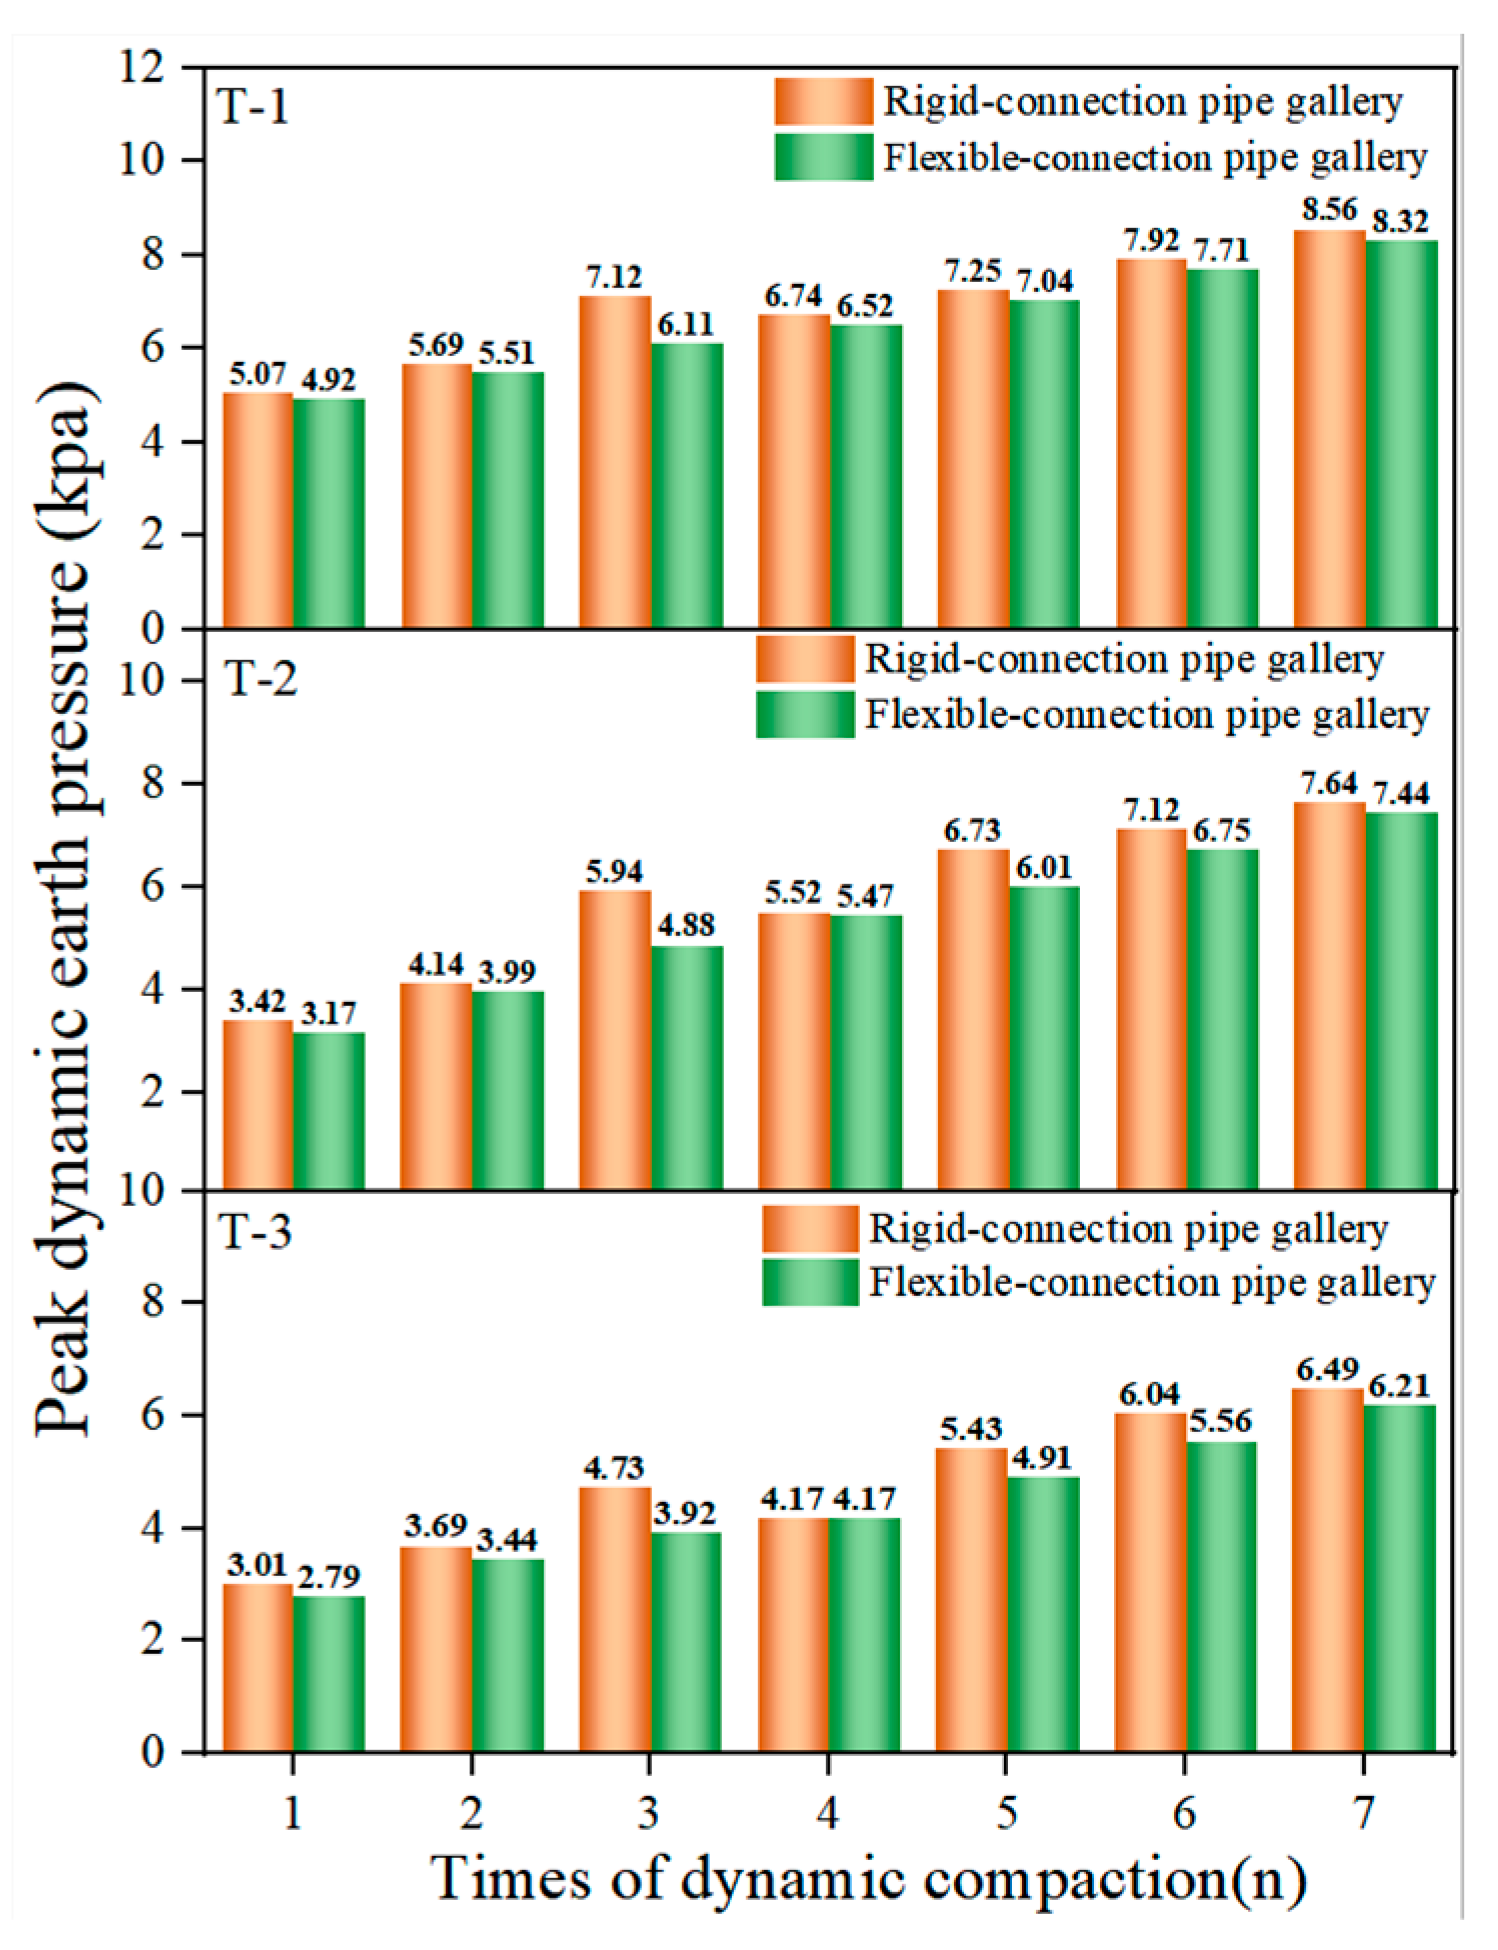
Figure 16 shows the peak values of the dynamic earth pressure. As the burial depth of the dynamic earth pressure measuring points from T-1 to T-3 increases progressively, the peak value of the dynamic earth pressure gradually decreases. During the seven times of tamping, the peak value of the dynamic earth pressure of the flexible-connection pipe rack decreased by 2.6~7.3% compared with that of the rigid-connection pipe rack. This is because the flexible-connection nodes permit the slight vertical movement of the pipe sections on either side (and possess a certain self-resetting capacity), which enables them to absorb a certain amount of the energy generated by the dynamic compaction load. Consequently, compared to the rigid-connection nodes, the flexible-connection nodes weaken the interaction between the pipe gallery and the soil. Since the variation patterns of 30 N·m and 40 N·m are similar to that of 50 N·m, and the residual earth pressure values are insignificant, the corresponding data are not presented in the figure.
Dynamic soil pressure data at monitoring points T-4 to T-6 are not recorded. This phenomenon can be attributed to the vibration propagation path exceeding the effective transmission range, resulting in the complete dissipation of vibration energy. Consequently, no soil–pipe interaction was detected at these measurement locations. (Due to the accuracy of the dynamic earth pressure cell being 0.01 kPa, a dynamic earth pressure less than 0.01 kPa cannot be collected).

5. Discussion

5.1. Result Analysis

The developed “skin-tendon” flexible-connection node exhibits a remarkable energy dissipation effect compared to the rigid-connection node. Specifically, the machine vibration and dynamic compaction loads are transmitted via this “skin-tendon” flexible-connection node. Analysis of the monitoring data for acceleration and the dynamic strain reveals a distinct attenuation phenomenon. For the acceleration, the data transmitted from measuring point J-1 to J-4 shows a notable decrease. And similarly, for the dynamic strain, the data from point Y-1 to Y-7 also demonstrates significant attenuation. In contrast, the “skin-tendon” flexible-connection node has a negligible impact on reducing the earth pressure. Consequently, only the monitoring data from the measuring points on both the acceleration and dynamic strain sides are selected for a comparative analysis.
As presented in Table 8, under the machine vibration load condition of 220 Hz/0.134 kN, when the load is transmitted through the rigid-connection node, the acceleration attenuation rate is 24.1%, and the dynamic strain attenuation rate is 4.1%. In contrast, after the load propagates through the flexible-connection node, the acceleration attenuation rate is 72.6%, and the dynamic strain attenuation rate is 60.4%. When the machine vibration load is set at 330 Hz/0.207 kN, the acceleration attenuation rate is 16.9%, and the dynamic strain attenuation rate is 11.1% after the load passes through the rigid-connection node. After propagating through the flexible-connection node, the acceleration attenuation rate is 59.7%, and the dynamic strain attenuation rate is 50%. Replacing the rigid-connection node with the flexible-connection node can enhance the load transfer acceleration attenuation rate by 3.01–3.53 times and boost the dynamic strain attenuation rate by 4.5–14.73 times.
As presented in Table 9, under dynamic compaction energy levels of 30 N·m, 40 N·m, and 50 N·m, the acceleration attenuation rates of the load after propagating through rigid-connection joints are 16.4%, 20.9%, and 21.5%, respectively. Correspondingly, the dynamic strain attenuation rates are 11%, 11.4%, and 14.6%, respectively. When the load propagates through flexible-connection nodes, the acceleration attenuation rates are 51.4%, 50%, and 50.1%, while the dynamic strain attenuation rates are 42.2%, 39.8%, and 38.5%. Replacing rigid-connection nodes with flexible-connection nodes can significantly enhance the acceleration attenuation rate of the load transfer by 3.13 times, 2.39 times, and 2.33 times, respectively. Moreover, the dynamic strain attenuation rate can be increased by 3.83 times, 3.49 times, and 2.63 times.

5.2. Energy Attenuation Mechanism

The energy attenuation mechanism is significant for the deformation and energy dissipation capacity of pipe gallery structures. During the test, due to the same size, material, and structural performance of each pipe gallery section, there are nearly the same values in the stiffness of each section of the pipe gallery structure. The flexible pipe gallery nodes proposed in this study are installed along the y-axis of the pipe gallery, and the y-axis stiffness of the pipe gallery undergoes significant changes at the nodes. When subjected to external loads, energy propagates from the pipe gallery sections to the connecting nodes. Due to the significant stiffness difference between the pipe gallery sections and the connecting nodes, some of the energy is absorbed by the elastic deformation of the nodes, resulting in a significant reduction in the energy that transmitted to the pipe gallery. This leads to the significant attenuation of the dynamic strain and acceleration of the pipe gallery structure. In addition, due to the y-axis installation of the connecting nodes of the pipe gallery, the x-axis stiffness changes in the pipe gallery are limited.
In this study, according to the test results, it could be found that flexible-connection methods have a significant energy attenuation performance compared to rigid-connection methods when subjected to external loads. The results of this study can provide reference for the design and installation of underground pipe gallery structures.

5.3. Long-Term Performance

In this study, the test time was constant and the short-term mechanical behavior of the pipe gallery structure under external loads were studied. In practical engineering, the long-term performance of the pipe gallery structure is also a key focus, and it is related to the service life of the pipe gallery and node materials. The service life of traditional underground pipe galleries is usually around 25–50 years [37], while the service life of the polyurea grouting slurry is over 30 years, which can match the shorter service life of pipe galleries. In the future, the service life of nodes can be improved by modifying the polyurea grouting slurry or selecting other high-performance materials. The spring vibration isolation bearing can experience about 10 million compression cycles [39], and if there is no rusting effect, there would be no service life limit. In addition, the surrounding structure formed by the polyurea grouting slurry greatly prevents rusting of the spring. Therefore, both node materials can meet the requirements of long-term operation of the pipe gallery structure.
During the test, residual earth pressure was detected on the pipe gallery structure due to the large load generated by dynamic compaction. Although the residual earth pressure is relatively small, it may also have adverse effects on the service life of the pipe gallery. In order to avoid the impact of residual earth pressure on the long-term operation of the pipe gallery, the strength and reinforcement ratio of the concrete can be increased when the pipe gallery structure is designed. These methods can enhance the strength of the pipe gallery and provide guarantees for the long-term operation of the gallery system.

6. Conclusions

In this study, a series of model tests are carried out on the pipe gallery structure with different connection modes under dynamic compaction and machine vibration. The evolution of acceleration, dynamic strain, and dynamic earth pressure are analyzed, and the main conclusions are as follows:
(1)
A flexible-connection node of “skin-tendon” for the pipe gallery structure has been proposed. The node is composed of an “outer skin” made by a polyurea grouting slurry and an “inner rib” composed of the spring vibration isolation bearing.
(2)
Under dynamic compaction, the maximum attenuation rates of acceleration and the dynamic strain of flexible-connection nodes are 51.4% and 42.2%, respectively, while those of rigid-connection nodes are only 21.5% and 14.6%, respectively. Under machine vibration, the maximum attenuation rates of acceleration and the dynamic strain of flexible-connection nodes are 72.6% and 60.4%, respectively. However, those of rigid-connection nodes are only 24.1% and 11.1%, respectively.
(3)
Under identical load conditions, the earth pressure measured at the pipe gallery structure with flexible nodes is smaller than that with rigid nodes, with a reduction range of 2.2–7.9%. Additionally, dynamic compaction generates residual earth pressure, leading to increased pressure on the side walls of the pipe gallery. Therefore, the reinforcement ratio of the pipe gallery structure should be increased to enhance the load-bearing capacity.
(4)
There may be scaling effects in the model test, but the mechanical properties and response laws of the prototype can still be basically revealed. The combination structure of “skin-tendon” flexible-connection nodes is not unique, and different materials with a similar performance can be used in combination to ensure the energy efficiency of the nodes. Future research will aim to establish theory and numerical models to conduct a quantitative analysis; at the same time, the feasibility of the flexible-connection node under complex loading would be verified.
(5)
Although this study incorporates bionic principles, verification for the self-recovery capability of flexible-connection nodes after vibration is also lacking. The current sensor layout mainly focuses on capturing global strain responses, and energy dissipation during load propagation is neglected. To capture energy changes in the underground pipe gallery accurately during load propagation, the installation distance between sensors should be reduced. These improvements will bridge the gap between the model test and engineering practice and provide guides for the design of underground pipe gallery structures more effectively.

Author Contributions

Software, E.Z.; Validation, Z.Z.; Formal analysis, Z.Z.; Investigation, J.L.; Resources, P.W.; Writing–original draft, E.Z.; Writing–review & editing, H.C. and J.L.; Visualization, P.W.; Supervision, H.C. All authors have read and agreed to the published version of the manuscript.

Funding

This research was funded by Haiying Cao grant number [No. 236Z5401G]. And the APC was funded by Central Guiding Local Science and Technology Development Fund Projects.

Data Availability Statement

The original contributions presented in the study are included in the article, further inquiries can be directed to the corresponding author.

Conflicts of Interest

Author Ping Wang and Zhen Zhao were employed by the company Shen Kan Qinhuangdao General Engineering Design & Research Institute Corporation. The remaining authors declare that the research was conducted in the absence of any commercial or financial relationships that could be construed as a potential conflict of interest.

References

  1. Canto-Perello, J.; Curiel-Esparza, J. Assessing governance issues of urban utility tunnels. Tunn. Undergr. Space Technol. 2013, 33, 82–87. [Google Scholar] [CrossRef]
  2. Legrand, L.; Blanpain, O.; Buyle-Bodin, F. Promoting the urban utilities tunnel technique using a decision-making approach. Tunn. Undergr. Space Technol. 2004, 19, 79–83. [Google Scholar] [CrossRef]
  3. Zhang, W.; Han, L.; Feng, L.; Ding, X.; Wang, L.; Chen, Z.; Liu, H.; Aljarmouzi, A.; Sun, W. Study on seismic behaviors of a double box utility tunnel with joint connections using shaking table model tests. Soil Dyn. Earthq. Eng. 2020, 136, 106118. [Google Scholar] [CrossRef]
  4. Tian, T.; Yao, A.; Li, Y.; Gong, Y. Seismic response of utility tunnels with different burial depths at the non-homogeneous liquefiable site. Appl. Sci. 2022, 12, 11767. [Google Scholar] [CrossRef]
  5. Darli, C.M.; Tang, A.; Huang, D.; Zhang, J. Large-scale shaking table model test and analysis on seismic response of utility tunnel in non-homogeneous soil. Earthq. Eng. Eng. Vib. 2021, 20, 505–515. [Google Scholar] [CrossRef]
  6. Deng, B.; Zheng, X.; Shen, C.; Fu, Y. Study on dynamic response characteristics of shallow buried pipe gallery structure under vehicle vibration load. Soil Dyn. Earthq. Eng. 2024, 181, 108597. [Google Scholar] [CrossRef]
  7. Wang, G.; Yin, Y.; Wang, J. Vibration safety evaluation and vibration isolation control measures for buried oil pipelines under dynamic compaction: A case study. Soil. Dyn. Earthq. Eng. 2023, 167, 107783. [Google Scholar] [CrossRef]
  8. Hu, Y.; Li, Z.; He, J.; Huang, Z. Experimental Study on Seismic Performance of Prefabricated Joints of Underground Utility Tunnel. IOP Conf. Ser. Earth Environ. Sci. 2019, 267, 042109. [Google Scholar] [CrossRef]
  9. Li, D.; Liang, J.; Dong, B.; Ba, Z. A multi-scale model for longitudinal seismic design of prefabricated utility tunnel based on multi-point constraints. Structures 2024, 62, 106176. [Google Scholar] [CrossRef]
  10. Wu, X.; Nie, C.; Li, D.; Qiu, F.; Tang, Y. Structural response of a prefabricated utility tunnel subject to a reverse fault. Buildings 2022, 12, 1086. [Google Scholar] [CrossRef]
  11. Wang, Z.; Wang, Y.; Huang, W.; Shan, H.; Zhu, L.; Song, G. Research on natural foundation bearing capacity and foundation pit settlement of prefabricated utility tunnel. Adv. Civ. Eng. 2022, 2022, 5361199. [Google Scholar] [CrossRef]
  12. Yang, M.; Li, H.; Li, N.; Yang, S.; Dede, T. Effect of subway excavation with different support pressures on existing utility tunnel in Xi’an loess. Adv. Civ. Eng. 2020, 2020, 8818949. [Google Scholar] [CrossRef]
  13. Zhao, Y.; Li, Z.; Zhang, H. Numerical analysis on the features of road deformation in the construction process of heat supply pipeline works. Alex. Eng. J. 2020, 60, 159–171. [Google Scholar] [CrossRef]
  14. Yang, M.; Li, H.; Li, N.; Yang, S.; Hao, X. Influence of Utility Tunnel on the Lower Part of the Existing Double-Track Shield Tunnel in Loess Soil. Adv. Mater. Sci. Eng. 2021, 2021, 9927245. [Google Scholar] [CrossRef]
  15. Deng, B.-T.; Li, P.; Li, X.; Tian, J.-T.; Zhi, B. Mechanical behavior of underground pipe gallery structure considering ground fissure. J. Mt. Sci. 2022, 19, 547–562. [Google Scholar] [CrossRef]
  16. Ma, J.; Cui, G.; He, S.; Liu, X. Application of isolation technology in shallow super-large comprehensive pipe galleries in seismically vulnerable areas with weak soils. Appl. Rheol. 2023, 33, 20220150. [Google Scholar] [CrossRef]
  17. Zhao, C.; Lei, M.; Shi, C.; Cao, H.; Yang, W.; Deng, E. Function mechanism and analytical method of a double layer pre-support system for tunnel underneath passing a large-scale underground pipe gallery in water-rich sandy strata: A case study. Tunn. Undergr. Space Technol. 2021, 115, 104041. [Google Scholar] [CrossRef]
  18. Tian, Y.; Wang, Q.; Hu, Z.; Yang, S.; Peng, C.; Zhang, X.; Li, Z.; Wang, X.; Xie, Z. Research on the influence of groundwater in coastal areas on the stress and deformation characteristics of integrated pipe gallery. Geofluids 2022, 2022, 3463752. [Google Scholar] [CrossRef]
  19. Duan, X.; Dong, Q.; Ye, W. Experimental study on seismic performance of prefabricated utility tunnel. Adv. Civ. Eng. 2019, 2019, 8968260. [Google Scholar] [CrossRef]
  20. Liang, J.; Zhang, J.; Dong, B.; Xu, A.; Ba, Z. Shaking table test on the seismic performance of prefabricated utility tunnel passing through hard-soft strata under longitudinal excitation. Soil Dyn. Earthq. Eng. 2024, 183, 108788. [Google Scholar] [CrossRef]
  21. Li, J.; Yue, Q. Research on shaking-table test and finite element numerical simulation of utility tunnel. J. Earthq. Eng. Eng. Vib. 2009, 29, 41–45. [Google Scholar] [CrossRef]
  22. Liu, W.; Wu, Q. Comparison between the seismic performance of buried pipes and pipes in a utility tunnel. CMES-Comp. Model. Eng. 2020, 123, 661–690. [Google Scholar] [CrossRef]
  23. Wei, G.; Qiu, H.J.; Wei, X.J. Analysis of settlement control measures in immersed tunnel. Appl. Mech. Mater. 2012, 204, 1449–1453. [Google Scholar] [CrossRef]
  24. Xiang, B.; Liu, Y.; Cui, J.; Yang, Z. Analytical Solution for the Deformation of Pipe Galleries Adjacent to Deep Excavation. Buildings 2024, 14, 1103. [Google Scholar] [CrossRef]
  25. Liu, X.; Xu, Z.-D.; Sun, B.; Liu, X.; Xu, D. Spatiotemporal state assessment for the underground pipe gallery: Physical model and experimental verification. Tunn. Undergr. Space Technol. 2024, 143, 105474. [Google Scholar] [CrossRef]
  26. Zhang, C.; Li, X.; Pang, Y.; Xu, Y. Mechanical Response and deformation mechanism of the utility tunnel crossing an earth fissure. Structures 2024, 64, 106587. [Google Scholar] [CrossRef]
  27. Dong, L.; Yao, A.; Zhou, D.; Zhang, G.; Zhang, P. Experimental study on seismic behavior of T-joints of composite shell system with prefabricated underground pipe gallery. Structures 2023, 58, 105572. [Google Scholar] [CrossRef]
  28. Liang, J.; Zhang, J.; Dong, B.; Xu, A.; Ba, Z. Shaking table tests on the seismic performance of prefabricated T-shaped cross utility tunnel. Structures 2023, 58, 105516. [Google Scholar] [CrossRef]
  29. Xu, Y.; Huang, Z.; Zhang, C.; Pang, Y.; Liu, T. Bearing Capacities and Failure Behaviors of F-Type Socket Joint in Rectangular Pipe Jacking Tunnel. Appl. Sci. 2023, 13, 5442. [Google Scholar] [CrossRef]
  30. Chen, H.; Liang, J.; Li, D.; Ba, Z. Transverse seismic analysis method of underground interchange prefabricated utility tunnel. Structures 2024, 68, 107112. [Google Scholar] [CrossRef]
  31. Zhu, L.; Shangguan, S.; Yu, H.; Guo, Y.; Chen, Z.; An, D.; Zhang, X. Quasi-Static Test Study on Seismic Behavior of Large-Section Fabricated Utility Tunnel. Shock Vib. 2022, 2022, 8679189. [Google Scholar] [CrossRef]
  32. Faux-Dugan, L.; Piazza, S.J. Correlations between Achilles tendon moment arm and plantarflexor muscle architecture variables. PLoS ONE 2024, 19, e0309406. [Google Scholar] [CrossRef] [PubMed]
  33. He, J.; Sun, X.; Pi, D. An experimental study on the resistance of a polyurea-sprayed structure to low-speed drop hammer impact. Constr. Build. Mater. 2024, 435, 136915. [Google Scholar] [CrossRef]
  34. Davidson, S.J.; Porter, R.J.; Dinan, J.R. Explosive Testing of Polymer Retrofit Masonry Walls. J. Perform. Constr. Face 2004, 18, 100–106. [Google Scholar] [CrossRef]
  35. Yu, C.; Guo, H.; Sun, M. Tensile Mechanical Properties and Dynamic Constitutive Model of Polyurea Elastomer under Different Strain Rates. Polymers 2022, 14, 3579. [Google Scholar] [CrossRef]
  36. Yan, X.; Yu, C.; Zhai, S. Experimental study on segment joint’s mechanical properties of split-type prefabricated municipal tunnel. Sichuan Build. Sci. 2017, 43, 28–31. (In Chinese) [Google Scholar]
  37. GB/50838-2015; Technical Standard for Urban Pipe Gallery Engineering. China Planning Press: Beijing, China, 2015. (In Chinese)
  38. JGJ79-2012; Technical Code for Building Foundation Treatment. China Planning Press: Beijing, China, 2012. (In Chinese)
  39. GB/T 1239.6-2012; Cold Coiled Helical Compressions Springs-Technical Specifications. Standards Press of China: Beijing, China, 2012. (In Chinese)
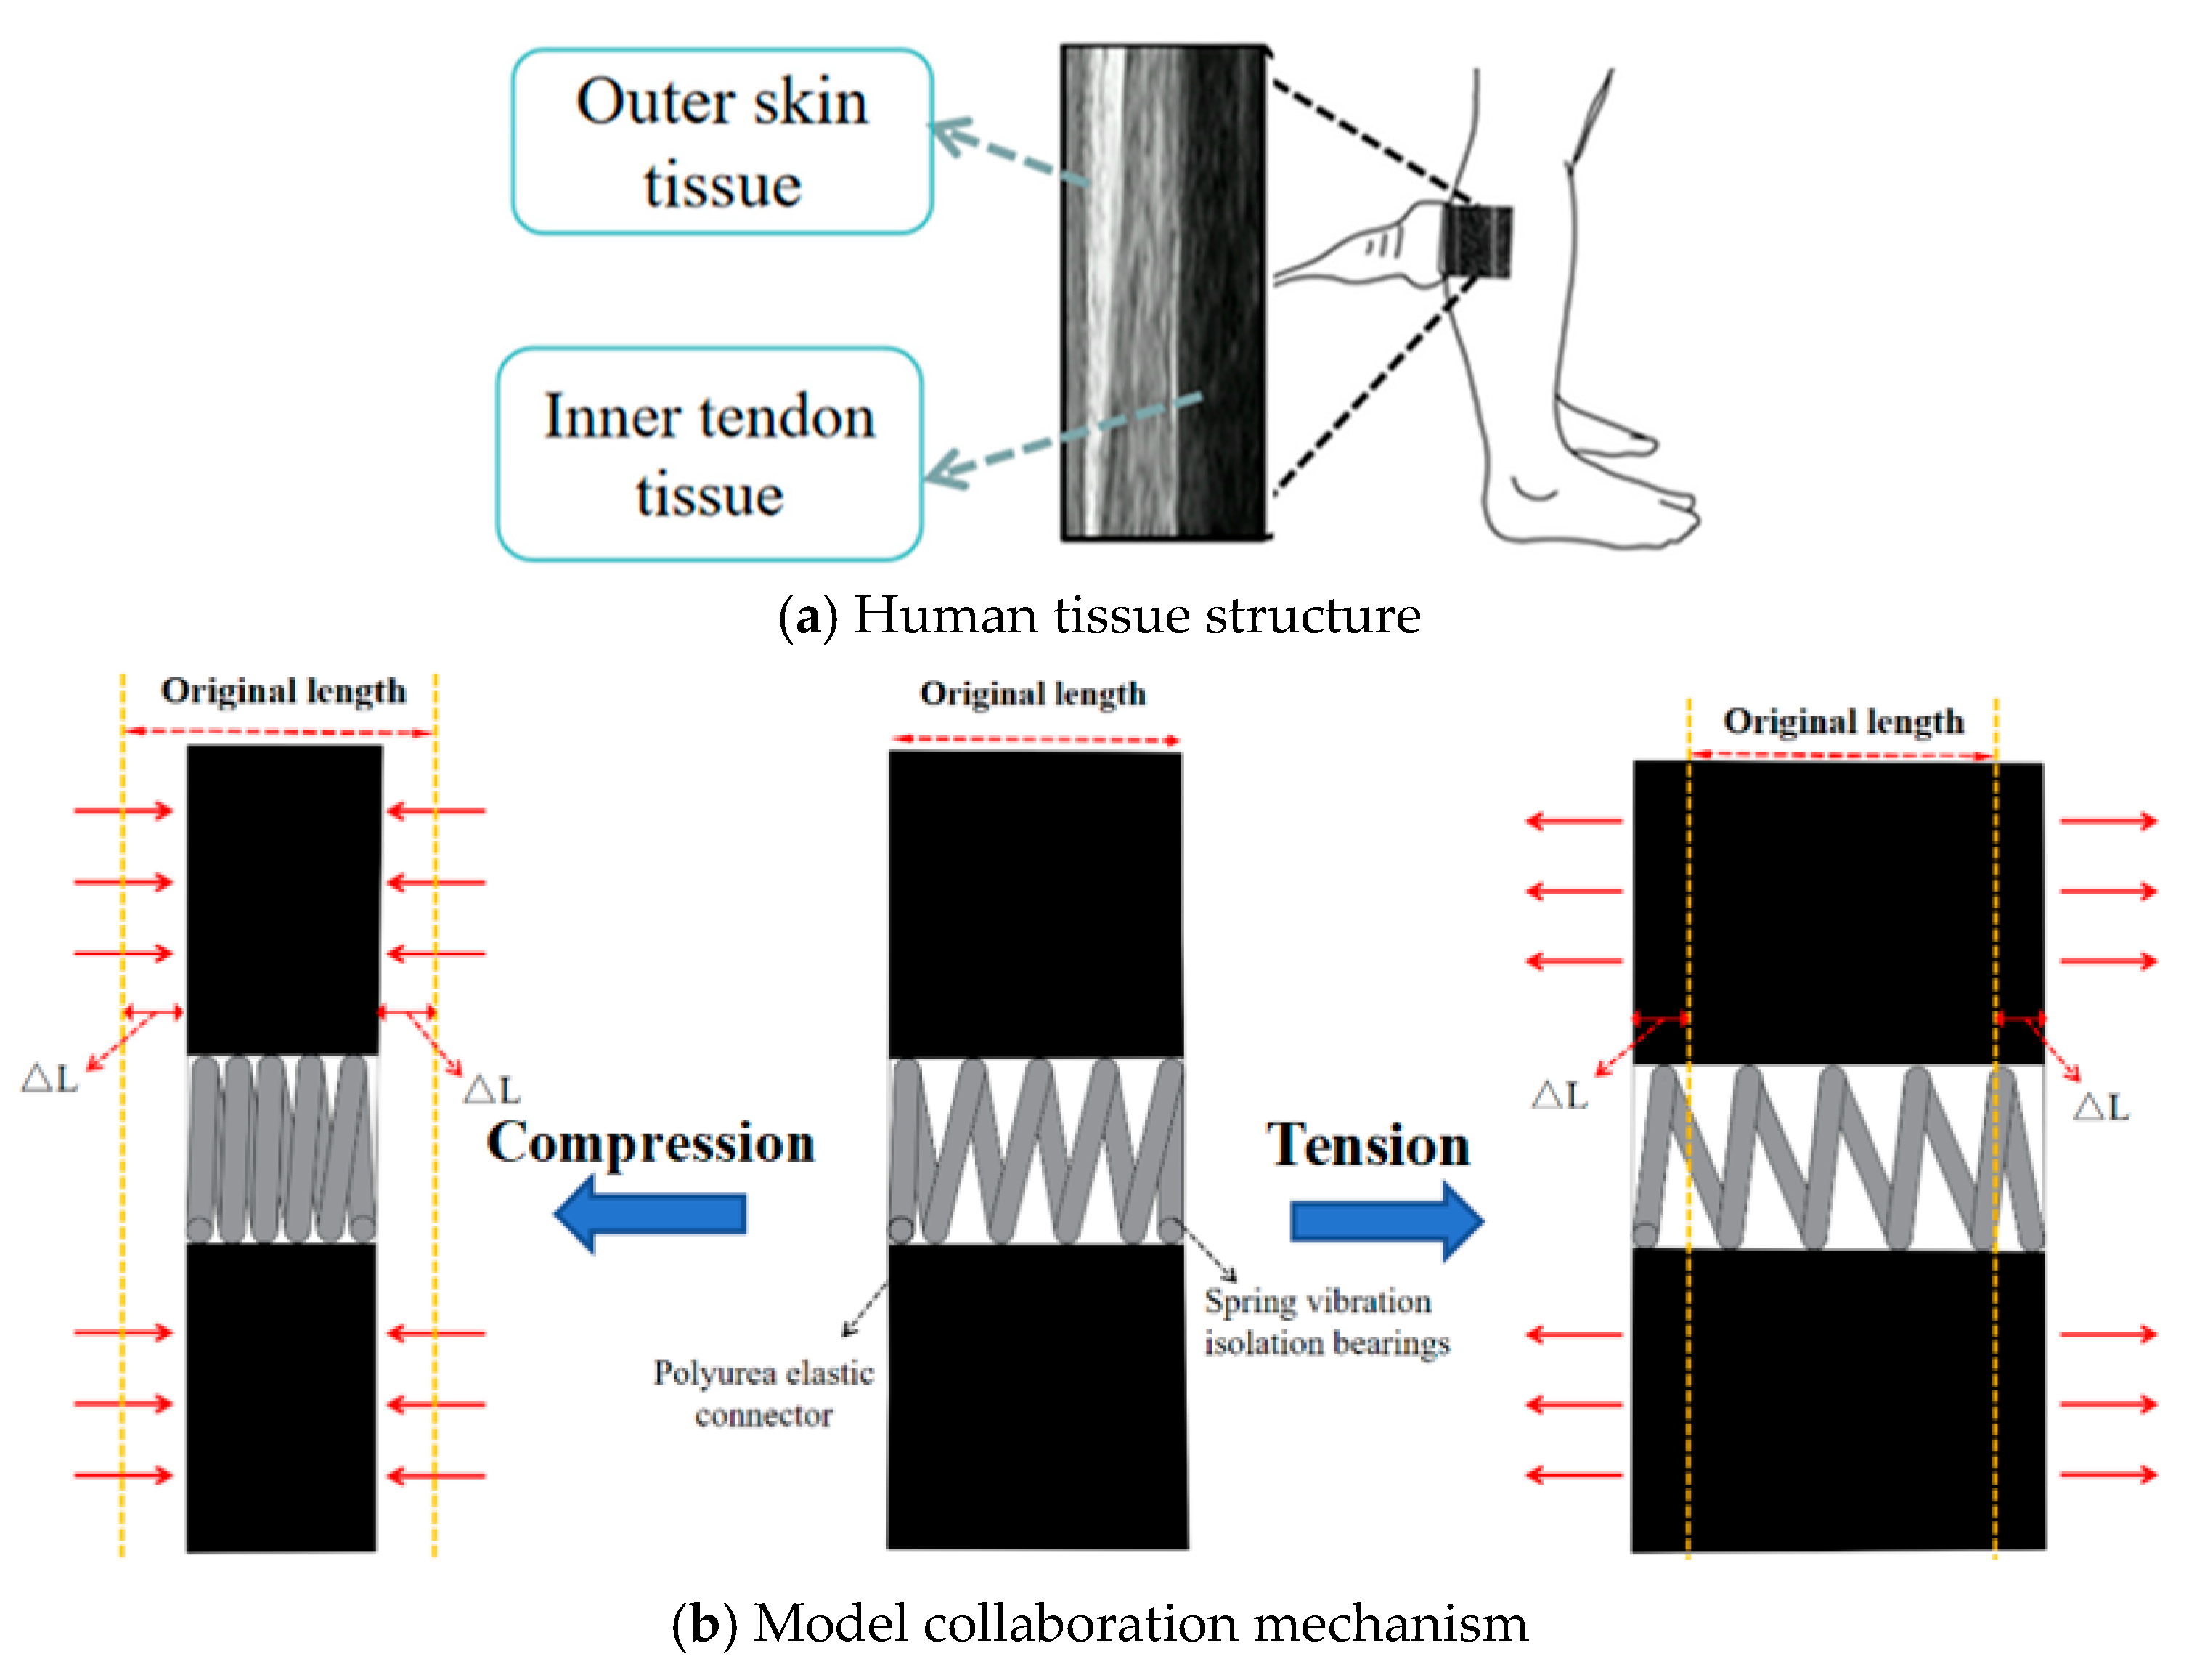
Figure 1. Sectional diagram of skin tendon connection structure.
Buildings 15 03521 g001
Figure 2. Rigid-connection pipe gallery and connection node structure.
Buildings 15 03521 g002
Figure 3. Flexible-connection pipe gallery and connection node structure.
Buildings 15 03521 g003
Figure 4. Spring vibration isolation bearing.
Buildings 15 03521 g004
Figure 5. Bolt parameter diagram.
Buildings 15 03521 g005
Figure 6. Model test system and sensor layout.
Buildings 15 03521 g006
Figure 7. Model joining process.
Buildings 15 03521 g007
Figure 8. Comparison of acceleration–time curves under different machine vibration loads.
Buildings 15 03521 g008
Figure 9. Comparison of acceleration peak values under different machine vibration loads.
Buildings 15 03521 g009
Figure 10. The time–history curves of dynamic strain measuring points Y-1 and Y-3 (RG-VA-1 and FG-VA-1).
Buildings 15 03521 g010
Figure 11. Comparison of dynamic strain peaks under different machine vibration loads.
Buildings 15 03521 g011
Figure 12. Comparison diagram of dynamic earth pressure along depth under different machine vibration loads.
Buildings 15 03521 g012
Figure 13. Comparison of acceleration at each measuring point (RG-DC-3 and FG-DC-3).
Buildings 15 03521 g013
Figure 14. Comparison of the dynamic strain peak value of each measuring point under dynamic compaction (RG-DC-3 and FG-DC-3).
Buildings 15 03521 g014
Figure 15. Dynamic earth pressure time–history curve under dynamic compaction.
Buildings 15 03521 g015
Figure 16. Comparison diagram of dynamic earth pressure peak value of each measuring point under the action of dynamic compaction (RG-DC-3 and FG-DC-3).
Buildings 15 03521 g016
Table 1. Properties of polyurea grout material.
ParametersValues
Density (g/cm3)1.1
Stickiness (mPa·s)2000
Curing time (min)120
Durometer (HBa)90
Tensile strength (MPa)20
Elongation at break (%)300
Tear strength (N/mm)50
Abrasion resistance (mg/1000 r)40
Table 2. Spring index.
Wire Diameter/mmSpring Height/mmTotal Height/mmLap Number/nWeight-Bearing Load/kgVertical Stiffness
N/mm
Horizontal Stiffness
N/mm
Stainless steels2.53842610–152110
Table 3. Similarity relationship of physical quantities in the model test.
Physical QuantityDimensionResemblanceSimilarity RatioPhysical QuantityDimensionResemblanceSimilarity Ratio
Length (L)[L] C 1 15Strain (ε)- C ε = 1 1
Quality (m)[M] C m = C ρ C 1 3
C m = C ρ C 1 3
4050Time (s)[T] C t = C 1 C ρ 1 / 2 C E 1 / 2 9.49
Density ( ρ )[M] [L]−3 C ρ 1.2Concentrated load (F)[M] [L] [T]−2 C F = C E C 1 2 675
Elastic modulus (E)[M] [L]−1 [T]−2 C E 3Acceleration (a)[L] [T]−2 C A = C 1 1 C ρ 1 C E 0.17
Stress (σ)[M] [L]−1 [T]−2 C ρ = C E 3Frequency (ƒ)[T]−1 C f = C 1 1 C ρ 1 / 2 C E 1 / 2 0.11
Table 4. (a) Material parameter of pipe gallery prototype and model. (b) Physical property parameters of clay.
(a)
ComponentActual Working Conditions and Model MaterialDensity (kg/m3)Elastic Modulus (Gpa)
Pipe Gallery SectionPrototype MaterialC35 Concrete250031.5
Model
Material
Cement Mortar
(water–mud–sand = 0.65:1:3)
200010.5
(b)
Density
ρ / kg / m 3
Moisture Content
ω / %
Elastic Modulus
E / kPa
Cohesion
c / kPa
Internal Friction Angle φ / °
18757.66307.3325.74
Table 5. Parameters of dynamic compaction tests.
Site Dynamic Compaction Weight/kgQuality Similarity RatioModel Dynamic Compaction Weight/kgSite Dynamic Compaction Height/mLength Similarity RatioModel Dynamic Compaction Height/mModel Dynamic Compaction Energy/(N·m)
20,250405059150.630
120.840
15150
Table 6. Vibration condition parameters.
Site Vibration Load/kNSimilarity Ratio of Concentrated LoadModel Vibration Load/kNSite Vibration Frequency/HzFrequency Similarity RatioModel Vibration Frequency/Hz
906750.134200.11220
1400.20730330
Table 7. Experiment scheme.
Test TypeNumberWorking Condition Perturbation Mode
Rigid-connection pipe galleryRG-DC-15 kg × 60 cmNumber of dynamic compactions: 7 times
RG-DC-25 kg × 80 cm
RG-DC-35 kg × 100 cm
RG-VA-1220 Hz/0.134 kNVibration action time: 20 S
RG-VA-2330 Hz/0.207 kN
Flexible-connection
pipe gallery
FG-DC-15 kg × 60 cmNumber of dynamic compactions: 7 times
FG-DC-25 kg × 80 cm
FG-DC-35 kg × 100 cm
FG-VA-1220 Hz/0.134 kNVibration action time: 20 S
FG-VA-2330 Hz/0.207 kN
Table 8. Comparison of monitoring data on both sides of pipe gallery under mechanical vibration.
Monitoring IndicatorsSensor Measuring PointRG-VA-1FG-VA-1RG-VA-2FG-VA-2
Acceleration amplitude (mm/s2)J-135.724.150.237.8
J-427.16.641.715.2
Attenuation rate (%) 24.1%72.6%16.9%59.7%
Dynamic strain amplitude (με)Y-19.68.614.313.2
Y-79.23.412.76.6
Attenuation rate (%) 4.1%60.4%11.1%50%
Table 9. Comparison of monitoring data on both sides of pipe gallery under dynamic compaction.
Monitoring IndicatorsSensor Measuring PointRG-DC-1FG-DC-1RG-DC-2FG-DC-2RG-DC-3FG-DC-3
Acceleration amplitude (mm/s2)J-1152.4107.4182.1120.4221.7149.7
J-4127.352.1143.960.2173.974.6
Attenuation rate (%) 16.4%51.4%20.9%50%21.5%50.1%
Dynamic strain amplitude (με)Y-136.131.740.236.145.640.2
Y-732.118.335.621.738.924.7
Attenuation rate (%) 11%42.2%11.4%39.8%14.6%38.5%
Note: (1) Take the absolute value of the measuring point with the maximum amplitude under each load condition. (2) Acceleration attenuation rate = X Y X × 100 % . X: J1 acceleration amplitude, Y: J4 acceleration amplitude. (3) Dynamic strain attenuation rate = M N M × 100 % . M: Y1 dynamic strain amplitude, N: Y7 dynamic strain amplitude.
Disclaimer/Publisher’s Note: The statements, opinions and data contained in all publications are solely those of the individual author(s) and contributor(s) and not of MDPI and/or the editor(s). MDPI and/or the editor(s) disclaim responsibility for any injury to people or property resulting from any ideas, methods, instructions or products referred to in the content.