Article

Assessment of Age-Friendly Streets in High-Density Urban Areas Using AFEAT, Street View Imagery, and Deep Learning: A Case Study of Qinhuai District, Nanjing, China

by
Xiaoguang Liu
,
Yiyang Lv
,
Wangtao Li
,
Lihua Peng
* and
Zhen Wu
*
College of Architecture, NanjingTech University, Nanjing 211000, China
*
Authors to whom correspondence should be addressed.
Buildings 2025, 15(19), 3518; https://doi.org/10.3390/buildings15193518
Submission received: 20 August 2025 / Revised: 22 September 2025 / Accepted: 24 September 2025 / Published: 30 September 2025
(This article belongs to the Section Architectural Design, Urban Science, and Real Estate)

Abstract

With the rapid urban aging trend in China, evaluating the age-friendliness of street environments is critical for inclusive urban planning. This study proposes the Age-Friendly Environment Assessment Tool (AFEAT) to assess street-level age-friendliness in high-density urban contexts, grounded in the World Health Organization’s (WHO) Global Age-Friendly Cities: A Guide and adapted to the spatial characteristics of Nanjing’s Qinhuai District. By integrating multi-source data such as street-view image segmentation, Point of Interest (POI)-based network accessibility, kernel density estimation, Analytic Hierarchy Process (AHP)-derived indicator weights, and Random Forest regression, the study develops a comprehensive and spatialized evaluation framework. The results reveal significant spatial disparities in age-friendliness across street segments, with Safe Mobility, Healthcare Services, and Walkable Environment identified as the most influential factors for older adults. High-performing areas are concentrated in the central urban core, while peripheral zones face challenges such as poor walkability, insufficient lighting, and a lack of facilities. The study recommends strengthening a walkability-based age-friendly safety and healthcare support system and optimizing the spatial distribution of recreational and medical facilities to address mismatches between supply and demand. These findings provide practical guidance for targeted, evidence-based interventions aimed at fostering equitable and resilient urban environments for aging populations.

1. Introduction

Urbanization and population ageing have emerged as two intertwined global challenges. By 2050, 16% of the global population will be aged 65 and over, with ageing accelerating across both high-income and emerging economies. China in particular is undergoing a rapid demographic transition, with older adults projected to comprise over 30% of its population by mid-century. This shift underscores the urgent need for urban environments that support healthy, active and inclusive ageing, an agenda reflected in the WHO’s Global Age-Friendly Cities initiative. In response, the World Health Organization (WHO) launched the Global Age-Friendly Cities: A Guide in 2007, promoting the development of safe, accessible, and socially inclusive street environments to enhance the quality of life, mental well-being, and social integration of older adults. Studies have shown that walking is the most common and preferred mode of commuting among older populations, providing significant health benefits [1,2,3]. Moderate-intensity walking can improve both physical and mental health. However, in high-density urban areas, older pedestrians often face narrow and discontinuous sidewalks, limited accessibility to facilities, and insufficient public services, all of which significantly undermine their walking experience and willingness to travel [4]. Therefore, advancing age-friendly street retrofitting in dense urban neighborhoods is not only essential for improving the health of older adults and fostering social participation but also a key strategy for promoting healthy ageing.
The rapid demographic transition demands greater public and academic attention to the physiological and psychological needs of older individuals. As part of its strategic response, the WHO introduced the concept of Age-Friendly Cities, aiming to encourage outdoor engagement and create supportive built environments that promote active and successful ageing [5]. Regular physical activity has been shown to yield substantial benefits for elderly well-being [6,7], including reducing risks of cardiovascular disease, diabetes, depression, and anxiety [8,9,10,11,12]. Walking is widely regarded as a preferred and accessible form of exercise among older adults [13,14,15]. Thus, street spaces serve multiple functions beyond mobility, as they are also crucial for leisure, social interaction, and health maintenance [16]. Evidence suggests that supportive walking environments can significantly encourage outdoor physical activity and social engagement among older adults [17,18]. Therefore, evaluating the age-friendliness of urban street environments is essential for guiding inclusive planning and policy-making.
The WHO 2007 Global Age-Friendly Cities: A Guide established the foundational framework for age-friendly urban development, defining principles that continue to guide research and interventions at street- and community-levels for older adults. Building on this, the WHO European Region’s Age-Friendly Cities Initiative emphasizes health, independence, and social engagement, while Canada’s Age-Friendly Communities Toolkit focuses on walkability and accessibility [19,20]. In China, the 14th Five-Year Plan for National Aging and Elderly Services (2021) and the White Paper on Building an Age-Friendly China (2024) set explicit targets for optimizing community and street facilities, integrating lessons from Canada and Europe and proposing 2035 goals for age-friendly communities [8,21]. Current policies are expanding from pilot projects to citywide implementation, paralleling the WHO 2023 Handbook on Age-Friendly Cities and Communities, which emphasizes quantitative assessment [7]. Collectively, these developments underscore that the WHO 2007 guide remains the core theoretical foundation of this study, justifying the selected indicators and street-level assessment. Investigating street-level age-friendliness in dense urban contexts is thus timely and highly relevant, contributing to global and national agendas for inclusive, age-friendly cities.
Current research on age-friendly street environments generally adopts three main methodological approaches. The first relies on field surveys, including questionnaires and interviews, to understand elderly residents’ subjective experiences of the streets [22,23]. However, these studies are prone to sampling bias and cognitive subjectivity [24]. The second employs Geographic Information System (GIS) techniques to assess the spatial distribution of public services and amenities. While effective for macro-level spatial analysis, this approach has limitations in capturing the micro-level built environment features relevant to walkability [25,26]. The third approach utilizes multi-source datasets, such as street view imagery (SVI) and point-of-interest (POI) data, in conjunction with object detection and semantic segmentation techniques to evaluate the quality of street-level spatial elements [27,28,29]. Nonetheless, this method faces several challenges: (1) it requires large volumes of high-resolution imagery and significant computational resources [30,31,32]; (2) it often overlooks the specific needs of elderly users; and (3) it lacks a systematic evaluation framework for assessing age-friendly attributes. Consequently, a scalable, accurate, and comprehensive framework for assessing age-friendly street environments remains underdeveloped, limiting its practical utility for age-friendly street retrofitting.
To address the methodological and practical gaps in current research, this study proposes an integrated, data-driven framework to systematically evaluate the age-friendliness of urban street environments. The aim is to develop a scalable and replicable assessment tool that reflects both the spatial accessibility of urban services and the physical characteristics of street-level environments relevant to older adults. Methodologically, the study introduces three key innovations: (1) a multidimensional indicator system aligned with the WHO’s Age-Friendly Cities framework, incorporating both macro- and micro-scale elements; (2) the integration of multi-source urban data, including street view imagery (SVI), point-of-interest (POI) data, and GIS-based spatial analysis, combined with deep learning (PSPNet) and machine learning (Random Forest) techniques to objectively quantify age-relevant urban features; and (3) the development of the Age Friendly Environment Assessment Tool (AFEAT), which enables fine-grained, segment-level scoring and clustering of street age-friendliness. Applied to a highly aged district in Nanjing, China, this framework not only advances methodological approaches in age-friendly urban research, but also offers practical value for data-informed planning, street retrofitting, and inclusive policy development in ageing societies.

2. Literature Review

The evaluation of age-friendly street environments has become a key frontier in urban studies, reflecting the dual pressures of rapid urbanization and population aging. Over the past two decades, methodological approaches have evolved from perception-based questionnaires to GIS-based spatial analyses and more recently to AI-driven techniques. Research has also shifted from neighborhood-scale case studies to citywide, data-intensive frameworks.
The subjective paradigm, which relies on field surveys, questionnaires, and behavioral observations, has long been central to environmental gerontology [33,34,35]. This approach is capable of capturing subtle perceptions and behavioral responses [36], and tools such as NEWS and SWEAT have been widely applied in Chinese cities [37]. However, it is resource-intensive, constrained by time and scale, and typically limited to small study areas, resulting in poor scalability [38].
The spatial-analytic paradigm, enabled by GIS, expanded the scale of research by focusing on accessibility and spatial equity [39]. Techniques such as kernel density estimation, buffer analysis, and network analysis have informed the optimization of medical and recreational facility layouts [40]. Yet these methods largely overlook micro-scale perceptual qualities—such as green view index, sidewalk continuity, and façade openness—limiting their ability to assess whether street paths themselves are walkable and age-friendly [41].
The computational paradigm, driven by artificial intelligence, has fundamentally reshaped street-level assessment. Advances in computer vision and deep learning allow semantic segmentation of street-view images (SVIs), enabling the extraction of features such as greenery proportion and façade complexity, which can be linked to perceived safety or aesthetic value via machine learning [42,43,44]. These approaches enable efficient multi-scale analysis from the micro to the macro level [45,46,47,48]. More recently, research has integrated multiple data sources (POIs, remote sensing, mobility data) with ensemble models, constructing multidimensional evaluation frameworks and even exploring causal relationships between environment and health outcomes [28,49].
An emerging paradigm focuses on the geometric attributes of streets extracted through deep learning. For example, Zhang and Hu (2022) used semantic segmentation of Google Street View images to quantify greenery indices and optimize walking routes, while Yu et al. (2025) combined visual feature extraction with generative adversarial models to assess perceptual dimensions, showing that vegetation and pedestrian presence contribute positively, whereas enclosed walls exert negative effects [50,51]. Crucially, these AI-based results converge strongly with findings from traditional questionnaire surveys, confirming both the validity and reliability of computational methods in evaluating age-friendly streets. In other words, AI-driven geometric analysis not only supplements but can, at larger scales, partially substitute perception-based surveys. More importantly, it provides a robust methodological bridge between physical spatial attributes and human-centered perceptions, opening new directions for future research and planning of age-friendly street environments.

3. Materials and Methods

3.1. Research Framework

This study establishes a quantitative model, the Age-Friendly Environment Assessment Tool (AFEAT), to evaluate urban pedestrian environments using multi-source big data (as shown in Figure 1). The indicator system follows the Global Age-Friendly Cities: A Guide (WHO) and covers six primary dimensions and fifteen secondary indicators: (1) Safe Mobility, (2) Environmental Amenity, (3) Accessible Amenities, (4) Health Services, (5) Leisure and Active Living Environment, and (6) Social Inclusion Hubs. The research process consists of four phases: data acquisition, data processing, data analysis, and visualization with discussion.
Define indicators and collect data. Primary and secondary indicators were identified through literature review and expert consultation, and weighted via surveys with elderly residents and urban planning professionals. For Safe Mobility, Environmental Amenity, and Accessible Amenities, Baidu street-view imagery was processed with the PSPNet deep learning model to extract proportions of features such as sidewalks, greenery, and obstacles. For Health Services, Leisure and Active Living Environment, and Social Inclusion Hubs, Point-of-Interest (POI) data were integrated with GIS-based walking accessibility analysis to assess facility distribution.
Process data and generate scores. For the first three dimensions, proportions of four streetscape feature types were combined with survey-derived weights and processed through a Random Forest regression model to produce street-level age-friendliness scores. For the latter three dimensions, scores were calculated from walking accessibility to relevant facilities.
Analyze results and verify relationships. Scores from the six dimensions were aggregated through weighted summation to generate composite AFEAT scores. K-means clustering classified street segments into high, moderate, and low age-friendliness. Street-level spatial elements were extracted through semantic segmentation, with de-scriptive and Pearson correlation analyses examined their associations with composite AFEAT scores.
Map spatial patterns and propose strategies. Thematic maps displayed overall and dimension-specific scores, revealing spatial disparities and infrastructure gaps. Based on these patterns, targeted spatial optimization strategies and policy recommendations were proposed to enhance street age-friendliness across neighborhoods.

3.2. Study Area

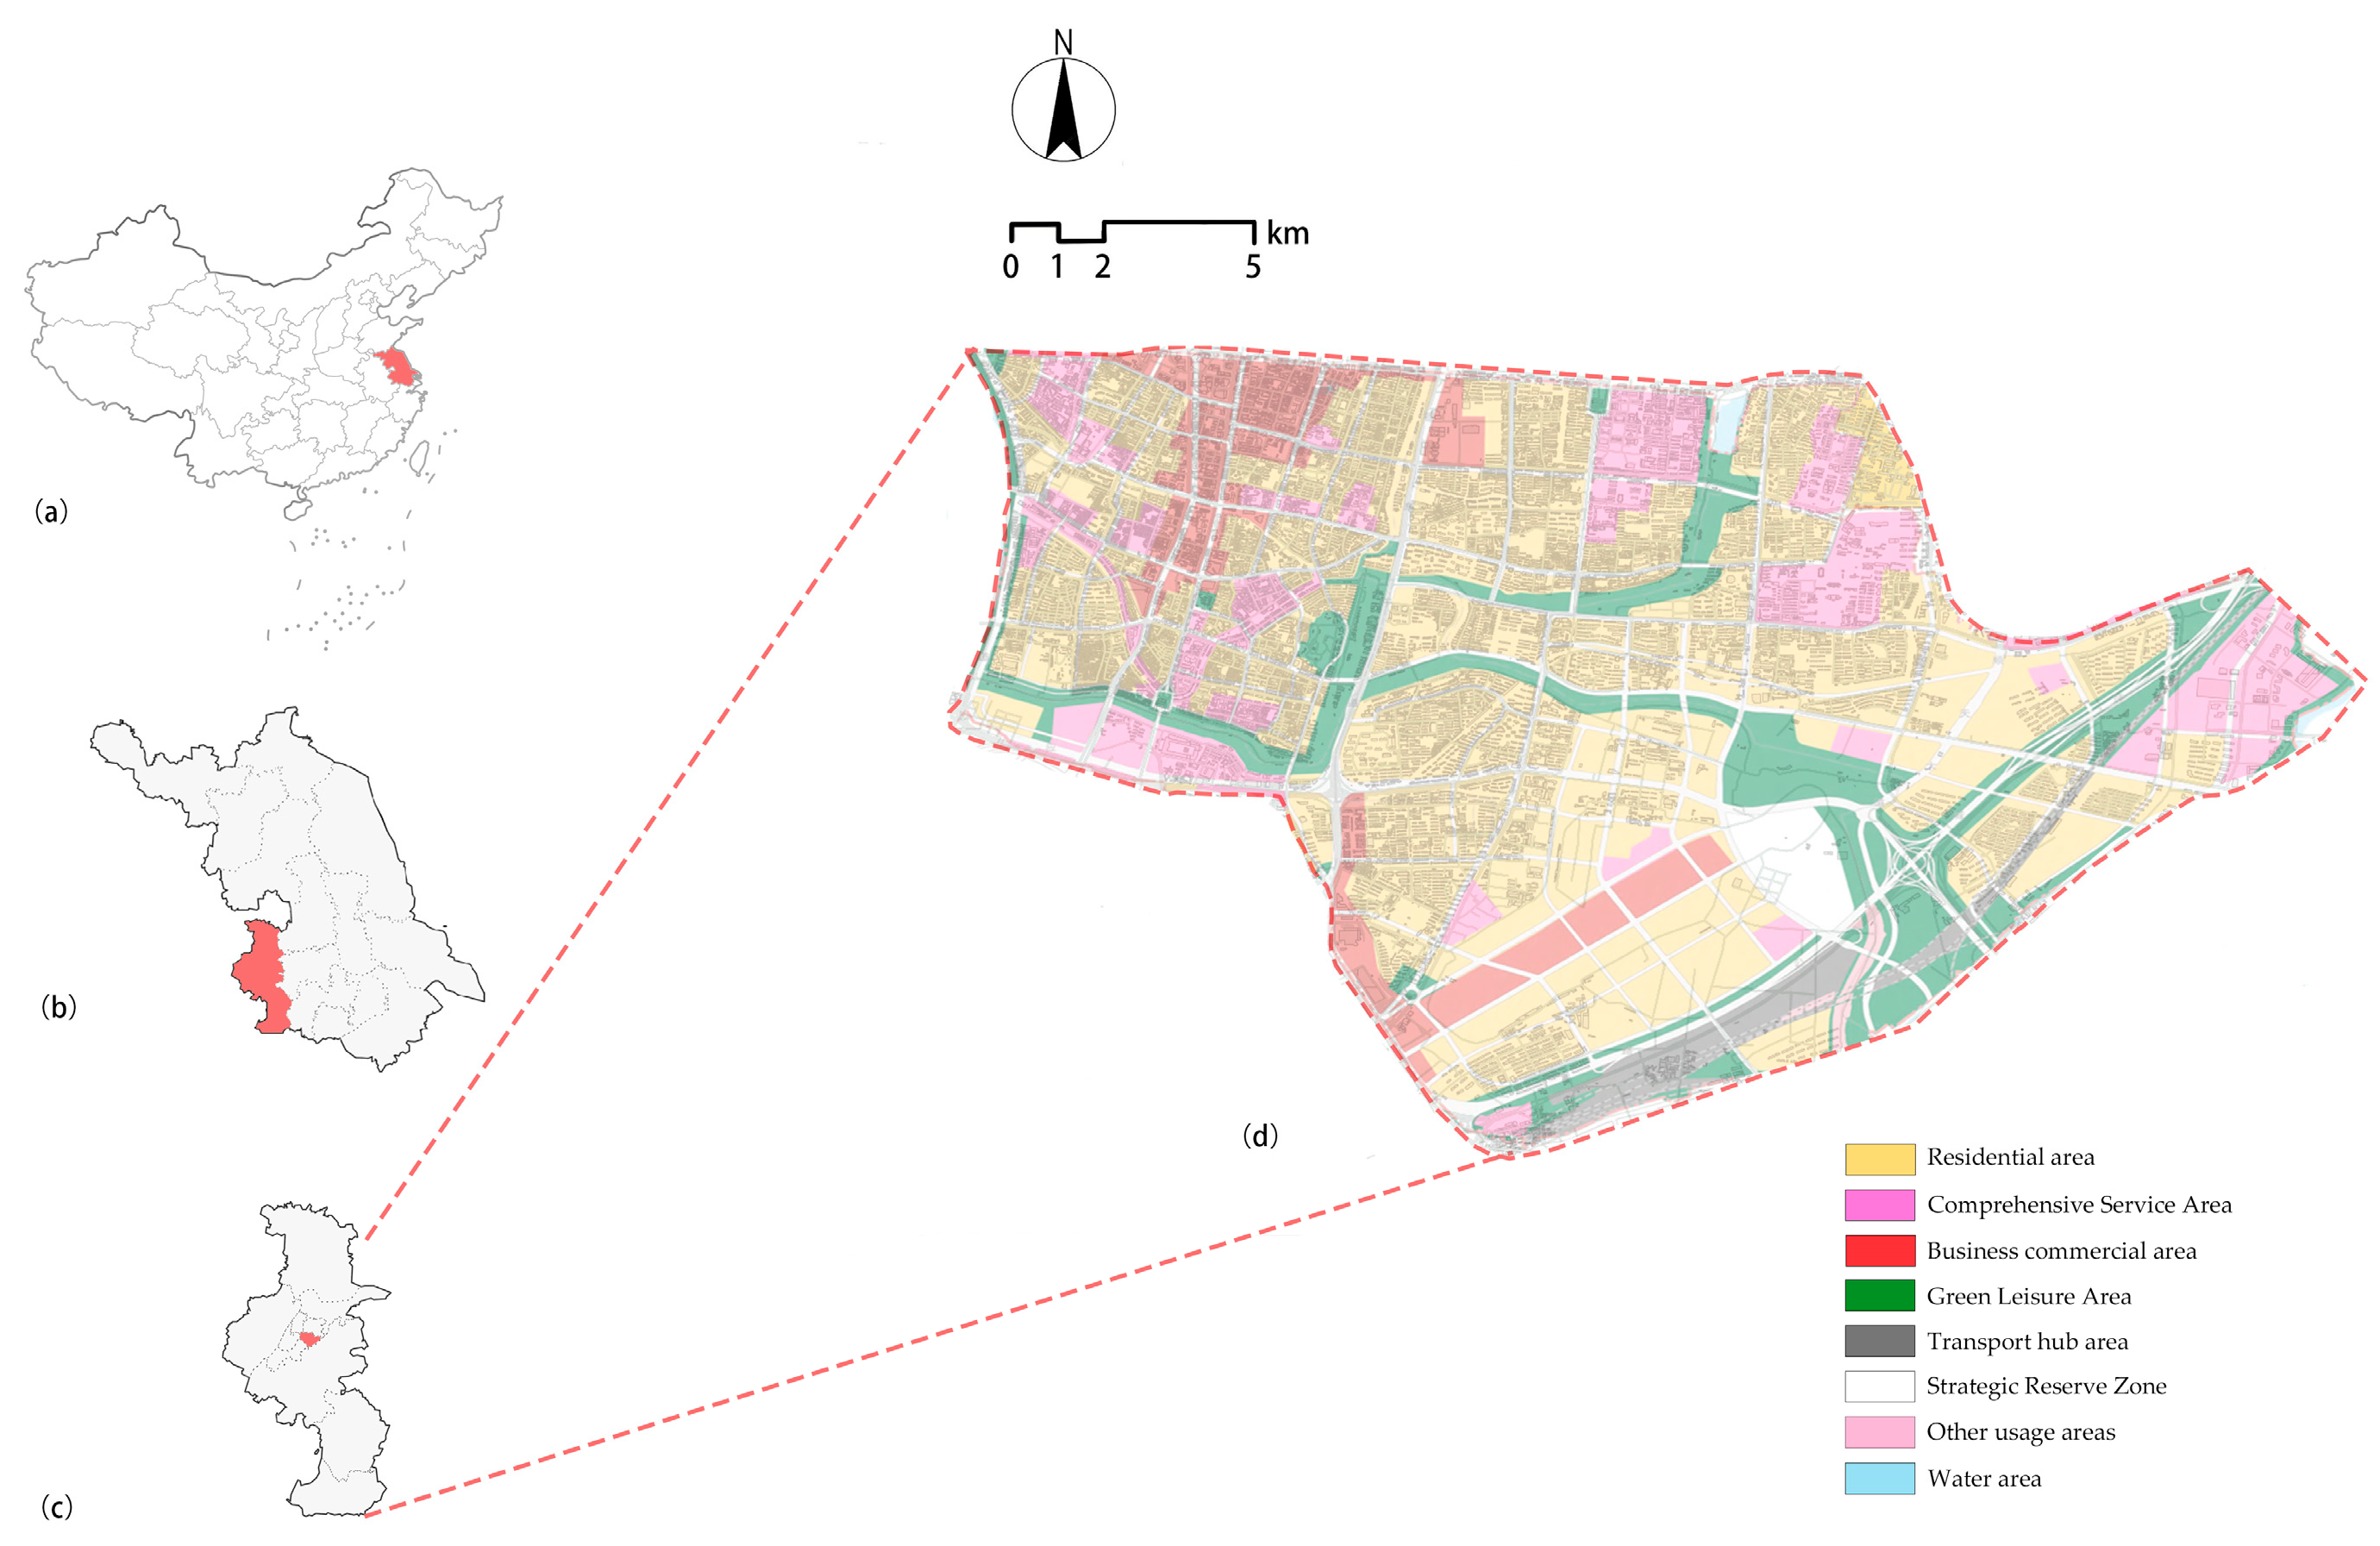
This study focuses on Qinhuai District in central Nanjing, China (Figure 2), a representative high-density urban core with 742,900 residents, a population density of 32,717/km2, and an urbanization rate of 98% [52]. Older adults (≥60 years) comprise 30.79% of the population, increasing 1.5% annually and projected to exceed 35% by 2025. Their average daily walking distance is approximately 3500 steps, below the recommended 6000 to 8000 steps, while age-friendly street modifications cover less than 5% of the district. These characteristics highlight critical mobility and accessibility challenges, making Qinhuai a highly relevant case for evaluating street age-friendliness. Given the severity of population aging and the associated socioeconomic implications, Qinhuai District serves as a highly relevant case study for assessing age-friendliness in street environments. The results of this study may inform urban improvement initiatives in Qinhuai and provide policy insights applicable to other cities in China and beyond.

3.3. The Age-Friendly Environmental Assessment Tool

3.3.1. Construction of the AFEAT Age-Friendly Street Assessment Model and Indicator Quantification

The World Health Organization (WHO) defines age-friendly cities in its Global Age-Friendly Cities Guide, recommending environments that support mobility, encourage physical activity, enhance safety, and facilitate social interaction and holistic well-being [5]. While studies on street perception share common objectives, significant variation remains in the selection, definition, and evaluation of indicators pertinent to older adults’ experiences. Menec et al. (2011) highlight imageability, walkability, and safety as key factors influencing older adults’ quality of life affect social participation and integration among the elderly [53,54]. Scharlach and Lehning (2013) propose a multidimensional perceptual framework encompassing safety, openness, and walkability [55]. Complementing these, Ewing et al. (2006) identified and quantified urban design qualities related to walkability, establishing foundational criteria widely applied in age-friendly environment assessments [56].
To enhance the objectivity of street age-friendliness assessments, Yao et al. (2019) developed a framework based on street view imagery, incorporating five principal indicators such as greenness, openness, and complexity [9]. King et al. (2015) applied kernel density estimation to investigate the relationship between neighborhood destination density and older adults’ walking and physical activity, providing insights for optimizing walking environments [57]. Building on this, Neal et al. (2006) and Sato et al. (2019) proposed a comprehensive framework integrating six perceptual qualities for evaluating street landscapes’ age-friendliness [58,59]. Furthermore, advances in urban spatial semantics, as demonstrated by Cai et al. (2019) and Liu et al. (2020), have facilitated a nuanced understanding of urban space functions and POI configurations, offering valuable context for assessing amenity accessibility and social inclusion hubs essential for older adults [60,61].
Drawing on six core needs of older adults in urban street settings, we constructed the AFEAT (Age-Friendly Environmental Assessment Tool) model tailored for high-density cities. As shown in Table 1, this model comprises six perceptual quality dimensions: (1) Safe Mobility, (2) Environmental Amenity, (3) Accessible Amenities, (4) Health Services, (5) Leisure and Active Living Environment, and (6) Social Inclusion Hubs.
These dimensions collectively address older adults’ mobility, recreation, medical access, and social participation needs, while also capturing both the physical features of the street and the accessibility of age-relevant services. The AFEAT model thus offers a robust and scalable approach for evaluating age-friendliness at the street level in high-density urban contexts.
(1)
Safe Mobility
This dimension focuses on the physical environment’s capacity to support older adults’ safe and accessible mobility. It emphasizes the mitigation of fall risks, pedestrian-vehicle conflicts, and spatial-induced anxiety. Anastasia (2006) highlighted neighborhood safety perception as a critical factor influencing older adults’ willingness to walk, noting that well-maintained traffic signals, streetlights, and pedestrian infrastructure significantly reduce potential hazards [62]. Wang et al. (2019) empirically demonstrated that visible safety features—such as clearly defined road edges, utility poles, and protective railings—are strongly associated with residents’ mental well-being [63]. Keskinen et al. (2020) further emphasized that sidewalks, streetlight, and staircases are essential for independent mobility among the elderly [64]. Accordingly, this study includes sidewalks, bridges, ashcan, utility poles, signboard, streetlight, and stairs in the Safe Mobility category to represent their role in ensuring a continuous, secure, and barrier-free walking environment (as shown in Table 2).
(2)
Environmental Amenities
This dimension evaluates how the spatial configuration of the street network facilitates older adults’ daily mobility through path continuity, functional integration, and spatial legibility. Nathan et al. (2012) found a strong correlation between the density of commercial facility entrances and walking behavior in older populations [65]. Carroll and Nørtoft (2022), in their co-design study of age-friendly neighborhoods in Copenhagen, emphasized that enhancing spatial coherence and wayfinding can significantly improve the convenience and appeal of urban streets [66]. Song et al. (2024) highlighted the importance of street intersections, entry points, and spatial continuity in supporting seniors’ spatial cognition and navigational ability [67]. Based on these findings, features such as sky, buildings, ceilings, walls, plants, fence, and grass are grouped under Mobility Convenience, reflecting the clarity of pedestrian flow and access to destination points (as shown in Table 2).
(3)
Accessible Amenities
This dimension addresses the visual and microclimatic comfort provided by the streetscape, with emphasis on natural elements and rest facilities that support psychological recovery and physical respite. Rodiek (2002) demonstrated that exposure to greenery and rest spaces effectively reduces emotional stress and anxiety among older adults [68]. Panno et al. (2017) showed that high greenery visibility enhances both psychological resilience and physiological recovery during urban heat events [69]. Similarly, Lottrup et al. (2013) and Peschardt & Stigsdotter (2013) found that the visibility and usability of green spaces and benches significantly increase outdoor stay duration and social interaction frequency [70,71]. Therefore, this study includes benches, doors, pots, cars, trucks, buses, and utility boxes under Accessible Amenities, capturing the streetscape’s restorative and supportive qualities (Table 2).
Table 2. Streetscape Feature Importance by AFEAT Indicator (Random Forest).
Age-Friendliness DimensionIndicatorElementsComposite Weight
Safe Mobility(A)Traffic Safety (A1)traffic light0.4515
streetlight0.3563
signboard0.1178
bridge0.0745
Transit Accessibility (A2)sidewalk0.5187
canopy0.2875
stairs0.0646
road0.1291
Barrier-free Transit (A3)utility pole0.1106
railing0.4716
ashcan0.1148
warning sign0.3030
Walkable Environment(B)Airflow Optimization (B1)sky0.4597
building0.3036
ceiling0.1302
wall0.1064
Noise-reducing Greenery (B2)plant0.5221
bushes0.2384
grass0.1088
fence0.1307
Accessible Amenities(C)Universal Access Infrastructure (C1)bench0.5097
box0.2403
door0.118
pot0.132
Organized Parking (C2)car0.5238
bus0.2892
truck0.0624
van0.1246
(4)
Healthcare Services
The Healthcare dimension focuses on the spatial availability and accessibility of health-related facilities, emphasizing support for emergency response and chronic disease management. The World Health Organization (2022) stated that maintaining older adults’ health relies heavily on timely access to nearby community medical services [72]. Plouffe and Kalache (2010) identified medical service coverage as a key indicator of age-friendly livability in cities [73]. Colangeli (2010) also emphasized the importance of embedding nursing homes within neighborhood-scale layouts to enhance social support systems for seniors [74]. This study classifies general hospitals and community clinics with geriatric rehabilitation functions (D1: Medical Facility Accessibility), pharmacies and health service points (D2: Medical Services Accessibility), and community-integrated nursing homes (D3: Senior Care Facilities) under the Healthcare dimension to assess the spatial distribution and service accessibility of daily health resources.
(5)
Leisure and Active Living Environment
The Daily Amenities dimension examines the availability of essential services and facilities that support older adults’ basic consumption and leisure needs, with an emphasis on walkability and convenience. Nathan et al. (2012) found that the distribution density of green spaces and neighborhood-scale commercial outlets directly influences walking frequency and social participation among seniors [65]. Cambra and Moura (2020) showed that the presence of markets, convenience stores, and open green areas significantly increases public space use and resident satisfaction [75]. King et al. (2015) further indicated that co-located green and commercial facilities help mitigate cognitive decline and social isolation in the elderly [57]. As such, this study includes urban parks and small-scale green spaces (E1: Green Space Accessibility), as well as farmers’ markets and convenience stores (E2: Daily Market Accessibility), under Daily Amenities to reflect the mixed functionality of community spaces.
(6)
Social Participation and Interaction
This dimension highlights the presence of platforms and infrastructure that facilitate older adults’ social participation and information access at the street level. Palmer et al. (2011), Green (2013) and Chan (2019) found that grassroots organizations, such as community committees and volunteer centers, significantly enhance older adults’ sense of belonging and mutual support networks [76,77,78]. Wang et al. (2023) emphasized the critical role of public transportation connectivity in shaping seniors’ ability to engage in social activities beyond their immediate neighborhoods [79]. Therefore, this study includes Volunteer Hub Accessibility (F1), Neighborhood Council Accessibility (F2), and public transit facilities such as Transit Node Accessibility (F3) under Community Engagement, to assess whether the streetscape supports social interaction and mobility opportunities for older adults.

3.3.2. Weighting of AFEAT Indicators

To determine the relative importance of indicators within the Age-Friendly Evaluation of Active Transportation (AFEAT) framework, this study adopted the Analytic Hierarchy Process (AHP) a widely applied structured decision-making method that quantifies indicator weights through systematic expert judgment [80]. The AHP procedure involves three key stages: (1) decomposition, in which the overall evaluation objective is structured into a hierarchical model comprising the overarching goal, six primary dimensions, and their respective secondary indicators; (2) comparative judgment, in which participants perform pairwise comparisons between indicators, scoring each pair on a scale from 1 (equal importance) to 9 (extreme preference for one indicator over the other); and (3) synthesis, in which individual judgment matrices are constructed, and consistency ratios (CR) are calculated to evaluate logical coherence (Table 3). Matrices exceeding the acceptable CR threshold were excluded from further analysis.
To ensure a balanced perspective that integrates both end-user experiences and professional expertise, a questionnaire survey was conducted with 105 older adults and 22 domain experts [81,82,83]. All older adult participants were aged 60 years or above, physically capable of independent mobility, and had the following age distribution: 42 aged 60 to 64, 33 aged 65 to 69, 15 aged 70 to 79, and 15 aged 80 to 84, with an approximately balanced gender ratio. Expert participants were recruited from academia, elder-care institutions, social work, and urban planning, representing diverse disciplines such as sociology, psychology, public health, and urban design. Informed consent was obtained from all participants, and the study protocol followed standard ethical guidelines. After data cleaning, 100 valid responses from older adults and 20 valid expert questionnaires were retained for analysis.
The mean weight values derived from the valid matrices were calculated and rounded to yield the final indicator weights. As shown in Table 4, both older residents and experts consistently identified Safe Mobility (A), Health Services (D), and Environmental Amenity (B) as the most influential dimensions in shaping age-friendly street environments. By contrast, Accessible Amenities (C), Leisure and Active Living Environment (E), and Social Inclusion Hubs (F) were rated as relatively less impactful in influencing older adults’ street-level mobility and spatial experiences.
Both stakeholder groups consistently rated Safe Mobility (A) as the highest priority, with weights of 0.248 (experts) and 0.218 (residents), underscoring that pedestrian safety and injury prevention are fundamental to the concept of age-friendly streets. Notably, older residents assigned greater importance to Health Services (D) (weight: 0.219) compared to experts, reflecting their strong reliance on accessible medical services in daily life. They also placed slightly more emphasis on Environmental Amenity (B), assigning it a weight of 0.197, which demonstrates heightened sensitivity to greenery and air quality. This is particularly evident in sub-indicator B2 (Noise-reducing Greenery), which received 52.3% of the total weight within this category from older participants. Meanwhile, both older residents and experts ranked the Leisure and Active Living Environment (E) as the least critical dimension, 9.2% for residents and 11.4% for experts, likely due to the already extensive coverage of parks (E1) and local markets (E2) in the Qinhuai District, resulting in a relatively saturated level of demand.

3.4. Data Source and Analysis

3.4.1. Semantic Segmentation with PSPNet

This study collected high-resolution street view imagery across Qinhuai District to support perceptual assessment modeling. Images were captured every 25 m via a Python 3.7 script integrated with the Baidu Street View API. Based on the platform’s data acquisition schedule, the images were predominantly captured during daytime hours (8:00–16:00), ensuring consistent lighting conditions. A total of 15,397 images were acquired, ensuring comprehensive spatial coverage. To reflect the diminished visual range of older adults due to reduced height and visual acuity, images were cropped at the top by 5/16 to simulate a typical viewing angle at 150 cm [84,85,86].
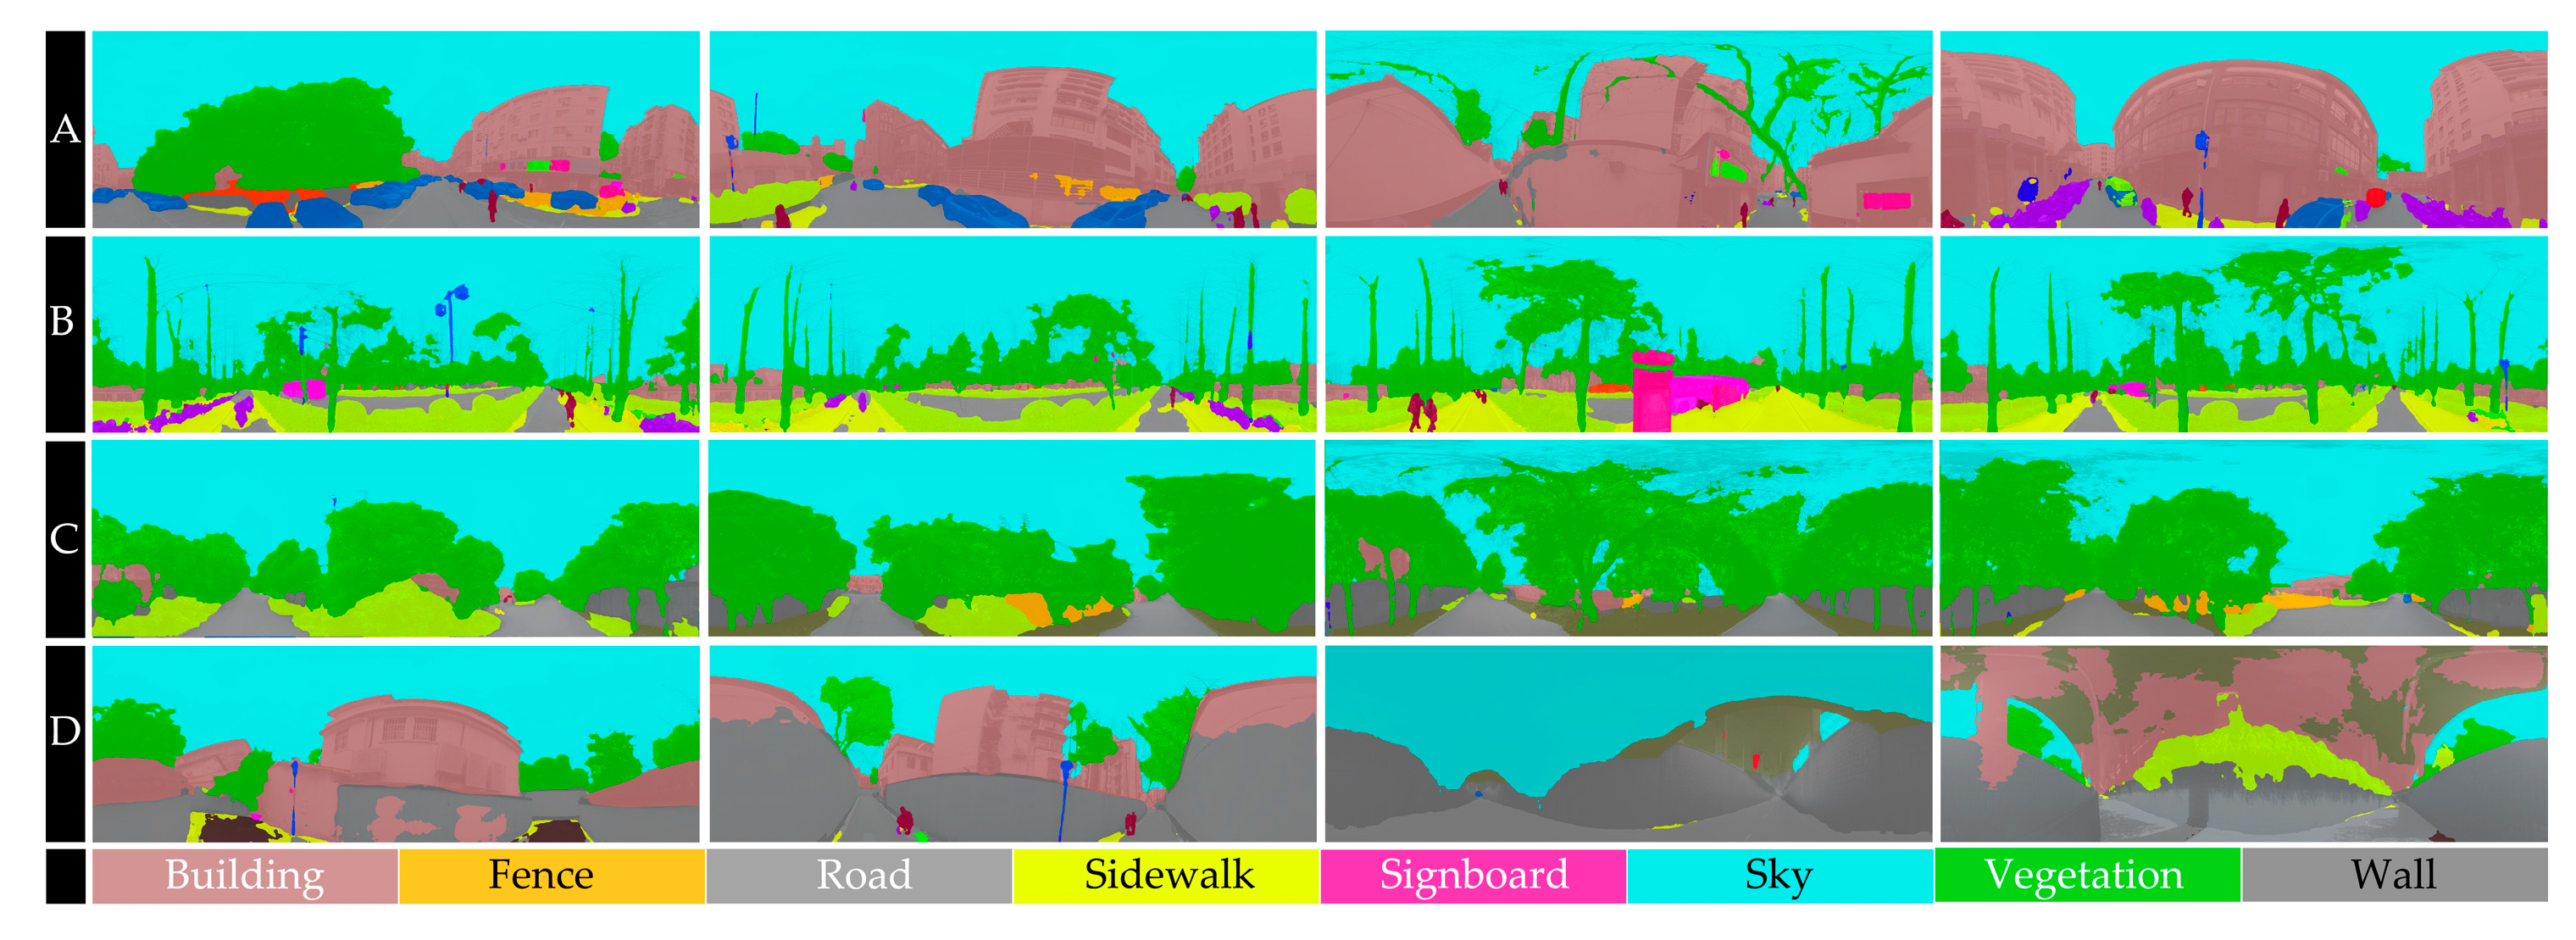
For semantic segmentation, the Pyramid Scene Parsing Network (PSPNet) was adopted, combining a ResNet-101 backbone with a Pyramid Pooling Module (PPM) to enable pixel-level classification of complex urban scenes [87]. The model was trained on a subset of the ADE20K dataset containing urban street categories (as shown in Figure 3).
PSPNet aggregates multi-scale contextual features through a four-level pyramid pooling structure with bin sizes k = 1 ,   2 ,   3 ,   6 . Given an input feature map F R C × H × W , the pooled representation at each scale is computed as:
P k = A v g P o o l k × k F ,
Each P k is then up-sampled to the original feature map size using bilinear interpolation:
P ^ K = U P k R C × H × W ,
All upsampled features are concatenated with the original feature map to form an enriched context-aware representation:
S ^ = S o f t m a x C o n v 1 × 1 F P P M R N × H × W ,
where N is the number of semantic classes. Model training was performed using transfer learning by freezing early layers and fine-tuning higher-level ones. The network was trained for 80 epochs using a batch size of 4, the Adam optimizer, an initial learning rate of 1 × 10 4 , and early stopping criteria to mitigate overfitting [88].
The semantic segmentation outputs were used to compute the proportional coverage of each semantic class per image:
R i , c = x ,   y 1 S 1 x ,   y = c H × W ,
where R i , c is the proportion of class ccc in image i and 1 · is the indicator function. These class-wise proportions were assembled into feature vectors R i R N , which served as input to a Random Forest regression model for predicting the six AFEAT indicators, enabling a perceptually grounded evaluation of age-friendliness.
Geometry-related indicators were further derived by calculating the proportional coverage of eight street elements (building, sky, road, sidewalk, wall, vegetation, fence, signboard) from the segmented images. These proportions characterize streetscape morphology in terms of enclosure, openness, and greenery, and were analyzed through Pearson correlation and descriptive statistics to assess their associations with overall age-friendliness scores.

3.4.2. Accessibility and Kernel Density Analysis Based on POI Data

(1)
POI Processing and Age-Friendly Screening
POI data collection focused on facilities most relevant to the daily lives of older adults, aligning with the requirements of an age-friendly urban environment [89]. A three-step processing pipeline was applied: deduplication, denoising, and spatial alignment. After removing duplicates and correcting outliers, POIs were spatially overlaid with the street boundaries of Qinhuai District in ArcGIS to ensure consistency between analytical units. In parallel, the road network data were obtained from OpenStreetMap (OSM) and processed in ArcGIS to align with district boundaries, providing the spatial framework for calculating walking accessibility and evaluating street-level age-friendliness. To validate the dataset, the POI distributions were compared against official statistics from the Qinhuai District Statistical Yearbook 2024, including metrics such as the older adult population, total park green space, the number of medical institutions, and eldercare service centers [90]. The high degree of consistency confirmed the dataset’s accuracy and reliability for further analysis (Table 5).
(2)
Walking Accessibility Analysis of POI Facilities
To evaluate the service accessibility of age-friendly facilities for older adults, this study employed a network-based walking accessibility model, integrating the street network to calculate the shortest walking distance from each residential unit to the nearest POI of each category. Based on the commonly accepted average walking speed of older adults, approximately 0.8 m per second, we established accessibility thresholds of 250 m, 500 m, and 750 m, corresponding to walking durations of about 5, 10, and 15 min, respectively [91,92]. These thresholds represent high, moderate, and low accessibility zones and serve as a practical basis for evaluating spatial equity and the adequacy of facility coverage within the urban environment.
The shortest walking distance d i j from residential point i to facility point j was calculated using the following formula:
d i j = m i n L e n g t h ( P i j ) ,
The symbol P i j epresents the set of feasible walking paths from residential point i to facility point j. Following this, a Spatial Join analysis was conducted to calculate the number of accessible facilities of each type within various walking thresholds for each street segment. The results were expressed using an accessibility ratio, defined as the proportion of facilities that fall within a given walking distance threshold.
A R k = N k r e a c h a b l e N k t o t a l ,
where A R k denotes the accessibility ratio for facility category K, N r e a c h a b l e  represents the number of POIs within the specified walking distance threshold for that category, and N t o t a l is the total number of POIs of that category.
(3)
Kernel Density Estimation
To identify the spatial clustering patterns of age-friendly facilities within the urban environment, Kernel Density Estimation (KDE) was employed to visualize the distribution of various POI categories. KDE transforms each point into a kernel function over space to estimate the density of facilities per unit area, thereby revealing “hotspots” of facility concentration and potential “service gaps.” The kernel density estimation is calculated using the following function:
f x , y = 1 n h 2 i = 1 n K d i x , y h ,
where
x , y denotes an arbitrary location in the spatial domain;
d i x , y is the Euclidean distance between location x , y and the i-th POI;
h  represents the bandwidth parameter, which in this study is set within the range of 200–1000 m;
K is the kernel function, and the commonly used Gaussian kernel is applied here.
The KDE analysis was conducted using the Spatial Analyst tool in ArcGIS 10.8 to visualize the spatial distribution of POI densities. Different bandwidth parameters were tested to examine their effects on density outcomes. The results showed that within the tested range, the KDE distribution patterns remained stable, confirming the robustness of the kernel density analysis.
Through the aforementioned data collection, cleaning, and analysis procedures, the walking accessibility and kernel density estimation methods reveal spatial variations in the provision of age-friendly facilities from the dimensions of “travel accessibility” and “spatial clustering,” respectively. These findings provide a scientific basis for proposing targeted optimization measures and planning interventions.
Table 5. The facility types and the number of POIs.
Type of POIsDescriptionNumber
Medical FacilitiesFacilities that offer accessible and healthcare services, such as hospitals and clinics.52
Medical ServicesPharmacies328
Senior Care FacilitiesSpecialized institutions that provide residential care, daily life assistance, and medical monitoring for elderly individuals.41
Green SpacesPublic open spaces designed to be safe, accessible, and restorative for all ages, especially older adults.60
Daily MarketsDaily supply venues such as wet markets or community supermarkets with barrier-free entry282
Volunteer Service CentersCommunity-based centers that mobilize volunteers to provide companionship, home assistance, or administrative help for elderly residents22
Community CommitteeLocal governance bodies that coordinate elderly services, mediate local issues, and promote intergenerational engagement through accessible communication channels and outreach programs.109
Bus Stops and Subway StationsPublic transport nodes designed to accommodate older passengers with features like seating, ramps, tactile paving, low-floor buses, and audible announcements.276

3.4.3. Random Forest Model for Assessing Street Age-Friendliness

(1)
Data Sources and Preprocessing
The dataset used for constructing the random forest model comprised both perceptual evaluation survey responses and semantic segmentation features extracted from street view images. First, a representative street image dataset was compiled for typical streets in Qinhuai District, Nanjing. The images were segmented using the PSPNet model to extract pixel proportion features of 28 street elements, including sidewalks, green spaces, guardrails, pedestrians, and traffic signs, which served as input variables for the model.
To obtain the target variables, 30 experts, such as urban planners, elderly residents, social workers, and nursing home managers, were invited to subjectively evaluate the streets using a five-point Likert scale, based on three primary perceptual dimensions: safe passage, travel convenience, and environmental comfort. The resulting perceptual evaluation dataset was then normalized, and any missing or anomalous data points were removed to enhance modeling accuracy and sample consistency prior to model training.
(2)
Modeling and Training Process
Random Forest is a non-parametric ensemble learning regression model that constructs multiple decision trees and aggregates their predictions to improve fitting capability and robustness [93,94]. In this study, the model was implemented in Python using the Random Forest Regressor module from the scikit-learn library. The dataset was split using the hold-out method, allocating 70% for training and 30% for testing.
Each decision tree in the forest was trained on bootstrap samples drawn with replacement from the training set. During node splitting, a random subset of features was selected to determine the best split, enhancing model diversity and reducing the risk of overfitting. The training sample set is defined as:
D = x 1   , y 1 ,   x 2   , y 2 x n   , y n ,
where xi ∈ Rm represents the i-th sample’s m-dimensional street view feature vector, and yi denotes the corresponding perceptual score. Each regression tree outputs:
hb (x) = Treeb(x), b = 1,2,……,B,
The final predicted score output by the Random Forest model is given by:
f x = 1 B b = 1 B h b ( x ) ,
where B denotes the total number of trees in the ensemble. The final predictive performance of the model is evaluated using three metrics: the coefficient of determination (R2), mean squared error (MSE), and mean absolute error (MAE), which are computed as follows:
R 2 = 1 y i y ^ i 2 y i y ^ i 2 ,   MSE   = 1 n y i y ^ i 2 ,   MAE   = 1 n y i y ^ i ,
In the above equations, y i ^ represents the model-predicted value, y i denotes the actual observed value, and y ^ is the mean of all observed values in the sample. Model training was performed with hyperparameter optimization based on the default settings. The number of trees was set to 200, and the maximum tree depth was limited to 15. Experimental results indicate that the Random Forest model demonstrates strong fitting performance on the test set, making it well-suited for establishing the mapping between streetscape features and perceived age-friendliness scores. This enables the quantitative estimation of subjective perceptions based on objective visual indicator.

4. Results

4.1. Overall Age-Friendliness of Streets

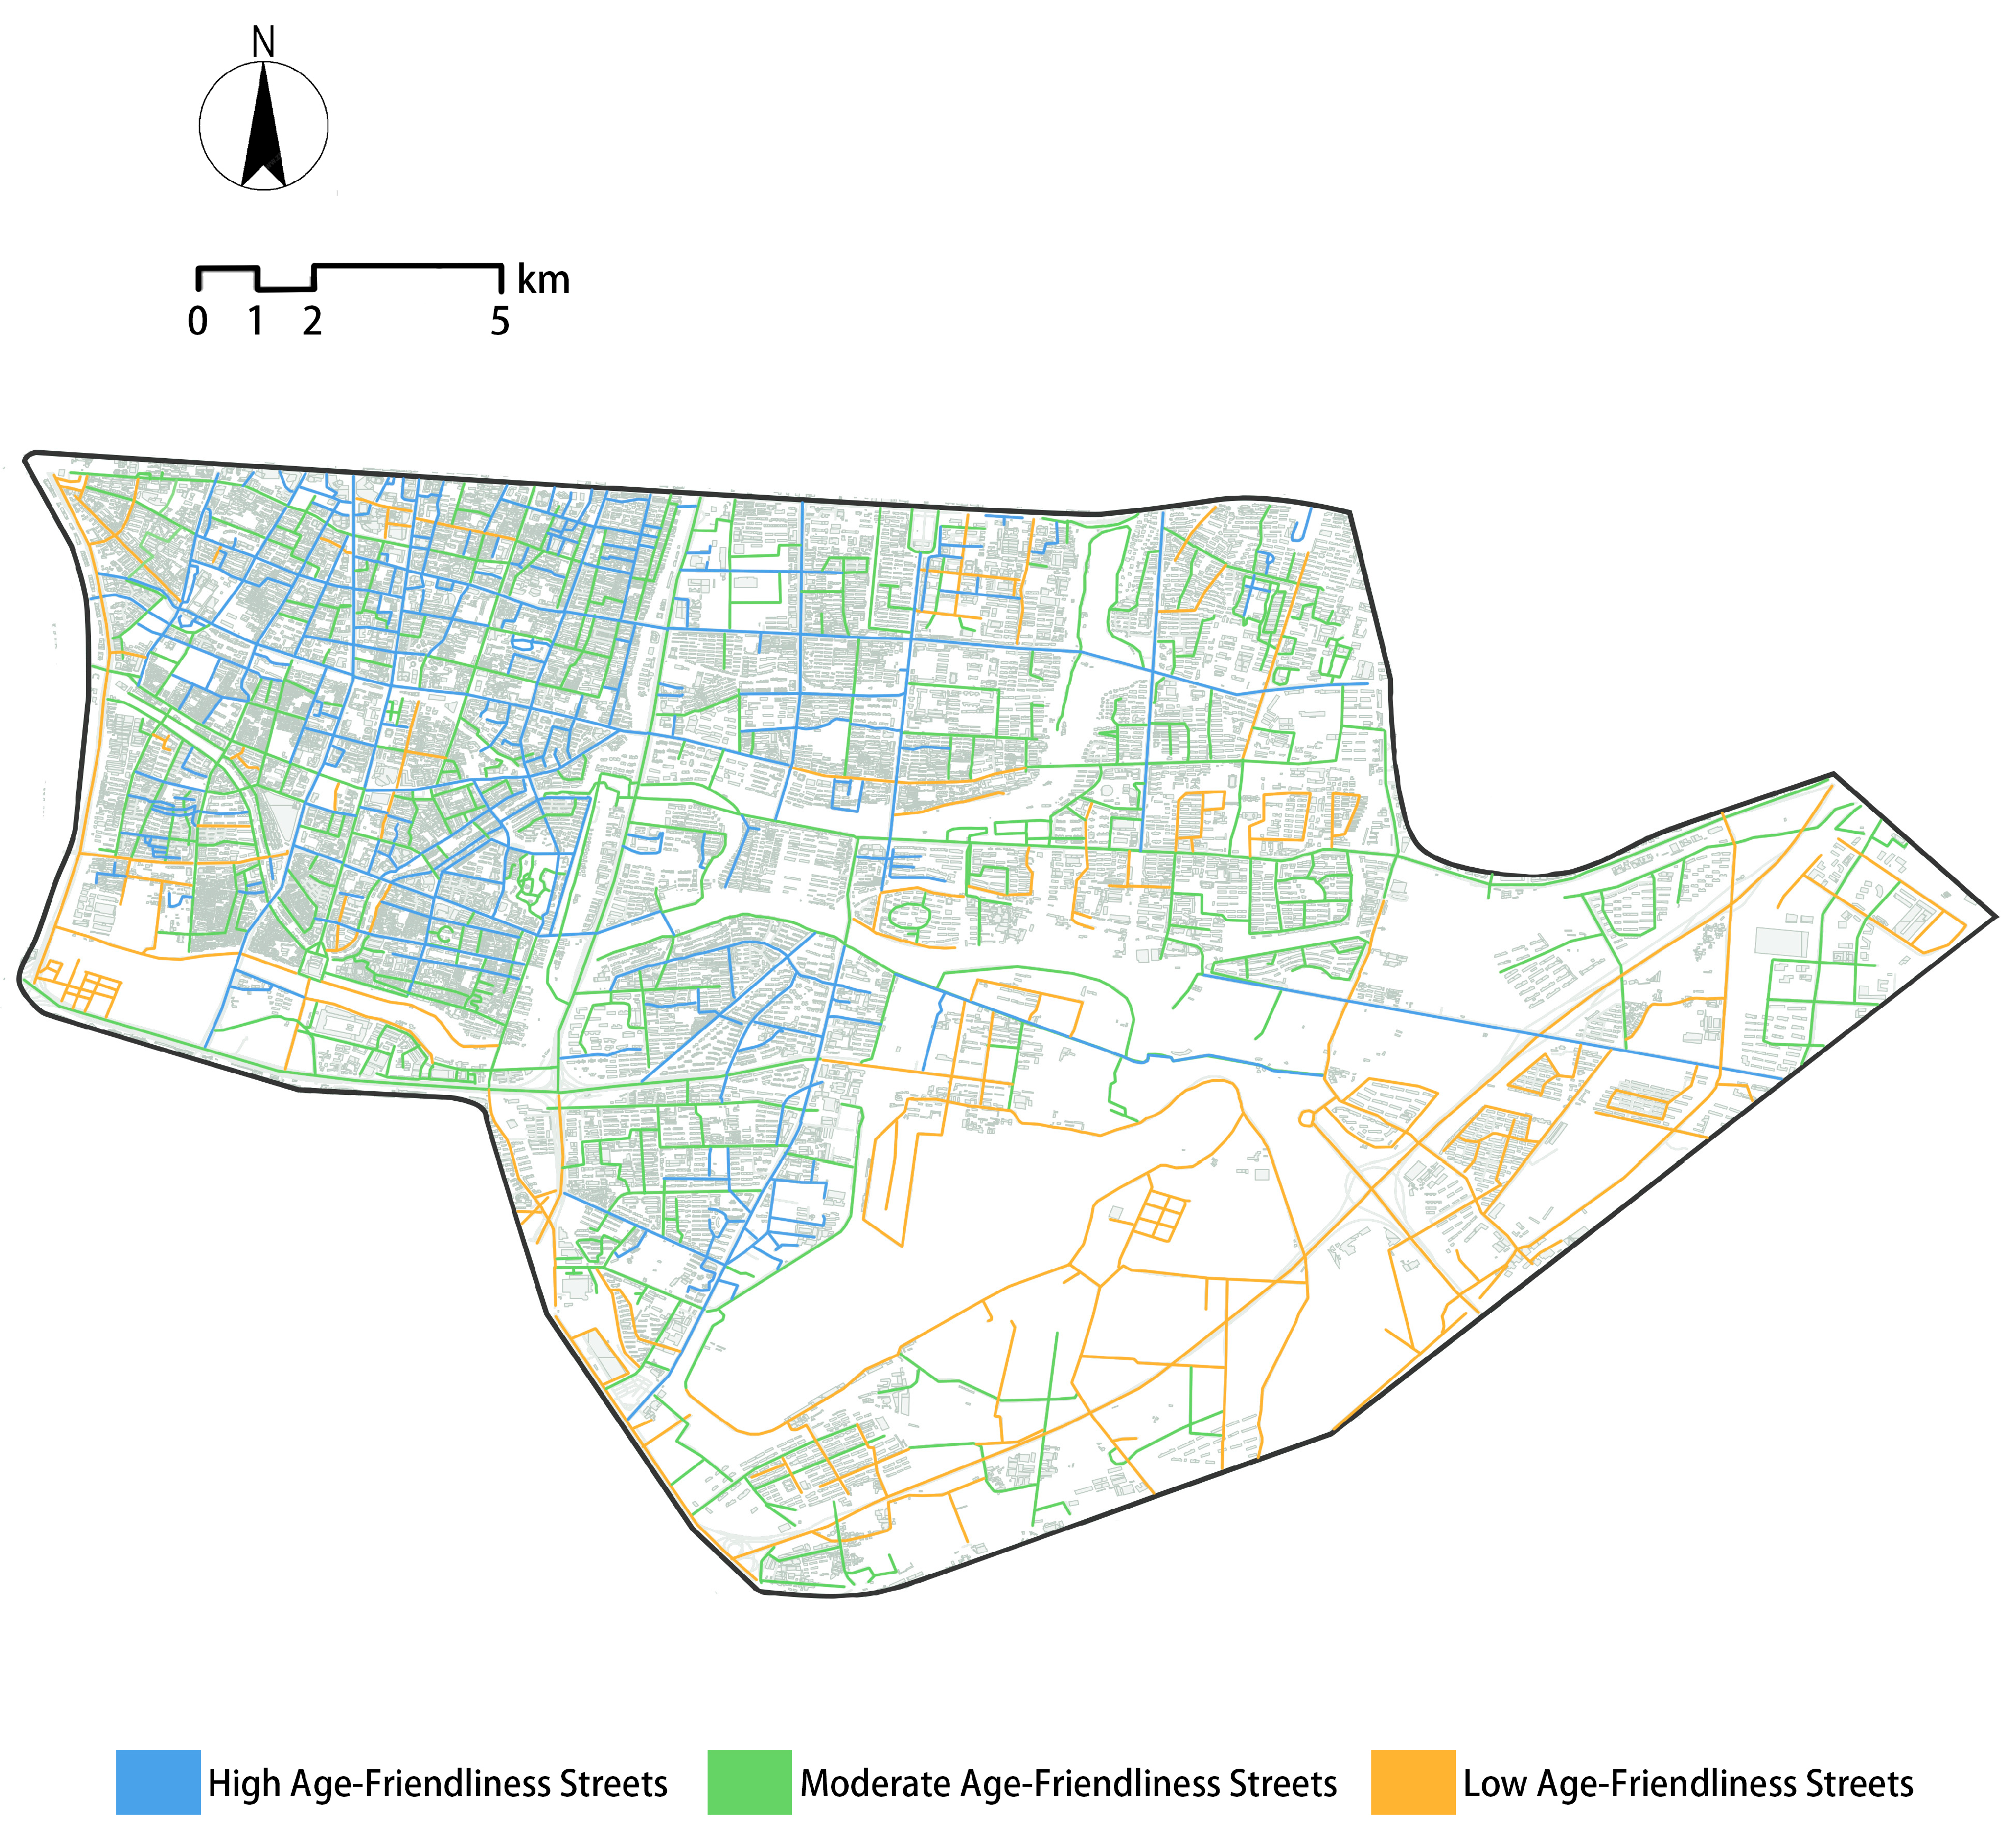
Based on the aforementioned datasets and methodologies, the age-friendliness scores of 202 streets in the Qinhuai District were calculated. Using K-means clustering on the scoring results, the streets were categorized into three levels: high, moderate, and low age-friendliness. Figure 4 illustrates the spatial distribution of street age-friendliness across Qinhuai District, while Table 6 presents the detailed scores for each dimension.
An analysis of the six core dimensions of street age-friendliness reveals the following patterns:
  • For Safe Mobility (Dimension A), streets with a medium level of age-friendliness account for the highest proportion (54.46%), whereas those with low age-friendliness represent the smallest share (19.80%).
  • In the Pleasant Environment (Dimension B), a significant portion of streets fall within the high (36.14%) and medium (45.05%) categories, with only 18.81% classified as low.
  • Facility Friendliness (Dimension C) is primarily characterized by medium-level streets (46.53%), followed by high-level (31.19%) and low-level (22.28%) streets.
  • Similarly, Health Security (Dimension D) shows a dominant presence of medium-level streets (44.06%), while high-level streets constitute 34.16%, and low-level ones make up 21.78%.
  • The Active Living Environment (Dimension E) performed notably well, with high and medium levels nearly evenly distributed (42.57% and 42.08%, respectively), and the lowest share in the low category (15.35%).
  • In contrast, Social Connectivity (Dimension F) demonstrates a relatively higher proportion of low age-friendliness streets (27.23%), while medium and high levels are comparable at 37.13% and 35.64%, respectively.
From the perspective of the overall age-friendliness index, streets with a medium level of age-friendliness dominate the study area, accounting for 52.97%, followed by high age-friendliness streets at 27.72%, and low-level streets at 19.31%. A comparative analysis across dimensions reveals that the Active Living Environment performs the best, with 42.57% of streets classified as highly age-friendly. In contrast, Social Connectivity exhibits a relatively high proportion of low-performing streets (27.23%), indicating it as a key area in need of improvement. The Safe Mobility dimension shows a particularly strong representation at the medium level (54.46%), reflecting the achievements of Qinhuai District in foundational age-friendly infrastructure development.
Overall, the age-friendliness of pedestrian street environments in Qinhuai District exhibits significant spatial heterogeneity. Streets with high age-friendliness are mainly concentrated along major arterial roads and core public service zones in the historic urban center, while streets with medium to low scores are generally distributed across secondary roads and peripheral neighborhoods.

4.2. Correlation Analysis of Multi-Level Indicators in the AFEAT Model

To assess the relative contribution of each AFEAT dimension to overall street age-friendliness, Pearson correlation analysis was conducted between the six primary indicators and the composite AFEAT score. Results indicate substantial variation in the strength of associations (Table 7).
Healthcare Services shows the strongest positive correlation (r = 0.846, p < 0.01), highlighting the central role of medical accessibility in shaping older adults’ environmental satisfaction. Social Inclusion Hubs (r = 0.719, p < 0.01) and Leisure and Active Living Environment (r = 0.693, p < 0.01) also exhibit strong correlations, underscoring the importance of social interaction and recreational spaces in supporting well-being and autonomy. Safe Mobility (r = 0.259, p < 0.01) and Accessible Amenities (r = 0.235, p = 0.001) display weaker but still significant correlations, suggesting that while foundational, their influence on overall perception is more limited.
In contrast, Environmental Amenity shows a weak, non-significant negative correlation (r = –0.104, p = 0.140). This may reflect a misalignment between objective visual features such as sky, buildings, walls, and ceilings and older adults’ subjective preferences. A high proportion of sky or hard surfaces may indicate openness and exposure, which can conflict with preferences for sheltered, human-scaled, and continuous spaces. In large-scale, hard-edged urban streetscapes, dominant configurations of buildings, sky, and walls may reduce spatial comfort and perceived safety.

4.3. AI-Derived Spatial Elements and Their Alignment with AFEAT Scores

Accurate extraction and quantification of street-level spatial elements are crucial for elucidating how urban form shapes age-friendly perceptions (Figure 5). Building on recent deep learning applications for extracting street-level features, this study selectively quantifies geometry-related elements from existing street view data, specifically Building, Sky, Road, Sidewalk, Wall, Vegetation, Fence, and Signboard, providing empirical evidence from a high-density urban district and addressing a gap in prior assessments. As shown in Table 8, descriptive statistics reveal that buildings dominate street interfaces in Qinhuai District (mean = 0.224), forming continuous corridors typical of dense urban morphology. Sky visibility averages 0.414 (SD = 0.104), indicating substantial variability in openness across street segments. Roads (mean = 0.085) and sidewalks (mean = 0.021) occupy limited space, reflecting constrained pedestrian environments that may restrict older adults’ mobility. Walls (mean = 0.019) are generally low in proportion but form continuous stretches locally, intensifying enclosure. Vegetation (mean = 0.167) is unevenly distributed, highlighting limited green provision, while fences (mean = 0.008) and signboards (mean = 0.003) have minimal coverage and impact.
Pearson correlation analyses further indicate that Building and Sidewalk proportions are positively associated with age-friendliness scores (r = 0.301, p < 0.001; r = 0.181, p = 0.01), suggesting that compact building interfaces and existing pedestrian infrastructure enhance older adults’ perceived usability. Conversely, Sky visibility and Wall proportion are negatively correlated with age-friendliness (r = −0.268, p < 0.001; r = −0.295, p < 0.001), showing that both overly open and excessively enclosed street configurations may reduce perceived comfort. Vegetation, Fence, and Signboard proportions show no significant correlation with age-friendliness, suggesting that in dense urban contexts, localized greenery or minor features alone do not substantially shape older adults’ perceptions (Table 9).
Importantly, AI-derived street geometric indicators show high agreement with survey-based AFEAT results, particularly for Building and Sidewalk proportions, validating the reliability of AI data in reflecting real age-friendly experiences. This finding not only corroborates the questionnaire results but also demonstrates that machine learning and generative AI can objectively identify human-centric environments that meet older adults’ needs, providing a robust complement and validation tool for age-friendliness assessment in high-density districts. Overall, street-view analysis of Qinhuai District reveals a dual spatial pattern: compact and continuous building interfaces enhance spatial enclosure and navigational clarity, supporting safety and walkability for older adults, while limited greenery and constrained sidewalks reduce comfort and environmental diversity. By quantifying street-level spatial elements and examining their consistency with survey scores, this study demonstrates how specific geometric characteristics influence perceptions of age-friendliness, highlighting the critical role and future potential of AI-based street view analysis in providing comprehensive evidence to guide spatial interventions and urban design in dense city districts.

4.4. Spatial Distribution Characteristics of Age-Friendly Pedestrian Streets

4.4.1. Safe Mobility

To further illustrate the characteristics of streets with varying levels of age-friendliness, separate scores and classifications were conducted based on six primary indicators, resulting in six distinct thematic maps of age-friendliness (as shown in Figure 5).
Scoring results derived from street view image segmentation indicate significant spatial heterogeneity in the level of safe mobility age-friendliness across the study area. The three categories of streets exhibit notable differences in traffic safety (A1), traffic convenience (A2), and barrier-free accessibility (A3). As shown in Figure 6a, spatially, streets with high age-friendliness predominantly cluster in the Fuzimiao scenic area, medium-level streets mainly concentrate in the transitional zones of the old city, and low-level streets are primarily distributed along the boundaries of Qinhuai District and near transport hubs, forming a clear concentric spatial pattern.
  • There is distinct spatial differentiation in the age-friendliness of streets within Qinhuai District. Streets with high safe mobility scores are mainly located in core areas such as Xinjiekou and Fuzimiao. As shown in Figure 6a, Zhongshan South Road and Hongwu Road have traffic light densities of 0.0013 and 0.0012 respectively, significantly exceeding the district average of 0.0008 ± 0.0003. Chaoku Street benefits from sufficient nighttime lighting with a streetlight density of 0.0011. Pedestrian infrastructure on roads like Xuguangli (sidewalk ratio = 0.0553) and Saozhou Alley (0.0730) meets width and continuity standards, creating a high-quality walking environment overall.
  • Moderate Age-Friendliness Streets are mainly distributed in a fragmented spatial pattern on the east and west sides of the southern old city, with common issues including a lack of traffic signals (e.g., Jiujiuchang Road, traffic light density = 0.0002), discontinuous sidewalks (e.g., Caixia Street, sidewalk ratio = 0.0063), and missing barrier-free facilities such as tactile paving and ramps (e.g., Junsi Alley).
  • Low age-friendliness streets cluster in the northeastern periphery of Qinhuai District, including areas like Xujia Alley, Junong Road, and Zhongheqiao Road. These areas generally suffer from insufficient nighttime lighting, encroachment of pedestrian space by non-motorized vehicles and shop displays, and severe lack of barrier-free accessibility facilities, posing high risks to elderly pedestrians.
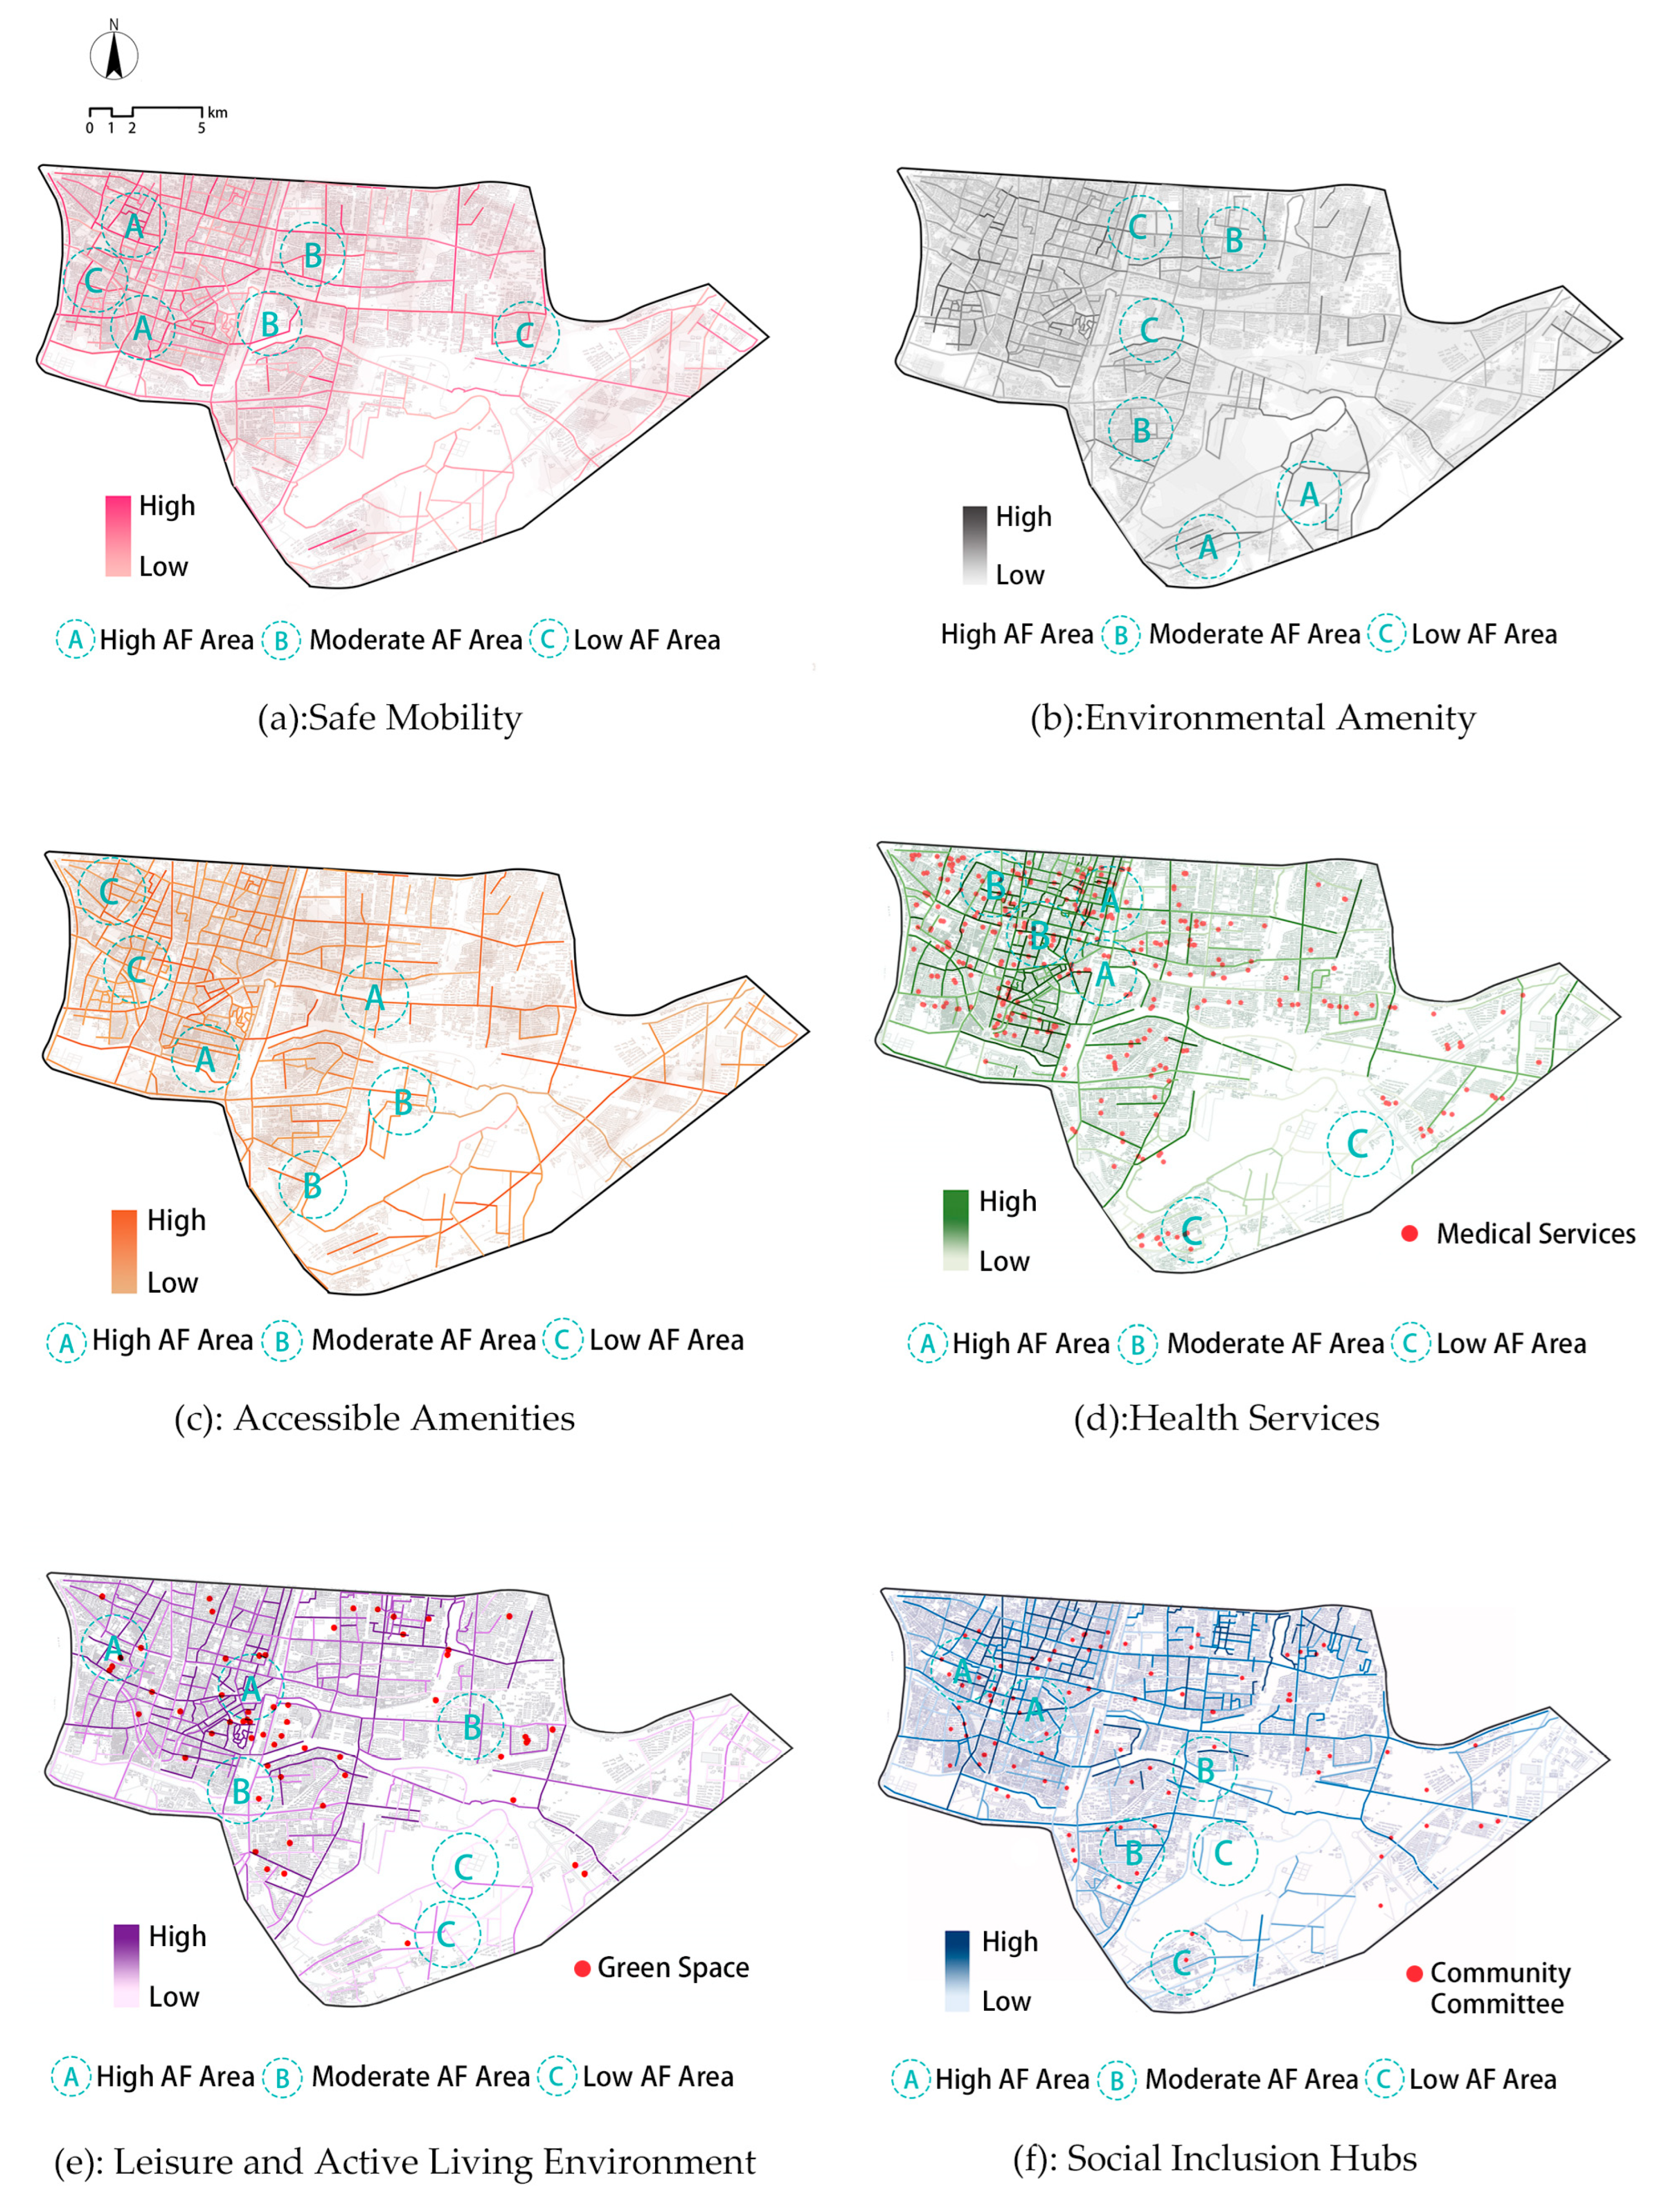
This spatial differentiation pattern provides a clear basis for targeted and differentiated age-friendly street improvement interventions.
Figure 6. Distribution of Age-Friendliness Across Six Dimensions in Qinhuai District: (a) Safe Mobility, (b) Environmental Amenity, (c) Accessible Amenities, (d) Health Services, (e) Leisure and Active Living Environment, and (f) Social Inclusion Hubs. In subfigures (df), the maps additionally display the locations of key POI facilities (e.g., Medical Facilities, Medical Services, and Green Spaces, and Community Committees), overlaid with KDE-based accessibility analysis results to highlight the spatial relationship between facility distribution and age-friendliness scores.
Buildings 15 03518 g006

4.4.2. Environmental Amenities

Analysis based on street view image segmentation data reveals significant spatial heterogeneity in the pleasantness of the street environment in Qinhuai District, particularly regarding Airflow Optimization (B1) and Noise-reducing Greenery (B2). As shown in Figure 6b, a core–periphery gradient is evident. Roads scoring medium to high are primarily concentrated along main arteries and urban green spaces, characterized by high spatial openness and robust greenery, whereas low-scoring roads are mostly located in side alleys and peripheral areas, exhibiting dual shortcomings of spatial confinement and lack of ecological facilities.
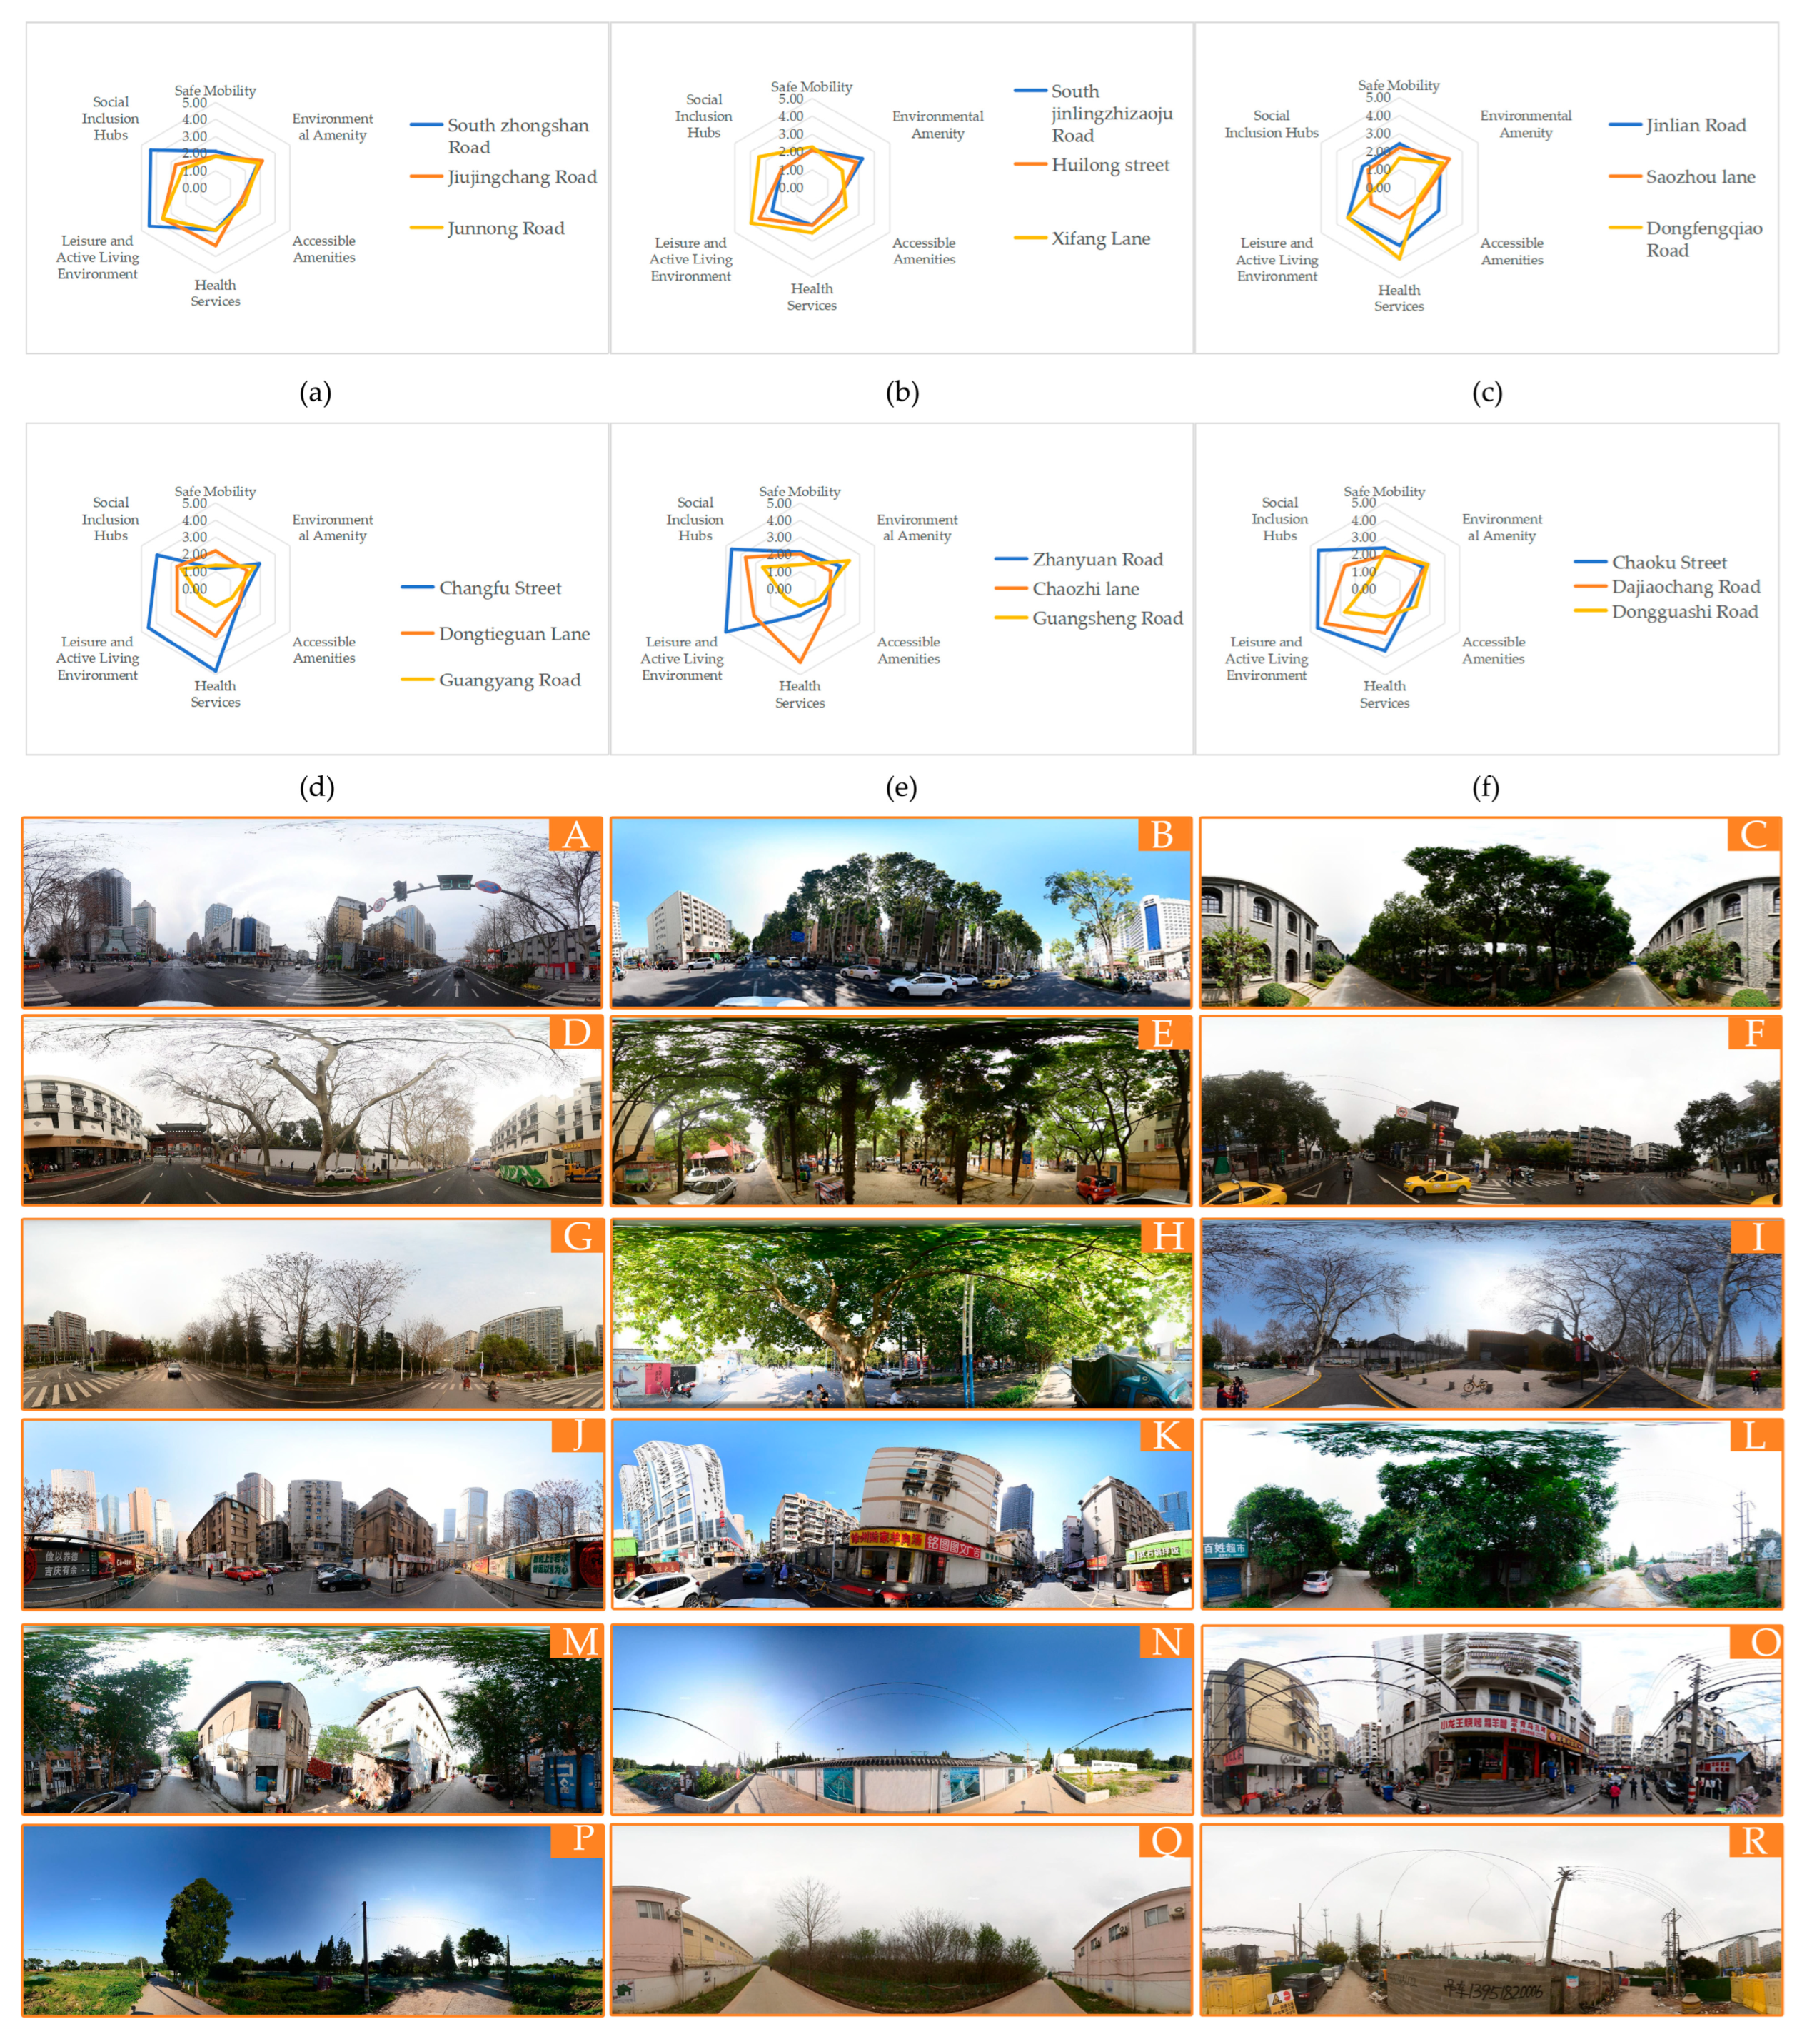
In terms of spatial openness, roads such as Guangsheng Road, Xiangxue Road, and Dongfengqiao Road stand out with sky visibility ratios exceeding 0.55 and building occlusion rates below 0.05. These characteristics contribute to excellent permeability and clear directional cues, effectively enhancing elderly pedestrians’ psychological comfort and environmental perception. For instance, Guangsheng Road features an exceptionally high sky proportion of 0.6564 and minimal building or wall obstruction, creating an extremely open space. Similarly, Xiangxue Road and Dongfengqiao Road exhibit broad views and minimal visual interference. Conversely, Huilong Street (sky = 0.605) and Xifang Alley (building = 0.0534) suffer from dense building coverage or limited sky visibility, resulting in a pronounced sense of spatial enclosure that may increase cognitive load for elderly pedestrians, potentially compromising travel safety and confidence (Figure 7).
Regarding green noise insulation, Guangsheng Road again ranks highest, with substantial vegetation (0.0724) and grassland (0.0949) coverage, forming an effective natural noise buffer. Figure 6b reveals that roads such as Xiangshuihe Road and Minggugong Road also demonstrate relatively high plant coverage (plant > 0.07). Although grassland areas are limited, they still contribute to a certain degree of ecological noise mitigation. In contrast, roads like Dasifu Alley and Xifang Alley have nearly zero greenery indicators, lacking green landscape guidance; their hardscape environments may exacerbate noise reflection, thereby reducing overall livability and rest quality.

4.4.3. Accessible Amenities

Analysis based on street view image segmentation data reveals a high degree of spatial imbalance in Universal Access Infrastructure (C1) and Organized Parking (C2) across streets in Qinhuai District, especially concerning the continuity, convenience, and safety of elderly people’s mobility and stay. As shown in Figure 6c, the combined effects of “facility friendliness” and “organized traffic” significantly influence elderly individuals’ accessibility and willingness to remain in street spaces, underscoring the need for coordinated improvements in facility supplementation and parking management along key routes.
Figure 6c demonstrates that Donggan Changxiang stands out in terms of facility availability, with the highest proportion of benches (bench = 0.0025) and potted plants (pot = 0.0009), offering excellent rest points and visual comfort. Shangshu Alley and Zijin Road, characterized by diverse facility combinations (e.g., door + box > 0.0014), enhance spatial interactivity and support for daily life services, significantly enriching the sequential experience of walking, resting, and social interaction. In contrast, Dasifu Alley shows zero presence across four types of facilities, and Xifang Alley is nearly devoid of amenities, with only minimal bench availability. These environments lack human-centered care and resting opportunities, failing to meet elderly residents’ needs for low-intensity activities. Prior research indicates that facility richness is directly linked to outdoor activity duration and perceived health among the elderly. Therefore, it is recommended to prioritize modular street furniture, such as backrest benches, sunshades, and combined planting boxes, in facility-deficient areas to systematically improve amenity completeness.
In terms of vehicle parking orderliness, significant disparities exist within Qinhuai District. Streets like Mafu West Street, Qinzhuangyuanli, and Nantai Alley exhibit very high densities of small vehicles (car > 0.068), with some segments also hosting vans (e.g., Mafu West Street van = 0.0044), which easily cause lane blockages and impair elderly pedestrians’ safety and street order. Conversely, roads such as Guangsheng Road and Dongfengqiao Road have very low vehicle densities (car < 0.0005), mostly pedestrian-prioritized or strictly regulated zones, creating smooth and tranquil walking environments that demonstrate strong traffic age-friendliness.

4.4.4. Healthcare Services

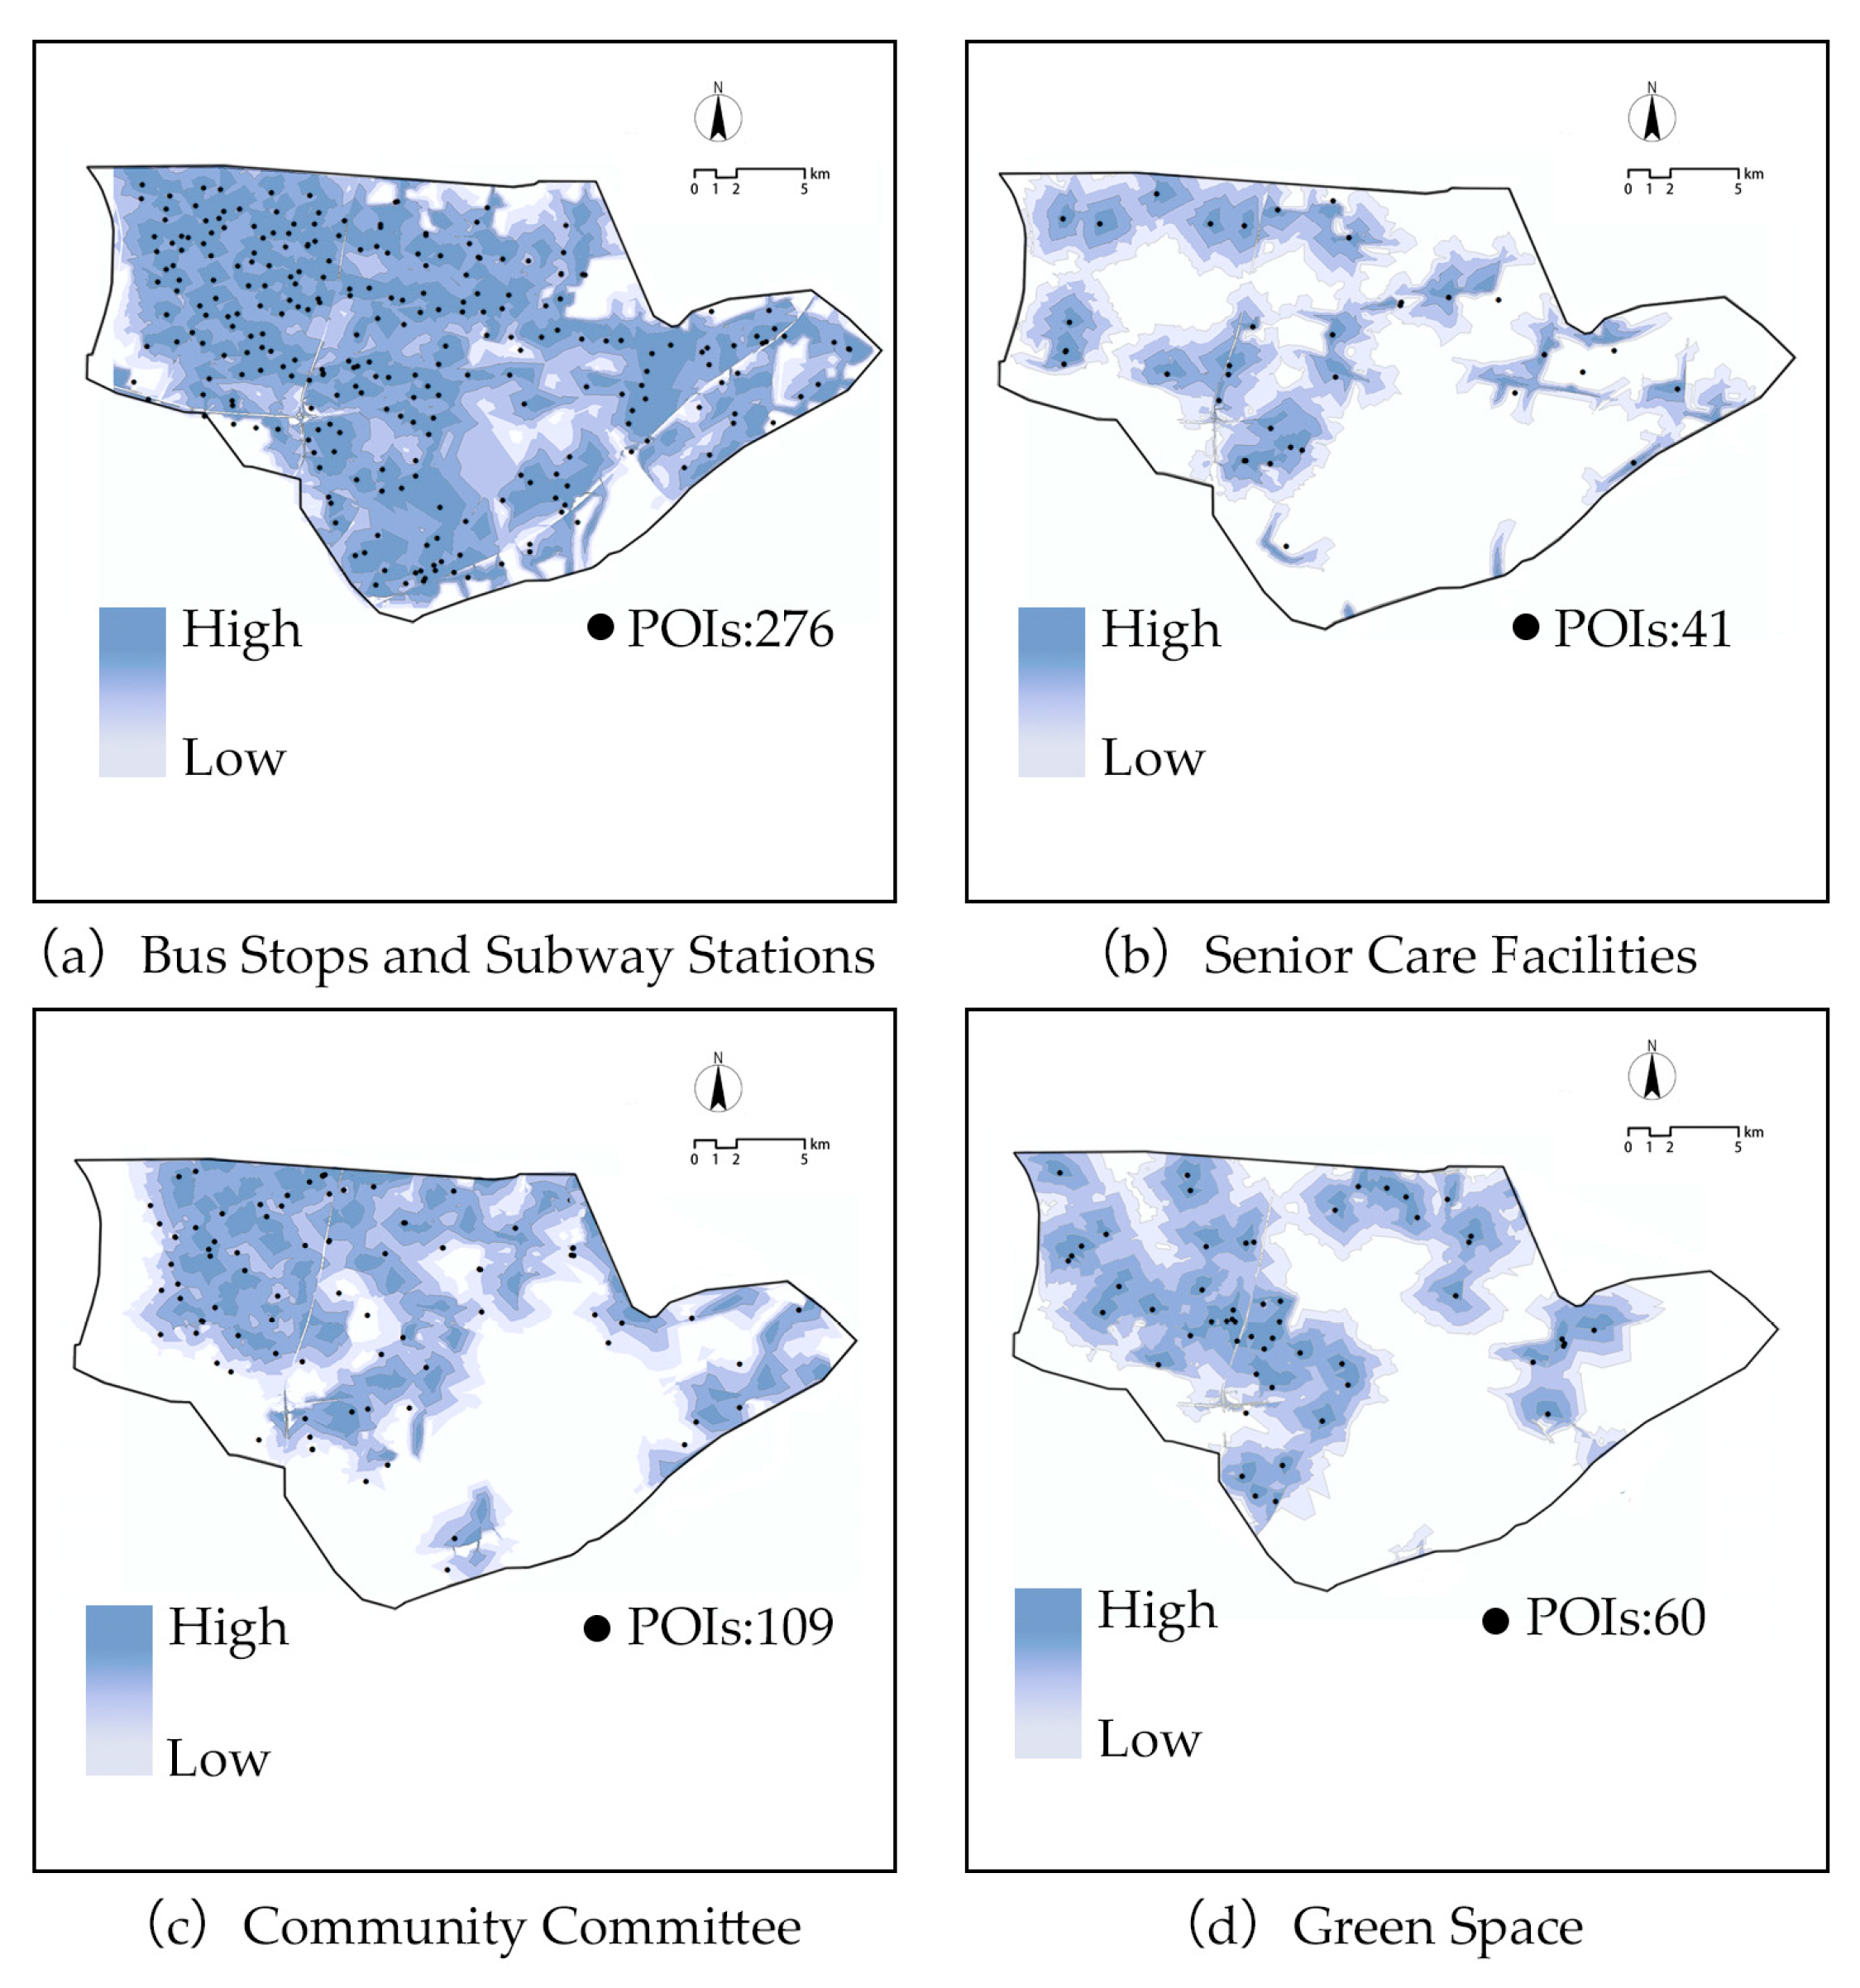
The evaluation of healthcare services in Qinhuai District is based on three indicators: Medical Facility Accessibility (D1), Medical Services Accessibility (D2), and Senior Care Facilities (D3). As shown in Figure 6d, the spatial accessibility of general hospitals and community medical centers within neighborhoods is a critical foundation for ensuring that elderly residents can receive timely responses to emergencies and continuous care for chronic conditions. Basic healthcare service points such as pharmacies provide daily health support and medication convenience, while the rational distribution of community-based elderly care institutions directly affects the completeness of social support systems and psychological security for the elderly. A comprehensive and well-configured health resource network not only enhances health resilience at the street level but also serves as an important guarantee for building age-friendly communities.
As shown in Figure 6d, based on clustering analysis of POI accessibility scores for 202 roads, the overall spatial distribution of healthcare service accessibility in Qinhuai District follows a “high in the south, low in the north; better in the east, worse in the west” pattern. Roads can be categorized into three types; this conclusion is also supported by Figure 6d and Figure 8:
  • High Age-Friendliness Roads (average score 3.90, accounting for 34.16%) are mainly concentrated in the southeastern part of Qinhuai District, such as Changfu Street (D = 4.79), Huowaxiang (D = 4.19), and Baixia Road (D = 4.71). These roads are adjacent to comprehensive hospitals and community medical institutions with elderly rehabilitation functions. The coverage rate of medical facilities within a 15-min walking radius reaches 85%, with pharmacy density as high as 5.4 stores/km2, indicating strong overall health service support capacity.
  • Moderate Age-Friendliness Roads (average score 2.74, accounting for 44.06%) are mostly located in the transitional old city areas such as Fuzimiao and Hongwu Road, including Mafu Street (D = 2.83) and Dongtiegian Alley (D = 2.75). Although pharmacies are relatively densely distributed (accessible within an 800-m service radius), the coverage rates of hospitals and elderly care institutions are only about 45%, revealing service type imbalances and a single-resource structure.
  • Low Age-Friendliness Roads (average score 1.59, accounting for 21.78%) are primarily distributed in the northern and western edges of Qinhuai District, including Chaiyuan North Road (D = 1.38), Guangsheng Road (D = 1.00), and Guangyang Road (D = 1.00). These roads face severe shortages of health resources: only 28% of roads have hospitals reachable within 15 min, pharmacy density is below 0.8 stores/km2, and 41% of roads fall within blind spots for elderly care facility coverage. Elderly residents here face notable deficits in daily health access and emergency response capability.

4.4.5. Leisure and Active Living Environment

The age-friendliness of the leisure and active living environment in Qinhuai District is assessed based on two core indicators: Green Space Accessibility (E1), and Daily Market Accessibility (E2). These indicators reflect the comprehensive capacity of streets to support daily life and provide accessible green recreational areas. The results reveal significant spatial heterogeneity in this dimension, with an overall distribution pattern characterized as “higher in the south, lower in the north; historic districts outperform peripheral areas.” As shown in Figure 6e, streets are categorized into three types (Figure 8 and Figure 9):
  • High Age-Friendliness Roads (average score 4.35, accounting for 44.1%) are primarily concentrated along the Qinhuai River scenic belt and adjacent densely populated residential areas, such as Wufu Lane (E = 5.00), Zhanyuan Road (E = 5.00), and Honghua Road (E = 4.53). These streets possess strong synergies between living convenience and leisure space: park and green space coverage within a 15-min walking radius reaches 91.3%, while daily market density is 6.4 locations/km2. Residents can easily walk to green spaces and supermarkets, with well-developed street resting facilities and strong spatial continuity. The overall environment supports elderly daily travel and social activities effectively.
  • Moderate Age-Friendliness Roads (average score 3.07, accounting for 34.2%) are mostly located in the northern and northeastern transitional zones of Qinhuai District, including Chaoxie Lane (E = 3.12), Guanghua Road (E = 2.50), and Chenguang Road (E = 2.00). These streets show a moderate foundation in daily market accessibility, with coverage rates reaching 82%, but relatively insufficient green space provision. Park coverage within a 15-min walking radius is only 65%, indicating some functional disconnections and spatial fragmentation.
  • Low Age-Friendliness Roads (average score 1.50, accounting for 21.8%) are concentrated mainly in the peripheral areas of the Daxiaochang neighborhood, with typical streets including Hongguang Road (E = 1.71), Guangsheng Road (E = 1.00), and Guangyang Road (E = 1.00). These areas face severe shortages in both living services and green recreational resources: park green space walkability is merely 12%, and the 15-min service coverage of daily markets is only 45%. The severe lack of service facilities limits elderly residents’ daily travel and outdoor activity opportunities, hindering the achievement of healthy aging goals.
Figure 8. Present KDE-based accessibility analysis with corresponding POI distributions. Figure 8 illustrates accessibility to medical services, medical facilities, daily markets, and volunteer service centers.
Buildings 15 03518 g008
Figure 9. Present KDE-based accessibility analysis with corresponding POI distributions. Depicts accessibility to bus stops and subway stations, senior care facilities, community committees and green space.
Buildings 15 03518 g009

4.4.6. Social Participation and Interaction

The age-friendliness of the “Community Participation” dimension in Qinhuai District is evaluated based on three core indicators: Volunteer Hub Accessibility (F1), Neighborhood Council Accessibility (F2), and Transit Node Accessibility (F3). This dimension primarily reflects the street-level capacity to support elderly residents’ social participation and outdoor activities. Grassroots community organizations not only provide emotional support and daily care but also serve as crucial platforms for elderly individuals to build social ties and integrate into neighborhood networks. Meanwhile, convenient transportation connections further extend their activity radius, enhancing the initiative and frequency of social engagement. The organic integration of these three elements creates a multi-layered platform for daily elderly social interaction, forming a fundamental basis for improving urban social cohesion and well-being.
As shown in Figure 6f, the POI accessibility analysis and AFEAT clustering results reveal marked spatial disparities in the age-friendliness of social connectivity across Qinhuai streets, exhibiting a concentric zonal distribution, where the urban core displays greater accessibility than the surrounding peripheral zones. Specifically:
  • High Age-Friendliness Roads (average score 3.90, accounting for 35.6%, n = 72) are primarily concentrated in urban core areas such as Xinjiekou and Fuzimiao. Typical roads include Zhanyuan Road (F = 4.62), Chaoku Street (F = 4.48), and Dashiba Street (F = 4.50), featuring well-established community support systems: volunteer service center coverage within a 15-min walk reaches 95%, community committee accessibility is 93%, and bus and subway station density stands at 8.2 stations/km2. Most roads have established a “three-tier elderly care service system,” with age-friendly renovations of transit facilities achieving 100%.
  • Moderate Age-Friendliness Roads (average score 2.74, accounting for 37.1%, n = 75) are mainly distributed in the transitional northwest and southwest zones of Qinhuai District, such as Muzhong Road (F = 2.74), Daxiaochang Road (F = 2.71), and Daming West Road (F = 2.71). Although community organization coverage reaches 70%, the degree of professional elderly care services remains below 45%, and only 62% of bus stops have undergone age-friendly renovations. This indicates an incomplete public service system with resource allocation gaps.
  • Low Age-Friendliness Roads (average score 1.77, accounting for 27.2%, n = 55) are predominantly located in the urban periphery and western areas, including Fuhua Road (F = 1.11), Dongguashi Road (F = 1.00), and Dongfengqiao Road (F = 1.00). These areas face triple challenges: volunteer hub coverage is below 25%, community organization service radii generally exceed 800 m, and public transit connectivity is poor, with average waiting times exceeding 12 min. The districts are mainly residential with low functional mix, leading to narrow social spaces for elderly residents and significantly heightened risks of social isolation.
The study highlights that social connectivity age-friendliness is closely related to urban functional mix. Central urban areas, benefiting from spatial compactness and multifunctionality, have formed relatively complete social support networks. In contrast, newly developed peripheral residential zones experience “bedroom community” development, with serious lagging in community organization and transportation service infrastructure. Therefore, it is recommended to adopt zoning optimization strategies based on neighborhood positioning: core areas should focus on service quality improvement and refined management; transitional zones need to address community service deficiencies; peripheral areas should prioritize building “15-min daily life circle” to enhance equity and accessibility of elderly social participation.

5. Discussion

Street age-friendliness in rapidly urbanizing Chinese cities demonstrates clear spatial disparities shaped by healthcare, social interaction, and leisure opportunities. Building on the AFEAT framework, this study conducts a multidimensional evaluation of street environments in Nanjing’s Qinhuai District by integrating semantic segmentation of street-view imagery with POI-based walking accessibility analysis. While the empirical focus is confined to a single district, the findings reflect broader patterns in high-density urban contexts. Nationwide, street age-friendliness commonly exhibits a medium-dominant profile, with central areas consistently outperforming peripheral zones. However, environmental livability in highly built-up cores often diverges from older residents’ subjective perceptions, underscoring the persistent tension between objective physical indicators and perceived safety and comfort in the context of rapid urbanization [95,96]. Similar contradictions between measured environmental quality and residents’ subjective perceptions have also been reported in Xi’an and Guangzhou [1,2,97], highlighting the challenge of aligning quantitative indicators with lived experiences in Chinese megacities.
Correlation results underscore the critical role of healthcare and leisure market accessibility in supporting older adults’ mobility and well-being. These findings resonate with recent studies leveraging street-view imagery and deep learning to evaluate urban perception and spatial quality [4,5,98]. Across cities, functional facilities display a consistent three-tier structure: dense and well-performing cores; transitional belts with dispersed functions requiring networked linkages; and peripheral zones lacking basic services [6]. Policy responses should therefore be tiered: refinement and quality enhancement in cores; functional supplementation and pedestrian network integration in transitional belts; and the establishment of accessible healthcare, leisure, and social infrastructure in peripheries.
Low-scoring streets share three recurrent weaknesses: insufficient social spaces and community interaction networks; discontinuous barrier-free pedestrian systems; and fragmented functional layouts with poor integration. Addressing these deficiencies requires a network-oriented approach, incorporating continuous chains of healthcare and leisure facilities, implementing 15-min community living circles, upgrading street furniture, shading, and night lighting, and integrating pedestrian environment improvements with traffic safety measures to enhance older residents’ sense of security and ease of use. Such strategies align with recommendations from the WHO Handbook on Age-Friendly Cities and Communities and China’s 14th Five-Year Plan for National Aging and Elderly Services [7,41].
Importantly, AI-derived street geometric indicators demonstrate high agreement with survey-based AFEAT results. For instance, Building and Sidewalk proportions show significant positive correlations with overall age-friendliness scores (r = 0.301, p < 0.001; r = 0.181, p = 0.01), confirming that AI data reliably reflect older adults’ perceptions of street usability. This alignment not only corroborates traditional questionnaire findings but also highlights the potential of machine learning and generative AI to objectively identify human-centric street environments that better meet the needs of older adults. Leveraging these AI-derived metrics in future research can enable more efficient, continuous, and large-scale assessment and monitoring of street-level age-friendliness, supporting targeted spatial interventions and informed urban design in dense city districts.
This study has methodological limitations, including the temporal sensitivity of street-view imagery, the static nature of POI data, and the subjectivity of AHP weight assignments. These challenges are not unique to Qinhuai but are common in urban age-friendliness assessments nationwide. Future research should integrate cross-city and multi-region dynamic mobility data, older adults’ trajectory analyses, and multi-source real-time information for continuous monitoring. Recent advances in street-view–based perception mapping and deep learning provide promising methodological pathways for such integration [10].
Overall, the findings from Qinhuai District emphasize the complementary value of integrating AI-based geometric analysis with traditional survey data, providing a comprehensive understanding of how urban form shapes age-friendly perceptions. These results demonstrate the potential applicability of AI-derived indicators in high-density urban environments and highlight their future use for cross-city comparisons and evidence-based planning and interventions in rapidly urbanizing contexts.

6. Conclusions

This study developed and applied an AFEAT-based framework to evaluate street age-friendliness by integrating semantic segmentation of street-view images, POI-based walking accessibility analysis, and kernel density estimation. A comprehensive, multi-dimensional assessment was conducted on 202 streets in Qinhuai District, Nanjing. Compared to prior research relying mainly on surveys, statistical data, or single spatial indicators, this work offers three key innovations: first, it is the first to combine semantic-level street-view data with network-based facility accessibility, enhancing objectivity and spatial resolution; second, it introduces a holistic six-dimensional framework encompassing safety, environment, facilities, health, vitality, and social interaction to capture the full scope of age-friendliness; third, it synthesizes spatial patterns and zoning optimization strategies from the case study with broad applicability across Chinese cities.
Findings reveal a consistent structural pattern in high-density Chinese cities: core areas exhibit higher age-friendliness scores, peripheral areas lower, with medium levels predominating overall. Healthcare and leisure facilities emerge as critical determinants of older adults’ mobility and quality of life. The Qinhuai case suggests a three-tiered optimization approach: focused refinement and quality improvements in core districts; enhanced pedestrian networks and functional integration in transitional zones; and prioritized development of basic healthcare, leisure, and social infrastructure in peripheries to ensure essential services are within a 5–15 min walking distance. Unlike many macro-level planning recommendations, this strategy emphasizes spatially precise, data-driven interventions.
From a city planning perspective, the study advocates creating integrated community micro-networks combining safe mobility, healthcare, and social leisure functions. This includes continuous barrier-free pedestrian systems, standardized street furniture and nighttime lighting, and aligning facility layouts closely with seniors’ daily activity patterns. This model applies not only to dense historic urban cores in eastern China but also to new and rapidly growing cities in central and western regions, offering a scalable, practical path for age-friendly urban transformation. Notably, the study’s quantifiable spatial data approach enables targeted identification of deficient areas and provides an actionable roadmap for phased, zoned, and prioritized street improvements nationwide.
Nonetheless, limitations exist due to the temporal constraints of street-view imagery, the static nature of POI data, and the subjective weighting in the AHP process. Future research should extend to dynamic, multi-city studies incorporating seniors’ actual travel trajectories and real-time environmental data to further validate and refine the AFEAT framework’s generalizability and adaptability. Such advancements will strengthen scientific and policy foundations for Chinese cities striving to create inclusive, safe, and convenient street environments amid population ageing challenges.

Author Contributions

X.L.: Writing—review & editing, Writing—original draft, Supervision, Project administration, Methodology, Investigation, Funding acquisition, Conceptualization. Y.L.: Validation, Investigation, Formal analysis, Data curation. W.L.: Validation, Software, Investigation, Formal analysis. Z.W.: Writing—review & editing, Conceptualization, Visualization, Formal analysis, Data curation. L.P.: Supervision, Writing—review & editing, Data curation. All authors have read and agreed to the published version of the manuscript.

Funding

This research was funded by the National Natural Science Foundation of China (NSFC), grant number 32401640.

Institutional Review Board Statement

Not applicable.

Informed Consent Statement

Informed consent was obtained from all subjects involved in this study.

Data Availability Statement

The original contributions presented in this study are included in the article. Further inquiries can be directed at the corresponding author(s).

Acknowledgments

The authors are extremely grateful for the Sustainability journal editorial team’s valuable comments on improving the quality of this article.

Conflicts of Interest

The authors declare no conflicts of interest.

References

  1. Wang, Y.; Li, X.; Chen, J.; Zhou, Y. Perceived versus measured neighborhood environments and their association with older adults’ well-being: Evidence from Xi’an, China. Cities 2022, 121, 103489. [Google Scholar]
  2. Wang, S.; He, S.; Webster, C. Environment, perception and subjective well-being in Guangzhou, China: A multilevel analysis. Urban Stud. 2021, 58, 2467–2486. [Google Scholar]
  3. Yue, W.; Chen, Y.; Zhang, H.; Liu, Y. Green space exposure, urban facilities, and mental health of older adults: Evidence from Chinese cities. Health Place 2022, 74, 102767. [Google Scholar]
  4. Aliyas, Z. Physical, mental, and physiological health benefits of green and blue outdoor spaces among elderly people. Int. J. Environ. Health Res. 2021, 31, 703–714. [Google Scholar] [CrossRef] [PubMed]
  5. He, L.; Zhang, F.; Liu, Y.; Lin, H. Spatial inequalities of elderly service facilities in Chinese megacities: Accessibility, equity and policy implications. Habitat Int. 2023, 132, 102735. [Google Scholar]
  6. Chen, J.; Wu, J.; Xu, Y. Evaluating the spatial distribution of elderly care facilities in China: Balancing demand and supply in high-density cities. J. Urban Plan. Dev. 2023, 149, 04023025. [Google Scholar]
  7. World Health Organization. Handbook for Age-Friendly Cities and Communities; WHO: Geneva, Switzerland, 2023.
  8. Government of China. The 14th Five-Year Plan for National Aging and Elderly Services; State Council of the People’s Republic of China: Beijing, China, 2021.
  9. Yao, Y.; Liang, Z.T.; Yuan, Z.H.; Liu, P.; Bie, Y.; Zhang, J.; Wang, R.; Wang, J.; Guan, Q. A human-machine adversarial scoring framework for urban perception assessment using street-view images. Int. J. Geogr. Inf. Sci. 2019, 33, 2363–2384. [Google Scholar] [CrossRef]
  10. Han, X.; Zhang, F.; Liu, Y. Deep learning-based urban perception mapping with street view images. Comput. Environ. Urban Syst. 2022, 94, 101777. [Google Scholar]
  11. Centre on Aging, University of Manitoba. Age-Friendly Cities Project Portage la Prairie, Manitoba, Canada: A Report Prepared for the City of Portage la Prairie; University of Manitoba: Winnipeg, MB, Canada, 2007. [Google Scholar]
  12. Choi, Y.; Seo, M.J.; Oh, S.H. Walkability analysis of Busan’s urban residential zones. KSCE J. Civ. Eng. 2016, 20, 2535–2547. [Google Scholar] [CrossRef]
  13. Chen, M.; Cai, Y.; Guo, S.; Sun, R.; Song, Y.; Shen, X. Evaluating implied urban nature vitality in San Francisco: An interdisciplinary approach combining census data, street view images, and social media analysis. Urban For. Urban Green 2024, 95, 128289. [Google Scholar] [CrossRef]
  14. Seresinhe, C.I.; Preis, T.; Moat, H.S. Quantifying the impact of scenic environments on health. Sci. Rep. 2015, 5, 16899. [Google Scholar] [CrossRef] [PubMed]
  15. Mohammed, M.; Antonio, P. A model-based approach to select case sites for walkability audits. Health Place 2012, 18, 1323–1334. [Google Scholar]
  16. Franke, T.; Tong, C.; Ashe, M.C.; McKay, H.; Sims-Gould, J. The secrets of highly active older adults. J. Aging Stud. 2013, 27, 398–409. [Google Scholar] [CrossRef]
  17. Alfonzo, M.A. To walk or not to walk? The hierarchy of walking needs. Environ. Behav. 2016, 37, 808–836. [Google Scholar] [CrossRef]
  18. Akpinar, A.; Cankurt, M. How are characteristics of urban green space related to levels of physical activity: Examining the links. Indoor Built Environ. 2017, 26, 1091–1101. [Google Scholar] [CrossRef]
  19. World Health Organization Regional Office for Europe. Age-Friendly Cities Initiative; WHO Regional Office for Europe: Copenhagen, Denmark, 2012. [Google Scholar]
  20. Government of Canada. Age-Friendly Communities Toolkit; Public Health Agency of Canada: Ottawa, ON, Canada, 2015.
  21. National Working Commission on Aging, China. White Paper on Building an Age-Friendly China; The State Council of the People’s Republic of China: Beijing, China, 2024.
  22. Cerin, E.; Sit, C.H.; Cheung, M.-C.; Ho, S.-Y.; Lee, L.-C.; Chan, W.-M. Reliable and valid NEWS for Chinese seniors: Measuring perceived neighborhood attributes related to walking. Int. J. Behav. Nutr. Phys. Act. 2010, 7, 84. [Google Scholar] [CrossRef]
  23. Li, J.; Zhang, J. A study on the impact of street environment on elderly leisure path preferences based on the stated preference method (SP Method). Sustainability 2024, 16, 7676. [Google Scholar] [CrossRef]
  24. Li, S.; Lyu, D.; Huang, G.; Zhang, X.; Gao, F.; Chen, Y.; Liu, X. Spatially varying impacts of built environment factors on rail transit ridership at station level: A case study in Guangzhou, China. J. Transp. Geogr. 2020, 82, 102631. [Google Scholar] [CrossRef]
  25. Wang, R.; Yuan, Y.; Liu, Y.; Zhang, J.; Liu, P.; Lu, Y.; Yao, Y. Using street view data and machine learning to assess how perception of neighborhood safety influences urban residents’ mental health. Health Place 2019, 59, 102186. [Google Scholar] [CrossRef]
  26. Yue, Y.; Zhuang, Y.; Yeh, A.G.O.; Xie, J.-Y.; Ma, C.-L.; Li, Q.-Q. Measurements of POI-based mixed use and their relationships with neighbourhood vibrancy. Int. J. Geogr. Inf. Sci. 2017, 31, 658–675. [Google Scholar] [CrossRef]
  27. Wang, R.; Lu, Y.; Zhang, J.; Liu, P.; Yao, Y.; Liu, Y. The relationship between visual enclosure for neighbourhood street walkability and elders’ mental health in China: Using street view images. J. Transp. Health 2019, 13, 90–102. [Google Scholar] [CrossRef]
  28. Sun, X.; Nie, X.; Wang, L.; Huang, Z.; Tian, R. Spatial sense of safety for seniors in living streets based on street view image data. Buildings 2024, 14, 3973. [Google Scholar] [CrossRef]
  29. Chen, L.; Cai, X.; Liu, Z. Multi-source data and semantic segmentation: Spatial quality assessment and enhancement strategies for Jinan Mingfu City from a tourist perception perspective. Buildings 2025, 15, 2298. [Google Scholar] [CrossRef]
  30. Liu, L.; Silva, E.A.; Wu, C.; Wang, H. A machine learning-based method for the large-scale evaluation of the qualities of the urban environment. Comput. Environ. Urban Syst. 2017, 65, 113–125. [Google Scholar] [CrossRef]
  31. Chen, L.; Lu, Y.; Sheng, Q.; Ye, Y.; Wang, R.; Liu, Y. Estimating pedestrian volume using Street View images: A large-scale validation test. Comput. Environ. Urban Syst. 2020, 81, 101481. [Google Scholar] [CrossRef]
  32. Moradi, F.; Biloria, N.; Prasad, M. Analyzing the age-friendliness of the urban environment using computer vision methods. Environ. Plan. B Urban Anal. City Sci. 2023, 50, 2294–2308. [Google Scholar] [CrossRef]
  33. Lawton, M.P.; Nahemow, L. Ecology and the aging process. In The Psychology of Adult Development and Aging; Eisendorfer, E.C., Lawton, M.P., Eds.; American Psychological Association: Washington, DC, USA, 1973; pp. 619–674. [Google Scholar]
  34. Wahl, H.-W.; Iwarsson, S.; Oswald, F. Aging well and the environment: Toward an integrative model and research agenda for the future. Gerontologist 2012, 52, 306–316. [Google Scholar] [CrossRef] [PubMed]
  35. Kahana, E.; Lovegreen, L.; Kahana, B.; Kahana, M. Person, environment, and person–environment fit as influences on residential satisfaction of elders. Environ. Behav. 2003, 35, 434–453. [Google Scholar] [CrossRef]
  36. Xia, Z.; Wang, X.; Wang, H.; Jiang, J.; Chen, S.; Cao, H. Age-Friendly Street Construction: The Synergy of the Physical Environment in Old Urban Communities in Suzhou. Buildings 2024, 14, 3378. [Google Scholar] [CrossRef]
  37. Cerin, E.; Saelens, B.E.; Sallis, J.F.; Frank, L.D. Neighborhood Environment Walkability Scale: Validity and development of a short form. Med. Sci. Sports Exerc. 2006, 38, 1682–1691. [Google Scholar] [CrossRef] [PubMed]
  38. Yin, B.; Wang, L.; Xu, Y.; Heng, K.C. A Study on the Spatial Perception and Inclusive Characteristics of Outdoor Activity Spaces in Residential Areas for Diverse Populations from the Perspective of All-Age Friendly Design. Buildings 2025, 15, 895. [Google Scholar] [CrossRef]
  39. Meng, Y.; Lyu, M.; Sun, D.; Shi, J.; Fukuda, H. Evaluating and Diagnosing Urban Function and Perceived Quality Based on Multi-Source Data and Deep Learning Using Dalian as an Example. Buildings 2025, 15, 998. [Google Scholar] [CrossRef]
  40. Lei, Y.; Zhou, H.; Xue, L.; Yuan, L.; Liu, Y.; Wang, M.; Wang, C. Evaluating and Comparing Human Perceptions of Streets in Two Megacities by Integrating Street-View Images, Deep Learning, and Space Syntax. Buildings 2024, 14, 1847. [Google Scholar] [CrossRef]
  41. Ma, Y.; Wang, L.; Zhang, J. Quantifying Spatial Openness and Visual Perception in Historic Urban Environments. Buildings 2025, 15, 3295. [Google Scholar] [CrossRef]
  42. Lu, X.; Li, Q.; Ji, X.; Sun, D.; Meng, Y.; Yu, Y.; Lyu, M. Impact of Streetscape Built Environment Characteristics on Human Perceptions Using Street View Imagery and Deep Learning: A Case Study of Changbai Island, Shenyang. Buildings 2025, 15, 1524. [Google Scholar] [CrossRef]
  43. Ewing, R.; Handy, S. Measuring the unmeasurable: Urban design qualities related to walkability. J. Urban Des. 2009, 14, 65–84. [Google Scholar] [CrossRef]
  44. Naik, N.; Philipoom, J.; Raskar, R.; Hidalgo, C.A. Streetscore: Predicting the perceived safety of one million streetscapes. In Proceedings of the IEEE Conference on Computer Vision and Pattern Recognition Workshops (CVPRW), Columbus, OH, USA, 23–28 June 2014; IEEE: Piscataway, NJ, USA, 2014; pp. 779–785. [Google Scholar] [CrossRef]
  45. Zhou, Q.; Zhang, J.; Zhu, Z. Evaluating Urban Visual Attractiveness Perception Using Multimodal Large Language Model and Street View Images. Buildings 2025, 15, 2970. [Google Scholar] [CrossRef]
  46. Zhang, F.; Zhou, B.; Liu, L.; Liu, Y.; Fung, H.H.; Lin, H.; Ratti, C. Measuring human perceptions of a large-scale urban region using machine learning. Landsc. Urban Plan. 2018, 180, 148–160. [Google Scholar] [CrossRef]
  47. Dubey, A.; Naik, N.; Parikh, D.; Raskar, R.; Hidalgo, C. Deep learning the city: Quantifying urban perception at a global scale. In Proceedings of the European Conference on Computer Vision, ECCV 2016, Amsterdam, The Netherlands, 11–14 October 2016; Springer: Cham, Switzerland, 2016; pp. 196–212. [Google Scholar]
  48. Gebru, T.; Krause, J.; Wang, Y.; Chen, D.; Deng, J.; Aiden, E.L.; Fei-Fei, L. Using deep learning and Google Street View to estimate the demographic makeup of neighborhoods across the United States. Proc. Natl. Acad. Sci. USA 2017, 114, 13108–13113. [Google Scholar] [CrossRef]
  49. Gong, S.; Zhang, J.; Duan, Y. Visual Perception Element Evaluation of Suburban Local Landscapes: Integrating Multiple Machine Learning Methods. Buildings 2025, 15, 3312. [Google Scholar] [CrossRef]
  50. Zhang, J.; Hu, Y. Measuring green view index and walkability using Google Street View and graph algorithms: Evidence from Osaka. Comput. Environ. Urban Syst. 2022, 96, 101843. [Google Scholar]
  51. Yu, X.; Chen, Y.; Zhang, L.; Wang, J. Visual elements and perceptual dimensions of streets: A deep learning approach with adversarial models. Environ. Plan. B Urban Anal. City Sci. 2025, in press.
  52. Government of Qinhuai District. Qinhuai District Territorial Spatial Planning (2021–2035); Government of Qinhuai District: Nanjing, China, 2025.
  53. Menec, V.H.; Means, R.; Keating, N.; Parkhurst, G.; Eales, J. Conceptualizing age-friendly communities. Can. J. Aging 2011, 30, 479–493. [Google Scholar] [CrossRef]
  54. Buffel, T.; Phillipson, C.; Scharf, T. Ageing in urban environments: Developing “age-friendly” cities. Crit. Soc. Policy 2012, 32, 597–617. [Google Scholar] [CrossRef]
  55. Scharlach, A.E.; Lehning, A. Ageing-friendly communities and social inclusion in the United States of America. Ageing Soc. 2013, 33, 110–136. [Google Scholar] [CrossRef]
  56. Ewing, R.; Handy, S.; Brownson, R.C.; Clemente, O.; Winston, E. Identifying and measuring urban design qualities related to walkability. J. Phys. Act. Health 2006, 3 (Suppl. S1), S223–S240. [Google Scholar] [CrossRef]
  57. King, T.L.; Thornton, L.E.; Bentley, R.J.; Kavanagh, A.M. The use of kernel density estimation to examine associations between neighborhood destination intensity and walking and physical activity. PLoS ONE 2015, 10, e0137402. [Google Scholar] [CrossRef]
  58. Neal, M.; Chapman, N.; Dill, J.; Sharkova, I.; DeLaTorre, A.; Sullivan, K.; Martin, S. Age-Related Shifts in Housing and Transportation Demand: A Multidisciplinary Study Conducted for Metro by Portland State University’s College of Urban and Public Affairs (Report); Institute on Aging, Portland State University: Portland, OR, USA, 2006; Available online: https://pdxscholar.library.pdx.edu/cgi/viewcontent.cgi?article=1062&context=usp_fac (accessed on 1 January 2024).
  59. Sato, M.; Inoue, Y.; Du, J.; Funk, D.C. Access to parks and recreational facilities, physical activity, and health care costs for older adults: Evidence from U.S. counties. J. Leis. Res. 2019, 50, 315–330. [Google Scholar] [CrossRef]
  60. Cai, L.; Xu, J.; Liu, J.; Ma, T.; Pei, T.; Zhou, C. Sensing multiple semantics of urban space from crowdsourcing positioning data. Cities 2019, 93, 31–42. [Google Scholar] [CrossRef]
  61. Liu, K.; Yin, L.; Lu, F.; Mou, N. Visualizing and exploring POI configurations of urban regions on POI-type semantic space. Cities 2020, 99, 102610. [Google Scholar] [CrossRef]
  62. Anastasia, L.S. Is it safe to walk? Neighborhood safety and security considerations and their effects on walking. J. Plan. Lit. 2006, 20, 219–232. [Google Scholar] [CrossRef]
  63. Wang, H.; Yang, Y. Neighbourhood walkability: A review and bibliometric analysis. Cities 2019, 93, 43–61. [Google Scholar] [CrossRef]
  64. Portegijs, E.; Keskinen, K.E.; Eronen, J.; Saajanaho, M.; Rantakokko, M.; Rantanen, T. Older adults’ physical activity and the relevance of distances to neighborhood destinations and barriers to outdoor mobility. Front. Public Health 2020, 8, 335. [Google Scholar] [CrossRef] [PubMed]
  65. Nathan, A.; Pereira, G.; Foster, S.; Hooper, P.; Saarloos, D.; Giles-Corti, B. Access to commercial destinations within the neighbourhood and walking among Australian older adults. Int. J. Behav. Nutr. Phys. Act. 2012, 9, 133. [Google Scholar] [CrossRef] [PubMed]
  66. Carroll, K.; Nørtoft, K. Co-designing age-friendly neighborhood spaces in Copenhagen: Starting with an age-friendly co-design process. Architecture 2022, 2, 214–230. [Google Scholar] [CrossRef]
  67. Song, Y.; Liu, Y.; Bai, X.; Yu, H. Effects of neighborhood built environment on cognitive function in older adults: A systematic review. BMC Geriatr. 2024, 24, 190. [Google Scholar] [CrossRef]
  68. Rodiek, S. Influence of an outdoor garden on mood and stress in older persons. J. Ther. Hortic. 2002, 13, 13–21. [Google Scholar]
  69. Panno, A.; Carrus, G.; Lafortezza, R.; Mariani, L.; Sanesi, G. Nature-based solutions to promote human resilience and wellbeing in cities during increasingly hot summers. Environ. Res. 2017, 159, 249–256. [Google Scholar] [CrossRef]
  70. Lottrup, L.; Grahn, P.; Stigsdotter, U.K. Workplace greenery and perceived level of stress: Benefits of access to a green outdoor environment at the workplace. Landsc. Urban Plan. 2013, 110, 5–11. [Google Scholar] [CrossRef]
  71. Peschardt, K.K.; Stigsdotter, U.K. Associations between park characteristics and perceived restorativeness of small public urban green spaces. Landsc. Urban Plan. 2013, 112, 26–39. [Google Scholar] [CrossRef]
  72. World Health Organization. Physical Activity [EB/OL]. 2022. Available online: https://www.who.int/news-room/fact-sheets/detail/physical-activity (accessed on 28 January 2024).
  73. Plouffe, L.; Kalache, A. Towards global age-friendly cities: Determining urban features that promote active aging. J. Urban Health 2010, 87, 733–739. [Google Scholar] [CrossRef] [PubMed]
  74. Colangeli, J.A. Planning for Age-Friendly Cities: Towards a New Model. Master’s Thesis, University of Waterloo, Waterloo, ON, Canada, 2010. [Google Scholar]
  75. Cambra, P.; Moura, F. How does walkability change relate to walking behavior change? Effects of a street improvement in pedestrian volumes and walking experience. J. Transp. Health 2020, 16, 100797. [Google Scholar] [CrossRef]
  76. Palmer, N.A.; Perkins, D.D.; Xu, Q.W. Social capital and community participation among migrant workers in China. J. Community Psychol. 2011, 39, 89–105. [Google Scholar] [CrossRef]
  77. Green, G. Age-friendly cities of Europe. J. Urban Health 2013, 90, 116–128. [Google Scholar] [CrossRef]
  78. Chan, E.T.H.; Schwanen, T.; Banister, D. The role of perceived environment, neighbourhood characteristics, and attitudes in walking behaviour: Evidence from a rapidly developing city in China. Transportation 2019, 48, 431–454. [Google Scholar] [CrossRef]
  79. Wang, R.; Grekousis, G.; Liu, Y.; Lu, Y. Detecting older pedestrians and aging-friendly walkability using computer vision technology and street view imagery. Comput. Environ. Urban Syst. 2023, 105, 102027. [Google Scholar] [CrossRef]
  80. Saaty, R.W. The analytic hierarchy process—What it is and how it is used. Math. Model. 1987, 9, 161–176. [Google Scholar] [CrossRef]
  81. Orpana, H.; Chawla, M.; Gallagher, E.; Escaravage, E. Developing indicators for evaluation of age-friendly communities in Canada: Process and results. Health Promot. Chronic Dis. Prev. Can. 2016, 36, 214–223. [Google Scholar] [CrossRef]
  82. Wang, Y.; Gonzales, E.; Howell, N.M. Applying WHO’s age-friendly communities framework to a national survey in China. J. Gerontol. Soc. Work 2017, 60, 215–231. [Google Scholar] [CrossRef]
  83. Schutz, A. The Phenomenology of the Social World; Walsh, G.; Lehnert, F., Translators; Northwestern University Press: Evanston, IL, USA, 1967; p. 4. [Google Scholar]
  84. Cordts, M.; Omran, M.; Ramos, S.; Rehfeld, T.; Enzweiler, M.; Benenson, R.; Franke, U.; Roth, S.; Schiele, B. The cityscapes dataset for semantic urban scene understanding. In Proceedings of the 2016 IEEE Conference on Computer Vision and Pattern Recognition (CVPR), Las Vegas, NV, USA, 27–30 June 2016; pp. 3213–3223. [Google Scholar]
  85. Chen, C.; Li, H.; Luo, W.; Xie, J.; Yao, J.; Wu, L.; Xia, Y. Predicting the effect of street environment on residents’ mood states in large urban areas using machine learning and street view images. Sci. Total Environ. 2022, 816, 151605. [Google Scholar] [CrossRef]
  86. Wei, J.; Yue, W.; Li, M.; Gao, J. Mapping human perception of urban landscape from street-view images: A deep-learning approach. Int. J. Appl. Earth Obs. Geoinf. 2022, 112, 102886. [Google Scholar] [CrossRef]
  87. Zhao, H.; Shi, J.; Qi, X.; Wang, X.; Jia, J. Pyramid Scene Parsing Network. arXiv 2016, arXiv:1612.01105. [Google Scholar]
  88. He, H.; Yang, D.; Wang, S.; Wang, S.; Li, Y. Road Extraction by Using Atrous Spatial Pyramid Pooling Integrated Encoder-Decoder Network and Structural Similarity Loss. Remote Sens. 2019, 11, 1015. [Google Scholar] [CrossRef]
  89. Zhang, J.; Liu, X.; Liao, W.; Li, X. Deep-learning generation of POI data with scene images. ISPRS J. Photogramm. Remote Sens. 2022, 188, 201–219. [Google Scholar] [CrossRef]
  90. Qinhuai District Bureau of Statistics. Qinhuai District Statistical Yearbook; Nanjing Publishing and Media (Group) Co., Ltd.: Nanjing, China, 2024. [Google Scholar]
  91. Peng, S.; Yu, L.; Gao, Y.; Dong, S.; Bai, Y.; Li, G.; Liang, C.; Tian, Z.; Lv, C.; Zhou, F.; et al. Association of objectively measured walking speed with incident cardiovascular diseases in middle-aged and older Chinese adults. Hellenic J. Cardiol. 2024, 80, 47–54. [Google Scholar] [CrossRef]
  92. Lindemann, U.; Najafi, B.; Zijlstra, W.; Hauer, K.; Muche, R.; Becker, C.; Aminian, K. Distance to achieve steady state walking speed in frail elderly persons. Gait Posture 2008, 27, 91–96. [Google Scholar] [CrossRef]
  93. Chang, J.; Jiang, Y.; Tan, M.; Wang, Y.; Wei, S. Building Height Extraction Based on Spatial Clustering and a Random Forest Model. ISPRS Int. J. Geo-Inf. 2024, 13, 265. [Google Scholar] [CrossRef]
  94. Wang, M.; Wang, Y.; Li, B.; Cai, Z.; Kang, M. A Population Spatialization Model at the Building Scale Using Random Forest. Remote Sens. 2022, 14, 1811. [Google Scholar] [CrossRef]
  95. Lee, C.-C.; Wang, Y.; Tang, C.; Li, X.; Yin, J. A Visual Preference Analysis of Building Façades in Street View Images: A Case Study of Nanshan District, Shenzhen. Buildings 2025, 15, 611. [Google Scholar] [CrossRef]
  96. Xie, Q.; Hu, L.; Wu, J.; Shan, Q.; Li, W.; Shen, K. Investigating the Influencing Factors of the Perception Experience of Historical Commercial Streets: A Case Study of Guangzhou’s Beijing Road Pedestrian Street. Buildings 2024, 14, 138. [Google Scholar] [CrossRef]
  97. Yu, Y.; Huang, G.; Sun, D.; Lyu, M.; Bart, D. Exploring the Impact of Waterfront Street Environments on Human Perception. Buildings 2025, 15, 1678. [Google Scholar] [CrossRef]
  98. Wang, Y.; Xiu, C. Spatial Quality Evaluation of Historical Blocks Based on Street View Image Data: A Case Study of the Fangcheng District. Buildings 2023, 13, 1612. [Google Scholar] [CrossRef]
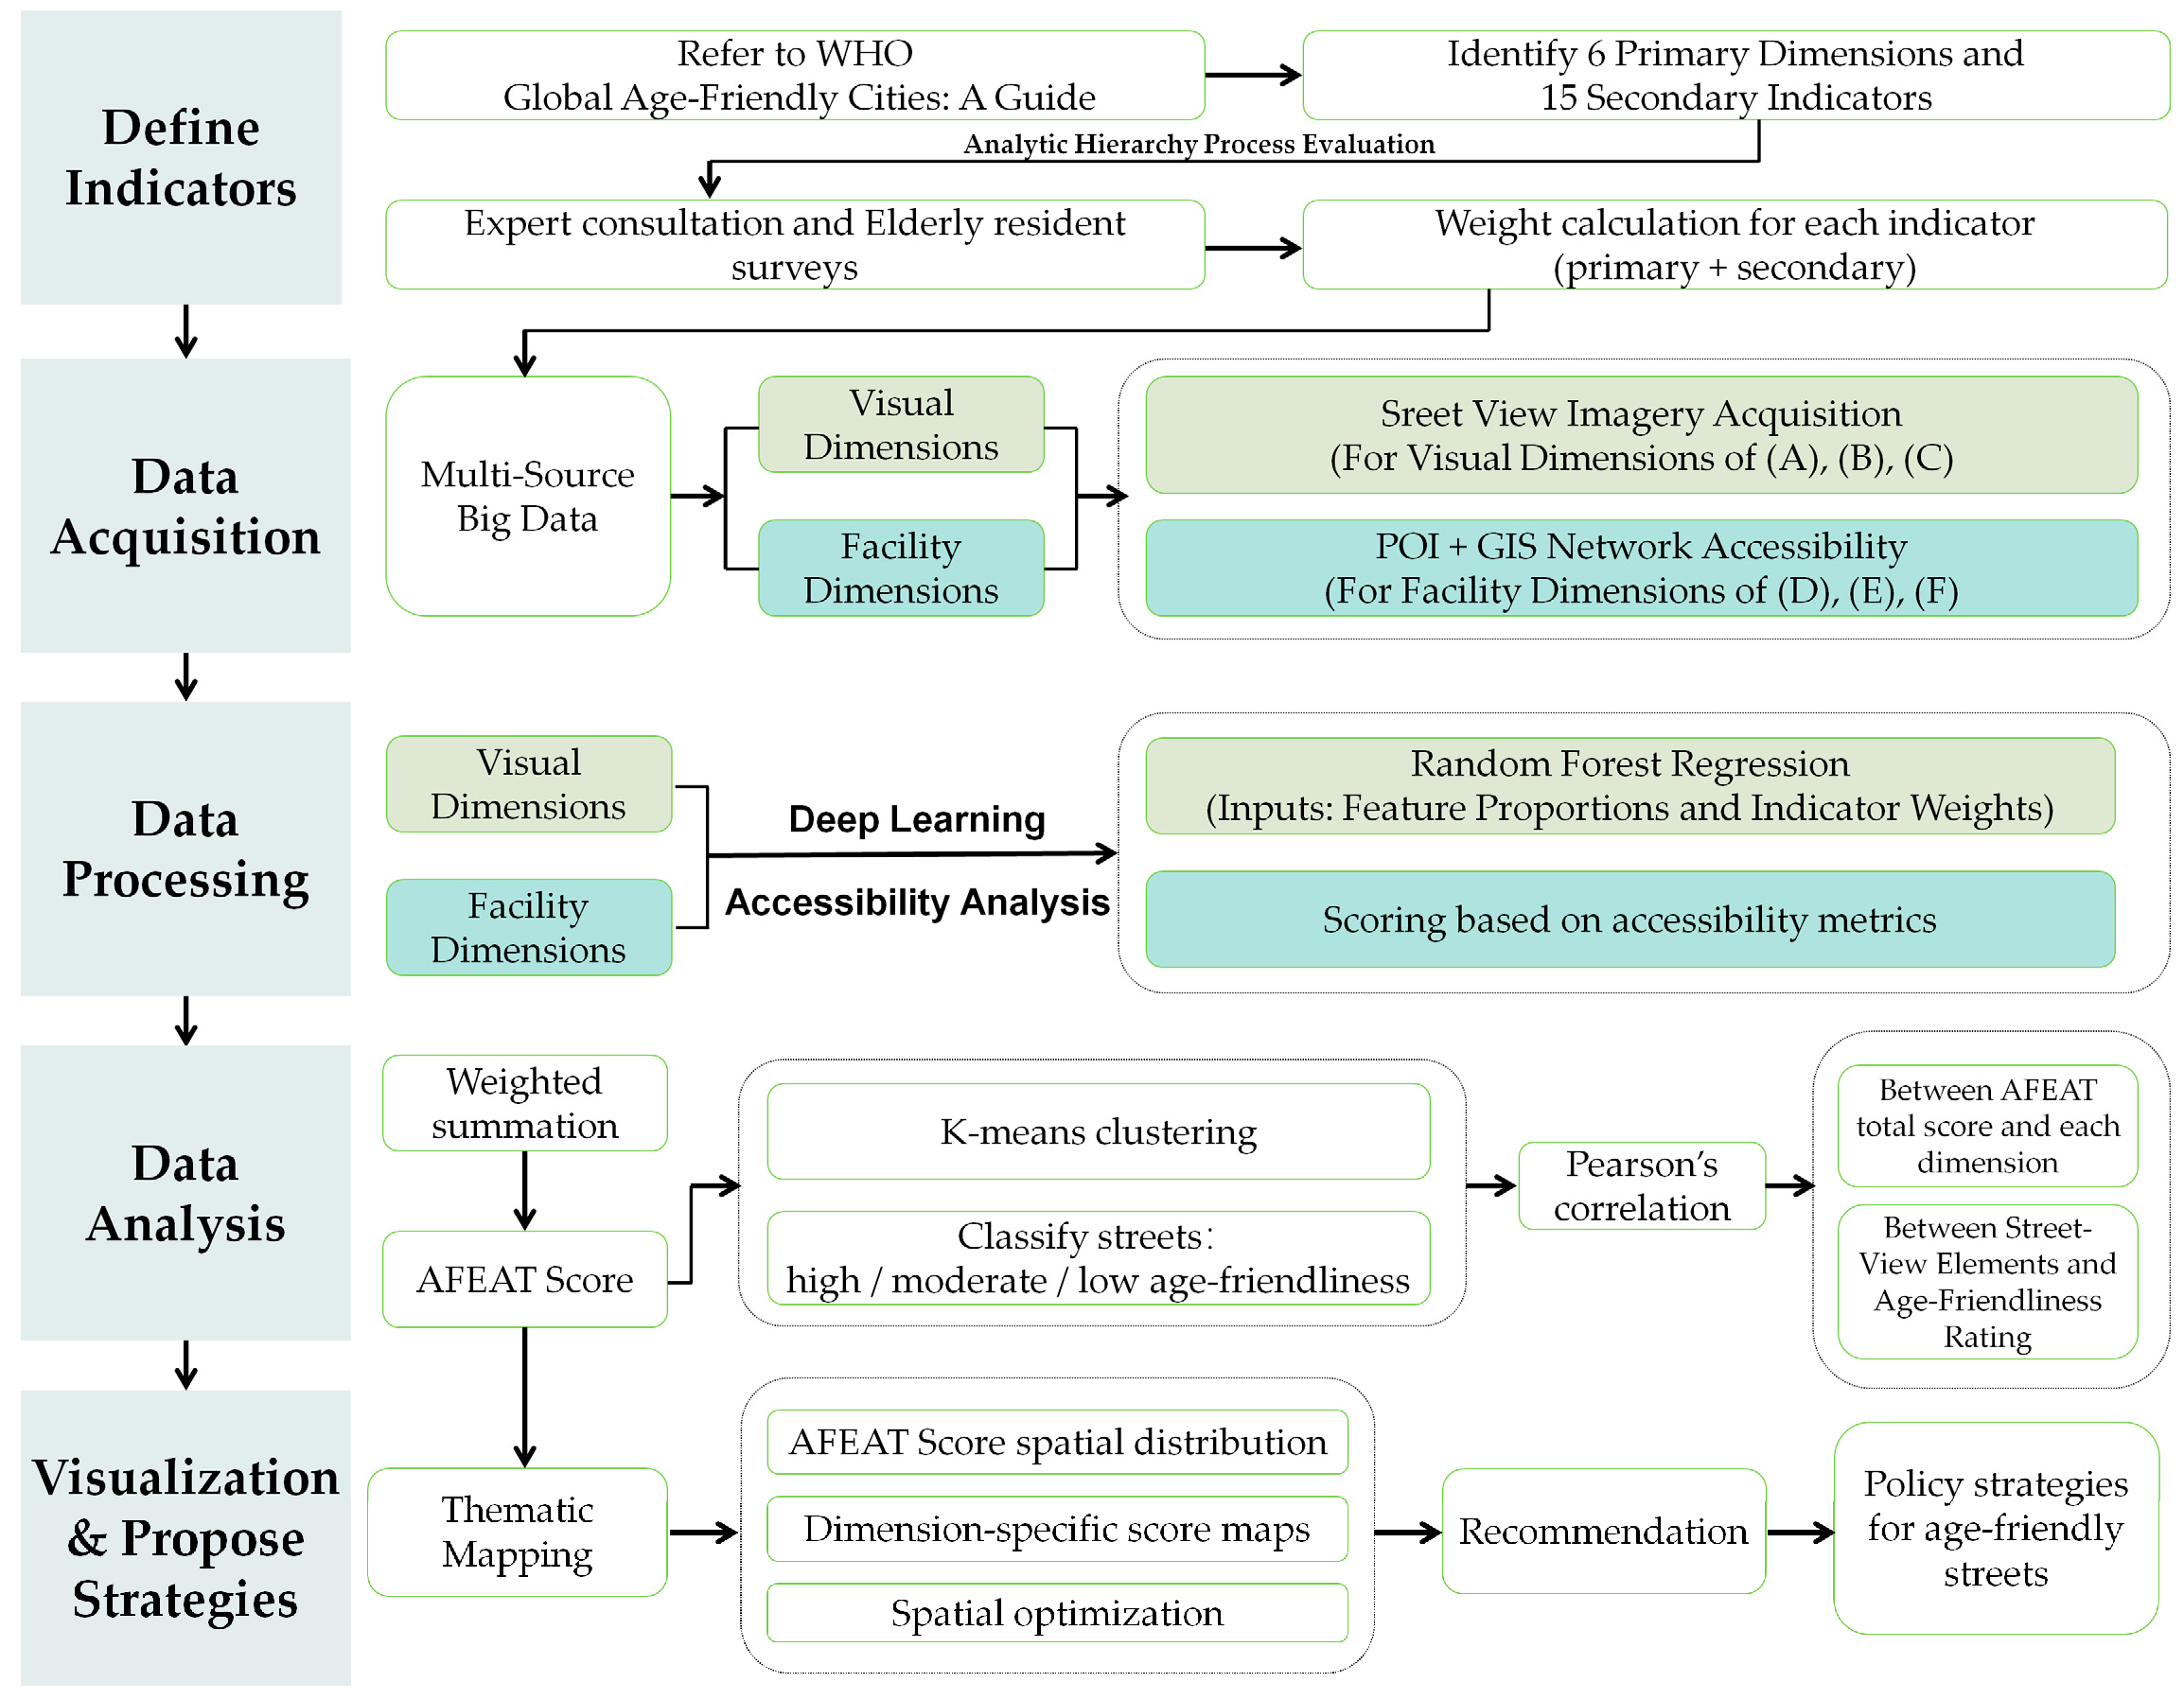
Figure 1. Research Framework. Framework of the analytical process. In the figure, (1) to (6) correspond to the six primary dimensions and fifteen secondary indicators: (1) Safe Mobility, (2) Environmental Amenity, (3) Accessible Amenities, (4) Health Services, (5) Leisure and Active Living Environment, and (6) Social Inclusion Hubs. Arrows indicate the sequential progression of analysis steps.
Buildings 15 03518 g001
Figure 2. This study focuses on Qinhuai District, located in central Nanjing, China. (a) Location of Jiangsu Province within China; (b) Location of the Qinhuai District within Nanjing City, such as the urban core area, characterized by high population density. (c) Road network situation in the Qinhuai District. (d)Territorial Spatial Planning of Qinhuai District, Nanjing City.
Buildings 15 03518 g002
Figure 3. Quantification of the street view elements using the PSPNet Image Segmentation Model.
Buildings 15 03518 g003
Figure 4. Spatial distribution of AFEAT scores for street age-friendliness in Qinhuai District. Streets are classified into three levels based on AFEAT scores: HIGH (blue), MODERATE (green), and LOW (orange).
Buildings 15 03518 g004
Figure 5. Semantic segmentation and geometrical spatialization of representative streets in Qinhuai District. Panels A to D illustrate four illustrative examples of typical streets dominated by different spatial elements: (A) Xifang Alley (building-dominant, continuous enclosure), (B) Xiangxue Road (sky-dominant, high openness), (C) Daxiaochang Road (vegetation-dominant, green interface), and (D) Zhanyuan Road (wall-dominant, linear hard enclosure). These examples visually complement the statistical results in Table 8 and Table 9 and highlight how distinct geometric configurations of street-level elements may shape age-friendliness perception.
Buildings 15 03518 g005
Figure 7. Typical street view images and age-friendliness of AFEAT Scores of Qinhuai District. Street aging-friendly radar diagnostic map. (af) present a comparative analysis of different streets across six evaluation dimensions: (a) Safe Mobility, (b) Environmental Amenity, (c) Accessible Amenities, (d) Health Services, (e) Leisure and Active Living Environment, and (f) Social Inclusion Hubs. These visualizations highlight the relative strengths and weaknesses of each street under specific indicators, enabling the identification of streets with either comprehensive advantages or targeted deficiencies. Such analysis provides a basis for subsequent spatial optimization and resource allocation strategies. (AF) show real-world examples of streets that perform well across the six evaluation dimensions: Area (A) (South zhongshan Road), Area (B) (South jinlingzhizaoju Road), Area (C) (Jinlian Road), Area (D) (Changfu Street), Area (E) (Zhanyuan Road), Area (F) (Chaoku Street). (GL) present streets that demonstrate moderate performance in the corresponding dimensions: Area (G) (Jiujingchang Road), Area (H) (Huilong street), Area (I) (Saozhou Lane), Area (J) (East Tieguan Road), Area (K) (Chaozhi Lane), Area (L) (Dajiaochang Road). (MR) present streets that demonstrate relatively weak performance in the corresponding dimensions: Area (M) (Junnong Road), Area (N) (Xifang Lane), Area (O) (Dongfengqiao Road), Area (P) (Guangyang Road), Area (Q) (Guangsheng Road), Area (R) (Dongguashi Road).
Buildings 15 03518 g007
Table 1. Description of dimensions of Age-Friendly Environment Assessment Tool.
Dimensions of AFEATIndicators
Safe Mobility(A)Traffic Safety (A1)
Transit Accessibility (A2)
Barrier-free Transit (A3)
Walkable Environment(B)Airflow Optimization (B1)
Noise-reducing Greenery (B2)
Accessible Amenities(C)Universal Access Infrastructure (C1)
Organized Parking (C2)
Healthcare Services(D)Medical Facility Accessibility (D1)
Medical Services Accessibility (D2)
Senior Care Facilities (D3)
Leisure and Active Living Environment(E)Green Space Accessibility (E1)
Daily Market Accessibility (E2)
Social Inclusion Hubs(F)Volunteer Hub Accessibility (F1)
Neighborhood Council Accessibility (F2)
Transit Node Accessibility (F3)
Table 3. Expert and Resident Questionnaires for AHP Evaluation of Age-Friendly Streets (Primary Indicators).
TypeDimensionQuestionnaires
ExpertSafe Mobilityevaluate the importance of Safe Mobility in enhancing the age-friendliness of urban streets.
Environmental Amenityevaluate the importance of Environmental Amenity in enhancing the age-friendliness of urban streets.
Accessible Amenitiesevaluate the importance of Accessible Amenities in enhancing the age-friendliness of urban streets.
Health Servicesevaluate the importance of Health Services in building age-friendly streets.
Leisure and Active Living Environmentevaluate the importance of the Leisure and Active Living Environment in building age-friendly streets.
Social Inclusion Hubsevaluate the importance of Social Inclusion Hubs in building age-friendly streets.
Older
Resident
Safe MobilityWhen you go out, do you think it is important to feel safe walking on the street?
Environmental AmenityWhen you walk on the street, do you care whether the air is fresh, it is quiet, and there is enough greenery?
Accessible AmenitiesWhen going out for shopping or to see a doctor, do you think it is important that the route is easy to walk and convenient? (For example, no unnecessary stairs, no detours)
Health ServicesDo you think it is important to have hospitals, pharmacies, and emergency medical services near your home?
Leisure and Active Living EnvironmentDo you think it is important to have parks, markets, or places for activities nearby?
Social Inclusion HubsDo you think it is important to have opportunities to chat with neighbors or join community activities?
Table 4. The weights of six perception dimensions.
Age-Friendliness DimensionWeight from Expert PerspectiveWeight from Older Resident PerspectiveComposite Weight
Safe Mobility0.2480.2180.233
Walkable Environment0.1430.1970.170
Accessible Amenities0.1290.1700.150
Healthcare Services0.2030.2190.211
Leisure and Active Living Environment0.1140.0920.103
Social Inclusion Hubs0.1620.1040.133
Table 6. Scores of the streets in Qinhuai District across dimensions of age-friendliness.
Age-Friendliness DimensionLow Age-FriendlinessModerate Age-FriendlinessHigh Age-Friendliness
(A) Safe Mobility19.80%54.46%25.74%
(B) Walkable Environment18.81%45.05%36.14%
(C) Accessible Amenities22.28%46.53%31.19%
(D) Healthcare Services21.78%44.06%34.16%
(E) Leisure and Active Living Environment15.35%42.08%42.57%
(F) Social Inclusion Hubs27.23%37.13%35.64%
overall age-friendliness index19.31%52.97%27.72%
Table 7. Pearson Correlation Between Dimensions and AFEAT Overall Score.
Pearson Correlation Analysis
DimensionsCorrelation Coefficientp-Value
Safe Mobility (A)0.259 **p < 0.01
Walkable Environment (B)–0.1040.140
Accessible Amenities (C)0.235 **0.001
Healthcare Services (D)0.846 **p < 0.01
Leisure and Active Living Environment (E)0.693 **p < 0.01
Social Inclusion Hubs (F)0.719 **p < 0.01
Note: ** p < 0.01 (two-tailed). n = 202.
Table 8. Descriptive Statistics of Street-View Spatial Elements in Qinhuai District.
ElementNRangeMinMaxSumMeanStd. DeviationVariance
Building2020.58800.58845.2010.2240.1260.016
Sky2020.6160.0610.67783.7030.4140.1040.011
Road2020.1610.0050.16617.070.0850.0310.001
Sidewalk2020.15400.1544.1770.0210.0150
Wall2020.12300.1233.7940.0190.0240.001
Vegetation2020.70900.70933.8090.1670.10.01
Fence2020.05300.0531.6660.0080.0090
Signboard2020.01800.0180.5180.0030.0020
Table 9. Pearson Correlation between Street-View Elements and Age-Friendliness Ratings.
Street-View ElementPearson’s rSignificance (p)Correlation Direction
Building0.301<0.001Positive
Sidewalk0.1810.01Positive
Road0.1330.06Not significant
Sky−0.268<0.001Negative
Wall−0.295<0.001Negative
Vegetation0.0020.98Not significant
Fence−0.0420.548Not significant
Disclaimer/Publisher’s Note: The statements, opinions and data contained in all publications are solely those of the individual author(s) and contributor(s) and not of MDPI and/or the editor(s). MDPI and/or the editor(s) disclaim responsibility for any injury to people or property resulting from any ideas, methods, instructions or products referred to in the content.