Article

Axial Force Analysis and Geometric Nonlinear Beam-Spring Finite Element Calculation of Micro Anti-Slide Piles

1
School of Civil Engineering and Transportation, Foshan University, Foshan 528225, China
2
School of Civil Engineering, Sun Yat-sen University, Zhuhai 519082, China
*
Author to whom correspondence should be addressed.
Buildings 2025, 15(19), 3498; https://doi.org/10.3390/buildings15193498
Submission received: 1 July 2025 / Revised: 21 September 2025 / Accepted: 24 September 2025 / Published: 28 September 2025

Abstract

This study investigates the development of axial force in micro anti-slide piles under soil movement during slope stabilization. Axial force arises from two primary mechanisms: axial soil displacement ( z s ) and pile kinematics. The former plays a dominant role, producing either tensile or compressive axial force depending on the direction of z s , while the kinematically induced component remains consistently tensile. A sliding angle of α = 5 ° represents an approximate transition point where these two effects balance each other. Furthermore, the two mechanisms exhibit distinct mobilization behaviors: z s -induced axial force mobilizes earlier than both bending moment and shear force, whereas kinematically induced axial force mobilizes significantly later. The study reveals two distinct pile–soil interaction mechanisms depending on proximity to the slip surface: away from the slip surface, axial soil resistance is governed by rigid cross-section translation, whereas near the slip surface, rotation-dominated displacement accompanied by soil–pile separation introduces significant complexity in predicting both the magnitude and direction of axial friction. A hyperbolic formulation was adopted to model both the lateral soil resistance relative to lateral pile–soil displacement (p-y behavior) and the axial frictional resistance relative to axial pile–soil displacement (t-z behavior). Soil resistance equations were derived to explicitly incorporate the effects of cross-sectional rotation and pile–soil separation. A novel beam-spring finite element method (BSFEM) that incorporates both geometric and material nonlinearities of the pile behavior was developed, using a soil displacement-driven solution algorithm. Validation against both numerical simulations and field monitoring data from an engineering application demonstrates the model’s effectiveness in capturing the distribution and evolution of axial deformation and axial force in micropiles under varying soil movement conditions.

1. Introduction

The installation of stabilizing piles is one of the most widely used and effective measures for landslide mitigation and control [1,2]. Compared to conventional large-diameter anti-sliding piles, micropiles (typically with diameters ranging from 90 to 300 mm) offer distinct advantages, including relatively simple and rapid construction, environmental friendliness, and cost effectiveness [3]. These characteristics make them particularly suitable for stabilizing landslides in steep or inaccessible areas with limited equipment access. Currently, micropiles are commonly employed for emergency stabilization of shallow to medium-depth landslides. When equipped with appropriate anti-corrosion measures, they can serve as a permanent alternative to conventional large-diameter anti-slide piles for long-term landslide stabilization.
Large-diameter anti-slide piles exhibit high stiffness and minimal deformation, enabling them to mobilize pile-soil interaction across a greater depth range and achieve maximum pile resistance [4]. The soil arching effect that develops between adjacent piles can effectively restrain the movement of slope soil mass [5]. In contrast, micropiles are inherently flexible structures. When subjected to landslide movements, they undergo significant bending deformation near the slip surface, while the upper portion displaces synchronously with the surrounding soil. Consequently, lateral pile-soil interactions are only mobilized within a limited depth range above the slip surface, resulting in relatively low anti-sliding capacity per individual pile. Nevertheless, the overall anti-sliding performance can be significantly improved by arranging multiple rows of micropiles, as evidenced by successful applications [3,6] and scaled model tests [7,8,9,10,11].
Beyond differences in the mobilization depth range of lateral pile-soil interactions, another key distinction between these two anti-slide pile types lies in the potential contribution of axial forces to slope stabilization. When micropiles undergo bending deformation at the sliding surface, longitudinal displacement occurs, generating axial frictional resistance along the pile-soil interface. This interface friction induces axial forces within the pile (i.e., kinematically induced axial force [12]) while simultaneously transferring stress to the surrounding soil mass. The resulting increase in normal stress at the sliding interface produces additional anti-sliding resistance [12]. In micropile-stabilized slopes, these axial forces may substantially influence reinforcement effectiveness. Therefore, a thorough investigation of the axial force mechanism and development of corresponding calculation methods are critically needed.
Current methods for calculating internal forces in micro anti-slide piles primarily employ either plane rigid frame analysis [7,13] or the p-y method [3,14], where p represents lateral soil resistance and y denotes relative lateral pile-soil displacement. However, these approaches are limited to solving lateral pile responses, including lateral pile displacement, cross-sectional rotation, bending moment and shear force, while typically treating axial displacement and axial force through uncoupled analyses. For assessing the shear capacity of individual inclined micropiles, Sun et al. [3] estimated the maximum axial resistance by summing the grout-to-ground ultimate bond strength along the micropile segment above the slip surface. To better capture the development of axial force with soil displacement, the t-z method (where t signifies axial soil friction and z represents relative axial pile-soil displacement), has been adapted from axially loaded pile analysis [15,16] and incorporated into micropile analysis [12,17]. However, compared to p-y analysis (which reliably predicts bending moment and shear force), this uncoupled t-z approach demonstrates larger discrepancies in axial force predictions relative to measure results and may even fail to correctly determine the direction of axial forces under certain conditions [17]. A key limitation of such uncoupled analysis is its neglect of axial pile displacement induced by transverse deformation (i.e., kinematically induced axial displacement). In enhance the accuracy of internal force calculations for micro anti-slide piles, it is imperative to incorporate geometric nonlinearity during pile deformation and perform coupled analyses of transverse and axial pile-soil interactions.
This study investigates the axial force development in micro-piles subjected to landslide movements through three-dimensional (3D) finite element (FE) simulations. As also an important factor influencing the pile axial responses, the effect of axial soil displacement has also been examined by varying the sliding angle. A comprehensive analysis of axial soil resistance during pile deformation is presented, leading to the development of a novel beam-spring finite element method (BSFEM) that incorporates both geometric and material nonlinearities for accurate prediction of micropile responses. The proposed methodology is validated through comparative analyses with numerical simulation results and a practical engineering case study, demonstrating its reliability in predicting internal forces in micropiles under complex loading conditions.

2. Analysis of Axial Force Mobilization of Micropiles

Finite element simulations provide an effective approach for investigating pile-soil interactions [18]. For slope-stabilizing pile design, Kourkoulis et al. [19,20] developed a hybrid methodology that combines conventional limit-equilibrium methods (for determining the required lateral resistance to achieve target safety factors) with rigorous 3D nonlinear FE analyses (for assessing pile lateral capacity, modeling only a localized soil region around the piles). Based on this framework, Lei et al. [21] conducted a detailed investigation of anti-slide micropile lateral capacity using a refined pile model. In the present study, we employ this established FE approach to analyze axial force development in micropiles, while simultaneously establishing it as the benchmark reference for validating our proposed simplified method.

2.1. Numerical Model

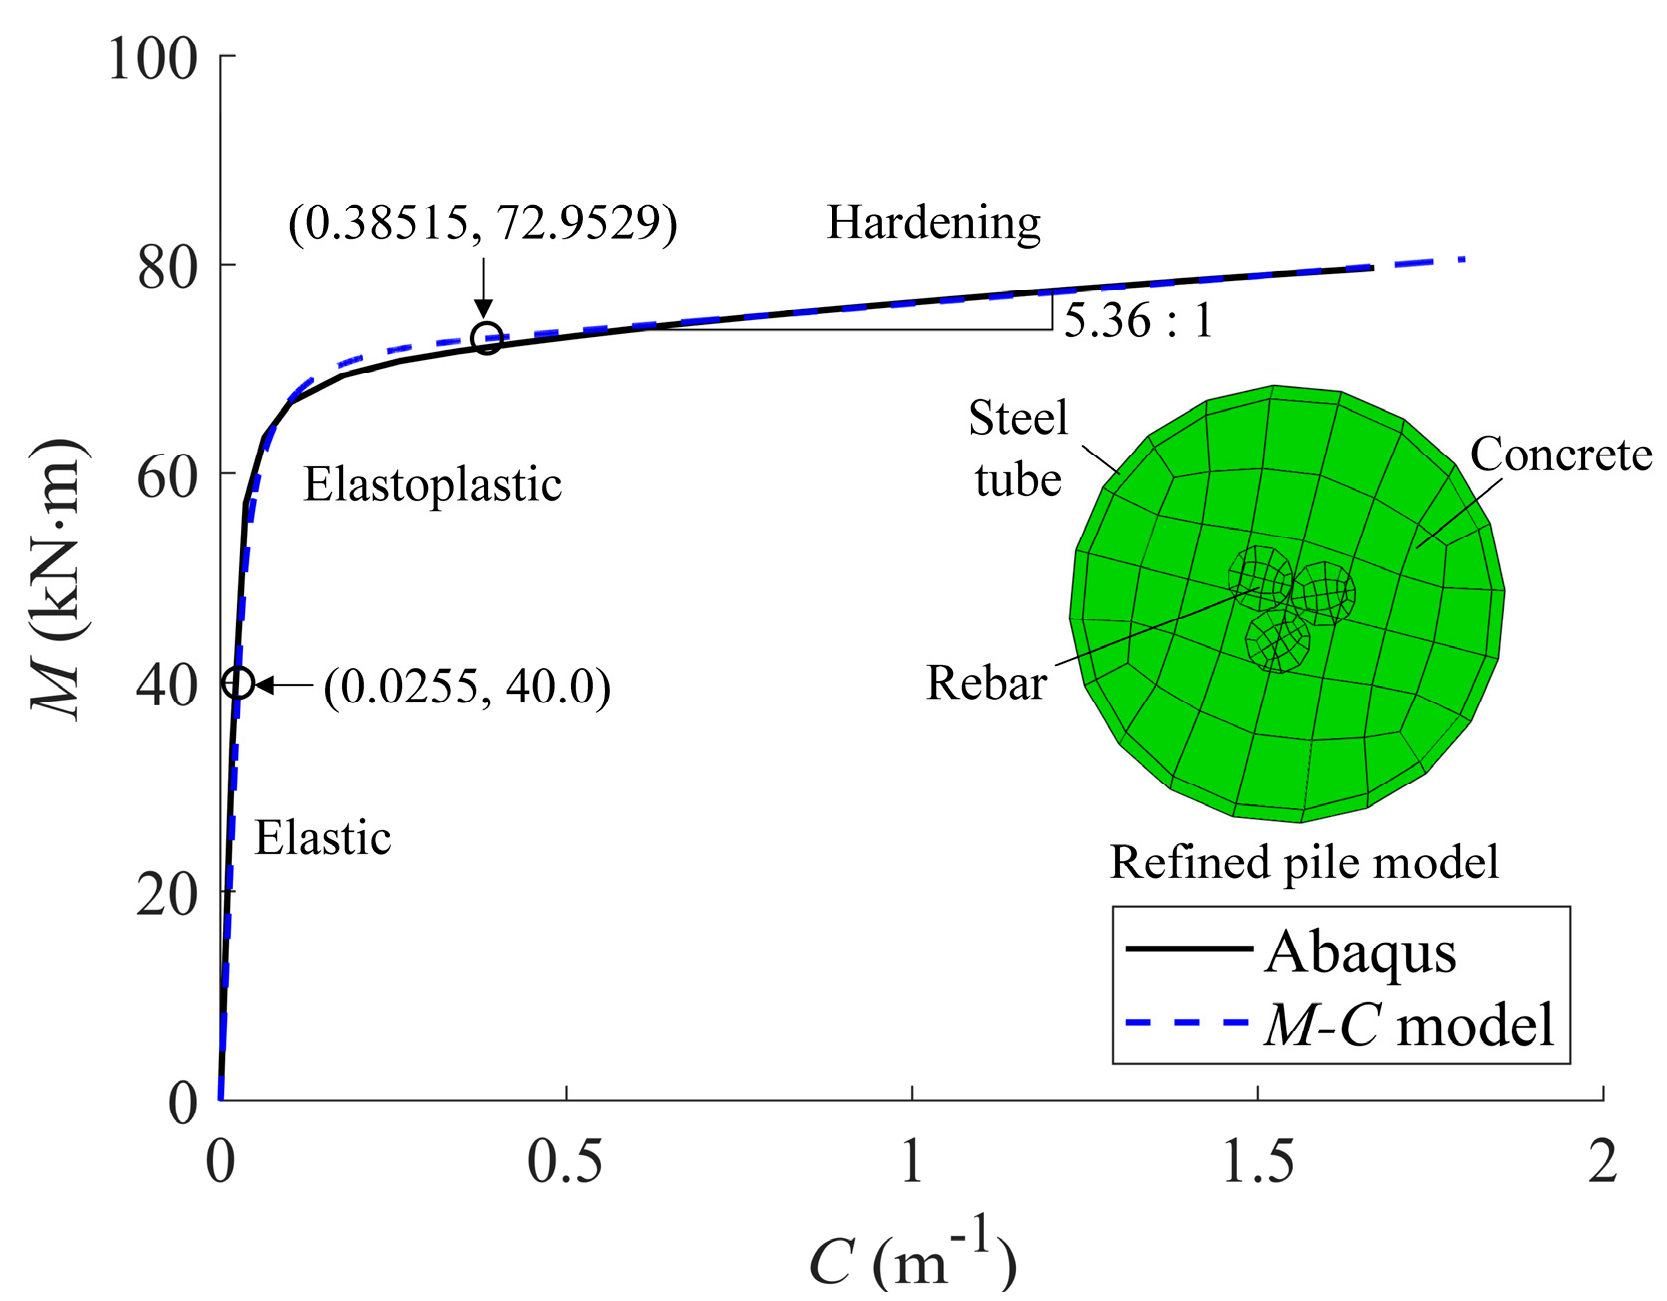
Figure 1 presents the geometry and boundary conditions of the numerical model, featuring micropiles with a diameter of 0.168 m. The pile consists of equal-length cantilever and embedded sections, each measuring 5 m. The structural composition comprises a concrete-filled steel tube with a central reinforcement bundle. The steel tube has an outer diameter of 168 mm and the tube thickness is 5 mm. The central reinforcement bundle includes three reinforcement bars with a diameter of 25 mm. Previous research by [21] conducted a refined FE simulation of the pile’s four-point bending behavior, employing an idealized elastoplastic model for both the steel tube (with tensile and compressive strengths of 420 MPa) and reinforcement bars (400 MPa strength). The concrete was modeled using a concrete damage plasticity model, with specified tensile and compressive strengths of 2.01 MPa and 20.1 MPa, respectively. The Young’s modulus is 200 GPa for both the steel tube and reinforcement bars while 30 GPa is used for the infilled concrete. The bending moment-curvature response (Figure 2) of this micropile type exhibits three distinct phases: (1) elastic, (2) elastoplastic, and (3) hardening, characterized by linear, hyperbolic, and linear relationships, respectively [21].
Leveraging the model’s inherent symmetry [20,22], only a thin slice extending from the pile axis to the midpoint between adjacent piles was modeled (Figure 1a), with symmetric boundary conditions imposed on the corresponding faces. The pile spacing, perpendicular to the landslide direction, was set to 5D, where D represents the pile diameter. In the landslide direction, the front and rear boundaries of the soil strata were positioned 20D from the pile axis. The stable layer was constrained against normal displacement, while the sliding layer was assigned a displacement boundary condition to simulate landslide movement. As an important factor which influences the axial force development in the micropiles, the sliding angle ( α , the angle of the slip surface to the horizontal surface) was set as a variable ranging from −30° to 30°, with positive α values correspond to the scenario in Figure 1b: the vertical component of soil displacement points downwards. The model base was located 2 m below the pile tip and was fixed against normal displacement. The interface friction coefficients were specified as 0.5 for pile-soil interactions and 0.3 for the contact between sliding and stable layers. In the top view, the mesh size is about 0.0264 m along the pile perimeter. The soil mesh size is 0.0525 m along X direction and also along Y direction (the sliding direction) when the Y-distance to the pile axis is less than 0.42 m. As the Y-distance to the pile axis becomes larger, the mesh size increases from 0.06 m to 0.2 m at the boundary. Along the depth, a uniform mesh size of 0.05 m is applied to both the pile and the soil layers above the pile bottom. For deeper ground, an increasing mesh size with depth from 0.05 m to 0.15 m is employed. Both soil strata were simulated using a linear-elastic perfectly plastic constitutive model based on the Mohr-Coulomb failure criterion [20,23,24], as the analysis focuses on fully mobilized pile–soil interaction involving extensive soil failure around the piles. The full set of physical and mechanical parameters used in the model is provided in Table 1.

2.2. Axial Force Development

Figure 3 presents the distribution profiles of bending moment (M), shear force (Q), and axial force (P) under increasing lateral soil displacements ( y s ). It should be noted that Q and P in these plots represent the tangential and normal components, respectively, of the cross-sectional forces relative to the pile’s initial orientation. Specifically, Q corresponds to the horizontal component while P denotes the vertical component of the resultant force of the cross-section. This representation facilitates direct interpretation of the pile’s reaction forces exerted on the surrounding soil mass. For more accurate analysis, the actual shear and axial forces considering cross-sectional rotation can be obtained through appropriate coordinate transformation of these measured components. As lateral soil displacement ( y s ) increases, the distribution patterns of M and Q remain consistent while exhibiting progressive magnitude amplification.
In contrast, the evolution of P profiles shows significant dependence on the sliding angle ( α ), manifesting through both distinct distribution patterns and varying mobilization levels. For negative α (e.g., Figure 3a), the pile develops tensile axial forces (P > 0) due to synergistic interaction between vertical soil displacement ( z s ) and pile kinematics—both mechanisms generate upward-directed shaft friction within the sliding layer. When α = 0 ° (Figure 3b), axial forces result solely from kinematically induced pile axial displacements, maintaining tensile forces but at a reduced mobilization level compared to M and Q. For positive α values (e.g., Figure 3d), axial forces represent the superposition of competing mechanisms: downward soil displacement generates compressive resistance while pile kinematics produce tensile forces. The case of α = 5 ° (Figure 3c) represents an approximate transition point where these opposing effects effectively cancel, particularly beyond y s > D where P diminishes markedly. At higher positive angles, z s -induced compression dominates, resulting in net compressive axial forces (P < 0).
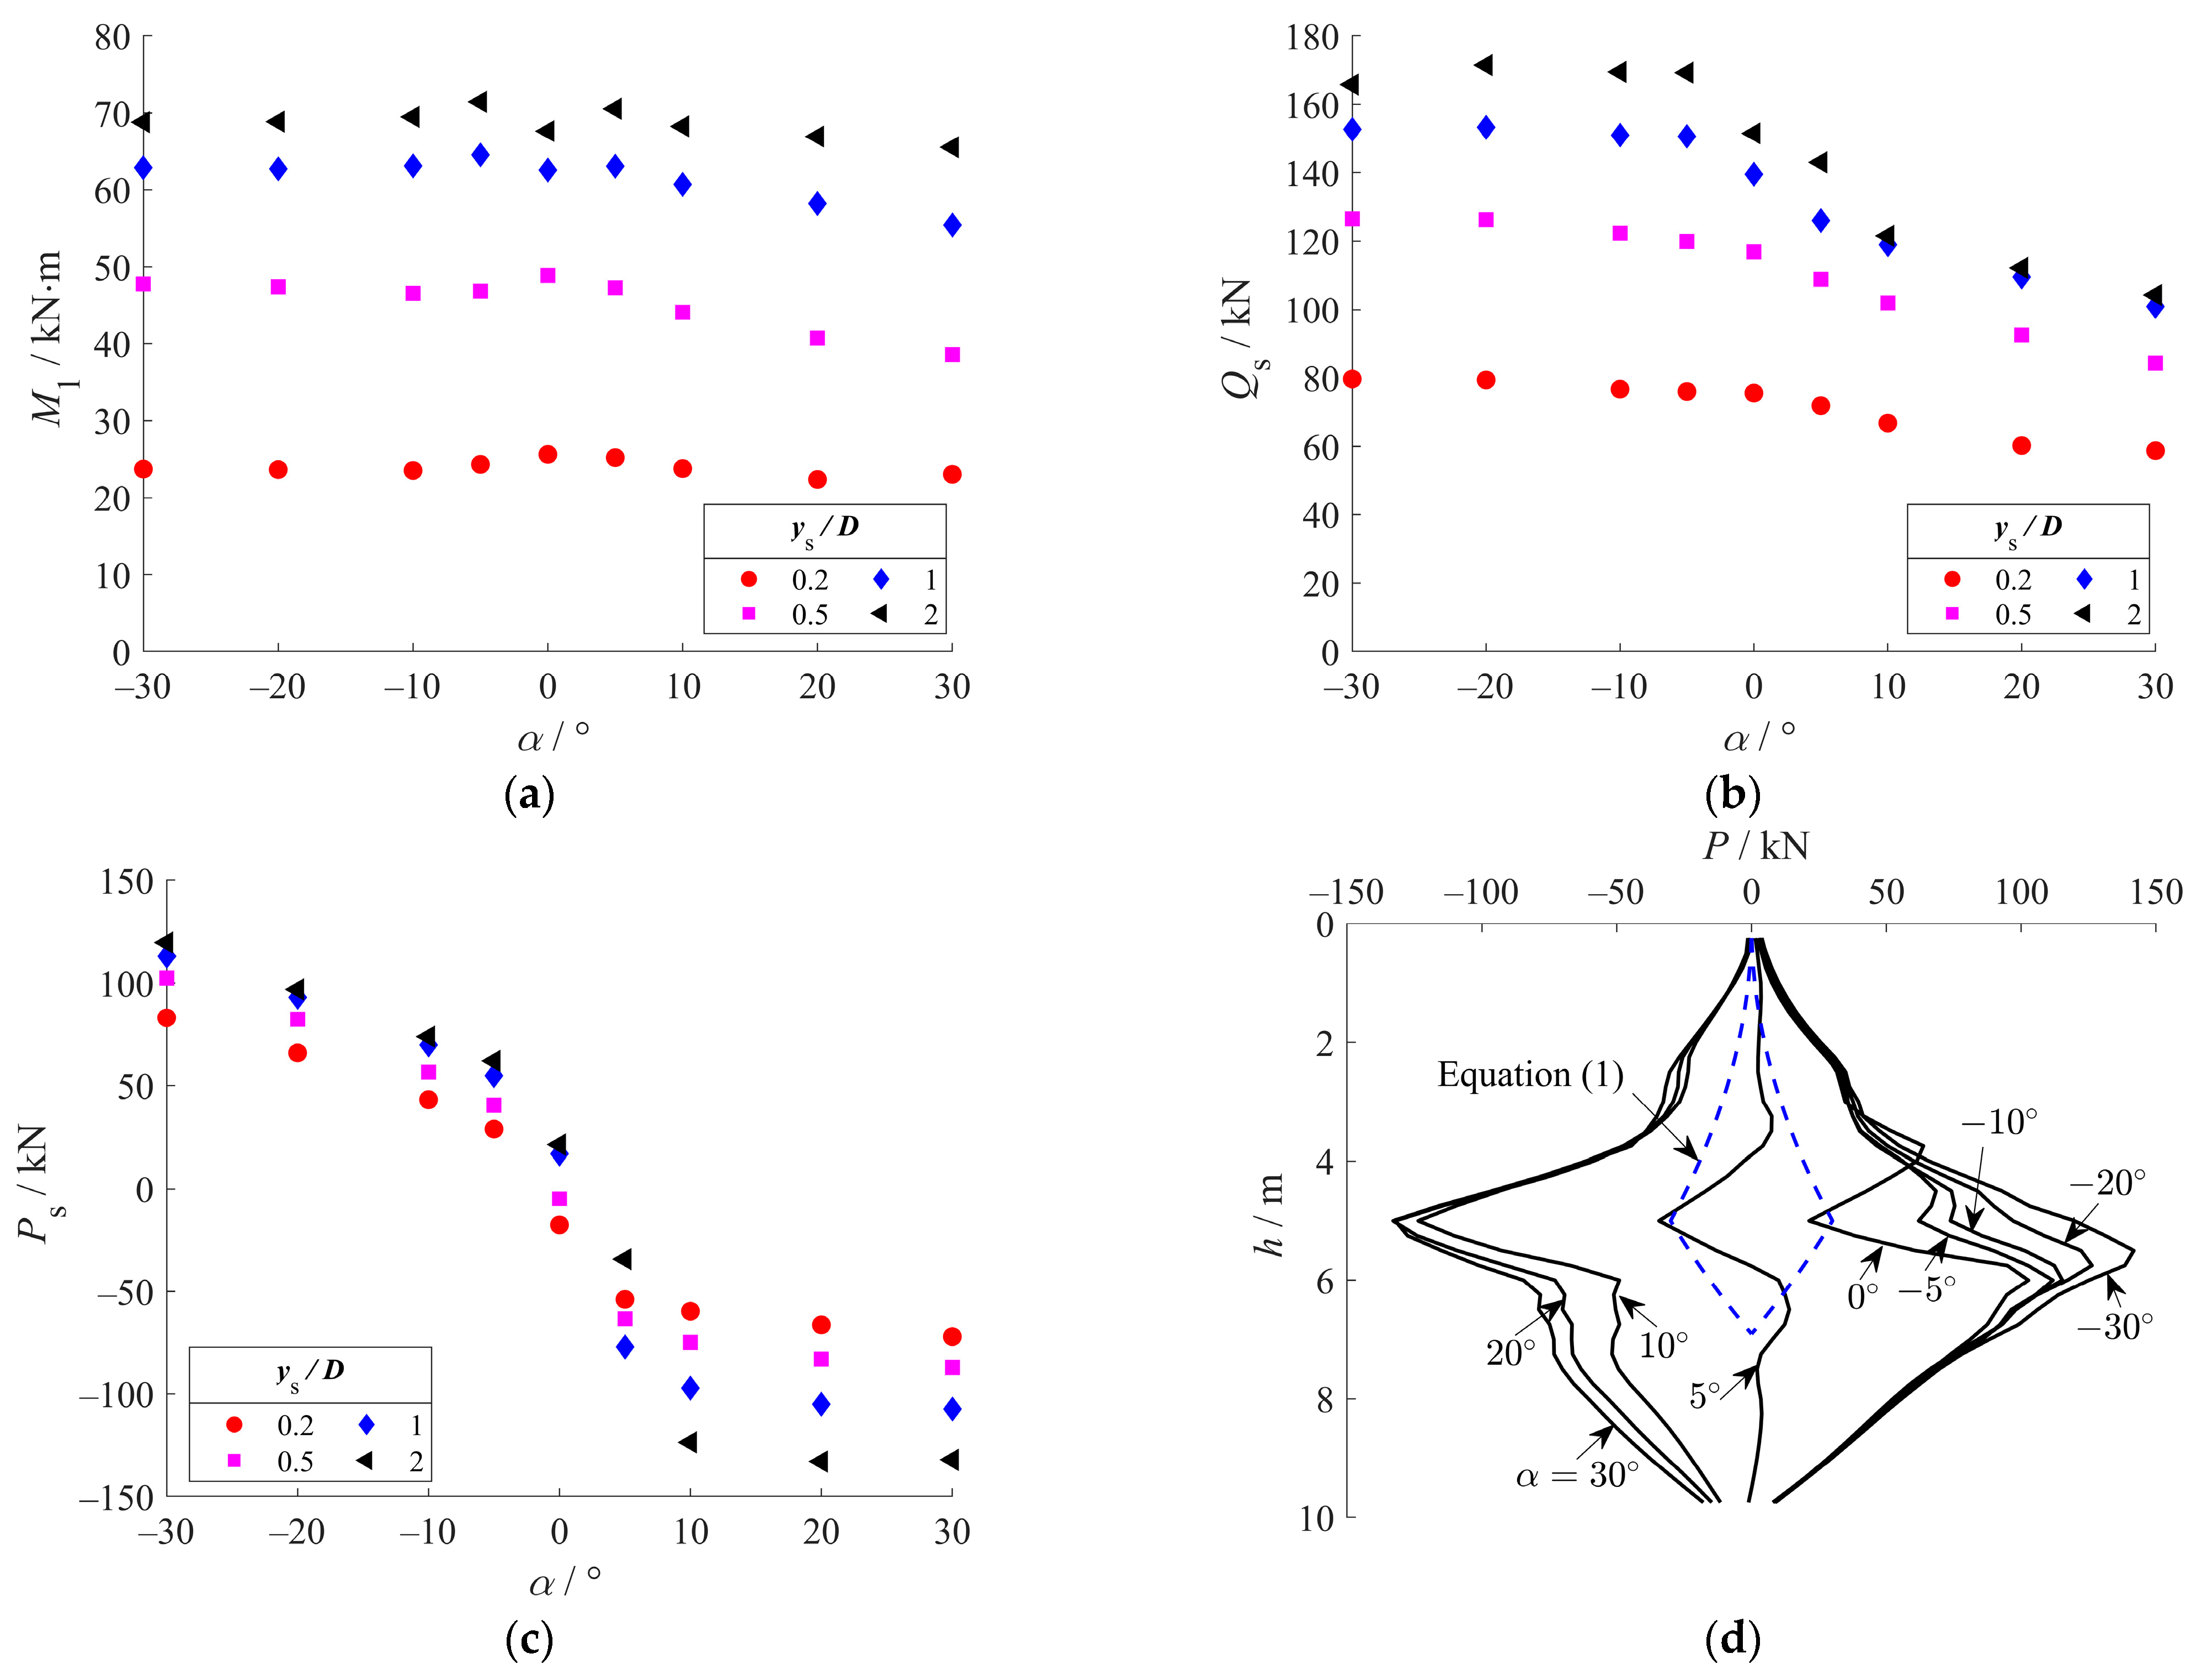
To systematically evaluate the influence of sliding angle ( α ), key internal force parameters were analyzed: (1) the peak bending moment above the slip surface ( M 1 ), (2) shear force at the slip surface ( Q s ), and (3) axial force at the slip surface ( P s ). Figure 4 presents their evolution with increasing lateral soil displacement ( y s ) through subfigures (a), (b), and (c), respectively. The results demonstrate that α has negligible influence on M 1 across all displacement levels. In contrast, Q s shows significant reduction when α 0 ° , a phenomenon whose mechanisms will be explored in subsequent analysis. Most notably, P s exhibits fundamental directional dependence on α : negative values induce tensile forces while positive values produce compression, confirming the crucial role of axial soil displacement ( z s ) in force mobilization. The mobilization efficiency of axial forces increases proportionally with | α | , approaching full mobilization at α 10 ° . This indicates the dominant role of z s in axial force development. At lower angles (e.g., α = 5 ° ), the competing interaction between z s -induced compression and kinematically induced tension creates complex nonlinear response, initially showing compression dominance followed by tension development as displacements increase.
The axial force (P) profiles of at y s = 2 D from all simulations are compared in Figure 4d with theoretically predictions from conventional axial loading theory using the following equation:
P h =     π D 0 h σ h μ d Z , h L 1 π D 0 L 1 σ h μ d Z L 1 H σ h μ d Z ,   h > L 1
where σ h = K 0 σ v is the horizontal soil stress; σ v is the vertical soil stress; K 0 = 0.5 is the horizontal stress coefficient; μ =   0.5 is the interface friction coefficient between the pile and surrounding ground; L 1 = 5   m is pile length above the slip surface; Z is the coordinate along the pile axis. Note that the theoretical formulation calculates P until a zero value is obtained below the slip surface, representing a scenario where shaft friction is estimated under purely axial pile-soil interaction. Comparative results demonstrate that this theoretical approach yields significantly lower axial force estimates than simulations incorporating coupled lateral-axial pile-soil interactions, highlighting the substantial influence of lateral interaction on axial behavior. Consequently, relying solely on conventional axial pile design methods may lead to substantial underestimation of axial forces in piles subjected to combined loading conditions.
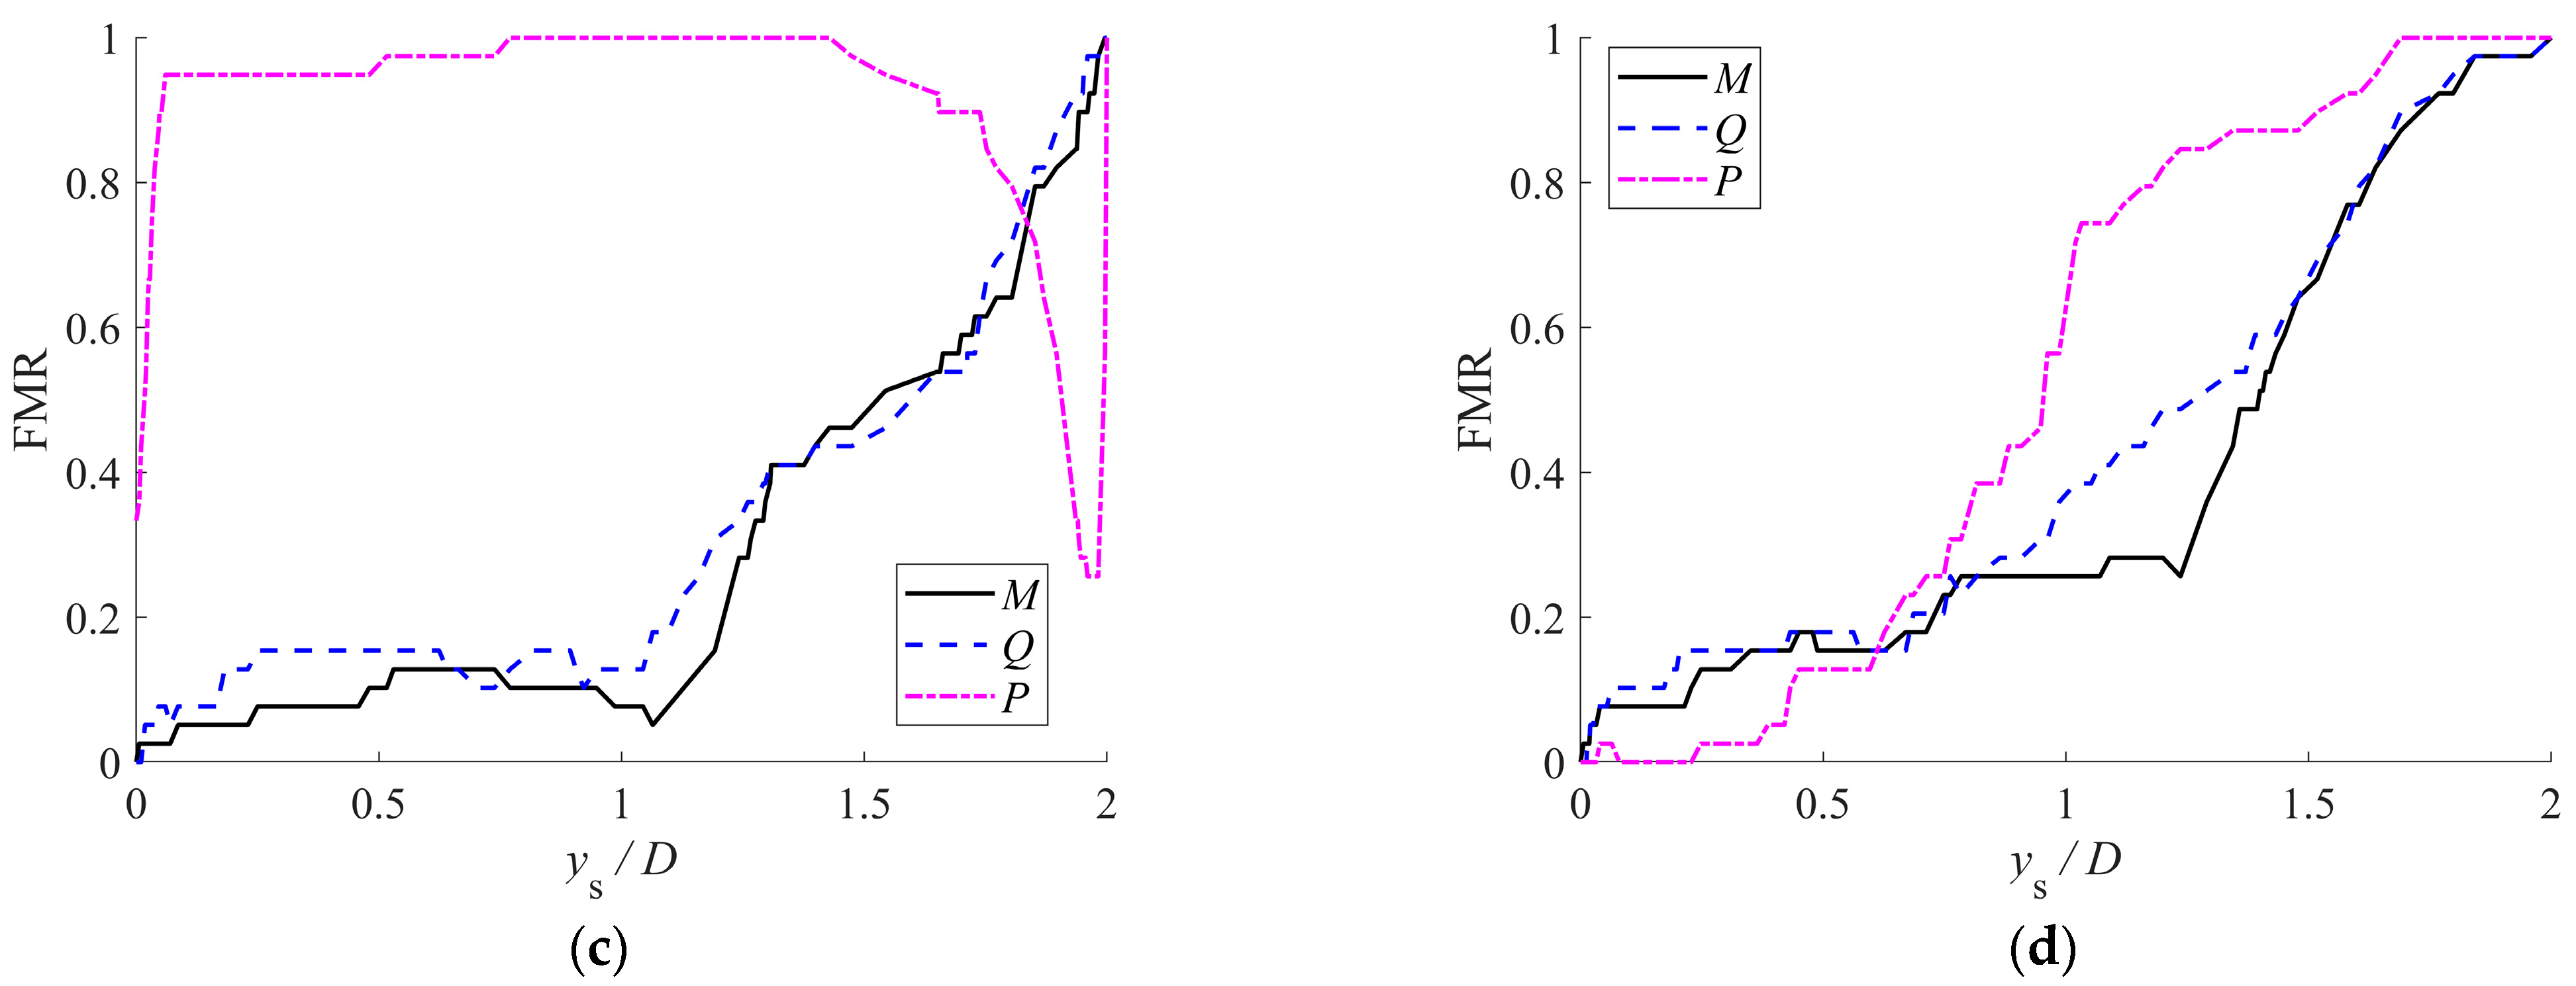
As indicated by the α = 5 ° case, the two sources of axial force exhibit distinct mobilization characteristics, as quantified through the Force Mobilization Ratio (FMR)—defined as the percentage of pile length attaining 95% of final force values at y s = 2 D . Figure 5 reveals three key mobilization patterns: (1) For |α| ≥ 10°, where axial soil displacement dominates, axial force mobilization precedes both bending moment and shear force, consistent with previous findings [12]; (2) For α = 0 ° (no prescribed axial soil displacement), axial force mobilization lags significantly behind other internal forces, confirming its kinematically induced nature; (3) For α = 5 ° , where zs-induced and kinematically induced forces approximately balance, axial force demonstrates initial rapid mobilization in compression (driven by soil displacement) followed by progressive demobilization toward tension (due to pile kinematics), revealing the complex temporal interaction between competing mechanisms.

2.3. Pile Displacements

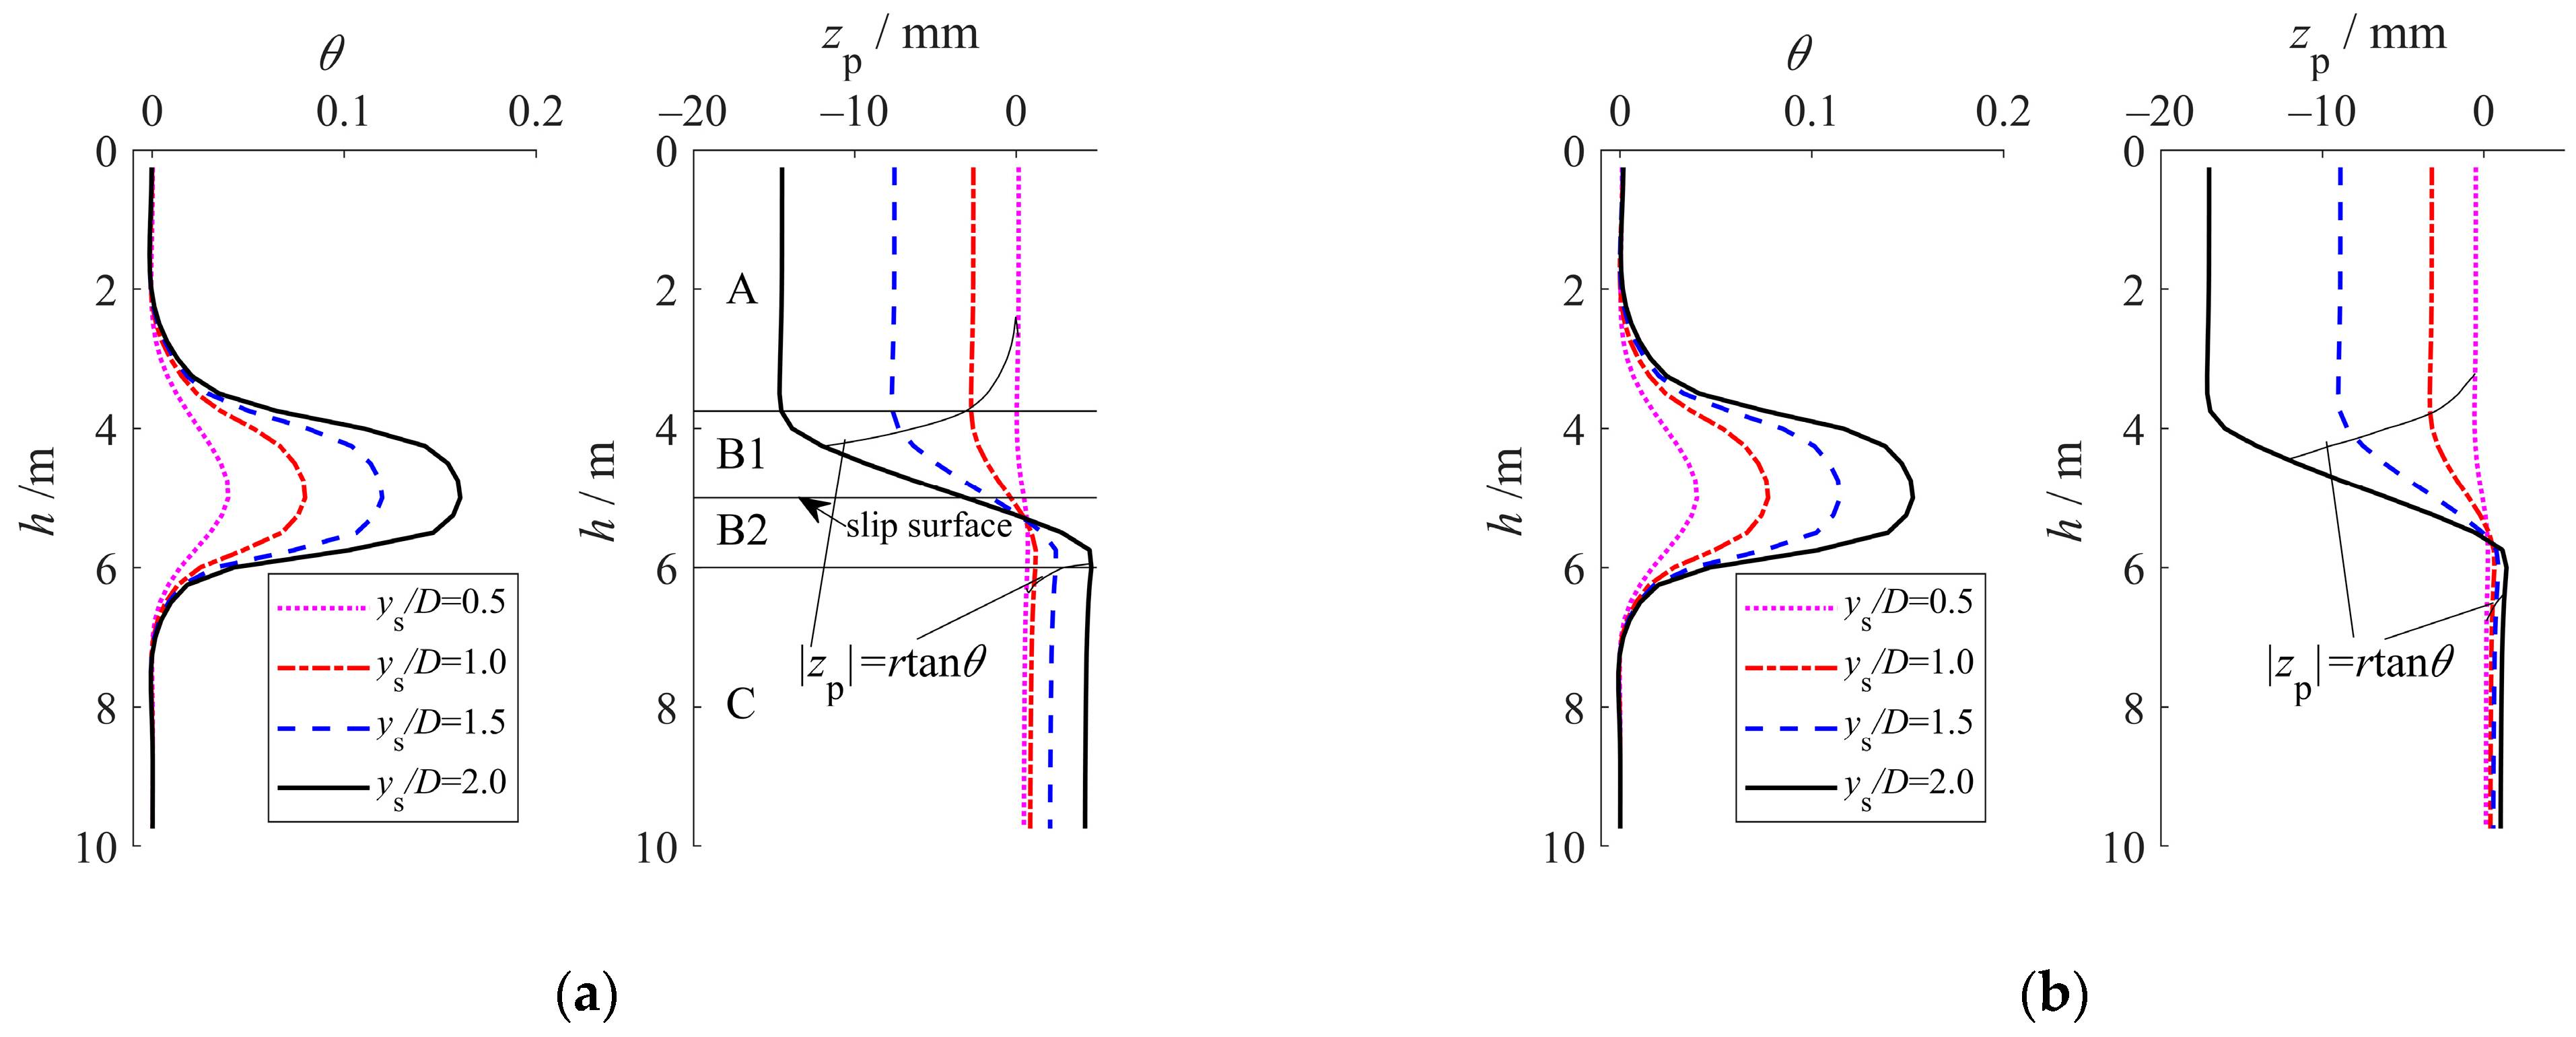
Figure 6 shows the profiles of the cross-sectional rotation angle ( θ ) and axial pile displacement ( z p ) along the micropile under increasing lateral soil displacements ( y s ). The maximum θ occurs at the slip surface and decays rapidly toward both the pile head and tip, where θ approaches zero. Due to the unrestrained pile head, z p exhibits bimodal distribution: the upper section displaces downward ( z p < 0), while the lower section displaces upward ( z p > 0), with minimal displacement in the central region. This antisymmetric pattern arises from pronounced flexural deformation near the slip surface, which induces opposing drag effects on either side of the slip surface (i.e., kinematically induced axial force).
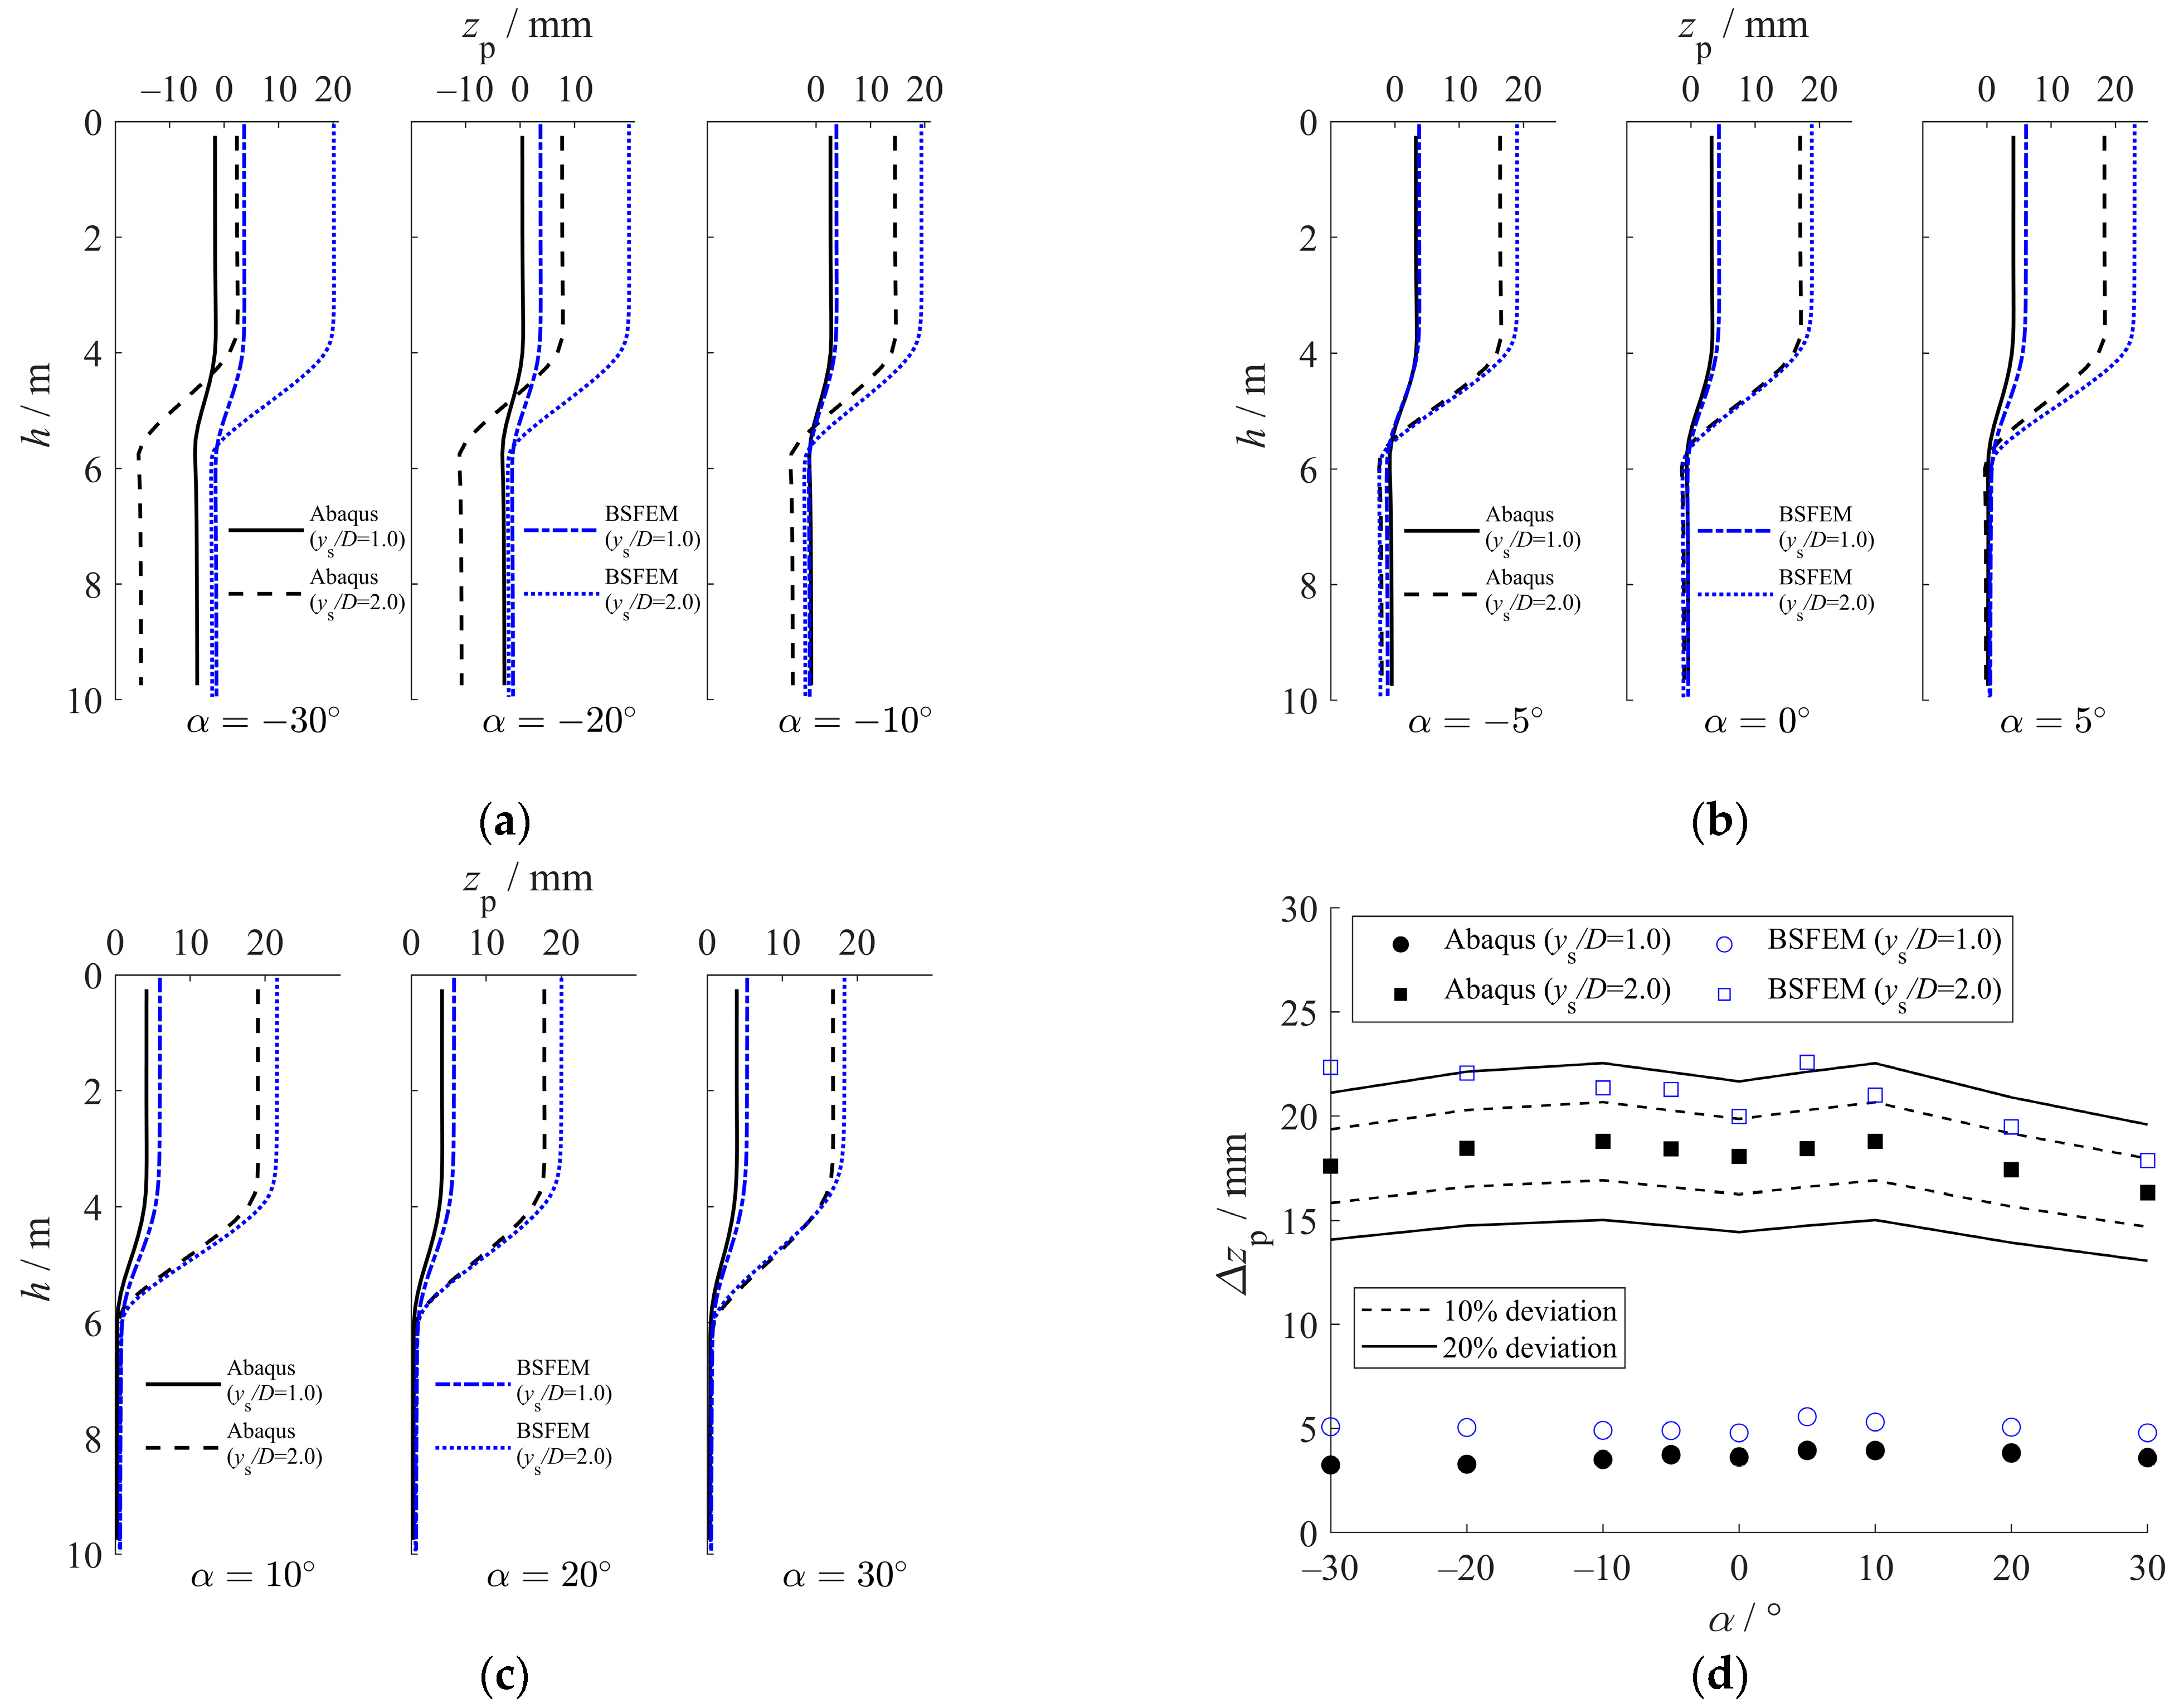
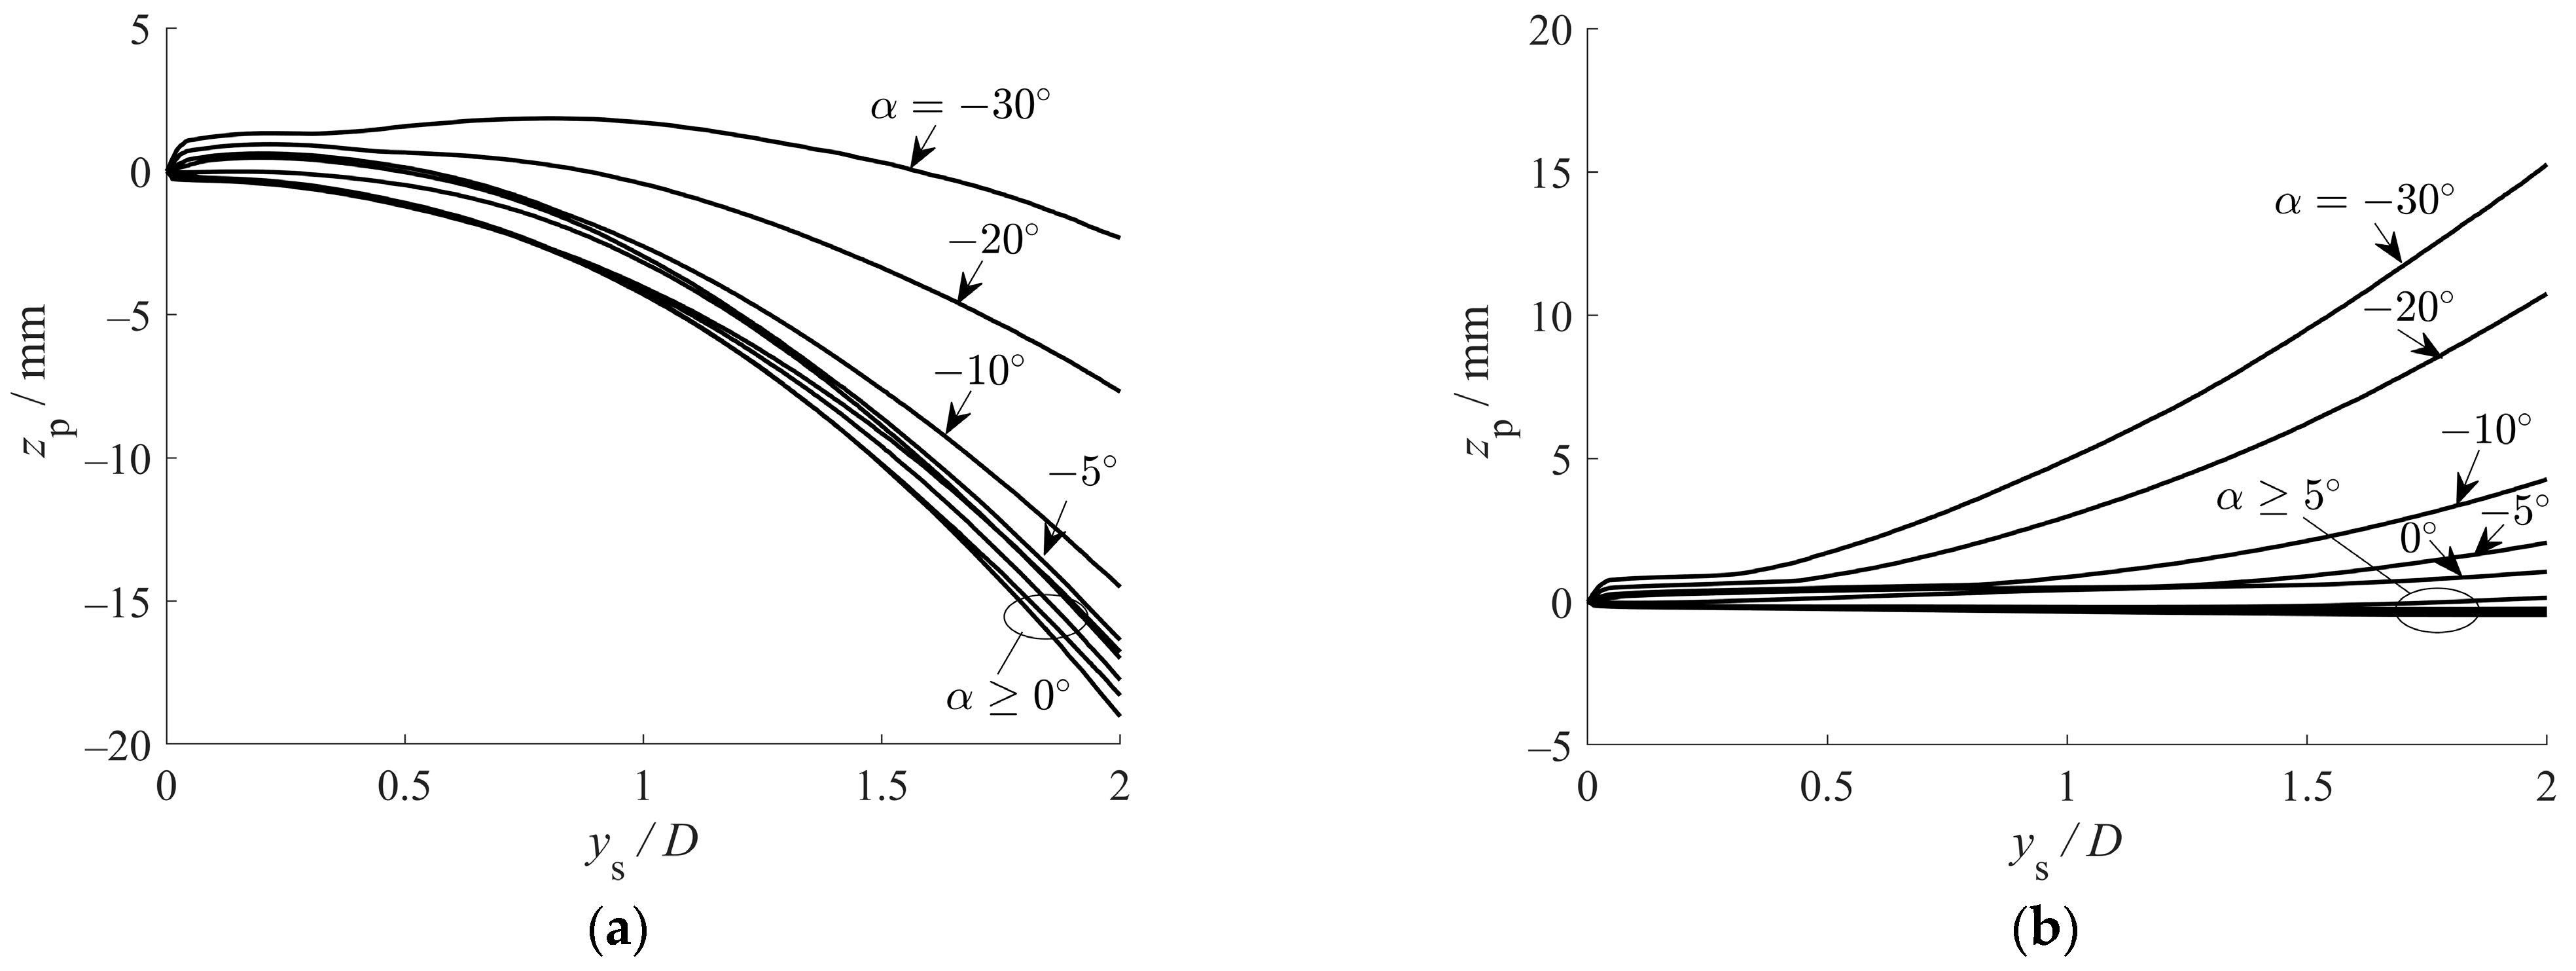
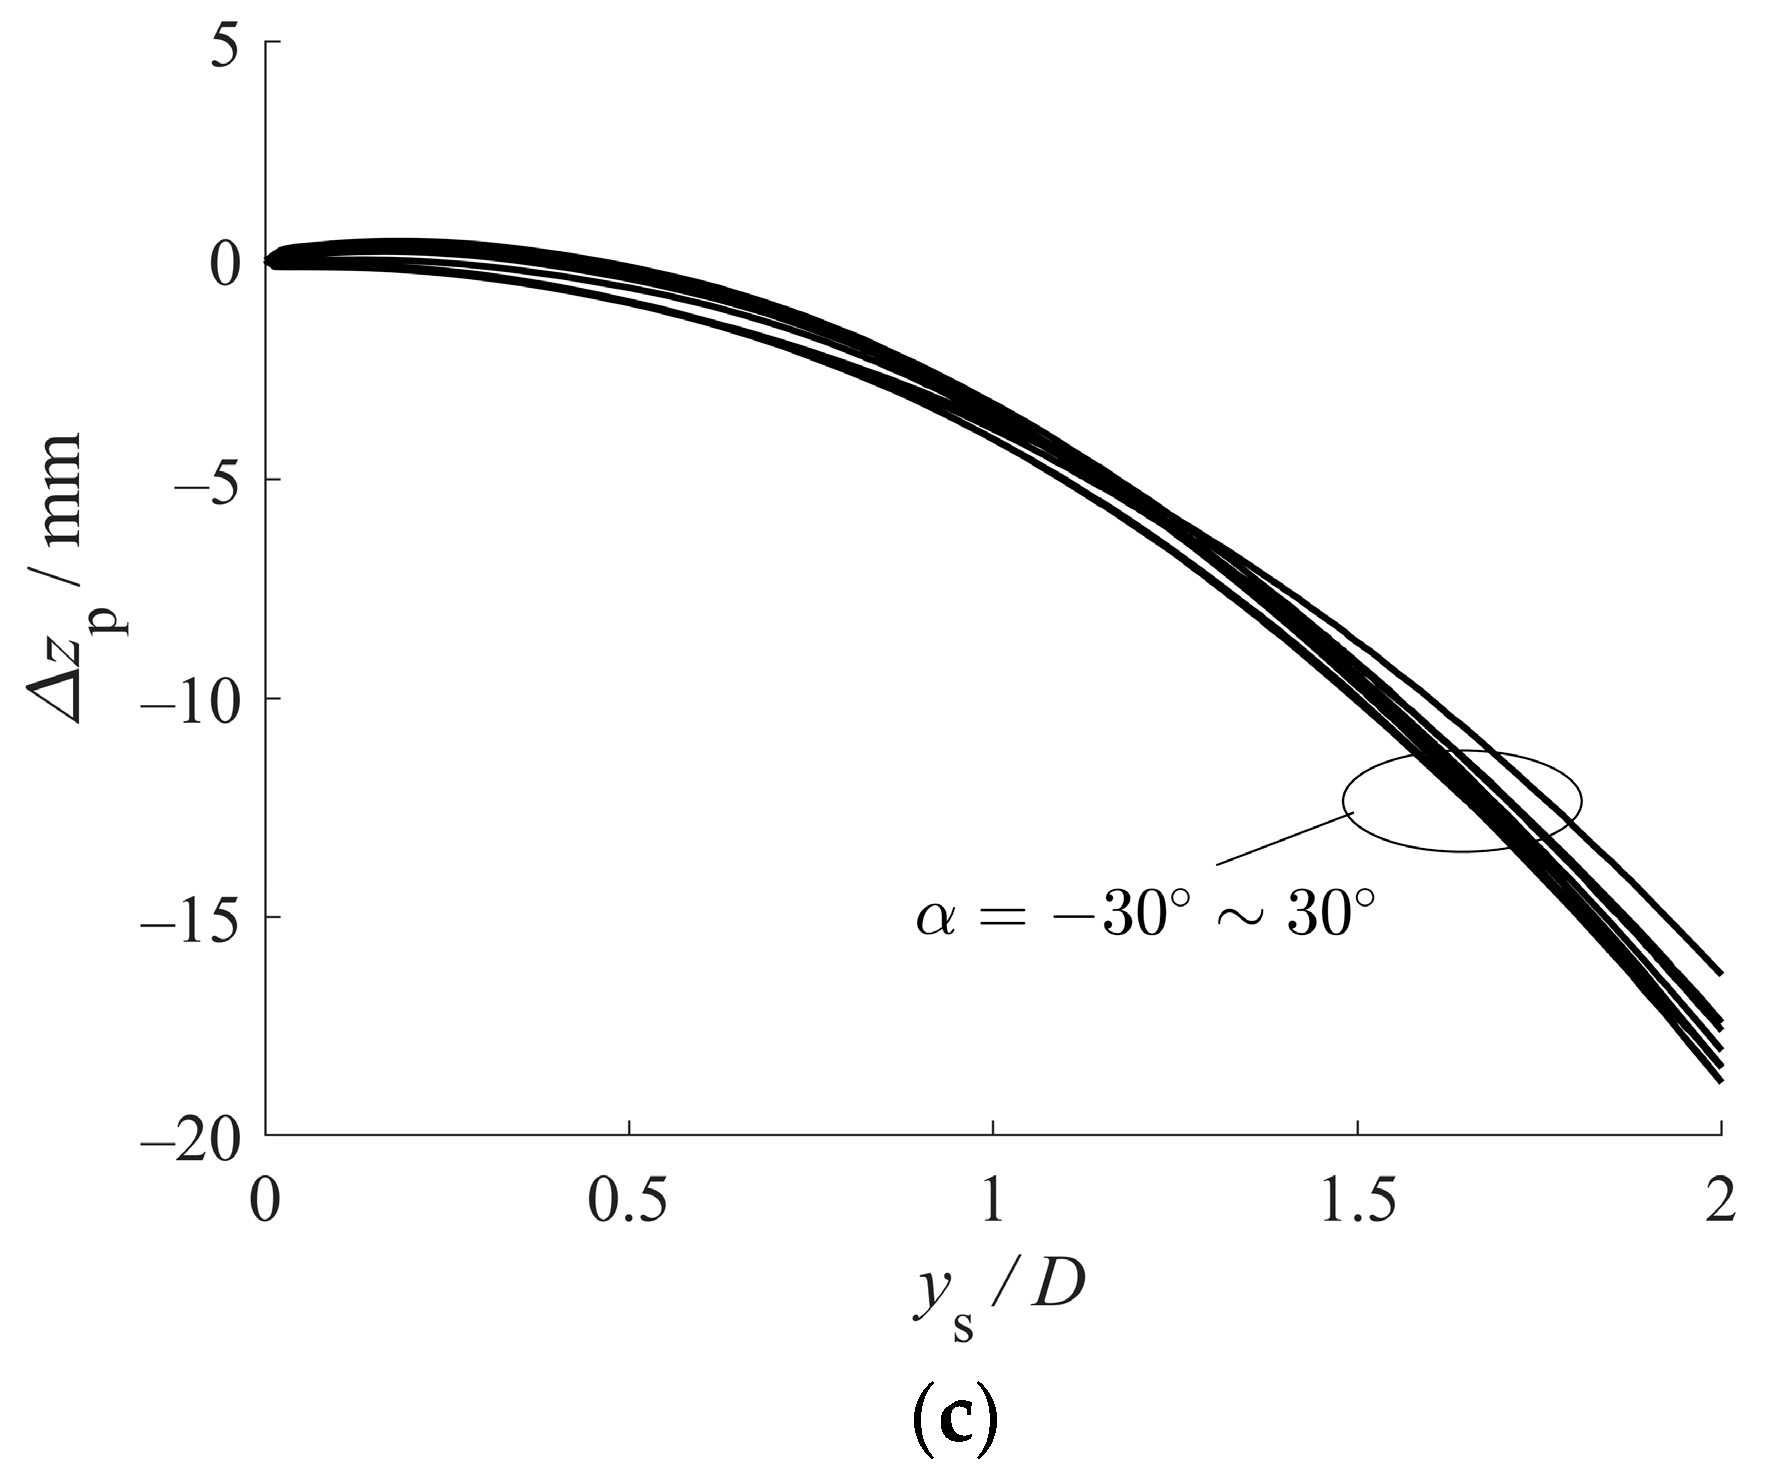
Comparative analysis of pile displacement under varying sliding angles ( α ) reveals similar patterns but significant differences in z p magnitude, as shown in Figure 7. For positive α values, substantial downward head displacements occur with minimal tip movement due to constraint from the underlying rock layer, showing little α -dependence. In contrast, negative α values ( 0 ° to 30 ° ) significantly influence z p , increasing upward tip displacement while reducing downward head displacement, with evolutionary paths diverging markedly from positive α cases. At α = 30 ° , z p at the pile head initially increases upward due to soil displacement, then reverses after y s D toward downward movement due to pile kinematic effects, confirming that soil displacement-driven and kinematics-driven mechanisms operate at different loading stages. Figure 7c presents the difference in z p between the pile head and tip ( Δ z p ), which reflects the relative axial displacement induced within the pile due to flexural deformation. The minimal variation observed across all sliding angles ( α ) suggests that the intensity of kinematically induced axial displacement is largely independent of the value of α .

2.4. p-y and t-z Curves

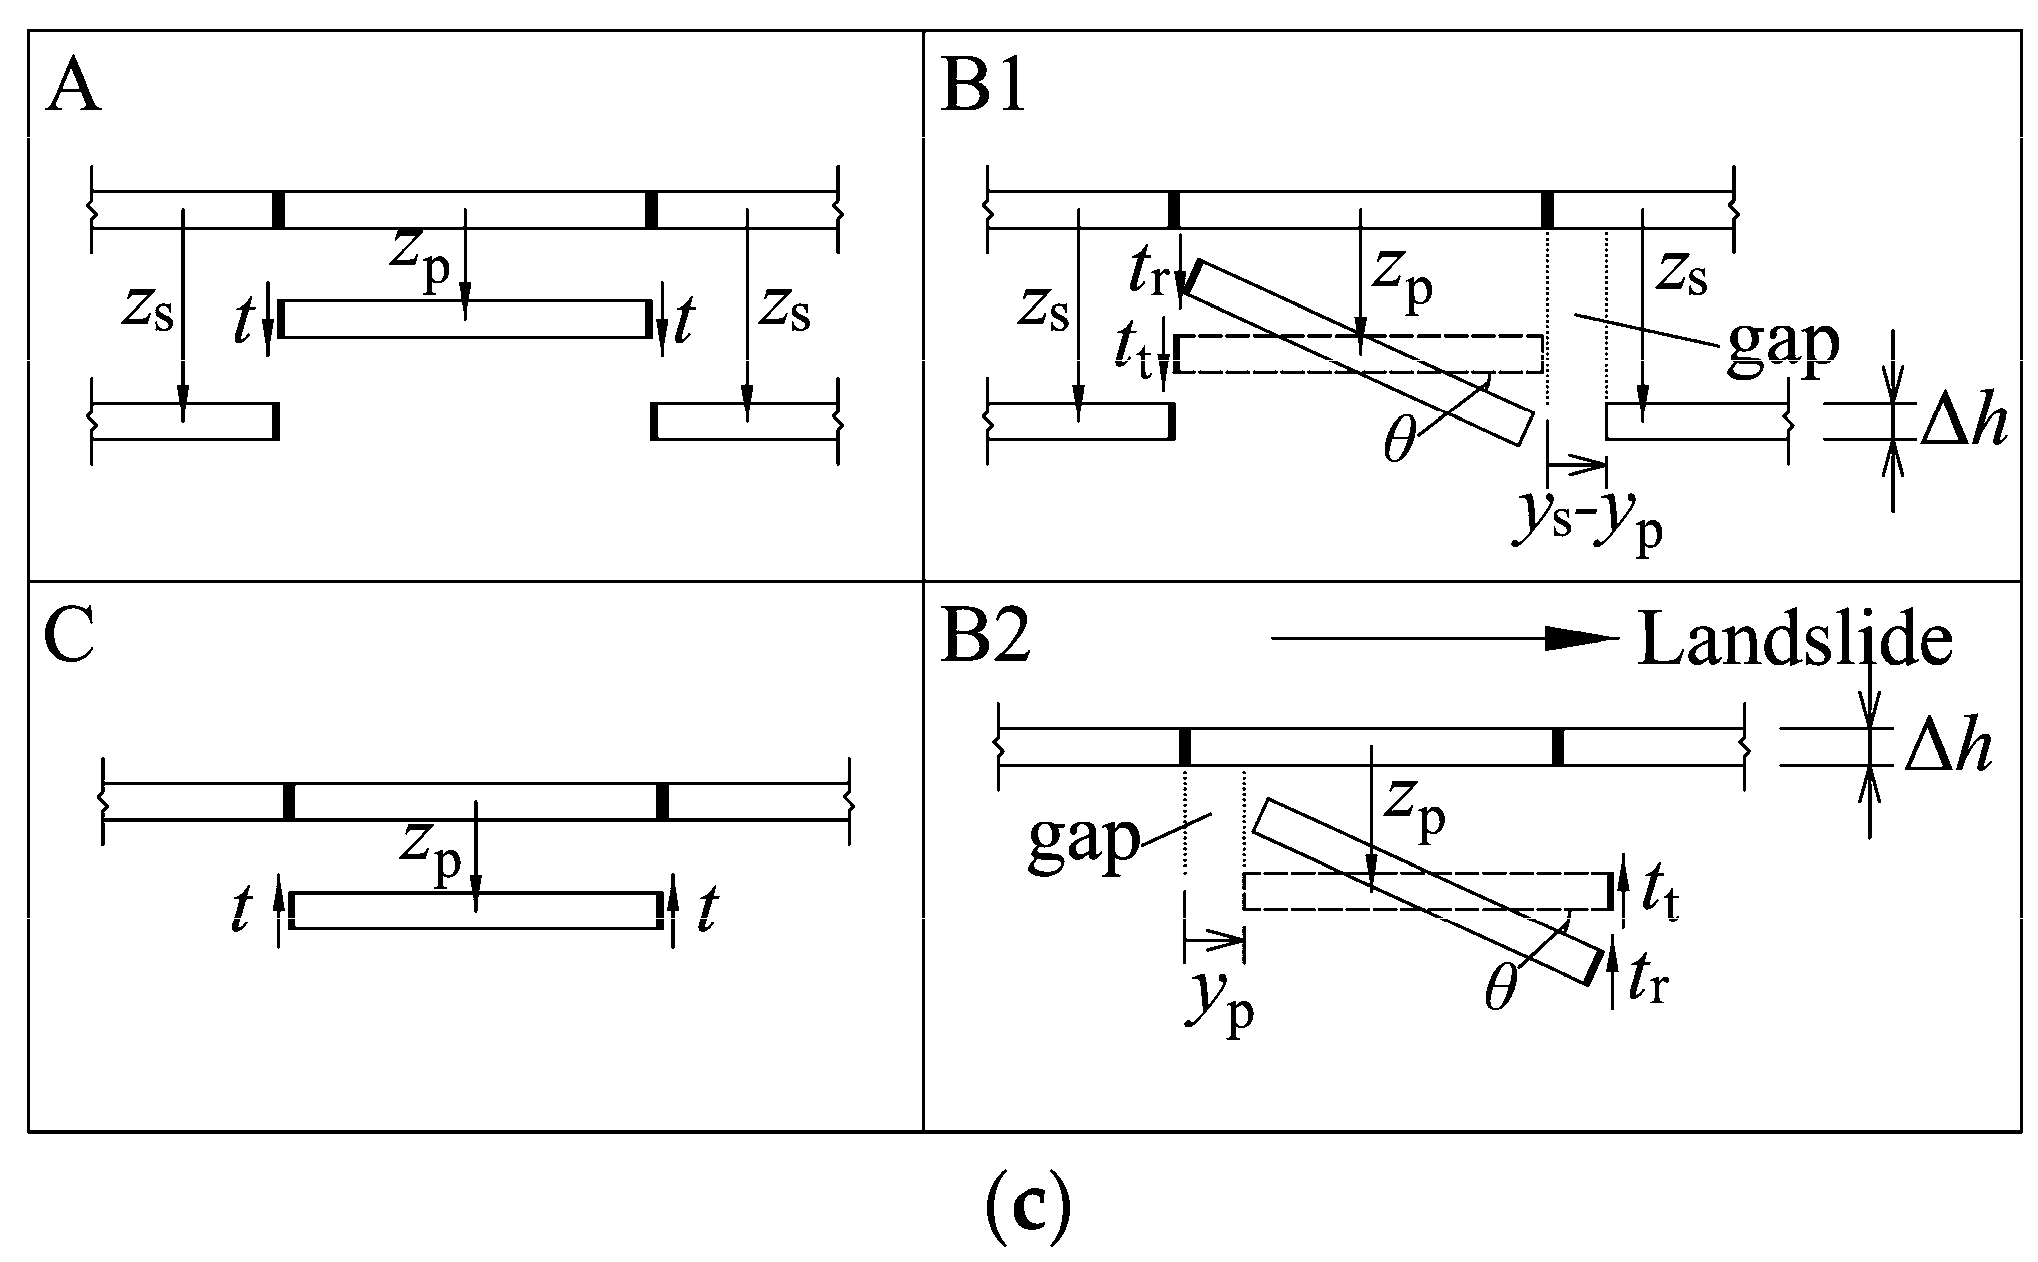
To characterize p-y and t-z relationships, the micropile is divided into three segments (A, B, and C in Figure 6) based on θ and z p distribution patterns, with Segment B further subdivided into B1 and B2 by the slip surface. In Segments A and C, where θ remains minimal, the axial friction force (t) consistently opposes the relative axial pile-soil displacement (Figure 8), producing a progressive axial force accumulation (tension for α 5 ° and compression for α > 5 ° ) toward the slip surface (Figure 3). In contrast, Segment B exhibits distinct mechanics: (1) large lateral displacements induce partial pile-soil separation, reducing axial friction resistance—specifically, on the down-sliding side of the pile in subsegment B1 and the up-sliding side in subsegment B2; (2) significant cross-sectional rotation complicates predictions of axial friction magnitude and direction, necessitating decomposition into translational ( t t ) and rotational ( t r ) components. While t t aligns directionally with Segments A and C (with subsegments B1 and B2 mirroring A and C, respectively), the direction of t r depends on α : it acts opposite to t t under upward soil movement ( α 0 ° ) and small downward movement ( 0 ° < α 5 ° ), but aligned with t t under more pronounced downward movement ( α > 5 ° ). This behavior reflects the complex interplay between soil displacement direction and pile kinematics.
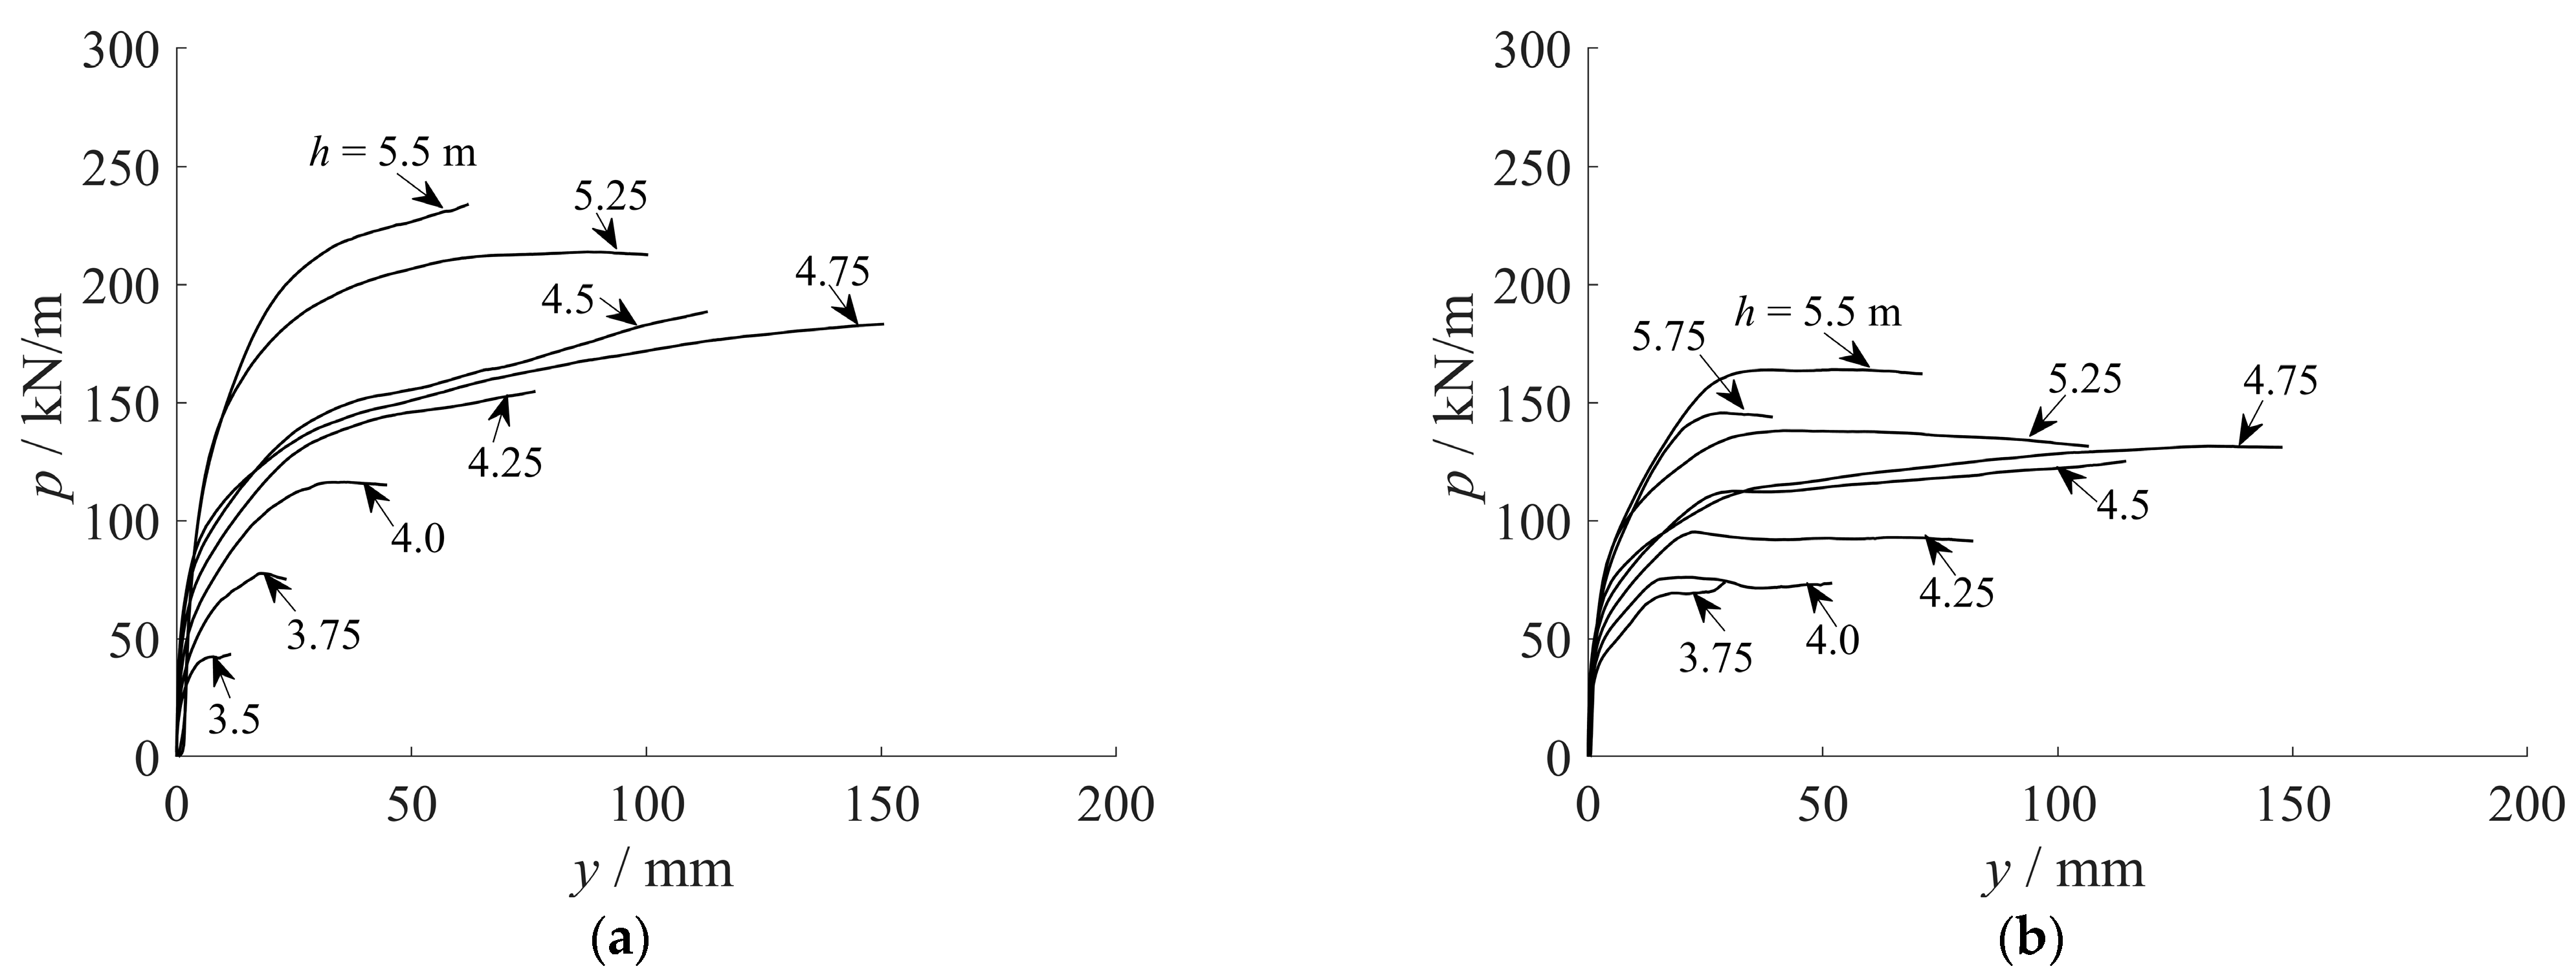
Based on the preceding analysis, complete p-y curves should be established in Segment B, where extensive lateral pile–soil interactions occur. Figure 9 presents representative p-y curves derived from scenarios with α = 10 ° and α = 10 ° . Similar curves at corresponding depths were obtained across other simulations, as will be further illustrated in the parameter calibration section.
As for the t-z curves, they can be identified at depths where the mobilization process is straightforward and monotonic—namely, in Segments A and C, as established in the preceding analysis. Given the characteristic hardening behavior typically exhibited by t-z curves, representative curves at selected depths (see Figure 10, which presents t-z curves for α = 20 ° and α = 0 ° ; similar curves are obtained in other simulations) are adopted for subsequent modeling and parameter calibration. This selective approach ensures the derived parameters accurately reflect the micopile’s load-transfer behavior while excluding regions (Segment B) where complex rotation-induced mechanisms dominate the soil-pile interaction.

3. Soil Resistance Models and Parameters

The preceding analysis demonstrates that micropiles undergo substantial lateral and axial relative pile-soil displacements and pronounced cross-sectional rotations under the action of soil movements. These relative deformations mobilize corresponding soil resistance components that critically influence pile behavior. This section presents the mathematical modeling framework for these soil resistances and describes the parameter calibration methodology based on FE simulation results.

3.1. p-y Model and Parameter Calibration

Nonlinear p-y relationships have been successfully employed in one-dimensional beam theory analyses (following the Winkler approach) to predict pile responses under both lateral loads [25,26,27] and lateral soil movements [4]. While sophisticated p-y models have been developed to enhance prediction accuracy for monopile foundations [26,27], the hyperbolic model has demonstrated effectiveness for slope-stabilizing piles despite its relative simplicity [4,21]. The hyperbolic p-y model is expressed as:
p = y 1 k p i n i + y p u
where y = y p y s represents the relative lateral displacement between the pile and surrounding soil; y p and y s denote the lateral displacements of the pile and soil, respectively; k p i n i is the initial stiffness of the p-y curve; and p u represents the ultimate lateral soil resistance. The corresponding tangent stiffness is given by:
d p d y = 1 / k p i n i 1 k p i n i + y p u 2
A calibration procedure was implemented to determine the distributions of the initial stiffness k p i n i and the ultimate lateral resistance p u based on numerical simulation results. Optimal parameters were identified by minimizing the standard deviation between the fitted hyperbolic p-y curves and the p-y data obtained from finite element (FE) simulations (Figure 9), within reasonable parameter ranges [4]. The resulting parameter distributions for all FE cases are presented in Figure 11.
The calibrated values of k p i n i exhibit no clear trend with depth or sliding angle α . Furthermore, the calibration process revealed that, within a plausible range, k p i n i has considerably less influence on p-y curve predictions compared to p u . Therefore, a uniform distribution of k p i n i with depth was adopted, using the mean value of all calibrated results for subsequent analyses.
In contrast, the calibrated values of p u show strong dependence on both depth and α . Data were obtained between depths of 3.5 m and 5.75 m—a zone (i.e., Segment B) dominated by substantial lateral pile–soil interaction—where p u increases approximately linearly with depth. Outside this interval, where direct calibration was not feasible, values were extrapolated: above 3.5 m, p u was set uniformly equal to the value at 3.5 m; below 5.75 m, the linear increasing trend was continued. Additionally, p u exhibits a clear decreasing trend as α varies from 30 ° to 30 ° . This behavior accounts for the previously noted reduction in shear force Q under large positive α values. Consequently, the uniform-linear model for p u was applied separately for each value of α to accurately represent its dependence on the sliding angle.

3.2. t-z and Anti-Rotation Models

t-z curves, used for response calculation of vertically loaded piles, can be developed through either empirical methods based on experimental data [15,28] or theoretical approaches based on plane strain analysis of horizontal soil layers [16,29,30], where the former offers practical simplicity while the latter explicitly accounts for soil deformation parameters, strength characteristics, and their spatial variations. This study employs a hyperbolic t-z model due to its demonstrated effectiveness in capturing nonlinear soil-pile interaction through physically meaningful parameters, expressed as:
t = z 1 k t i n i + z t u
where z = z p z s represents the axial relative pile-soil displacement; z p and z s  denote the axial displacements of the pile and surrounding soil, respectively; k t i n i is the initial tangent stiffness of the t-z curve; and t u corresponds to the ultimate axial friction resistance. The corresponding tangent stiffness is given by:
d t d z = 1 / k t i n i 1 k t i n i + z t u 2
Equation (4) characterizes the fundamental load-transfer relationship between axial shaft friction (t) and relative axial pile-soil displacement (z) at any differential element of the pile-soil interface. For Segments A and C, where the pile cross-section undergoes predominantly translational movement, the integrated resistance-displacement relationship over a finite pile segment of thickness Δ h can be expressed as:
T z = Δ h 0 2 π r t d φ = 2 π r t · Δ h
where r denotes the pile radius, and φ represents the polar angle of a differential pile-soil interface element in the cylindrical coordinate system.
For Segment B, as established in the preceding analysis, the mobilization of axial frictional resistance is governed by both translational and rotational movements of the cross-section, corresponding to the components t t and t r illustrated in Figure 8. Under conditions of pile–soil separation, shaft friction develops predominantly on the contact side of the pile. Assuming a separation zone extending over π radians (180°), the contribution of the translational component t t to the axial force over a finite pile segment of thickness Δ h can be expressed as:
T t z = Δ h 0 π r t d φ = π Δ h r t
while the axial force contribution from t r on Δ h is expressed as:
T r ( θ ) = r t u Δ h 0 π sin φ t u r θ k t i n i + sin φ d φ
The corresponding tangent stiffness is given by:
d T r d θ = t u 2 θ 2 k t i n i Δ h 0 π sin φ t u r θ k t i n i + sin φ 2 d φ
The anti-rotation model characterizes the moment resistance offered by the surrounding soil in response to pile cross-section rotation. The resultant resisting moment ( M r ) is calculated through the integration of friction-induced moments about the cross-section’s rotational axis. For Segment B,
M r ( θ ) = r 2 t u 0 π sin 2 φ t u r θ k t i n i + sin φ d φ
The corresponding tangent stiffness is given by:
d M r d θ = r t u 2 θ 2 k t i n i 0 π sin φ 2 t u r θ k t i n i + sin φ 2 d φ
Since t in Segment B is conceptually decomposed into translational and rotational components t t and t r , the translational component t t also contributes to a moment resistance M t as a result of pile–soil separation. This moment can be calculated using the following expression:
M t z = Δ h 0 π r 2 t sin φ d φ = 2 Δ h r 2 t
In Segments A and C, where cross-sectional rotations are negligible, the resulting moment resistance remains minimal. Since these segments maintain full pile-soil contact (without interface separation), the resistance contributions can be estimated as twice the values computed from Equation (10).
The model’s predictive capability is fully established once the t-z parameters are calibrated, enabling simultaneous determination of axial shaft friction and moment resistance.

3.3. Parameter Calibration for the t-z Model

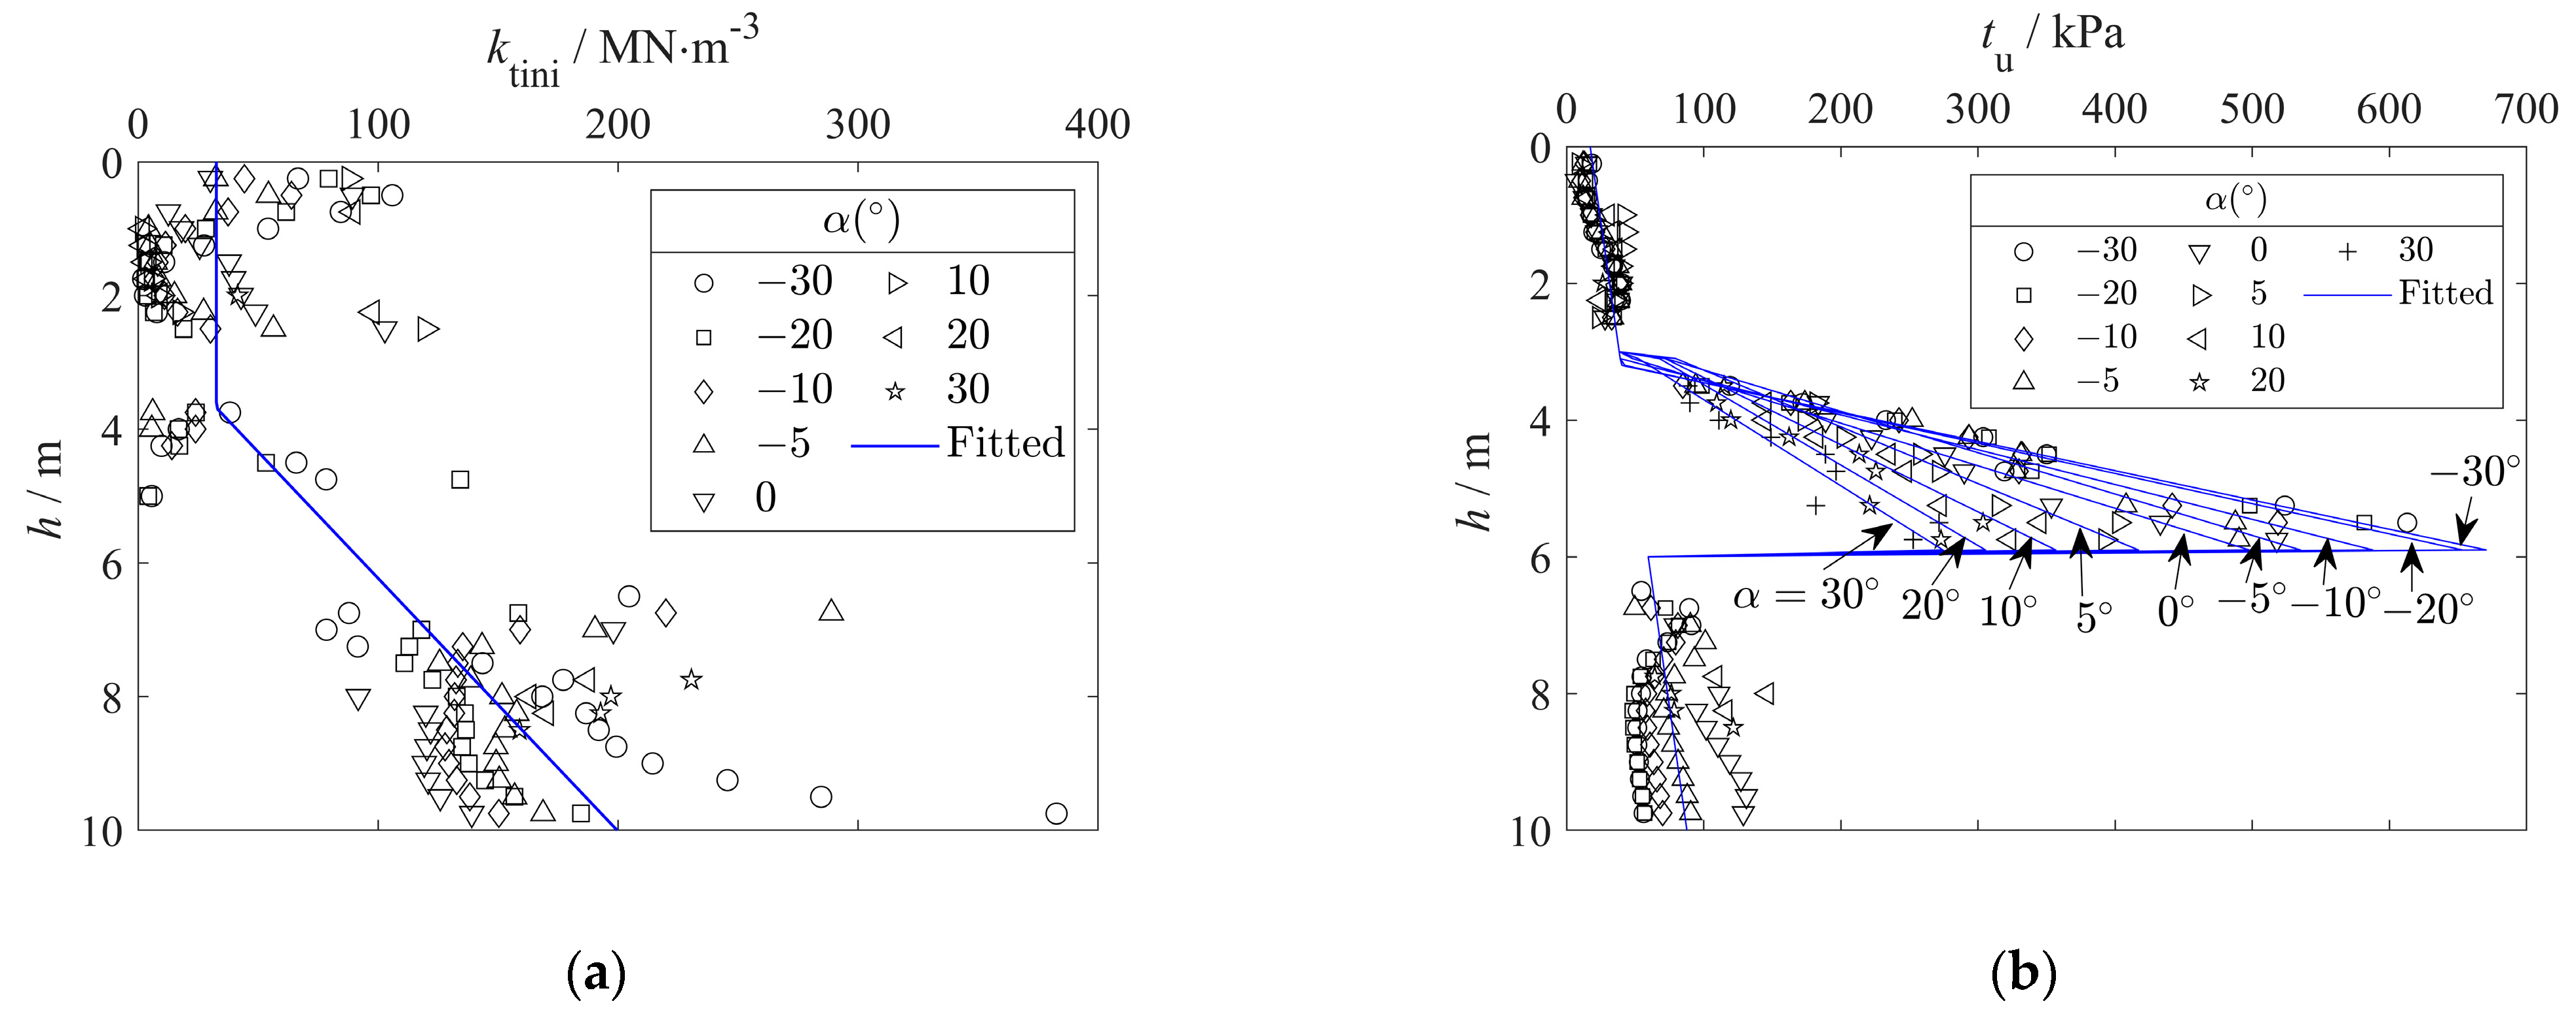
A calibration procedure analogous to that used for the p-y parameters was employed to determine the distributions of the initial axial stiffness k t i n i and the ultimate shaft resistance t u from the t-z curves derived from FE simulations (Figure 10). The resulting values are presented as scattered data points in Figure 12, which are predominantly located in the pile head and tip regions (Segments A and C)—areas where relative pile–soil displacement occurs primarily in the axial direction, and lateral interactions are negligible.
For k t i n i , several data points were also obtained in subsegment B1 from simulations with α < 0 ° , where larger relative axial displacements helped prevent oscillations in the t-z curves. The distribution of k t i n i shows no strong correlation with depth, except in Segment C (depths between 6.5 m and 10 m), where a clear increasing trend with depth is observed. Accordingly, a bilinear fitting model was adopted: a constant value in the upper depth range and a linearly increasing function with depth in Segment C.
Regarding t u , a linearly increasing trend with depth is observed in Segments A and C, reflecting the influence of confining stress. Previous analyses of axial force (Figure 4d) have demonstrated a significant enhancement in axial friction resistance due to lateral pile–soil interaction. Therefore, for Segment B, values of t u were derived using the ultimate lateral soil resistance p u , accounting for soil–pile separation by assuming p u acts uniformly over the contact side of the pile ( t u = 2 p u · μ / π D ). The complete distribution of t u was then represented using a piecewise linear fit, as illustrated by the solid lines in Figure 12b.

4. Beam-Spring Finite Element Method (BSFEM)

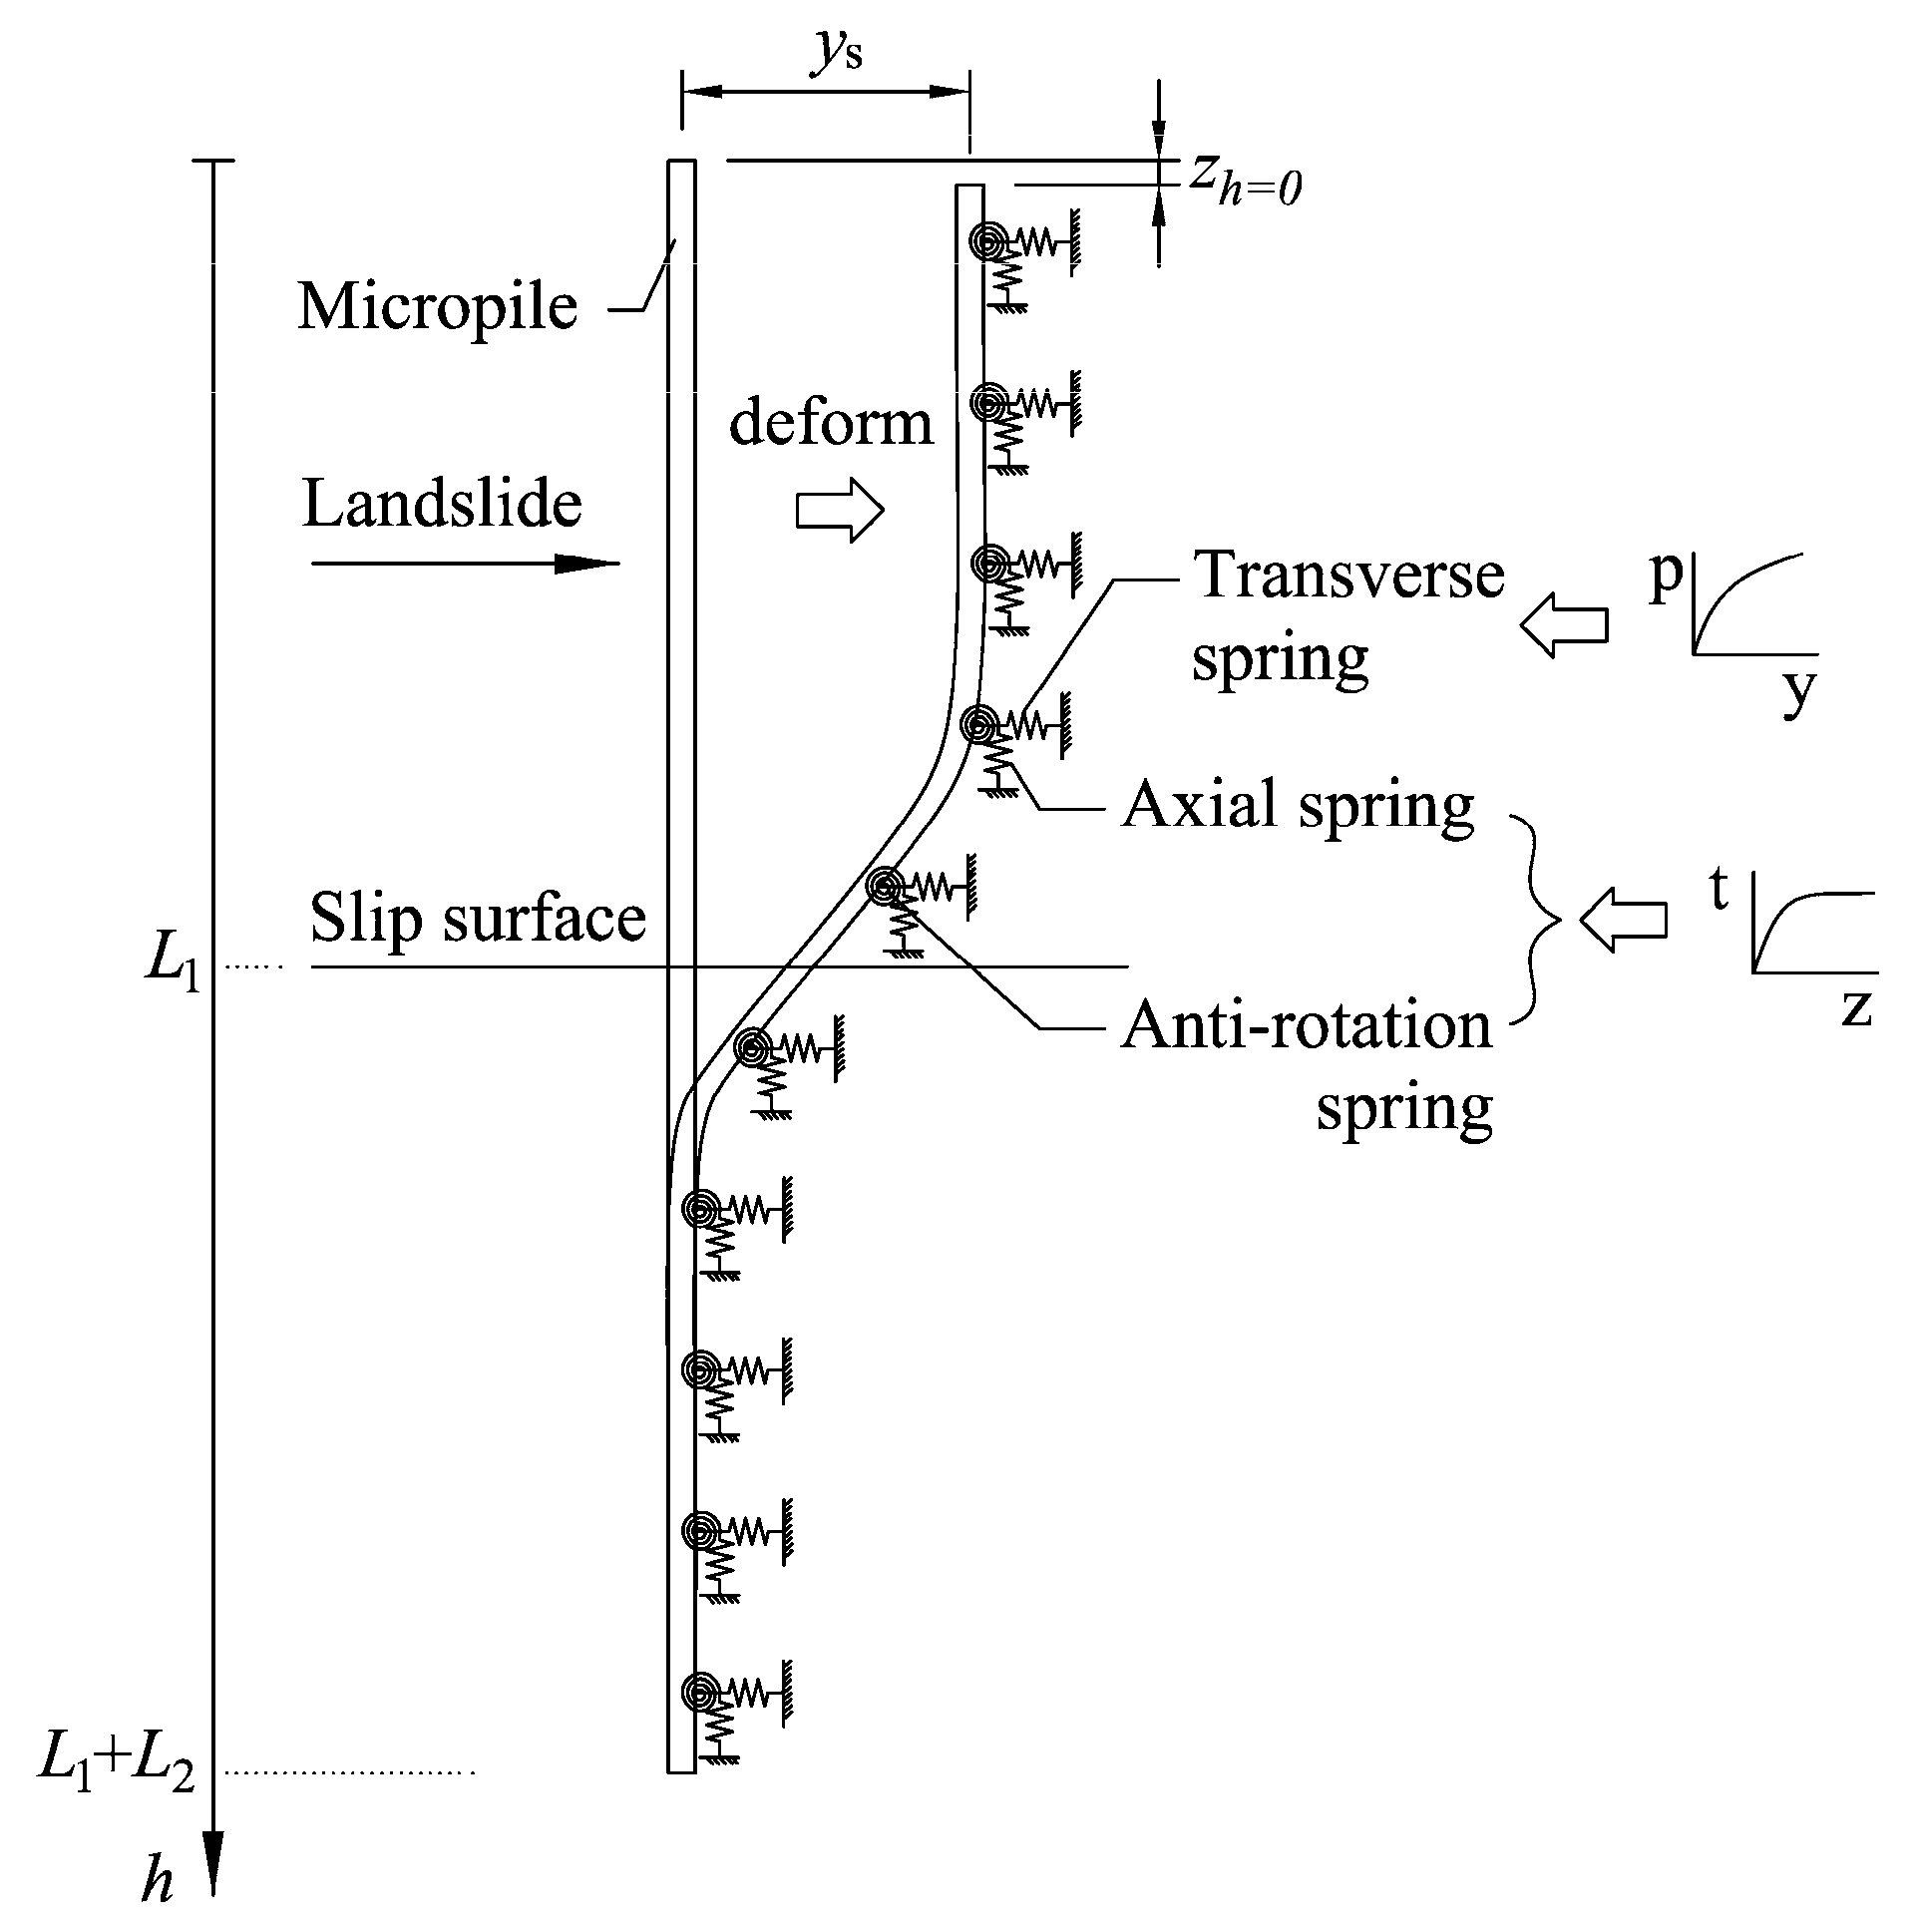
For laterally loaded piles under combined loading conditions, the P Δ effect [26]—accounting for axial force influences on lateral deformation—must be considered. While conventional piles develop axial forces primarily through vertical external loads (with minimal variations due to small lateral displacements), anti-slide micropiles exhibit fundamentally different behavior. Although not subjected to external axial loads, these micropiles develop significant axial forces due to kinematically induced displacements. To properly capture this effect, the Beam-Spring Finite Element Method (BSFEM) incorporates both geometric and material nonlinearities, implementing both the derived p-y and t-z relationships as nonlinear soil springs (transverse, axial, and anti-rotation) at all nodal points, as illustrated in Figure 13.

4.1. Geometric Nonlinear Finite Element Formulation

The beam finite element analysis in this study employs an updated Lagrangian formulation to account for geometric nonlinearity. At each incremental step, equilibrium equations are formulated based on the deformed configuration from the previous step:
K t Δ U = Δ P
where Δ P is the nodal load increment vector, Δ U the nodal displacement increment vector, and K t the tangent stiffness matrix, defined as:
K t = K E + K G
where K E denotes the elastic stiffness matrix (dependent on material properties), while K G represents the geometric stiffness matrix, which captures stiffness variations induced by large deformations.
Based on the Euler-Bernoulli beam bending theory, the elastic stiffness matrix K E for a two-node beam element using Hermitian shape functions is given by:
K E = E A l 0 0 E A l 0 0 0 12 E I l 3 6 E I l 2 0 12 E I l 3 6 E I l 2 0 6 E I l 2 4 E I l 0 6 E I l 2 2 E I l E A l 0 0 E A l 0 0 0 12 E I l 3 6 E I l 2 0 12 E I l 3 6 E I l 2 0 6 E I l 2 2 E I l 0 6 E I l 2 4 E I l
where l is the element length, EI the bending stiffness, and EA the axial stiffness. Material nonlinearity during pile bending [21] is incorporated by updating EI according to the current bending moment at each incremental step.
Based on simplified strain energy formulation, the element geometric stiffness matrix [31] is expressed as:
K G = P l 1 0 0 1 0 0 0 6 5 l 10 0 6 5 l 10 0 l 10 2 l 2 15 0 l 10 l 2 30 1 0 0 1 0 0 0 6 5 l 10 0 6 5 l 10 0 l 10 l 2 30 0 l 10 2 l 2 15
where P represents the axial force in the element. This formulation explicitly accounts for the influence of axial forces on the element’s bending behavior.

4.2. Beam-Spring Finite Element Calculation Driven by Soil Displacements

The BSFEM adopts a displacement-driven approach similar to Abaqus simulations, where displacement boundary conditions were imposed to represent landslide processes. The nodal load increment vector ( Δ P ) in Equation (13) is expressed through soil-pile interaction as:
Δ P = K s p Δ S Δ U
where Δ S is the nodal soil displacement increment vector, and K s p the tangent stiffness matrix of the soil springs. At the element level, these quantities can be expressed as:
Δ U = Δ y p 1       Δ z p 1       Δ θ 1       Δ y p 2       Δ z p 2       Δ θ 2 T
Δ S = Δ y s 1       Δ z s 1       0       Δ y s 2       Δ z s 2       0 T
K s p = l 2 k p y 1 0 0 0 0 0 0 π D k t z 1 0 0 0 0 0 0 2 d M t d θ 1 0 0 0 0 0 0 k p y 2 0 0 0 0 0 0 π D k t z 2 0 0 0 0 0 0 2 d M t d θ 2
K s p = l 2 k p y 1 0 0 0 0 0 0 1 2 π D k t z 1 ( a ) d F t d θ 1 0 0 0 0 a 1 2 D 2 k t z 1 d M t d θ 1 0 0 0 0 0 0 k p y 2 0 0 0 0 0 0 1 2 π D k t z 2 ( a ) d F t d θ 2 0 0 0 0 a 1 2 D 2 k t z 2 d M t d θ 2
where the subscripts 1 and 2 correspond to local node numbers within each finite element;   k p y     a n d     k t z represent the tangent stiffness of the transverse and axial soil springs, respectively. Equations (20) and (21) are applied to Segments A/C and Segment B, respectively. The parameter a = 1 for subsegment B1 and a = 1 for subsegment B2, serving as a multiplier to account for the reversal in force or moment direction resulting from pile–soil separation on opposite sides of the pile. Note that the sign of a may need to be reversed if a different global coordinate system is adopted.
Based on Equation (17), the system equilibrium equation is transformed into:
K t + K s p Δ U = K s p Δ S
The numerical solution procedure follows these steps: First, the prescribed soil displacement history is discretized into sufficiently small increments. At each increment, Equation (22) is solved iteratively using the Newton-Raphson method to ensure equilibrium convergence. This incremental-iterative scheme ultimately provides the complete mechanical response of the micropile system under progressively increasing soil displacements.

5. Verifications

5.1. Verification Against Abaqus

The proposed Beam-Spring Finite Element Method (BSFEM) was verified against Abaqus simulations using the calibrated p-y and t-z parameters described in Section 3. Figure 14, Figure 15, Figure 16, Figure 17, Figure 18 and Figure 19 present comparative results of deformation profiles and internal force distributions between the two methods under varying lateral soil displacement ( y s ) conditions.

5.1.1. Lateral Pile Responses

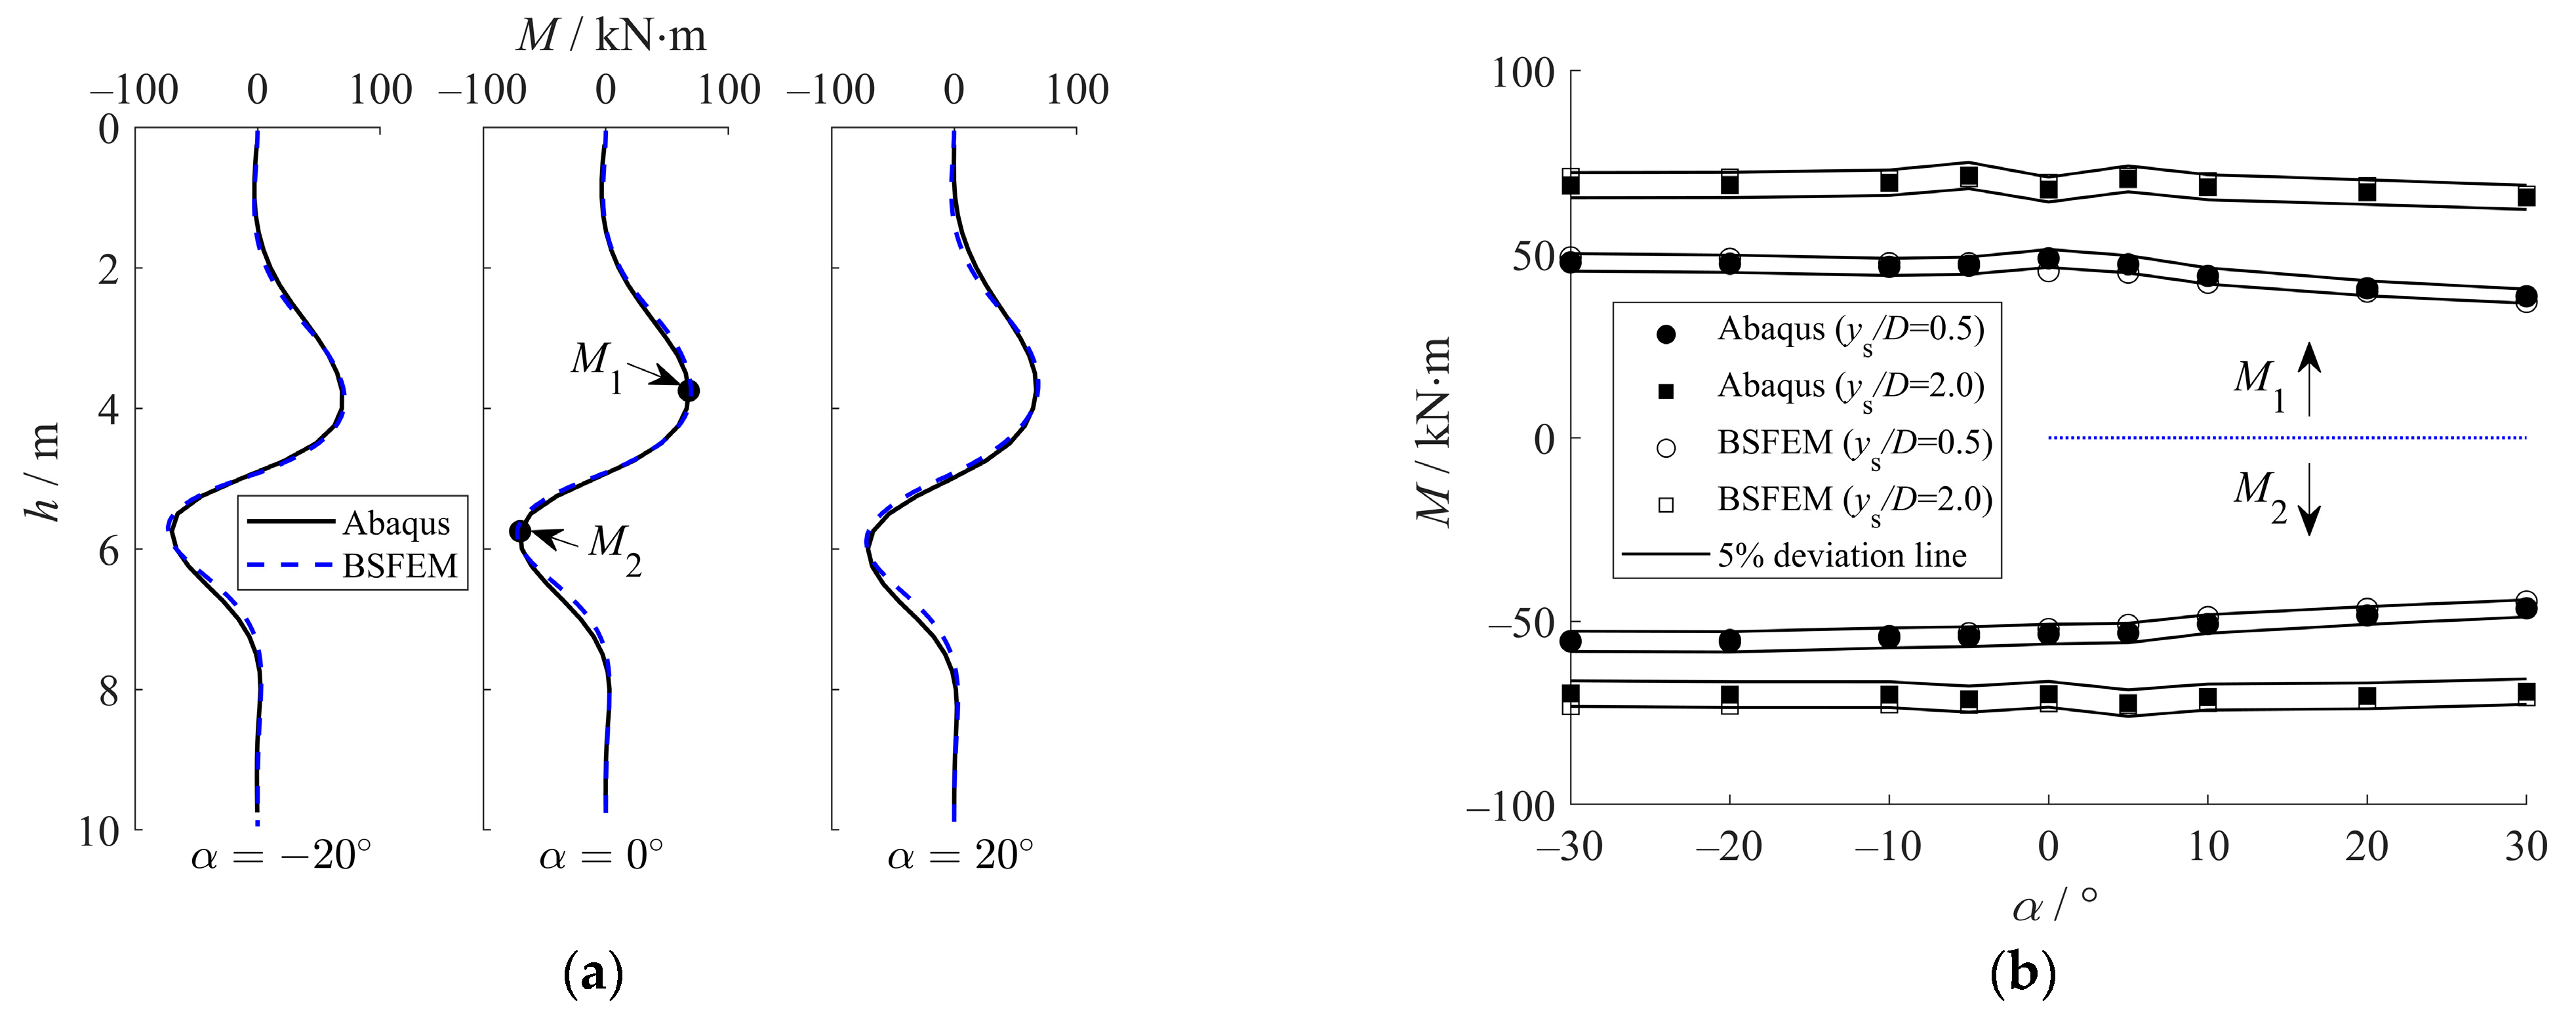
Figure 14 demonstrates that the proposed method accurately reproduces the bending moment distributions across all sliding angles ( α ). For conciseness, profiles for certain α values are omitted due to their similarity to those shown; this illustrative strategy is consistently applied throughout the results section. Figure 14b provides a quantitative comparison of the two bending moment peaks— M 1 above the slip surface and M 2 below—confirming close agreement with deviations within 5% for all α cases at both y s / D = 0.5 and y s / D = 2.0 .
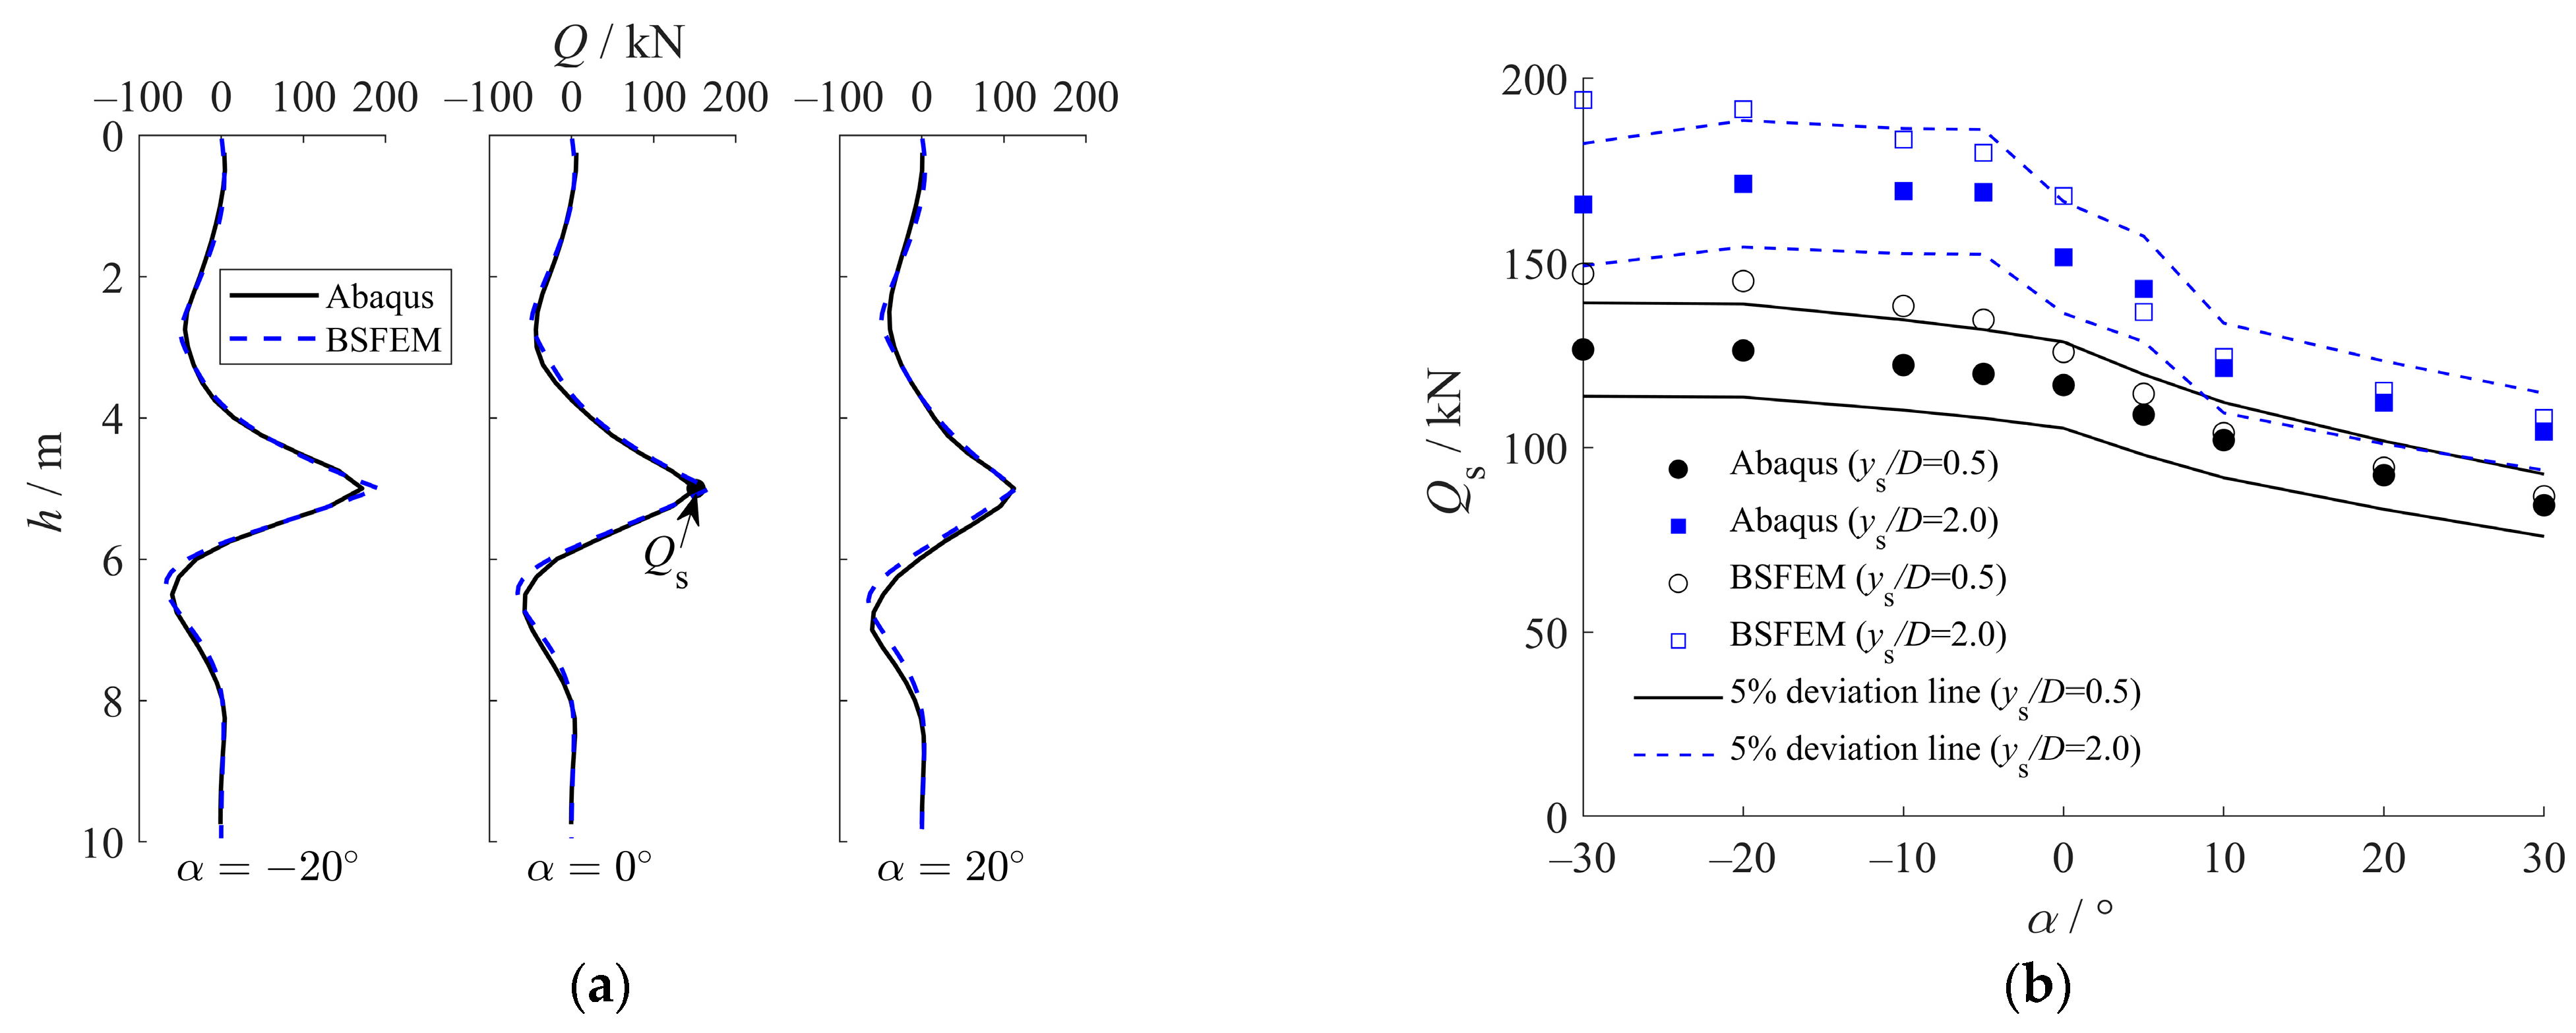
Figure 15 presents a comparison of shear force (Q) distributions, demonstrating good agreement between the proposed method and Abaqus simulations. Figure 15b specifically highlights the shear force at the slip surface ( Q s )—a critical parameter in practical design—under lateral soil displacements of y s / D = 0.5 and y s / D = 2.0 . The results show deviations within 5% for most sliding angles ( α ), with an average deviation of approximately 8%.
Figure 14. Comparison of bending moment obtained from Abaqus simulations and the proposed BSFEM. (a) M profile at y s / D   = 2.0 , (b) M 1 and M 2 .
Buildings 15 03498 g014
Figure 15. Comparison of shear force obtained from Abaqus simulations and the proposed BSFEM. (a) Q profile at y s / D   = 2.0 , (b) Q s .
Buildings 15 03498 g015
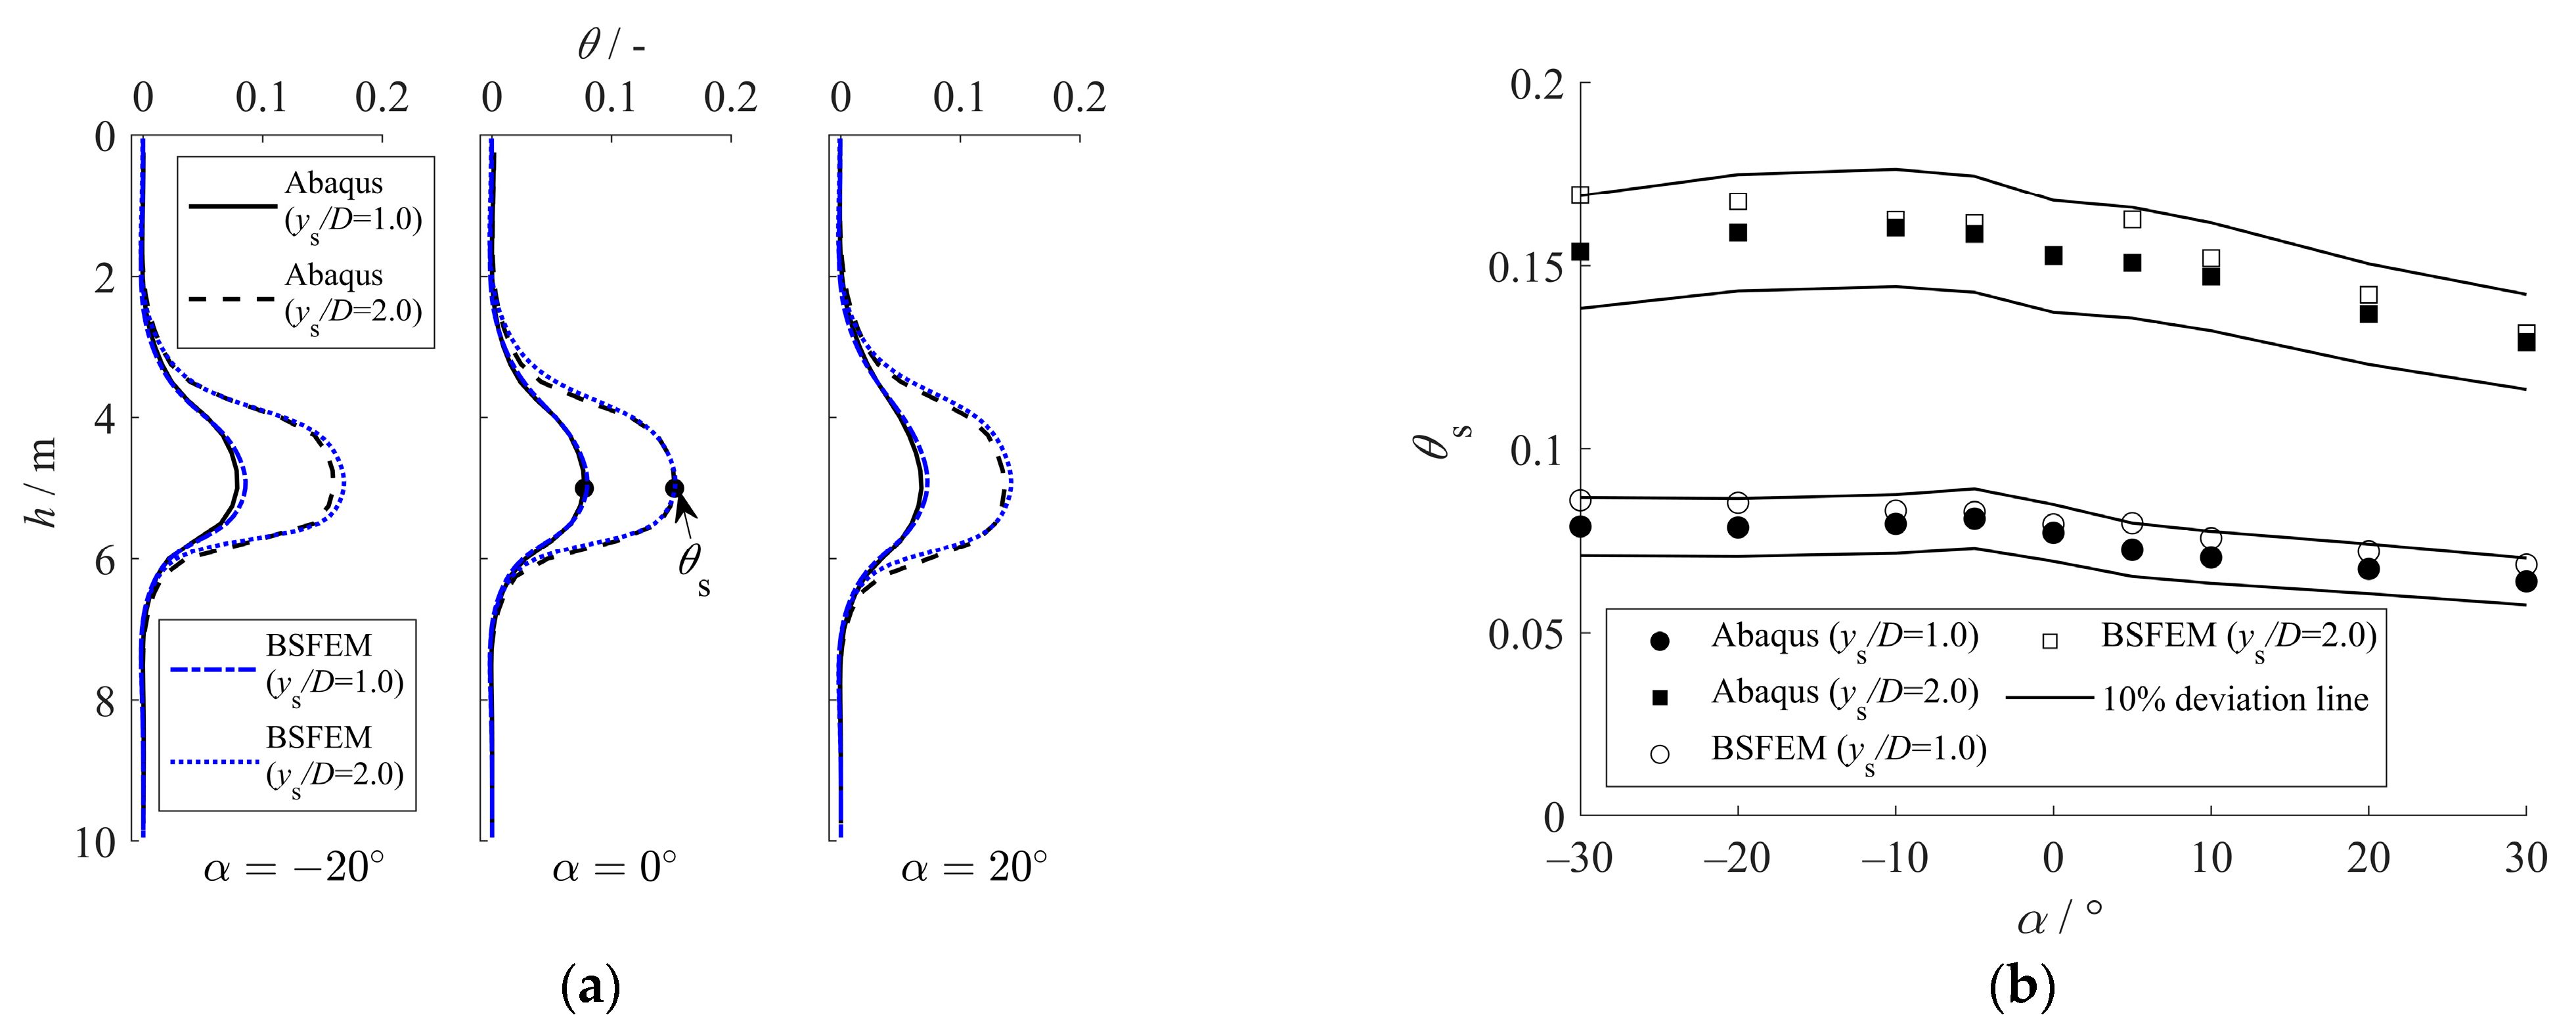
Figure 16 presents a comparison of cross-sectional rotation ( θ ) at y s / D = 1.0 and y s / D = 2.0 , showing good agreement between the proposed method and Abaqus simulations. Figure 16b focuses on the rotation at the slip surface ( θ s ), which corresponds to the maximum value. The deviations for all α cases are within 10%, with average deviations of approximately 7% at y s / D = 1.0 and 4% at y s / D = 2.0 .
Note that lateral pile displacement results are not shown, as good agreement is inherently expected: the embedded portion of the pile experiences minimal lateral movement, while the force-bearing segment displaces in conjunction with the sliding soil.
Figure 16. Comparison of pile cross-sectional rotation obtained from Abaqus simulations and the proposed BSFEM. (a) θ profiles at y s / D   = 1.0 and 2.0, (b) θ s .
Buildings 15 03498 g016

5.1.2. Axial Pile Responses

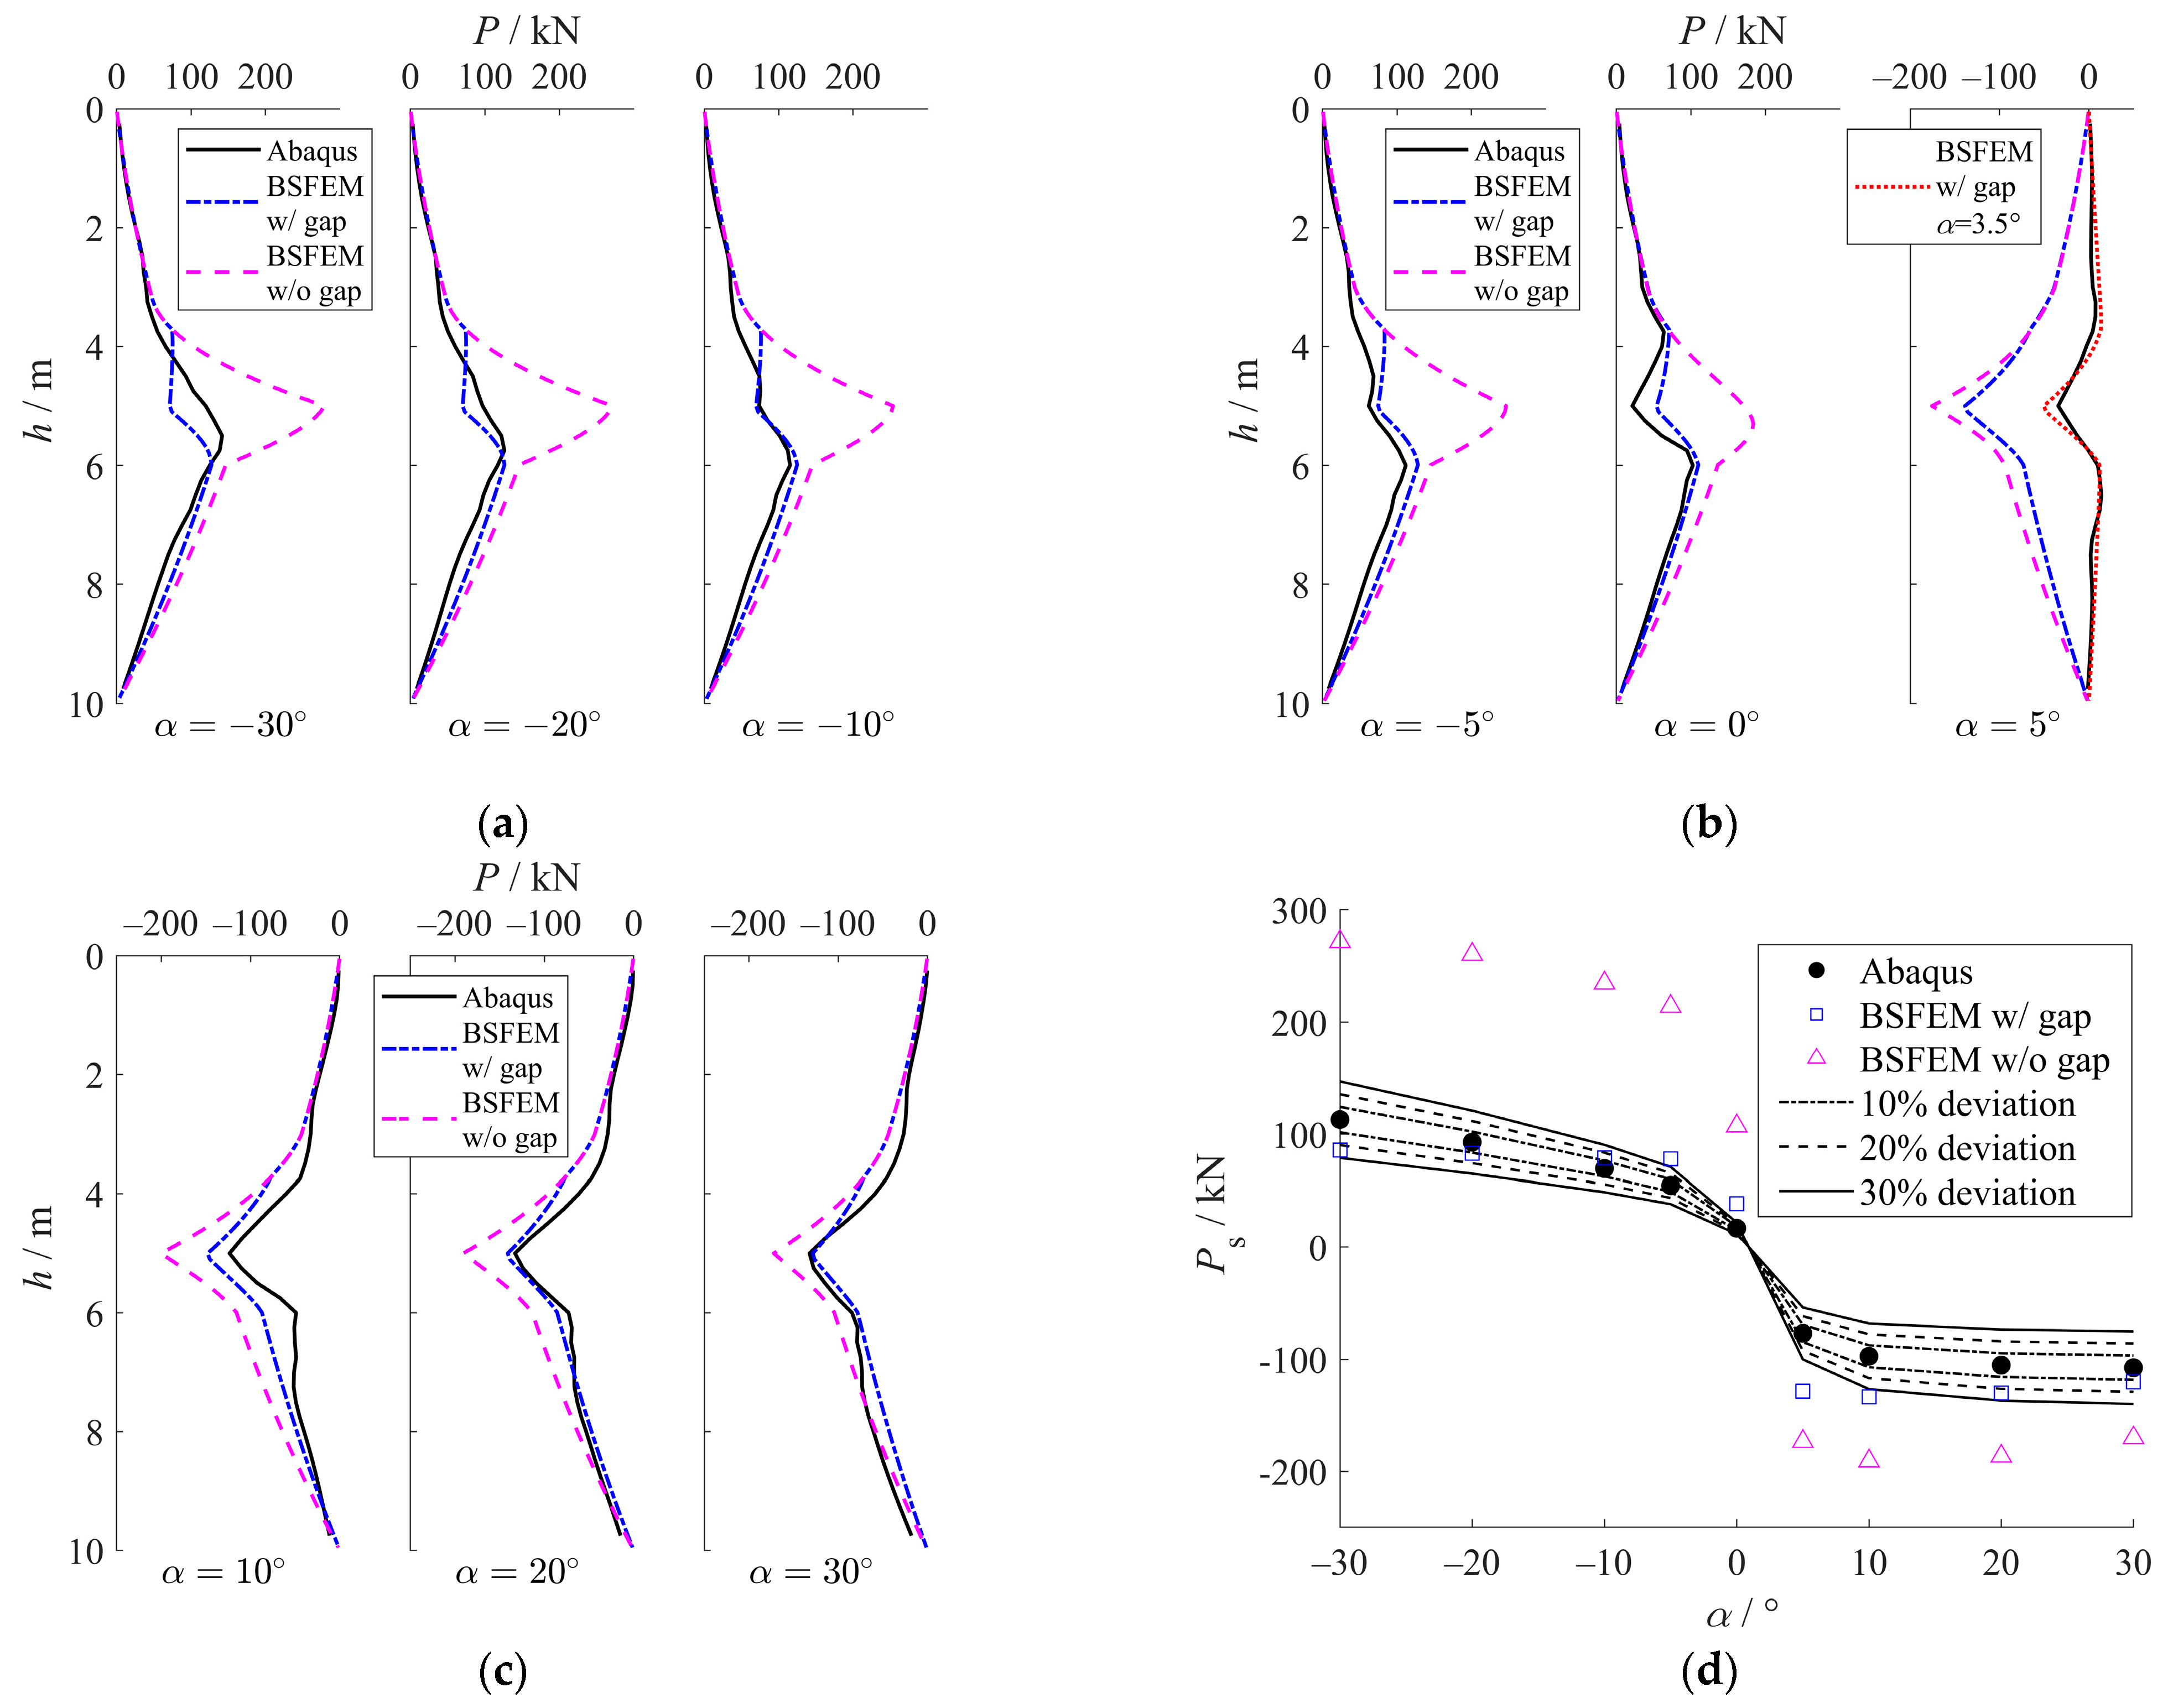
Figure 17 compares the axial force (P) profiles calculated by the BSFEM with those obtained from Abaqus simulations. To highlight the significance of accounting for soil–pile separation near the slip surface, a supplementary set of BSFEM calculations was conducted in which separation effects were omitted (denoted by “without gap” in the figure). The results clearly demonstrate that calculations incorporating separation agree more closely with Abaqus than those neglecting this mechanism. Therefore, only results with separation are considered in subsequent evaluations.
In general, the BSFEM demonstrates good agreement with Abaqus in predicting P profiles. However, a notable discrepancy is observed for the case where α = 5 ° . This arises because the axial force induced by axial soil displacement and the kinematically induced axial force nearly cancel each other in this scenario. As a result, the mobilization of axial friction is low, rendering the axial force highly sensitive to the initial axial spring stiffness k t i n i , which is challenging to calibrate precisely. To validate this interpretation, an additional simulation was performed with a modified sliding angle of α = 3.5 ° . The resulting P profile shows significantly improved agreement with the Abaqus results for α = 5 ° , supporting the explanation that force cancelation and parameter sensitivity are the primary causes of the discrepancy.
For quantitative comparison, the axial force at the slip surface ( P s ) is evaluated across all α scenarios: Figure 17d presents results for y s / D = 1.0 , and Figure 17e for y s / D = 2.0 . The deviations between BSFEM calculations and Abaqus simulations are largely within 30%, with many cases falling below 20%. These results also demonstrate a substantial improvement over models that neglect soil–pile separation (triangle data points).
Figure 17. Comparison of axial force results between Abaqus simulations and BSFEM calculations. (a) P profiles for α = 30 ° ~ 10 ° , (b) P profiles for α = 5 ° ~ 5 ° , (c) P profiles for α = 10 ° ~ 30 ° , (d) P s at y s / D = 1.0 , (e) P s at y s / D = 2.0 .
Buildings 15 03498 g017aBuildings 15 03498 g017b
Figure 18. Comparison of pile axial displacement results between Abaqus simulations and BSFEM calculations. (a) z p profiles for α = 30 ° ~ 10 ° , (b) z p profiles for α = 5 ° ~ 5 ° , (c) z p profiles for α = 10 ° ~ 30 ° , (d) Δ z p between pile head and tip.
Buildings 15 03498 g018
Figure 18 compares the axial pile displacement (zₚ) calculated by the BSFEM with Abaqus simulations under y s / D   = 1.0 and y s / D   = 2.0 . While general agreement is achieved, deviations occur for α = 20 ° and α = 30 ° , where the BSFEM does not fully capture the overall upward translational movement, particularly at y s / D   = 2.0 . This discrepancy may stem from simplifications inherent in the BSFEM framework. In these cases, axial force is nearly fully mobilized early in the loading process (Figure 4c), indicating an ultimate axial resistance state. In 3D Abaqus simulations, further interactions with the surrounding inclined soil or rock layers may induce additional upward displacement without increasing axial resistance—a mechanism not captured by the one-dimensional beam-spring model, where springs act independently. Given this limitation, a more meaningful comparison is achieved using the relative axial displacement due to lateral deformation, quantified as the difference between pile head and tip displacements ( Δ z p ), as shown in Figure 18d. The BSFEM predicts Δ z p generally well, with most results within a 20% deviation range at y s / D   = 2.0 , and many within approximately 10%.
Overall, the proposed BSFEM effectively captures the distribution and evolution of axial deformation and force induced by soil movements, despite certain limitations in representing full three-dimensional interactions under large upward displacement conditions.

5.1.3. Discussion

The Abaqus benchmark model simulates soil-pile separation by defining contacting interfaces. However, it should be noted that conventional finite element methods cannot simulate extreme soil deformations, including localized soil collapse around the pile or subsequent gap infilling processes. Consequently, the current modeling approach is particularly suitable for cohesive geomaterials. For cohesionless granular soils or cases involving post-separation gap infilling, the axial force distribution patterns in Segment B (near the slip surface) may deviate from the presented results.
Furthermore, practical applications typically employ micro anti-slide piles in group configurations with connecting structural elements (beams or caps) at pile heads, which may significantly influence axial force distribution. While the current study focuses on single pile behavior, the proposed methodology can be readily extended to analyze group pile systems through appropriate modifications to account for pile-to-pile interactions and structural constraints.

5.2. Verification Against Field Measurements
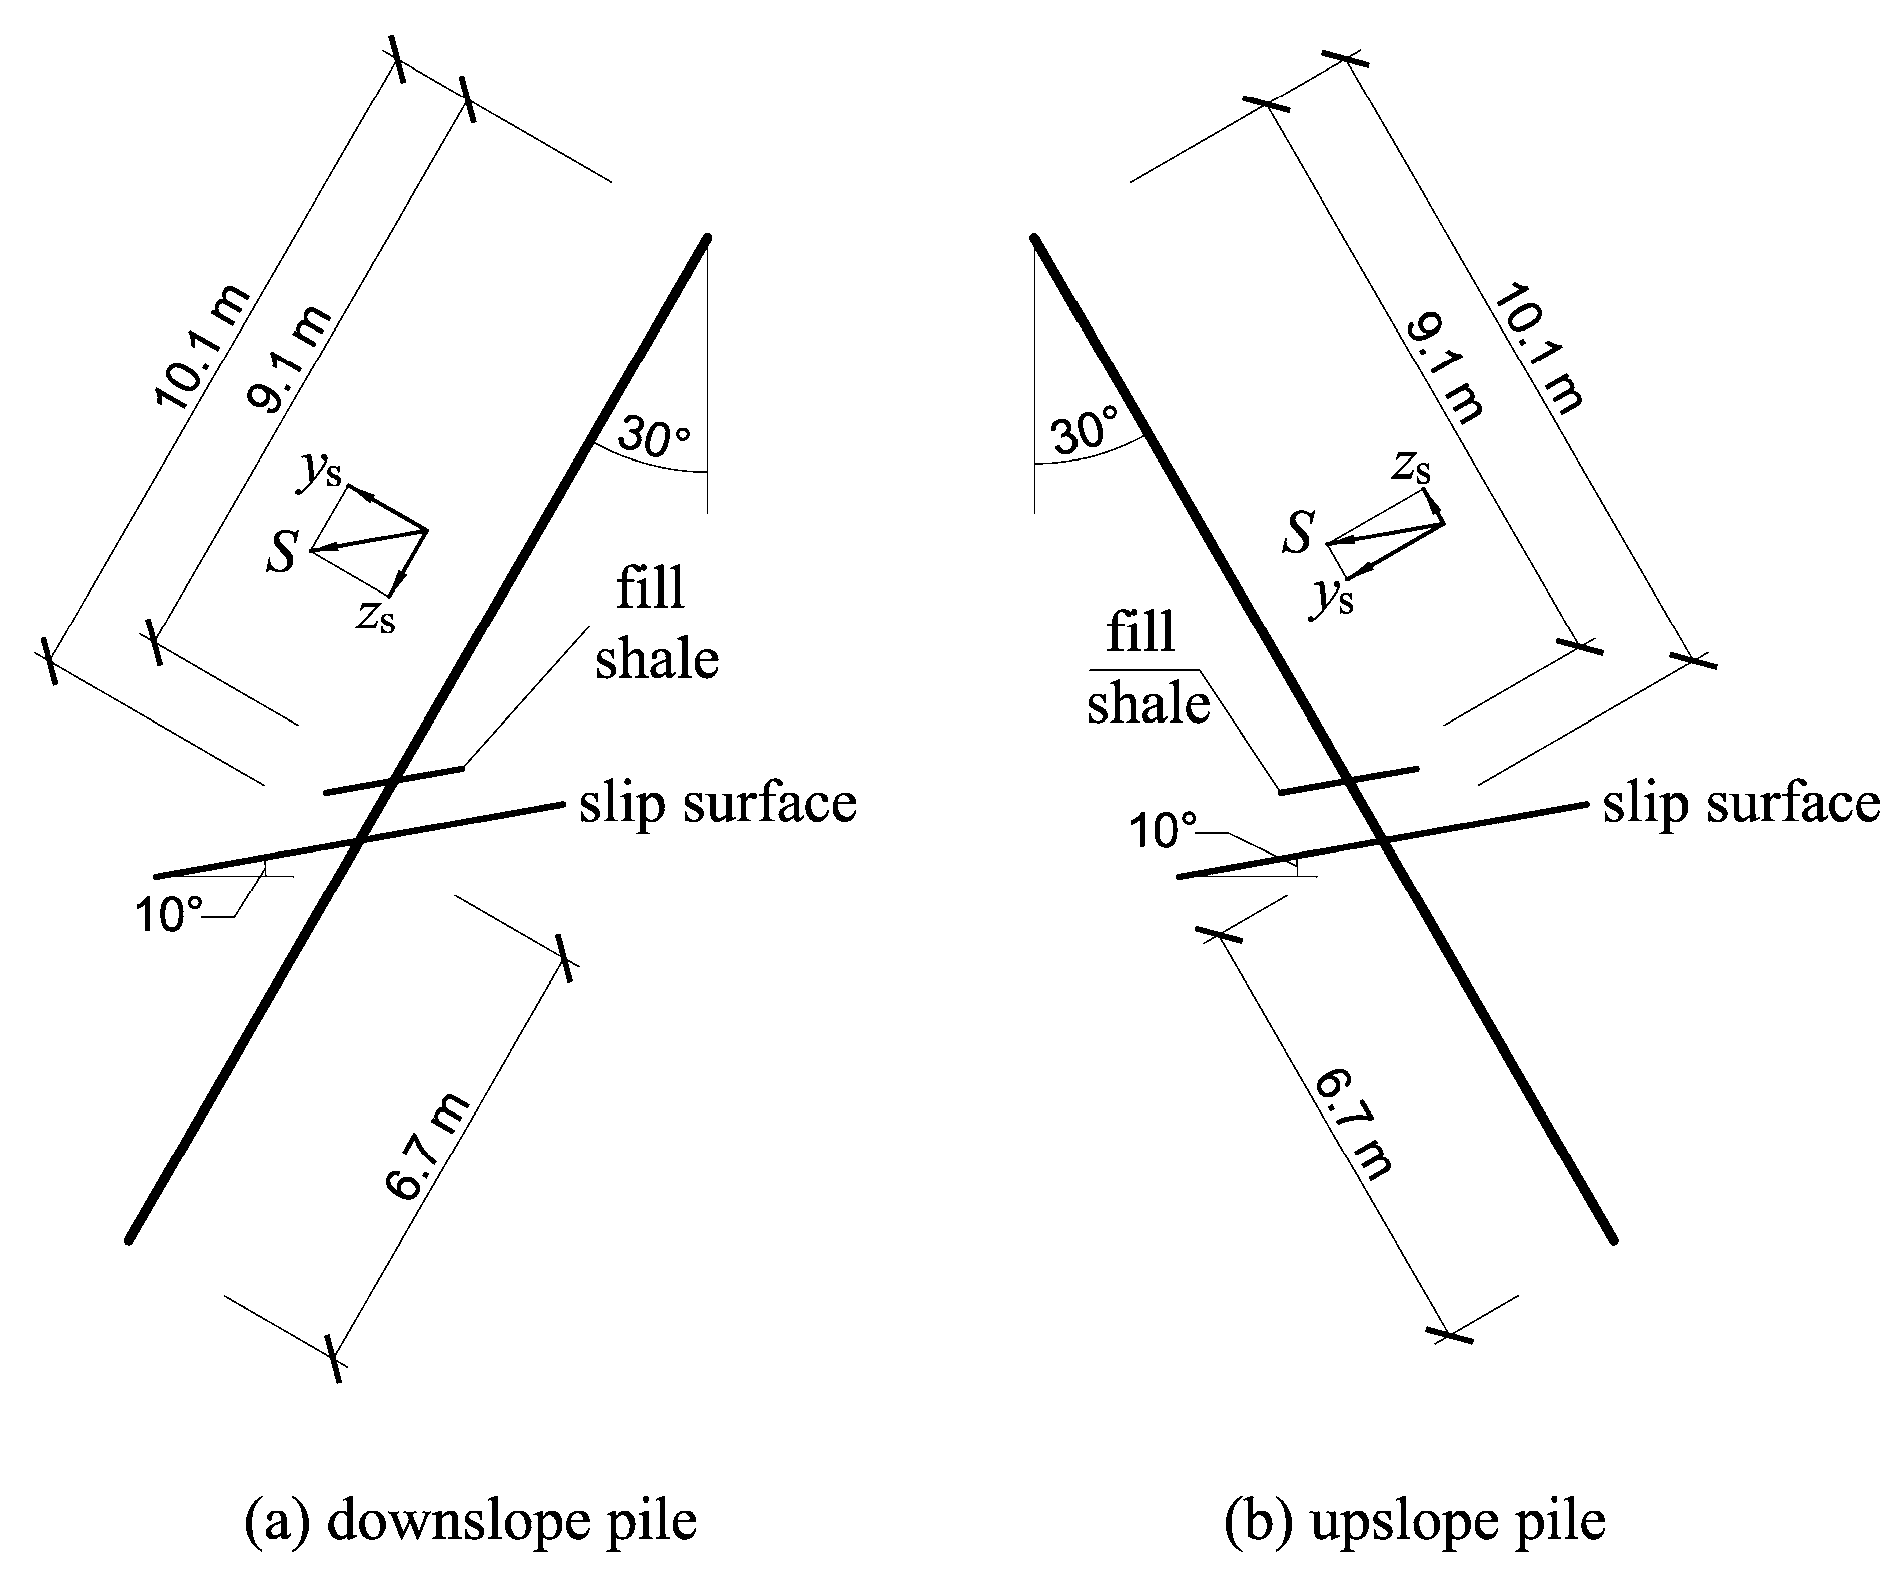
The proposed methodology was further validated using field measurements from the Littleville slope stabilization project along Alabama State Route 29 [32], which employed micro anti-slide piles in an A-frame configuration. The monitored data recorded two distinct slope movement events: an initial displacement of 8.64 mm (upslope pile) and 6.10 mm (downslope pile), followed by subsequent movement increasing to 9.91 mm and 7.87 mm, respectively [12].
The stabilization system utilized grouted steel pipe micropiles with a 154.2 mm outer diameter, containing steel pipes (114.3 mm outer diameter, 7.62 mm wall thickness) as load-bearing elements. For computational modeling, the section stiffness was represented solely by the steel pipe properties, with a flexural rigidity (EI) of 730.4 kN·m2 and axial stiffness (EA) of 510.8 MPa. The geometric relationship between the inclined micropiles and the slip surface, illustrated in Figure 19, facilitates the vector decomposition of imposed soil displacements (S) into transverse ( y s ) and axial ( z s ) displacement components for mechanical analysis.
Figure 19. Decomposition of soil displacements applied on the micropiles in the Littleville Alabama slope project.
Buildings 15 03498 g019
Loehr and Brown [12] proposed p-y and t-z relationships for this case study, which have been equivalently reformulated as hyperbolic models in this work, with corresponding parameters provided in Table 2. Field monitoring data confirm negligible internal forces in the pile head region, justifying the adoption of free pile head conditions in the analysis. Furthermore, given the relatively small slope displacements observed, soil-pile separation near the slip surface is considered insignificant, allowing for the omission of Segment B in the analytical model.
Figure 20 presents a comparison between the calculated and monitored internal forces. The geometrically nonlinear BSFEM, utilizing a uniform set of p-y and t-z parameters (without depth variation), demonstrates generally good agreement with field measurements. Notably, bending moment predictions show marginally higher accuracy than axial force estimations. While adopting distinct parameters for the upslope and downslope piles could potentially enhance prediction accuracy—accounting for their spatial arrangement—the present results sufficiently validate the proposed methodology.
The primary advantage of the proposed BSFEM over conventional 3D finite element approaches is its ability to directly calibrate model parameters using field measurements or existing databases, thereby predicting pile responses efficiently without explicitly simulating complex soil behavior. To fully realize this potential, future work should focus on: (1) incorporating field cases with larger soil displacements, and (2) performing comprehensive numerical simulations to systematically establish reliable p-y and t-z parameter determination methods for micro anti-slide piles, ultimately improving their practical design and application in slope stabilization engineering.

6. Conclusions

This study performed 3D finite element simulations to analyze the behavior of micro anti-slide piles subjected to landslide-induced movements, with specific focus on the axial force development mechanisms in micropiles under different sliding angle conditions. The research systematically investigated and modeled soil resistance responses to relative axial pile-soil displacements. A novel beam-spring finite element method (BSFEM) was developed, incorporating both geometric and material nonlinearities to accurately capture micropile responses. The principal findings of this investigation can be summarized as follows:
  • Axial force (P) in a micro anti-slide pile develops through two primary mechanisms: axial soil displacement ( z s ) and pile kinematics. As the sliding angle ( α ) transitions from negative to positive values, P shifts from tension to mainly compression, highlighting the predominant role of z s in axial force generation. In contrast, the kinematically induced axial force remains consistently tensile, opposing the compressive influence of z s when α is positive. The case where α = 5 ° serves as an approximate transition point at which these opposing effects effectively cancel each other. The two mechanisms governing axial force development also demonstrate distinct mobilization behaviors: the zs-induced axial force mobilizes earlier than both bending moment and shear force, whereas kinematically induced axial force mobilizes considerably later.
  • Based on displacement characteristics, the micropile is divided into three segments: Segments A and C away from the slip surface show axial displacement governed by rigid cross-section translation, while Segment B near the slip surface exhibits rotation-dominated axial displacement accompanied by partial soil–pile separation due to large lateral displacements—significantly complicating predictions of axial friction magnitude and direction. A detailed analysis of axial frictional resistance was conducted for each segment, taking into account the influence of varying sliding angles ( α ).
  • Both the p-y and t-z relationships were modeled using a hyperbolic formulation. For Segment B, the derived soil resistance equations explicitly account for two key mechanisms: cross-sectional rotation effects and soil-pile separation behavior. Model parameters for both the p-y and t-z curves were calibrated through inverse analysis based on numerically simulated response data. The results indicate that both the ultimate lateral soil resistance ( p u ) and the ultimate shaft resistance ( t u ) exhibit clear dependence on the sliding angle ( α ).
  • This study developed a novel beam-spring finite element method (BSFEM) that incorporates both geometric and material nonlinearities of the pile behavior, featuring a soil displacement-driven solution algorithm. The proposed BSFEM demonstrates good agreement with Abaqus simulations in capturing the distribution and evolution of axial deformation and force in micropiles under varying soil movement conditions.
  • The proposed methodology has been successfully validated against field monitoring data from an actual engineering application. The advantage over conventional 3D finite element approaches is its ability to predict pile responses efficiently without explicitly simulating complex soil behavior. To fully realize this potential, future work should focus on: (1) incorporating field cases with larger soil displacements, and (2) performing comprehensive numerical simulations to systematically establish reliable p-y and t-z parameter determination methods for micro anti-slide piles, ultimately improving their practical design and application in slope stabilization engineering.
  • The developed numerical model and Segment B soil resistance formulations are particularly appropriate for cohesive soils, where significant soil-pile separation develops under lateral soil movements. However, for cohesionless granular materials or cases involving post-separation gap infilling, the observed axial force distribution patterns near the slip surface may deviate from the current findings. In such scenarios, modifications to the soil resistance models would be necessary to account for these differing mechanical behaviors.

Author Contributions

Conceptualization, G.L.; methodology, G.L. and Z.W.; software, G.L., D.Y., Z.W. and F.L.; validation, G.L. and D.Y.; formal analysis, G.L. and D.Y.; investigation, G.L. and D.Y.; resources, G.L.; data curation, G.L. and Z.W.; writing—original draft preparation, G.L. and D.Y.; writing—review and editing, G.L.; visualization, G.L., D.Y. and F.L.; supervision, G.L.; project administration, G.L.; funding acquisition, G.L. All authors have read and agreed to the published version of the manuscript.

Funding

This research was funded by the Science and Technology Innovation Program of Foshan City (grant number 2420001004398) and the Guangdong Basic and Applied Basic Research Foundation (grant number 2024A1515140052).

Data Availability Statement

Data will be made available on request.

Conflicts of Interest

The authors declare no conflicts of interest.

References

  1. Tang, H.; Wasowski, J.; Juang, C.H. Geohazards in the Three Gorges Reservoir Area, China—Lessons Learned from Decades of Research. Eng. Geol. 2019, 261, 105267. [Google Scholar] [CrossRef]
  2. Tang, H.; Wang, L.; Li, C.; Zou, Z. Key Techniques of Prevention and Control for Reservoir Landslides Based on Evolutionary Process. In Progress in Landslide Research and Technology, Volume 1 Issue 2, 2022; Alcántara-Ayala, I., Arbanas, Ž., Huntley, D., Konagai, K., Mikoš, M., Sassa, K., Sassa, S., Tang, H., Tiwari, B., Eds.; Progress in Landslide Research and Technology; Springer International Publishing: Cham, Switzerland, 2023; pp. 11–28. ISBN 978-3-031-18470-3. [Google Scholar]
  3. Sun, S.-W.; Zhu, B.-Z.; Wang, J.-C. Design Method for Stabilization of Earth Slopes with Micropiles. Soils Found. 2013, 53, 487–497. [Google Scholar] [CrossRef]
  4. Lei, G.; Su, D.; Cabrera, M.A. Non-Dimensional Solutions for the Stabilising Piles in Landslides in Layered Cohesive Soils Considering Non-Linear Soil–Pile Interactions. Géotechnique 2022, 72, 737–751. [Google Scholar] [CrossRef]
  5. Li, C.; Wu, J.; Tang, H.; Wang, J.; Chen, F.; Liang, D. A Novel Optimal Plane Arrangement of Stabilizing Piles Based on Soil Arching Effect and Stability Limit for 3D Colluvial Landslides. Eng. Geol. 2015, 195, 236–247. [Google Scholar] [CrossRef]
  6. Xiang, B.; Zhang, L.M.; Zhou, L.-R.; He, Y.-Y.; Zhu, L. Field Lateral Load Tests on Slope-Stabilization Grouted Pipe Pile Groups. J. Geotech. Geoenviron. Eng. 2015, 141, 04014124. [Google Scholar] [CrossRef]
  7. Zeng, J.; Xiao, S. A Simplified Analytical Method for Stabilizing Micropile Groups in Slope Engineering. Int. J. Civ. Eng. 2020, 18, 199–214. [Google Scholar] [CrossRef]
  8. Yang, T.; Men, Y.; Rutherford, C.J.; Zhang, Z. Static and Dynamic Response of Micropiles Used for Reinforcing Slopes. Appl. Sci. 2021, 11, 6341. [Google Scholar] [CrossRef]
  9. Liu, X.; Liu, Y.; Liu, K.; Su, Y. Experimental Investigation on Anti-Sliding Performance of Grouted Micro-Pipe Pile Groups. Nat. Hazards 2022, 113, 1367–1384. [Google Scholar] [CrossRef]
  10. Zhang, C.; Yin, Y.; Yan, H.; Zhu, S.; Li, B.; Hou, X.; Yang, Y. Centrifuge Modeling of Multi-Row Stabilizing Piles Reinforced Reservoir Landslide with Different Row Spacings. Landslides 2023, 20, 559–577. [Google Scholar] [CrossRef]
  11. Zhang, C.; Yin, Y.; Yan, H.; Zhu, S.; Zhang, M.; Wang, L. Centrifuge Modeling of Unreinforced and Multi-Row Stabilizing Piles Reinforced Landslides Subjected to Reservoir Water Level Fluctuation. J. Rock Mech. Geotech. Eng. 2024, 16, 1600–1614. [Google Scholar] [CrossRef]
  12. Loehr, J.E.; Brown, D.A. A Method for Predicting Mibilization of Resistance for Micropiles Used in Slope Stabilization Applications. Report Submitted to the Joint ADSC/DFI Micropile Committee. 2008. Available online: https://danbrownandassociates.com/wp-content/uploads/2008/01/a-method-for-predicting-mobilization-of-resistance-for-micropiles-used-in-slope-stabilization-applications-loher_brown-adsc-dfi-micropile-committee-report-jan-08.pdf (accessed on 12 September 2025).
  13. Han, M.; Jia, J. Nonlinear Response of Micropile Groups Stabilizing Landslides Considering Pile–Soil Interactions. Int. J. Geomech. 2024, 24, 04024109. [Google Scholar] [CrossRef]
  14. White, D.J.; Thompson, M.J.; Suleiman, M.T.; Schaefer, V.R. Behavior of Slender Piles Subject to Free-Field Lateral Soil Movement. J. Geotech. Geoenviron. Eng. 2008, 134, 428–436. [Google Scholar] [CrossRef]
  15. API. Recommended Practice for Planning, Designing and Constructing Fixed Offshore Platforms-Working Stress Design; American Petroleum Institute: Washington, DC, USA, 2000. [Google Scholar]
  16. Bateman, A.H.; Crispin, J.J.; Vardanega, P.J.; Mylonakis, G.E. Theoretical T-z Curves for Axially Loaded Piles. J. Geotech. Geoenviron. Eng. 2022, 148, 04022052. [Google Scholar] [CrossRef]
  17. Boeckmann, A.Z. Load Transfer in Micropiles for Slope Stabilization from Tests of Large Scale Physic Models. Master’s Thesis, University of Missouri, Columbia, MO, USA, 2006. [Google Scholar]
  18. Su, D.; Li, J.H. Three-Dimensional Finite Element Study of a Single Pile Response to Multidirectional Lateral Loadings Incorporating the Simplified State-Dependent Dilatancy Model. Comput. Geotech. 2013, 50, 129–142. [Google Scholar] [CrossRef]
  19. Kourkoulis, R.; Gelagoti, F.; Anastasopoulos, I.; Gazetas, G. Hybrid Method for Analysis and Design of Slope Stabilizing Piles. J. Geotech. Geoenviron. Eng. 2012, 138, 1–14. [Google Scholar] [CrossRef]
  20. Kourkoulis, R.; Gelagoti, F.; Anastasopoulos, I.; Gazetas, G. Slope Stabilizing Piles and Pile-Groups: Parametric Study and Design Insights. J. Geotech. Geoenviron. Eng. 2011, 137, 663–677. [Google Scholar] [CrossRef]
  21. Lei, G.; Wu, Z.; Su, D.; Mo, Y.; Cheng, M. A p-y method for calculating micro anti-slide piles considering pile material nonlinearity. Rock Soil Mech. 2024, 45, 337–348. [Google Scholar] [CrossRef]
  22. Asgari, A.; Bagheri, M.; Hadizadeh, M. Advanced Seismic Analysis of Soil-Foundation-Structure Interaction for Shallow and Pile Foundations in Saturated and Dry Deposits: Insights from 3D Parallel Finite Element Modeling. Structures 2024, 69, 107503. [Google Scholar] [CrossRef]
  23. Bagheri, M.; Jamkhaneh, M.E.; Samali, B. Effect of Seismic Soil–Pile–Structure Interaction on Mid- and High-Rise Steel Buildings Resting on a Group of Pile Foundations. Int. J. Geomech. 2018, 18, 04018103. [Google Scholar] [CrossRef]
  24. Zheng, G.; Yang, X.; Zhou, H.; Chai, J. Numerical Modeling of Progressive Failure of Rigid Piles under Embankment Load. Can. Geotech. J. 2019, 56, 23–34. [Google Scholar] [CrossRef]
  25. Su, D.; Huang, J.J.; Yan, W.M. Parametric Investigation on the Responses of Laterally Loaded Piles in Overconsolidated Clay Using Nondimensional Solutions Addressing Nonlinear Soil-Pile Interaction. Comput. Geotech. 2018, 96, 203–214. [Google Scholar] [CrossRef]
  26. Lu, W.; Zhang, G. New P-y Curve Model Considering Vertical Loading for Piles of Offshore Wind Turbine in Sand. Ocean. Eng. 2020, 203, 107228. [Google Scholar] [CrossRef]
  27. Byrne, B.W.; Houlsby, G.T.; Burd, H.J.; Gavin, K.G.; Igoe, D.J.P.; Jardine, R.J.; Martin, C.M.; McAdam, R.A.; Potts, D.M.; Taborda, D.M.G.; et al. PISA Design Model for Monopiles for Offshore Wind Turbines: Application to a Stiff Glacial Clay Till. Géotechnique 2020, 70, 1030–1047. [Google Scholar] [CrossRef]
  28. Abchir, Z.; Burlon, S.; Frank, R.; Habert, J.; Legrand, S. T–z Curves for Piles from Pressuremeter Test Results. Géotechnique 2016, 66, 137–148. [Google Scholar] [CrossRef]
  29. Kraft, L.M.; Ray, R.P.; Kagawa, T. Theoretical tz Curves. J. Geotech. Engrg. Div. 1981, 107, 1543–1561. [Google Scholar] [CrossRef]
  30. Zhu, H.; Chang, M.-F. Load Transfer Curves along Bored Piles Considering Modulus Degradation. J. Geotech. Geoenviron. Eng. 2002, 128, 764–774. [Google Scholar] [CrossRef]
  31. Rangel, R.L. Educational Tool for Structural Analysis of Plane Frame Models with Geometric Nonlinearity. Master’s Thesis, Pontifical Catholic University of Rio de Janeiro, Rio de Janeiro, Brazil, 2019. [Google Scholar]
  32. Brown, D.A.; Chancellor, K. Instrumentation, Monitoring and Analysis of the Performance of a Type-A Insert Wall—Littleville, Alabama; Highway Research Center, Harbert Engineering Center, Auburn University: Auburn, AL, USA, 1997. [Google Scholar]
Figure 1. Geometry and boundary conditions of the numerical model: (a) top view; (b) side view. Unit: m.
Buildings 15 03498 g001
Figure 2. Refined FE analysis of the pile and moment-curvature (M-C) modeling.
Buildings 15 03498 g002
Figure 3. Profiles of internal forces at various lateral soil displacements. (a) α = 10 ° , (b) α = 0 ° , (c) α = 5 ° , (d) α = 10 ° .
Buildings 15 03498 g003
Figure 4. Comparison of key internal force parameters for various sliding angles: (a) M 1 ;  (b) Q s ;  (c) P s ;  (d) axial force at y s = 2 D .
Buildings 15 03498 g004
Figure 5. Evolution of Force Mobilization Ratio (FMR) with increasing lateral soil displacement. (a) α = 10 ° , (b) α = 0 ° , (c) α = 5 ° , (d) α = 10 ° .
Buildings 15 03498 g005aBuildings 15 03498 g005b
Figure 6. Profiles of cross-sectional rotation and axial pile displacement at various lateral soil displacements. (a) α = 10 ° , (b) α = 0 ° , (c) α = 5 ° , (d) α = 10 ° .
Buildings 15 03498 g006aBuildings 15 03498 g006b
Figure 7. Evolutions of pile axial displacement z p with lateral soil displacements y s (a) z p at the pile head, (b) z p at the pile tip, (c) Δ z p between the pile head and tip.
Buildings 15 03498 g007aBuildings 15 03498 g007b
Figure 8. Schematic diagram of axial frictional resistance for each segment of the micropile. (a) α 0 ° , (b) 0 ° < α 5 ° ,  (c) α > 5 ° .
Buildings 15 03498 g008aBuildings 15 03498 g008b
Figure 9. Representative p-y curves obtained from finite element simulations. (a) α = 10 ° , (b) α = 10 ° .
Buildings 15 03498 g009
Figure 10. Representative t-z curves obtained from finite element simulations. (a) α = 20 ° , (b) α = 0 ° .
Buildings 15 03498 g010
Figure 11. Distribution of p-y curve parameters. (a) k pini , (b) p u .
Buildings 15 03498 g011
Figure 12. Distribution of t-z curve parameters. (a) k tini , (b) t u .
Buildings 15 03498 g012
Figure 13. Beam-spring finite element model for the calculation of a micro anti-slide pile.
Buildings 15 03498 g013
Figure 20. Comparison of BSFEM calculation results and measured data: (a) Upslope pile; (b) Downslope pile.
Buildings 15 03498 g020
Table 1. Main physical and mechanical parameters of the strata in the numerical model.
StratumUnit Weight
(kN·m−3)
Elastic Modulus
(MPa)
Poisson’s Ratio
(-)
Cohesion
(kPa)
Internal Friction Angle
(°)
Silty clay18.2600.302518
Fully weathered bedrock20.01000.253020
Table 2. Parameters for p-y and t-z models for the Littleville Alabama slope project.
Stratumkpini
(kPa)
pu
(kN/m)
ktini
(kN/m3)
tu
(kPa)
Fill2718.5329.921.722 × 10588.66
Shale7087.5978.01
Disclaimer/Publisher’s Note: The statements, opinions and data contained in all publications are solely those of the individual author(s) and contributor(s) and not of MDPI and/or the editor(s). MDPI and/or the editor(s) disclaim responsibility for any injury to people or property resulting from any ideas, methods, instructions or products referred to in the content.