Article

Theoretical Calculation Modeling of Thermal Conductivity of Geopolymer Foam Concrete in Building Structures Based on Image Recognition

1
School of Civil Engineering and Architecture, University of Jinan, Jinan 250000, China
2
School of Civil Engineering, Shandong Jianzhu University, Jinan 250000, China
3
China Construction Eighth Engineering Division Second Construction Co., Ltd., Jinan 250000, China
4
School of Civil Engineering, Central South University, Changsha 410000, China
*
Author to whom correspondence should be addressed.
Buildings 2025, 15(19), 3494; https://doi.org/10.3390/buildings15193494
Submission received: 25 August 2025 / Revised: 18 September 2025 / Accepted: 23 September 2025 / Published: 28 September 2025

Abstract

A novel thermal conductivity prediction model was developed to address the complex influence of pore structure in porous materials. This model incorporates pore size (d) and a pore distribution parameter (t) to calculate the material’s thermal conductivity. To validate the model’s accuracy, geopolymer foamed concrete (GFC) samples with varying pore structures were fabricated. These utilized ground granulated blast furnace slag (GGBS) as the precursor, a mixed solution of sodium hydroxide (NaOH) and sodium silicate as the alkaline activator, and sodium stearate (NaSt), hydroxypropyl methylcellulose (HPMC), and sodium carboxymethyl cellulose (CMC-Na) as foam stabilizers. Conventional pore size characterization techniques exhibit limitations; consequently, this research implements a high-fidelity machine vision-driven image analysis methodology. Pore size measurement is achieved through a combined technical approach involving equivalent diameter modeling and morphological optimization. The feasibility of the proposed theory is validated by our experimental data and data from previous literature, with the error between experimental and theoretical values maintained within 5%. The value of t increases with increasing porosity and increasing disorder in pore distribution. Based on the experimental data obtained in this study and the research data from previous scholars’ studies, the t value for porous materials can be categorized according to porosity: when porosity is approximately 30%, t ≈ 0.9; when porosity is 55~65%, t ranges from 1.2 to 1.3; and when porosity is approximately 80%, t ranges from 1.9 to 2.2.

1. Introduction

The construction industry is extensively plagued by issues of energy consumption and environmental pollution. Compared to traditional building materials, more economical and environmentally friendly thermal insulation materials have attracted significant attention [1,2,3]. Insulation materials are divided into two categories: organic and inorganic materials [4]. Organic materials exhibit poor flame retardancy, making it difficult to meet fire resistance requirements, whereas inorganic materials like foam concrete demonstrate good fire resistance. Additionally, foam concrete offers excellent properties such as light weight, sound insulation, and shock absorption, holding promising development prospects. However, traditional foam concrete is composed of water, cement, cementitious materials, and foam generated through physical pre-foaming or chemical foaming [5,6]. The production of 1 ton of Portland cement clinker emits approximately 0.86 tons of CO2, causing substantial environmental pollution. Utilizing solid waste to replace cement for producing GFC can achieve carbon reduction. As one of the substitutes for cement production, alkali-activated materials are a novel type of inorganic amorphous aluminosilicate polymer prepared by reacting active aluminosilicate materials (such as GGBS, metakaolin, fly ash, red mud, etc.) with alkaline solutions [7,8,9,10,11]. Their greenhouse gas emissions are 5–6 times lower than those of cement [12]. Using GGBS to produce GFC can fully and rationally utilize industrial solid waste, turning waste into treasure. Promoting its application not only contributes to energy conservation and environmental protection but also aligns with the strategy of sustainable development.
In the study of GFC material properties, thermal conductivity is an extremely important performance evaluation indicator. Consequently, the complex multi-scale structure that determines the thermal conduction characteristics of GFC has become a research focus in the field of materials science. Analyzed from the perspective of heat transfer, porous materials can be regarded as solid–gas two-phase coupled systems, and their effective thermal conductivity not only depends on the intrinsic thermal conductivity of the solid matrix and the conduction properties of the gas-phase medium, but also forms a strong coupling with the pore structure (e.g., porosity, pore size, and pore distribution).
For simple structures, established thermal conductivity calculation models include series and parallel models, the Maxwell–Eucken (ME) model [13], the effective medium percolation theory model (EMPT) [14], the effective medium theory model (EMT) [15], the new effective medium theory model (NEMT) [16], and other structural models (the specific expressions of the above thermal conductivity models will be introduced later). However, these traditional models generally neglect the influence of pore size on thermal conductivity. Changes in pore size significantly affect the properties of GFC. The experimental data from Kamseu et al. [14] demonstrate that larger pore sizes substantially impact thermal conductivity even at similar porosities. Chen et al. [17] demonstrated that thermal conductivity decreases with increasing porosity. Gao et al. [18] found that, at the same porosity, an increase in the number of small pores reduces thermal conductivity. Othuman et al. [19] also indicated that when a dominant pore size exists at a given porosity, it can be used to calculate the thermal conductivity.
Considering the effect of pore size on the thermal conductivity of porous materials, Wang et al. [20] derived a theoretical equation based on the principle of equivalent thermal conductivity using the ratio of the lengths of the semiaxes of an ellipsoid to denote the macroporous shapes, which efficiently predicts the thermal conductivity of most of the GGBFS-based foam geopolymers. In addition, different pore distribution patterns lead to a change in the connectivity of the porous material, which in turn leads to similar thermal conductivity for materials with similar porosity and different pore sizes. Gadkar et al. [21] found that three groups of porous geopolymer test blocks with similar porosity and similar dry density but different average pore sizes had similar thermal conductivity values. This is mainly due to the distribution pattern of the pores. Cui et al. [15] proposed the pore size distribution parameter t to correct the Cheng–Vachon model [22], which makes the experimental values basically consistent with the theoretical values. Bi et al. [23] introduced a pore size distribution function into their model, enhancing the prediction accuracy of the gaseous thermal conductivity in aerogels. Ordonez-Miranda et al. [24] incorporated an Archie-type exponent to account for the influence of pore shape, an approach grounded in Bruggeman’s differential effective medium theory. However, this theory is applicable to materials with low to medium porosity and cannot be directly extended to the high-porosity structure of GFC. In summary, most of the current thermal conductivity models only calculate the thermal conductivity through the solid–gas phase, and some of the models take into account the effect of pore size or pore distribution on the thermal conductivity, and do not take into account the effect of pore size and pore distribution at the same time.
In addition, traditional pore structure identification methods include mercuric pressure, gas adsorption, optical scattering, and electron microscope scanning. The mercury compression method is the use of pressure to press mercury into the pores of the evacuated material, according to the pressure and volume of injected mercury, to obtain the pore volume and size data of the material, so as to calculate the pore volume and pore size distribution. This method is mainly suitable for analyzing more rigid materials; however, the overall test cost is relatively high. The gas adsorption method is conducted at the temperature of liquid nitrogen (77 K). By applying specific relative pressures of nitrogen, adsorption occurs within the material, leading to capillary condensation of nitrogen in the pores. The pore volume and pore size distribution can then be calculated based on the Barrett–Joyner–Halenda (BJH) principle. However, this method requires strict measurement temperature, as low accuracy of the measurement results in large pores, high cost, and long measurement time. Optical scattering method is an analytical technique based on the principle of interaction between light and matter. By measuring the intensity, angular distribution, polarization state, and other scattering signals generated by the incident light on the surface of particles or pores, the structural parameters such as the pore size of the matter can be deduced inversely. The method suffers from high experimental requirements as well as time-consuming measurements. Scanning electron microscopy (SEM) is a microscopic imaging technique based on the interaction of an electron beam with the surface of a sample, which realizes the observation of the surface morphology and structure of the sample by collecting signals such as secondary electrons and backscattered electrons. The electron microscope scanning method requires visual observation of the pore structure generated on the screen, which is costly and inefficient, in addition to the large difference in brightness and contrast between different electron microscope images. In comparison, image recognition technology offers efficient, accurate, and contactless capabilities, automatically processing large volumes of image data to achieve the rapid identification and classification of targets, which holds promising development prospects [25]. It also provides an efficient solution for on-site inspection scenarios where 3D scanning of the surface is not possible.
Based on the existing thermal conductivity model and the defects of pore structure identification, this paper proposes a new thermal conductivity calculation model considering the pore size and distribution characteristics based on image recognition technology; the introduction of pore size (d) and pore distribution parameters (t) has significantly enhanced the prediction accuracy of the thermal conductivity model. This addresses the substantial discrepancy often observed between predicted values from traditional models and experimental data. The thermal conductivity values predicted by the present model demonstrate a consistent error margin of within 5% compared to the experimental measurements. Furthermore, an innovative classification of the bubble distribution parameter (t), based on the varying porosity of the material, was established. This classification provides a valuable reference for subsequent in-depth research by scholars.

2. Calculation Model of Thermal Conductivity of GFC

The expressions of several traditional models mentioned above are as follows:
k e = k 1 ( 1 φ ) + k 2 φ
k e = 1 1 φ k 1 + φ k 2
The parallel model (Equation (1)) and series model (Equation (2)) represent the simplest and most rudimentary mathematical frameworks for predicting the thermal conductivity of composite materials, yet they serve as a fundamental basis for many more complex theoretical developments. In practice, the actual thermal conductivity of composite materials typically falls between the upper and lower bounds predicted by these series and parallel models. However, these models do not account for the shape, size distribution, or interactions of the filler materials, consequently resulting in a relatively wide prediction range.
k e = k 1 2 k 1 + k 2 2 ( k 1 k 2 ) φ 2 k 1 + k 2 + ( k 1 k 2 ) φ
k e = k 2 2 k 2 + k 1 2 ( k 2 k 1 ) ( 1 φ ) 2 k 2 + k 1 + ( k 2 k 1 ) ( 1 φ )
The Maxwell model is divided into the ME1 model (Equation (3)) and the ME2 model (Equation (4)). The Maxwell model characterizes the thermal conductivity of materials formed by non-interacting, homogeneous spherical inclusions randomly dispersed within a matrix. This model is applicable to materials with low to medium porosity ranges and where the pores are non-interconnecting. However, for complex porous materials like GFC, which typically exhibit high porosity, irregular pore shapes, and interconnected pore structures, the fundamental assumptions of the Maxwell model deviate significantly from the actual microstructural configuration. Consequently, its predictive accuracy for such materials is considerably limited.
k e = 1 4 k 2 ( 3 φ 1 ) + k 1 3 ( 1 φ ) 1 + k 2 ( 3 φ 1 ) + k 1 ( 3 ( 1 φ ) 1 ) 2 + 8 k 1 k 2
k e = 1 4 k 2 ( 3 k 2 1 ) + k 1 3 ( 1 φ ) 1 + k 2 ( 3 k 2 1 ) + k 1 ( 3 ( 1 φ ) 1 ) 2 + 8 k 1 k 2
The effective medium theory (EMT) model (Equation (5)) conceptualizes a microscopically complex and heterogeneous system as a macroscopically homogeneous “effective medium,” describing its bulk physical behavior using a single “effective” parameter. Building upon the foundation of the EMT model, the effective medium percolation theory (EMPT; Equation (6)) incorporates the critical concept of a percolation threshold. When the volume fraction of thermally conductive fillers exceeds this critical value, the fillers interconnect to form a continuous conductive network or pathway. This formation induces a nonlinear and sharp increase in the composite material’s thermal conductivity.
k e = k 1 ( 1 φ ) ( k 2 + 2 k m ) + k 2 φ ( k 1 + 2 k m ) φ ( k 1 + 2 k m ) + ( 1 φ ) ( k 2 + 2 k m )
The NEMT model (Equation (7)) treats the phase as spherical particles dispersed within an assumed homogeneous medium with a thermal conductivity of km. This model provides a unified framework that incorporates five fundamental effective thermal conductivity structural models: the series and parallel models, the Maxwell–Eucken 1 (ME1) model, the Maxwell–Eucken 2 (ME2) model, and the effective medium theory (EMT) model.
In the above models, φ is the total porosity; k e is the effective thermal conductivity; k 1 is the thermal conductivity of geopolymer concrete paste, which is 0.58 W/(m·k); k 2 is the thermal conductivity of air, which is 0.026 W/(m·k) at room temperature; and k m is an adjustable constant depending on the material.
In this paper, considering the pore size and pore distribution of porous materials, a new model for calculating thermal conductivity is proposed with the following expression:
k e = a φ t k 2 + 1 φ t k 1 ( 1 φ ) t
where a depends on the average diameter of the material’s macropores and t depends on the distribution of the pores in the material.

3. Pore Size Statistical Method Based on Image Recognition

Currently, scanning electron microscopy (SEM) and mercury compression methods are used for the study of the pore size of foam concrete. Arvind et al. [26] tested the pore size distribution of foam concrete by SEM. Ahmed et al. [27] in 2023 used SEM to observe the pore size, and in 2025 [28], used a combination of SEM and mercury compression to analyze the pore size distribution. Considering the problems of the SEM method, this study is based on a high-precision image analysis method with machine vision in order to realize the quantitative characterization of the complex pore structure of foam concrete. The method establishes an automated measurement system suitable for two-dimensional cross-section analysis of porous materials through a technical path combining the construction of an equivalent diameter model and morphological optimization. The study initiates image processing by employing the emphasize operator to enhance image contrast, thereby accentuating edges and details. The image is subsequently converted to grayscale. Dynamic threshold segmentation is then applied to obtain a preliminary segmented region. The edge contours of the target were subsequently extracted using the Canny sub-pixel edge detection algorithm. The smoothing coefficient (Sigma) of the Canny filter was set to 5, and the hysteresis thresholds were configured as [20, 40]. This combined approach of dynamic thresholding and edge detection facilitates the retention of strong edges by the high threshold and the connection of weak edges by the low threshold, resulting in more complete and coherent boundaries. This methodology effectively mitigates issues of under-segmentation or over-segmentation commonly associated with global thresholding techniques, thereby reducing errors in aperture measurements. Subsequent morphological processing involves a closing operation to repair fractured edges. Effective pores are then screened based on compactness (set within the range of [0.4, 1.9]) and area thresholds (set within the range of [20, 99999] pixels). This parameter selection ensures a balance between retaining potential target pores and filtering out obvious noise. To address the issue of misidentification in the calibration scale region at the bottom of the sample, a region selection method based on spatial domain coordinates was employed to exclude the bottom 11.7% area of the image. This method involves generating a rectangular mask within the spatial domain and subsequently removing the interfering bottom region through a set difference operation. The equivalent diameter model ( D e q = 2 A / π ) is used to equivalently convert the area of holes to a standard circle diameter to overcome the geometric characterization difficulties of irregular hole shapes, and is then combined with the calibration scale factor to realize the physical size conversion. The recognition process of hole diameters is shown in Figure 1.

4. Test Verification

4.1. Materials and Methods

In this paper, the theoretical formula is verified by determining the indexes of thermal conductivity and porosity of GFC. The raw materials used in the test include S95 grade slag powder, whose chemical composition is analyzed as shown in Table 1. NaOH granules (analytically pure AR) and water glass (27.3% SiO2, 8.54% sodium oxide, and 3.3 modulus of water glass) were mixed for the alkali activator. Hydrogen peroxide is 30% pure. NaSt is analytically pure and has the appearance of a white or off-white powder.
The water glass modulus was adjusted to 1.4 by adding sodium hydroxide, the liquid-to-solid ratio was set to 0.53, the alkali content was set to 10%, and the hydrogen peroxide doping was 5.5%. The alkaline activator was prepared by mixing NaOH, the water glass solution, and tap water proportionally, and left to age for 24 h before use. The granulated blast furnace slag powder was mechanically premixed for 120 s to achieve homogeneous dispersion of the material, then injected into the prefabricated alkaline activator and foam stabilizer, then placed in the mortar mixer for 60 s with high-speed mixing, and finally added into hydrogen peroxide for rapid mixing before being injected into the standard mold immediately after the completion of the mixing and the fluid slurry to be shaped, finally producing the GFC; the produced foamed concrete is shown in Figure 2. Based on the dosage of foam stabilizers used in the local polymer foam concrete by Shi et al. [29] and previous experimental studies, three dosage levels of stabilizers were determined. Specifically, NaSt and HPMC were used at 0.10%, 0.20%, 0.30%, 0.40%, and 0.50% of the total weight, while CMC-Na was applied at 0.05%, 0.10%, 0.15%, 0.20%, and 0.25% of the total weight. The mix design of the specimens is detailed in Table 2.

4.2. Test Methods

4.2.1. Thermal Conductivity

Test specimens with dimensions of 300 mm × 300 mm × 30 mm were prepared. The specimens were placed in a drying oven and dried to constant weight. The specimen surfaces remained flat and were free of significant internal defects or cracks. The testing age was 28 days, and the number of specimens was three. The testing procedure was as follows: the sample was placed between two parallel constant temperature plates, and a constant unidirectional heat flow was applied in the vertical direction. The cold plate was set to room temperature (20 °C), and the hot plate was set to 60 °C. The thermal conductivity of the material was then calculated based on the thickness of the specimen, the heat flux passing through the specimen, the temperature difference between the cold and hot surfaces, and the effective surface area.

4.2.2. Dry Density

Specimens with dimensions of 100 mm × 100 mm × 100 mm were used. The testing age was 28 days, and the number of specimens was three. After the curing of the specimens was completed, the length, width, and height values were measured sequentially. For each direction, the value needed to be measured twice at each end (once at each opposite side), totaling four measurements. The measured values were precise to 1 mm. The average of the four measurements was taken as the length value for that direction, and the volume V of each specimen was subsequently calculated through computation. The specimens were dried in a constant temperature oven (temperature set to 105 °C ± 2 °C) until they reached a thermally stable state, and the measured mass was recorded as m 0 . The criterion for constant weight was an absolute value of mass fluctuation ≤ 0.2% between two weighings performed 4 h apart. The dry density ρ 0 was taken as the arithmetic mean of the test values from three independent samples. The specific calculation is shown in Equation (9):
ρ 0 = m 0 V

4.2.3. Porosity

The geopolymer paste concrete was dried to constant weight to measure its dry density ρ . The GFC was dried to constant weight to measure its dry density ρ . The porosity f was calculated according to Equation (10):
f = ρ ρ ρ

4.3. Dry Density and Porosity

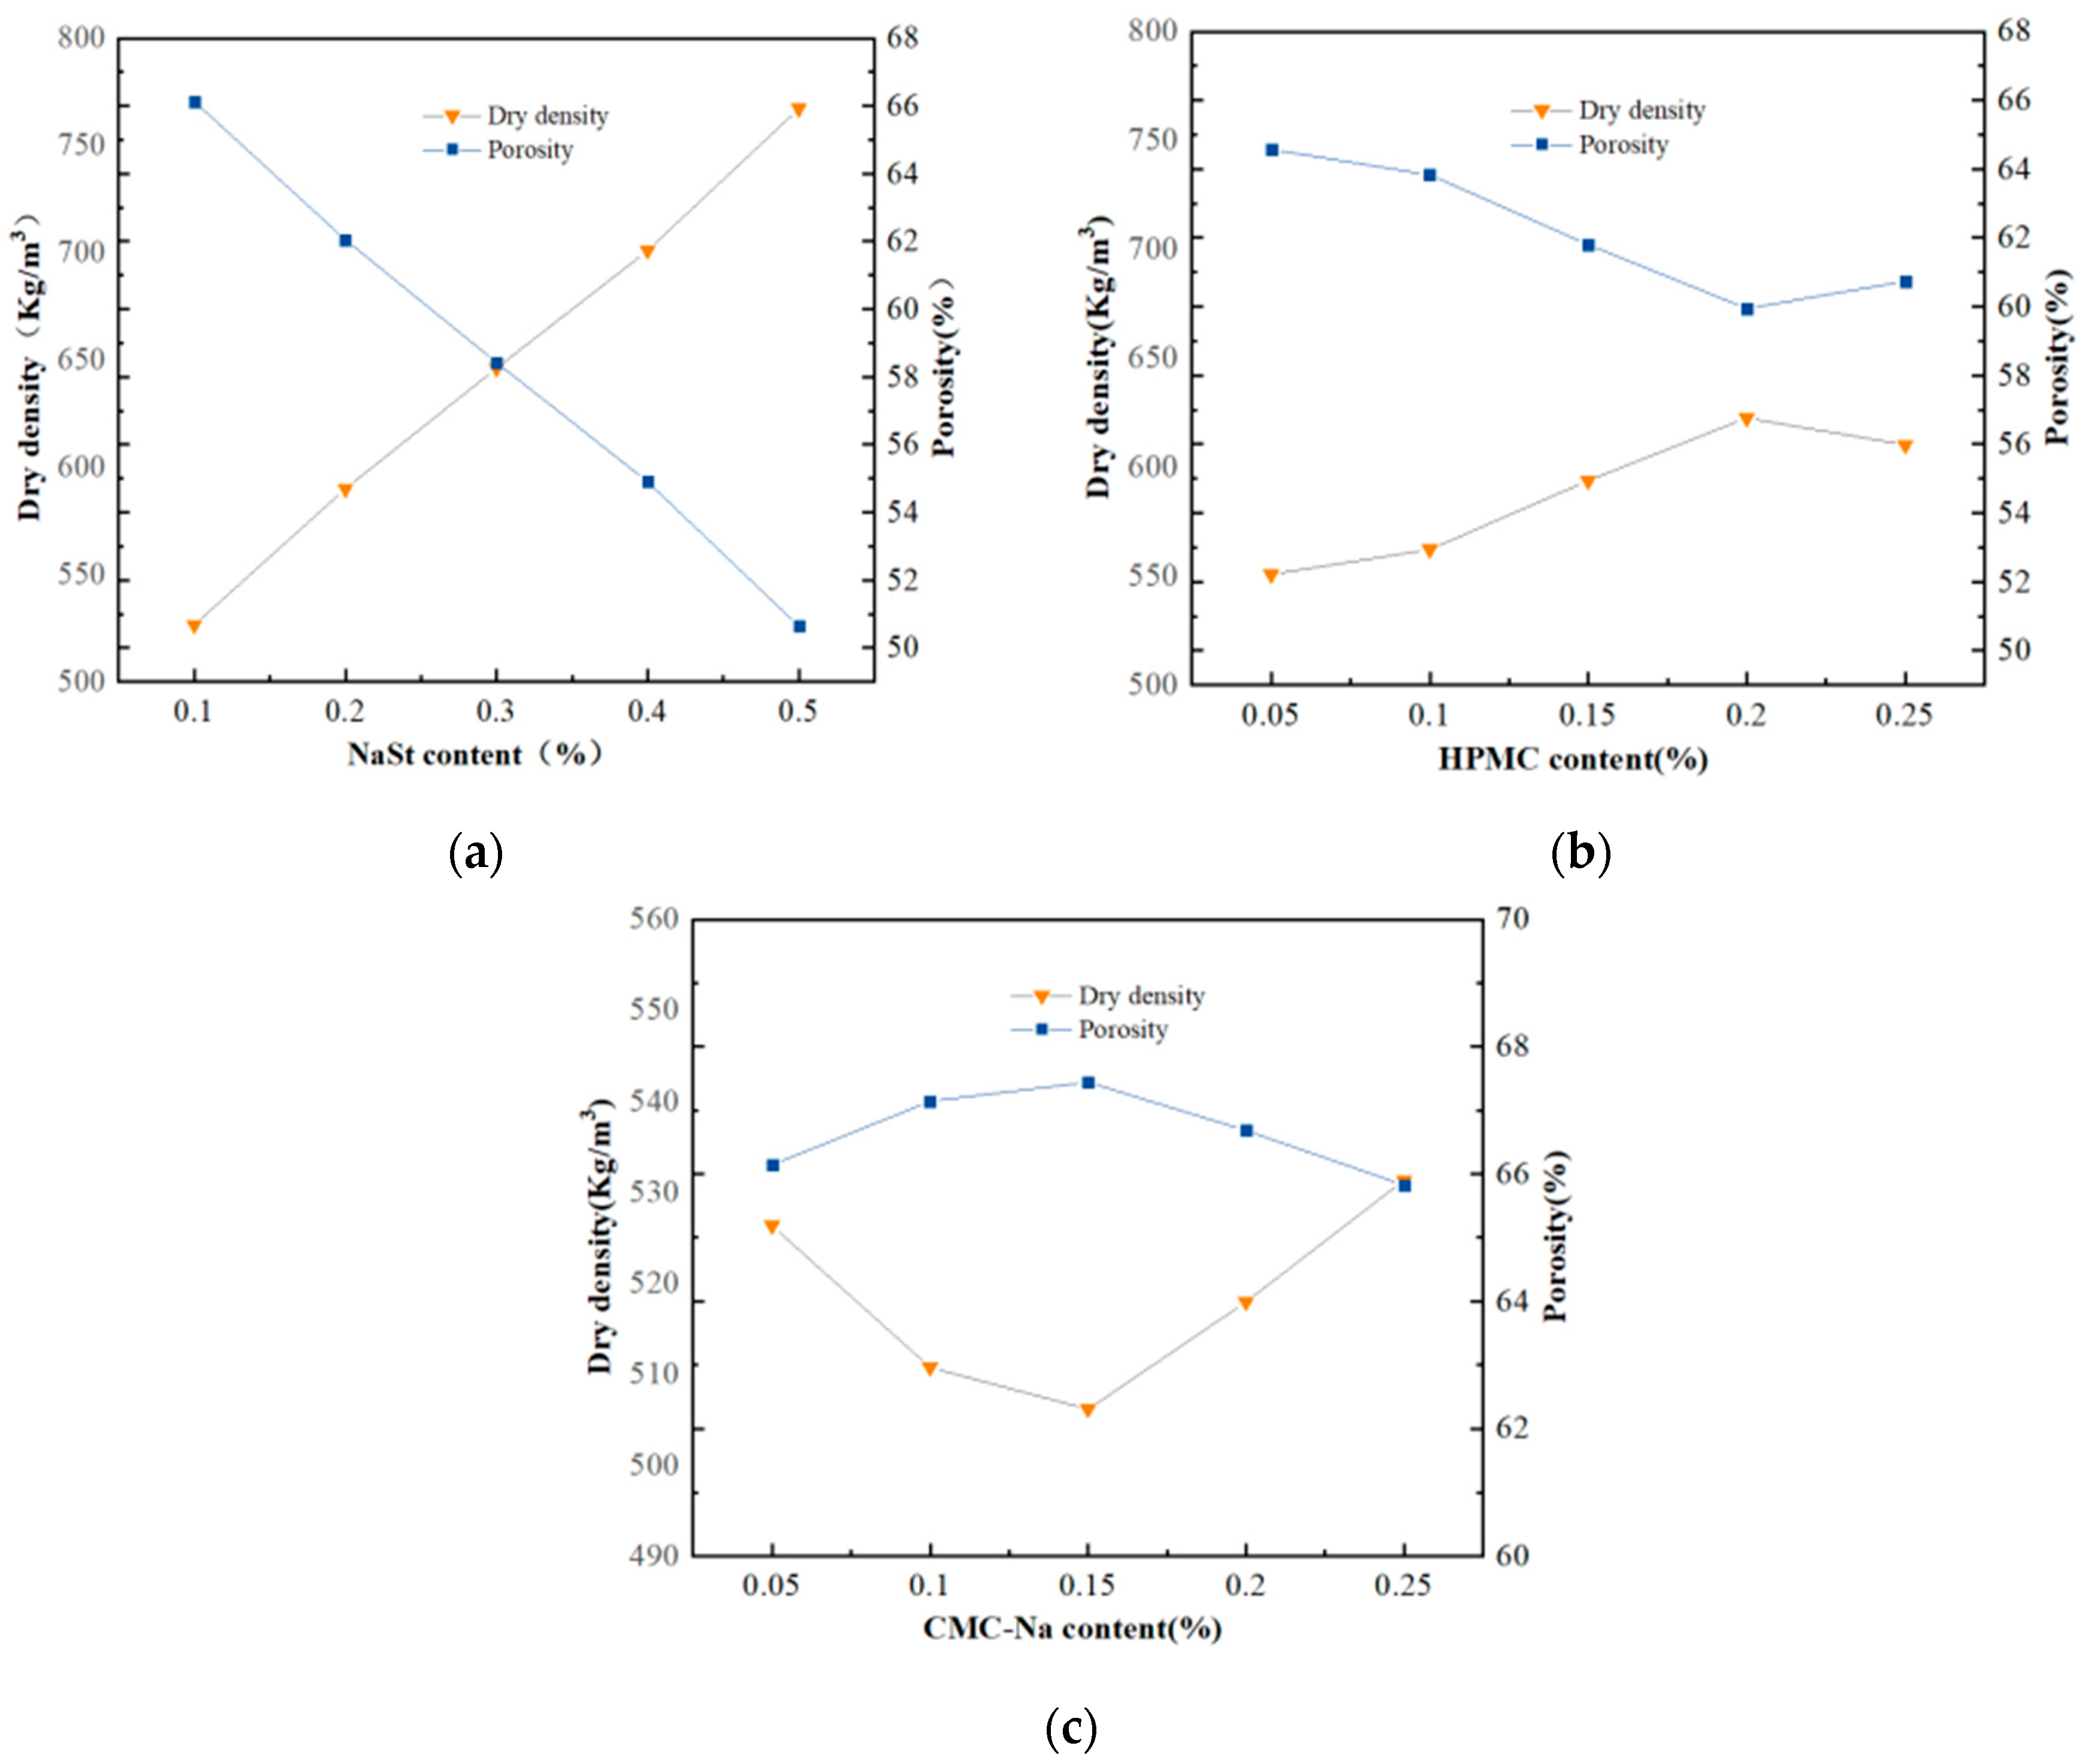
The dry density and porosity of GFC with different NaSt, HPMC, and CMC-Na contents are shown in Figure 3. The dry density of GFC reached 526.5 kg/m3 and the porosity reached 66.13% when NaSt content was 0.1%, and with the increase in mixing amount to 0.2%, 0.3%, 0.4%, and 0.5%, the dry density increased by 12.04%, 22.72%, 33.14%, and 41.92% to 589.9 kg/m3, 646.1 kg/m3, 701 kg/m3, and 747.2 kg/m3, and the porosity decreased to 62.05%, 58.43%, 54.90%, and 51.93%, respectively.
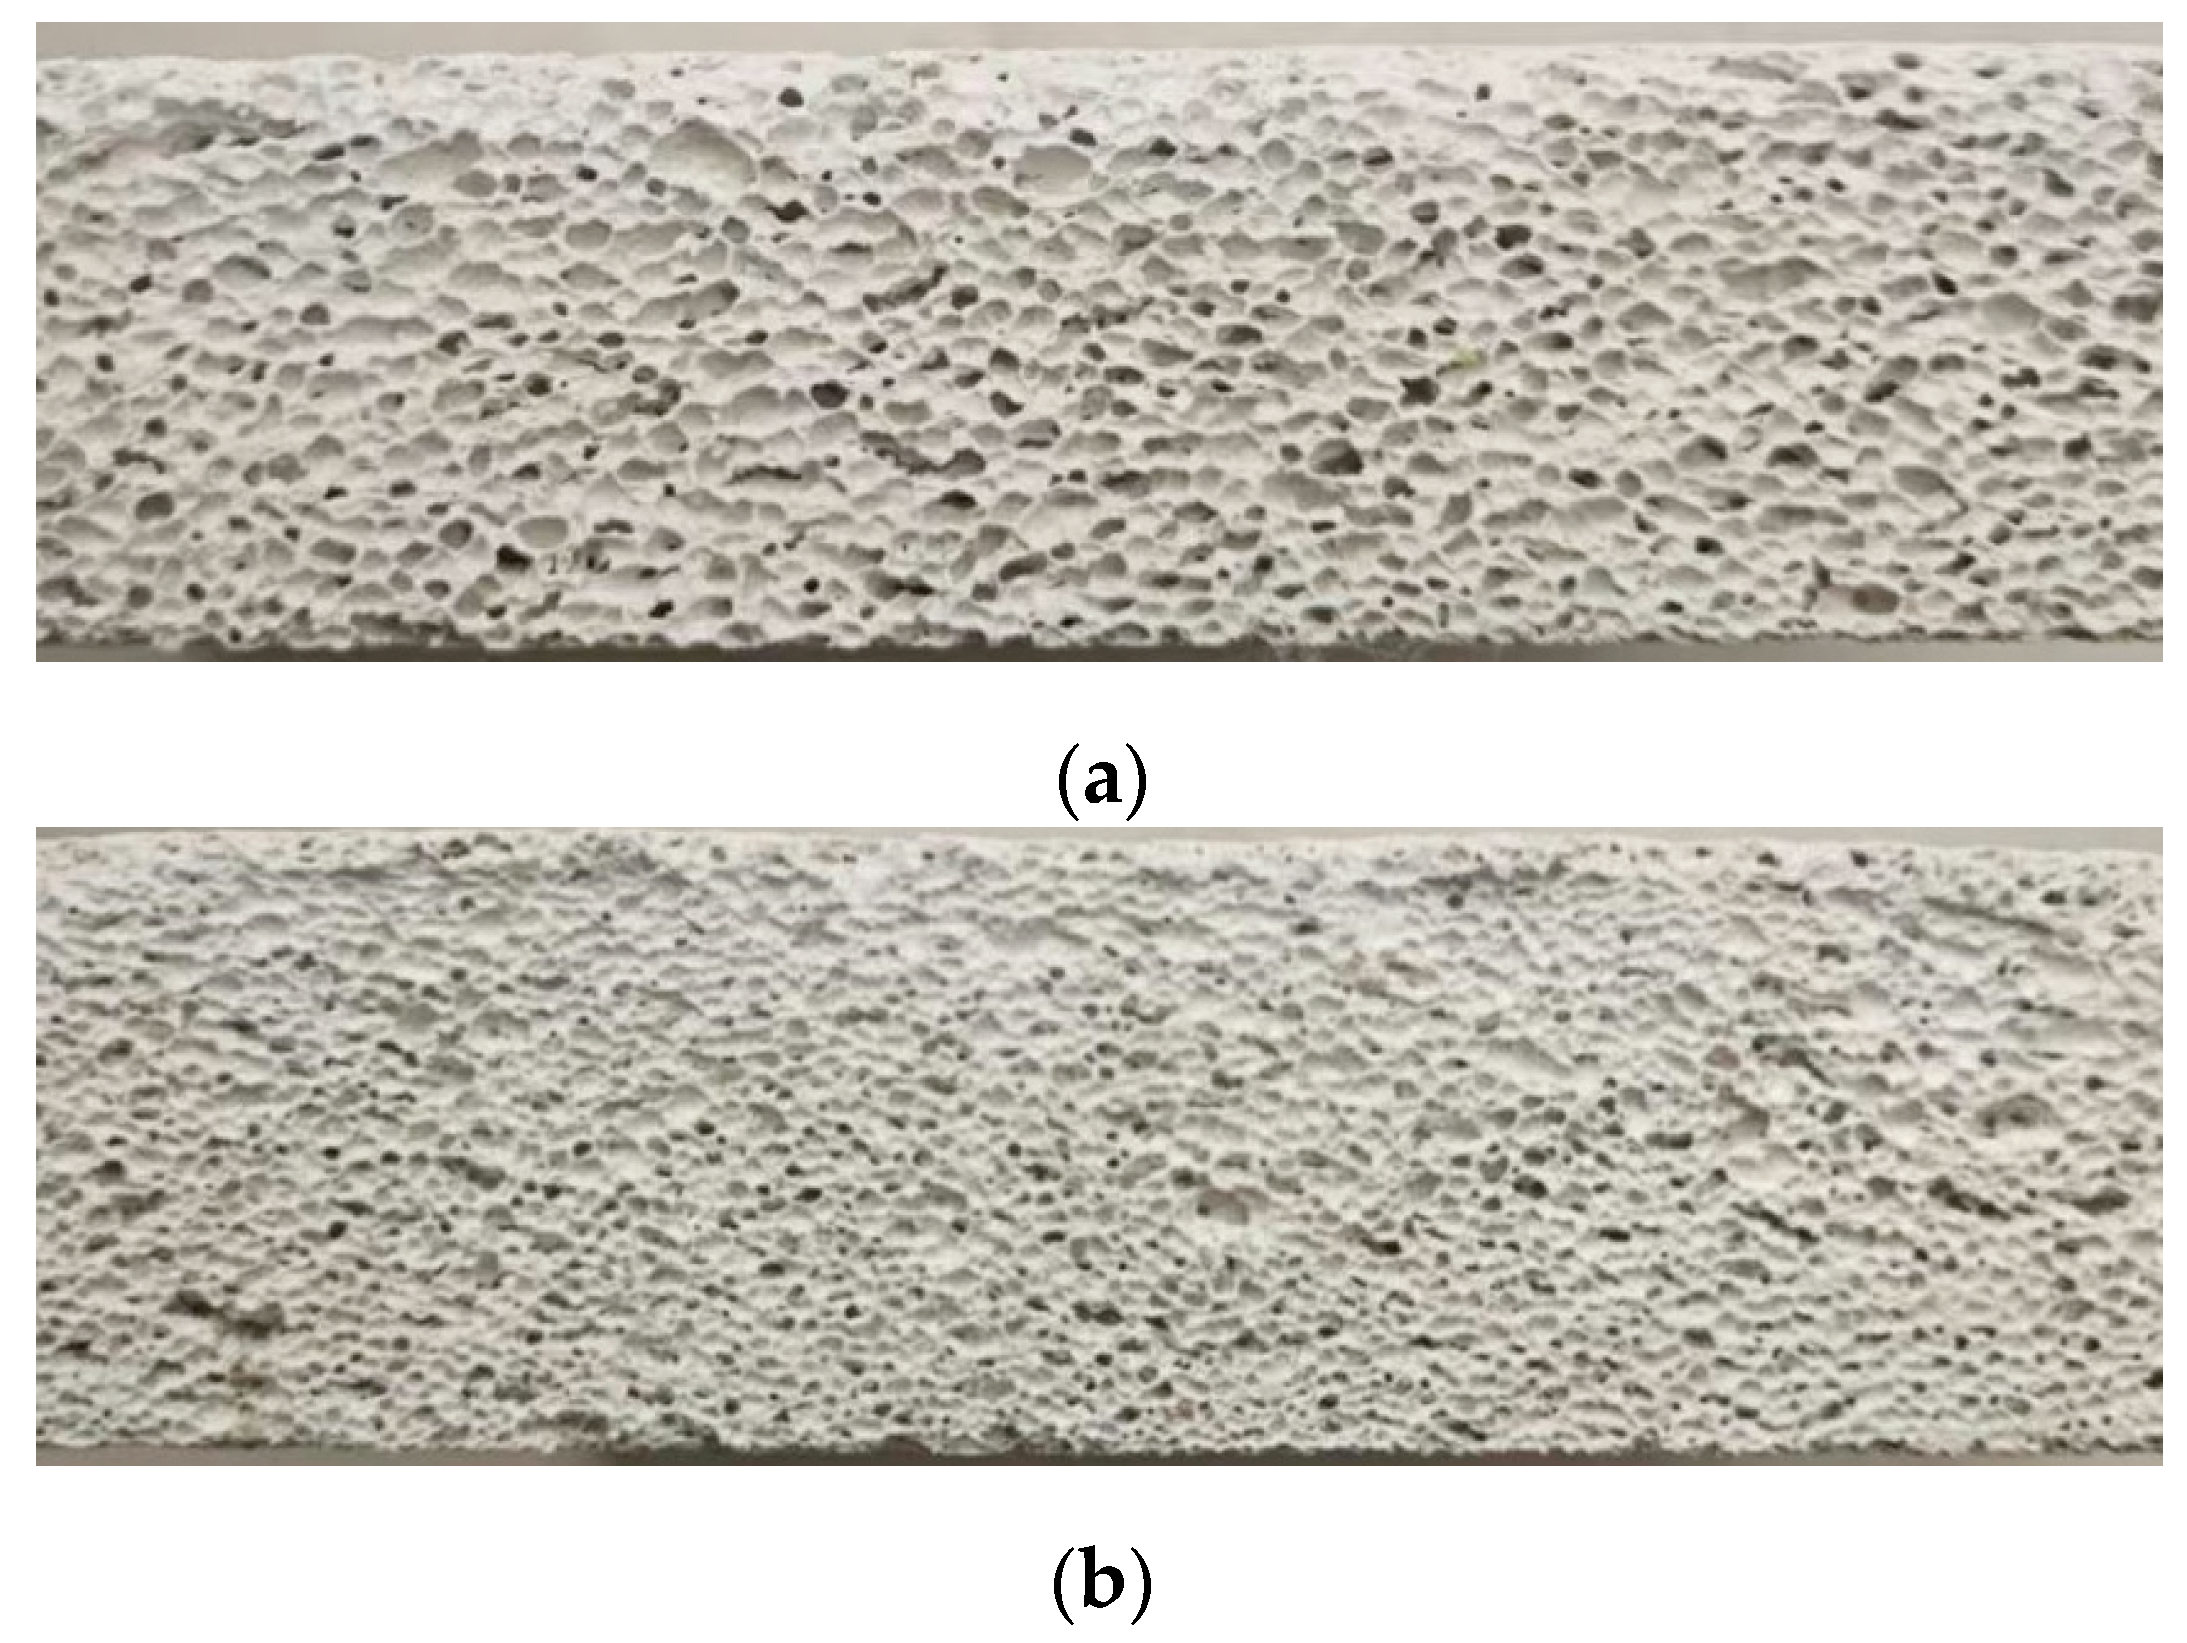
The lowest dry density was 550.7 kg/m3 with 64.57% porosity at 0.05% HPMC doping, and as the doping increased to 0.1%, 0.15%, 0.2%, and 0.25%, the dry density increased by 2.09%, 7.83%, 13.06%, and 10.80% to 562.2 kg/m3, 593.8 kg/m3, 622.6 kg/m3, and 610.2 kg/m3, respectively, and the porosity decreased to 63.83%, 61.80%, 59.94%, and 60.74%, respectively. The lowest dry density was 506.1 kg/m3 with a porosity of 67.44% when CMC-Na was doped at 0.15%, the lowest dry density was 526.1 kg/m3 with a porosity of 67.44% when it was doped at 0.05%, 0.10%, 0.20%, and 0.25%, and the dry densities were 526.3 kg/m3, 510.7 kg/m3, 517.9 kg/m3, and 531.3 kg/m3, corresponding to porosities of 66.14%, 67.14%, 66.68%, and 65.82%, respectively. From the three control groups, it can be seen that the foam concrete made with both NaSt and HPMC had the lowest dry density at the lowest dosage, which was due to the fact that there were more irregular connecting pores in the GFC at the low dosage, which increased the porosity of the foam concrete and made the dry density lower. With the increase in stabilizer dosage, the dry density increases, mainly because the stabilizer improves the pore structure, causes the formation of a small pore size, dense bubbles, and results in less merging phenomenon between bubbles, with this phenomenon being more obvious in the use of NaSt; the cross-sectional pore diameter of the GFC made by NaSt is shown in Figure 4. At the same time, it can be clearly seen from Figure 4 that the bubbles are independent of each other and present a honeycomb structure. This indicates that the bubbles maintained good stability during the foaming and solidification processes, and the pores are uniformly distributed in the structure. The dry density decreased when the dosage of HPMC was increased to 0.25%, which was mainly due to the fact that the continuous increase in the dosage of foam stabilizer would lead to part of the HPMC not participating in the reaction remaining on the surface of the slag powder, which would affect the decomposition of hydrogen peroxide. The dry density of CMC-Na decreased when the dosage was increased from 0.05% to 0.15%, which was mainly due to the fact that CMC-Na could greatly slow down the flow rate of gas bubbles, prolong the duration of the foaming phase, and allow the gas to continue to be generated and retained. When the dosage is increased again, the dry density rises, which is due to the collision phenomenon that occurs when too many bubbles are retained in the material, resulting in the collapse of bubbles or the formation of large holes, which in turn increases the dry density. However, in general, the dry density of GFC using CMC-Na is generally low, fluctuating around 520 kg/m3, and the effect of dosage change on it is not obvious.

4.4. Thermal Conductivity

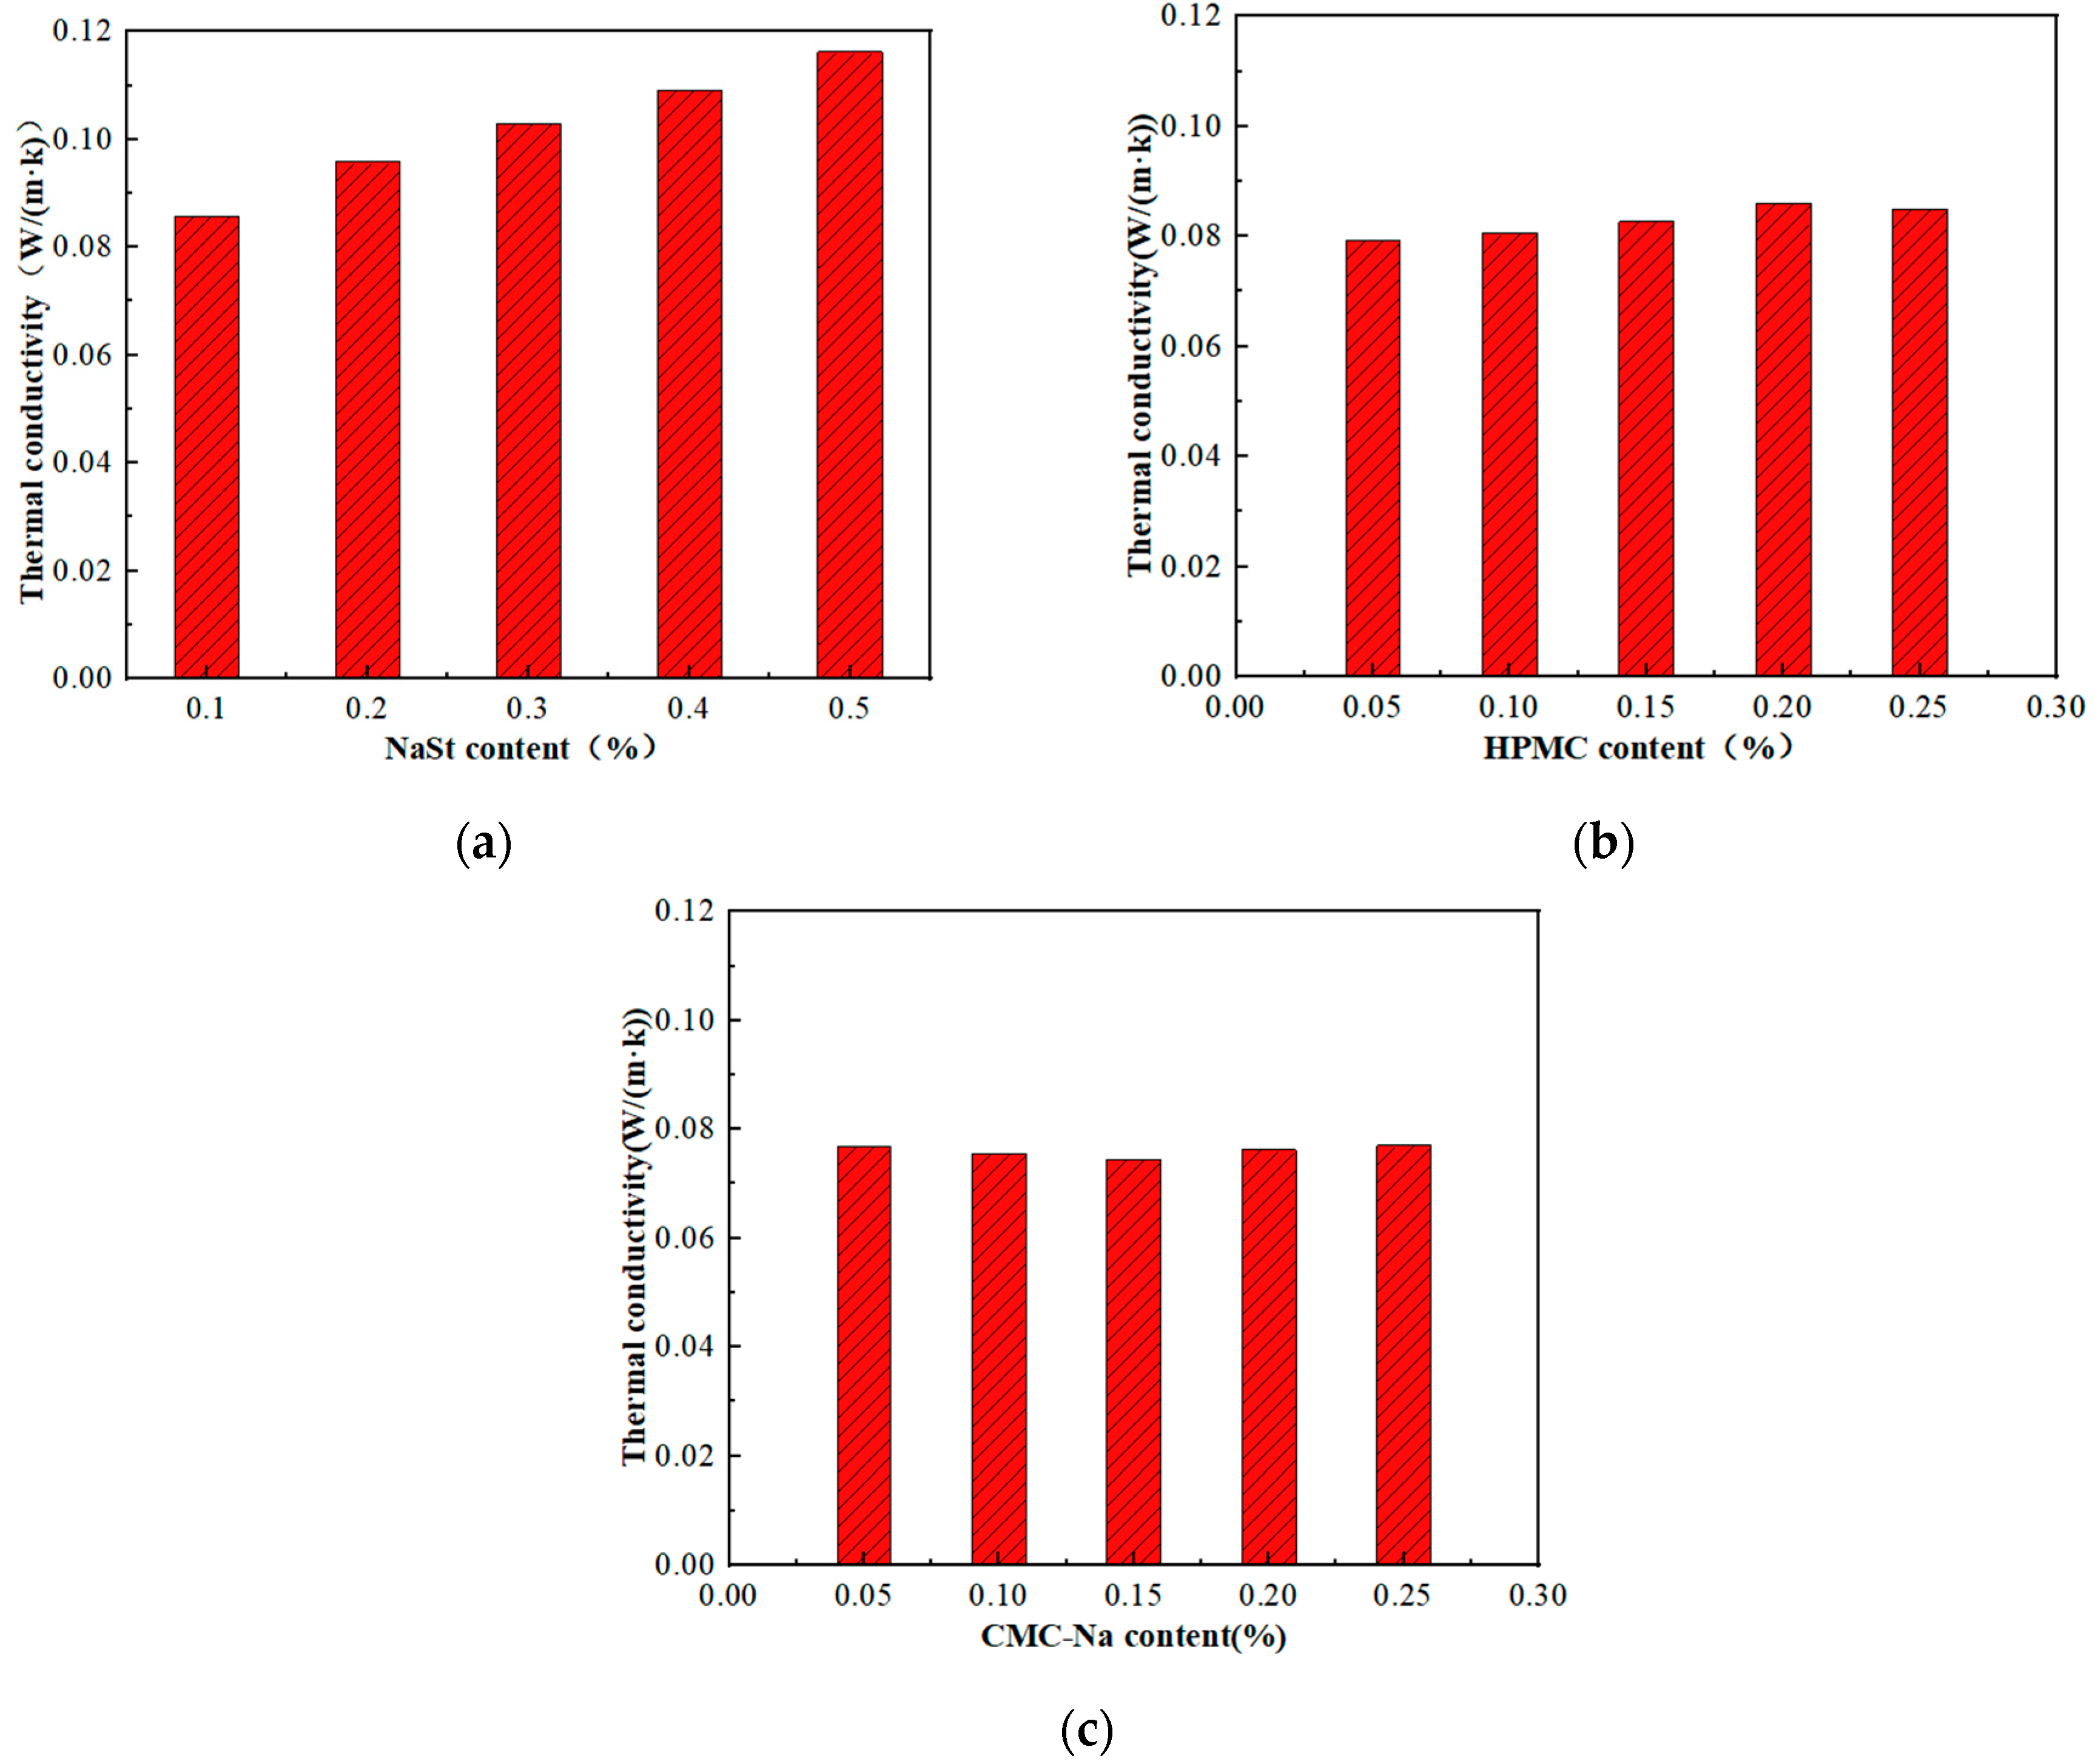
The thermal conductivity of GFC with different NaSt, HPMC, and CMC-Na contents is shown in Figure 5. The thermal conductivity of GFC was 0.08578 W/(m·k) at 0.1% NaSt content, and as the mixing amount was increased to 0.2%, 0.3%, 0.4%, and 0.5%, the thermal conductivity increased by 17.39%, 21.15%, 25.94%, 27.91% to 0.10070 W/(m·k), 0.10392 W/(m·k), 0.10803 W/(m·k), and 0.11035 W/(m·k). The thermal conductivity of GFC was 0.07924 W/(m·k) for HPMC content of 0.05%, and increased by 1.6%, 4.3%, 8.5%, and 7.3% with the increase in admixture amount up to 0.1%, 0.15%, 0.2%, and 0.25% to 0.08052 W/(m·k), 0.08268 W/(m·k), 0.08598 W/(m·k), and 0.08502 W/(m·k), respectively. The thermal conductivity of GFC with CMC-Na content of 0.15% was 0.07438 W/(m·k), with the contents of 0.05%, 0.10%, 0.20%, and 0.25%, corresponding to thermal conductivity of 0.07686 W/(m·k), 0.07552 W/(m·k), 0.07620 W/(m·k), and 0.07705 W/(m·k), respectively. Compared to the NaSt control group, the GFC with CMC-Na and HPMC has better thermal conductivity, which shows that the viscosity stabilizer has a better effect than the synergistic stabilizer in improving the thermal conductivity, and the change in viscosity stabilizer dosage has a smaller effect on the thermal conductivity.

4.5. Material Bubble Pore Size

The larger pore size of GFC with different dosages of the stabilizing agent was identified using image recognition technology, and then the average pore size of the larger holes was calculated, which resulted in the average pore sizes of the stabilizing agents with different dosages and the corresponding thermal conductivity as shown in Table 3, and the effect of porosity and average pore size on the thermal conductivity as shown in Figure 6. From the table, it can be seen that the macroporous pore sizes of GFC made with CMC-Na, HPMC, and NaSt range from 0.297 to 0.409 mm, 0.347 to 0.509 mm, and 0.598 to 0.831 mm, respectively; the GFC made with the viscosity stabilizing agent has smaller pore sizes and better bubble stability. The foam concrete made with 0.05% CMC-Na has a porosity of 66.14% and a thermal conductivity of 0.07686 W/(m·k), while the foam concrete made with 66.13% porosity using 0.10% NaSt has a thermal conductivity of 0.08578 W/(m·k), which is mainly due to the fact that the average pore size of the former is smaller, which increases the material thermal resistance and thus decreases the thermal conductivity.

5. Results and Analysis

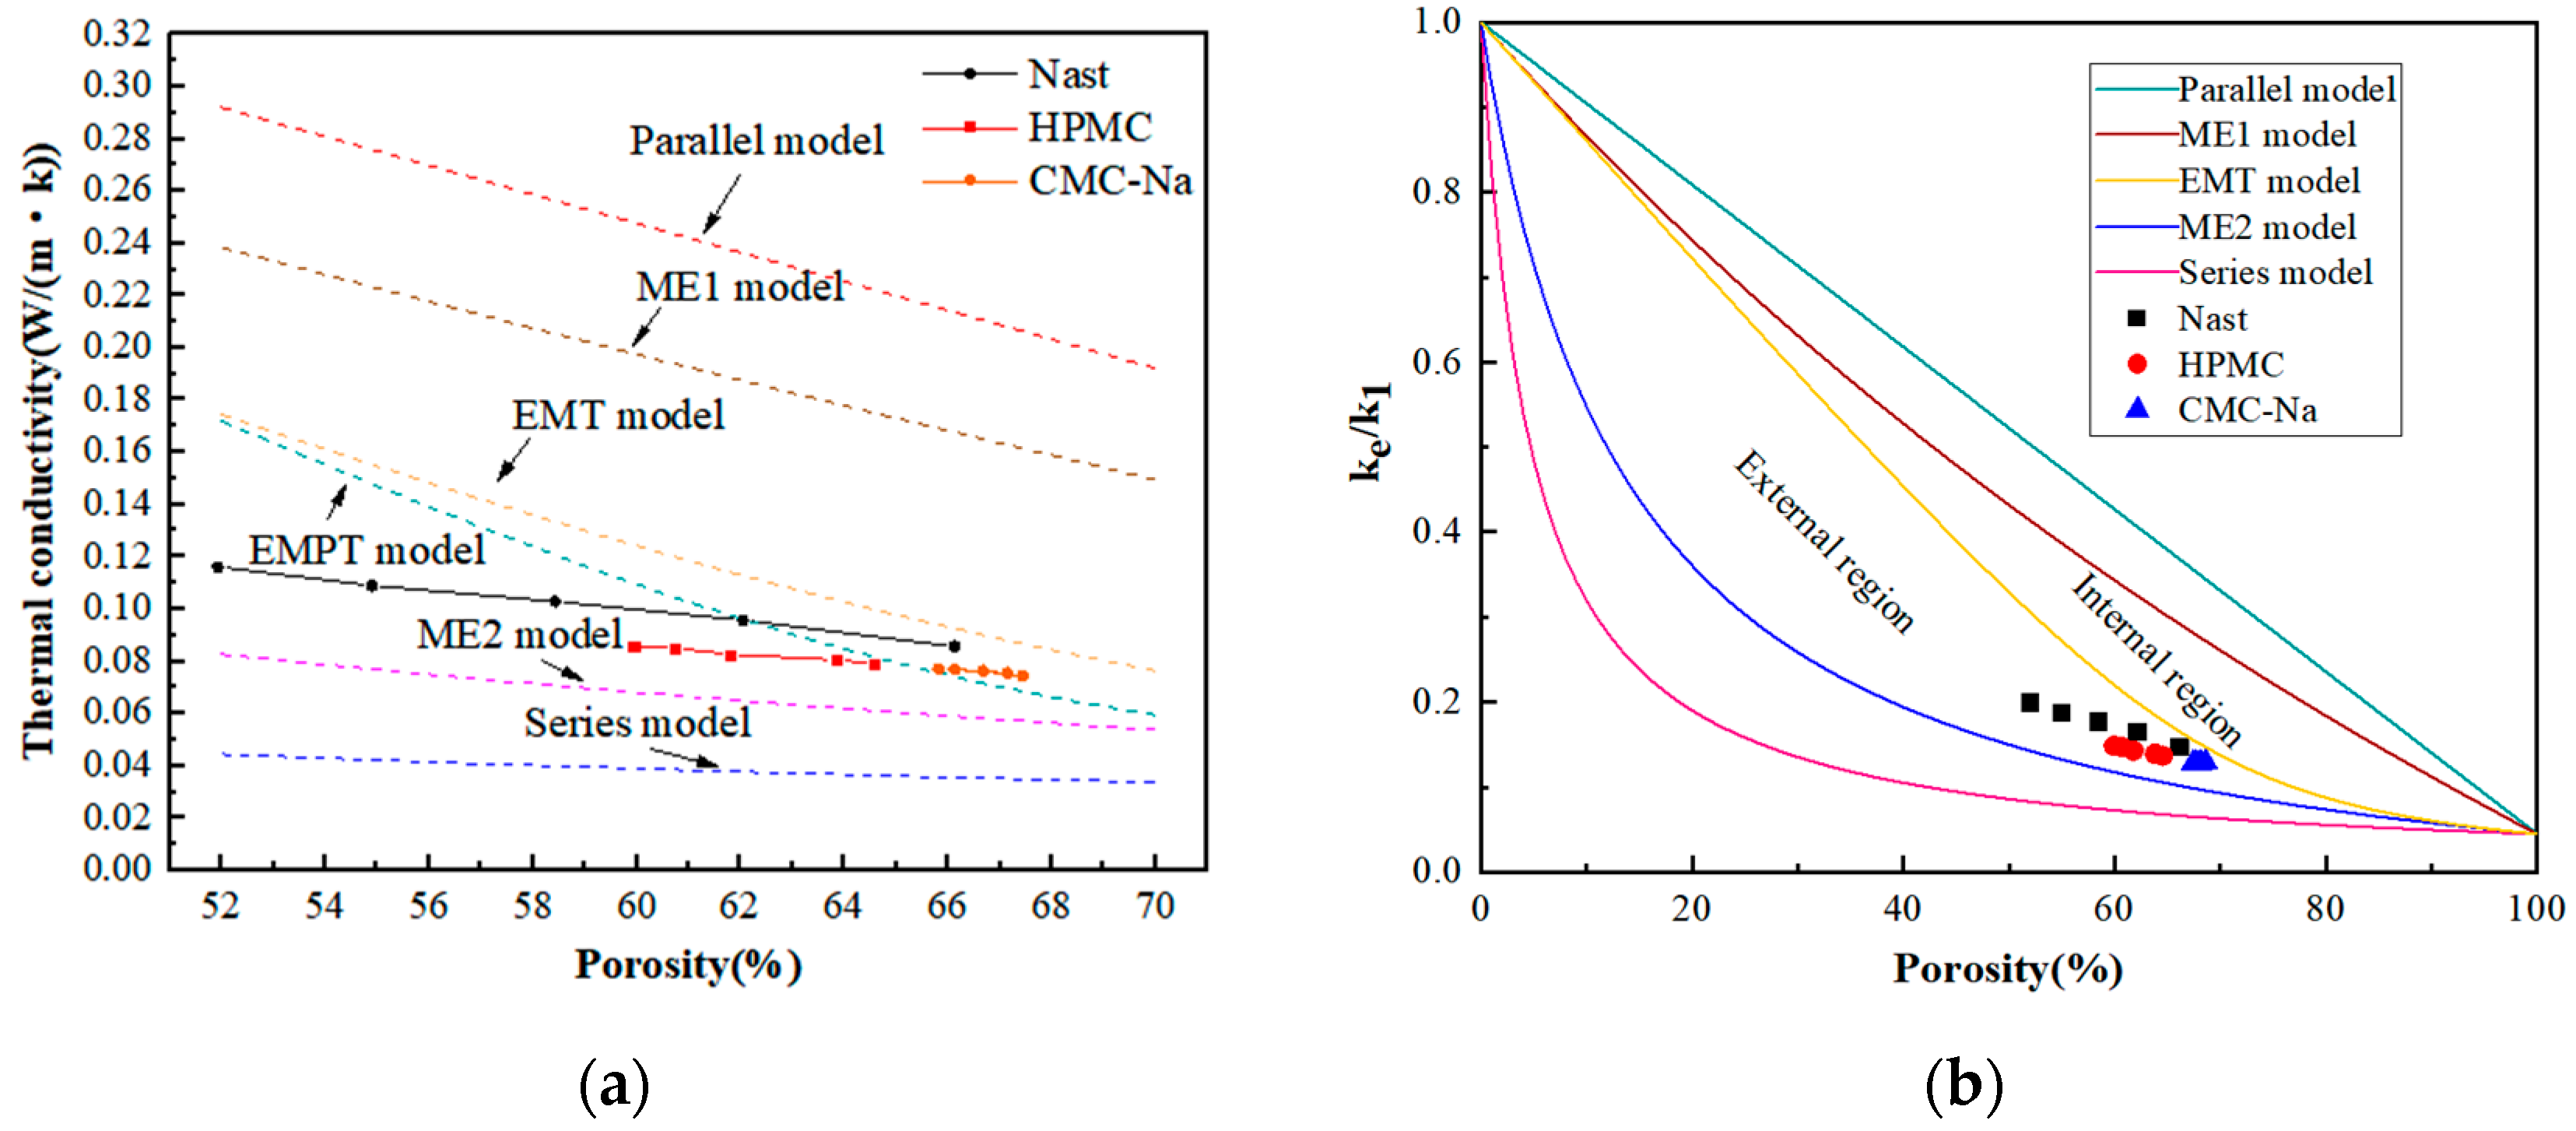
A comparison of the traditional structural model of the relationship between porosity and thermal conductivity of GFC with different stabilizer dosages is shown in Figure 7a. Meanwhile, in order to show the structural model of the GFC more clearly, the relative thermal conductivity ( k e / k 1 ) model is plotted as shown in Figure 7b, where the porous material is divided into internal and external porous materials by Carson et al. [30].
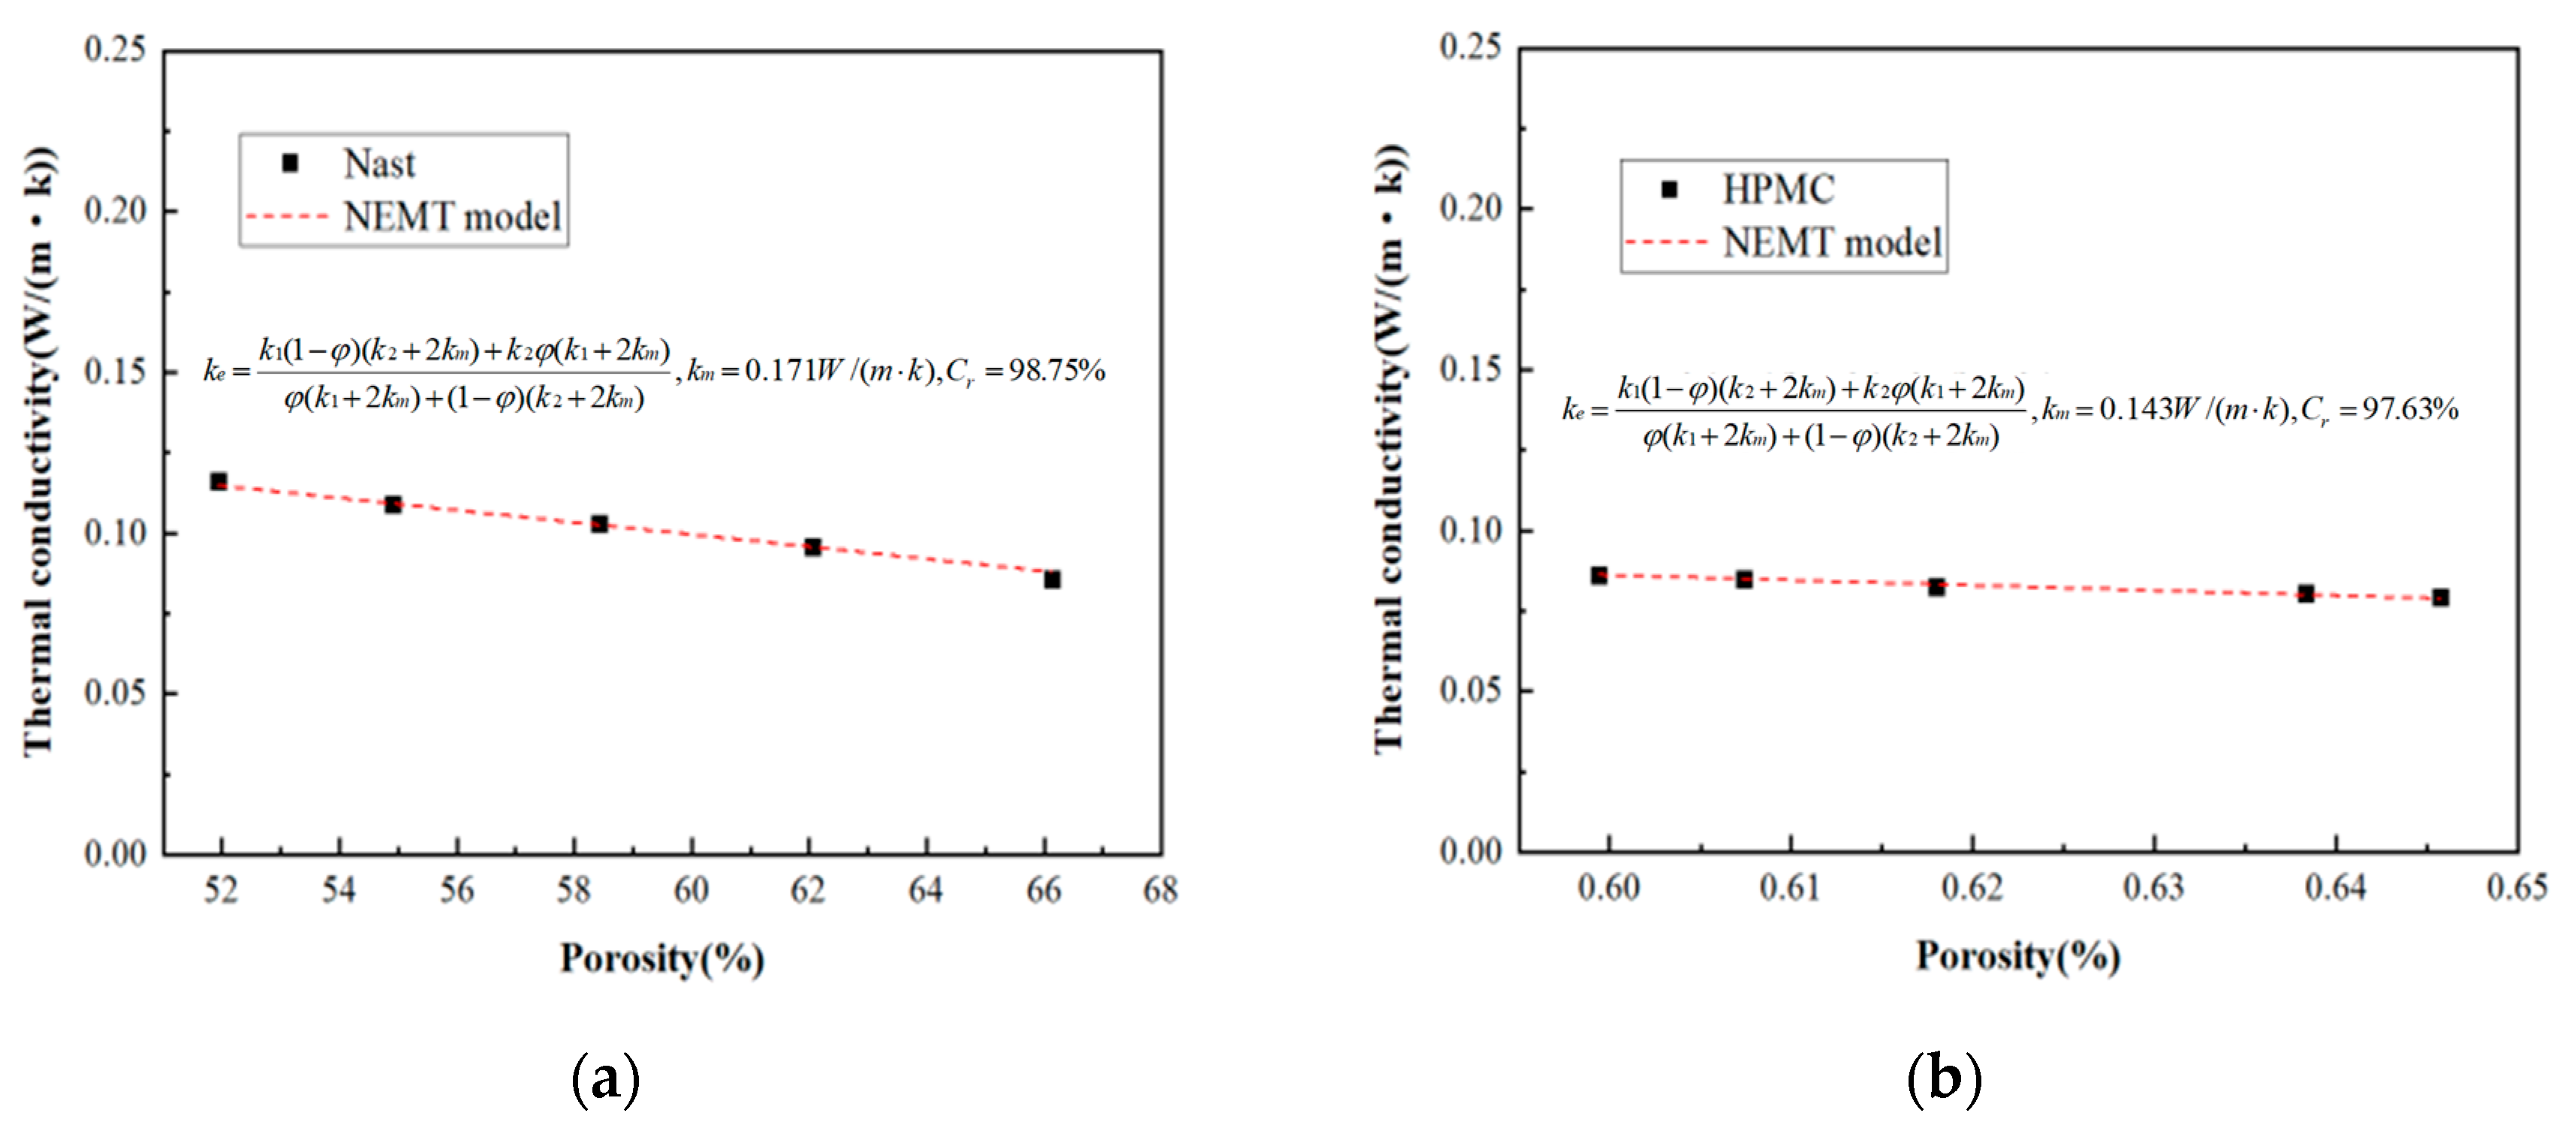
As shown in Figure 8, the NEMT model was used to fit the three sets of experimental data, and the unique coefficient solutions km = 0.171 W/(m·k), 0.143 W/(m·k), 0.144 W/(m·k) were obtained by regression, where the parameters can be adjusted; all three sets of data showed a good correlation in the NEMT model. The response is the heat transfer between the solid and the air, for example, when km = 0 behaves as a parallel model and when km = 1 behaves as a series model. The three regression solutions in this test intermediate between km = 0.07 W/(m·k) for dry sand material and km = 0.80 W/(m·k) for cellular ceramic material [16], which shows that the GFC has a structure within it that is similar to that of dry sand in terms of heat transfer through the air phase.
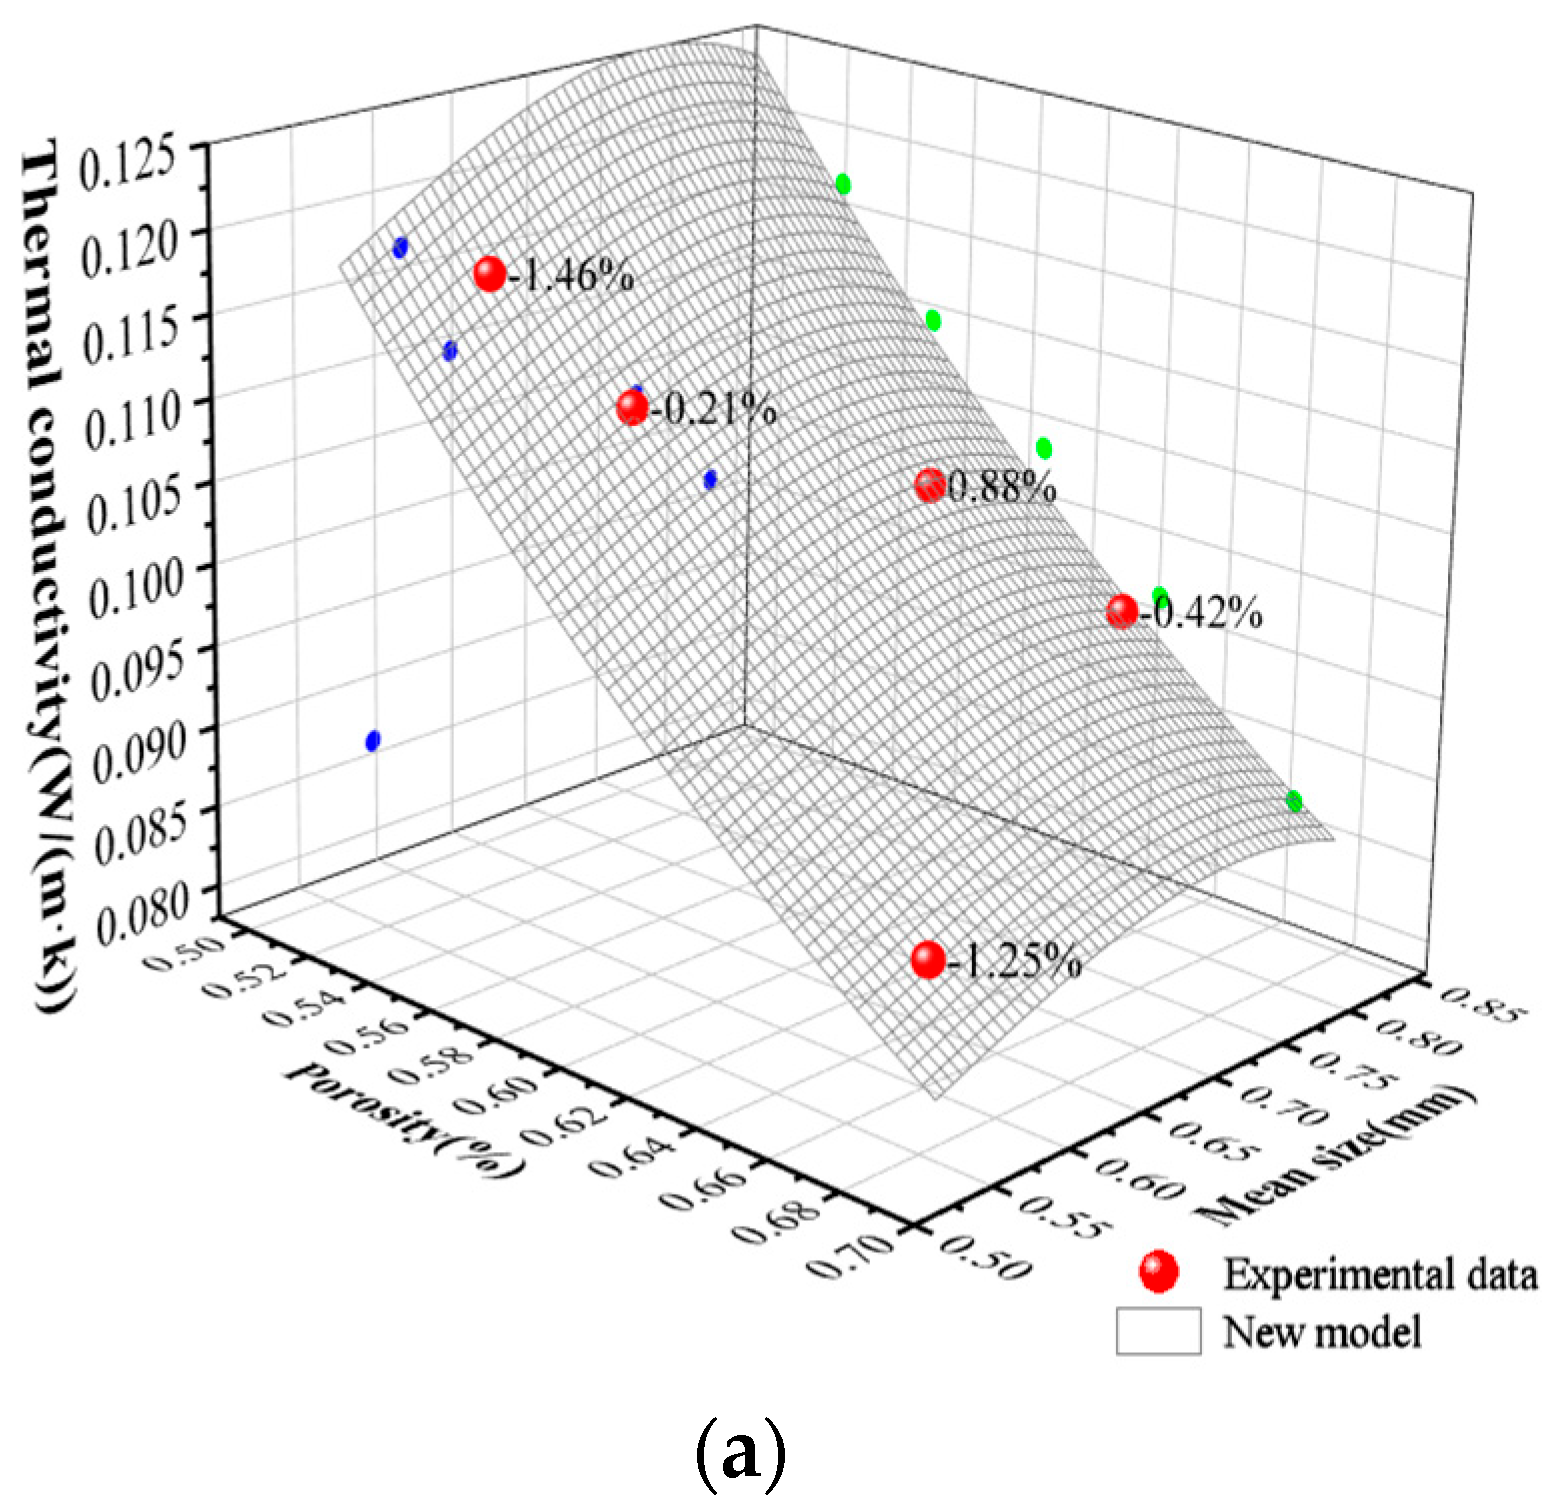
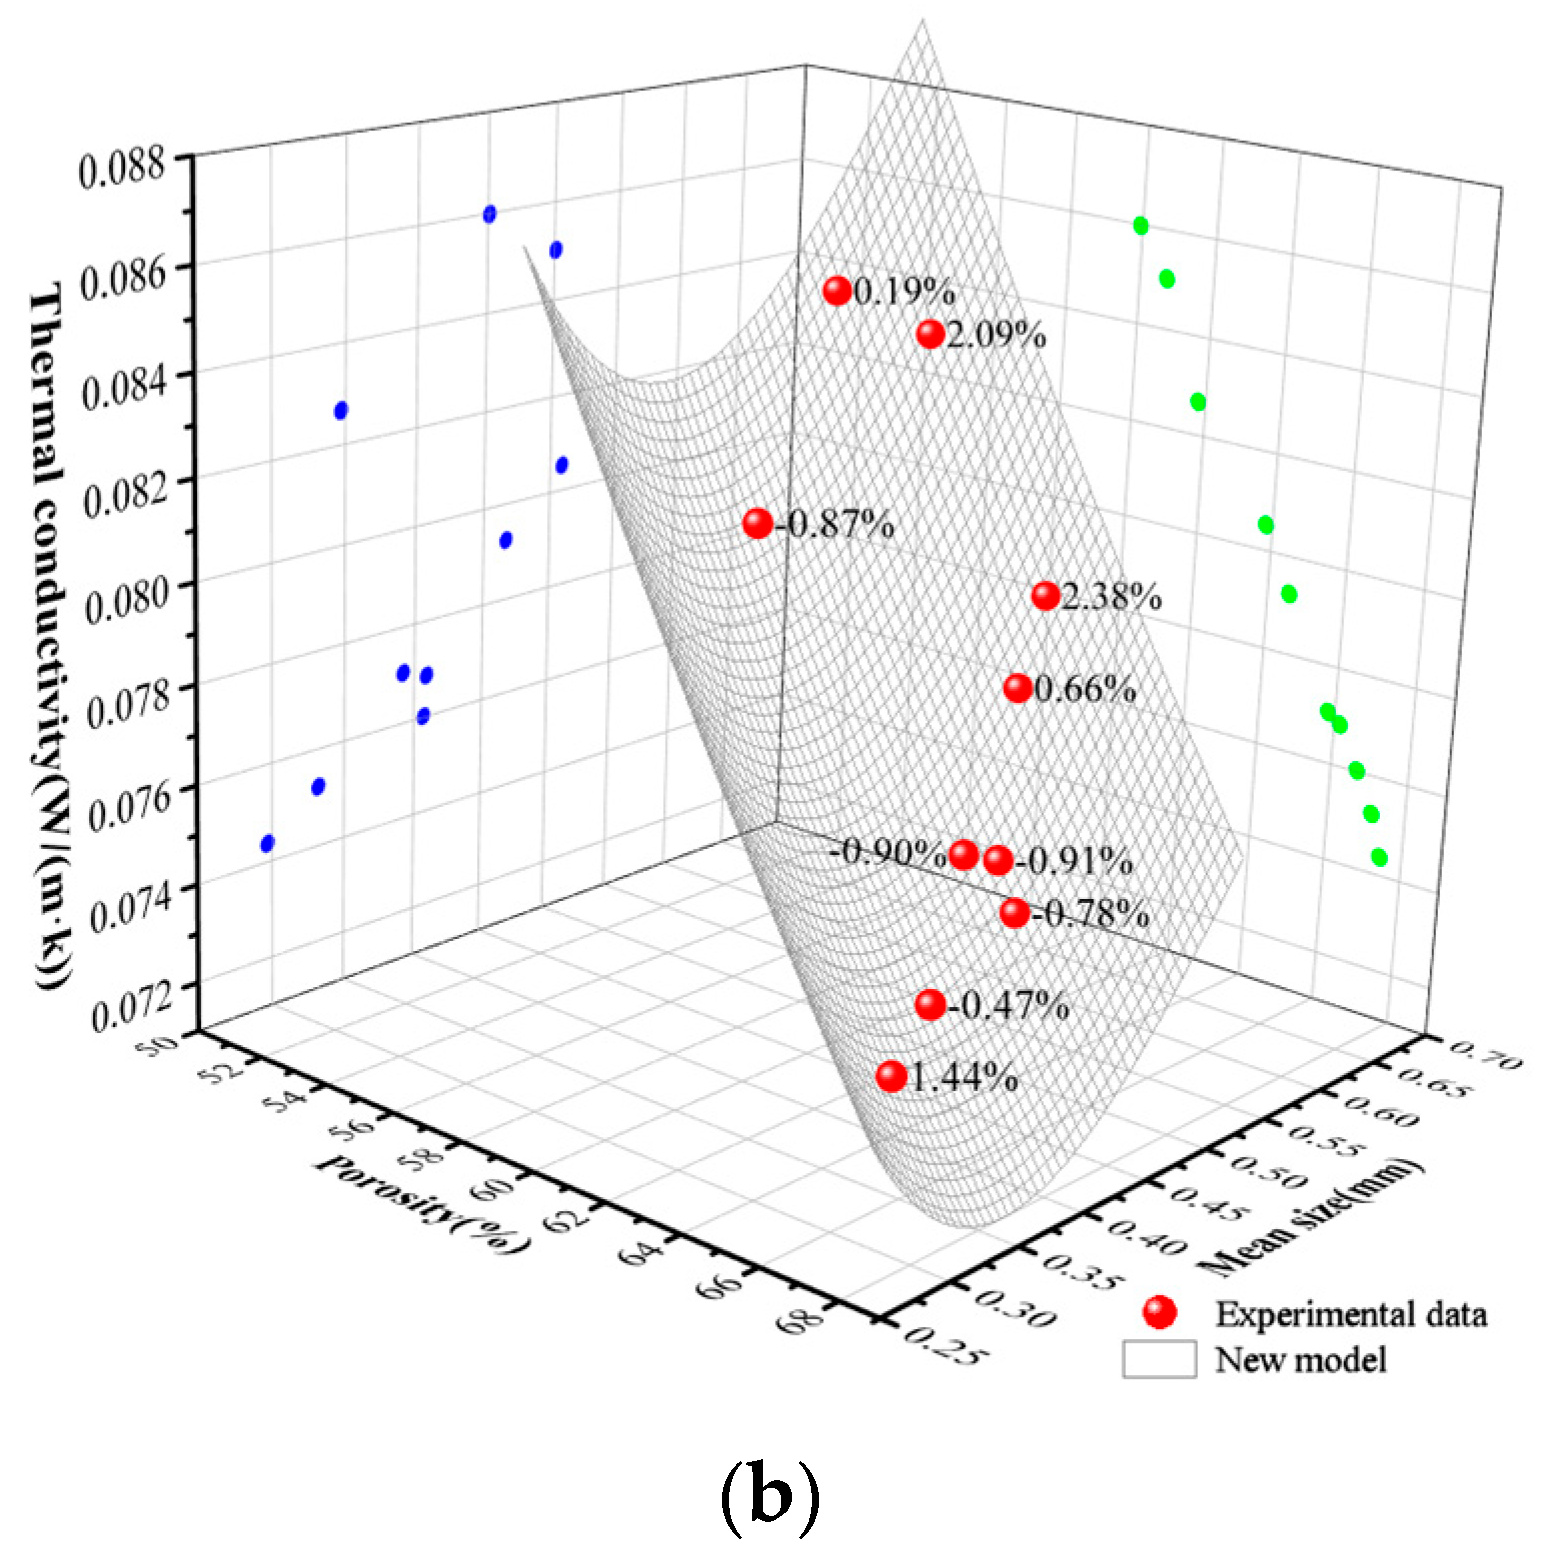
Significant discrepancies exist between model predictions of the traditional thermal conductivity model and the data measured in the tests. The new model was fitted to the three sets of test data to obtain the values of a and t. For the viscosity stabilizing agents HPMC and CMC-Na, t = 1.2; for the synergistic stabilizing agent NaSt, t = 1.3. Parameters a and d were correlated and fitted, yielding Equation (8) and subsequently Equation (11). As shown in Figure 9a, the error between the theoretical and experimental values is labeled next to the experimental data, and it can be seen from the figure that the two are basically in line with each other. The comparison between the theoretical and experimental values of the thermal conductivity of the NaSt specimen is shown in Figure 9b, and the two are basically in line with each other as well.
k e = 3.25 8.31 d + 16.69 d 2 9.81 d 3 φ t k 2 + 1 φ t k 1 ( 1 φ ) t
The test data of porosity, thermal conductivity of porous materials, and thermal conductivity of pure solid materials (k1) in different studies were selected to apply the formulae, but some scholars did not carry out thermal conductivity tests of pure solid materials. By checking the literature, it is known that Othuman et al. [19] used cement to make lightweight porous materials and calculated the base thermal conductivity of pure solids as 0.52, 0.49, and 0.50 W/(m·k), respectively, and took the average value of 0.50 W/(m·k) as the thermal conductivity of pure solids; Cui et al. [15] made the thermal conductivity of geopolymer solids as 0.55 W/(m·k); Wei et al. [31] used 0.50 W/(m·k) for the thermal conductivity of pure solid materials. According to the previous research results and the thermal conductivity test results of pure solid materials in this paper, for the literature [14,32] where k1 is not mentioned, take k1 as 0.50 W/(m·k). The values of a and t can be obtained through curve fitting; the fitting results of the test data are shown in Table 4 below.
From the fitting correlation in the table, it can be seen that the formula is applicable to different porous materials. The t value is related to the pore distribution, where the larger the porosity is, the more disordered the pore distribution is, and the t value increases accordingly. Comprehensive experimental data in this paper and the literature data in the table can be classified according to the porosity of the porous material t value: when the porosity in about 30%, the t value is 0.9; when the porosity in 55~65%, the t value is in the range of 1.2~1.3; when the porosity in about 80%, the t value is in the range of 1.9~2.2.

6. Conclusions

(1)
The thermal conductivity of GFC reaches the lowest value of 0.07438 W/(m·k) when CMC-Na with a dosage of 0.15% is used as the foam stabilizer. The viscosity increasing stabilizing agents such as CMC-Na and HPMC have a better effect than the synergistic stabilizing agent NaSt in improving the thermal conductivity, and the change in viscosity increasing stabilizing agent mixing amount has less of an effect on the thermal conductivity.
(2)
In this paper, when using the image recognition technology to measure the pore size of GFC bubbles, the range of macroporous pore sizes of GFC made by using CMC-Na, HPMC, and NaSt is 0.297~0.409 mm, 0.347~0.509 mm, and 0.598~0.831 mm, respectively; GFC made by viscosity stabilizing agent has a smaller pore size.
(3)
A new theory is proposed to predict the thermal conductivity of GFC. The experimental data of GFC in this paper and the experimental data of previous literature show that the thermal conductivity predicted by the model is basically consistent with the experimental results. Meanwhile, the pore distribution parameter t in the new model is categorized by the experimental data in this paper and the previous literature. Our long-term objective is to conduct extensive and systematic experiments to build a comprehensive database encompassing different material systems and processes. This database will then be used to train a machine learning algorithm, ultimately creating a big data model capable of recommending or predicting the values of parameters a and t directly based on various input conditions such as material formulation and foaming agent type. This approach is expected to significantly enhance the model’s universality and predictive power.
(4)
In the present study, due to the high cost and relatively low efficiency of 3D-CT scanning, an image recognition technique was employed for pore size measurement based on 2D images. With the increasing maturity of AI-3D reconstruction technology, which can potentially achieve reconstruction from multiple photographs and address the cost and efficiency limitations of 3D-CT scanning, the image recognition method adopted in this study can serve as a valuable reference for subsequent researchers.
(5)
Additionally, pore structural parameters such as the proportion of micropores and connectivity significantly impact thermal conductivity. However, these parameters exhibit complex interdependencies—for instance, in GFC, high porosity drastically increases pore connectivity. This interplay makes it challenging to isolate the influence of individual parameters on thermal modeling. Given the inherent complexity of pore structures, incorporating all potential factors is impractical. Therefore, this study focuses on key pore structural parameters to balance model complexity with accuracy. Future research will expand predictive capabilities by integrating additional influential variables.

Author Contributions

Methodology, Supervision, J.L., Q.X., M.L., H.F., Z.D. and L.J.; Data curation, Formal analysis, Writing—original draft, Y.X.; Investigation, Writing—review & editing, W.C. All authors have read and agreed to the published version of the manuscript.

Funding

This study was supported by the Shandong Higher Education Institutions Young Creative Talents Science and Technology Support Program (TJY2303).

Data Availability Statement

The original contributions presented in the study are included in the article, further inquiries can be directed to the corresponding author.

Conflicts of Interest

Author Haibo Fang was employed by the company China Construction Eighth Engineering Division Second Construction Co., Ltd. The remaining authors declare that the research was conducted in the absence of any commercial or financial relationships that could be construed as a potential conflict of interest.

References

  1. Tuyan, M.; Andiç-Çakir, Ö.; Ramyar, K. Effect of alkali activator concentration and curing condition on strength and microstructure of waste clay brick powder-based geopolymer. Compos. Part B Eng. 2018, 135, 242–252. [Google Scholar] [CrossRef]
  2. Pasupathy, K.; Ramakrishnan, S.; Sanjayan, J. Formulating eco-friendly geopolymer foam concrete by alkali-activation of ground brick waste. J. Clean. Prod. 2021, 325, 129180. [Google Scholar] [CrossRef]
  3. Dang, J.; Hao, L.; Xiao, J.; Ding, T. Utilization of excavated soil and sewage sludge for green lightweight aggregate and evaluation of its influence on concrete properties. J. Clean. Prod. 2023, 390, 136061. [Google Scholar] [CrossRef]
  4. Dang, J.; Zhao, S.; Chen, G.; Cao, X.; Yang, J. Effect of polyethylene powder and heating treatment on the microstructure and hardened properties of foam concrete. J. Build. Eng. 2022, 50, 104143. [Google Scholar] [CrossRef]
  5. Dhasindrakrishna, K.; Pasupathy, K.; Ramakrishnan, S.; Sanjayan, J. Effect of yield stress development on the foam-stability of aerated geopolymer concrete. Cem. Concr. Res. 2020, 138, 106233. [Google Scholar] [CrossRef]
  6. She, W.; Du, Y.; Miao, C.; Liu, J.; Zhao, G.; Jiang, J.; Zhang, Y. Application of organic- and nanoparticle-modified foams in foamed concrete: Reinforcement and stabilization mechanisms. Cem. Concr. Res. 2018, 106, 12–22. [Google Scholar] [CrossRef]
  7. Huo, W.; Zhu, Z.; Sun, H.; Yang, L.; Zhang, C. Estimating the relationships between initial constituent molar ratios and physical–mechanical properties of RCFP-GBFS based geopolymers. Constr. Build. Mater. 2023, 406, 133409. [Google Scholar] [CrossRef]
  8. Singh, B.; Ishwarya, G.; Gupta, M.; Bhattacharyya, S. Geopolymer concrete: A review of some recent developments. Constr. Build. Mater. 2015, 85, 78–90. [Google Scholar] [CrossRef]
  9. Liew, Y.; Heah, C.; Mustafa, A.; Kamarudin, H. Structure and properties of clay-based geopolymer cements: A review. Prog. Mater. Sci. 2016, 83, 595–629. [Google Scholar] [CrossRef]
  10. Nie, Q.; Hu, W.; Huang, B.; Shu, X.; Qiang, H. Synergistic utilization of red mud for flue-gas desulfurization and fly ash-based geopolymer preparation. J. Hazard. Mater. 2019, 369, 503–511. [Google Scholar] [CrossRef]
  11. Hu, W.; Nie, Q.; Huang, B.; Shu, X. Investigation of the strength development of cast-in-place geopolymer piles with heating systems. J. Clean. Prod. 2019, 215, 1481–1489. [Google Scholar] [CrossRef]
  12. Mclellan, B.; Williams, R.; Lay, J.; Riessen, A.; Corderet, G. Costs and carbon emissions for geopolymer pastes in comparison to ordinary portland cement. J. Clean. Prod. 2011, 19, 1080–1090. [Google Scholar] [CrossRef]
  13. Feng, W.; Jin, Y.; Zheng, D.; Li, Z.; Cui, H. Synergic effect of compositions and processing method on the performance of high strength alkali activated slag foam. Constr. Build. Mater. 2022, 352, 128991. [Google Scholar] [CrossRef]
  14. Kamseu, E.; Ngouloure, Z.; Benoît Nait Ali Zekeng, S.; Melo, U.; Rossignol, S.; Leonelli, C. Cumulative pore volume, pore size distribution and phases percolation in porous inorganic polymer composites: Relation microstructure and effective thermal conductivity. Energy Build. 2015, 88, 45–56. [Google Scholar] [CrossRef]
  15. Cui, Y.; Wang, D.; Zhao, J.; Li, D.; Serina, N.; Rui, Y. Effect of calcium stearate based foam stabilizer on pore characteristics and thermal conductivity of geopolymer foam material. J. Build. Eng. 2018, 20, 21–29. [Google Scholar] [CrossRef]
  16. Gong, L.; Wang, Y.; Cheng, X.; Zhang, R.; Zhang, H. A novel effective medium theory for modelling the thermal conductivity of porous materials. Int. J. Heat Mass Transf. 2014, 68, 295–298. [Google Scholar] [CrossRef]
  17. Chen, G.; Li, F.; Geng, J.; Jing, P.; Si, Z. Identification, generation of autoclaved aerated concrete pore structure and simulation of its influence on thermal conductivity. Constr. Build. Mater. 2021, 294, 123572. [Google Scholar] [CrossRef]
  18. Gao, R.; Zhou, Z.; Chen, K.; Hu, X.; Jia, H.; Zhang, H.; Han, L. Mechanisms of the effect of surfactant types on the pore structure feature and properties of geopolymer foams. Constr. Build. Mater. 2025, 458, 139696. [Google Scholar] [CrossRef]
  19. Othuman, M.; Wang, Y. Elevated-temperature thermal properties of lightweight foamed concrete. Constr. Build. Mater. 2011, 25, 705–716. [Google Scholar] [CrossRef]
  20. Wang, S.; Zhang, Z.; Mao, J.; Lin, J.; Xiao, F.; Chen, S. Modeling the thermal conductivity of the ground granulated blast furnace slag-based foam geopolymer based on its multi-scale pore structure. J. Build. Eng. 2025, 105, 112487. [Google Scholar] [CrossRef]
  21. Gadkar, A.; Subramaniam, K. Tailoring porosity and pore structure of cellular geopolymers for strength and thermal conductivity. Constr. Build. Mater. 2023, 393, 132150. [Google Scholar] [CrossRef]
  22. Li, X.; Zhao, X.; Guo, X.; Shao, Z.; Ai, M. New theoretical equation for effective thermal conductivity of two-phase composite materials. Mater. Sci. Technol. 2012, 28, 620–626. [Google Scholar] [CrossRef]
  23. Bi, C.; Tang, G.; Tao, W. Prediction of the gaseous thermal conductivity in aerogels with non-uniform pore-size distribution. J. Non-Cryst. Solids 2012, 358, 3124–3128. [Google Scholar] [CrossRef]
  24. Ordonez-Miranda, J.; Alvarado-Gil, J. Effect of the pore shape on the thermal conductivity of porous media. J. Mater. Sci. 2012, 47, 6733–6740. [Google Scholar] [CrossRef]
  25. Pimenov, D.; da Silva, L.; Ercetin, A.; Der, O.; Mikolajczyk, T.; Giasin, K. State-of-the-art review of applications of image processing techniques for tool condition monitoring on conventional machining processes. Int. J. Adv. Manuf. Technol. 2024, 130, 57–85. [Google Scholar] [CrossRef]
  26. Vishavkarma, A.; Venkatanarayanan, H. Assessment of pore structure of foam concrete containing slag for improved durability performance in reinforced concrete applications. J. Build. Eng. 2024, 86, 108939. [Google Scholar] [CrossRef]
  27. Maglad, A.; Othuman Mydin, M.; Datta, S.; Tayeh, B. Assessing the mechanical, durability, thermal and microstructural properties of sea shell ash based lightweight foamed concrete. Constr. Build. Mater. 2023, 402, 133018. [Google Scholar] [CrossRef]
  28. Maglad, A.; Mydin, M.; Kaze, R.; Abbood, I.; Tayeh, B. Synergistic effect of waste gypsum plasterboard and fly ash as partial cement replacement on fresh-state, microstructural, mechanical and transport properties of foamed concrete. Constr. Build. Mater. 2025, 463, 140079. [Google Scholar] [CrossRef]
  29. Shi, X.; Zhang, Y.; Hu, H.; Arachchi, E.; Cen, X.; Li, W.; Wang, Q. Role of red mud as a foam stabilizer in geopolymer foam concrete: Enhancing stability, rheology, and mechanical performance. J. Build. Eng. 2025, 105, 112446. [Google Scholar] [CrossRef]
  30. Carson, J.; Lovatt, S.; Tanner, D.; Cleland, A. Thermal conductivity bounds for isotropic, porous materials. Int. J. Heat Mass Transf. 2005, 48, 2150–2158. [Google Scholar] [CrossRef]
  31. Wei, S.; Chen, Y.; Zhang, Y.; Jones, M. Characterization and simulation of microstructure and thermal properties of foamed concrete. Constr. Build. Mater. 2013, 47, 1278–1291. [Google Scholar] [CrossRef]
  32. Vaou, V.; Panias, D. Thermal insulating foamy geopolymers from perlite. Miner. Eng. 2010, 23, 1146–1151. [Google Scholar] [CrossRef]
Figure 1. Flow of aperture recognition: (a) Enhanced contrast; (b) Screening for effective holes; (c) Calculation of average pore size.
Buildings 15 03494 g001
Figure 2. The production process of GFC: (a) GFC fully foamed; (b) GFC surface cutting treatment.
Buildings 15 03494 g002
Figure 3. Dry density and porosity of GFC: (a) NaSt; (b) HPMC; (c) CMC-Na.
Buildings 15 03494 g003
Figure 4. Macropore size distribution in GFC: (a) 0.2% NaSt; (b) 0.5% NaSt.
Buildings 15 03494 g004
Figure 5. Thermal conductivity profiles of GFC: (a) NaSt; (b) HPMC; (c) CMC-Na.
Buildings 15 03494 g005
Figure 6. Scatter plot distribution of experimental data. (The blue part is the projection of the thermal conductivity in the pore diameter direction.)
Buildings 15 03494 g006
Figure 7. Structural model predictions: (a) comparison of structural models; (b) relative thermal conductivity modeling diagram.
Buildings 15 03494 g007
Figure 8. Regression fit of NEMT model: (a) NaSt; (b) HPMC; (c) CMC-Na.
Buildings 15 03494 g008aBuildings 15 03494 g008b
Figure 9. Correlation between experimental and theoretical values: (a) NaSt; (b) HPMC/CMC-Na. (The blue part is the projection of the thermal conductivity—pore diameter and the green part is the projection of thermal conductivity—porosity.).
Buildings 15 03494 g009aBuildings 15 03494 g009b
Table 1. Chemical composition analysis.
ComponentsCaOSiO2Al2O3MgOFe2O3SO3Loss on Ignition
Content (%)34.0034.5017.706.011.031.640.84
Table 2. Design of mixing ratios.
Foam Stabilizer Percent (%)Slag Powder
/g
H2O2
/g
Water Glass
/g
NaOH
/g
Water
/g
NaSt (0.1–0.5%)90004951895.36283.543653.10
HPMC (0.05–0.25%)90004951895.36283.543653.10
CMC-Na (0.05–0.25%)90004951895.36283.543653.10
Table 3. (a) GFC (CMC-Na) test data. (b) GFC (HPMC) test data. (c) GFC (NaSt) test data.
(a)
Foam Stabilizer Dosage (%)0.050.100.150.200.25
Porosity
(%)
66.1467.1467.4466.6865.82
Average pore size of large holes (mm)0.4090.3320.2970.4070.392
Thermal conductivity (W/(m·k))0.076860.075220.074380.076020.07705
(b)
Foam Stabilizer Dosage (%)0.050.100.150.200.25
Porosity
(%)
64.5763.8361.8059.9460.74
Average pore size of large holes (mm)0.4670.5090.3470.4510.501
Thermal conductivity (W/(m·k))0.079240.080520.082680.085980.08502
(c)
Foam Stabilizer Dosage (%)0.050.100.150.200.25
Porosity
(%)
66.1362.0558.4354.9051.93
Average pore size of large holes (mm)0.5980.8310.7760.6490.617
Thermal conductivity (W/(m·k))0.085780.095770.102920.109030.11620
Table 4. Fitting results.
ReferencePorosity
(%)
Thermal Conductivity (W/(m·k))atR2
[14]-MKPC176.9–81.90.200–0.25010.692.1897.4
[14]-MKPC283.8–86.80.160–0.1808.361.9194.5
[15]70.0–82.00.095–0.1393.851.9098.5
[13]21.2–34.30.160–0.2322.720.8895.3
[32]74.4–87.50.030–0.0531.842.0798.4
Disclaimer/Publisher’s Note: The statements, opinions and data contained in all publications are solely those of the individual author(s) and contributor(s) and not of MDPI and/or the editor(s). MDPI and/or the editor(s) disclaim responsibility for any injury to people or property resulting from any ideas, methods, instructions or products referred to in the content.