Article

Spring-Based Soil–Structure Interaction Modeling of Pile–Abutment Joints in Short-Span Integral Abutment Bridges with LR and RSM

by
Erkan Polat
1,* and
Elifcan Göçmen Polat
2
1
Department of Civil Engineering, Munzur University, Tunceli 62000, Turkey
2
Department of Industrial Engineering, Munzur University, Tunceli 62000, Turkey
*
Author to whom correspondence should be addressed.
Buildings 2025, 15(19), 3493; https://doi.org/10.3390/buildings15193493
Submission received: 21 August 2025 / Revised: 15 September 2025 / Accepted: 25 September 2025 / Published: 27 September 2025
(This article belongs to the Special Issue Research on Soil–Structure Interaction for Civil Structures)

Abstract

Integral abutment bridges (IABs) are increasingly adopted in transportation infrastructure due to their durability, reduced maintenance needs, and cost-effectiveness compared to conventional bridges. However, their reliable performance under live loads is strongly influenced by the nonlinear soil–structure interaction (SSI) at the pile–abutment joint, which remains challenging to quantify using conventional analysis methods. This study develops simplified spring-based models to capture the SSI behavior of pile–abutment joints in short-span IABs. Predictive equations for joint rotation, deflection, moment, and shear are formulated using Linear Regression (LR) and Response Surface Methodology (RSM). Unlike prior studies relying solely on FEM or traditional p–y curves, the novelty of this work lies in deriving regression-based spring constants calibrated against FEM analyses, which can be directly implemented in standard structural software. This approach significantly reduces computational demands while maintaining predictive accuracy, enabling efficient assessment of pile contributions and global bridge response. Validation against finite element method (FEM) results confirms the reliability of the simplified models, with RSM outperforming LR in representing nonlinear parameter interactions.

1. Introduction

Integrated Abutment Bridges (IABs) have emerged as an effective alternative to conventional bridges because they offer numerous advantages such as accelerated bridge construction, structural resiliency, and efficiency. One of the main benefits of IABs is the reduction of positive moments and deflections at mid-span by generating negative end moments in the bridge girders. These negative moments are transferred to the ground through the pile-abutment connection, making its deformation behavior critical to overall performance. This response is influenced by the relative flexural stiffness of structural components and the mechanical properties of surrounding soil, which together govern load transfer and deformation.
Traditional bridges rely on expansion joints and bearings to accommodate movements caused by temperature changes, traffic loads, and other effects. While essential for serviceability, these components often lead to high construction and maintenance costs due to water ingress, corrosion, and frequent repairs [1]. IABs eliminate these elements by rigidly connecting girders and piles to abutments, creating a monolithic structure that transfers movements through soil-structure interaction. This jointless system enhances durability, reduces maintenance, and improves load distribution, ride quality, and constructability [2,3].
IAB adoption is widespread in the U.S. and Europe, though design practices vary. U.S. agencies typically use flexible steel H-piles oriented for weak-axis bending, allowing for thermal expansion, while European countries often employ concrete-filled pipe piles and incorporate pile sleeves to minimize thermal stresses. Backfill practices also differ, with U.S. standards favoring loose or granular fill and compressible inclusions, while European designs often require simultaneous backfilling to balance lateral pressures [4].
Integral bridges have been successfully implemented in medium to long spans, particularly in the U.S., where lengths of 290–358 m have been achieved [5,6]. Abutment heights vary widely, and studies have shown that thermal movements are primarily accommodated by abutment rotation rather than translation [7]. While joint-free systems induce cyclic bending and axial loads in the piles, advancements in detailing (such as pile orientation, material improvements, and connection alternatives) have mitigated issues like wingwall cracking and pile yielding [8].
Economically, IABs offer significant savings. For example, Vermont’s VTrans study reported 10–20% lower construction costs for three IABs compared to conventional bridges, not accounting for indirect benefits such as reduced maintenance and faster construction [3].
In parallel, advanced modeling methods such as RSM have gained popularity for both optimizing structural performance and predicting structural responses with greater accuracy. RSM employs multiple regression models to conduct statistical experiments, enabling high correlation between input parameters and output responses, as demonstrated by Kuntoğlu et al. [9]. RSM encompasses various experimental design techniques, including Central Composite Design (CCD) and Box–Behnken Design (BBD), each with unique advantages depending on the nature of the problem. CCD is particularly effective for capturing complex variable interactions and curvature in the response surface, as noted by Adamu et al. [10], whereas BBD is more limited in its ability to explore variable extremes, making it less suitable for studies requiring broad parameter ranges [11].
Despite their advantages, modeling IABs is challenging due to the complex, nonlinear interaction between the superstructure, substructure, and soil. Accurate representation demands detailed simulation of soil-structure behavior, involving a large set of geometric, material, and boundary parameters. Although the present study adopts a simplified linear-elastic soil model, it is acknowledged that soil is a multiphase medium in which void ratio, moisture content, and pore pressure strongly influence stiffness and load transfer behavior. These factors are well established in advanced multiphase soil–structure interaction models [12,13] but are beyond the scope of this study. In IAB design, piles are typically modeled as cantilever beams with a fixed end located below the ground surface. The location of this fixity point is commonly assumed to occur at a depth of approximately ten times the pile diameter (D). Although this assumption is not explicitly prescribed in the AASHTO LRFD Bridge Design Specifications [14], it is widely adopted in design practice and supported by previous studies. Empirical observations, such as those reported by Pando et al. [15], indicate that lateral pile deflections tend to diminish significantly within approximately 8–10 times the pile diameter. Similarly, analyses based on Reese and Van Impe’s methods [16] show that most lateral resistance is mobilized within the upper 5–10 D. While these values are used as practical rules-of-thumb, they are influenced by soil stiffness, pile flexibility, and loading conditions. As Rajapakse [17] discusses, in sandy soils the so-called “critical depth” for pile capacity is often approximated as 10D for loose sands, 15D for medium-dense sands, and 20D for dense sands. Although this critical depth concept relates to axial end-bearing rather than lateral fixity, it reinforces the fact that the “10D rule” is a heuristic approximation whose value depends strongly on soil density and stiffness. Thus, while the 10D assumption is commonly adopted in practice, it should be applied cautiously and verified against site-specific soil conditions and analytical methods. Beyond linear-elastic or p–y-based models, recent studies have advanced coupled hydro-mechanical and thermo-hydro-mechanical formulations capable of capturing pore pressure evolution, capillary effects, and transient saturation [18,19]. While these approaches offer comprehensive representation of multiphase soil behavior, they require significant computational effort and expertise. By contrast, the present study develops simplified regression-based spring models, prioritizing efficiency and practical usability for preliminary analysis of short-span IABs.
This study aims to develop practical and efficient spring models that accurately represent pile–soil interaction in integral abutment bridges. These models are calibrated against finite element method (FEM) simulations to replicate the static behavior of the pile–abutment joint while incorporating the influence of the superstructure. Simplified spring models are commonly used in preliminary structural analyses, as they reduce computational effort and facilitate early-stage design decision-making. The approach adopted in this study transforms highly indeterminate systems into more tractable analytical representations and is particularly suitable for short-span IABs with lengths up to approximately 98 ft (30 m). Extrapolation beyond this limit may introduce uncertainties not captured in the present dataset.
The analysis focuses on short-span, single-span IABs without skew, subjected to vehicular live loads. Both cohesive (clay) and non-cohesive (sand) soils are considered under the assumption of deep groundwater conditions. The bridge configurations used in this study are based on Polat [20], which analyzed single- and multi-span IABs using FEM under varying soil and pile stiffness. That study demonstrated the role of IABs in extending allowable span lengths by mitigating mid-span positive moments. The two single-span bridges (Bridges I and II) from that work are used as references here. Their critical design parameters including substructure and superstructure stiffness, soil type, abutment height, and span length were systematically varied to represent practical design scenarios.
A two-dimensional (2D) linear-elastic modeling approach was adopted due to its efficiency and proven ability to capture fundamental structural responses in integral abutment bridges (IABs). Fennema et al. [21] demonstrated that 2D models show strong agreement with 3D simulations, particularly for thermal and soil-structure interaction effects. Similarly, Kim et al. [22], through long-term monitoring of operational IABs, confirmed that 2D static and time-history analyses yield reliable predictions of substructure behavior. Given their accuracy and computational efficiency, 2D models are well-suited for evaluating IAB performance in preliminary and parametric studies.
The study omits backfill-abutment interaction as the preliminary investigation, which resulted in conservative estimates. Results from supplementary analysesindicate that including backfill leads to reduced span moments and pile head deformations due to the stiffening effect of the soil, while slightly increasing shear forces at the pile head because of the added restraint. Similar behavior is documented in the literature; for example, Huang [7] observed that abutment substructures provide rotational restraint, resulting in end-span behavior intermediate between simple-span and fixed-pinned conditions.

2. Proposed Spring Model

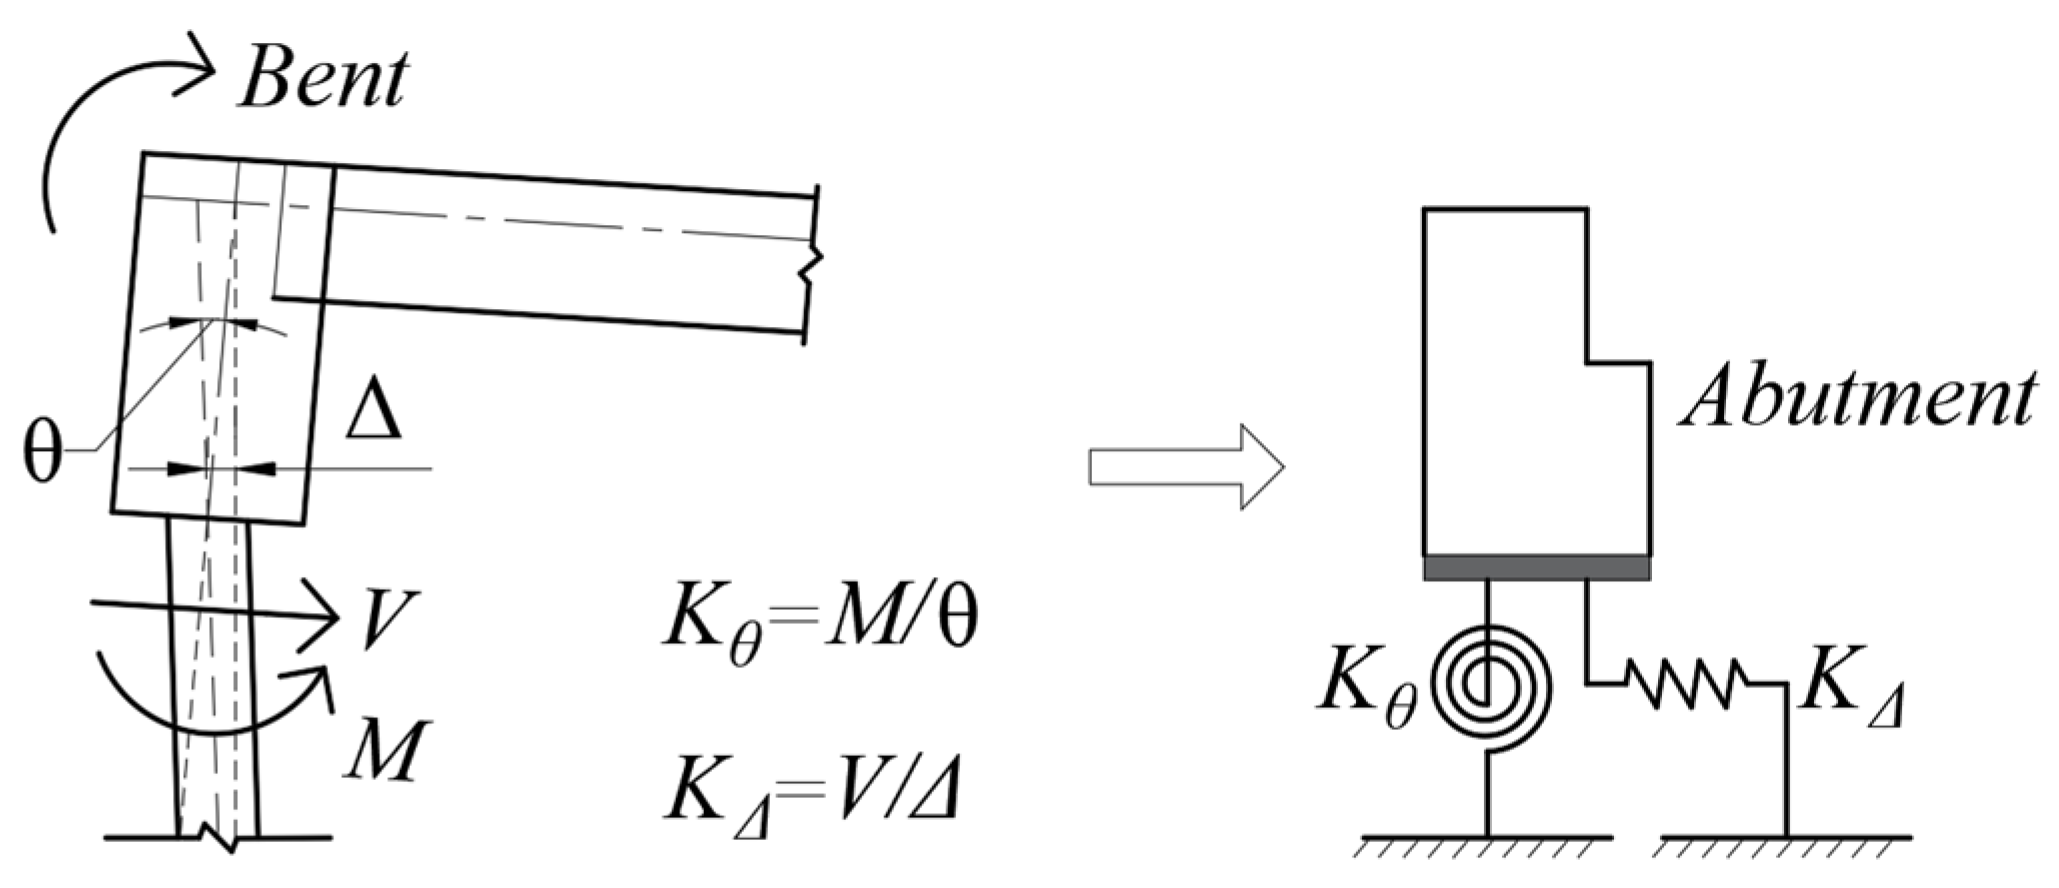
Figure 1 illustrates the developed force components and the corresponding spring model of the pile-abutment joint. Part (a) shows the free-body diagram with applied moment (M), shear (V), and axial force (N), while part (b) presents the idealized spring representation. As axial deformation is not considered in this study, the axial force component (N) is excluded from the spring model. The objective is to predict the pile-abutment joint responses, including rotation (θ), deflection (Δ), moment (M), and shear (V), using statistical modeling techniques. Regression equations are developed to quantify the effects of geometric, material, and structural parameters under lateral deformation. Spring stiffness values are then derived from the predicted responses using Linear Regression (LR) and Response Surface Methodology (RSM).

3. Reference Bridge Models

The bridge models employed in this study are based on typical bridges in North America that were previously examined by Polat [20] to evaluate span moment reduction when configured as IABs. Although the two reference bridges were adopted from Polat [20] the design variables (Ks, EIp, EIg, H, and L) were systematically varied using CCD, enabling the regression equations to be applied to a wide range of short-span IAB configurations. The geometric and structural properties of the reference bridges serve as the basis for defining axial levels in the numerical design matrix, developed using CCD in the next section. These configurations guide the selection of realistic parameter ranges for statistical modeling using LR and RSM.
Bridge I is a single-span slab-on-girder structure with a span of 45 ft (13.72 m) and a width of 32 ft (9.75 m), as shown in Figure 2. Its superstructure consists of precast channel-section girders placed adjacently without gaps, supporting an 8 in (203 mm) thick slab deck. The figure also includes composite section details for an interior girder, showing centroid location and transformed properties. The substructure comprises abutments without wingwalls, supported by 8 steel HP piles. The abutments are 5 ft (1.52 m) high and 3 ft (0.91 m) thick, rigidly connected to both girders and piles.
Bridge II is a solid slab bridge constructed entirely of reinforced concrete, with a span length of 50 ft (15.24 m) and width of 46 ft (14.02 m), as illustrated in Figure 3. The slab serves as both superstructure and deck and is 26.4 in (670 mm) thick. The substructure includes abutments supported by 10 steel HP piles. These abutments are 10 ft (3.05 m) high and 2.5 ft (0.76 m) thick and are also rigidly connected to the piles.
For both bridges, a uniform pile length of 30 ft (9.14 m) was used in the analyses. The soil conditions were modeled using four clay consistency levels and three sand types. A detailed summary of the bridges’ structural and material properties is provided in Table 1.

4. Experimental Design Using RSM, LR

The displacement and force responses of the pile-abutment joint in an IAB are influenced by complex, nonlinear interactions among material and geometric design variables, including substructure and superstructure flexural stiffness, soil stiffness, span length, and abutment height. RSM offers an effective framework for modeling such nonlinear behavior, providing high predictive accuracy and the ability to capture intricate parameter interactions. In comparison, LR is a simpler and more computationally efficient approach, particularly suitable when variable interactions are minimal or predominantly linear.

4.1. Application of RSM

In this study, RSM is used to predict pile-abutment joint responses in terms of displacements and forces. The method identifies the most influential parameters and models their interaction effects on structural responses. The governing input variables for IAB response include soil stiffness (Ks), pile flexural stiffness (EIp), girder flexural stiffness (EIg), abutment height (H), and bridge span (L). These variables were selected based on their fundamental role in the structural analysis of indeterminate elastic frames, which represent the assumed behavior of IABs. Frame deformations are primarily governed by flexural rigidity (a function of EI and span length, L), while soil response is represented by discrete springs that deform axially and are distributed along the soil depth. Thus, Ks, EIp, EIg, H, and L together capture the dominant mechanisms influencing global bridge–soil interaction.
RSM employs regression-based statistical analysis and offers an efficient approach to modeling quadratic response functions, especially when compared to full factorial designs [23]. While both CCD and Box–Behnken Design (BBD) are commonly used in RSM, though BBD is less suitable for variables with more than three levels. Accordingly, CCD is adopted in this study for its ability to accommodate higher-level variable complexity and support robust optimization.

4.2. Central Composite Design

The CCD methodology provides a second-order model for predicting outputs by accounting for both individual and interaction effects of input variables. The output variables, rotation, deflection, moment and shear, are expressed as a quadratic function in Equation (1). n represents the number of input variables, β 0 is the constant coefficient, and β i ,   β i i ,   β i j are regression coefficients for linear, quadratic, and interaction terms, respectively. X i denotes the coded level of the inputs.
Y = β 0 + i = 1 n β i + i = 1 n β i i X i 2 + i < j n β i j X i X j
The CCD includes 2 n factorial points, 2n axial points, and one center point (cp), leading to the total number of experiments estimated using Equation (2):
T E = 2 n + 2 n + c p
In this study, with five input variables, 43 numerical experiments are required, consisting of 32 factorial points, 10 axial points, and 1 center point.
Table 2 presents the input values distributed across five levels: center level (0), low-high levels (±1), and axial levels (±α), where α is defined as 2 and calculated using Equation (8). The studied inputs include K s , E I p , E I g , H, and L.
α = 2 n 4
Table 3 presents the numerical experiment parameters for 43 IAB cases generated using CCD, with input variables including K s ,   E I p ,   E I g ,   H , and L. FEM analyses were conducted for each configuration to produce datasets suitable for LR and RSM modeling.
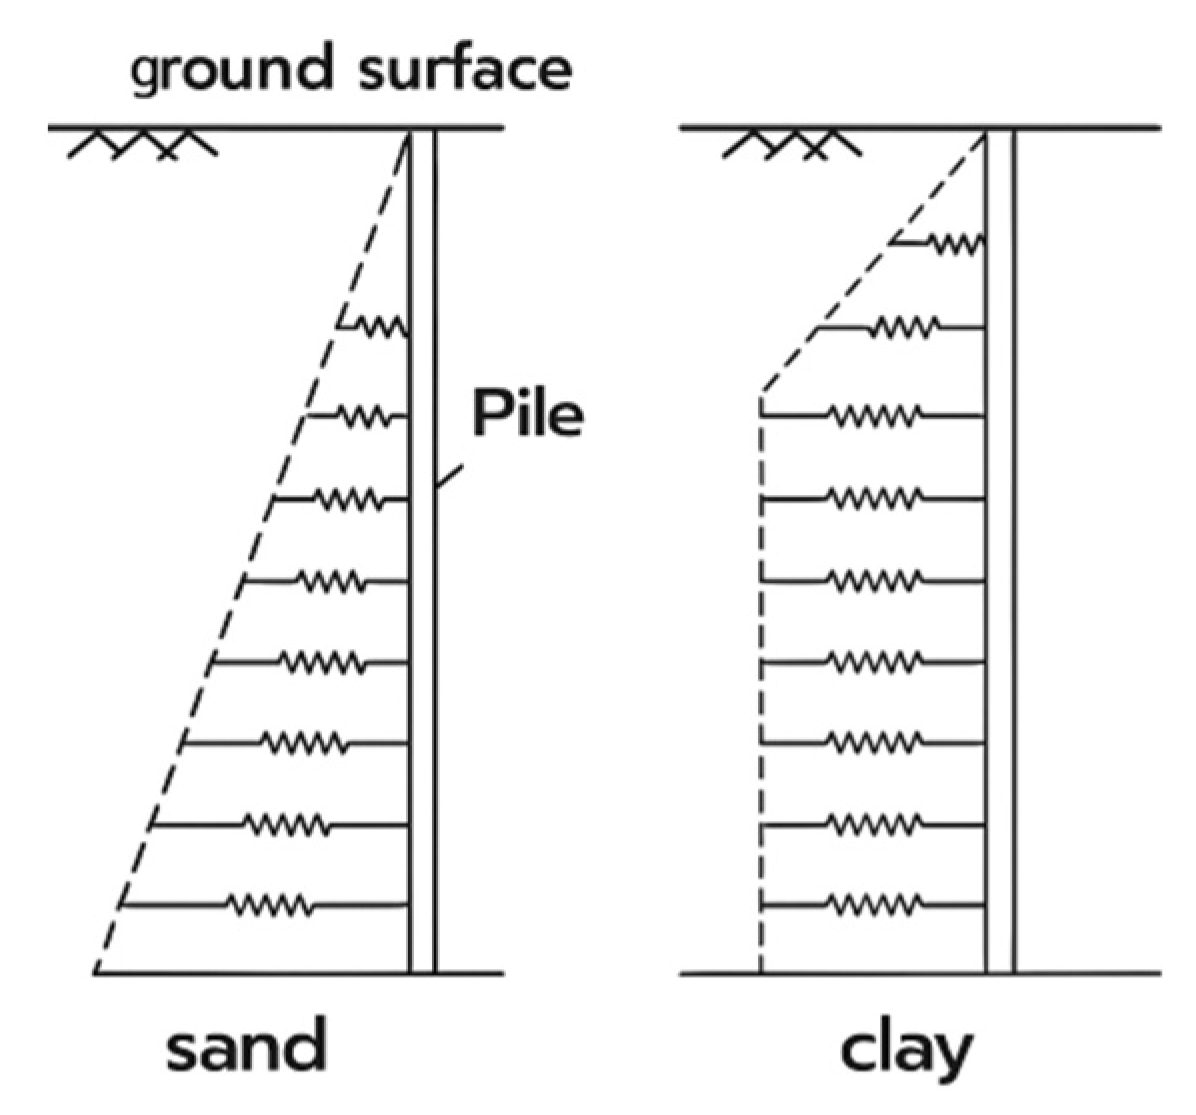
The study considers two distinct soil types, sand and clay, to account for differences in soil stiffness distribution along the pile length. In sand, stiffness increases uniformly with depth, whereas in clay, it increases linearly up to a certain depth and then remains constant. To reflect these variations accurately, all numerical analyses were performed separately for each soil type.

5. Finite Element Modeling

5.1. Pile-Soil Interaction

Soil-structure interaction was modeled using spring elements representing soil stiffness, with properties calibrated based on empirical studies and existing literature. The p-y method was employed to capture soil behavior. Multilinear soil springs derived from p-y curves, as validated in previous studies [21], were integrated into the numerical models to accurately represent nonlinear soil-pile interaction. This approach, widely recognized in the literature, provides a robust framework for simulating lateral pile behavior under various soil conditions.

P-Y Method

The p-y method, developed by Reese and Van Impe [16] for computer program use, is widely adopted for modeling the nonlinear behavior of pile-soil interaction. It employs the Winkler approach, treating the soil as discrete, independent resistances rather than a continuum. This method has proven to provide reasonable responses [16].
The p-y method correlates the soil resistance (p, force per unit length of the pile) and pile deflection (y) through a nonlinear curve, representing real soil behavior. The method assumes that soil pressure corresponds to pile deflection, influenced by the stiffness of both the pile and soil. This correlation is illustrated in Figure 4.
In this study, the approximate method of Greimann, Abendroth, Johnson and Ebner [24] was used in the development of p-y curves, which adapts the modified Ramberg-Osgood model. Using this method, the expressions [24] that enable us to get the spring stiffness for soft and stiff clay are as follows:
For soft and stiff clay, the soil stiffness is calculated as:
k h = p u y 50
where the ultimate soil resistance is calculated from the following expression:
p u = m i n 9 · c u · B p 3 + γ c u · z + 0.5 B p · z · c u · B p  
For very stiff clay the soil stiffness is calculated as:
k h = p u 2 · y 50
where the ultimate soil resistance is calculated from the following expression:
p u = m i n 9 · c u · B p 3 + γ c u · z + 2 B p · z · c u · B p  
For sand, the soil stiffness is obtained by the following equation:
k h = J · γ · k 1.35
Details of the soil spring parameters, representative undrained shear strength values, and their correlations are provided in Appendix A.
To assign the spring elements, the beam elements representing piles were divided into 30 discrete elements, each 1 ft. (0.3 m) long, for a total length of 30 ft (9.14 m) from the ground surface. This allowed for the assignment of linear-elastic springs to the nodes of adjacent discrete elements, representing the soil’s response to the piles. The soil properties considered in the analysis of all the bridge models are given in Table 4.

5.2. Two-Dimensional Frame Modeling of Bridges

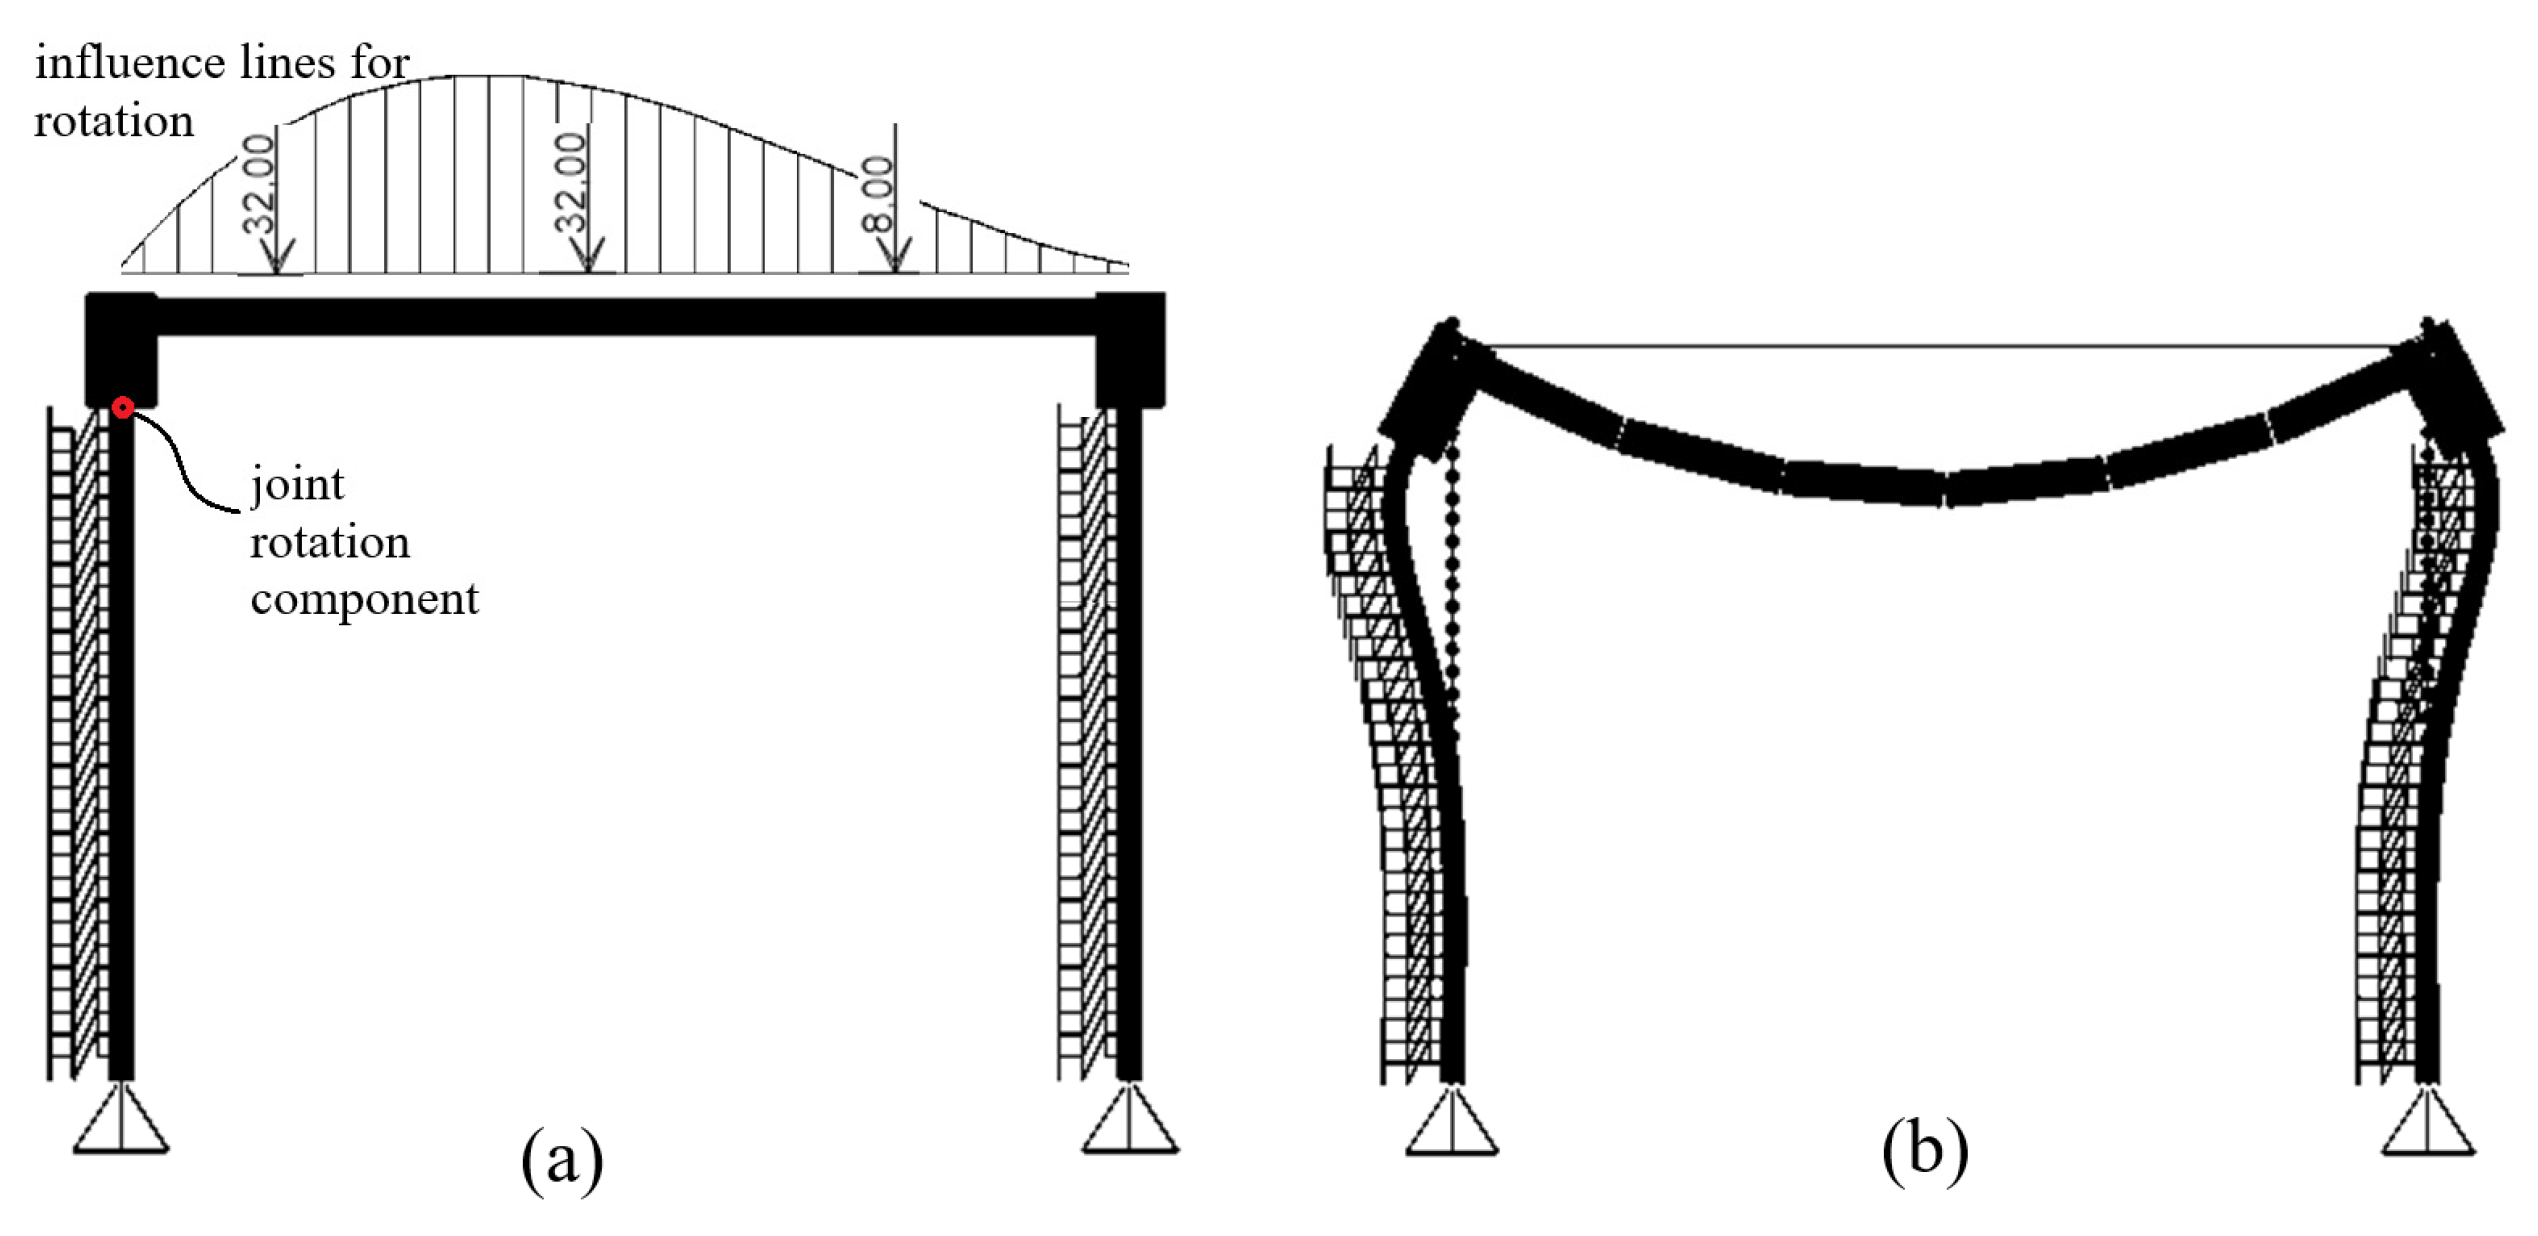
Figure 5 illustrates the 2D frame model of a typical bridge developed in SAP2000. Soil-pile interaction was represented by assigning discrete spring stiffnesses at regular intervals (1 ft or 0.3 m) along the length of the piles. The bridge was analyzed under AASHTO HL-93 live load conditions, which include a design truck with a front axle load of 8 kips (35.6 kN) and rear axles of 32 kips each (142.3 kN), a tandem load of two 25-kip axles (111.2 kN) spaced 4 ft (1.22 m) apart, and a uniform lane load of 0.64 kip/ft (9.34 kN/m) over a 10-ft (3.05 m) lane width. These loads were applied following AASHTO-recommended combinations to capture the most critical structural effects. The figure also depicts the deformed shape of the bridge model under the combined action of truck and lane loads, demonstrating the system’s response to representative live load scenarios.
For each analysis case, influence line analyses were performed to evaluate the rotation at the pile-abutment joint under moving truck load conditions. These analyses identified the critical positions of the AASHTO HL-93 truck load along the bridge span that produced the maximum rotational response. Truck axle loads were then applied as concentrated point loads at these critical positions, while lane loads were uniformly distributed along the girder length. Since the reference bridges were assumed to have two traffic lanes, both truck and lane loads were applied in duplicate to reflect the full loading configuration.

5.3. Typical Pile Response and Spring Model Representation

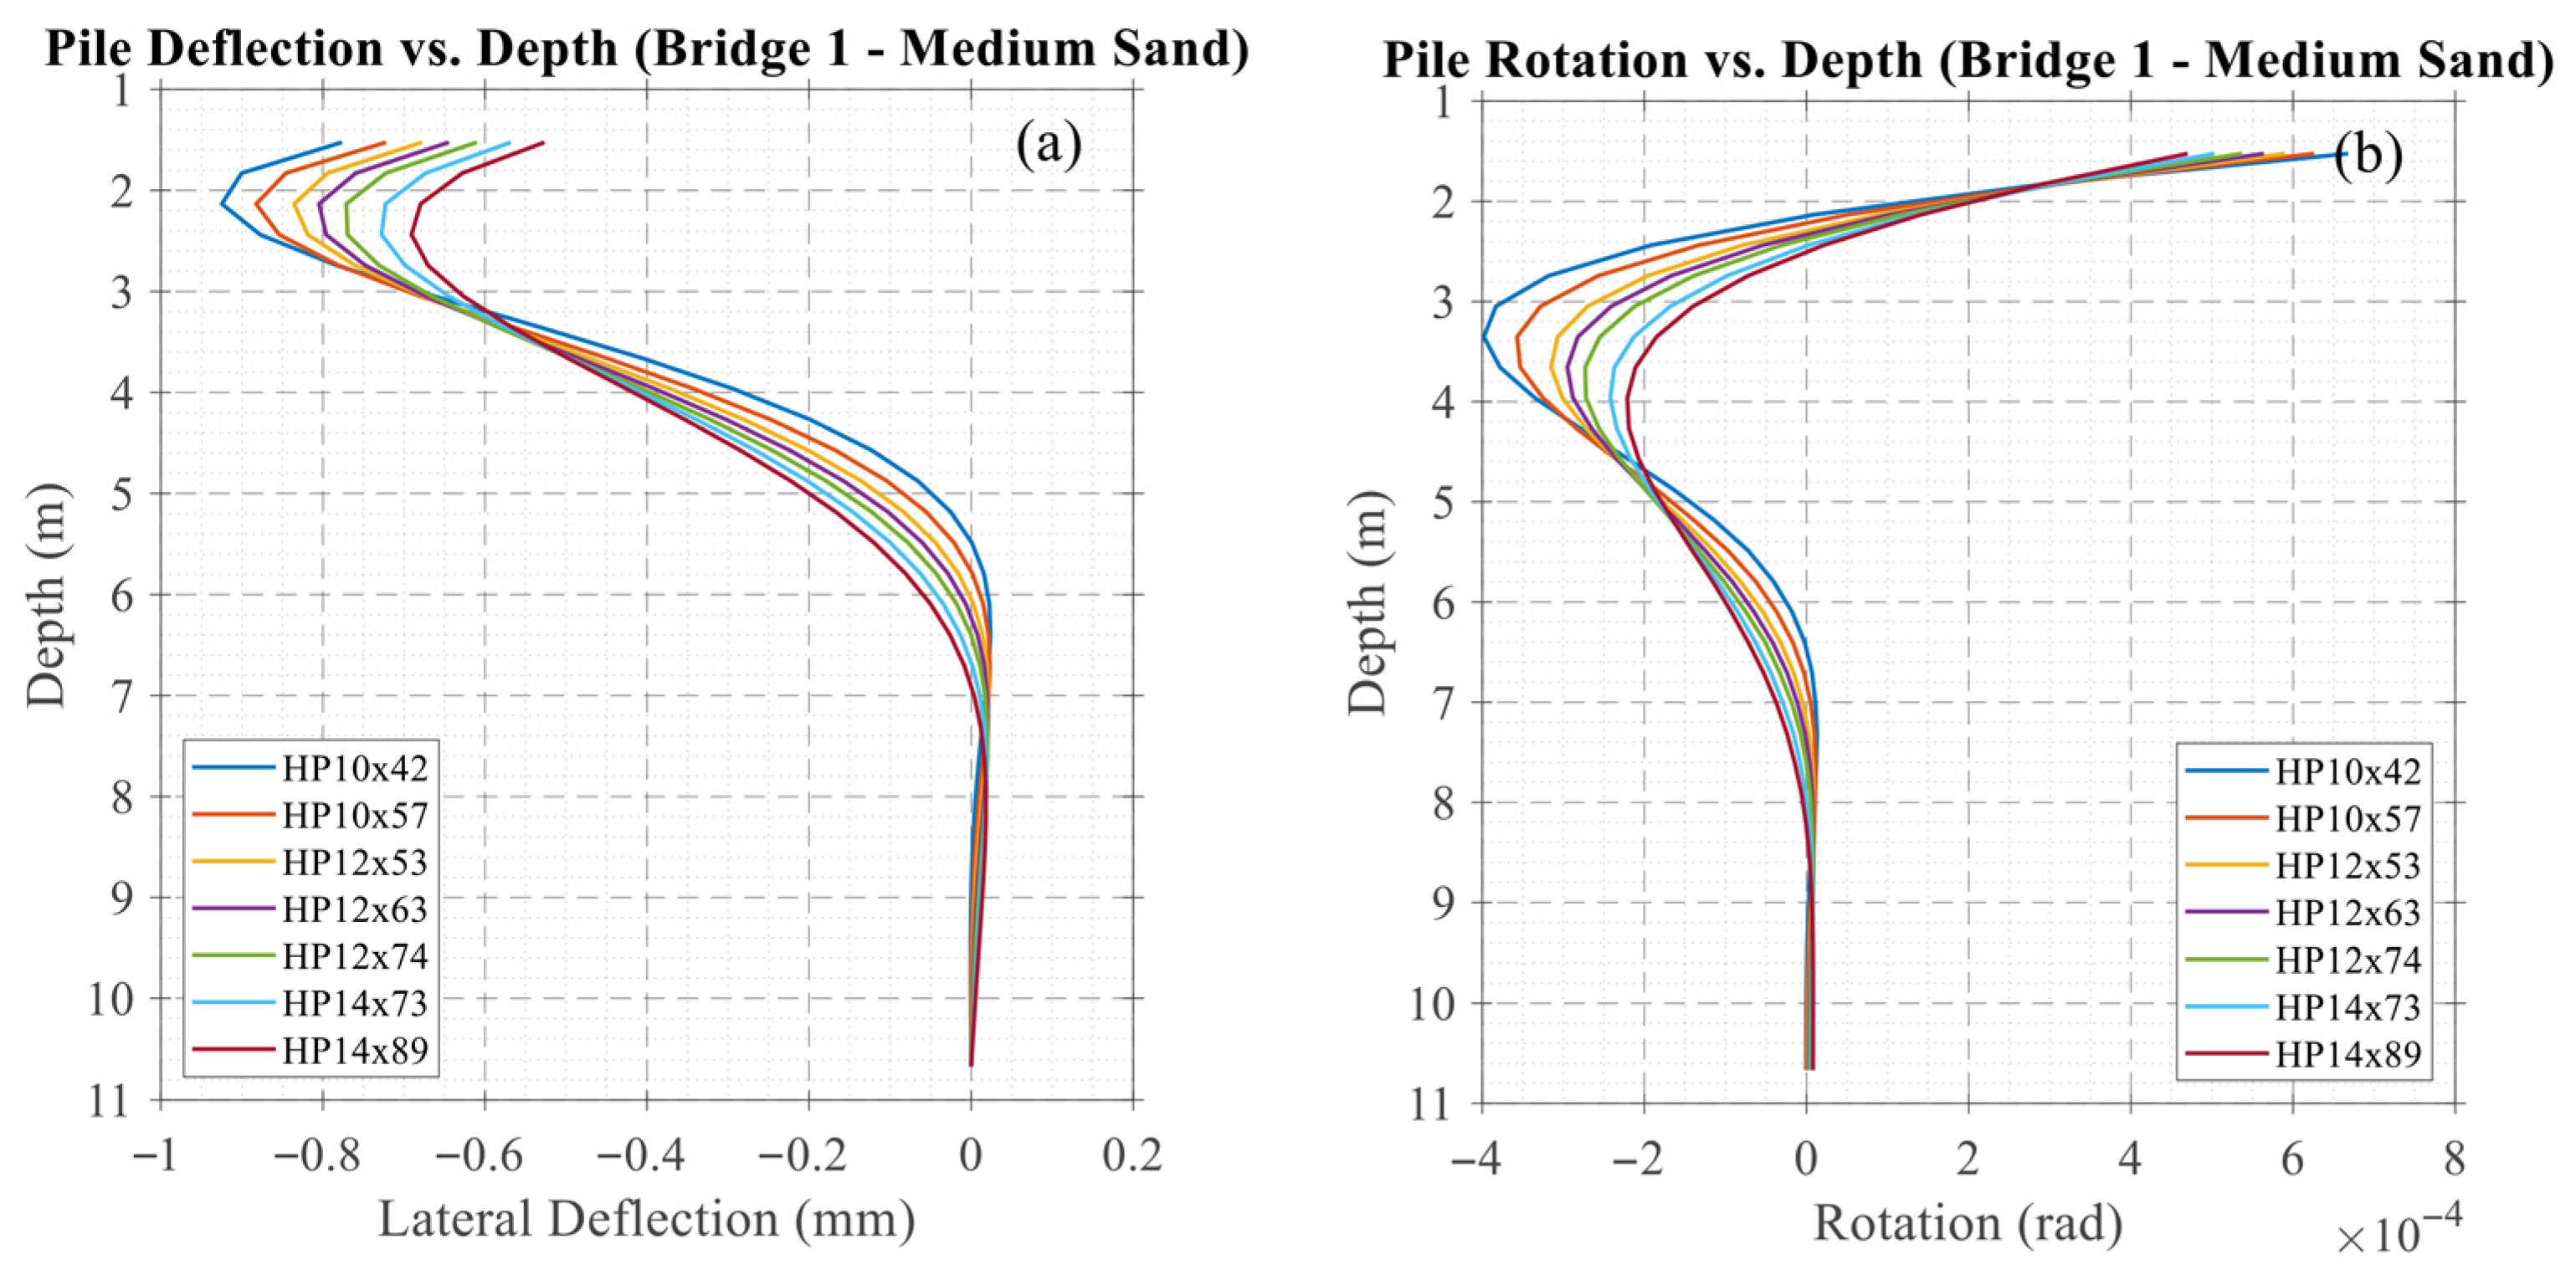
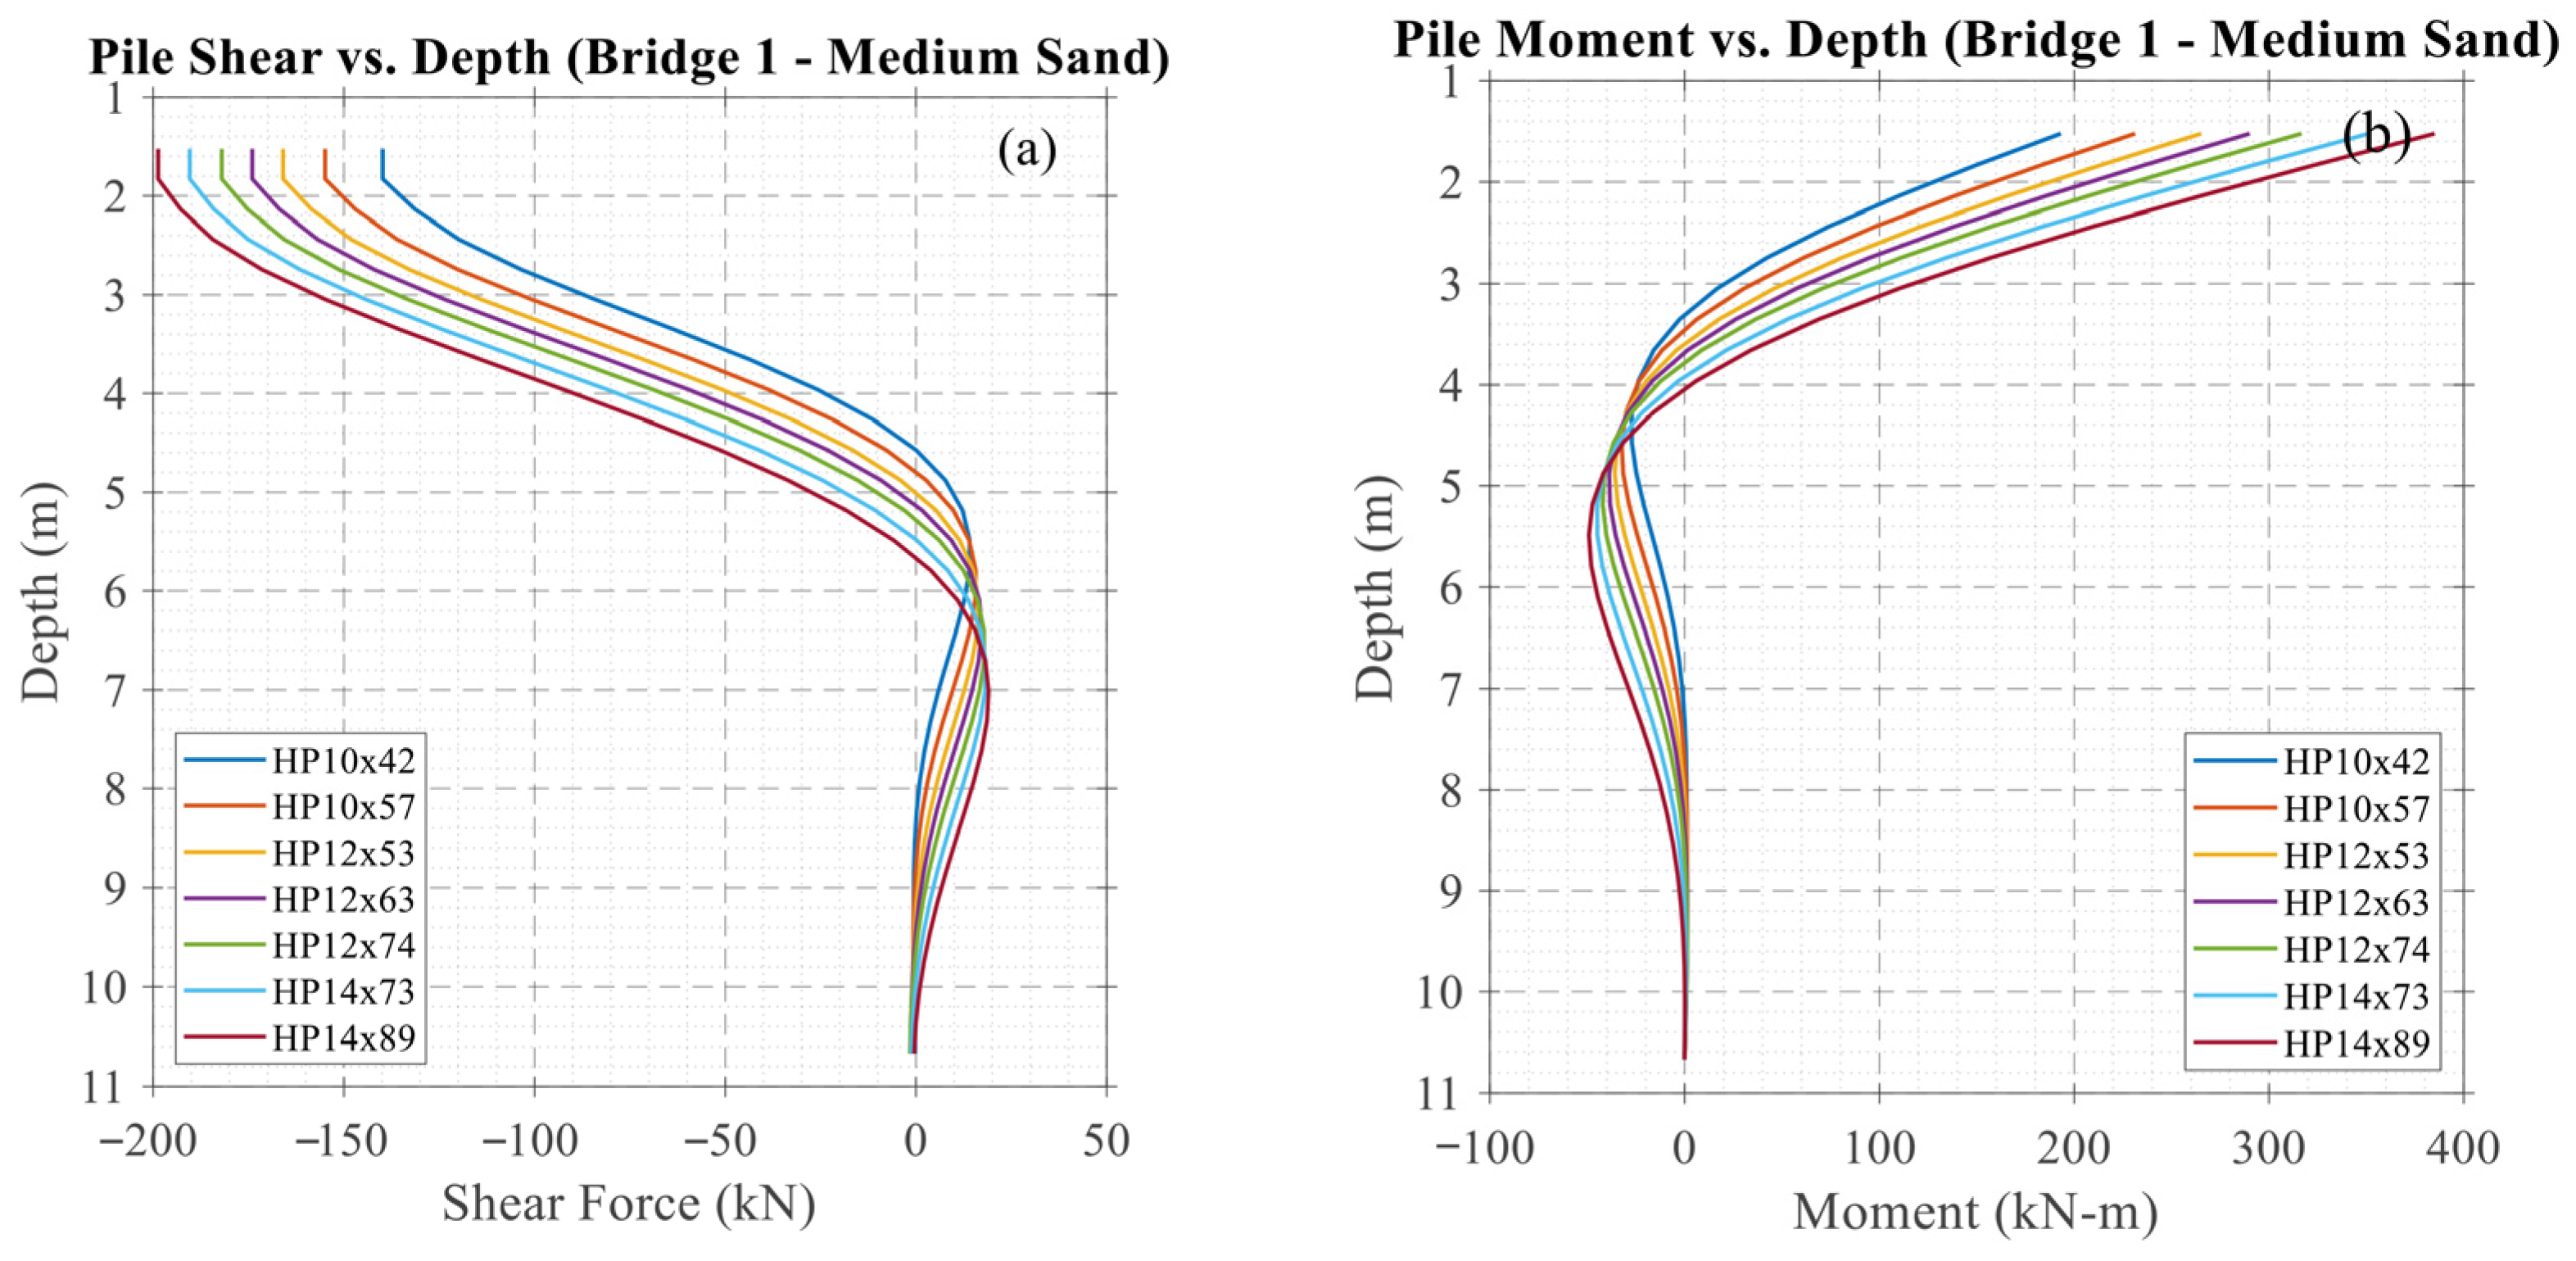
A representative pile behavior obtained from 2D numerical analysis is presented as an illustrative case under selected soil and pile properties. In this analysis, seven different steel H-pile sections (HP10x42, HP10x57, HP12x53, HP12x63, HP14x73, and HP14x89) were modeled interacting with a single soil type, medium sand, under AASHTO HL-93 truck loading conditions. For Bridge I, the corresponding pile responses in terms of lateral displacements and internal forces are shown in Figure 6 and Figure 7, respectively. Figure 6 illustrates the variation in lateral deflection and rotation along the pile length, while Figure 7 presents the corresponding shear force and bending moment distributions. As plotted, the piles develop a characteristic double curvature under the defined vehicular loads. At a certain depth below the ground surface, pile rotation reduces to zero, indicating the location of the inflection point, beyond which the curvature reverses. A second point of zero rotation typically occurs deeper, with its position influenced by both pile stiffness and soil properties.
The distributions in Figure 7 indicate that the maximum shear force and bending moment both develop at the pile head. Likewise, Figure 6 shows that the largest rotation is concentrated at the pile head. In contrast, Figure 6 demonstrates that the maximum lateral deflection occurs at a depth of about 6.5 ft (2 m) below the ground surface. These patterns are consistent with the expected pile–soil interaction mechanisms in short-span IABs, noting also that the applied vehicle loading was intended to create maximum rotations at the pile–abutment joint.
Figure 8 illustrates the spring model representations for the pile-abutment joint response obtained for each analysis set. The target rotational spring stiffnesses were determined by dividing the pile head moments by their corresponding rotations, while the target translational spring stiffnesses were calculated by dividing the pile head shear forces by the lateral displacements.

6. Design Optimization Using LR and RSM

Both LR and RSM analyses were performed using the same data set, as presented in Table 3, and under similar conditions. Additionally, response optimization was performed to identify the most influential factors affecting the outputs. The Minitab software (version 21.1.0) [25] was employed for the design process.

6.1. Development of Predictive Equations Using LR and RSM

LR and RSM models were developed to predict the analysis outputs (i.e., θ, Δ, M, and V) based on the selected input variables (i.e., Kₛ, EIₚ, EIg, H, and L). Table 5 presents the LR equations, while the corresponding RSM equations are provided in Table 6. These models were used to estimate bridge responses and compared against FEM results. Note that the predicted values for θ and Δ should be multiplied by 10−6, and those for V by 10−2, to convert them to actual units consistent with FEM output.
The LR and RSM results exhibit strong predictive capability, with high R2 values obtained across all response variables. For sand soil, LR produced R2 values of 98.84% for θ, 92.73% for Δ, 97.21% for M, and 97.13% for V, which indicates strong accuracy. For clay soil, LR yielded 94.99% for θ, 91.90% for Δ, 96.87% for M, and 97.08% for V, also demonstrating high reliability. RSM further improved predictive performance across both soil types. For sand soil, RSM achieved 99.81% for θ, 98.82% for Δ, 99.58% for M, and 99.78% for V. For clay soil, RSM achieved 99.61% for θ, 99.55% for Δ, 99.79% for M, and 99.79% for V. These values show that while LR provides robust predictive models, RSM attains near-perfect fits for all response variables and thus offers a more reliable representation of nonlinear relationships among the design parameters.

6.2. RSM and LR Predicted Response

Figure 9 compares the LR-predicted responses for rotation (a), deflection (b), moment (c), and shear (d) with the FEM results for sand soil. While LR demonstrates reasonable accuracy for predicting rotation and deflection, notable discrepancies emerge in the scatter plots for moment and shear, particularly at higher response magnitudes. For instance, deviations in moment and shear predictions exceed 10% in several cases, especially under extreme loading conditions.
Figure 10a–d presents the RSM-predicted responses for the same variables. The scatter plots indicate strong correlations between the predicted and FEM-obtained values, with most data points closely aligning along the equality line. Minor deviations appear at dataset extremes, suggesting model limitations under these conditions. Nonetheless, percentage errors for rotation predictions generally remain below 5%.
The comparison of clay soil results (Figure 11 and Figure 12) reveals similar variations. RSM predictions closely match the FEM responses across all response variables, whereas LR maintains acceptable accuracy for rotation and deflection but shows relatively larger discrepancies for moment and shear predictions. These outcomes demonstrate RSM’s superiority over LR in capturing nonlinear interactions and complex parameter dependencies within IAB systems.

6.3. Interaction of Variables with Responses Obtained by RSM

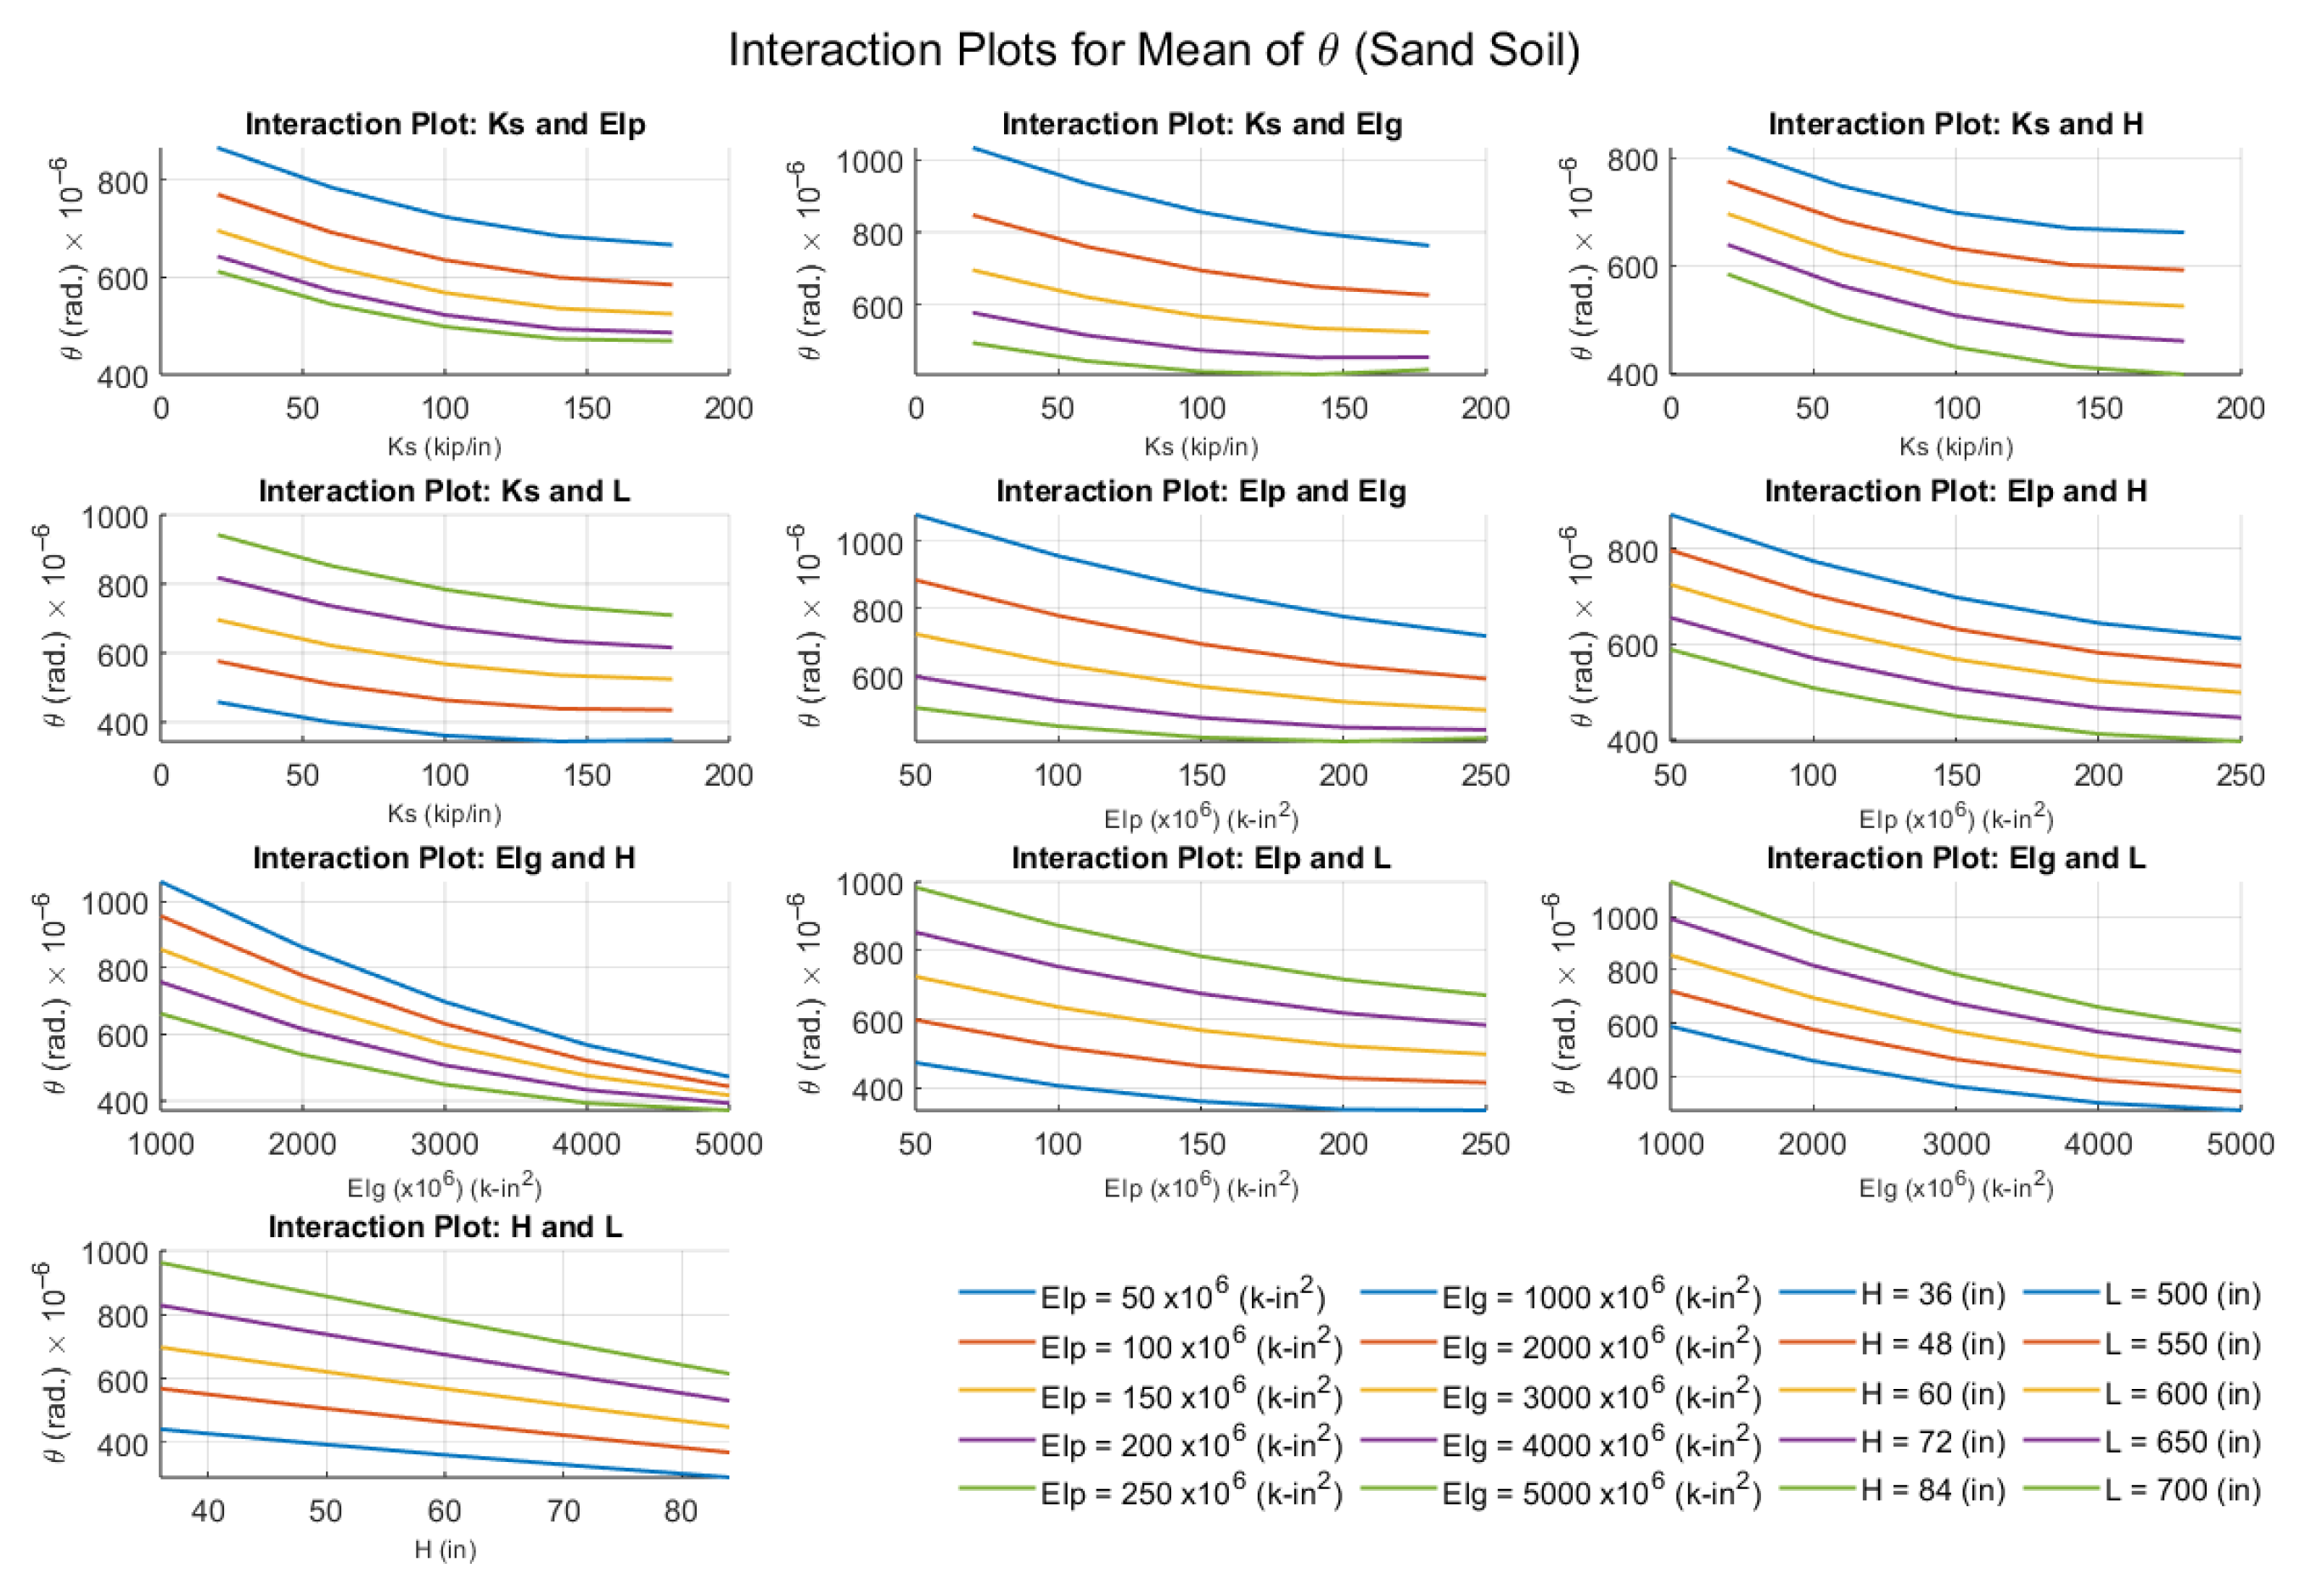
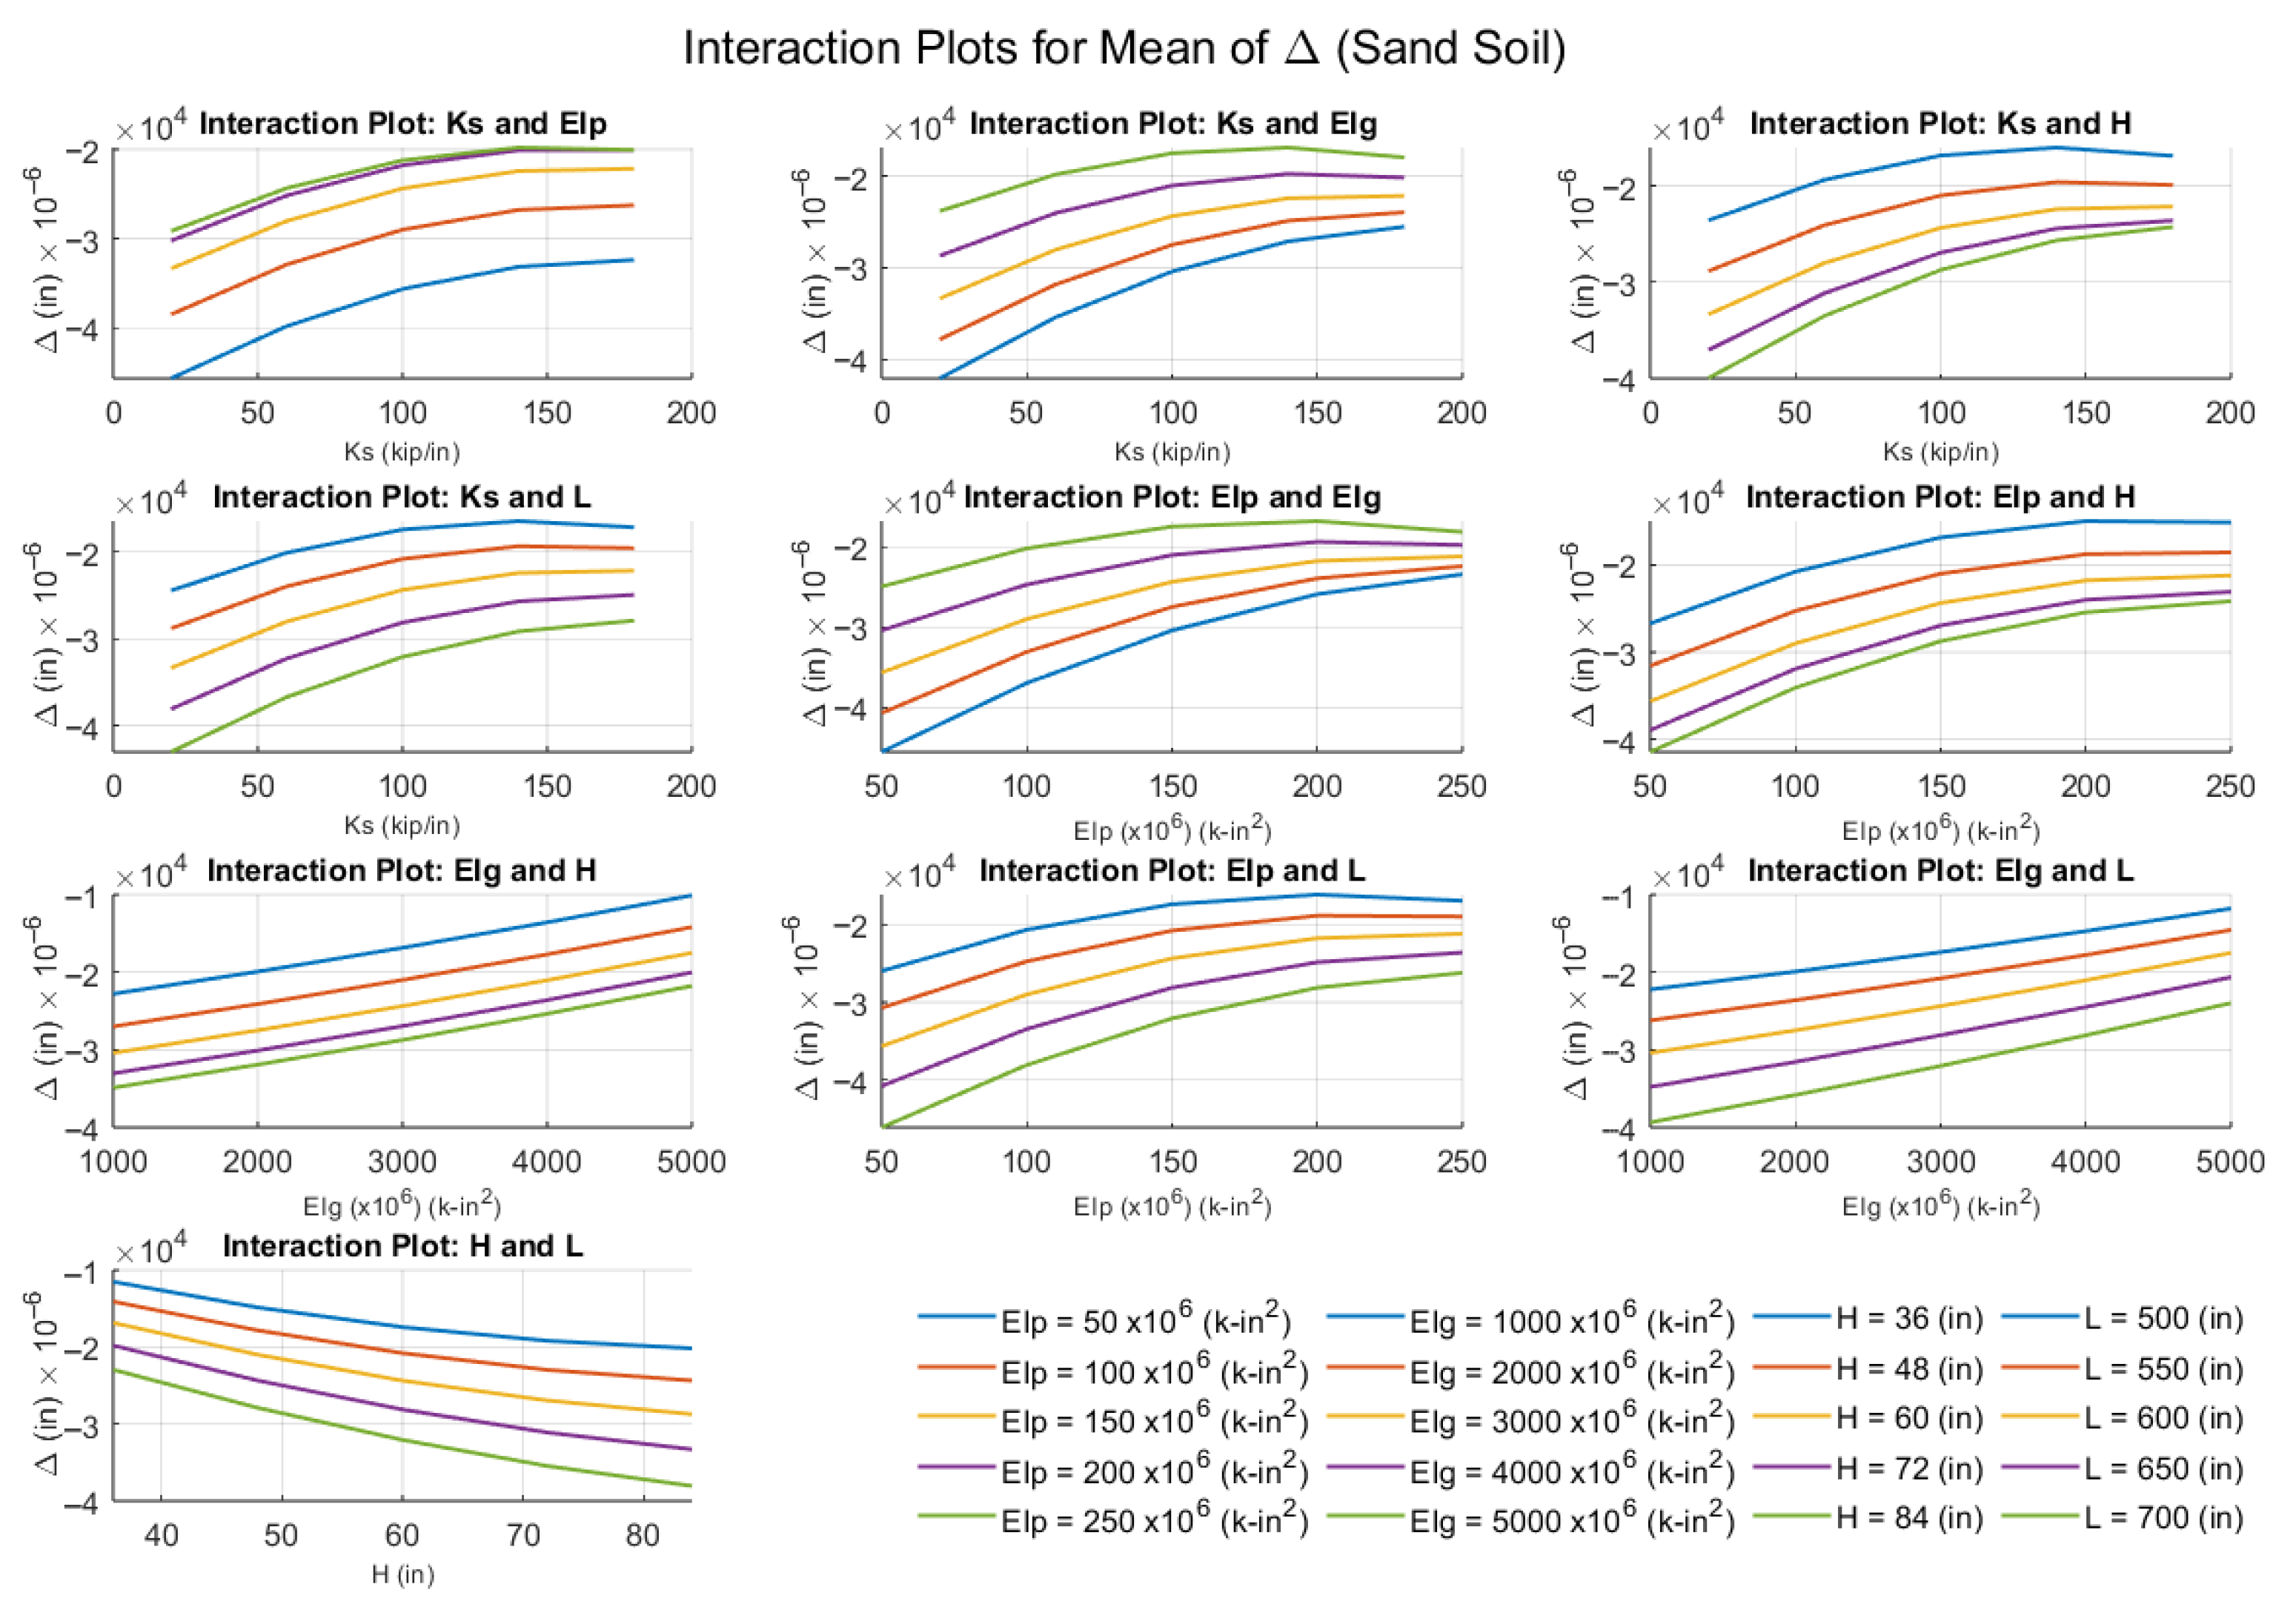
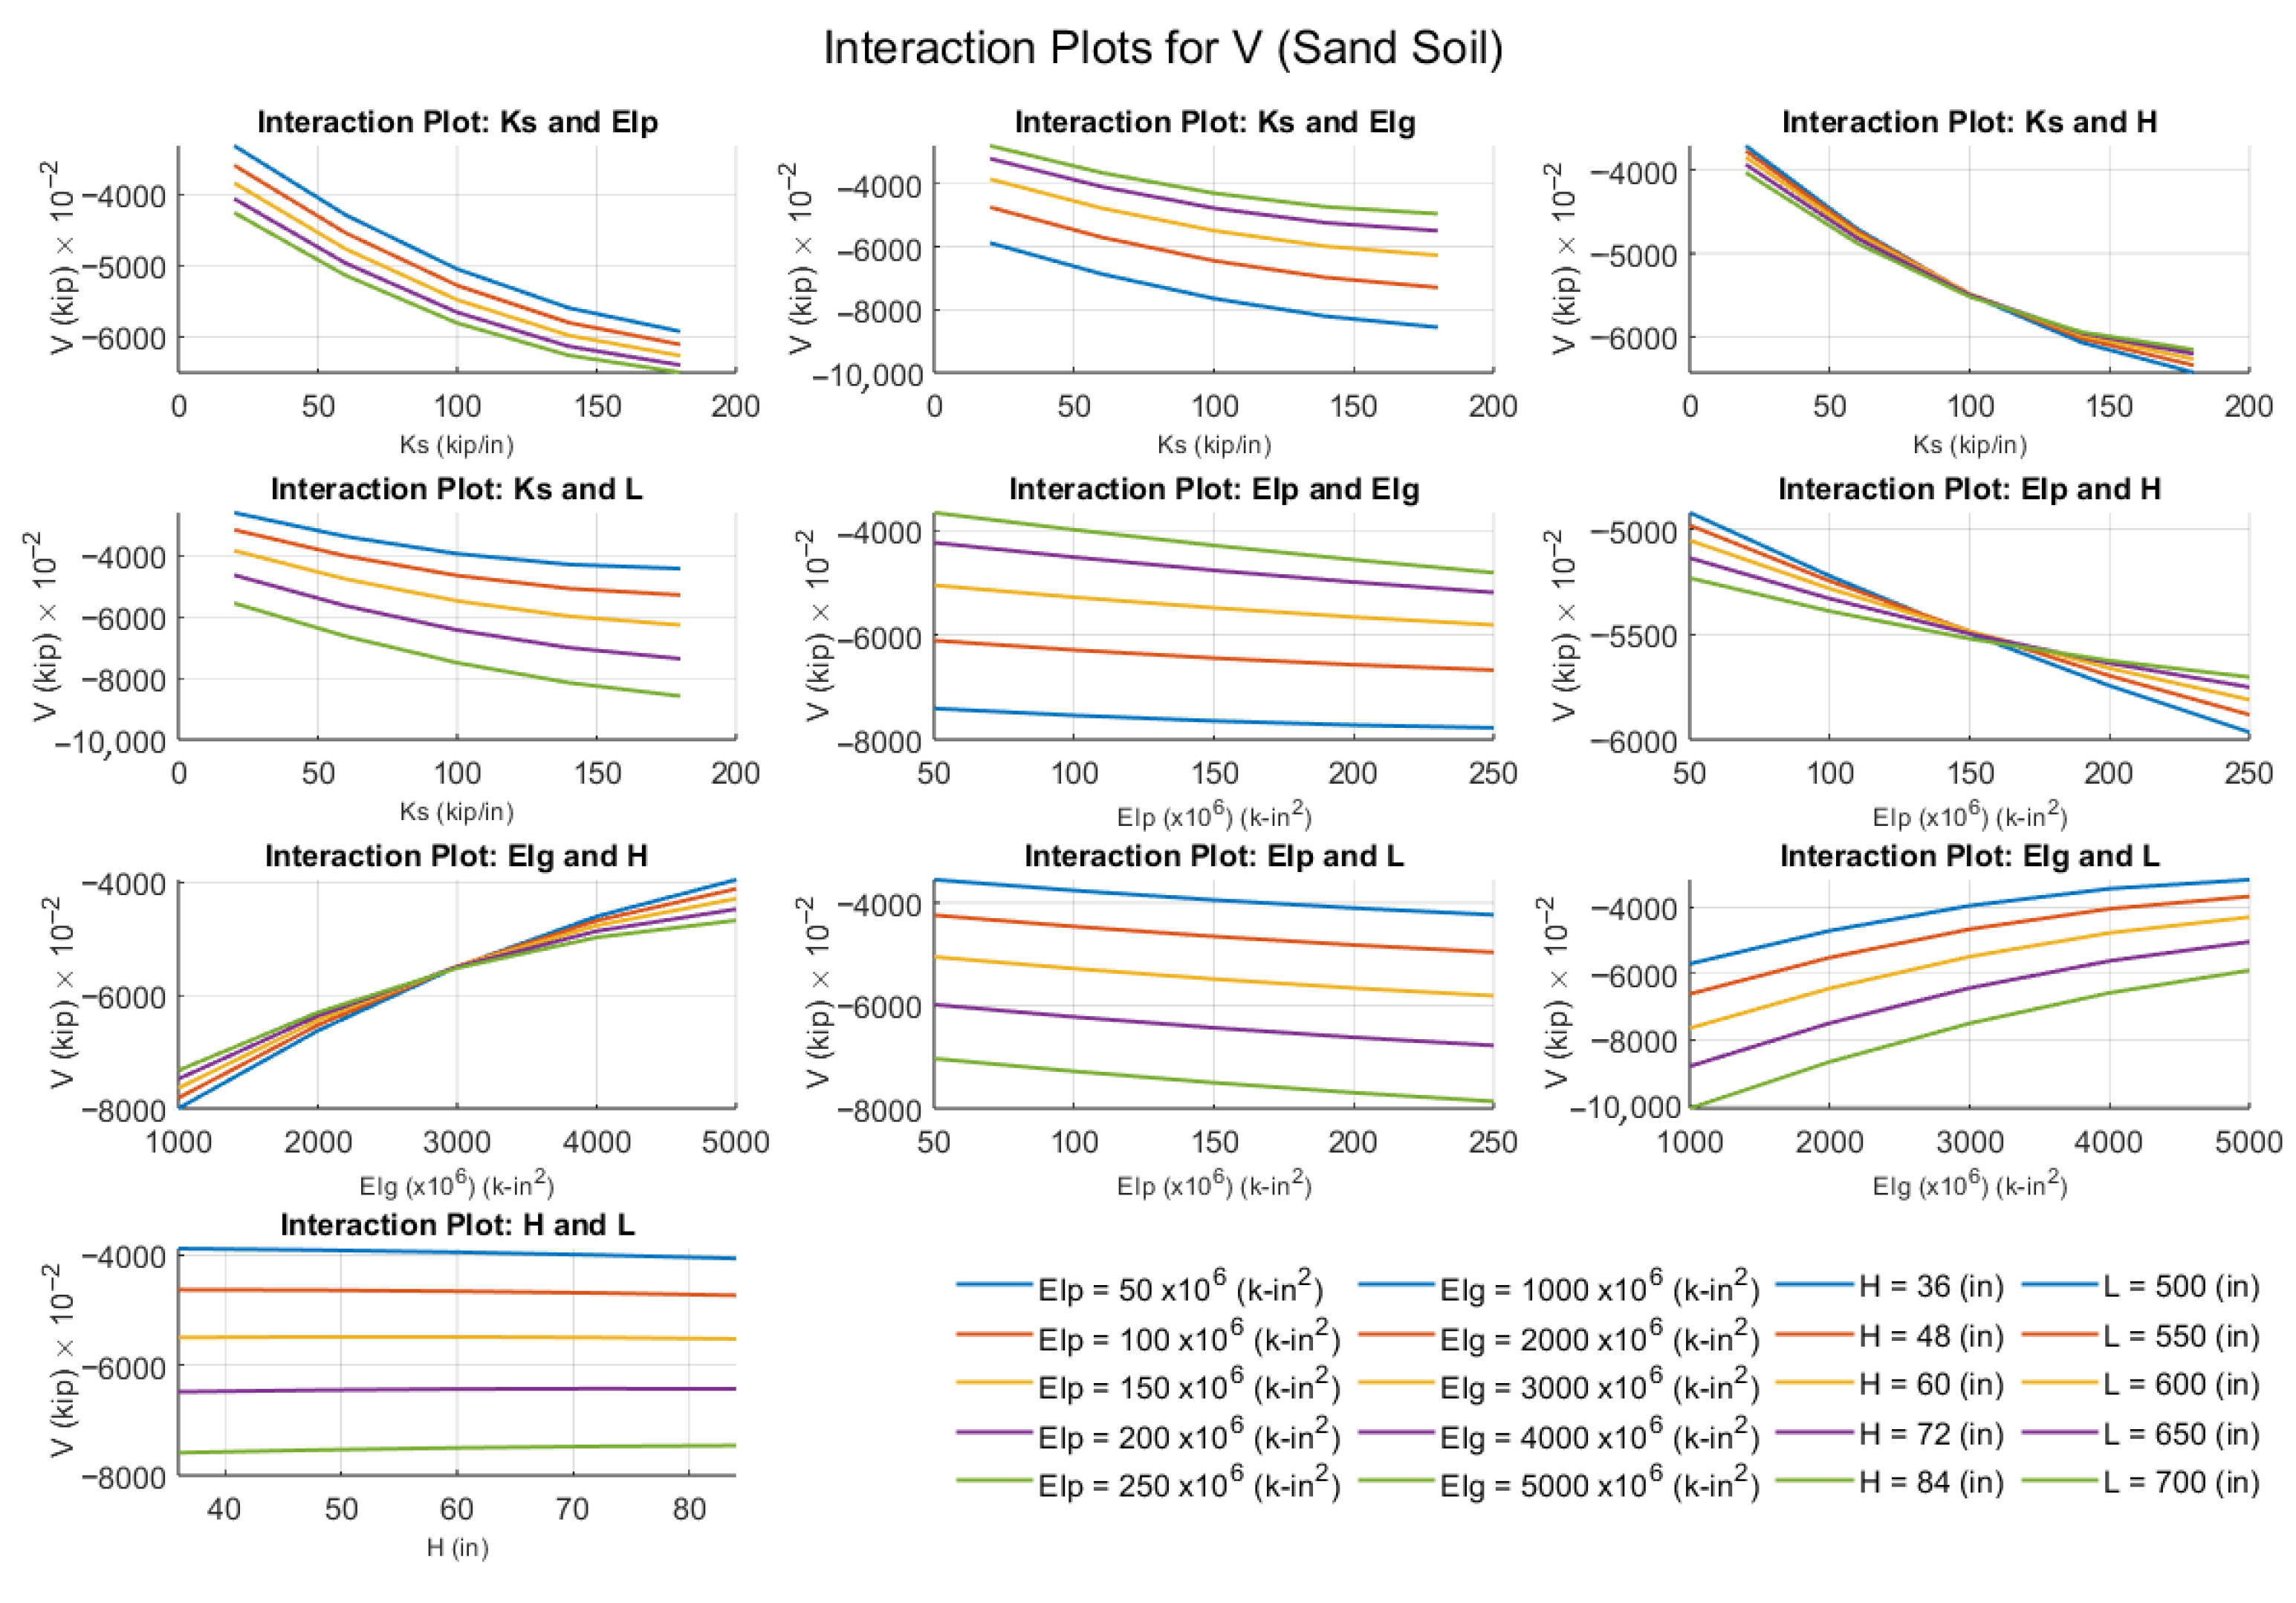
Figure 13, Figure 14 and Figure 15 present interaction plots illustrating how paired variables influence pile-abutment joint responses (θ, Δ, M, and V) in sand-type soil. Each plot shows the mean response at different levels of one factor as the other is varied. Similar trends were observed for clay-type soil and are therefore not shown.
Figure 13 demonstrates that θ decreases with increasing soil stiffness (Kₛ), pile rigidity (EIₚ), and girder rigidity (EIg). For example, increasing Kₛ from 20 to 180 kip/in (3.5 to 31.5 kN/mm) at EIₚ = 100 × 106 kip-in2 (42 × 106 kN·m2) reduces θ from 0.000770 to 0.000585 rad. Similarly, θ is sensitive to geometric variables: increasing bridge span (L) increases θ, while taller abutments (H) reduce it.
In Figure 14, Δ also decreases with higher Kₛ, EIₚ, and EIg. For instance, increasing EIₚ from 50 to 250 × 106 kip-in2 (21 to 105 × 106 kN·m2) at Kₛ = 100 kip/in (17.5 kN/mm) reduces Δ from −0.035 in (−0.9 mm) to −0.021 in (−0.54 mm). In contrast, increases in H and L generally lead to higher deflections, especially for longer spans.
Figure 15 shows that M is moderately affected by stiffness variables but strongly influenced by geometry. For example, increasing EIg at Kₛ = 100 kip/in reduces M from 4876 to 2670 kip-in (551 to 302 kN·m), while increasing L from 500 to 700 in (12.7 to 17.8 m) at H = 60 in (1.52 m) increases M from 2410 to 4698 kip-in (272 to 531 kN·m).
Figure 16 indicates that V generally increases with Kₛ and EIₚ due to higher load transfer efficiency. For instance, increasing Kₛ from 20 to 180 kip/in at EIₚ = 100 × 106 kip-in2 causes V to rise from −35.96 to −61.13 kip (−160 to −272 kN). Conversely, increased EIg reduces V, especially at lower stiffness ranges. Geometric effects vary: longer spans consistently increase V, while taller abutments tend to reduce it under fixed span conditions.
Overall, the interaction plots confirm that increasing structural and soil stiffness reduces rotational and deflection responses but may elevate moment and shear due to load redistribution. Span length consistently amplifies demands, while abutment height provides moderating effects depending on the response type.

7. FEM vs. RSM Predictions

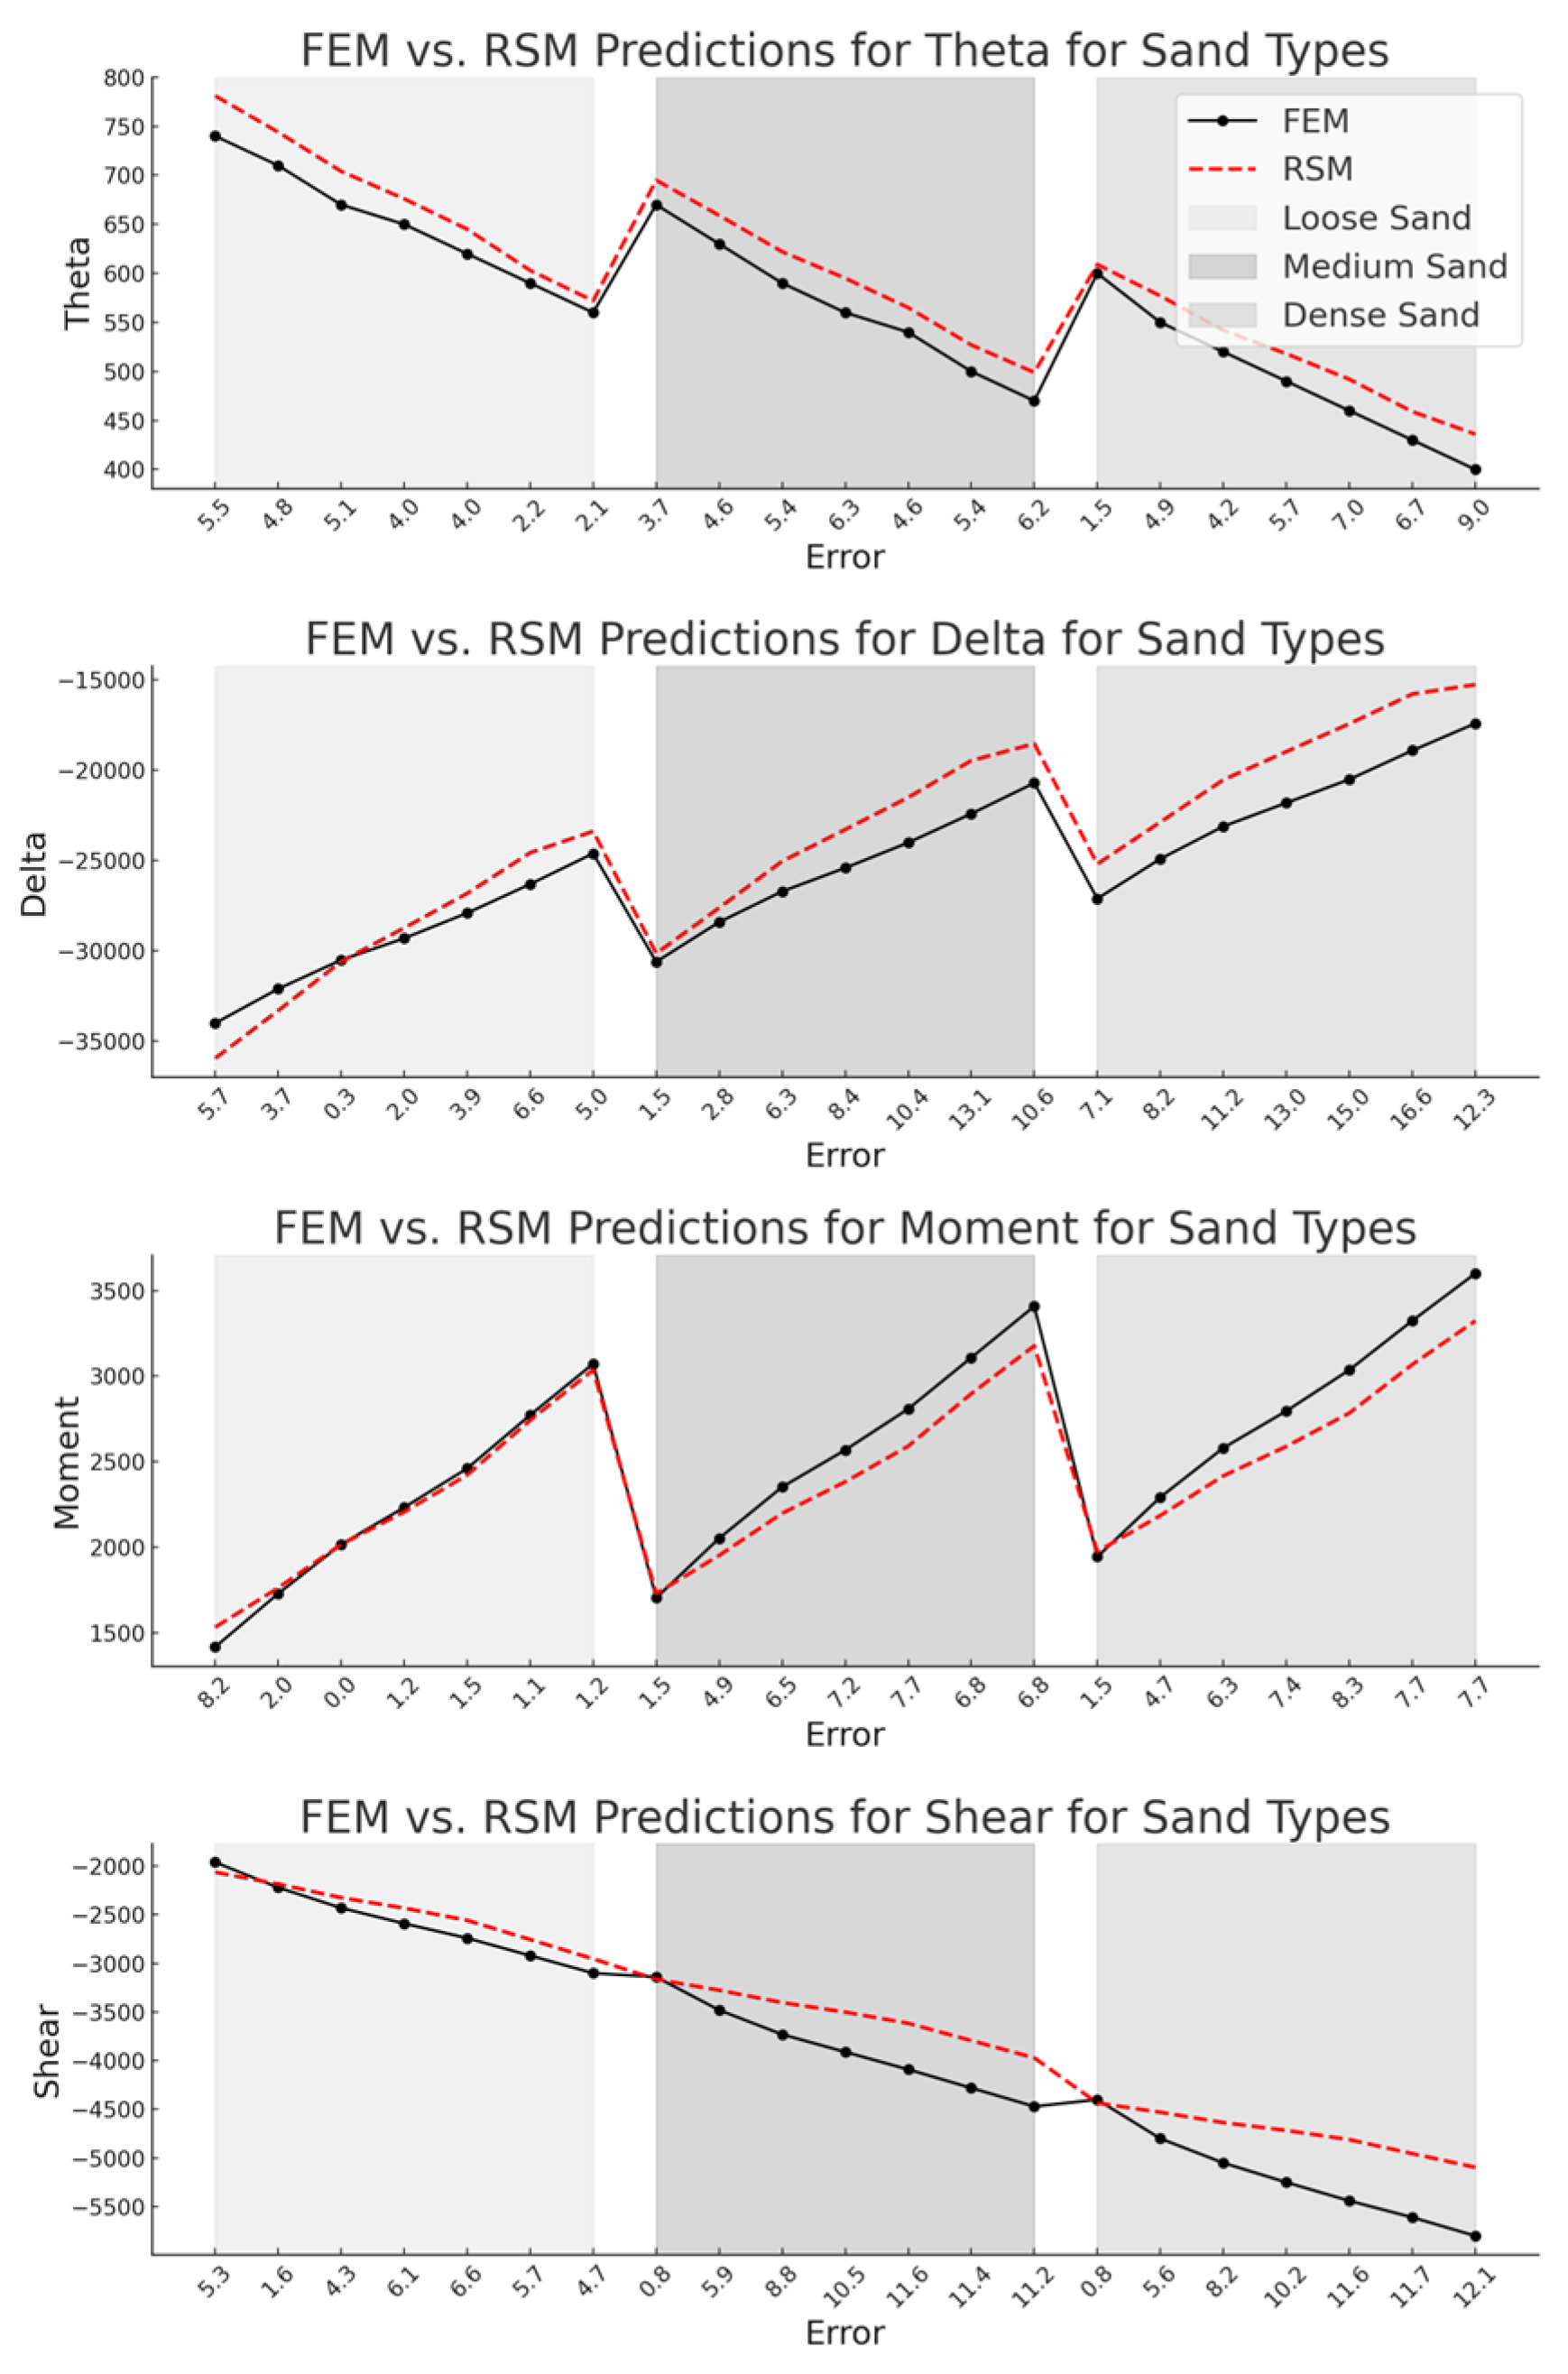
RSM predictions for pile-abutment rotation, deflection, moment, and shear responses of Bridge I were evaluated under varying pile parameters (seven different HP piles: HP10x42, HP10x57, HP12x53, HP12x63, HP14x73, HP14x89) and different soil conditions (sand types: loose sand, medium sand, and dense sand; and clay types: soft clay, medium clay, stiff clay, and very stiff clay). The results, presented in Figure 17 and Figure 18, illustrate the prediction accuracy and numerical error values, categorized by soil type and pile flexural stiffness. For sand types (Figure 17), the errors between RSM and FEM predictions were generally small, with the rotation response for loose sand exhibiting the lowest error range (2.1% to 5.5%). For the medium sand condition, the predictions from the RSM and FEM models showed strong agreement, with most errors remaining below 5%. In contrast, for the dense sand condition, error rates exhibited an increasing tendency, particularly for the deflection response, where the maximum error reached 16.6%. Moment predictions were highly accurate across all sand types, with error rates predominantly below 8%. Shear predictions displayed a mixed tendency, with minimal errors (0.8% to 6.6%) observed for loose sand, while higher errors occurred for medium and dense sands, reaching up to 12.1%. While 2D–3D discrepancies are inherent, the additional LR and RSM approximations introduced only modest error increases, with cumulative deviations remaining below 15% for most soil conditions and response variables. For very stiff soils, cumulative errors may approach 20–27%, which indicates that the models remain within acceptable engineering limits but should be applied with caution in extreme stiffness ranges or for longer spans.
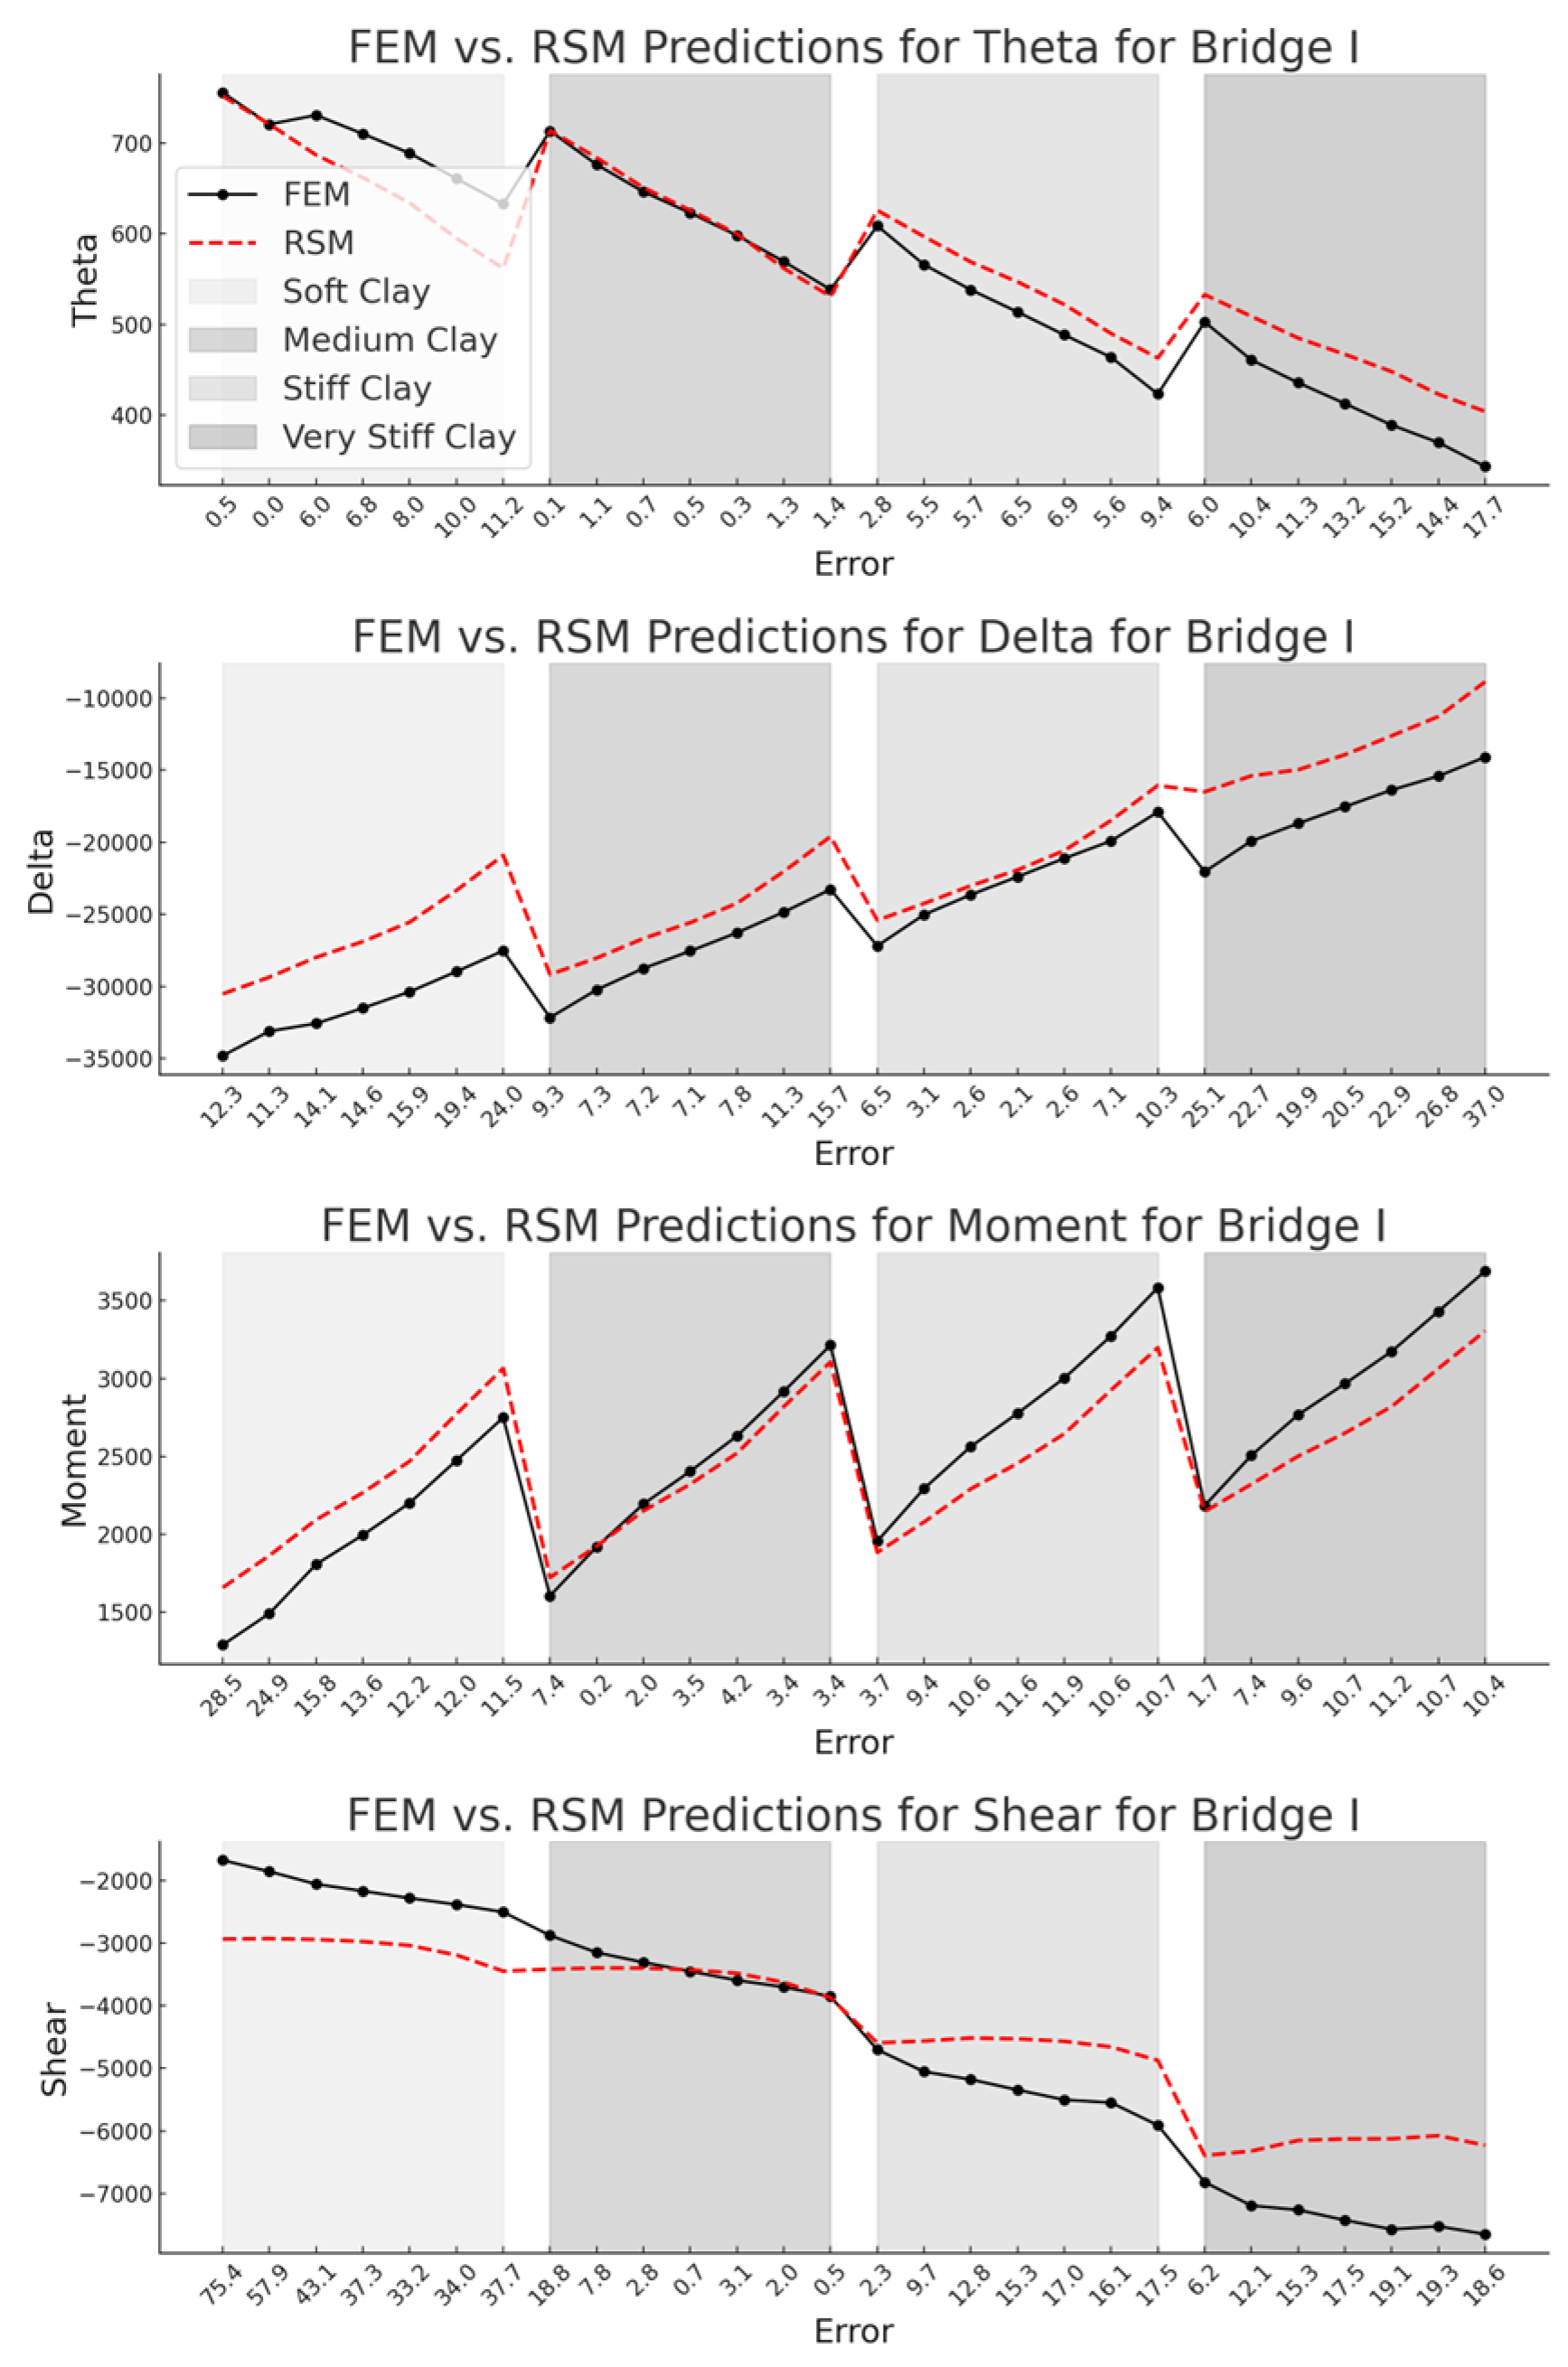
For clay types (Figure 18), RSM predictions for rotation response demonstrated high accuracy for soft and medium clay conditions, with error rates below 5% in most cases. However, error rates increased to as high as 17.7% for stiff and very stiff clays. Deflection response predictions showed a clear tendency of increasing error rates with clay stiffness, remaining below 8% for soft and medium clay conditions but reaching 26.8% for very stiff clay. For moment response, consistent prediction accuracy was observed across all clay types, with errors remaining below 12%. Predictions for shear force followed a similar tendency to deflection response, with error rates increasing for stiffer clay types. The highest errors were observed for very stiff clay, exceeding 18%, highlighting potential limitations of the RSM model in capturing shear behavior in high-stiffness materials. Overall, the RSM model performed well for both sand and clay types, particularly for loose sand and soft clay, where errors were minimal. However, challenges were noted in predicting deformation and shear responses for dense sand and very stiff clay.

8. Implementation of Spring Model for Pile-Abutment Joint

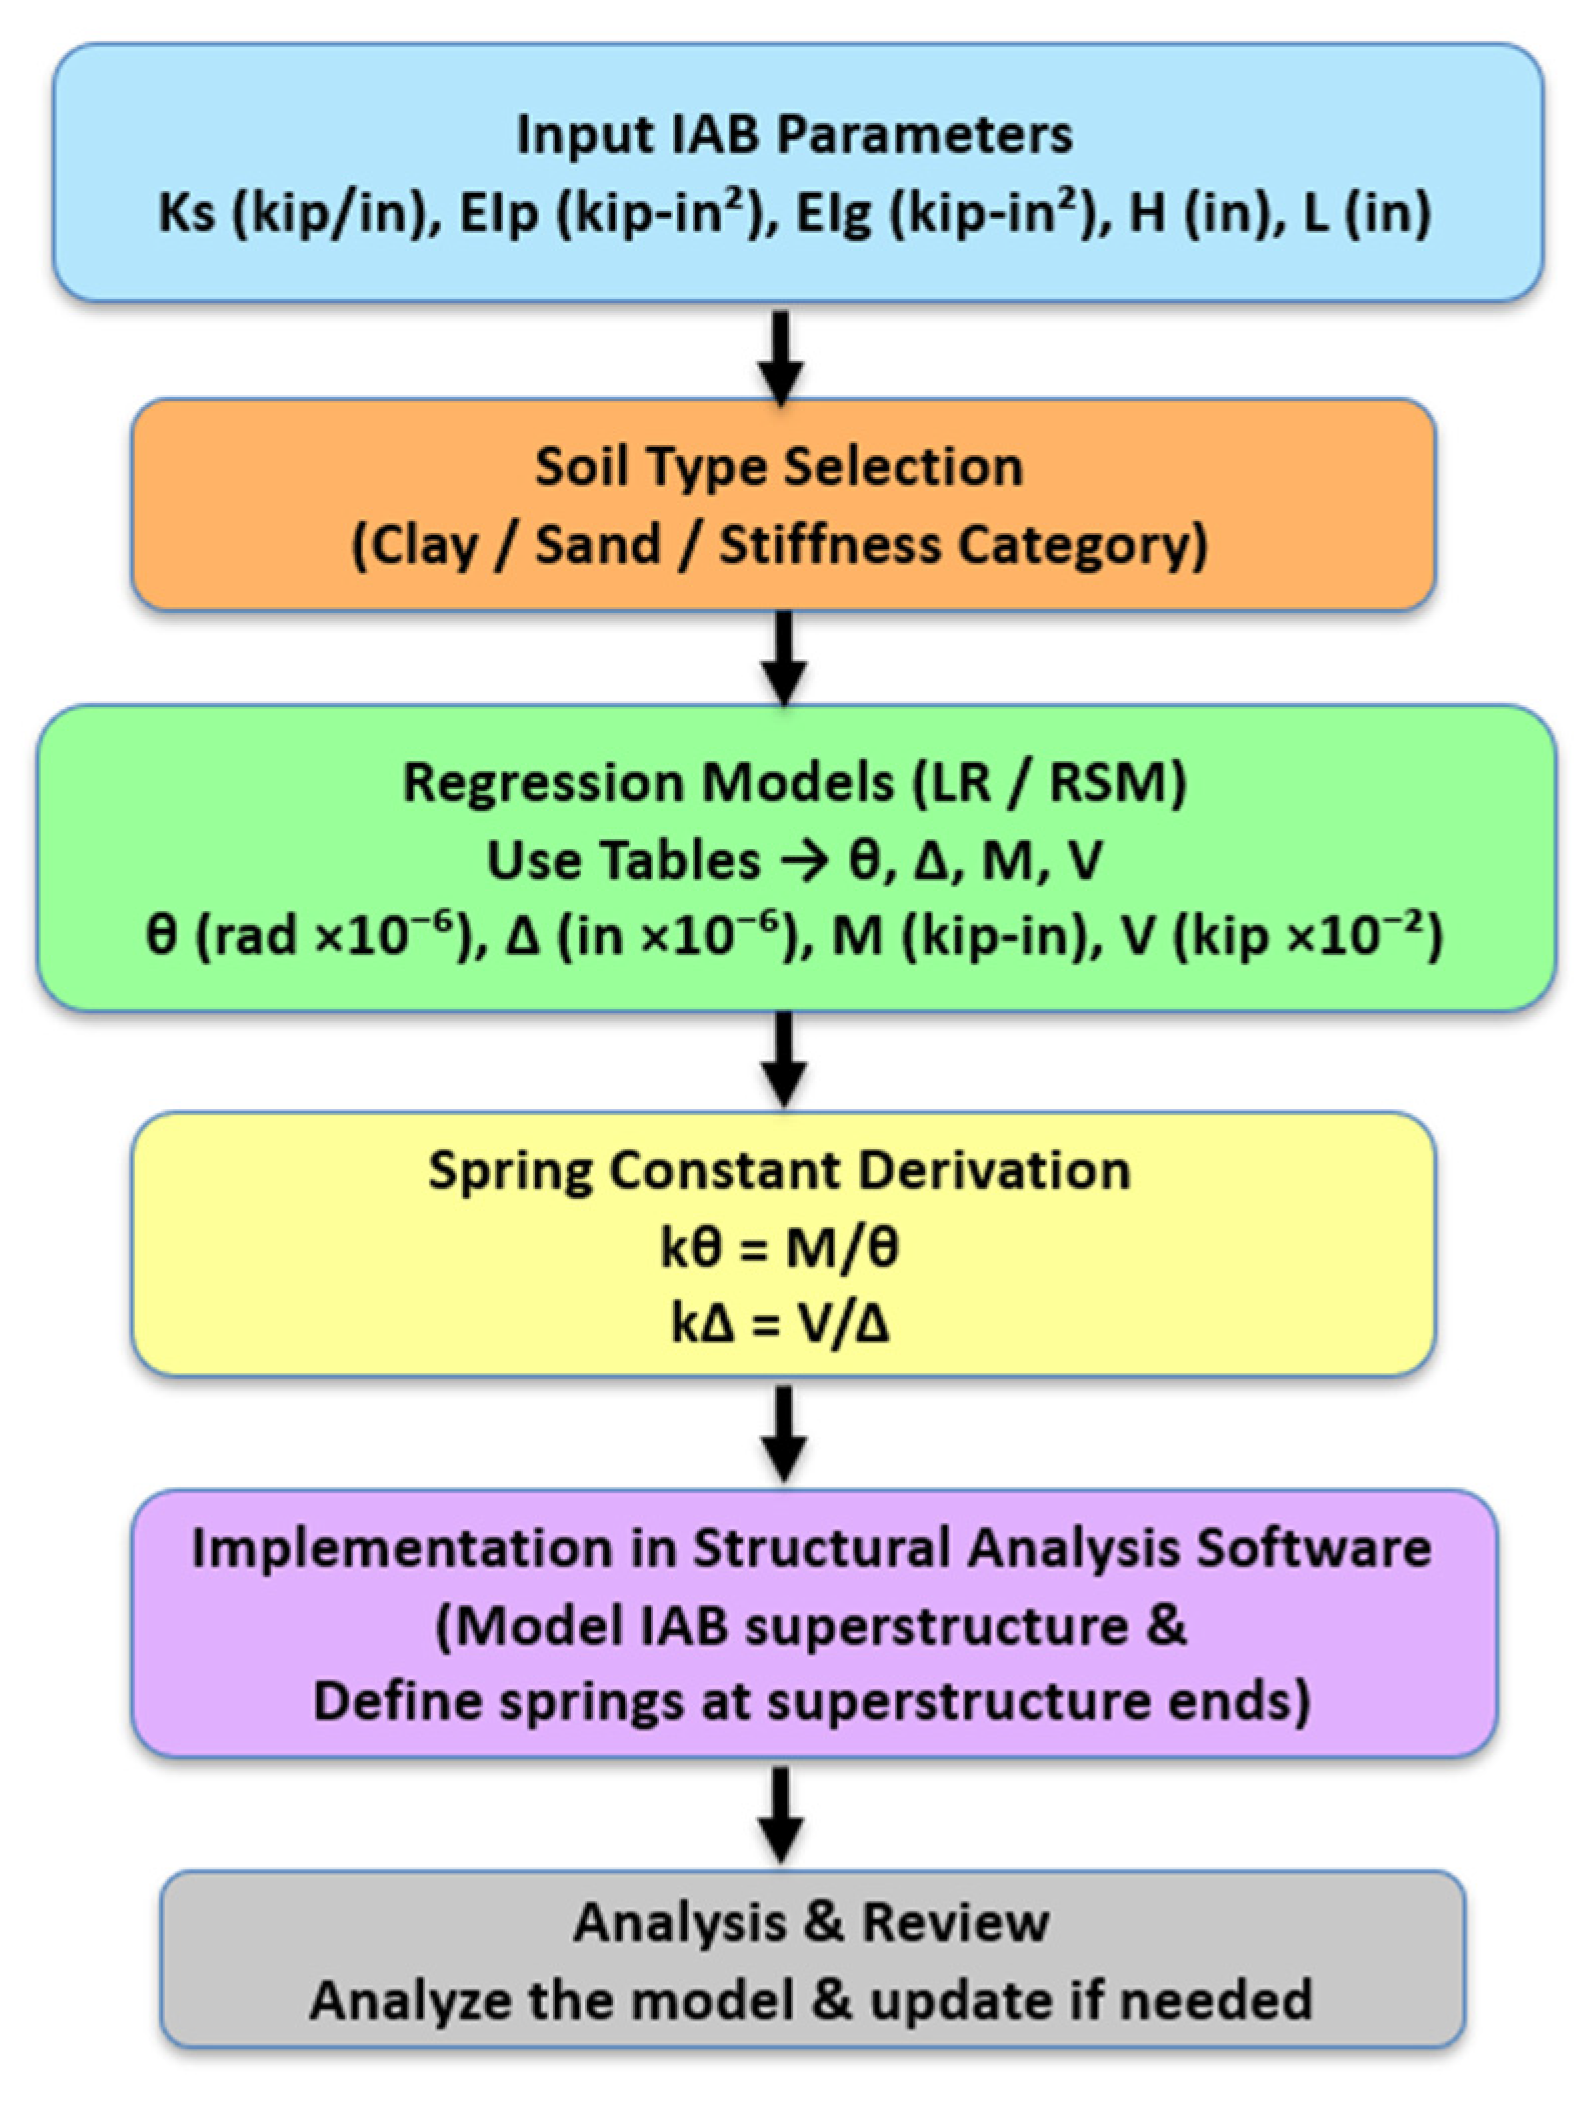
To demonstrate the implementation of the spring model for a pile-abutment joint, the 2D frame model of Bridge I was modified to include rotational and linear springs. To further clarify the procedure, a flowchart has been developed (Figure 19), illustrating the step-by-step process of deriving the spring stiffness constants from the regression equations (Table 5 and Table 6) and implementing them within structural analysis software.
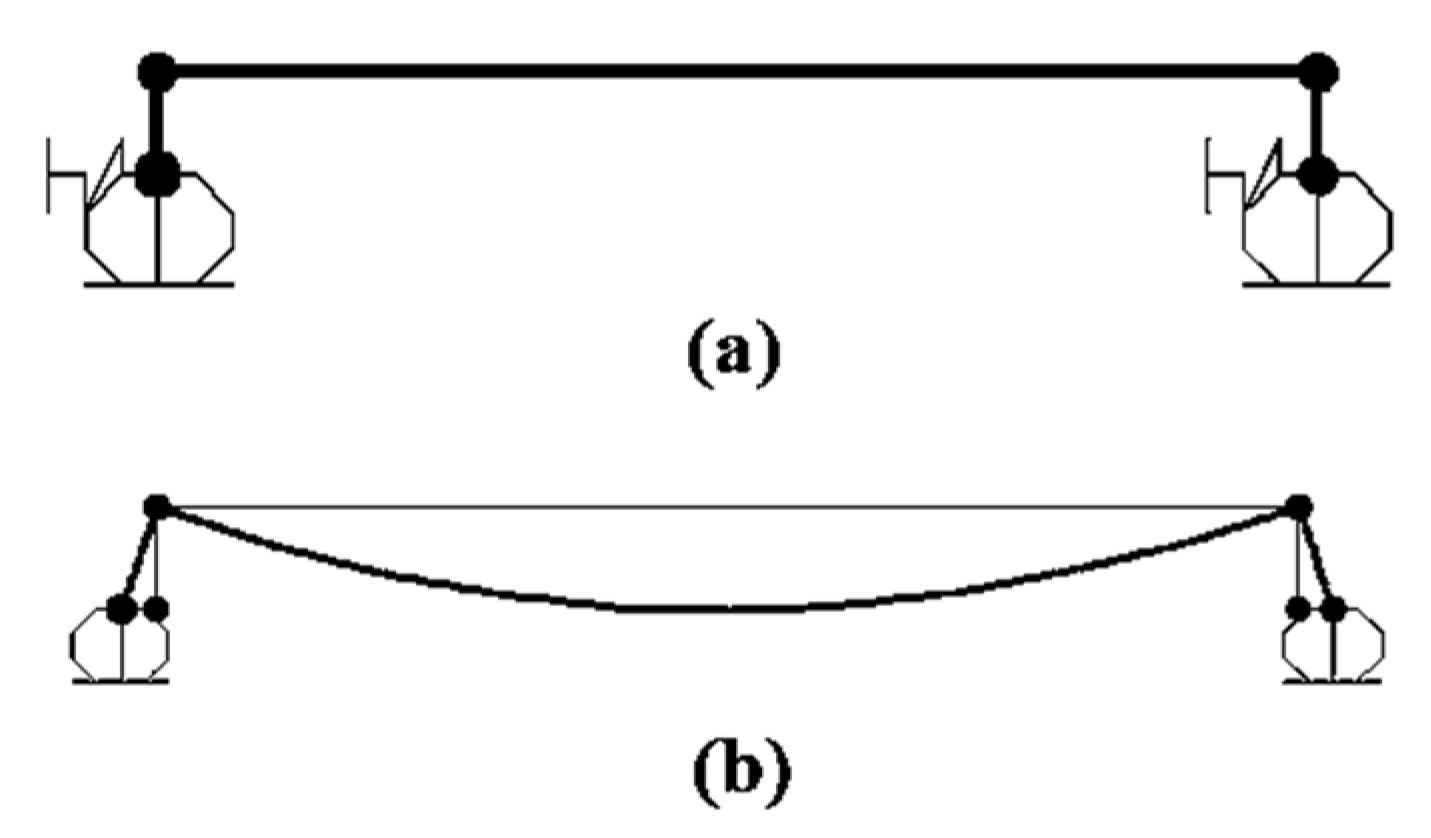
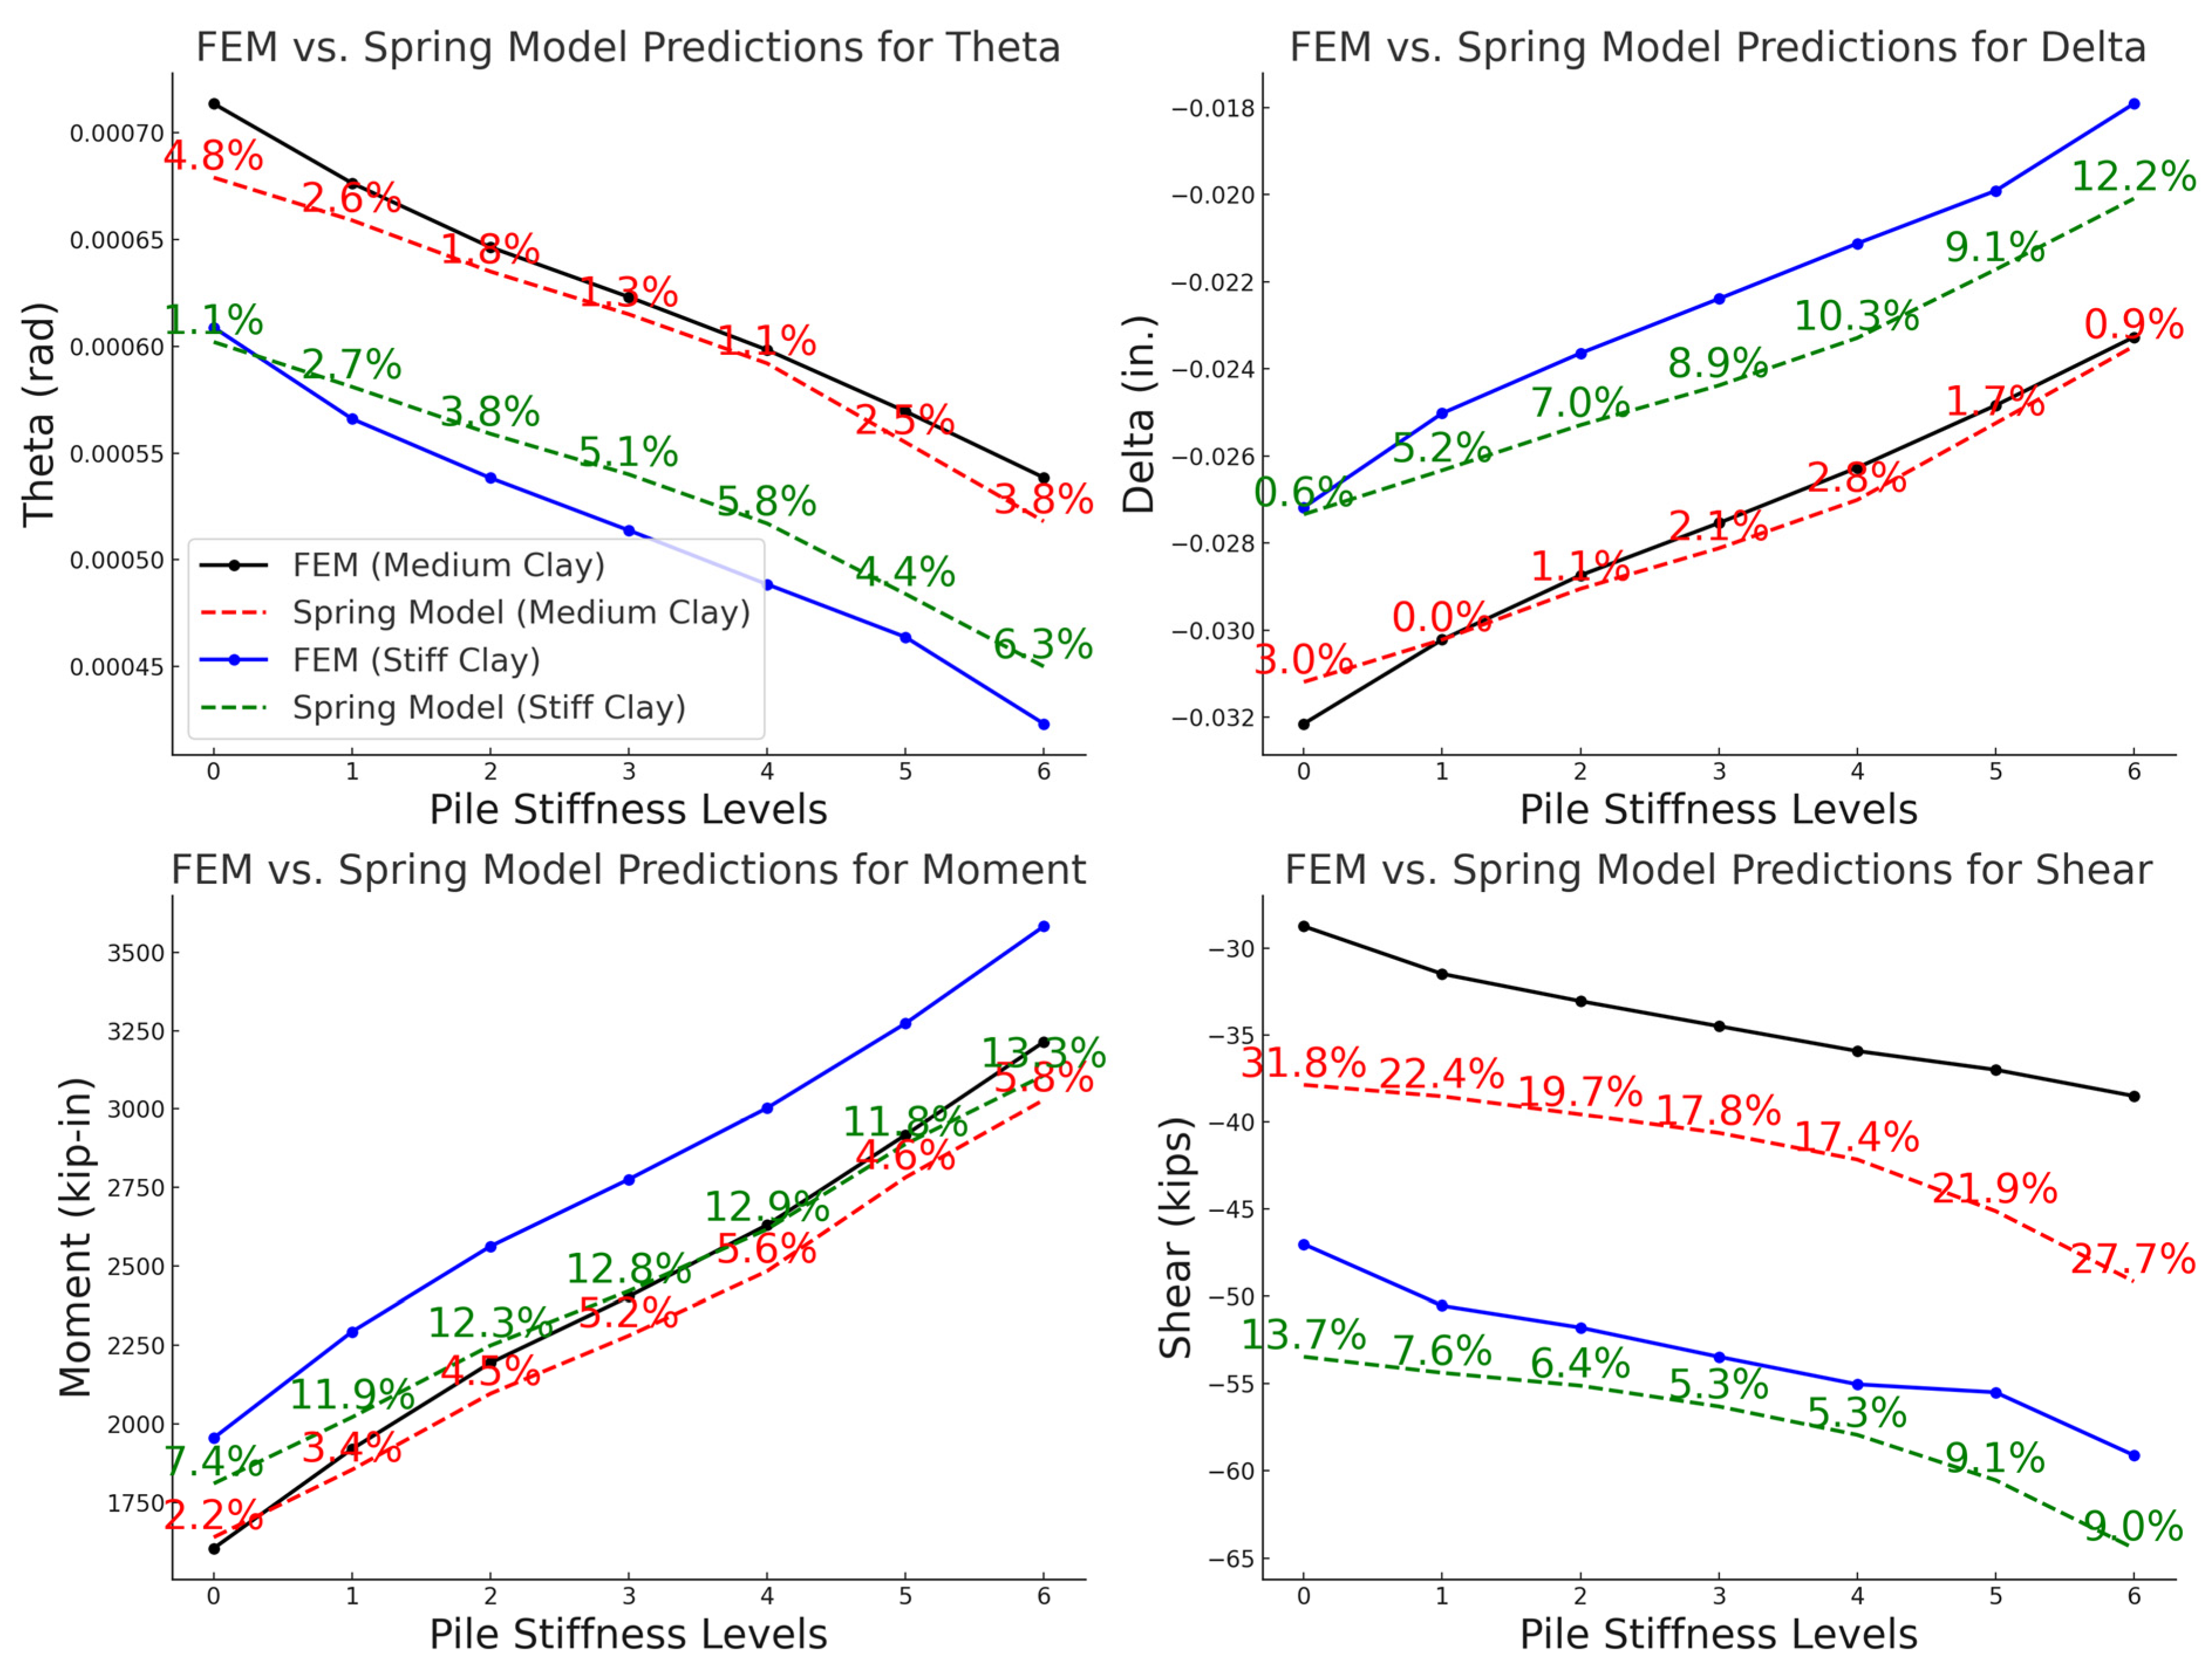
These springs were attached to the bottom joints of the abutment element to replicate the pile-soil interaction model behavior, as illustrated in Figure 20. The stiffness values of the springs were derived from the pile-abutment joint responses predicted for a given soil, substructure and superstructure bridge parameters by the RSM regression equations (Table 6). Rotational spring stiffness was calculated by dividing the pile head moments by the pile head rotations (Kθ = M/θ), while linear spring stiffness was determined by dividing the pile head shear forces by the lateral deflection at the pile head (KΔ = V/Δ). The analysis was conducted under loading conditions similar to those used in the experimental design. For demonstration purposes, medium and stiff clay soils were assumed as the foundation soil types, and seven different HP pile sections were considered for comparison.
The comparison between the predictions of the spring model and FEM results, along with the corresponding error values, is presented in Figure 21. The spring model demonstrated good accuracy in predicting FEM results for medium clay. Error rates for pile-abutment joint rotation, deflection, and bending moment are generally below 5%. However, the shear forces were moderately predicted with increased error rates. For stiff clay, the errors in the spring model’s predictions, particularly for deflection and moment, were slightly higher compared to medium clay, ranging between 5% and 13.3%. Rotational response predictions also exhibited slightly greater errors in stiff clay, with values reaching up to 6.3%. On the other hand, shear force predictions in stiff clay were more accurate than those in medium clay, with error rates ranging between 5.3% and 13.7%.

9. Conclusions

This study developed and validated predictive models to analyze and optimize the behavior of pile–abutment joints in short-span IABs. Using LR and RSM, practical and computationally efficient spring-based models were established to represent the nonlinear characteristics of pile–soil interaction. The proposed models provide viable alternatives to conventional FEM analyses, particularly for early-stage design and parametric studies. The principal findings of the study can be summarized as follows:
  • The complex and nonlinear behavior of pile–soil interaction can be effectively approximated using the proposed spring models, in which stiffness values are derived from RSM equations.
  • RSM provides better prediction accuracy for pile–abutment responses of short-span IABs under live loads and varying soil and structural conditions, significantly outperforming LR in capturing complex parameter interactions.
  • The novelty of this study lies in deriving regression-based spring constants calibrated against FEM analyses, which is a practical and resilience-oriented technique for bridge designers. Unlike prior studies relying solely on FEM or traditional p–y curves, the proposed model enables direct use of predictive spring constants in design software.
  • Prediction errors for soft clay and very stiff clay exceed 20% in some cases, reaching up to 27% for very stiff clays. Extrapolation to high-stiffness soils should therefore be applied cautiously, with engineering judgment and conservatism as required by design codes.
  • For other soil conditions, prediction errors remain below 20% for rotation and deflection, and below 15% for moment and shear. The models are most reliable within the ranges Ks = 20–180 kip/in (3.5–31.5 kN/mm), EIp = 50–250 × 106 kip·in2 (0.14–0.72 × 10⁶ kN·m2), EIg = 1000–5000 × 106 kip·in2 (2.9–14.3 × 10⁶ kN·m2), H = 3–7 ft (0.91–2.13 m), and L = 42–58 ft (12.7–17.8 m). A design safety factor of 1.2–1.3 is recommended when applying regression-derived stiffness values.
  • Sensitivity analyses revealed that increasing soil stiffness reduces pile–abutment rotation and deflection, slightly increases moments, but considerably raises shear demand.
  • Increasing pile rigidity reduces joint rotation and deflection but increases moments and shear forces.
  • Increasing girder flexural rigidity reduces joint rotation, deflection, moments, and shear forces.
  • Increasing abutment height slightly reduces moments and joint rotation but increases deflection, with negligible influence on shear.
  • Increasing span length amplifies joint rotation, deflection, moments, and shear forces due to larger lever arms and higher load demands.
  • Prediction errors increase with span length due to amplified lever-arm effects and greater sensitivity of pile-abutment responses to geometric nonlinearity. Regression models capture these effects within the studied range of 42–58 ft (12.7–17.8 m), but extrapolation to longer spans introduces cumulative deviations.
  • The proposed regression-based spring model is restricted to static analysis of short-span IABs. It does not capture dynamic effects such as seismic or thermal cycling, nor does it consider pile-to-pile interaction effects. These aspects should be addressed in future research.
  • The findings regarding the influence of soil stiffness on pile–abutment rotation, deflection, moment, and shear are valid only for the dry/static soil conditions modeled herein. Pore pressure evolution, seasonal groundwater fluctuations, and long-term environmental effects are not accounted for in this study, as they are beyond its scope.
Overall, the proposed RSM- and LR-based spring models provide a reliable and efficient framework for estimating pile–abutment joint behavior in short-span IABs.

Author Contributions

E.P.: Conceptualization, Methodology, Investigation, Data curation, Validation, Writing—original draft, Writing—review and editing. E.G.P.: Investigation, Formal analysis, Data curation, Writing—review and editing. All authors have read and agreed to the published version of the manuscript.

Funding

This research received no external funding.

Data Availability Statement

The data that support the findings of this study are available from the corresponding author upon reasonable request.

Conflicts of Interest

The authors declare that they have no known competing financial interest or personal relationships that could have appeared to influence the work reported in this paper.

Appendix A. Soil Spring Parameters Used in p-y Method Correlations

Parameters used in the p-y method correlations are given in Table A1. Although the correlations do not explicitly address medium clay, it is assumed to be an intermediate between soft and stiff clay, and hence the correlations were adapted for medium clay. In this adaptation, the value “0.5” in the correlation was modified to “0.25” following recommendation [26]. Hannigan et al. [27] provided representative values for the undrained shear strength of clay (cu), which are given in Table A2.
Table A1. Parameters used in the correlations.
NomenclatureDescriptionUnits/Values
k h Soil stiffness-
PuUltimate soil resistancekip/ft (kN/m)
cuUndrained shear strength of clayRefer to Table 4
BpPile widthft (m)
ɣEffective unit weight of the soilpcf (N/m3)
zDepth of soil spring from ground surfaceft (m)
y50Displacement at one-half of the ultimate soil reactionft (m):
2.5Bpε50 for soft and stiff clay
2Bpε50 for very stiff clay
ε50Axial strain at one-half of the peak stress difference from a triaxial test0.02 for soft clay
0.01 for stiff clay
0.005 for very stiff clay
JSoil parameter200 for loose sand
600 for medium sand
1500 for dense sand
Table A2. Representative values of cu and ε50 for clay [27].
Clay
Consistency
Average Undrained
Shear Strength, cu (kPa)
ε50
Soft Clay12–240.02
Medium Clay24–480.01
Stiff Clay48–960.007
Very Stiff Clay96–1920.005
Hard Clay192–3830.04
Linear elastic spring stiffness values were derived from soil correlations and distributed along the pile length. Figure A1 shows how stiffness varies with soil type: it increases linearly with depth in sand but levels off in clay beyond a certain depth. Each spring area was calculated using the pile diameter and tributary length, defined by the spacing above and below the spring. The pile diameter was taken as the flange width since piles are oriented along their strong axis.
Figure A1. Variation of soil stiffness with pile depth.
Buildings 15 03493 g0a1

References

  1. Kunin, J.; Alampalli, S. Integral abutment bridges: Current practice in United States and Canada. J. Perform. Constr. Facil. 2000, 14, 104–111. [Google Scholar] [CrossRef]
  2. Khodair, Y.; Abdel-Mohti, A. Numerical analysis of pile–soil interaction under axial and lateral loads. Int. J. Concr. Struct. Mater. 2014, 8, 239–249. [Google Scholar] [CrossRef]
  3. Allen, C.A. Research Pays Off: Jointless Bridge Research Pays Dividends for Vermont. TR News 2010, 267, 51–53. [Google Scholar]
  4. White, H. Integral Abutment Bridges: Comparison of Current Practice Between European Countries and the United States of America; Transportation Research and Development Bureau, New York State Department of Transportation: Albany, NY, USA, 2007. [Google Scholar]
  5. Maruri, R.F.; Petro, S.H. Integral Abutments and Jointless Bridges (IAJB) 2004 Survey Summary. In Proceedings of the Integral Abutment and Jointless Bridges (IAJB 2005), Federal Highway AdministrationWest Virginia Department of Transportation, Baltimore, MD, USA, 16–18 March 2005. [Google Scholar]
  6. Arsoy, S.; Barker, R.M.; Duncan, J.M. The behavior of Integral Abutment Bridges; Virginia Transportation Research Council (VTRC): Charlottesville, VA, USA, 1999. [Google Scholar]
  7. Huang, J. Behavior of Concrete Integral Abutment Bridges. Doctoral Dissertation, University of Minnesota, Minneapolis, MN, USA, 2004. [Google Scholar]
  8. Burke, M.P., Jr. Integral and Semi-Integral Bridges; John Wiley & Sons: Hoboken, NJ, USA, 2009. [Google Scholar]
  9. Kuntoğlu, M.; Aslan, A.; Pimenov, D.Y.; Giasin, K.; Mikolajczyk, T.; Sharma, S. Modeling of cutting parameters and tool geometry for multi-criteria optimization of surface roughness and vibration via response surface methodology in turning of AISI 5140 steel. Materials 2020, 13, 4242. [Google Scholar] [CrossRef] [PubMed]
  10. Adamu, M.; Ayeni, K.O.; Haruna, S.I.; Mansour, Y.E.-H.I.; Haruna, S. Durability performance of pervious concrete containing rice husk ash and calcium carbide: A response surface methodology approach. Case Stud. Constr. Mater. 2021, 14, e00547. [Google Scholar] [CrossRef]
  11. Zhang, Q.; Feng, X.; Chen, X.; Lu, K. Mix design for recycled aggregate pervious concrete based on response surface methodology. Constr. Build. Mater. 2020, 259, 119776. [Google Scholar] [CrossRef]
  12. Ghorbani, J.; Kodikara, J. Thermodynamically consistent effective stress formulation for unsaturated soils across a wide range of soil saturation. Comput. Mech. 2024, 73, 1077–1094. [Google Scholar] [CrossRef]
  13. Borja, R.I. Cam-Clay plasticity. Part V: A mathematical framework for three-phase deformation and strain localization analyses of partially saturated porous media. Comput. Methods Appl. Mech. Eng. 2004, 193, 5301–5338. [Google Scholar] [CrossRef]
  14. AASHTO. AASHTO LRFD Bridge Design Specifications, 10th ed.; AASHTO: Washington, DC, USA, 2024. [Google Scholar]
  15. Pando, M.A.; Ealy, C.D.; Filz, G.M.; Lesko, J.; Hoppe, E. A Laboratory and Field Study of Composite Piles for Bridge Substructures; United States Department of Transportation, Federal Highway Administration: Washington, DC, USA, 2006. [Google Scholar]
  16. Reese, L.C.; Van Impe, W.F. Single Piles and Pile Groups Under Lateral Loading; CRC Press: Boca Raton, FL, USA, 2000. [Google Scholar]
  17. Rajapakse, R.A. Pile Design and Construction Rules of Thumb; Butterworth-Heinemann: Amsterdam, The Netherlands, 2016. [Google Scholar]
  18. Sabetamal, H.; Nazem, M.; Sloan, S.W.; Carter, J.P. Frictionless contact formulation for dynamic analysis of nonlinear saturated porous media based on the mortar method. Int. J. Numer. Anal. Methods Geomech. 2016, 40, 25–61. [Google Scholar] [CrossRef]
  19. Ghorbani, J.; Nazem, M.; Kodikara, J.; Wriggers, P. Finite element solution for static and dynamic interactions of cylindrical rigid objects and unsaturated granular soils. Comput. Methods Appl. Mech. Eng. 2021, 384, 113974. [Google Scholar] [CrossRef]
  20. Polat, E. Finite Element Analysis of Integral Abutment Bridges. Master’s Thesis, University of Wisconsin-Madison, Madison, WI, USA, 2013. [Google Scholar]
  21. Fennema, J.L.; Laman, J.A.; Linzell, D.G. Predicted and measured response of an integral abutment bridge. J. Bridge Eng. 2005, 10, 666–677. [Google Scholar] [CrossRef]
  22. Kim, W.; Laman, J.A.; Jeong, Y.; Ou, Y.-C.; Roh, H. Comparative study of integral abutment bridge structural analysis methods. Can. J. Civ. Eng. 2016, 43, 378–389. [Google Scholar] [CrossRef]
  23. Polat, E.; Polat, E.G. Predicting and optimizing maximum flexural strength of planar composite plate shear walls—concrete filled with the application of LR and RSM. Structures 2024, 69, 107353. [Google Scholar] [CrossRef]
  24. Greimann, L.; Abendroth, R.; Johnson, D.; Ebner, P. Pile Design and Tests for Integral Abutment Bridges; Final Report; Iowa Department of Transportation: Ames, IA, USA, 1987. [Google Scholar]
  25. Alin, A. Minitab. Wiley Interdiscip. Rev. Comput. Stat. 2010, 2, 723–727. [Google Scholar] [CrossRef]
  26. Matlock, H. Correlation for Design of Laterally Loaded Piles in Soft Clay. In Proceedings of the Offshore Technology Conference, Houston, TX, USA, 21–23 April 1970; p. OTC–1204-MS. [Google Scholar]
  27. Hannigan, P.J.; Rausche, F.; Likins, G.; Robinson, B.; Becker, M.; Berg, R.R. Design and Construction of Driven Pile Foundations—Volume I; National Highway Institute: Vienna, VA, USA, 2016. [Google Scholar]
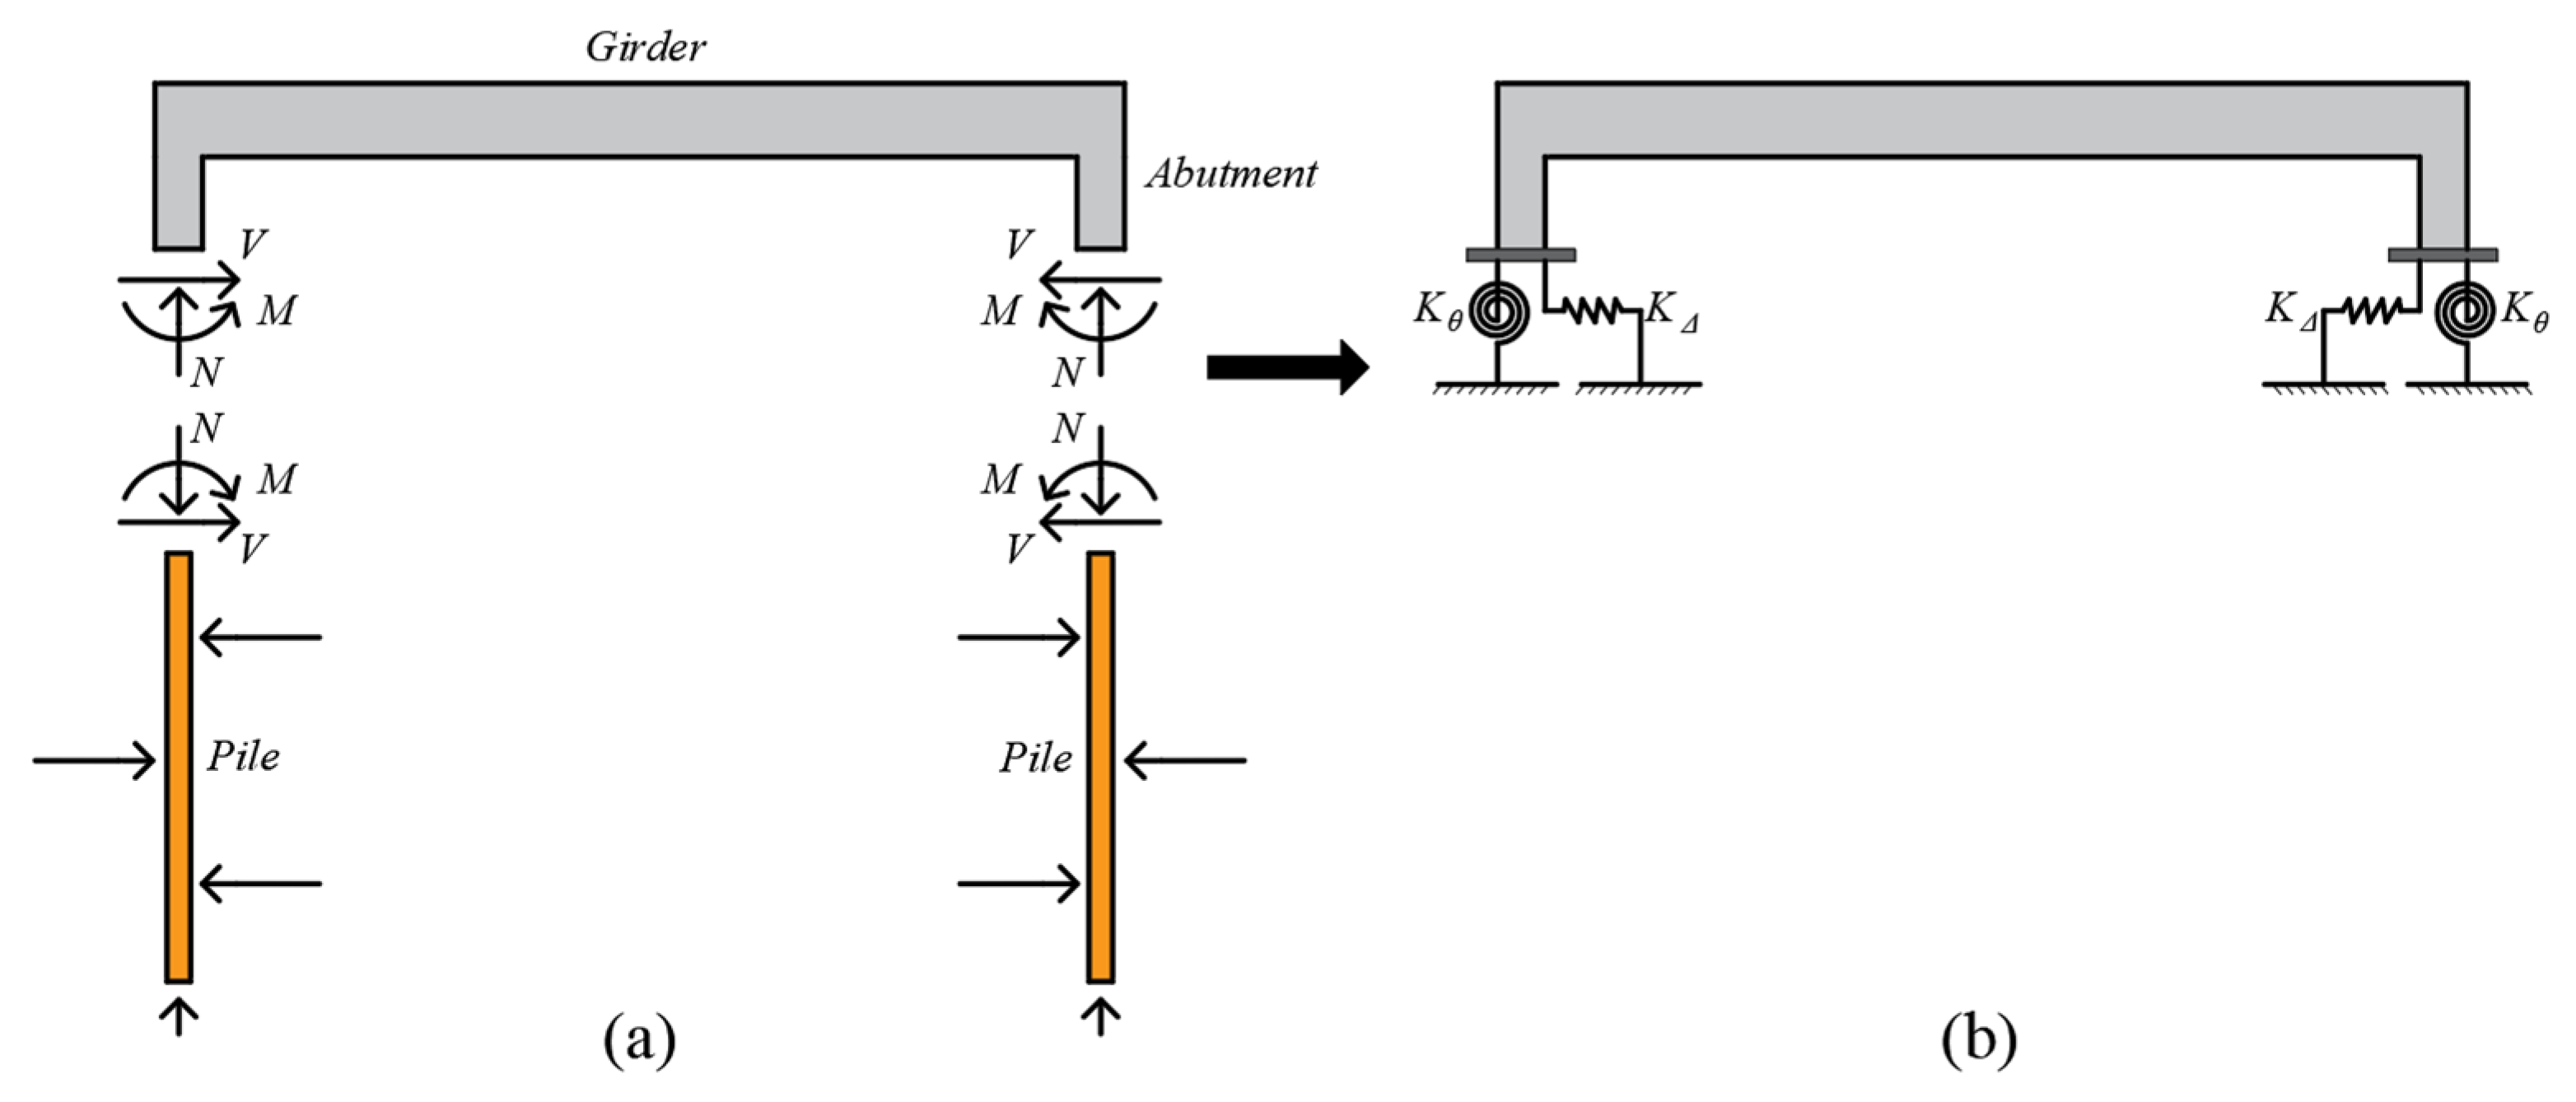
Figure 1. Schematic representation: (a) Free-body diagram of the pile-abutment joint, and (b) Spring model representation.
Buildings 15 03493 g001
Figure 2. Elevation and plan view of Bridge I with details of cross-section of superstructure and transformed section (1 ft = 0.3 m, 1 in = 25.4 mm).
Buildings 15 03493 g002
Figure 3. Elevation and plan view of Bridge II (1 ft = 0.3 m, 1 in = 25.4 mm).
Buildings 15 03493 g003
Figure 4. Typical p-y curve [24].
Buildings 15 03493 g004
Figure 5. FEM model of the bridge illustrating (a) influence lines and truck loading and (b) the deformed shape under AASHTO HL-93 vehicle load (shown values are in kips).
Buildings 15 03493 g005
Figure 6. Pile displacement response of Bridge I in medium sand: (a) deflection vs. depth, and (b) rotation vs. depth.
Buildings 15 03493 g006
Figure 7. Pile force response of Bridge I in medium sand: (a) shear vs. depth, and (b) moment vs. depth.
Buildings 15 03493 g007
Figure 8. Pile-abutment joint deformation with associated deflections and forces.
Buildings 15 03493 g008
Figure 9. Comparison of LR-predicted and FEM-obtained responses for sand soil: (a) rotation, (b) deflection, (c) moment, and (d) shear.
Buildings 15 03493 g009
Figure 10. Comparison of RSM-predicted and FEM-obtained responses for sand soil: (a) rotation, (b) deflection, (c) moment, and (d) shear.
Buildings 15 03493 g010
Figure 11. Comparison of LR-predicted and FEM-obtained responses for clay soil: (a) rotation, (b) deflection, (c) moment, and (d) shear.
Buildings 15 03493 g011
Figure 12. Comparison of RSM-predicted and FEM-obtained responses for clay soil: (a) rotation, (b) deflection, (c) moment, and (d) shear.
Buildings 15 03493 g012
Figure 13. Interaction plot of rotation at the pile-abutment joint.
Buildings 15 03493 g013
Figure 14. Interaction plot of deflection at the pile-abutment joint.
Buildings 15 03493 g014
Figure 15. Interaction plot of moment at the pile-abutment joint.
Buildings 15 03493 g015
Figure 16. Interaction plot of shear force at the pile-abutment joint.
Buildings 15 03493 g016
Figure 17. Comparison of FEM and RSM predictions for rotation, deflection, moment, and shear responses for sand type soils for Bridge I.
Buildings 15 03493 g017
Figure 18. Comparison of FEM and RSM predictions for rotation, deflection, moment, and shear responses for clay type soils for Bridge I.
Buildings 15 03493 g018
Figure 19. Flowchart for deriving and implementing spring stiffness constants in structural analysis software.
Buildings 15 03493 g019
Figure 20. Implementation of spring model for IAB in SAP2000: (a) spring model, and (b) deformed shape under vehicle load.
Buildings 15 03493 g020
Figure 21. Comparison of FEM vs. spring model predictions for rotation, deflection, moment, and shear for medium and stiff clay.
Buildings 15 03493 g021
Table 1. Structural Properties and Material Specifications for Bridges I and II.
PropertyBridge IBridge II
Span length45 ft (13.7 m)50 ft (15.2 m)
Bridge width32 ft (9.8 m)46 ft (14.0 m)
Girder typeChannelConcrete slab
Girder width4 ft (1.2 m)-
Girder height28 in (711 mm)-
Slab thickness8 in (203 mm)26.4 in (670 mm)
Abutment height5 ft (1.5 m)10 ft (3.0 m)
Abutment thickness3 ft (914 mm)2.5 ft (762 mm)
Number of piles8 HP steel10 HP steel
Pile length30 ft (9.1 m)30 ft (9.1 m)
Girder concrete strength (fc′)5000 psi (34.5 MPa)-
Girder modulus of elasticity (Ec)4286 ksi (29.6 GPa)-
Deck concrete strength (fc′)4000 psi (27.6 MPa)4000 psi (27.6 MPa)
Deck modulus of elasticity (Ec)3834 ksi (26.4 GPa)3834 ksi (26.4 GPa)
Substructure concrete strength (fc′)4000 psi (27.6 MPa)3500 psi (24.1 MPa)
Substructure modulus of elasticity (Ec)3834 ksi (26.4 GPa)3587 ksi (24.7 GPa)
Composite Section M.of.Inertia (Ig)86,988 in2 (561,000 cm2)-
Table 2. Input parameter levels in CCD for K s ,   E I p ,   E I g , H, and L.
Levels
NoVariablesUnits (US/SI)AxialFactorialAxial
(−2)Low (−1)Center (0)High (1)(+2)
1Soil stiffness (Sand), Kskip/in (kN/m)20 (3504)60 (10,512)100 (17,520)140 (24,528)180 (31,536)
2Pile flexural rigidity, EIp 106 k-in2
(109 N-m2)
50 (5.65)100 (11.3)150 (16.95)200 (22.6)250 (28.25)
3Girder flexural rigidity, EIg106 k-in2
(109 N-m2)
1000 (113)2000 (226)3000 (339)4000 (452)5000 (565)
4Abutment height, Hin. (mm)36 (914.4)48 (1219.2)60 (1524)72 (1828.8)84 (2133.6)
5Bridge span, Lin. (mm)500 (12,700)550 (13,970)600 (15,240)650 (16510)700 (17,780)
Table 3. List of numerical analyses model parameters obtained from central composite design (1 in = 25.4 mm, 1 kip = 4.448 kN, 1 kip-in = 0.113 N·m).
2-D IAB Model PropertiesAnalyses Results (Sand)Analyses Results (Clay)
Case
No
K s E I p E I g H L θ Δ M V θ Δ M V
(Sand)× 106× 106 × 10−6× 10−6 × 10−2× 10−6× 10−6 × 10⁻²
kip/inkip-in2kip-in2in.in.radin.kip-inkipsradin.kip-inkips
1100150100060600853−27,4104772−7411740−30,5004565−8322
260100200048550774−28,3103053−4734743−26,8303030−5291
3140100200048550681−23,4403196−5946608.1−19,5303166−7201
460200200048550638−21,3403935−5124620.8−20,6203875−5552
5140200200048550561−17,3504015−6234509.7−14,7103924−7274
6140100200048650966−31,2004436−8184860.6−25,5504359−9798
7601002000486501100−38,3404287−66041060−36,1904240−7344
860200200048650900−27,9005445−7027875−26,9705353−7589
9140200200048650788−22,3005506−8451716.8−18,6405357−9774
10140200200072550437−21,0003621−5968383.6−17,1503431−6824
1160200200072550517−26,9003660−5041494.5−25,4403555−5440
1260100200072550634−35,6002923−4790595.4−32,8602851−5306
13140100200072550534−28,1002955−5823456.4−22,3302820−6850
14140100200072650750−37,1004038−7888641.4−29,0003826−9179
1560200200072650724−35,1005000−6823692−33,1604848−7337
1660100200072650894−47,7004040−6576838.6−43,8603926−7246
17140200200072650611−27,0004906−7990537.9−21,7704632−9063
18100150300036600696−16,7003604−5408659.9−15,1103641−6375
19100150300060500379−17,7002399−3912348.7−15,6102378−4603
2020150300060600715−34,0003139−3577708−33,7903087−3798
21100250300060600493−19,8804133−5843458.2−17,6104037−6642
2210050300060600739−36,4702321−4942665.7−31,3702365−6170
23180150300060600515−21,0003531−6457455−16,9203427−7697
24100150300060600566−24,4703484−5624519.3−21,3803429−6552
25100150300060700775−31,3004661−7456710.2−27,1004563−8615
26100150300084600460−28,3903264−5529410.1−23,9903132−6326
27140100400048550456−16,6402185−4096420.3−14,3802239−5142
2860200400048550436−15,6802741−3600426.9−15,2202719−3935
29140200400048550395−13,3102903−4556367.5−11,5702905−5457
3060100400048550499−19,1802000−3120485.3−18,4002012−3538
31140200400048650569−17,7004085−6348528−15,2004062−7525
32140100400048650664−22,9003116−5799608.8−19,4403163−7189
3360100400048650731−26,8002887−4478709.2−25,6402893−5052
3460200400048650630−21,3003898−5083617.1−20,6403859−5535
35140200400072550323−17,1202781−4645289.7−14,3702703−5470
3660100400072550432−25,6702042−3370412.6−24,1402027−3806
37140100400072550379−21,4202167−4310334.8−17,7502148−5283
3860200400072550370−20,8802701−3760357.5−19,9202649−4105
39140100400072650545−29,2003039−6001479.2−23,7902981−7257
4060200400072650530−28,3003786−5232511.2−26,8803705−5688
4160100400072650625−35,6002902−4764595.2−33,3102867−5347
42140200400072650461−22,8003855−6378412.7−18,8503723−7431
43100150500060600432−20,0002728−4445432−20,0002728−4445
Table 4. Soil parameters used in the analysis.
Soil TypeUnit Weight (ɣ)Cohesion (c)Angle of Internal Friction (Ø)Strain at 50% Strength (ε50)
(pcf)/(N/m3)(Psi)/(MPa)(Deg)
Soft Clay120/18,8522.6/0.018-0.02
Medium Clay120/18,8525.2/0.036-0.01
Stiff Clay120/18,85210.4/0.072-0.007
Very Stiff Clay120/18,85220.8/0.143-0.005
Loose Sand120/18,852-30-
Medium Sand120/18,852-35-
Dense Sand120/18,852-40-
Table 5. LR equations for θ, Δ, M, and V based on IAB properties (Ks, EIp, EIg, H, and L) for sand and clay soils. All coefficients are in consistent units: θ (rad × 10−6), Δ (in × 10−6), M (kip-in), V (kip × 10−2). For SI units: 1 in = 25.4 mm, 1 kip-in = 0.113 N·m, 1 kip = 4.448 kN.
Sand SoilClay Soil
VariableΘ
(rad × 10−6)
Δ
(in × 10−6)
M
(kip-in)
V
(kip × 10−2)
Θ
(rad × 10−6)
Δ
(in × 10−6)
M
(kip-in)
V
(kip × 10−2)
R2 (%)98.8492.7397.2197.1394.9991.9096.8797.08
Constants256.35748−26574705293.2−1020−23235187
Linear Terms
K s (kip/in)−1.07170.011.430−15.157−1.4999.871.069−22.75
E I p (kip-in2)−1.13372.208.598−3.789−0.96259.718.048−2.057
E I g (kip-in2)−0.107653.225−0.55040.8399−0.092352.903−0.50530.9265
H (in)−5.196−248.3−8.23−0.45−5.467−193.4−11.423.46
L (in)2.107−73.2511.436−17.7991.95−63.3211.055−19.952
Table 6. RSM regression equations for θ, Δ, M, and V based on IAB properties (Ks, EIp, EIg, H, and L) for sand and clay soils. All coefficients are in consistent units: θ (rad × 10−6), Δ (in × 10−6), M (kip-in), V (kip × 10−2). For SI units: 1 in = 25.4 mm, 1 kip-in = 0.113 N·m, 1 kip = 4.448 kN.
Sand SoilClay Soil
VariableΘ
(rad × 10−6)
Δ
(in × 10−6)
M
(kip-in)
V
(kip × 10−2)
Θ
(rad × 10−6)
Δ
(in × 10−6)
M
(kip-in)
V
(kip × 10−2)
R2 (%)99.8198.8299.5899.7899.6199.5599.7999.79
Constants−60912,769276−2372−26868,654−342−3510
Linear Terms
K s (kip/in)−104228.46.44−14.74−1.667−16.19.77−22.15
E I p (kip-in2)−141266.45.38−4.95−1.60831.95.13−1.51
E I g (kip-in2)−0.20143.30−0.5670.842−0.19928.96−0.5830.458
H (in)0.75−38411.3−9.9−1.37−68615.4−12.4
L (in)4.80−71−0.467.23.98−247.41.2912.7
Quadratic Terms
K s 2 0.00659−0.529−0.010330.06690.00967−0.4537−0.015240.0871
E I p 2 0.00432−0.406−0.017410.00530.00423−0.2039−0.01536−0.0101
E I g 2 0.0000170.0001030.000087−0.0001211.70 × 10−5−0.00070.000073−0.000020
H 2 0.00902.730.0571−0.0410.02675.040.0554−0.079
L 2 0.00042−0.0380.01289−0.02390.000980.10960.01159−0.0304
Interaction Terms
K s · E I p 0.001781−0.1309−0.007690.01140.00282−0.2011−0.010660.02081
K s · E I g 0.000306−0.016700.0006590.0008120.000415−0.022230.0010590.000867
K s · H −0.003781.172−0.05780.0779−0.002851.502−0.08840.159
K s · L −0.0038440.2447−0.00050−0.0377−0.005420.3558−0.00322−0.05547
E I p · E I g 0.000338−0.01911−0.000467−0.0009690.000274−0.01468−0.000476−0.001184
E I p · H 0.006980.592−0.06060.05970.008280.37−0.060.0522
E I p · L −0.0043750.27080.02375−0.00374−0.003710.21810.02270.00137
E I g · H 0.0015420.00220.005698−0.007250.001521−0.005180.006161−0.00935
E I g · L −0.0003070.00619−0.0014070.002036−0.0002770.00479−0.0012740.002065
H · L −0.02052−0.673−0.04770.0322−0.02136−0.503−0.05690.0496
Disclaimer/Publisher’s Note: The statements, opinions and data contained in all publications are solely those of the individual author(s) and contributor(s) and not of MDPI and/or the editor(s). MDPI and/or the editor(s) disclaim responsibility for any injury to people or property resulting from any ideas, methods, instructions or products referred to in the content.