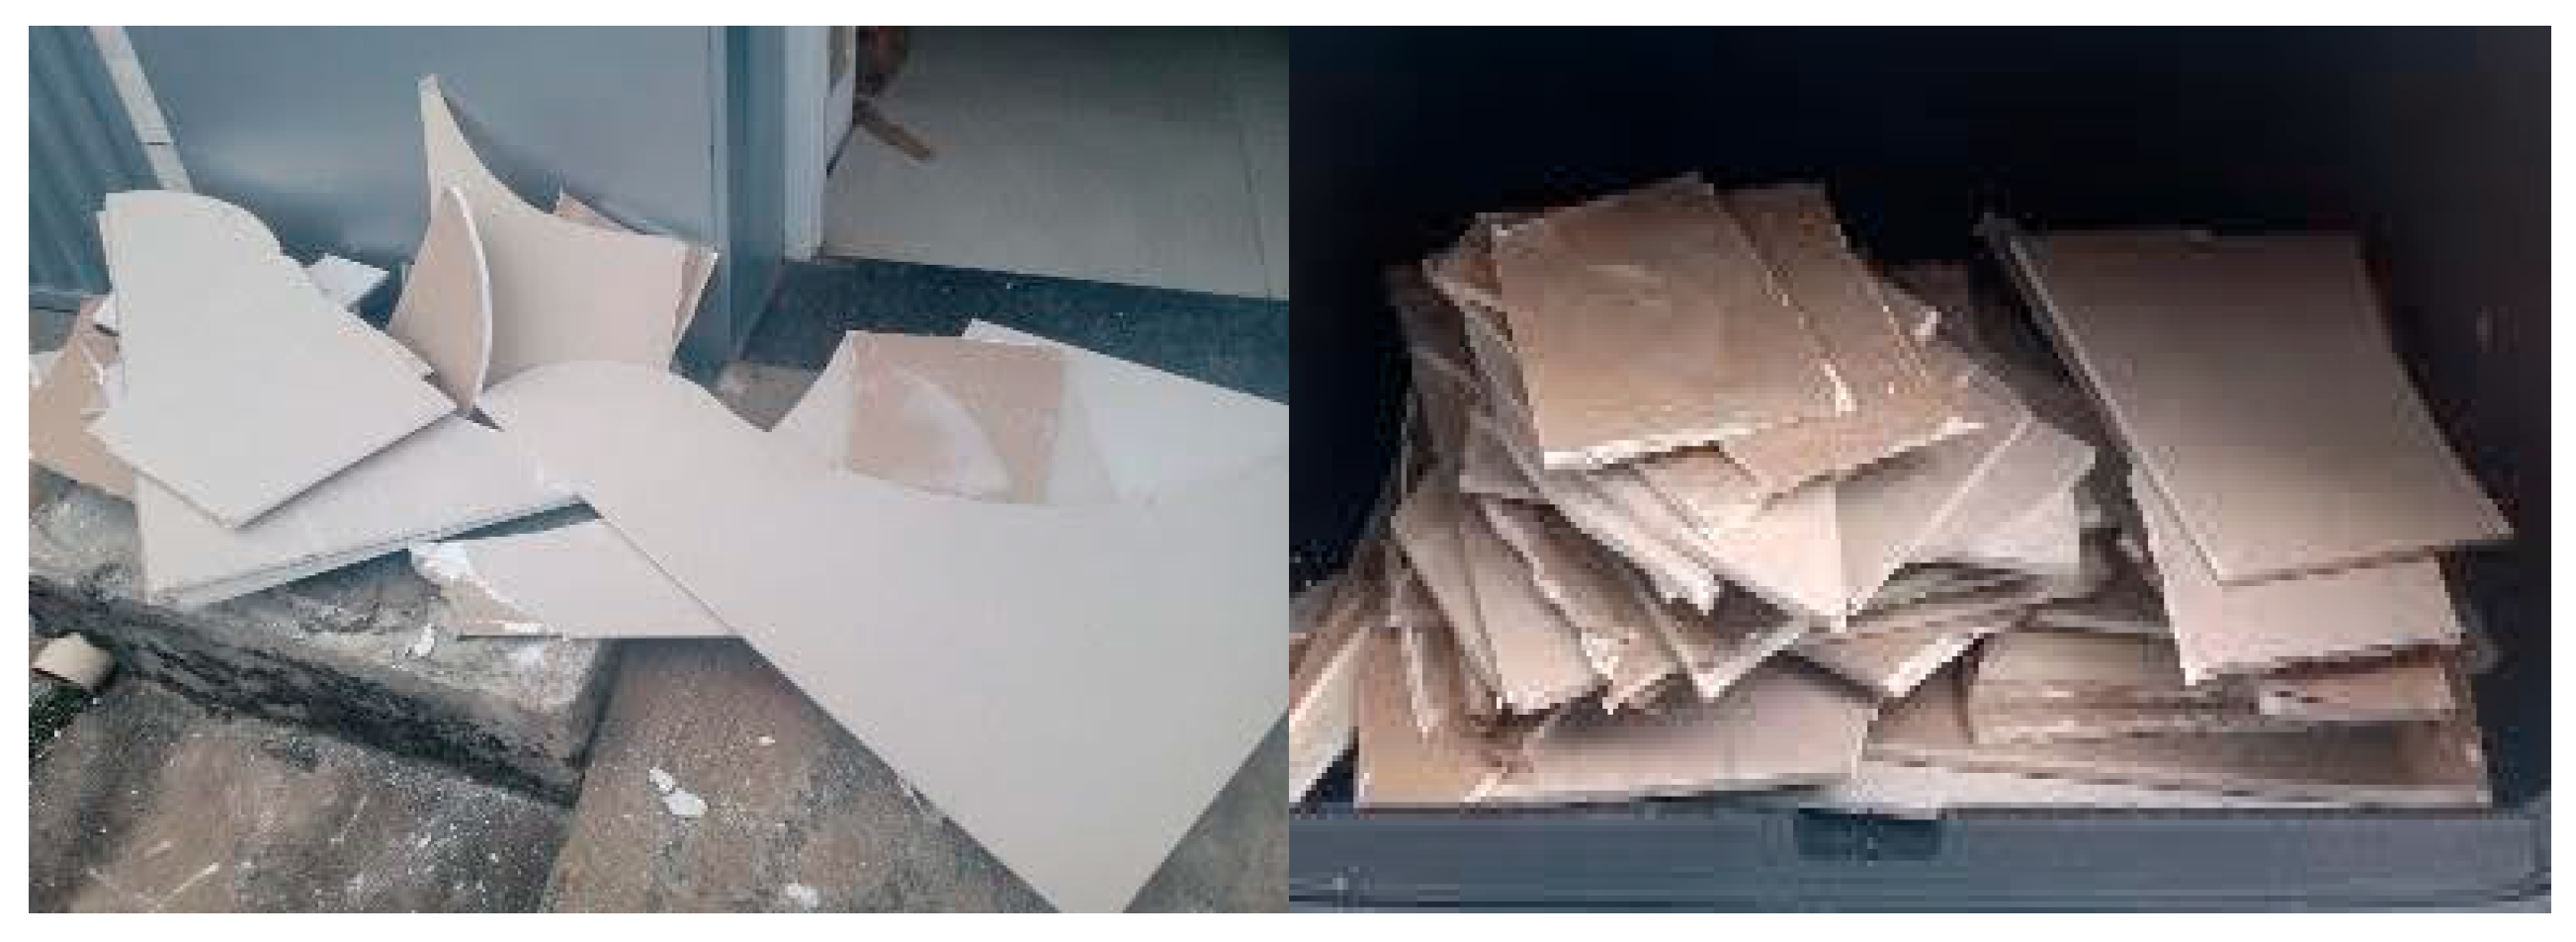
Figure 1.
Photographs of collected drywall panels.
Figure 1.
Photographs of collected drywall panels.
Figure 2.
Stages of recycled gypsum production: (a) waste gypsum drywall panels; (b) manual striking; (c) removal of adhered cardboard; (d) gypsum waste; (e) manual crushing; (f) electromechanical crushing; (g) ball mill grinding; (h) sieving; (i) calcination; (j) bagged recycled gypsum.
Figure 2.
Stages of recycled gypsum production: (a) waste gypsum drywall panels; (b) manual striking; (c) removal of adhered cardboard; (d) gypsum waste; (e) manual crushing; (f) electromechanical crushing; (g) ball mill grinding; (h) sieving; (i) calcination; (j) bagged recycled gypsum.
Figure 3.
Alkaline pretreatment of green coconut fibers: (a) soaking in an alkaline solution; (b) pH testing after washing; (c) fibers after drying.
Figure 3.
Alkaline pretreatment of green coconut fibers: (a) soaking in an alkaline solution; (b) pH testing after washing; (c) fibers after drying.
Figure 4.
Characterization of gypsum paste in its fresh state: (a) normal consistency; (b) initial and final setting times.
Figure 4.
Characterization of gypsum paste in its fresh state: (a) normal consistency; (b) initial and final setting times.
Figure 5.
Consistency of gypsum pastes: (a) commercial; (b) recycled; (c) recycled with fibers.
Figure 5.
Consistency of gypsum pastes: (a) commercial; (b) recycled; (c) recycled with fibers.
Figure 6.
Production of test specimens: (a) mixing of polyvinyl acetate (PVA) emulsion with water; (b) dry mixing of coconut fibers with gypsum; (c) homogenization of the mixture; (d) molds for the test specimens; (e) test specimens cured for 28 days.
Figure 6.
Production of test specimens: (a) mixing of polyvinyl acetate (PVA) emulsion with water; (b) dry mixing of coconut fibers with gypsum; (c) homogenization of the mixture; (d) molds for the test specimens; (e) test specimens cured for 28 days.
Figure 7.
Water absorption by capillarity test: (a) sealing of lateral faces; (b) test procedure.
Figure 7.
Water absorption by capillarity test: (a) sealing of lateral faces; (b) test procedure.
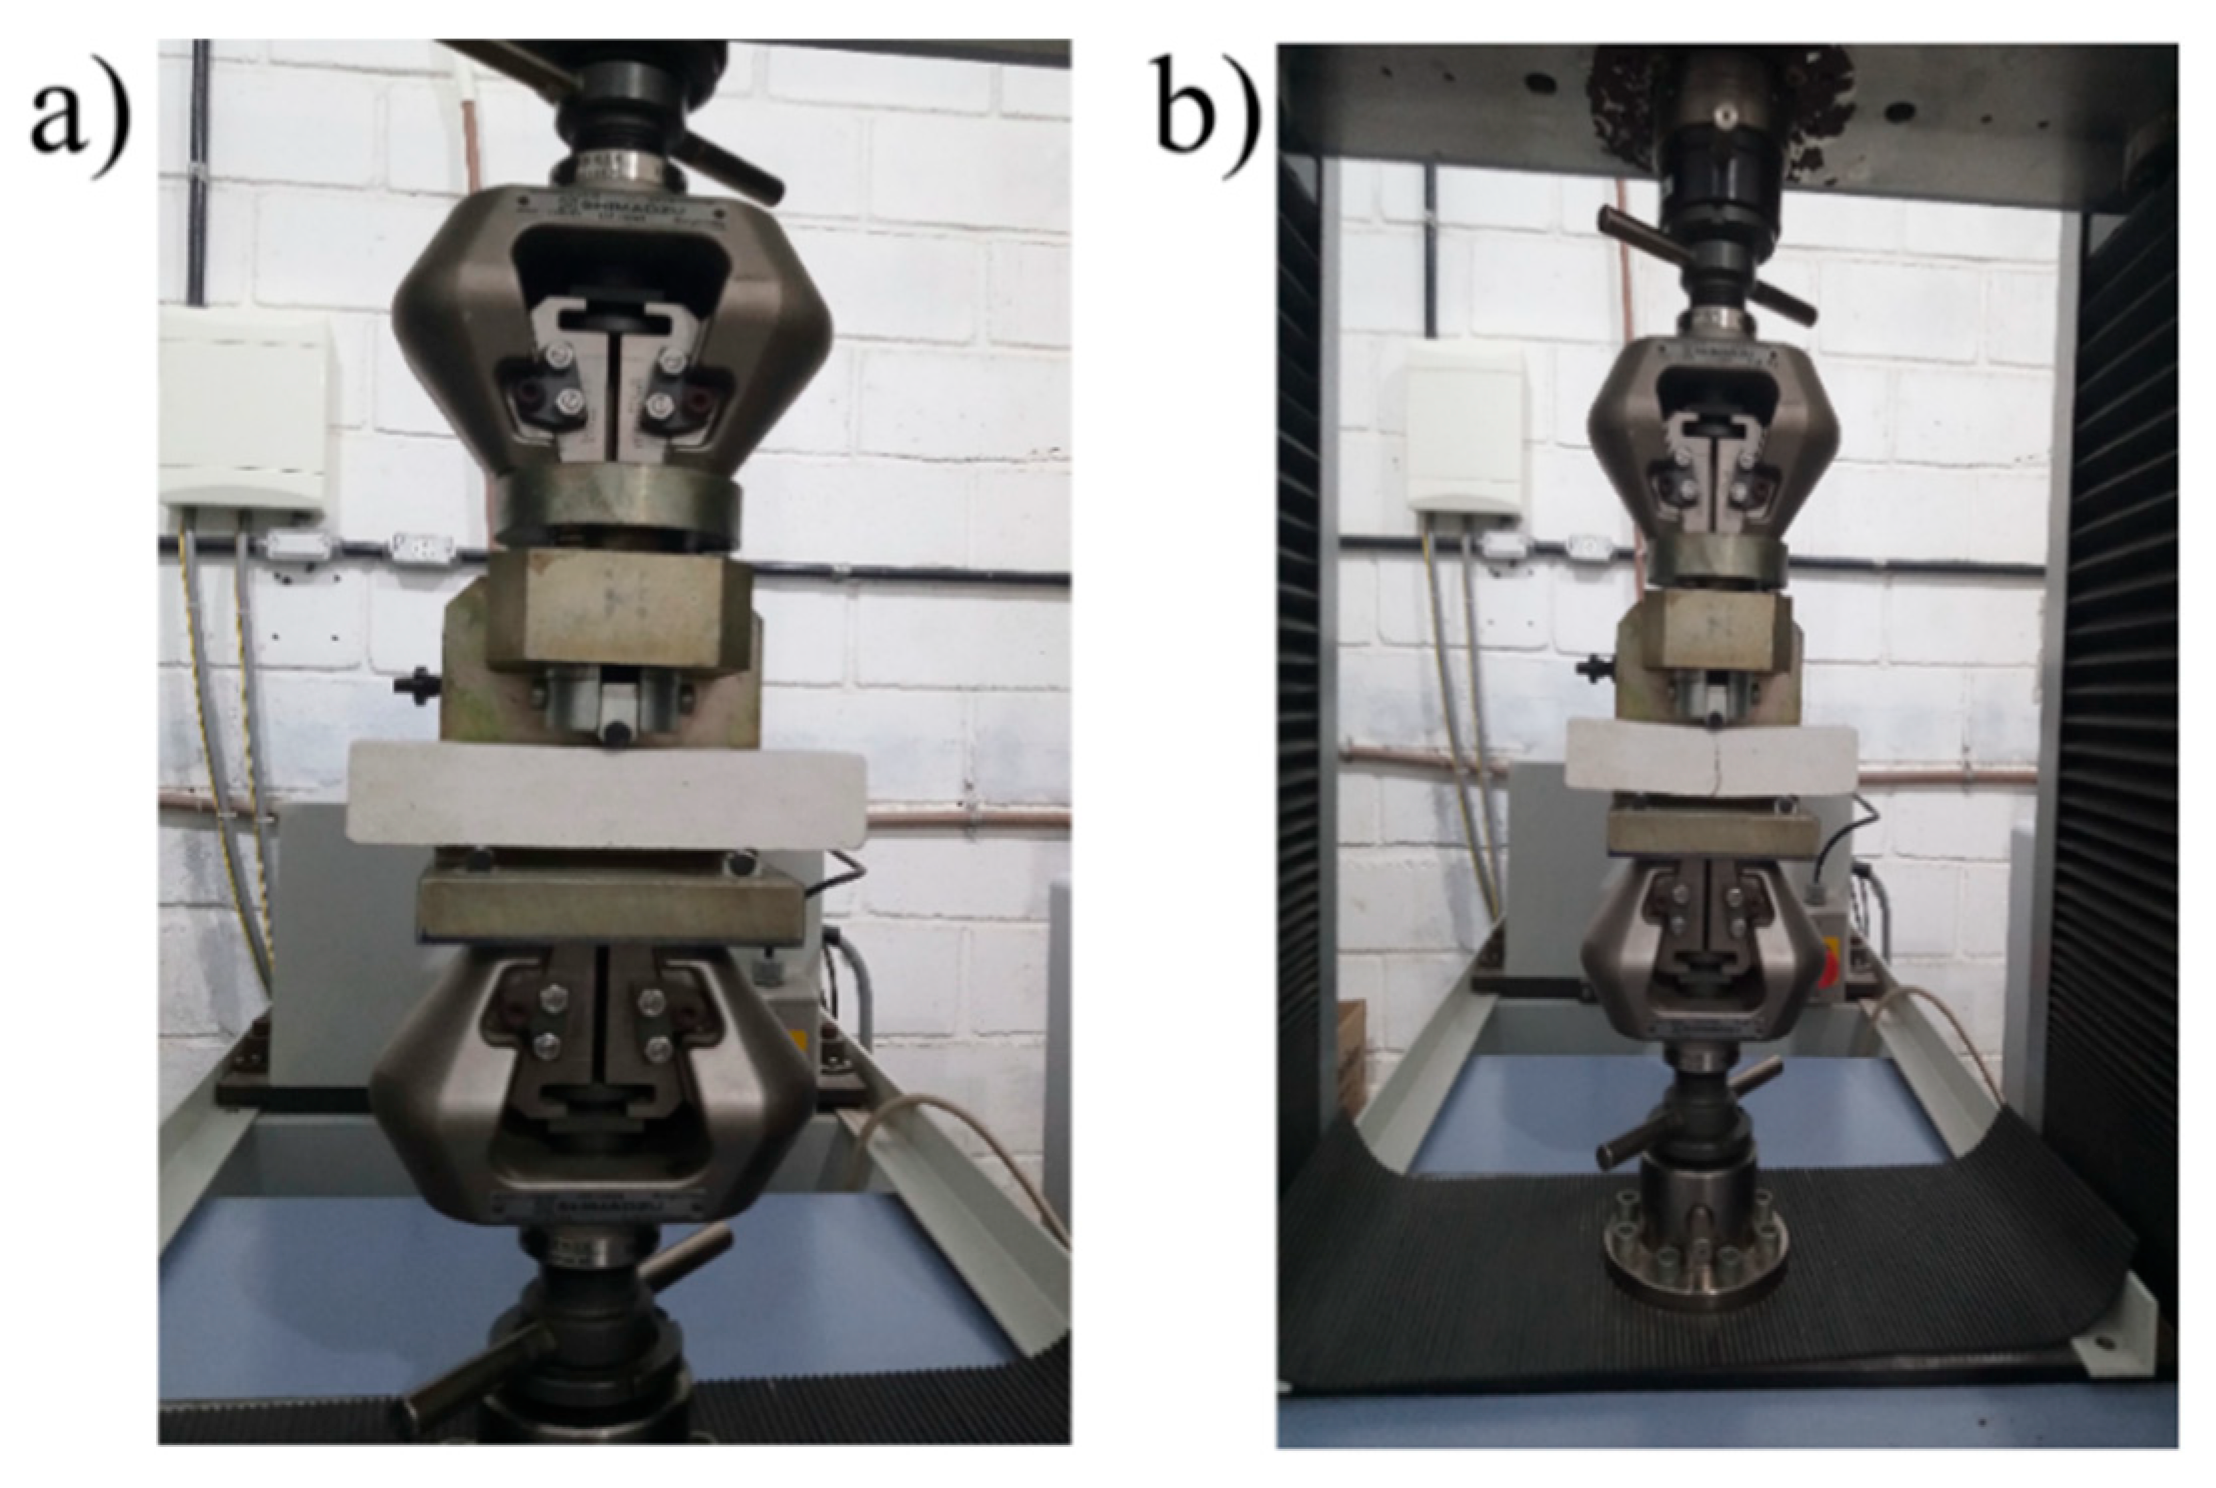
Figure 8.
Three-point flexural tensile strength test: (a) positioning of the specimen; (b) completion of the test after fracture.
Figure 8.
Three-point flexural tensile strength test: (a) positioning of the specimen; (b) completion of the test after fracture.
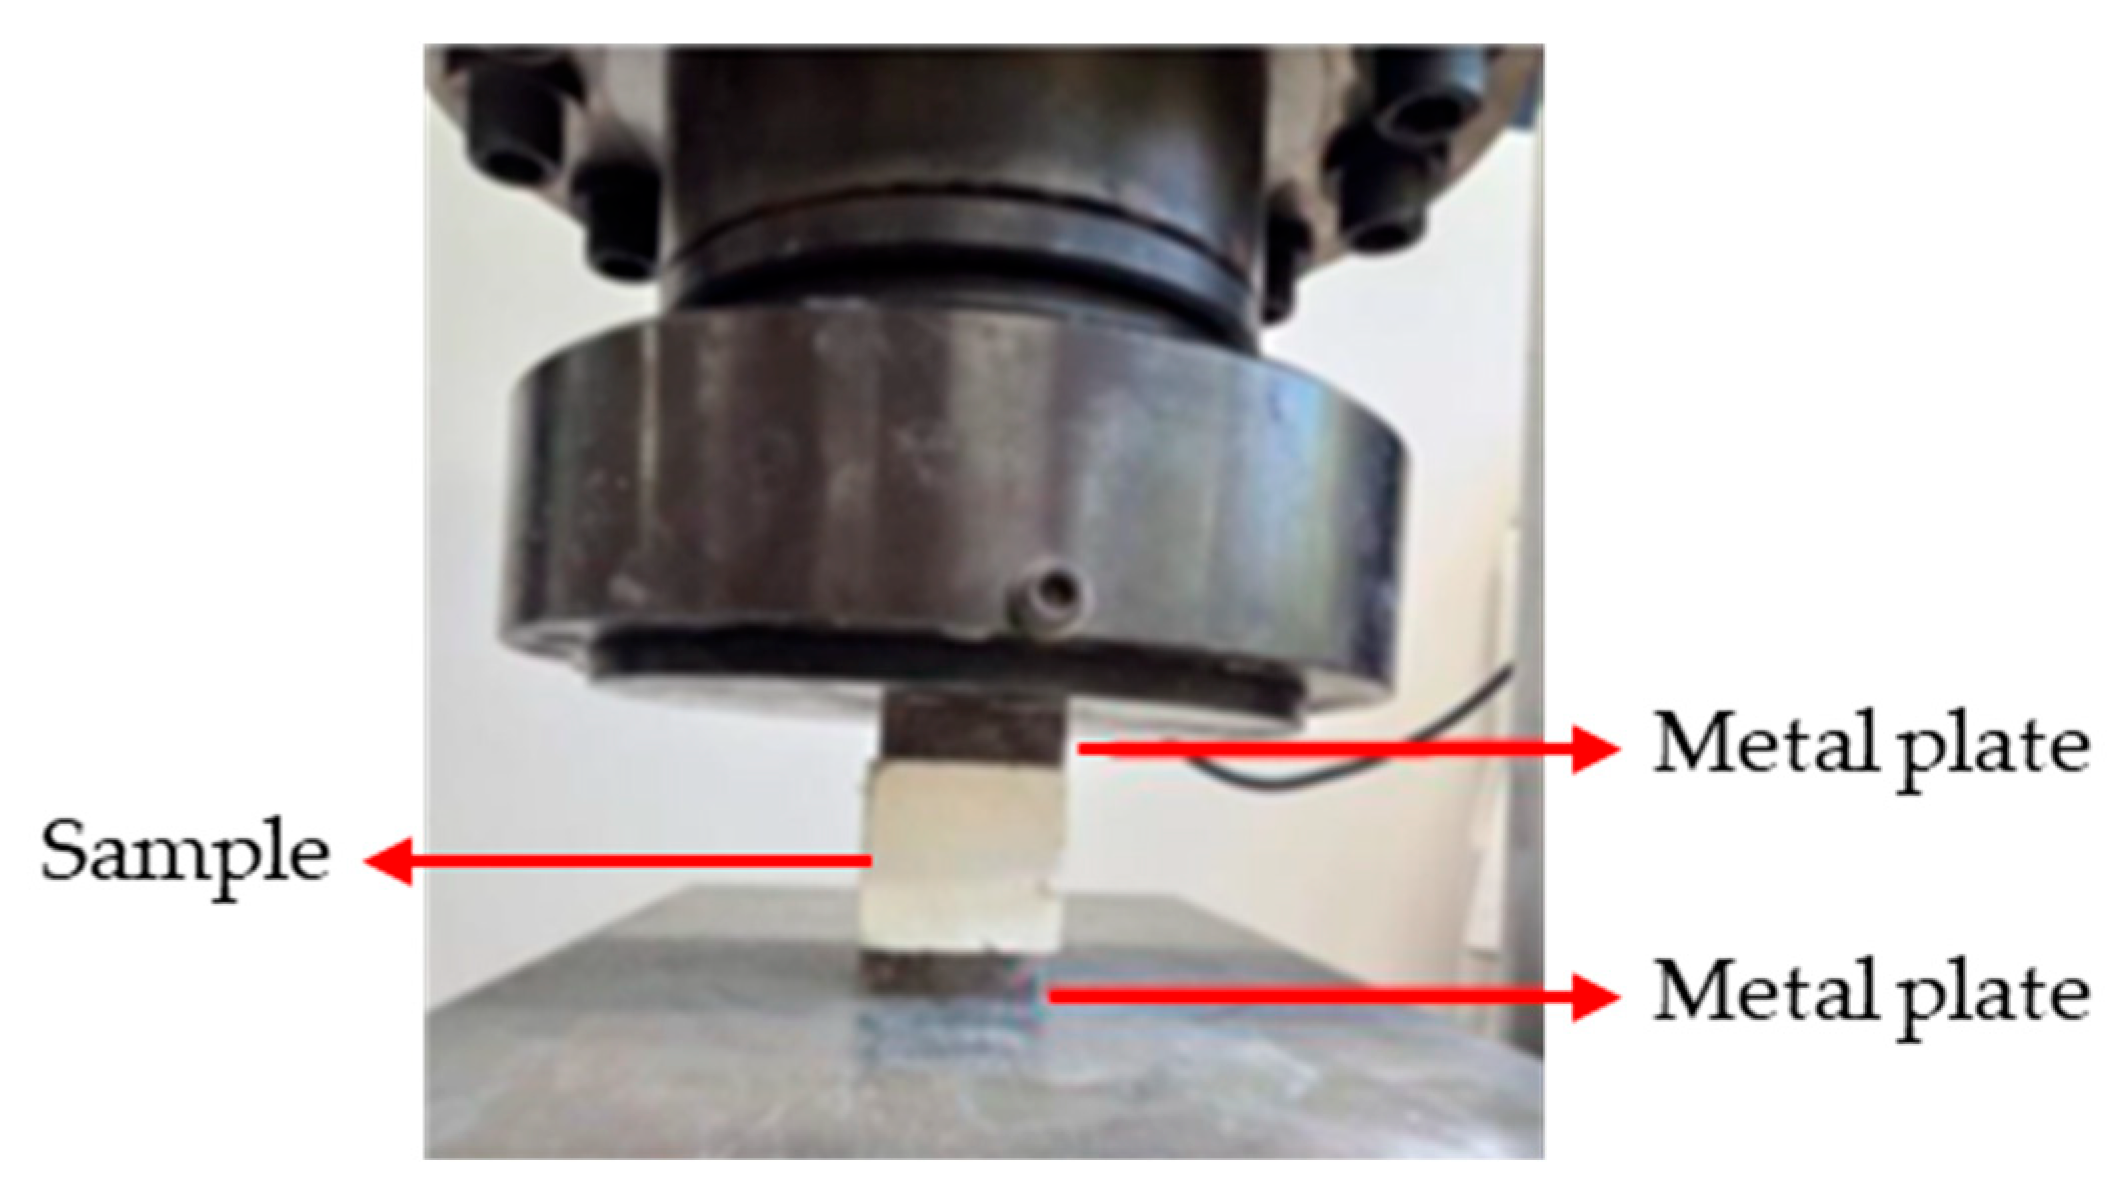
Figure 9.
Axial compression strength test setup.
Figure 9.
Axial compression strength test setup.
Figure 10.
Surface hardness test: (a) calibration base; (b) calibration of the applied force; (c) test execution.
Figure 10.
Surface hardness test: (a) calibration base; (b) calibration of the applied force; (c) test execution.
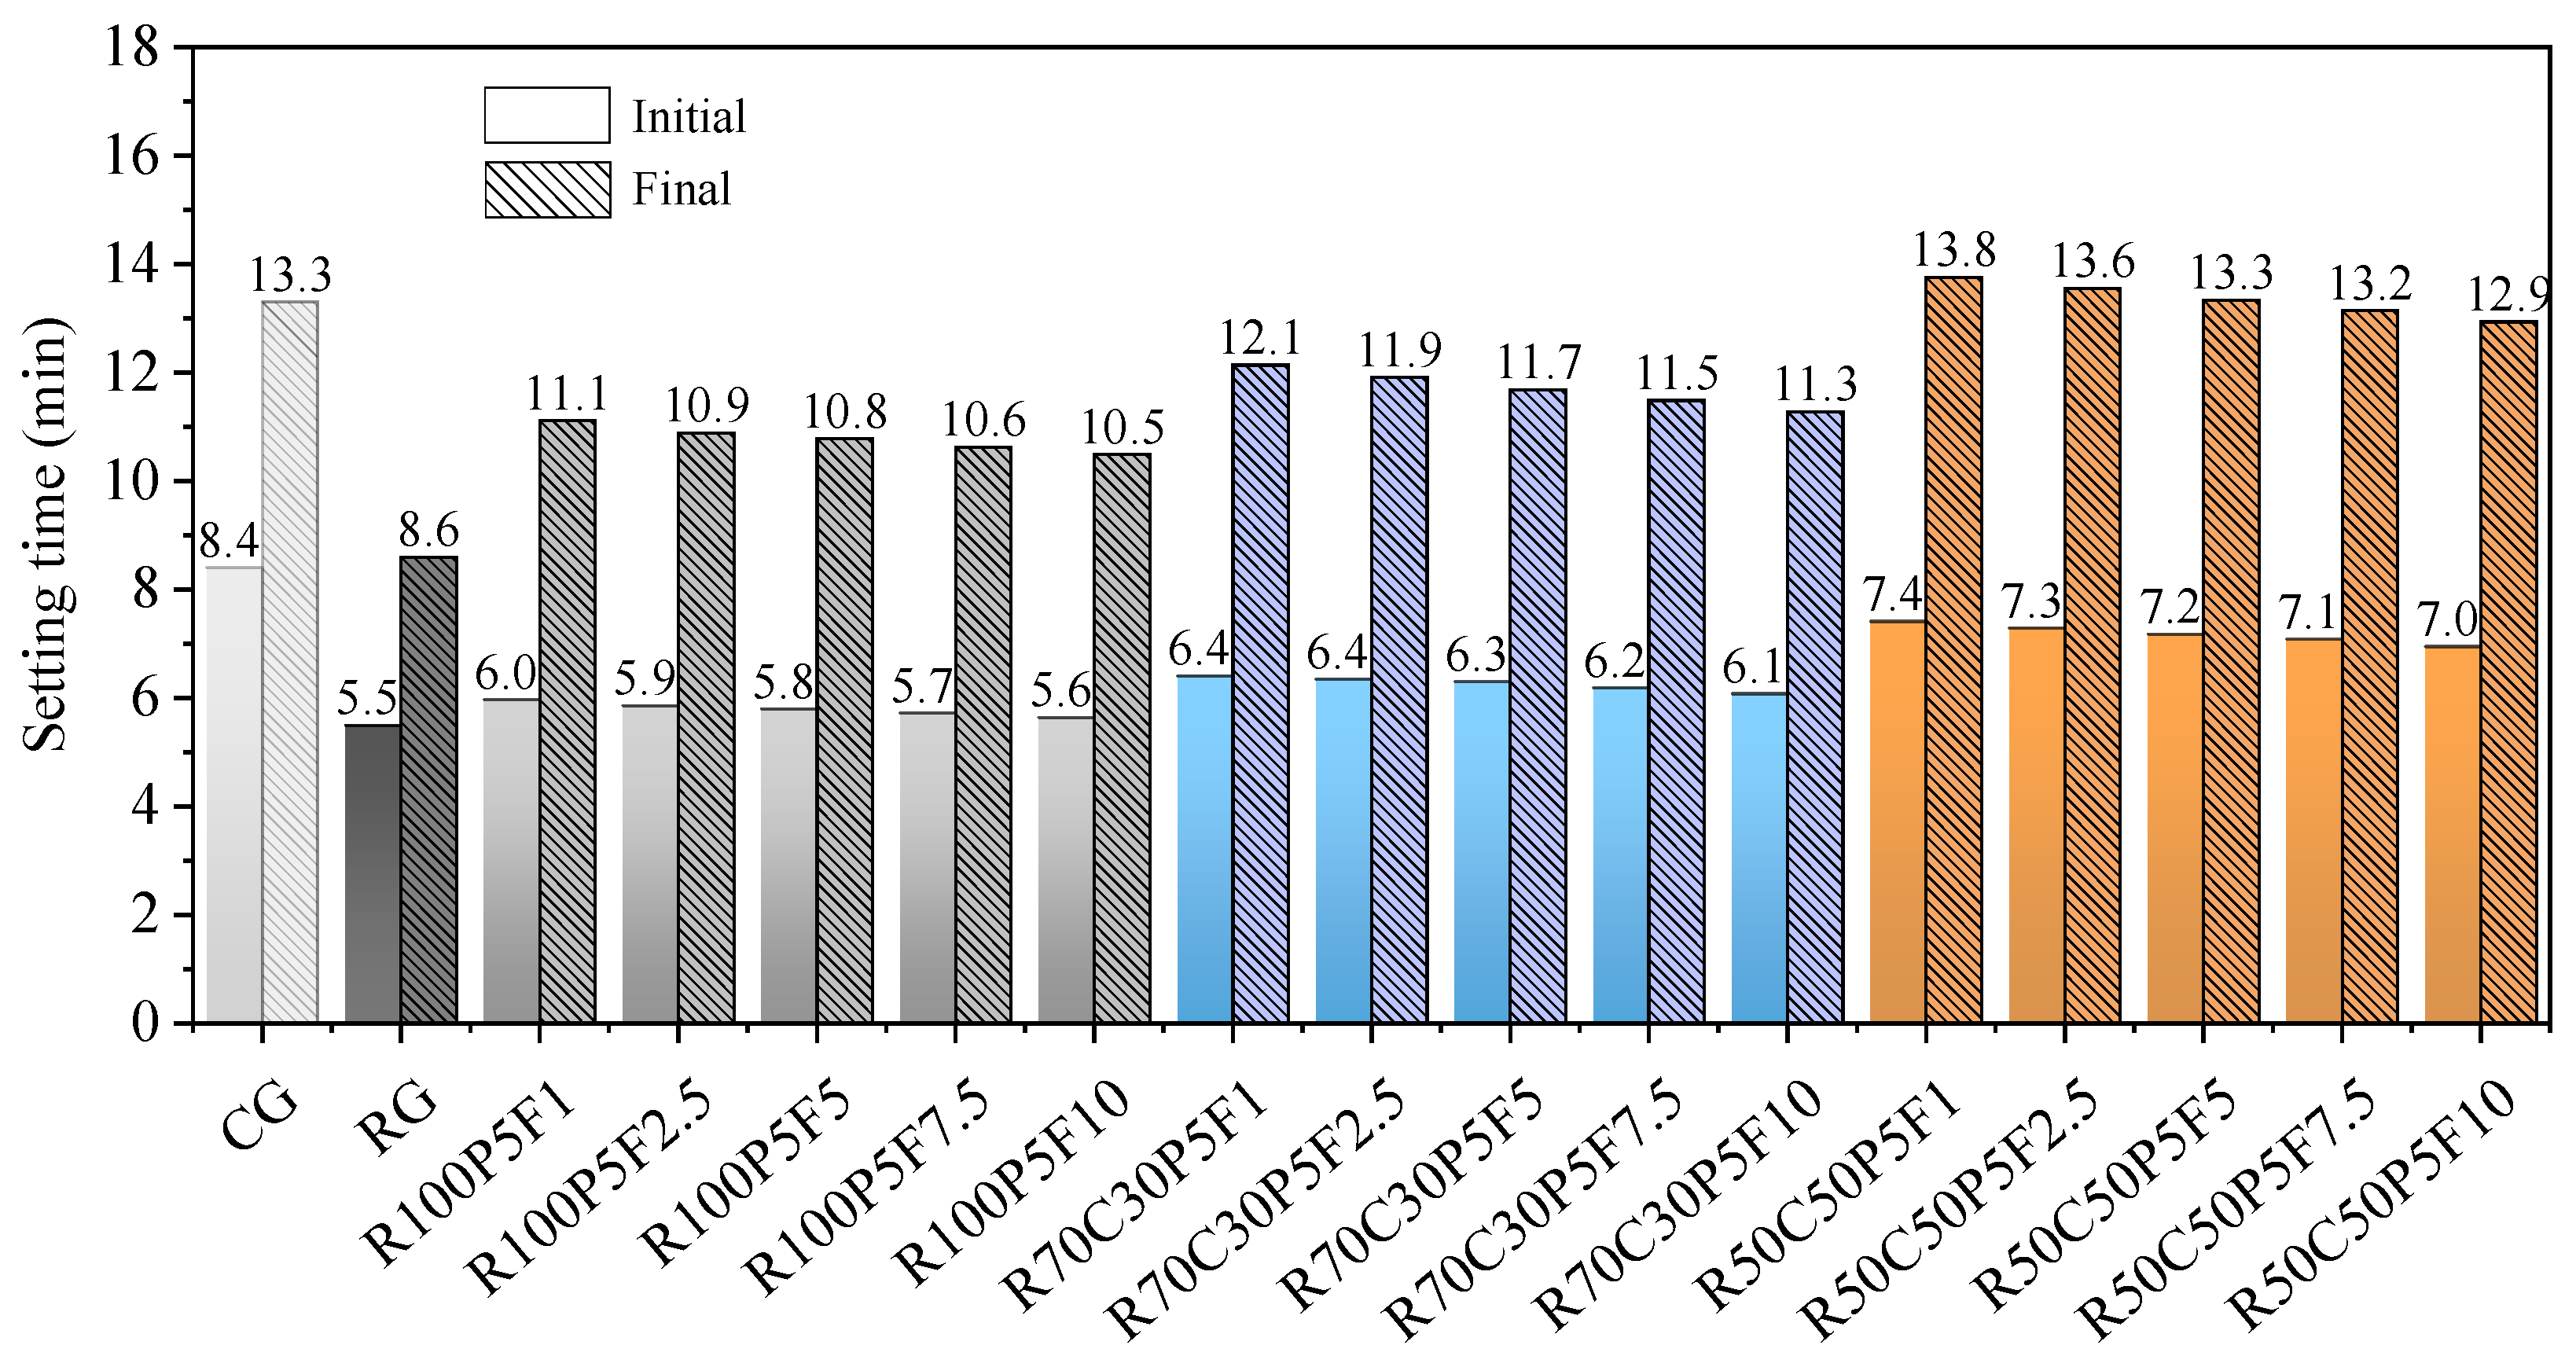
Figure 11.
Initial and final setting times of commercial gypsum, recycled gypsum, and composite pastes.
Figure 11.
Initial and final setting times of commercial gypsum, recycled gypsum, and composite pastes.
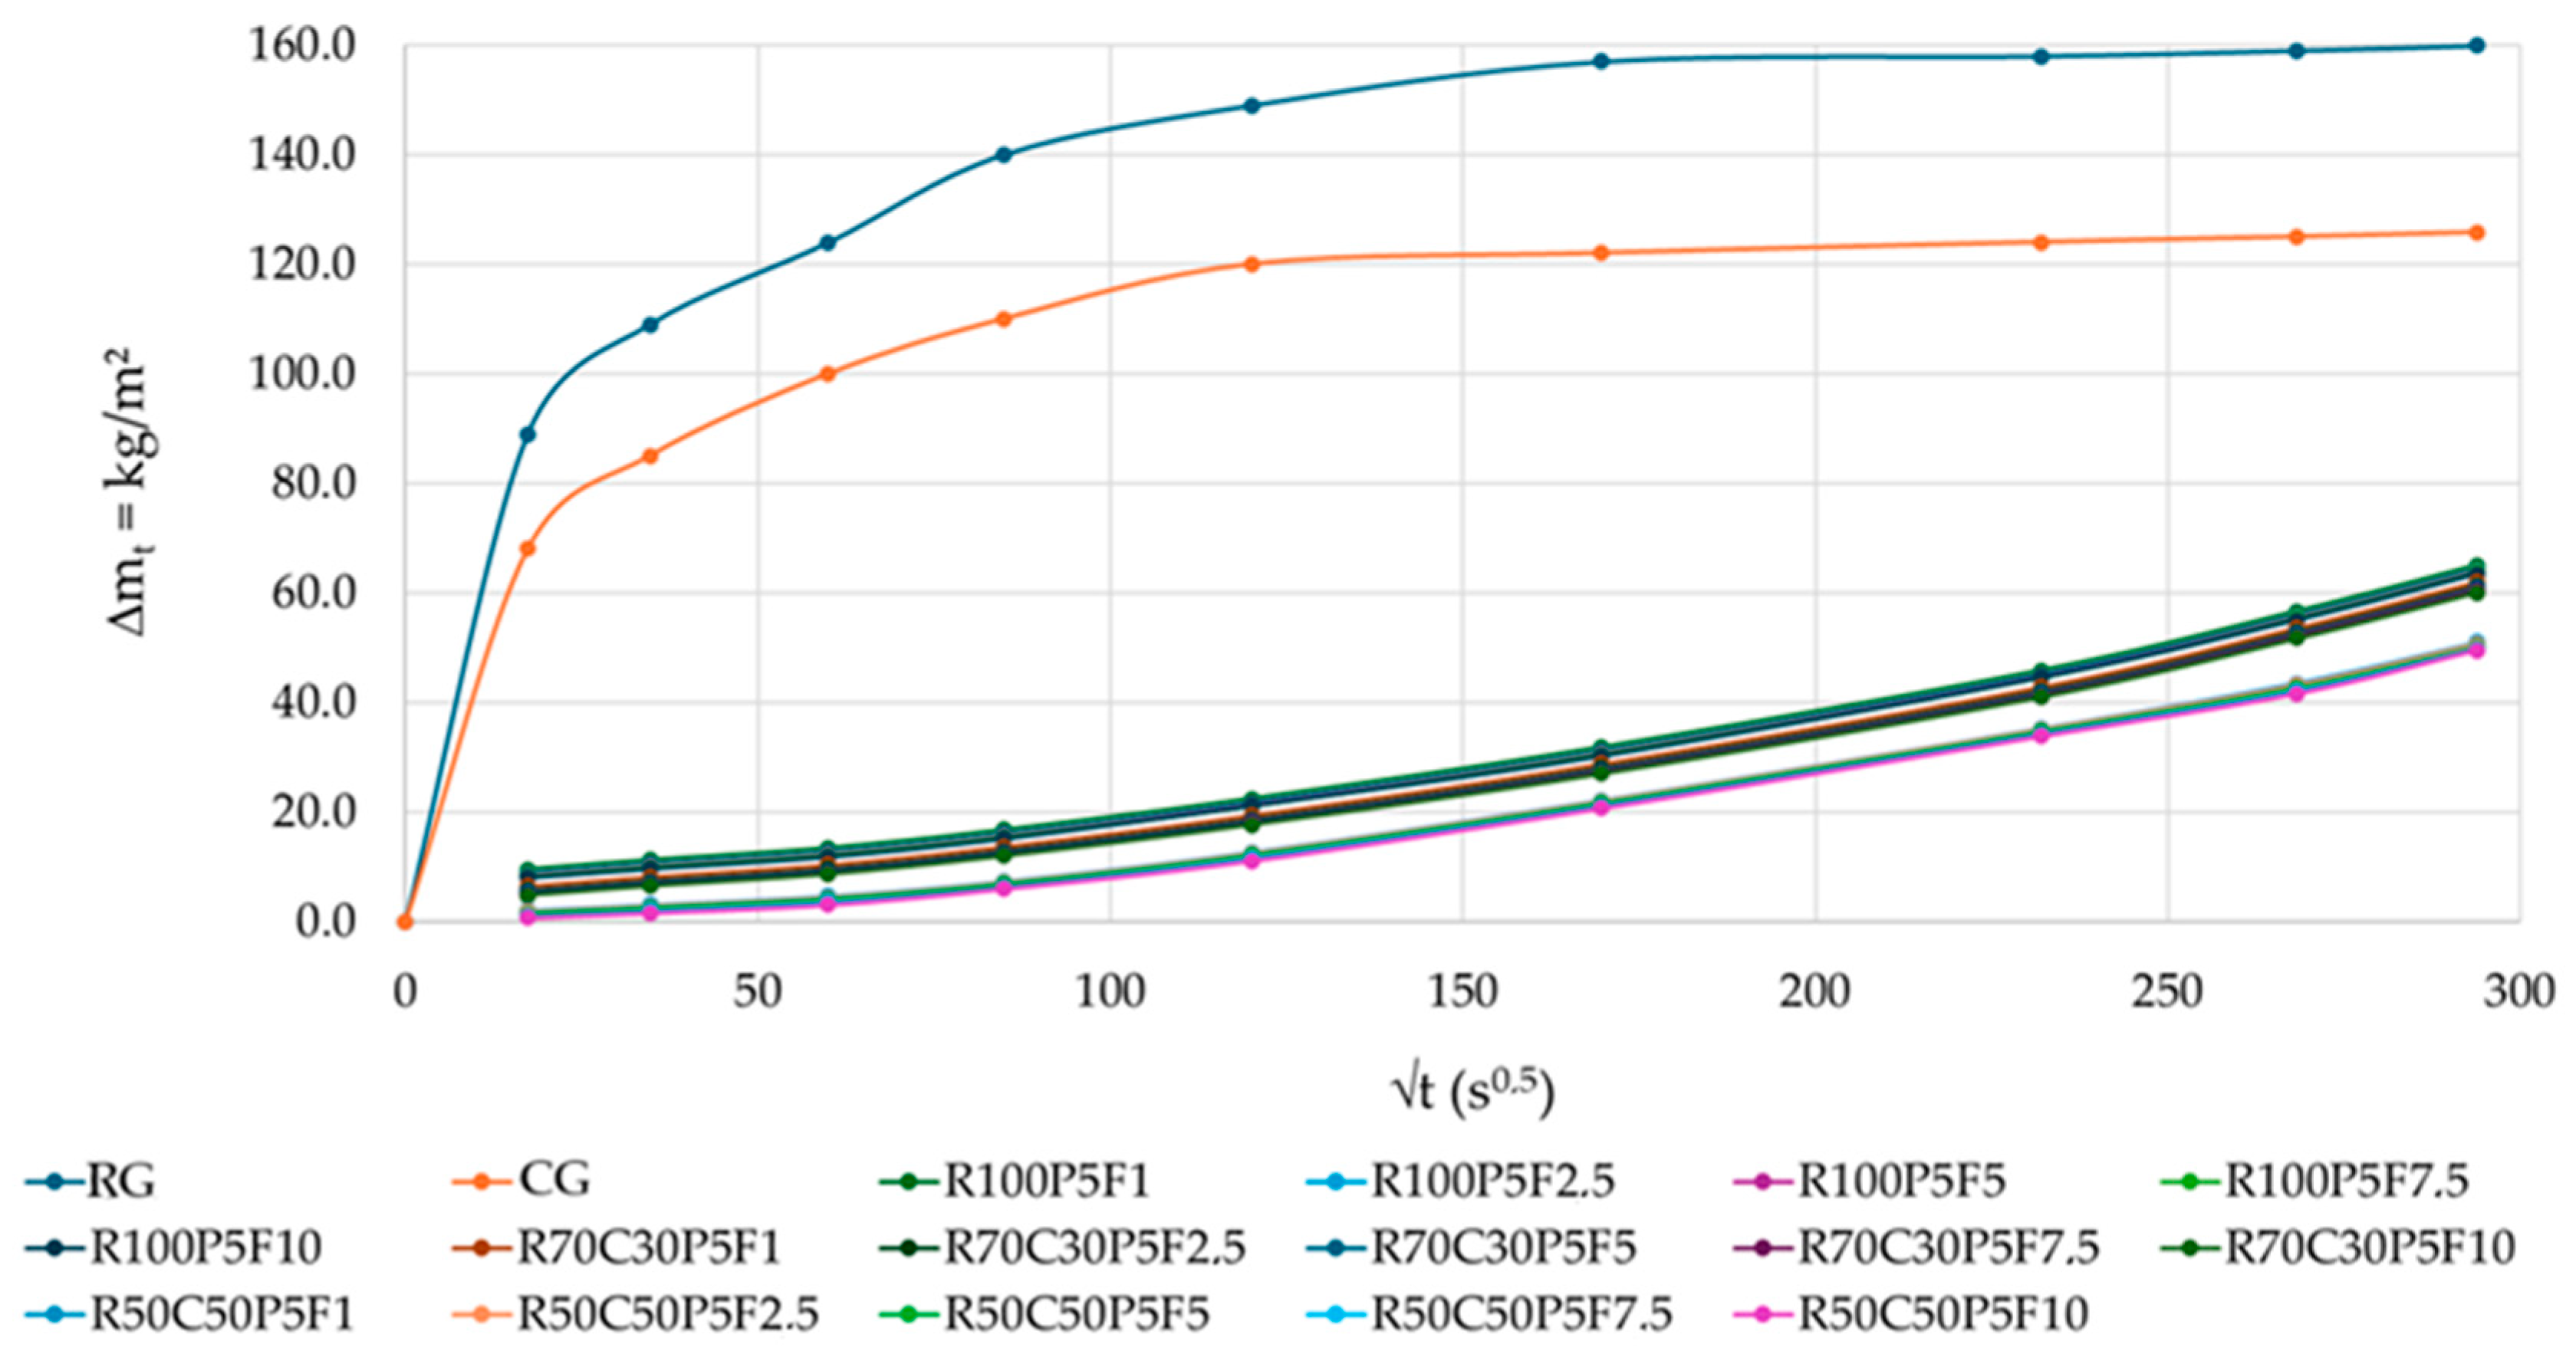
Figure 12.
Water capillary absorption curves for the pure and composite gypsum samples.
Figure 12.
Water capillary absorption curves for the pure and composite gypsum samples.
Figure 13.
Average three-point flexural tensile strengths of the composites.
Figure 13.
Average three-point flexural tensile strengths of the composites.
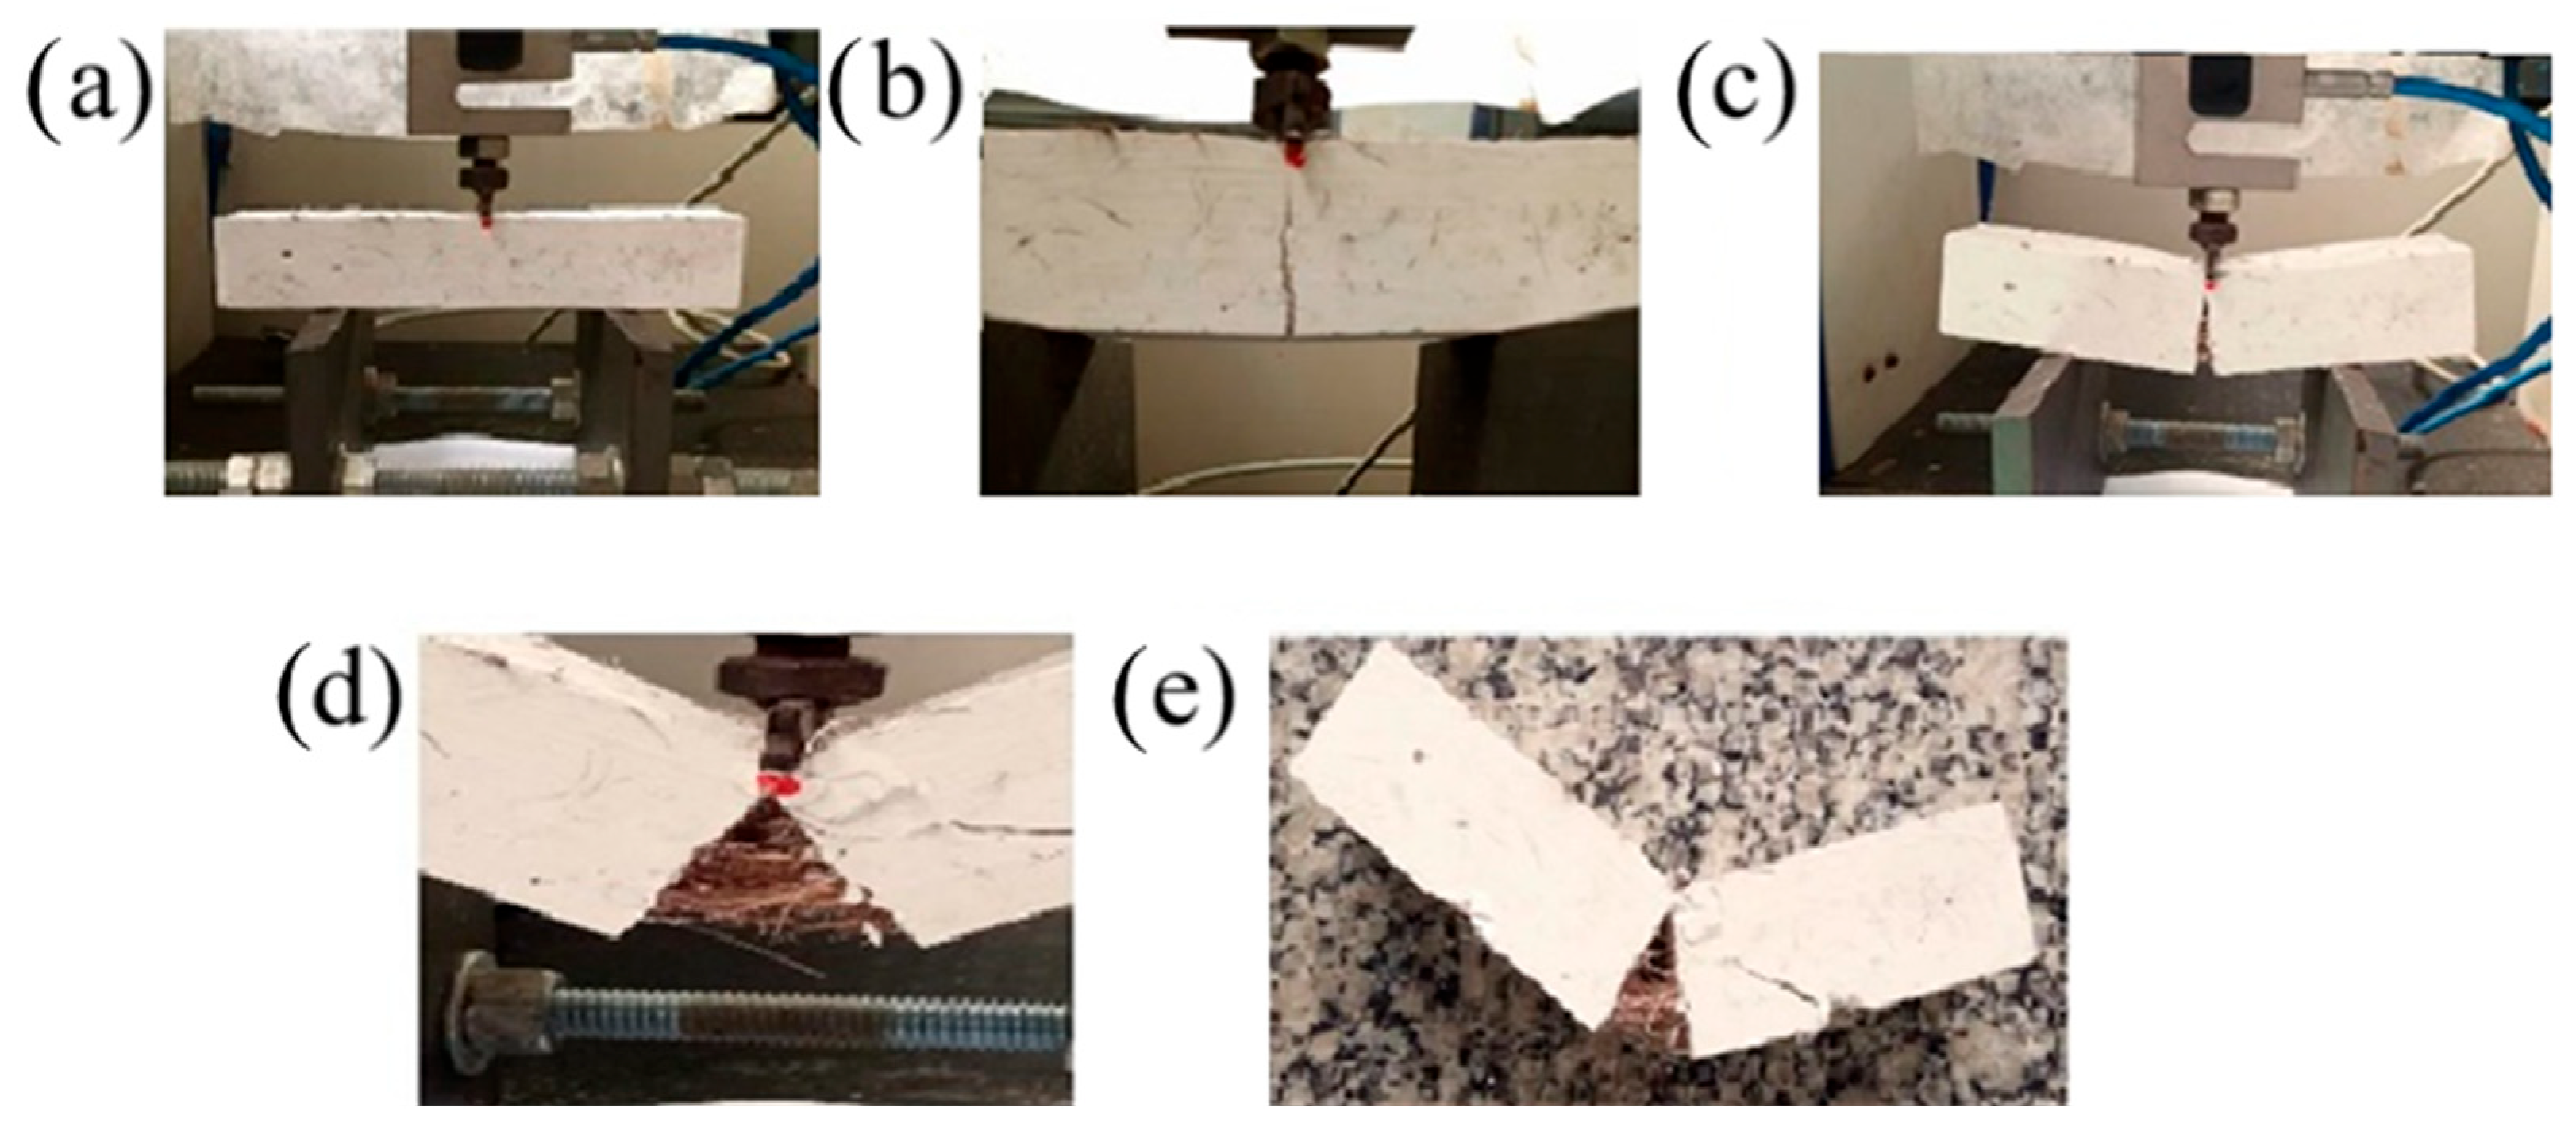
Figure 14.
Flexural tensile test of R50C50P5F10 sample: (a) before rupture; (b) formation of the first crack; (c) onset of fracture; (d) completion of the test; (e) specimen after the test.
Figure 14.
Flexural tensile test of R50C50P5F10 sample: (a) before rupture; (b) formation of the first crack; (c) onset of fracture; (d) completion of the test; (e) specimen after the test.
Figure 15.
Average compressive strengths of the composites.
Figure 15.
Average compressive strengths of the composites.
Figure 16.
Cross-sections of different gypsum samples: (a) recycled gypsum; (b) recycled gypsum + 5% PVA; (c) 70% recycled gypsum + 30% commercial gypsum + 5% PVA; (d) 50% recycled gypsum + 50% commercial gypsum + 5% PVA.
Figure 16.
Cross-sections of different gypsum samples: (a) recycled gypsum; (b) recycled gypsum + 5% PVA; (c) 70% recycled gypsum + 30% commercial gypsum + 5% PVA; (d) 50% recycled gypsum + 50% commercial gypsum + 5% PVA.
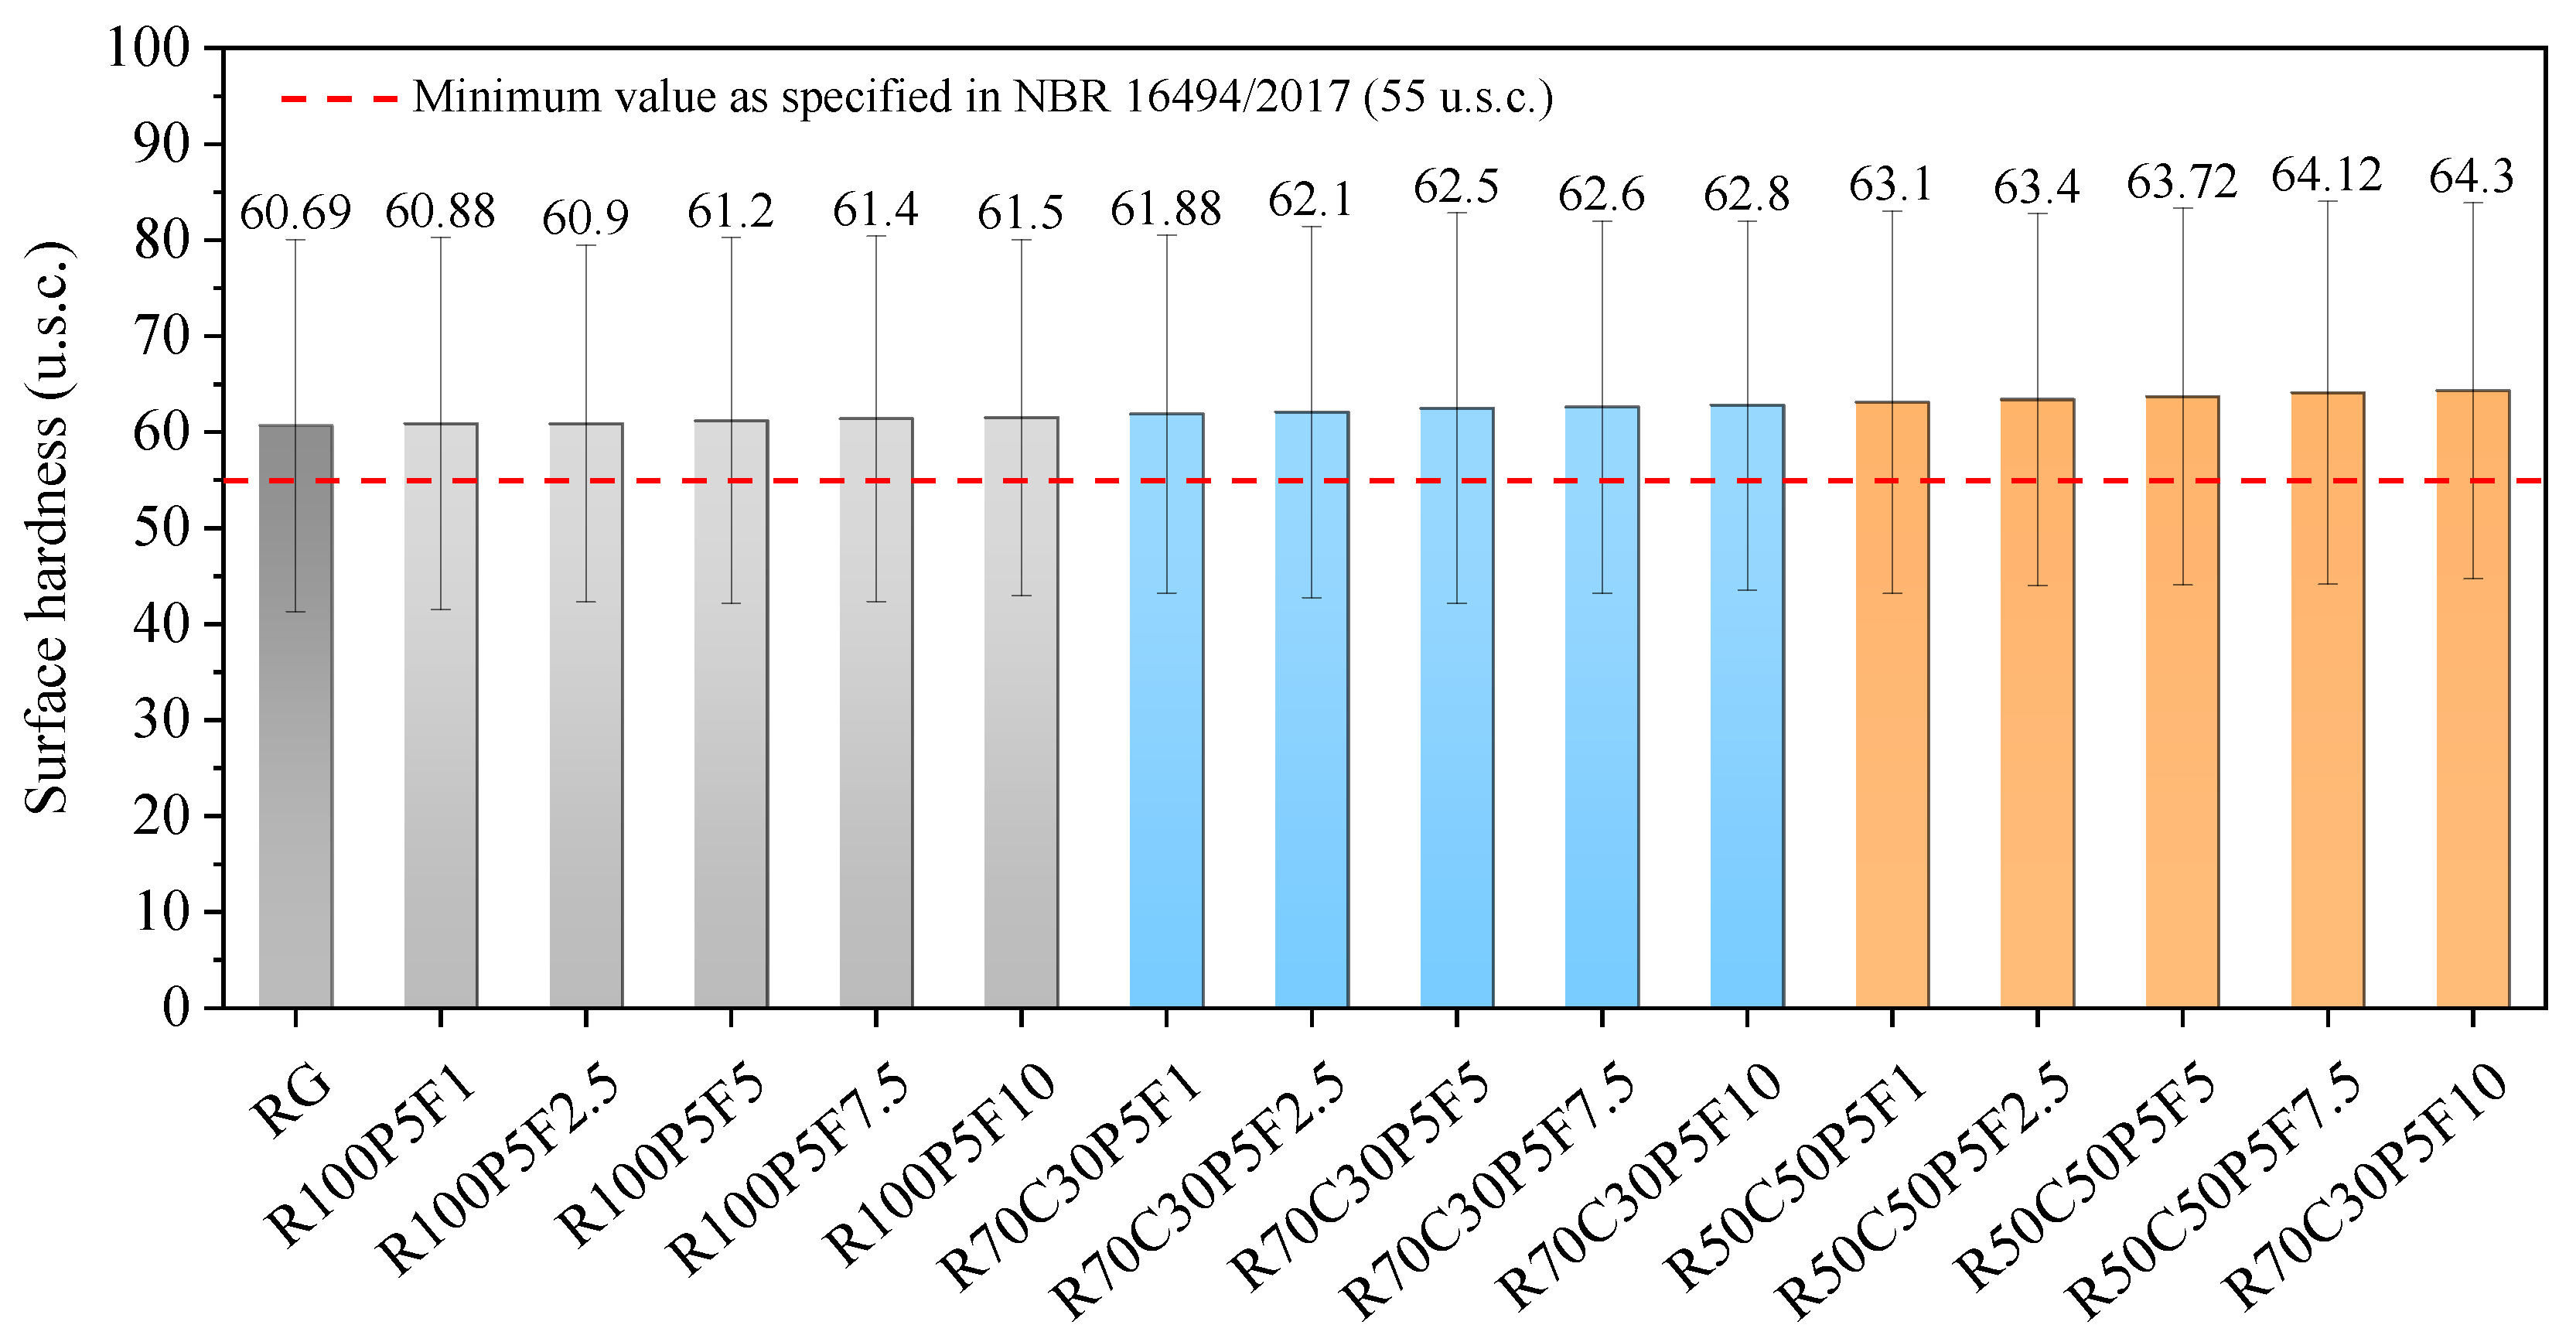
Figure 17.
Average Shore C surface hardness values of the composites.
Figure 17.
Average Shore C surface hardness values of the composites.
Figure 18.
X-ray diffraction (XRD) pattern of the PVA emulsion.
Figure 18.
X-ray diffraction (XRD) pattern of the PVA emulsion.
Figure 19.
XRD patterns of untreated and treated coconut fibers.
Figure 19.
XRD patterns of untreated and treated coconut fibers.
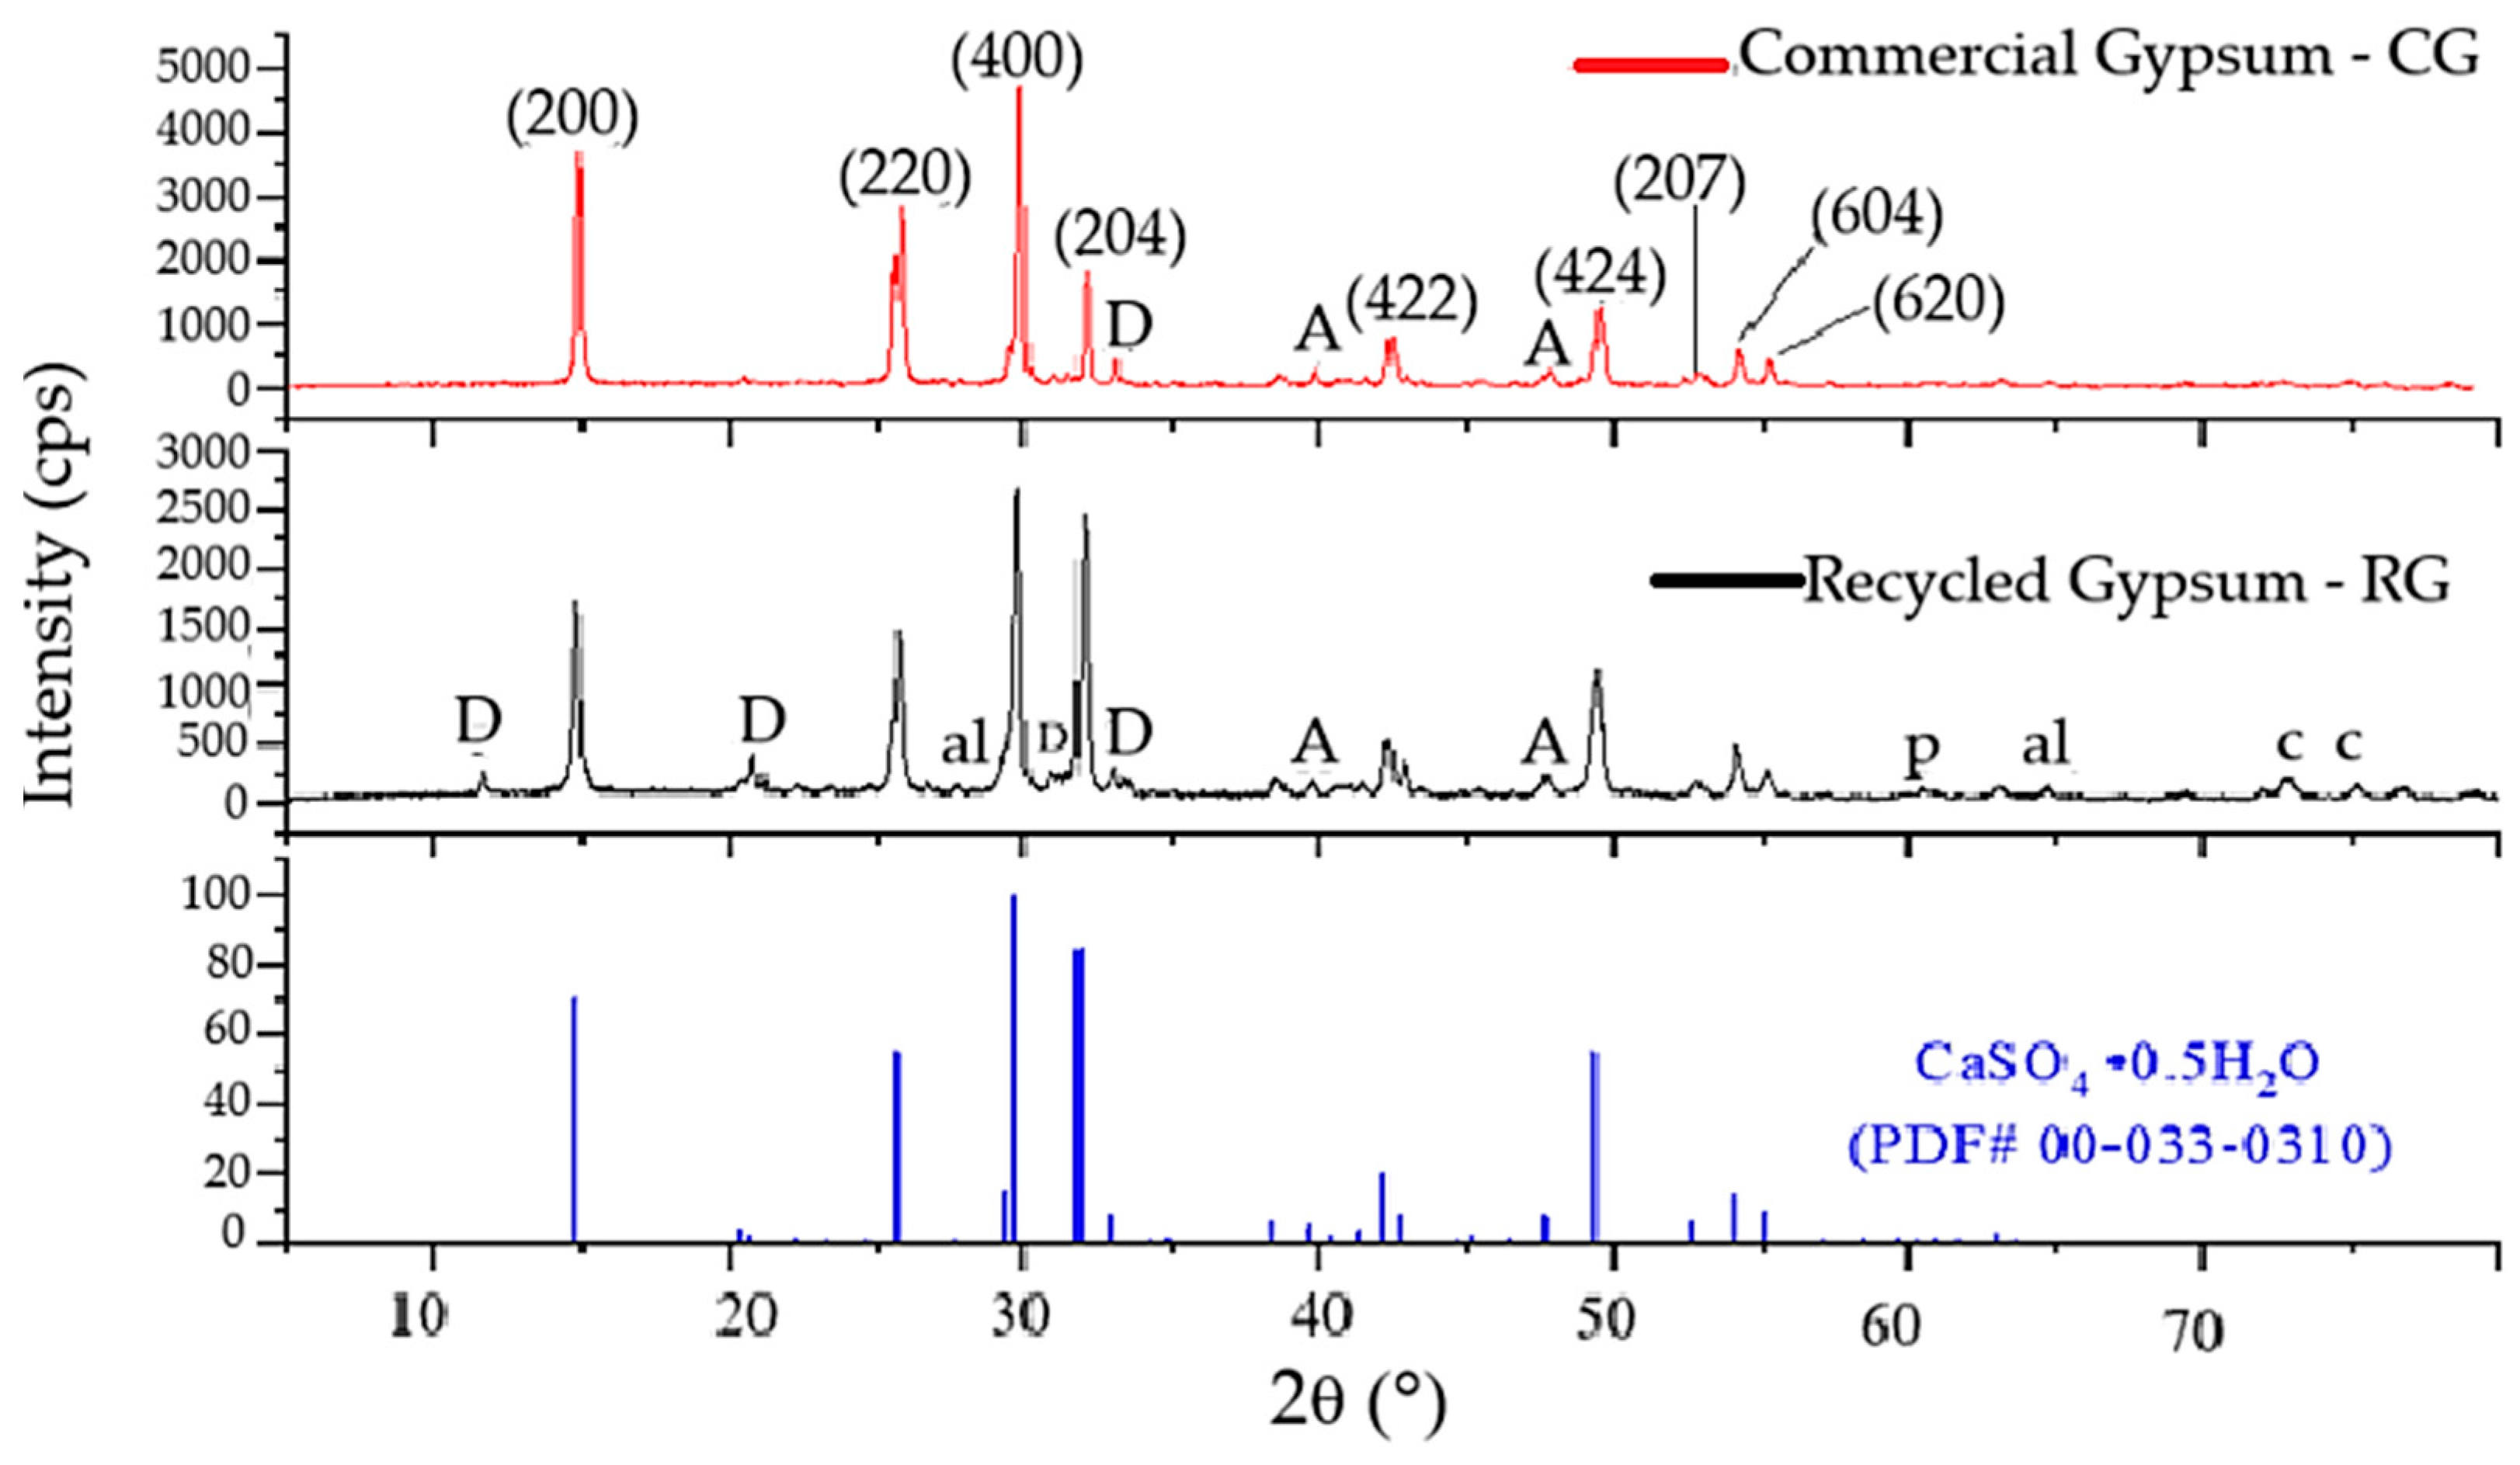
Figure 20.
XRD patterns of commercial gypsum hemihydrate and recycled gypsum before hydration. D = dihydrate, A = anhydrite, al = alumina, p = perlite, c = cellulose.
Figure 20.
XRD patterns of commercial gypsum hemihydrate and recycled gypsum before hydration. D = dihydrate, A = anhydrite, al = alumina, p = perlite, c = cellulose.
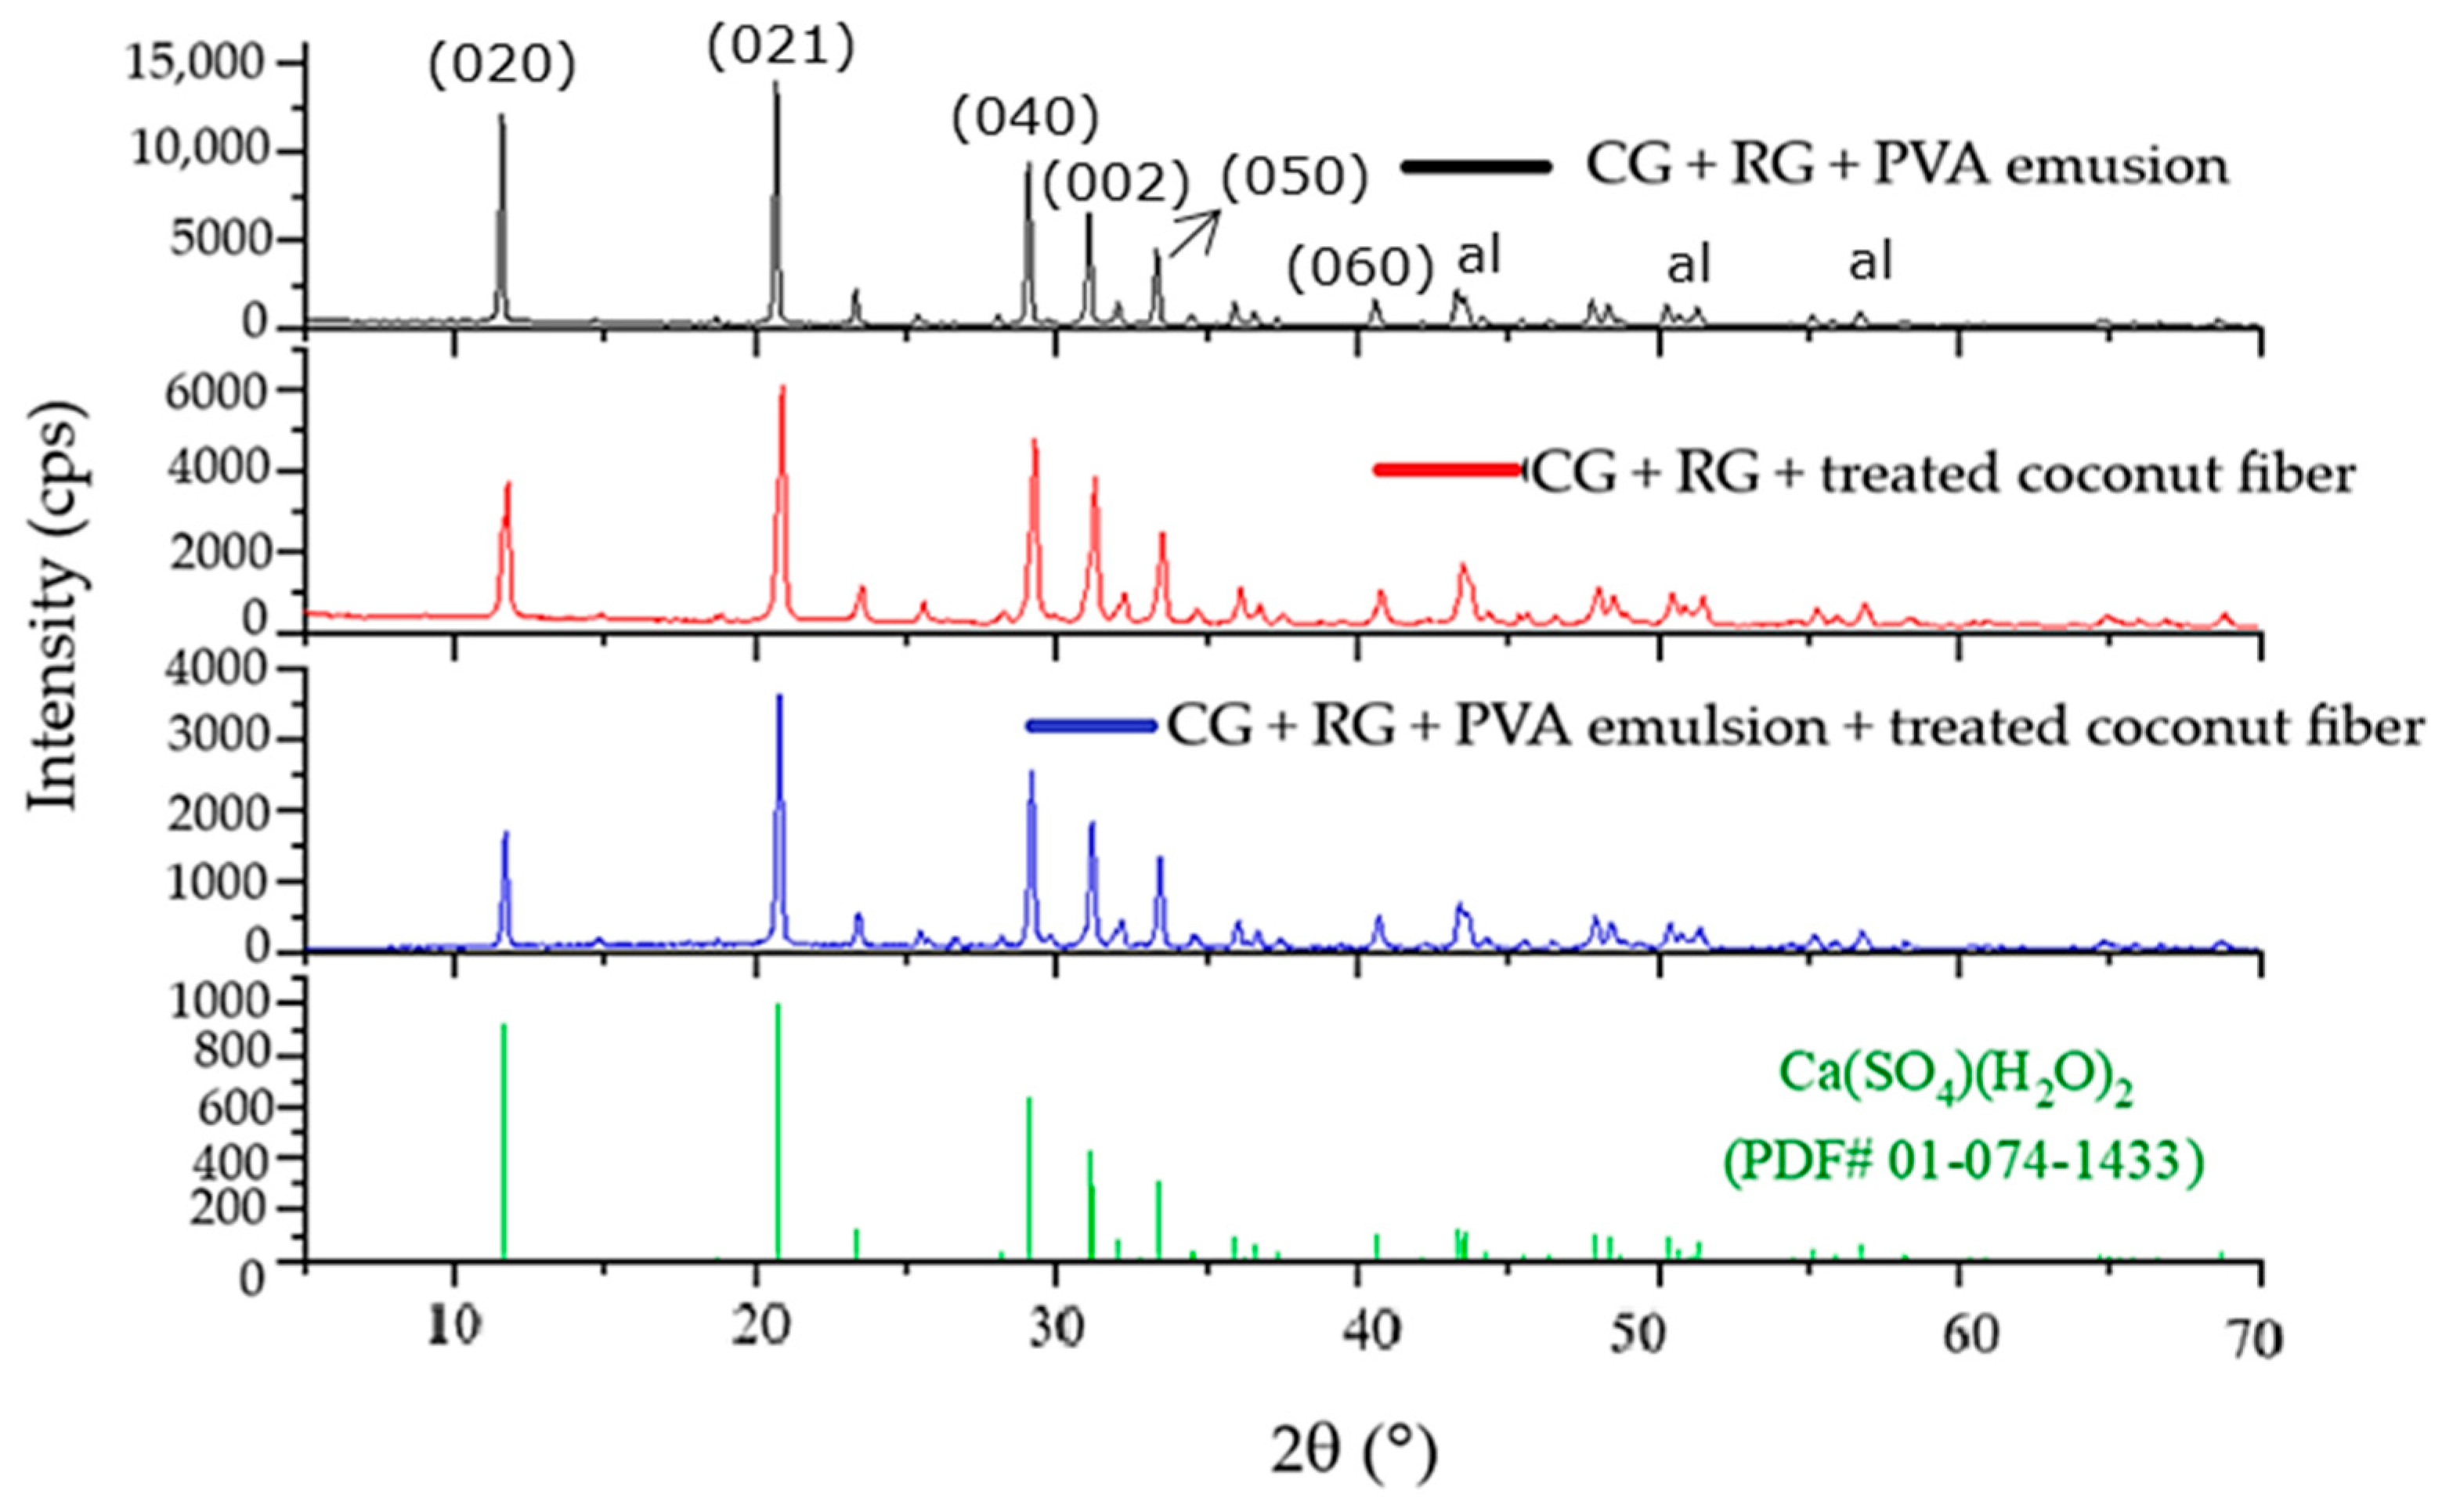
Figure 21.
XRD patterns of dihydrate composites.
Figure 21.
XRD patterns of dihydrate composites.
Figure 22.
Thermal analysis: (a,b) thermogravimetric analysis (TGA), differential thermal analysis (DTA), and differential thermogravimetry (DTG) results of gypsum with PVA emulsion; (c,d) TGA, DTA, and DTG results of composite with treated green coconut fibers; (e,f) TGA, DTA, and DTG results of composite with PVA emulsion and treated green coconut fibers.
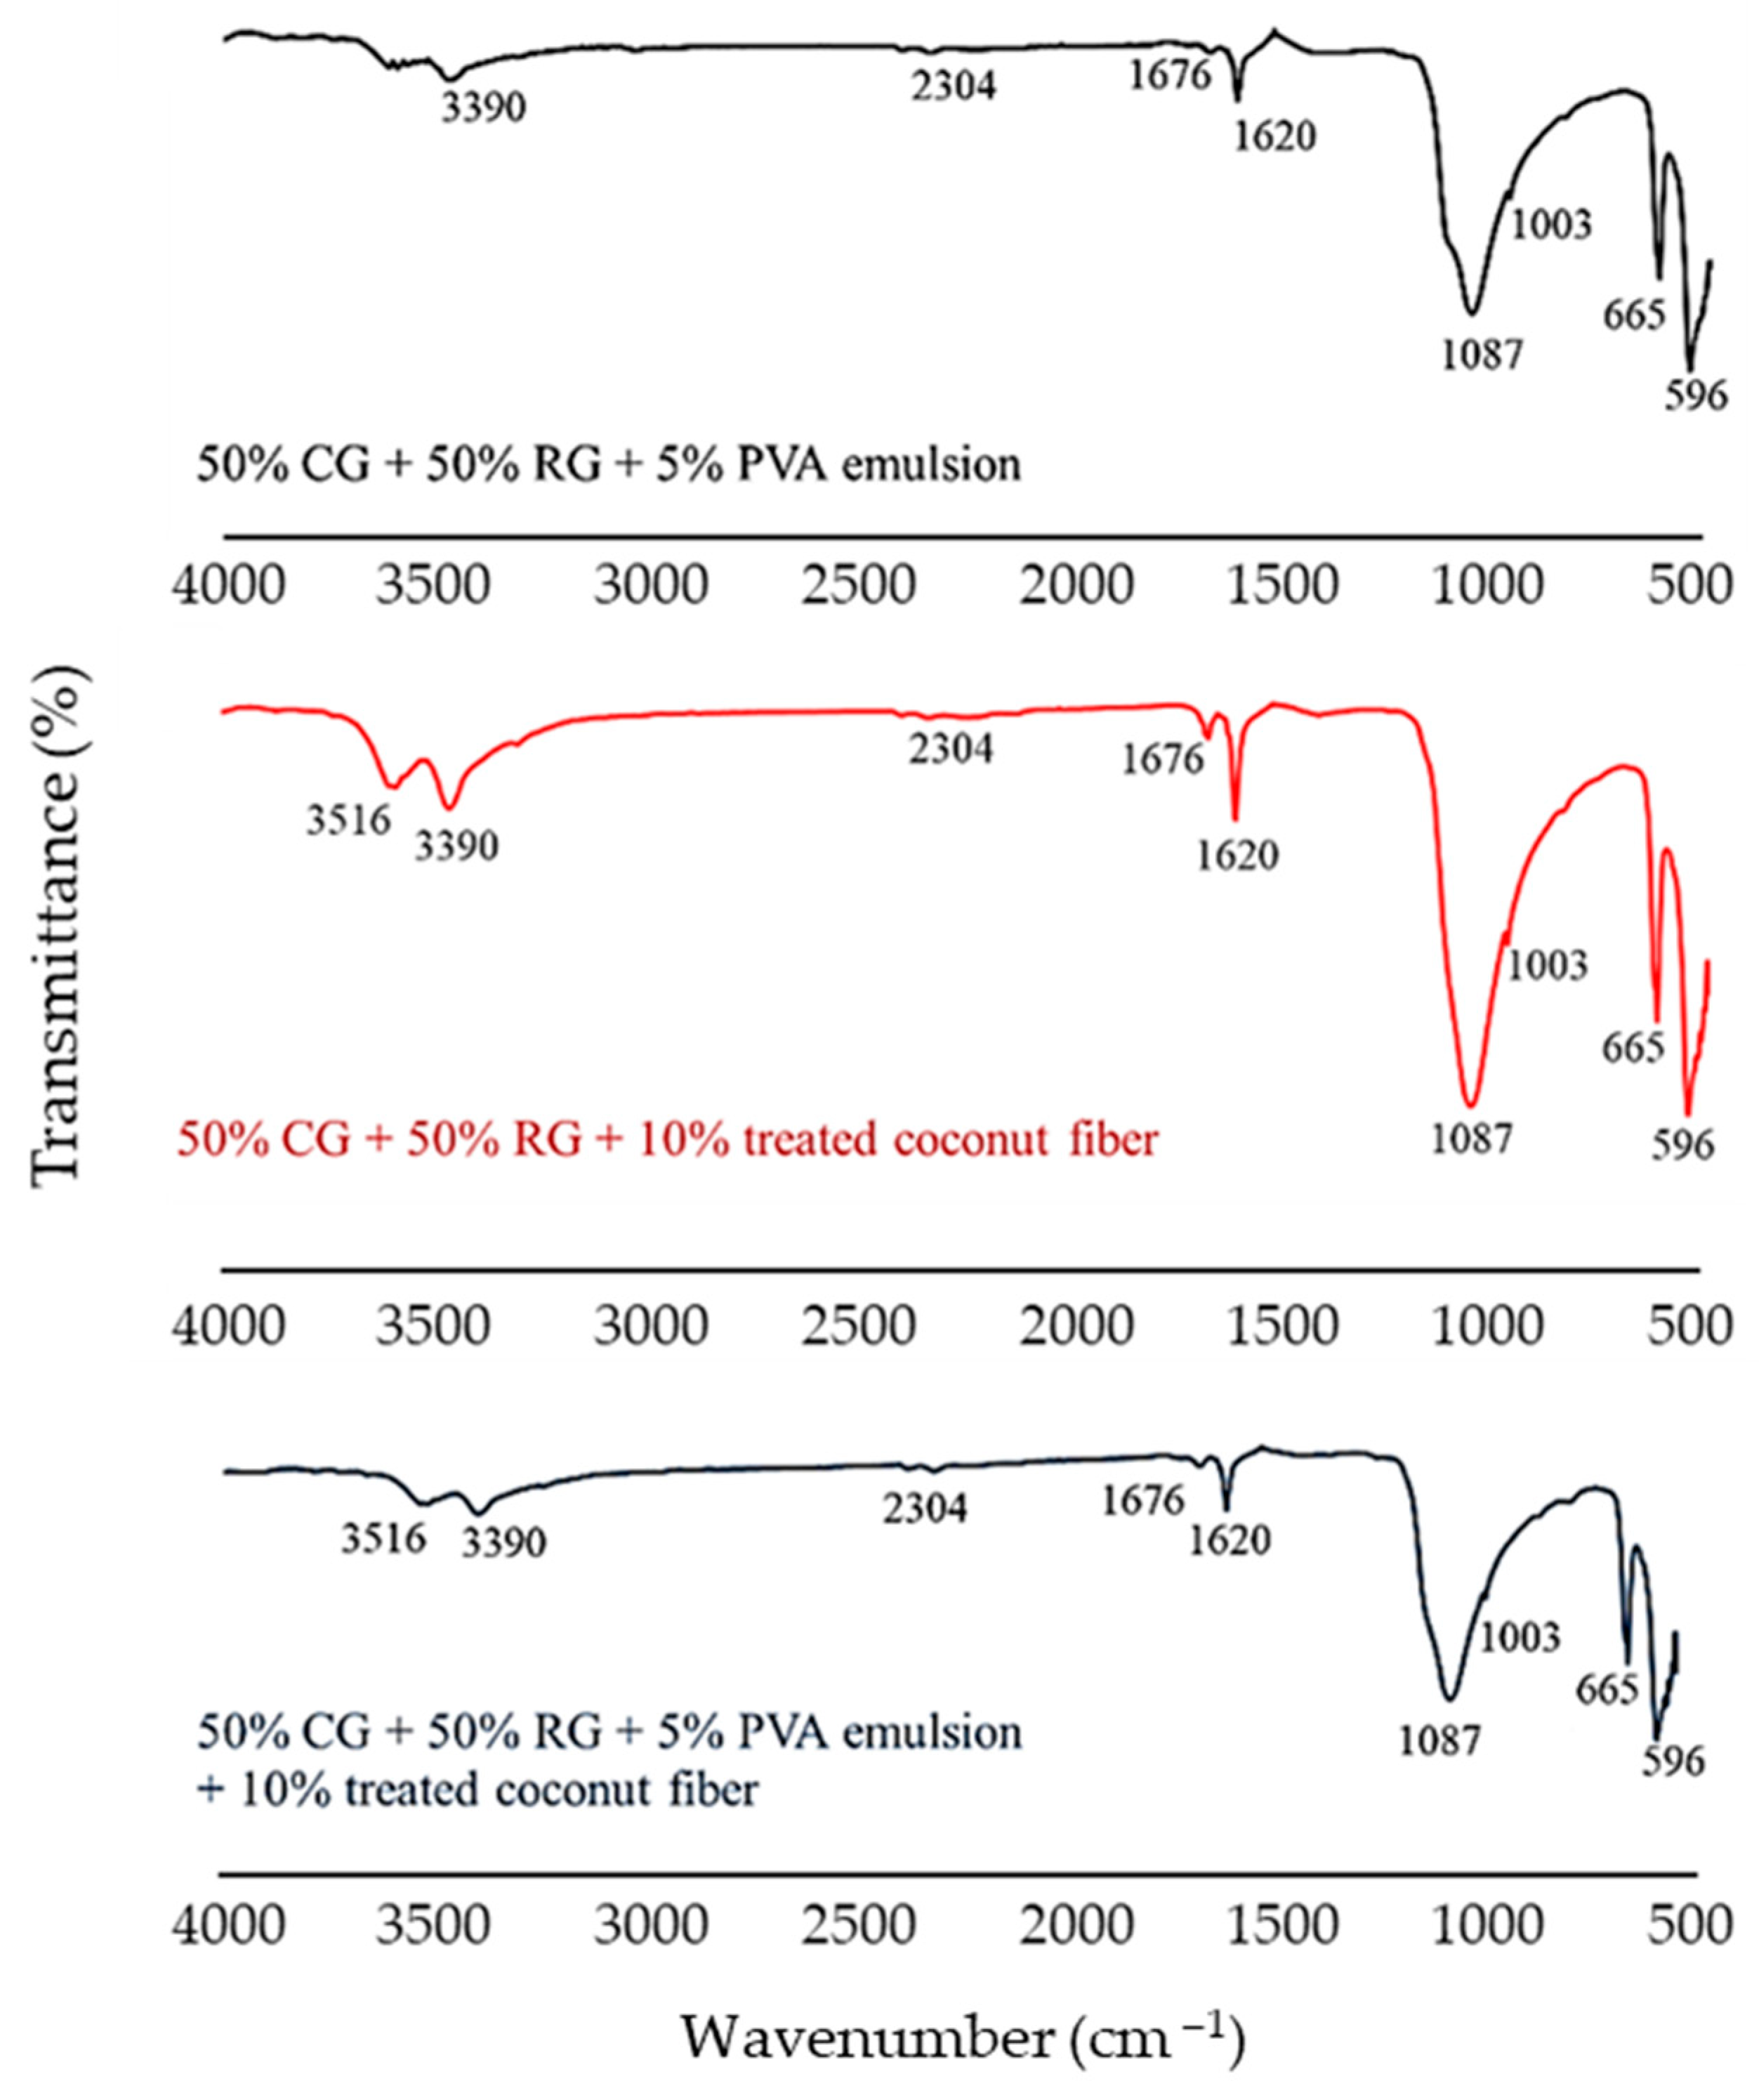
Figure 23.
Fourier-transform infrared (FTIR) spectra of the studied composites.
Figure 23.
Fourier-transform infrared (FTIR) spectra of the studied composites.
Table 1.
Physicochemical parameters of gypsum powder.
Table 1.
Physicochemical parameters of gypsum powder.
| Physical Parameters |
|---|
| Properties (Unit) | Gypsum Type | Result (CV) 2 | p-Value 3 | Normative Limit | Standard |
|---|
| Granulometry (%) 1 | Commercial | 96 (2.1) | 2.8930 × 10⁻³ | ≥90 | NBR 13207 [11] |
| Recycled | 91 (3.2) |
| Unit mass (kg/m3) | Commercial | 830 (3.0) | 1.2796 × 10⁻¹² | ≥600 |
| Recycled | 636 (3.4) |
| Specific mass (kg/m3) | Commercial | 3096.54 (6.2) | 4.2841 × 10⁻¹⁷ | N/A 4 |
| Recycled | 2442.66 (9.8) |
| Specific surface area (m2/kg) | Commercial | 540.74 (2.9) | 4.9864 × 10⁻¹² | 200–800 | NBR 16372/2015 [20] |
| Recycled | 346.54 (3.7) |
| Chemical Parameters |
| Properties (unit) | Gypsum Type | Result (CV) 1 | p-Value | Normative Limit | Standard |
| Free water content (%) | Commercial | 1.23 (8.1) | 1.0143 × 10⁻² | ≤1.3 | NBR 13207 [11] |
| Recycled | 1.07 (9.3) |
| Water of crystallization (%) | Commercial | 6.1 (3.3) | 2.2101 × 10⁻³ | 4.2–6.2 |
| Recycled | 4.9 (8.2) |
| Calcium oxide content (%) | Commercial | 41.4 (5.6) | 7.0134 × 10⁻¹¹ | >38 |
| Recycled | 32.7 (5.4) |
| Sulfur trioxide content (%) | Commercial | 51.6 (7.5) | 7.6898 × 10⁻¹⁰ | >53 |
| Recycled | 40.3 (9.1) |
Table 2.
Composition of the experimental matrices.
Table 2.
Composition of the experimental matrices.
| Sample | Gypsum | PVA Emulsion (%) | Fiber Content (%) | Water/Gypsum Ratio |
|---|
| Recycled (%) | Commercial (%) |
|---|
| Reference—no additives | | | | | |
| Commercial gypsum (CG) | 0 | 100 | 0 | 0 | 0.6 |
| Recycled gypsum (RG) | 100 | 0 | 0 | 0 | 0.7 |
| Composite group 1 | | | | | |
| R100P5F1 | 100 | 0 | 5 | 1.0 | 0.65 |
| R100P5F2.5 | 100 | 0 | 5 | 2.5 | 0.65 |
| R100P5F5 | 100 | 0 | 5 | 5.0 | 0.65 |
| R100P5F7.5 | 100 | 0 | 5 | 7.5 | 0.65 |
| R100P5F10 | 100 | 0 | 5 | 10.0 | 0.65 |
| Composite group 2 | | | | | |
| R70C30P5F1 | 70 | 30 | 5 | 1.0 | 0.65 |
| R70C30P5F2.5 | 70 | 30 | 5 | 2.5 | 0.65 |
| R70C30P5F5 | 70 | 30 | 5 | 5.0 | 0.65 |
| R70C30P5F7.5 | 70 | 30 | 5 | 7.5 | 0.65 |
| R70C30P5F10 | 70 | 30 | 5 | 10.0 | 0.65 |
| Composite group 3 | | | | | |
| R50C50P5F1 | 50 | 50 | 5 | 1.0 | 0.65 |
| R50C50P5F2.5 | 50 | 50 | 5 | 2.5 | 0.65 |
| R50C50P5F5 | 50 | 50 | 5 | 5.0 | 0.65 |
| R50C50P5F7.5 | 50 | 50 | 5 | 7.5 | 0.65 |
| R50C50P5F10 | 50 | 50 | 5 | 10.0 | 0.65 |
Table 3.
Sorptivity (S) of the studied gypsum and composite samples, with the statistical coefficient of variation shown in parenthesis.
Table 3.
Sorptivity (S) of the studied gypsum and composite samples, with the statistical coefficient of variation shown in parenthesis.
| References | S [×10−4 kg/(m2·s0.5)] | Composites |
|---|
| Group 1 | S [×10−4 kg/(m2·s0.5)] | Group 2 | S [×10−4 kg/(m2·s0.5)] | Group 3 | S [×10−4 kg/(m2·s0.5)] |
|---|
| CG | 4280 (1.4) | R100P5F1 | 2210 (10.8) | R70C30P5F1 | 2110 (7.8) | R50C50P5F1 | 1730 (9.6) |
| RG | 5440 (1.9) | R100P5F2.5 | 2180 (9.8) | R70C30P5F2.5 | 2080 (10.2) | R50C50P5F2.5 | 1720 (8.7) |
| | | R100P5F5 | 2180 (8.8) | R70C30P5F5 | 2070 (11.2) | R50C50P5F5 | 1700 (8.9) |
| | | R100P5F7.5 | 2170 (9.8) | R70C30P5F7.5 | 2060 (10.1) | R50C50P5F7.5 | 1690 (9.5) |
| | | R100P5F10 | 2160 (8.8) | R70C30P5F10 | 2040 (9.3) | R50C50P5F10 | 1680 (8.0) |
Table 4.
Relative flexural tensile strength of modified compositions compared to the reference gypsum (RG). Percentage variation (%Δ mean vs. RG) is calculated from the mean values. Statistical analysis was performed using Welch’s t-test; results include t- and p-values, with significance determined at p < 0.05.
| Comparison | %Δ Mean vs. RG | t-Value | p-Value | Significant? |
|---|
| RG vs. R100P5F1 | +1.7 | 0.312 | 0.7664 | No |
| RG vs. R100P5F2.5 | +4.4 | 0.977 | 0.3645 | No |
| RG vs. R100P5F5 | +6.6 | 1.786 | 0.115 | No |
| RG vs. R100P5F7.5 | +8.5 | 1.864 | 0.1097 | No |
| RG vs. R100P5F10 | +10.0 | 2.361 | 0.0523 | No |
| RG vs. R70C30P5F1 | +9.3 | 2.228 | 0.0627 | No |
| RG vs. R70C30P5F2.5 | +12.3 | 3.055 | 0.0187 | Yes |
| RG vs. R70C30P5F5 | +14.5 | 3.184 | 0.018 | Yes |
| RG vs. R70C30P5F7.5 | +17.7 | 4.232 | 0.0043 | Yes |
| RG vs. R70C30P5F10 | +20.2 | 5.252 | 0.0011 | Yes |
| RG vs. R50C50P5F1 | +14.9 | 4.129 | 0.0038 | Yes |
| RG vs. R50C50P5F2.5 | +17.9 | 4.27 | 0.0041 | Yes |
| RG vs. R50C50P5F5 | +20.7 | 3.591 | 0.014 | Yes |
| RG vs. R50C50P5F7.5 | +23.9 | 4.922 | 0.0027 | Yes |
| RG vs. R50C50P5F10 | +27.7 | 6.635 | 0.0004 | Yes |
Table 5.
Relative compressive strength of modified compositions compared to the reference gypsum (RG). Percentage variation (%Δ mean vs. RG) is calculated from the mean values. Statistical analysis was performed using Welch’s t-test; results include t- and p-values, with significance determined at p < 0.05.
| Comparison | %Δ Mean vs. RG | t-Value | p-Value | Significant? |
|---|
| RG vs. R100P5F1 | +2.2 | 0.458 | 0.6602 | No |
| RG vs. R100P5F2.5 | +2.7 | 0.547 | 0.6002 | No |
| RG vs. R100P5F5 | +3.4 | 0.694 | 0.5083 | No |
| RG vs. R100P5F7.5 | +4.3 | 0.964 | 0.3636 | No |
| RG vs. R100P5F10 | +5.0 | 1.192 | 0.2676 | No |
| RG vs. R70C30P5F1 | +4.9 | 1.071 | 0.3160 | No |
| RG vs. R70C30P5F2.5 | +5.6 | 1.345 | 0.2157 | No |
| RG vs. R70C30P5F5 | +6.4 | 1.609 | 0.1469 | No |
| RG vs. R70C30P5F7.5 | +7.4 | 1.559 | 0.1591 | No |
| RG vs. R70C30P5F10 | +8.3 | 1.582 | 0.1566 | No |
| RG vs. R50C50P5F1 | +8.4 | 1.793 | 0.1118 | No |
| RG vs. R50C50P5F2.5 | +9.9 | 2.297 | 0.0507 | No |
| RG vs. R50C50P5F5 | +12.2 | 2.743 | 0.0255 | Yes |
| RG vs. R50C50P5F7.5 | +13.4 | 2.897 | 0.0205 | Yes |
| RG vs. R50C50P5F10 | +15.1 | 3.315 | 0.0109 | Yes |
Table 6.
Relative surface hardness of composites compared to the reference gypsum (RG). Percentage variation (%Δ mean vs. RG) is calculated from the mean values. Statistical analysis was performed using Welch’s t-test; results include t- and p-values, with significance determined at p < 0.05.
Table 6.
Relative surface hardness of composites compared to the reference gypsum (RG). Percentage variation (%Δ mean vs. RG) is calculated from the mean values. Statistical analysis was performed using Welch’s t-test; results include t- and p-values, with significance determined at p < 0.05.
| Comparison | %Δ Mean vs. RG | t-Value | p-Value | Significant? |
|---|
| RG vs. R100P5F1 | +0.3 | 0.016 | 0.9880 | No |
| RG vs. R100P5F2.5 | +0.3 | 0.017 | 0.9865 | No |
| RG vs. R100P5F5 | +0.8 | 0.042 | 0.9676 | No |
| RG vs. R100P5F7.5 | +1.2 | 0.058 | 0.9548 | No |
| RG vs. R100P5F10 | +1.3 | 0.068 | 0.9478 | No |
| RG vs. R70C30P5F1 | +2.0 | 0.099 | 0.9236 | No |
| RG vs. R70C30P5F2.5 | +2.3 | 0.115 | 0.9112 | No |
| RG vs. R70C30P5F5 | +3.0 | 0.144 | 0.8889 | No |
| RG vs. R70C30P5F7.5 | +3.1 | 0.156 | 0.8800 | No |
| RG vs. R70C30P5F10 | +3.5 | 0.173 | 0.8671 | No |
| RG vs. R50C50P5F1 | +4.0 | 0.194 | 0.8511 | No |
| RG vs. R50C50P5F2.5 | +4.5 | 0.221 | 0.8304 | No |
| RG vs. R50C50P5F5 | +5.0 | 0.246 | 0.8121 | No |
| RG vs. R50C50P5F7.5 | +5.7 | 0.276 | 0.7896 | No |
| RG vs. R50C50P5F10 | +5.9 | 0.293 | 0.7769 | No |
Table 7.
Peak intensity and crystallinity index values (in percent) for PVA emulsion and coconut fibers.
Table 7.
Peak intensity and crystallinity index values (in percent) for PVA emulsion and coconut fibers.
| Material | I1 1 | I2 2 | Ic (%) 3 |
|---|
| PVA emulsion | 759.6 | 1393.90 | 45.49 |
| Coconut fibers untreated | 3636.40 | 5454.55 | 33.3 |
| Coconut fibers pretreated with 5% NaOH (w/w) | 4090.91 | 6363.64 | 35.71 |
Table 8.
Crystallite size (t) and lamellar spacing between lamellae in the (220) plane of the studied samples.
Table 8.
Crystallite size (t) and lamellar spacing between lamellae in the (220) plane of the studied samples.
| Sample | t (nm) | Spacing (Å) |
|---|
| Hemihydrate gypsum | | |
| Commercial gypsum (CG) | 54 | 4.3288 |
| Recycled gypsum (RG) | 43 | 4.3462 |
| Dihydrate gypsum | | |
| RG + CG + PVA emulsion | 70 | 2.3732 |
| RG + CG + treated coconut fiber | 37 | 2.3696 |
| RG + CG + PVA emulsion + treated coconut fiber | 52 | 2.3989 |
