Article

Experimental and Numerical Investigations on Load Capacity of SRC Beams with Various Sections

1
School of Civil Engineering, Tongji University, Shanghai 200092, China
2
China Construction Eighth Engineering Division Co., Ltd., Shanghai 200112, China
*
Author to whom correspondence should be addressed.
Buildings 2025, 15(19), 3473; https://doi.org/10.3390/buildings15193473
Submission received: 4 August 2025 / Revised: 5 September 2025 / Accepted: 18 September 2025 / Published: 25 September 2025
(This article belongs to the Section Building Materials, and Repair & Renovation)

Abstract

Steel-reinforced concrete (SRC) structures combine steel skeletons with concrete components, improving load-bearing capacity and streamlining construction. In this study, four full-size lattice SRC members were tested under pure bending to validate fundamental assumptions and were further analyzed numerically. The experimental specimens demonstrated a 15.3% increase in ultimate load-carrying capacity and an average 58.7% increase in the ductility index compared with conventional members. Notably, the improvement in ductility was substantially greater than the enhancement in load-bearing capacity. In parallel, a load-bearing capacity formula for lattice SRC members was proposed, yielding an error margin of 0.136 when compared with existing formulae for section steel members. The flexural strength predictions of formulae derived from simplified elastic–plastic theory and numerical analysis agreed with the test results.

1. Introduction

Steel-reinforced concrete (SRC) systems were originally developed to mitigate the overproduction of steel and to address housing shortages [1]. In the building industry, prefabrication has enhanced efficiency [2], precision [3], and safety [4] of construction. However, conventional SRC members are often associated with higher costs and potential quality concerns [2]. To overcome these limitations, researchers have introduced innovative prefabrication systems in recent years [5,6,7].
Extensive studies have focused on enhancing individual building SRC components with various sections [8,9,10,11,12,13,14,15,16,17]. Studies have shown that the compressive strength of precast steel-stud concrete members is usually higher than that of plain concrete members [8]. Lou et al. [9] investigated the bending behavior of four space lattice deep beams with various sections in four-point bending tests, finding significant improvements in stiffness and load-bearing capacity. Similarly, Guo et al. [10] examined the load-bearing capacity of twelve built-in steel member ends with different shear span ratios in three-point tests, noting substantial enhancements in node performance. It indicates that the lattice SRC structures have an effective seismic performance compared with RC beams subsequently. Shear tests have further elucidated the role of steel reinforcement in enhancing the shear strength of SRC members, particularly in high-shear regions [11]. Dynamic testing, including static cyclic tests and shaking table experiments, has been conducted to evaluate the seismic performance of SRC structures [12]. Xu et al. [17] investigated the SRC nodes through numerical modeling, incorporating diverse mesh sizes within each component. The findings of the study suggest a strong correlation between the numerical models and the experimental results. Xu et al. [18] conducted an analysis of the element types of SRC special-shaped interior joints, determining that the embedded region performs well in the collaborative interaction between different materials. However, the extant literature on SRC members is predominantly focused on H-beam combined members [15,16,17,18], with limited research addressing hollow web lattice-type members [19,20,21,22,23]. The bearing capacity of angle SRC members has been proposed [13,14], and it is suggested that this capacity can be extended to the calculation of the bearing capacity of lattice SRC members.
Therefore, pure bending tests of lattice SRC beams were performed and analyzed. This beam features a thin steel plate integrated with the web at the ends, forming a steel-like connection node, which is depicted in Figure 1. The design allows the beam ends to connect securely to the steel columns, supporting substantial construction loads. This connection method is more straightforward and reliable than traditional prefabricated nodes, enabling construction methods akin to those used for structural steel members, but with significantly less steel. The external concrete layer protects the load-bearing steel and maintains the connection through splices and baseboards.
This study presents a comprehensive experimental investigation of full-scale lattice SRC beams. Four-point bending tests were performed to evaluate failure modes, load–deflection behavior, and the validity of design assumptions. Complementary numerical analyses were then carried out, comparing experimental results with theoretical predictions to examine the influence of construction methods and member parameters on beam performance. Based on both experimental and numerical findings, a simplified design method for lattice SRC beams is proposed.

2. Experimental Setup

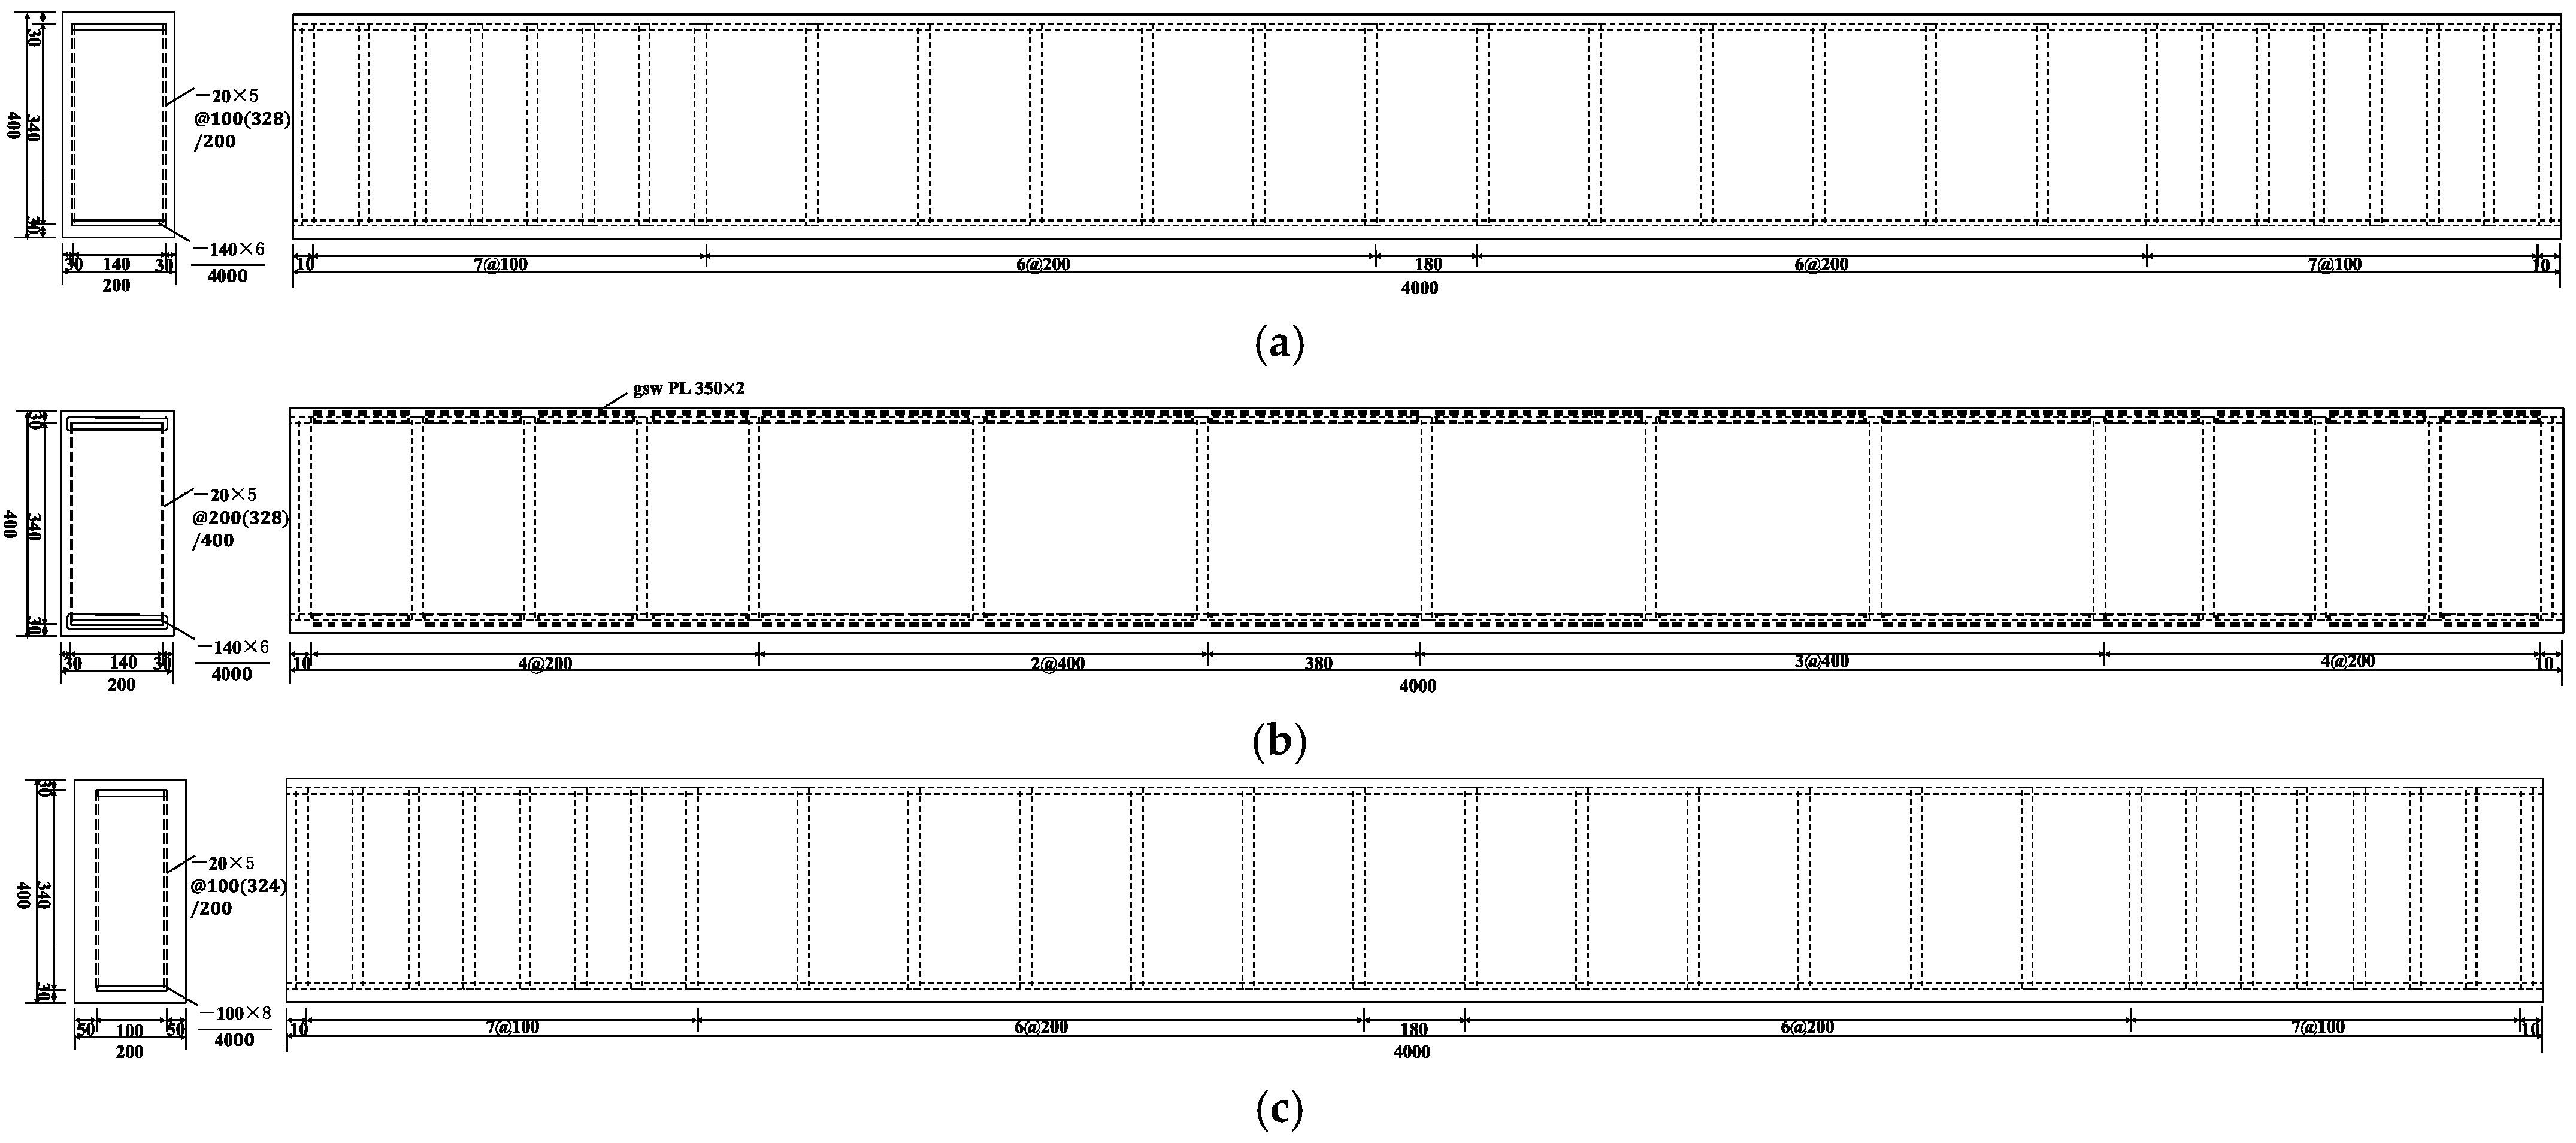
Five experimental tests were conducted to evaluate the performance of novel prefabricated beams reinforced with Q355 steel, alongside conventional concrete beams reinforced with HRB400 steel as control specimens. The concrete cover thickness was consistent across all specimens, except for GL3, where the lateral cover thickness was increased to 50 mm. Each experimental component featured distinct structural details, as outlined in Table 1. The variation in structural details aimed to assess their impact on beam performance. The results from specimens GL1 to GL4 were utilized to validate the applicability of current codes and the accuracy of the proposed models.
The SRC beams were fabricated using Q355 steel and concrete designed to achieve a compressive strength of 30 MPa. According to [24], concrete cubes measuring 150 mm per side were cast, and, under standard curing conditions, achieved a 28-day strength of 32.5 MPa, meeting code requirements. The reinforcing steel exhibited a tensile strength of 399 MPa, in compliance with specified standards [25], as detailed in Table 2.

2.1. Specimen Preparation

A total of five beam specimens were designed for this study: GL1 through GL4, representing new assembled truss concrete beams, and LH, serving as an ordinary concrete beam for comparison. All specimens shared the following parameters: structural measures (spigot, wire mesh, and longitudinal reinforcement, etc.) and form of steel distribution (type of stressed steel: including steel plate type and size). The calculated span (l = 3800 mm), section size (b = 200 mm, h = 400 mm), and concrete cover (c = 30 mm) of the specimens remain unchanged; only the lateral protective layer and structural measures are changed. The design strength of the concrete is C30; the design variations among the specimens are depicted in Figure 2.
GL1 served as the baseline specimen, without additional structural modifications; GL2 incorporated double-spaced strips to investigate their effect on beam performance; GL3 featured an increased lateral concrete cover thickness of 50 mm to assess its impact; and GL4 combined both strips and increased lateral cover to evaluate their combined effects. The reinforcing details, including wire mesh, longitudinal reinforcement, and steel distribution, varied among the specimens to study their influence on beam behavior.
The structural steel plates are fabricated using steel plates of standard thickness that are commonly available on the construction site, ensuring a more favorable material procurement for construction purposes. The steel framework is first fixed and welded using large-spaced strips on both sides. Then, the spacing of the strips at the midspan is adjusted according to experimental requirements for complete welding. Concrete pouring is carried out in a precast component factory, using the same pouring method as for ordinary precast components. Subsequent to the rectification of the wooden formwork, a layer of mineral oil or alternative release agent that does not react with concrete is applied to the inner surface of the test mold. The concrete mixture is prepared with the sensor wire outlet facing upward, and it is thoroughly mixed at least three times with a shovel until uniform. The on-site flat plate vibration casting of concrete is a process in which the mixture is loaded into the test mold in a single step. During the loading process, it is essential to utilize a trowel to ensure the concrete mixture exceeds the mold opening. This can be achieved by vibrating the mixture along the walls of the test mold. The excess concrete must be removed from the top of the test mold. As the concrete approaches its initial setting phase, the use of a trowel becomes essential for achieving a level surface. The specimen should be transferred to a room maintained at 20 ± 0.5 °C for standard curing. Subsequent to a 28-day period, the specimen should be meticulously extracted from the mold and positioned in a suitable location. The specimen preparation is complete. The load-bearing steel plates of the four components should be measured three times at both ends and the midpoint. The average value of these measurements should then be calculated. The error is displayed in the following table, and the cross-sectional error is indicated in Table 3.

2.2. Instrumentation and Measurement

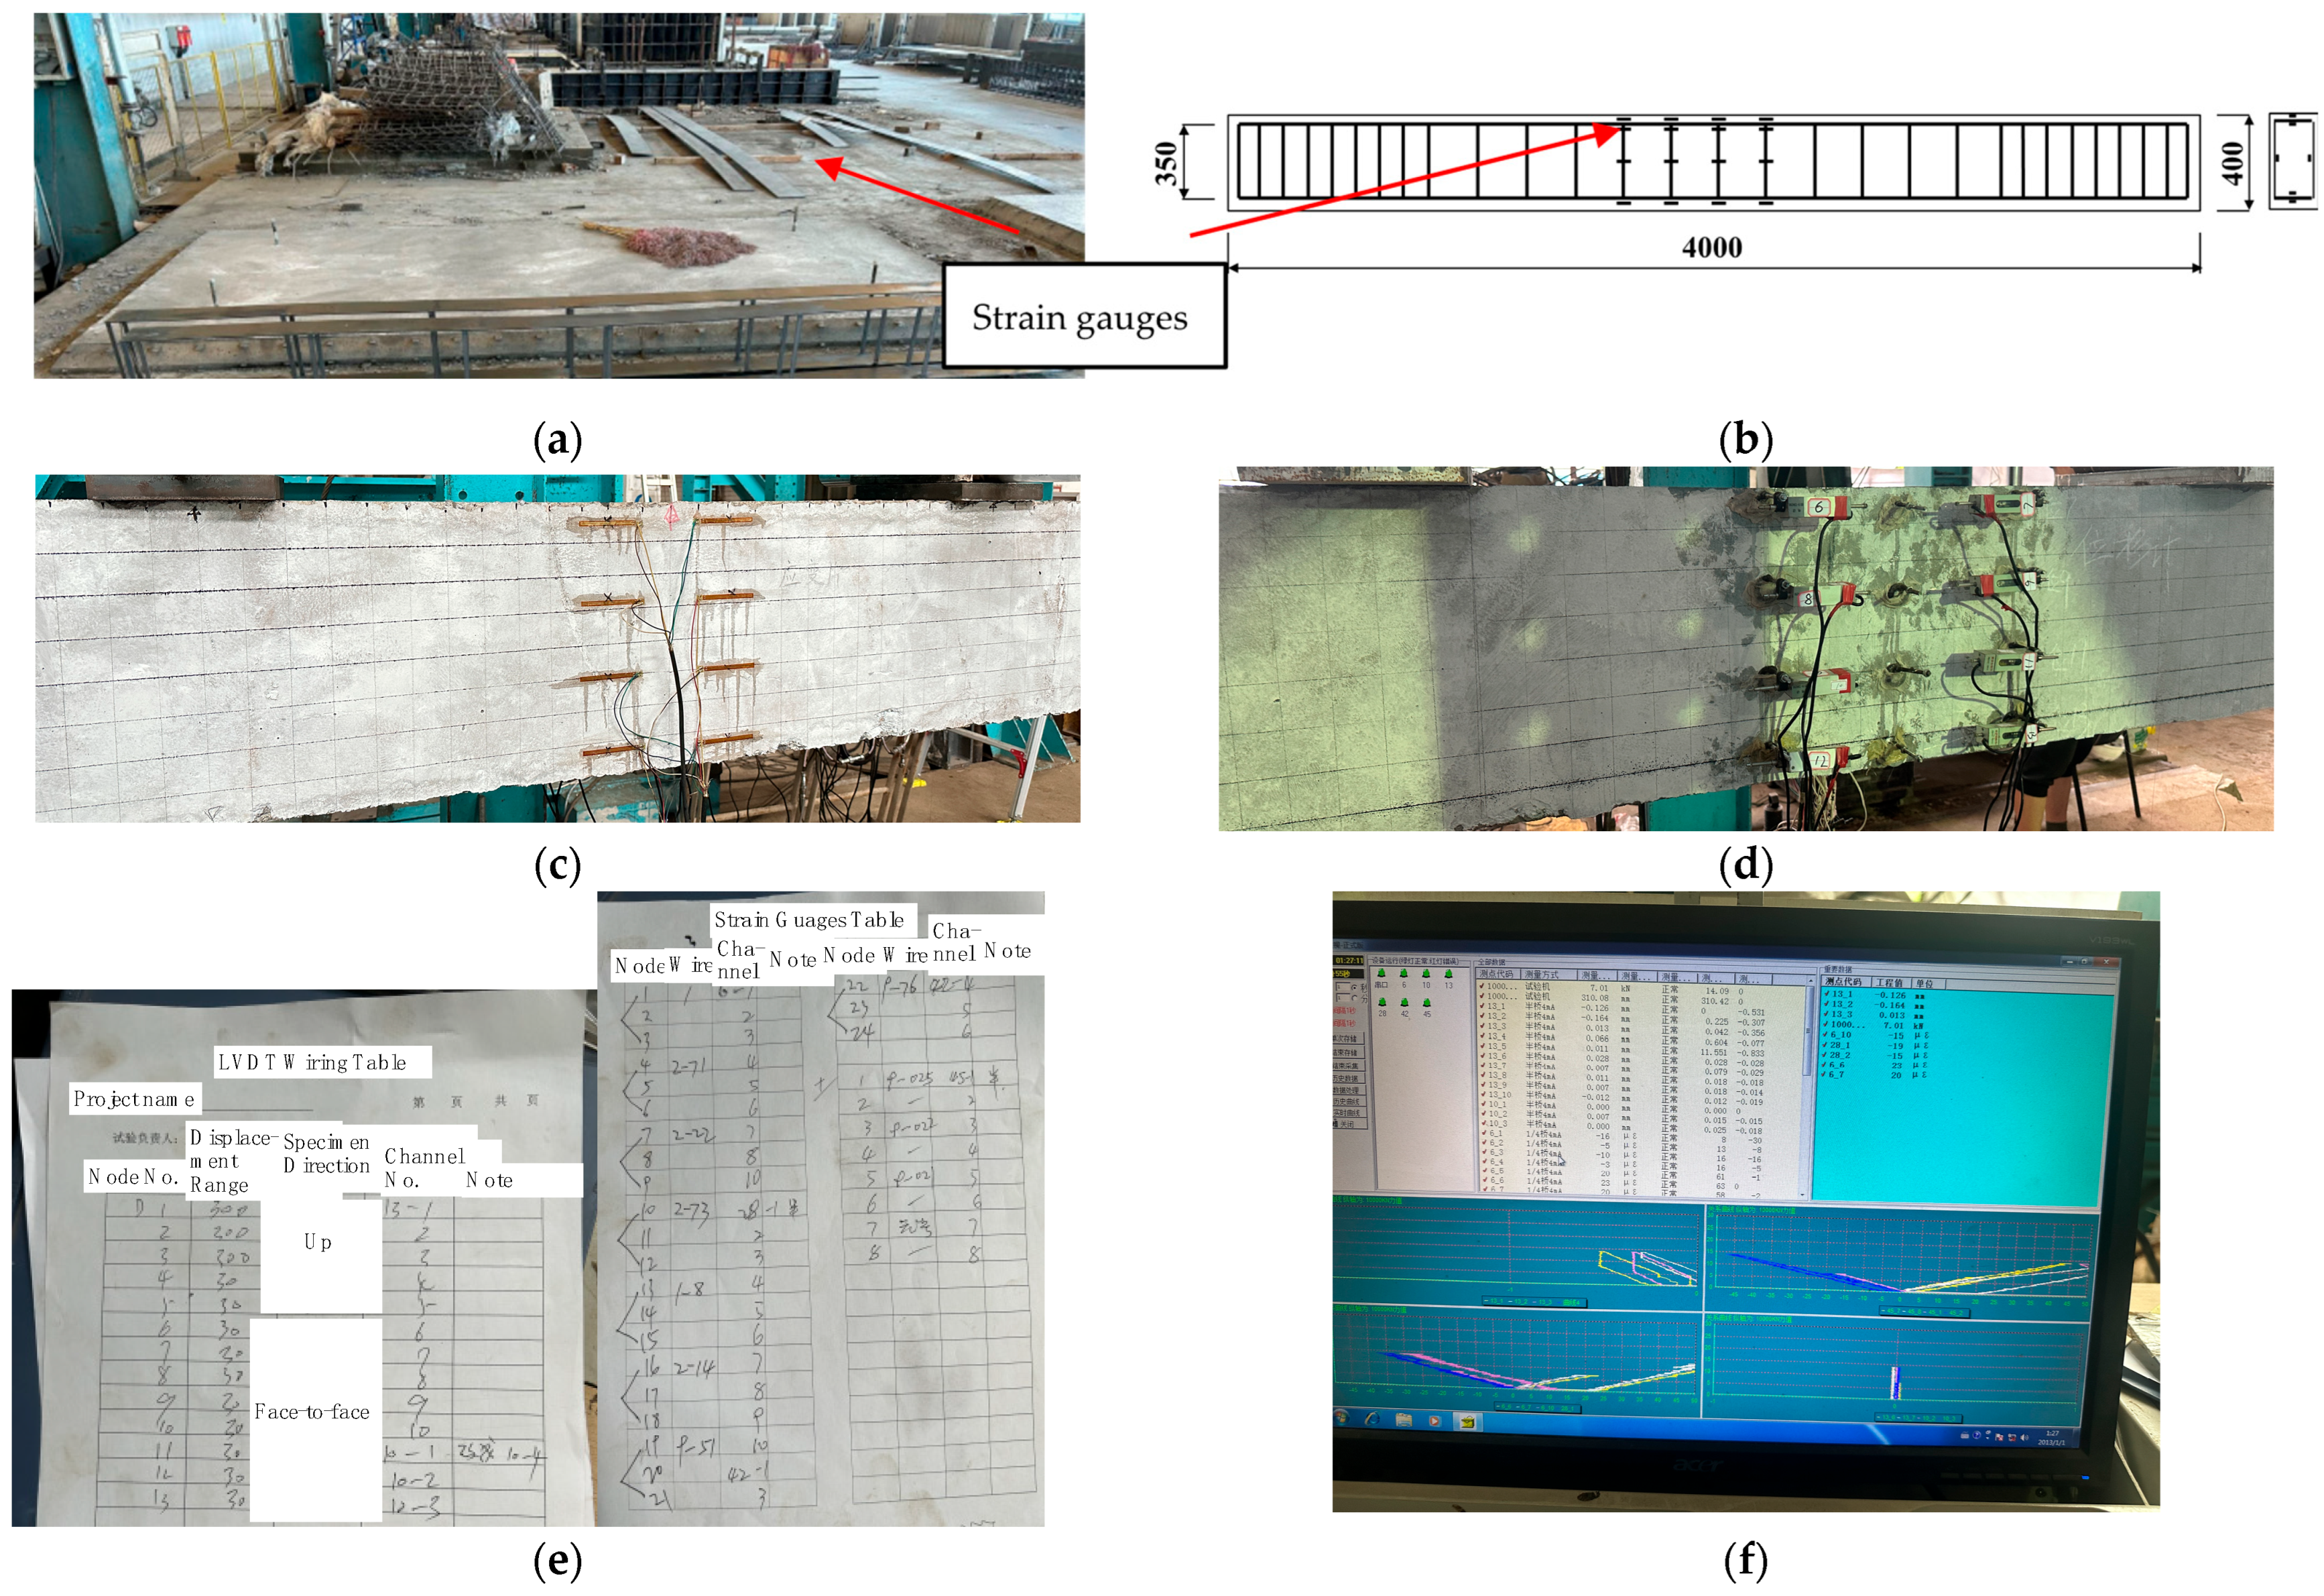
As shown in Figure 3a, in order to obtain steel strains of different cross-sectional heights, eight electrical resistance strain gauges were symmetrically placed on the upper and lower surfaces of the steel plates at critical cross-sections to capture strain variations. All strain gauges arrangements are shown in Figure 3b.
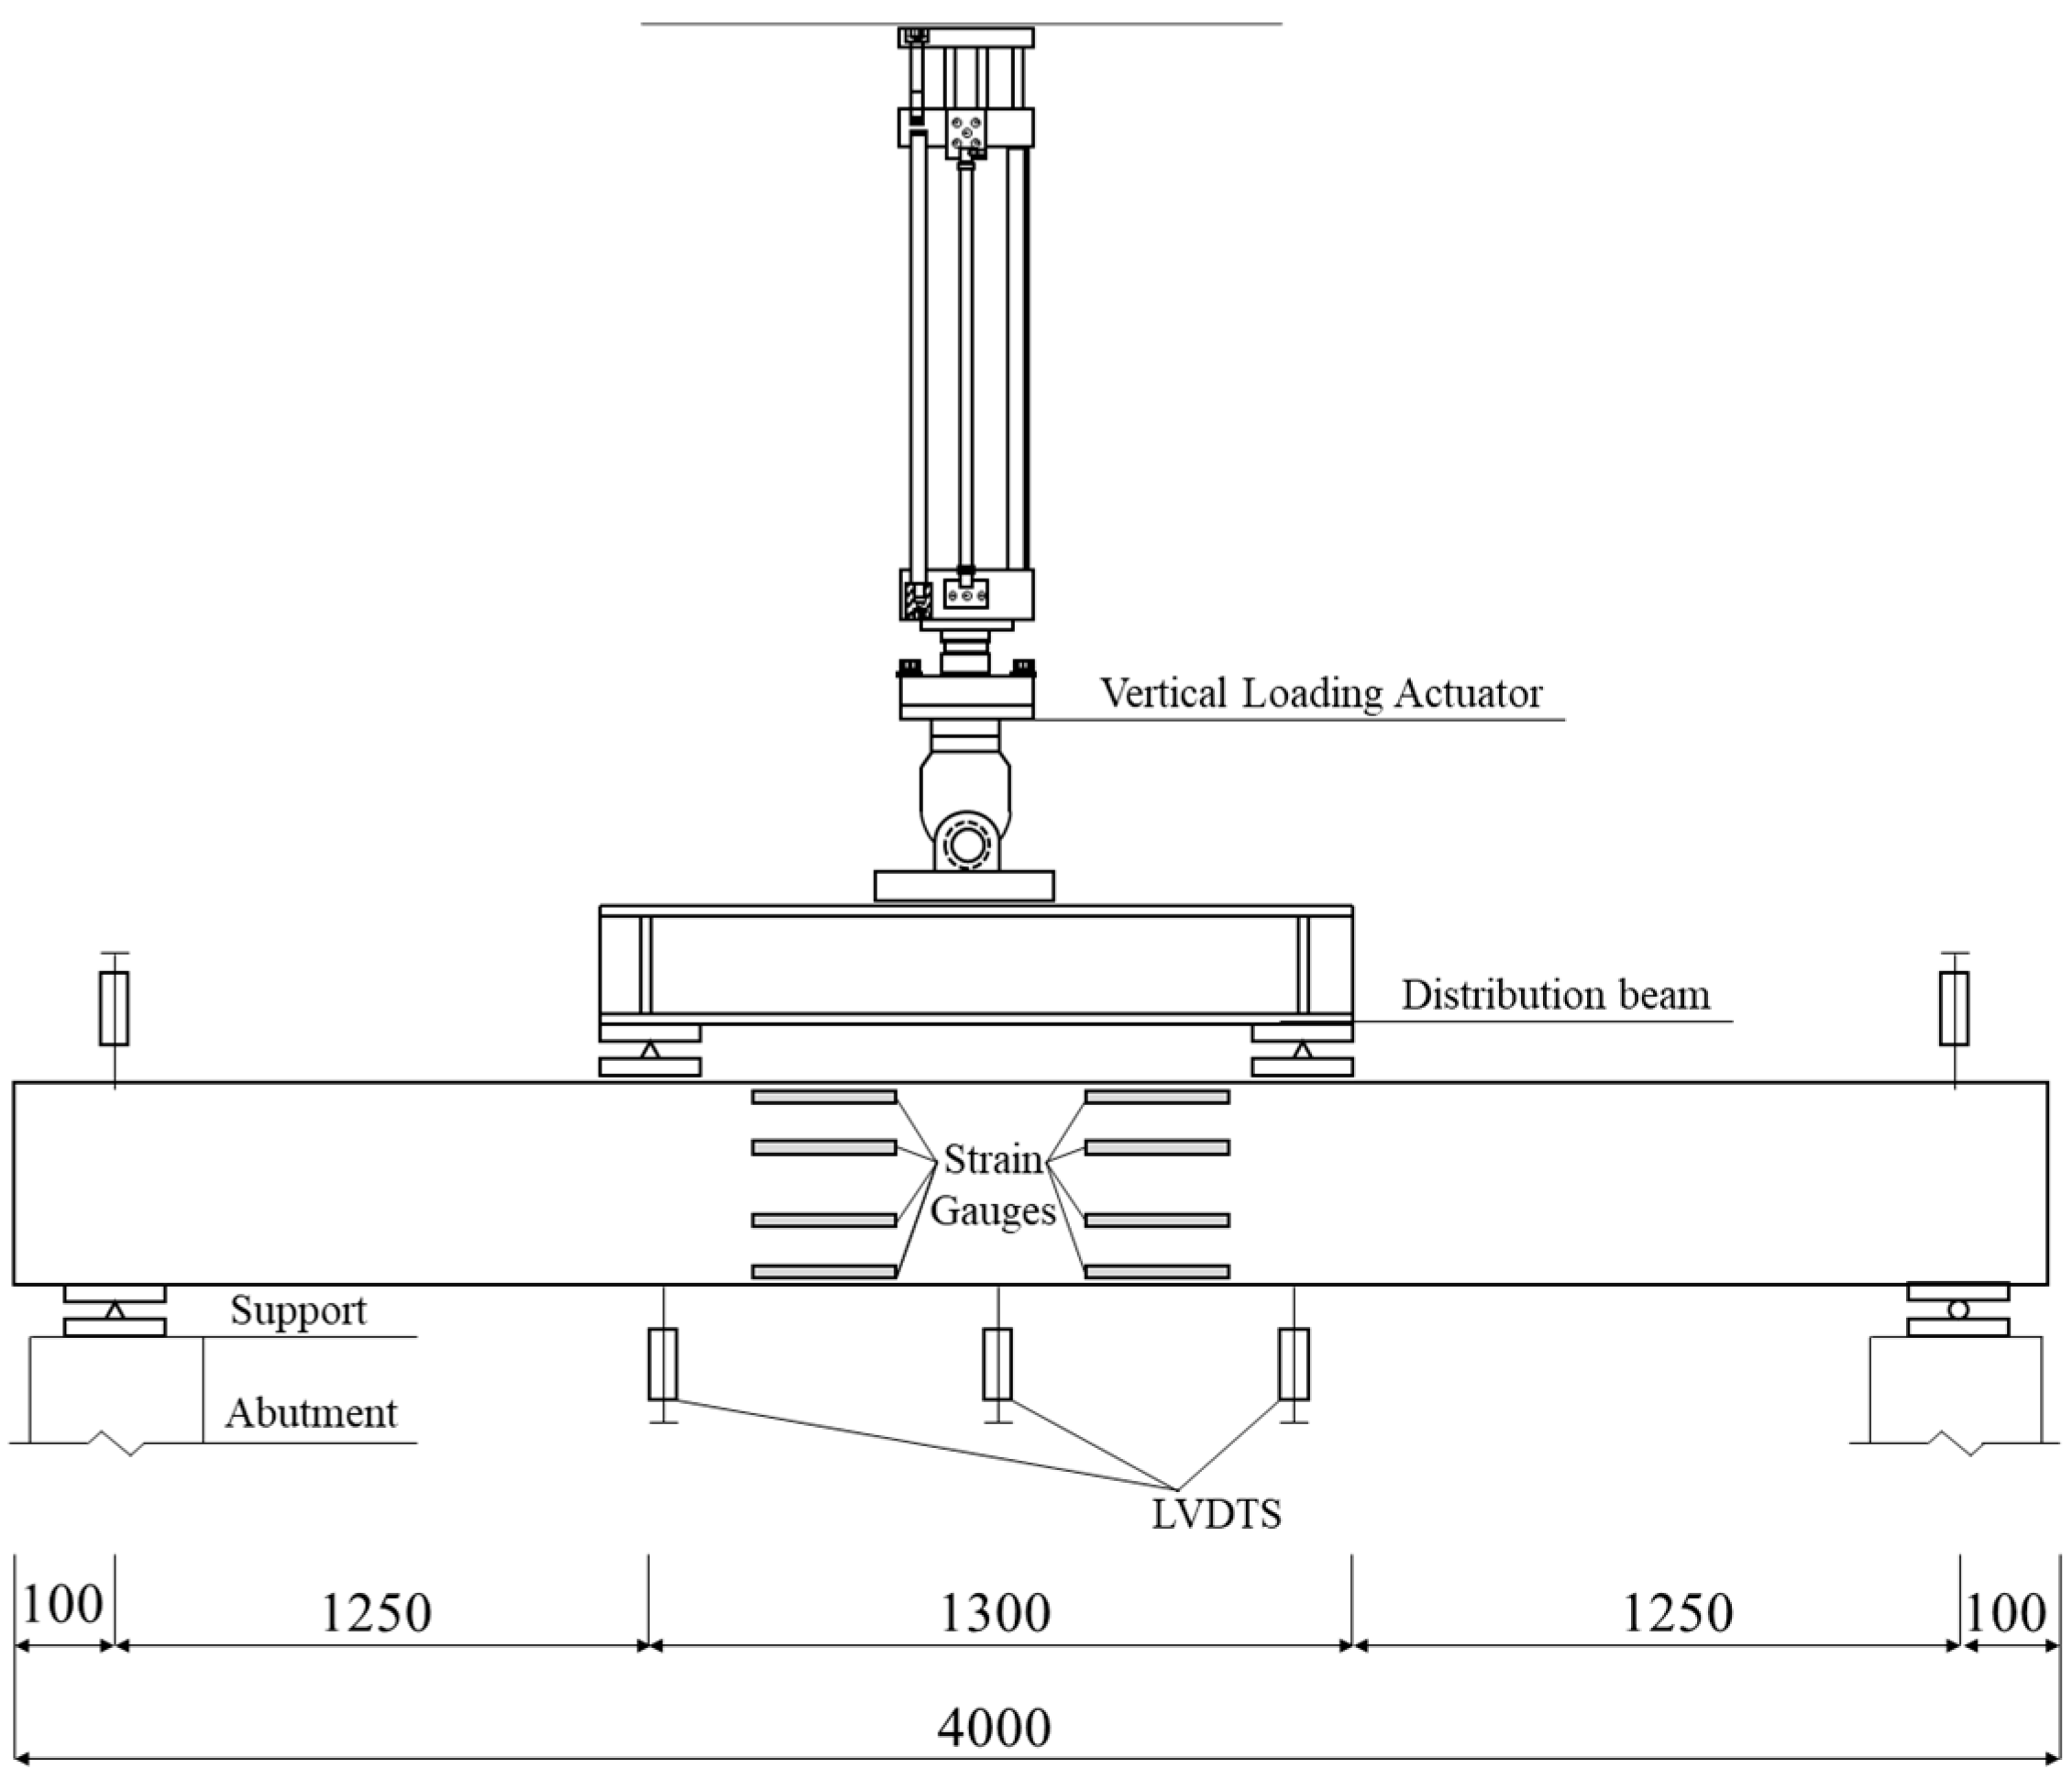
To verify whether SRC beams satisfy plane section assumptions or not, eight electrical resistance strain gauges were installed in the surface at 100 mm from the middle line symmetrically, which indicate concrete cracking primarily, as shown in Figure 3c. In addition, the other side is set up with eight linear variable displacement transducers (LVDT) symmetrically to record displacement data, facilitating the analysis of beam deflection post-cracking, as show in Figure 3d. Two additional LVDTs were mounted on the upper surface near the supports to monitor support deformation, and three on the beam’s underside to measure vertical displacement at mid-span.

2.3. Testing Procedure

All specimens underwent four-point bending tests in a controlled laboratory setting, which was defined in [17], following the configuration depicted in Figure 4. A vertical loading actuator (VLA) with a capacity of 500 kN was utilized to precisely control the loading level.
In order to ensure that the device was normal, before the formal loading of the experiment, the first two levels of loading were carried out first, while observing the loading status as well as acquisition of data. The experiments were divided into three parts according to [26]. In the cracking period, the loading step was at a rate of 7 kN within two minutes until reaching 28 kN. Then, the loading step was reduced to 3 kN within two minutes to observe the development of cracks sufficiently. Once cracks exceed 0.05 mm, the load rate was increased to 20 kN in two minutes until approaching failure. Afterwards, the loading step was switched to displacement-controlled loading at 0.7 mm per minute until the specimen reached failure criteria. Throughout the testing, data on displacement, strain, crack width, and crack patterns were meticulously recorded after each loading increment to facilitate comprehensive analysis.

3. Experimental Test

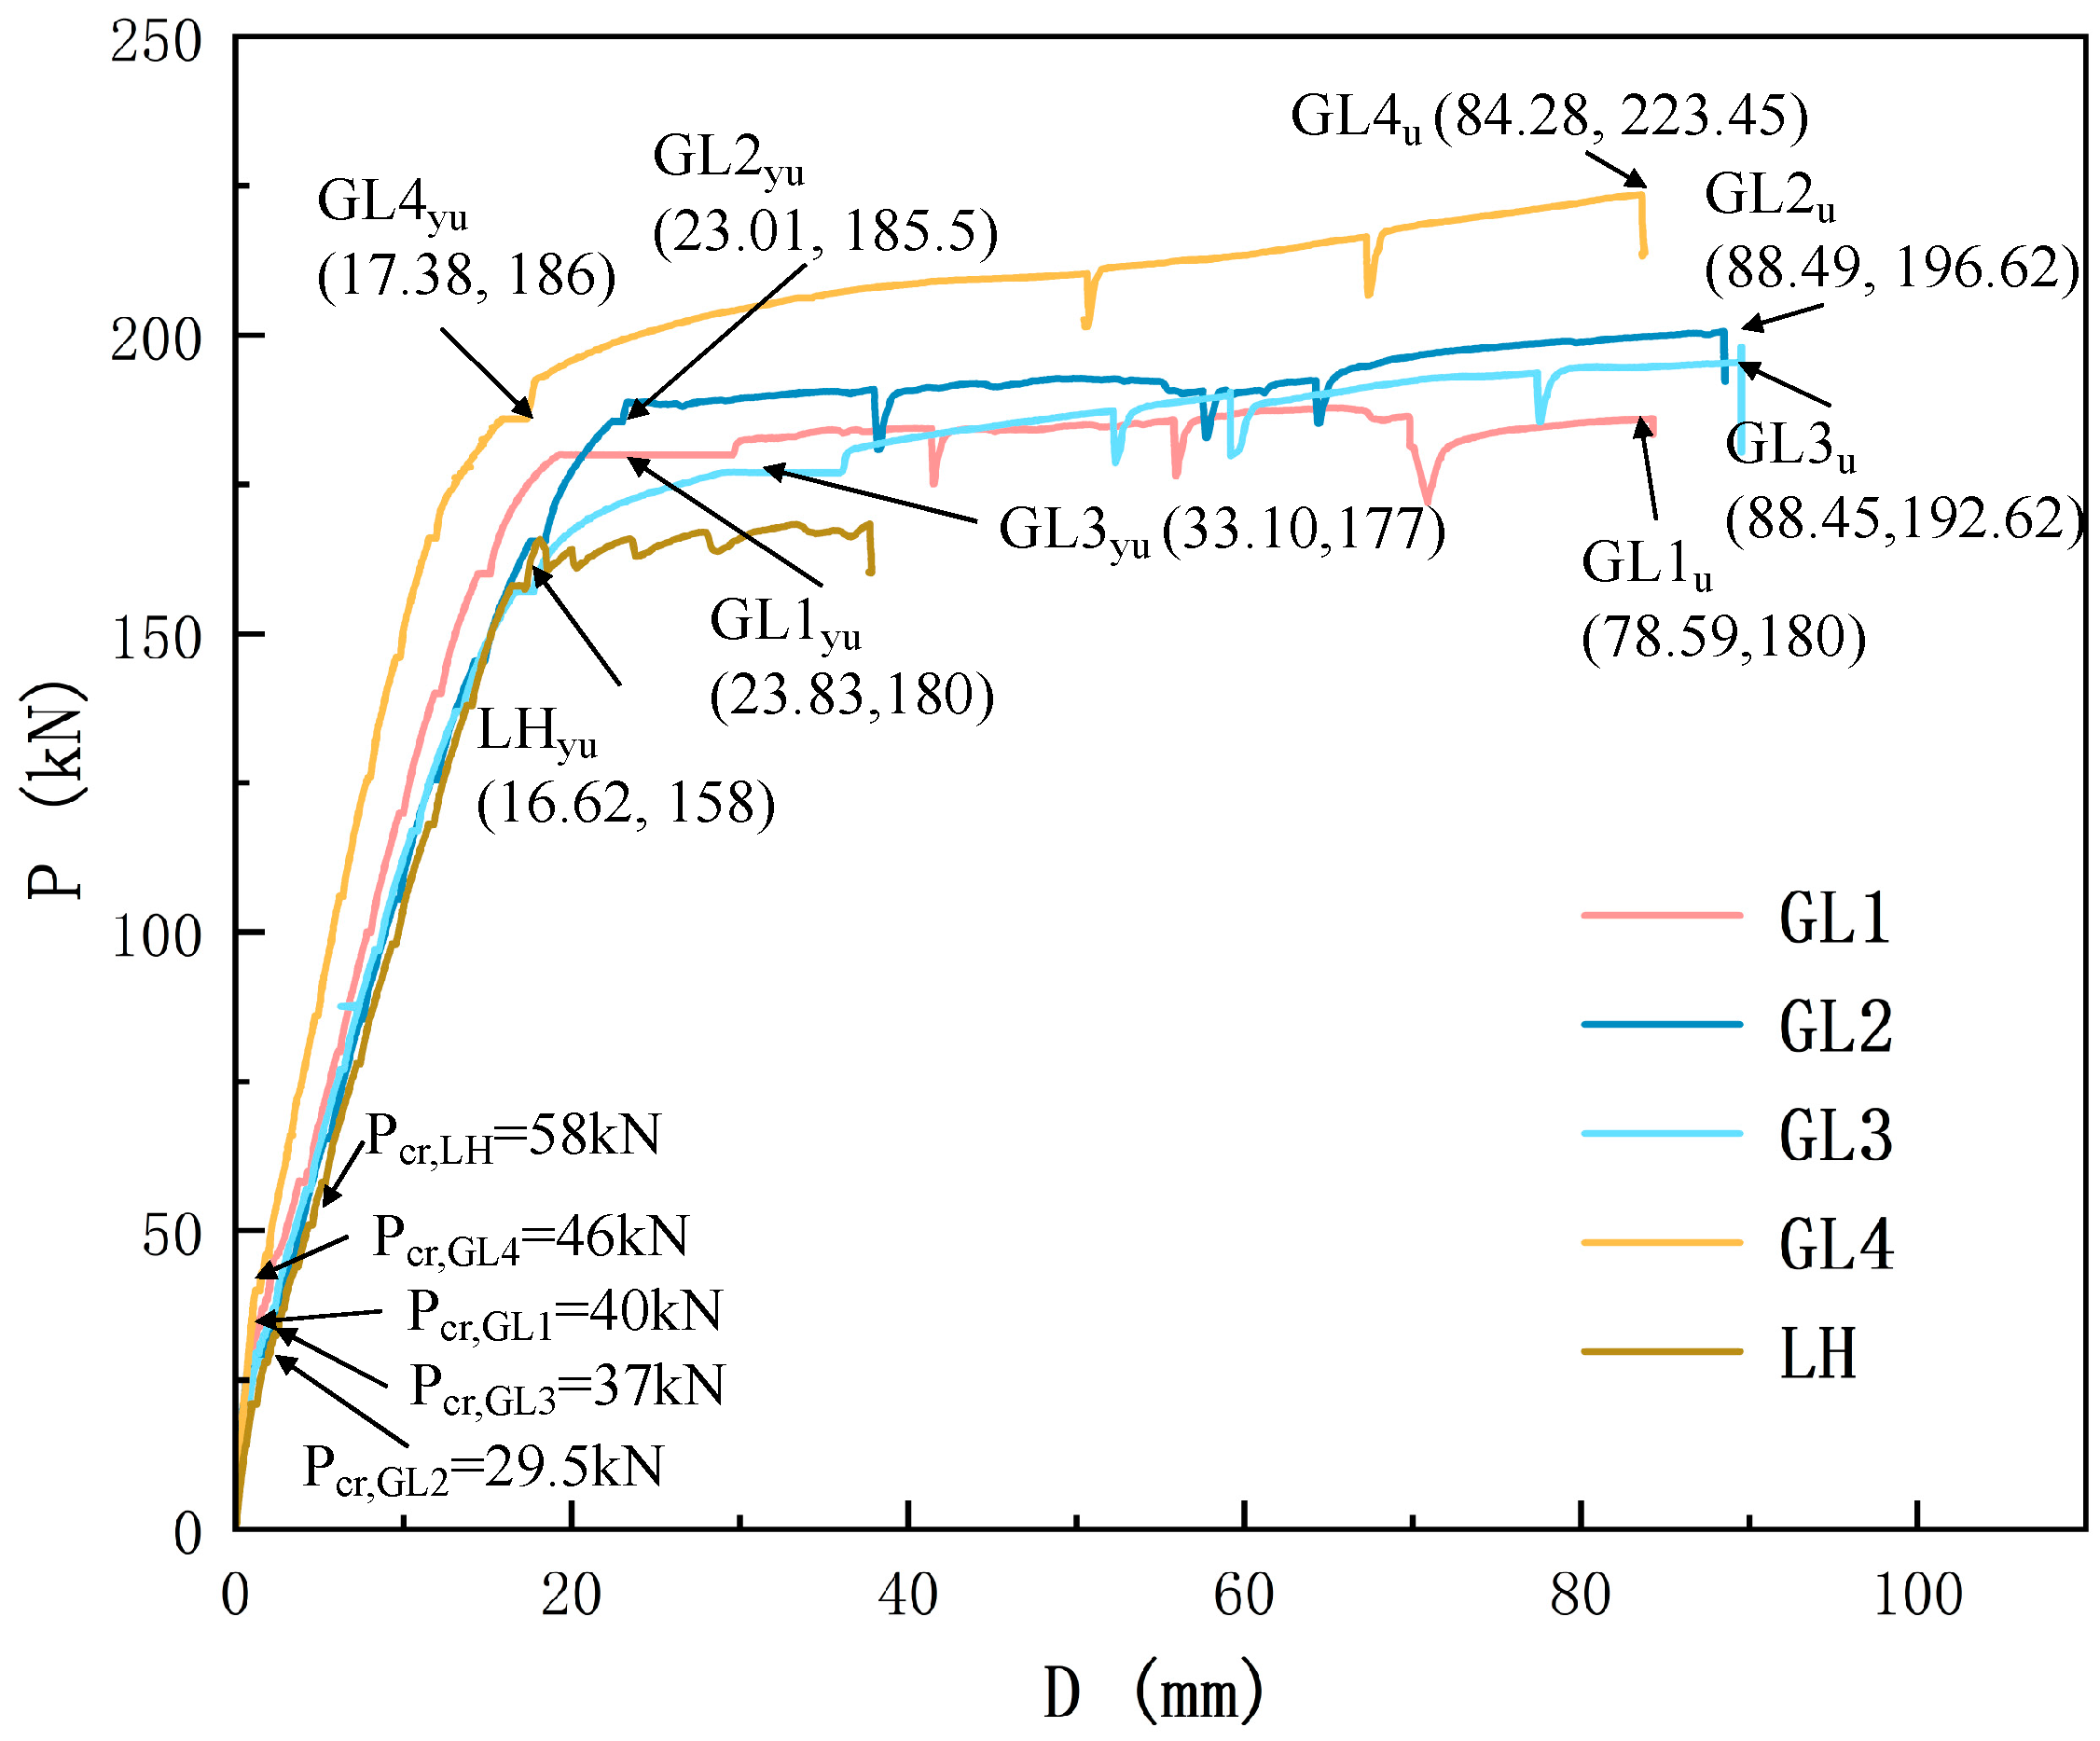
Table 4 presents the results of the experimental tests, detailing the key performance indicators of the beams under investigation, where Pcr denotes the load when the maximum crack width reaches 0.05 mm. Pyu and Dyu denote the load and deflection at the yielding of the member. Pu and Du denote the load and mid-span deflection, respectively, at which the member reaches the termination condition of the test. k1 denotes the initial stiffness of the member, which is expressed as the slope of the initial linear portion of the load–deflection curve prior to the occurrence of cracking. The index of ductility of components is denoted by Du/Dy.

3.1. Crack Pattern and Failure Modes

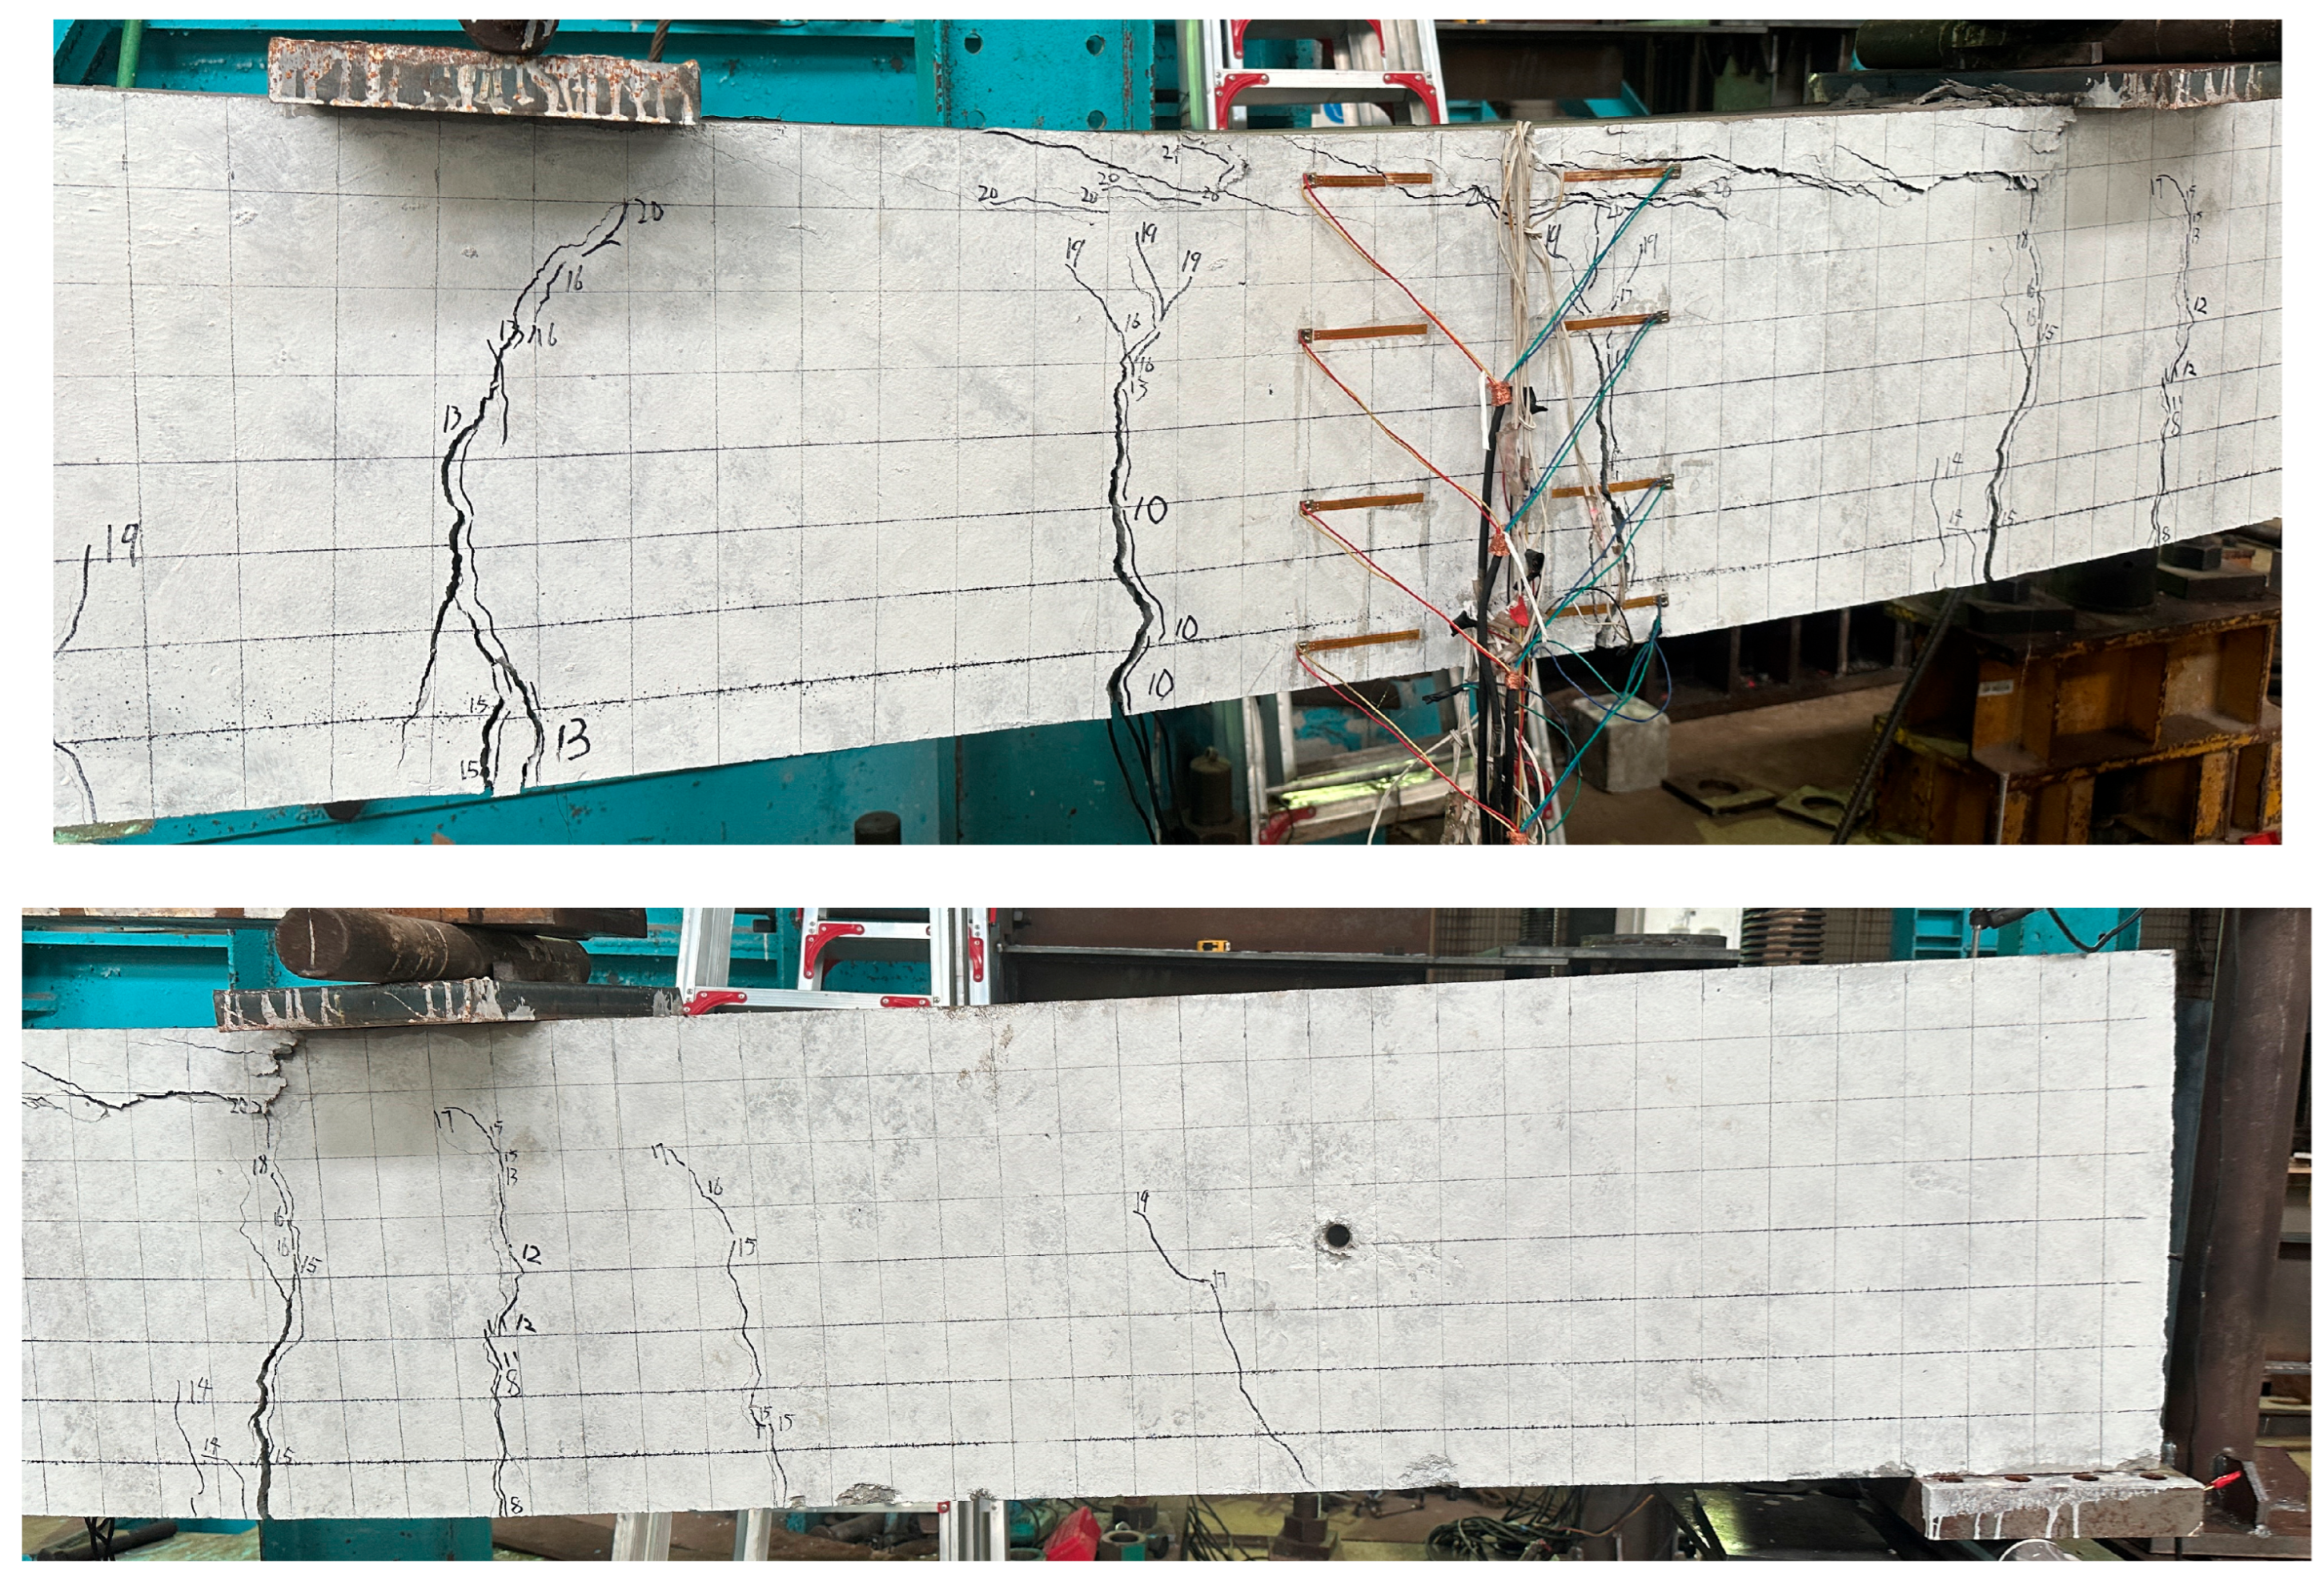
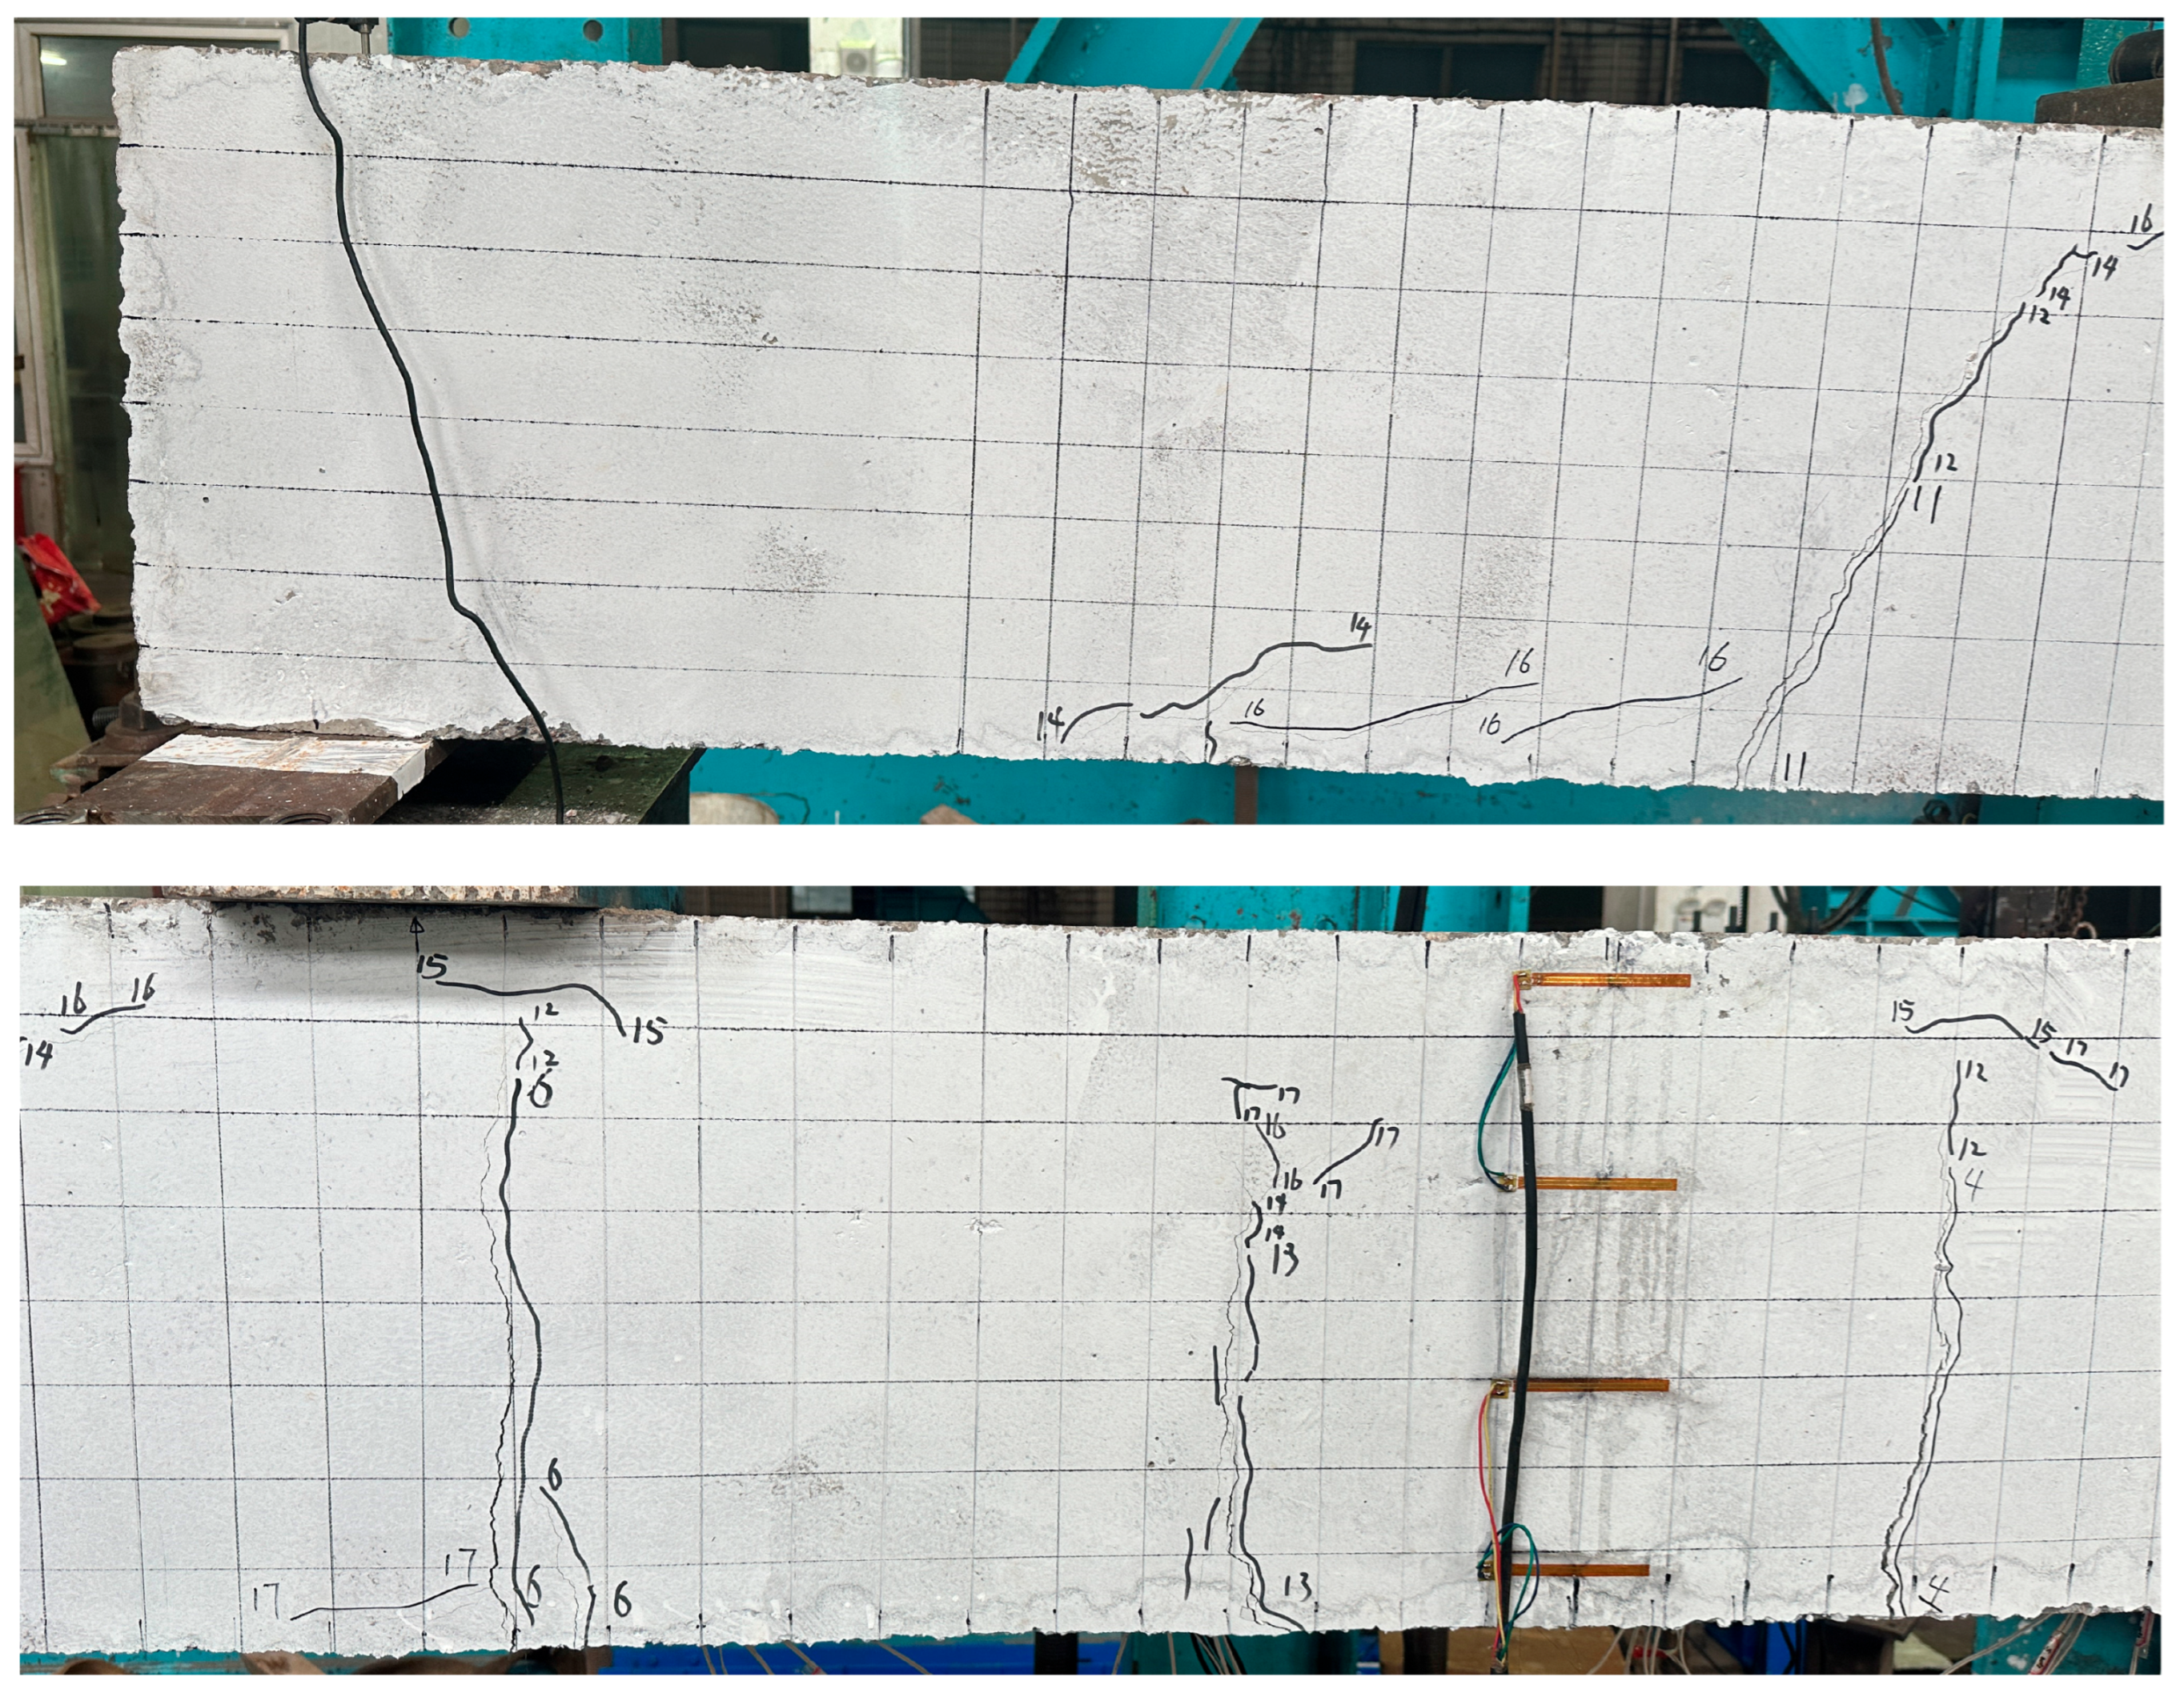
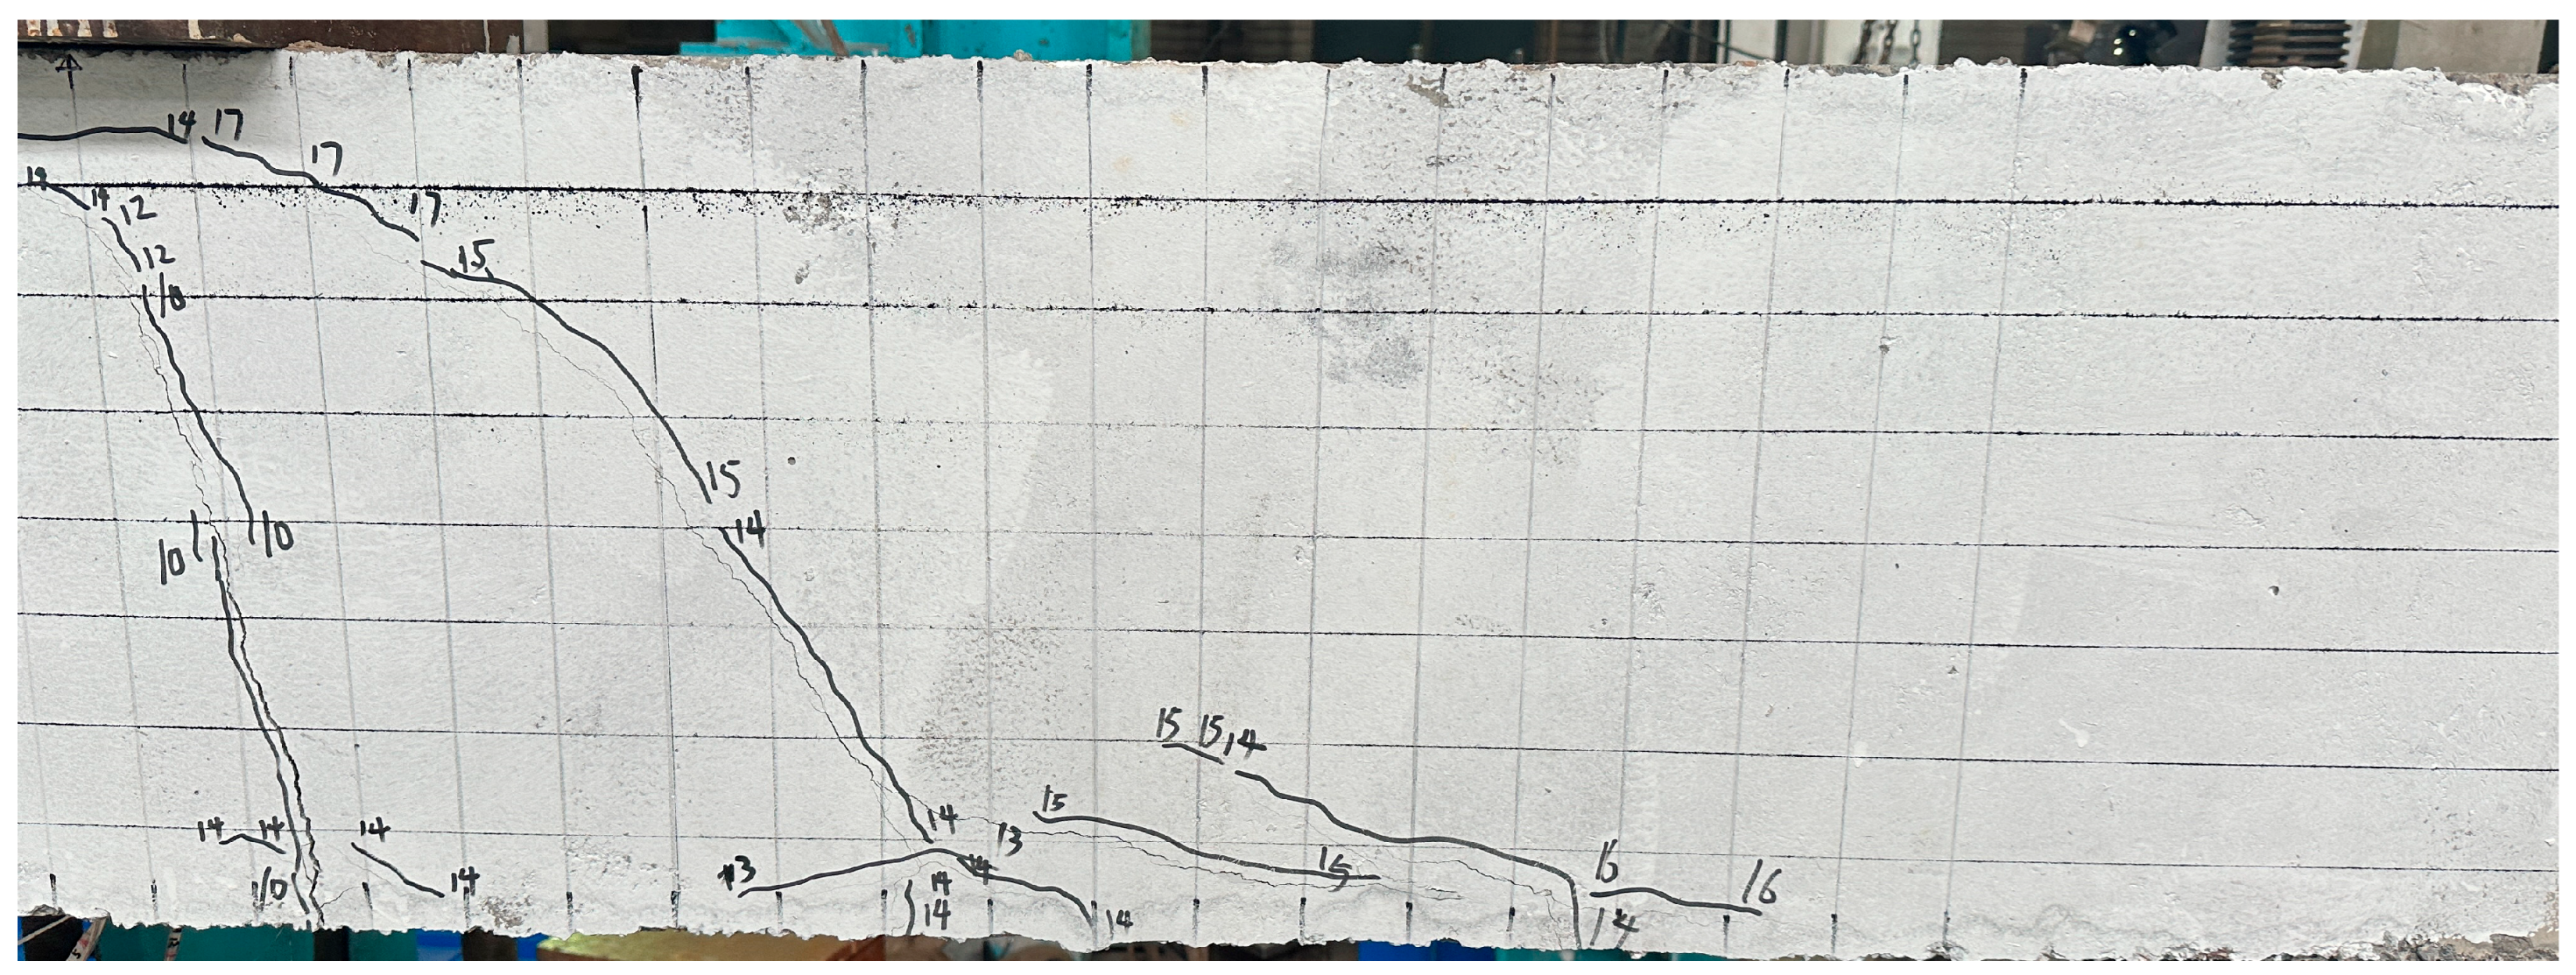
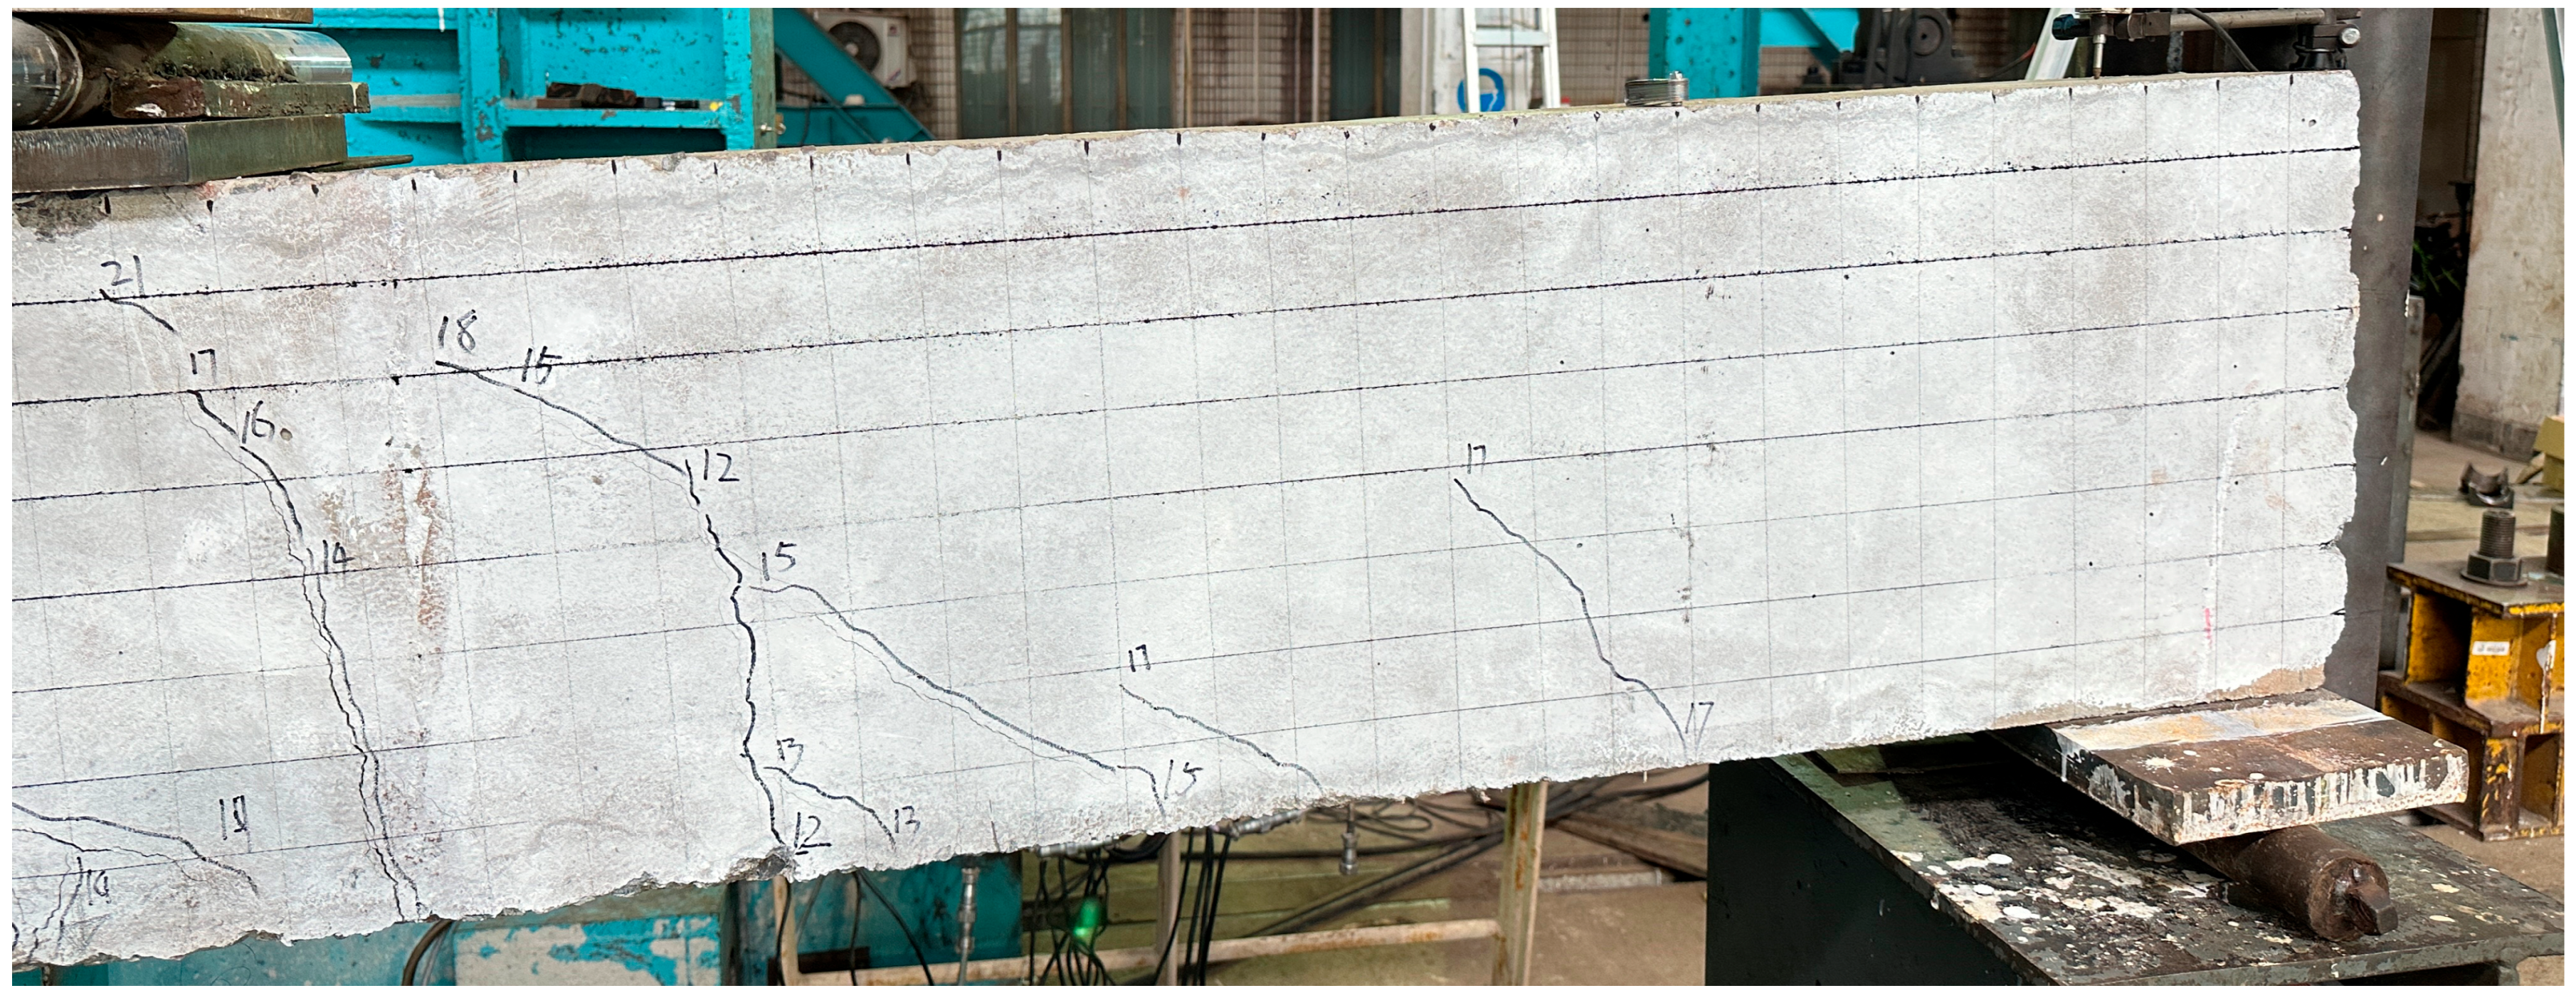
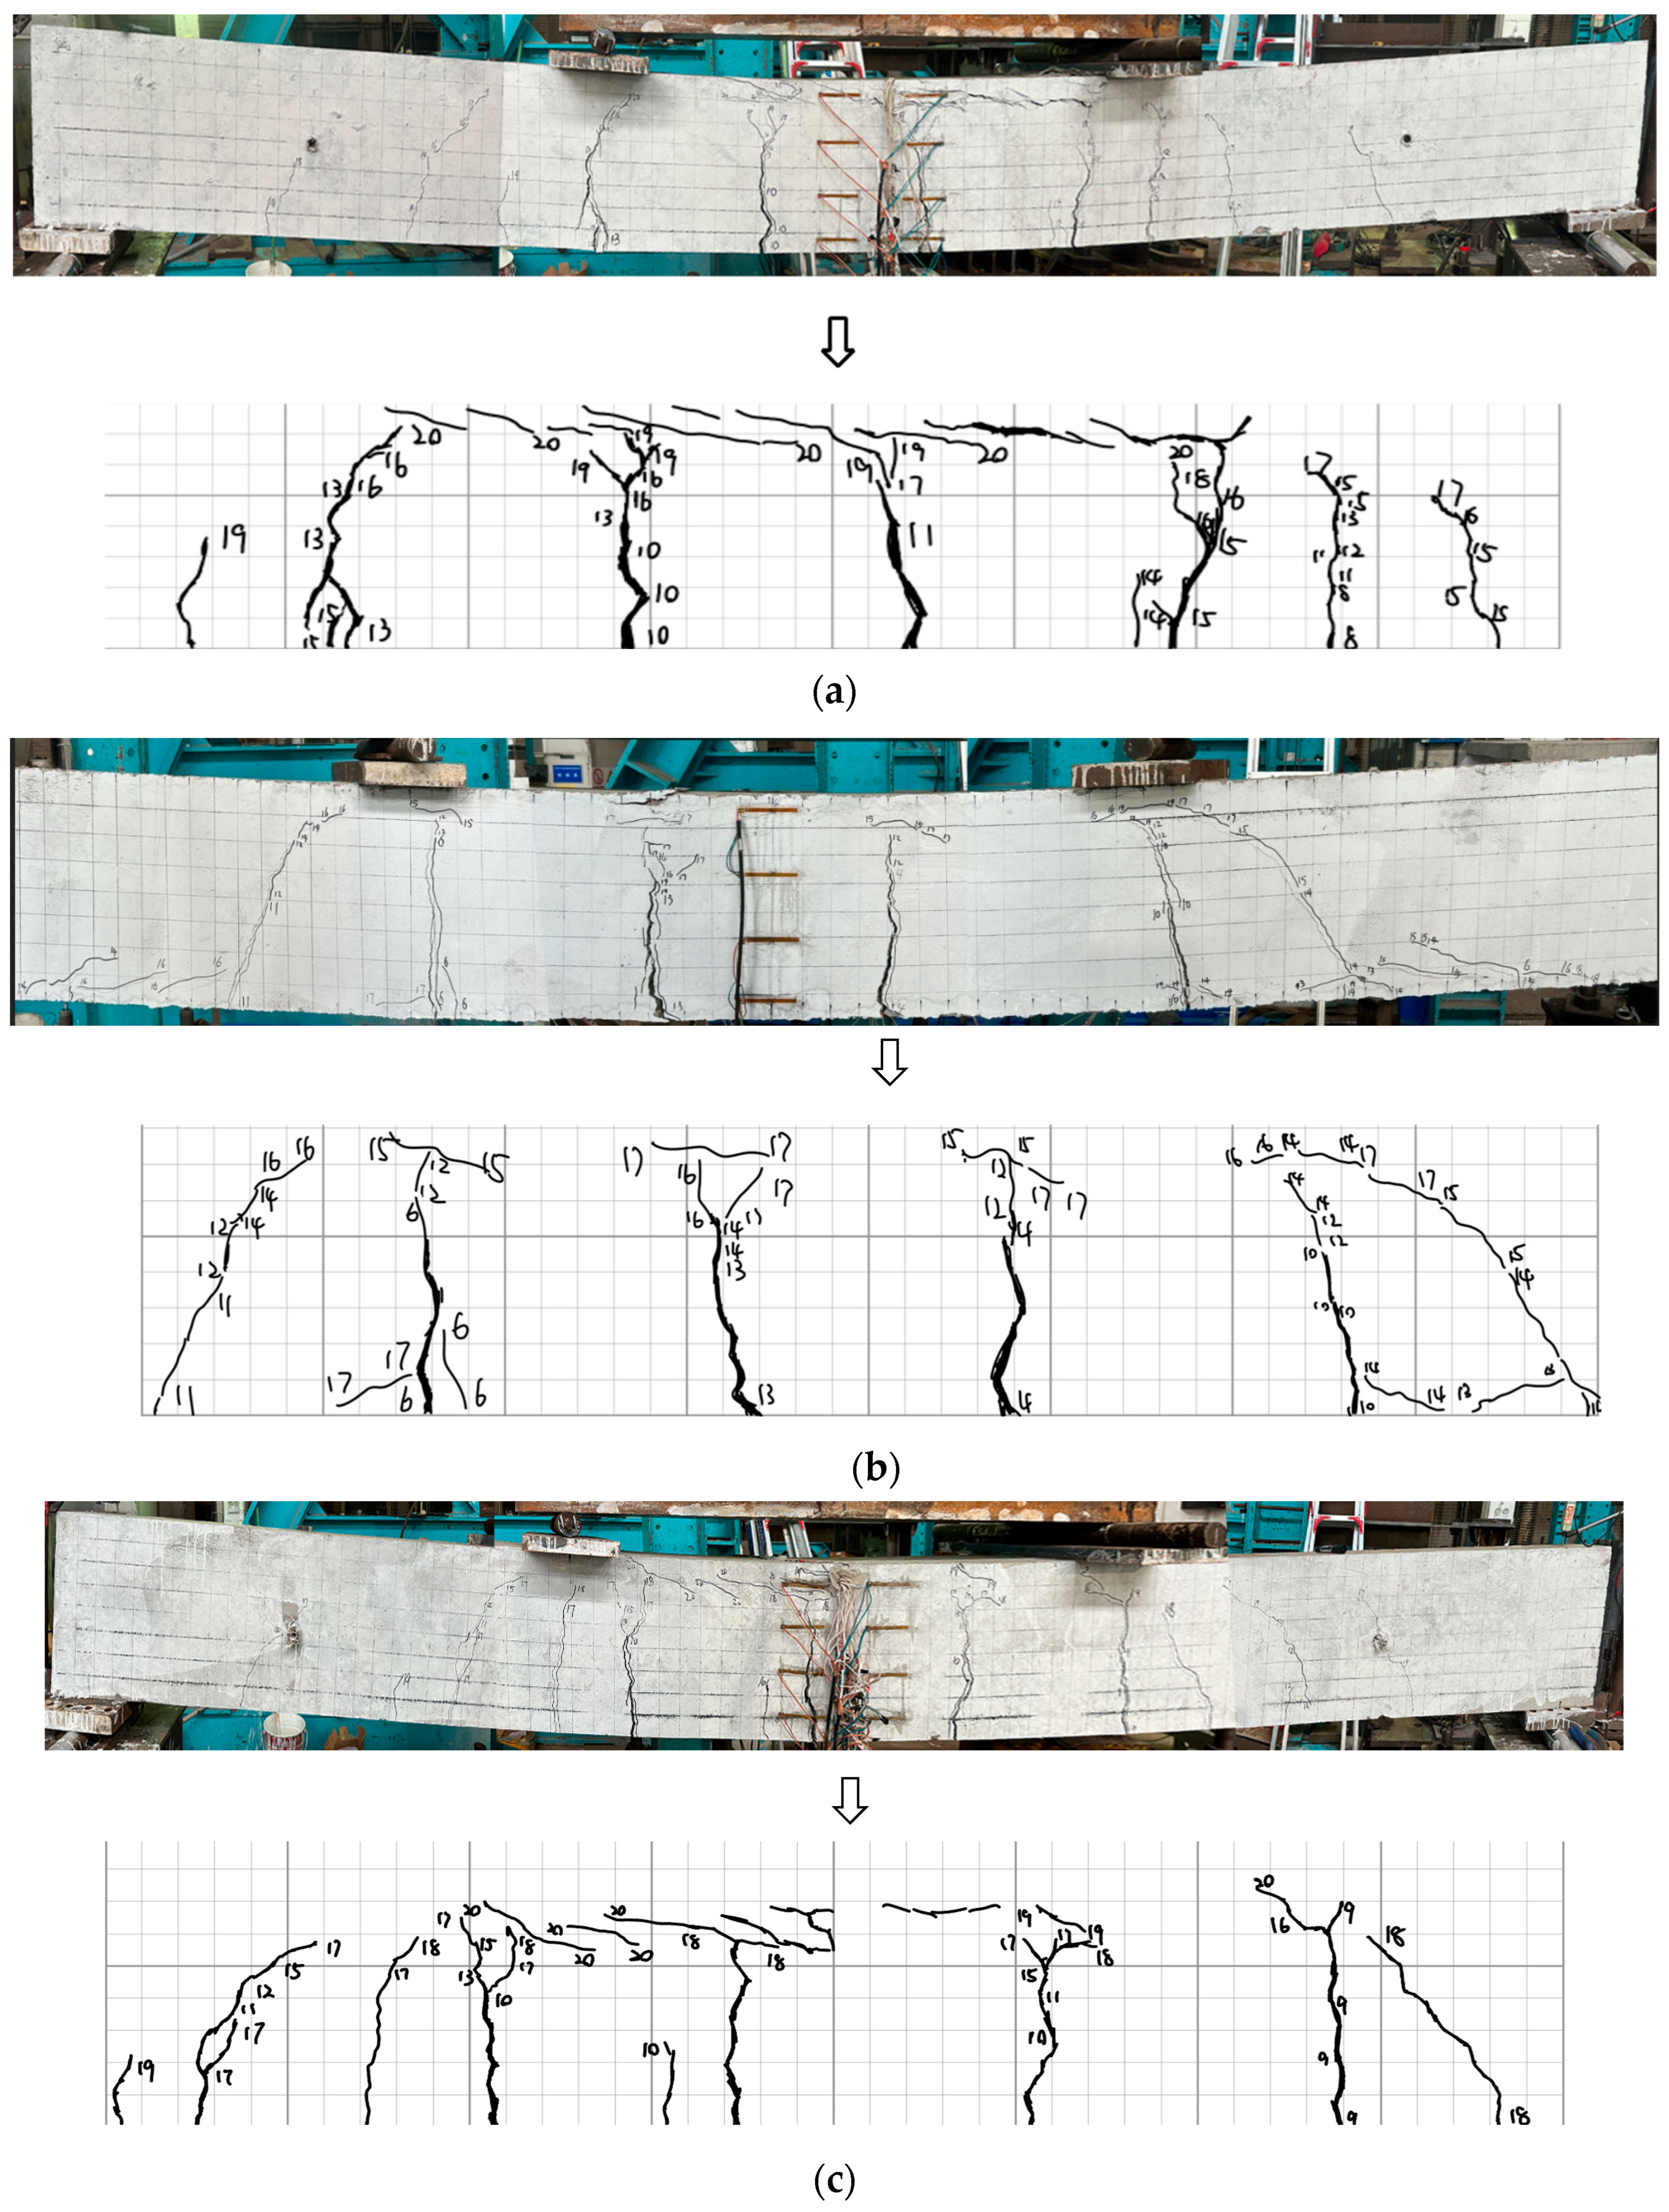
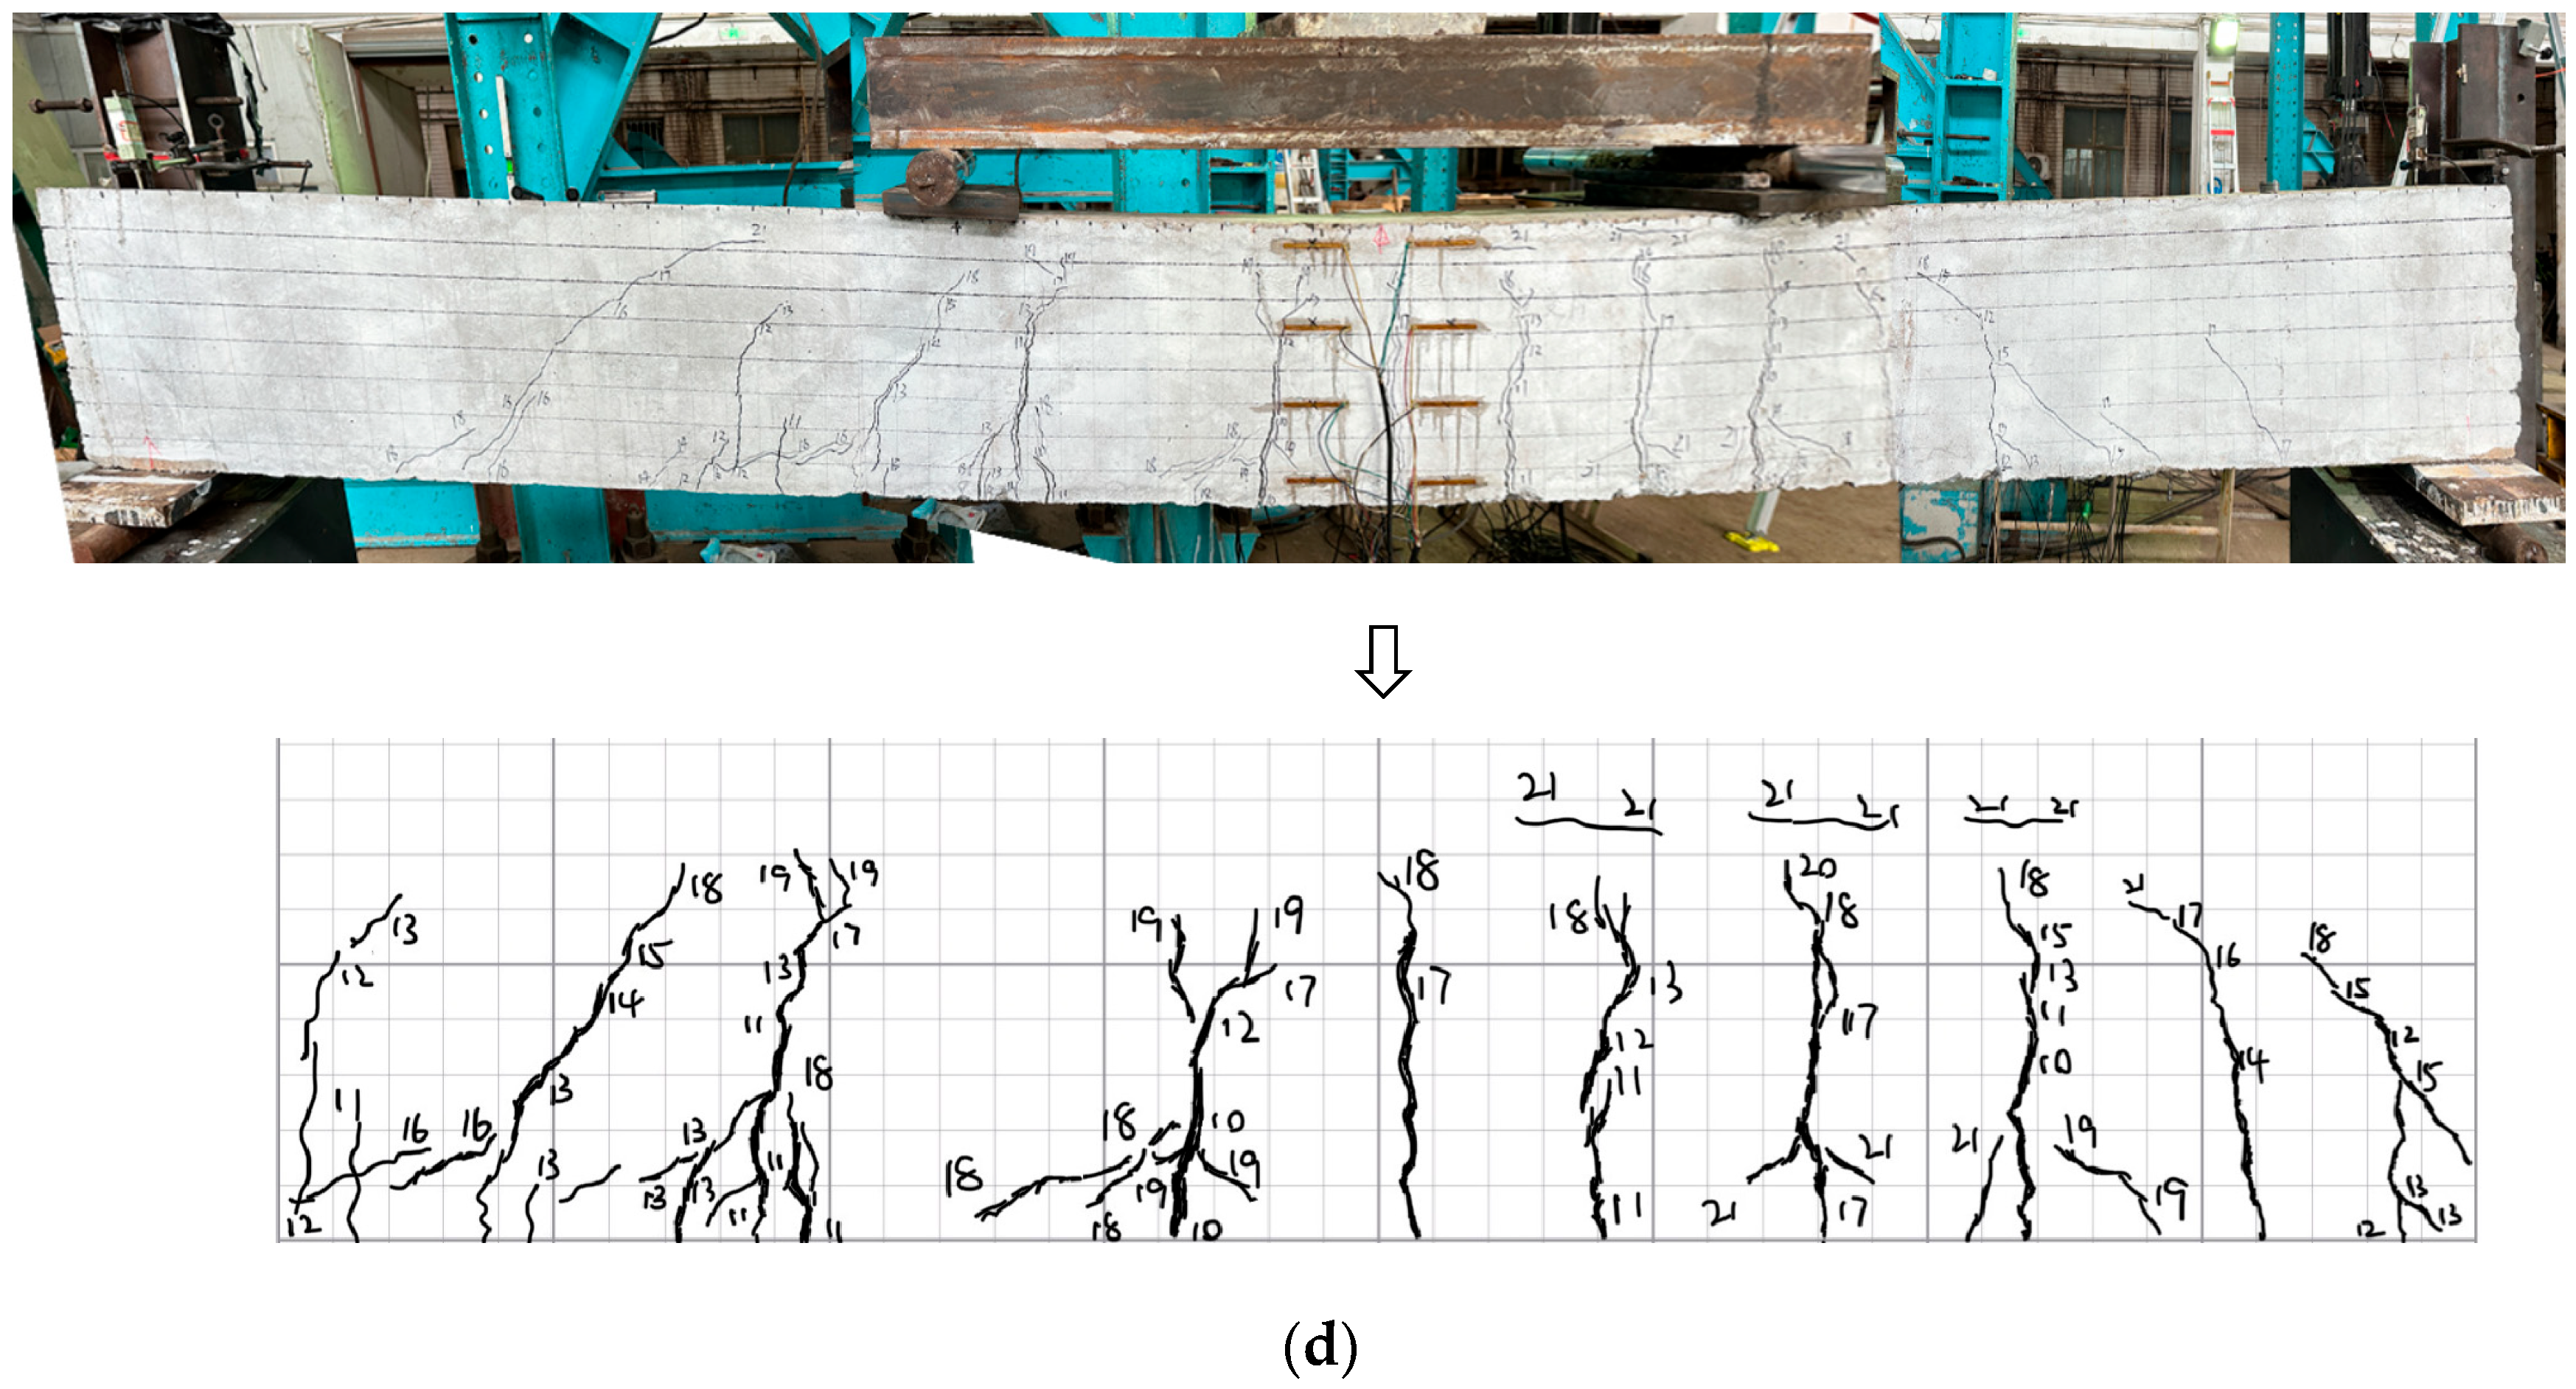
The damage patterns of all test specimens are depicted in Figure 5. Given that the component is only affected by bending moments in the area between the two supports of the distribution beam, its cracking characteristics primarily develop vertically along the height of the beam. This section is henceforth referred to as the pure bending section. Given its position between the support of the distribution beam and the bearing on its side, the component is subject to bending moments and shear forces. The fissures initially manifest vertically and subsequently extend diagonally. This area is henceforth referred to as the diagonal shear section. Initial cracks typically appeared near the supports in the pure bending region, starting as microcracks (less than 0.02 mm) at approximately one-quarter of the web height, as shown in Figure 6a. As the load increased, these microcracks expanded, and new cracks developed along the span’s pure bending section. Vertical tensile cracks emerged in the bending–shear regions, progressing into diagonal shear cracks. Upon yielding, the cracks in the pure bending section widened rapidly, eventually leading to concrete damage in the top compression zone, as illustrated in Figure 6b [20,23]. Throughout the tests, damage was primarily attributed to excessive deflection, highlighting the beams’ notable ductility [22].
As shown in Figure 5, The first cracking loads for all test specimens ranged from 29 to 46 kN, representing approximately 15% to 21.3% of the ultimate load capacity. Doubling the splice bar spacing resulted in a 35% reduction in cracking load, likely due to the decreased bond surface area between concrete and steel, leading to higher interface stresses and earlier cracking. Conversely, incorporating ribs increased the cracking load by about 15%. Other construction modifications had a minimal impact on the cracking load.
As shown in Figure 5, the crack development and damage patterns were largely consistent across specimens, with rapid crack propagation in the pure bending sections as failure approached. Ribbed designs generally improved damage resistance, possibly due to the increased steel stiffness. Enhancing the bond between steel and concrete, by such methods as reducing splice spacing, improved beam properties. Due to the length of the test specimens, the data acquisition equipment was incapable of collecting all the data simultaneously. The corresponding high-definition images can be found in Appendix A.

3.2. Load–Displacement Curve

Figure 7 illustrates the mid-span load–displacement curves for each specimen. Before yielding, the deformation behavior of the test beams closely matched that of the control beam, indicating a similar initial stiffness. Post-yielding, the beams remained within the strengthened section, benefiting from the steel’s excellent deformation capacity [20]. Compared to the control beam (LH), the test beams exhibited a 13.4% to 28.5% increase in load-carrying capacity and demonstrated enhanced ductility.

3.3. Strain Development

3.3.1. Steel Strain Behavior

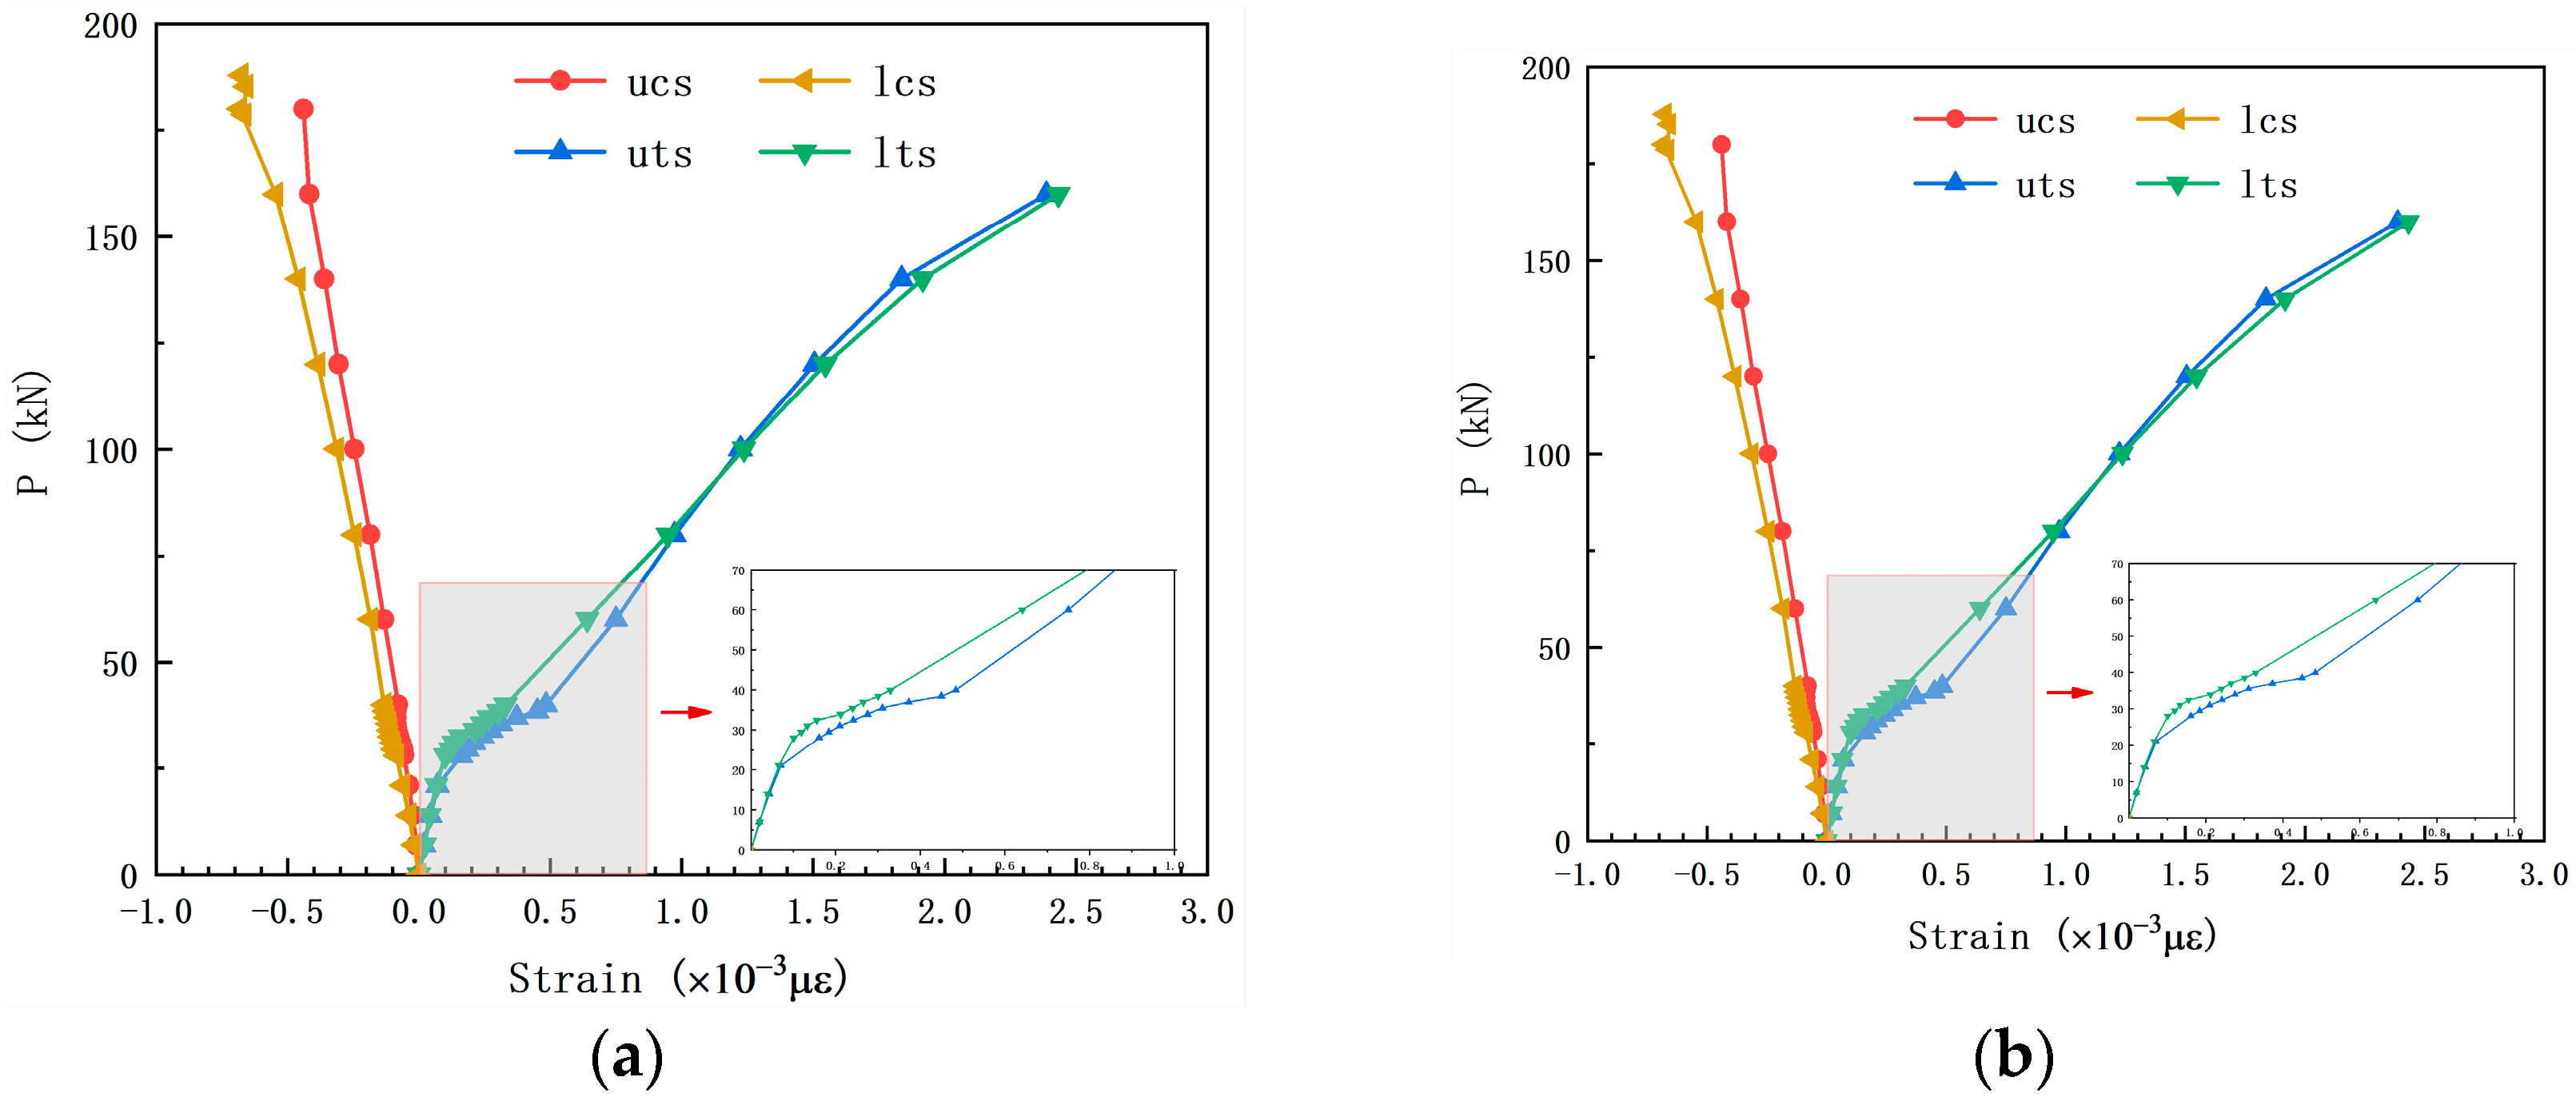
The strain curves of the steel plates at splice sections within the pure bending region are presented in Figure 8a, where ucs and lcs indicate the upper and lower surface strain of compressive steel, respectively; uts and lts indicate the upper and lower surface strain of tensile steel, respectively. Notably, tensile regions experienced significant strain changes near the cracking load, indicative of bilinear load–deflection behavior [23]. In contrast, strains in the spandrel regions remained relatively stable, likely due to the concrete’s energy release post-cracking, which subjected the steel plates to increased tensile stresses, accelerating strain development. This observation is consistent with the hypothesis that, following the onset of concrete cracking, the tensile stresses in the steel are predominantly influenced by the residual concrete stiffness, which declines as the cracking process progresses. Compression zone strains showed linear growth until failure, with abrupt changes corresponding to concrete damage. Construction variations had minimal impact on steel strain behavior, primarily because steel plates deformed more slowly than reinforcing steel, as shown in Figure 8b.

3.3.2. Concrete Strain Behavior

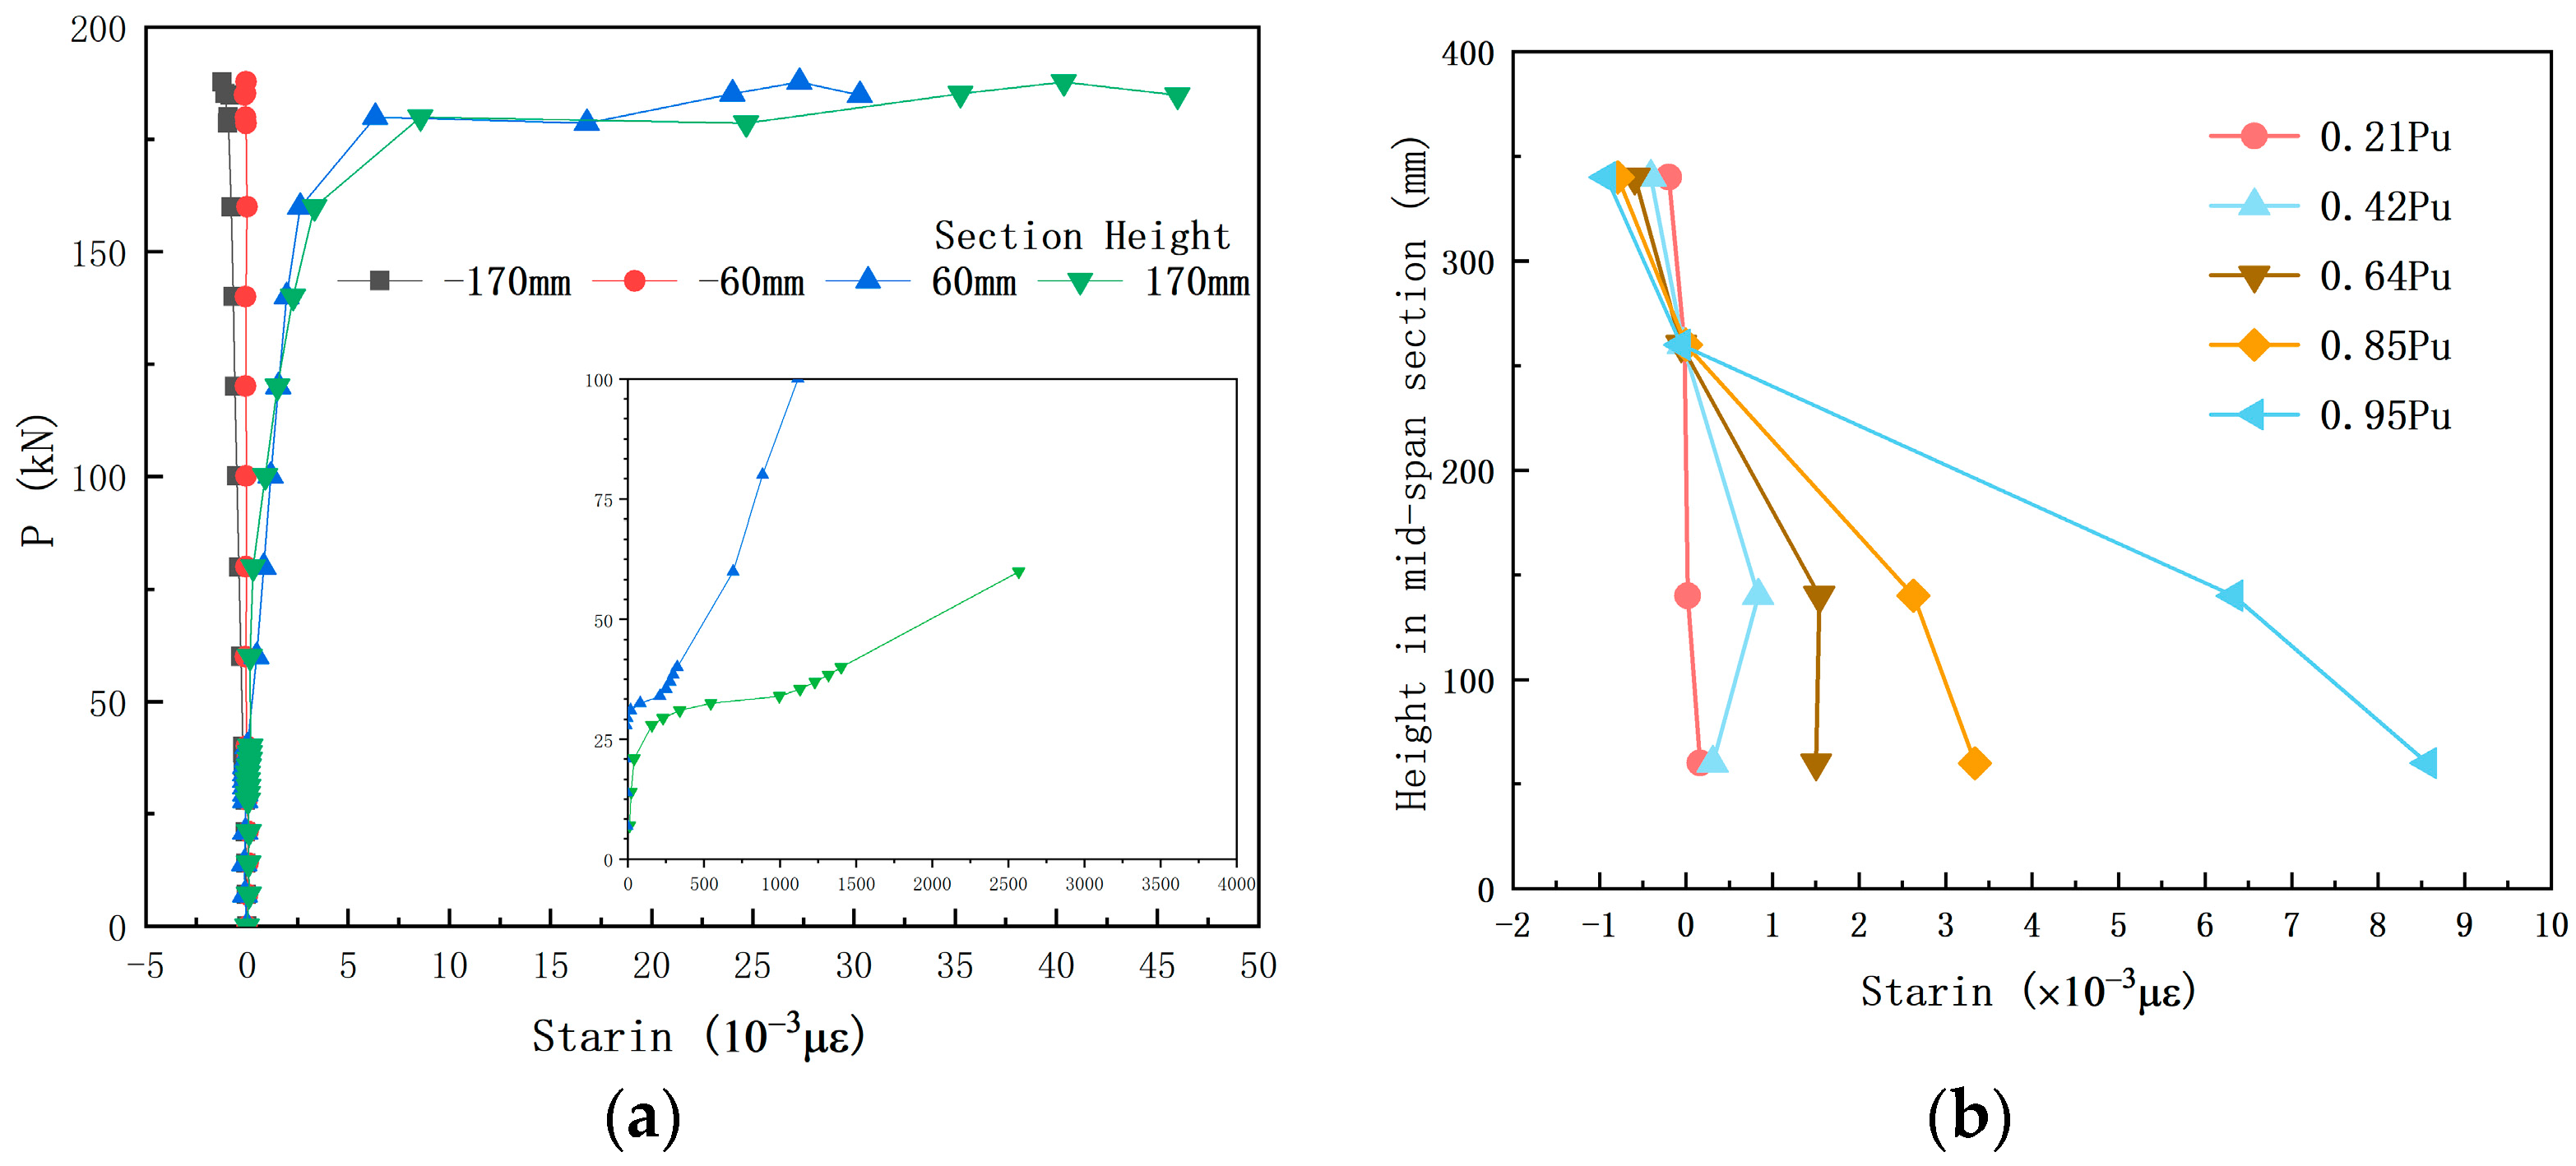
Figure 9a displays the average concrete strain across the span’s pure bending section, with insets showing strains measured in the tension zone. Concrete strains increased notably around a 25 kN load, signifying initial cracking, even before visible cracks exceeded 0.02 mm. Post-cracking, the load–deflection curve exhibited bilinear characteristics, with rapid strain escalation in the tension zone upon yielding, while compression zone strains remained relatively unaffected, increasing linearly until failure, aligned with the predictions of elastic theory, as shown in Figure 9b.
Figure 10a compares the average strains of concrete and steel at corresponding section heights under varying loads, illustrating coordinated deformation. The coordinated strain behavior observed at these sections is consistent with the theoretical assumption of compatible deformation, in which the steel and concrete should deform together under the load. The section cut along the largest crack in the pure bending region, shown in Figure 10b, reveals a tight bond between concrete and steel, confirming the assumption of compatible deformation between the two materials aligned with the predictions of the classical beam theory [13,20,22].
These findings provide valuable insights into the structural behavior of the novel beam design, highlighting the effects of construction modifications on performance and the interplay between material strains under loading.

4. Numerical Analysis

4.1. Model Verification

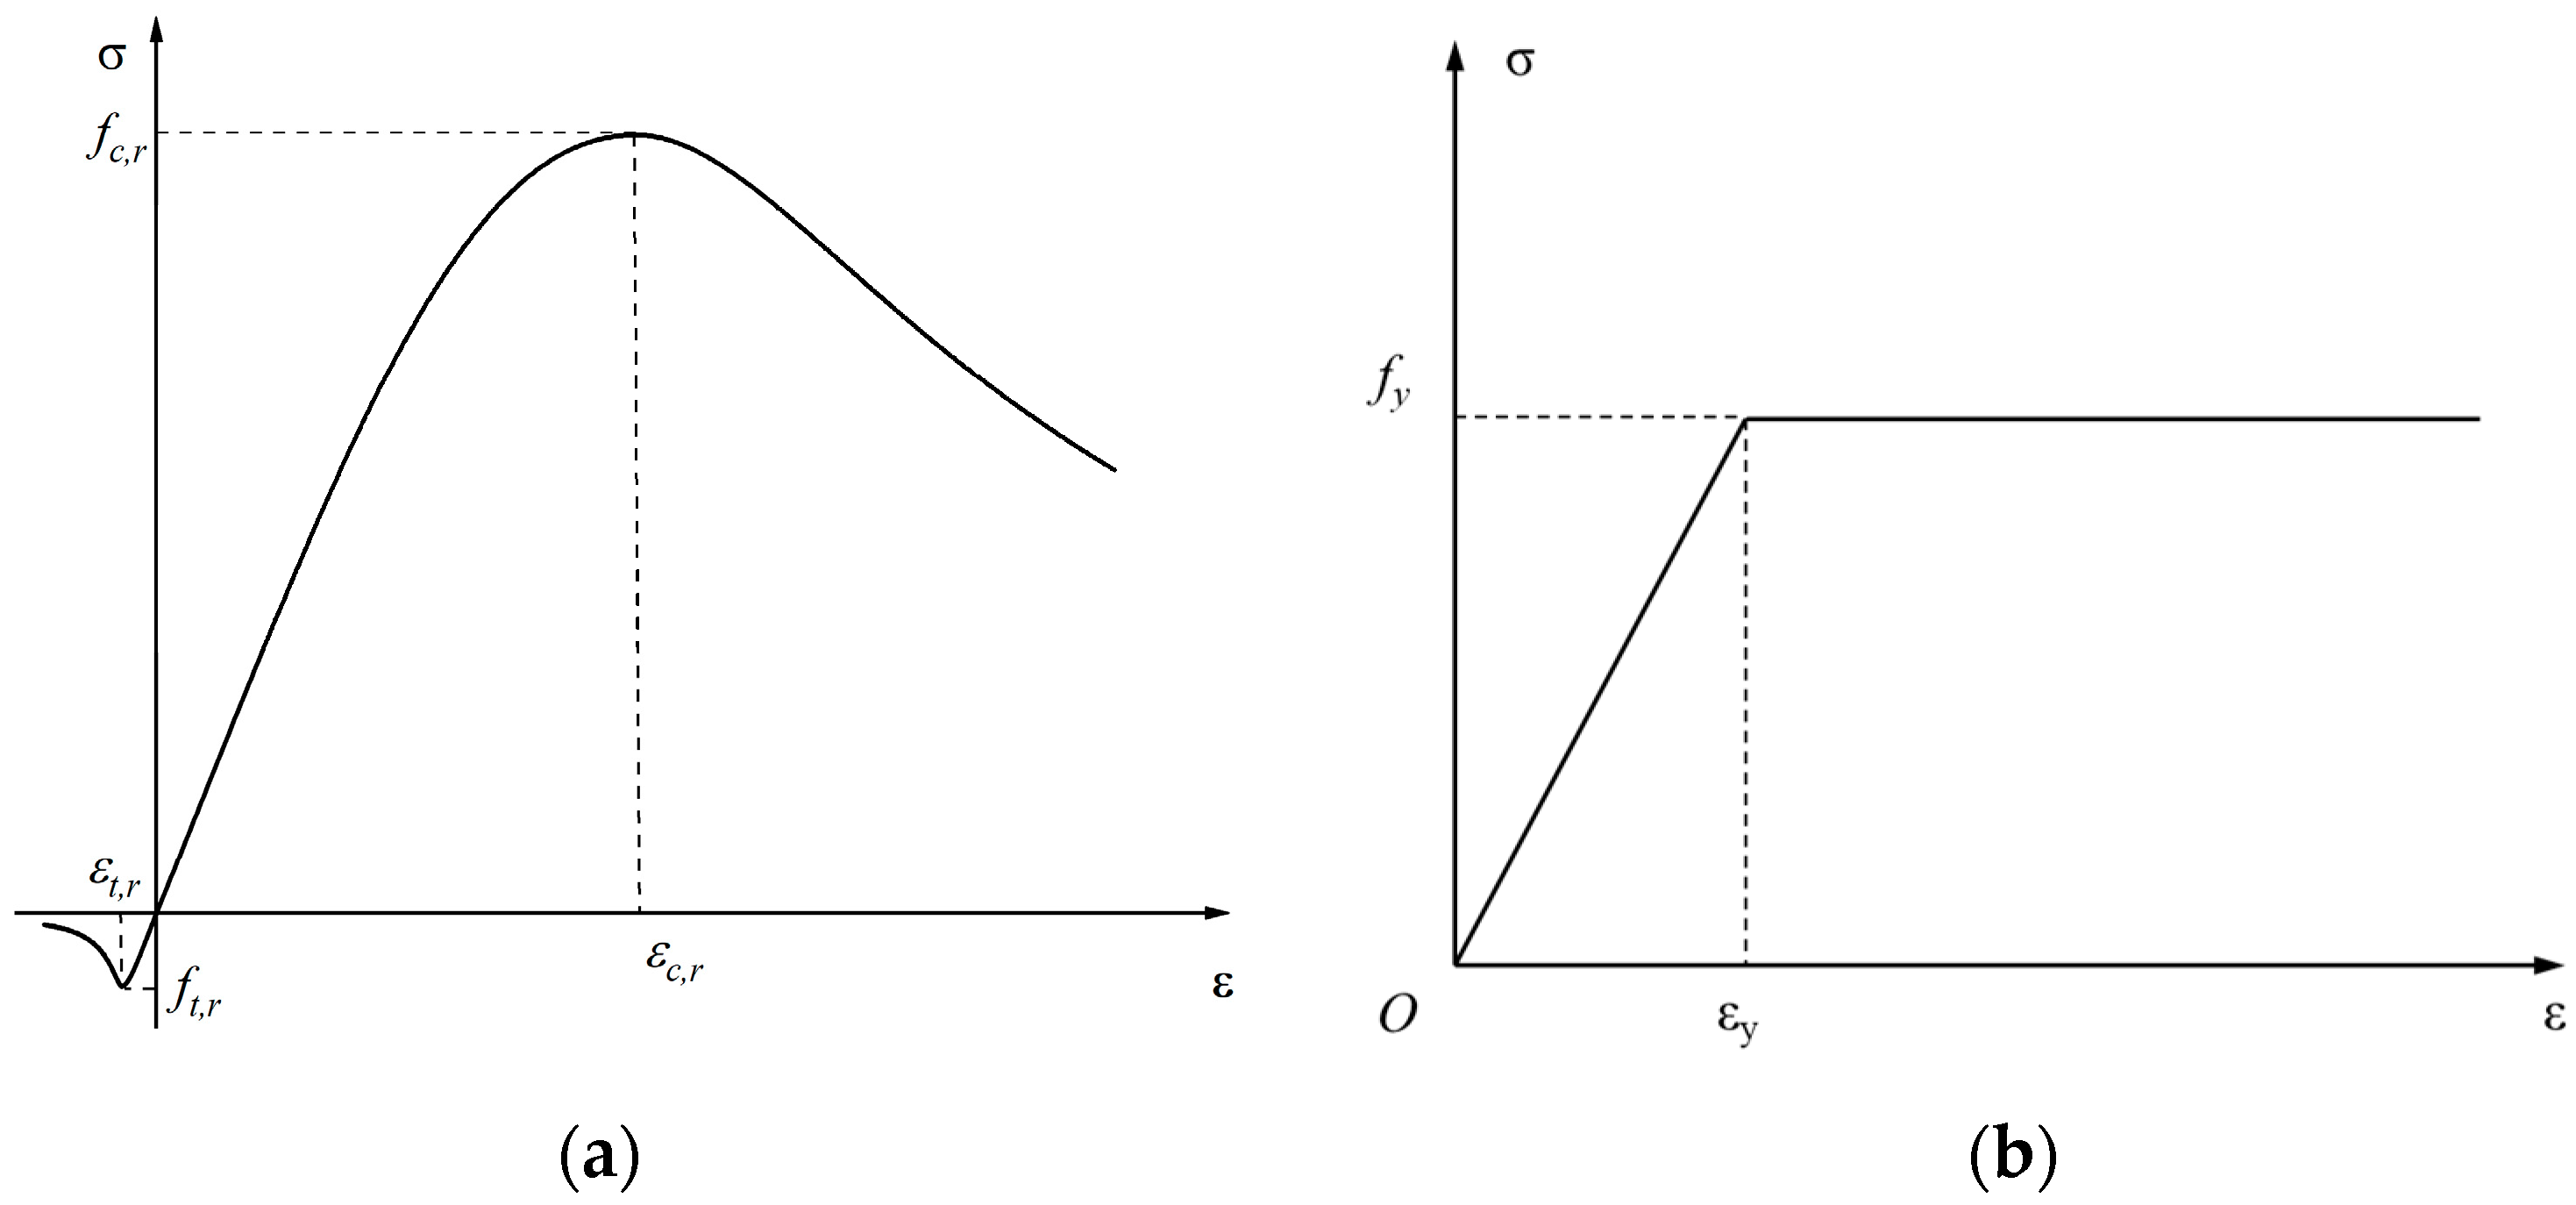
To facilitate the sensitivity analysis of various member parameters, an Abaqus-based script was developed, as Appendix B shows, allowing for systematic variation in key parameters. SRC beams were modeled using C3D8R solid elements. The concrete was assigned four sections, with load application points and bearing points appropriately paired. The two steel flanges formed a cage with paired strips, which were embedded within the concrete. Given the established correlation between mesh quality and analysis accuracy, the mesh parameters employed in this experiment were sourced from the sensitivity analysis of mesh parameters in finite element experiments related to SRC [17]. The mesh sizes were approximately 25 mm for the steel and 50 mm for the concrete. As demonstrated in Figure 10, the concrete and steel exhibit robust bonding, with no discernible separation. Consequently, the interaction between concrete and steel used the embedded method in Abaqus 2022. The concrete damage plastic model (CDP) of concrete in this study is based on the material property test results and [20], as shown in Figure 11a. It can be decided by Equations (1) and (2) as follows:
σ = f c , r ε / ε c , r n 1 + ε / ε c , r n ( ε     ε c , r ) f c , r ε / ε c , r α c ε / ε c , r 1 2 + ε / ε c , r ( ε > ε c , r )
σ = f t , r 1.2 ε / ε t , r 0.2 ε / ε t , r 6 ( ε   ε t , r ) f t , r ε / ε t , r α t ε / ε t , r 1 1.7 + ε / ε t , r ( ε > ε t , r )
where σ denotes the stress of the concrete, ε denotes the strain of the concrete, fc,r and ft,r indicate the axial compressive and tensile strength of the concrete, αc = 3.38 and αt = 1.52 indicate the parameters for the compressive and tensile descending curve, respectively, εc,r = 1684.8 × 10−6 and εt,r = 127.44 × 10⁻⁶ indicate ultimate compressive and tensile strain of the concrete, respectively, and n = 2.85 in this study.
The constitutive model of steel is adopted using an ideal elasto-plastic model, as shown in Figure 11b, where fy denotes the yield strength and εy denotes the yield strain.
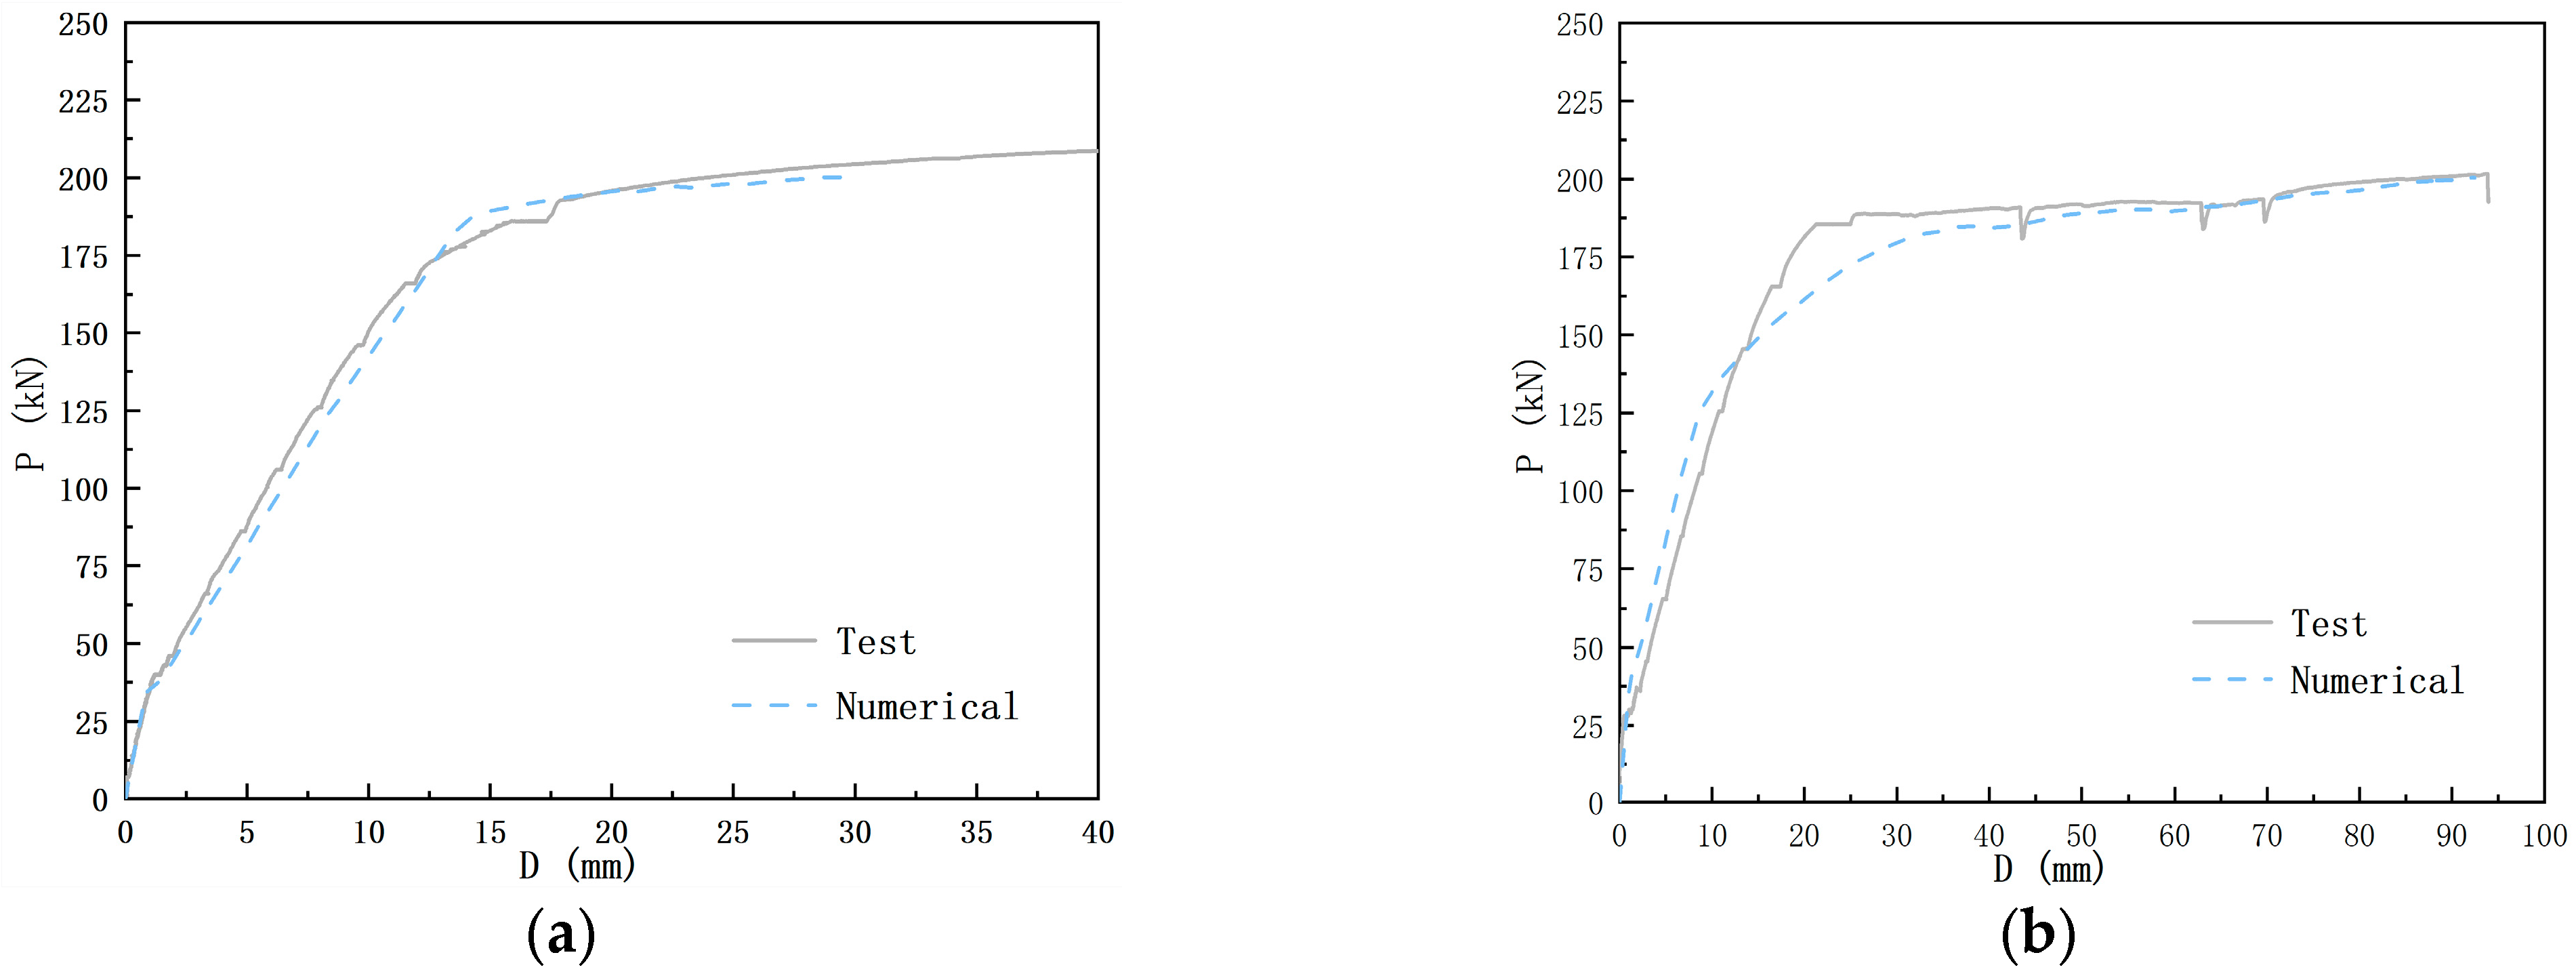
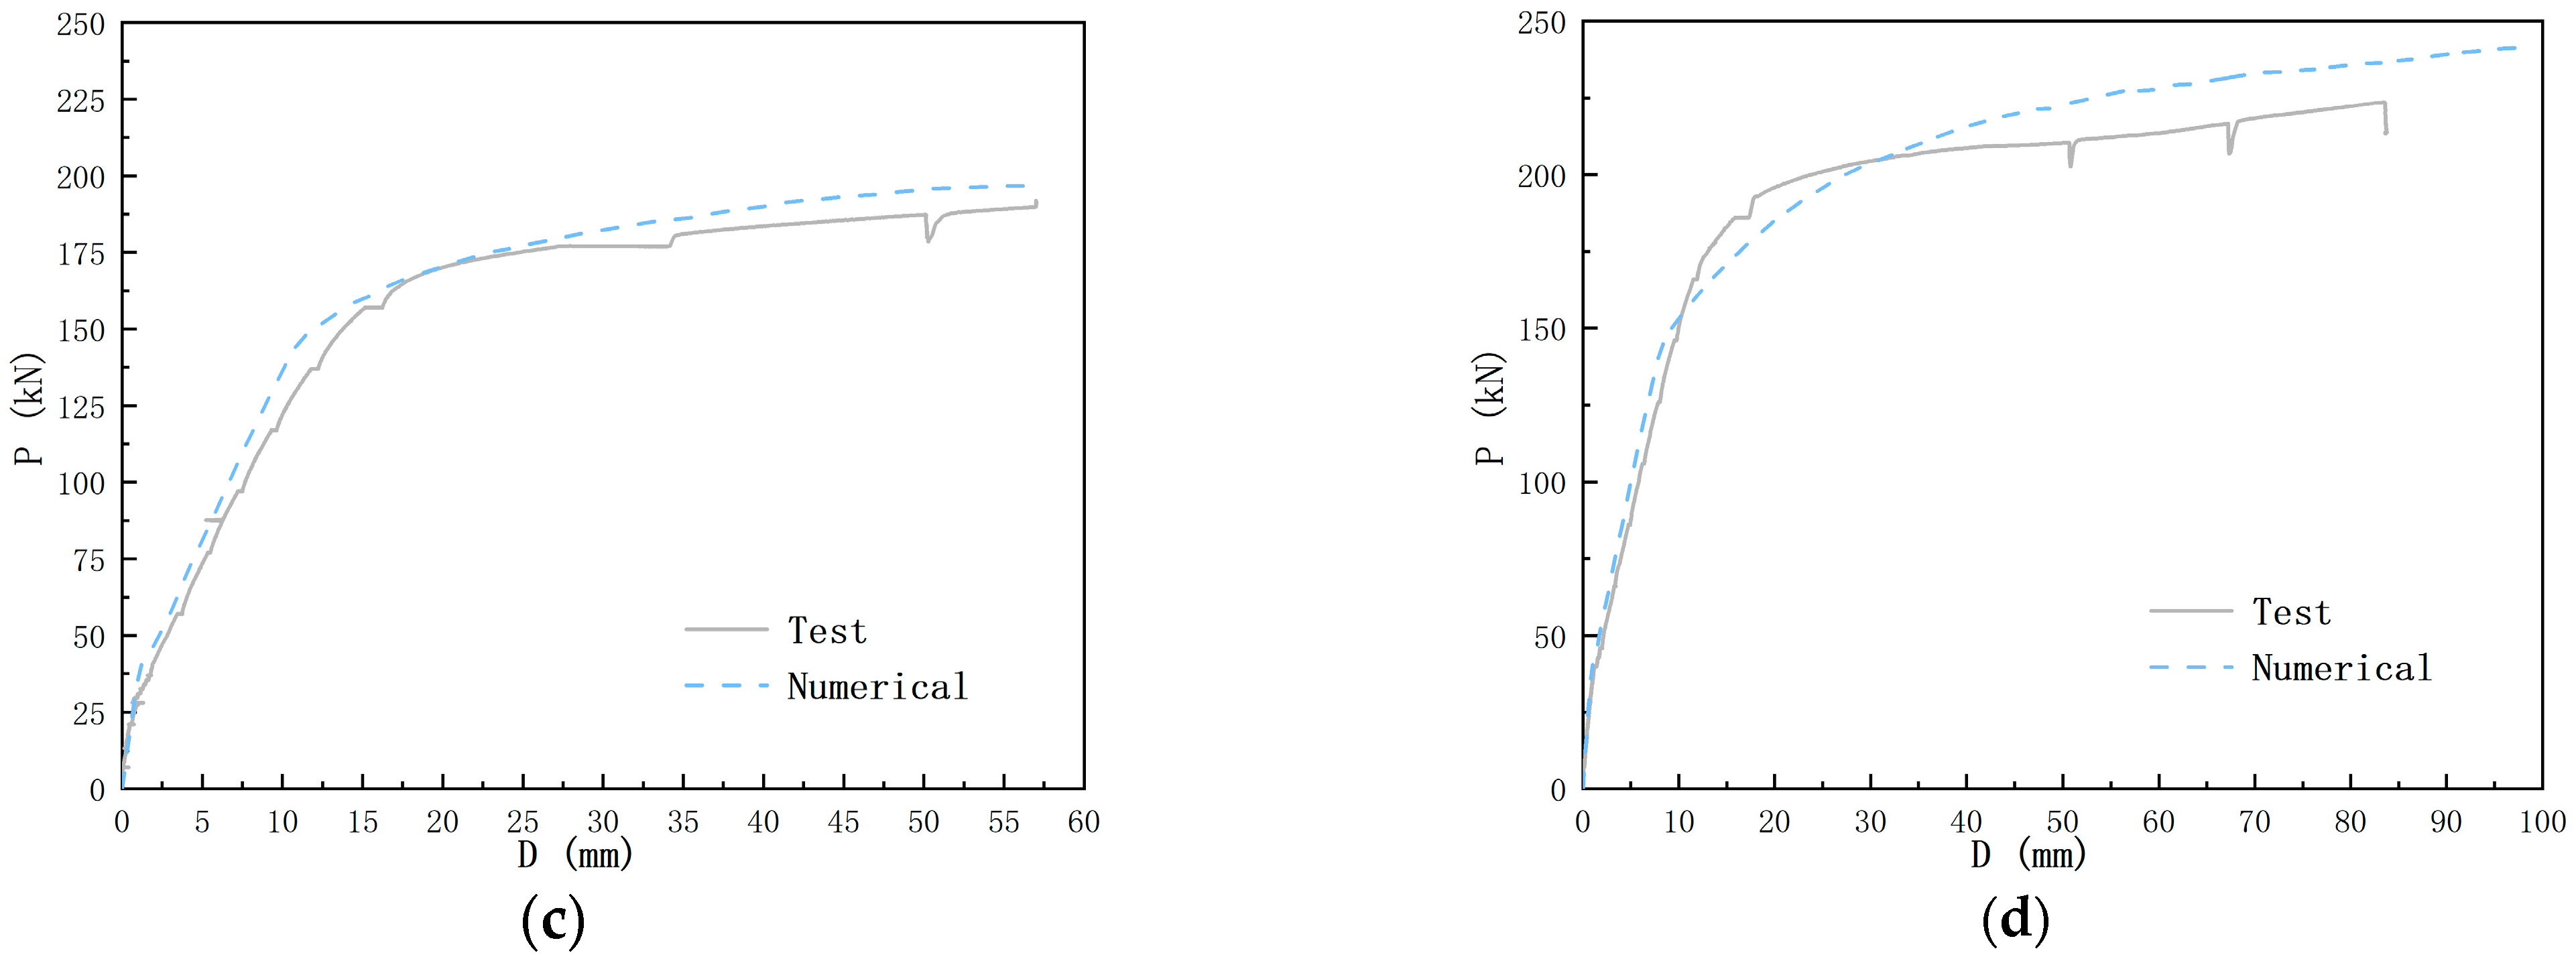
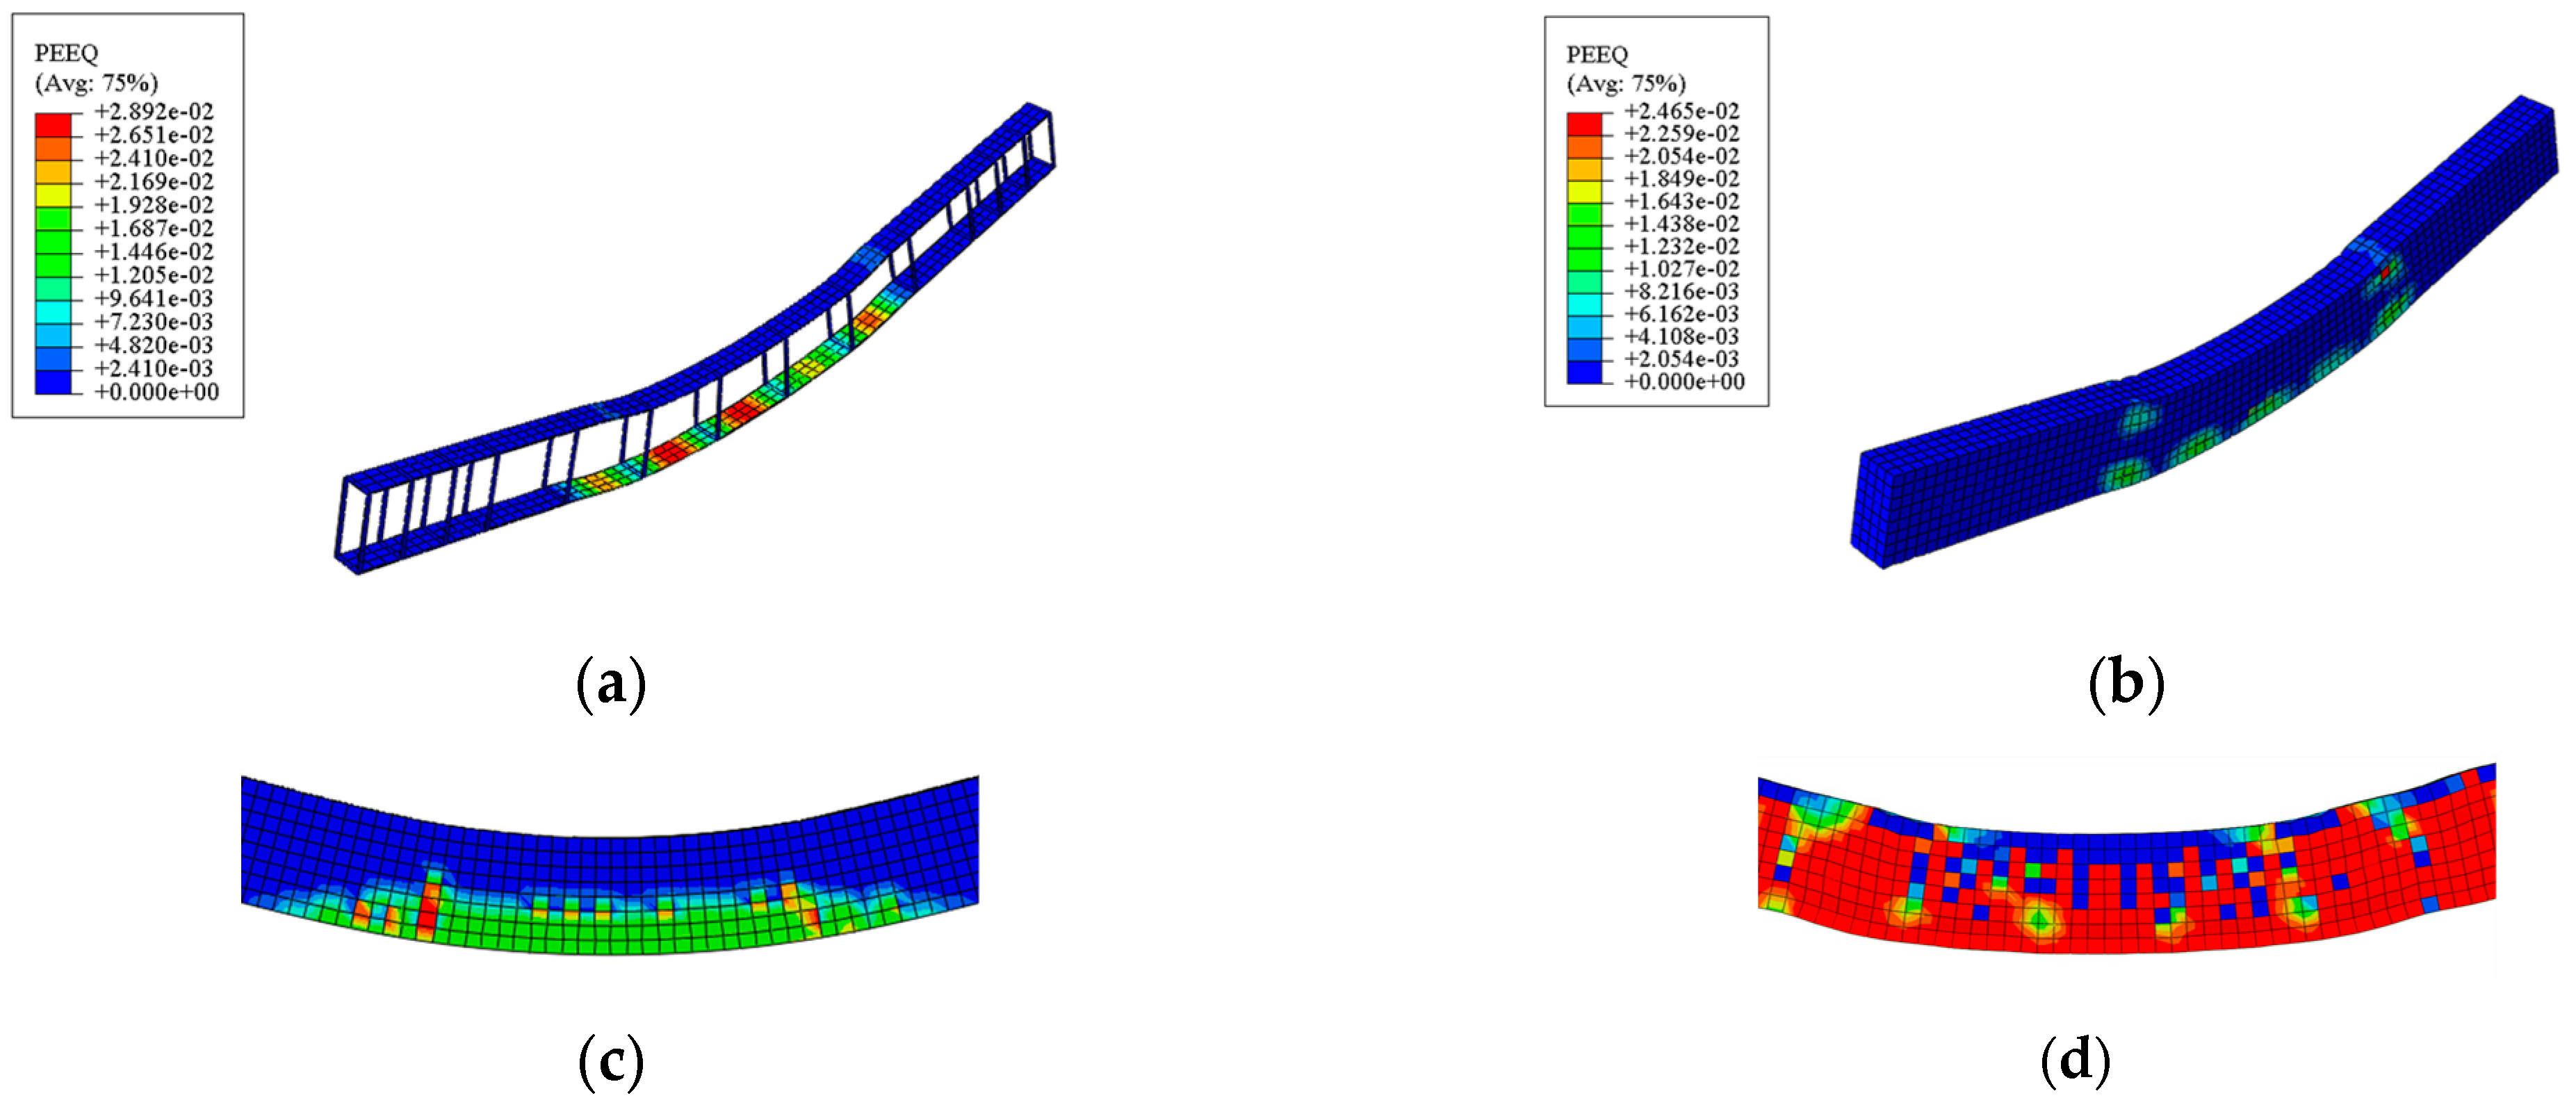
The comparison between the experimental and numerical load–displacement curves, shown in Figure 12, indicates good agreement, validating the numerical model. The yield loads of each finite element model were obtained using the farthest point sampling method. The yield loads of the numerical models of the four components were 188.8 kN, 186.88 kN, 207.17 kN, and 175.77 kN, respectively, with a relative average error of 6.45%. The numerical analysis revealed partial plastic strain in the tension zone of the steel plate in the pure bending section due to excessive deformation, as shown in Figure 13a,b. Figure 13c,d illustrate the occurrence of microcracks in the web and the concrete damage in the compression zone at failure, respectively. These observations closely match the experimental results, confirming that the finite element model accurately reflects the performance characteristics of the lattice SRC members.
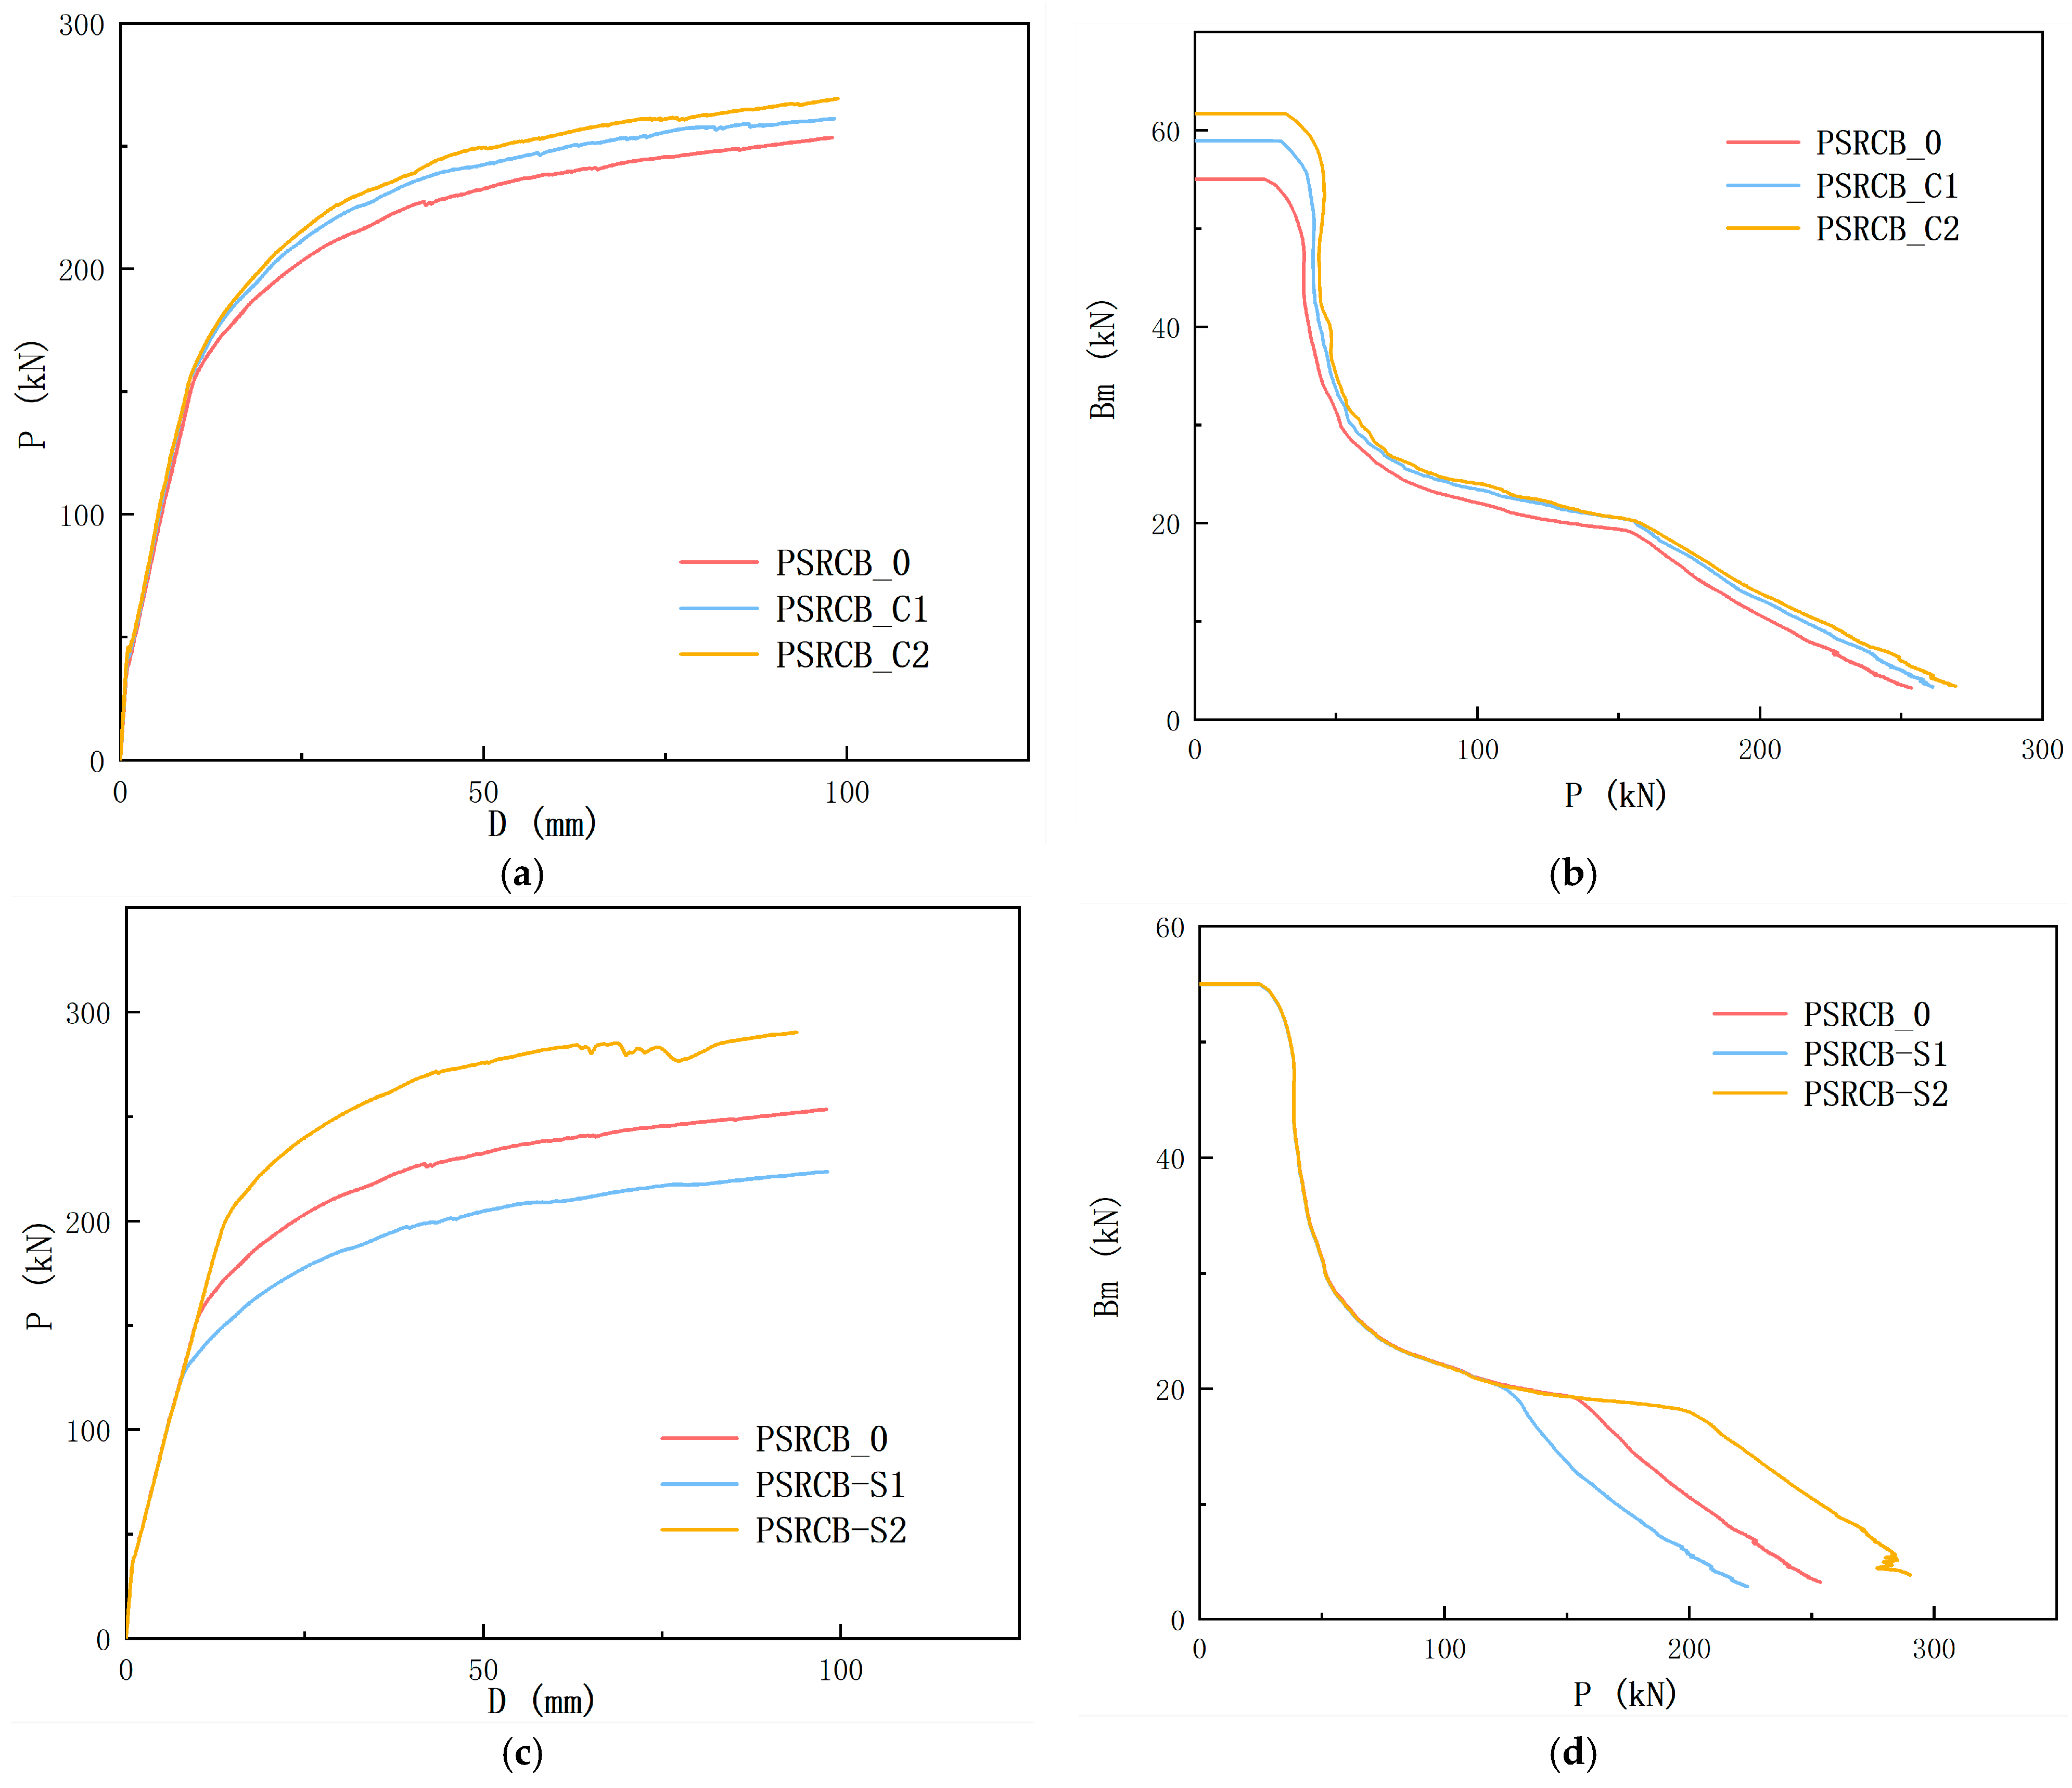
The above results demonstrate that the finite element model effectively captures the mechanical behavior of lattice SRC members. As a result, five key parameters—concrete strength, steel strength, steel plate thickness, side protection layer thickness, and spandrel spacing—were analyzed through further modeling. These parameters are summarized in Table 5, where SRCB-0 denotes the reference member, C40 and C50 are used for C1/C2, respectively; Q275 and Q390 are used for S1/S2, respectively; 8 mm and 10 mm steel plate thicknesses are used for TS1/TS2, respectively; 40 mm and 50 mm concrete cover thicknesses are used for TC1/TC2, respectively; and D1 is used with double splicing spacing.

4.2. Parameter Analysis

To assess the impact of concrete strength on SRC members, two finite element models were created to compare foundation members. The resulting load–displacement curves are presented in Figure 14a. Additionally, the generalized stiffness–load curve, shown in Figure 14b, demonstrates the stiffness variation in three stages: in the first stage, the stiffness of the members does not change much, and the stiffness decreases after exceeding the cracking load; in the second stage, the stiffness decreases in an inverse proportional function until the members yield; in the third stage, the stiffness decreases in a linear manner, which is due to the larger plastic deformation, and increases with the deformation until reaching the termination condition of the test. The results indicate a minimal increase in stiffness with higher concrete strength, primarily observed in the first stage.
Three models were created to investigate the effect of steel strength on SRC members. As shown in Figure 14c, the yield strength is more pronounced in the test beams, though its impact on stiffness is mostly evident during the plastic phase. The load–displacement curves for these models follow the same three-phase behavior, as seen in Figure 14d.
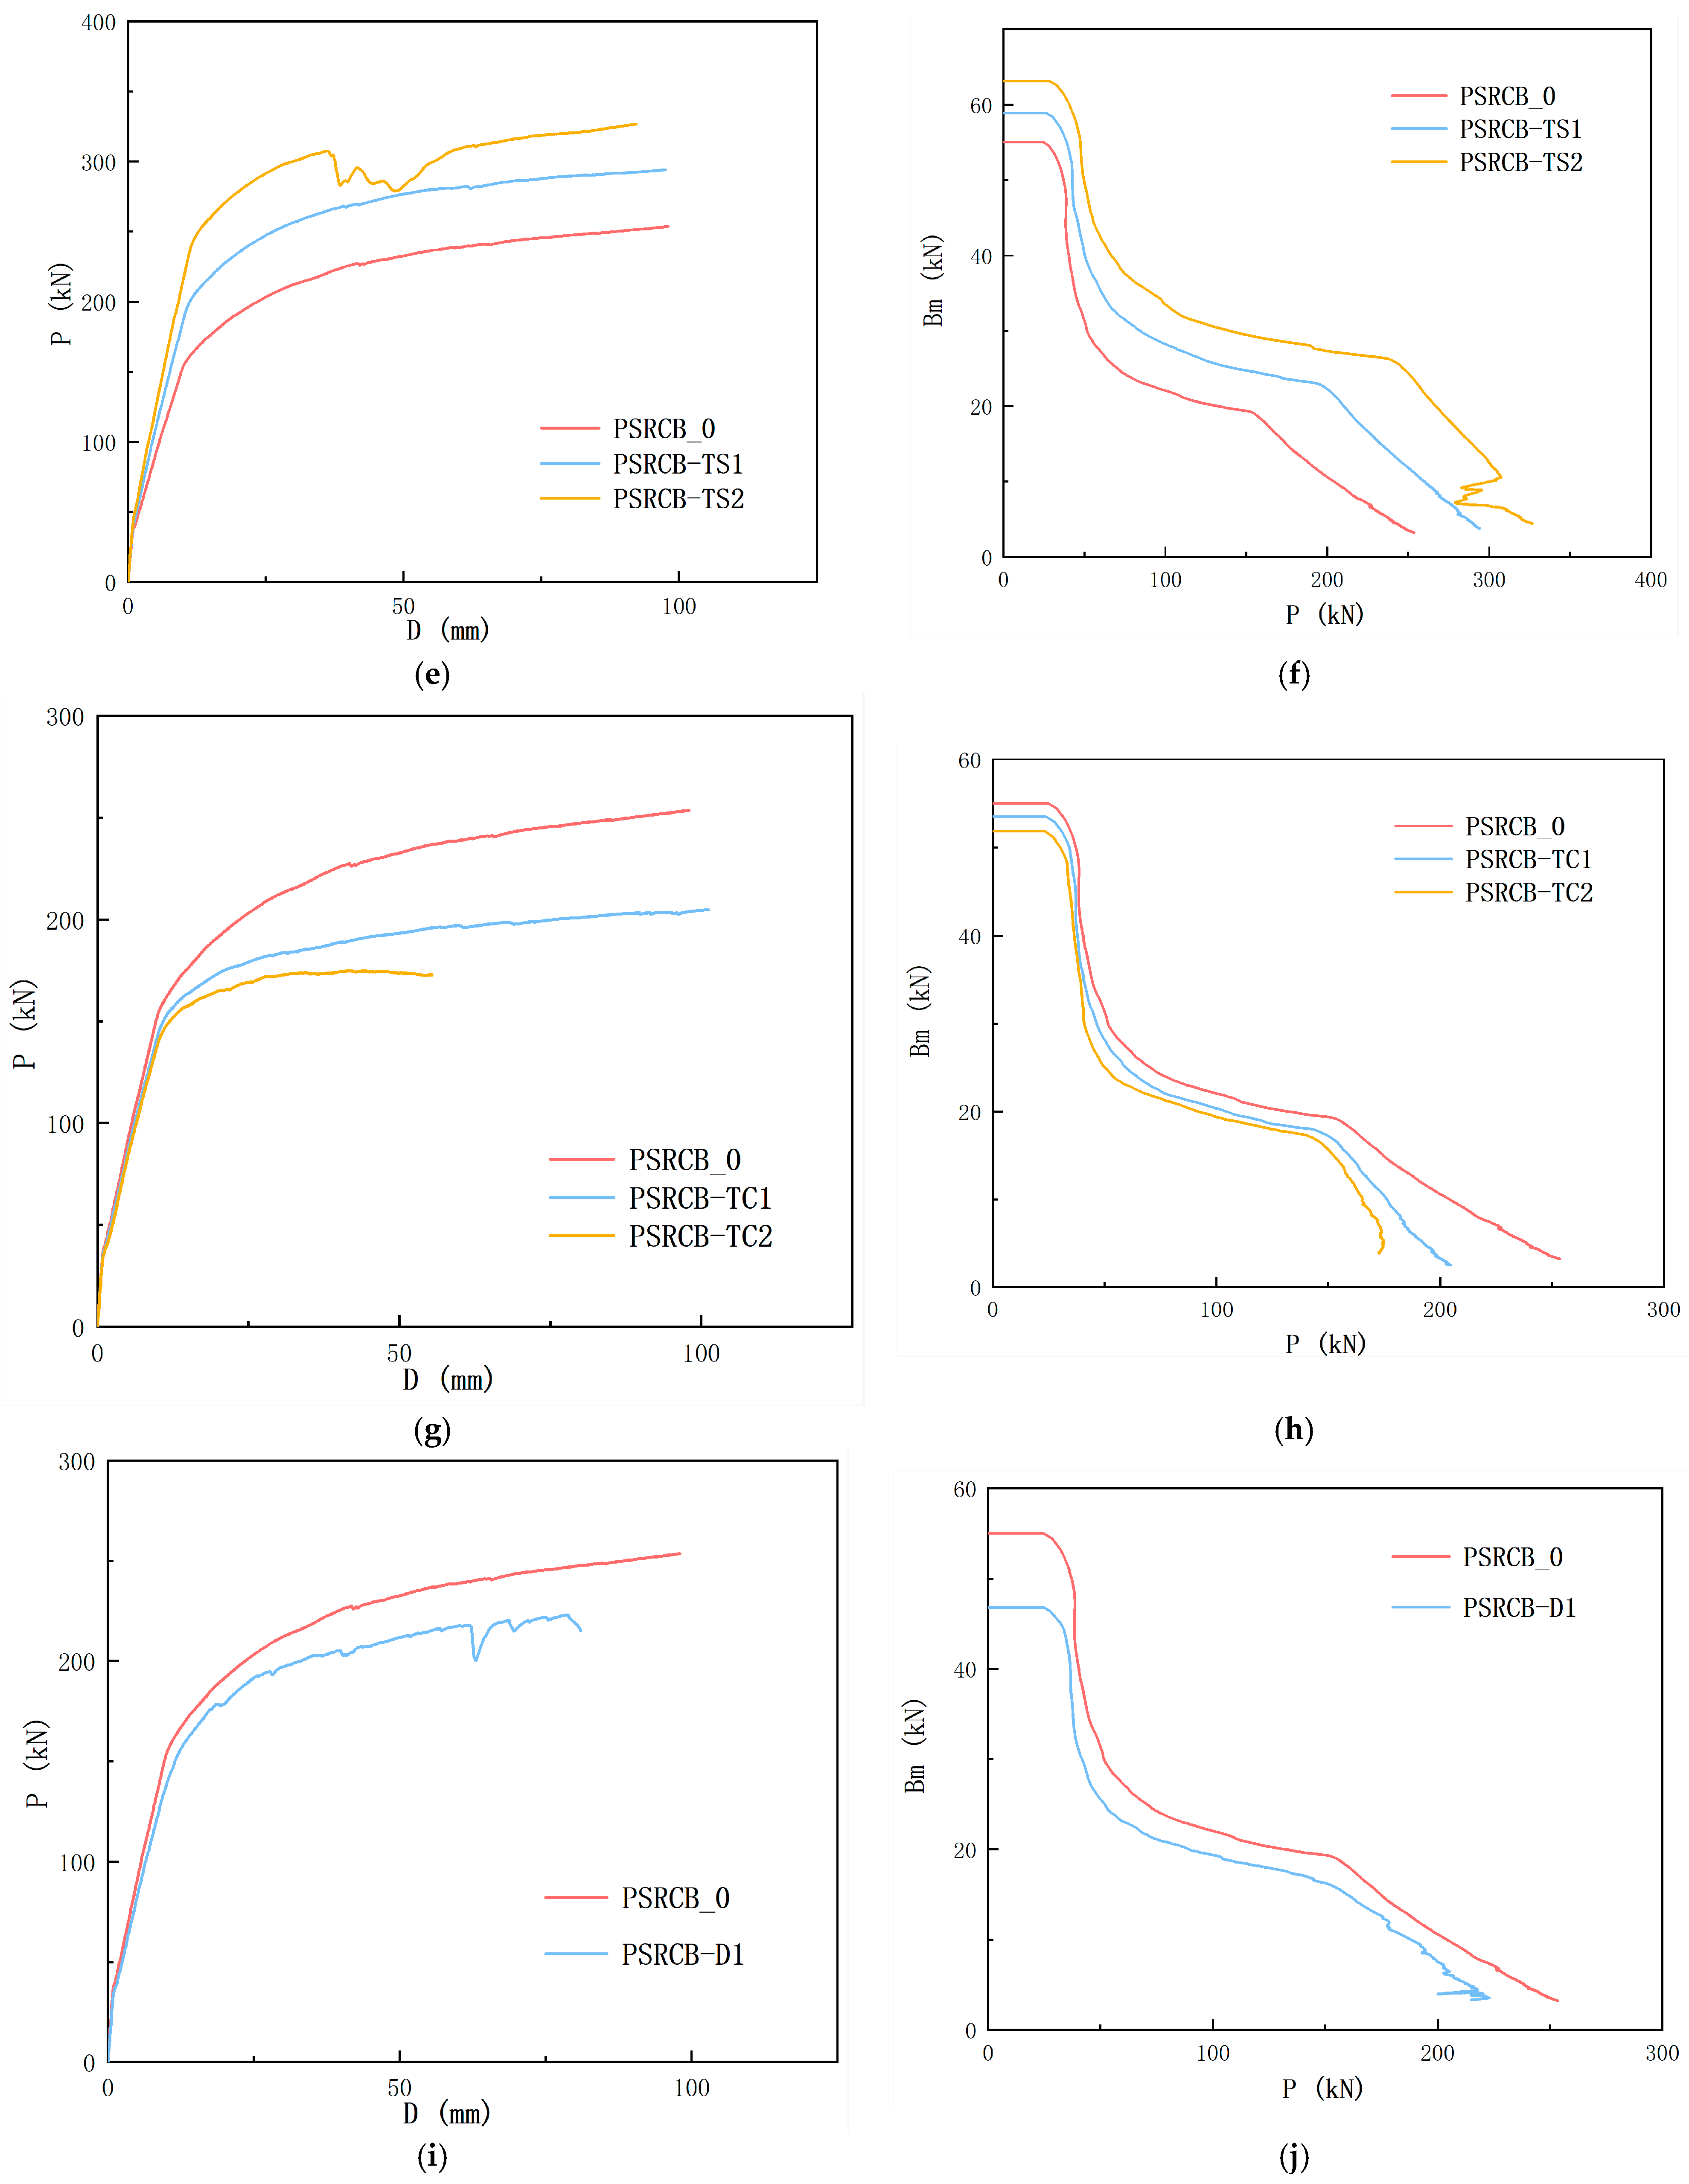
To explore the effect of member geometry, five additional finite element models were developed. The results, shown in Figure 14e,f, reveal that steel plate thickness has a significant impact on both strength and stiffness. Increasing the steel plate thickness by 30% leads to an 18% increase in the ultimate load, though the stiffness decreases as the load increases and the initial stiffness is smaller. The concrete cover thickness influences the initial stiffness, but its effect becomes more pronounced during the plastic phase, as shown in Figure 14g,h. Splice spacing notably affects both initial stiffness and ultimate strength, with larger spacing resulting in decreased strength and stiffness as the plastic phase progresses, as illustrated in Figure 14i,j.
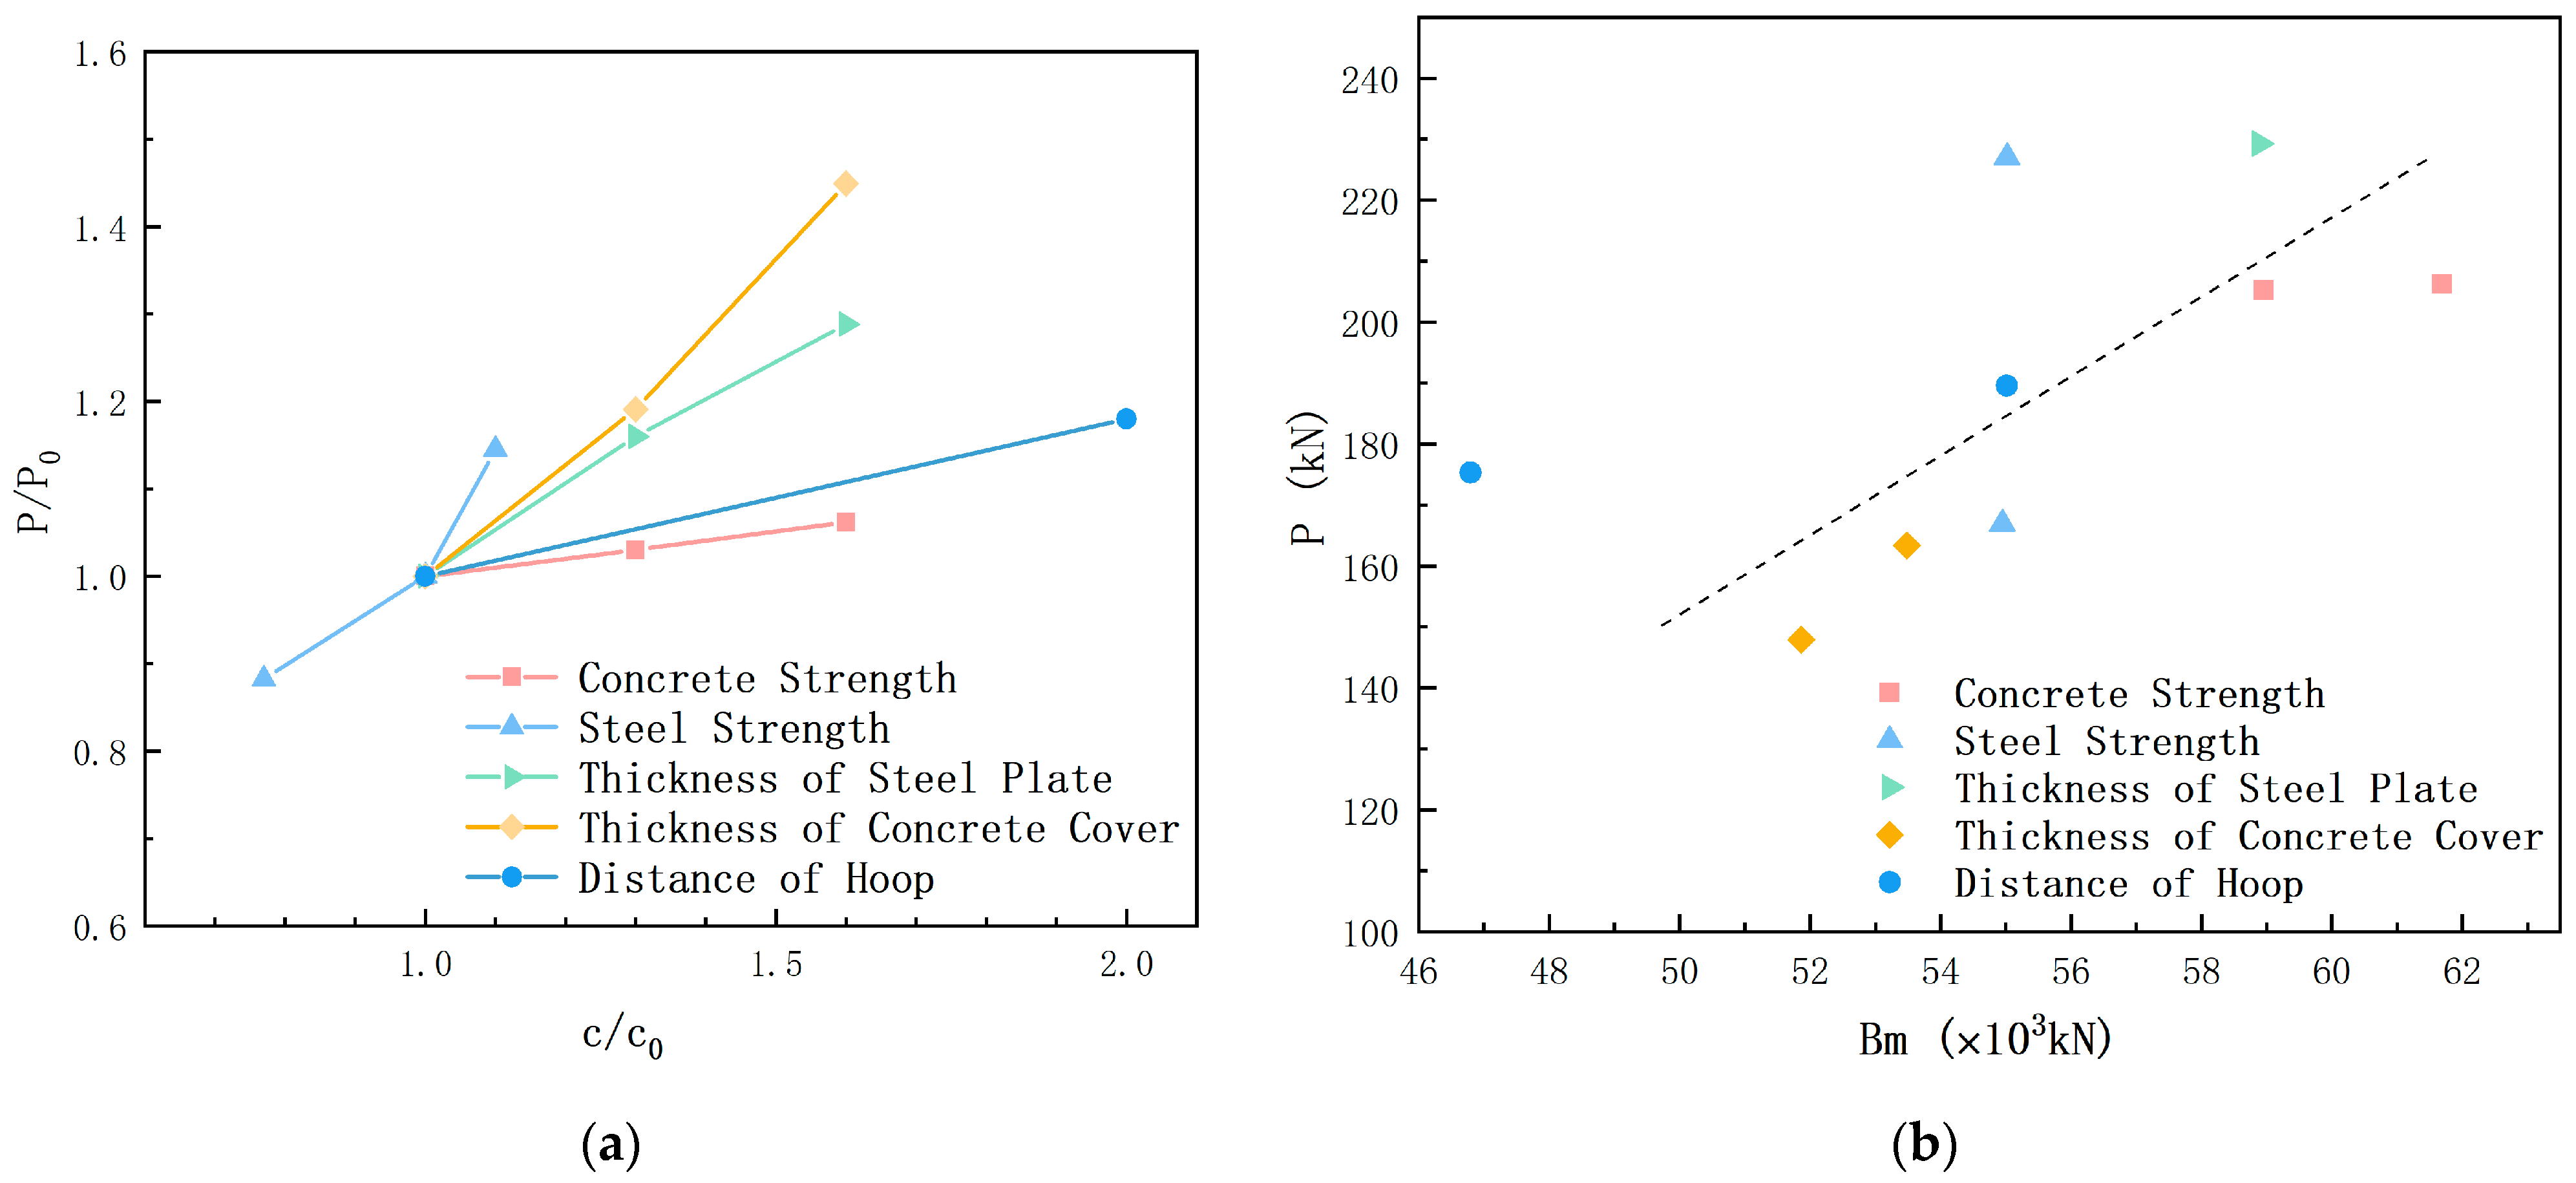
To quantify the effects of each parameter, a comparison plot of parameter influence on ultimate strength is shown in Figure 15a. The ratio of each parameter to the base member (denoted as c/c0) is plotted against the ratio of ultimate strength. The steeper the slope, the more sensitive the ultimate strength is to that parameter. The results demonstrate that steel strength has the most significant impact, followed by protective layer thickness, while concrete strength has the least influence on strength. The analysis revealed a substantial marginal effect on steel plate thickness, which indicates that augmenting the thickness of the steel plate by 25% does not result in a 25% enhancement in load-bearing capacity. Consequently, the utilization of SRC components does not necessitate an augmentation in the amount of steel employed to enhance load-bearing capacity.
Figure 15b illustrates the relationship between displacement ductility coefficients and the ultimate loads of the finite element model. The data points for varying thicknesses of the concrete cover and concrete strength approximately align along the dash line in the figure, indicating consistent trends across these parameters. In contrast, specimens with higher steel strengths exhibit larger displacement ductility coefficients, suggesting that increased steel strength enhances the member’s bearing capacity to undergo larger deformations before failure. As cracks evolve and extend, the embedded steel reinforcement provides additional confinement, thereby increasing the ultimate load-carrying capacity of the member. This phenomenon is reflected in the observed increase in displacement ductility coefficients, highlighting the steel skeleton’s contribution to both strength and ductility.

4.3. Basic Assumption

According to the experimental results, the test members satisfy the flat section assumption under bending moments. Moreover, as shown in Figure 10a, cut along the cracked section of the member, the internal materials of the member remain tightly bonded to ensure their joint action.
Therefore, based on the relevant equations for plain concrete beams, the following assumptions will be used:
(1) The critical section remains plane after deformation.
(2) Relative slip between materials is not considered.
(3) The action of tension concrete is not considered.
(4) There is a uniform strain distribution in the section.
(5) The compressive steel yields when the member breaks down.

4.4. Prediction and Validation

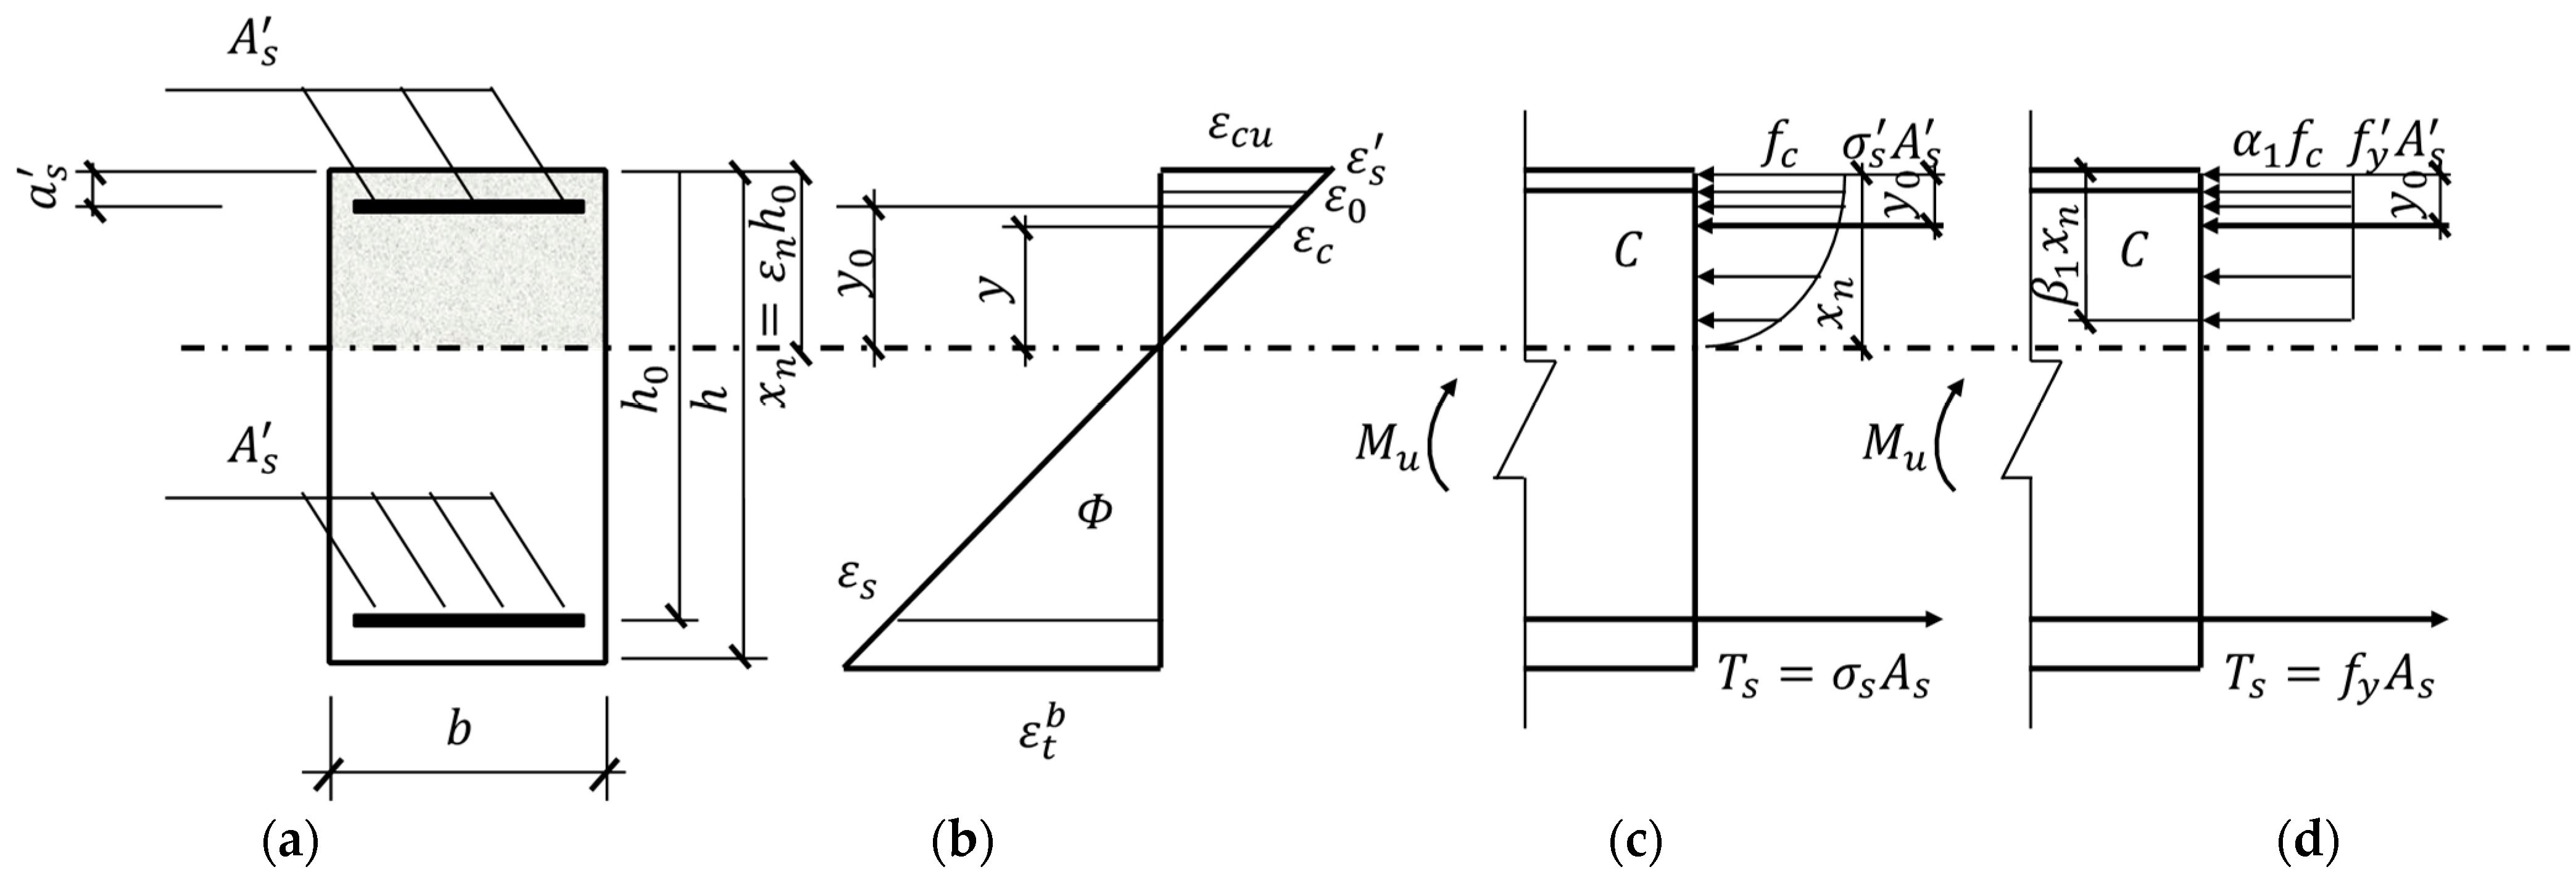
A method for calculating the moment capacity of the new SRCB is obtained based on the simplified plasticity theory. Ref. [9] shows that symmetrical reinforcement improves the ductility as well as the ultimate load-carrying capacity of this type of members. Based on the flat section assumption, the neutral axis position of symmetrically reinforced members is determined according to Equation (1) in order to determine the load-carrying capacity of the SRCB under the bending moment. The design parameters of the critical cross-section of the SRC beam are shown in Figure 16a. According to the plane section assumption, strain distribution in the section is shown in Figure 16b, and compressive stress σc is approximately satisfied as Equation (3) when the stress is small:
σc = Ec · εc
The height of the concrete in the compression zone, xn, is satisfied without considering the action of concrete in the slip and tension zones:
xn = ξn · h0
ξ n = α E ρ 2 + 2 α E ρ α E ρ
where ξn indicates the factor of the relative compressive zone, αE indicates the ratios of Es and Es, and ρ indicates the ratio of steel reinforcement.
The actual stress distribution in the section is shown in Figure 16c, which is satisfied by the concrete form center y0 in the pressure zone:
y0= xn · ycucu
where ycu indicates the equivalent center of the compressive stress zone according to the CDP model of concrete, as shown in Figure 11a, and εcu indicates the ultimate compressive strain of the concrete.
Adopting the principle of equivalent force and moment generated by the concrete in the pressure zone within the cross-section, the equivalent compressive stress distribution is shown in Figure 16d, and the cross-section equilibrium relationship has the following equations:
α 1 f c b x = k 1 f c b x n x = 2 x n y 0 ,   x = 2 1 k 2 x n
where k1 and k2 denote the coefficients of equivalent cross-section height for concrete, which are only related to the strain–stress curve of the concrete.
According to the equivalent stress zone, the equations used to calculate the moment capacity by balancing the forces and moments in the section are shown in Equations (8) and (9). Ref. [27] points out that x = 0.2h0 can be considered when 0.2h0 > 2as. Therefore, the equations for this type of symmetrically reinforced reinforcement can be shown in Equation (10).
αfcbx + fyAs′ = fyAs
MufyAs(h0as′) − α1fcbx(x/2 − as′)
MufyAs(h0as′) − 0.2α1fcbh0(0.1h0as′)
where α indicates the equivalence factor of compressive concrete stress, fc is the equivalent stress of compressive concrete, fy and fy′ indicate the tensile stress and compressive stress of the encased steel plate, respectively, As and As′ indicate section areas of the tensile steel plate and compressive steel plate, respectively, x is the equivalent section height of the compressive concrete, as and as′ are the thicknesses of the bottom and top concrete cover, respectively, b is the width of the SRC beams, h0 is the effective height of the SRC beams, which means the height, except for the thickness of cover, to the center of the tensile steel, and Mu indicates the ultimate bearing capacity of the SRC beams.

4.5. Design Recommendations

In order to ensure the feasibility of the realistic prefabricated construction of SRC beams and the economic efficiency and reliability for future use, a number of design recommendations for steel plates, construction measures, and building measures for SRC beams have been proposed.
(1) Steel plate
Experimental data indicate that the ultimate load-bearing capacity of SRC beams is significantly influenced by the steel’s strength. It is advisable to utilize steel plates with a minimum yield strength of 355 MPa, such as Q355 steel, to achieve an optimal load capacity while minimizing material usage. Additionally, employing plates with a thickness of at least 6 mm is recommended. Thicker plates, such as those with a thickness of 8 mm, have demonstrated superior cross-sectional properties and stiffness, enhancing overall beam performance.
(2) Structural Measures
While sensitivity analyses suggest that the ultimate load capacity is relatively unaffected by construction measures, as shown in Figure 15a, the observed damage patterns underscore the importance of thoughtful structural detailing. To ensure uniform damage progression and improved performance, it is recommended that splice spacing should not exceed 200 mm or 10 times the plate thickness, whichever is smaller. Furthermore, tests have shown satisfactory interfacial bonding without the need for additional construction measures on the contact surfaces.
(3) Construction measures
The formation of microcracks in the beam web indicates significant stress variations at the steel–concrete interface, as evidenced by Figure 13. Given the reduced structural integrity during early stages, it is advisable to avoid applying concentrated construction loads or additional measures at the tensile steel–concrete interface. This approach will help maintain the serviceability and longevity of the SRC beam members.
A comparison of the load-carrying capacity of the test beams and the finite element beams calculated by the formulae is shown in Table 6, achieving an average relative error for the formulae of about 0.12. Meanwhile, the C and S groups show that the formulae are more accurate in reflecting the changes in the material property parameters. For geometrical parameters, as shown in groups TS and TC, the formulae do not show their effects well, and thus underestimate the load-carrying capacity of the members. For changes in structural measures, the formulae can effectively predict the corresponding load-carrying capacity, as shown in group D. Since the formulae do not take into account the strength of the reinforcement stage, the formulae will not reflect the effect of the structural measures in the plastic stage well for some structural measures that affect the ultimate load-carrying capacity, which is usually considered as strength redundancy to ensure the safety of the members.

5. Conclusions

In this paper, the mechanical properties of lattice SRC beams under pure bending loads are investigated through experimental and parametric analyses. Four members with different construction measures are taken to investigate their effects, and five potential factors affecting the mechanical properties are analyzed by Abaqus. Finally, a simplified SRC formula is proposed to calculate the load-carrying performance of the new beams with reference to the relevant formulae and the results of parametric analysis, and the main conclusions are shown below:
1. The finite element and experimental results are in good agreement, and the damage of SRC members is in line with the damage characteristics of general members.
2. SRC beams are sensitive to the spacing of the splices; doubling the spacing of the splices decreases the bearing capacity by more than 5%, and the stiffness decreases significantly.
3. The SRC beam pure bearing strength is limited by the influence of structural measures, with a variation in capacity between different measures amounting to less than 5%. A comparative analysis reveals that, in contrast to conventional members, there is an average augmentation in ductility of 125.1% and an average escalation in bearing capacity of 15.3%. Notably, the increase in ductility surpasses that of bearing capacity by eightfold.
4. The formulae presented in this article are in good agreement with the test results, which can help in the design of SRC members. The experimental findings corroborate that the bearing capacity formula for solid web SRC members can be extrapolated to hollow lattice members.

Author Contributions

Conceptualization, H.C. and B.Y.; methodology, J.G. and C.P.; software, C.P.; validation, B.Y. and P.W.; formal analysis, P.W.; investigation, J.G.; resources, H.C.; data curation, P.W.; writing—original draft preparation, P.W.; writing—review and editing, B.Y.; visualization, P.W.; supervision, B.Y.; project administration, B.Y.; funding acquisition, H.C. All authors have read and agreed to the published version of the manuscript.

Funding

This research received no external funding.

Data Availability Statement

The data presented in this study are available upon request from the corresponding author.

Conflicts of Interest

The authors declare that they have no known competing financial interests or personal relationships that could have appeared to influence the work reported in this paper.

Appendix A

This appendix contains high-definition images of crack patterns.
Figure A1. The crack pattern of GL1.
Buildings 15 03473 g0a1aBuildings 15 03473 g0a1b
Figure A2. The crack pattern of GL2.
Buildings 15 03473 g0a2aBuildings 15 03473 g0a2b
Figure A3. The crack pattern of GL3.
Buildings 15 03473 g0a3aBuildings 15 03473 g0a3b
Figure A4. The crack pattern of GL4.
Buildings 15 03473 g0a4aBuildings 15 03473 g0a4b

Appendix B

This appendix section contains the script for the FEM model.
# -*- coding: utf-8 -*-
# 2024-03-18 by Mr.P
# Concrete
b = 200 # Width of the Section
h = 400 # Height of the Section
c = 30 # Thickness of the Cover
l = 4000 # Length of the Beam
concrete = 30 # Compression Strength of the Conrete
# Upper flange
st1 = 355 # Strength of the Steel
t1 = 8 # Thickness of the Upper flange
# Lower flange
st2 = 355 # Strength of the Steel
t2 = 8 # Thickness of the Lower flange
# Strip
st3 = 335 # Strength of the Steel
t3 = 5 # Thickness of the Strip
bw = 20 # Width of the Strip
bs1 = 200 # Distance of the Strip
bs2 = 100 # Distance of the Strip in Critical region
# Loading
sd = 100 # Distance of the Support
ld = 1300 # Length of the Distribution beam
fyu = 185500.0 # component yield strength(unit: N)
umax = 80.0 # ultimate deformation(unit: mm)
# Calculation
bn = b - 2 * 50 # Length of the Flange
ln = h - 2 * c - t1 - t2 # Height of the Strip
fd = (l - ld) / 2 # Support spacing for the Distribution beam
# IMPORT ABAQUS MODULE
from part import *
from material import *
from section import *
from assembly import *
from step import *
from interaction import *
from load import *
from mesh import *
from optimization import *
from job import *
from sketch import *
from visualization import *
from connectorBehavior import *
import regionToolset
import os
# MODEL
Mdb()
model = mdb.Model(name='Model-3', modelType=STANDARD_EXPLICIT)
session.journalOptions.setValues(replayGeometry=INDEX,recoverGeometry=INDEX)
# MATERIAL
name = "CONCRETE"
con = model.Material(name=name)
con.Density(table=((2.4e-09, ), ))
con.Elastic(table=((round(1e5/(2.2+34.7/concrete)), 0.2), ))
model.materials[name].ConcreteDamagedPlasticity(table=((30.0,
  0.1, 1.16, 0.6667, 0.0005), ))
model.materials[name].concreteDamagedPlasticity.ConcreteCompressionHardening(
  table=((11.64714746, 0.0), (14.3838373, 0.000105357), (16.47636888,
  0.000182162), (17.98927214, 0.000278422), (19.01347457, 0.000391087), (
  19.64442013, 0.000516952), (19.96974679, 0.000653076), (20.064,
  0.000796956), (19.92846948, 0.000948549), (19.57584788, 0.001107429), (
  19.07603163, 0.001271249), (18.48370949, 0.001438175), (17.83970553,
  0.001606836), (17.17336207, 0.001776247), (16.5050637, 0.001945723), (
  15.84848167, 0.002114806), (15.21239984, 0.002283201), (14.60212352,
  0.00245073), (14.02053012, 0.002617296), (13.46883469, 0.002782858), (
  12.9471385, 0.002947413), (12.45481696, 0.003110982), (11.99079101,
  0.003273602), (11.55371483, 0.003435317), (11.14210421, 0.003596177), (
  10.75442304, 0.003756234), (10.3891404, 0.003915539), (10.04476724,
  0.004074142), (7.477610044, 0.00563075), (5.91178458, 0.007153747), (
  4.873385208, 0.00865904), (4.139179293, 0.010154121), (3.594364,
  0.011642846), (3.174796249, 0.013127367)))
model.materials[name].concreteDamagedPlasticity.ConcreteTensionStiffening(
  table=((2.055543781, 0.0), (2.007539553, 3.81219e-05), (1.91888817,
  5.06892e-05), (1.817505613, 6.3684e-05), (1.71534452, 7.67048e-05), (
  1.617902603, 8.95673e-05), (1.527448961, 0.000102195), (1.444627518,
  0.000114567), (1.369290826, 0.000126687), (1.300934489, 0.000138574), (
  1.238920791, 0.000150247), (1.182590834, 0.000161729), (1.131317869,
  0.000173042), (1.084529887, 0.000184204), (1.041716447, 0.000195233), (
  1.002427697, 0.000206143), (0.966269853, 0.000216949), (0.932899323,
  0.000227661), (0.902016622, 0.000238289), (0.873360601, 0.000248842), (
  0.846703241, 0.000259329), (0.656029261, 0.000361646), (0.543338715,
  0.000461345), (0.468311376, 0.00055978), (0.414369332, 0.000657507), (
  0.373473225, 0.000754797), (0.341246111, 0.000851795), (0.315094639,
  0.000948589)))
model.materials[name].concreteDamagedPlasticity.ConcreteCompressionDamage(
  table=((0.0, 0.0), (0.093979003, 0.000105357), (0.132685458, 0.000182162),
  (0.17270186, 0.000278422), (0.212568831, 0.000391087), (0.251304038,
  0.000516952), (0.288301744, 0.000653076), (0.323232279, 0.000796956), (
  0.356910369, 0.000948549), (0.389760178, 0.001107429), (0.421233723,
  0.001271249), (0.451013802, 0.001438175), (0.478950374, 0.001606836), (
  0.505007579, 0.001776247), (0.529223237, 0.001945723), (0.551679647,
  0.002114806), (0.572483439, 0.002283201), (0.591752167, 0.00245073), (
  0.609605719, 0.002617296), (0.62616105, 0.002782858), (0.641529141,
  0.002947413), (0.655813421, 0.003110982), (0.669109126, 0.003273602), (
  0.681503235, 0.003435317), (0.693074761, 0.003596177), (0.703895219,
  0.003756234), (0.714029203, 0.003915539), (0.723534981, 0.004074142), (
  0.793422847, 0.00563075), (0.835712252, 0.007153747), (0.863833391,
  0.00865904), (0.883817966, 0.010154121), (0.898726245, 0.011642846), (
  0.910263825, 0.013127367)))
model.materials[name].concreteDamagedPlasticity.ConcreteTensionDamage(
  table=((0.0, 0.0), (0.200823095, 3.81219e-05), (0.251931407, 5.06892e-05),
  (0.300523036, 6.3684e-05), (0.345184616, 7.67048e-05), (0.38561901,
  8.95673e-05), (0.421996358, 0.000102195), (0.454668364, 0.000114567), (
  0.484036703, 0.000126687), (0.510493881, 0.000138574), (0.534398914,
  0.000150247), (0.556069669, 0.000161729), (0.575782876, 0.000173042), (
  0.593777423, 0.000184204), (0.61025877, 0.000195233), (0.625403482,
  0.000206143), (0.639363439, 0.000216949), (0.652269553, 0.000227661), (
  0.664234967, 0.000238289), (0.675357771, 0.000248842), (0.685723292,
  0.000259329), (0.760426476, 0.000361646), (0.804989707, 0.000461345), (
  0.83472813, 0.00055978), (0.856069778, 0.000657507), (0.872182019,
  0.000754797), (0.884808665, 0.000851795), (0.894990711, 0.000948589)))
model.HomogeneousSolidSection(name="concrete", material=name)
# PART
p = model.Part(name='CONCRETE', dimensionality=THREE_D,type=DEFORMABLE_BODY)
s = model.ConstrainedSketch(name='s',sheetSize=2000.0)
s.rectangle(point1=(0,0), point2=(b,h))
p.BaseSolidExtrude(sketch=s, depth=l);del s
region = (p.cells,)
p.SectionAssignment(region=region, sectionName='concrete')
name = "STEEL01"
stl = model.Material(name=name)
stl.Density(table=((7.85e-09, ), ))
stl.Elastic(table=((206000.0, 0.3), ))
stl.Plastic(table=((st1, 0.0), ))
model.HomogeneousSolidSection(name='steel01', material=name)
name = "STEEL02"
stl = model.Material(name=name)
stl.Density(table=((7.85e-09, ), ))
stl.Elastic(table=((206000.0, 0.3), ))
stl.Plastic(table=((st2, 0.0), ))
model.HomogeneousSolidSection(name='steel02', material=name)
name = "STEEL03"
stl = model.Material(name=name)
stl.Density(table=((7.85e-09, ), ))
stl.Elastic(table=((206000.0, 0.3), ))
stl.Plastic(table=((st3, 0.0), ))
model.HomogeneousSolidSection(name='steel03', material=name)
p = model.Part(name='FLANGE01', dimensionality=THREE_D,type=DEFORMABLE_BODY)
s = model.ConstrainedSketch(name='s',sheetSize=2000.0)
s.rectangle(point1=(0,0), point2=(bn,t1))
p.BaseSolidExtrude(sketch=s, depth=l);del s
region = (p.cells,)
p.SectionAssignment(region=region, sectionName='steel01')
p = model.Part(name='FLANGE02', dimensionality=THREE_D,type=DEFORMABLE_BODY)
s = model.ConstrainedSketch(name='s',sheetSize=2000.0)
s.rectangle(point1=(0,0), point2=(bn,t2))
p.BaseSolidExtrude(sketch=s, depth=l);del s
region = (p.cells,)
p.SectionAssignment(region=region, sectionName='steel02')
p = model.Part(name='WEB', dimensionality=THREE_D,type=DEFORMABLE_BODY)
s = model.ConstrainedSketch(name='s',sheetSize=2000.0)
s.rectangle(point1=(0,0), point2=(t3,ln))
s.rectangle(point1=(bn-t3,0), point2=(bn,ln))
p.BaseSolidExtrude(sketch=s, depth=bw);del s
region = (p.cells,)
p.SectionAssignment(region=region, sectionName='steel03')
# ASSEMBLY
a = model.rootAssembly
a.DatumCsysByDefault(CARTESIAN)
p = model.parts['FLANGE02']
a.Instance(name='FLANGE02', part=p, dependent=ON)
p = model.parts['FLANGE01']
a.Instance(name='FLANGE01', part=p, dependent=ON)
a.translate(instanceList=('FLANGE01', ), vector=(0.0, t2+ln, 0.0))
list1 = [0,90,190,290,390,490,590,690,890,1090,1290,1490,1690,1890]
# list1 = [0,190,390,390,590,590,990,1390,1790]
list2 = [l - i - 20 for i in list1]
list = list1 + list2
for index,value in enumerate(list):
  p = model.parts['WEB']
  name = 'WEB-'+str(index+1)
  a.Instance(name=name, part=p, dependent=ON)
  a.translate(instanceList=(name, ), vector=(0.0, t2, value))
key=a.instances.keys()
group=()
for i in range(len(key)):
  flag=(a.instances[key[i]],)
  group=group+flag
a.InstanceFromBooleanMerge(name='STEEL', instances=group, keepIntersections=ON, originalInstances=DELETE, domain=GEOMETRY)
a.translate(instanceList=('STEEL-1', ), vector=(c, c, 0.0))
model.rootAssembly.features.changeKey(fromName='STEEL-1',
  toName='STEEL')
p = model.parts['CONCRETE']
a.Instance(name='CONCRETE', part=p, dependent=ON)
con_list = [100,100+1250,100+1250+1300,100+1250+1300+1250]
for i in con_list:
  p.DatumPlaneByPrincipalPlane(principalPlane=XYPLANE, offset=i)
datum = p.datums
name = datum.keys()
for i in name:
  cc = p.cells
  pickedCells = cc
  try:
    DP = datum[i]
    p.PartitionCellByDatumPlane(datumPlane=DP, cells=pickedCells)
  except:
    pass
p = model.parts['STEEL']
p.DatumPlaneByPrincipalPlane(principalPlane=YZPLANE, offset=t3)
p.DatumPlaneByPrincipalPlane(principalPlane=YZPLANE, offset= b - 2 * c - t3)
for i in list:
  p.DatumPlaneByPrincipalPlane(principalPlane=XYPLANE, offset=i)
  p.DatumPlaneByPrincipalPlane(principalPlane=XYPLANE, offset=i + bw)
datum = p.datums
name = datum.keys()
for i in name:
  cc = p.cells
  pickedCells = cc
  try:
    DP = datum[i]
    p.PartitionCellByDatumPlane(datumPlane=DP, cells=pickedCells)
  except:
    pass
# INTERACTION-EMBED
e = a.instances['STEEL'].cells
a.Set(cells=e, name='STEEL')
c = a.instances['CONCRETE'].cells
a.Set(cells=c, name='CONCRETE')
# STEP
model.StaticStep(name='Step-1', previous='Initial',
  maxNumInc=10000, initialInc=0.01, minInc=1e-4, maxInc=1)
# model.StaticStep(name='Step-2', previous='Step-1',
#    maxNumInc=10000, initialInc=0.01, minInc=1e-4, maxInc=1)
model.fieldOutputRequests['F-Output-1'].setValues(variables=(
  'S', 'PE', 'PEEQ', 'PEMAG', 'LE', 'U', 'RF', 'CF', 'CSTRESS', 'CDISP',
  'DAMAGEC', 'DAMAGET'))
region1=a.sets['STEEL']
region2=a.sets['CONCRETE']
model.EmbeddedRegion(name='CONCRETE-STEEL',
  embeddedRegion=region1, hostRegion=region2, weightFactorTolerance=1e-06,
  absoluteTolerance=0.0, fractionalTolerance=0.05, toleranceMethod=BOTH)
# MESH
p = model.parts['CONCRETE']
p.seedPart(size=50, deviationFactor=0.1, minSizeFactor=0.1) #Enhance accurancy
p.generateMesh()
p = model.parts['STEEL']
p.seedPart(size=25, deviationFactor=0.1, minSizeFactor=0.1)
p.generateMesh()
a.regenerate() # Inherit nodes of parts, required
# BOUNDARY
# Define the Set of left support (Edge of the beam end)
left_edges = a.instances["CONCRETE"].edges.getByBoundingBox(
  yMax=0.1, zMin=l-sd-0.1, zMax=l-sd+0.1 # Adjust tolerance based on actual coordinates
)
a.Set(edges=left_edges, name='LeftSupportEdges')
# Define the Set of right support
right_edges = a.instances["CONCRETE"].edges.getByBoundingBox(
  yMax=0.1, zMin=sd-0.1, zMax=sd+0.1
)
a.Set(edges=right_edges, name='RightSupportEdges')
# Define Loading nodes set (Top nodes of the Beam)
load_nodes = (
    a.instances["CONCRETE"].nodes.getByBoundingBox(
    yMax=h+0.1, yMin=h-0.1,zMax=fd+0.1, zMin=fd-0.1)
    +a.instances["CONCRETE"].nodes.getByBoundingBox(
      yMax=h+0.1, yMin=h-0.1, zMin=l-fd-0.1, zMax=l-fd+0.1
      )
  )
a.Set(nodes=load_nodes, name='LoadNodes')
num_nodes = len(load_nodes)
#Applied boundary condition
model.DisplacementBC(name='LeftSupport', createStepName='Initial',
  region=a.sets['LeftSupportEdges'], u1=0.0, u2=0.0, ur3=0.0)
model.DisplacementBC(name='RightSupport', createStepName='Initial',
  region=a.sets['RightSupportEdges'], u1=0.0, u2=0.0, u3=0.0, ur3=0.0)
# LOADS
# model.ConcentratedForce(name='Load-1', createStepName='Step-1',
#  region=a.sets['LoadNodes'], cf1=0.0, cf2=-fyu/num_nodes, cf3=0.0)
model.DisplacementBC(name='DeformationLoads', createStepName='Step-1',
  region=a.sets['LoadNodes'], u2=-umax) #Displacement controlling
# JOB
mdb.Job(name='job1', model='Model-1', description='', type=ANALYSIS,
  atTime=None, waitMinutes=0, waitHours=0, queue=None, memory=90,
  memoryUnits=PERCENTAGE, getMemoryFromAnalysis=True,
  explicitPrecision=SINGLE, nodalOutputPrecision=SINGLE, echoPrint=OFF,
  modelPrint=OFF, contactPrint=OFF, historyPrint=OFF, userSubroutine='',
  scratch='', resultsFormat=ODB, multiprocessingMode=DEFAULT, numCpus=10,
  numDomains=10, numGPUs=4) #original_numCpus=14;original_numDomains=14
# mdb.jobs['job1'].submit()
# mdb.jobs['job1'].waitForCompletion()

References

  1. Sun, H.; Shen, W. Stiff reinforced concrete structures—A promising structural type. Build. Sci. 1992, 2, 15–20. [Google Scholar]
  2. Sadoughi, A.; Kouhirostami, M.; Kouhirostamkolaei, M.; Qi, B.; Costin, A. Autonomous Building Design for Manufacturing and Assembly: A Systematic Review of Design Application, Challenges, and Opportunities. J. Constr. Eng. Manag. 2024, 150, 03124006. [Google Scholar] [CrossRef]
  3. Li, X.; Wang, C.; Alashwal, A.; Bora, S. Game analysis on prefabricated building evolution based on dynamic revenue risks in China. J. Clean. Prod. 2020, 267, 121730. [Google Scholar] [CrossRef]
  4. Ferdous, W.; Bai, Y.; Ngo, T.D.; Manalo, A.; Mendis, P. New advancements, challenges and opportunities of multi-storey modular buildings—A state-of-the-art review. Eng. Struct. 2019, 183, 883–893. [Google Scholar] [CrossRef]
  5. Zhang, J.; Wang, M.; Zhao, L.; Chen, M. Analysis of Factors Affecting Prefabricated Building Quality Based on ISM-BN. Sustainability 2023, 15, 9682. [Google Scholar] [CrossRef]
  6. Kurama, Y.C.; Sritharan, S.; Fleischman, R.B.; Restrepo, J.I.; Henry, R.S.; Cleland, N.M.; Ghosh, S.K.; Bonelli, P. Seismic-Resistant Precast Concrete Structures: State of the Art. J. Struct. Eng. 2018, 144, 03118001. [Google Scholar] [CrossRef]
  7. Vähä, P.; Heikkilä, T.; Kilpeläinen, P.; Järviluoma, M.; Gambao, E. Extending automation of building construction—Survey on potential sensor technologies and robotic applications. Autom. Constr. 2013, 36, 168–178. [Google Scholar] [CrossRef]
  8. Wu, C.; Liu, L.; Mou, B.; Pan, W.; Liu, J. Experimental and theoretical study on seismic behavior of connection between prefabricated steel-reinforced concrete column and base. Eng. Struct. 2023, 274, 115169. [Google Scholar] [CrossRef]
  9. Lou, G.; Li, Y.; Jia, G.; Chen, P. Research on bending behavior of angle steel lattice concrete composite beam. J. Build. Struct. 2024, 45, 230–242. [Google Scholar]
  10. Guo, X.; Gao, S.; Wang, L.; Bui, T.N. Bearing capacity of embedded channel-shaped steel connections at precast concrete beam end. Eng. Struct. 2018, 175, 177–190. [Google Scholar] [CrossRef]
  11. Yu, Y.; Liu, Y.; Tan, B.; Liu, Y.; Xue, Y. Experiments and FE Modeling on the Seismic Behavior of Partially Precast Steel-Reinforced Concrete Squat Walls. Buildings 2024, 14, 3441. [Google Scholar] [CrossRef]
  12. Chen, H.B.; Wu, L.W.; Jiang, H.; Liu, Y. Seismic performance of prefabricated middle frame composed of special-shaped columns with built-in lattice concrete-filled circular steel pipes. Structures 2021, 34, 1443–1457. [Google Scholar] [CrossRef]
  13. Tang, X.; Sun, H. Experimental research and design suggestion on static behavior of spatial steel frame concrete simply supported deep beam. J. Build. Struct. 2010, 31, 108–116. [Google Scholar]
  14. Tang, X.R.; He, B.L. Experimental study and design recommendations on seismic behavior of spatial steel frame concrete frame structures. J. Build. Struct. 2009, 30, 45–52. [Google Scholar]
  15. Wu, C.L.; Liu, J.M.; Tan, W.Y.; Wang, P.F. Seismic behavior of composite interior joints of prefabricated H-shaped steel reinforced concrete column—Steel beam. Structures 2020, 23, 558–572. [Google Scholar] [CrossRef]
  16. Wu, C.; Liu, Z.; Men, J.; Li, Z.; Ding, H.; Xiong, C.; Wang, X. Analysis of stress mechanism in a new prefabricated SRC composite column. Structures 2024, 59, 105695. [Google Scholar] [CrossRef]
  17. Xu, Z.-H.; Bai, G.L.; Zhao, J.Q.; Liu, B. Study on seismic performance of SRC leaning beam-column exterior joints in the main workshop of CAP1400 nuclear power plant. Structures 2021, 34, 2721–2734. [Google Scholar] [CrossRef]
  18. Xu, Z.H.; Bai, G.L.; Zhao, J.Q.; Liu, B. Study on seismic performance of SRC special-shaped interior joints in NPP. Eng. Struct. 2021, 234, 111736. [Google Scholar] [CrossRef]
  19. Tang, B.; Ruan, H.; Li, Y. Design and construction of 24 m-long-span lattice SRC transfer structure. Ind. Constr. 2008, 38, 96–98. [Google Scholar]
  20. Eom, T.S.; Hwang, H.J.; Park, H.G.; Lee, C.N.; Kim, H.S. Flexural Test for Steel-Concrete Composite Members Using Prefabricated Steel Angles. J. Struct. Eng. 2014, 140, 04013094. [Google Scholar] [CrossRef]
  21. Xue, J.; Qi, L.; Gao, L.; Liu, Z. Mechanical behavior of lattice steel reinforced concrete inner frame with irregular section columns under cyclic reversed loading. Eng. Struct. 2016, 128, 225–236. [Google Scholar] [CrossRef]
  22. Ding, J.; Zou, Y.; Wang, C.Q.; Zhou, H.F.; Li, T.Q. Investigation on flexural behavior of a new-type composite column with steel angles. J. Asian Archit. Build. Eng. 2020, 19, 458–479. [Google Scholar] [CrossRef]
  23. Kim, H.-J.; Hwang, H.-J.; Park, H.-G. Flexural testing for composite members with bolt-connected steel angles. Eng. Struct. 2021, 230, 111638. [Google Scholar] [CrossRef]
  24. JGJ369-2016; Code for Design of Concrete Structures. China Architecture & Building Press: Beijing, China, 2016.
  25. GB 55008-2021; General Code for Concrete Structures. China Architecture & Building Press: Beijing, China, 2021.
  26. GB/T 50152-2012; Standard for Test Method of Concrete Structures. China Architecture & Building Press: Beijing, China, 2012.
  27. Guo, J.Q.; Xiong, E.G.; Yang, K. Analysis and calculation for flexural capacity of symmetrically reinforced concrete beams. J. Chang’An Univ. Nat. Sci. Ed. 2011, 31, 72–76. [Google Scholar]
Figure 1. This is the lattice SRC joint: (a) Schematic diagram of the lattice-type SRC connection node. (b) The new-type SRC connection node on site.
Buildings 15 03473 g001
Figure 2. Schematic diagrams of the specimens (mm): (a) GL1; (b) GL2; (c) GL3; (d) GL4.
Buildings 15 03473 g002aBuildings 15 03473 g002b
Figure 3. Measurements of the specimens: (a) Strain gauges of the steel. (b) The diagram of strain gauges. (c) Strain gauges of the concrete. (d) Horizontal LVDTs of the specimens. (e) Sign conventions of gauges. (f) Experimental data acquisition system.
Buildings 15 03473 g003
Figure 4. Schematic diagrams of the test devices.
Buildings 15 03473 g004
Figure 5. Crack pattern of the specimens: (a) GL1; (b) GL2; (c) GL3; (d) GL4.
Buildings 15 03473 g005aBuildings 15 03473 g005b
Figure 6. Experimental behaviors of the specimens: (a) microcrack; (b) concrete crushing.
Buildings 15 03473 g006
Figure 7. Comparison of load–displacement curves: Pcr,GL1, Pcr,GL2, Pcr,GL3, Pcr,GL4, Pcr,LH indicate the cracking load of components separately; GL1yu, GL2yu, GL3yu, GL4yu, LHyu indicate the load and mid-span displacement at yield condition separately; GL1u, GL2u, GL3u, GL4u, LHu indicate the load and mid-span displacement at the ultimate state separately.
Buildings 15 03473 g007
Figure 8. Strain curves of the basic specimen: (a) experimental curves of steel train; (b) comparison of SRC and RC curves.
Buildings 15 03473 g008
Figure 9. Concrete strain analysis of the basic specimen: (a) concrete strain of the basic specimen; (b) vertical strain distribution of the mid-span section.
Buildings 15 03473 g009
Figure 10. Deformation analysis of the cross-section: (a) cross-section of the basic specimen; (b) comparison of strain curves.
Buildings 15 03473 g010
Figure 11. Parameters of the FEM model: (a) single axis stress–strain of the concrete curve; (b) equivalent strain of the steel curve.
Buildings 15 03473 g011
Figure 12. Comparison of experimental and numerical curves: (a) GL1; (b) GL2; (c) GL3; (d) GL4.
Buildings 15 03473 g012aBuildings 15 03473 g012b
Figure 13. Numerical analysis of phenomenon in experimental process: (a) equivalent strain of steel truss; (b) equivalent strain of concrete; (c) FEM analysis of the microcrack; (d) FEM analysis of the microcrack.
Buildings 15 03473 g013
Figure 14. Results of FE models with different parameters: (a) Load–displacement curves of PSRCB-0 and C1/2. (b) Generalized stiffness of PSRCB-0 and C1/2. (c) Load–displacement curves of PSRCB-0 and S1/2. (d) Generalized stiffness of PSRCB-0 and S1/2. (e) Load–displacement curves of PSRCB-0 and TS1/2. (f) Generalized stiffness of PSRCB-0 and TS1/2. (g) Load–displacement curves of PSRCB-0 and TC1/2. (h) Generalized stiffness of PSRCB-0 and TS1/2. (i) Load–displacement curves of PSRCB-0 and D1. (j) Generalized stiffness of PSRCB-0 and D1.
Buildings 15 03473 g014aBuildings 15 03473 g014b
Figure 15. Comparison of parameters: (a) comparison of parameters ratio; (b) comparison of ductility coefficient.
Buildings 15 03473 g015
Figure 16. SRC calculation diagram: (a) cross-section; (b) strain distribution; (c) curve stress distribution; (d) equivalent rectangle stress distribution.
Buildings 15 03473 g016
Table 1. Construction details of the specimens.
LabelBeam Section b × h × l (mm)SteelThickness of Steel
tw (mm)
Steel Wire MeshWidth of Cover
cl (mm)
Strips/Hoop (mm)
GL1200 × 400 × 4000Q3556 30−20 × 5@100/200
GL2200 × 400 × 4000Q355630−20 × 5@200/400
GL3200 × 400 × 4000Q3558 50−20 × 5@100/200
GL4200 × 400 × 4000Q355630−20 × 5@100/200
LH200 × 400 × 4000HRB 4008 30Ф8@100/200
Table 2. Material properties of the specimens.
MaterialThickness (mm)fy (MPa)fu (MPa)fc (MPa)
Steel (Q235)6335417-
Steel (Q355)10399522-
Concrete (C30)---32.5
Table 3. Dimensional tolerance of specimens.
LabelGL1GL2GL3GL4
Upper steel plate6.10 (1.67%)5.97 (0.50%)7.98 (0.25%)5.92 (1.33%)
Below steel plate5.83 (2.83%)5.97 (0.50%)7.97 (0.38%)5.94 (1.00%)
Length of the specimen4008.8 (0.2%)4008.4 (0.2%)4010.1 (0.3%)3991.8 (0.2%)
Height of sections400.1 (0.03%)403.6 (9.0%)401.4 (0.4%)399.7 (0.08%)
Width of sections201.1 (0.6%)201.4 (0.7%)202.7 (1.35%)199.8 (0.1%)
Table 4. Test results.
LabelPcr
(kN)
Pyu
(kN)
Dyu
(mm)
Pu
(kN)
Du
(mm)
k1
(×103 kN/m)
Du/Dy
GL14018023.83187.5478.5937.423.3
GL229.5185.523.01196.6288.4941.313.8
GL33717733.10192.6288.4538.682.7
GL44618617.38223.4584.2838.084.8
LH5815816.62164.9837.7527.662.3
Table 5. Parameter of FEM.
LabelConcreteSteelThickness of Steel (mm)Thickness of Cover (mm)Distance of Hoop (mm)
PSRCB-0C30Q35563020
PSRCB-C1/C2C40, C50Q35563020
PSRCB-S1/S2C30Q275, Q39063020
PSRCB-TS1/TS2C30Q3358, 103020
PSRCB-TC1/TC2C30Q335640, 5020
PSRCB-D1C30Q33563040
Table 6. Comparison of calculation and test results.
LabelUltimate Capacity
Fu (kN)
Calculation Capacity
Fc (kN)
Ding et al. [22]Kim et al. [23]
SRCB-0189.54172.41 (0.91)150.38 (0.79)158.48 (0.83)
SRCB-C1205.26174.05 (0.85)150.38 (0.73)158.48 (0.77)
SRCB-C2206.25175.69 (0.85)150.38 (0.72)158.48 (0.76)
SRCB-S1166.94145.99 (0.87)134.67 (0.80)141.93 (0.85)
SRCB-S2227.03193.17 (0.85)179.56 (0.79)189.24 (0.83)
SRCB-TS1229.28192.45 (0.84)199.31 (0.86)210.71 (0.91)
SRCB-TS2269.01236.40 (0.88)247.63 (0.92)262.64 (0.97)
SRCB-TC1163.33129.63 (0.79)123.37 (0.75)133.72 (0.81)
SRCB-TC2147.91120.65 (0.82)109.86 (0.74)122.47 (0.82)
SRCB-D1175.32172.41 (0.98)150.38 (0.85)158.48 (0.90)
Disclaimer/Publisher’s Note: The statements, opinions and data contained in all publications are solely those of the individual author(s) and contributor(s) and not of MDPI and/or the editor(s). MDPI and/or the editor(s) disclaim responsibility for any injury to people or property resulting from any ideas, methods, instructions or products referred to in the content.