Article

Progressive Collapse Resistance of Steel Frames with Reduced Beam Sections and Web Openings

1
Materials, Geomaterials and Environment Laboratory (LMGE), Faculty of Technology, Department of Civil Engineering, Badji Mokhtar-Annaba University, P.O. Box 12, Annaba 23000, Algeria
2
Faculty of Sciences and Technology, Department of Civil Engineering, Chadli Bendjedid-El Tarf University, P.O. Box 73, El Tarf 36000, Algeria
3
Department of Civil Engineering, Jamia Millia Islamia, New Delhi 110025, India
4
Faculty of Technology, Department of Civil Engineering, Badji Mokhtar-Annaba University, P.O. Box 12, Annaba 23000, Algeria
5
Civil Engineering Department, Istanbul Gelisim University, Avcilar 34310, Turkey
6
Research Institute of Clean Growth and Future Mobility, Coventry University, Priory Street, Coventry CV1 5FB, UK
*
Author to whom correspondence should be addressed.
Buildings 2025, 15(19), 3443; https://doi.org/10.3390/buildings15193443
Submission received: 6 September 2025 / Revised: 19 September 2025 / Accepted: 21 September 2025 / Published: 23 September 2025
(This article belongs to the Section Building Structures)

Abstract

Progressive collapse represents a critical failure scenario in steel moment-resisting frames, especially when beam sections are intentionally weakened through flange cuts or web openings. While previous studies reported that circular openings were the most effective configuration among various shapes, the present study investigates whether semi-circular openings, when combined with reduced beam sections (RBS), can provide superior performance. A finite element model was developed in ABAQUS/Explicit v2016 and validated against experimental results to ensure reliability. Parametric analyses considered both circular and semi-circular openings with diameters of 80 mm and 110 mm, placed at various distances from the RBS centerline (L = 0, 65, 140, and 180 mm). The results show that openings located too close to the RBS zone (L = 0 mm and L = 65 mm) significantly reduced strength and suppressed catenary action. Conversely, larger spacings (L = 140 mm and L = 180 mm) enhanced load capacity and ductility by promoting stress redistribution. Importantly, semi-circular openings consistently outperformed circular ones in the present investigation. In particular, the SC3-140-110 specimen achieved the highest peak load (248.7 kN) and the strongest catenary action contribution (227.6 kN), demonstrating superior robustness against progressive collapse. These findings highlight the technical advantage of semi-circular openings as an effective detailing strategy for improving the collapse resistance of steel moment frames.

1. Introduction

In recent years, researchers in structural engineering have shown great interest in how buildings respond to earthquakes, fires, and other natural hazards. Most of the published work has focused on earthquakes and natural disasters. Studies on progressive collapse are limited. This is surprising because these same hazards often trigger progressive collapse [1]. Famous failures such as the Ronan Point building and the FIU Pedestrian Bridge are clear examples [2,3,4,5,6,7].
Progressive collapse is different from ordinary structural failures. In a normal failure, damage usually stays in one area. But in progressive collapse, a small local problem, such as the loss of one column, can spread rapidly and cause total structural failure. This chain reaction makes progressive collapse one of the most challenging problems in structural mechanics. It requires close scientific attention and strong design solutions.
Many studies have shown that the sudden loss of a column is a critical case when evaluating the progressive collapse of steel structures. For example, Kim and Park [8] studied steel moment frames under column loss using nonlinear analysis. They found that conventional frames were weak, but plastic design methods based on virtual work improved resistance. When beams and columns were redesigned to follow the strong column–weak beam principle, the frames met GSA guidelines [9]. Pantidis and Gerasimidis [10] proposed a simplified analytical method for steel–concrete buildings. Their method identified whether yielding or instability would control the collapse. They validated it on a nine-story building and showed good agreement with simulations. Ferraioli [11] suggested a modal pushdown method based on a nonlinear single-degree-of-freedom model. It captured dynamic effects without needing a fixed increase factor. The method matched results from nonlinear simulations and proved useful for assessing robustness.
A key factor in resisting progressive collapse is how the structure shifts from bending (flexural action) to stretching (tensile action) when a column is lost. This shift creates catenary action, where beams act like tension cables. For this to work, the beam–column connections must be strong enough to handle high axial forces [12]. Stylianidis and Bellos [13] reviewed the role of these connections. They concluded that strength, stiffness, and deformation capacity are essential. But they also noted that connections must work in balance with surrounding elements to avoid new failure modes. Faridmehr and Baghban [14] tested different steel beam–column connections at full scale. They found that rigid connections performed much better than flexible ones because they developed higher tension and rotation capacity, making catenary action possible.
Design guidelines such as FEMA-350 [15] suggest ways to improve ductility and energy dissipation in steel connections. One common method is the Reduced Beam Section (RBS), where parts of the beam flange are cut to force plastic hinges away from the column face. Another method is the Reduced Web Section (RWS), where holes are added in the web for the same reason. Both aim to shift damage away from the joint area.
Several researchers have studied these techniques. Qian et al. [16] tested two-storey frames with welded seismic connections. They compared Gross Beam Section (GBS) joints with RBS joints. The RBS performed much better, carrying higher loads and allowing larger deformations. This was because the intentional flange cuts moved plastic hinges away from the welds. In contrast, GBS joints often fractured early at the welds. They also observed that at large displacements, catenary action became important. Boushehri et al. [17] studied RWS connections through finite element analysis. They looked at the effects of opening size, position, and beam span. Their results confirmed that RWS could improve ductility by reducing stress at the welds. Chen et al. [18] carried out nine experiments on different joint configurations with and without RBS detailing. They found that RBS joints showed much better ductility and rotation, nearly double compared to conventional joints. Welded web connections performed especially well, activating catenary action at large deformations.
Most past studies have treated RBS and RWS separately. Very few have looked at the combined effect of flange cuts and web openings. Qiao et al. [19] expanded on earlier work by testing nine full-scale specimens under a column removal scenario. They grouped them into three types: RBS0 with no modifications, RBS1 with only flange cuts, and RBS2 with both flange cuts and web openings. The results were clear. RBS0 fractured early. RBS1 performed better but still had weaknesses. RBS2 performed the best, showing stable deformation, delayed fractures, and better energy dissipation. The web openings promoted arching action along with catenary action, which increased resistance to collapse.
Altheeb et al. [12] carried out numerical studies on 3D frames with RBS and different web opening shapes. Their simulations, calibrated against experiments, showed that circular openings gave the best performance. Circular holes spread stress more evenly, delayed fracture, and improved both arching and catenary mechanisms. This improved the energy absorption and overall robustness of the frames.
Despite these efforts, the combined effect of flange weakening and web openings is still not fully understood. To address this gap, the present study uses ABAQUS/Explicit v2016 for numerical analysis. The models are validated against experimental results to ensure reliability. The study focuses on failure patterns, load–displacement behavior, and the role of catenary action in resisting collapse after a middle column is removed.

2. Description and Validation of Finite Element Model

This section explains how the finite element (FE) model was developed and then checked against two separate experimental studies.

2.1. Material Modelling and Damage

The model was built to capture the nonlinear behavior of steel when it undergoes large deformations. Both geometric and material nonlinearities were considered. The stress–strain curve of steel was simplified into a bilinear model. The elastic modulus was set to 200,000 MPa, Poisson’s ratio to 0.3, and the density to 7850 kg/m3.
The material properties of various steel elements, as reported in previous experimental studies by Chen et al. [18] and Alrubaidi et al. [20], are summarized in Table 1. The properties taken from [18] are denoted as Set A, while those from [20] are denoted as Set B.
Material nonlinearity was fully accounted for in the FE simulations. Steel components were modeled using a bilinear elastoplastic constitutive law with isotropic hardening, thereby enabling accurate representation of yielding, strain redistribution, and post-yield deformation capacity. Fracture was modeled using the ductile damage option in ABAQUS v2016 [21,22,23,24]. This method relies on element deletion: once the fracture strain reaches a critical value, the affected elements are gradually removed. This prevents excessive mesh distortion in zones of high tensile stress. Damage evolution was linked to stress triaxiality, strain rate, and fracture strain, which helped simulate crack growth realistically [24,25,26].

2.2. Solver Type and Loading

The simulations were carried out using ABAQUS/Explicit v2016 [21]. Nonlinear analyses were carried out using Abaqus/Explicit to capture large deformations, yielding, and fracture in the beams and connections [20]. This approach was selected because implicit static solvers often encounter convergence issues once material softening and instability occur. The explicit procedure, combined with appropriate mass scaling control, ensures stable progression of the simulation even beyond the yield point. Quasi-static conditions were verified by maintaining the ratio of kinetic to internal energy (KE/IE) below 5% [21]. This allowed the models to reproduce the initiation and evolution of plastic hinges and local fracture with sufficient robustness. A displacement-controlled vertical loading was applied to represent sudden column loss. The loading rate was kept very low to minimize inertial effects.

2.3. Mesh, Constraints and Interactions

Three-dimensional solid brick elements (C3D8R) were used to model the steel parts [12]. These elements, with reduced integration, provided a good balance between accuracy and computational cost.
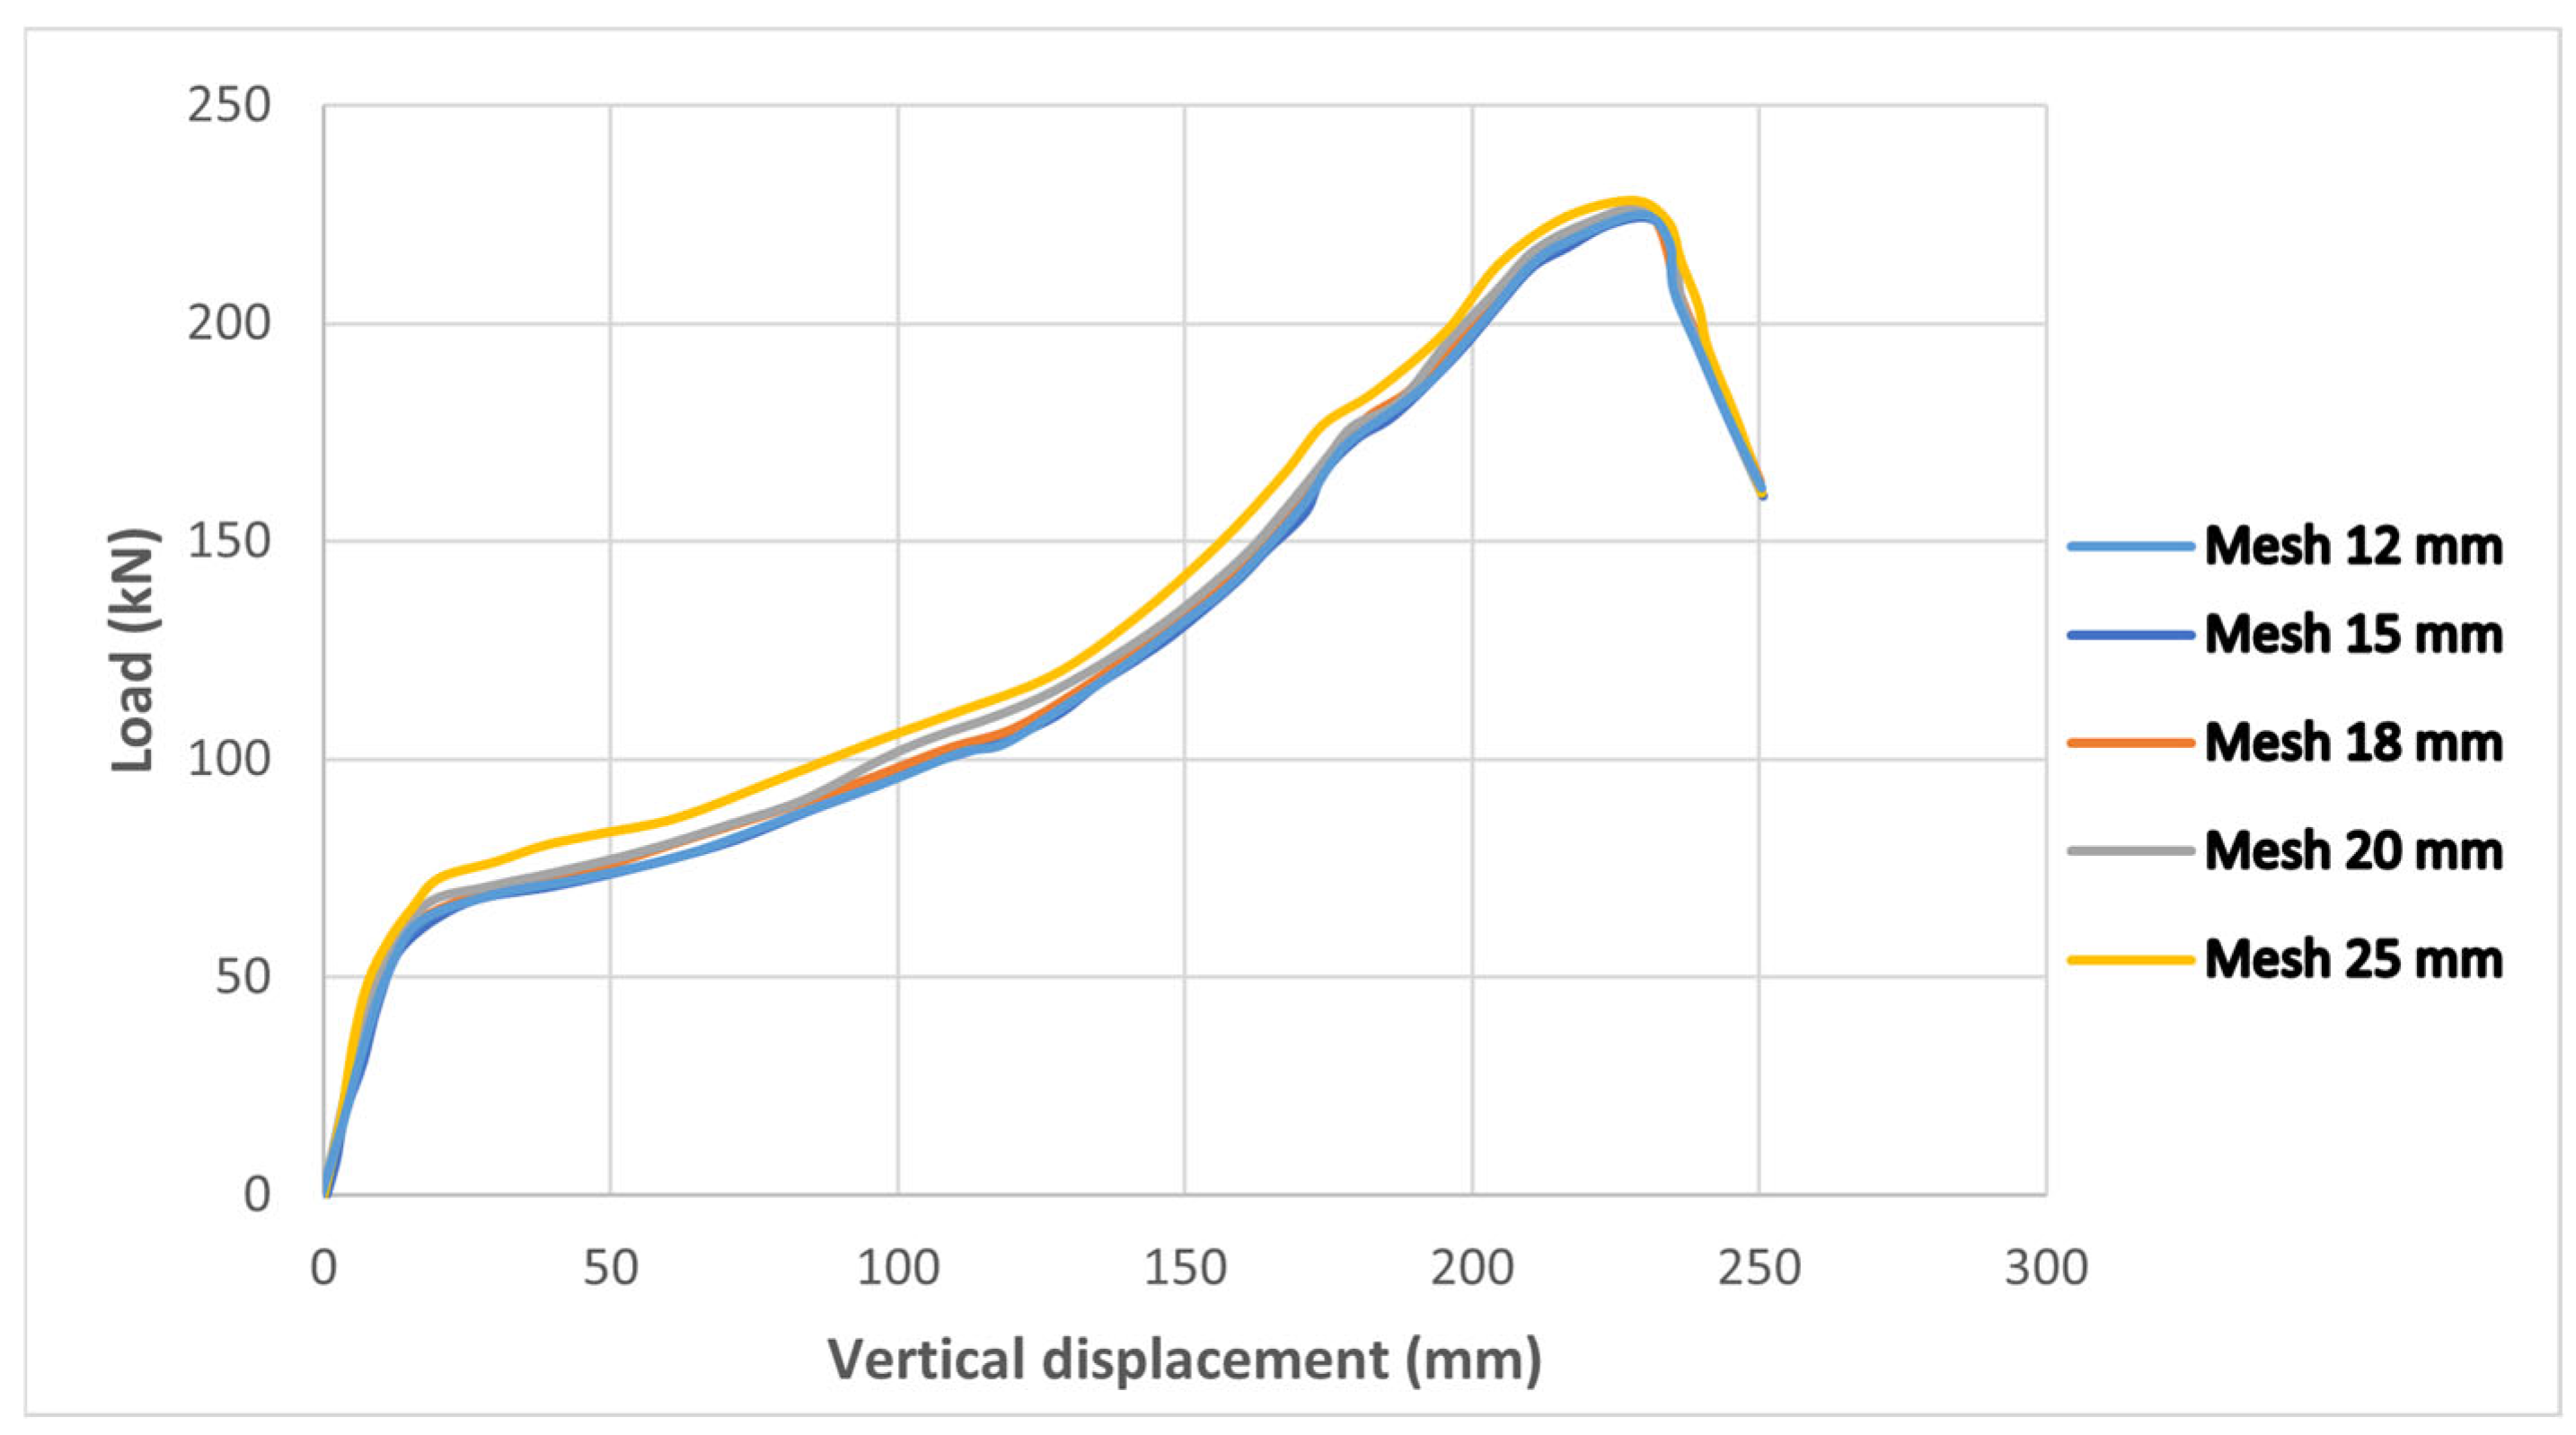
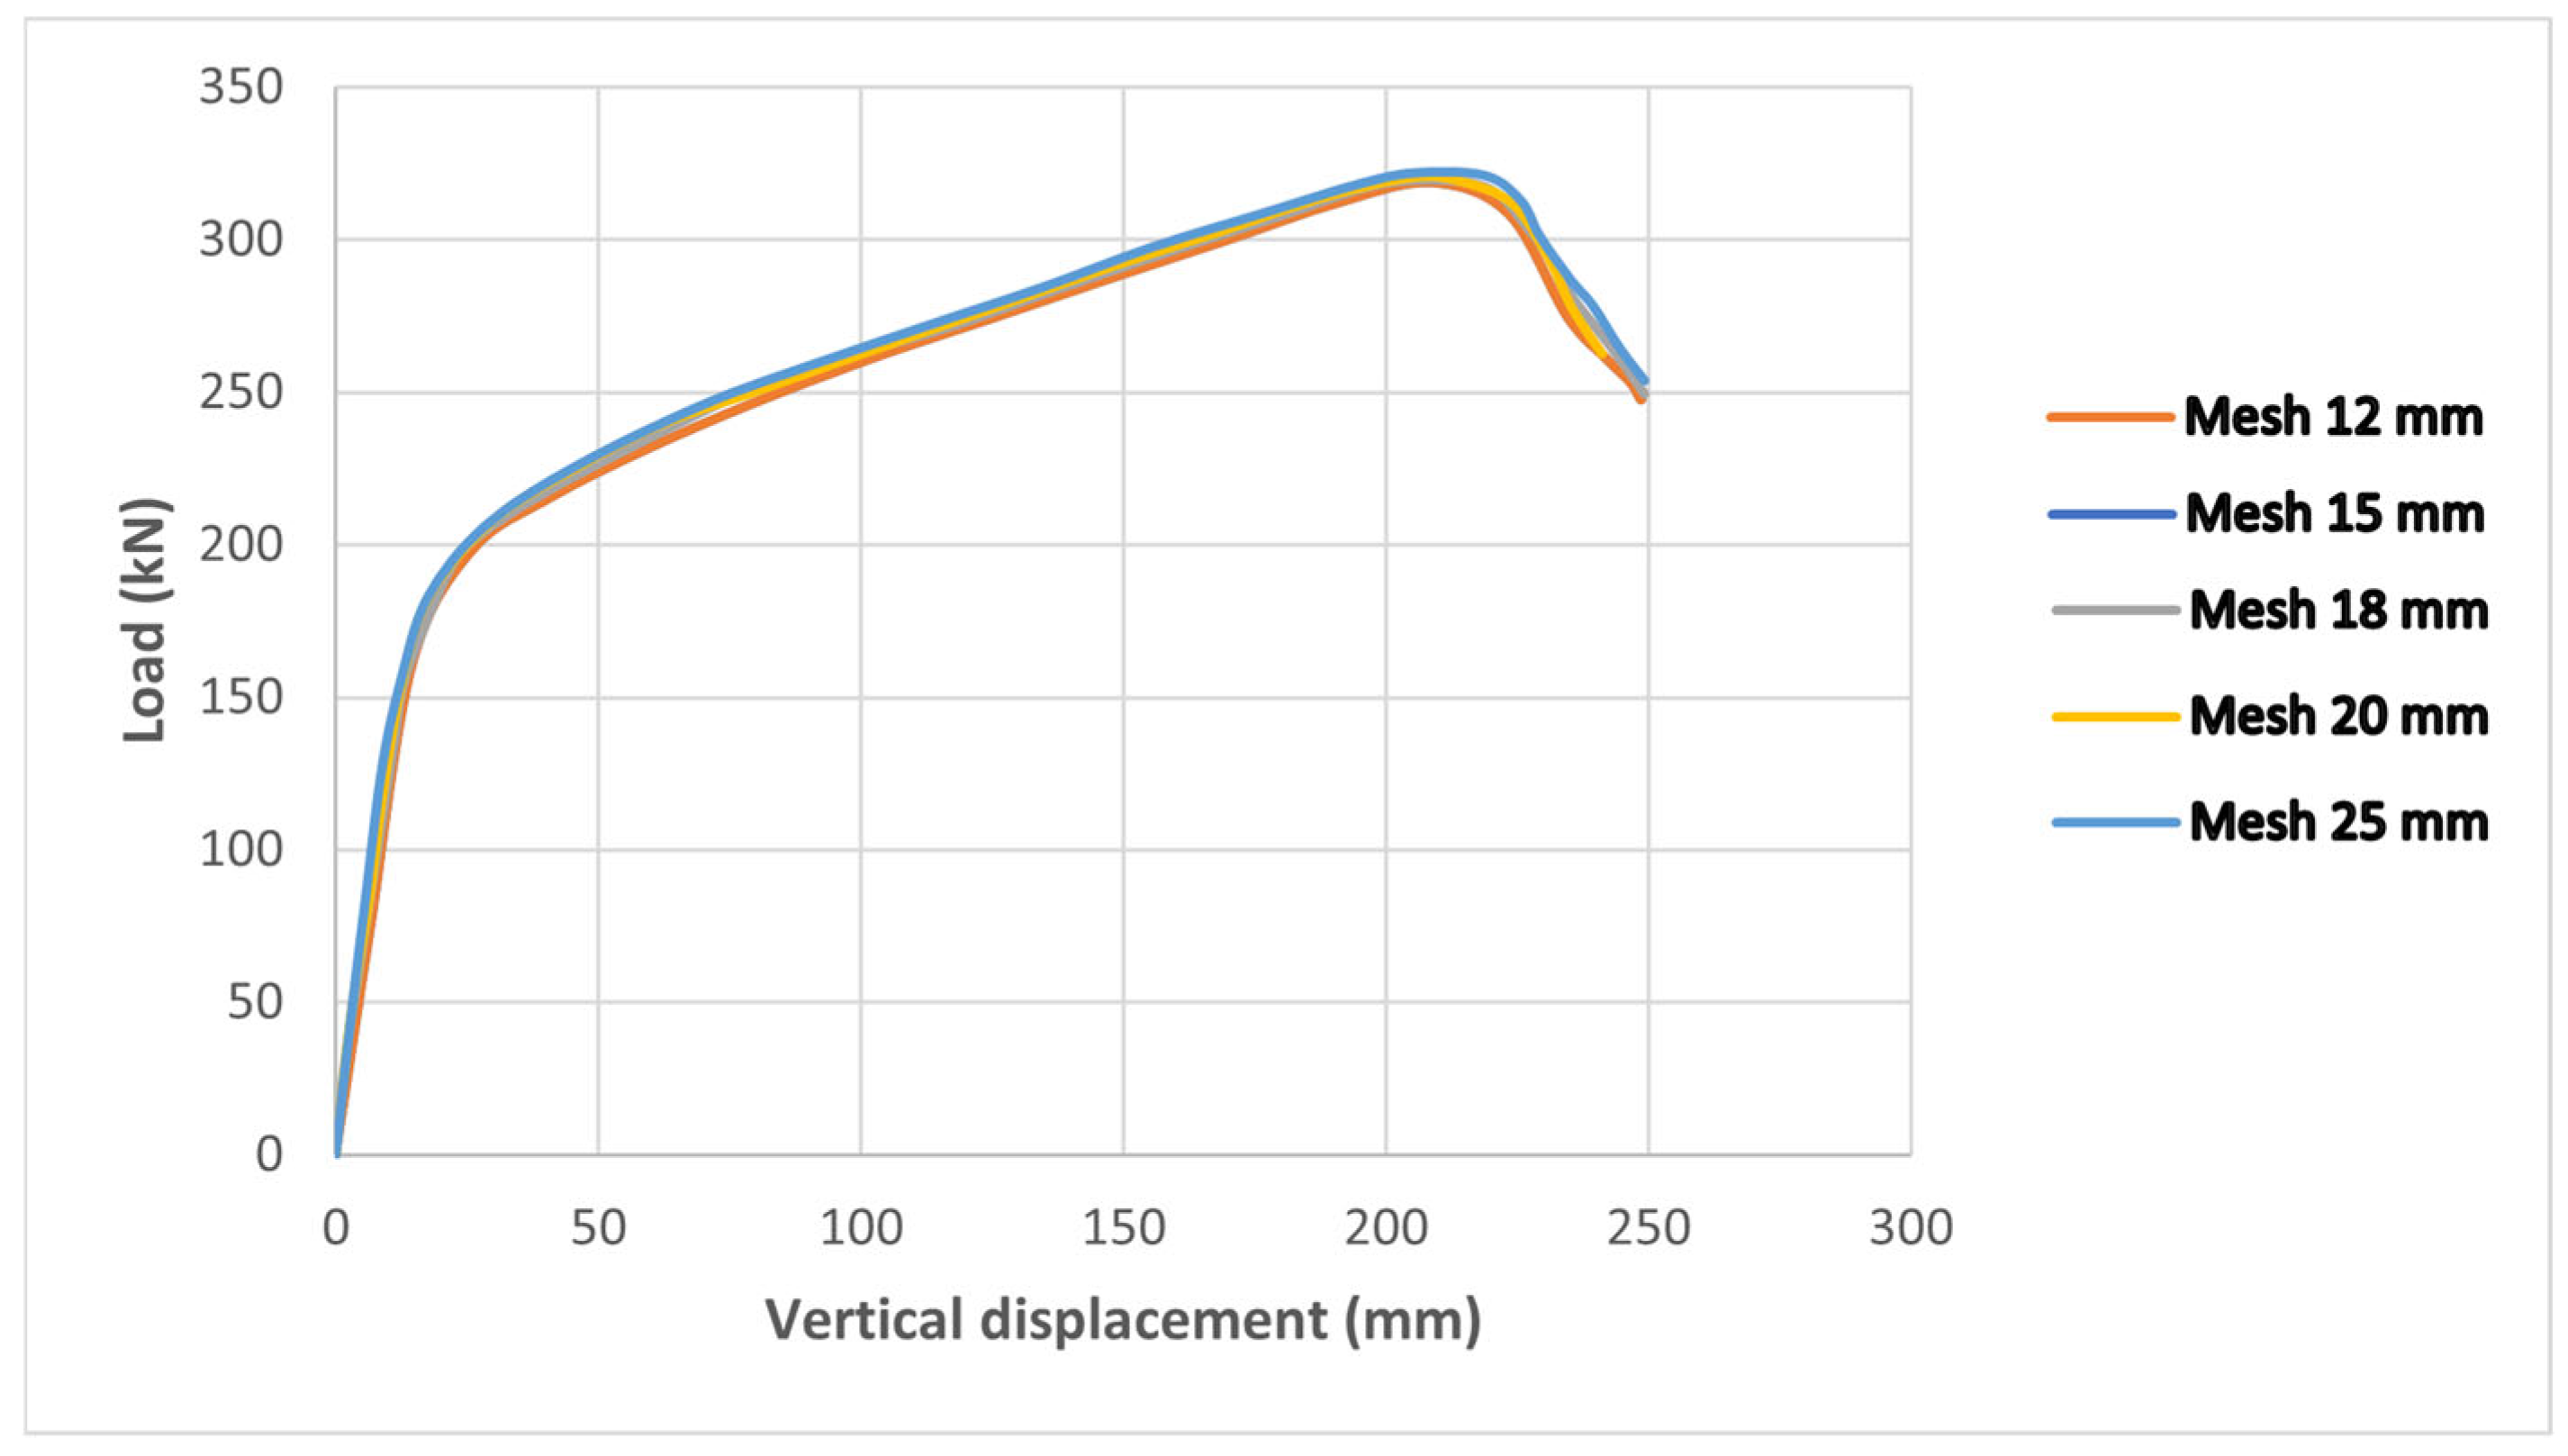
A mesh sensitivity study was carried out on validation models using element sizes of 25, 20, 18, 15, and 12 mm (Figure 1 and Figure 2). Figure 1 presents the mesh sensitivity analysis conducted for the experimental test carried out by Chen et al. [18], while Figure 2 illustrates the corresponding mesh sensitivity analysis for the experimental program reported by Alrubaidi et al. [20]. The results confirmed that the global response converged, with only minor variations once the mesh reached 15 mm. Accordingly, a 15 mm discretization was adopted for the overall model to maintain an appropriate balance between accuracy and computational cost, which is particularly important for explicit simulations. In the reduced beam section and around the web openings, where stress concentration and fracture are critical, a finer mesh of 8 mm was introduced to ensure accurate representation of local damage and failure mechanisms (Figure 3).
Load and support plates were modeled as rigid bodies. They were connected to reference points through coupling constraints. Welded joints were represented using the “Tie” constraint, avoiding the need to model weld geometry explicitly.

2.4. Boundary Conditions

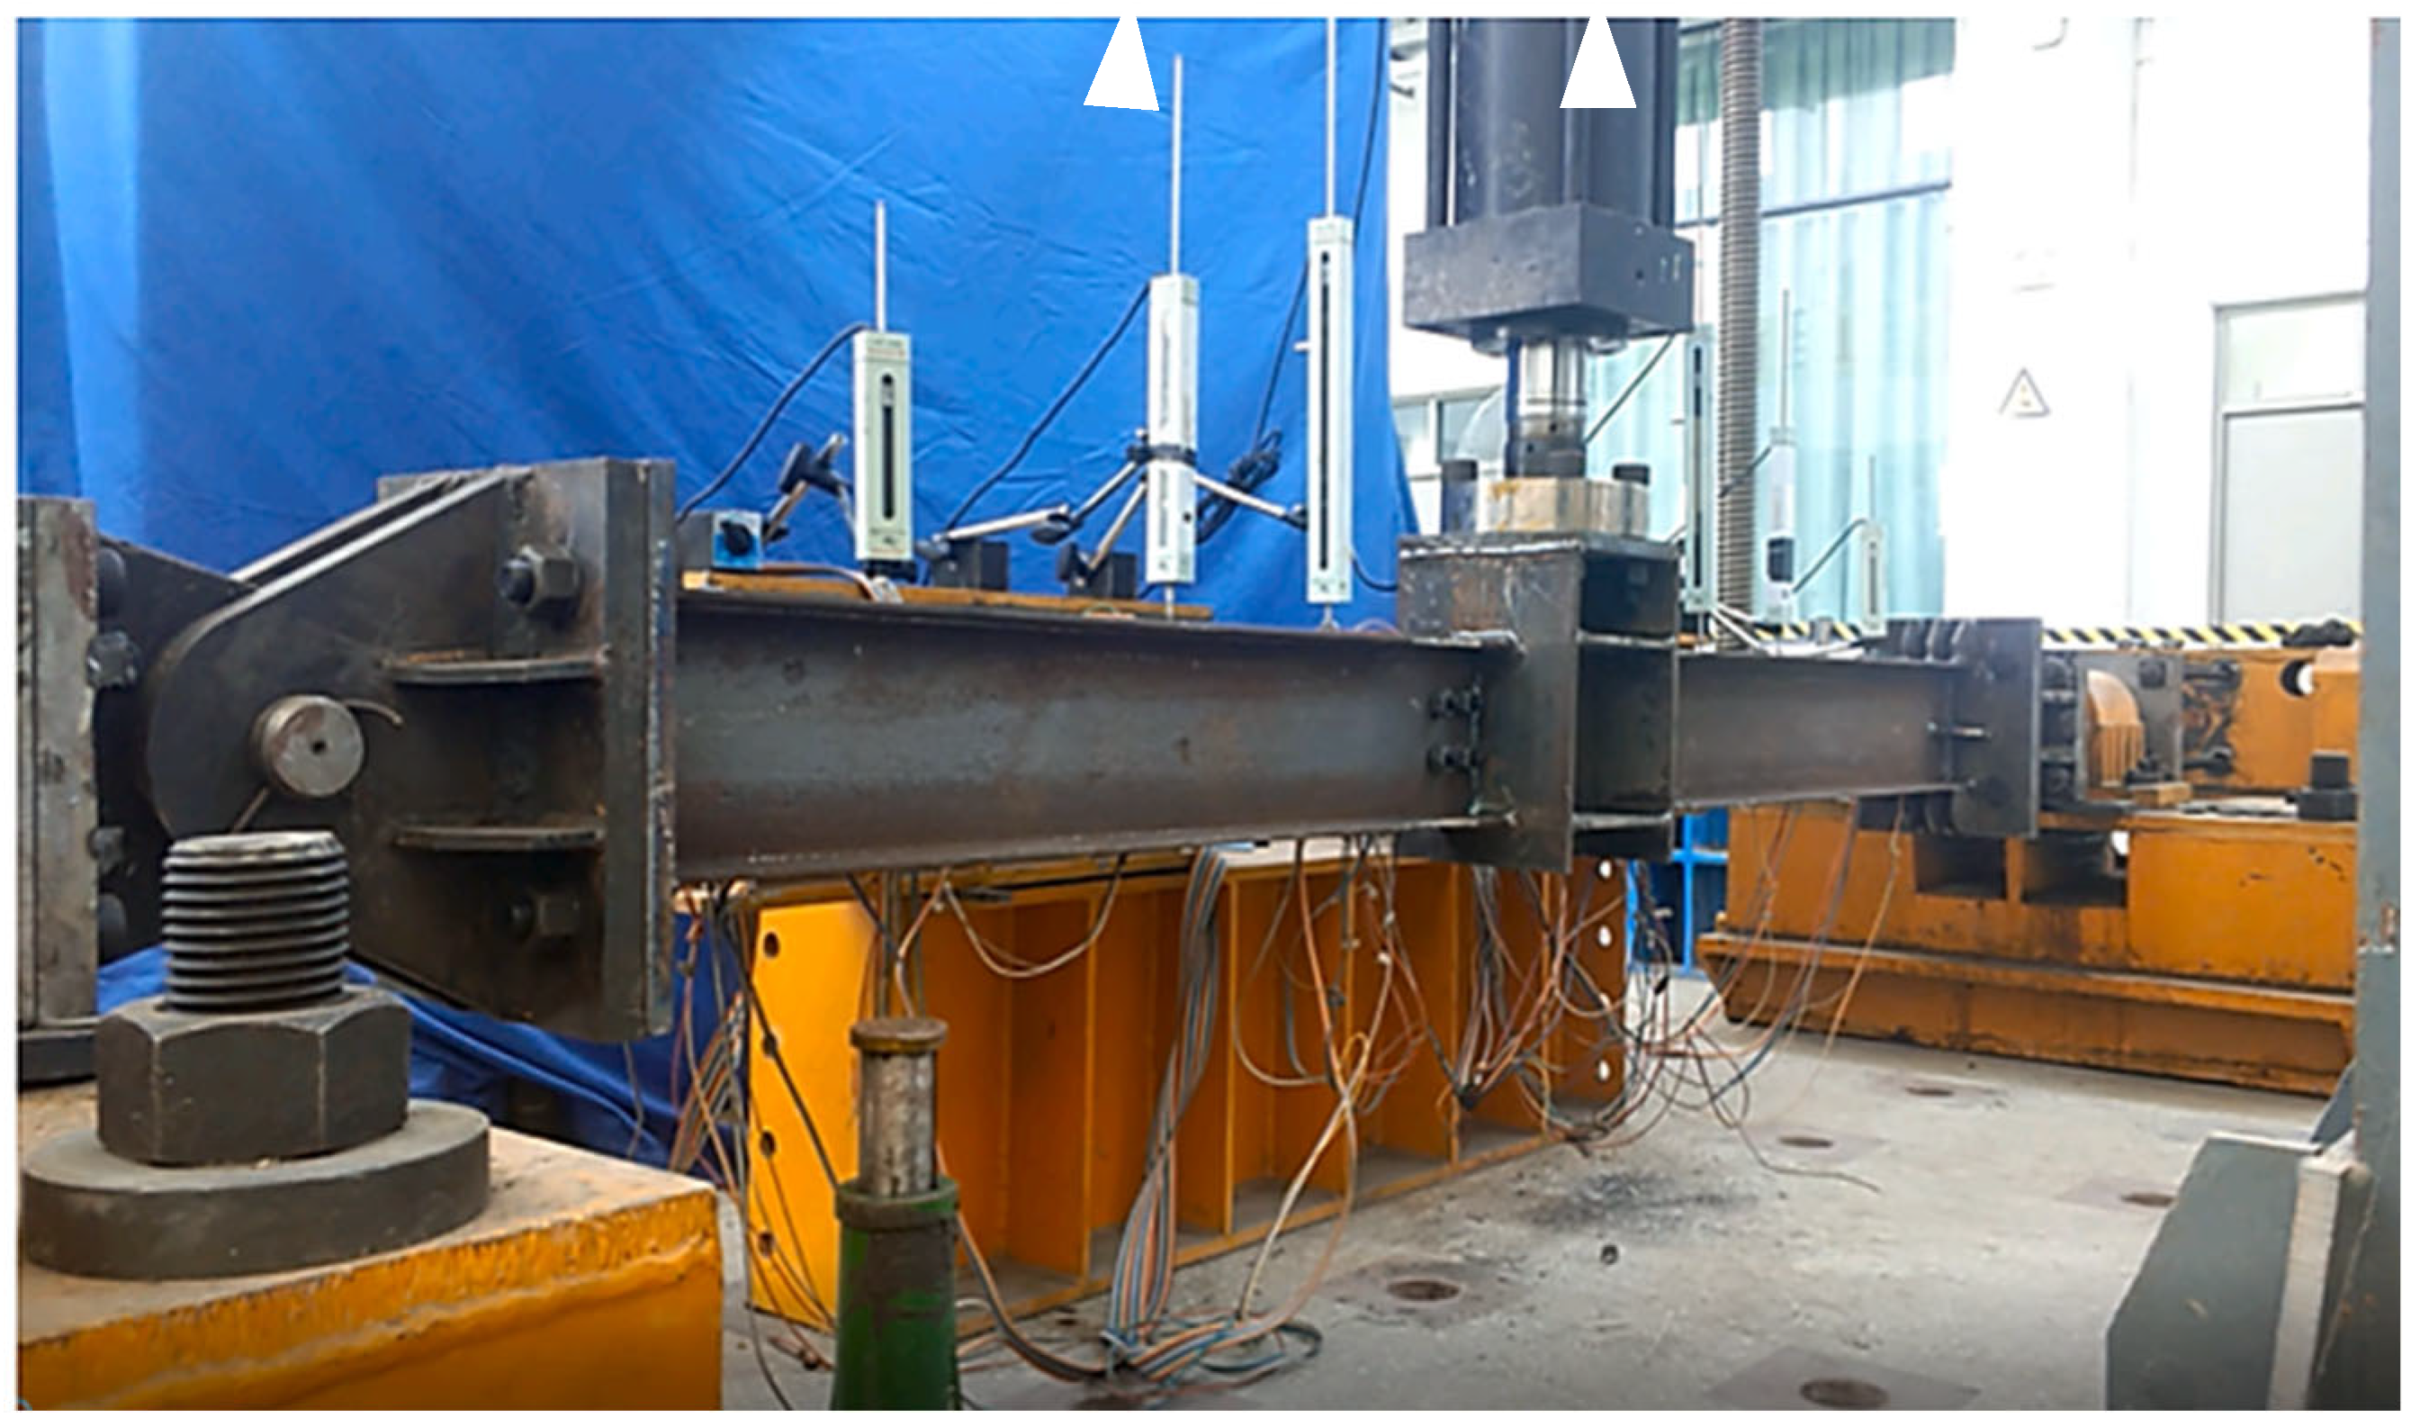
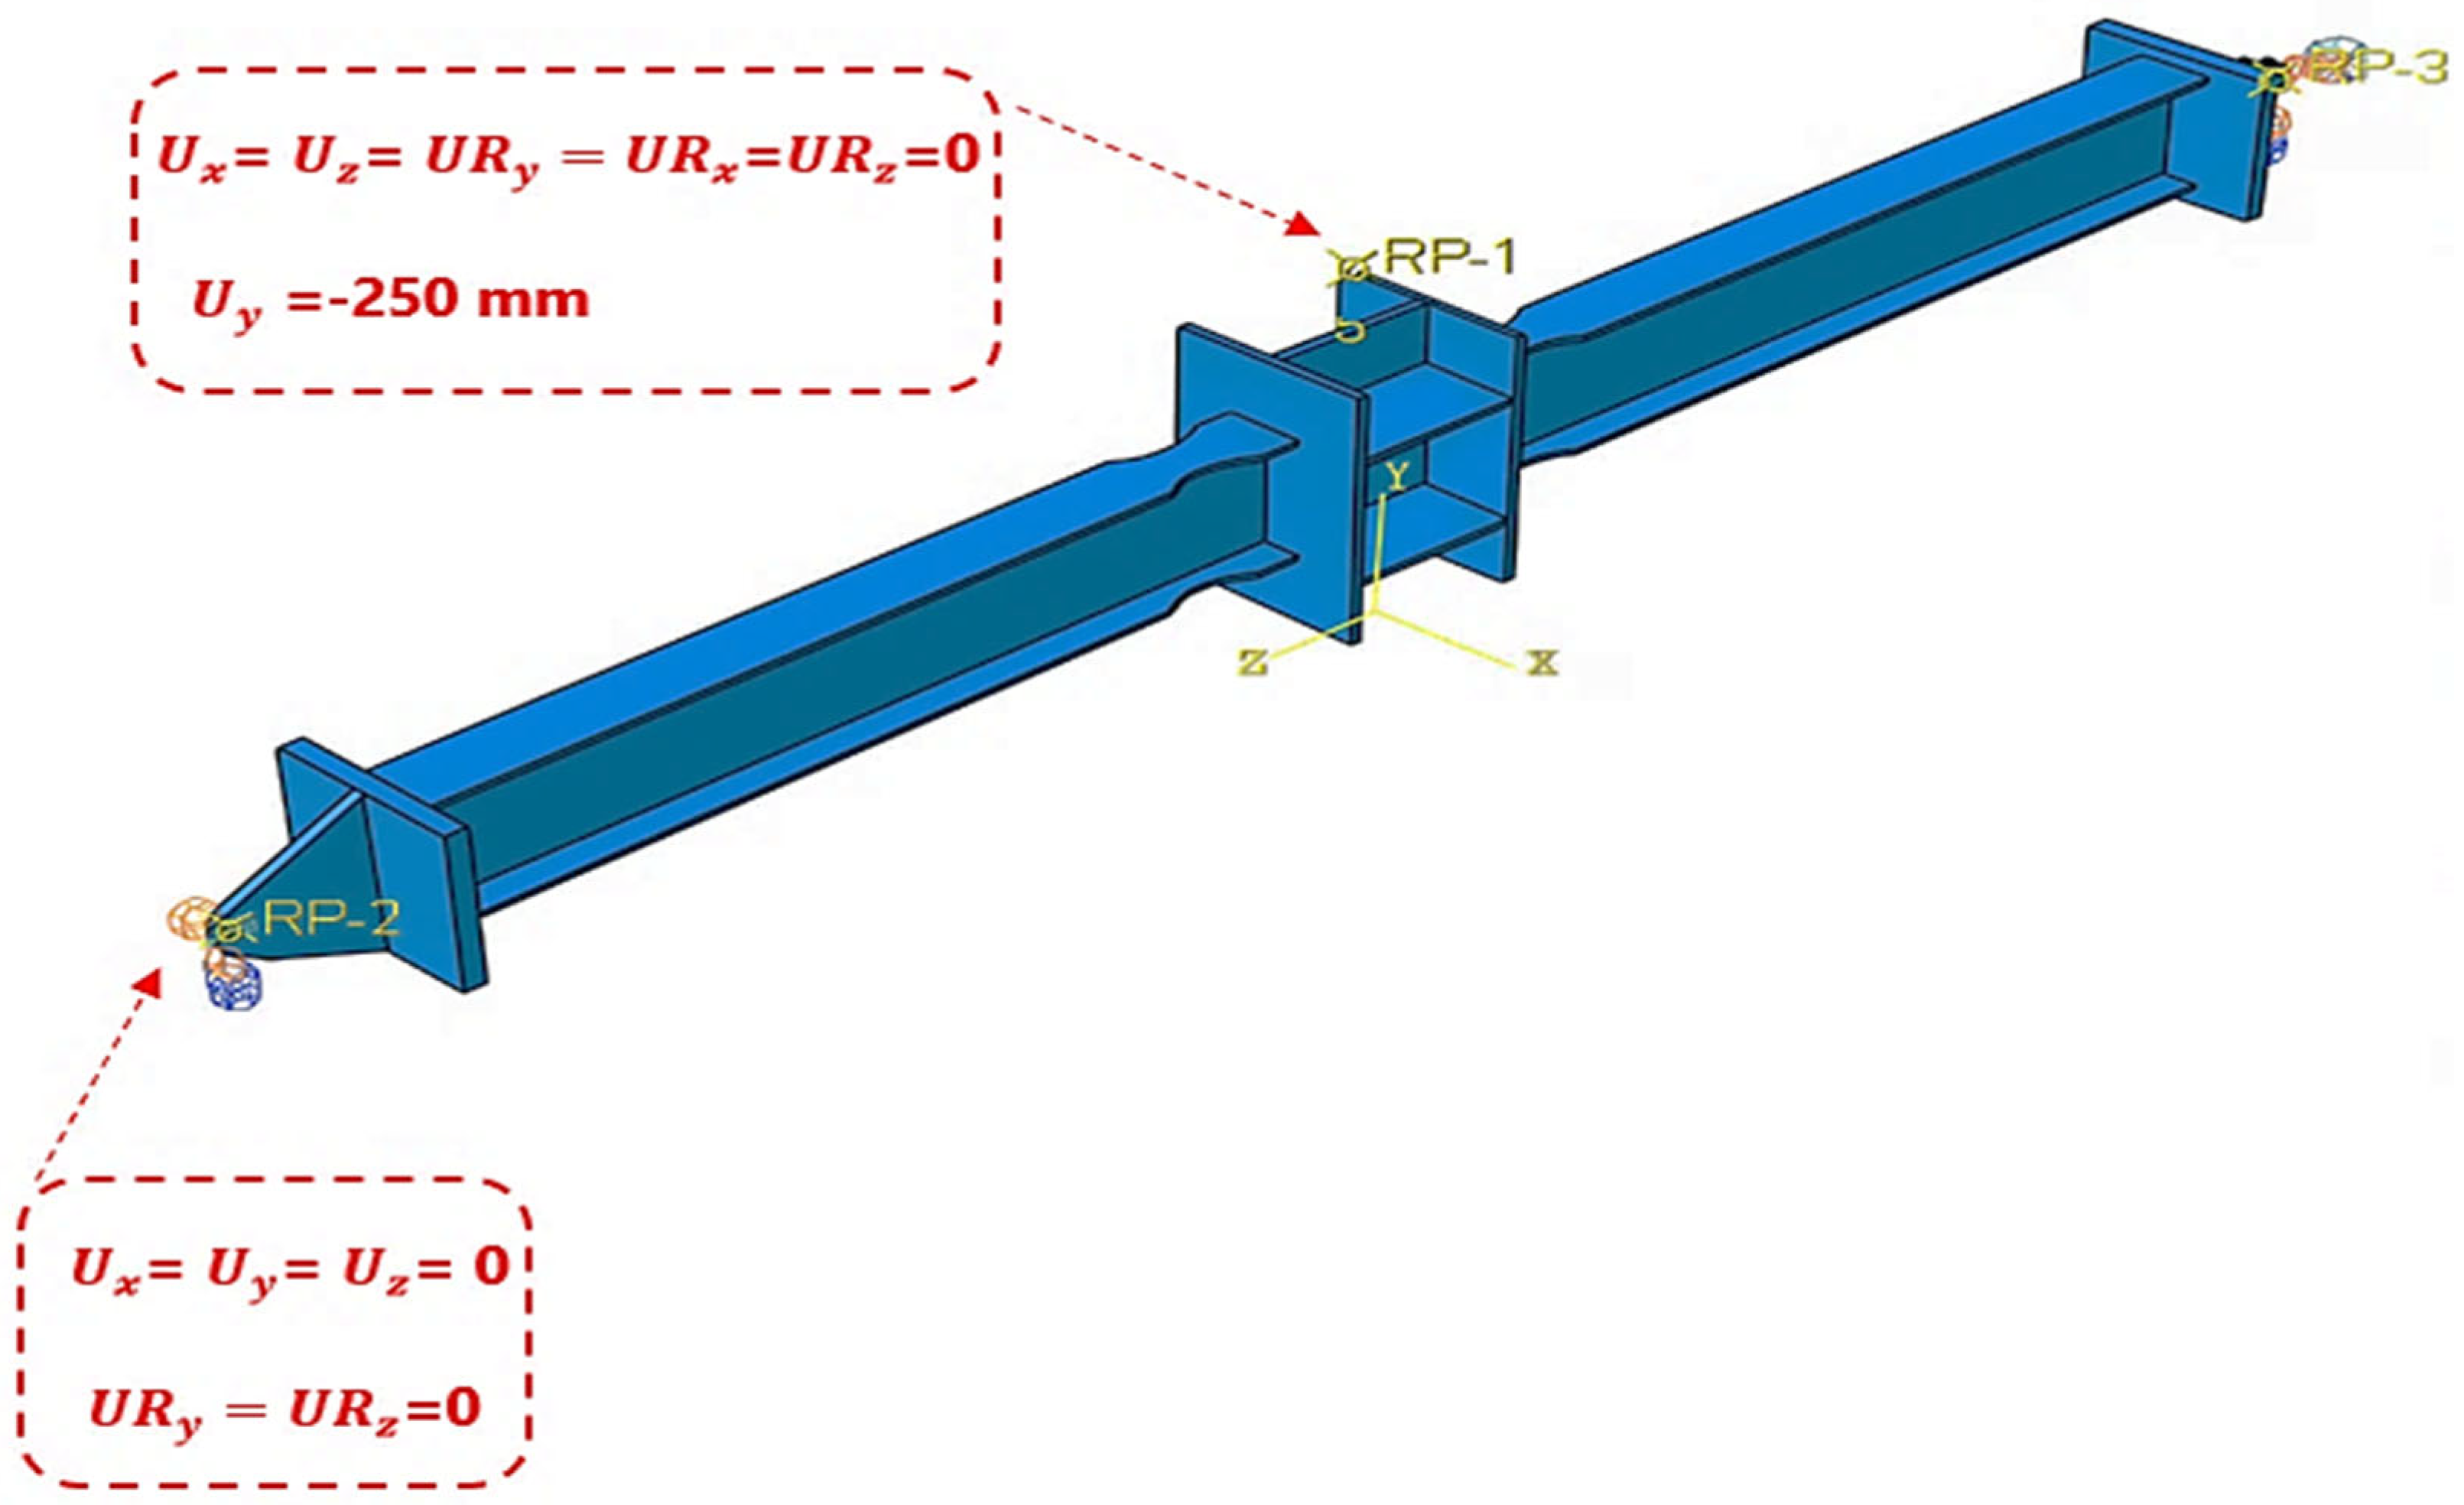
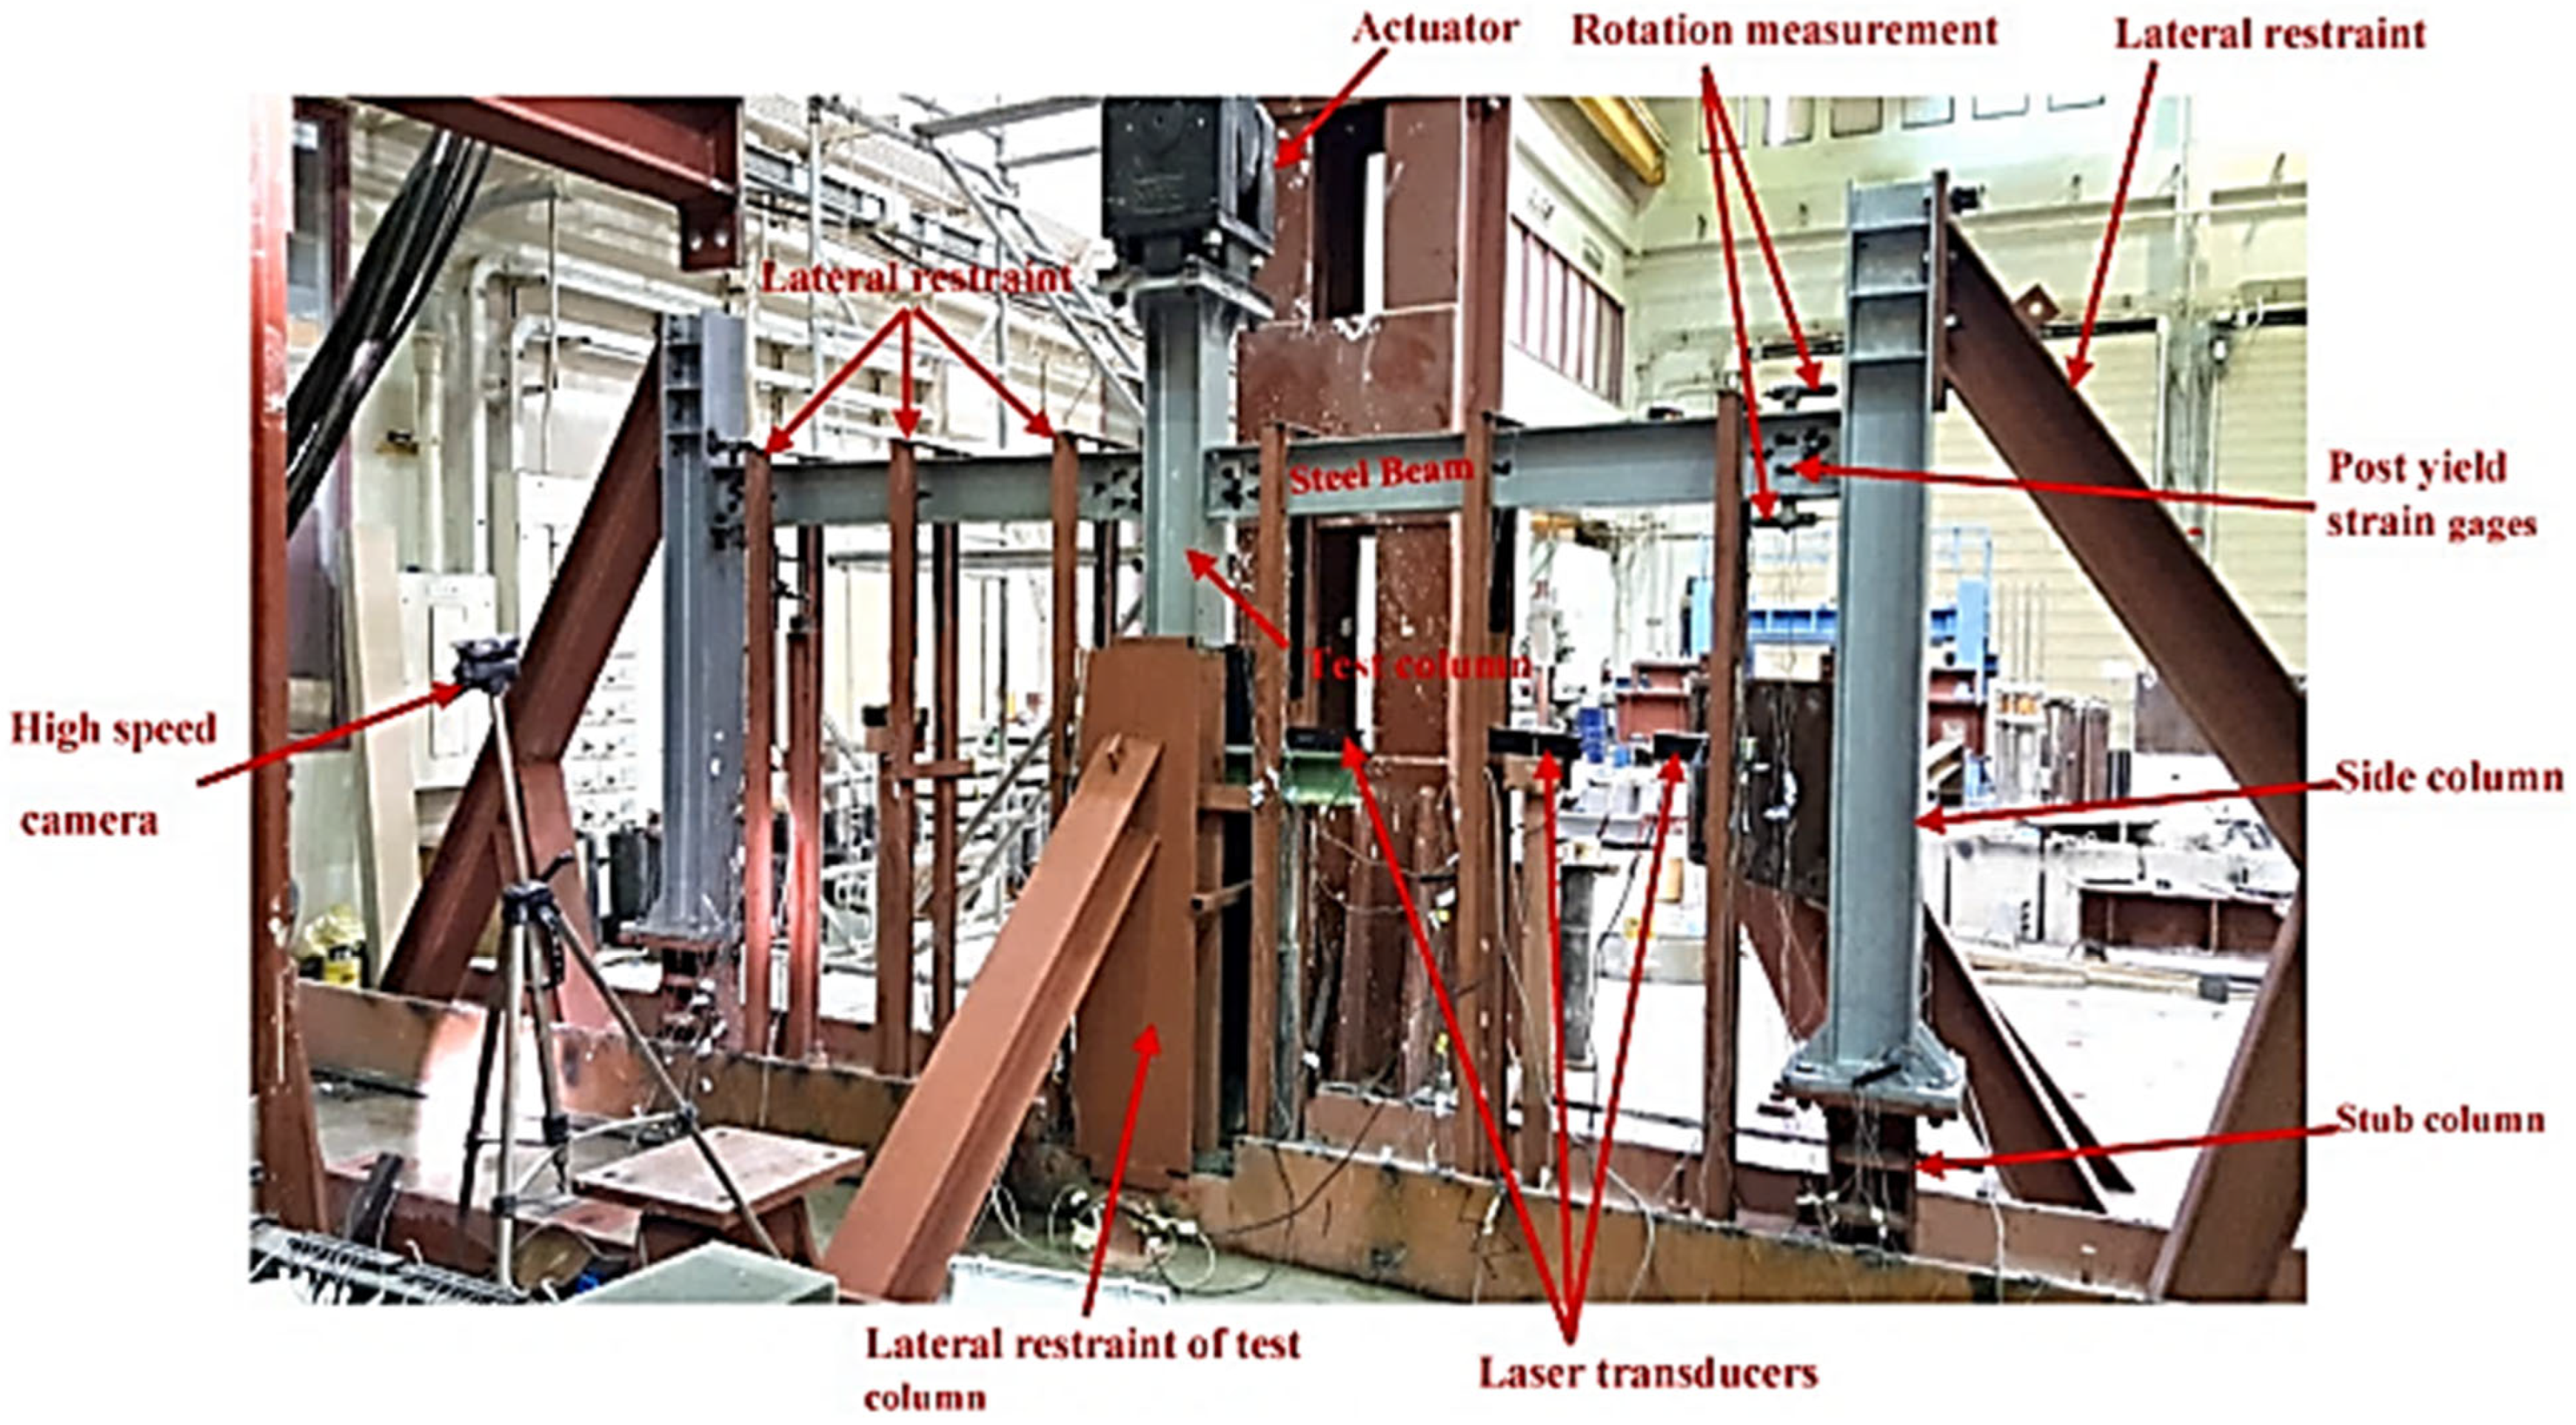
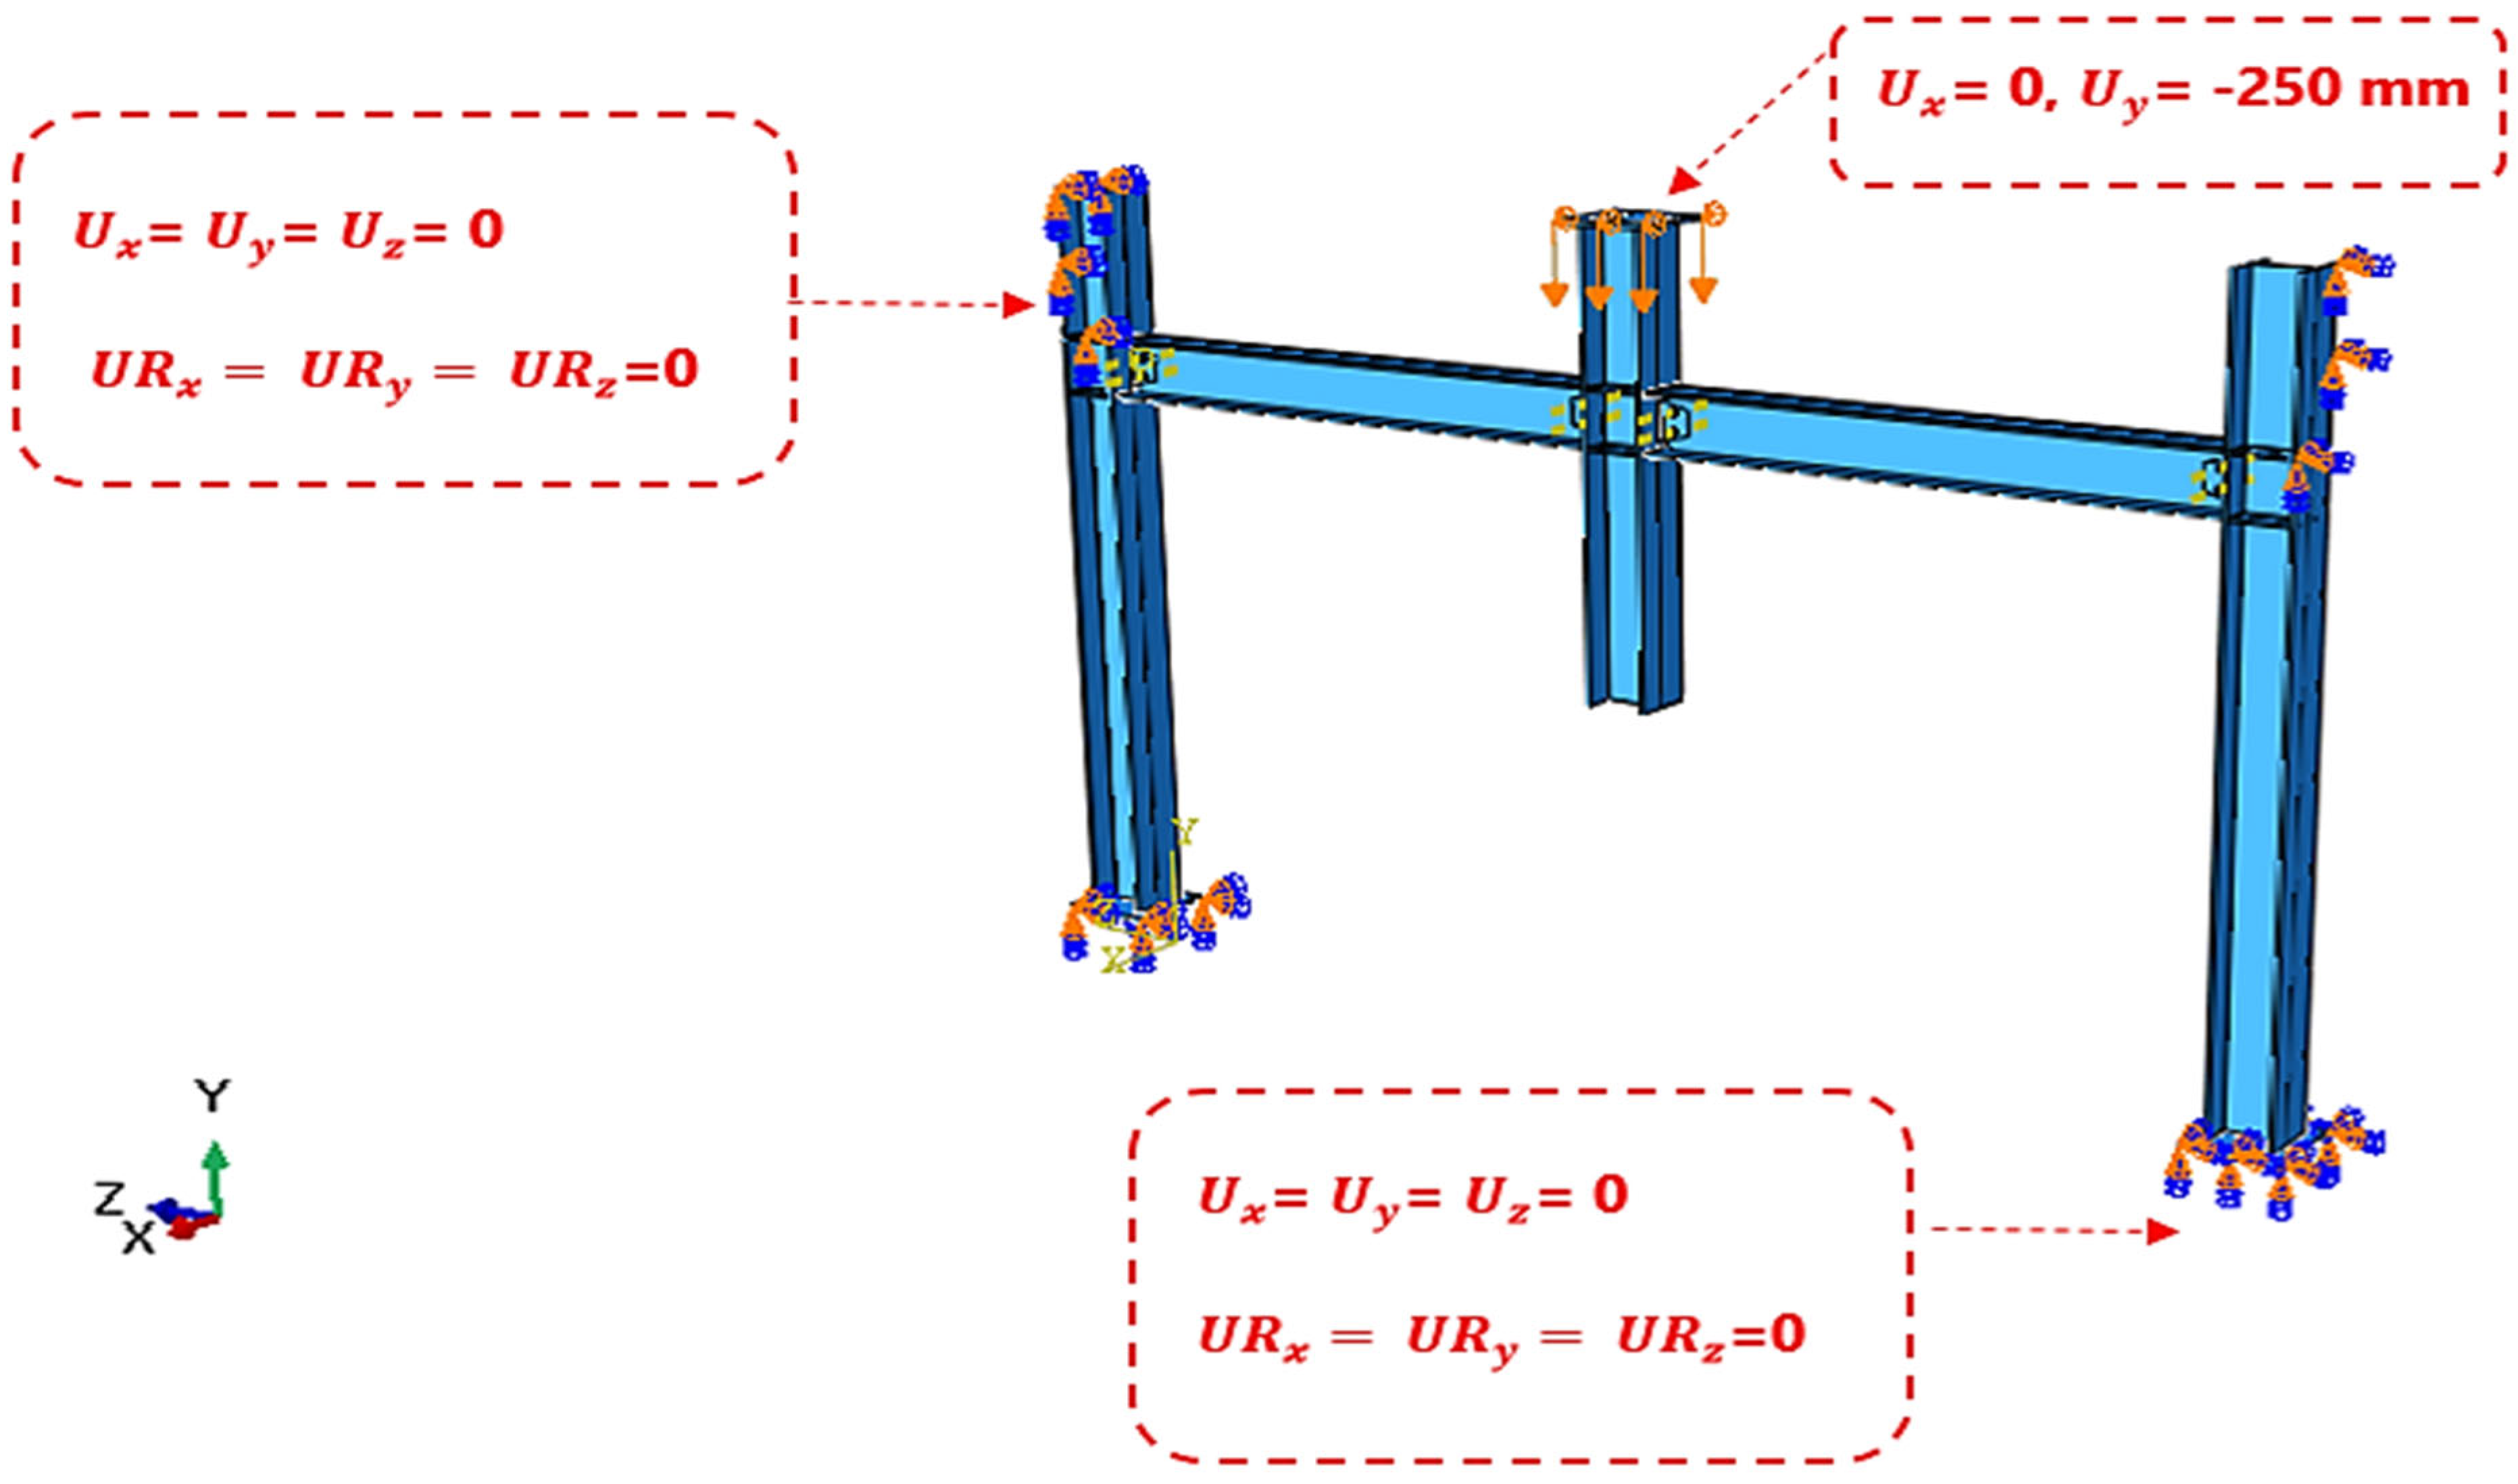
Boundary conditions were designed to match those used in earlier experimental studies by Chen et al. [18] and Alrubaidi et al. [20]. Figure 4, Figure 5, Figure 6 and Figure 7 show the experimental setups and the boundary conditions used in earlier studies. Figure 4 and Figure 6 display the experimental tests carried out by Chen et al. [18] and Alrubaidi et al. [20], respectively. Figure 5 and Figure 7 illustrate the boundary conditions used in the numerical simulations of the same specimens, following the experiments reported by Chen et al. [18] and Alrubaidi et al. [20].
Following ABAQUS guidelines [21] and standard FE principles [20], careful attention was given to ensure these conditions were realistic. This was essential for simulating progressive collapse correctly in ABAQUS/Explicit.

2.5. Model Validation

The FE model was validated against two experimental programs from the literature: Chen et al. [18] and Alrubaidi et al. [20]. These studies provided a reliable benchmark for comparison.
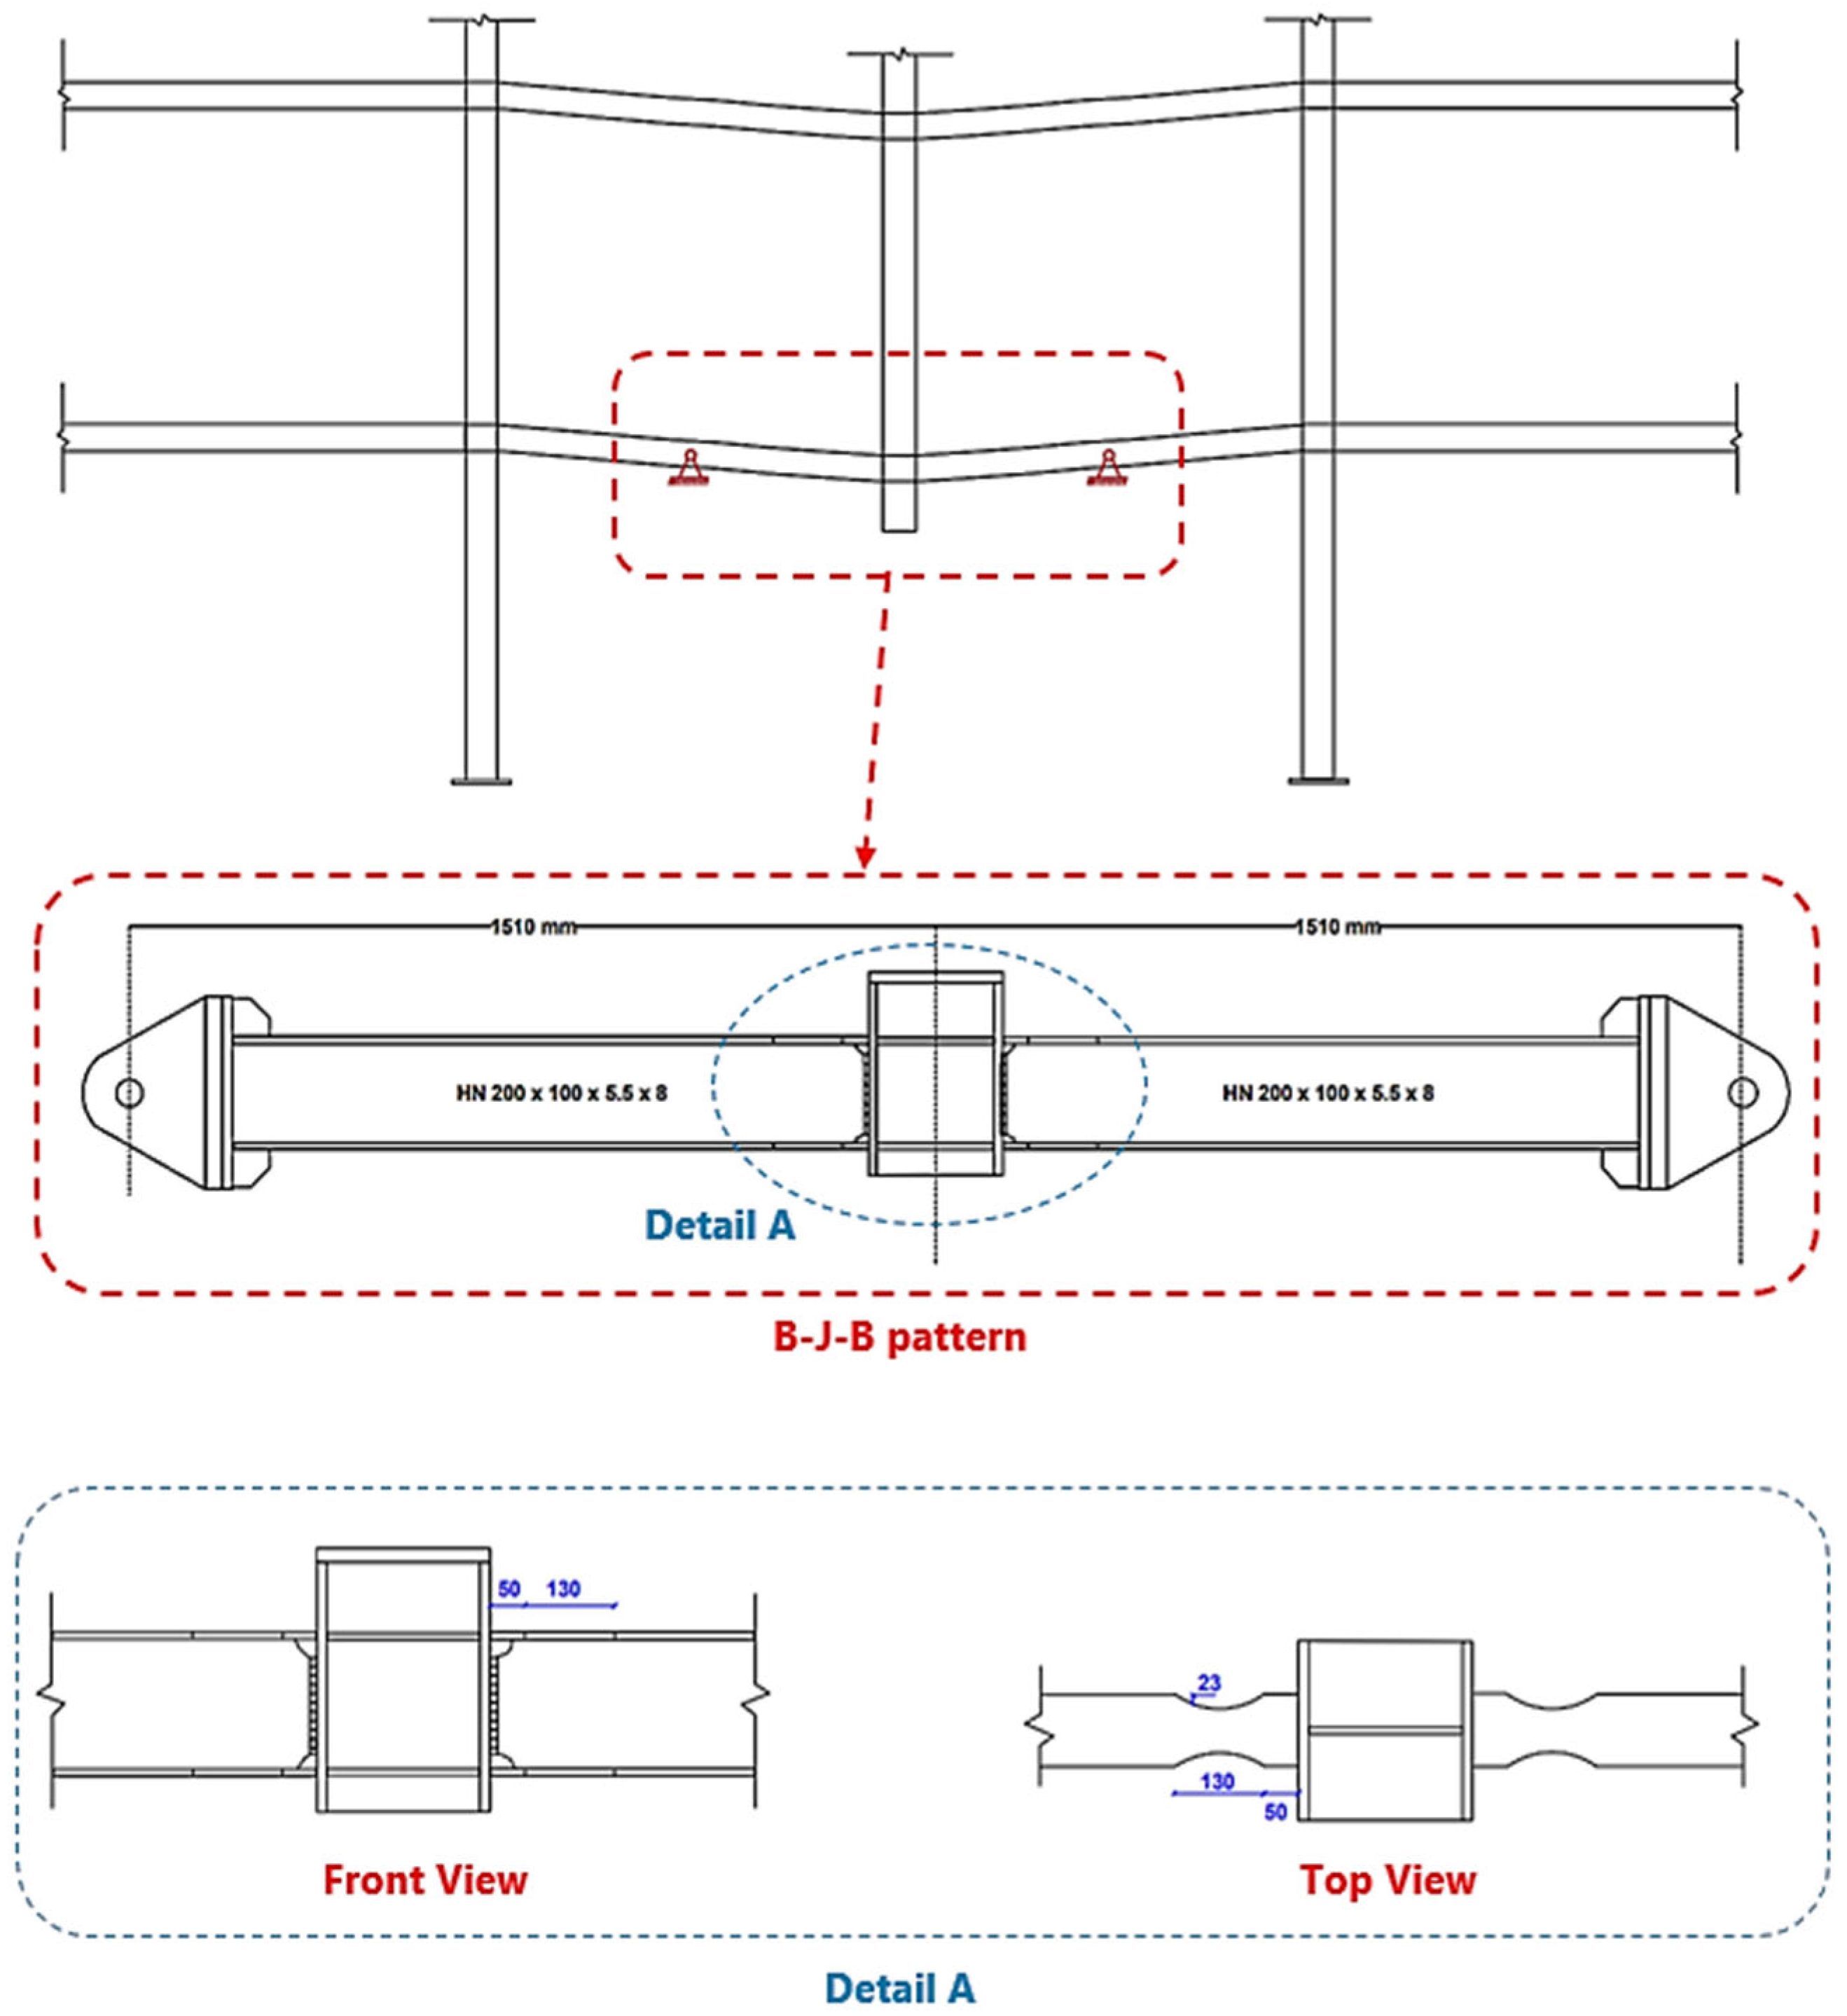
From Chen et al. [18], the specimen WUF-W-RBS-50-130-23 was used as a reference. This specimen had welded unreinforced flanges and a fully welded web, which directed plastic hinges into the reduced beam section instead of the brittle weld zone. Figure 8 shows the test setup reported in [18], where the beam-to-column assembly was simplified into a beam–joint–beam configuration. The supports acted like hinges at mid-span, representing the inflection points after column removal. Supports were fixed to rigid steel frames anchored to the floor but still allowed free in-plane rotation.
The specimen was made from Q235 steel. Beams were HN 200 × 100 × 5.5 × 8 mm, and columns were HW 250 × 250 × 9 × 14 mm. The reduced beam section geometry (a = 50 mm, b = 130 mm, c = 23 mm) followed FEMA-350 [15] seismic guidelines [15].
From Alrubaidi et al. [20], the WUF-FW specimen was used. This was a one-third scale, single-storey, two-bay frame (Figure 9) [20]. It included H200 × 200 × 12 × 8 mm columns and H194 × 150 × 9 × 6 mm beams spaced 2000 mm apart. The beam web was connected with a bolted shear tab (120 × 100 × 6 mm, M16 bolts, grade 10.9). The flanges were welded to the column with fillet welds. All members were made from Q235 steel. Supports were designed to allow in-plane rotation. A central actuator applied displacement-controlled loading to simulate column removal.

2.6. Model Validation Results

Figure 10 and Figure 11 show the comparison between experimental and FE load–displacement curves, reported in the literature Chen et al. [18] and Alrubaidi et al. [20]. The FE model matched both the stiffness at the start and the nonlinear behavior afterward.
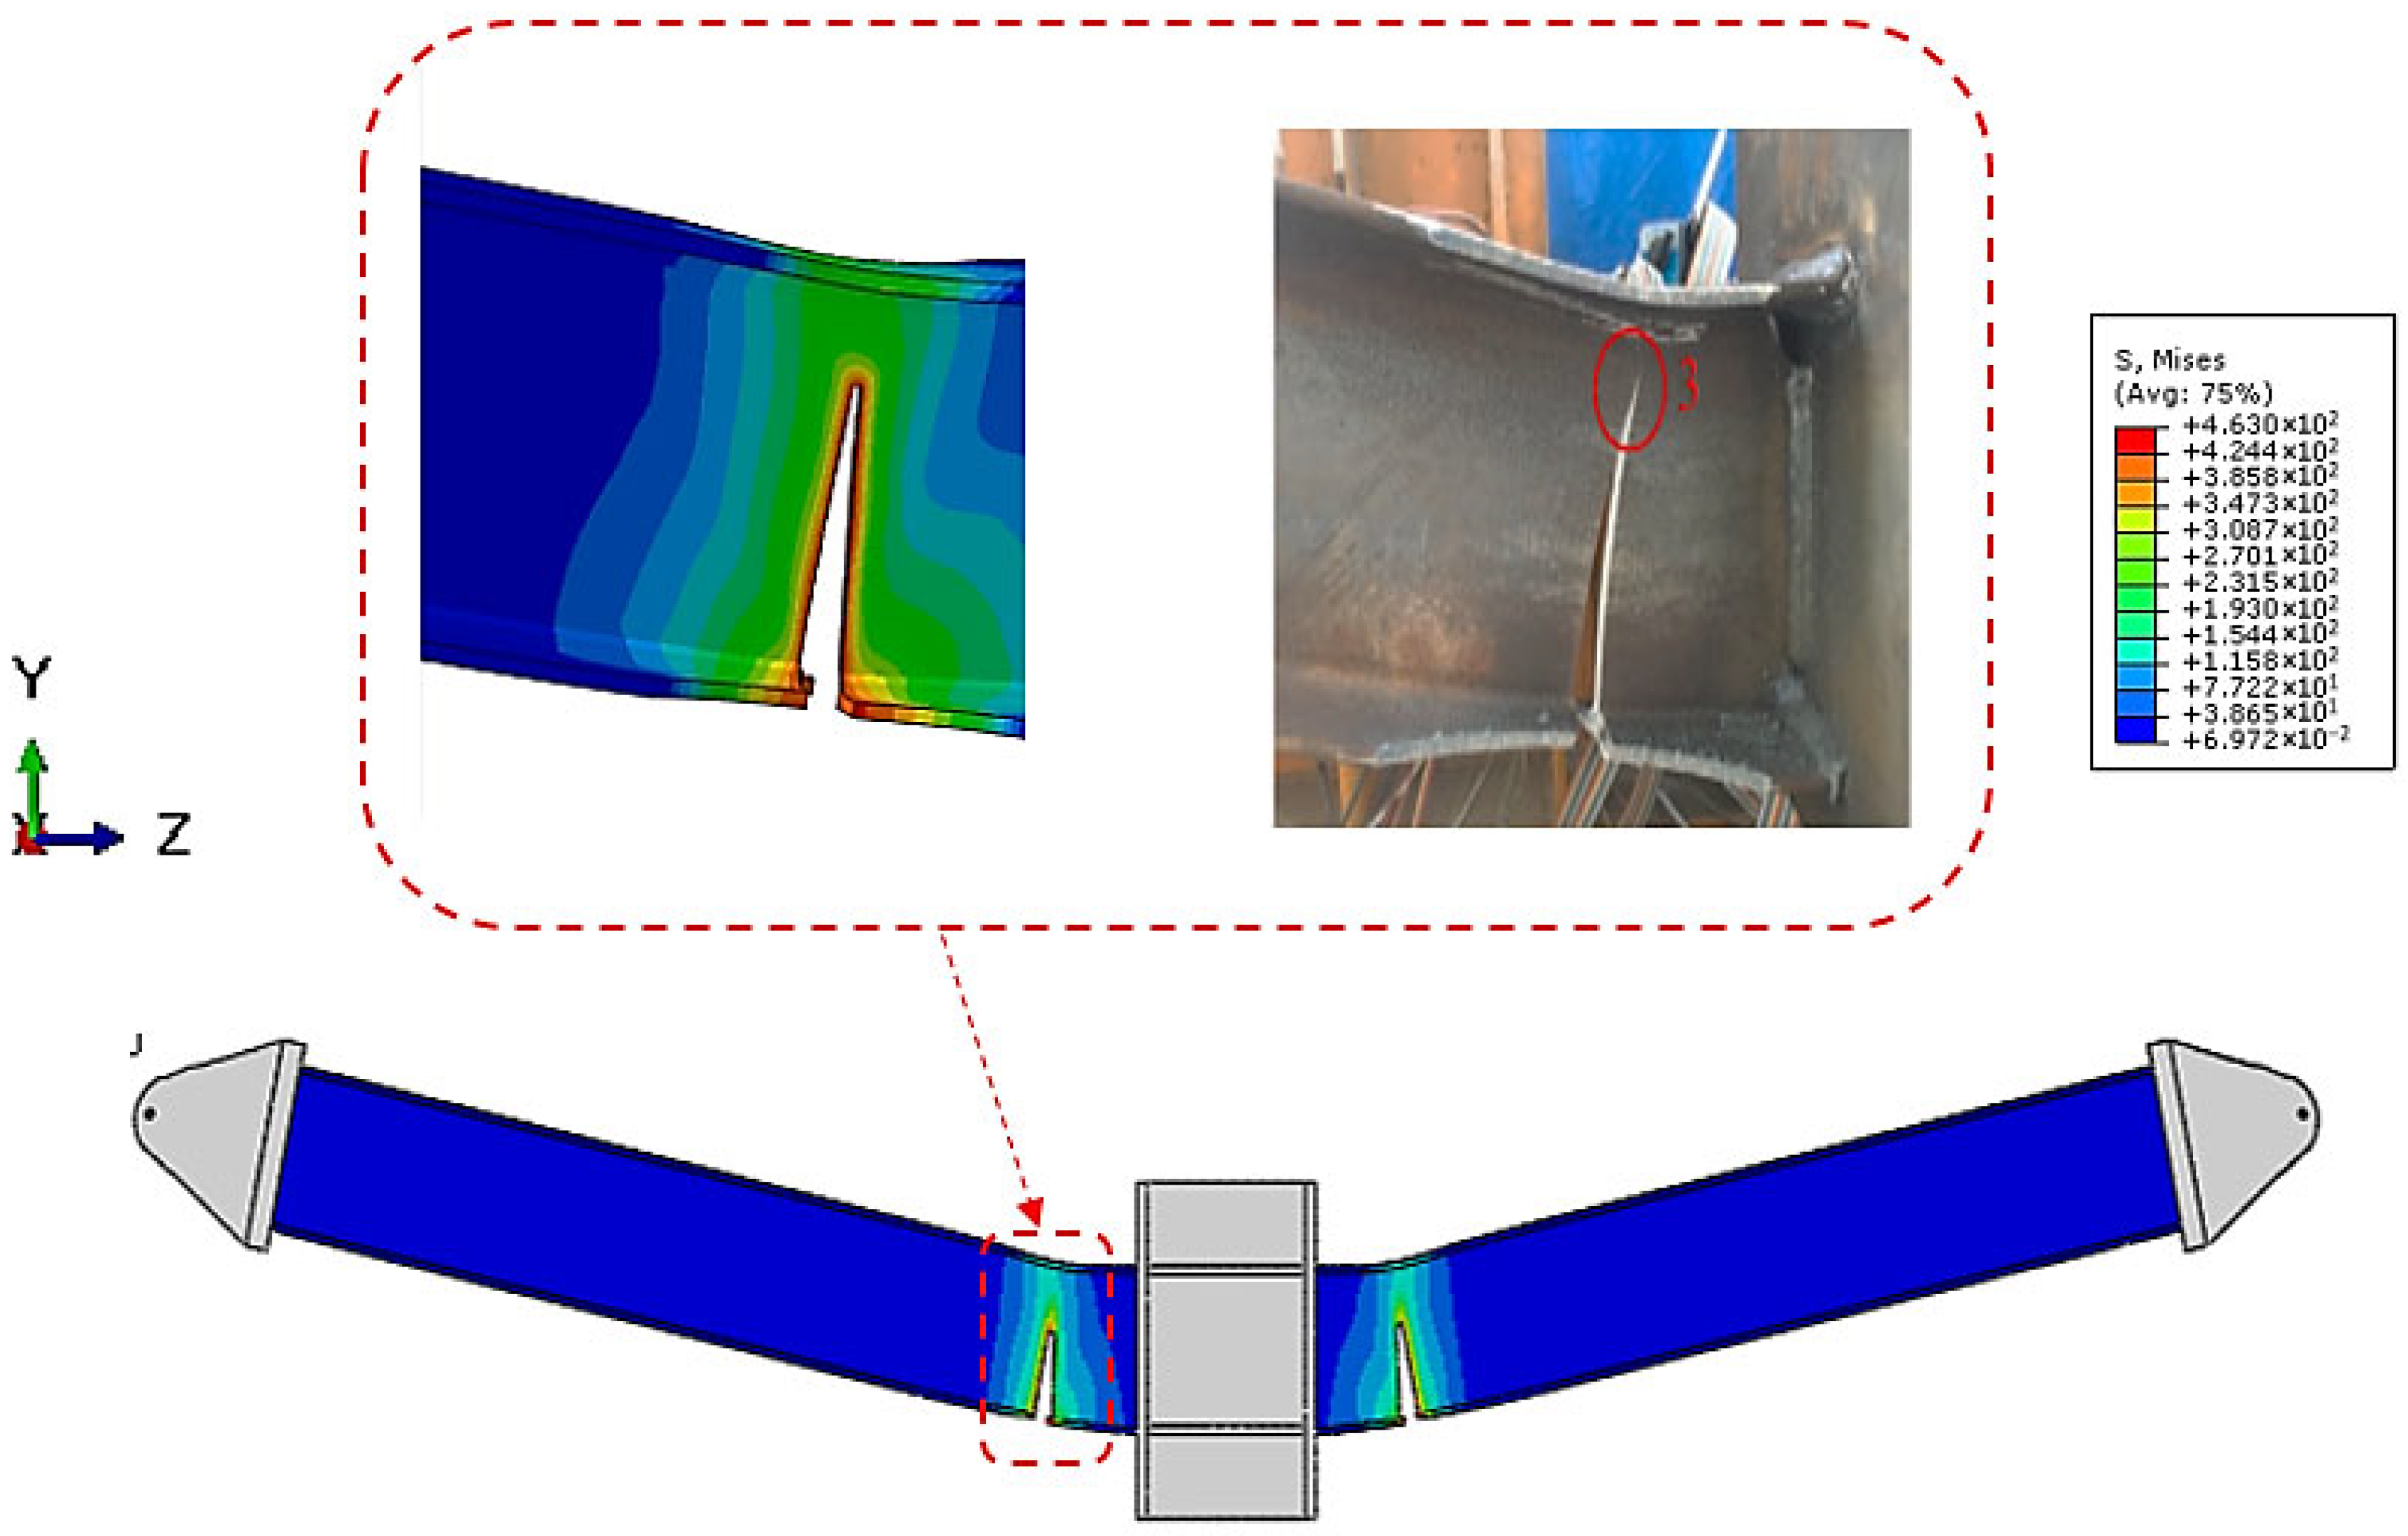
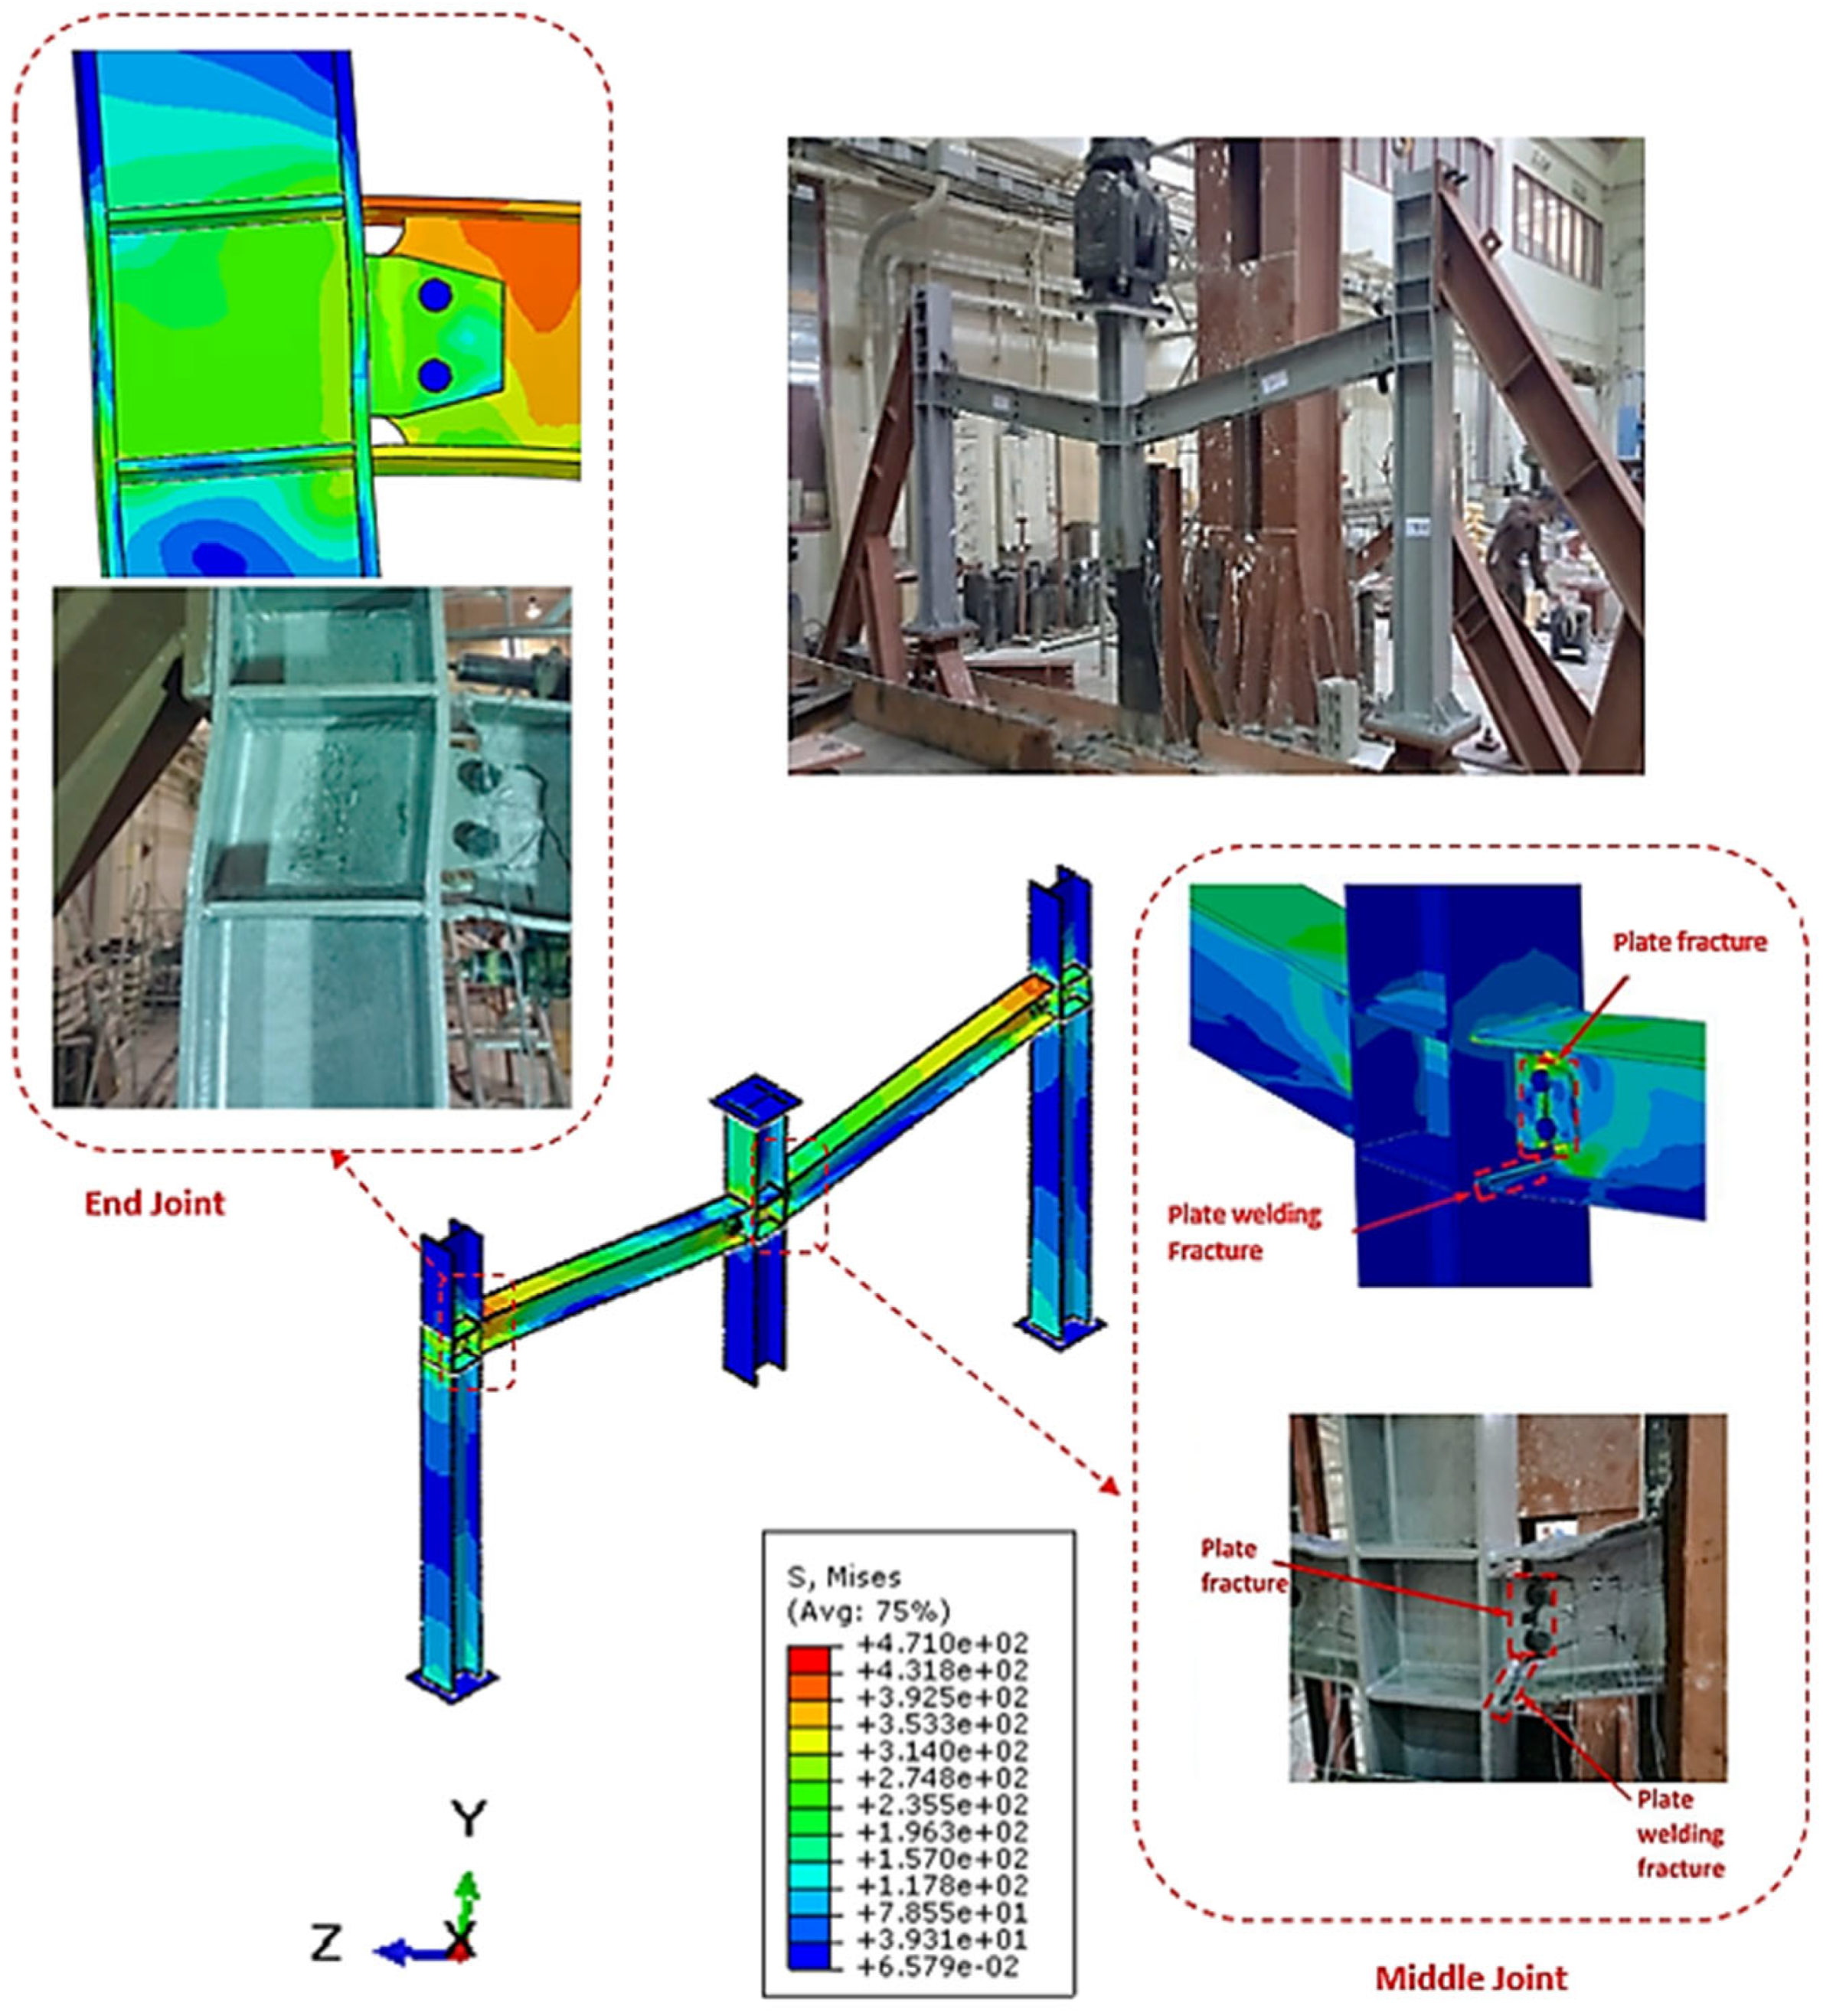
Figure 12 and Figure 13 compare failure patterns with the results from Chen et al. [18] and Alrubaidi et al. [20]. The FE model reproduced the same crack initiation, propagation, and rupture modes as the experiments. This confirms the model captures both global response and local damage.
Small differences between experiment and simulation can be explained by residual stresses, imperfections, or variations in material properties that were not included in the FE model. Still, the good agreement demonstrates that the modeling strategy was well calibrated.

2.7. Case Study

The validated model was then used to study the effect of reduced beam sections (RBS) combined with semi-circular web openings. Parametric analyses were performed starting from the WUF-W-RBS-50-130-23 specimen of Chen et al. [18].
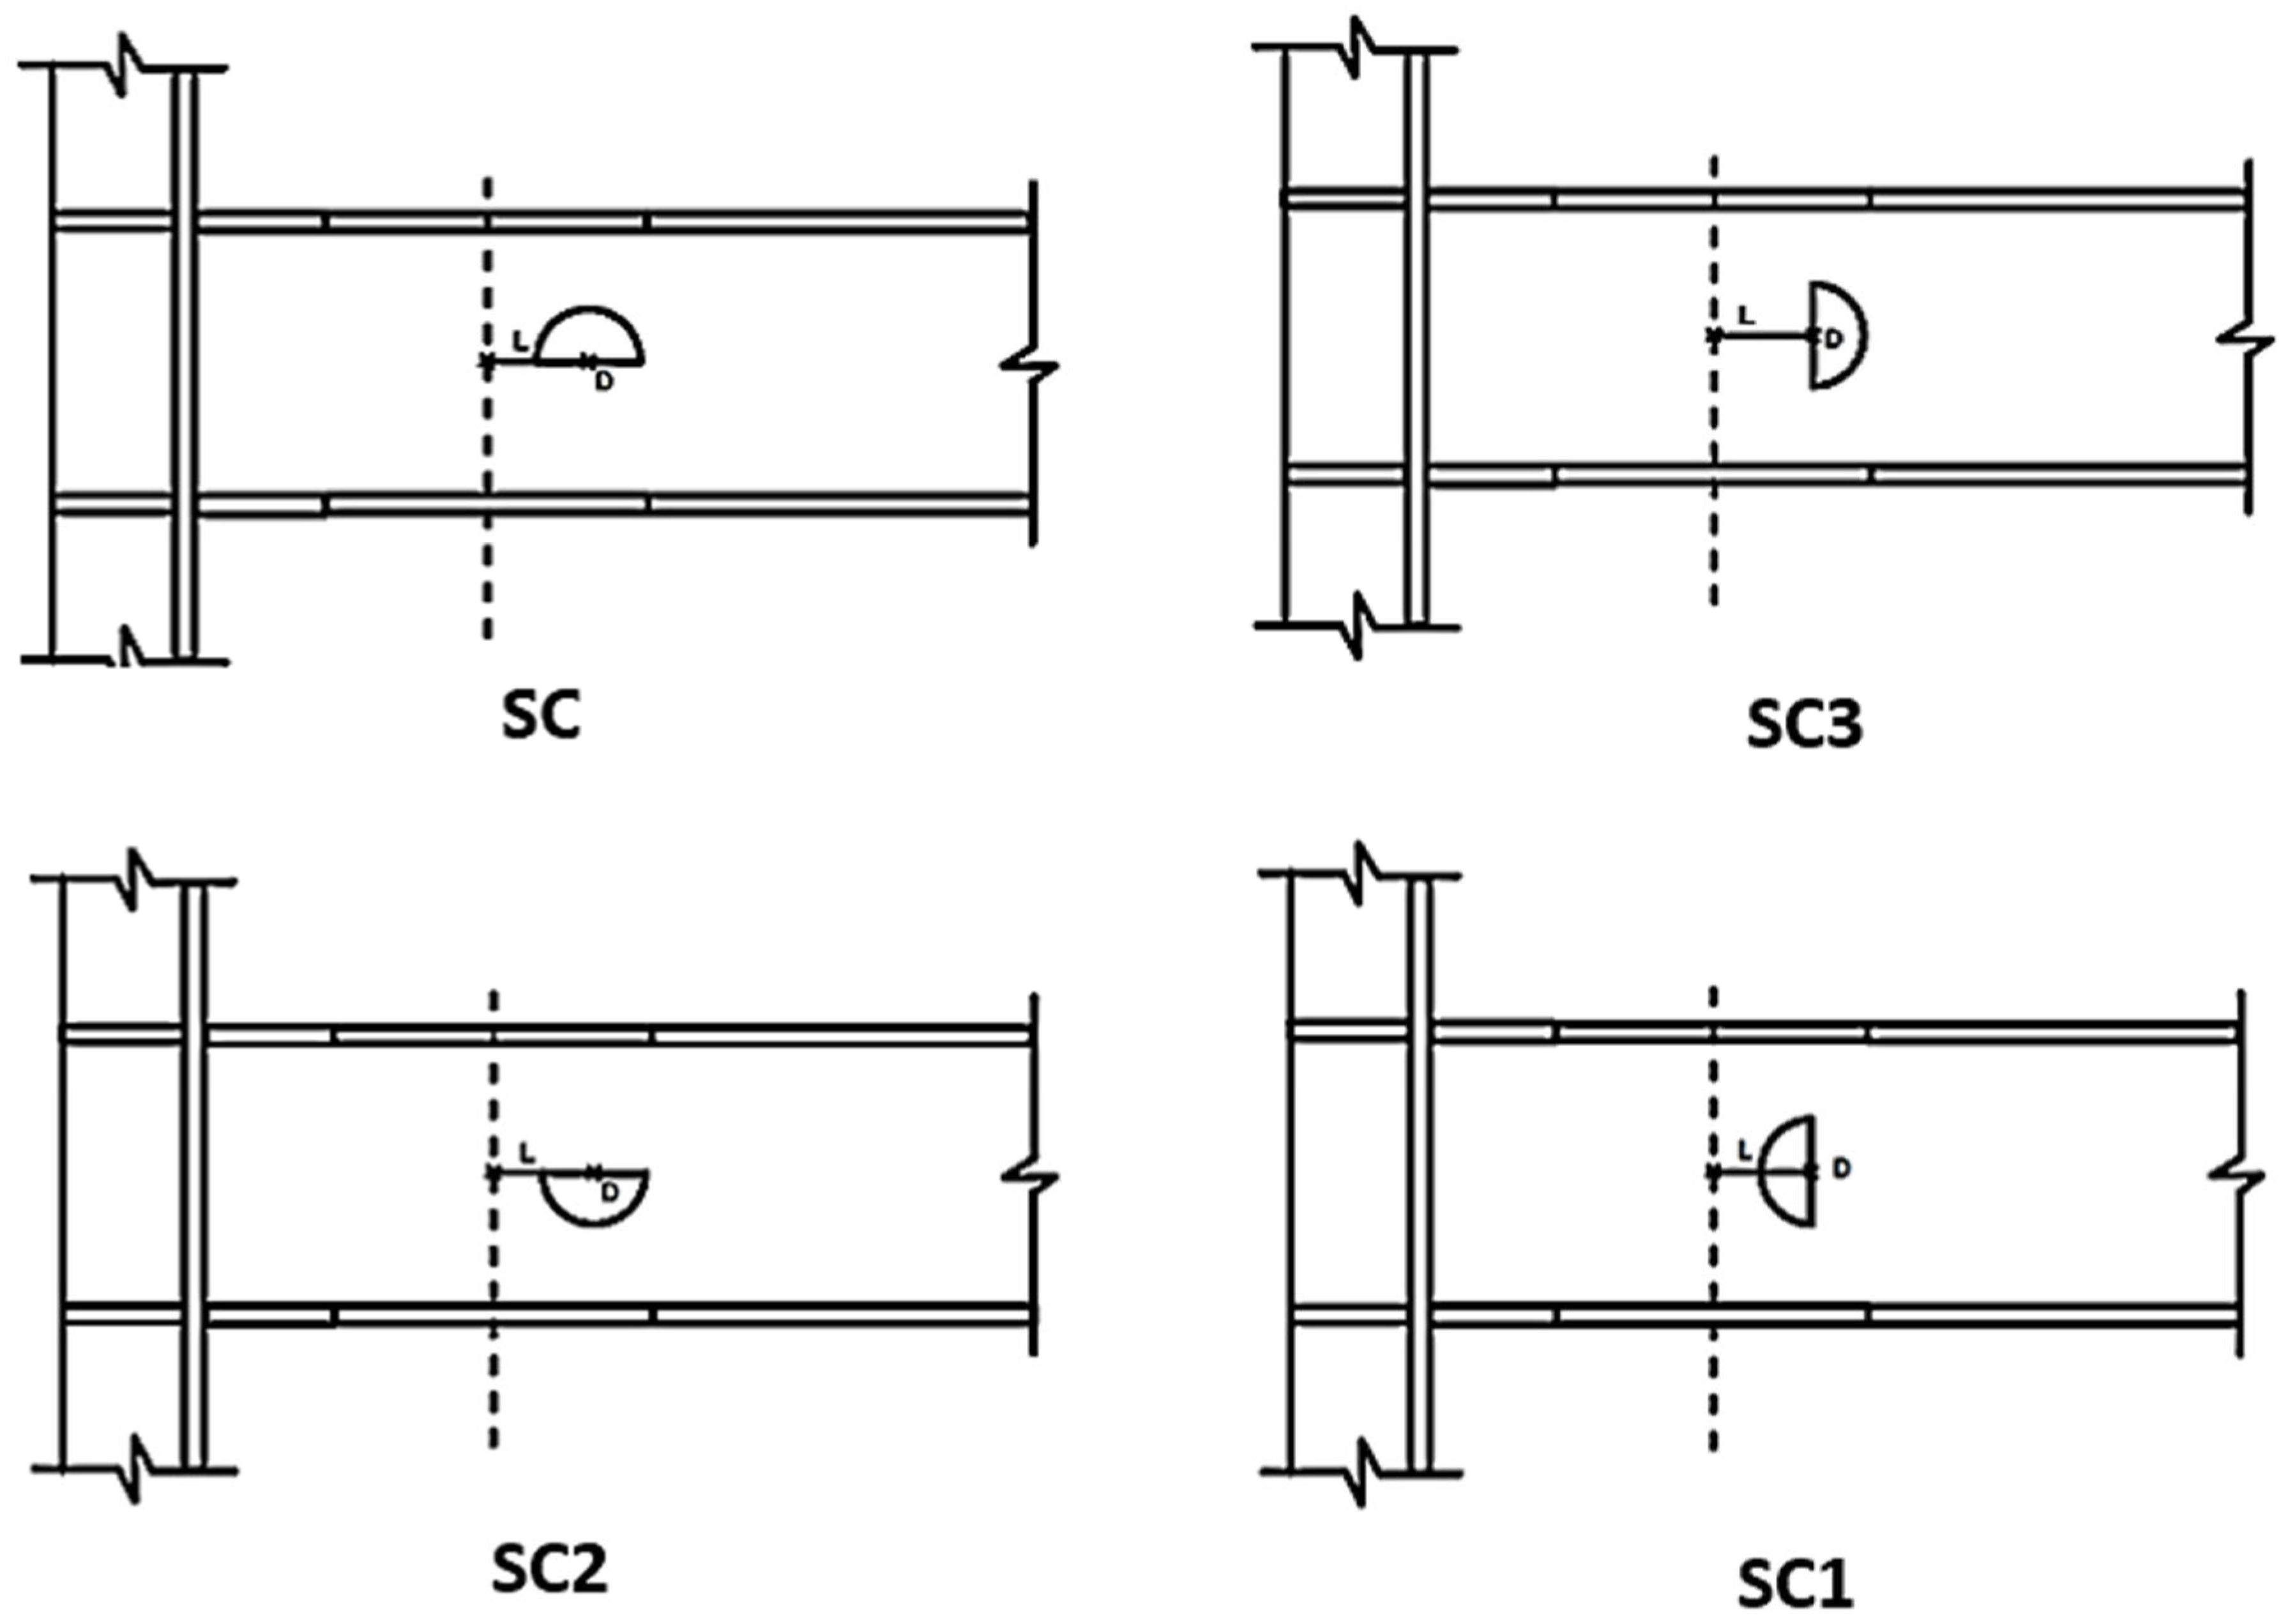
Openings of 80 mm and 110 mm diameter were introduced in both circular and semi-circular shapes (Figure 14). Their positions were varied relative to the RBS centroid at distances of 0 mm, 65 mm, 140 mm, and 180 mm. Semi-circular openings were placed in four layouts (SC, SC1, SC2, SC3) as shown in Figure 15.
Specimens were named using a coding system. “C” means circular openings, and “SC” means semi-circular. The next number gives the distance from the RBS centroid, and the last number is the opening diameter. For example,
  • C-140-110 → circular opening, 110 mm diameter, 140 mm from the flange cut centerline.
  • SC1-A65-80 → semi-circular opening, layout SC1, 80 mm diameter, 65 mm from the flange cut centroid.
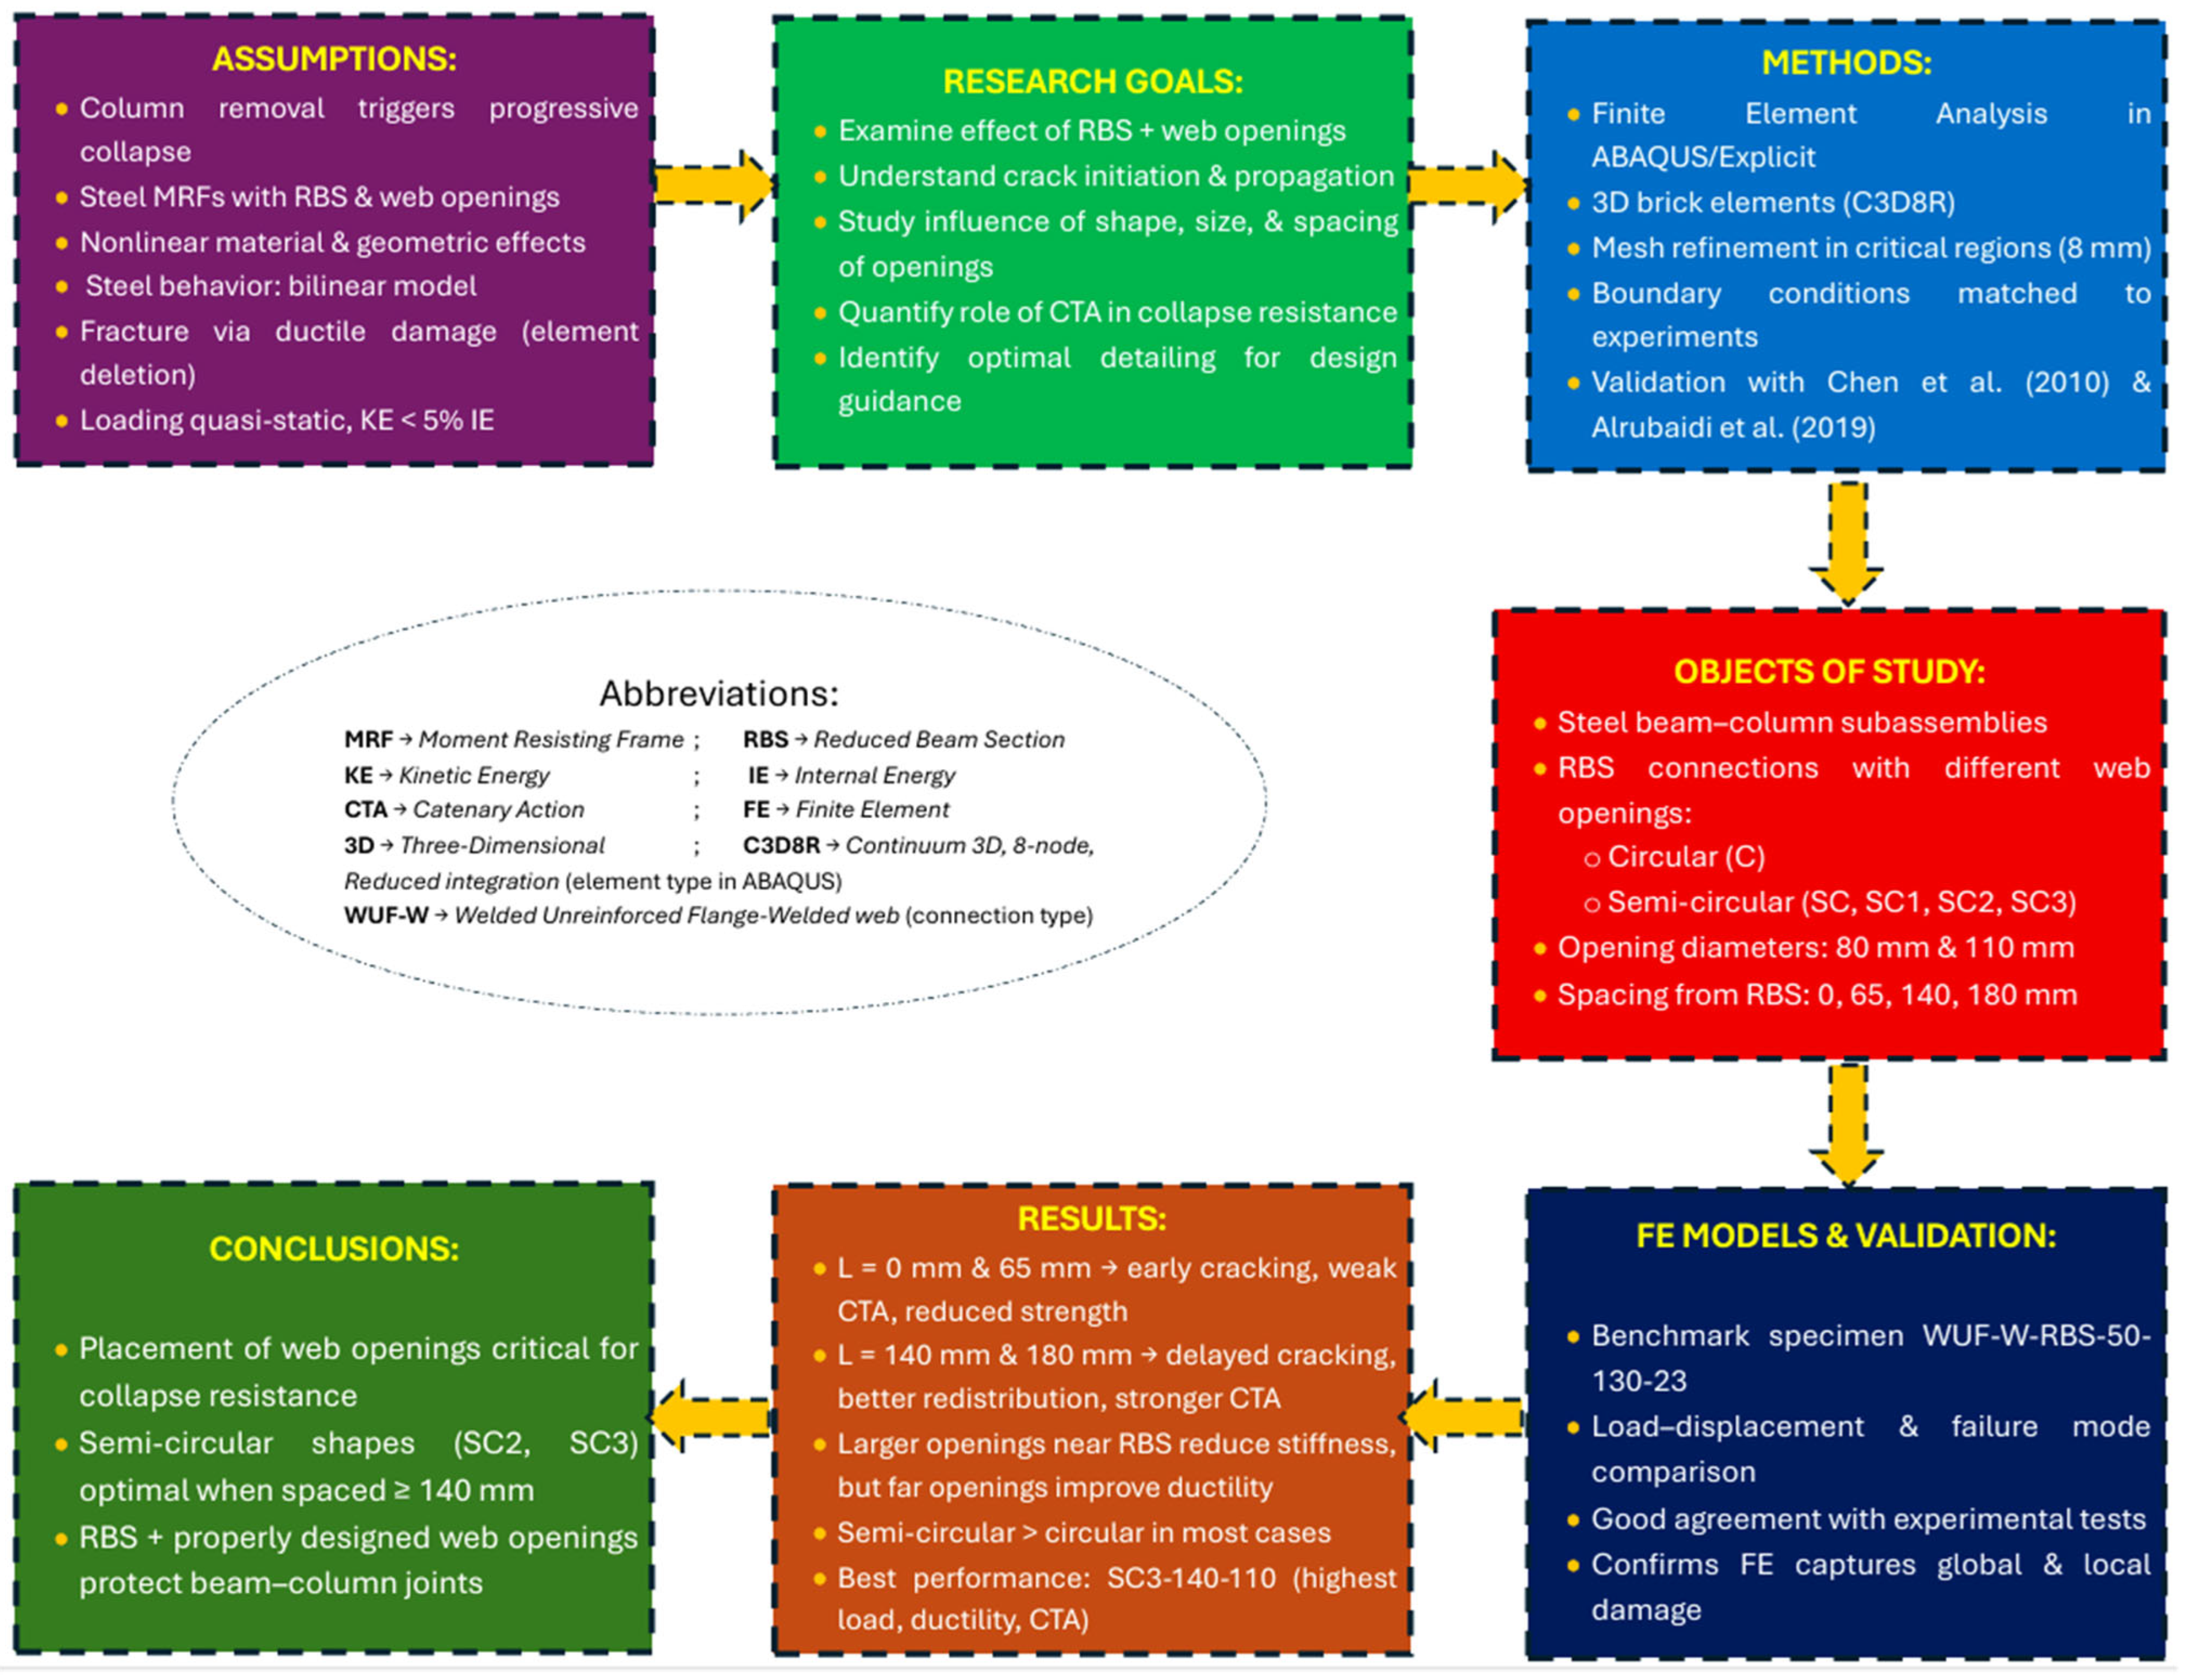
Figure 16 illustrates the workflow of this study. It highlights the assumptions, the FE modeling process, different RBS–web opening configurations, and the main findings on progressive collapse resistance.
Results were analyzed in terms of load–displacement behavior, failure modes, and development of catenary action.

3. Results and Discussion

This section explains the results in three main parts:
i.
Load–displacement behavior of the tested specimens.
ii.
Development and type of failure modes.
iii.
Role of catenary action in the later stages of deformation.
For the benchmark specimen WUF-W-RBS-50-130-23 (FE), the failure sequence is shown in Figure 12. The process began with small cracks at the reduced portion of the lower beam flange, close to the beam–column joint. As the load increased, these cracks moved upward toward the top flange. They grew wider as the displacement became larger. Eventually, the fracture passed through the web-reduced section, leading to complete failure. This mechanism shifted the critical failure zone away from the immediate beam–column interface. As a result, the joint itself remained better protected.
In the case of this control specimen without web openings (WUF-W-RBS-50-130-23 (FE)), the vertical load–displacement curve at the top of the removed column started almost linearly. It behaved elastically until the load reached about 57 kN, with a deflection of around 30 mm. After this, the response turned nonlinear, indicating plastic behavior. The load kept increasing with displacement until it peaked at 219 kN (Figure 10). Beyond this peak, the specimen experienced a sharp drop in load capacity, which led to complete structural failure.

3.1. Control Specimen (WUF-W-RBS-50-130-23 (FE))

For the benchmark specimen WUF-W-RBS-50-130-23 (FE), failure began with cracks in the reduced part of the lower beam flange, right next to the beam–column joint (Figure 12). As the load increased, the cracks spread upward toward the upper flange. They widened with more displacement. The fracture cut through the reduced web section, which led to complete failure.
This failure path moved the weak point away from the joint area. That means the beam–column connection itself was better protected.
In terms of load–displacement response (Figure 10), the specimen behaved almost elastically until about 57 kN. The deflection was only 30 mm at that point. Beyond this, plastic behavior started. The load kept rising with displacement until it peaked at 219 kN. After reaching this maximum, the specimen suddenly lost capacity and failed.

3.2. L = 0 mm Position

For the first configuration, where L = 0 mm, the web opening is placed exactly at the center of the reduced beam section. In this case, failure started at the lower flange of the reduced region, right next to the beam–column interface. As the applied displacement increased, the crack grew upward toward the web opening. However, it stayed confined to the lower part of the beam and did not cause a full separation across the section (Figure 17).
This behavior was due to stress concentration along the reduced flange and the local loss of stiffness from the overlapping web opening. Together, they created a path for the crack to grow faster as the loading continued.
When the web opening diameter increased from 80 mm to 110 mm, the structural performance declined clearly. Cracking in the lower part of the opening began much earlier in the larger openings compared to those with 80 mm holes. The larger opening reduced the load-carrying area of the beam and created stronger stress concentrations around the edges.
This shows the combined weakening effect when the reduced flange and the web opening are aligned at the same section. By removing material from both regions at once, the stiffness and energy dissipation capacity of the beam dropped significantly. With no intact material left between the flange reduction and the web opening, the section could not redistribute stresses effectively. As a result, loads got concentrated in a small region. This led to early stiffness loss and faster crack growth. Hence, the L = 0 mm case is unfavorable for resisting progressive collapse.
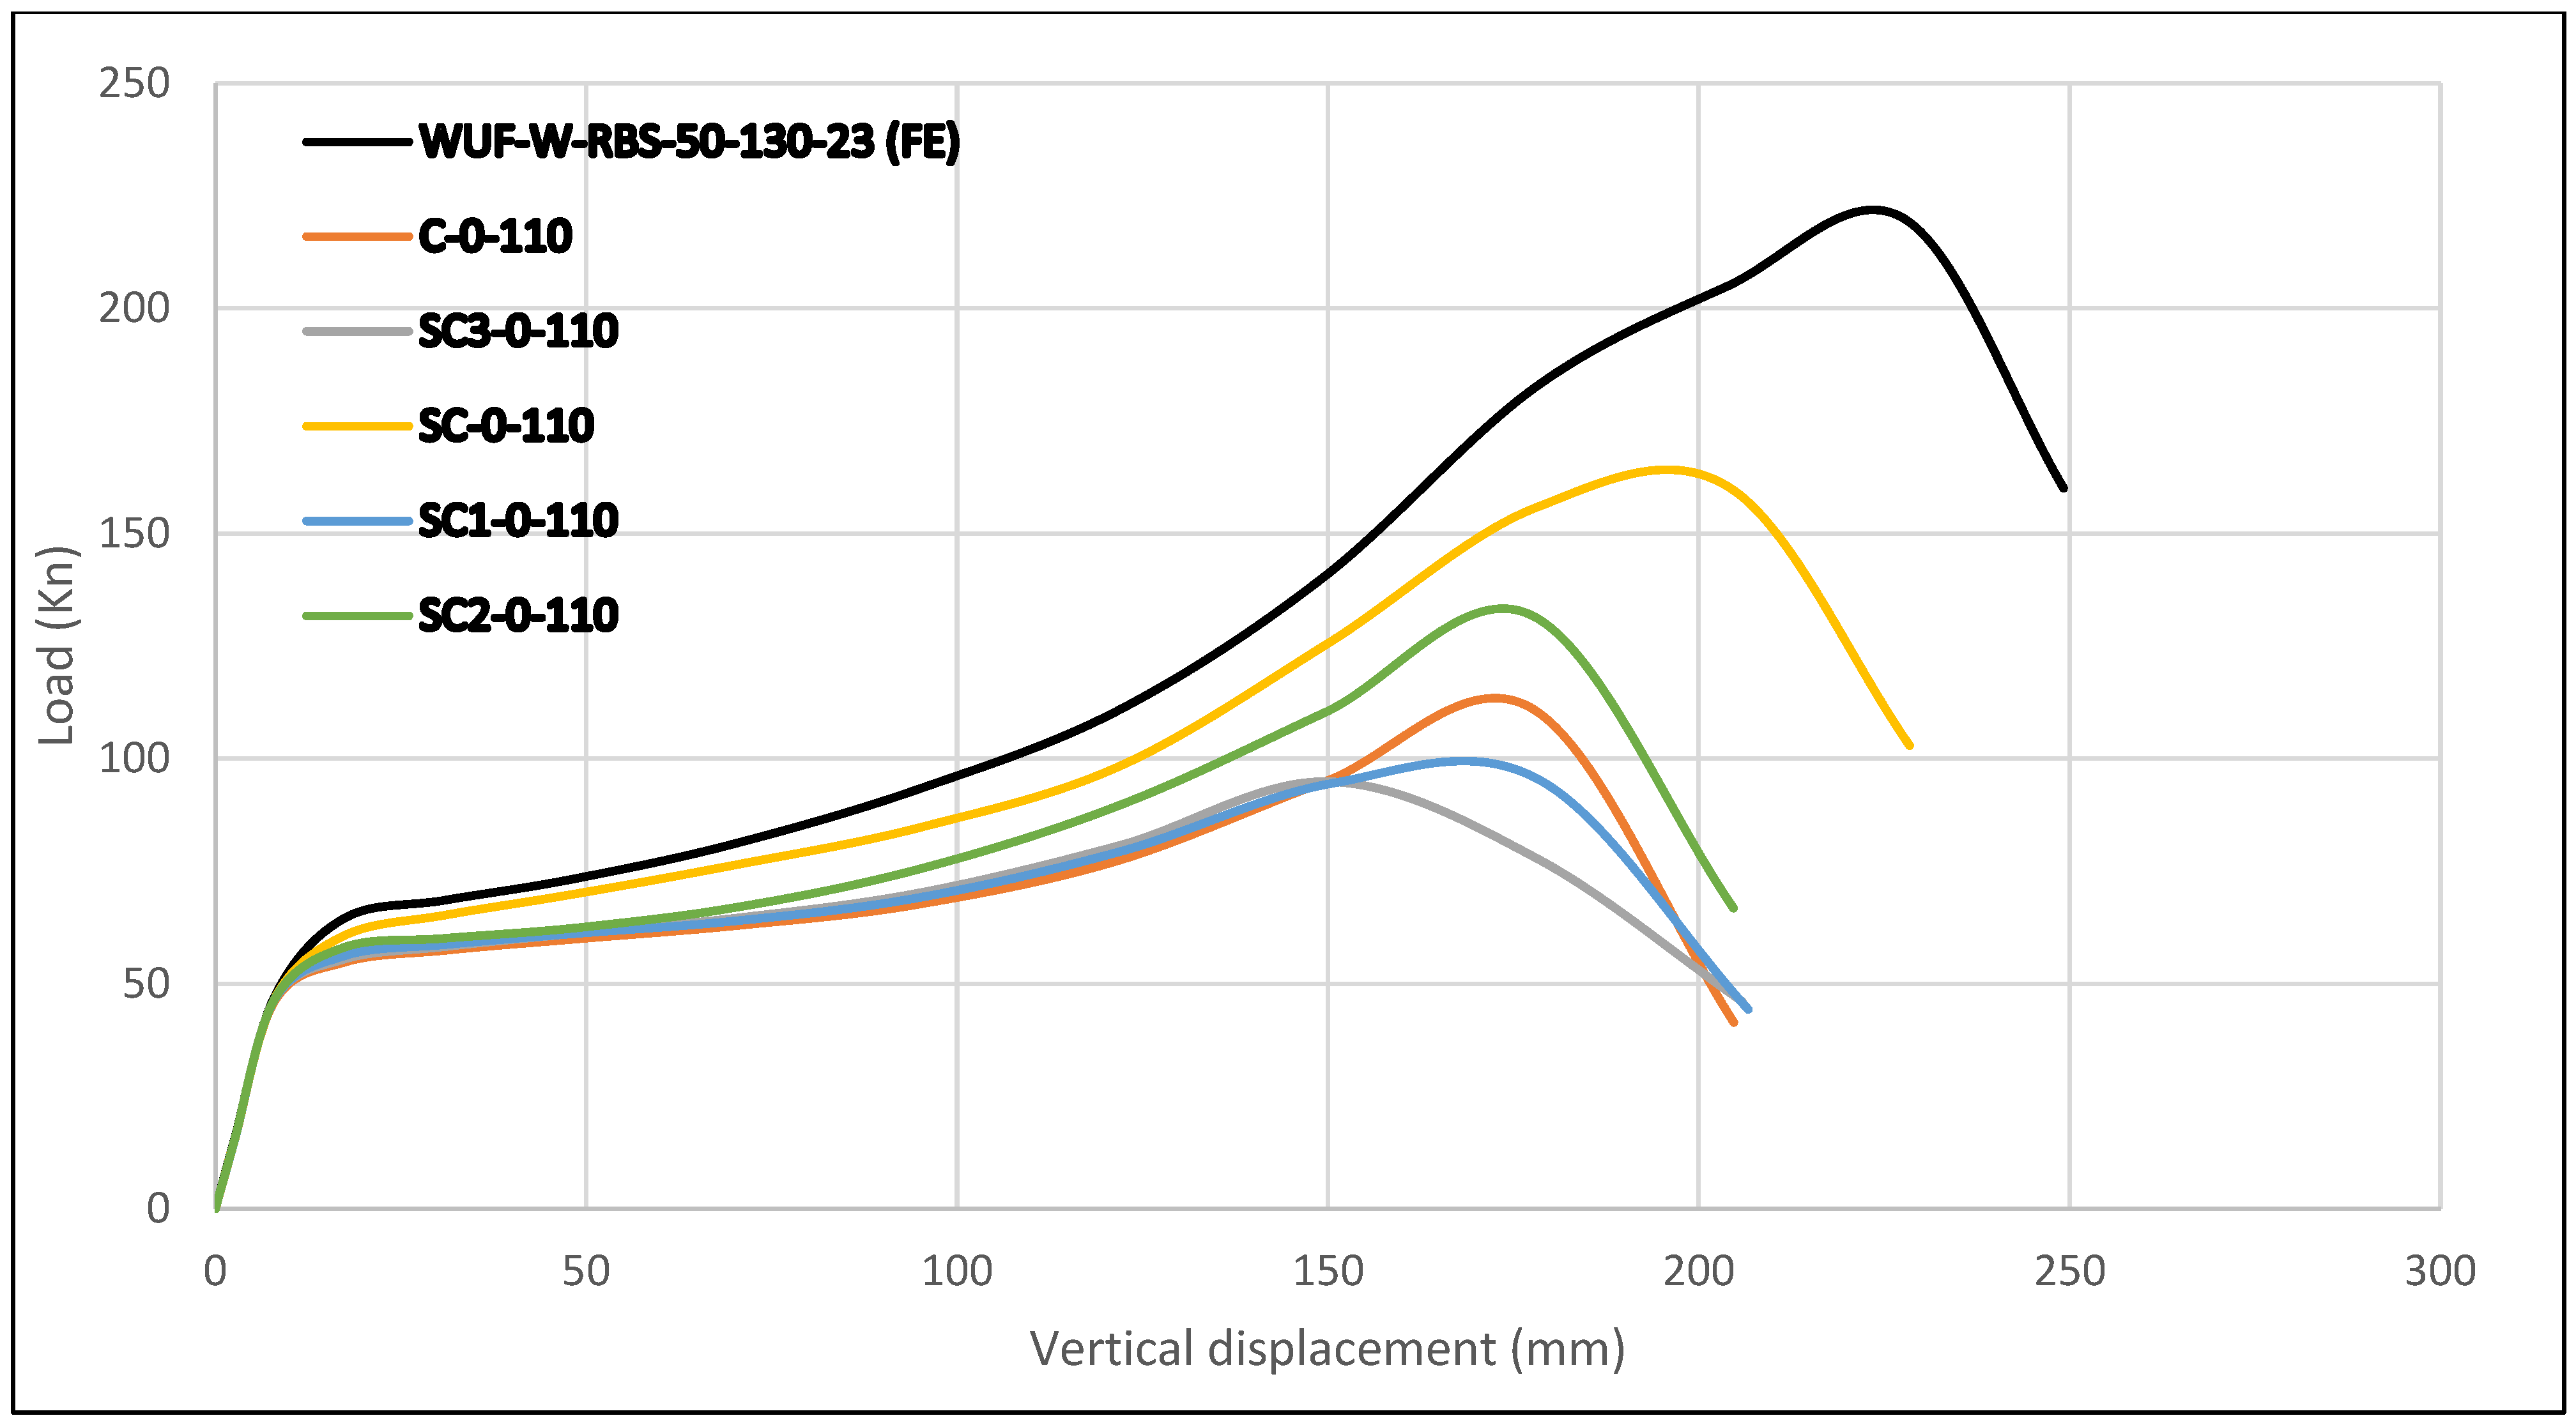
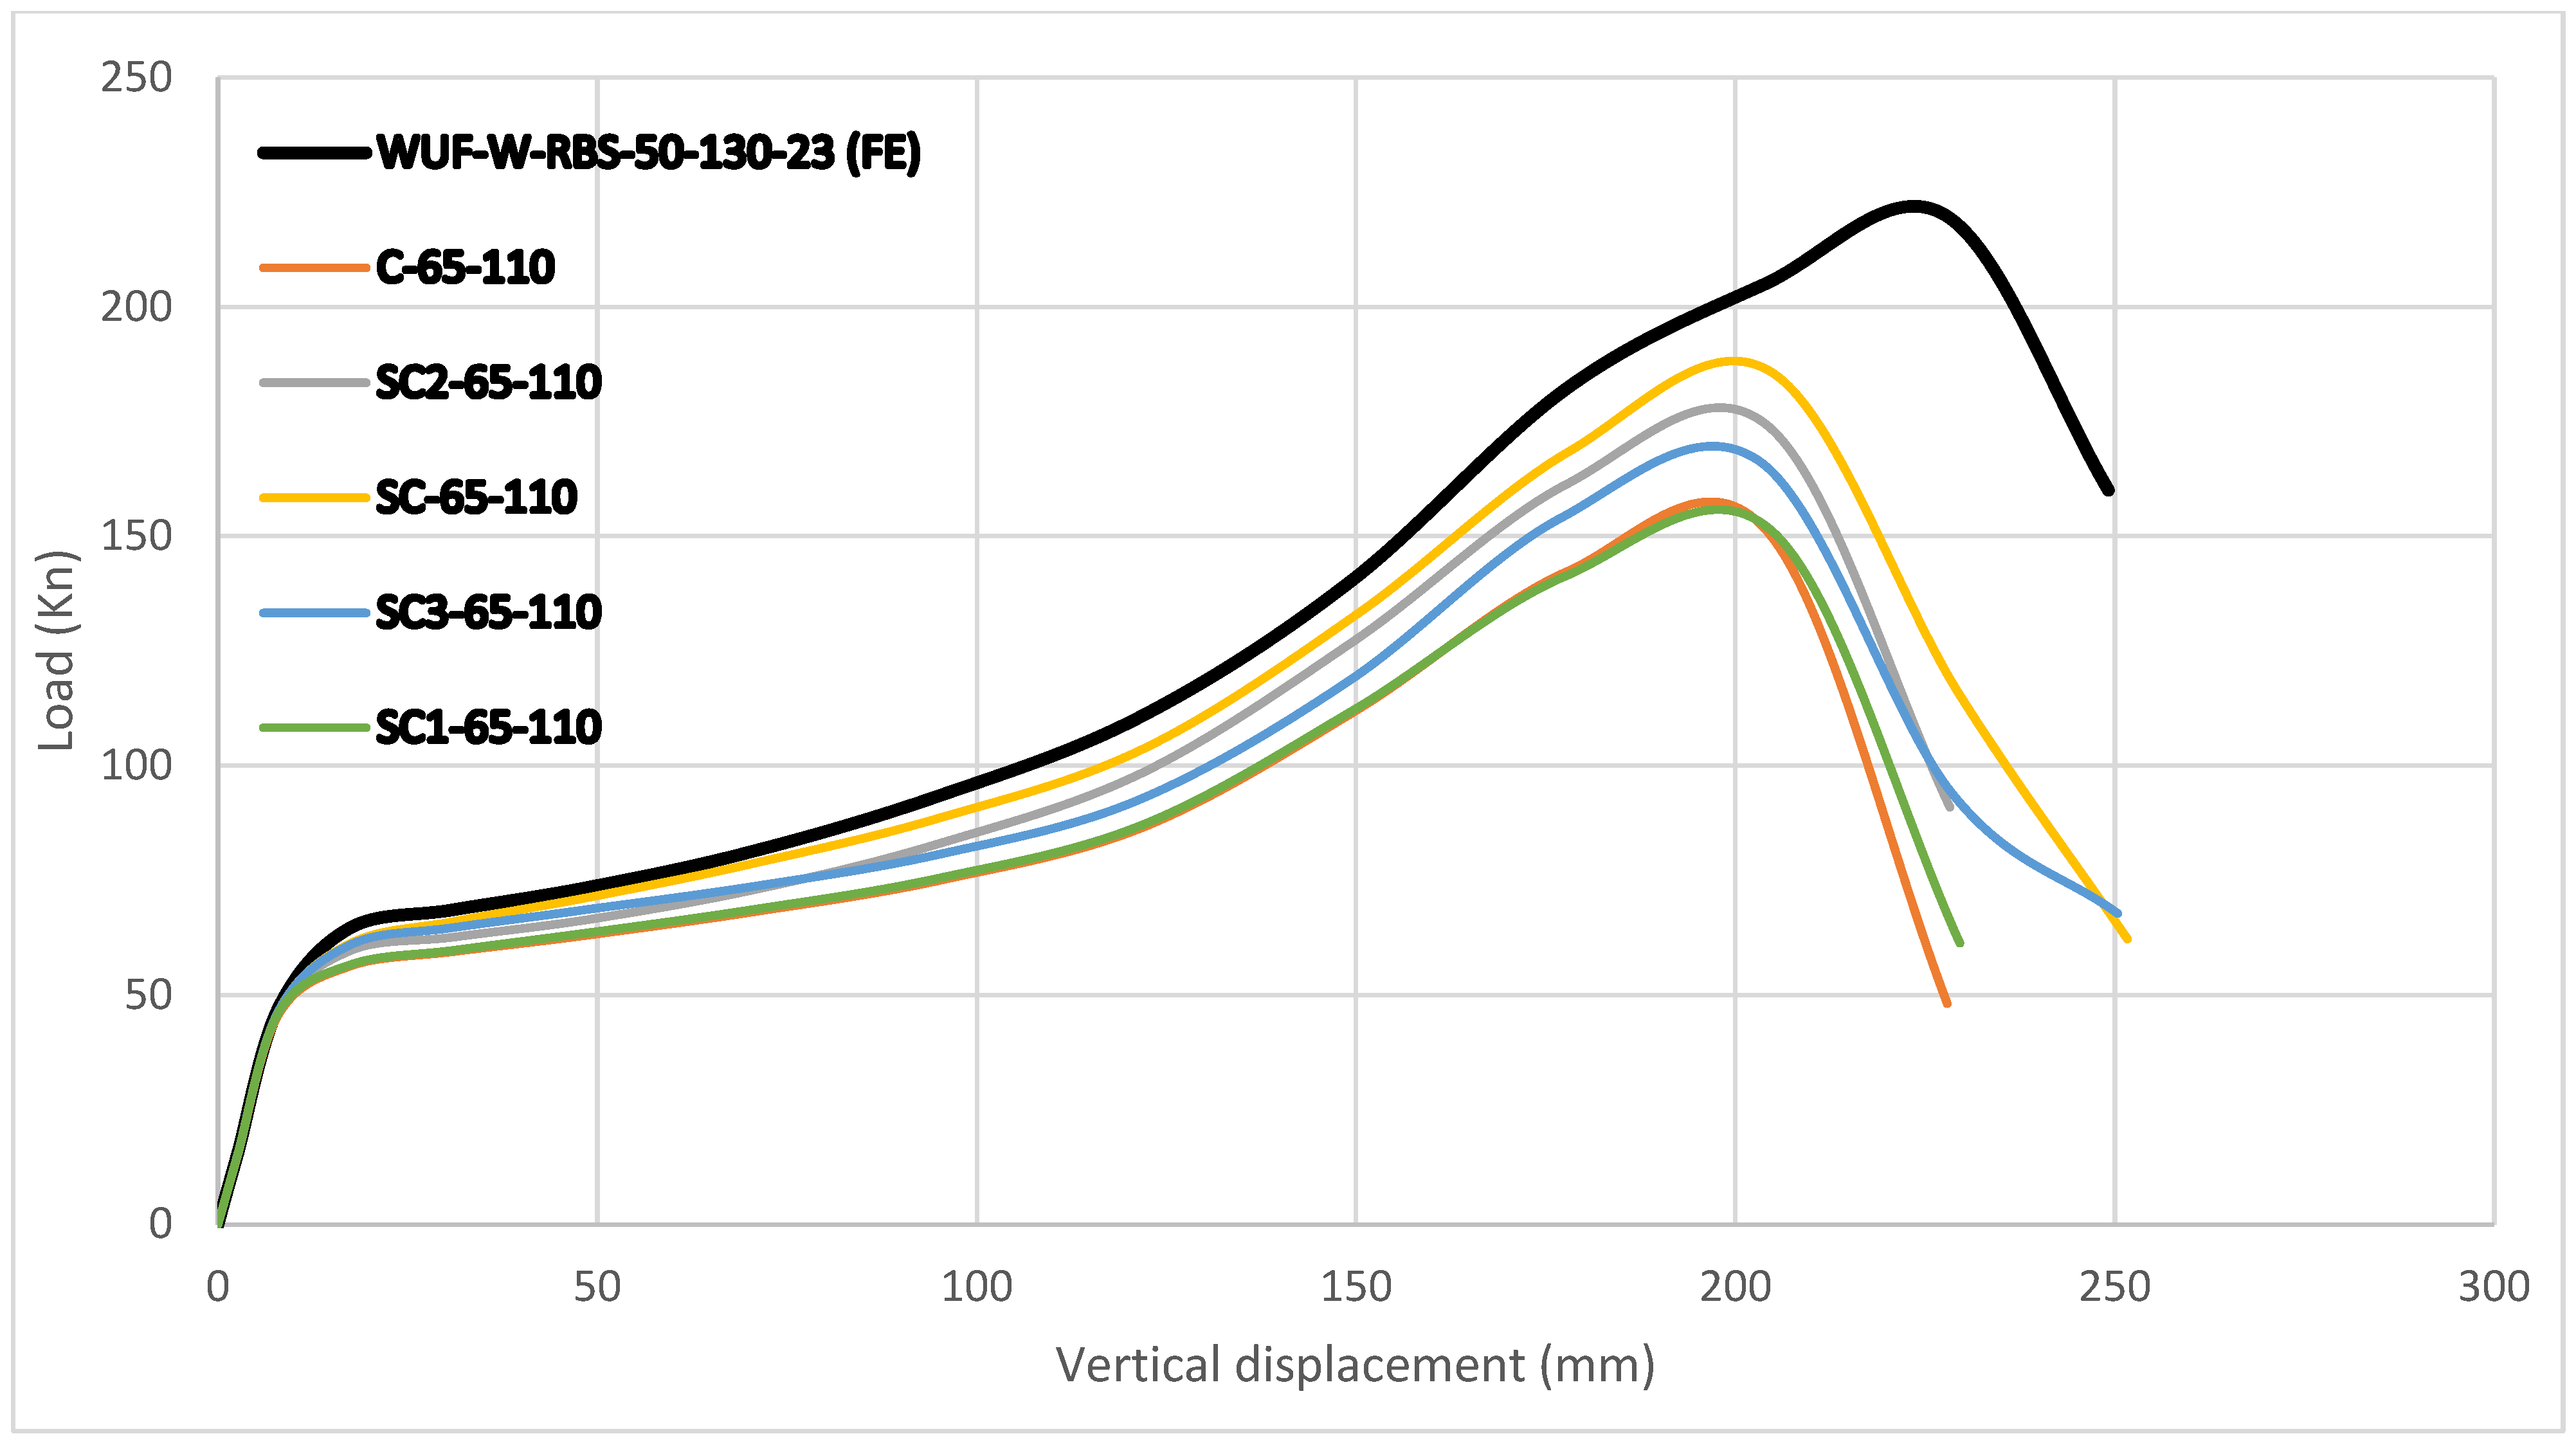
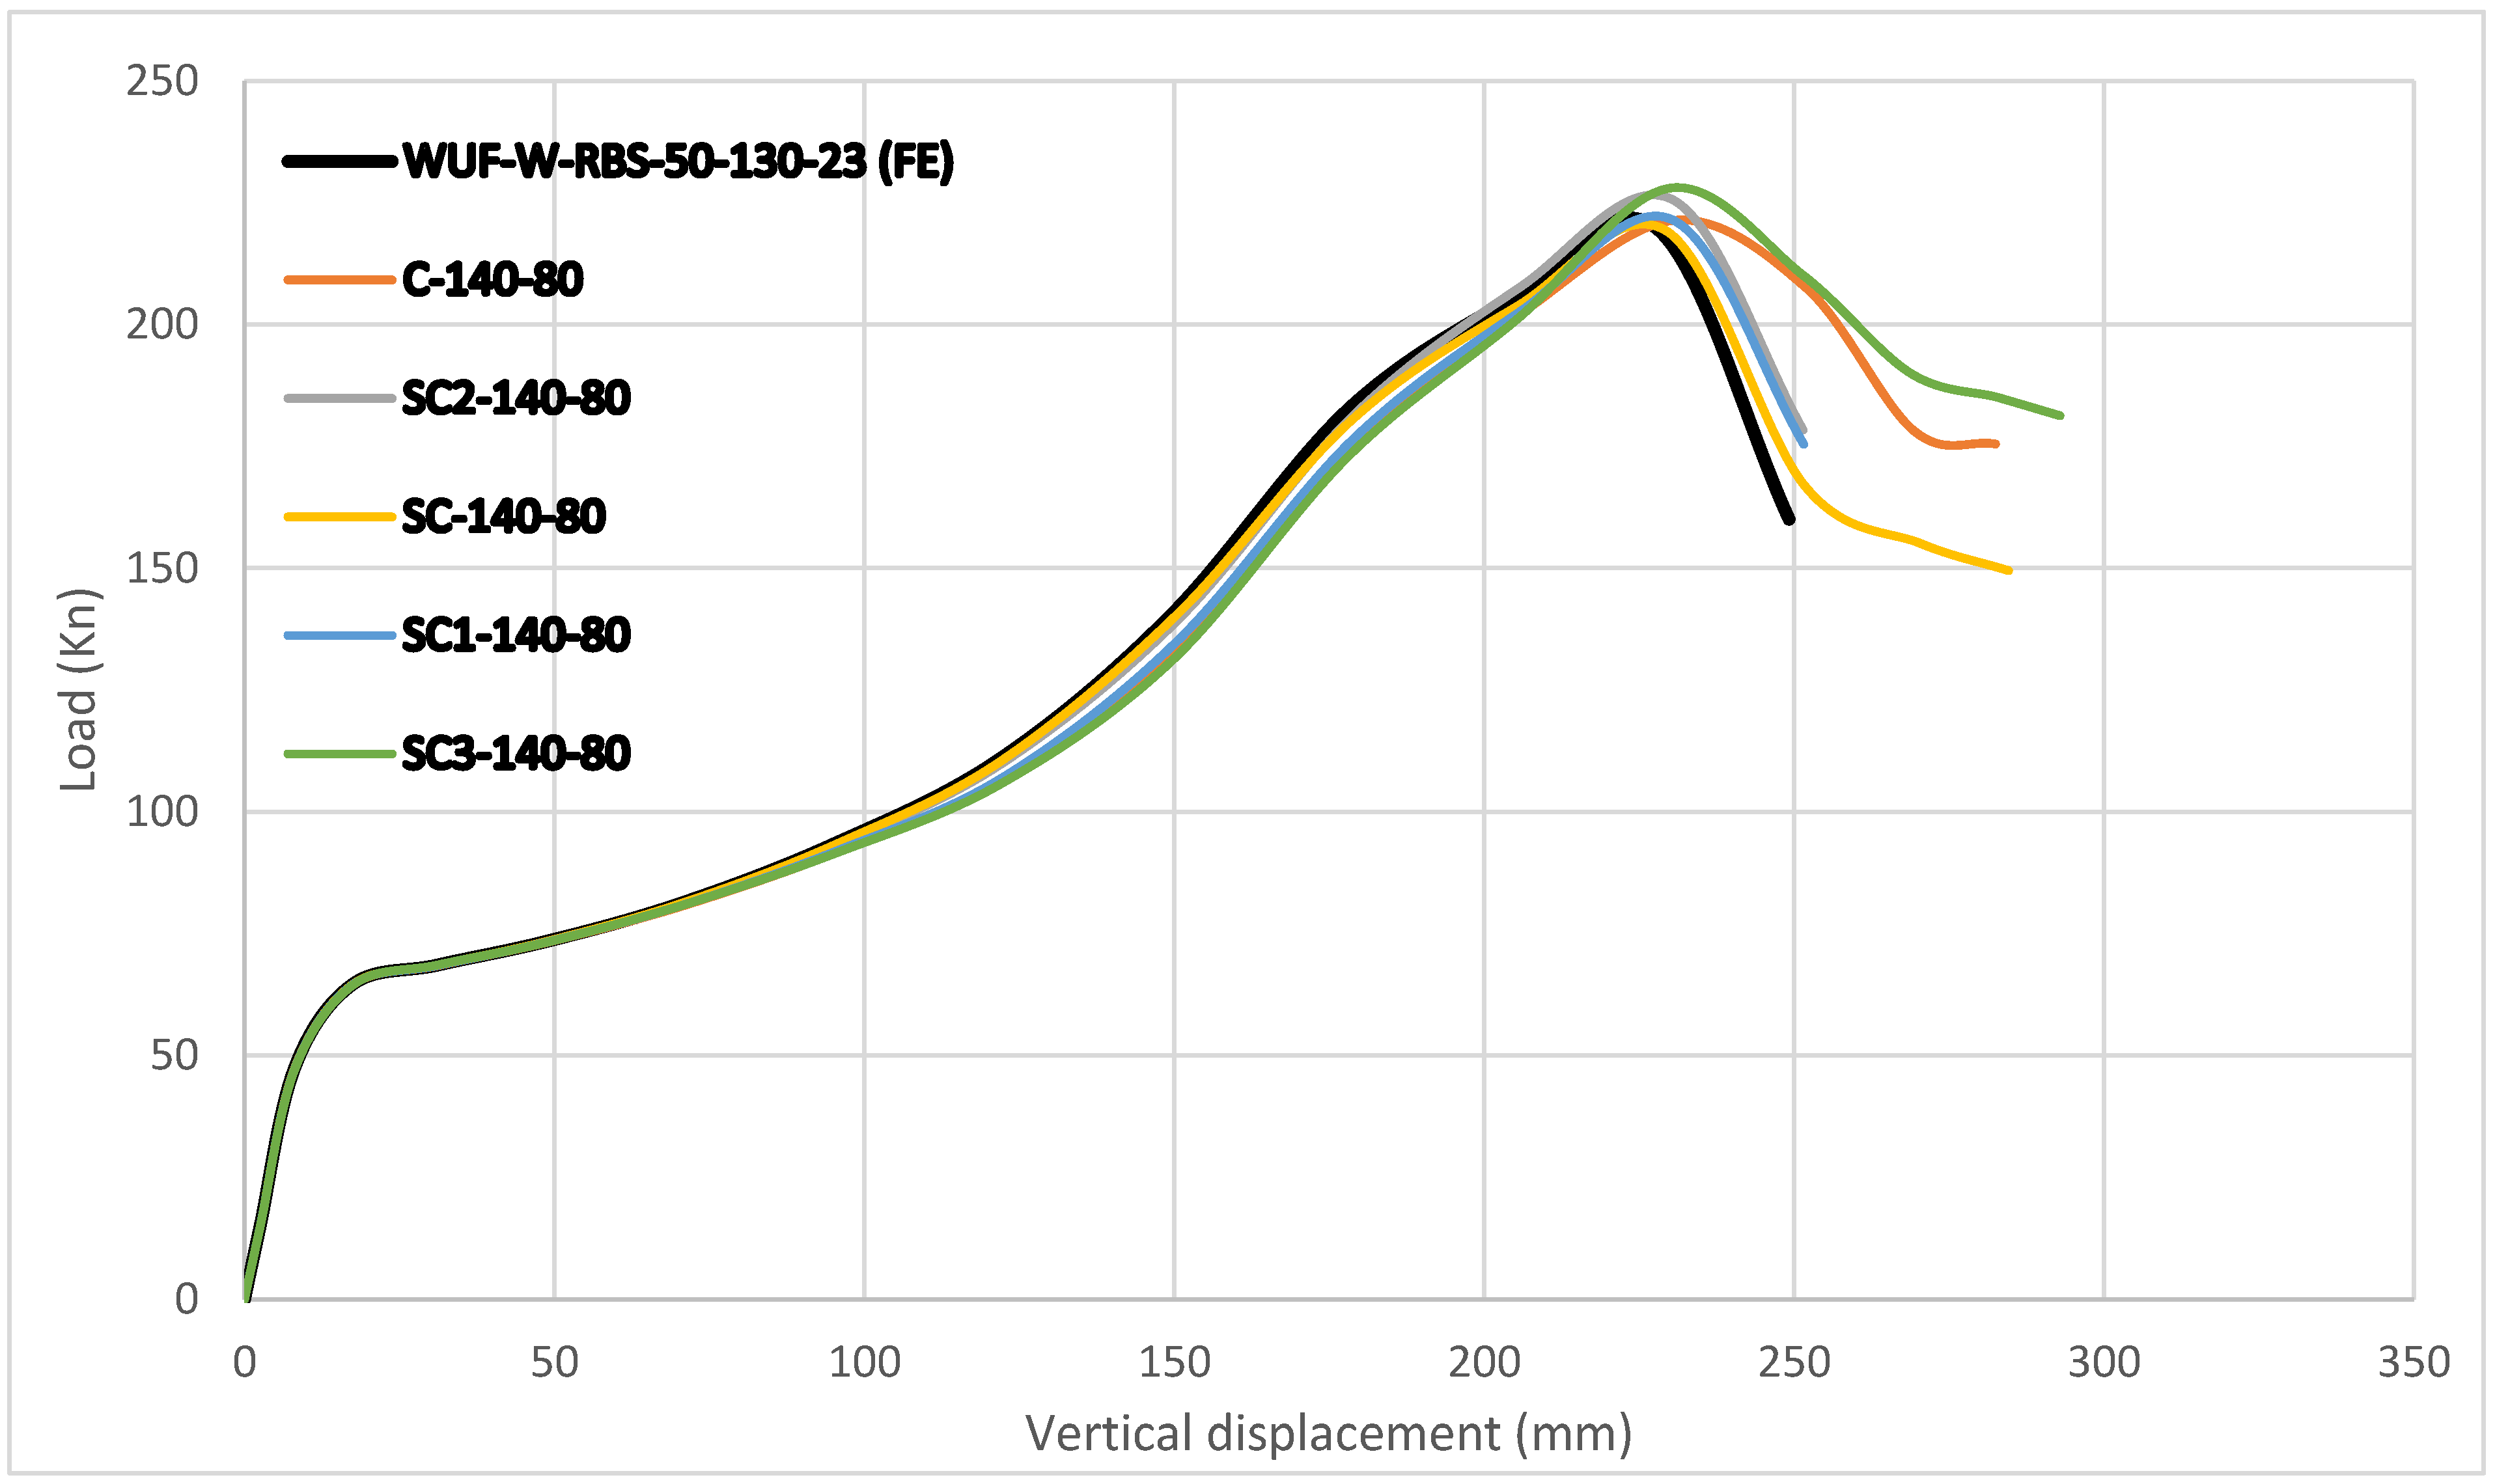
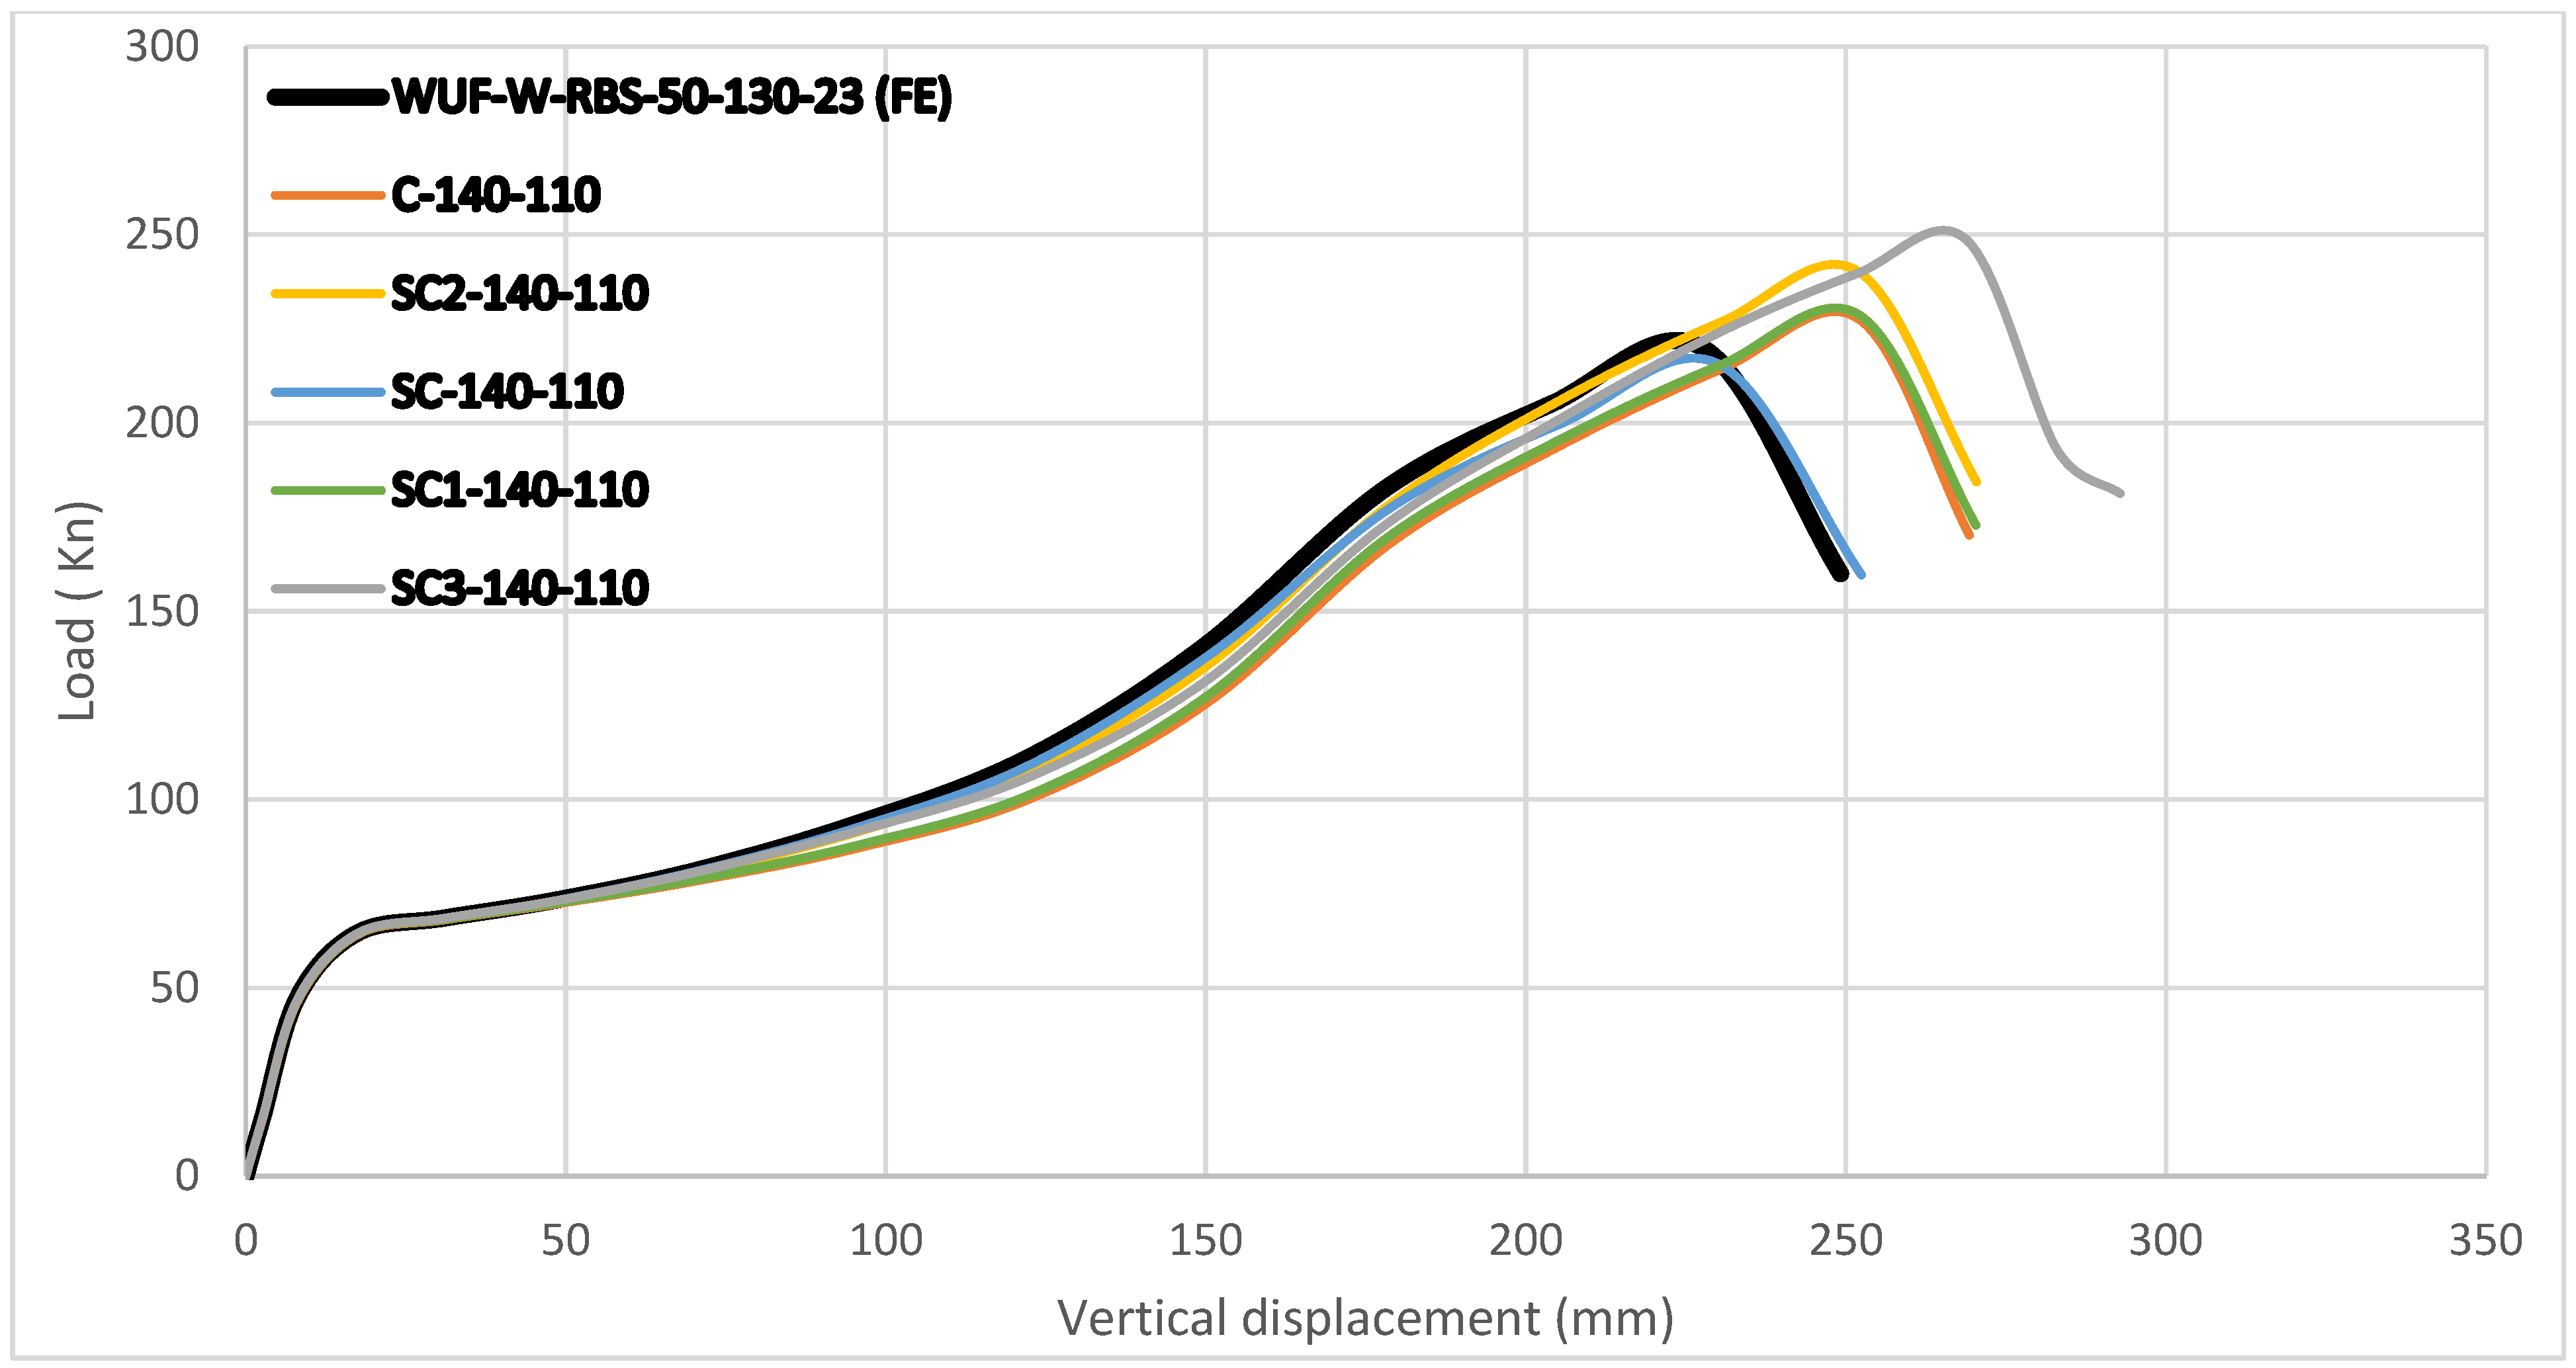
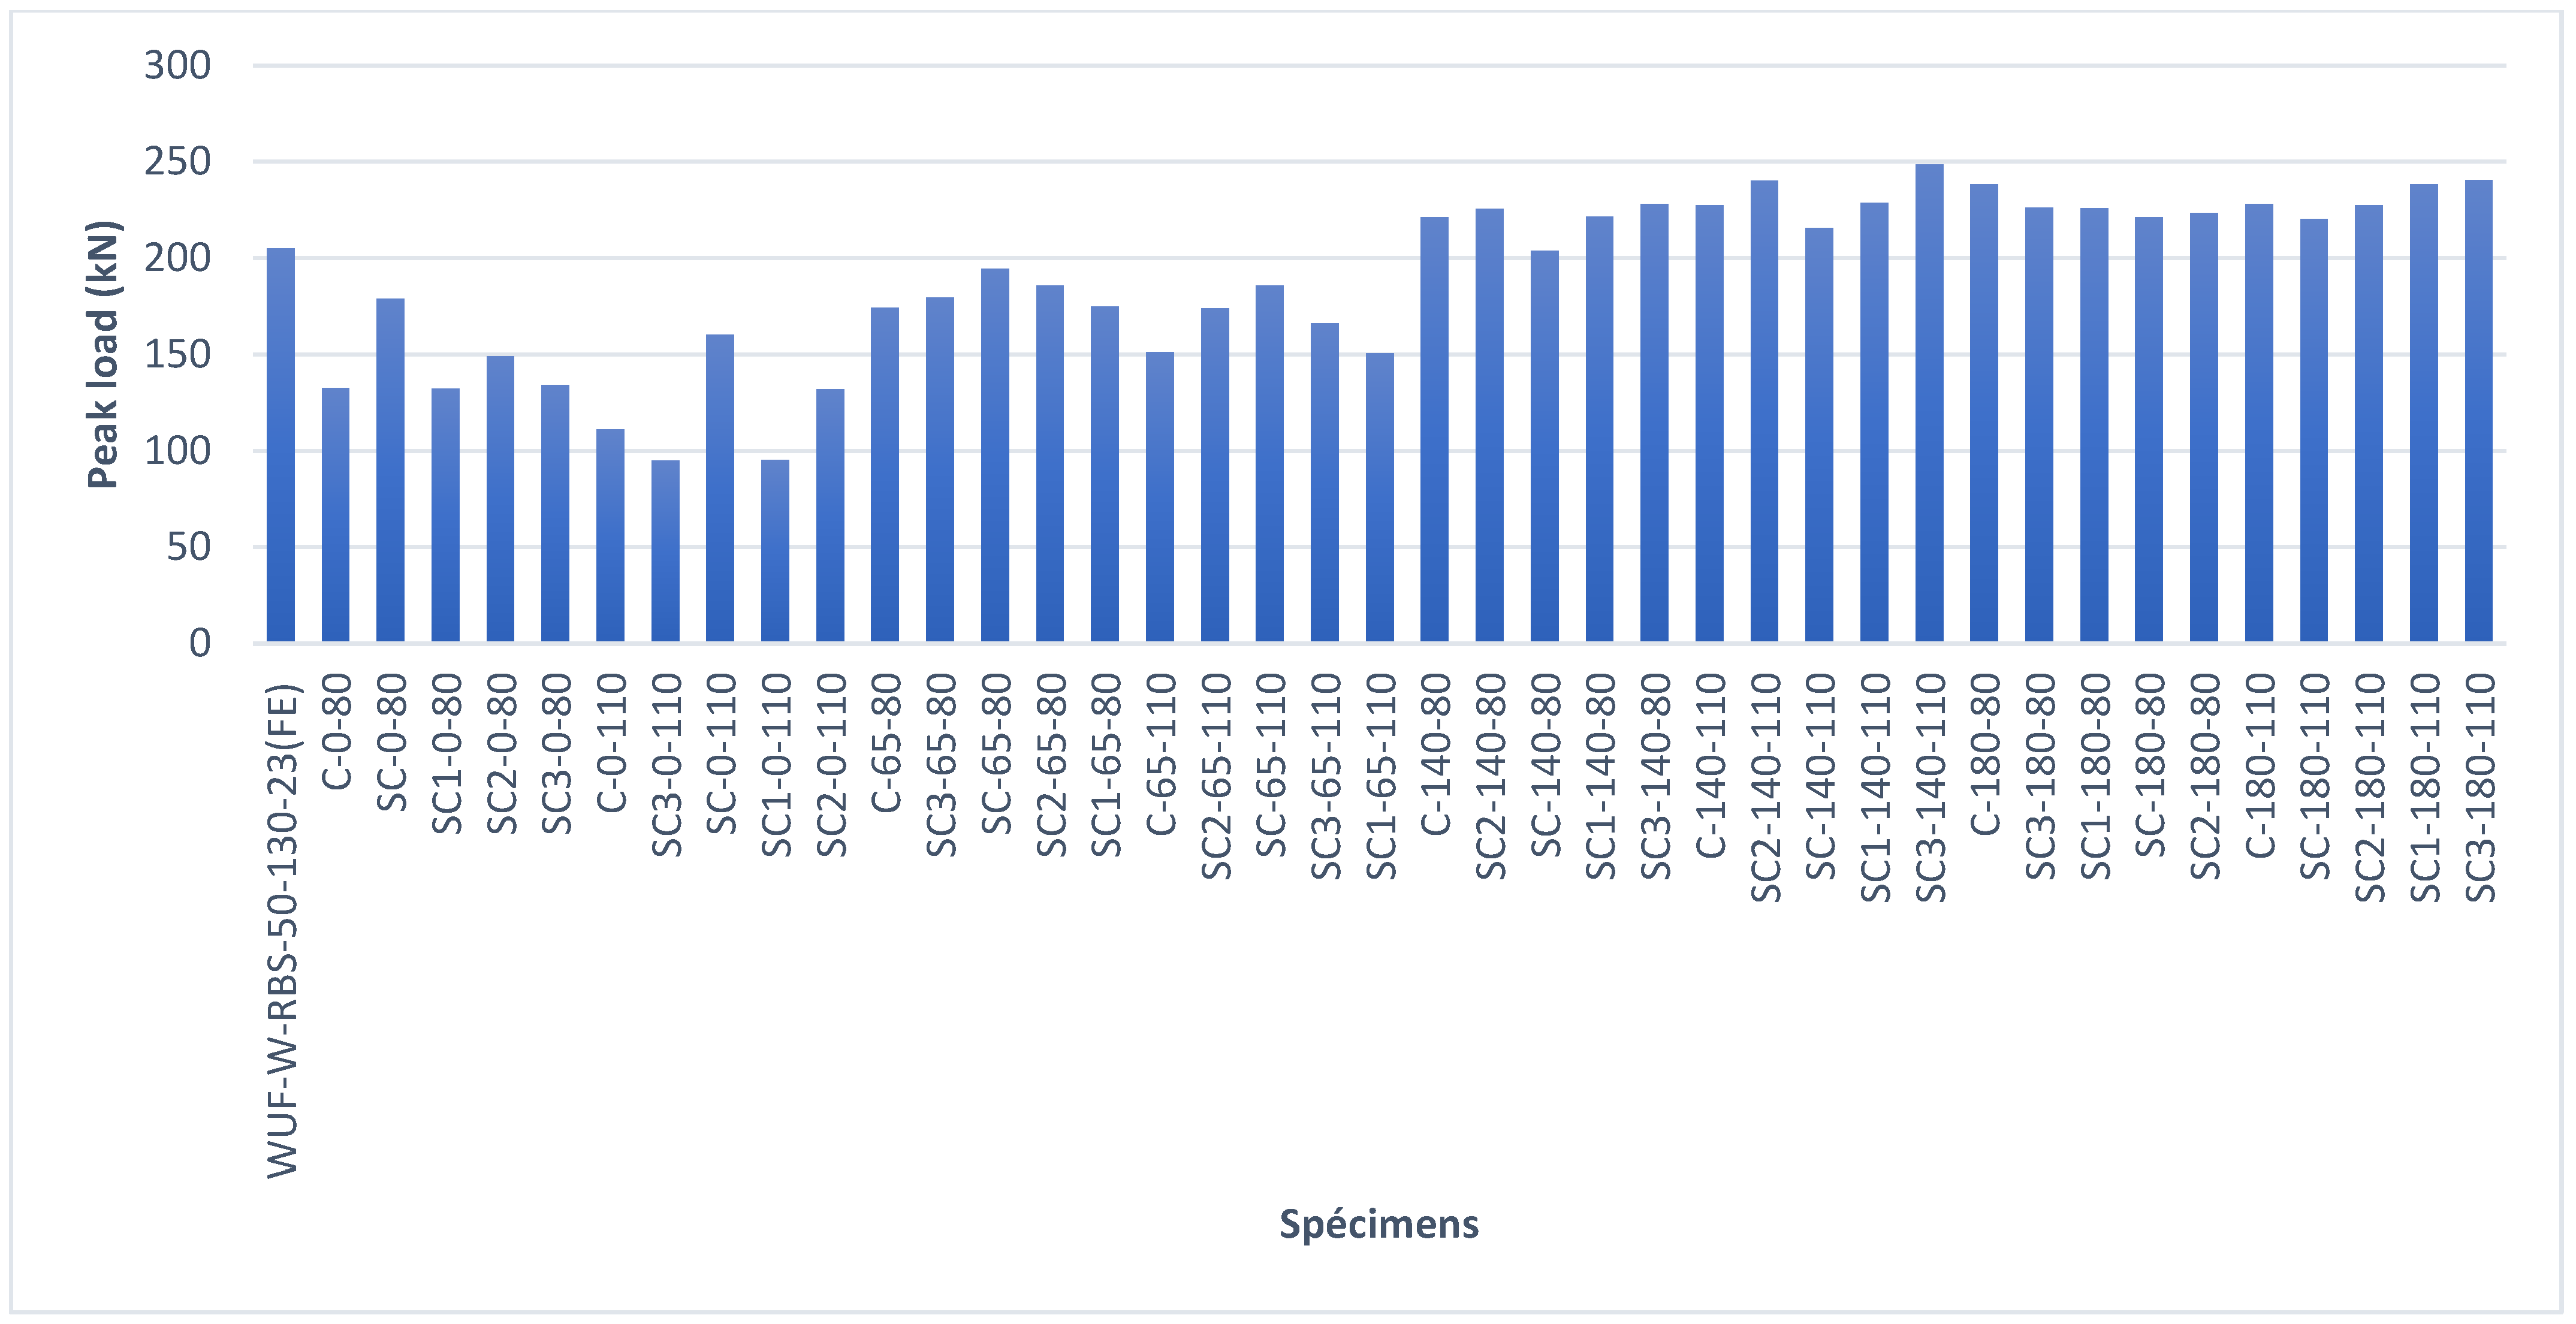
Figure 18 and Figure 19 present the vertical load–displacement curves at the top of the failed column for all specimens with openings at L = 0 mm, with diameters of 80 mm and 110 mm. The corresponding first cracking loads (Pcrack) from finite element simulations are also discussed in this study. Figure 20, Figure 21, Figure 22, Figure 23, Figure 24, Figure 25, Figure 26, Figure 27, Figure 28 and Figure 29 present both the failure patterns and vertical load–displacement responses of specimens tested with different opening sizes and positions. Figure 20, Figure 23, and Figure 26 illustrate the failure modes for opening positions at 65 mm, 140 mm, and 180 mm, respectively. The corresponding load–displacement curves for openings of varying diameters, 80 mm, 100 mm, and 110 mm, are shown in Figure 21, Figure 22, Figure 24, Figure 25, Figure 27, and Figure 28, each compared with the reference model WUF-W-RBS-50-130-23 (FE). Finally, Figure 29 summarizes the comparative peak load values of all tested specimens against the reference specimen.
For 80 mm openings, the first cracking loads were as follows:
  • C-0-80: 132.69 kN;
  • SC-0-80: 178.93 kN;
  • SC1-0-80: 132.17 kN;
  • SC2-0-80: 149.15 kN;
  • SC3-0-80: 134 kN.
These results show that when the reduced web opening overlaps with the reduced beam section (L = 0 mm), the load capacity drops significantly before final failure. However, SC-0-80 and SC2-0-80 carried higher cracking loads compared to C-0-80. This means semi-circular openings, especially SC and SC2, perform better than circular ones at this location.
For 110 mm openings, the peak load capacities were as follows:
  • C-0-110: 111.13 kN;
  • SC3-0-110: 94.92 kN;
  • SC-0-110: 160.17 kN;
  • SC1-0-110: 95.42 kN;
  • SC2-0-110: 131.88 kN.
In comparison, the reference specimen reached 219 kN. The reductions were 49.26%, 56.66%, 26.86%, 56.43%, and 39.78%, respectively. This proves that increasing the diameter to 110 mm severely reduces load-carrying capacity, making the structure weaker and more prone to early failure under column removal conditions. Even so, semi-circular openings (SC and SC2) still performed better than circular ones.
In case of the load–displacement curves of the 80 mm openings, different stiffness behaviors were seen.
  • SC-0-80 showed a moderate stiffness reduction, with its first peak load at about 204 mm displacement.
  • SC2-0-80 had more stiffness loss but still reached its peak load later than other specimens.
  • C-0-80, SC1-0-80, and SC3-0-80 showed the highest stiffness losses. Their maximum loads occurred earlier, around 177 mm displacement.
This means that more stiffness degradation speeds up peak loading and reduces the beam’s ability to dissipate energy before failure.
For 110 mm openings, the results followed the same trend.
  • SC-0-110 showed a clear stiffness loss, with its peak load at about 200 mm.
  • SC2-0-110 had a smaller loss but still followed the same pattern.
  • C-0-110 and SC1-0-110 suffered greater stiffness loss, with peaks at about 177 mm.
  • SC3-0-110 reached its maximum load even earlier, at around 150 mm.
These observations confirm that larger openings worsen stiffness degradation, accelerate peak loading, and reduce resistance before failure.

3.3. L = 65 mm Position

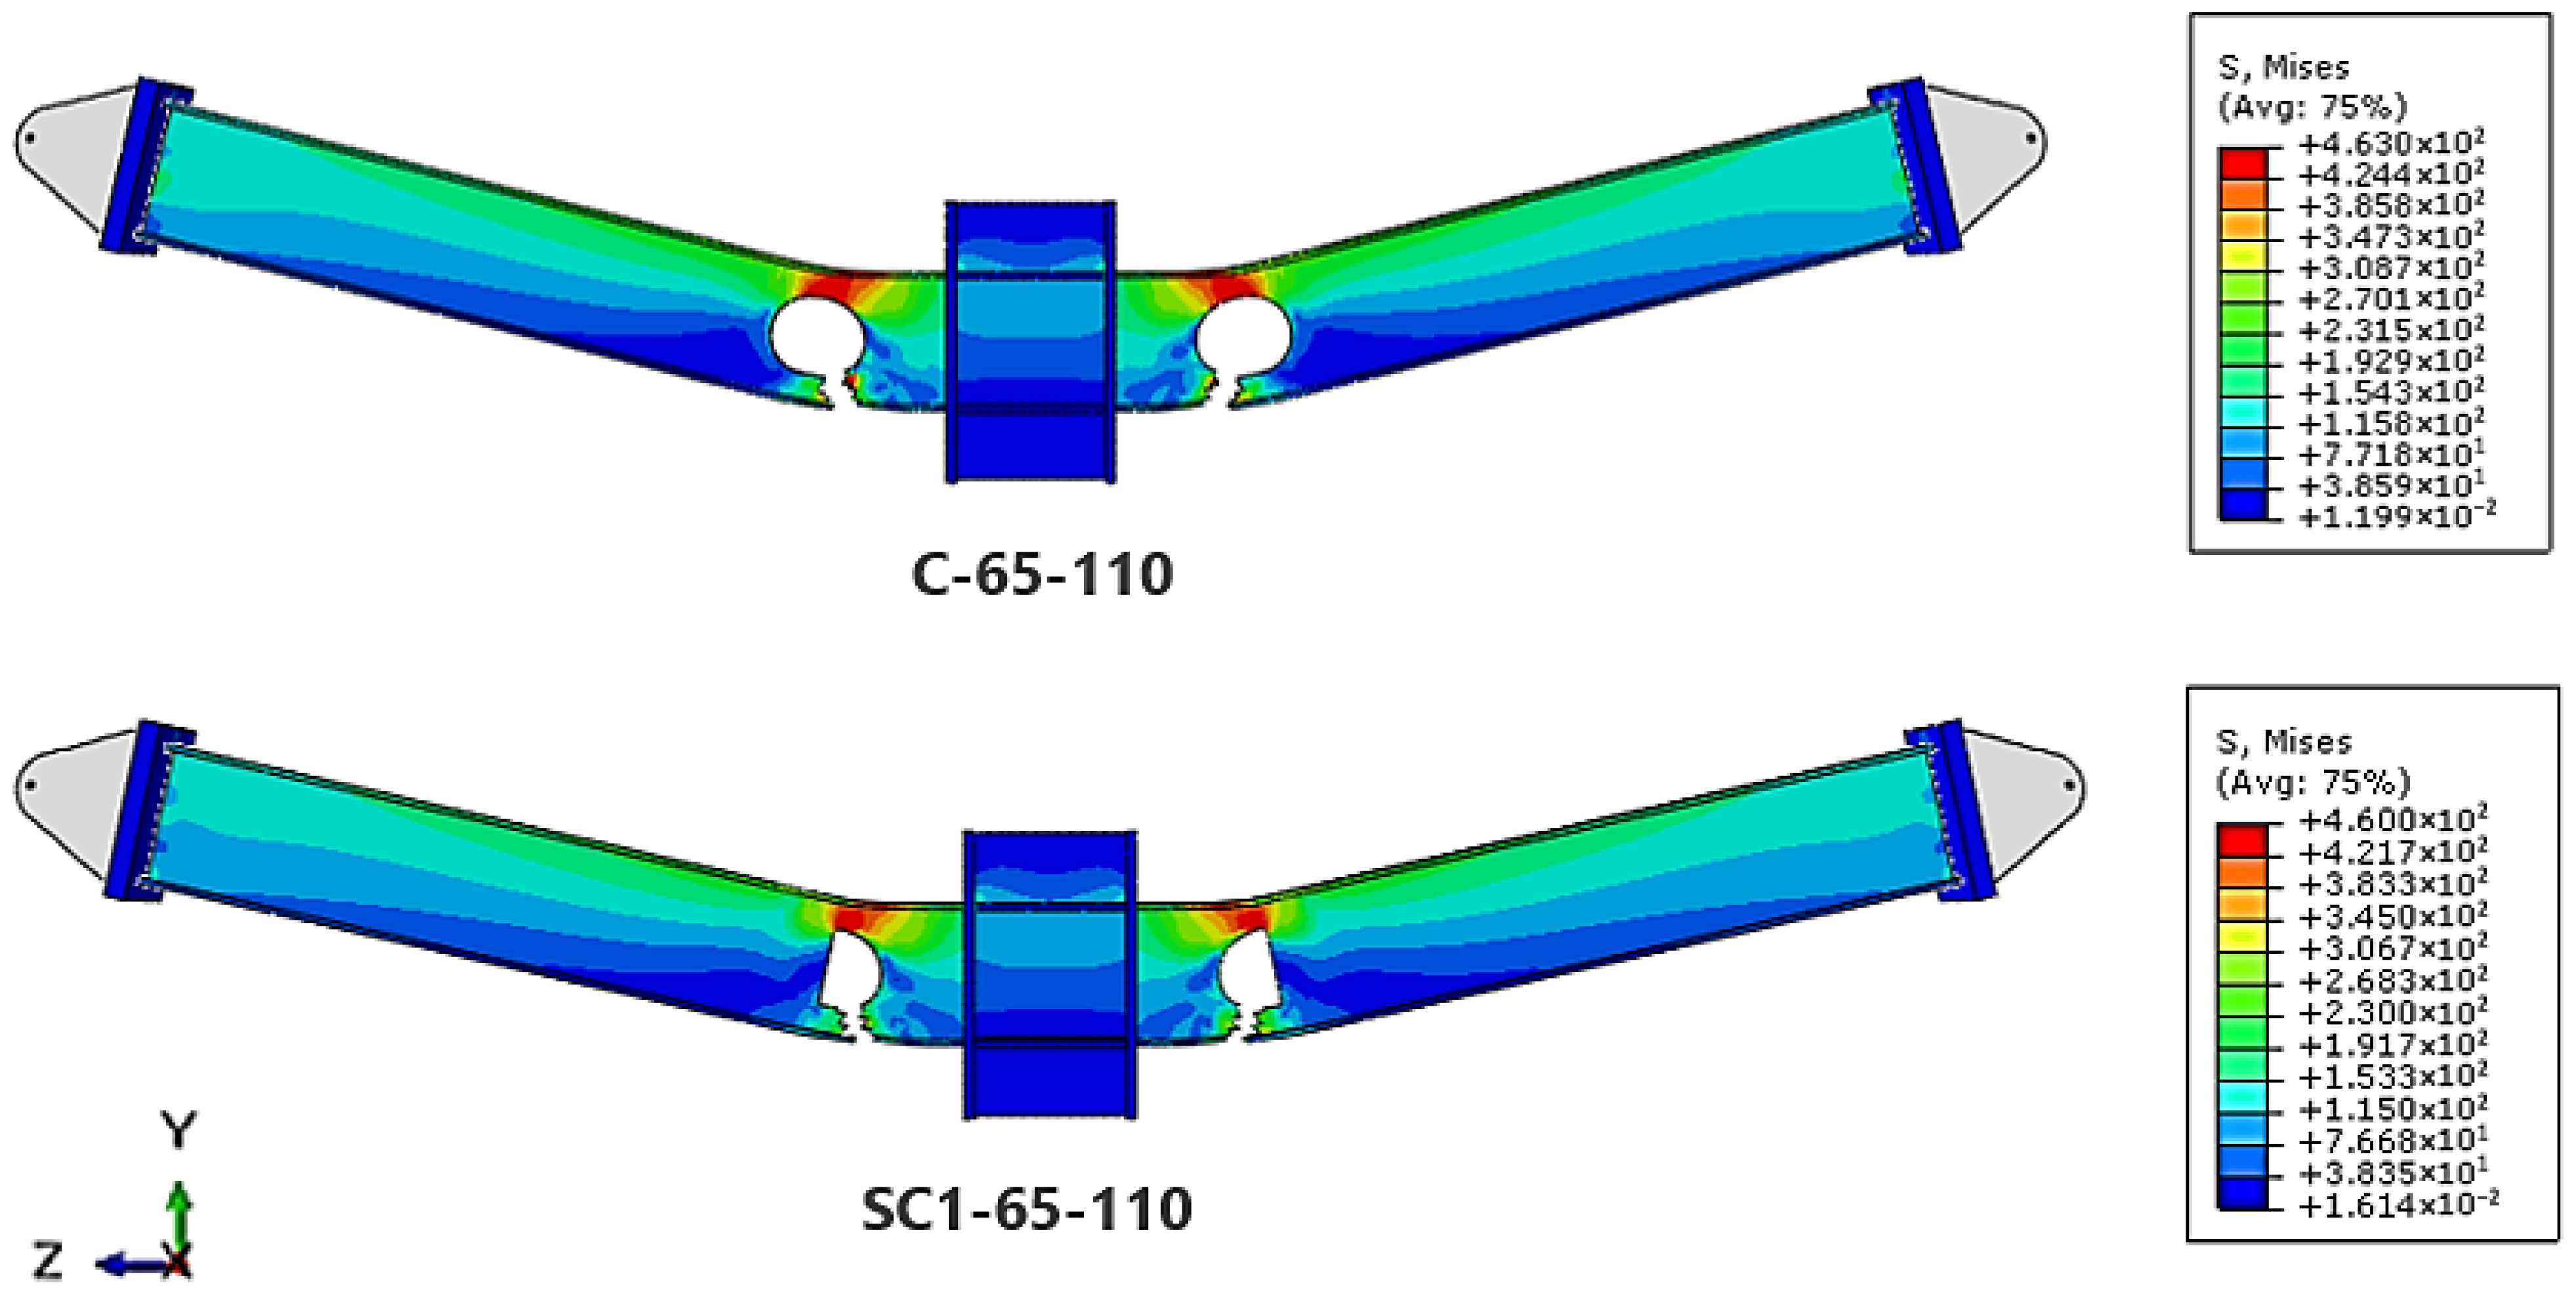
Figure 20 shows that specimens with a spacing of L = 65 mm between the reduced beam section (RBS) center and the web opening (RW) experienced less severe damage compared to specimens with openings placed directly at the RBS center (L = 0 mm).
In all tested cases, whether the openings were circular or semi-circular, the failure mechanism followed the same pattern. Cracks first appeared at the lower beam flange in the RBS zone. This area carried the highest stress because of the reduced cross-sectional stiffness. As the load increased, the cracks grew diagonally toward the web openings and then spread further into the nearby column region.
This behavior is mainly due to the short spacing between the RBS center and the web opening. The steel ligament connecting the two zones could not effectively transfer or redistribute the stresses. As a result, cracks formed earlier and spread faster. Similar findings were reported by Altheeb et al. [12], who also observed diagonal crack patterns in frames with circular, square, and hexagonal openings near the RBS center.
Results clearly show that small spacing between the flange-reduced zones and web openings is harmful. Increasing the distance helps delay crack initiation and improves resistance against progressive collapse.
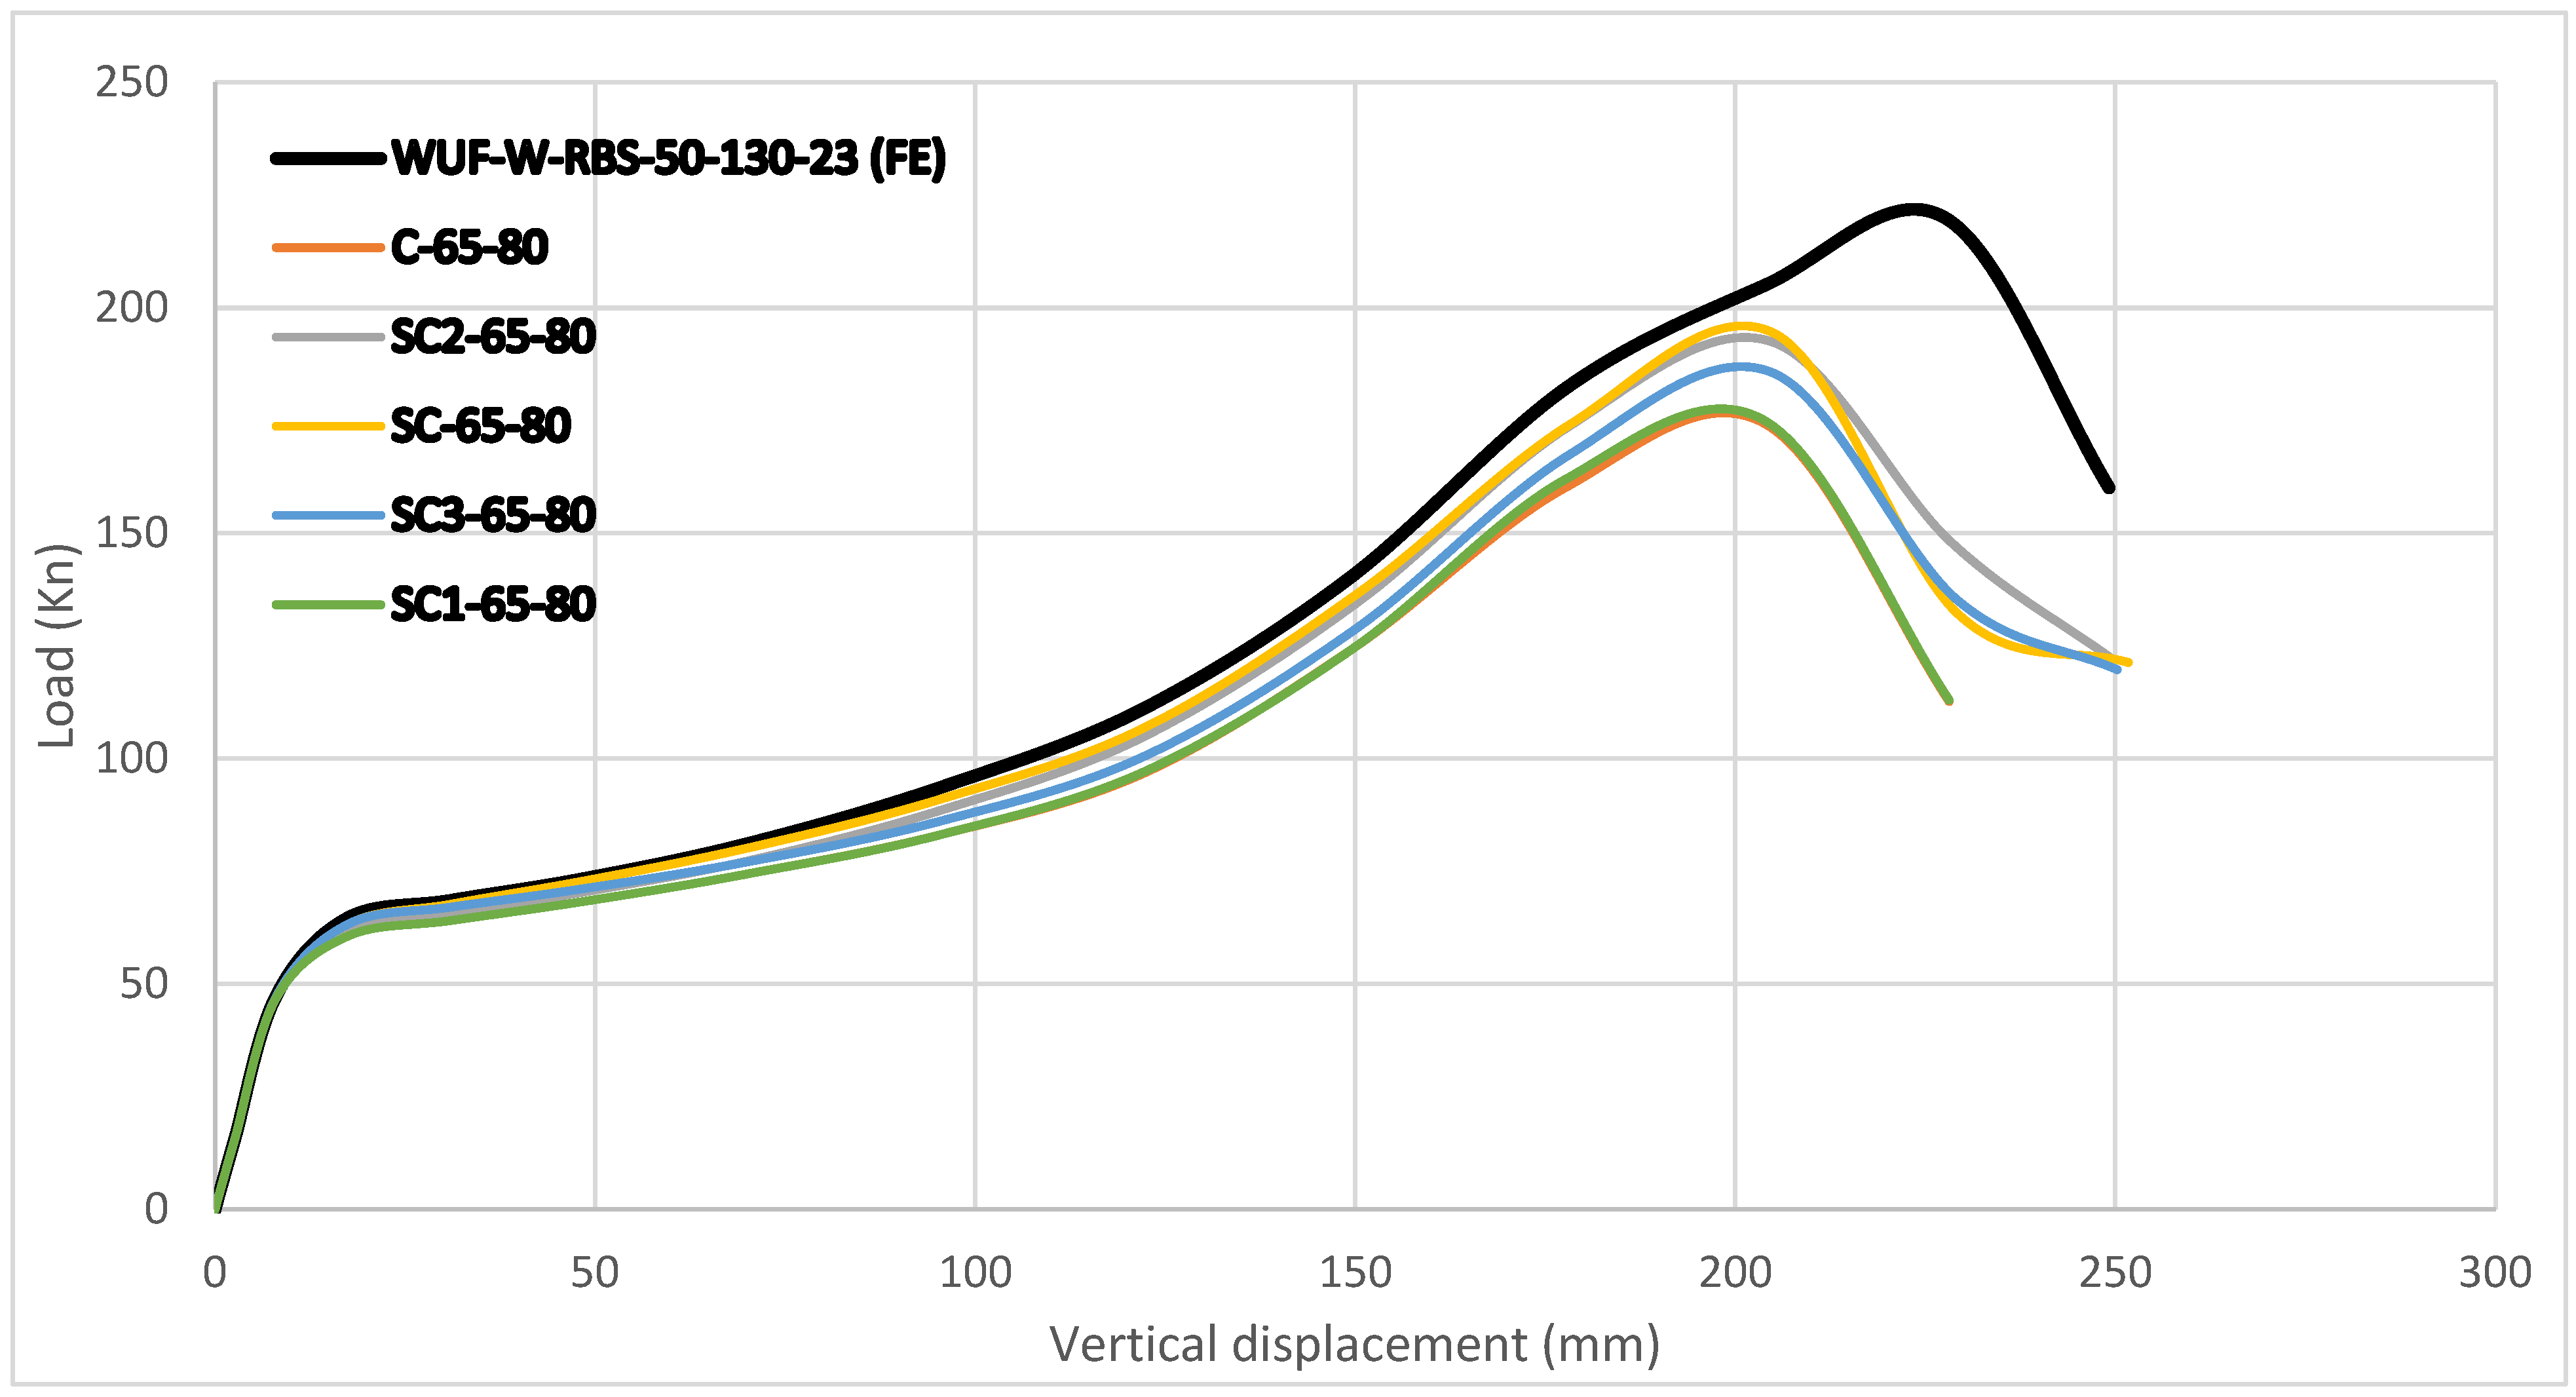
For specimens with L = 65 mm spacing and 80 mm openings, the peak load at crack initiation (Pcrack) was measured as follows:
  • 174.32 kN (C-65-80);
  • 179.43 kN (SC3-65-80);
  • 194.37 kN (SC-65-80);
  • 185.80 kN (SC2-65-80);
  • 175.00 kN (SC1-65-80).
(See Figure 29).
The reference specimen without openings carried 219 kN. Compared with this, the load reductions were as follows:
  • 20.39% (C-65-80);
  • 18.06% (SC3-65-80);
  • 11.24% (SC-65-80);
  • 15.12% (SC2-65-80);
  • 20.09% (SC1-65-80).
These results show that openings at L = 65 mm cause a moderate strength loss compared to the intact frame. However, the extent depends on the shape and orientation of the opening. Among all, SC-65-80 performed best with only 11.24% reduction, while SC2-65-80 and C-65-80 performed worst, with reductions above 20%.
For specimens with larger 110 mm openings at the same spacing (L = 65 mm), the Pcrack values were as follows:
  • 151.28 kN (C-65-110);
  • 173.94 kN (SC2-65-110);
  • 185.75 kN (SC-65-110);
  • 166.25 kN (SC3-65-110);
  • 150.75 kN (SC1-65-110).
The reductions compared with the reference specimen (219 kN) were as follows:
  • 30.94% (C-65-110);
  • 20.49% (SC2-65-110);
  • 15.14% (SC-65-110);
  • 24.04% (SC3-65-110);
  • 31.18% (SC1-65-110).
Clearly, enlarging the opening diameter to 110 mm reduced strength even more, especially in C-65-110 and SC1-65-110, where the capacity dropped by over 30%. On the other hand, SC-65-110 was the best performer, showing only a 15.14% reduction. This highlights the benefit of semi-circular shapes in controlling the negative effects of large openings.
Figure 21 and Figure 22 show the load–displacement curves. The reference specimen always outperformed specimens with 80 mm openings. Adding openings reduced stiffness in all cases. However, SC-65-80 and SC2-65-80 performed better than the others, showing improved resistance. All specimens reached their peak load at almost the same displacement of 204 mm, meaning the semi-circular openings helped reduce the negative effect of material removal.
When the opening size increased to 110 mm, the general trend was similar. Still, important differences appeared between the configurations. SC-65-110 and SC2-65-110 showed better performance compared to the circular opening (C-65-110). Although stiffness decreased in all cases, these semi-circular layouts kept more structural capacity during loading. For all, the maximum load was reached at around 200 mm displacement, which is earlier than the reference frame. Even so, SC and SC2 arrangements again performed best.
Both the shape and placement of web openings strongly affect the behavior of steel frames. Semi-circular openings, especially in the SC and SC2 orientations, help maintain more capacity compared to circular openings of the same size.

3.4. L = 140 mm Position

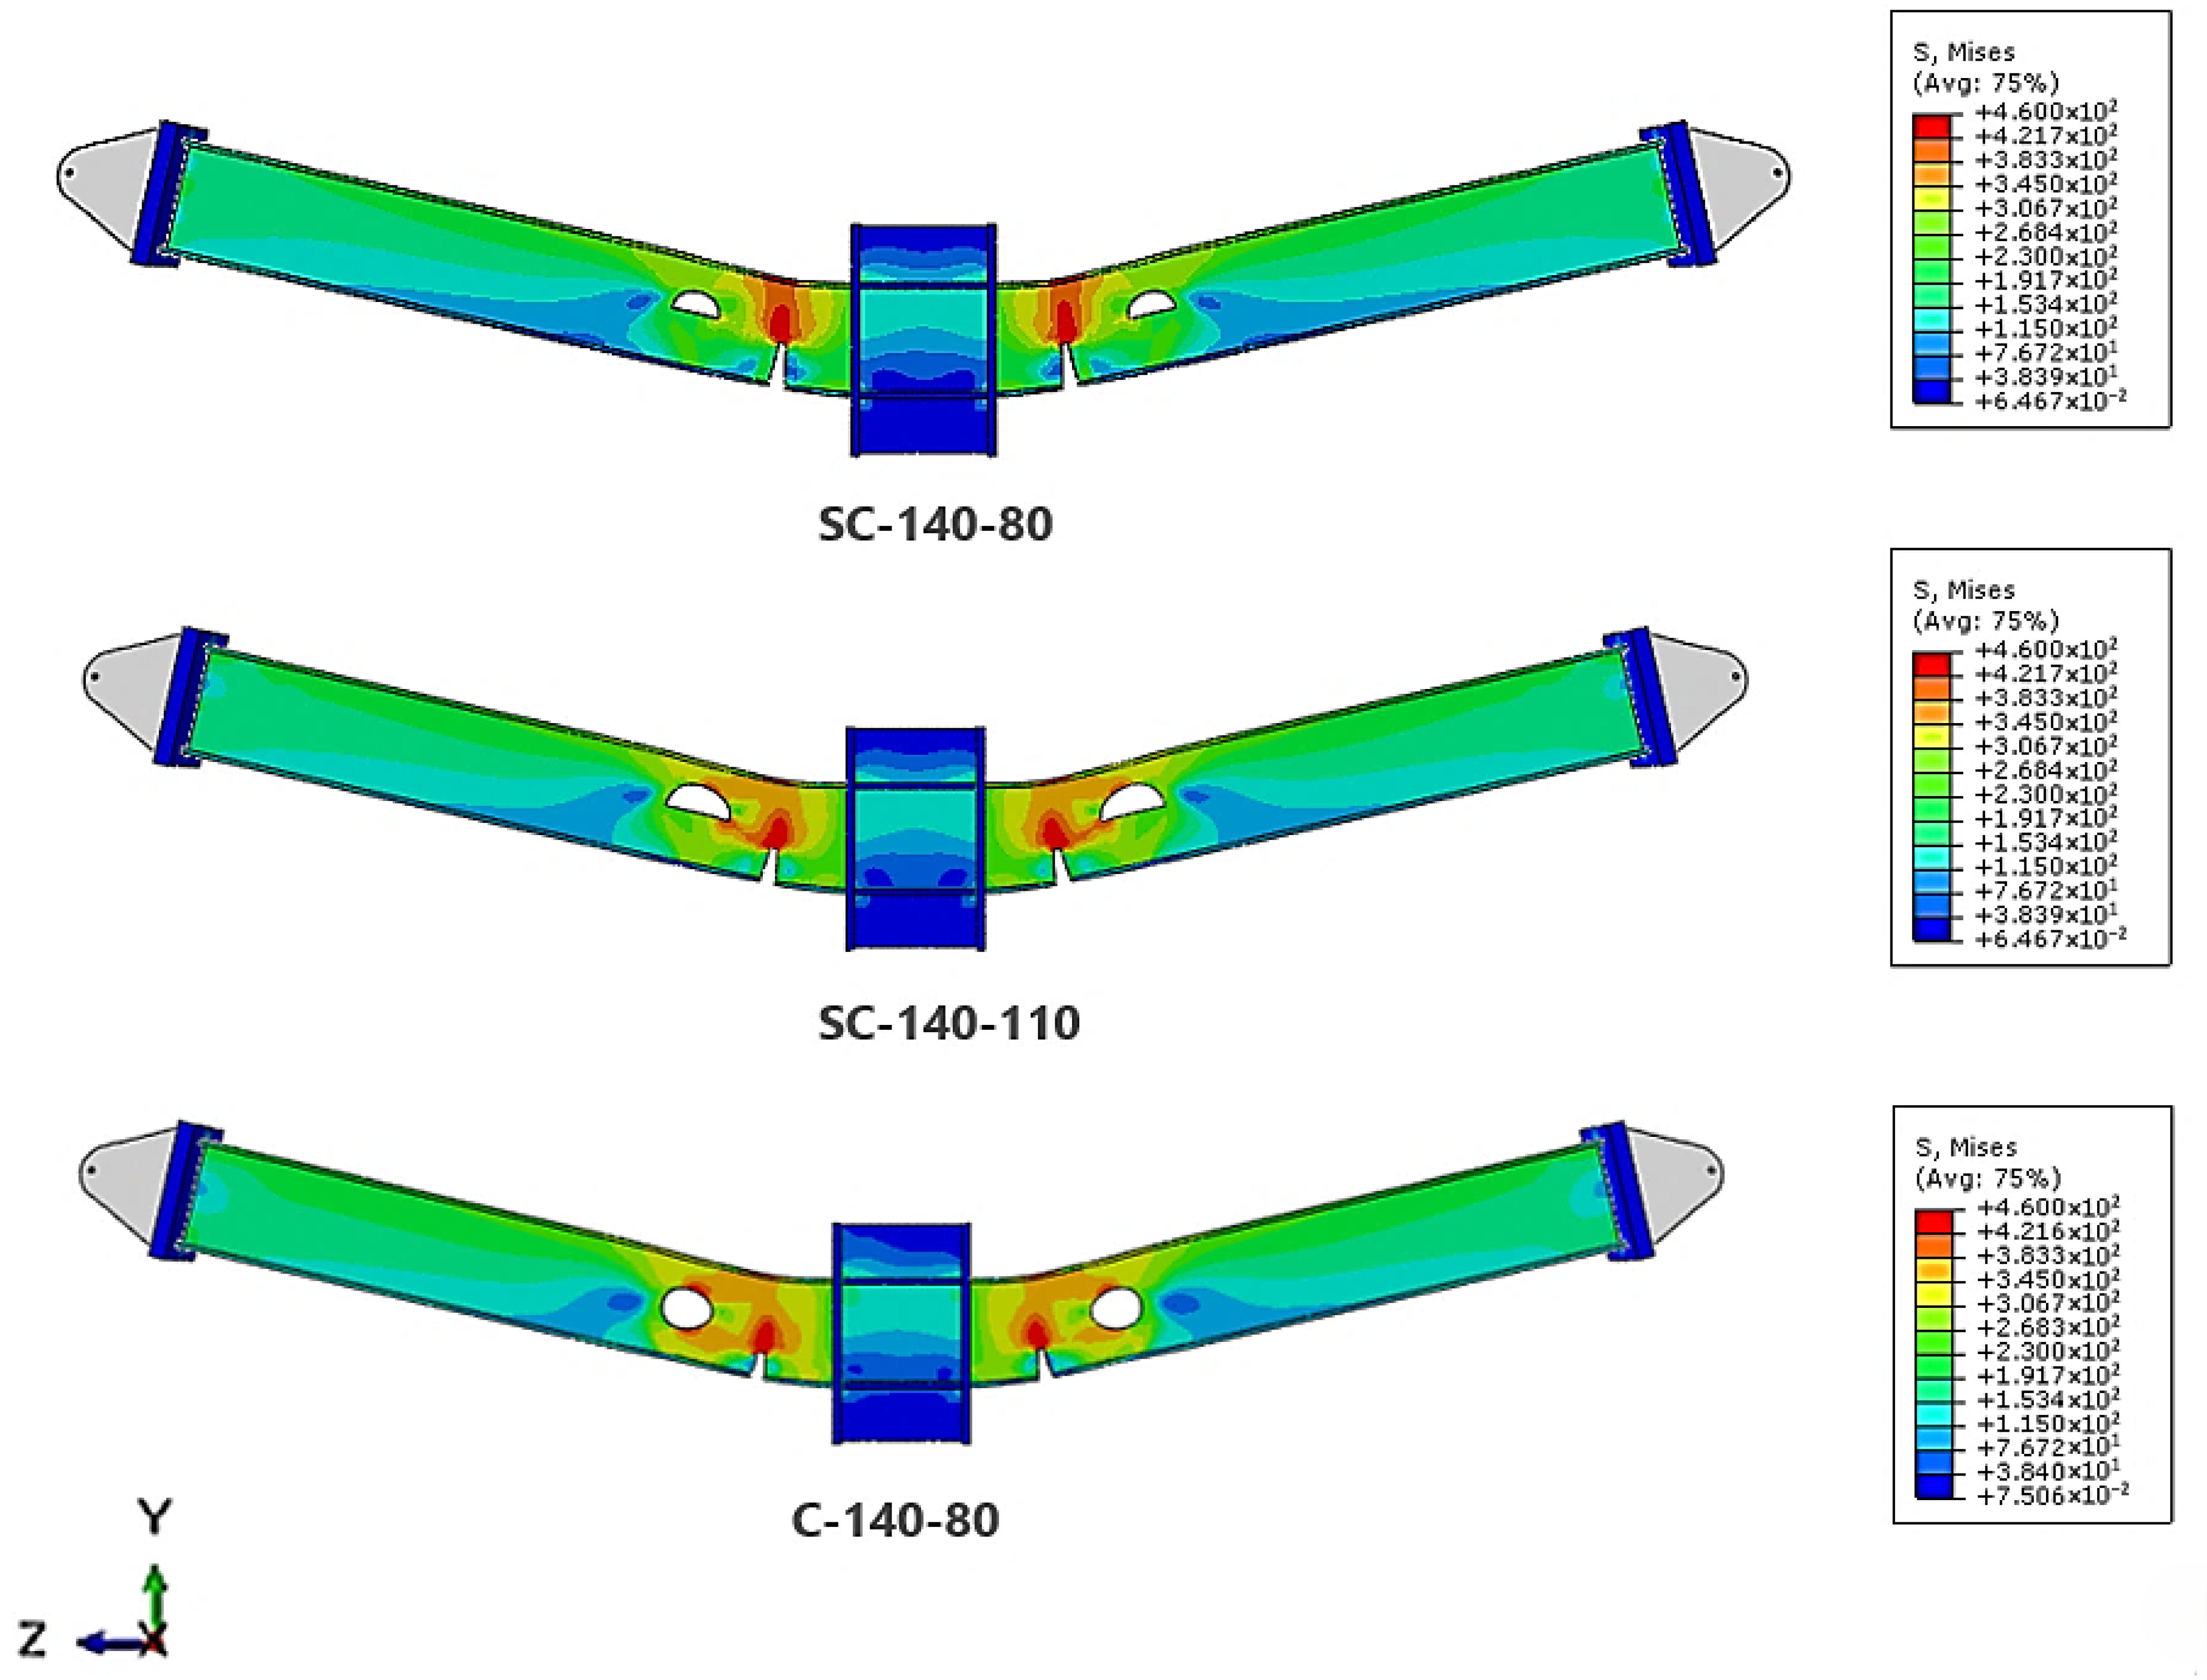
For specimens with spacing L = 140 mm, cracks always started near the reduced flange area, close to the failed and side columns. As the load increased, the cracks grew upward toward the top flange. However, in every test, the cracks did not spread into the web opening. This kept the web section intact. The same pattern appeared in the control specimen (Figure 23).
This shows that at L = 140 mm, the presence of a web opening—whether circular or semi-circular, no matter its size or orientation—did not change the fracture path. Once the distance between the reduced beam section (RBS) and the web opening becomes large enough, here 140 mm, the opening itself no longer affects how cracks start or spread. Failure remains concentrated in the reduced flange zone. This trend also agrees with previous work by Altheeb et al. [12].
The peak load capacities for specimens with 80 mm diameter openings at L = 140 mm were as follows:
  • C-140-80 → 221.37 kN;
  • SC2-140-80 → 225.67 kN;
  • SC-140-80 → 203.75 kN;
  • SC1-140-80 → 221.46 kN;
  • SC3-140-80 → 228.00 kN.
The control specimen without openings carried 219 kN. Compared with it, four configurations (C-140-80, SC2-140-80, SC1-140-80, SC3-140-80) showed small to moderate gains of 1.08%, 3.05%, 1.12%, and 4.11% (Figure 29). Only SC-140-80 was weaker, with a 6.96% drop in strength.
An important point appears in the post-cracking stage. In specimens with higher capacity, the load did not fall right after cracks formed. Instead, the system resisted a bit more before stiffness dropped quickly. This means that the combination of RBS with properly spaced web openings helped redistribute stresses in the beam. It also delayed sudden failure.
As displacement continued, cracks spread from the bottom edge of the reduced flange upward. The bottom flange ruptured (Figure 23). However, in cases like SC2-140-80 and SC3-140-80, the slower crack growth and retained strength suggest that semi-circular openings, when spaced well, can limit the negative effects usually linked with web reductions. A spacing of 140 mm seems to balance material reduction and structural safety, giving useful insights for collapse prevention strategies.
For 110 mm diameter openings at L = 140 mm, the peak loads were as follows:
  • C-140-110 → 227.6 kN;
  • SC2-140-110 → 240.24 kN;
  • SC-140-110 → 215.61 kN;
  • SC1-140-110 → 228.69 kN;
  • SC3-140-110 → 248.72 kN.
The control was 219 kN. Among these, SC3-140-110 reached the highest, with a 13.58% gain. SC2-140-110 and SC1-140-110 also improved strongly, by 9.71% and 4.42%. In contrast, the circular opening (C-140-110) showed only 3.93% improvement, while SC-140-110 dropped slightly by 1.54%. This means that circular openings, although reported earlier as effective [12], perform less well than semi-circular ones when the diameter increases.
During loading, semi-circular openings also showed an energy dissipation effect. Strain energy was absorbed and redistributed around the openings, as cracks and yielding developed gradually. A key finding is that enlarging the opening to 110 mm at L = 140 mm not only preserved but often improved capacity. This supports Altheeb et al. [12], who also found that larger openings, when placed far from the RBS zone, delay cracking and spread stresses better.
For specimens with 80 mm openings at L = 140 mm, the load–displacement curves looked almost the same as the control model WUF-W-RBS-50-130-23 (FE) (Figure 24). Only small stiffness losses appeared, while the ultimate loads were slightly higher.
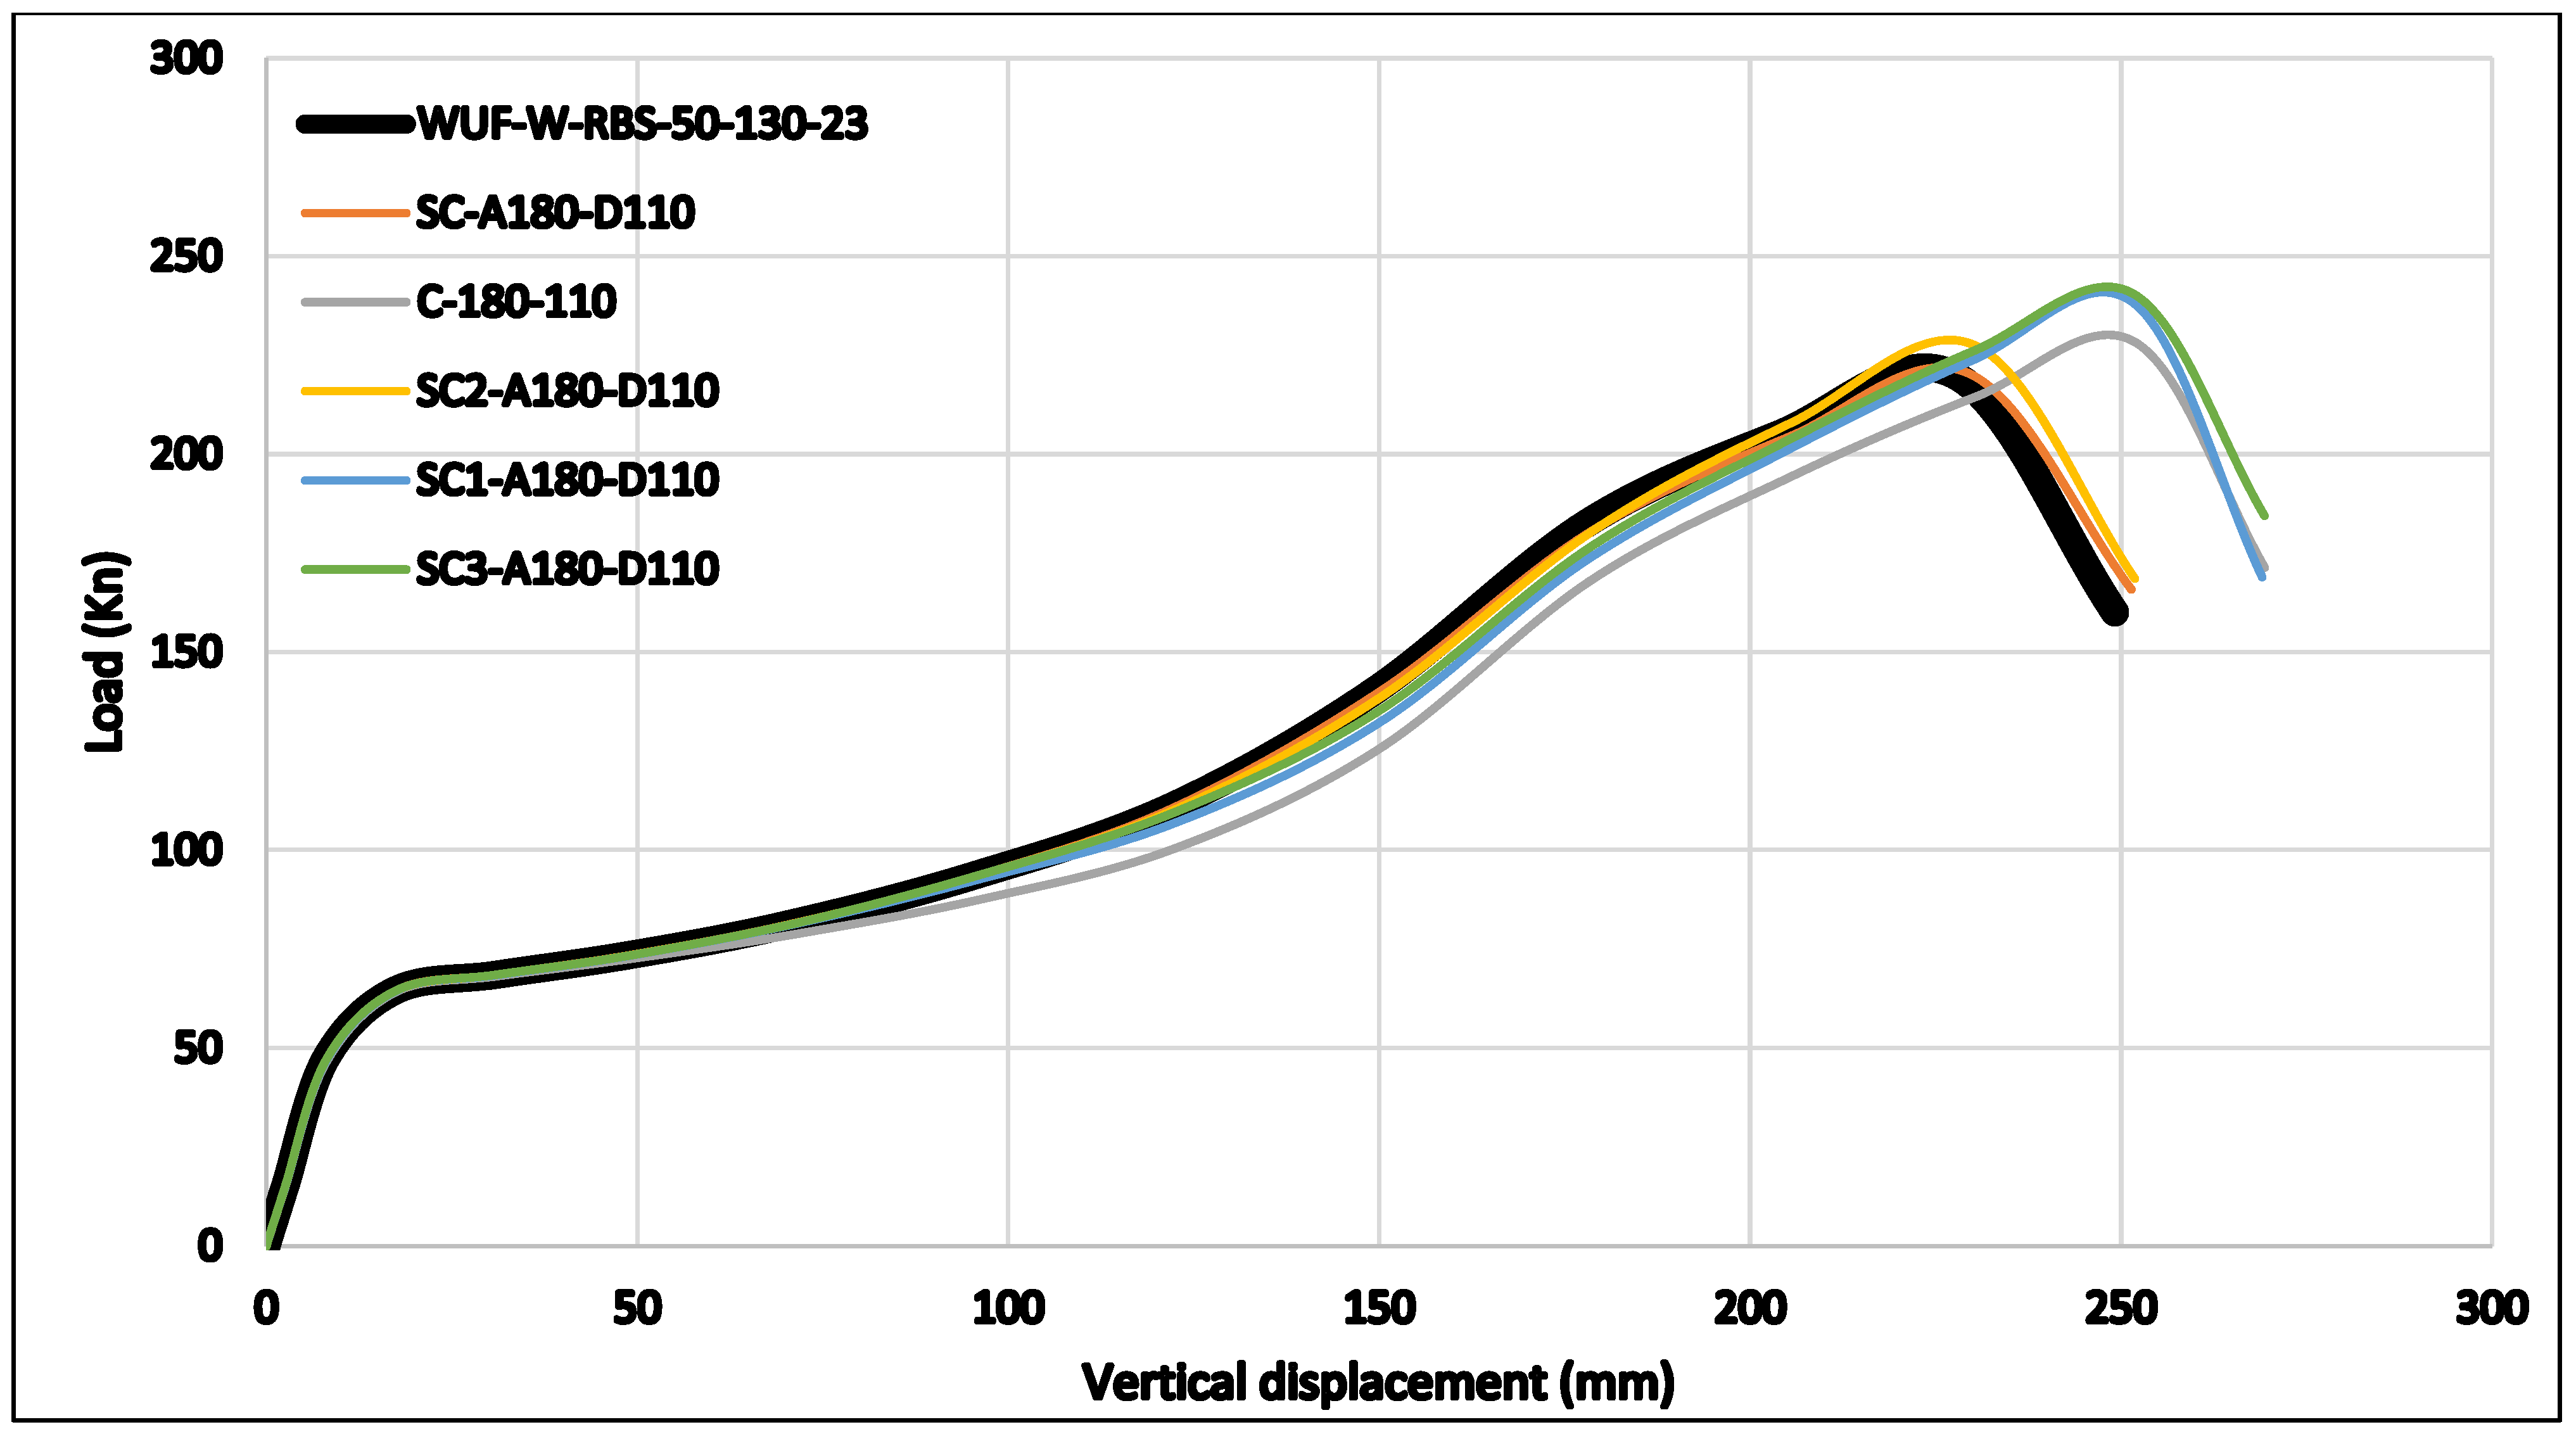
For specimens with 110 mm openings at L = 140 mm, the response was much stronger (Figure 25). Loads increased steadily to larger displacements, around 250–270 mm, before softening. Initial stiffness reductions were minor in both elastic and early plastic phases. The larger displacement range before peak load shows stronger catenary action. This helped the structure redistribute forces after plastic hinges formed.
These results show that larger openings at larger spacing improve ductility and ultimate strength. This agrees with Altheeb et al. [12]. Semi-circular openings, in particular, when placed carefully, perform better than circular ones. At small spacing (L = 0 mm and L = 65 mm), semi-circular shapes worked better than circular but still reduced stiffness compared with the control. Increasing spacing to 140 mm greatly improved performance, with SC3 and SC2 giving the best results in terms of load and delayed cracking. These findings provide an additional contribution to the provisions of FEMA-350 [15], which does not explicitly address the combined influence of reduced beam sections and web openings on progressive collapse resistance
Semi-circular openings positioned further from the RBS zone consistently outperformed circular ones, offering higher strength, better ductility, and delayed cracking.

3.5. L = 180 mm Position

Based on the earlier results, the study was extended to specimens with a larger spacing of L = 180 mm between the reduced beam section (RBS) and the web openings. Both circular and semi-circular shapes were examined.
The simulations showed the same failure pattern in all cases. Cracks started at the reduced section of the lower beam flange and then moved upward toward the top flange (Figure 26). This shows that increasing the spacing between the RBS and the web opening prevents the two weakened regions from interacting too early. As a result, stress concentration near the opening boundary was reduced. Another key point is that no cracks spread into the joint region. This means the structure had better integrity and a higher ability to redistribute loads at this larger spacing. In turn, this helps improve resistance against progressive collapse.
For specimens with an 80 mm opening diameter and spacing of L = 180 mm, the peak load capacities varied depending on the shape and orientation of the openings (Figure 29). The circular specimen C-180-80 carried the highest load, reaching 238.43 kN. The semi-circular specimens showed slightly lower but still strong capacities:
  • SC3-180-80 = 226.33 kN;
  • SC1-180-80 = 225.99 kN;
  • SC-180-80 = 221.18 kN;
  • SC2-180-80 = 223.28 kN.
These results suggest that when the spacing is large enough, the negative interaction seen at smaller spacings (L = 0 mm or L = 65 mm) becomes less critical. The members can then carry more load before failure. It is noted that at this spacing, the circular specimen (C-180-80) performed better than the semi-circular ones. This is the opposite of what happened at smaller spacings, where semi-circular shapes usually worked better. The reason is that more distance between the RBS and the opening reduces stress around the edge of the hole, allowing the beam to take higher loads before cracks form.
For specimens with a larger opening of 110 mm, the load capacities showed another clear trend. The circular specimen C-180-110 reached 228.21 kN, while the standard semi-circular SC-180-110 failed at 220.4 kN. Among the semi-circular cases, SC2-180-110 sustained 227.45 kN, while SC1-180-110 and SC3-180-110 performed the best, with 238.31 kN and 240.48 kN, respectively. These findings highlight that at larger spacings, semi-circular openings, especially SC1 and SC3, can outperform both circular openings and other semi-circular positions. This indicates that with sufficient distance between the reduced section and the opening, stress redistribution around the opening becomes more effective. This allows the structure to carry higher vertical loads before cracking and failure.
Referring to the load–vertical displacement curves, only small differences in stiffness were found among the specimens with 80 mm openings at L = 180 mm (Figure 25). All of them behaved very similarly to the reference specimen in terms of initial stiffness and overall load–displacement response. Most reached their peak load at around 230 mm mid-span displacement. The exception was C-180-80, which reached a higher peak load at nearly 250 mm displacement. This confirms that larger spacing between RBS and RW gives the structure more deformation capacity before cracks start.
Another observation is that increasing the opening size from 80 mm to 110 mm improved the strength in several configurations (Figure 28). Among them, the semi-circular SC3 arrangement consistently gave the best performance, showing the highest load values at both L = 140 mm and L = 180 mm.

3.6. Contribution of Catenary Action (CTA)

Many studies [12,16,18,19,24] have highlighted the important role of catenary action (CTA) in resisting progressive collapse. CTA acts as a key internal mechanism that comes into play when beams undergo large deformations. Once the flexural resistance of a beam is used up, CTA provides an extra safeguard against complete failure.
In the early stages of loading, beams mainly resist through bending. But as the deformation increases, the behavior shifts. The beam begins to work in axial tension rather than bending. This change allows vertical loads to be carried through membrane action, not just bending stiffness. Such a mechanism becomes crucial if a major load-carrying member, like an internal column, suddenly fails.
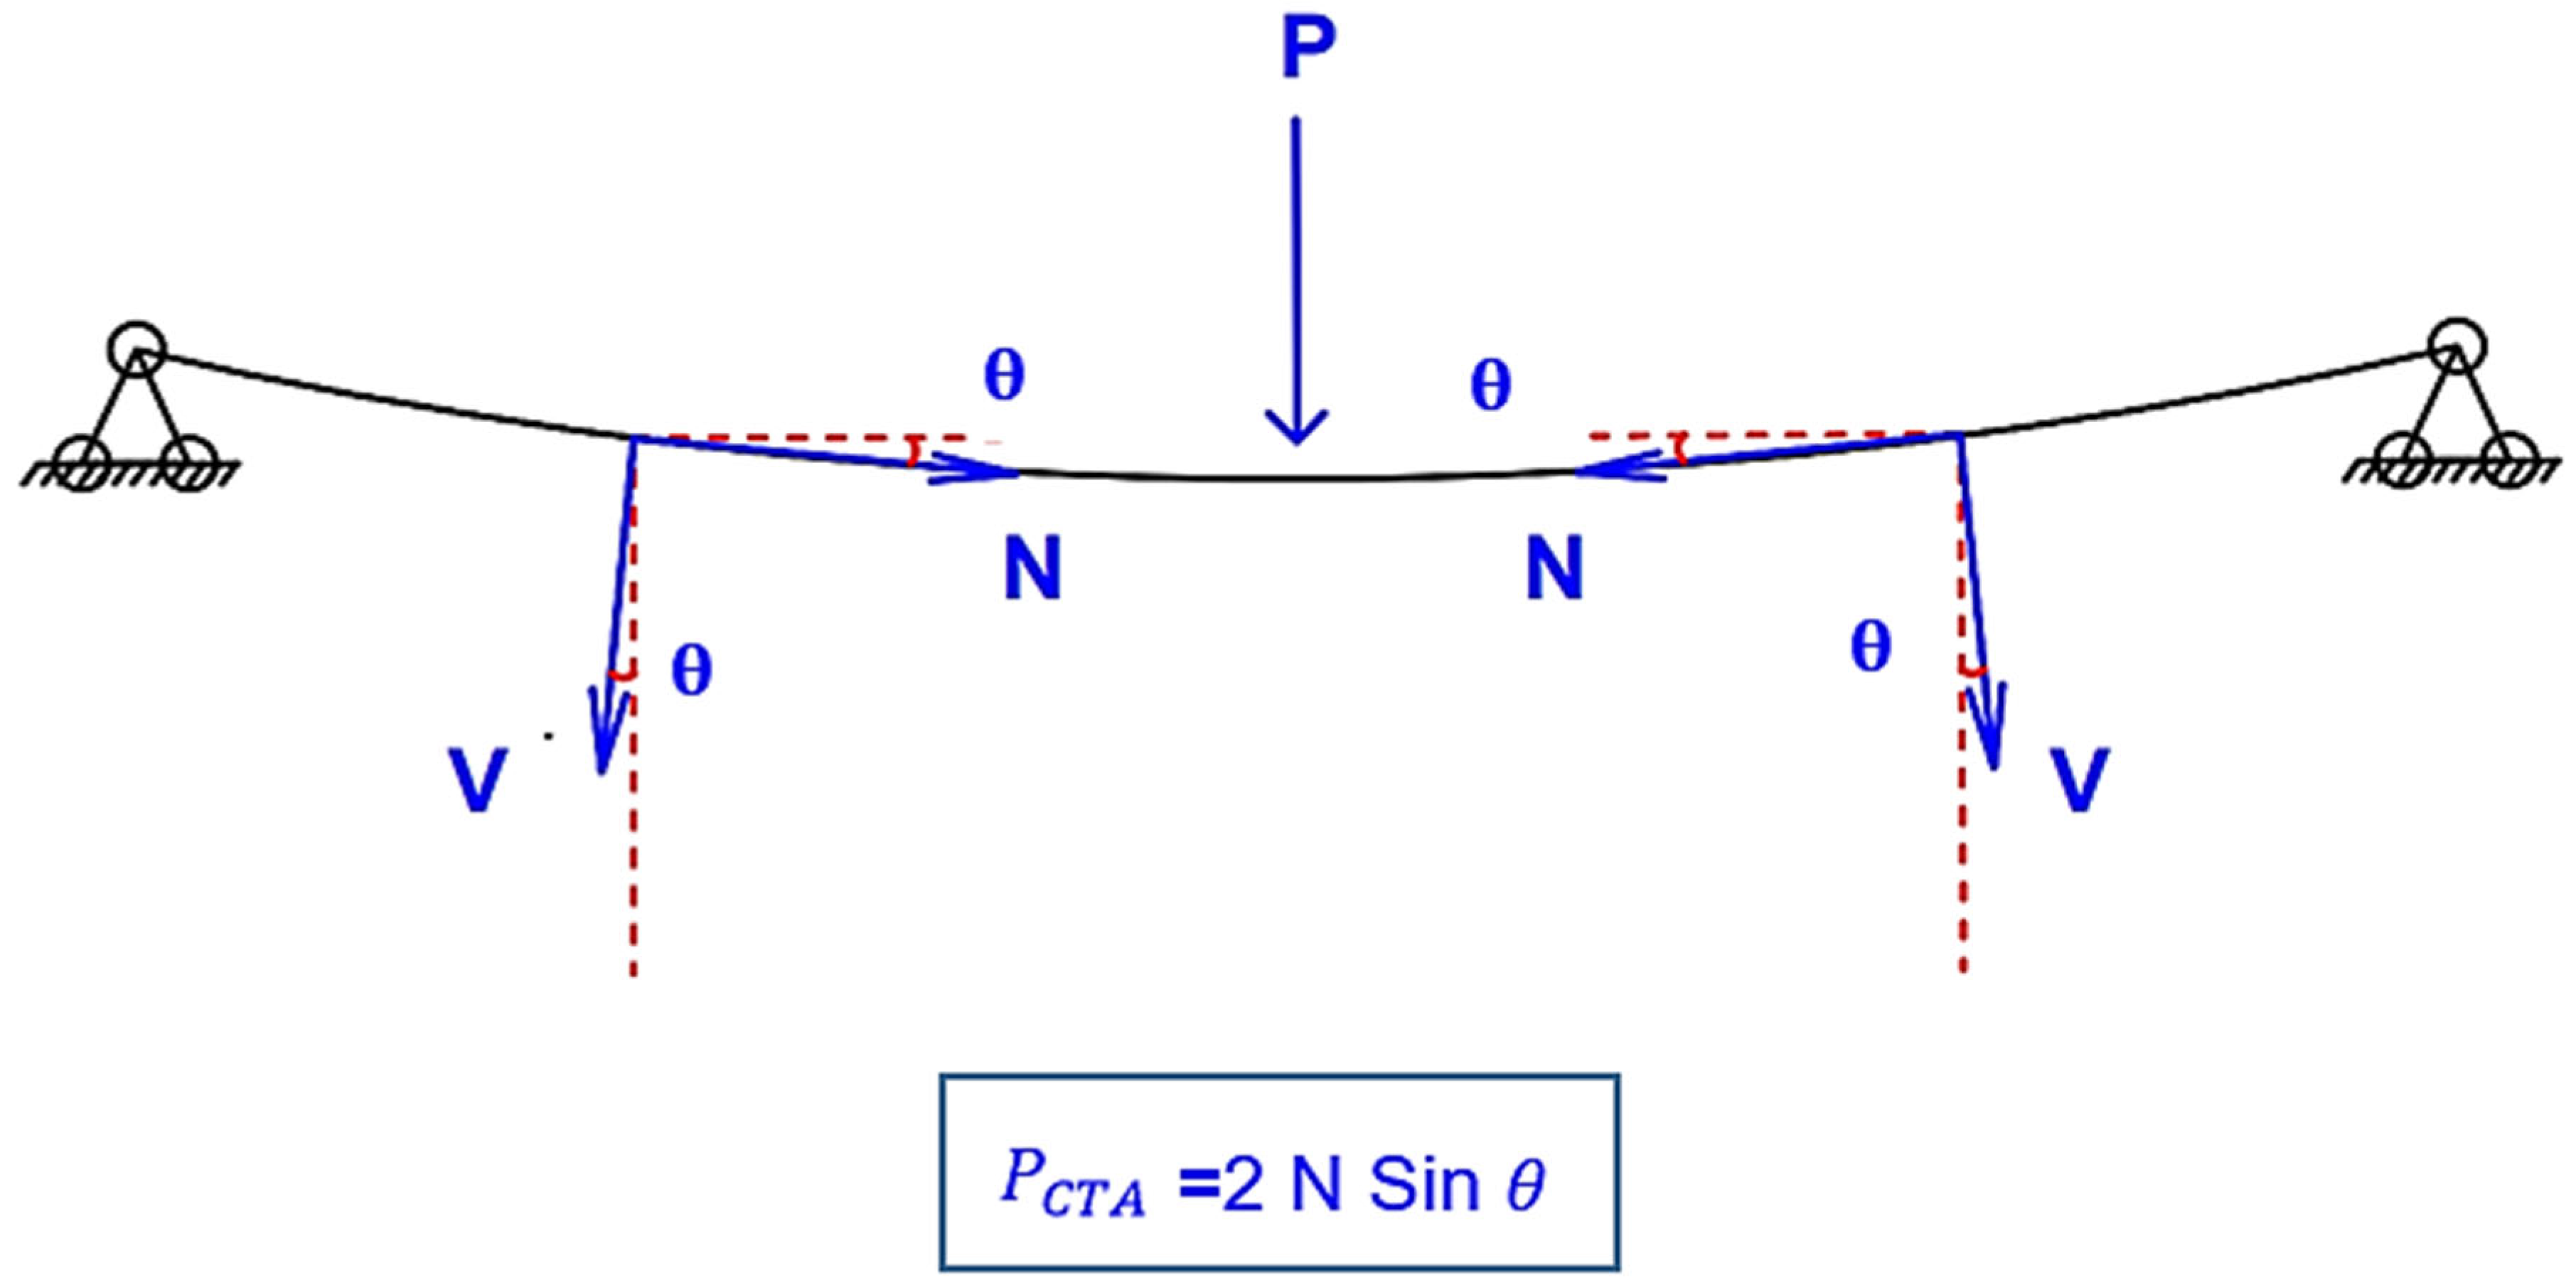
If the beam-to-column connections are strong enough to transfer axial forces, CTA helps redistribute the loads once carried by the failed column. In this way, catenary action works as the last line of defense. It prevents a disproportionate collapse by “bridging” the gap created by the failed support and helps keep the whole structure stable under extreme conditions (see Figure 30).
In this study, we look at how using semi-circular web reductions together with reduced beam section (RBS) detailing affects the development of CTA. The aim is to understand how this combination influences the overall resistance of a structure to progressive collapse.
Table 2 shows the crack initiation loads (Pcrack), displacements (∆), and catenary load capacities (PCTA). From these results, both the shape and location of web openings (circular or semi-circular) strongly affect how CTA contributes to collapse resistance. When the catenary load crosses a certain value, the positive effect of CTA on structural stability becomes clear.
However, when web openings are too close to the flange-reduced regions (at L = 0 mm and L = 65 mm), the ability of CTA to develop is reduced. This leads to lower collapse resistance compared with beams without openings. The main reason is that fractures form earlier in the web area under the openings. These cracks spread either vertically or diagonally, reducing the beam’s capacity to develop enough tensile forces for load redistribution.
On the other hand, specimens with larger distances between the openings and the reduced beam sections (L = 140 mm and L = 180 mm) showed much better CTA development, as seen in Table 2. In these cases, the extra length allowed tensile forces to redistribute more evenly after cracks started to appear. As a result, the beams carried higher loads and delayed failure compared with the shorter spacing cases.
The larger spacing also reduced stress concentrations around the openings. This allowed the beams to deform more while still sustaining high tensile forces. Because of this, specimens with L = 140 mm and L = 180 mm showed superior resistance to progressive collapse. These findings confirm that providing enough spacing plays a major role in mobilizing CTA. Similar results were also reported by Altheeb et al. [12].
Another key outcome of this work is the clear advantage of semi-circular web openings over circular ones. Across all configurations, semi-circular openings consistently developed stronger CTA. The best performance was seen in specimen SC3-140-110, with L = 140 mm and a 110 mm diameter. This specimen reached the highest catenary load, PCTA = 227.62 kN, which gave it the greatest resistance to progressive collapse and the highest ultimate load capacity among all tested cases.
Both the shape and the position of web openings affect the strength of steel frames under extreme loading. Semi-circular openings located farther from the RBS centerline reduce stress concentration and improve both the load capacity and ductility of beam-to-column connections. On the other hand, openings placed too close to the RBS region increase stress concentration, which can weaken the structure during extreme events.
4. Conclusions

This study presented a detailed numerical investigation on how steel frames with reduced beam sections (RBS) behave when combined with circular and semi-circular web openings of different shapes, sizes, and positions. The main findings are as follows:
i.
The finite element model, validated with reliable experimental results, was able to reproduce the peak load, load–displacement response, and failure modes of steel frames with RBS accurately.
ii.
The position of the web openings in relation to the RBS zone had a strong effect on progressive collapse resistance. Openings placed very close to the reduced section (L = 0 mm and L = 65 mm) led to early crack initiation and limited catenary action. On the other hand, openings placed further away (L = 140 mm and L = 180 mm) allowed better redistribution of forces and improved collapse resistance.
iii.
The shape and size of the web openings also influenced performance. Larger diameters near the RBS zone reduced stiffness and peak load. However, when openings were placed further away, larger holes helped in better energy dissipation and stronger catenary action.
iv.
Semi-circular openings performed better than circular ones in most cases. In particular, the SC2 and SC3 configurations showed higher peak loads, greater ductility, and stronger catenary contributions.
v.
Among the tested cases, SC3-140-110 achieved the highest catenary capacity; however, the choice of opening shape and position should be considered as part of broader design trade-offs, since closer openings reduce strength but save space and material, while larger spacing enhances ductility and load capacity at the cost of longer member dimensions
vi.
Using flange reduction along with properly designed semi-circular web openings shifted the failure away from the critical beam–column joint. This protected the joint region and improved the overall robustness of the structure under column loss.
vii.
These results provide an additional contribution to FEMA-350 [15], since the code addresses reduced beam sections and web openings separately, but does not offer guidance on their combined influence on progressive collapse resistance
viii.
From a design point of view, the results highlight the importance of carefully selecting the shape, size, and location of web openings. Semi-circular openings placed at larger distances from the RBS center appear to be an effective solution for improving the progressive collapse resistance of steel moment-resisting frames.
This study shows that using reduced beam sections along with web openings can reduce local stiffness. However, if semi-circular openings are placed carefully with enough spacing, they can maintain and even improve the structure’s resistance to progressive collapse. The results provide useful guidance for the design of steel frames incorporating reduced beam sections and web openings, especially in applications where progressive collapse resistance and ductility are key considerations. Such detailing strategies may assist engineers in balancing strength, deformation capacity, and material efficiency in seismic or fire design scenarios. Nevertheless, the study is limited to a specific beam–column configuration, a restricted range of opening geometries, and relies primarily on numerical modelling validated by previously published experiments. Broader experimental testing and further numerical investigations are recommended to extend the applicability of the present findings. Future research should also integrate statistical parameterization or machine-learning techniques to derive predictive functions and broaden the applicability of the results for design practice.

Author Contributions

Conceptualization, M.B. and H.G.; methodology, M.B.; software, M.B.; validation, M.B., H.G. and S.M.A.; formal analysis, M.B.; investigation, M.B. and Y.H.; resources, N.G. and A.C.H.; data curation, Y.H. and N.G.; writing—original draft preparation, M.B.; writing—review and editing, S.M.A. and M.S.; visualization, Y.H. and A.C.H.; supervision, H.G. and M.S.; project administration, M.B.; funding acquisition, H.G. All authors have read and agreed to the published version of the manuscript.

Funding

This research received no external funding.

Data Availability Statement

The original contributions presented in this study are included in the article. Further inquiries can be directed to the corresponding author.

Conflicts of Interest

The authors declare no conflicts of interest.

Abbreviations

The following abbreviations are used in this manuscript:
ABAQUSAdvanced Body Analysis using Quadrilateral Unification System (commercial FE software)
CTACatenary Action
FEFinite Element
FEMFinite Element Method
GBSGross Beam Section
GSAGeneral Services Administration
RBSReduced Beam Section
RWSReduced Web Section
SC, SC1, SC2, SC3Semi-Circular web opening configurations
C-XX-YYCircular web opening configuration (XX = spacing, YY = diameter)
SC-XX-YYSemi-circular web opening configuration (XX = spacing, YY = diameter)
PcrackCrack initiation load
PCTALoad capacity under catenary action
Displacement

References

  1. Saeedi, K.; Tehrani, P.; Behnam, B. Investigating post-earthquake progressive collapse resistance of irregular steel structures. Structures 2024, 67, 107010. [Google Scholar] [CrossRef]
  2. Pearson, C.; Delatte, N. Ronan Point apartment tower collapse and its effect on building codes. J. Perform. Constr. Facil. 2005, 19, 172–177. [Google Scholar] [CrossRef]
  3. Hayes, J.R.; Woodson, S.C.; Pekelnicky, R.G.; Poland, C.D.; Corley, W.G.; Sozen, M. Can strengthening for earthquake improve blast and progressive collapse resistance? J. Struct. Eng. 2005, 131, 1157–1177. [Google Scholar] [CrossRef]
  4. Bažant, Z.P.; Zhou, Y. Why did the World Trade Center collapse?—Simple analysis. J. Eng. Mech. 2002, 128, 2–6. [Google Scholar]
  5. Amumpeire, S.; Demir, A. Progressive collapse and the Turkish earthquake code 2018: A review for precast industrial buildings. In Proceedings of the 4th International Civil Engineering & Architecture Conference, Trabzon, Türkiye, 17–19 May 2025; Civil Engineering. Golden Light Publishing: Trabzon, Türkiye, 2025; Volume 1. [Google Scholar]
  6. Ngekpe, B.E.; Fabulous, O. Progressive collapse of multistorey frame structures—A critical review. Glob. Sci. J. 2025, 13, 303–321. [Google Scholar]
  7. Arkhipova, E.; Ovchinnikov, I. Analysis of bridge structure failures due to progressive collapse. Russ. J. Transp. Eng. 2024, 11, 06SATS424. [Google Scholar] [CrossRef]
  8. Kim, J.; Park, J. Design of steel moment frames considering progressive collapse. Steel Compos. Struct. 2008, 8, 85–98. [Google Scholar] [CrossRef]
  9. Ashoub, M.M.N.M.; Attia, W.A.L. Effect of alternative load path design method on preventing progressive collapse and reducing the rehabilitation cost using FEMA-P58. J. Eng. Appl. Sci. 2023, 70, 84. [Google Scholar] [CrossRef]
  10. Pantidis, P.; Gerasimidis, S. Progressive collapse of 3D steel composite buildings under interior gravity column loss. J. Constr. Steel Res. 2018, 150, 60–75. [Google Scholar] [CrossRef]
  11. Ferraioli, M. A modal pushdown procedure for progressive collapse analysis of steel frame structures. J. Constr. Steel Res. 2019, 156, 227–241. [Google Scholar] [CrossRef]
  12. Altheeb, A.; Alshaikh, I.M.H.; Abadel, A.A.; Nehdi, M.L.; Abu Bakar, B.H. Investigation of 3D steel frames with a reduced beam section and various web-opening shapes under internal column loss. J. Asian Archit. Build. Eng. 2025, 1–24. [Google Scholar] [CrossRef]
  13. Stylianidis, P.; Bellos, J. Survey on the role of beam-column connections in the progressive collapse resistance of steel frame buildings. Buildings 2023, 13, 1696. [Google Scholar] [CrossRef]
  14. Faridmehr, I.; Hajmohammadian Baghban, M. An overview of progressive collapse behavior of steel beam-to-column connections. Appl. Sci. 2020, 10, 6003. [Google Scholar] [CrossRef]
  15. SAC Joint Venture; Guidelines Development Committee. Recommended Seismic Design Criteria for New Steel Moment-Frame Buildings; Federal Emergency Management Agency: Washington, DC, USA, 2000; Volume 350. [Google Scholar]
  16. Qian, K.; Lan, X.; Li, Z.; Li, Y.; Fu, F. Progressive collapse resistance of two-storey seismic configured steel sub-frames using welded connections. J. Constr. Steel Res. 2020, 170, 106117. [Google Scholar] [CrossRef]
  17. Boushehri, K.; Tsavdaridis, K.D.; Cai, G. Seismic behaviour of RWS moment connections to deep columns with European sections. J. Constr. Steel Res. 2019, 161, 416–435. [Google Scholar] [CrossRef]
  18. Chen, C.; Qiao, H.; Wang, J.; Chen, Y. Progressive collapse behavior of joints in steel moment frames involving reduced beam section. Eng. Struct. 2020, 225, 111297. [Google Scholar] [CrossRef]
  19. Qiao, H.; Chen, Y.; Wang, J.; Chen, C. Experimental study on beam-to-column connections with reduced beam section against progressive collapse. J. Constr. Steel Res. 2020, 175, 106358. [Google Scholar] [CrossRef]
  20. Alrubaidi, M.; Elsanadedy, H.; Abbas, H.; Almusallam, T.; Al-Salloum, Y. Investigation of different steel intermediate moment frame connections under column-loss scenario. Thin-Walled Struct. 2020, 154, 106875. [Google Scholar] [CrossRef]
  21. Dassault Systèmes. Abaqus/CAE User’s Guide; Dassault Systèmes: Vélizy-Villacoublay, France, 2016. [Google Scholar]
  22. Benzerara, M.; Guedaoura, H.; Anas, S.; Yolchiyev, M.; Daminova, B. Advanced strengthening of steel structures: Investigating GFRP reinforcement for floor beams with trapezoidal web openings. In Proceedings of the 5th International Conference on Energetics, Civil and Agricultural Engineering (ICECAE 2024), Samarkand, Uzbekistan, 13–14 May 2024; EDP Sciences: Les Ulis, France, 2024; Volume 497, p. 02013. [Google Scholar]
  23. Kouider, N.; Hadidane, Y.; Benzerara, M. Numerical investigation of the cold-formed I-beams bending strength with different web shapes. Fract. Struct. Integr. 2022, 16, 153–171. [Google Scholar] [CrossRef]
  24. Slimani, F.; Benzerara, M.; Saidani, M. Experimental and numerical investigation of gap K-joints of rectangular hollow section trusses. Fract. Struct. Integr. 2022, 16, 107–125. [Google Scholar] [CrossRef]
  25. Hadidane, Y.; Kouider, N.; Benzerara, M. Flexural behavior of delta and bi-delta cold-formed steel beams: Experimental investigation and numerical analysis. Fract. Struct. Integr. 2022, 16, 69–88. [Google Scholar] [CrossRef]
  26. Harrat, O.; Gouider, N.; Anas, S.M.; Benzerara, M.; Hadidane, Y.; Saidani, M. Optimizing thin-walled structures: Analysis of cold-formed steel columns with concrete infills, web stiffeners, and CFRP strengthening. J. Eng. 2024, 2024, 4851075. [Google Scholar]
Figure 1. Mesh sensitivity analysis showing element size effects on the steel specimen.
Buildings 15 03443 g001
Figure 2. Comparison of mesh sensitivity results for a steel specimen under different element sizes.
Buildings 15 03443 g002
Figure 3. Influence of mesh refinement on crack propagation in steel specimen.
Buildings 15 03443 g003
Figure 4. Experimental test carried out by previous researcher and reported in the literature.
Buildings 15 03443 g004
Figure 5. Boundary conditions adopted in the numerical simulation of specimen WUF-W-RBS-50-130-23, as experimentally tested and reported in the literature.
Buildings 15 03443 g005
Figure 6. Experimental test reported in the literature.
Buildings 15 03443 g006
Figure 7. Boundary conditions adopted in the numerical simulation of specimen WUF-FW, as experimentally tested and reported in the literature.
Buildings 15 03443 g007
Figure 8. Geometric details and dimensions of the simplified B–J–B prototype employed in the experimental program reported in the current literature.
Buildings 15 03443 g008
Figure 9. Geometric details and dimensions of specimen WUF-FW, reported in the literature.
Buildings 15 03443 g009
Figure 10. Comparison of vertical load–displacement responses from experimental testing (reported in the literature) and FE simulation for specimen WUF-W-RBS-50-130-23.
Buildings 15 03443 g010
Figure 11. Comparison of vertical load–displacement responses from experimental testing (reported in the literature) and FE simulation for specimen WUF-FW.
Buildings 15 03443 g011
Figure 12. Experimental (reported in the literature) and finite element representations of the failure mode for specimen WUF-W-RBS-50-130-23.
Buildings 15 03443 g012
Figure 13. Comparison of experimental (reported in the literature) and FE-predicted failure modes for specimen WUF-FW.
Buildings 15 03443 g013
Figure 14. Placement of circular and semi-circular openings at varying offsets from the centroid of the RBS zone.
Buildings 15 03443 g014
Figure 15. Arrangement of semi-circular openings in different orientations.
Buildings 15 03443 g015
Figure 16. Flowchart of the research framework, showing the assumptions, steps in finite element modeling, studied RBS configurations with web openings, and key findings on collapse resistance.
Buildings 15 03443 g016
Figure 17. Failure patterns of tested specimens for opening position L = 0 mm.
Buildings 15 03443 g017
Figure 18. Vertical load–displacement curves of specimens with openings of 80 mm diameter at L = 0 mm compared to the reference model WUF-W-RBS-50-130-23 (FE).
Buildings 15 03443 g018
Figure 19. Vertical load–displacement curves of specimens with openings of 110 mm diameter at L = 0 mm compared to the reference model WUF-W-RBS-50-130-23 (FE).
Buildings 15 03443 g019
Figure 20. Failure patterns of tested specimens for opening position L = 65 mm.
Buildings 15 03443 g020
Figure 21. Vertical load–displacement curves of specimens with openings of 80 mm diameter at L = 65 mm compared to the reference model WUF-W-RBS-50-130-23 (FE).
Buildings 15 03443 g021
Figure 22. Vertical load–displacement curves of specimens with openings of 100 mm diameter at L = 65 mm compared to the reference model WUF-W-RBS-50-130-23 (FE).
Buildings 15 03443 g022
Figure 23. Failure patterns of tested specimens for opening position L = 140 mm.
Buildings 15 03443 g023
Figure 24. Vertical load–displacement curves of specimens with openings of 80 mm diameter at L = 140 mm compared to the reference model WUF-W-RBS-50-130-23 (FE).
Buildings 15 03443 g024
Figure 25. Vertical load–displacement curves of specimens with openings of 110 mm diameter at L = 140 mm compared to the reference model WUF-W-RBS-50-130-23 (FE).
Buildings 15 03443 g025
Figure 26. Failure patterns of tested specimens for opening position L = 180 mm.
Buildings 15 03443 g026
Figure 27. Vertical load–displacement curves of specimens with openings of 80 mm diameter at L = 180 mm compared to the reference model WUF-W-RBS-50-130-23 (FE).
Buildings 15 03443 g027
Figure 28. Vertical load–displacement curves of specimens with openings of 110 mm diameter at L = 180 mm compared to the reference model WUF-W-RBS-50-130-23 (FE).
Buildings 15 03443 g028
Figure 29. Peak load values of tested specimens relative to the reference specimen.
Buildings 15 03443 g029
Figure 30. Simplified free-body diagram illustrating the computation of catenary forces.
Buildings 15 03443 g030
Table 1. Material properties of different steel elements adapted from literature.
Experimental TestComponents Yield   Strength   f y   N / m m 2 Tensile   Strength   f u   N / m m 2 Elongation δ (%)
Set ABeam web29546024
Beam flange28546322
Column web30850019
Column flange27652527
Shear plate31448520
Set BBeam web36247119
Beam flange33247123
Column web30446220
Column flange29546622
Shear plate28335623
End plate28043118
Bolt class 10.9957107110.3
Table 2. Catenary forces across all tested specimens.
SpecimenPcrack (kN)PCTA (kN)
WUF-W-RBS-50-130-23(FE)205.00203.87176.46
C-0-80132.69177.72118.10
SC-0-80178.93204.37158.28
SC1-0-80132.17178.24116.22
SC2-0-80149.15178.09131.38
SC3-0-80134178.24125.00
C-0-110111.13177.5298.80
SC3-0-11094.92150.1474.73
SC-0-110160.17204.18148.24
SC1-0-11095.42178.3589.88
SC2-0-110131.88177.41119.77
C-65-80174.32203.86151.35
SC3-65-80179.43204.47167.36
SC-65-80194.37205.07166.08
SC2-65-80185.8204.6157.83
SC1-65-80175203.86156.32
C-65-110151.28204.06135.21
SC2-65-110173.94204.32157.26
SC-65-110185.75204.72158.77
SC3-65-110166.25203.19142.55
SC1-65-110150.75205.04135.430
C-140-80221.37230.68186.98
SC2-140-80225.67230.29197.67
SC-140-80203.75229.38193.23
SC1-140-80221.46230.38188.34
SC3-140-80228229.92198.51
C-140-110227.6252.01209.55
SC2-140-110240.24251.88212.51
SC-140-110215.61230.18187.59
SC1-140-110228.69252.11194.97
SC3-140-110248.72268.82227.62
C-180-80238.43252.04210.48
SC3-180-80226.33229.65195.70
SC1-180-80225.99230.15185.92
SC-180-80221.18228.73196.44
SC2-180-80223.28229.96198.68
C-180-110228.21251.92192.84
SC-180-110220.4229.47192.81
SC2-180-110227.45230.31194.00
SC1-180-110238.31251.57202.78
SC3-180-110240.48251.67206.43
Disclaimer/Publisher’s Note: The statements, opinions and data contained in all publications are solely those of the individual author(s) and contributor(s) and not of MDPI and/or the editor(s). MDPI and/or the editor(s) disclaim responsibility for any injury to people or property resulting from any ideas, methods, instructions or products referred to in the content.