2.1. Constitutive Relationship
Based on the general finite element analysis software ABAQUS 2022, this study established a numerical calculation model for UHPC-SRC short columns, providing a simulation foundation for analyzing the axial compressive performance of such short columns. In ABAQUS, the concrete damaged plasticity (CDP) constitutive model was adopted. This model was originally proposed by Lubliner [
22] and later improved and promoted by scholars such as Lee [
23]. The CDP model can comprehensively consider the plastic deformation of concrete and the stiffness degradation caused by damage. It can also accurately describe the variation in stiffness during the unloading process [
24], thereby providing a reasonable reflection of the actual mechanical behavior of concrete. Due to the distinct ductility and post-peak hardening behavior of UHPC after tensile cracking, which differs from that of conventional concrete, it is theoretically necessary to determine all parameters of the CDP model through dedicated experimental back-calculation. However, the focus of this study is on analyzing the overall structural performance of the members, rather than on a comprehensive calibration of UHPC’s constitutive parameters. To facilitate comparison with existing research findings, the geometric parameters of the CDP model were retained as the ABAQUS default values, while the stress–strain relationship was modified based on UHPC’s elastic modulus, compressive strength, and tensile strength. This approach not only ensures computational efficiency and comparability of results but also effectively reflects the overall mechanical behavior of UHPC.
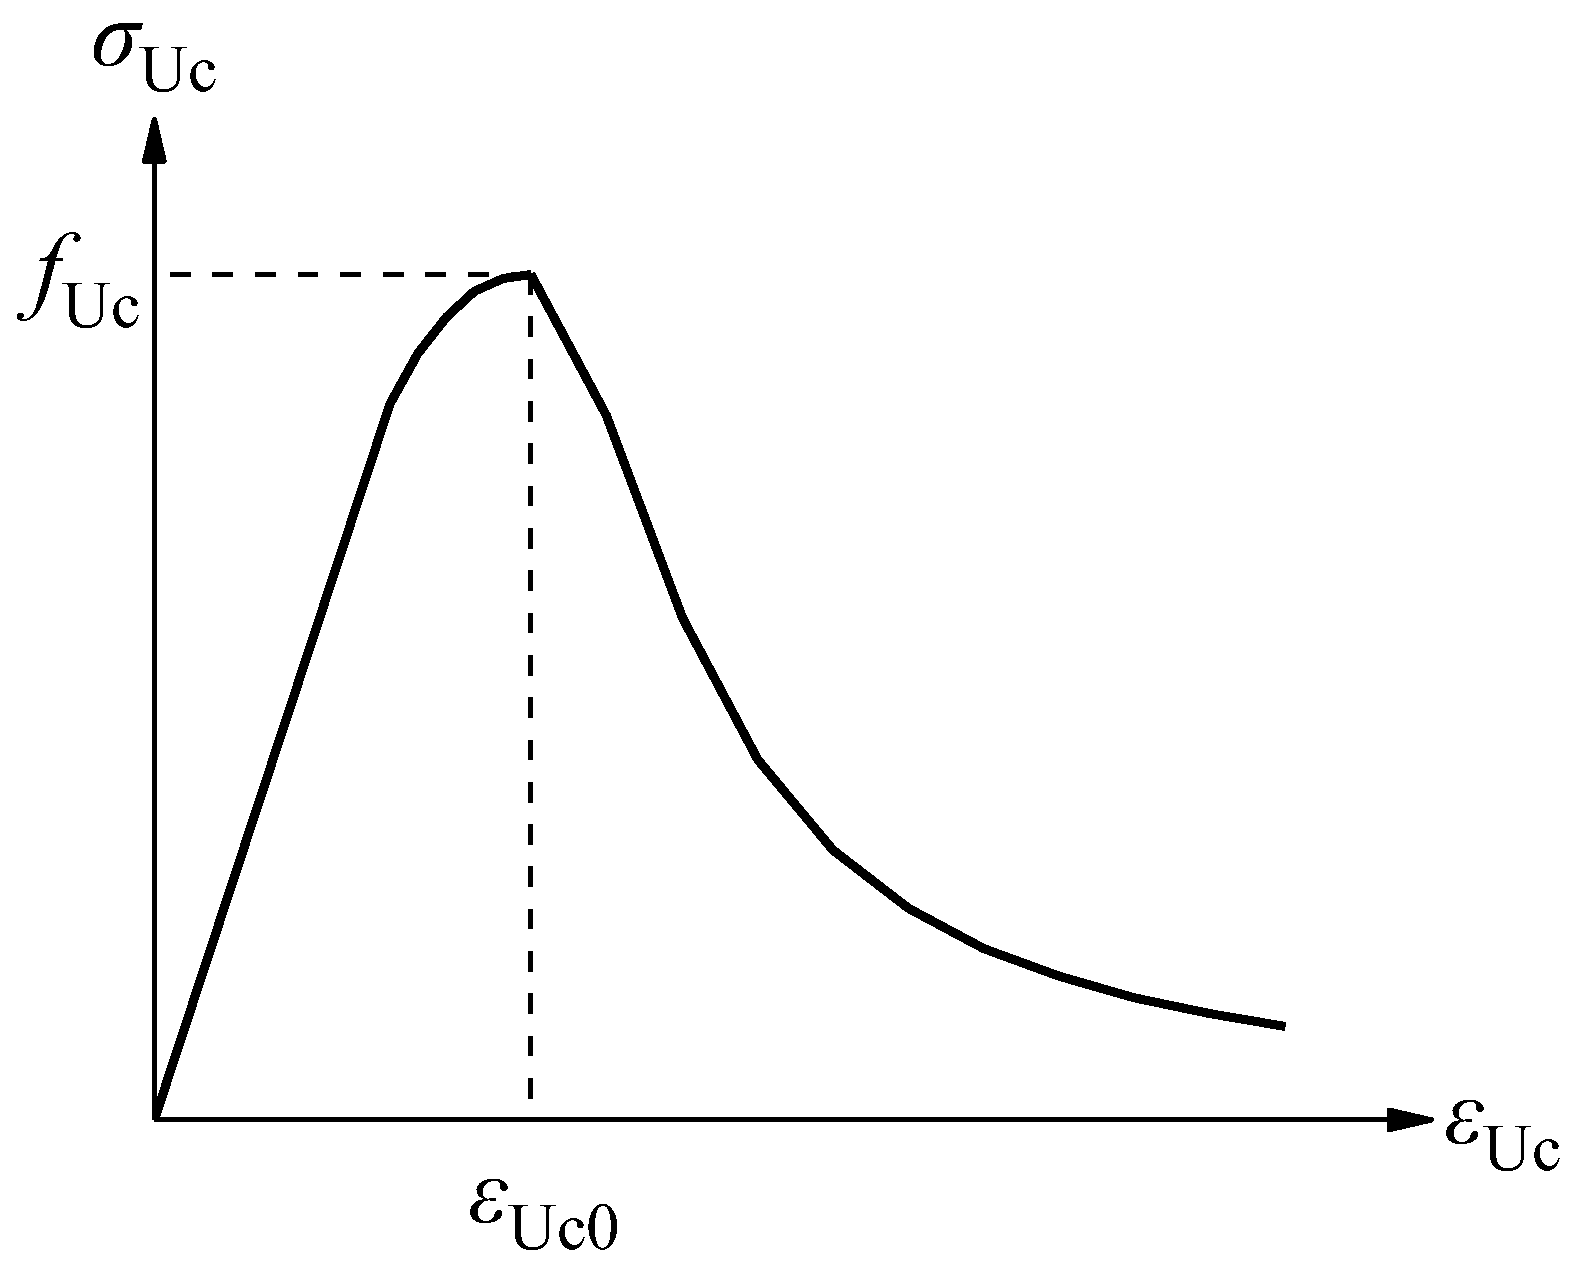
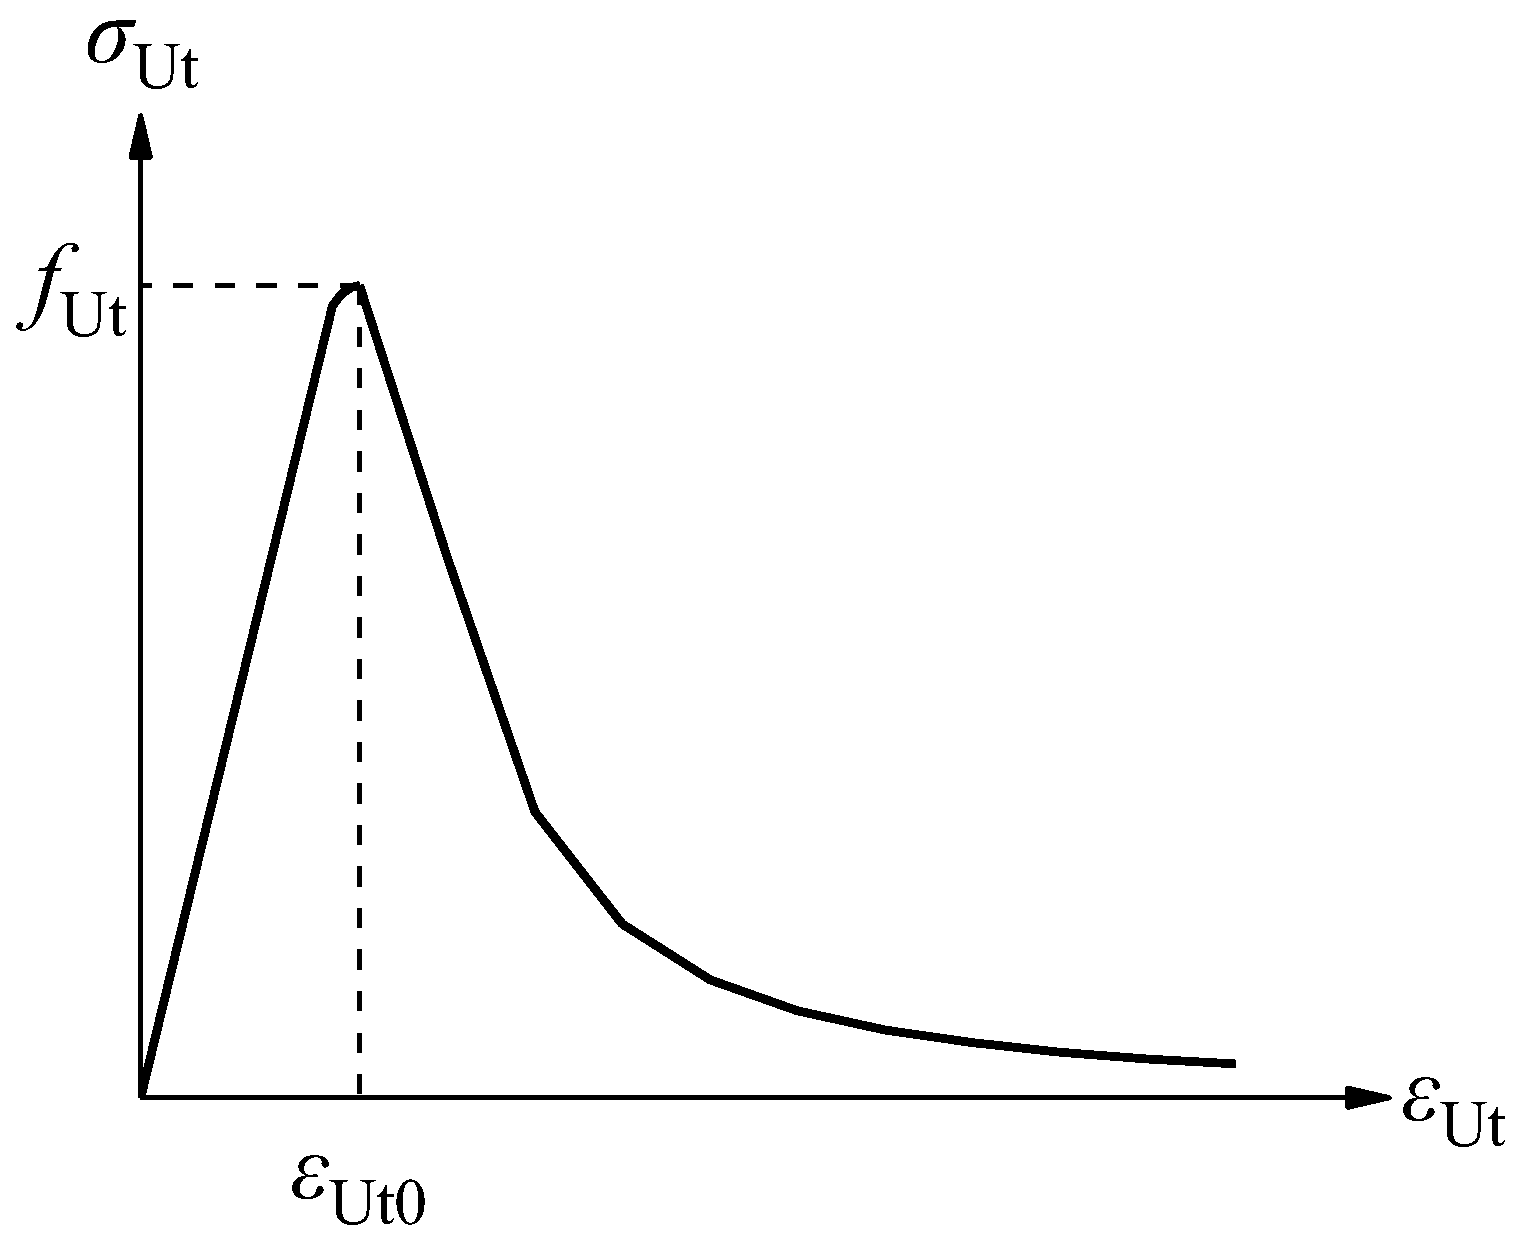
For UHPC materials, this study adopts the constitutive model proposed by Zheng [
25]. Based on experimental studies of reactive powder concrete (RPC) and extensive experimental data fitting, this model establishes complete stress–strain relationships under uniaxial compression and tension, as shown in Equations (1) and (2). The model is applicable to UHPC grades of C100 and above containing steel fibers, and it can reflect the tensile performance of the material, whereby steel fibers are still able to bear tensile forces after cracking. The curves are shown in
Figure 3 and
Figure 4.
In the equations,
σUc and
σUt denote the compressive and tensile stresses of the UHPC prism, respectively;
fUc and
fUt represent the compressive and tensile strengths of the UHPC prism, respectively;
εUc and
εUt are the compressive and tensile strains of the UHPC prism, respectively; and
εUc0 and
εUt0 correspond to the peak compressive and peak tensile strains of the UHPC prism, respectively. In this study, the values of the main mechanical parameters for the UHPC constitutive model are based on the relevant conversion formulas proposed by Lü et al. [
26]. Specifically, the calculation methods for the compressive strength and tensile strength of the UHPC prism are given in Equations (3) and (4), respectively. The determination of peak compressive strain and peak tensile strain corresponds to Equations (5) and (6). It should be noted that
fUcu in the equations represents the compressive strength of a UHPC cubic specimen with a side length of 100 mm.
The constitutive relationship of normal concrete (NC) adopts the segmented model proposed by Guo [
27], which is suitable for NC of grades C20 to C40 and is used to describe its mechanical behavior. This model has been verified by a large number of experiments and can accurately reflect the stress characteristics of NC under different loads. Its mathematical expressions are shown in Equations (7) and (8). In the formula,
σc and
σt represent the compressive stress and tensile stress of the NC prism, respectively;
fc and
ft are the compressive strength and tensile strength of the NC prism, respectively;
εc and
εt are the compressive strain and tensile strain of the NC prism, respectively;
ε0 and
εt0 denote the peak compressive strain and peak tensile strain of the NC prism, respectively;
α and
β are the coefficients for the ascending and descending branches of the uniaxial compressive stress–strain curve, respectively;
γ is the coefficient for the descending branch of the uniaxial tensile stress–strain curve.
This study adopts the model proposed by Yu et al. [
28] to define the damage parameters for UHPC and NC. The damage effect only needs to be considered when the stress endured by the concrete reaches its tensile or compressive strength limit; prior to this, no cracks have formed within the material. Under uniaxial loading conditions, the damage index
dc(t) of the concrete in tension and compression directions can be calculated using Equation (9).
For the reinforcement, this study assumes that it follows the ideal elastic-plastic constitutive model. Before reaching the yield point, the reinforcement exhibits linear elastic deformation. Once the yield strength
fy is attained, it enters the plastic stage, after which the stress remains at the yield strength while plastic strain continues to increase, displaying typical plastic behavior. The corresponding stress–strain relationship is given in Equation (10). In the formula,
σs denotes the stress in the reinforcement;
Es is the elastic modulus of the reinforcement;
εs represents the strain in the reinforcement;
fy and
fy′ are both the yield strengths of the reinforcement;
εy and
εy′ are both the yield strains of the reinforcement. The relevant parameters of the CDP model in this paper are shown in
Table 1.
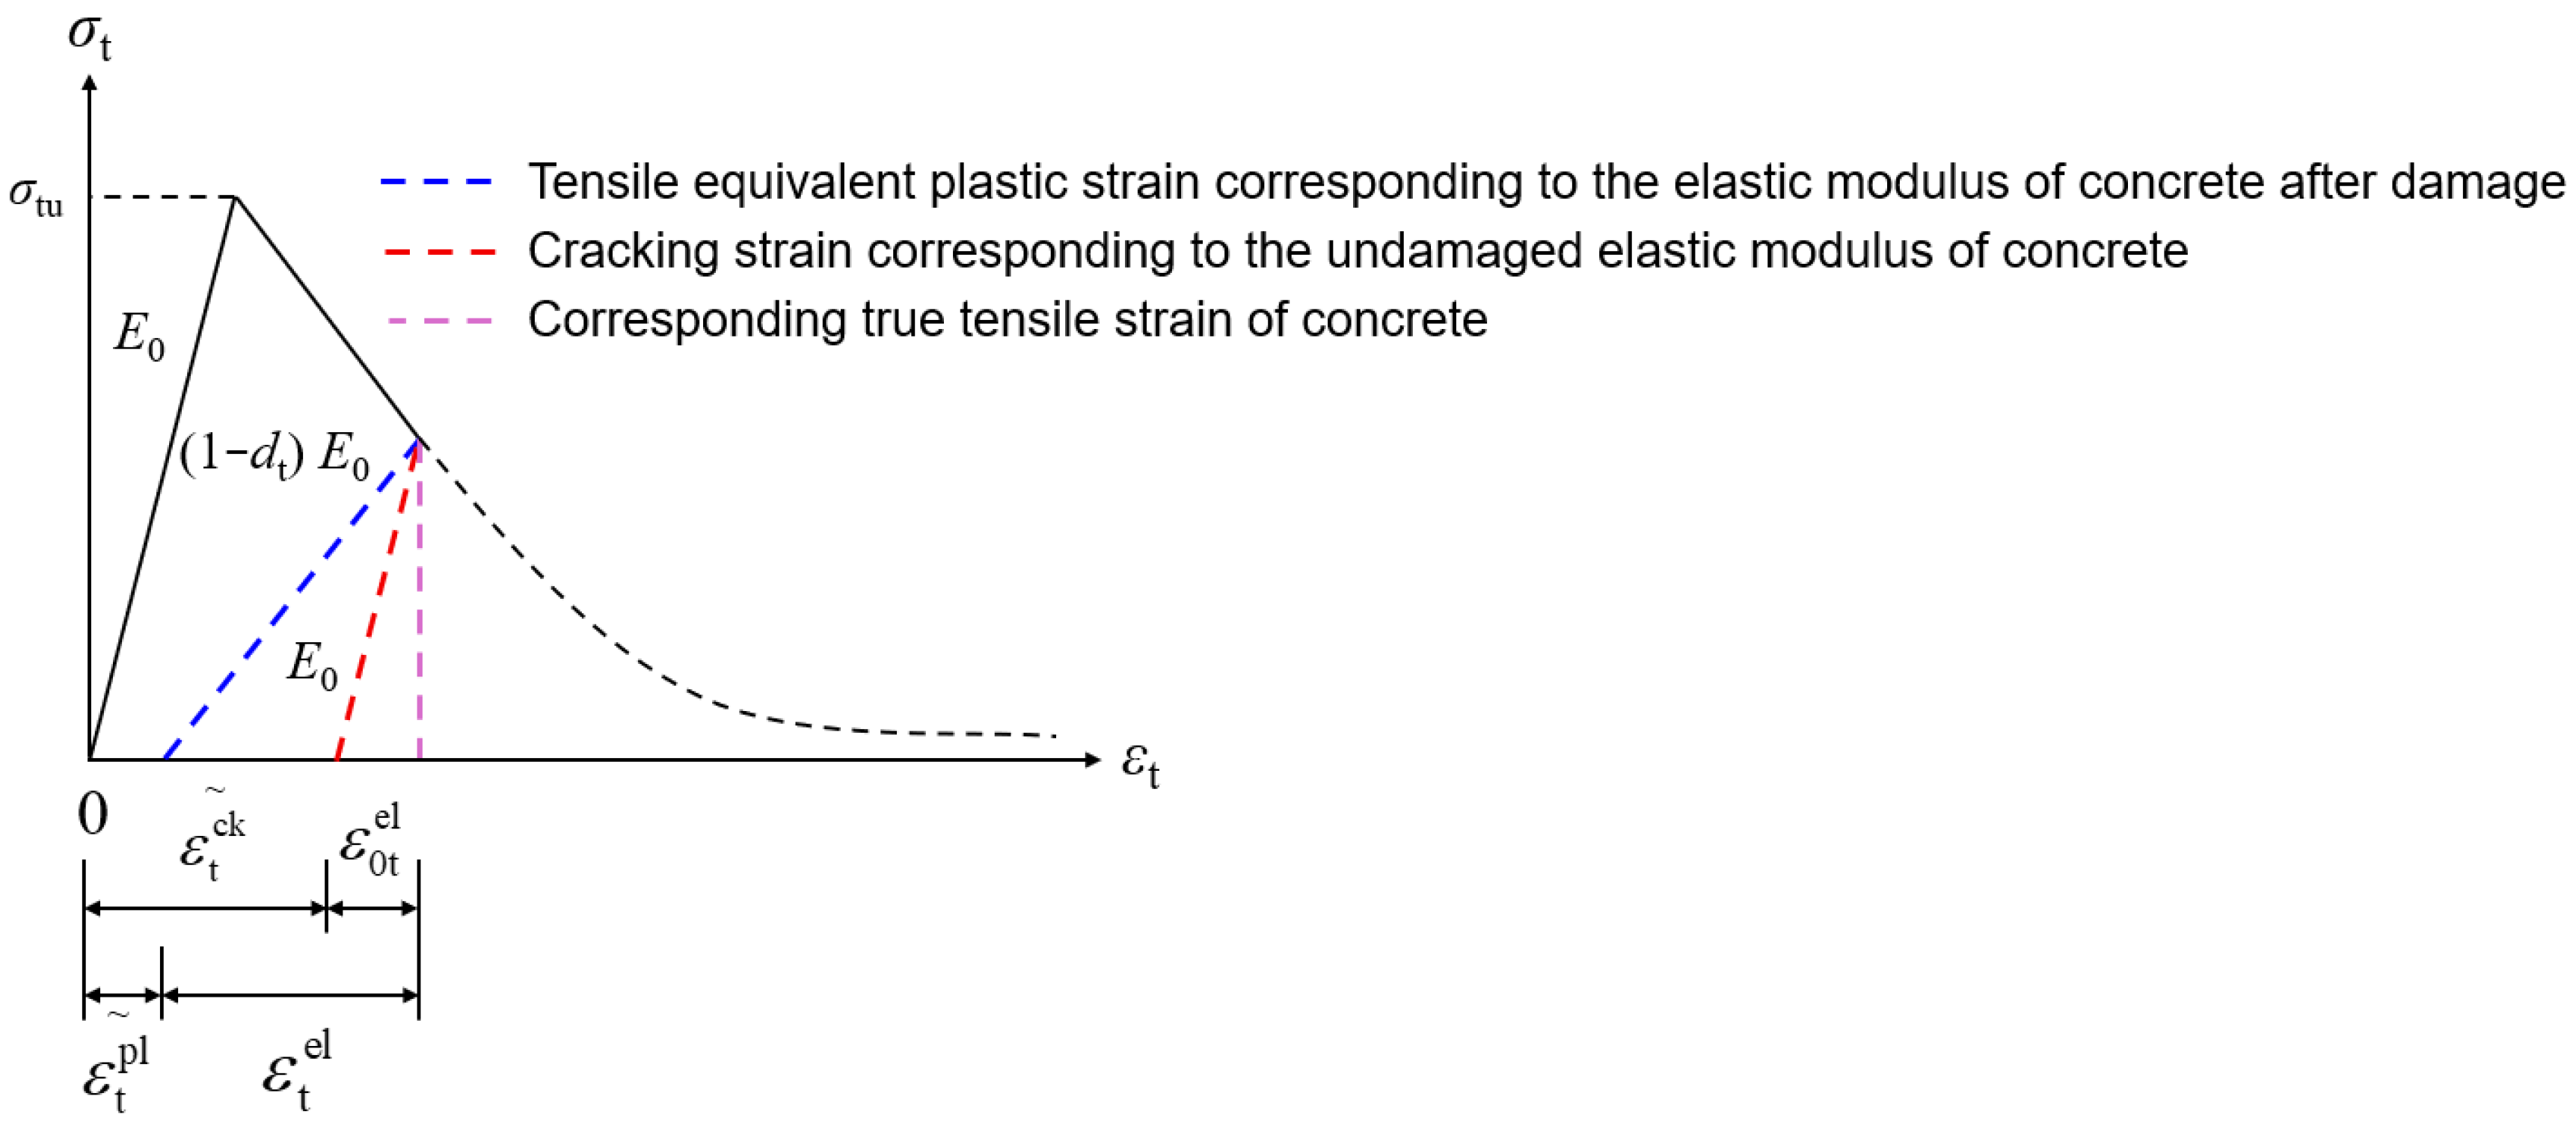
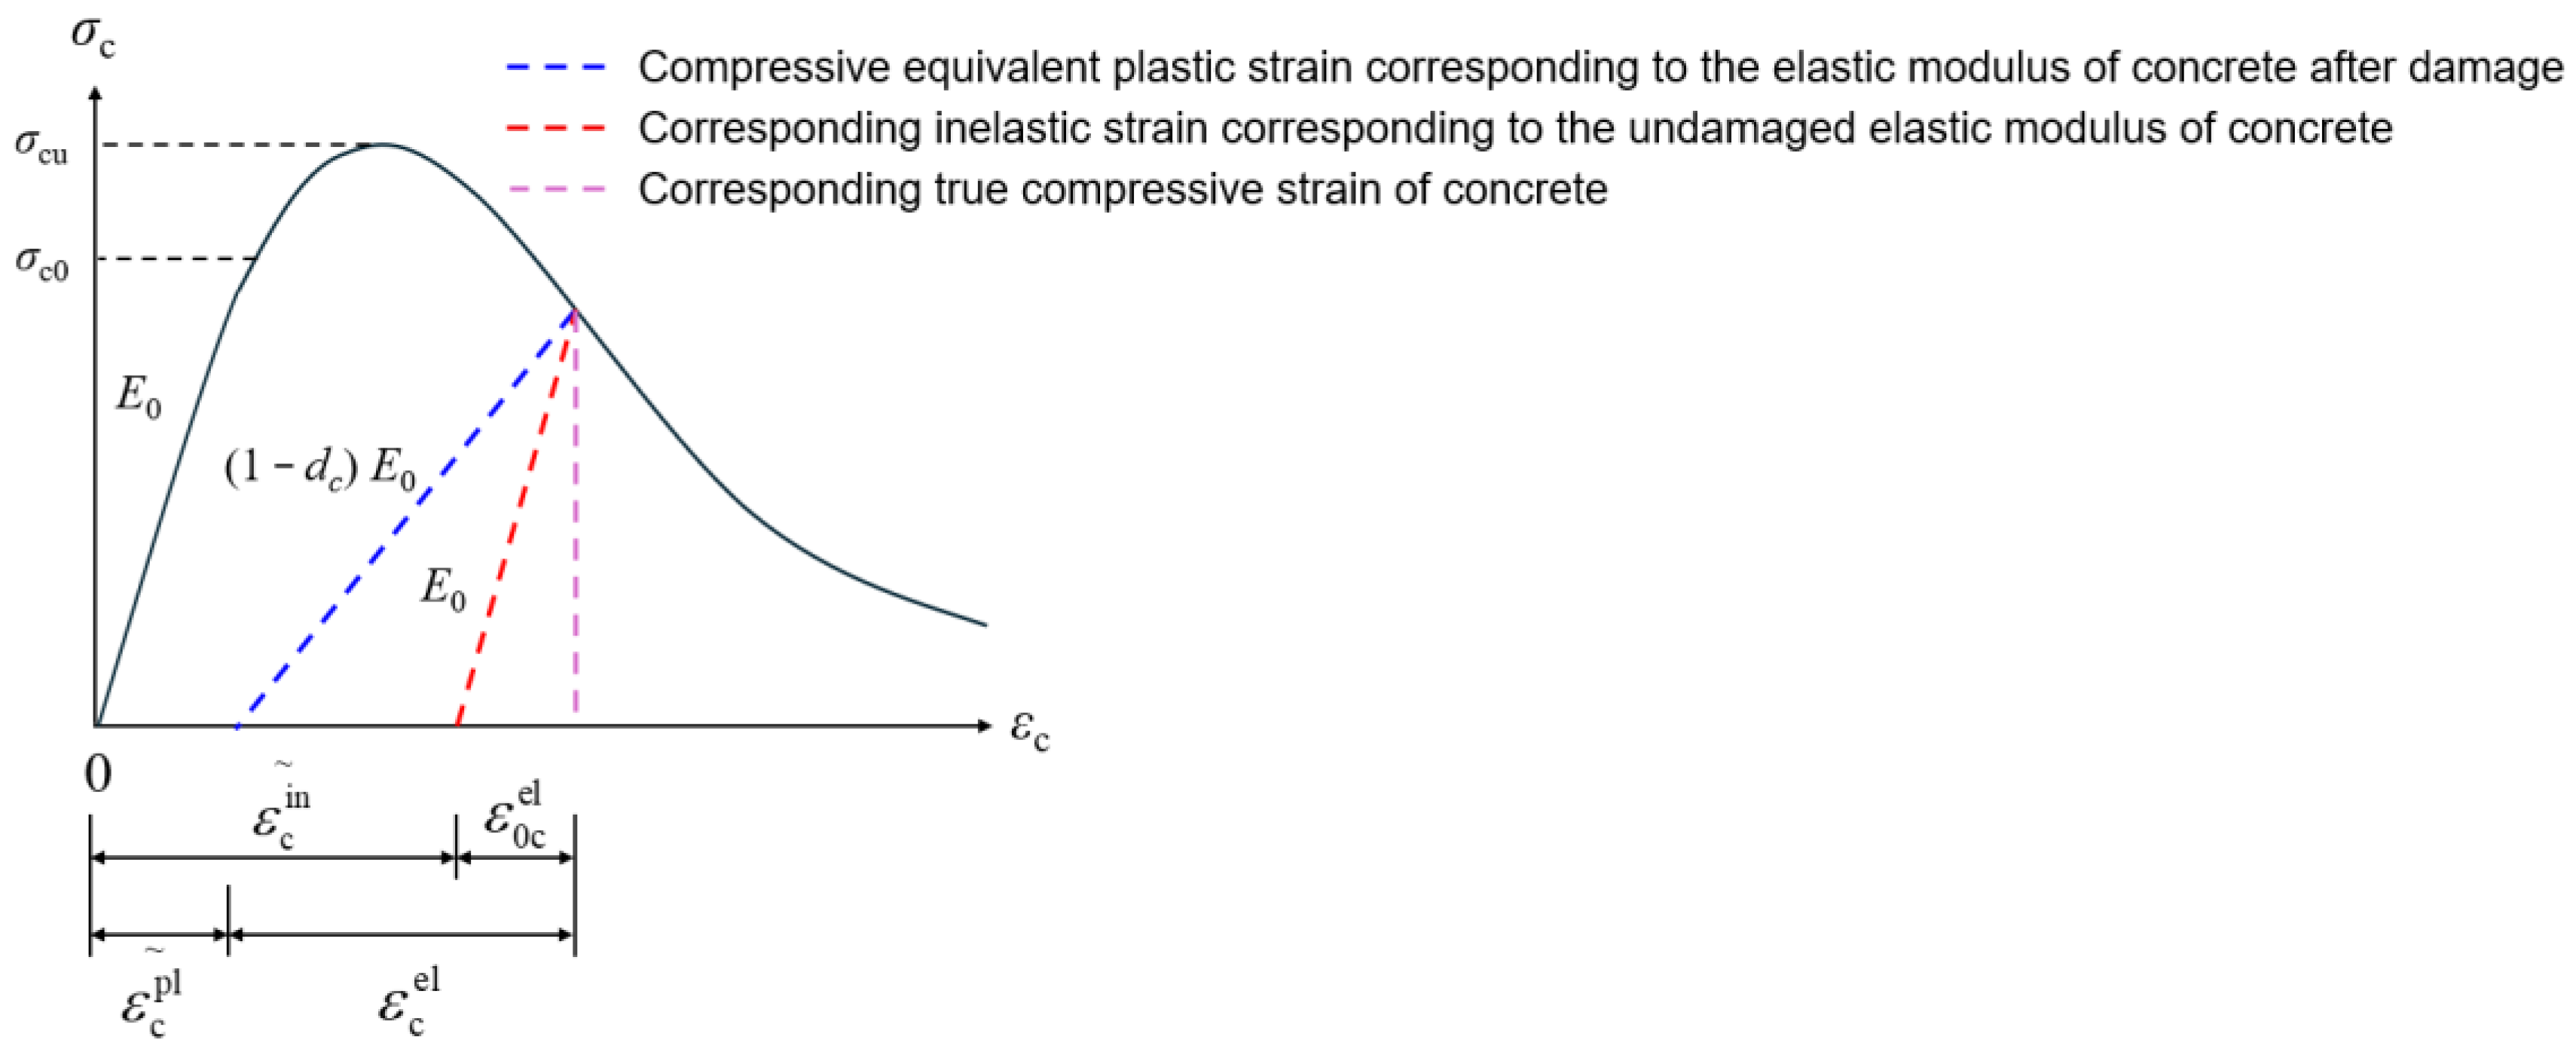
The CDP model, by introducing damage variables in combination with plasticity theory, can effectively characterize the entire transition process of concrete from the elastic stage to the plastic stage under both tensile and compressive states. When concrete is subjected to uniaxial tension or uniaxial compression, the inelastic deformation beyond the elastic range is regarded as damage, and the evolution of damage is represented and controlled by equivalent plastic strain. In the tensile case, a tensile damage factor
dt is defined, and its mechanical response can be divided into the elastic stage and the stiffness degradation stage, as shown in
Figure 5. In the compressive case, a compressive damage factor
dc is defined, and its deformation process consists of an elastic stage, a stress hardening stage, and a softening stage, as shown in
Figure 6.
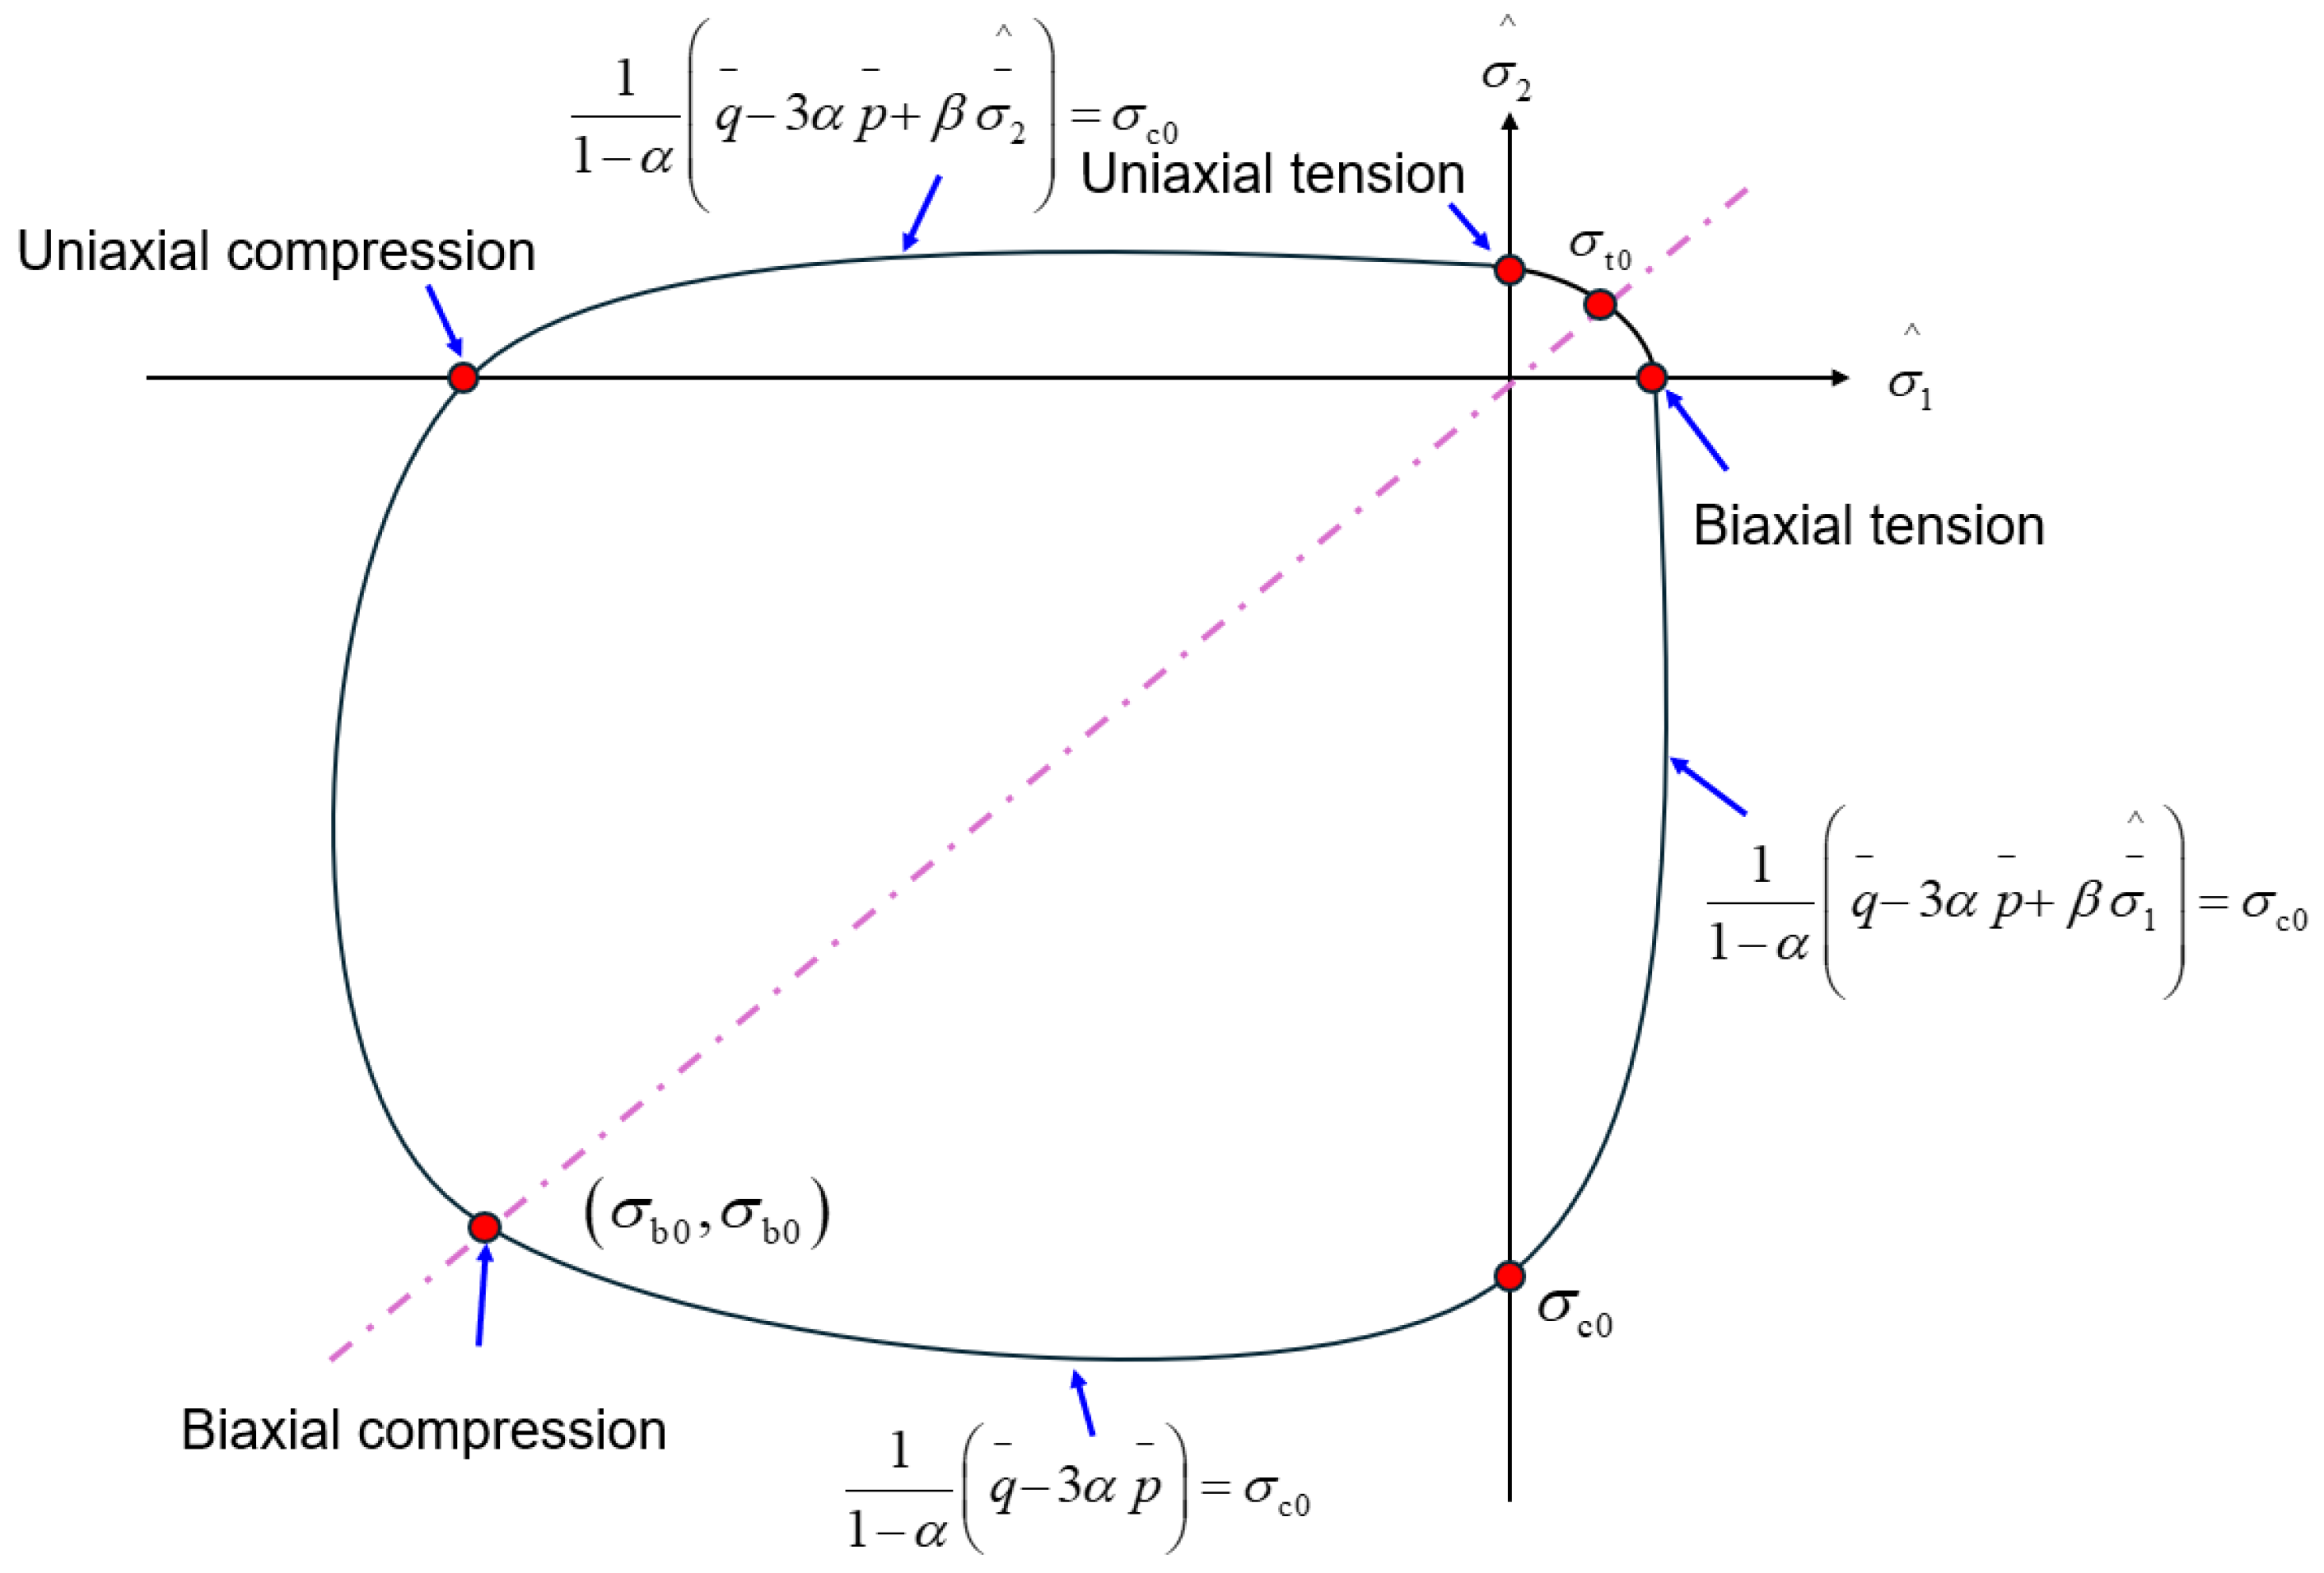
The theoretical framework of the CDP model is based on three core assumptions: the initial yield criterion, the hardening law, and the flow rule. The initial yield criterion is used to reduce a complex multiaxial stress state to an equivalent stress, which is then compared with the material’s yield strength to determine whether plastic deformation occurs. When the equivalent stress exceeds the yield strength, the material enters the plastic stage. The hardening law describes the evolution of the yield surface during plastic deformation. For example, under the Mises criterion, the yield surface expands isotropically, and the yield stresses in compression and tension are approximately equal. The flow rule defines the direction of the plastic strain increment after yielding, and its form depends on the yield surface and the hardening law. Once the first two are specified, the flow rule is consequently determined. The yield surface of the model is shown in
Figure 7.
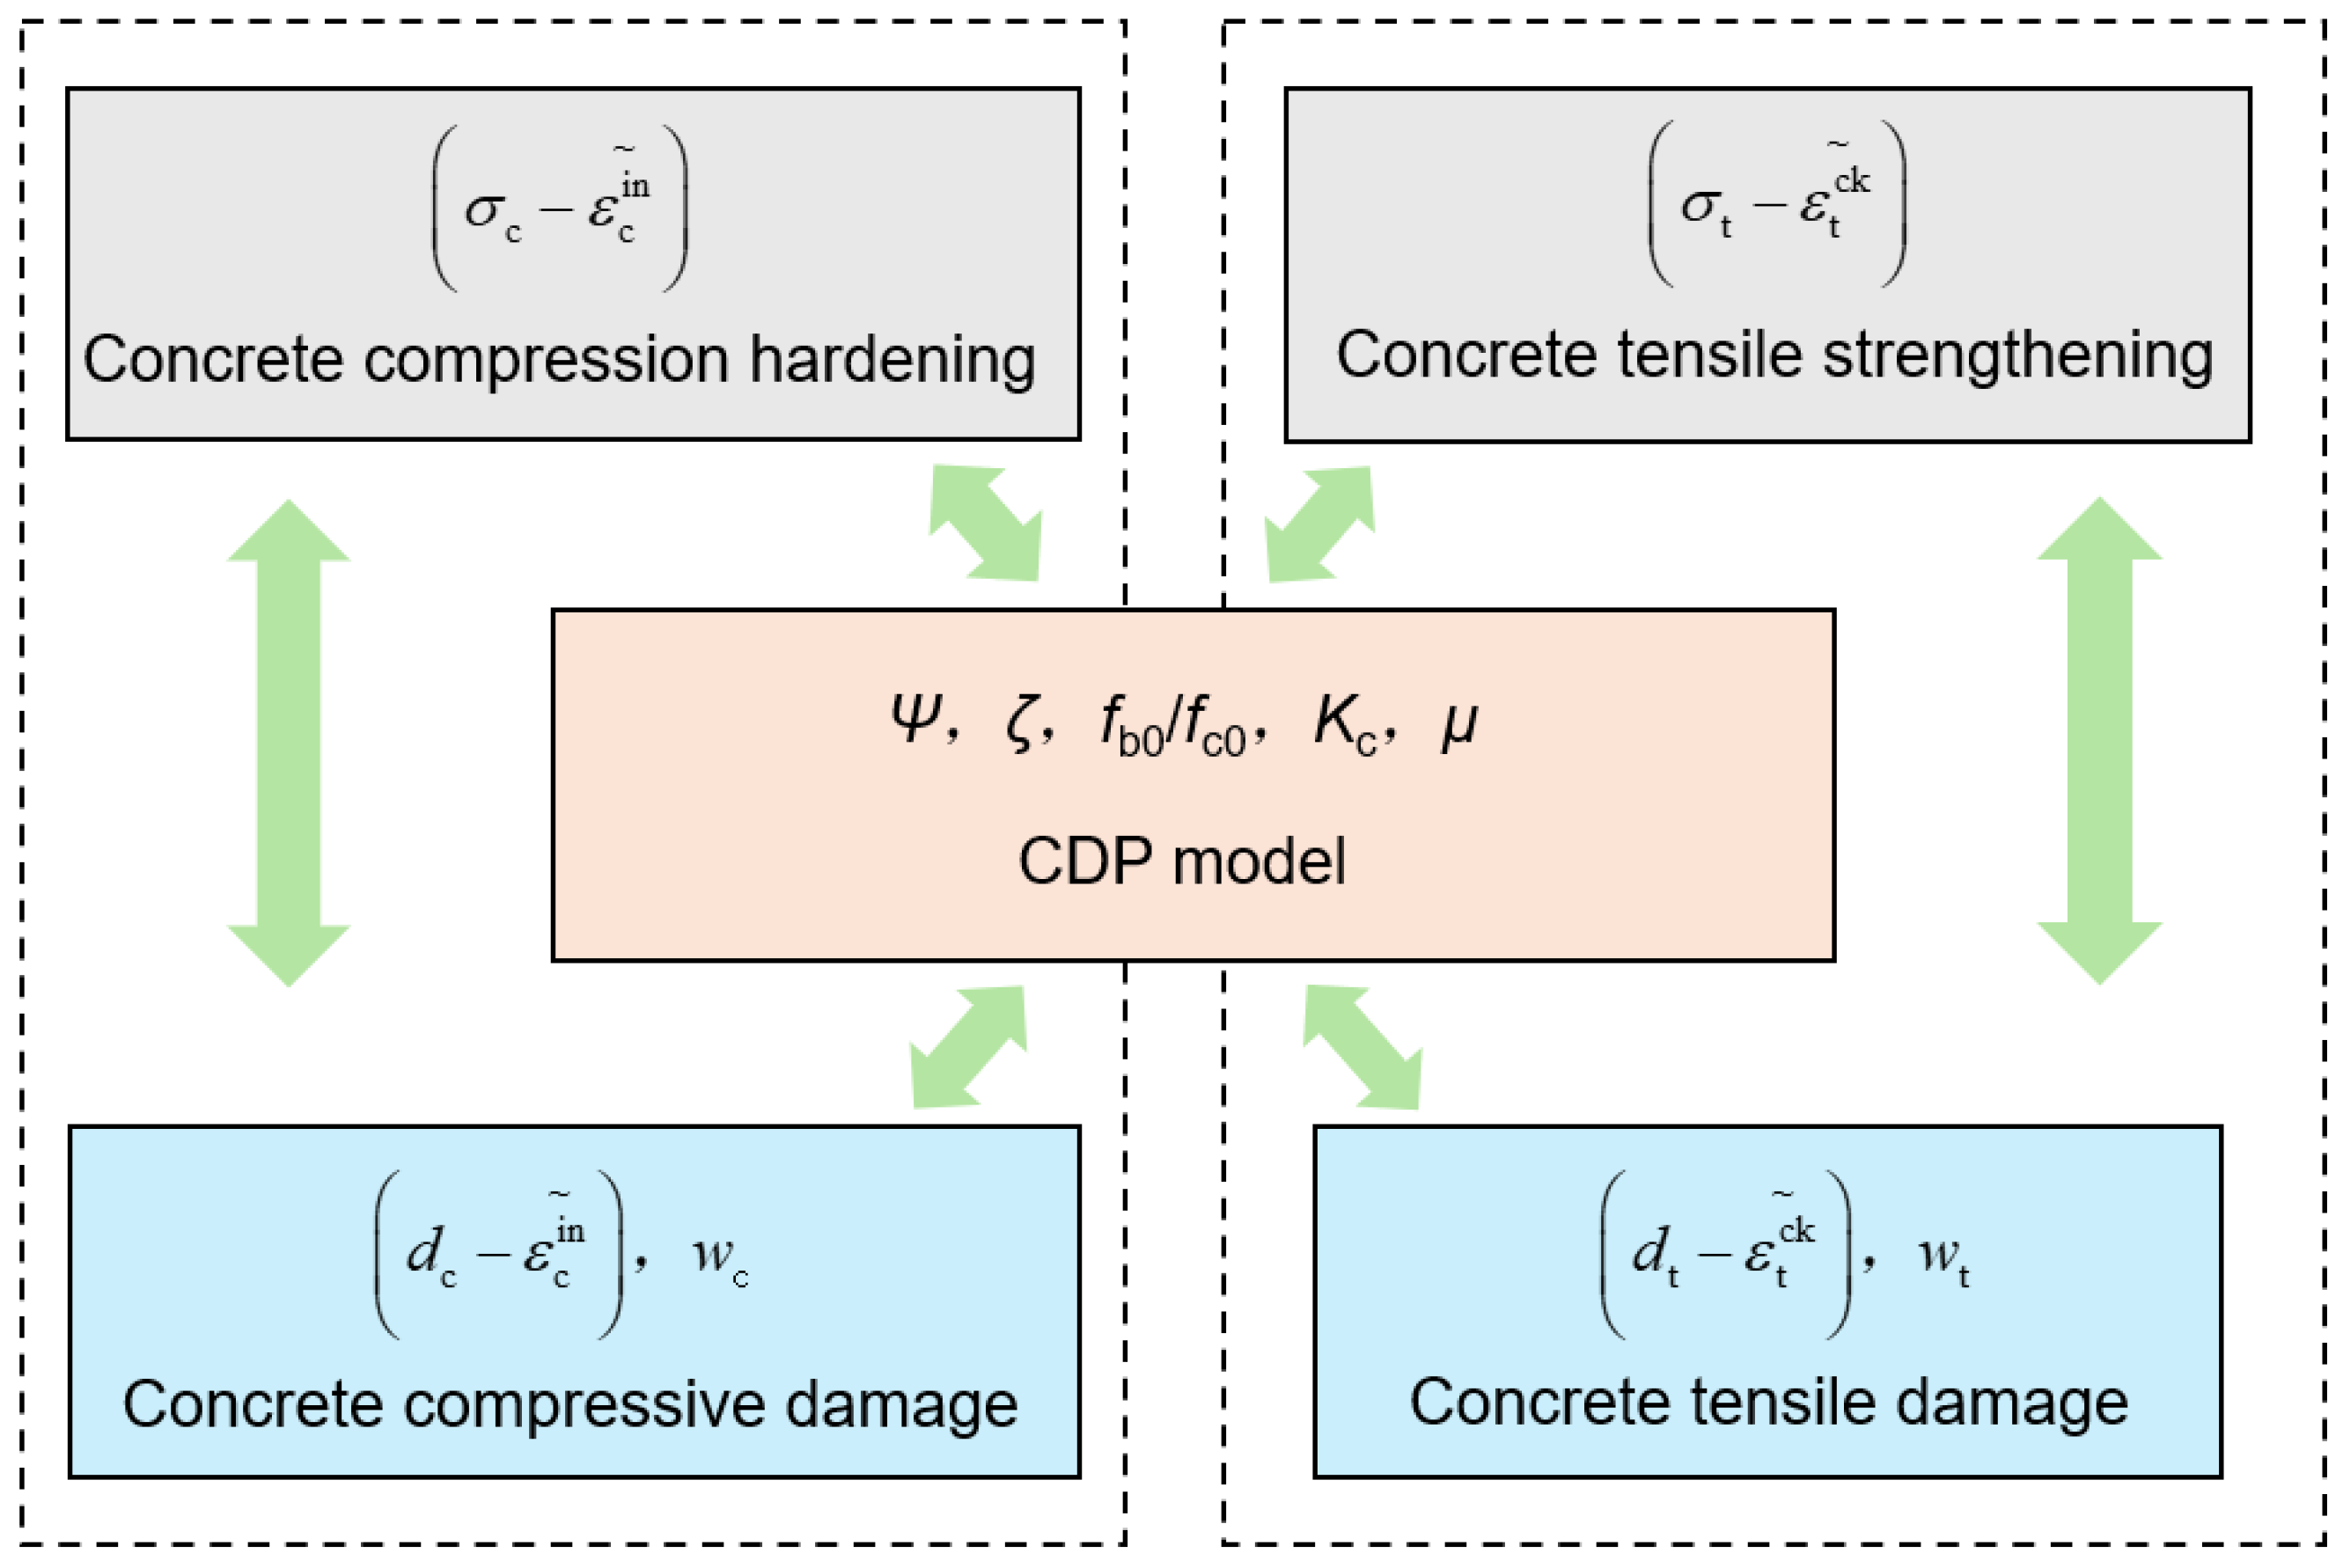
This model integrates elasticity, plasticity, and damage mechanisms in an organic manner, enabling a relatively accurate simulation of the response characteristics of concrete under loading. In terms of parameter settings, the elastic modulus E and Poisson’s ratio
ν govern the deformation characteristics in the elastic stage; plasticity parameters such as dilation angle and eccentricity influence the yielding behavior; the initial yield stress ratio and invariant stress ratio determine the exact location of the yield surface; viscous parameters help improve numerical convergence during the softening stage and stiffness degradation process. Through the appropriate selection of these parameters, the CDP model can realistically reproduce the nonlinear behavior and damage evolution of concrete under loading. Parameter definitions are shown in
Figure 8.
2.2. Finite Element Model
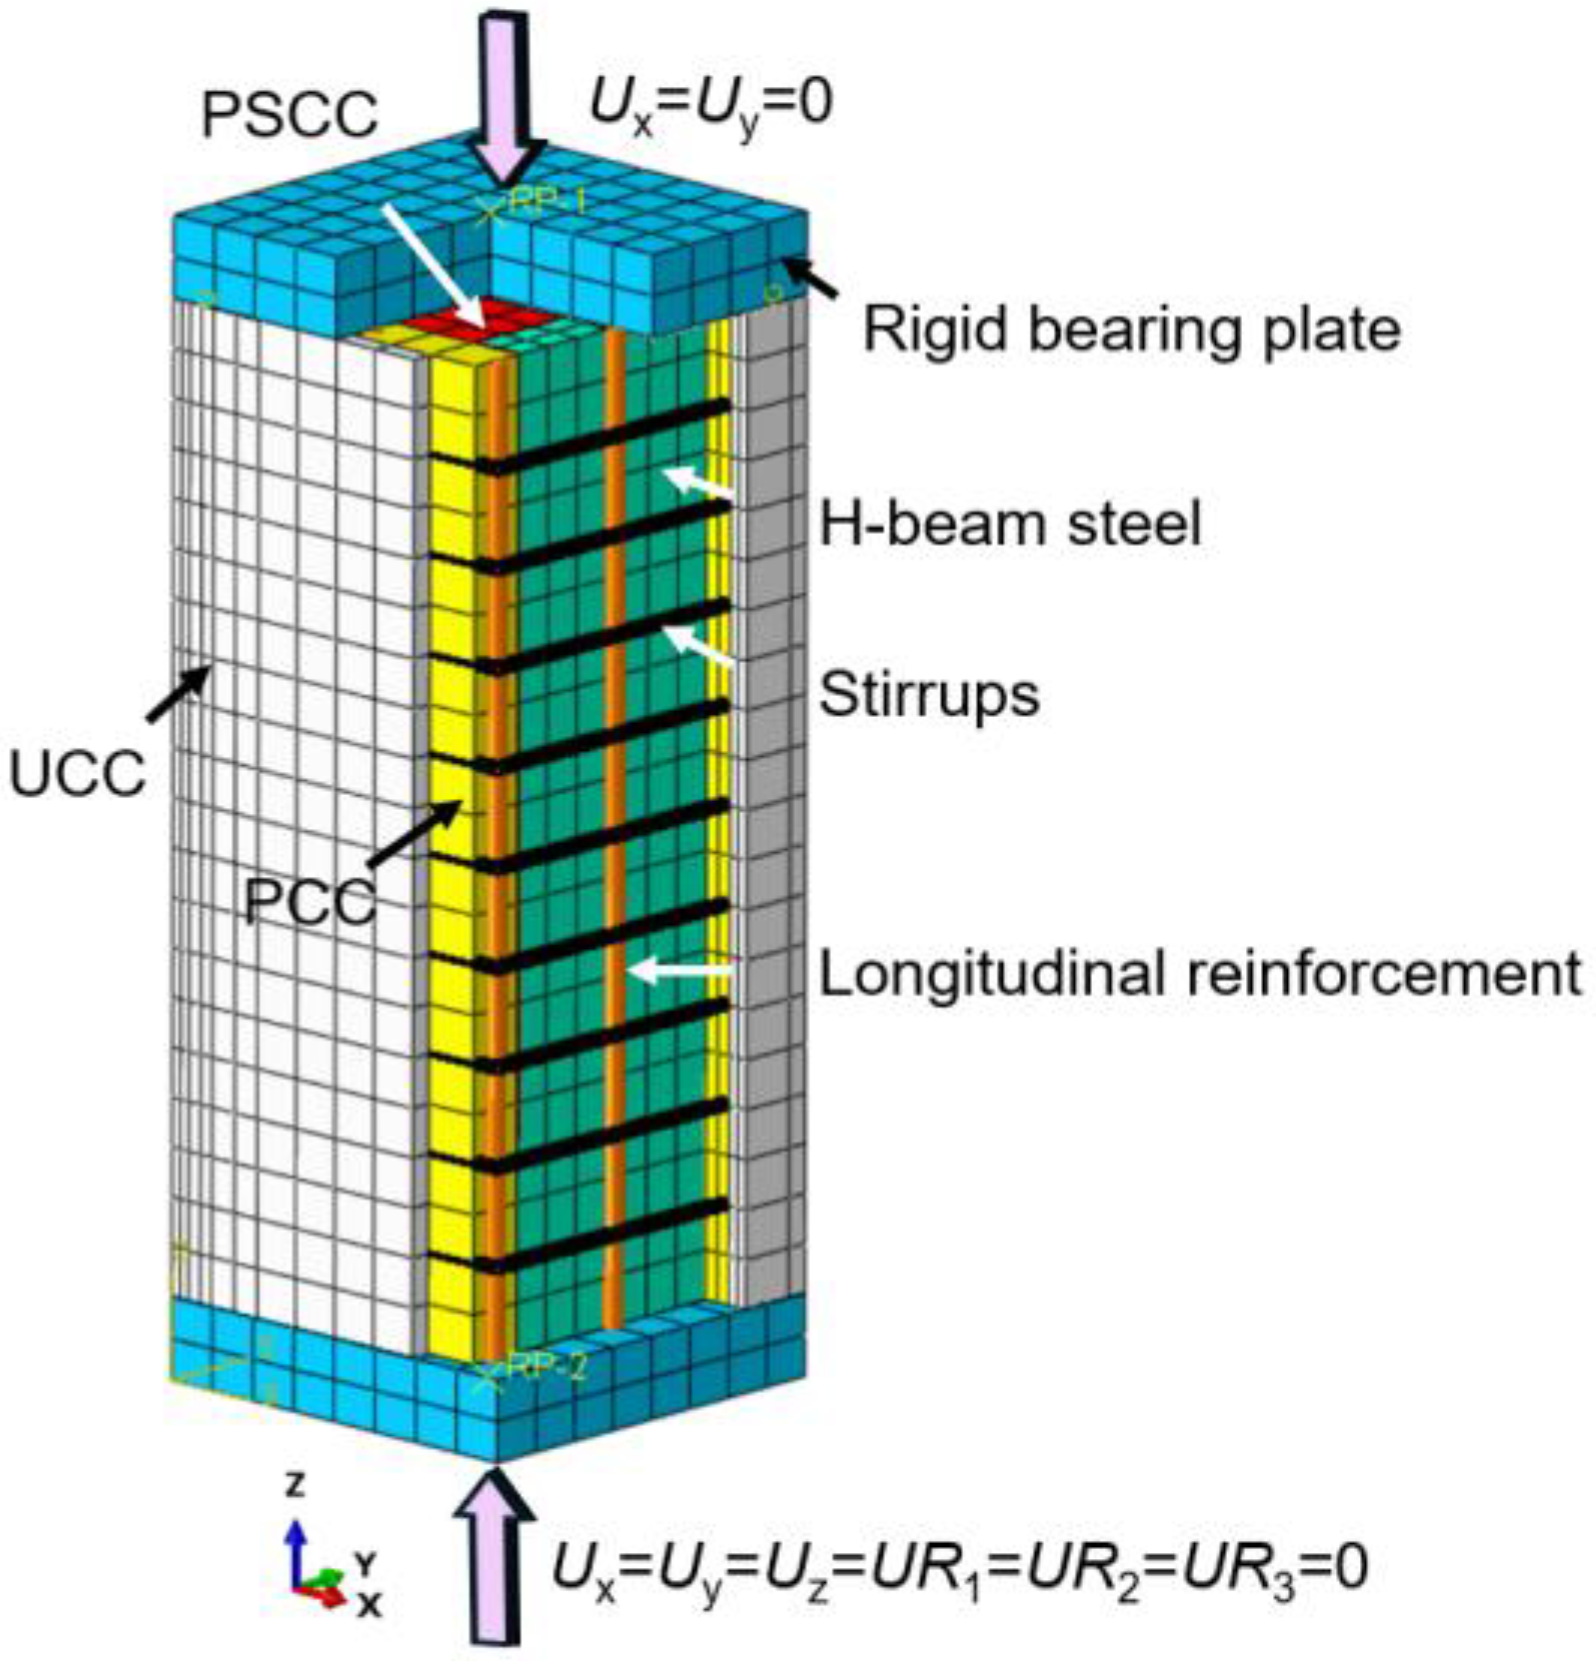
To balance computational accuracy and efficiency, the rigid cushion, UHPC formwork, cast-in-place NC layer, and H-shaped steel are all modeled using eight-node reduced integration solid elements (C3D8R). Since the primary function of the reinforcement is to withstand tension and compression, it is typically modeled using linear elements, with shear effects and complex loading conditions neglected. In this study, both the longitudinal reinforcement and stirrups are simulated using two-node three-dimensional truss elements (T3D2), in which each node possesses three degrees of freedom. This design allows for a more accurate representation of the actual structural behavior under loading.
In handling the material interfaces, the interaction between the reinforcement and the surrounding concrete was defined using the Embedded Region option in ABAQUS. For the interfaces between the UHPC panel and the cast-in-place layer, as well as between the cast-in-place layer and the H-shaped steel, hard contact was adopted in the normal direction, while the Coulomb friction criterion was applied in the tangential direction, typically with a friction coefficient of 0.6 [
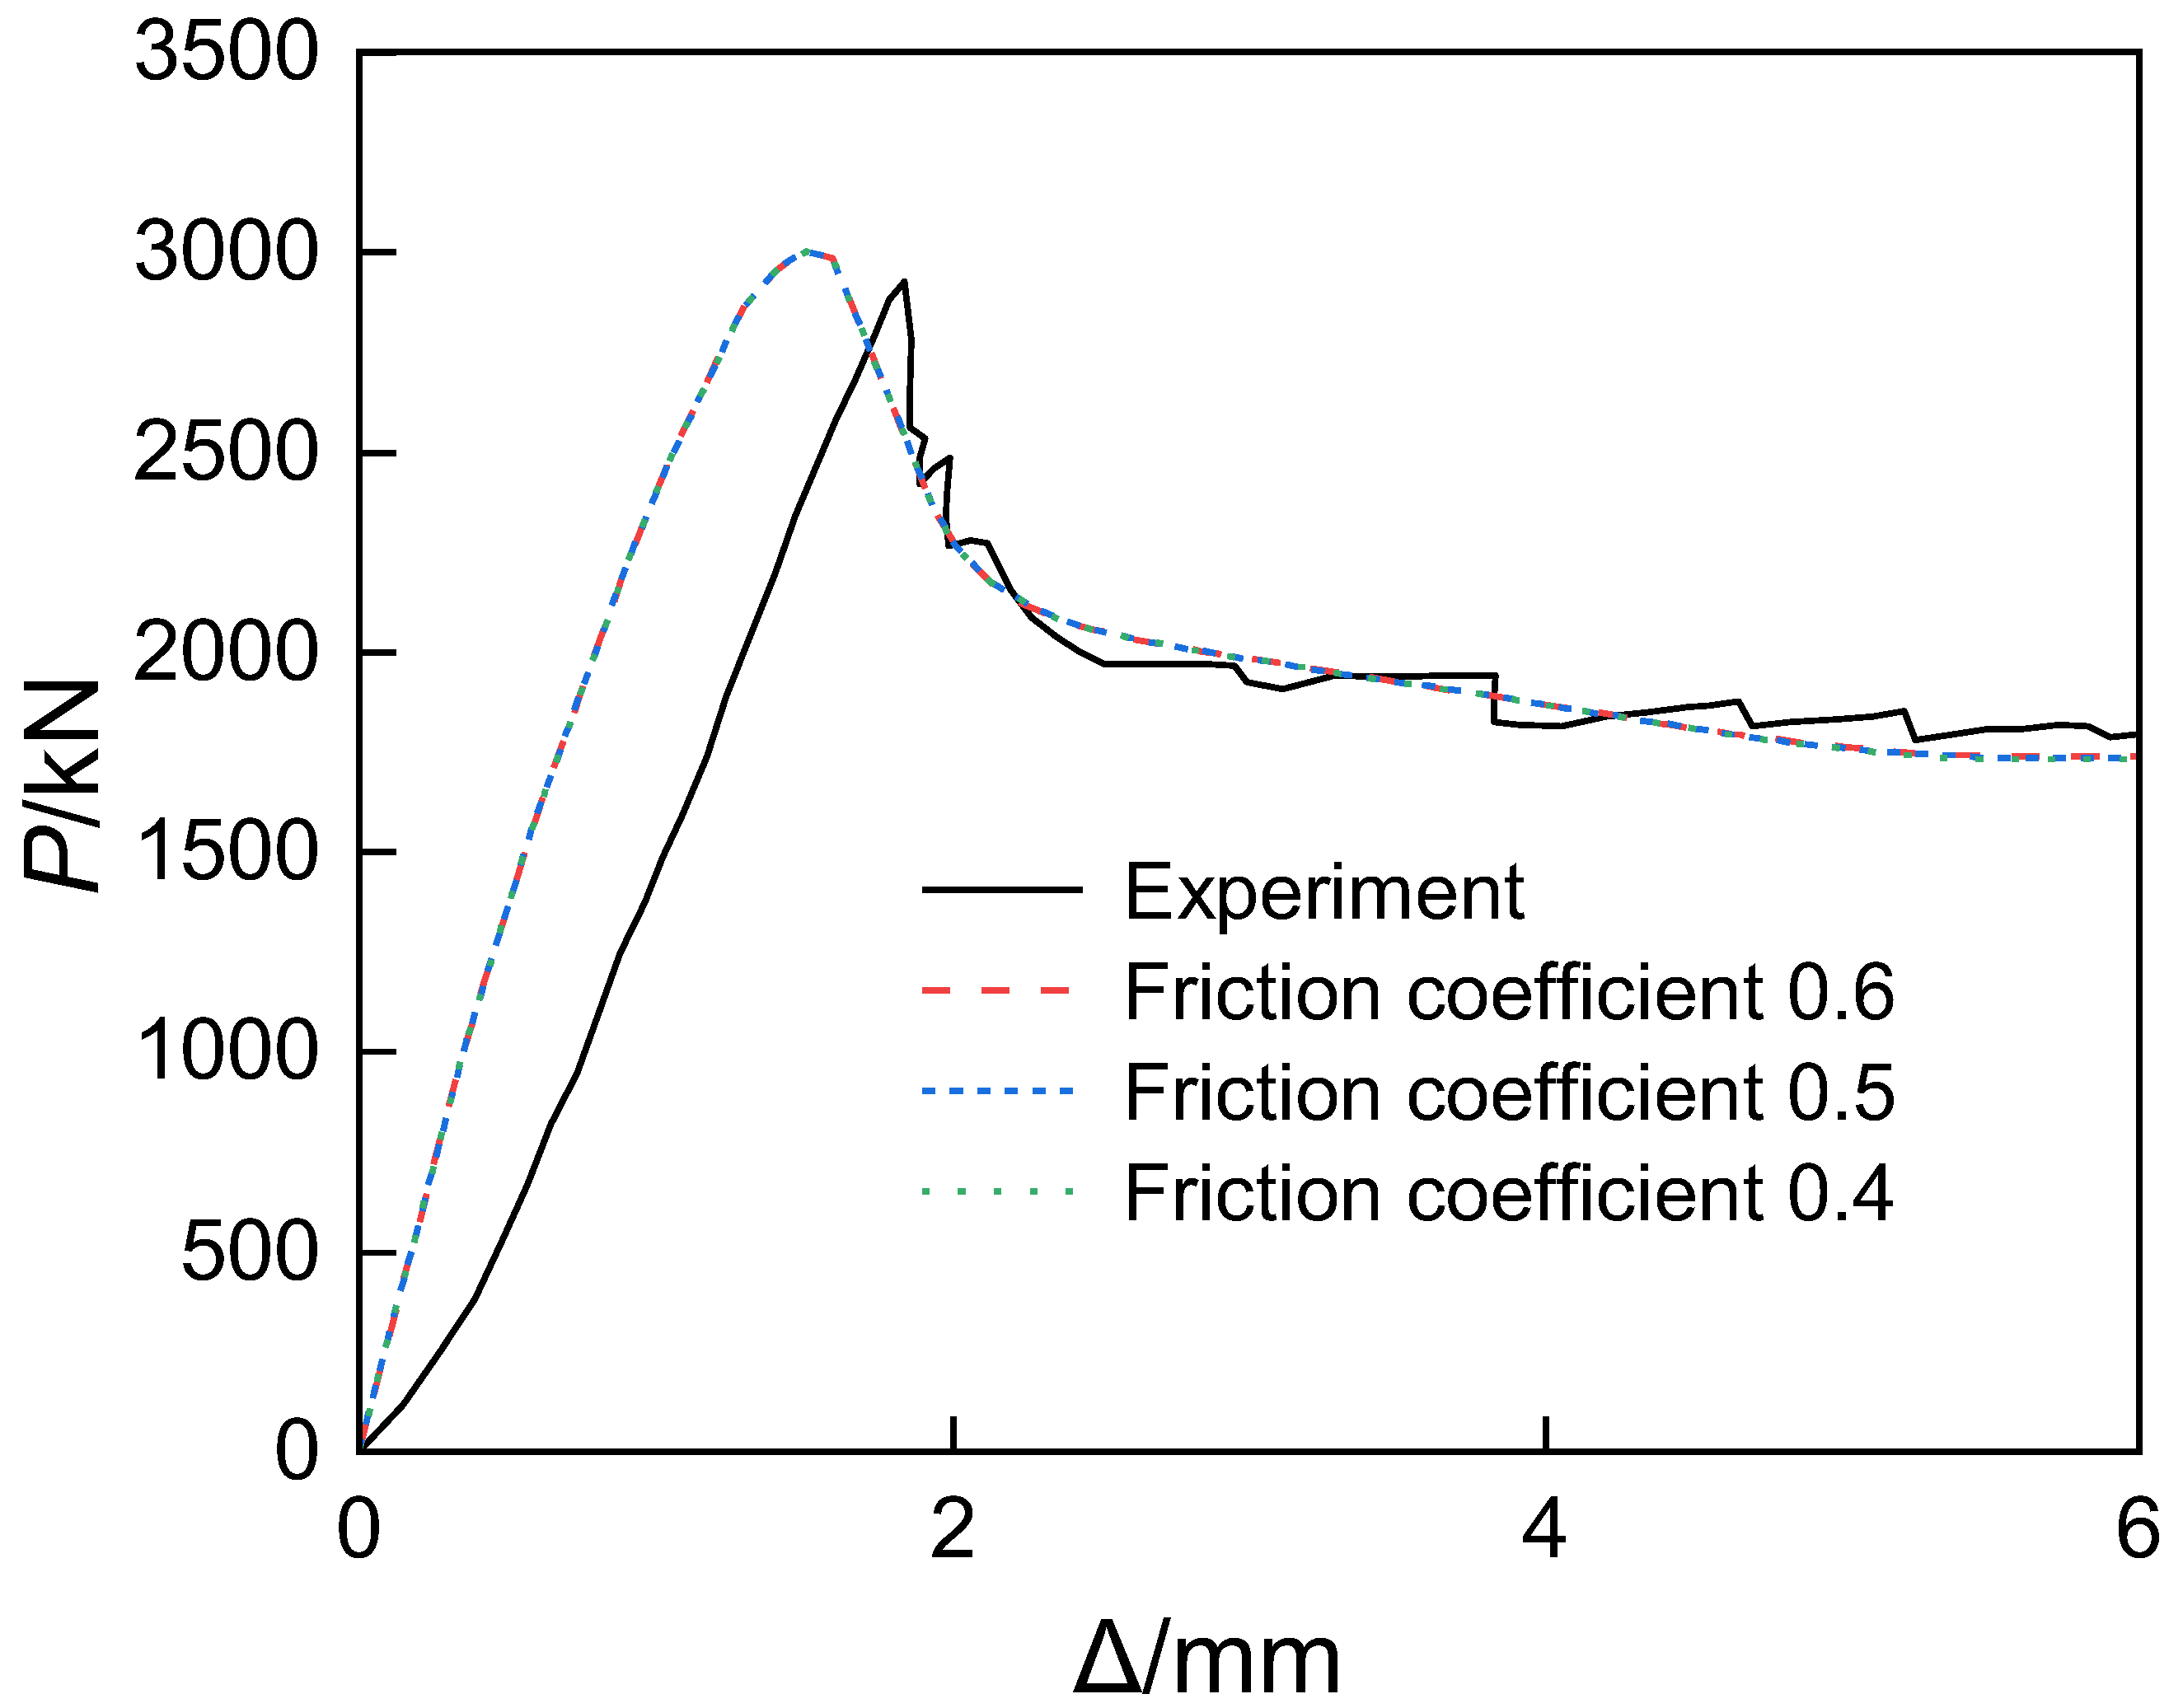
29]. A sensitivity analysis was conducted for friction coefficients of 0.4, 0.5, and 0.6, by comparing the axial load–displacement curves of short columns, evaluating computational efficiency, and calculating the ratio of ultimate loads obtained from experiments and simulations, in order to determine the optimal friction coefficient.
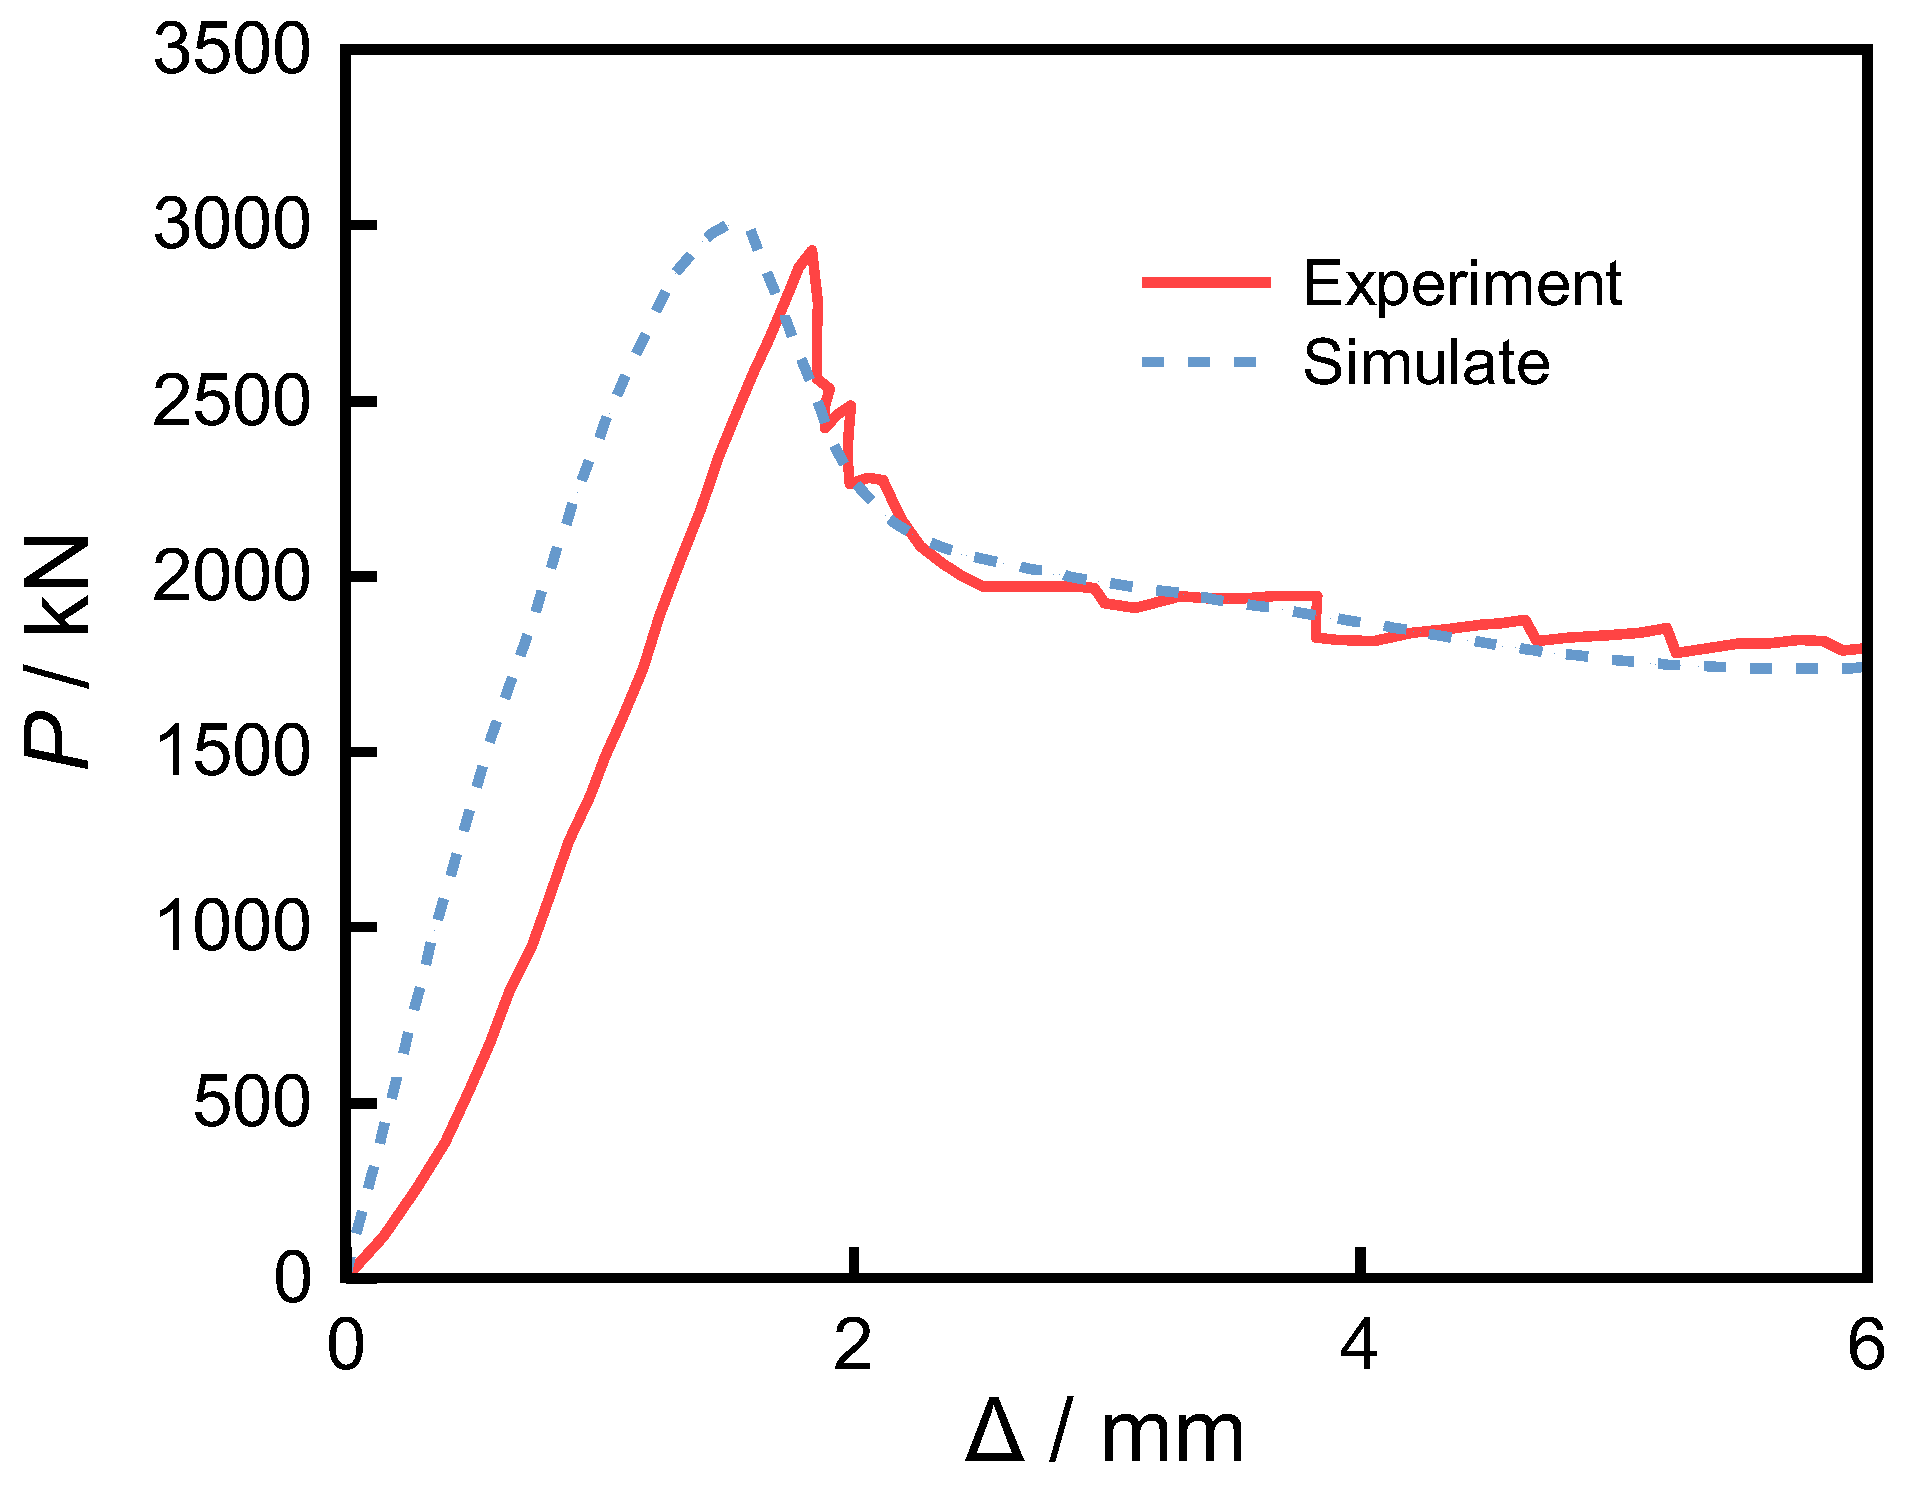
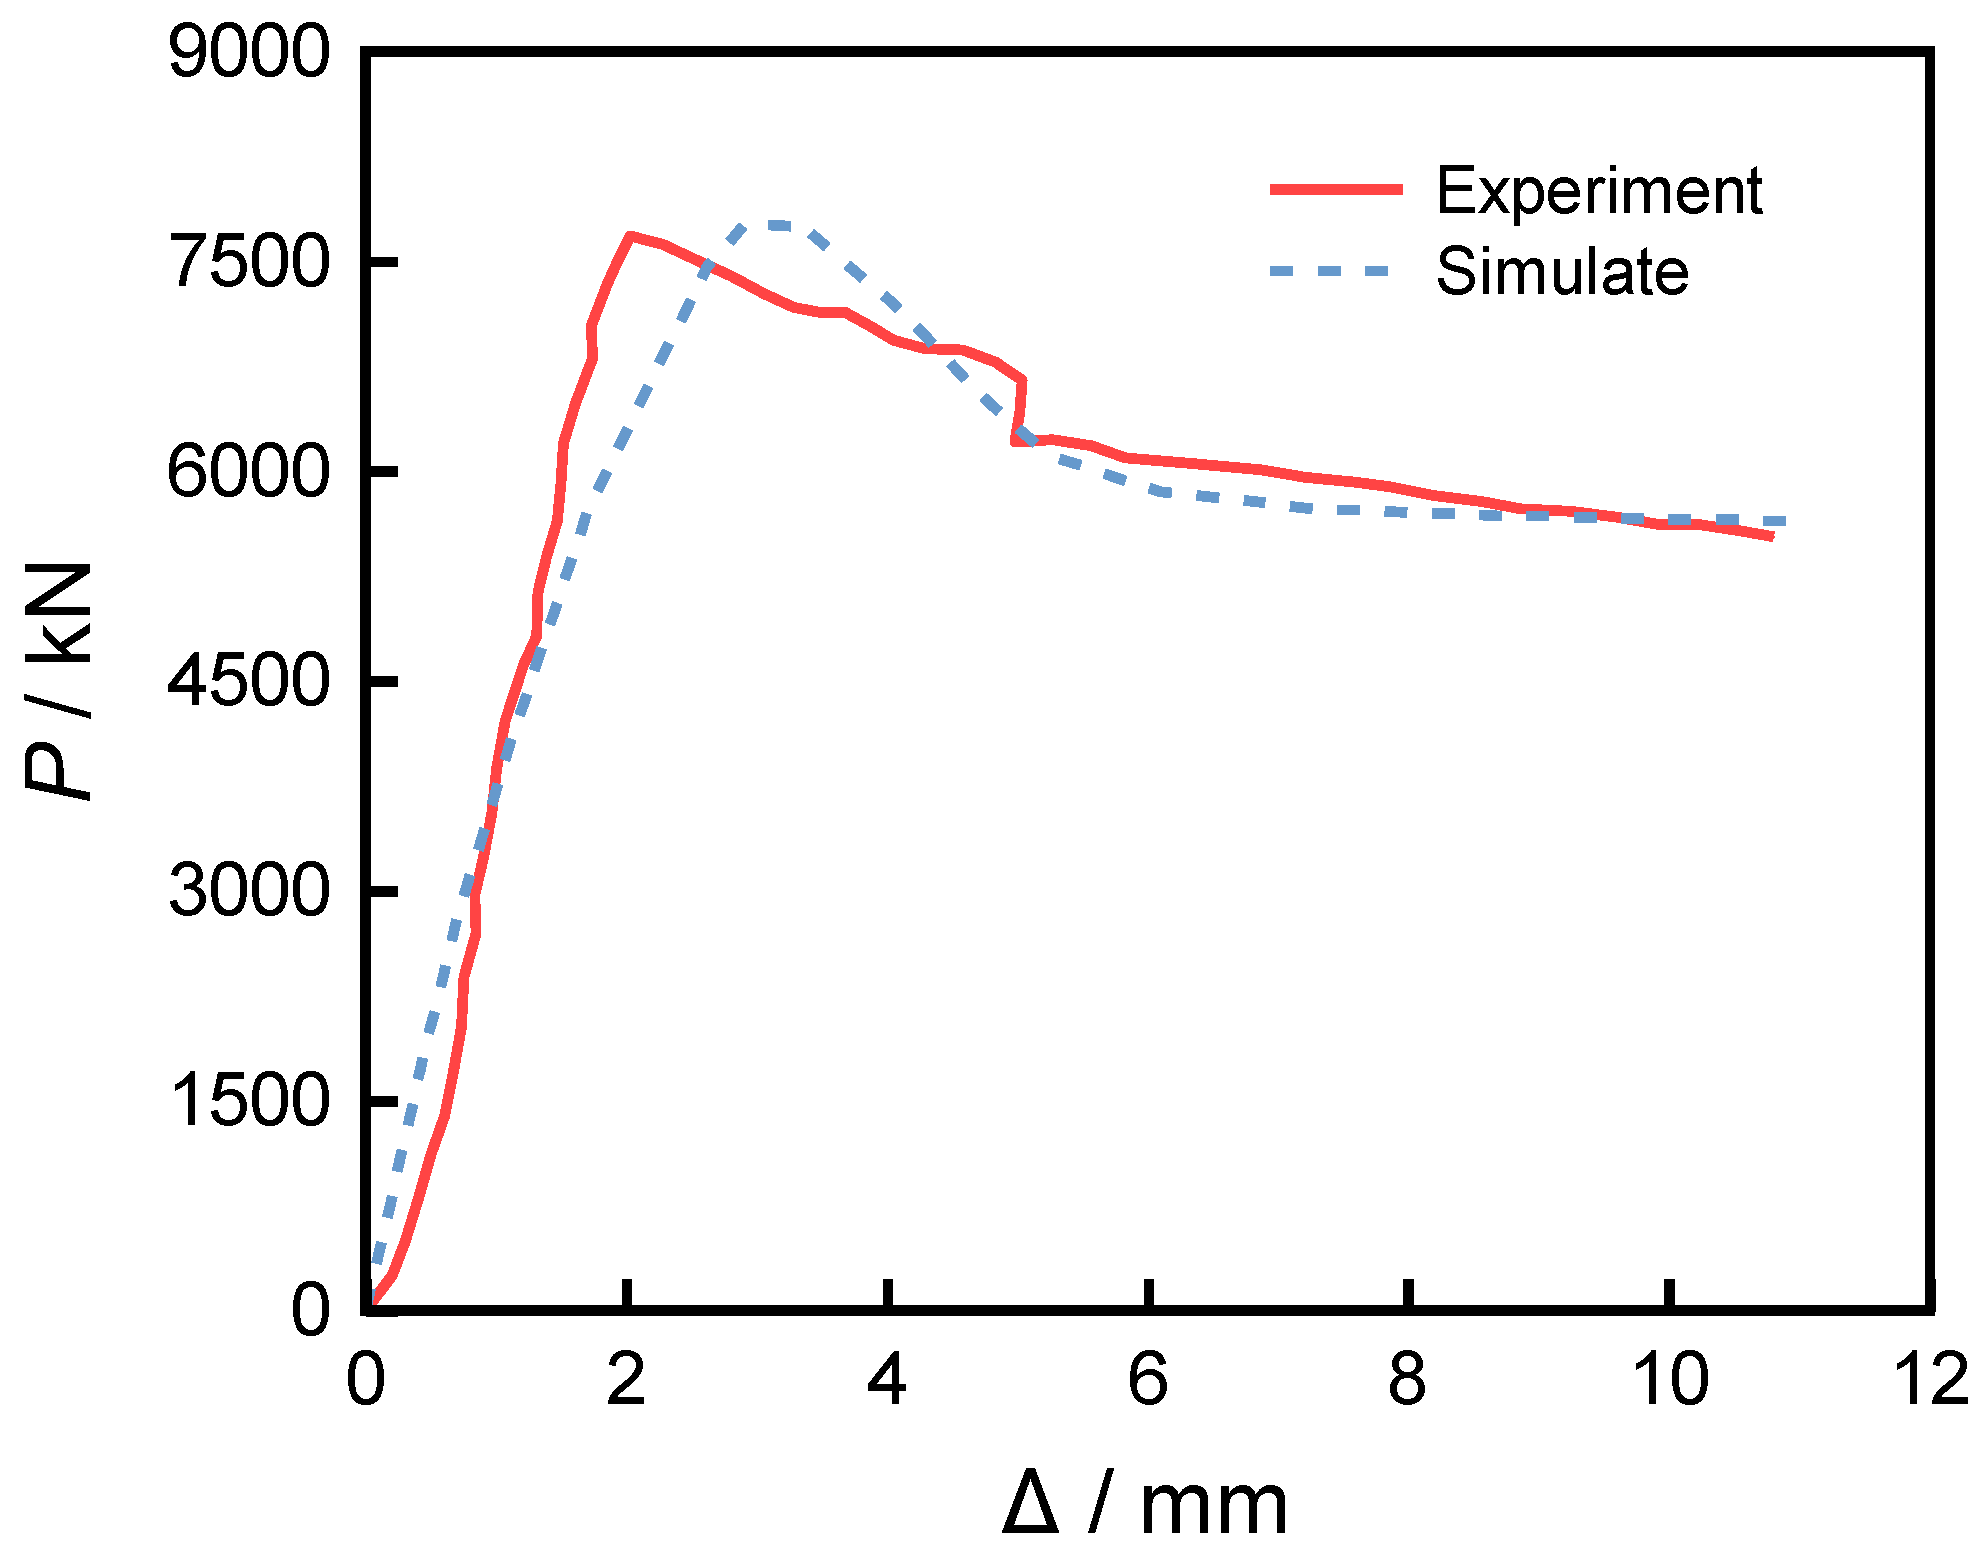
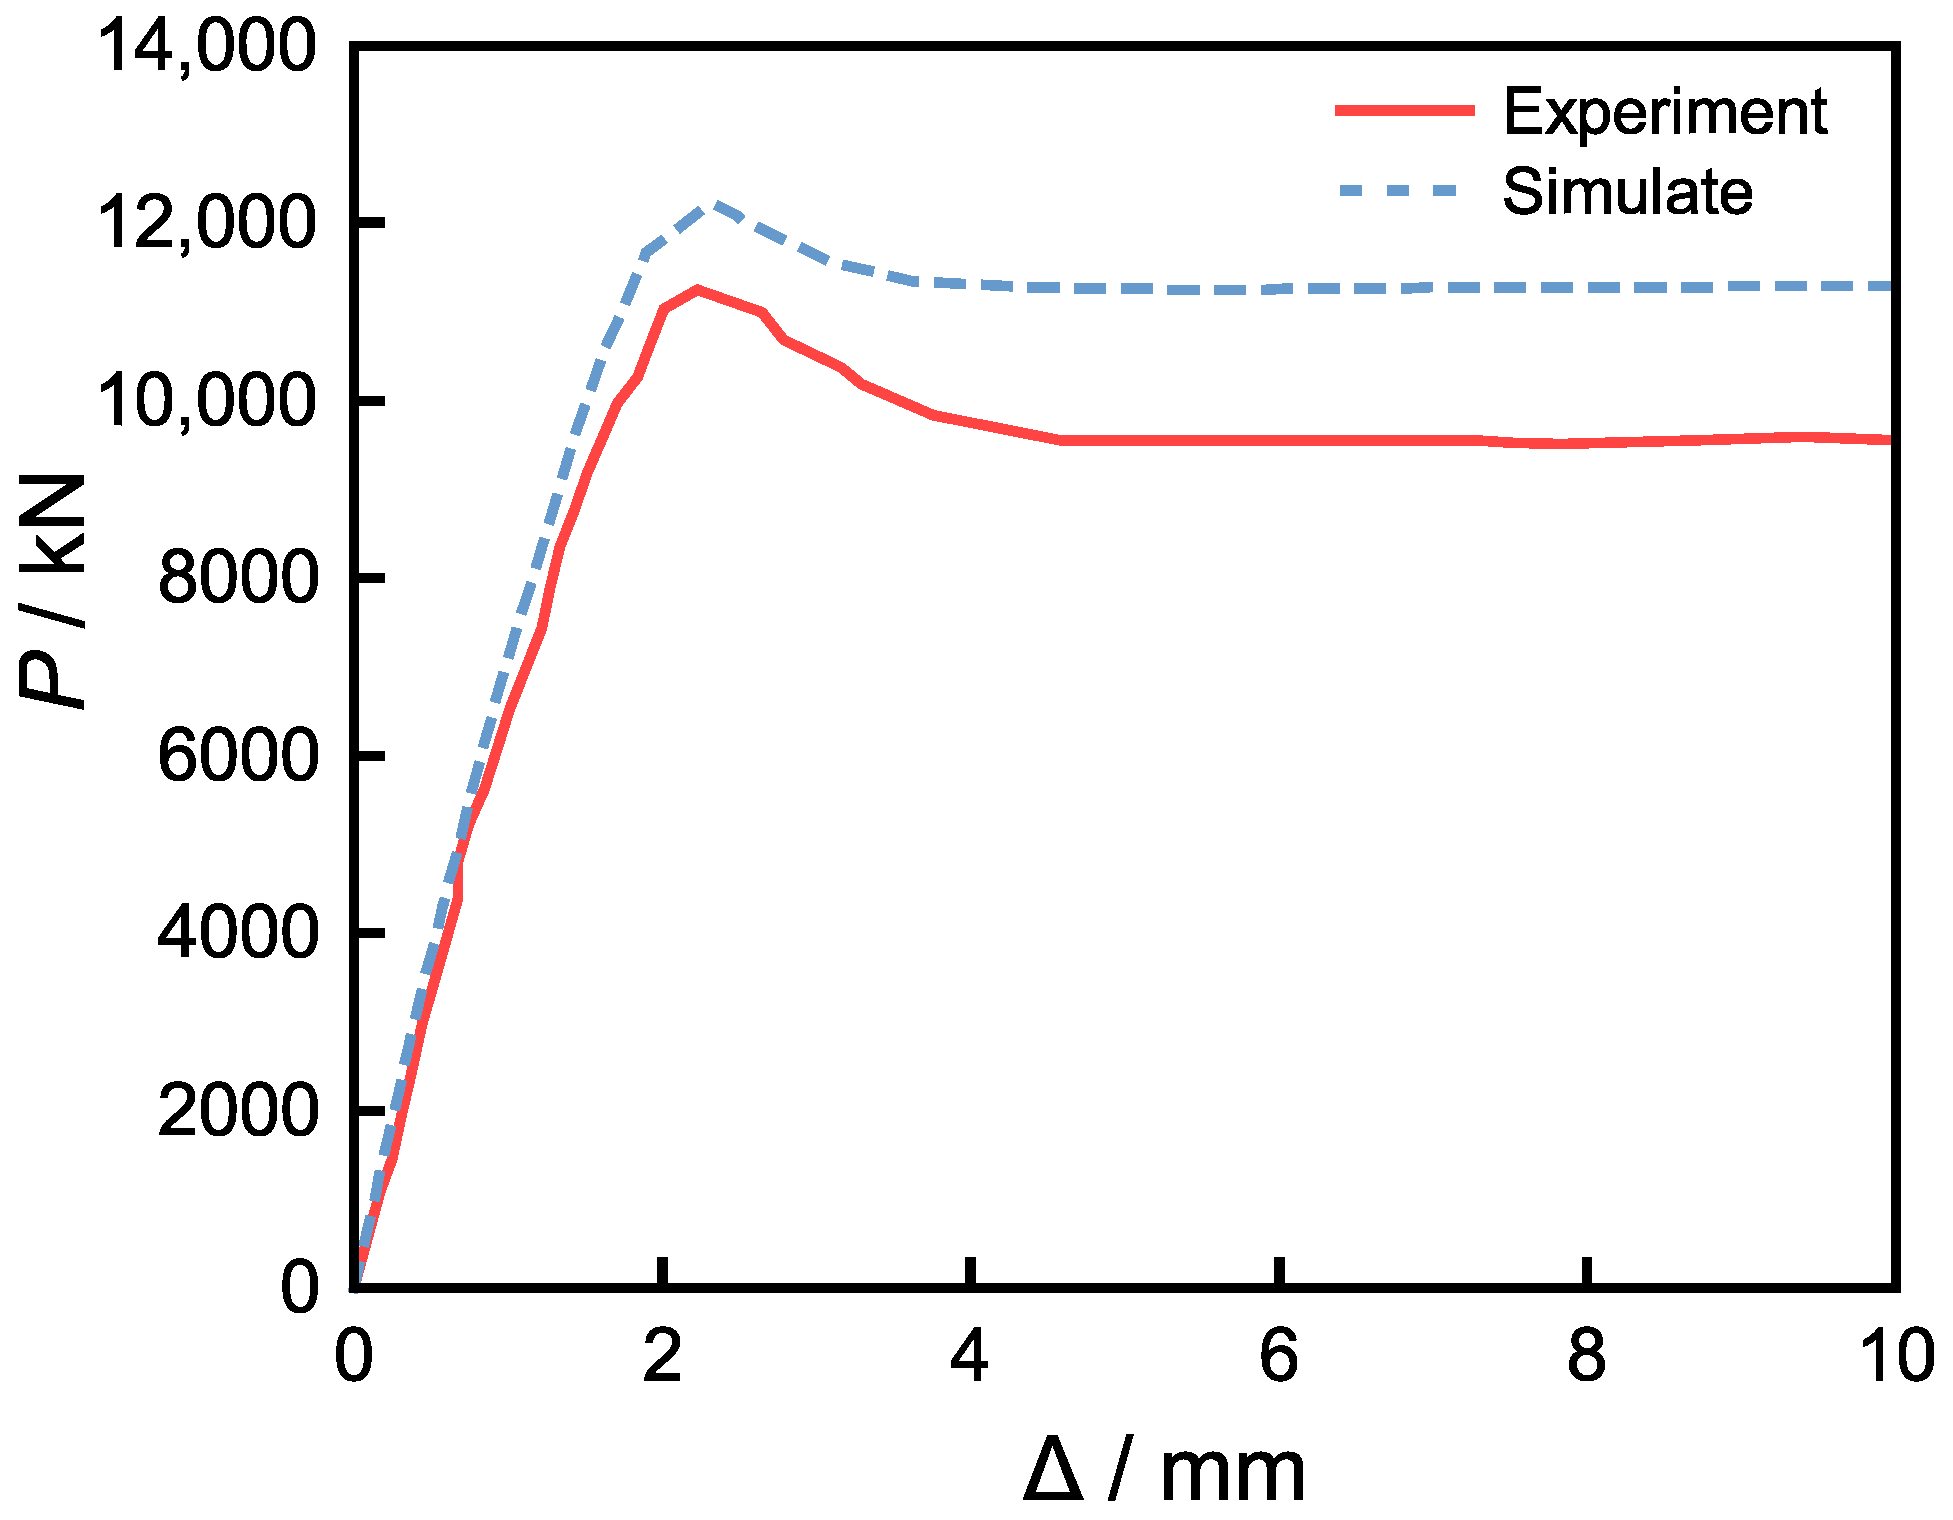
The analysis results indicate that, under the three friction coefficients, the axial load–displacement curves of the short columns obtained from numerical simulations exhibit essentially the same trend and are consistent with the experimental results, as shown in
Figure 9. As presented in
Table 2, when the friction coefficient is 0.6, the simulation results show the highest agreement with the experiments, achieving an accuracy of 0.99, which is superior to the cases with friction coefficients of 0.5 and 0.4 (both 0.98).
In contact analysis, the accuracy of the friction coefficient directly affects the prediction of interfacial stress and deformation; therefore, higher precision implies greater reliability of the model’s mechanical response. Although the total number of incremental steps is 137 when the friction coefficient is 0.6—slightly higher than the result for 0.5—it has the fewest total iterations, only 10, indicating faster convergence per step and better algorithmic stability. In nonlinear contact analysis, reducing the number of iterations helps avoid numerical divergence and convergence difficulties.
In addition, when the friction coefficient is 0.6, the computation time is 11 min and 03 s, which is less than one minute longer than the shortest time obtained at 0.5, yet it significantly improves accuracy. From an engineering perspective, this difference in computation time is negligible. In summary, a friction coefficient of 0.6 achieves a sound balance among accuracy, convergence, and computational efficiency, while closely matching actual physical conditions. Therefore, it is the optimal parameter in this study to ensure both numerical stability and engineering reliability.
In Reference [
30], the traction–separation law and the bilinear cohesive model are discussed, in which the interfacial behavior is divided into three stages: linear elastic response, damage initiation, and damage evolution. Although cohesive elements were not implemented in the present simulation in order to maintain consistency with experimental observations and meet computational efficiency requirements, we acknowledge that this method can effectively simulate progressive debonding phenomena and will consider its application in future studies.
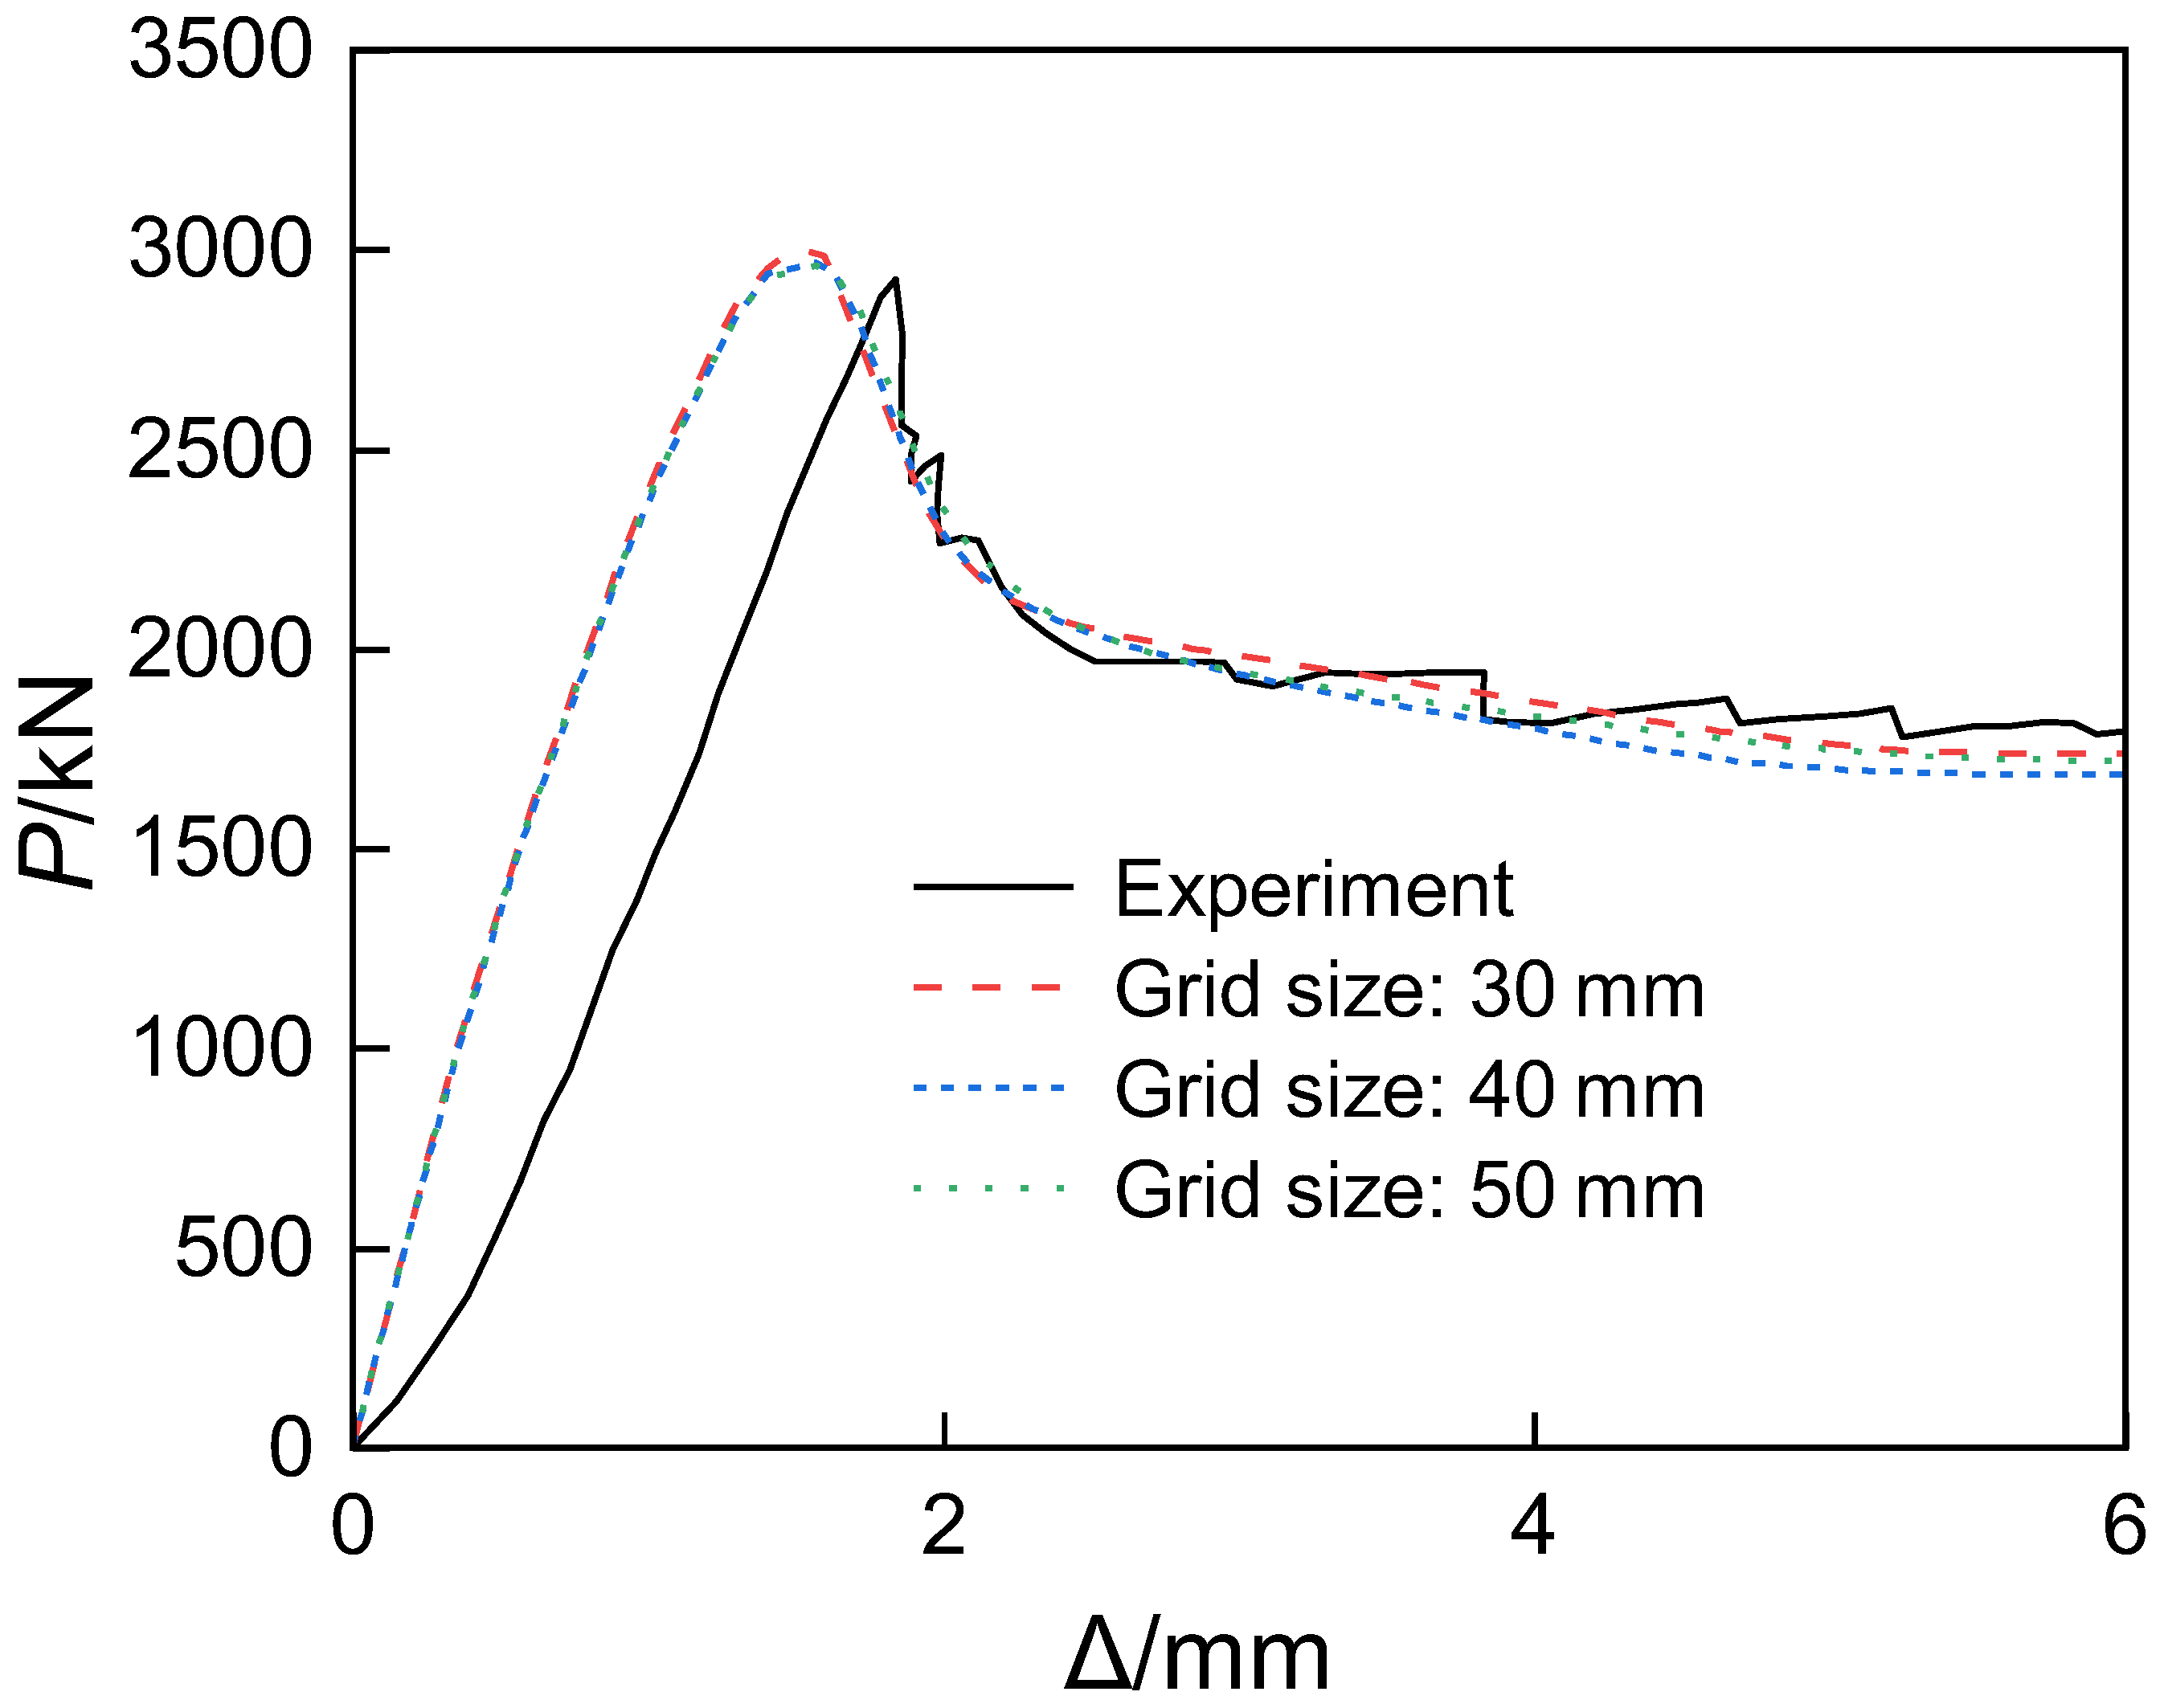
The rigid cushion blocks were connected to the surface of the short columns using a bonded contact method. To assess the influence of mesh discretization on the computational results, a sensitivity analysis was conducted by comparing three mesh sizes: 30 mm, 40 mm, and 50 mm. The results indicate that when both the concrete and structural steel adopt a mesh size of 30 mm, a desirable balance between accuracy and computational efficiency can be achieved.
As shown in
Figure 10, the axial load–displacement curves of the short columns obtained from numerical simulations under the three mesh sizes exhibit essentially the same trend and agree well with the experimental curves. As can be seen from
Table 3, under identical loading parameters and time increments, the differences in simulation accuracy among the three mesh sizes are minimal. However, although the 50 mm mesh contains fewer elements, it requires a significantly greater number of iterations, which may affect the convergence of large-scale computations. Overall, the influence of mesh size variation on computation time is relatively small. Taking both accuracy and convergence into account, a mesh size of 30 mm is recommended, as it can moderately reduce computation time while ensuring accuracy.
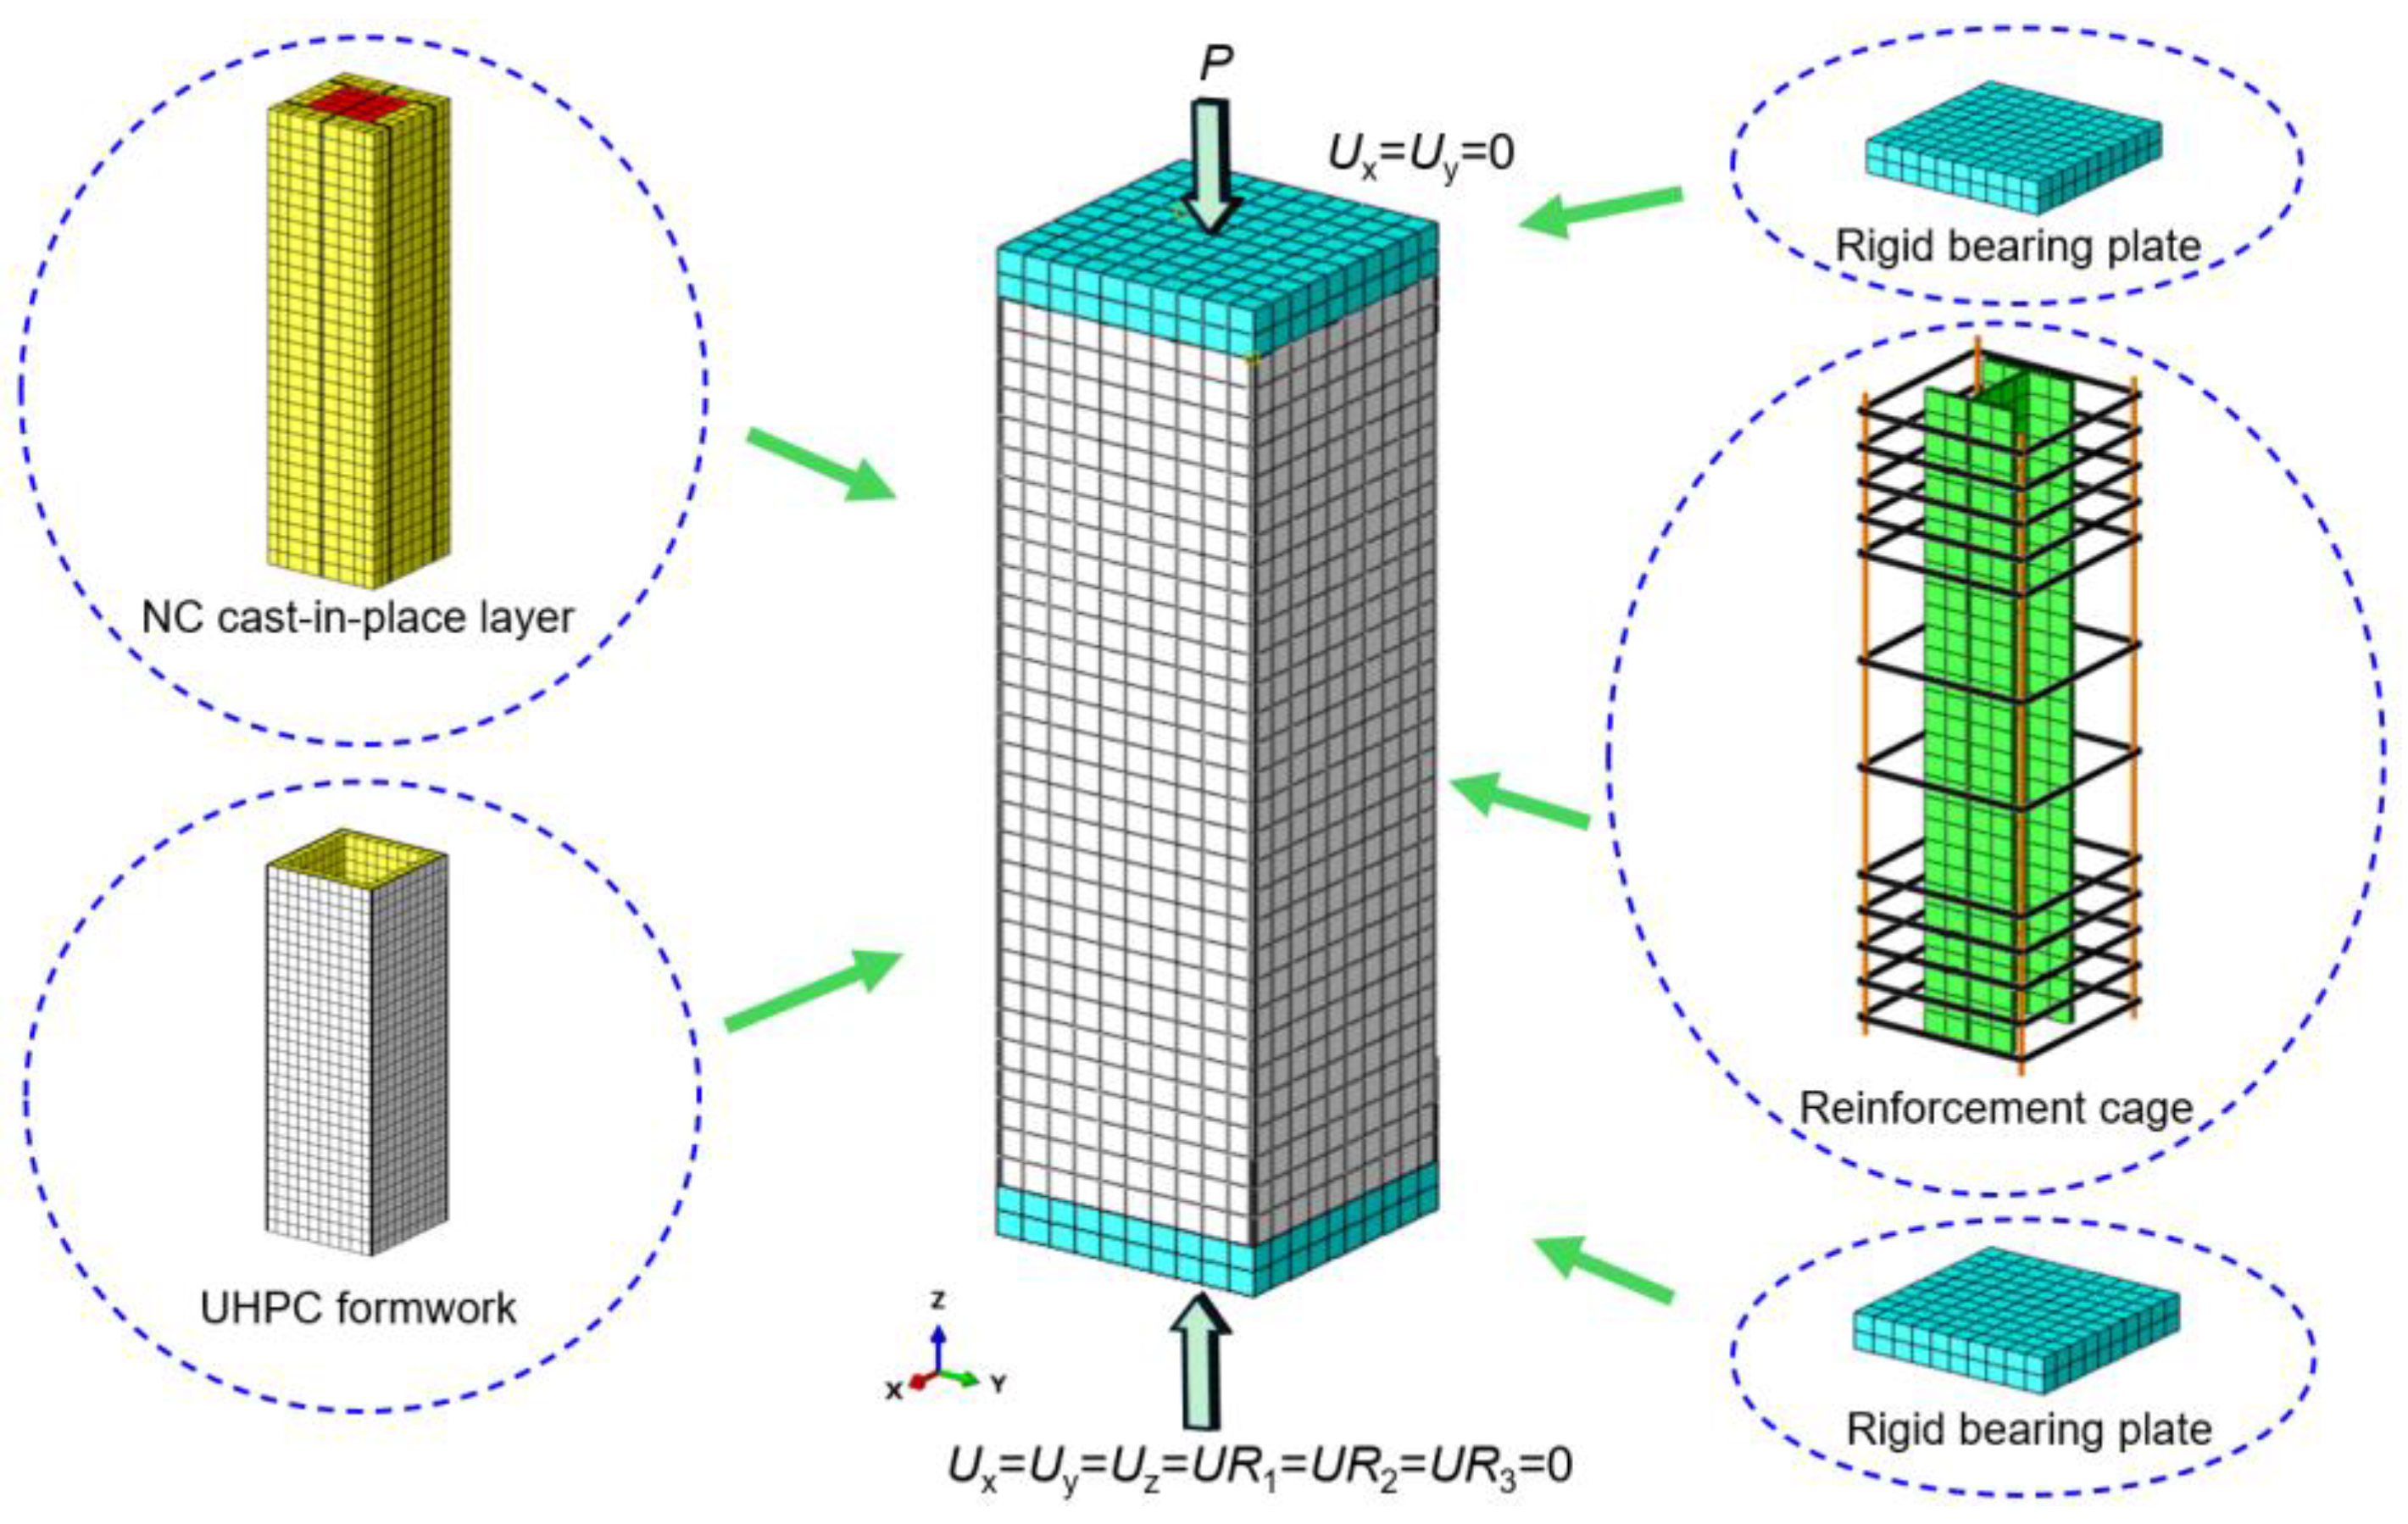
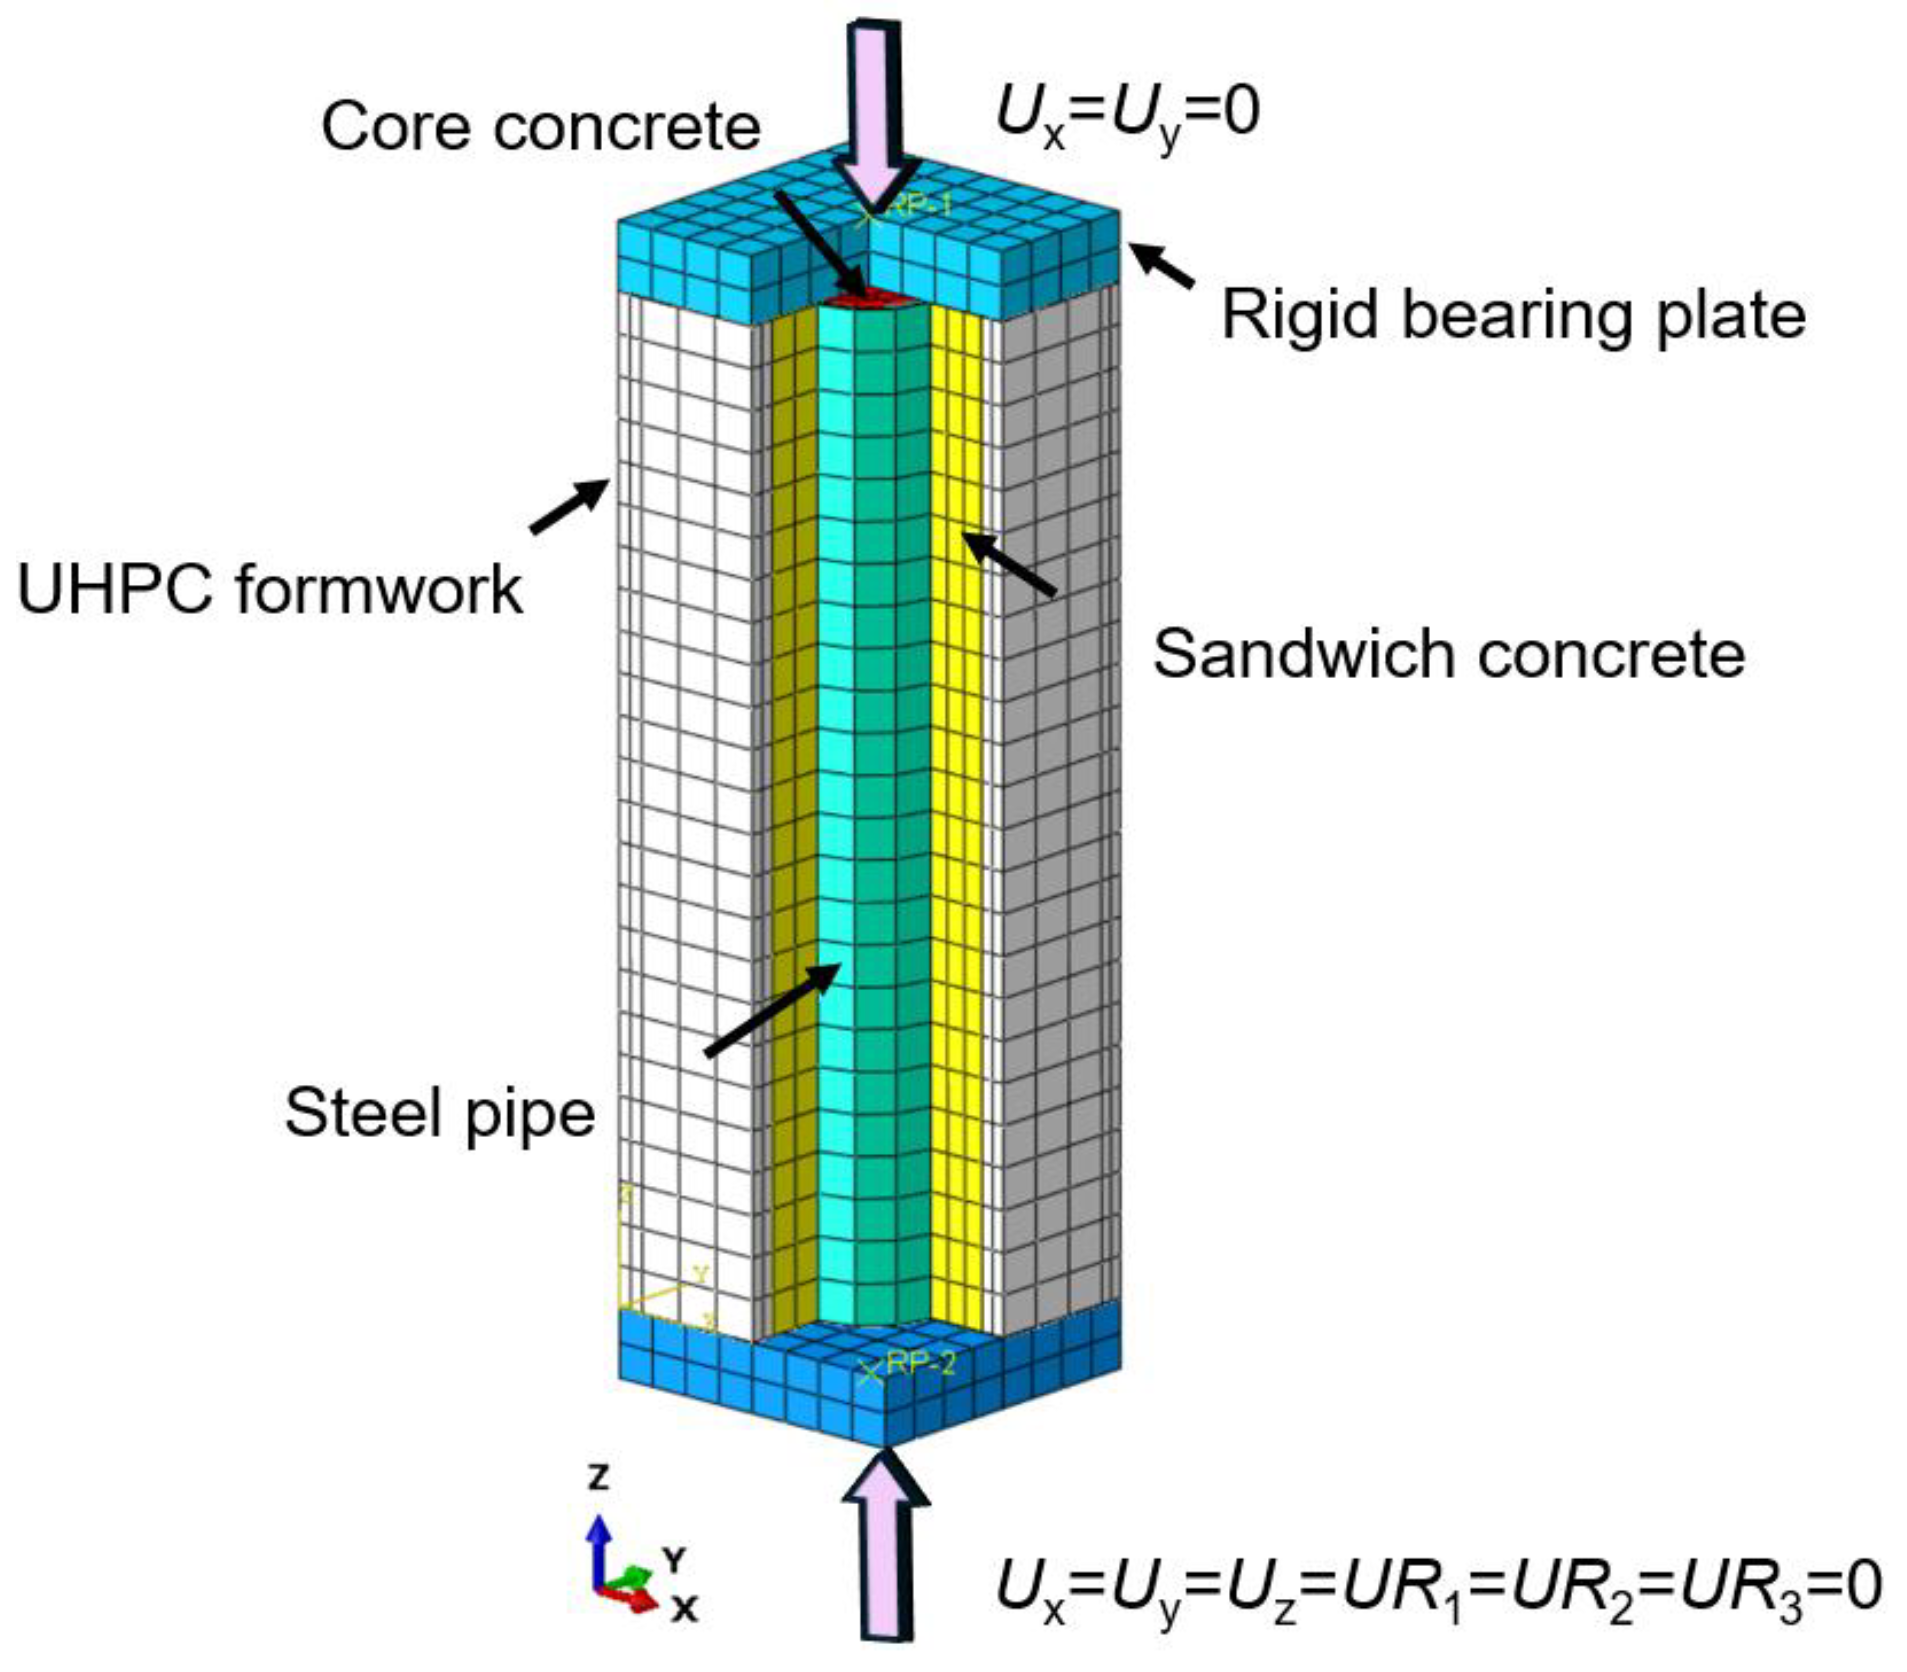
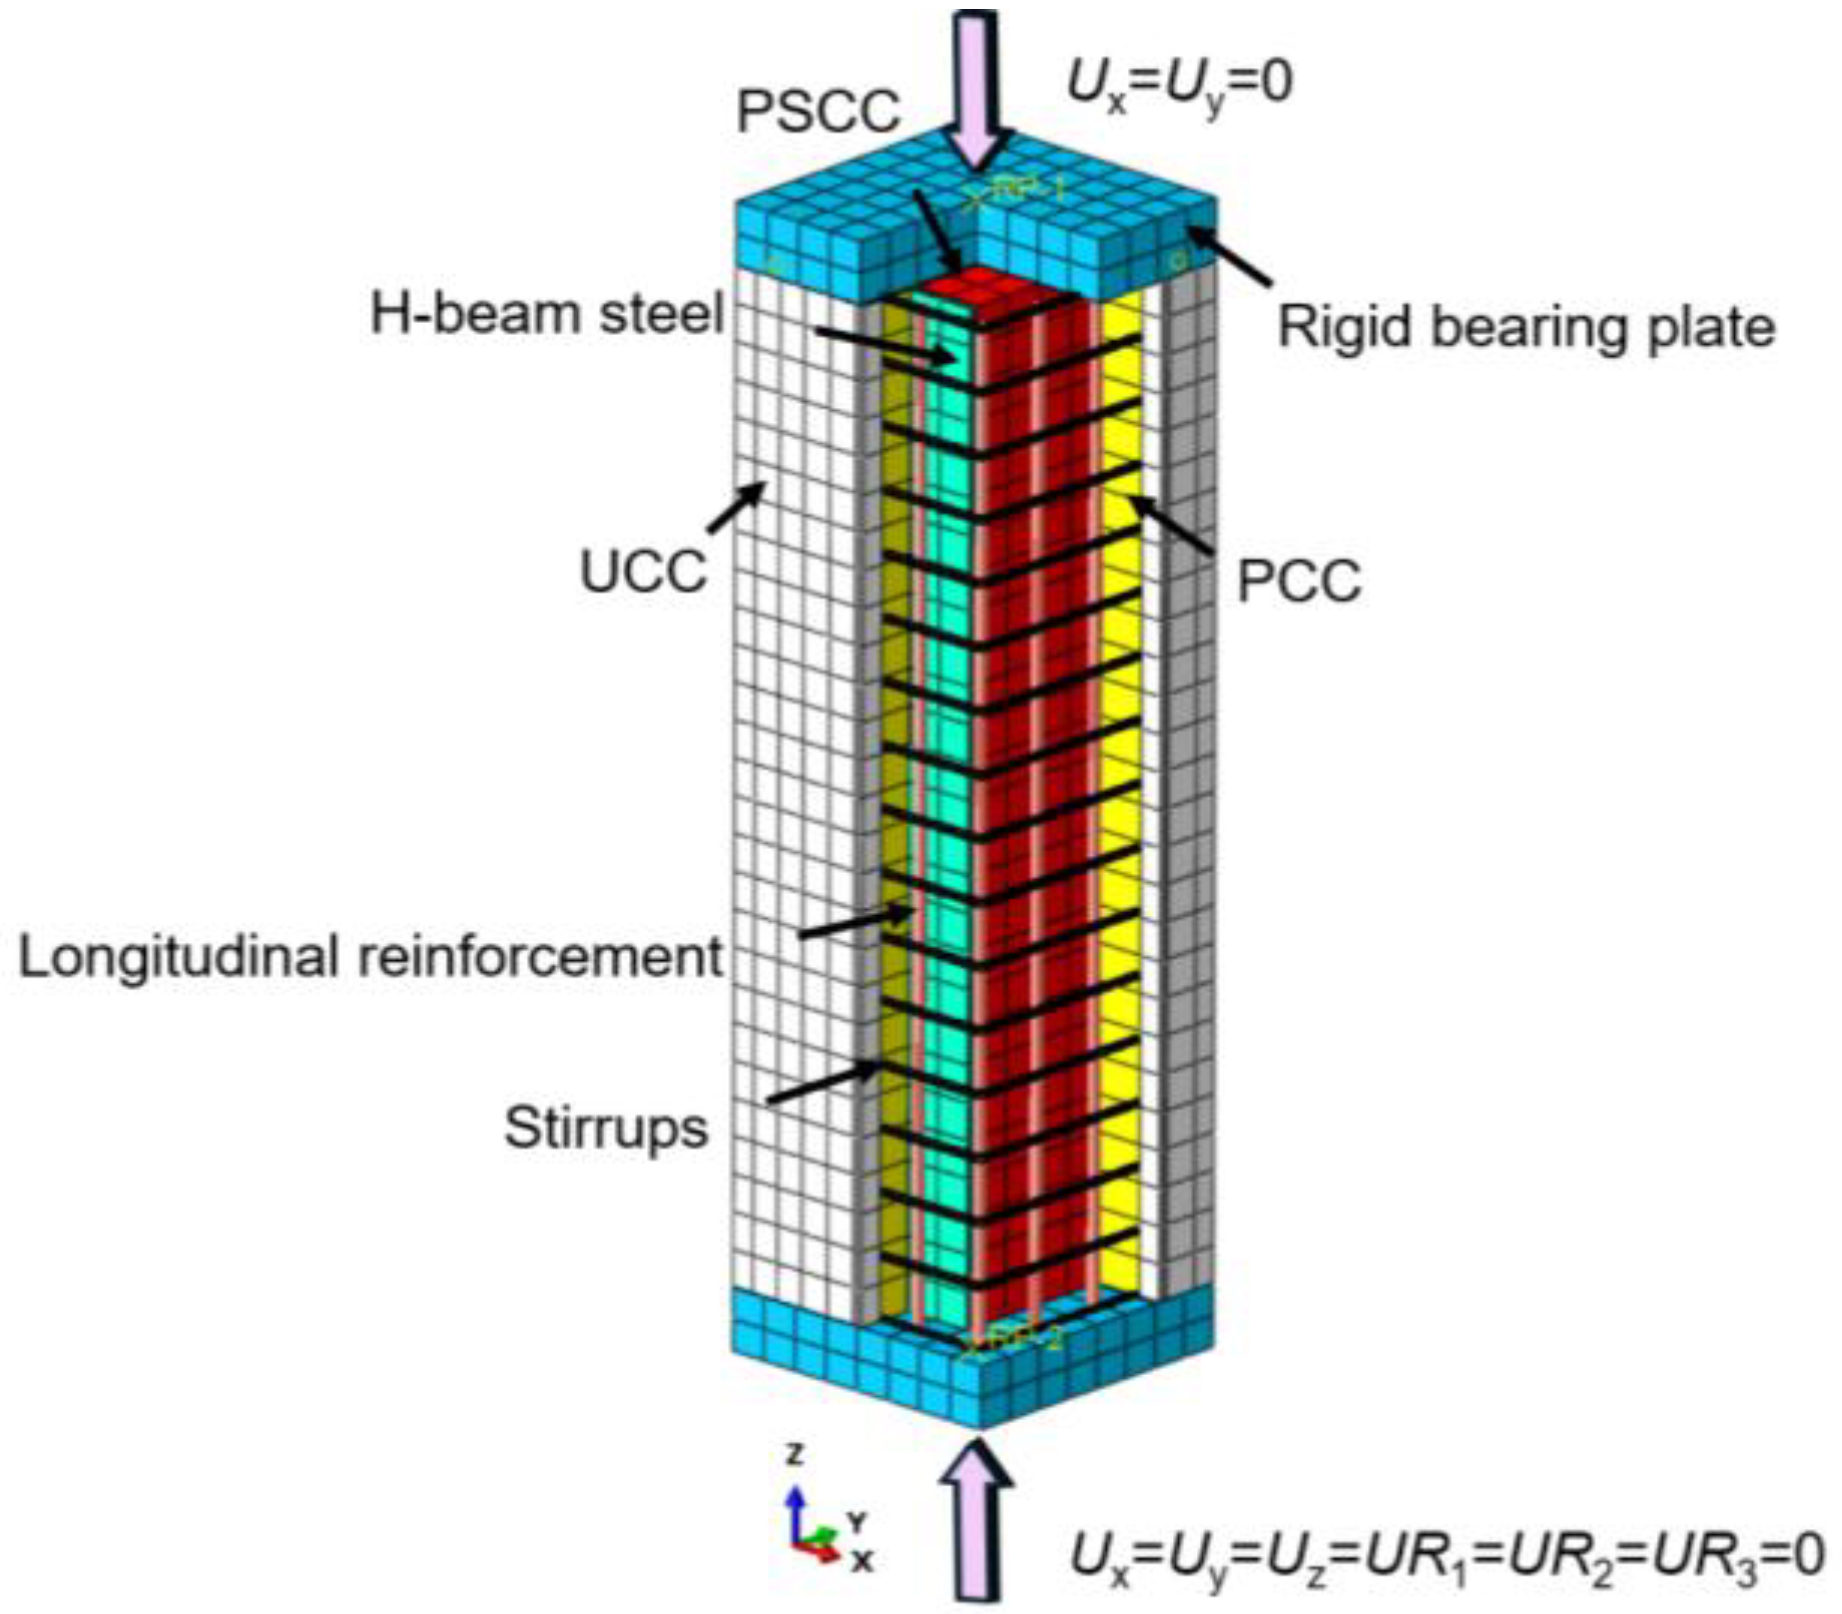
In terms of loading methods, the rigid pad at the lower end of the short column is set as a fully fixed constraint (Ux = Uy = Uz = UR1 = UR2 = UR3 = 0). The rigid pad at the upper end is supported by a sliding hinge (Ux = Uy = 0), and a downward displacement of 20 mm is applied at the reference point of the pad.
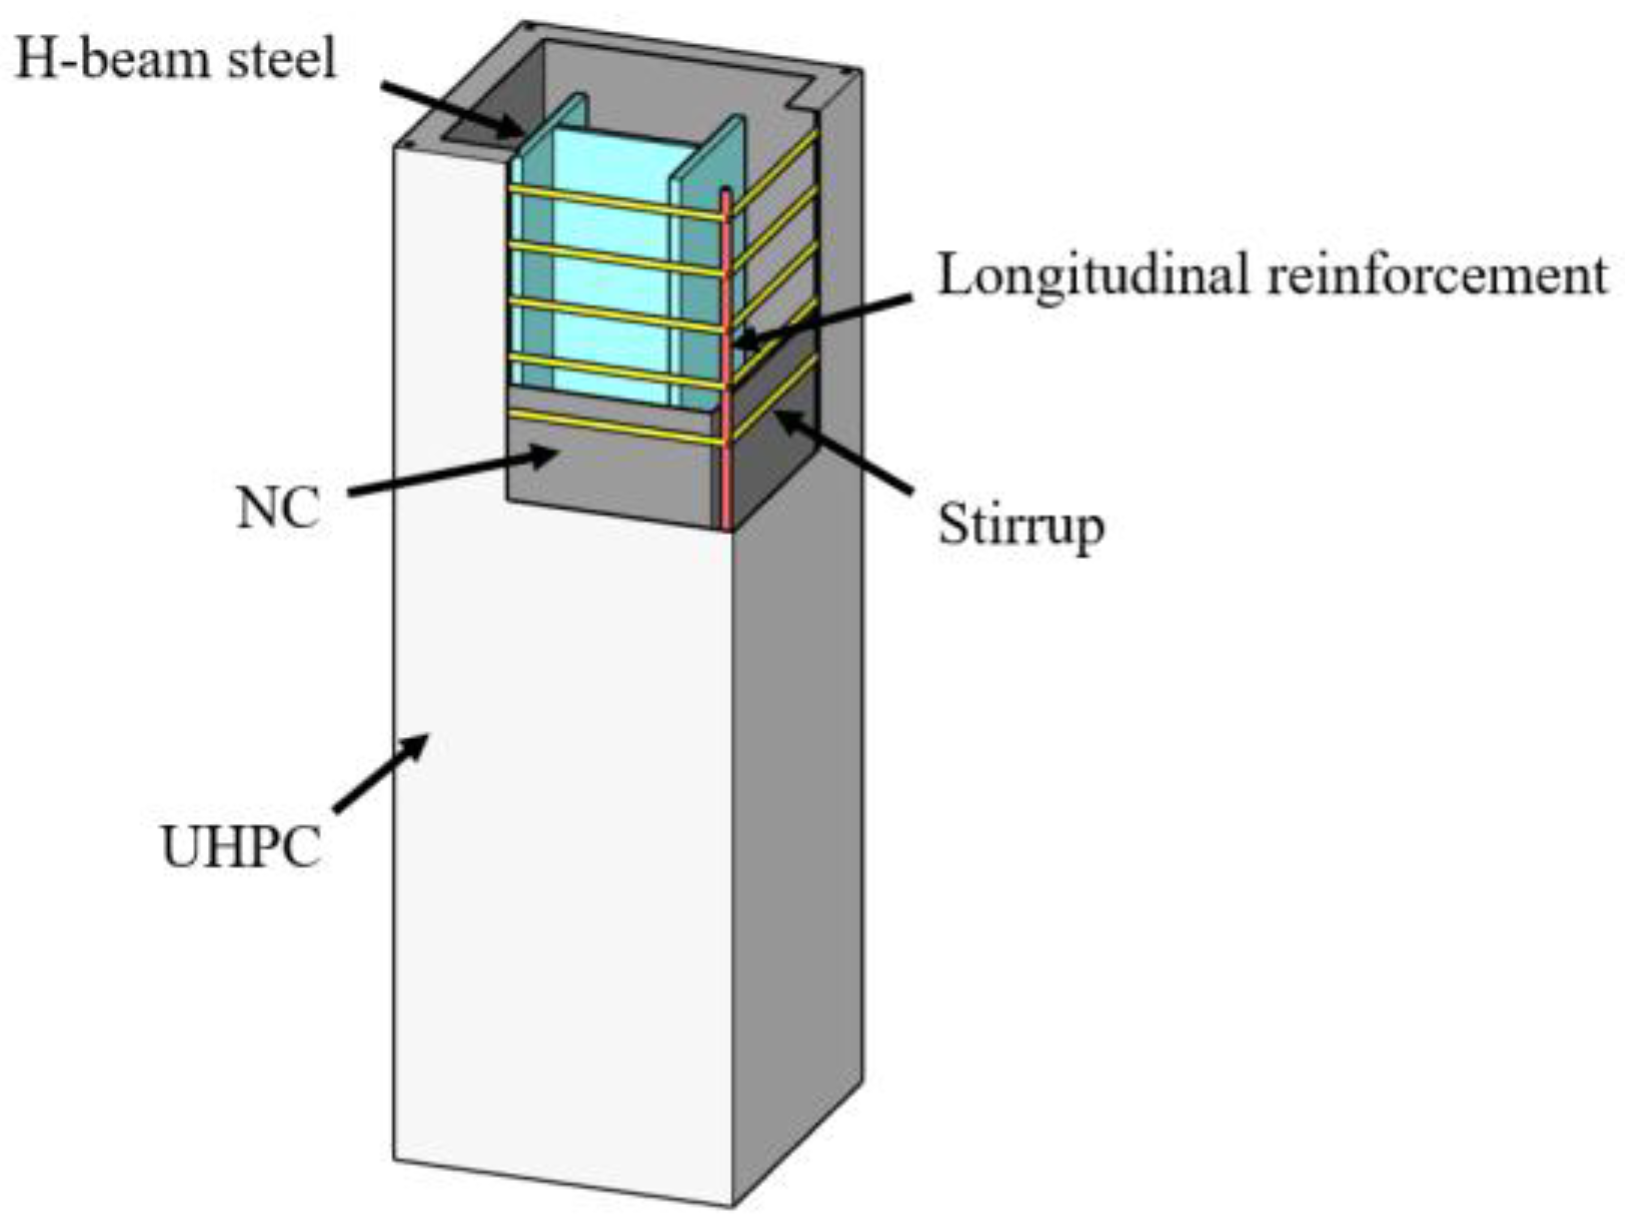
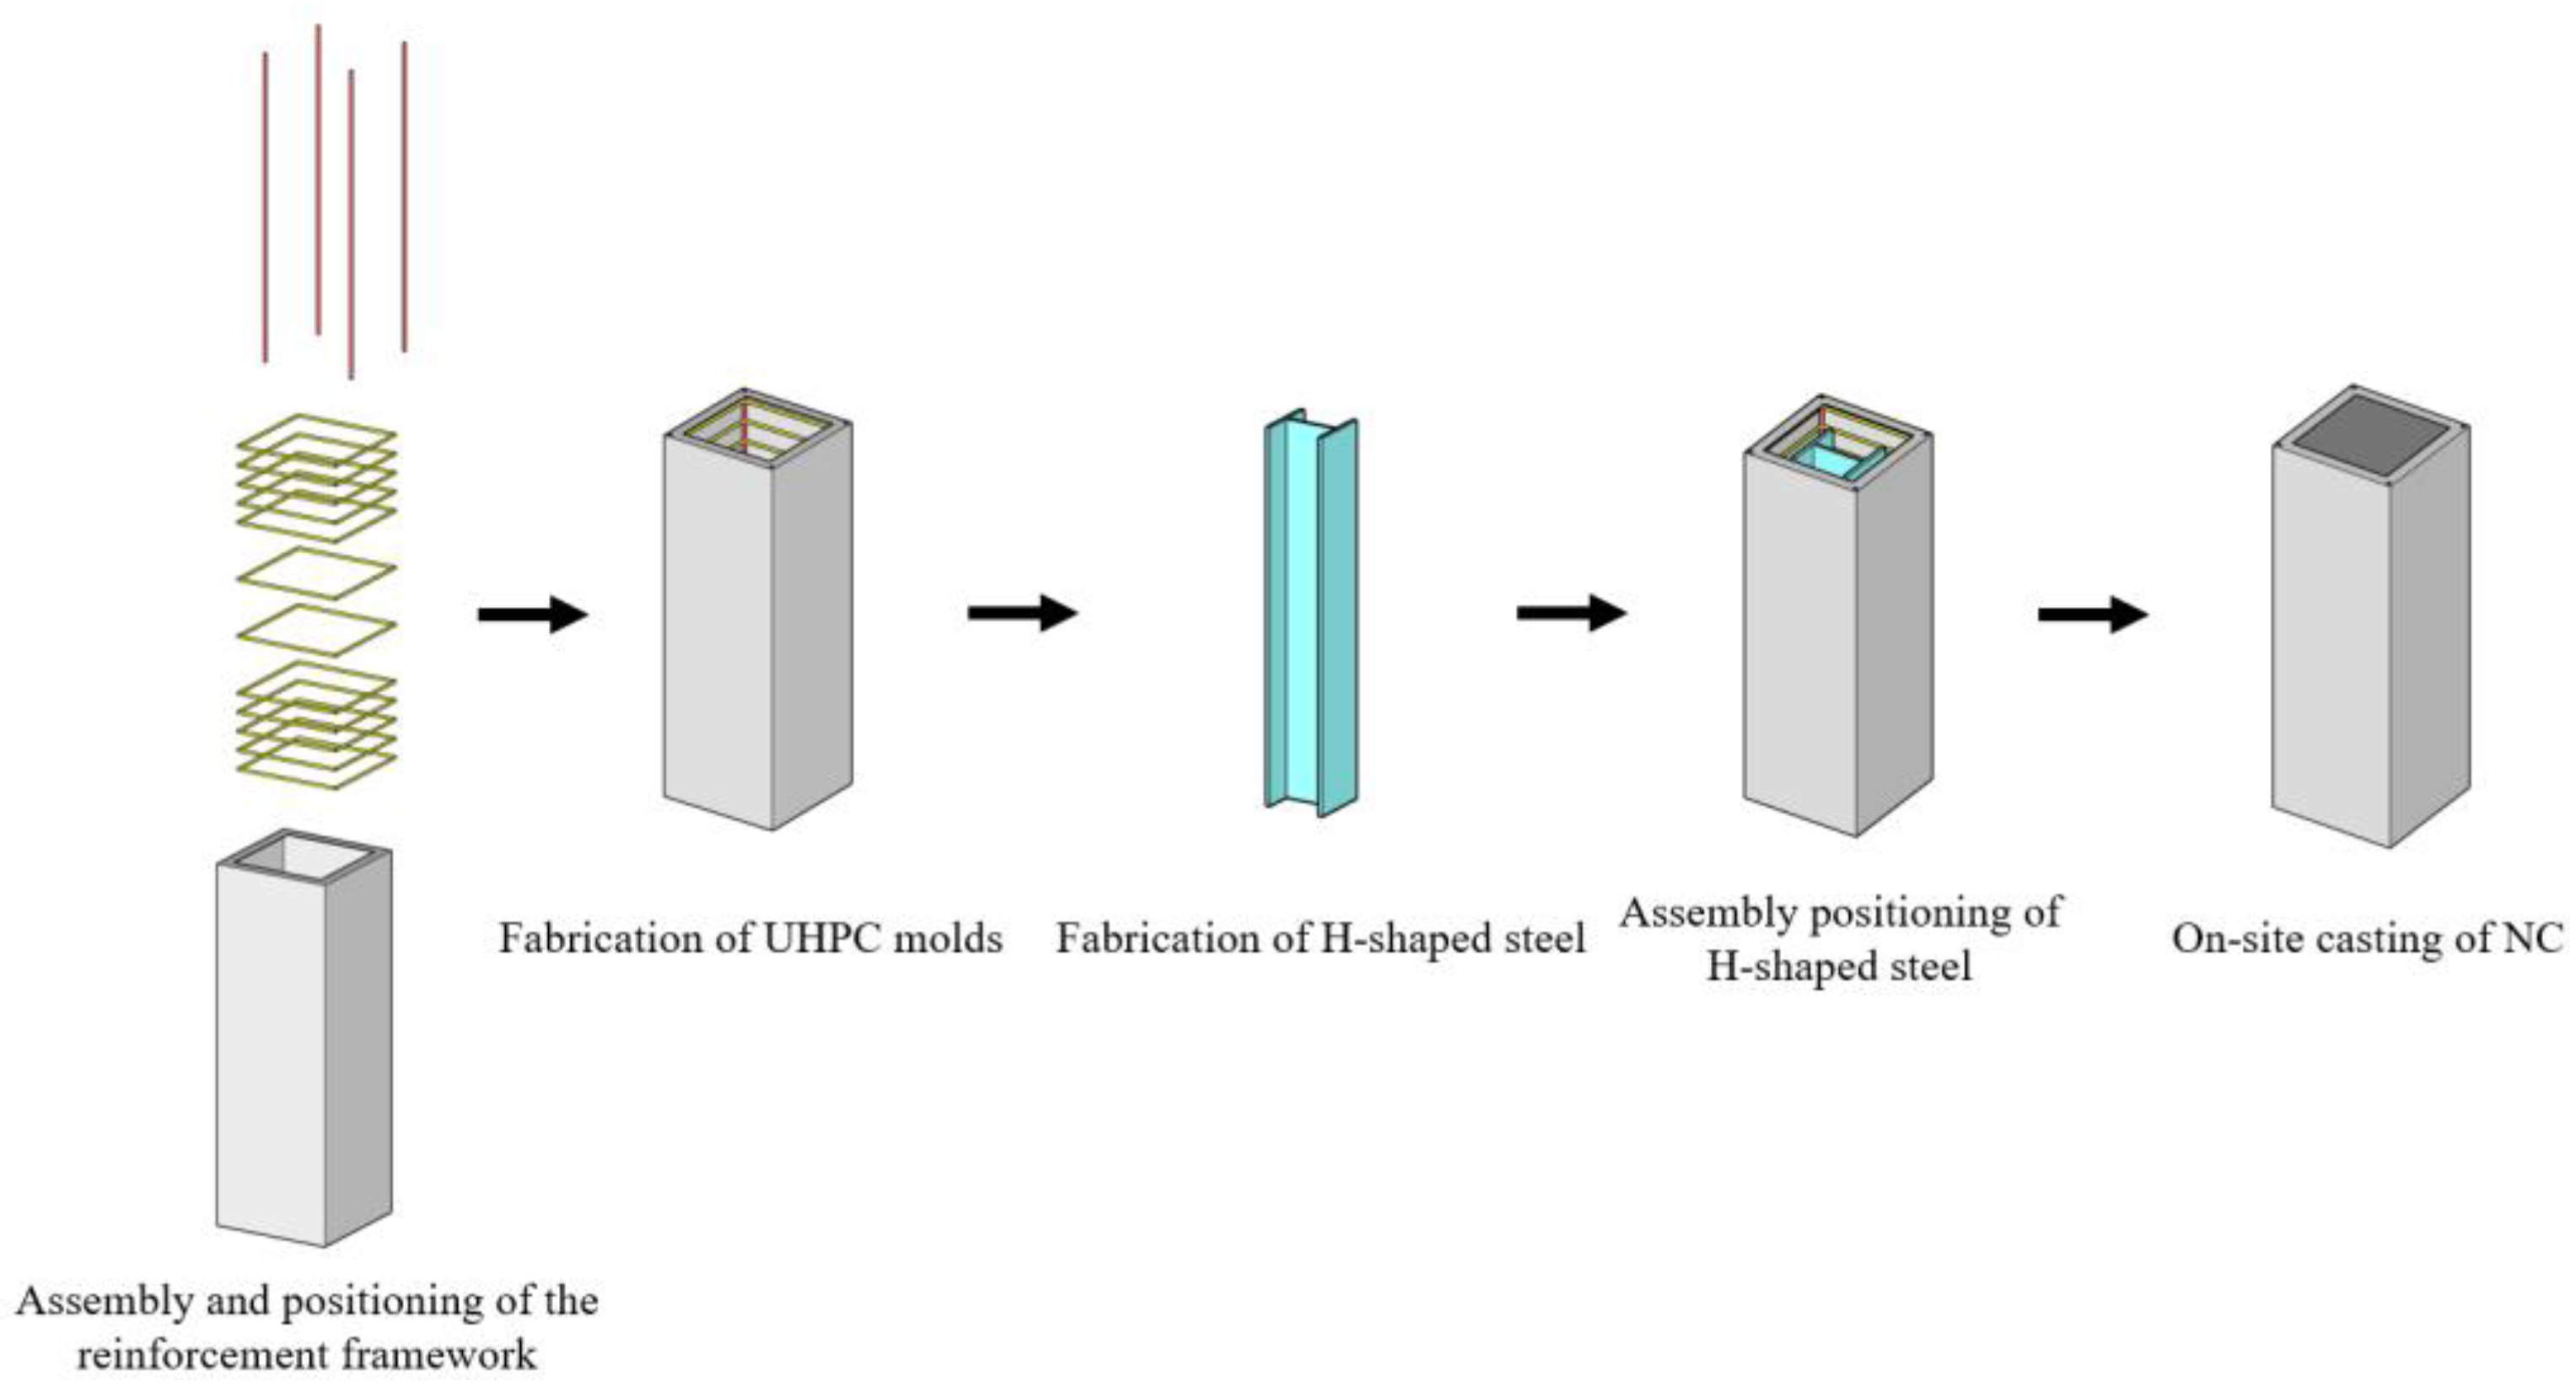
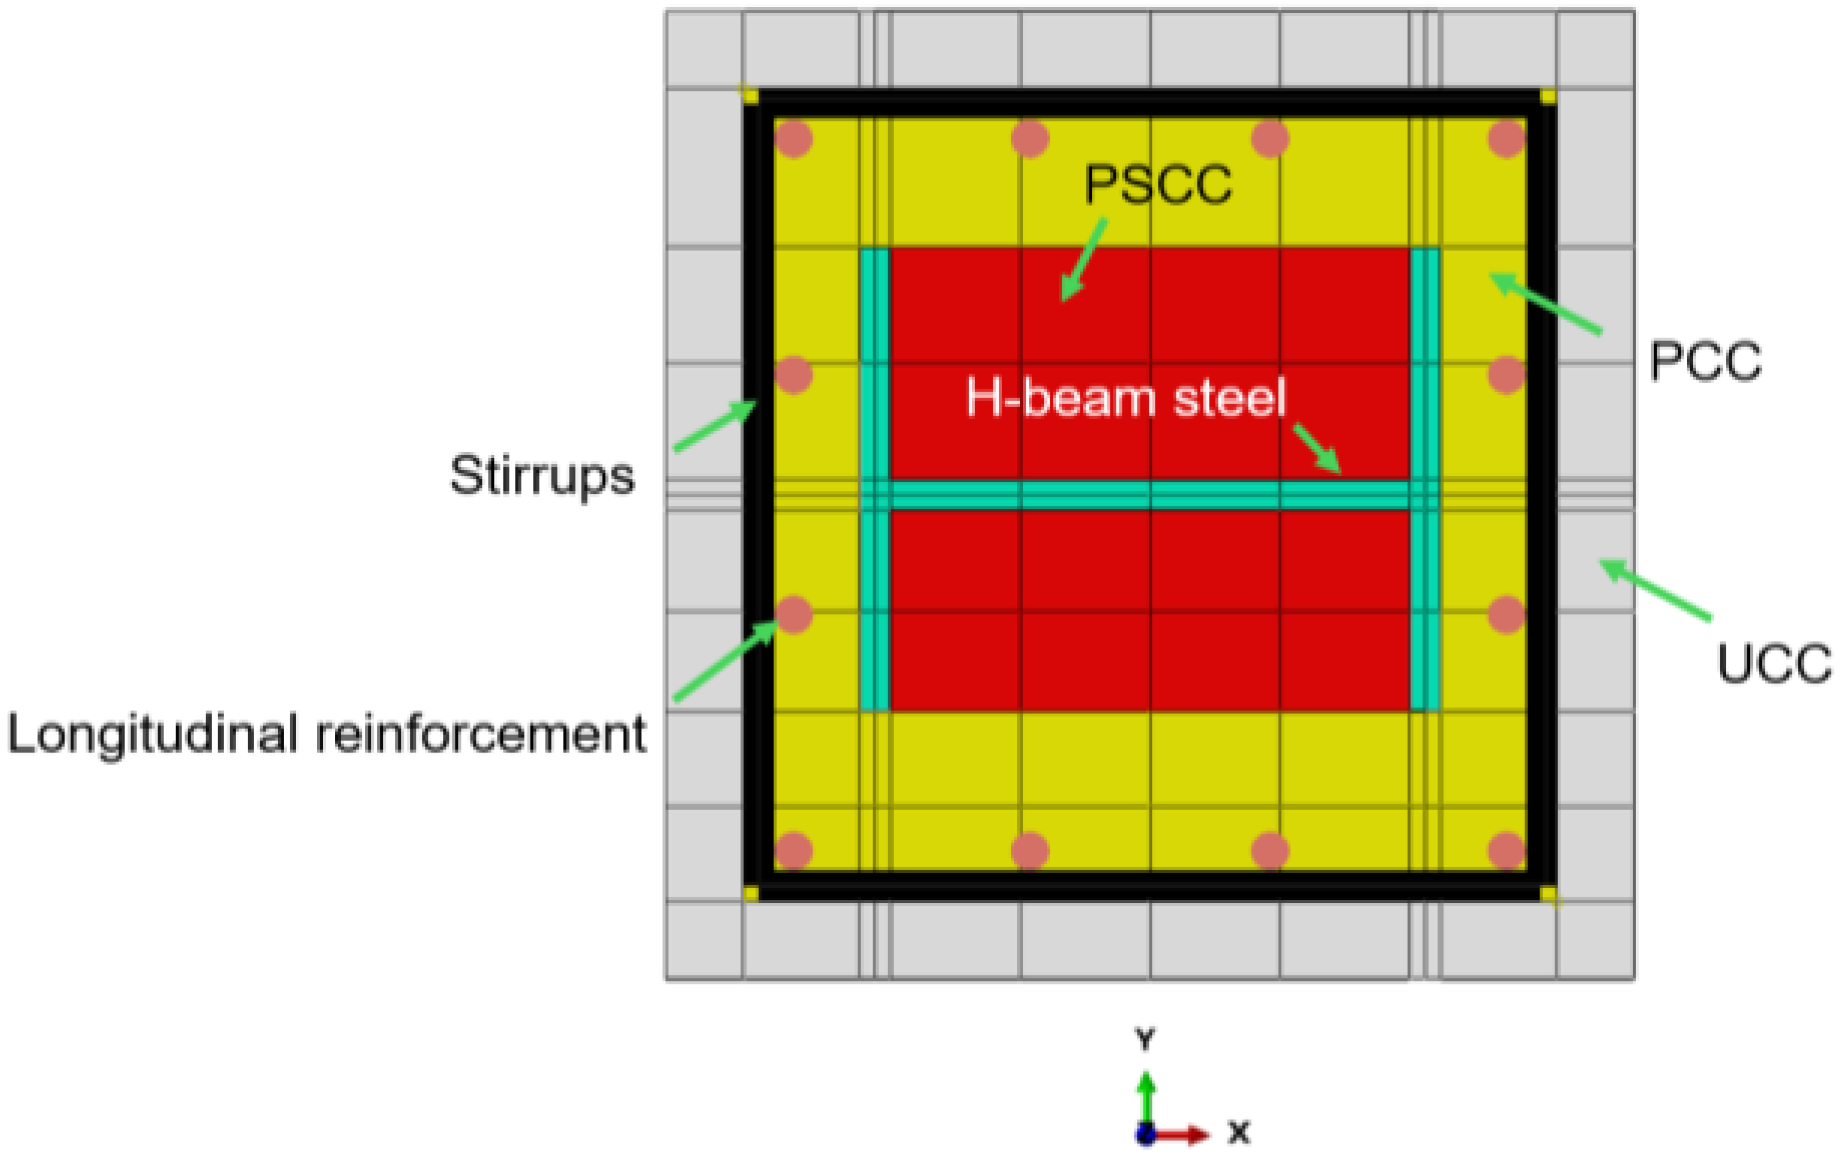
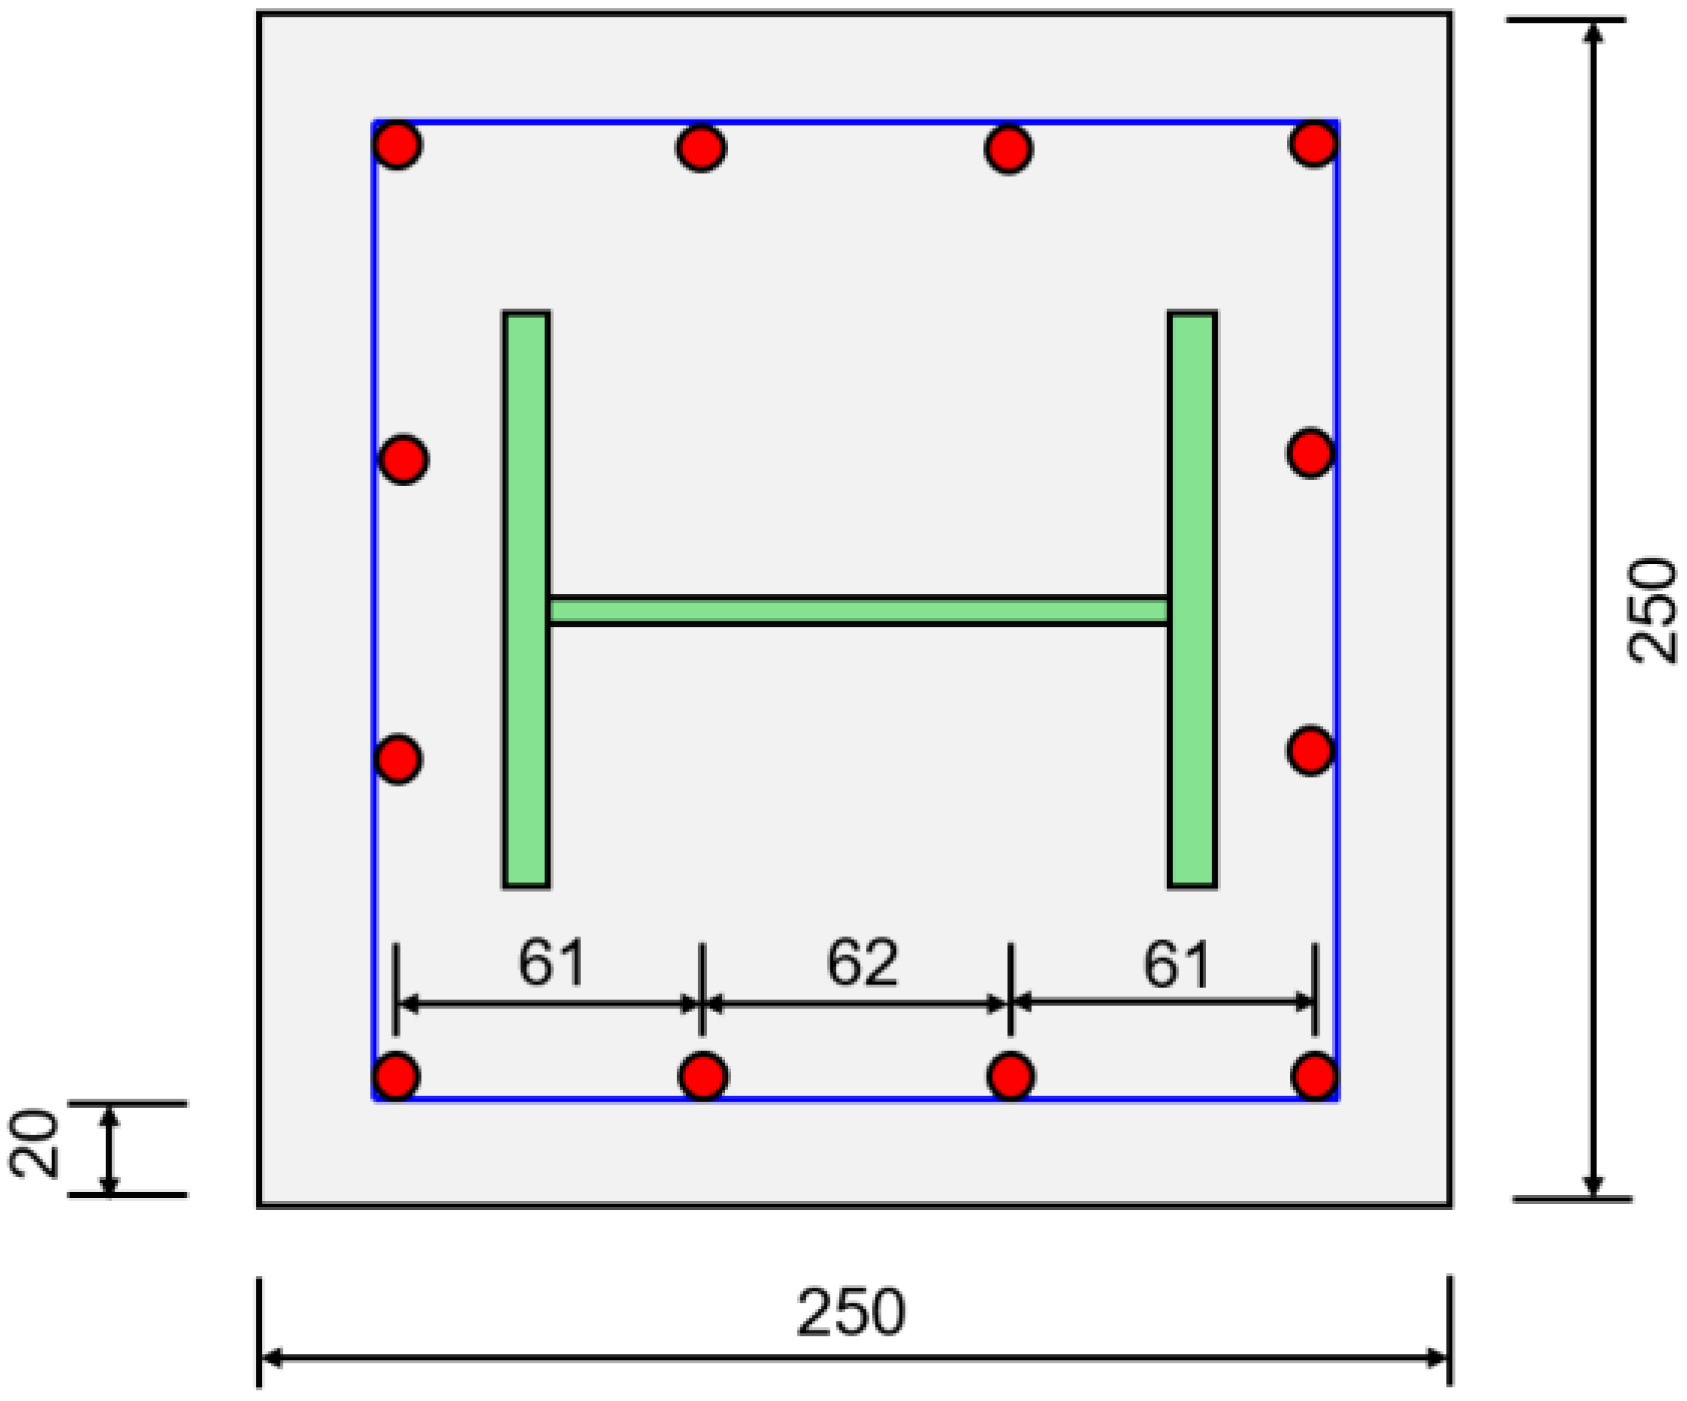
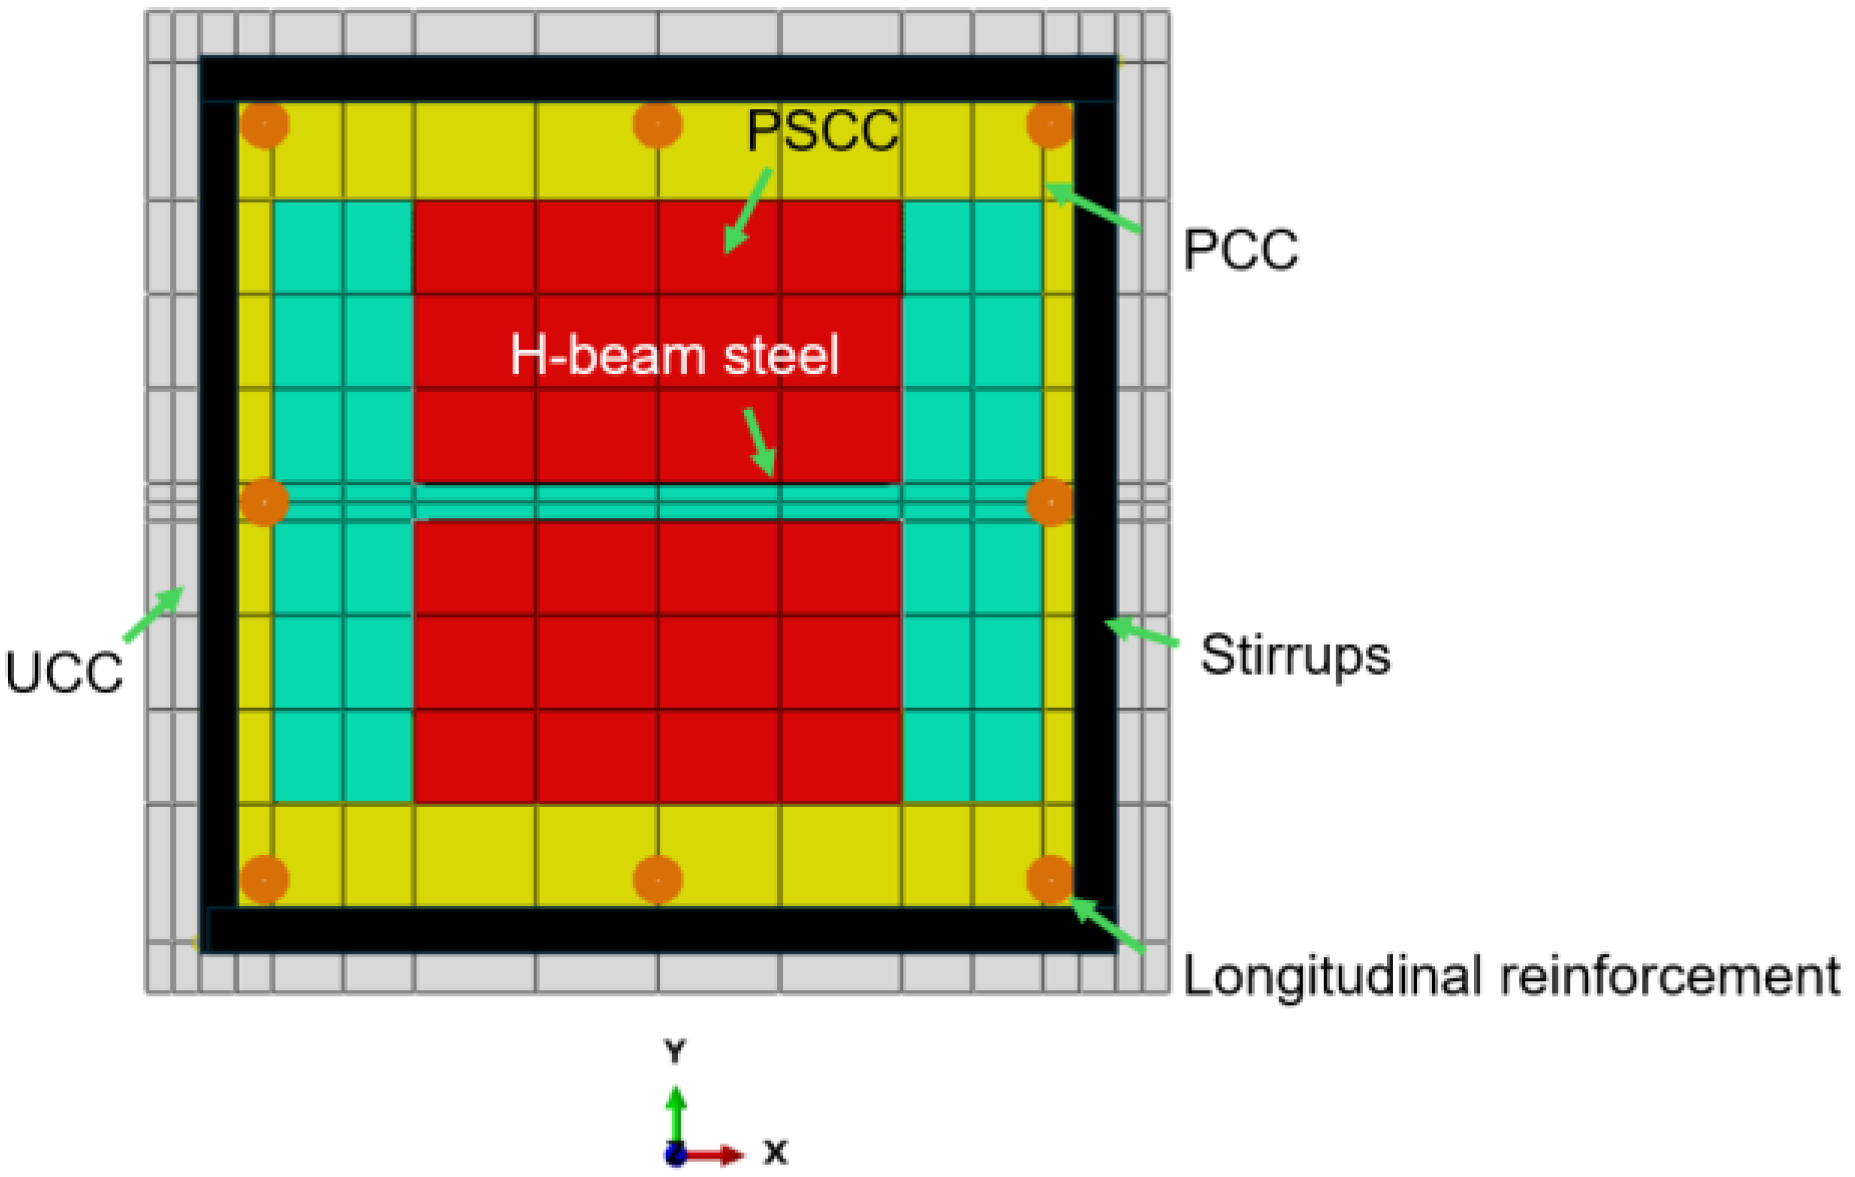
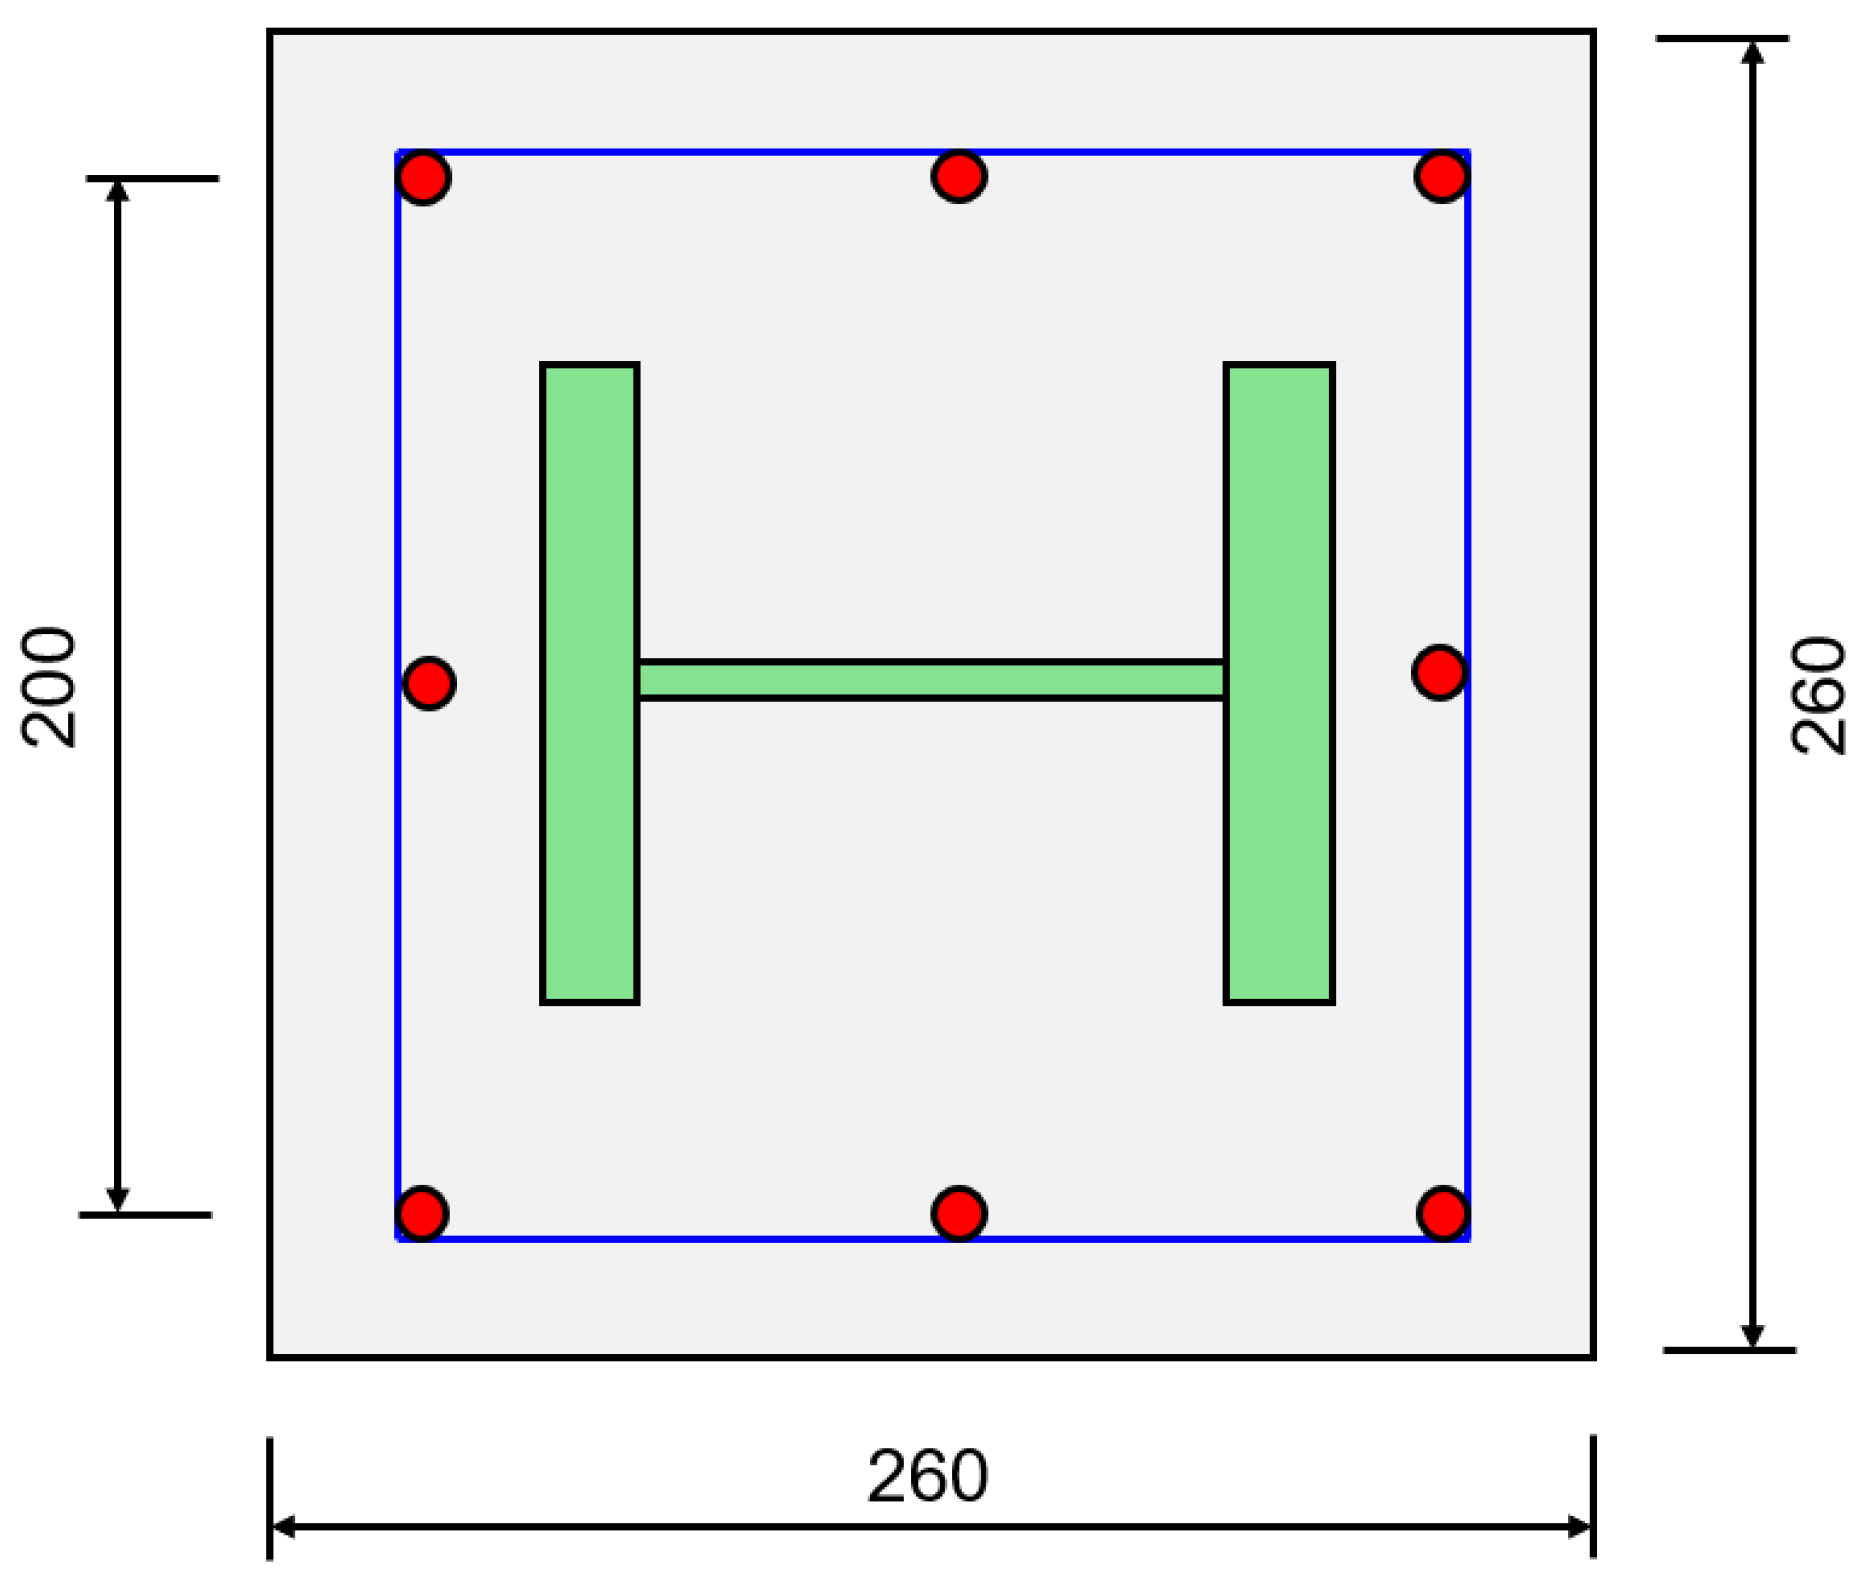
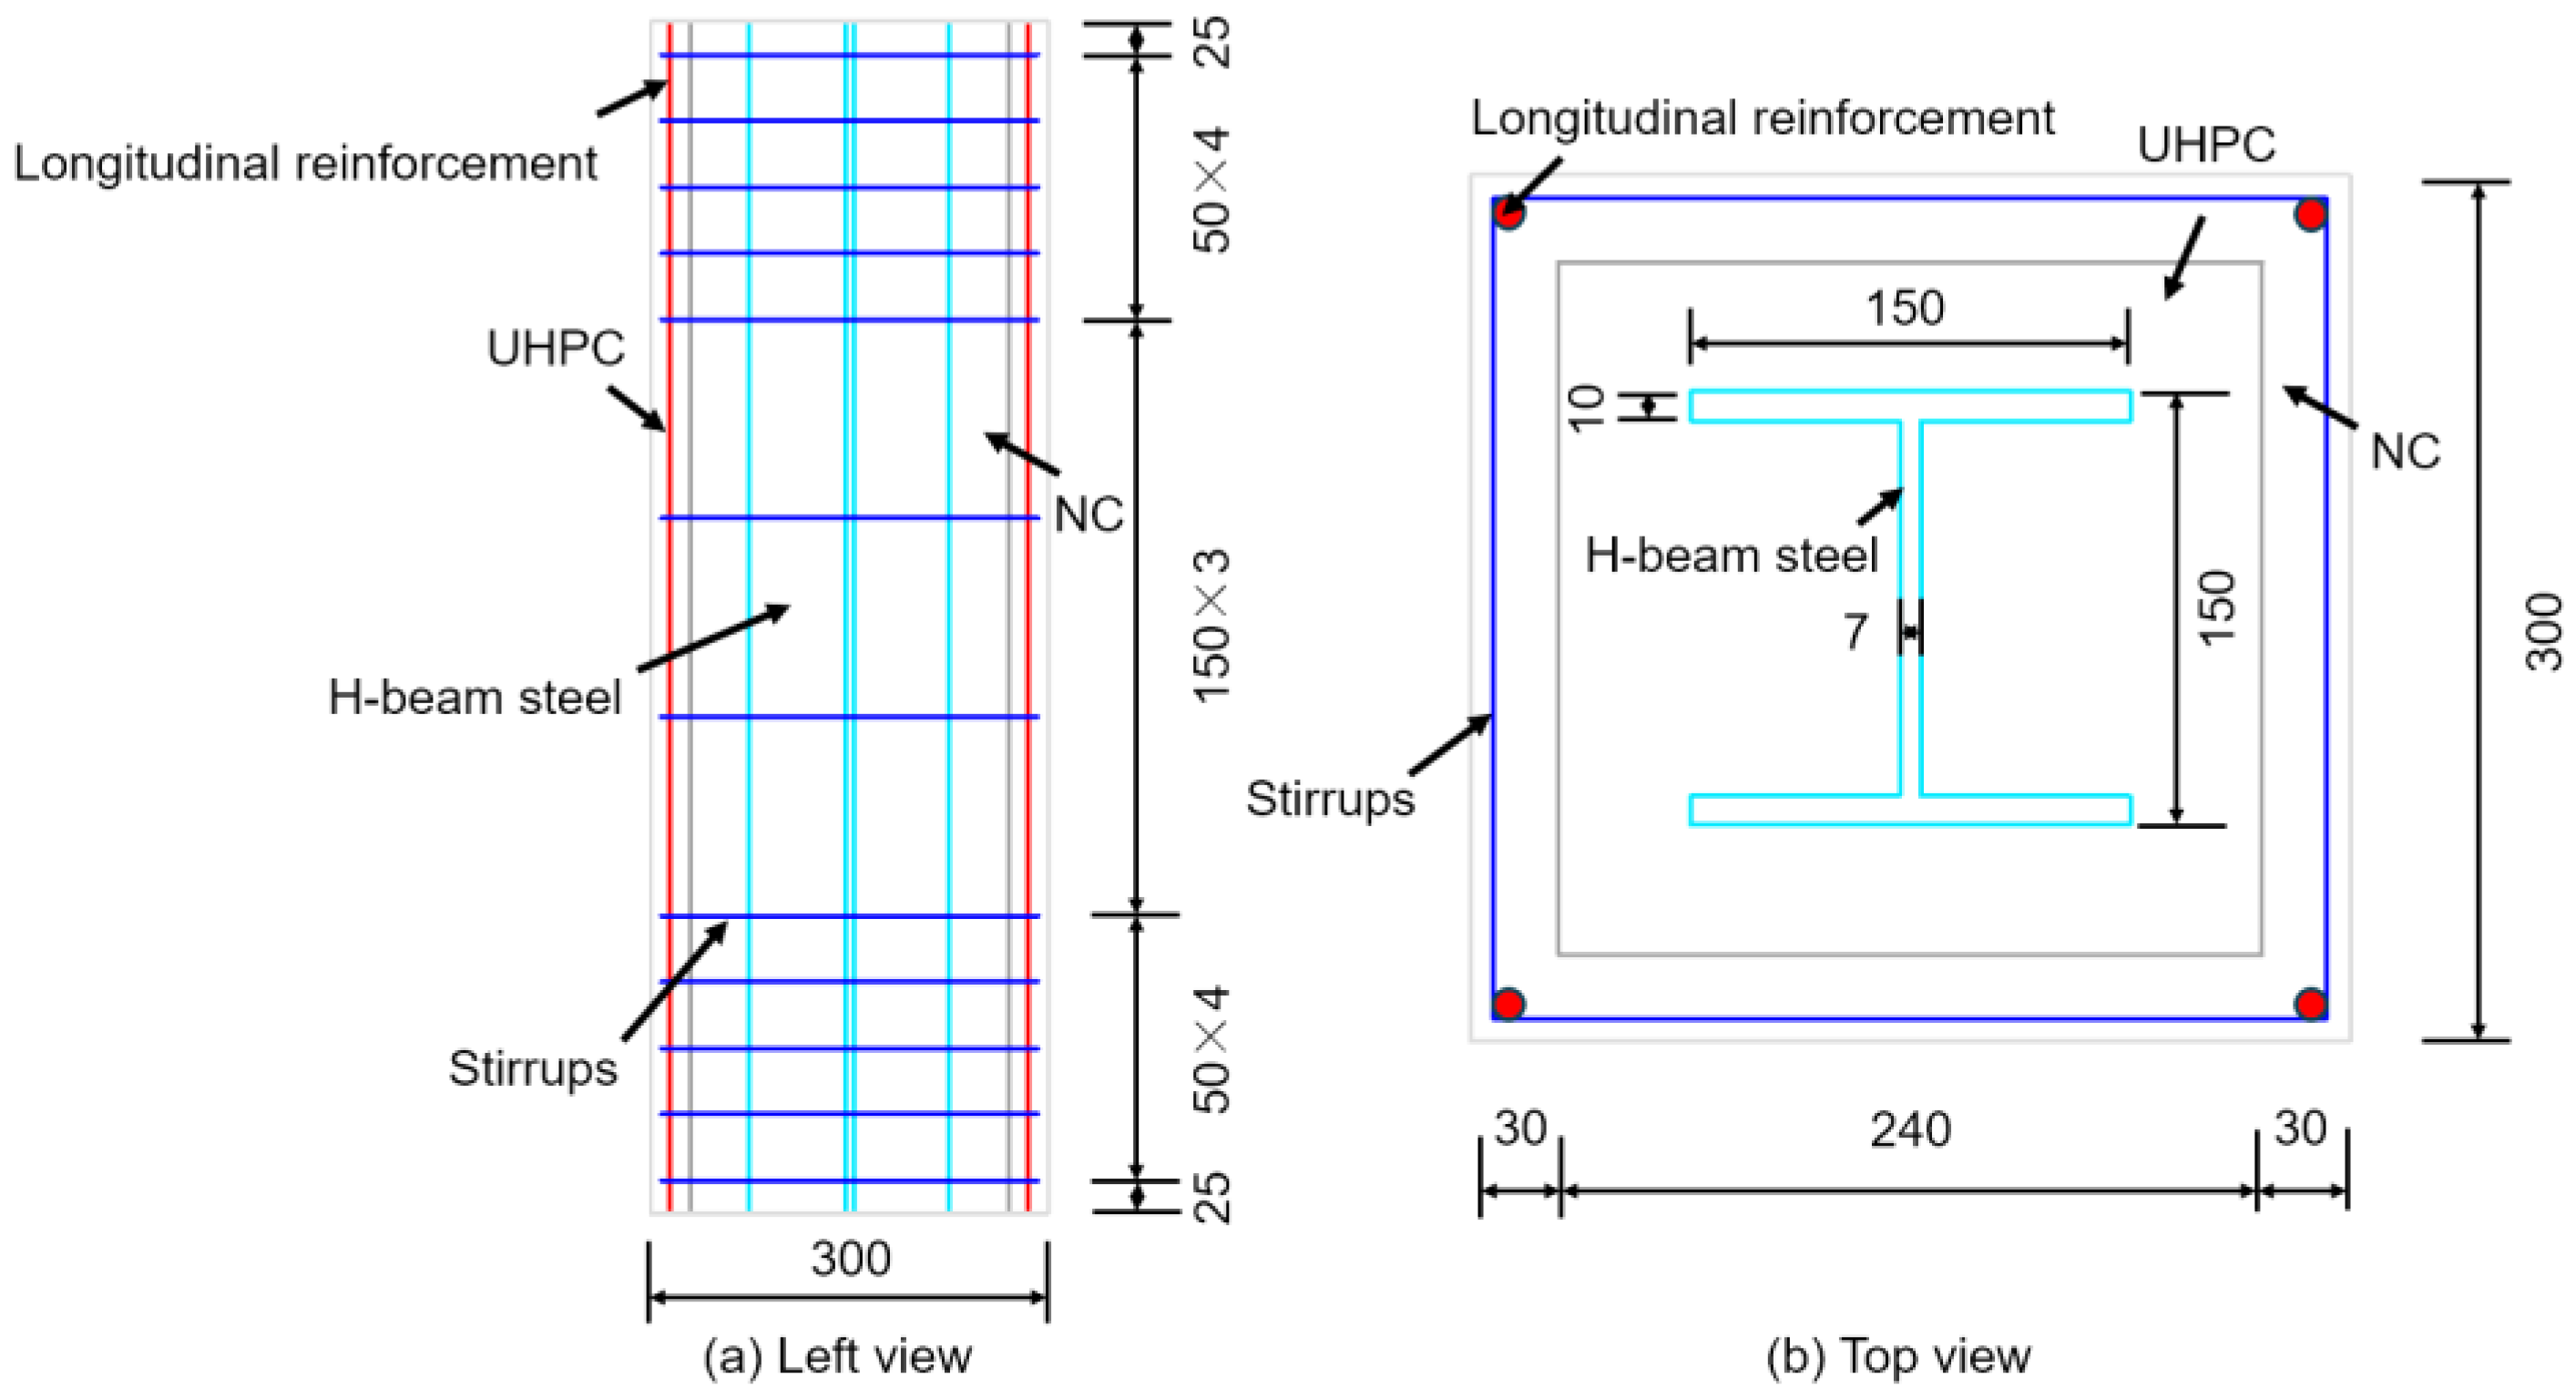
The finite element model constructed in this study enhances the accuracy and reliability of UHPC-SRC short column analysis by appropriately handling contact surfaces, uniformly discretizing the mesh, and effectively setting loading and support conditions. This model not only provides a reference for subsequent related research but also establishes a theoretical basis for design and optimization in practical engineering applications. The geometric model of the UHPC-SRC short column primarily consists of a UHPC formwork and a cast-in-place NC layer. The model includes longitudinal reinforcement, stirrups, and H-shaped steel, along with upper and lower rigid base plates, collectively forming the complete structure, as shown in
Figure 11. In the ABAQUS software, after creating the longitudinal reinforcement and stirrup components, it is necessary to select all reinforcement components in the assembly module, generate their instances, and merge them while maintaining the intersection boundaries of each reinforcement. Finally, the merged reinforcement assembly is reassembled with the concrete components in the assembly module, thus preparing for subsequent analysis. According to Mirza’s division [
31] of the regions of steel-restrained concrete, the white area in the figure represents unrestrained concrete, yellow represents semi-restrained concrete, and red represents highly restrained concrete.
