Urban Metro System Network Resilience Under Waterlogging Disturbance: Connectivity-Based Measurement and Enhancement
Abstract
1. Introduction
2. Formation Progress of the UMS Network Resilience
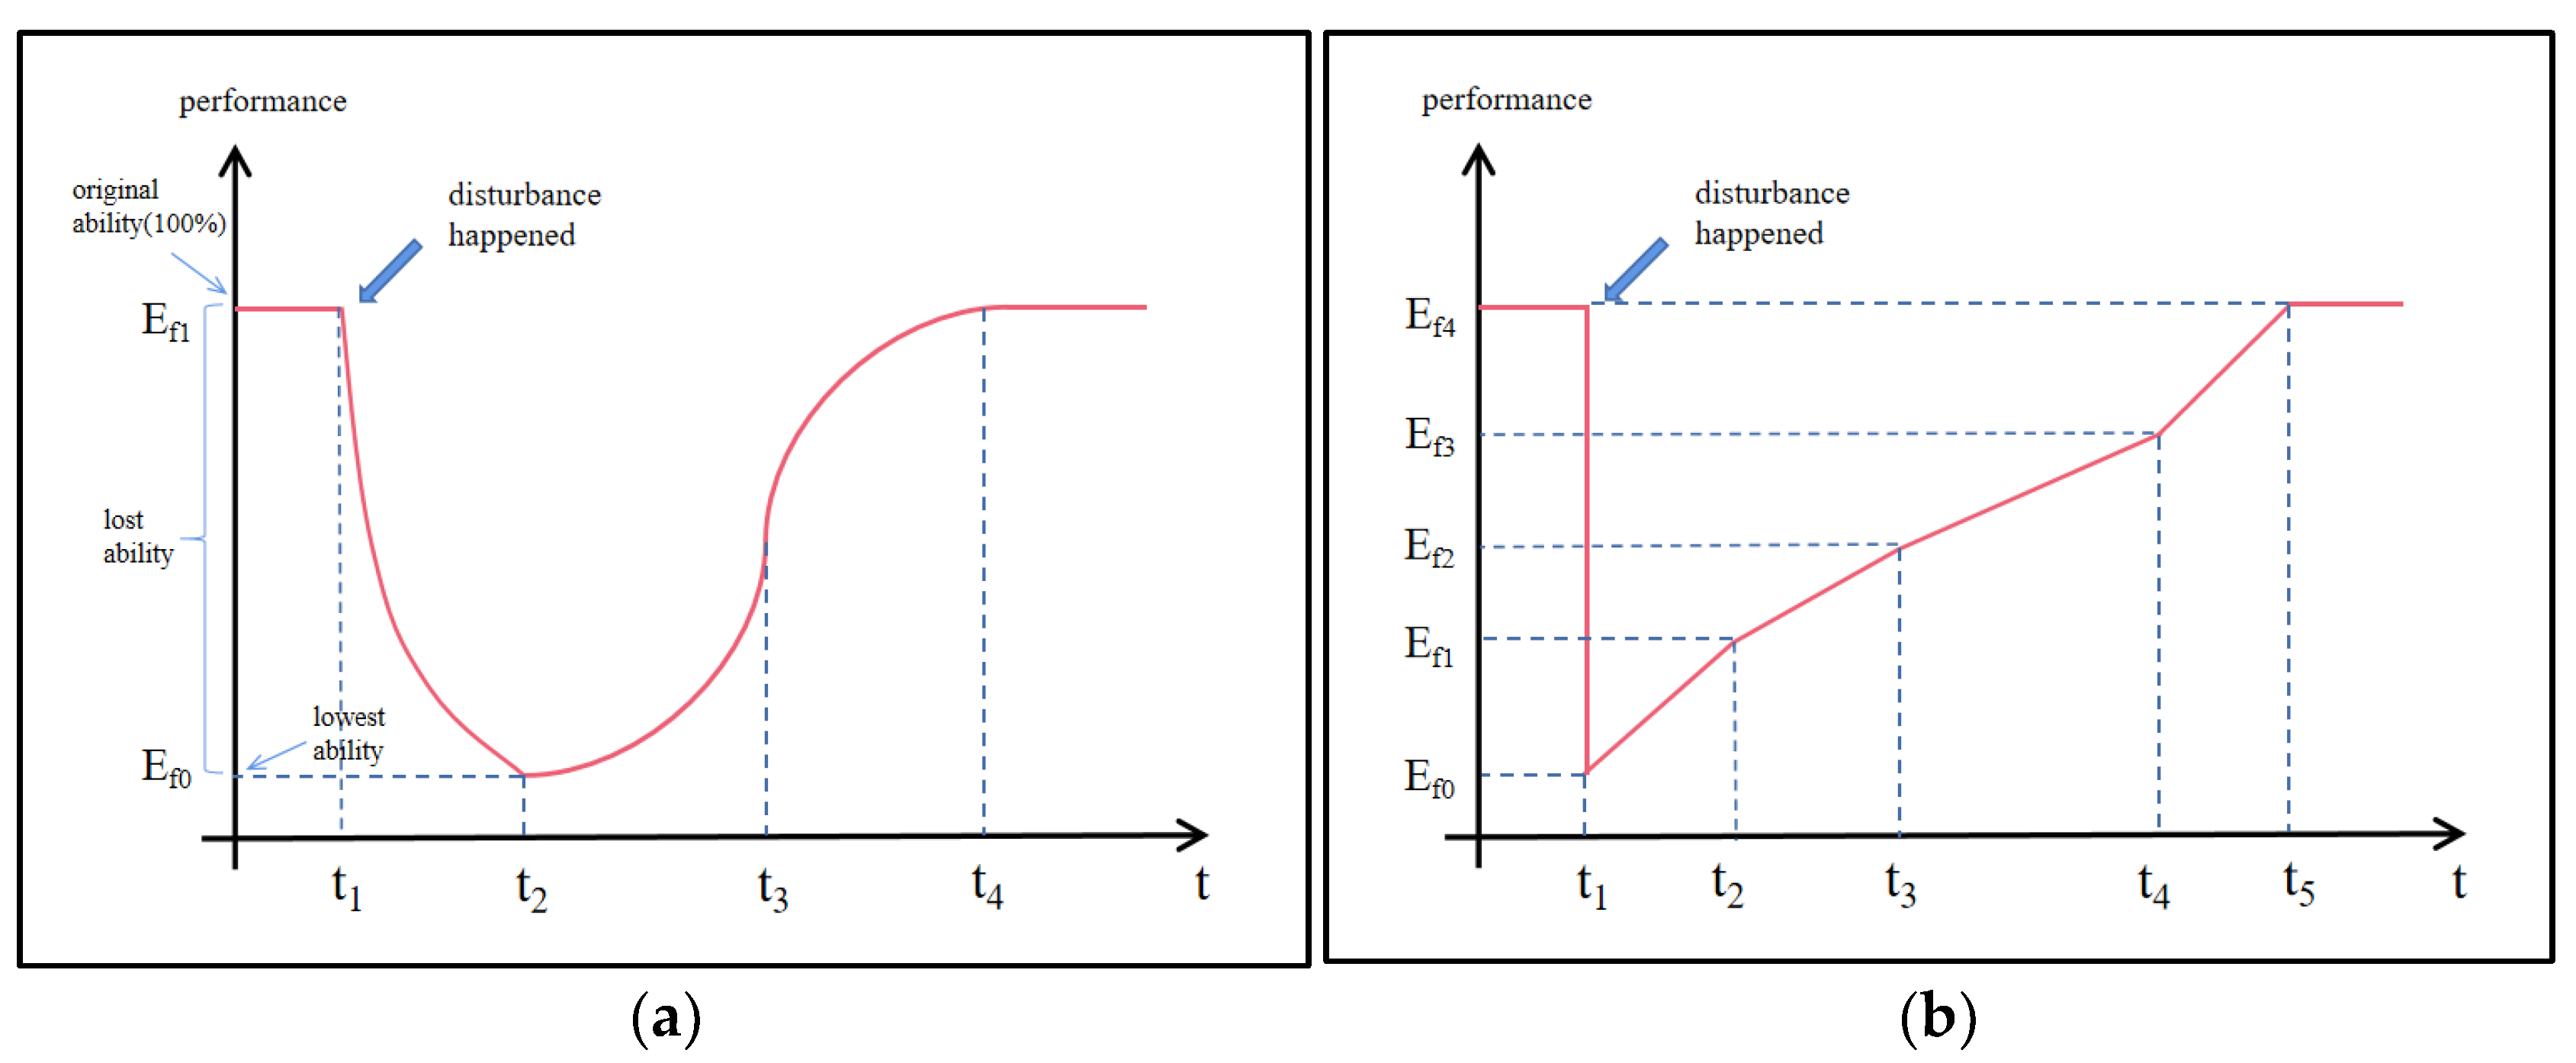
2.1. Connectivity-Based Evolution Process of the UMS Network Resilience
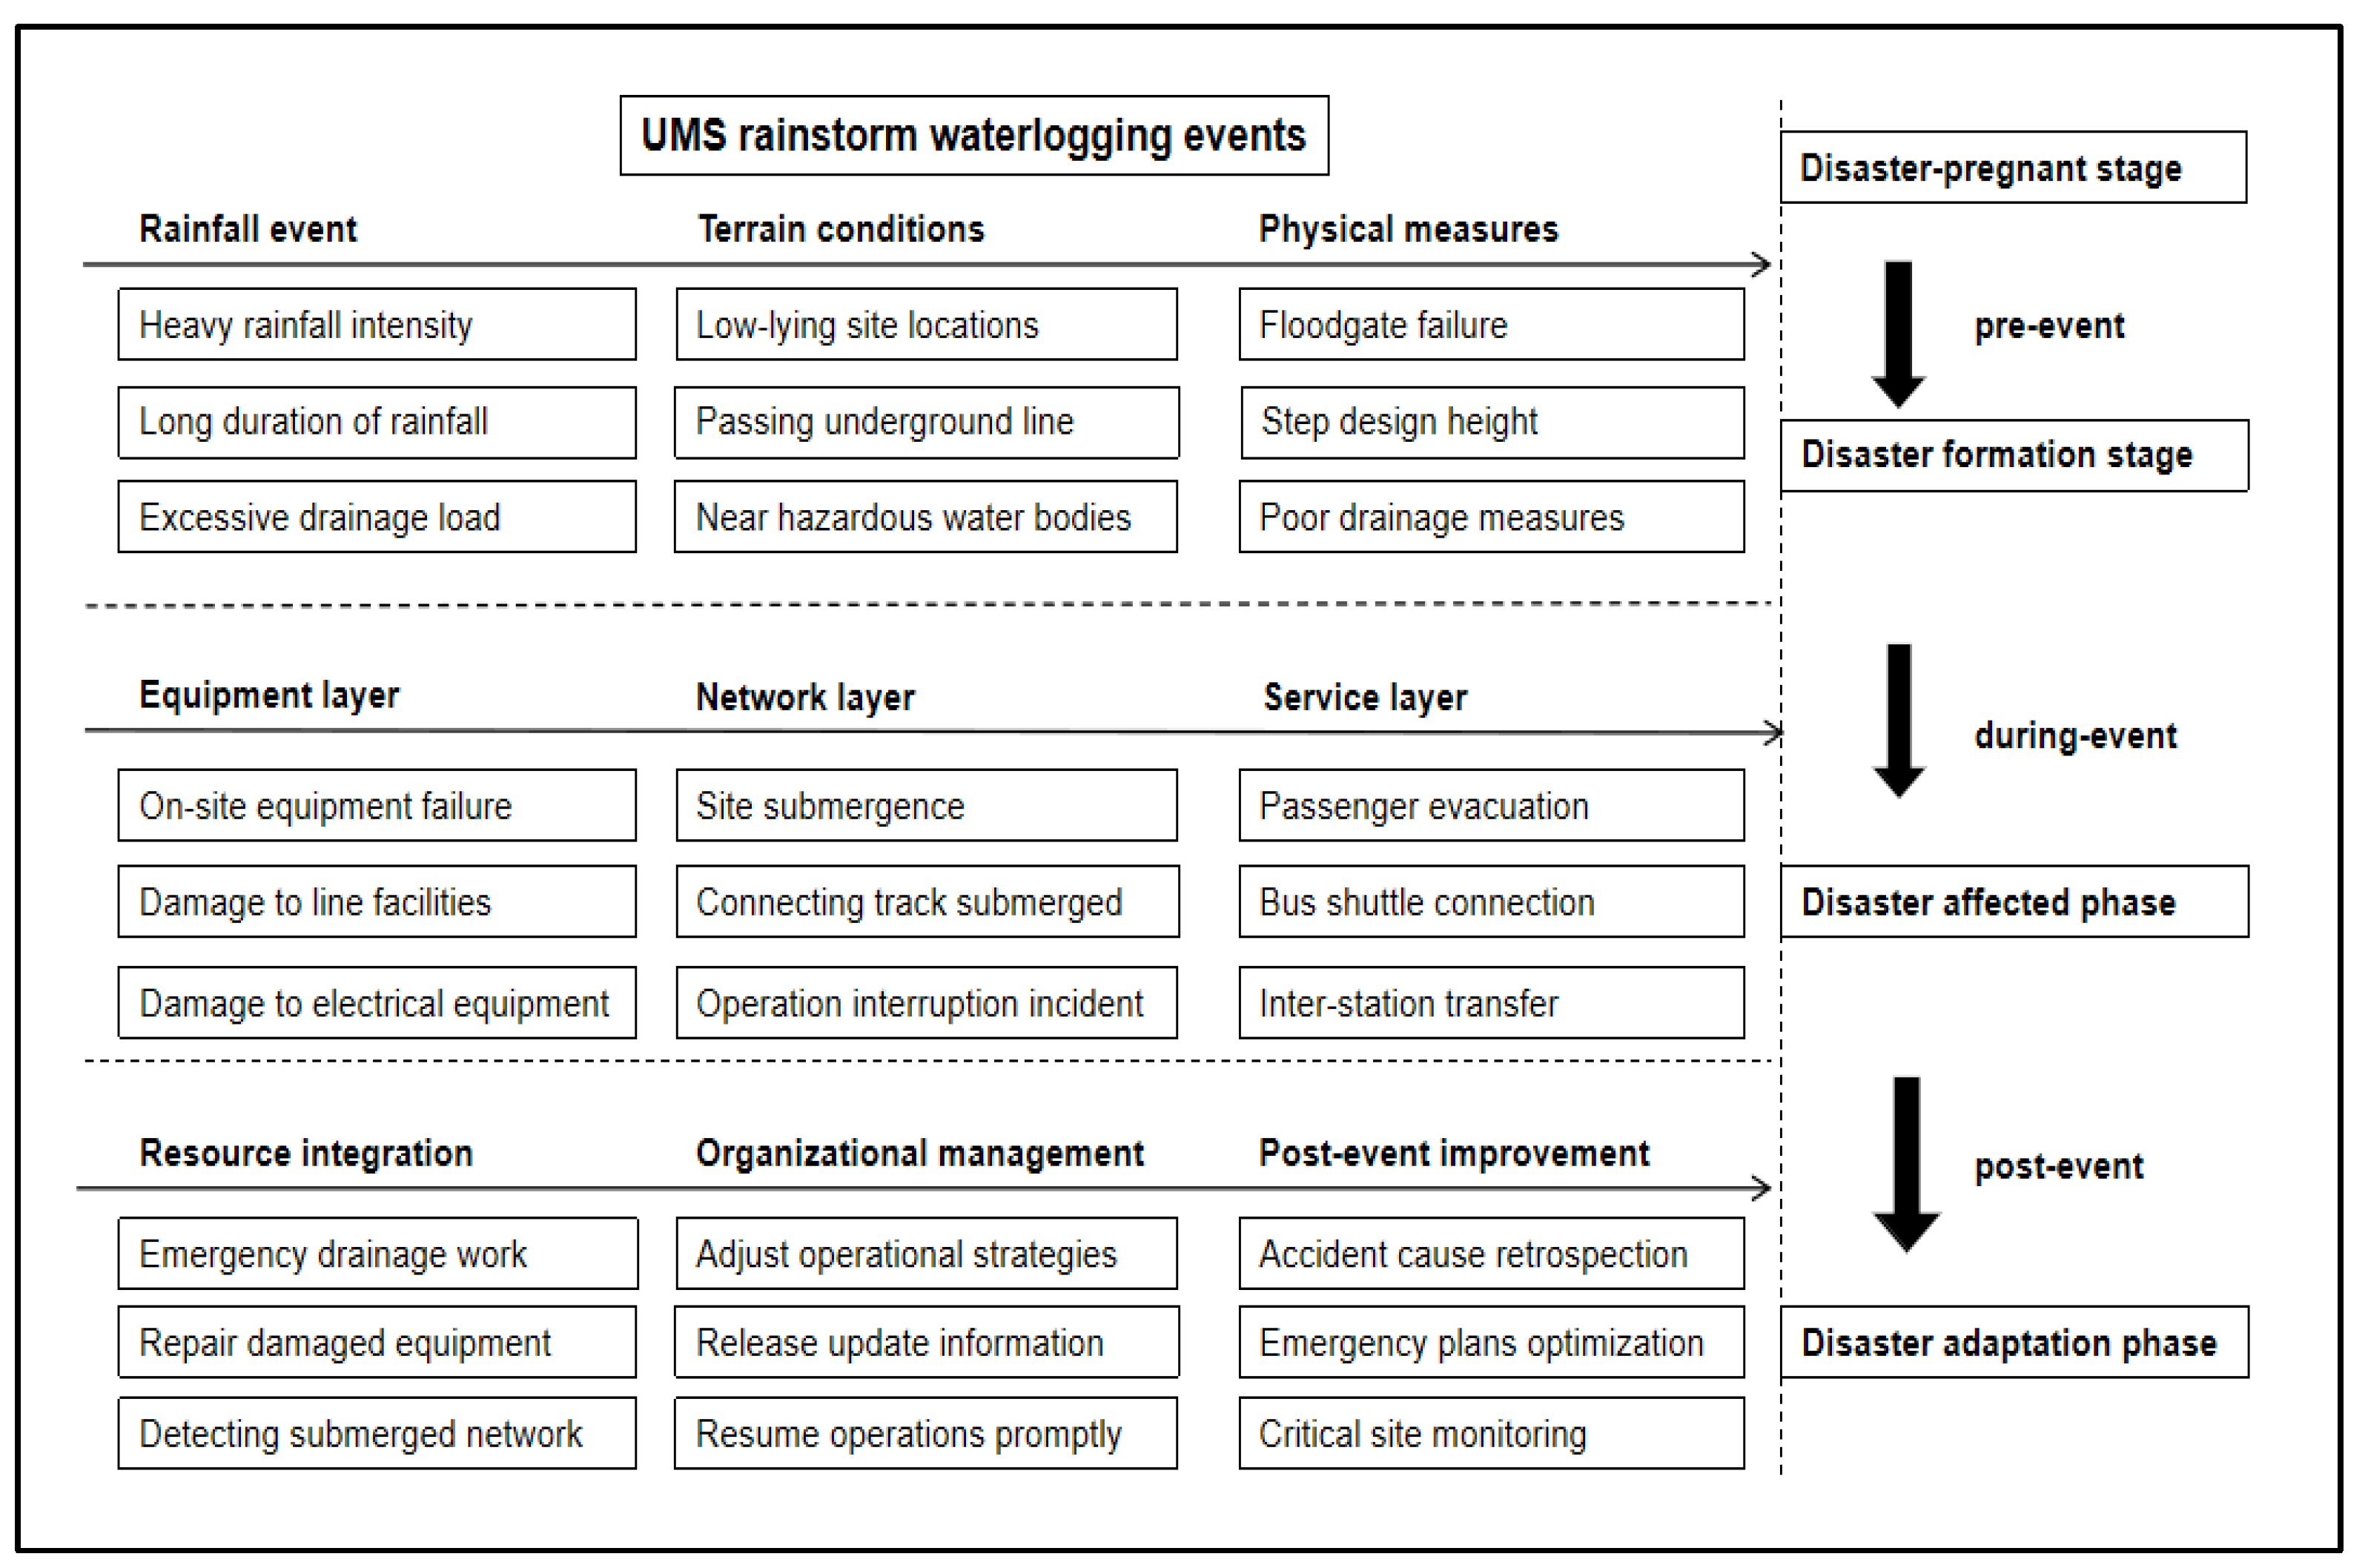
2.2. UMS Operation Characteristics Process in Response to Waterlogging
3. Vulnerable Areas Analysis of the UMS During Flooding Conditions
3.1. Various Recurrence Periods of Rainstorm Risk Scenarios
3.2. UMS Network Modeling Within Geographic Information
3.3. Flooding Scenario Simulation of the UMS Network Operation
3.3.1. Selection of Algorithm for Urban Flooding Simulation
3.3.2. Numerical Simulation in UMS Operations Under Waterlogging
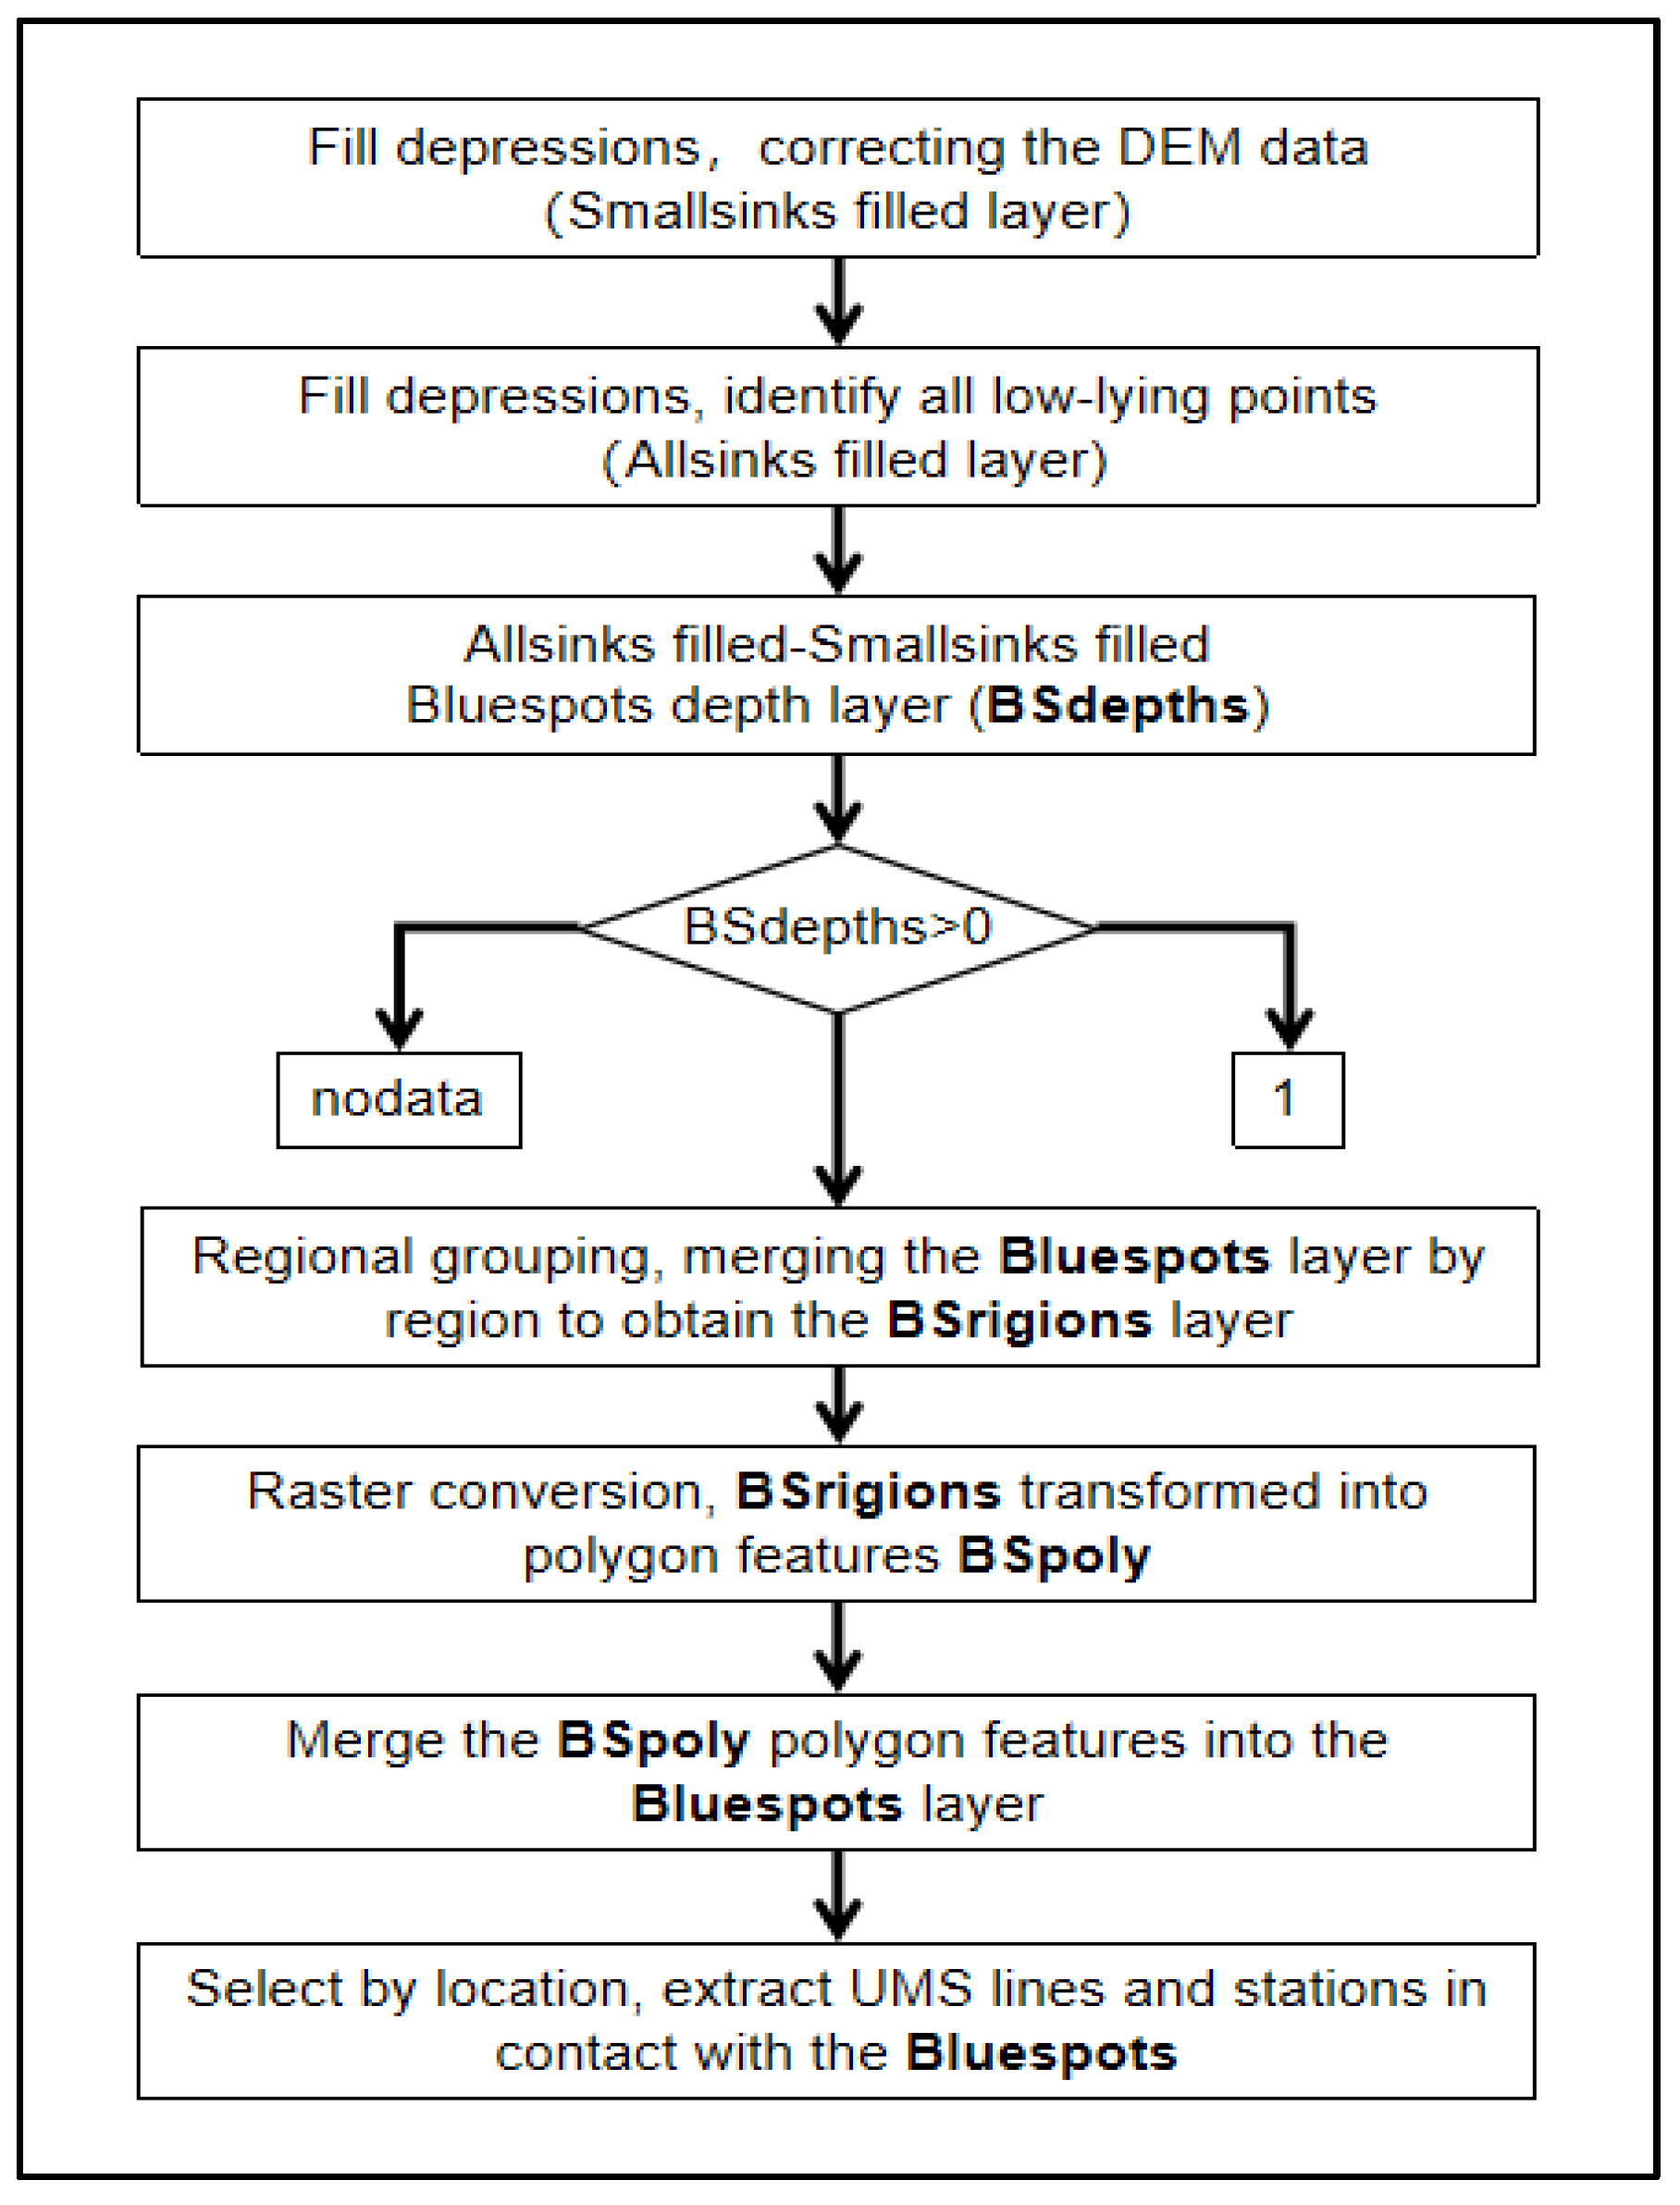
3.3.3. UMS Vulnerable Points Identification Under Waterlogging Disruption
4. Network Resilience Measurement Under Waterlogging Disturbance
4.1. Definition of Connectivity in the UMS Network
4.2. Recovery Strategy and Resilience Calculation for the UMS
- (1)
- Calculate the global connectivity and network efficiency of the network. When the UMS network is operating normally, the network performance index value can serve as the baseline before any disturbance, corresponding to the starting point of the PRF curve. Define the global connectivity of the UMS as the connection status of nodes in the system to all other nodes, with a value of one indicating full connectivity. Network efficiency is a metric defined based on the shortest distance dij between nodes. The sum of the reciprocals of the shortest distances between all node pairs in the network is the network efficiency. The shorter the distance between each node pair, the higher the efficiency value. In NetworkX, functions can be directly called to calculate both connectivity and network efficiency.
- (2)
- Remove flood-prone areas and calculate the minimal impact on network performance. During heavy rain flooding, certain locations and lines of the UMS become submerged, leading to the cessation of line operations and a significant reduction in service capacity. As a result, connectivity and network efficiency plummet to the lowest point on the resilience PRF curve. To ascertain the network’s minimum performance, flood-prone areas within the UMS topology were removed, creating a connected subgraph of the network. The all-node-connectivity and global-efficiency commands were subsequently employed to compute the network’s connectivity and global efficiency. The findings of the minimum performance calculations for both the operational and planned networks in Nanjing are detailed in Table 6 and Table 7.
- a.
- Operating network: (once in 50 years, continuous rainfall for 1 h)
- b.
- Operating network: (100, 500, 1000 years once, continuous rainfall 1 h/50, 100, 500, 1000 years once, continuous rainfall 3 h)
- (3)
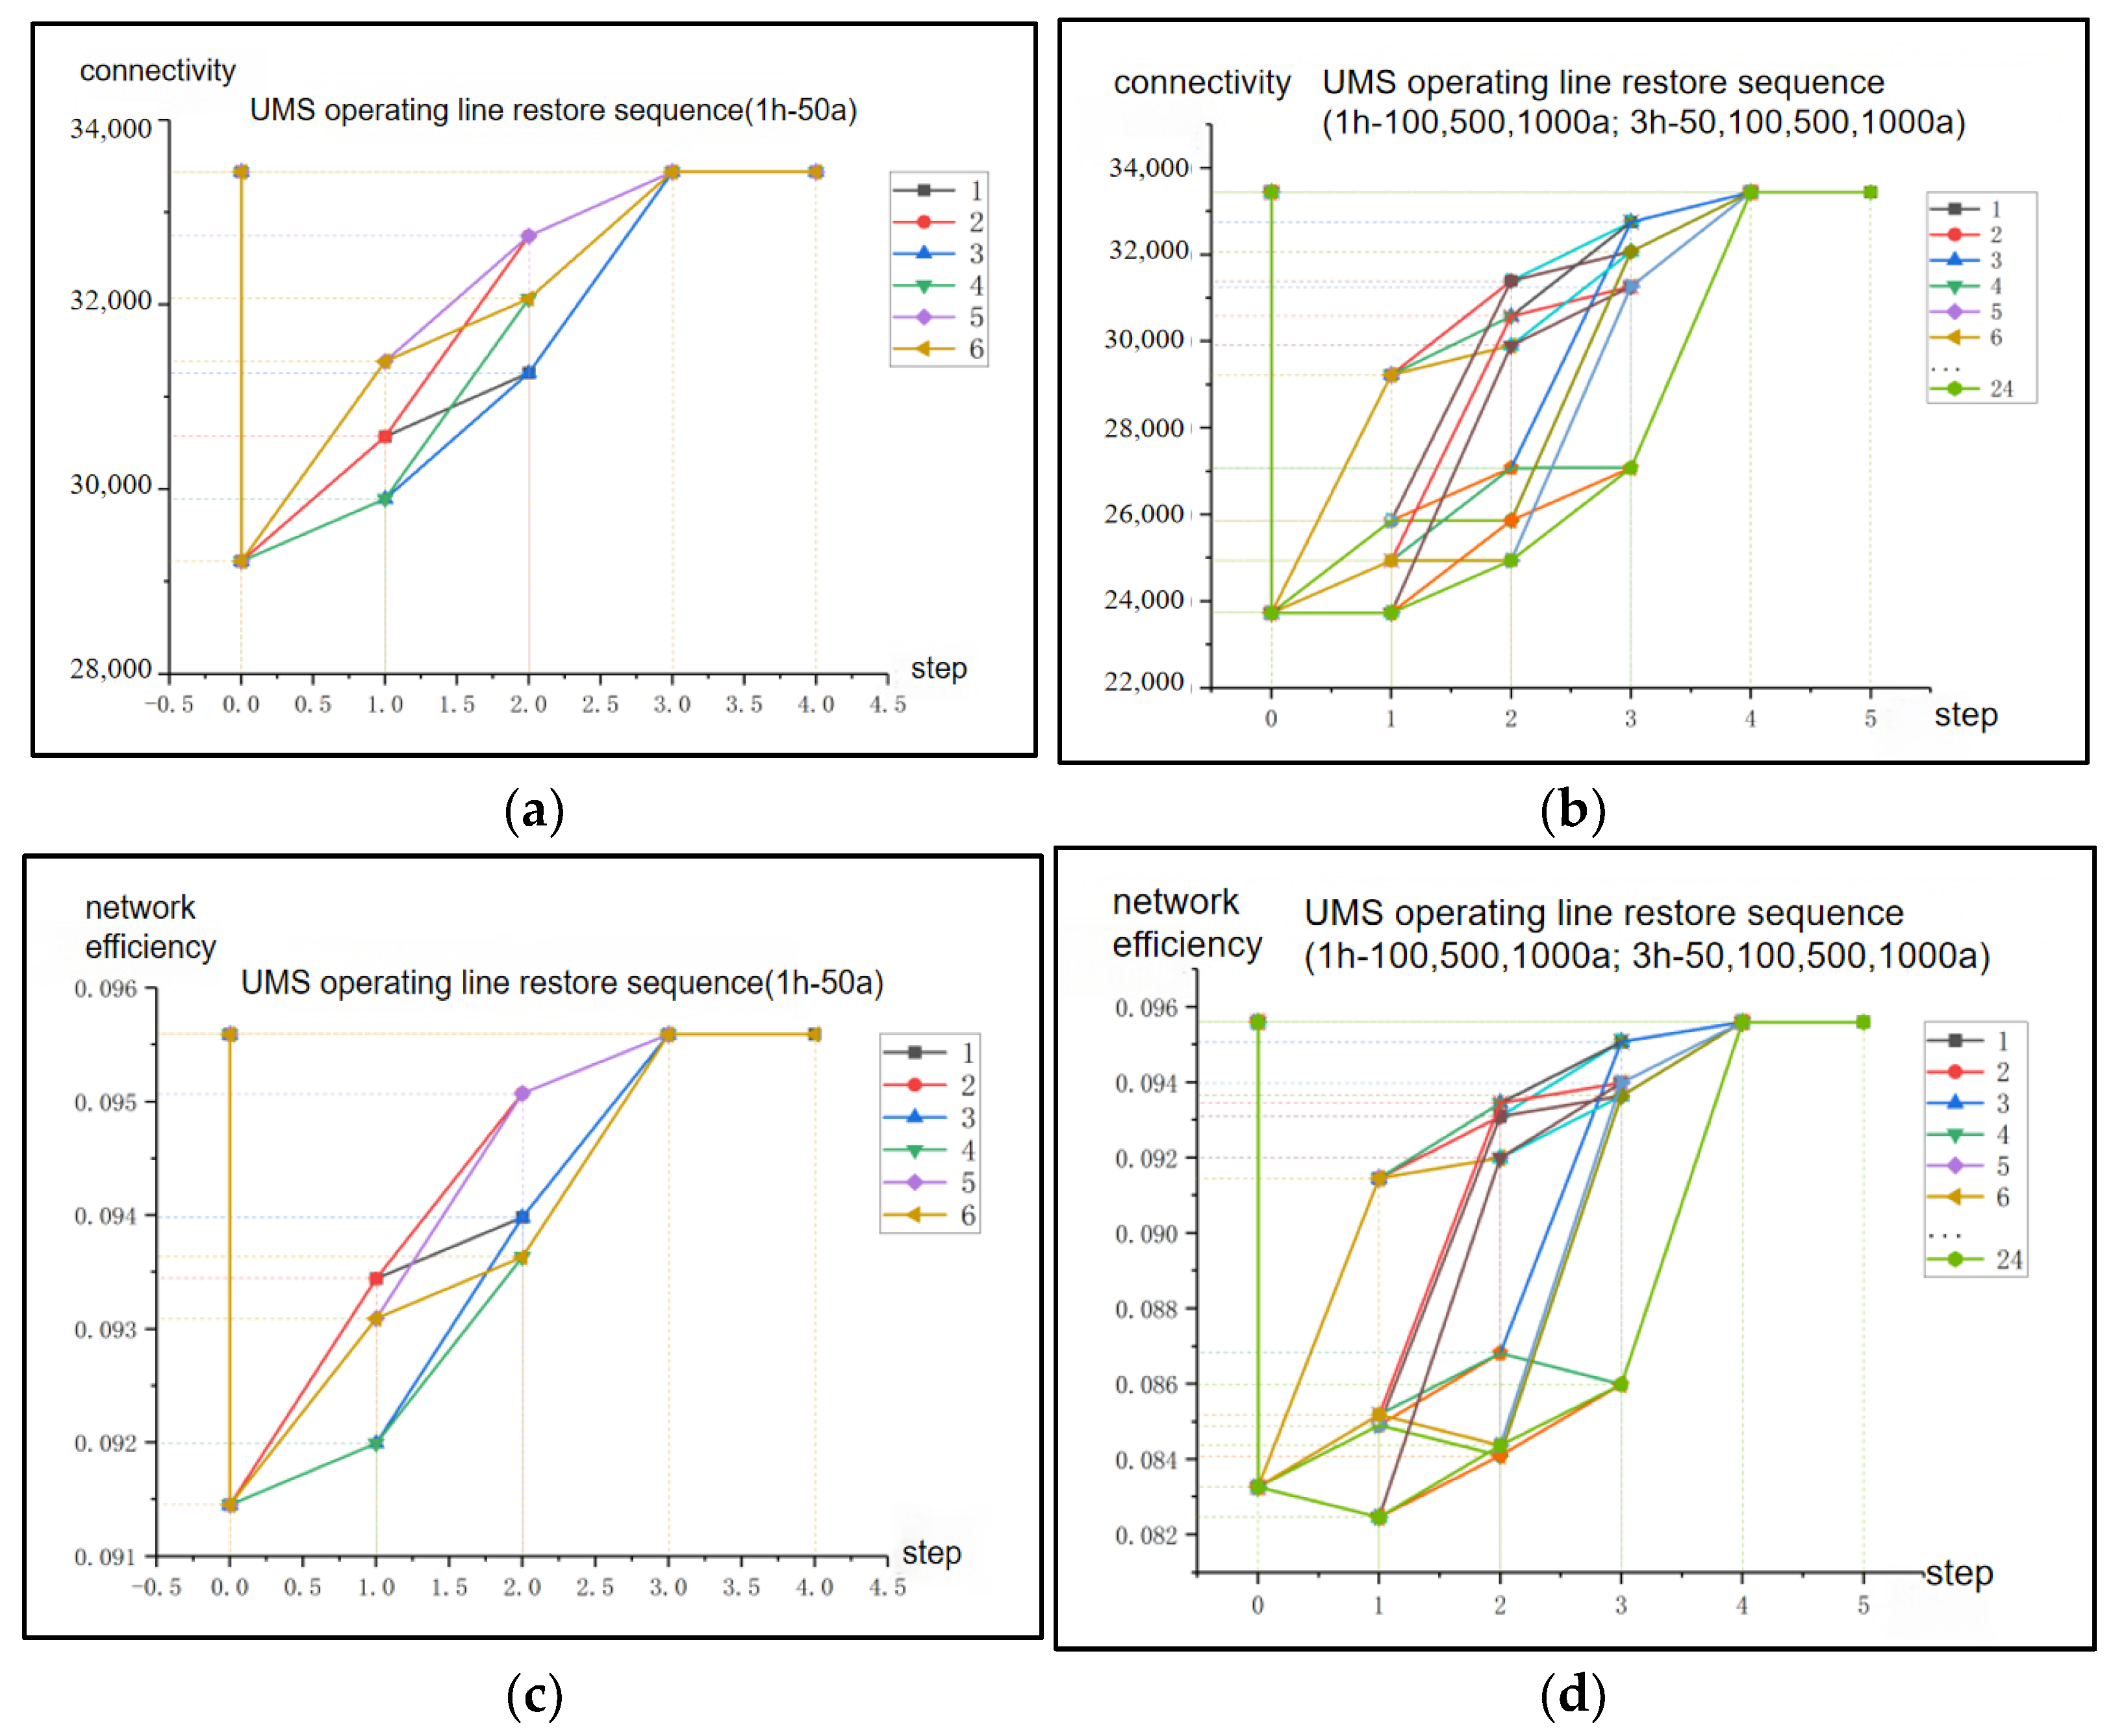
- Calculate the connectivity and network efficiency after the restoration of flood-prone areas. The performance of stations in the UMS networks significantly declines when disrupted, and the sequence of station recovery and the selection of repair strategies have varying impacts on the evolution of network resilience. Different flood-prone points have varying node degrees and terrain attributes, and the restoration of the UMS nodes and lines requires substantial material resources, as well as human and time investments. The station restoration sequence is calculated based on the following fundamental assumptions:
- (1)
- The resources required for each site to resume operations are identical;
- (2)
- The time to complete restoration at different sites is also uniform;
- (3)
- Regardless of the regional differences in resource distribution where the repair nodes are located, the maintenance team has equal capabilities and repairs each site sequentially.
- (4)
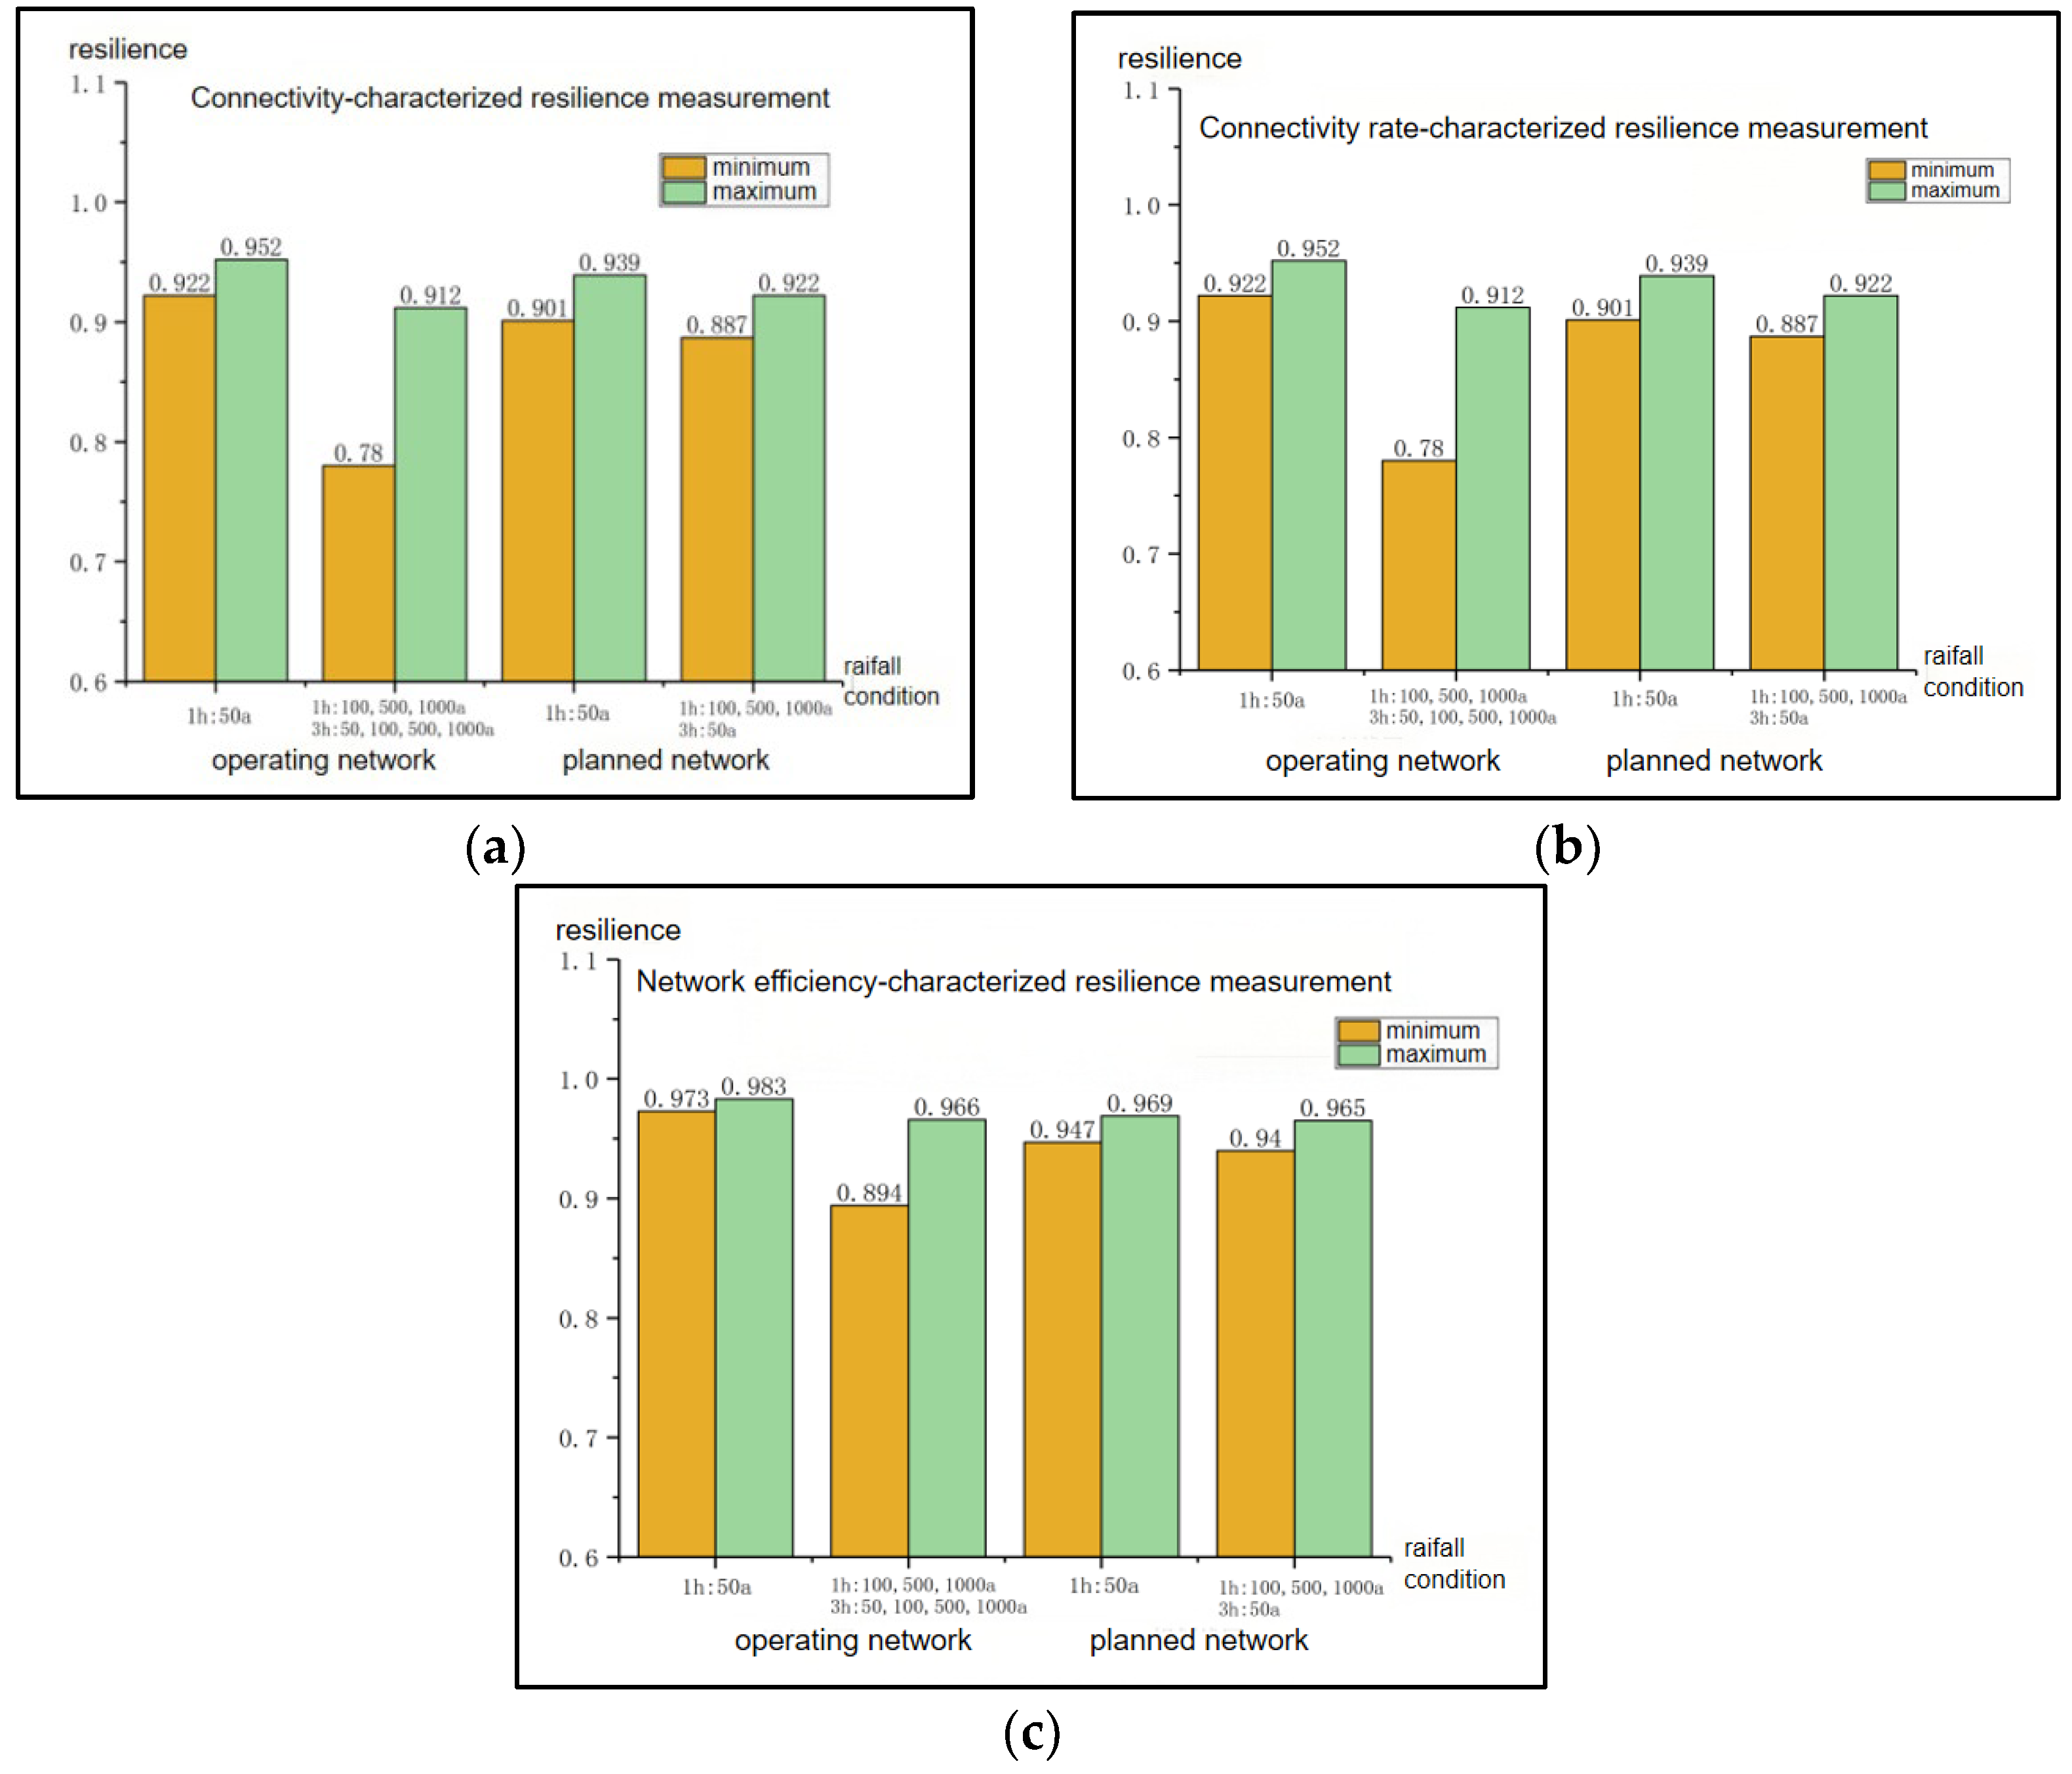
- Resilience value Calculation and result analysis. There are two primary methods for measuring infrastructure resilience: capacity representation and index system evaluation. These methods are based on dimensions such as resistance, absorption, repair, and adaptation. Furthermore, mathematical measurement methods exist that depend on PRF curves and probabilistic reasoning [37,38,39,40]. The resilience calculation of the UMS under waterlogging disturbances relies on the PRF curve, with connectivity and network efficiency serving as performance indicators for the resilience evolution process.
5. Conclusions
- (1)
- Focus on monitoring flood-prone areas in the UMS network.
- (2)
- Protect critical lines and maintain maximum network connectivity and operational capacity. A complex network can be seen not only as a topology diagram of discrete points and connections but as a direct composition of lines. When the entire network requires shutdown for adjustment, the impact of different line shutdowns on the overall performance of the UMS varies significantly. The number of effective OD pairs in the Nanjing Metro network is 33,438, and when Line 1 malfunctions, the network performance drops by more than 80%. The impact of Line 1’s shutdown on the overall network operation is almost devastating.
- (3)
- Determine the recovery sequence of stations and the entire line based on the network resilience value. During flooding events, the UMS network may experience multiple inundations, and the backflow of rainwater can damage the network’s structure and equipment. In the event of an operational disruption, the initial priority is to swiftly evacuate any trapped passengers. Subsequently, resources should be mobilized to repair the damaged lines and equipment within the stations. Variations in resource allocation and the order of site repairs will lead to differing levels of network resilience during the recovery process. A higher flood resilience value, which is characterized by the network’s connectivity, indicates a stronger system response to disasters and a more efficient and rapid return to normal operations.
Author Contributions
Funding
Data Availability Statement
Conflicts of Interest
References
- Ji, J.; Fang, L.; Chen, J.; Ding, T. A novel framework for urban flood resilience assessment at the urban agglomeration scale. Int. J. Disaster Risk Reduct. 2024, 108, 104519. [Google Scholar] [CrossRef]
- Singh, P.; Amekudzi-Kennedy, A.; Woodall, B.; Joshi, S. Lessons from case studies of flood resilience: Institutions and built systems. Transp. Res. Interdiscip. Perspect. 2021, 9, 100297. [Google Scholar] [CrossRef]
- Fang, X.; Lu, L.; Li, Y.; Hong, Y. A Driver-Pressure-State-Impact-Response study for urban transport resilience under extreme rainfall-flood conditions. Transp. Res. Part D Transp. Environ. 2023, 121, 103819. [Google Scholar] [CrossRef]
- Li, D.; Zhu, X.; Huang, G.; Feng, H.; Zhu, S.; Li, X. A hybrid method for evaluating the resilience of urban road traffic network under flood disaster: An example of Nanjing, China. Environ. Sci. Pollut. Res. Int. 2022, 29, 46306–46324. [Google Scholar] [CrossRef]
- Ro, B.; Garfin, G. Building urban flood resilience through institutional adaptive capacity: A case study of Seoul, South Korea. Int. J. Disaster Risk Reduct. 2023, 85, 103474. [Google Scholar] [CrossRef]
- Zhou, Z.; Irizarry, J.; Li, Q. Using network theory to explore the complexity of subway construction accident network (SCAN) for promoting safety management. Saf. Sci. 2014, 64, 127–136. [Google Scholar] [CrossRef]
- Hong, L.; Ouyang, M.; Xu, M.; Hu, P. Time-varied accessibility and vulnerability analysis of integrated metro and high-speed rail systems. Reliab. Eng. Syst. Saf. 2020, 193, 106622. [Google Scholar] [CrossRef]
- Chen, J.; Huang, G.; Chen, W. Towards better flood risk management: Assessing flood risk and investigating the potential mechanism based on machine learning models. J. Environ. Manag. 2021, 293, 112810. [Google Scholar] [CrossRef]
- Sen, M.K.; Dutta, S.; Kabir, G.; Pujari, N.N.; Laskar, S.A. An integrated approach for modelling and quantifying housing infrastructure resilience against flood hazard. J. Clean. Prod. 2021, 288, 125526. [Google Scholar] [CrossRef]
- Wang, H.; Hu, Y.; Guo, Y.; Wu, Z.; Yan, D. Urban flood forecasting based on the coupling of numerical weather model and stormwater model: A case study of Zhengzhou city. J. Hydrol. Reg. Stud. 2022, 39, 100985. [Google Scholar] [CrossRef]
- Lechowska, E. Approaches in research on flood risk perception and their importance in flood risk management: A review. Nat. Hazards 2022, 111, 2343–2378. [Google Scholar] [CrossRef]
- Dong, S.; Yu, T.; Farahmand, H.; Mostafavi, A. Probabilistic modeling of cascading failure risk in interdependent channel and road networks in urban flooding. Sustain. Cities Soc. 2020, 62, 102398. [Google Scholar] [CrossRef]
- Yu, X.; Chen, Z.; Liu, F.; Zhu, H. How urban metro networks grow: From a complex network perspective. Tunn. Undergr. Space Technol. 2023, 131, 104841. [Google Scholar] [CrossRef]
- Xu, Z.; Chopra, S.S. Network-based Assessment of Metro Infrastructure with a Spatial–temporal Resilience Cycle Framework. Reliab. Eng. Syst. Saf. 2022, 223, 108434. [Google Scholar] [CrossRef]
- Shen, Y.; Yang, H.; Ren, G.; Ran, B. Model cascading overload failure and dynamic vulnerability analysis of facility network of metro station. Reliab. Eng. Syst. Saf. 2024, 242, 109711. [Google Scholar] [CrossRef]
- Peng, P.; Liu, Z.; Guo, J.; Wang, C. Dynamic Metro Stations Importance Evaluation Based on Network Topology and Real-Time Passenger Flows. KSCE J. Civ. Eng. 2023, 27, 4459–4471. [Google Scholar] [CrossRef]
- Meng, Y.; Tian, X.; Li, Z.; Zhou, W.; Zhou, Z.; Zhong, M. Comparison analysis on complex topological network models of urban rail transit: A case study of Shenzhen Metro in China. Phys. A Stat. Mech. Its Appl. 2020, 559, 125031. [Google Scholar] [CrossRef]
- Gong, D.; Tian, J.; Hu, W.; Dong, J.; Chen, Y.; Ren, R.; Chen, Z. Sustainable Design and Operations Management of Metro-Based Underground Logistics Systems: A Thematic Literature Review. Buildings 2023, 13, 1888. [Google Scholar] [CrossRef]
- Tang, Y.; Bi, W.; Varga, L.; Dolan, T.; Li, Q. An integrated framework for managing fire resilience of metro station system: Identification, assessment, and optimization. Int. J. Disaster Risk Reduct. 2022, 77, 103037. [Google Scholar] [CrossRef]
- Li, C.; Sun, N.; Lu, Y.; Guo, B.; Wang, Y.; Sun, X.; Yao, Y. Review on Urban Flood Risk Assessment. Sustainability 2023, 15, 765. [Google Scholar] [CrossRef]
- Saikh, N.I.; Mondal, P. GIS-based machine learning algorithm for flood susceptibility analysis in the Pagla river basin, Eastern India. Nat. Hazards Res. 2023, 3, 420–436. [Google Scholar] [CrossRef]
- Kumar, V.; Sharma, K.V.; Caloiero, T.; Mehta, D.J.; Singh, K. Comprehensive Overview of Flood Modeling Approaches: A Review of Recent Advances. Hydrology 2023, 10, 141. [Google Scholar] [CrossRef]
- Diaconu, D.C.; Costache, R.; Popa, M.C. An Overview of Flood Risk Analysis Methods. Water 2021, 13, 474. [Google Scholar] [CrossRef]
- Karim, F.; Armin, M.A.; Ahmedt-Aristizabal, D.; Tychsen-Smith, L.; Petersson, L. A Review of Hydrodynamic and Machine Learning Approaches for Flood Inundation Modeling. Water 2023, 15, 566. [Google Scholar] [CrossRef]
- Da Silva, L.B.L.; Humberto, J.S.; Alencar, M.H.; Ferreira, R.J.P.; de Almeida, A.T. GIS-based multidimensional decision model for enhancing flood risk prioritization in urban areas. Int. J. Disaster Risk Reduct. 2020, 48, 101582. [Google Scholar] [CrossRef]
- Thrysøe, C.; Balstrøm, T.; Borup, M.; Löwe, R.; Jamali, B.; Arnbjerg-Nielsen, K. FloodStroem: A fast dynamic GIS-based urban flood and damage model. J. Hydrol. 2021, 600, 126521. [Google Scholar] [CrossRef]
- Demissie, Z.; Rimal, P.; Seyoum, W.M.; Dutta, A.; Rimmington, G. Flood susceptibility mapping: Integrating machine learning and GIS for enhanced risk assessment. Appl. Comput. Geosci. 2024, 23, 100183. [Google Scholar] [CrossRef]
- Chen, Y. Flood hazard zone mapping incorporating geographic information system (GIS) and multi-criteria analysis (MCA) techniques. J. Hydrol. 2022, 612, 128268. [Google Scholar] [CrossRef]
- Kopsidas, A.; Kepaptsoglou, K. Identification of critical stations in a Metro System: A substitute complex network analysis. Phys. A Stat. Mech. Its Appl. 2022, 596, 127123. [Google Scholar] [CrossRef]
- Tang, J.; Li, Z.; Gao, F.; Zong, F. Identifying critical metro stations in multiplex network based on D–S evidence theory. Phys. A 2021, 574, 126018. [Google Scholar] [CrossRef]
- Owais, M.; Ahmed, A.S.; Moussa, G.S.; Khalil, A.A. Integrating underground line design with existing public transportation systems to increase transit network connectivity: Case study in Greater Cairo. Expert Syst. Appl. 2021, 167, 114183. [Google Scholar] [CrossRef]
- Rus, K.; Kilar, V.; Koren, D. Resilience assessment of complex urban systems to natural disasters: A new literature review. Int. J. Disaster Risk Reduct. 2018, 31, 311–330. [Google Scholar] [CrossRef]
- Paul, S.; Poudyal, A.; Poudel, S.; Dubey, A.; Wang, Z. Resilience assessment and planning in power distribution systems: Past and future considerations. Renew. Sustain. Energy Rev. 2024, 189, 113991. [Google Scholar] [CrossRef]
- Chen, C.; Li, J.; Zhao, Y.; Goerlandt, F.; Reniers, G.; Yiliu, L. Resilience assessment and management: A review on contributions on process safety and environmental protection. Process Saf. Environ. Prot. 2023, 170, 1039–1051. [Google Scholar] [CrossRef]
- Mujjuni, F.; Betts, T.; To, L.; Blanchard, R. Resilience a means to development: A resilience assessment framework and a catalogue of indicators. Renew. Sustain. Energy Rev. 2021, 152, 111684. [Google Scholar] [CrossRef]
- Saja, A.A.; Goonetilleke, A.; Teo, M.; Ziyath, A.M. A critical review of social resilience assessment frameworks in disaster management. Int. J. Disaster Risk Reduct. 2019, 35, 101096. [Google Scholar] [CrossRef]
- Fraccascia, L.; Giannoccaro, I.; Albino, V. Resilience of Complex Systems: State of the Art and Directions for Future Research. Complexity 2018, 2018, 3421529. [Google Scholar] [CrossRef]
- Hosseini, S.; Ivanov, D. Bayesian networks for supply chain risk, resilience and ripple effect analysis: A literature review. Expert Syst. Appl. 2020, 161, 113649. [Google Scholar] [CrossRef]
- Jiao, L.; Li, D.; Zhang, Y.; Zhu, Y.; Huo, X.; Wu, Y. Identification of the Key Influencing Factors of Urban Rail Transit Station Resilience against Disasters Caused by Rainstorms. Land 2021, 10, 1298. [Google Scholar] [CrossRef]
- Li, T.; Dong, Y.; Liu, Z. A review of social-ecological system resilience: Mechanism, assessment and management. Sci. Total Environ. 2020, 723, 138113. [Google Scholar] [CrossRef]



| Recurrence Period/Year | 1 h Rainfall Intensity (Average) | One-Hour Rainfall (mm) | 3 h Rainfall Intensity (Average) | 3 h Rainfall (mm) |
|---|---|---|---|---|
| 20a | 1.375 | 82.518 | 0.595 | 107.040 |
| 50a | 1.595 | 95.673 | 0.689 | 124.105 |
| 100a | 1.760 | 105.624 | 0.761 | 137.013 |
| 500a | 2.146 | 128.730 | 0.928 | 166.986 |
| 1000a | 2.311 | 138.682 | 0.999 | 179.895 |
| Recurrence Period/a | 1 h Precipitation Intensity | Theoretical Displacement/mm | 3 h Precipitation Intensity | Theoretical Displacement/mm |
|---|---|---|---|---|
| Once in 5 years | 1.044 | 62.615 | 0.451 | 81.223 |
| Once in 10 years | 1.209 | 72.567 | 0.523 | 94.132 |
| Once in 50 years | 1.595 | 95.673 | 0.689 | 124.105 |
| Algorithm Name | Main Idea | Simulation Results | Main Advantages | Main Disadvantages | Common Software |
|---|---|---|---|---|---|
| One-dimensional pipe network simulation | Solve the one-dimensional Saint-Venant equations to calculate the flow state of water in the network, and subsequently allocate the water volume. | Check well overflow, as well as the flow rate, velocity, and section fill of water in the network. | The calculation speed is fast and the accuracy is relatively high. | It is impossible to calculate the flow and diffusion of water on the surface. | SWMM |
| Two-dimensional pipe network simulation | Solve the two-dimensional shallow water wave equation to diffuse the overflow from the inspection well along the flow path. | The spatio-temporal distribution of waterlogged water bodies along the urban road network. | It is currently the most computationally accurate method for simulating waterlogging. | The model calculation takes a lot of time and requires a high level of computing power. | MIKE+/ Fluent |
| Active flooding | Starting from the water diffusion point within the basin, flow and diffuse along the basin elevation to simulate events such as dam failures. | The flow path of the water body along the basin, the inundation area and depth of each sub-basin. | The algorithm is clear, the modeling process is simple, and the calculation speed is fast. | It is not applicable to the simulation of waterlogging events in small watersheds. Basin topographic data have a significant impact on the calculation results. | ArcGIS/ SWMM |
| Passive flooding | Determine the fixed water level values and compare the elevations of all grids within the basin, which is suitable for simulating uniform precipitation events. | The size and depth of all inundation points within the basin. | The algorithm is clear in thinking and fast in calculation, suitable for simulating rainstorm flooding in urban plain areas. | It does not satisfy the fluidity and continuity of water bodies. | ArcGIS/ SWMM |
| One-dimensional expansion method | Simplify the allocation of overflow water bodies based on urban road network data or regional V-H curves. | It solves the problem that one-dimensional simulation methods cannot allocate water volume to water bodies. | High calculation accuracy and faster calculation speed compared to pure two-dimensional simulation methods. | Compared with the shallow water wave equation, the calculation accuracy is insufficient and it is a simplified algorithm. | ArcGIS/ SWMM/ CAD |
| 1 h Rainfall | Operating Network | Node Degree Distribution | Planned Network | Node Degree Distribution |
|---|---|---|---|---|
| 50 a | Xinghuo Road, Daming Road, Dongliu (2) | 0 + 3 Degree 4:0 Degree 2:3 | Xinting Road, Luotang Road (4) Daming Road, Dongliu, October Square, Xinghuo Road (2) | 2 + 4 Degree 4:2 Degree 2:4 |
| 100 a | Taifeng Road (4) Xinghuo Road, Daming Road, Dongliu (2) | 1 + 3 Degree 4:1 Degree 2:3 | Xinting Road, Luotang Road, Taifeng Road (4) Daming Road, Dongliu, October Square, Xinghuo Road (2) Fangjiaying (1) | 3 + 4 + 1 Degree 4:3 Degree 2:4 Degree 1:1 |
| 500 a | Taifeng Road (4) Xinghuo Road, Daming Road, Dongliu (2) | 1 + 3 Degree 4:1 Degree 2:3 | Xinting Road, Luotang Road, Taifeng Road (4) Daming Road, Dongliu, October Square, Xinghuo Road (2) Fangjiaying (1) | 3 + 4 + 1 Degree 4:3 Degree 2:4 Degree 1:1 |
| 1000 a | Taifeng Road (4) Xinghuo Road, Daming Road, Dongliu (2) | 1 + 3 Degree 4:1 Degree 2:3 | Xinting Road, Luotang Road, Taifeng Road (4) Daming Road, Dongliu, October Square, Xinghuo Road (2) Fangjiaying (1) | 3 + 4 + 1 Degree 4:3 Degree 2:4 Degree 1:1 |
| 3 h Rainfall | Operating Network | Node Degree Distribution | Planned Network | Node Degree Distribution |
| 50 a | Taifeng Road (4) Xinghuo Road, Daming Road, Dongliu (2) | 1 + 3 Degree 4:1 Degree 2:3 | Xinting Road, Luotang Road, Taifeng Road (4) Daming Road, Dongliu, October Square, Xinghuo Road (2) Fangjiaying (1) | 3 + 4 + 1 Degree 4:3 Degree 2:4 Degree 1:1 |
| 100 a | Taifeng Road (4) Xinghuo Road, Daming Road, Dongliu (2) | 1 + 3 Degree 4:1 Degree 2:3 | Xinting Road, Luotang Road, Taifeng Road (4) Daming Road, Dongliu, October Square, Xinghuo Road, Yanjiang New Town (2) Fangjiaying (1) | 3 + 5 + 1 Degree 4:3 Degree 2:5 Degree 1:1 |
| 500 a | Taifeng Road (4) Xinghuo Road, Daming Road, Dongliu (2) | 1 + 3 Degree 4: 1 Degree 2: 3 | Xinting Road, Luotang Road, Taifeng Road, Yangzhuang (4) Daming Road, Dongliu, October Square, Xinghuo Road, Yanjiang New Town, Nantieyuan (2) Fangjiaying (1) | 4 + 6 + 1 Degree 4:4 Degree 2:6 Degree 1:1 |
| 1000 a | Taifeng Road (4) Xinghuo Road, Daming Road, Dongliu (2) | 1 + 3 Degree 4: 1 Degree 2: 3 | Xinting Road, Luotang Road, Taifeng Road, Yangzhuang (4) Daming Road, Dongliu, October Square, Xinghuo Road, Yanjiang New Town, Nantieyuan, Xiangfeng Road (2) Fangjiaying (1) | 4 + 7 + 1 Degree 4:4 Degree 2:7 Degree 1:1 |
| Rainfall intensity: 50 a Rainfall Duration: 1 h Inundation risk sites: Xinghuo Road, Daming Road, Dongliu | Delete Node | Connectivity | Connectivity Rate | Network Efficiency |
| Dongliu | 32,064 | 0.95891 | 0.09363 | |
| Xinghuo Road | 31,386 | 0.93863 | 0.09309 | |
| Daming Road | 29,220 | 0.87386 | 0.09145 | |
| Delete node order: [‘Dongliu’, ‘Xinghuo Road’, ‘Daming Road’] | ||||
| Connectivity set: [32,064, 31,386, 29,220] | ||||
| Connectivity rate set: [0.95891, 0.93863, 0.87386] | ||||
| Network efficiency set: [0.09363, 0.09309, 0.09145] | ||||
| Rainfall intensity: 50 a/100 a/500 a/1000 a Rainfall Duration: 1 h/3 h Flooding risk sites: Xinghuo Road, Taifeng Road, Daming Road, Dongliu | Delete Node | Connectivity | Connectivity Rate | Network Efficiency |
| Tai Feng Road | 27,074 | 0.80968 | 0.08598 | |
| Daming Road | 24,936 | 0.74573 | 0.08436 | |
| Dongliu | 23,730 | 0.70967 | 0.08246 | |
| Xinghuo Road | 23,724 | 0.70949 | 0.08326 | |
| Delete node order: [‘Taifeng Road’, ‘Daming Road’, ‘Dongliu’, ‘Xinghuo Road’] | ||||
| Connectivity set: [27,074, 24,936, 23,730, 23,724] | ||||
| Connectivity rate set: [0.80968, 0.74573, 0.70967, 0.70949] | ||||
| Network efficiency set: [0.08598, 0.08436, 0.08246, 0.08326] | ||||
| Rainfall Situation | Number of Affected Nodes | Connectivity | Connectivity Rate | Network Efficiency |
|---|---|---|---|---|
| 1 h–50 a | 2 + 4 | 125,602 | 0.80560 | 0.09063 |
| 1 h–100, 500, 1000 a 3 h–50 a | 3 + 4 + 1 | 113,872 | 0.73036 | 0.08611 |
| 3 h–100 a | 3 + 5 + 1 | 112,176 | 0.71948 | 0.08519 |
| 3 h–500 a | 4 + 6 + 1 | 109,585 | 0.70286 | 0.08344 |
| 3 h–1000 a | 4 + 7 + 1 | 108,978 | 0.69897 | 0.08297 |
| Performance Indicators: Connectivity/Connectivity Rate/Network Efficiency | A: Range of Resilience Values | B: Range of Resilience Values | C: Range of Resilience Values | |
|---|---|---|---|---|
| Operating network | 1 h–50 a | [0.922–0.952] | [0.922–0.952] | [0.973–0.983] |
| 1 h–100, 500, 1000 a 3 h–50, 100, 500, 1000 a | [0.780–0.912] | [0.780–0.912] | [0.894–0.966] | |
| Planned network | 1 h–50 a | [0.901–0.939] | [0.901–0.939] | [0.947–0.969] |
| 1 h–100, 500, 1000 a 3 h–50 a | [0.887–0.922] | [0.887–0.922] | [0.940–0.965] | |
Disclaimer/Publisher’s Note: The statements, opinions and data contained in all publications are solely those of the individual author(s) and contributor(s) and not of MDPI and/or the editor(s). MDPI and/or the editor(s) disclaim responsibility for any injury to people or property resulting from any ideas, methods, instructions or products referred to in the content. |
© 2025 by the authors. Licensee MDPI, Basel, Switzerland. This article is an open access article distributed under the terms and conditions of the Creative Commons Attribution (CC BY) license (https://creativecommons.org/licenses/by/4.0/).
Share and Cite
Yang, X.; Xiahou, X.; Li, K.; Li, Q. Urban Metro System Network Resilience Under Waterlogging Disturbance: Connectivity-Based Measurement and Enhancement. Buildings 2025, 15, 3432. https://doi.org/10.3390/buildings15183432
Yang X, Xiahou X, Li K, Li Q. Urban Metro System Network Resilience Under Waterlogging Disturbance: Connectivity-Based Measurement and Enhancement. Buildings. 2025; 15(18):3432. https://doi.org/10.3390/buildings15183432
Chicago/Turabian StyleYang, Xiaohua, Xiaer Xiahou, Kang Li, and Qiming Li. 2025. "Urban Metro System Network Resilience Under Waterlogging Disturbance: Connectivity-Based Measurement and Enhancement" Buildings 15, no. 18: 3432. https://doi.org/10.3390/buildings15183432
APA StyleYang, X., Xiahou, X., Li, K., & Li, Q. (2025). Urban Metro System Network Resilience Under Waterlogging Disturbance: Connectivity-Based Measurement and Enhancement. Buildings, 15(18), 3432. https://doi.org/10.3390/buildings15183432


