Article

Electromigration of Chloride Ions in Cementitious Material: Extension of Nernst–Planck Theory

1
State Key Laboratory of Precision Blasting, Jianghan University, Wuhan 430056, China
2
Hubei Key Laboratory of Blasting Engineering, Jianghan University, Wuhan 430056, China
3
School of Ocean Engineering, Harbin Institute of Technology at Weihai, Weihai 264209, China
4
School of Civil, Environmental & Architectural Engineering, Korea University, Seoul 02841, Republic of Korea
*
Authors to whom correspondence should be addressed.
Buildings 2025, 15(18), 3429; https://doi.org/10.3390/buildings15183429
Submission received: 22 August 2025 / Revised: 16 September 2025 / Accepted: 19 September 2025 / Published: 22 September 2025
(This article belongs to the Section Building Materials, and Repair & Renovation)

Abstract

The transport of chloride ions in concrete is often affected by electric fields, and its concentration distribution is generally evaluated using the Nernst–Planck equation. The Nernst–Planck theory can only effectively predict the mass electromigration in ideal porous media. However, under an electric field, cementitious materials still have a certain binding ability to chloride ions. This causes the transport model to have significant prediction errors, and the specific value of the electromigration coefficient cannot be accurately measured. This article systematically investigated the transfer rate of chloride ions in cementitious material under different current densities. An analytical solution of the Nernst–Planck equation containing an independent electromigration coefficient was presented, and its value was quantitatively measured and discussed. The results indicated that the relationship between the electromigration and the apparent diffusion coefficient of chloride ions needs to be fitted in segments corresponding to various electric voltage intensities; but the electromigration coefficient shows a highly linear relationship with the pure effective diffusion coefficient. This work can provide assistance and valuable data support for the evaluation of mass transport in non-ideal porous media, such as cementitious materials, using the Nernst–Planck theory.

1. Introduction

In marine environments, chloride-induced corrosion is a key factor in weakening the durability of reinforced concrete (RC) structures [1,2,3,4]. The process of chloride ions destroying RC structures is as follows: Chloride ions first invade the concrete and accumulate inside it; when the chloride concentration at the concrete–steel interface reaches the threshold, the passive film begins to destroy the concrete. After the formation of a corrosion macrocell system, the cross-sectional area of the steel bars begins to decrease, and the expansion of corrosion products can also damage the concrete cover [5,6,7,8,9,10]. Chloride ions are transported to the interior of the concrete mainly by diffusion, which can be described by Fick’s second law [11,12,13,14,15,16,17].
Note that RC structures are often affected by electric fields during service. For example, stray electric currents will be formed by high-speed railway operations and will act on the RC system [18,19,20,21,22]. The electrical chloride removal (ECR) technique is also widely used to remove free chloride ions from concrete by applying an external electric field [23,24,25]. Furthermore, once the corrosion reaction is initiated, a corrosion electric field will form in the concrete [26]. As a cathode ion, the concentration of chloride ions in the anode region will continue to increase, which can be named as a concentrated effect. Some experiments were conducted to measure the corrosion current density in RC structures. The literature [27] reported that the average current density of steel mesh under free corrosion is about 4 A/m2. In the corrosion process, from initiation to damage, it is reported that the corrosion current density is in the range of 0.1 to 0.6 A/m2 after 600 days [28]. Feng et al. [29] found that the peak current density in corroded RC gradually increased from 0.04 A/m2 at 7 days to 0.38 A/m2 at 28 days. Therefore, constructing a reliable transport model for chloride ions in concrete under an electric field is urgently needed. The literature [30,31] has reported that the steel bars at the corners of concrete generally initiate corrosion electrochemical reactions earlier. After the corrosion initiation of the corner reinforcement, this model can be used to predict the subsequent depassivation time of the bottom reinforcement, considering the influence of existing corrosion electric fields. For the concrete components with the double layer of reinforcement, the corrosion initiation of reinforcement in the inner layer can be calculated precisely too. Meanwhile, this model can also be applied to evaluate the removal effect of chloride ions through the ECR technique and predict the corrosion behavior of steel in concrete in the presence of stray current, such as in a DC railway.
At present, the governing equation of chloride transport under an electric field is mainly obtained using the Nernst–Planck theory [32,33]. But the electromigration coefficients in these works were calculated based on the apparent diffusion coefficient. Its value has not been specifically determined through the fitting of test data. The electromigration coefficient should only be related to the properties of concrete materials. Therefore, it is necessary to systematically measure the actual value of the electromigration coefficient as a standalone variable. P. Spiesz [34] demonstrated the relationship between the electromigration coefficient and diffusion coefficient of chloride ions through an extensive literature review. Based on the theoretical relationship provided by Nernst–Planck theory, the Rapid Chlorine Migration (RCM) test was used to predict the apparent diffusion coefficient of chloride ions in concrete, as described in NT BUILD 492 [35] and the literature [36,37,38]. The literature [39,40] also provided the relationship between the comprehensive transmission rate and applied electric voltage intensity. In the above experiments [32,33,36,37,38,39,40], a strong fixed electric voltage (usually 30 V or 60 V) was applied to the concrete specimen. However, we note that the corrosion current density is also influenced by the electrical resistivity of the concrete. Due to the discreteness of concrete, the electrical resistivity of different parts varies greatly, but on-site measurement of resistivity is very cumbersome. Therefore, there are some limitations in fitting the electromigration coefficient directly to this single voltage. Directly determining the electromigration coefficient of cementitious materials under various current densities has more practical application value.
Moreover, stray current coupled with chloride ions can significantly accelerate the corrosion and deterioration of concrete properties [41], and some experiments have clarified that the corrosion current intensity can further influence the chloride binding capacity of concrete. The literature [42,43] reported that bound chloride ions in concrete lose stability and release free chloride ions under the action of an external electric field, and the balance between bound and free chloride ions recombines. Orellan et al. [44] found that only about 1% of the mass of cement chloride ions remains in concrete according to the electrochemical desalination test. Trittart’s experiment [45] indicated that bound chloride ions gradually will turn into free chloride ions, which are removed rapidly leading to a significant decrease in total chloride ions, when a larger current density is applied. The literature [34,46] confirmed that the chloride binding capacity of concrete under a strong voltage was almost completely lost. However, recent experimental studies [46,47] reported that the chloride chemical bonding ability of concrete was retained to a certain extent under the action of a weak or medium electric field strength. Note that the Nernst–Planck equation is applicable to an ideal porous media material. But the apparent diffusion coefficient of chloride ions in concrete is also influenced by the binding capacity [30,48,49]. Therefore, it is necessary to propose a rearranged Nernst–Planck theory suitable for cementitious materials.
In this paper, an analytical solution of the Nernst–Planck equation containing an independent electromigration coefficient was presented, and its value was quantitatively measured corresponding to various current densities (i.e., electric voltage gradients). After this introduction, the detailed experimental information is given in Section 2. Section 3 presents the results of the RCM test and microscopic investigation, and the relationship between the chloride electromigration coefficient and diffusion coefficient is discussed in this section, too. Section 4 draws the conclusion.
To summarize, this study provides three main contributions: (i) we propose an extended analytical solution of the Nernst–Planck equation with an independent electromigration coefficient suitable for cementitious materials; (ii) we quantitatively determine this coefficient under different current densities through systematic experiments; and (iii) we establish the relationship between chloride electromigration, the diffusion coefficient, and binding capacity, thereby improving the predictive capability of chloride ion transport models in non-ideal porous media.

2. Experiment

2.1. Materials and Specimen Preparation

Here, the cement mortar specimens were used in the test to limit the discreteness of experimental data. Type I ordinary Portland cement (OPC) was used as the cementitious material, and its chemical constituents and physical properties are given in Table 1. Based on the requirement of Chinese standard GB 175-2007 [50] and GB/T 17671-2021 [51], a fine aggregate with sizes of 0.08–2 mm was selected. Sodium β-naphthalene sulfonate with 0.5% wt. by cement was added as the superplasticizer to meet the resistance requirements for permeability and temperature changes. The mix proportion of the specimen is shown in Table 2.
As shown in Figure 1a, the specimens were cast as cylindrical with a diameter of 100 mm and height of 200 mm. After 24 h of curing, they were taken out of the mold. During this period, plastic wrap was used to prevent the evaporation of water in the specimen and the entry of chloride into the air. The specimens were placed into the SHBY-60B chamber for 28 days of curing with a controlled temperature of 20 ± 1 °C and relative humidity of greater than 95%. All specimens were divided into three terms by considering 10, 20, and 30 test days under different electrical current densities. Referring to the range of corrosion current density provided by previous scholars [27,28,29], five gradients of corrosion current density of 0, 0.3, 0.6, 0.9, and 1.2 A/m2 were adopted in this test. The different experimental groups are named and listed in Table 3. Each group contains three test specimens. For each specimen, the cylindrical part AA’BB’ with the height of 50 mm is taken and placed into a saturated sodium hydroxide (Ca(OH)2) solution for 24 h to maintain the alkali environment in the mortar. The constant current corrosion was taken in this test, and the actual applied voltages for various specimens were set in the range of 1.5 to 7 V.

2.2. Experimental Procedure

2.2.1. Electrical Field Conduction

The surrounding face of the cylindrical specimen AA’BB’ was sealed with water-proof tape and epoxy resin. The bottom surface was reserved for the ingress of chloride solution. Then, the specimen was placed into a polyvinyl chloride (PVC) tube with 0.5 mm thick stainless-steel mesh fixed on its top surface acting as the anode. According to NT BUILD 492 [35], the above-assembled part was placed into the glass sink with an angle of 30° deviated from the horizontal, as shown in Figure 1b,c. The inclination angle facilitates the migration of chloride ions without spilling the anolyte. A circular steel plate with a diameter of 100 mm and thickness of 0.5 ± 0.1 mm was placed underneath the PVC pipe, and it acted as the cathode connected to the negative terminal of the current supply. The cathodic electrolyte solution was 10% NaCl solution, which was filled into the glass sink of 370 × 270 × 280 mm. The anodic electrolyte solution was 0.3 mol/L NaOH solution, which was filled into the PVC pipe. The height of the cathode solution and anode solution must remain constant, and all solutions were refreshed every 15 days. This interval, although not specified in NT BUILD 492, was chosen based on our previous experimental practice [47], as more frequent replacement tended to accelerate electrode corrosion, while 15 days ensured solution stability. Then, stainless-steel mesh, steel plate, electrolyte solutions, wires, and a constant current supply were connected to conduct the electrical field, as shown in Figure 1b. Five levels of current densities (e.g., 0, 0.3, 0.6, 0.9, and 1.2 A/m2) were adopted by adjusting current supplies to be 2, 5, 7, and 10 mA. Each experiment was conducted under a temperature of 35 ± 1 °C.

2.2.2. Measurement of Chloride Concentration

After the applied current reached the design time, the specimen was cut into cubes (50 × 50 × 55 mm) and then into two prisms (Figure 1d). Thin slices (1 mm) were further ground into fine powders for chloride analysis (Figure 1e,f). The powders were dried at 105 °C for 2 h and divided into three parts for testing free contents, bound contents, and microscopic chloride performance. Note that free chloride ions are water-soluble, while total chlorides are acid-soluble [52,53]. The chemical reaction equation is as follows:
A g + + C l A g C l w h i t e
When the solution turns brick red, the titration reaches the end point. The chemical reaction can be expressed as follows:
2 A g + + C r O 4 2 A g 2 C r O 4 b r i c k   r e d
The measurement of acid-soluble chloride ions is used to determine the total content of chloride ions in the mortar. The chemical reaction can be given as follows:
A g + e x c e s s + C l A g C l
A g + s u r p l u s + S C N A g S C N
The endpoint of titration can be determined by the following chemical reaction equation:
F e 3 + s u r p l u s + S C N F e S C N 2 +
The free chloride content ( C f ) was determined by the precipitation titration method using AgNO3 as titrant, with the chemical reaction given in Equation (1). The total chloride content ( C t ) was measured by back titration after dissolving in nitric acid, following Equations (2)–(4). The bound chloride content ( C b ) was obtained as the difference between total and free chloride contents. Representative titration procedures are illustrated in Figure 1j.

2.2.3. XRD and MIP Test

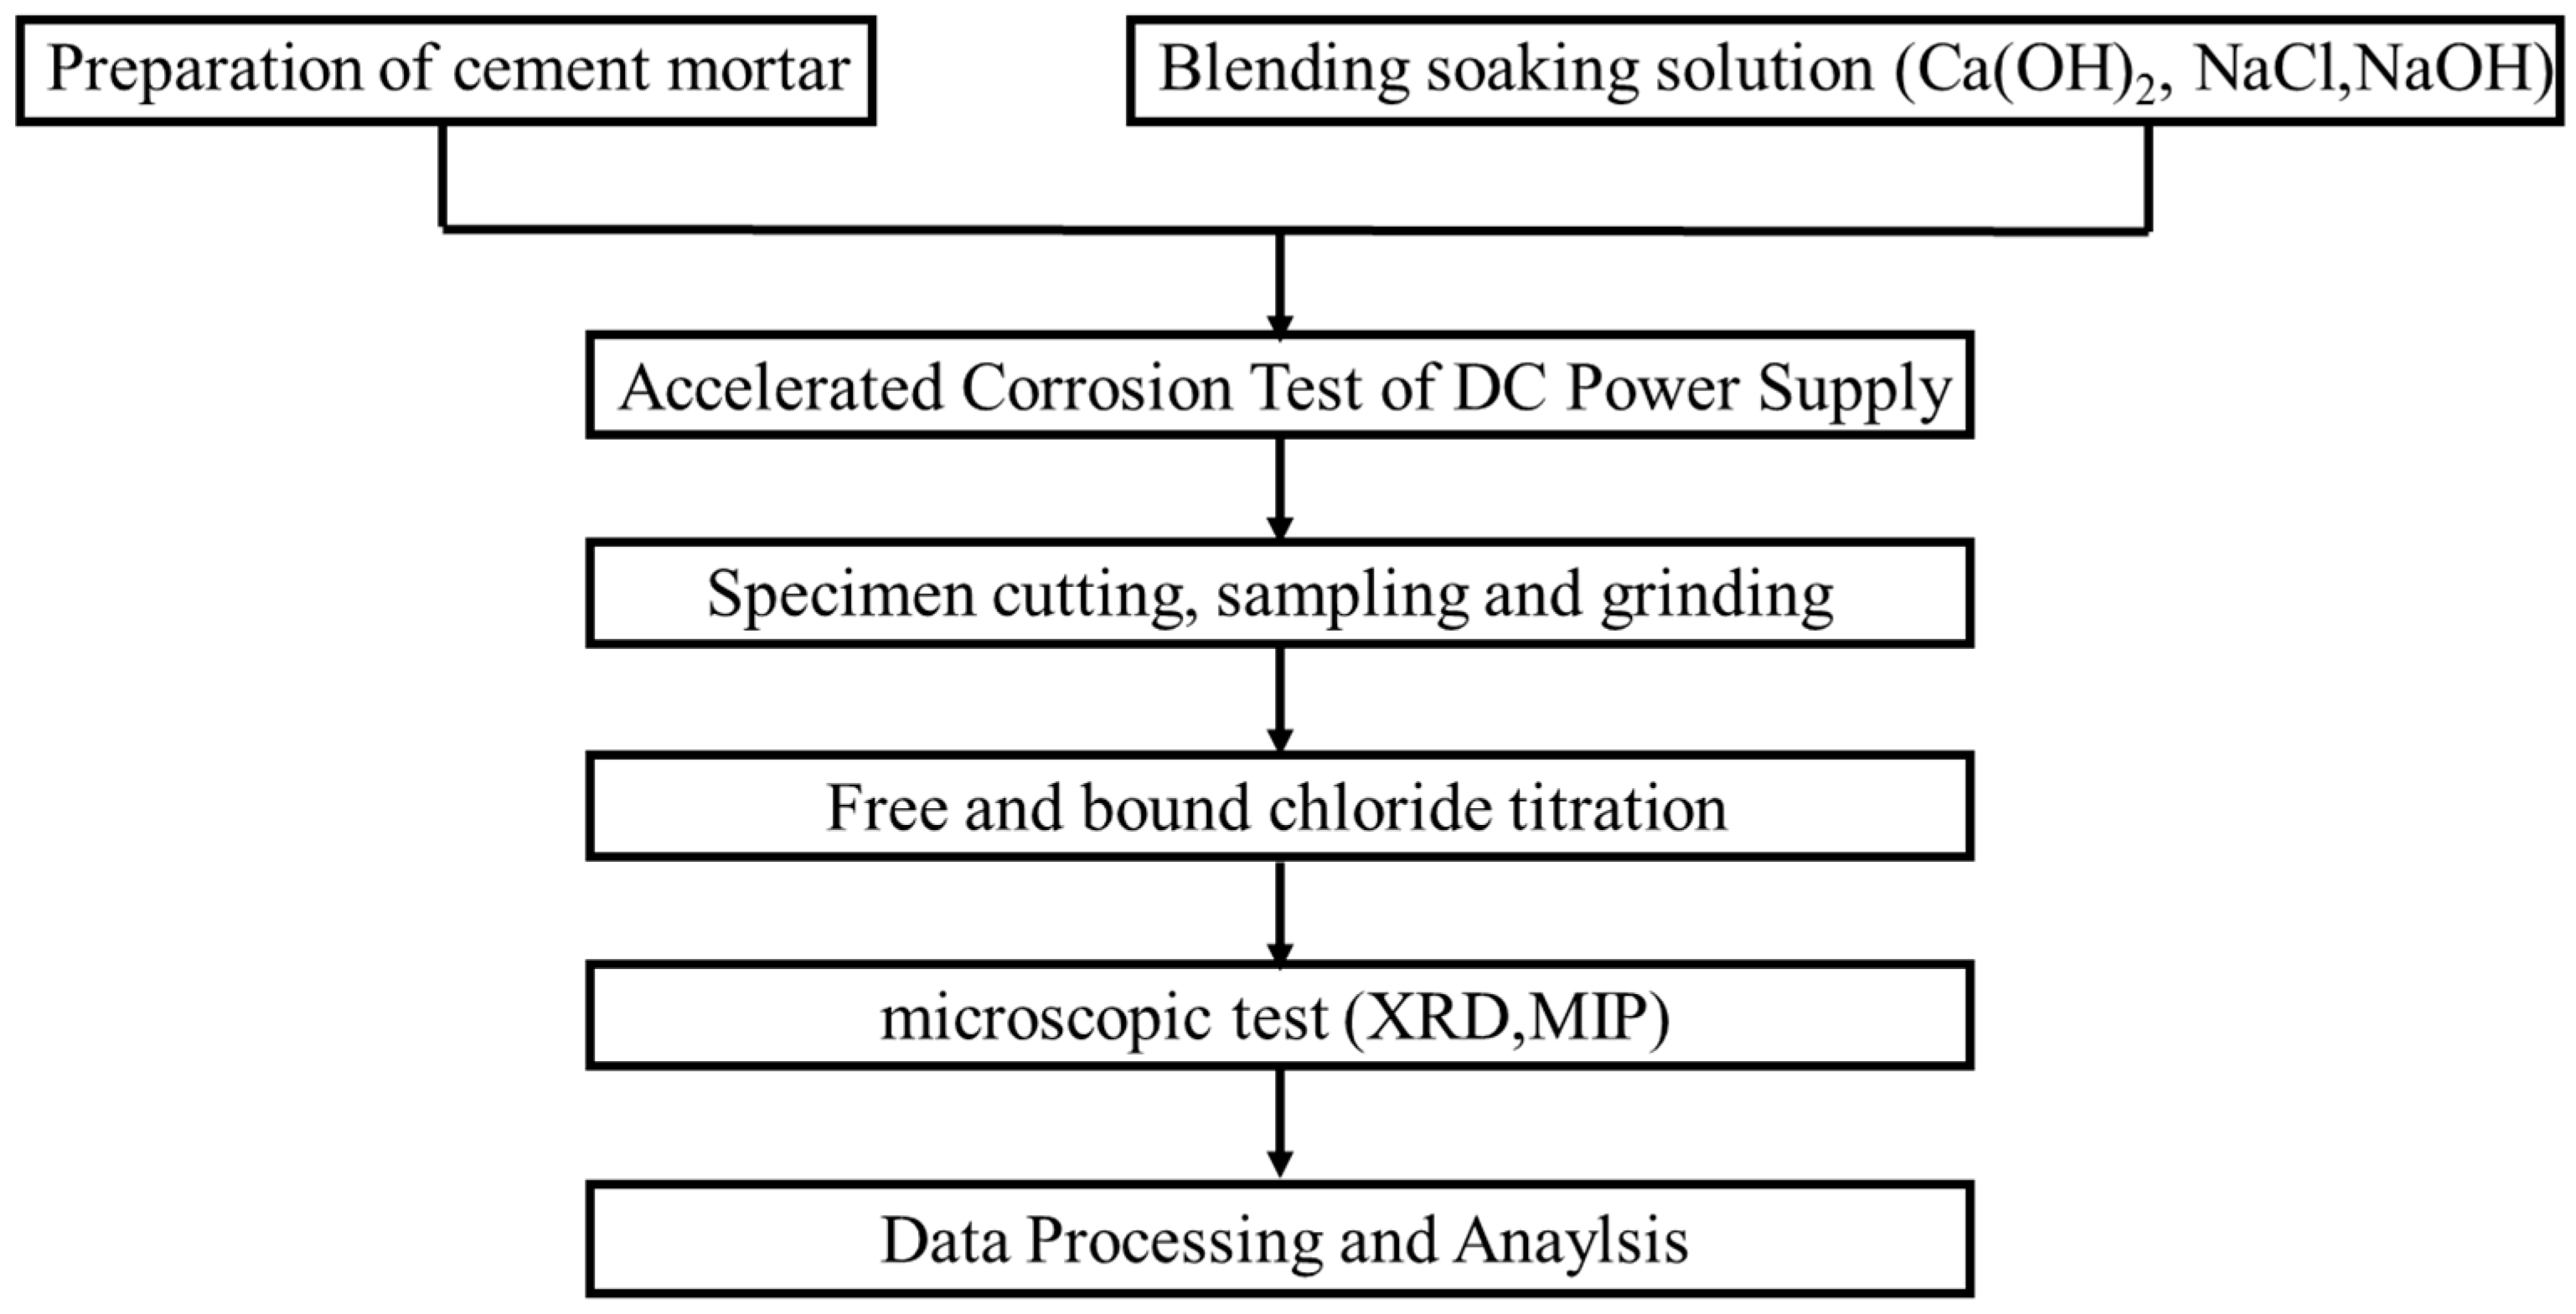
Here, X-ray diffraction measurements (XRD) and the mercury intrusion porosimetry test (MIP) microscopic were also used to explore the phase composition and pore structure of the specimen, respectively. For the XRD test, a beam of monochromatic X-rays is incident on the crystal, and the X-rays scattered by different atoms interfere with each other, resulting in strong X-ray diffraction in some special directions. The orientation and intensity of the diffraction lines in space are closely related to the crystal structure. According to the θ of the diffraction line and the corresponding peak intensity, the material composition and change in the sample can be analyzed. The XPERT-PRO produced by PANalytical B.V. (Almelo, The Netherlands) was used in this experiment. A thin slice was taken out from the specimen with 30 days of corrosion under each current intensity. The sampling depth of this slice was 15 mm. Then, it was ground into 320 mesh for the test. Meanwhile, AutoPore IV 9500 produced by Micromeritics (Norcross, GA, USA) was used in the MIP experiment. Before the test, a thin slice was removed from the specimen with 30 days of corrosion under current density of 0 A/m2, 0.3 A/m2, and 0.9 Am2. The sampling depth of this slice was 15 mm too. The overall experimental process in our work is shown in Figure 2.

3. Results and Discussion

3.1. Investigation of Free Chlorides Under Current Densities

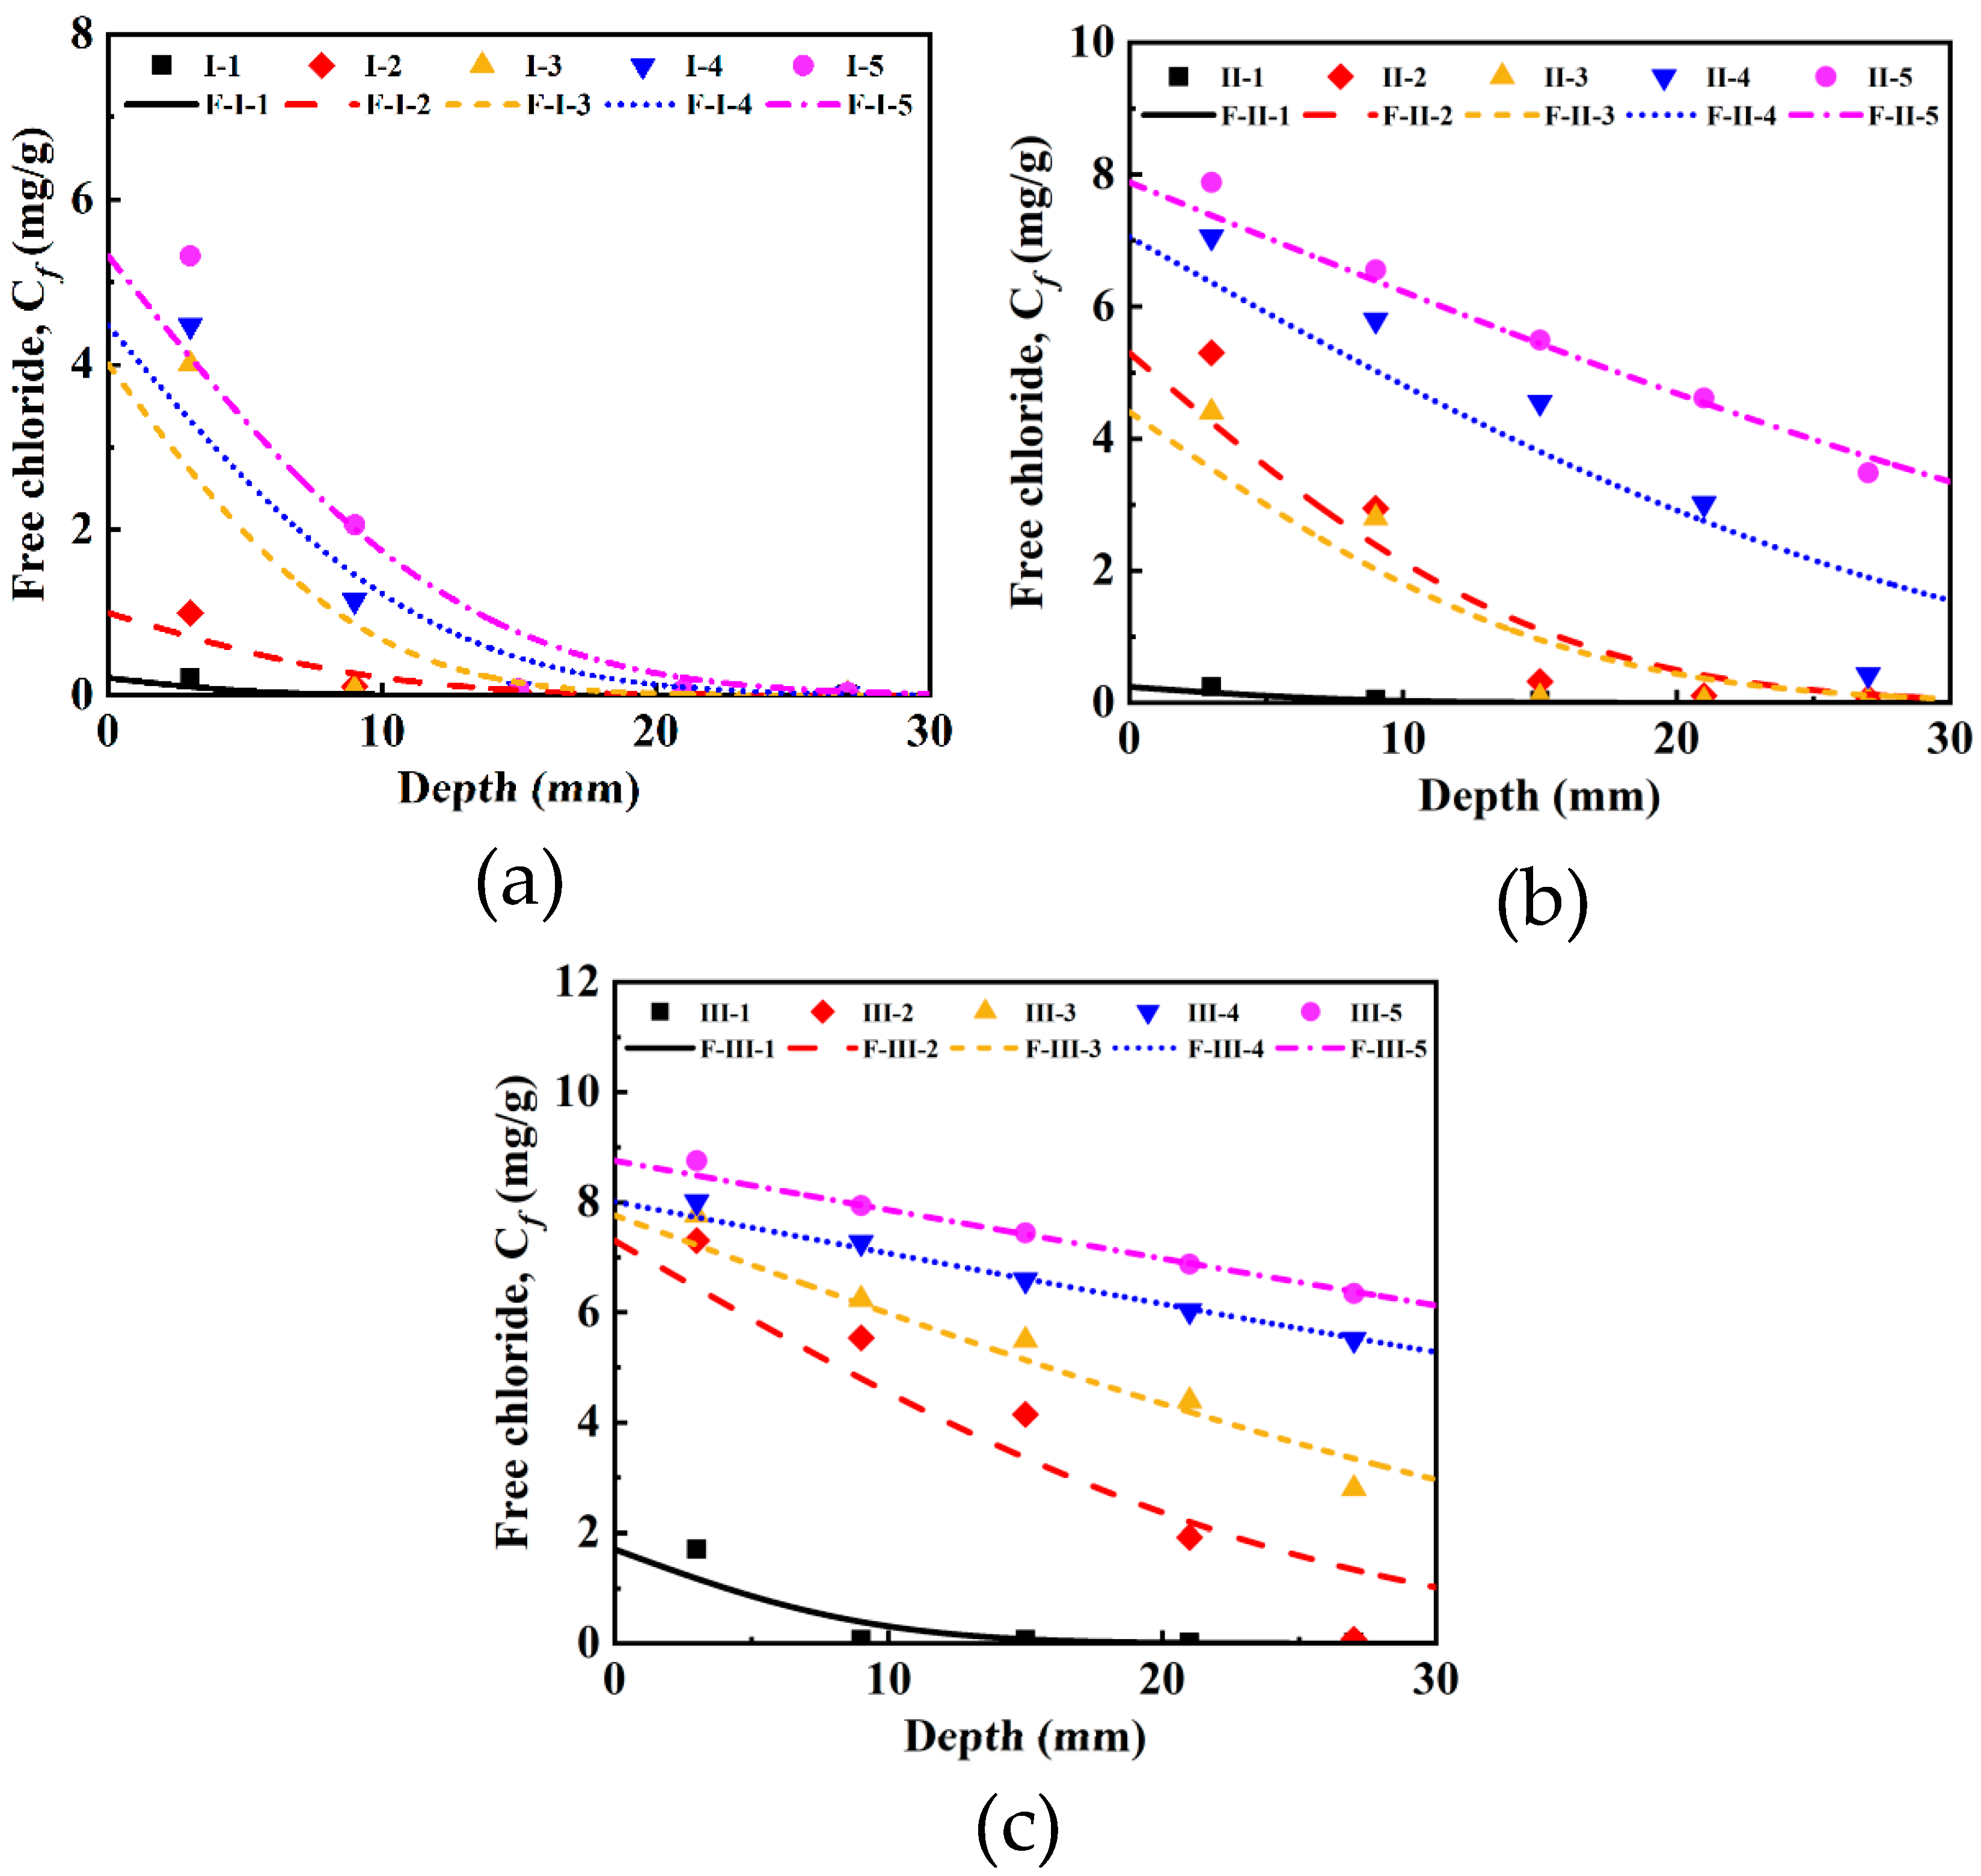
In Figure 3, the concentrations of free chloride ions along the depths are plotted at different current densities of 0, 0.3, 0.6, 0.9, and 1.2 A/m2, with erosion periods of 10, 20, and 30 days, respectively. It can be found that the application of current can significantly increase the amount of chloride ions, and stronger current density causes higher free chloride concentrates with smaller gradient values [47]. For group III, there is no obvious change in the gradient of the free chloride profile at current densities of 0.9 and 1.2 A/m2. Alternatively, it can be considered that a stable chloride ion migration channel has formed, and it can be speculated that the free chloride ion content in these layers has begun to approach the threshold value. In the groups of II-2 and II-3, the electric field is at a low value. The results show that the free chloride ion is not in equilibrium in the specimen. In this case, the chloride ion is not only affected by the electric field, but also by the diffusion effect, which depends on the porosity of the mortar in the process of ion continuous migration.

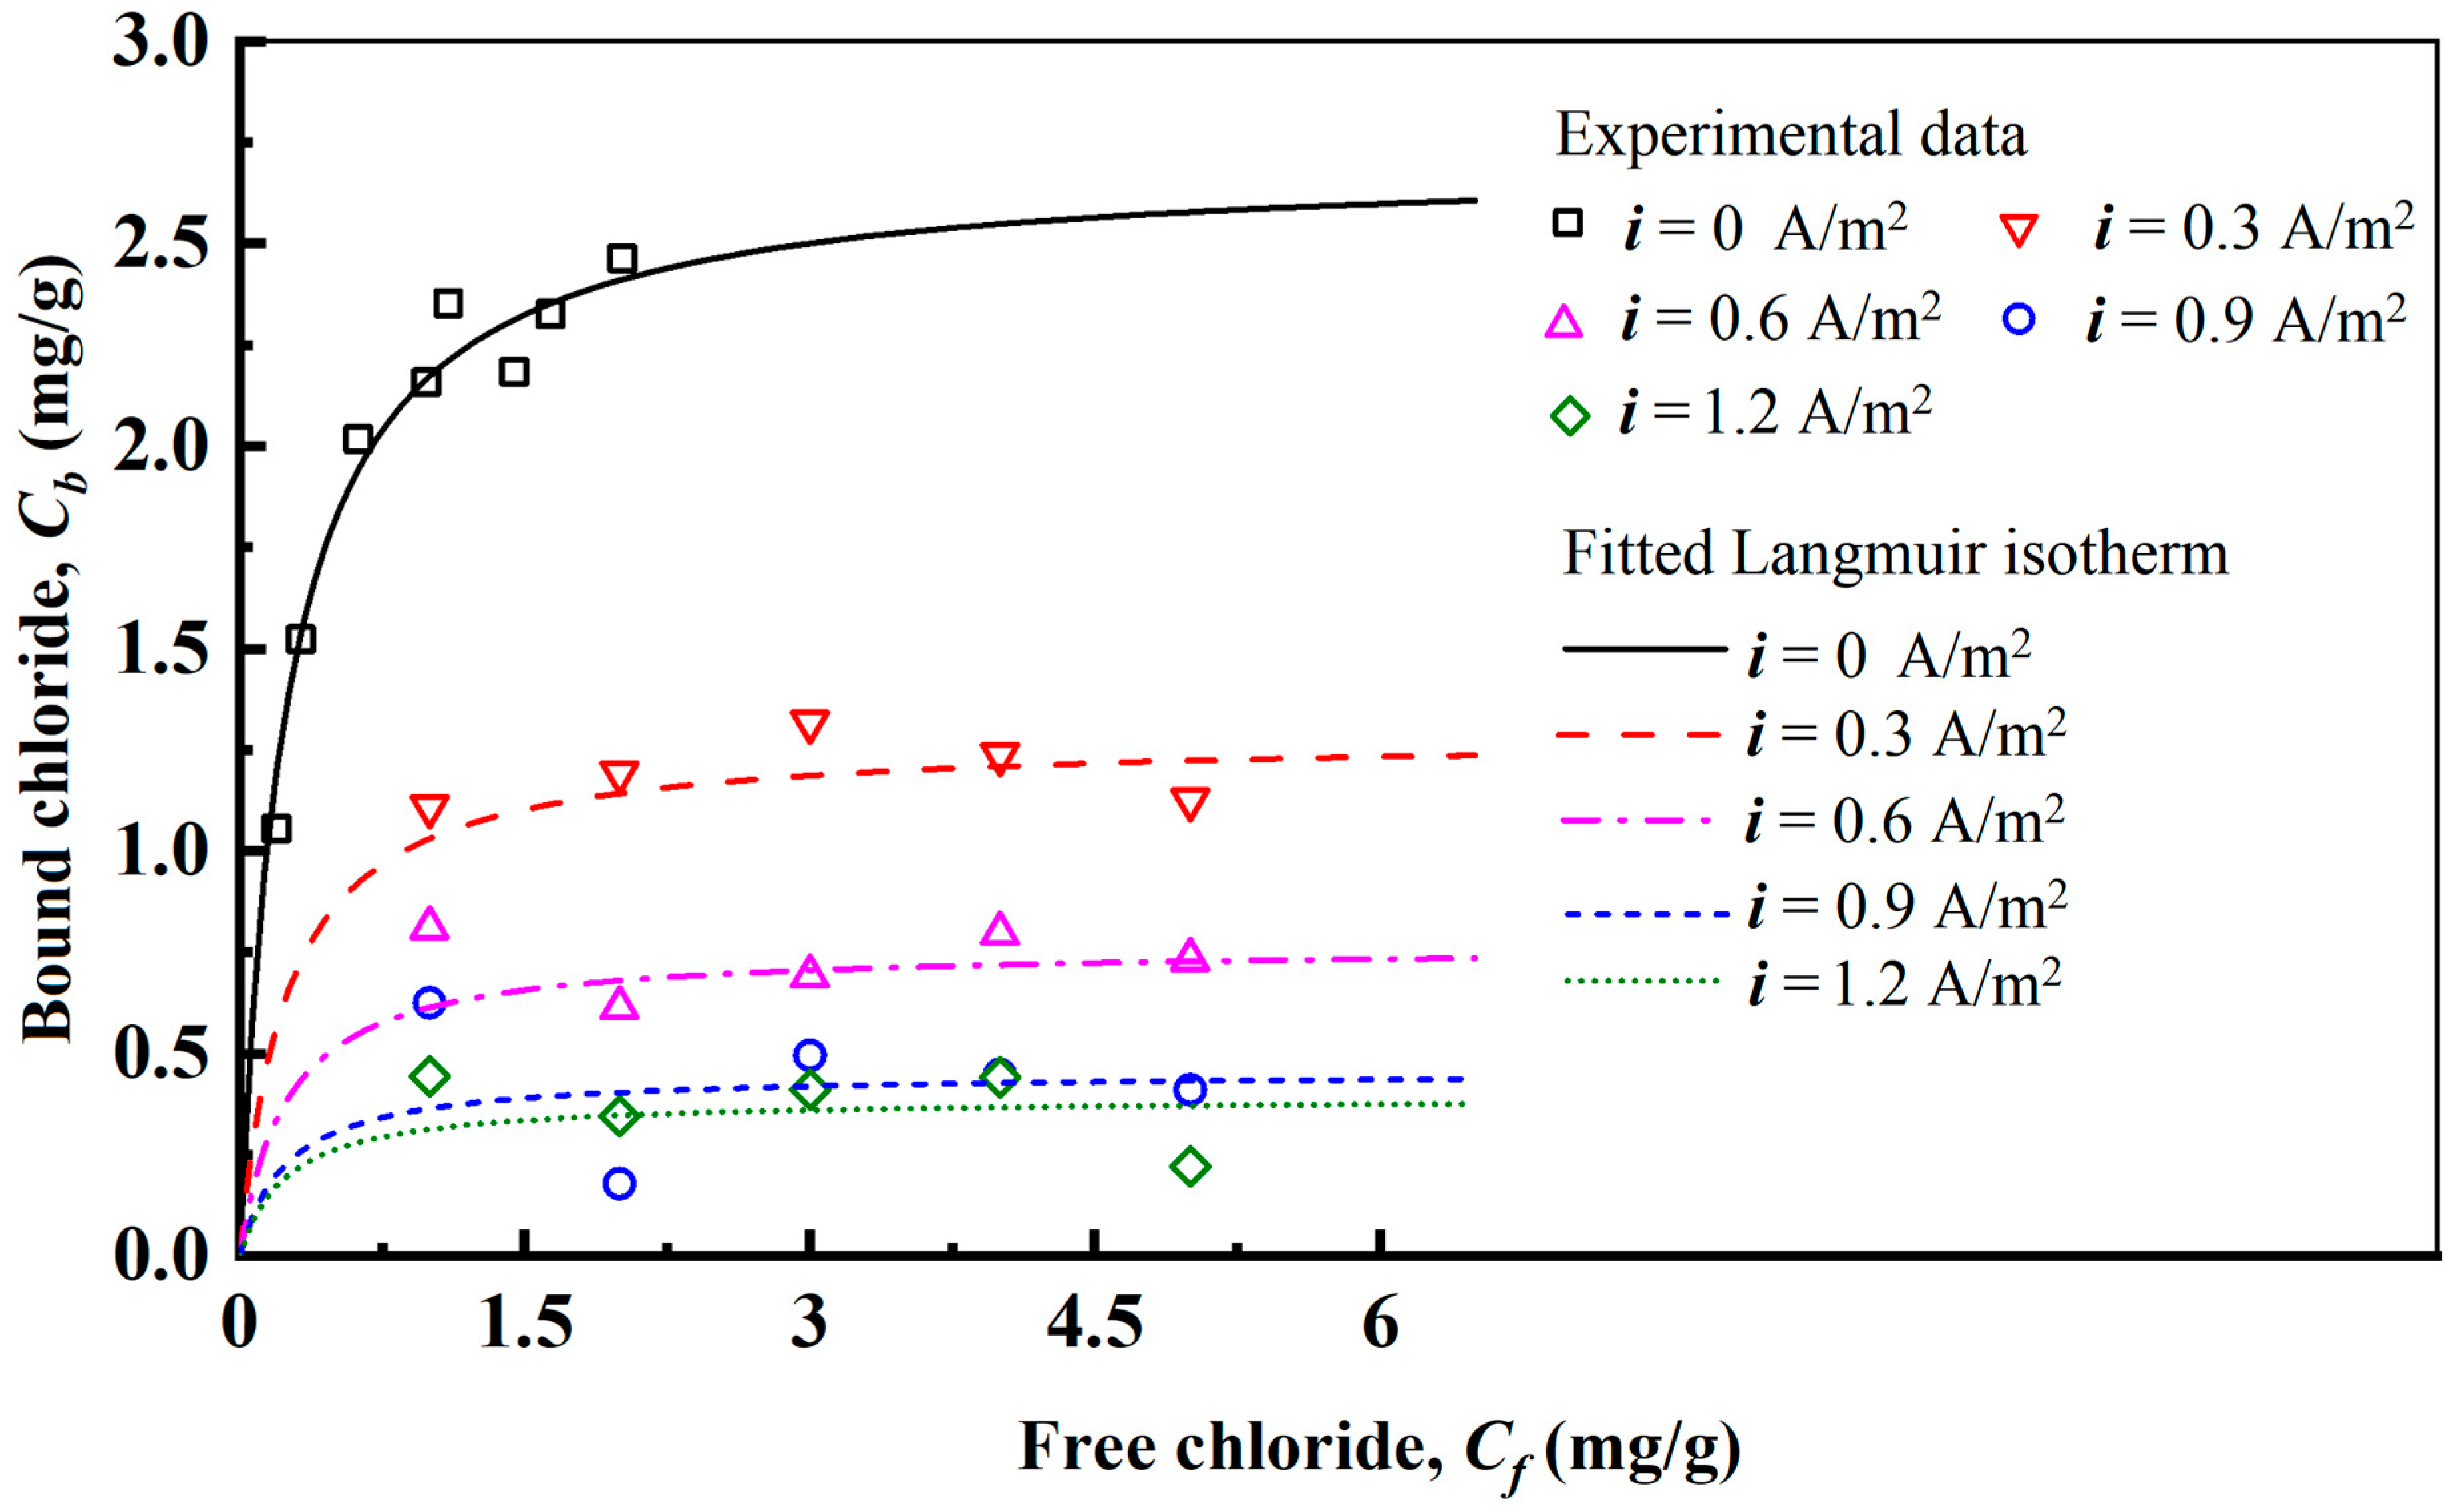
3.2. Chloride Binding Isotherms Under Current Densities

The Langmuir binding isotherm is often used to describe the binding capacity relationship between free chloride ions and bound chloride ions when the concentration is balanced [54]. Its expression is given as below:
C b = α C f 1 + β C f
where α and β are the Langmuir binding constants.
Note that, during the process of free chloride ions invading the interior of the concrete under the action of the electric field, the free and bound chloride ions in each layer may not reach an equilibrium within a short testing period [55]. Therefore, after ensuring that they were in equilibrium, we measured the content of free and bound chloride ions again and analyzed the evolution of the chloride ion binding ability. These data were reported in [46]. Here, the chloride binding capacity of cementitious specimens under various current electric densities is presented in Figure 4. It can be found that the binding capacity of specimens to chloride ions has decreased in varying degrees under the effect of the electric field. As the current density increases, the binding ability rapidly weakens. But, ultimately, the chloride binding capacity was still preserved to a certain extent. Especially at weaker current densities (such as 0.3 A/m2), the adsorption capacity of the cementitious materials for free chloride ions is still very significant. This shows that the transport of chloride ions in cementitious materials under the action of an electric field cannot be considered as the transport of particles in an ideal porous media. Further discussion and improvement are still needed when using the traditional Nernst–Planck equation to predict its concentration distribution.
Setting β = 4.08 as a fixed constant, the evolution of α with current density is shown in Figure 5. The evolution of the α value can be considered as the degree of attenuation of chloride binding capacity at different current densities. At current densities of 0.3, 0.6, 0.9, and 1.2 (A/m2), the decay ratio of the binding ability is 52.6%, 71.8%, 83.2%, and 85.6%, respectively. The evolution of the Langmuir binding constant α corresponding to various current densities can be fitted as follows:
α   = α 0 + 9.6 · 1 e i 0.29
where α 0 = 11.04 is the initial value of α when no electric field is applied.

3.3. Discussion of Chloride Comprehensive Migration Coefficient

Fick’s second law is commonly used to describe the transport behavior of chloride ions in cementitious material. In previous studies, many scholars assumed that the effect of an external electric field on chloride ion transport also follows Fick’s second law. Then, the apparent diffusion coefficient of chloride ions in the cementitious specimens can be approximately fitted through the acceleration experiment of chloride ion electrification [35]. For a one-dimensional situation, its governing equation can be described as follows [56]:
C f x , t t   =   D 2 C f x , t x 2
where C f is the content of free chloride ions, t is the corrosion time, x is the depth, and D is the apparent diffusion coefficient. In this work, the transport process of chloride ions can be regarded as a semi-infinite problem. If there is no chloride binding, or the binding isotherm is linear, the one-dimensional transport model of chloride ions in cementitious material can be analytically obtained by the error function solution, i.e., the following [57]:
C f x , t   =   C f s C f s C f i e r f x 2 D t
where C f s is the free chloride content on the boundary surface, and C f i is the initial concentration of free chloride ions.
If the transport of chloride ions under an electric field still meets Fick’s second law, the apparent migration coefficient of chloride ions D m can be fitted by the experimental data through the adjustment of Equation (9), i.e., the following:
C f x , t   =   C f s C f s C f i e r f x 2 D m t
The values of D m in each test group are summarized in Table 4, Table 5 and Table 6. And Figure 6 gives the comparison between the experimental data and the fitting curves for the distribution of chloride ion concentration. Note that D m is a comprehensive migration coefficient, including the diffusion effect and electromigration effect simultaneously. It can be observed that the migration of chloride ions under the electric field is much greater than the chloride ion transport guided by diffusion and convection effects. Furthermore, the larger current density leads to the stronger transport of chloride ions. When the duration of the Rapid Chloride Migration (RCM) test is 10 days, D m has a low value. This indicates that the chloride ion transport channel has not been formed stably, and the transport resistance is still relatively high. With the increase in erosion time, the chloride transport in the specimen with a high current density is significantly enhanced.
As shown in Table 4, Table 5 and Table 6, we can find that the correlation coefficients R2 of the fitted values of D m are generally less than 0.9. This indicated that the data has a high degree of discreteness. That means it is difficult to accurately describe the transport process of chloride ions in cementitious material under the presence of an electric field using only Fick’s second law. Meanwhile, the value of D m is only simply fitted based on experimental data, without separating the influence of current intensity. But, obviously, the concentration gradient of chloride ions is highly correlated with the applied current intensity. Therefore, we should have further discussions to obtain the true electromigration coefficient, which depends solely on the properties of cementitious materials.

3.4. Determination of Electromigration Coefficient of Chloride Ions

3.4.1. One-Dimensional Analytical Solution of Nernst–Planck Equation Containing Independent Electromigration Coefficient

The transport flux of chloride ions in the pore solution under the action of the electric field force in a one-dimensional case can be described by the Nernst–Planck equation as follows [32,33]:
J f = D C f z i F R T D C f Φ + C f u i C f γ i γ i
where J f is the transport flux of chloride ions, u i is the advective velocity, γ i is the chemical activity coefficient, z i is the charge number, F = 96485   C · m o l 1 is the Faraday constant, R = 8.314   J · m o l 1 K 1 is the ideal gas constant, T is the absolute temperature, and Φ is the electrostatic potential.
As the pore solution is fully saturated with the diluted solution and there are no pressure differences, the terms of convection and chemical activity can be ignored. Then, the extended Nernst–Planck equation can be simplified to a diffusion–electromigration form, i.e., the following:
J f = D C f z i F R T D C f Φ
where z i F · D / R T is the influence term of electric potential on the transport of chloride ions, which is dependent on the apparent diffusion coefficient.
However, the Nernst–Planck equation only has an effective predictive effect on the transport of particles in ideal porous media materials. The measurement of bound chloride content under different current densities in the previous text indicated that cementitious materials still retain a certain binding ability to chloride ions even under electric fields, especially under weak electric fields. Therefore, the formula for the electromigration coefficient of chloride ions in cementitious material D e l = z i F · D / R T may not necessarily hold true, and using the apparent diffusion coefficient to calculate the effect of electromigration will inevitably result in significant error.
In this work, we will try to directly fit the specific value of the electromigration coefficient based on the experimental data. The pure electromigration flux of chloride ions J e f with the independent electromigration coefficient D e l can be expressed as follows:
J e f = D e l C f Φ
In cementitious material, it can be considered that the potential decreases linearly along the direction of the electric field [30,58]. Although some recent studies have explored non-linear potential distributions and boundary effects [59,60], our derivation mainly follows the traditional RCM-based model, in which the linear potential assumption has been widely adopted and has proven effective within the applied voltage ranges. Hence, we can obtain the following:
E   =   Φ x
J f = D C f + D e l C f E
where E is the electric field intensity.
Then, for a one-dimensional situation, the governing equation for chloride ion transport can be given by the following:
C f t   =   x D C f x D e l C f E
For the stable boundary condition [36], an analytical solution for chloride ion transport under the electric field with the independent electromigration coefficient D e l as the independent variable can be obtained, i.e., the following:
C f   =   C f s 2 e D e l E x D e r f c x + D e l E t 2 D t + e r f c x D e l E t 2 D t
Equation (17) is the theoretical basis for the determination of the chloride migration coefficient using the unsteady electromigration method. Assuming that the resistivity of the specimens is a constant, the relationship between E and the current density can be obtained by basic physics equations as follows:
E   =   U d
I = U R
R = ρ L S
i = I S
where L and d are the width of each specimen AA’BB’ and distance between the plates, respectively, and are considered to be approximately equal; S is the cutting cross-sectional area of the specimen; R is the resistance value of the specimen; i is the current density of the specimen; and ρ is the resistivity of specimen, which is assumed to be 0.127 Ω·m [61]. Then, the analytical solution Equation (17) can be adjusted as follows:
C f   =   C f s 2 e i ρ D e l x D e r f c x i ρ D e l t 2 D t + e r f c x + i ρ D e l t 2 D t

3.4.2. Electromigration Coefficient Fitting Based on Experimental Data Corresponding to Different Current Densities

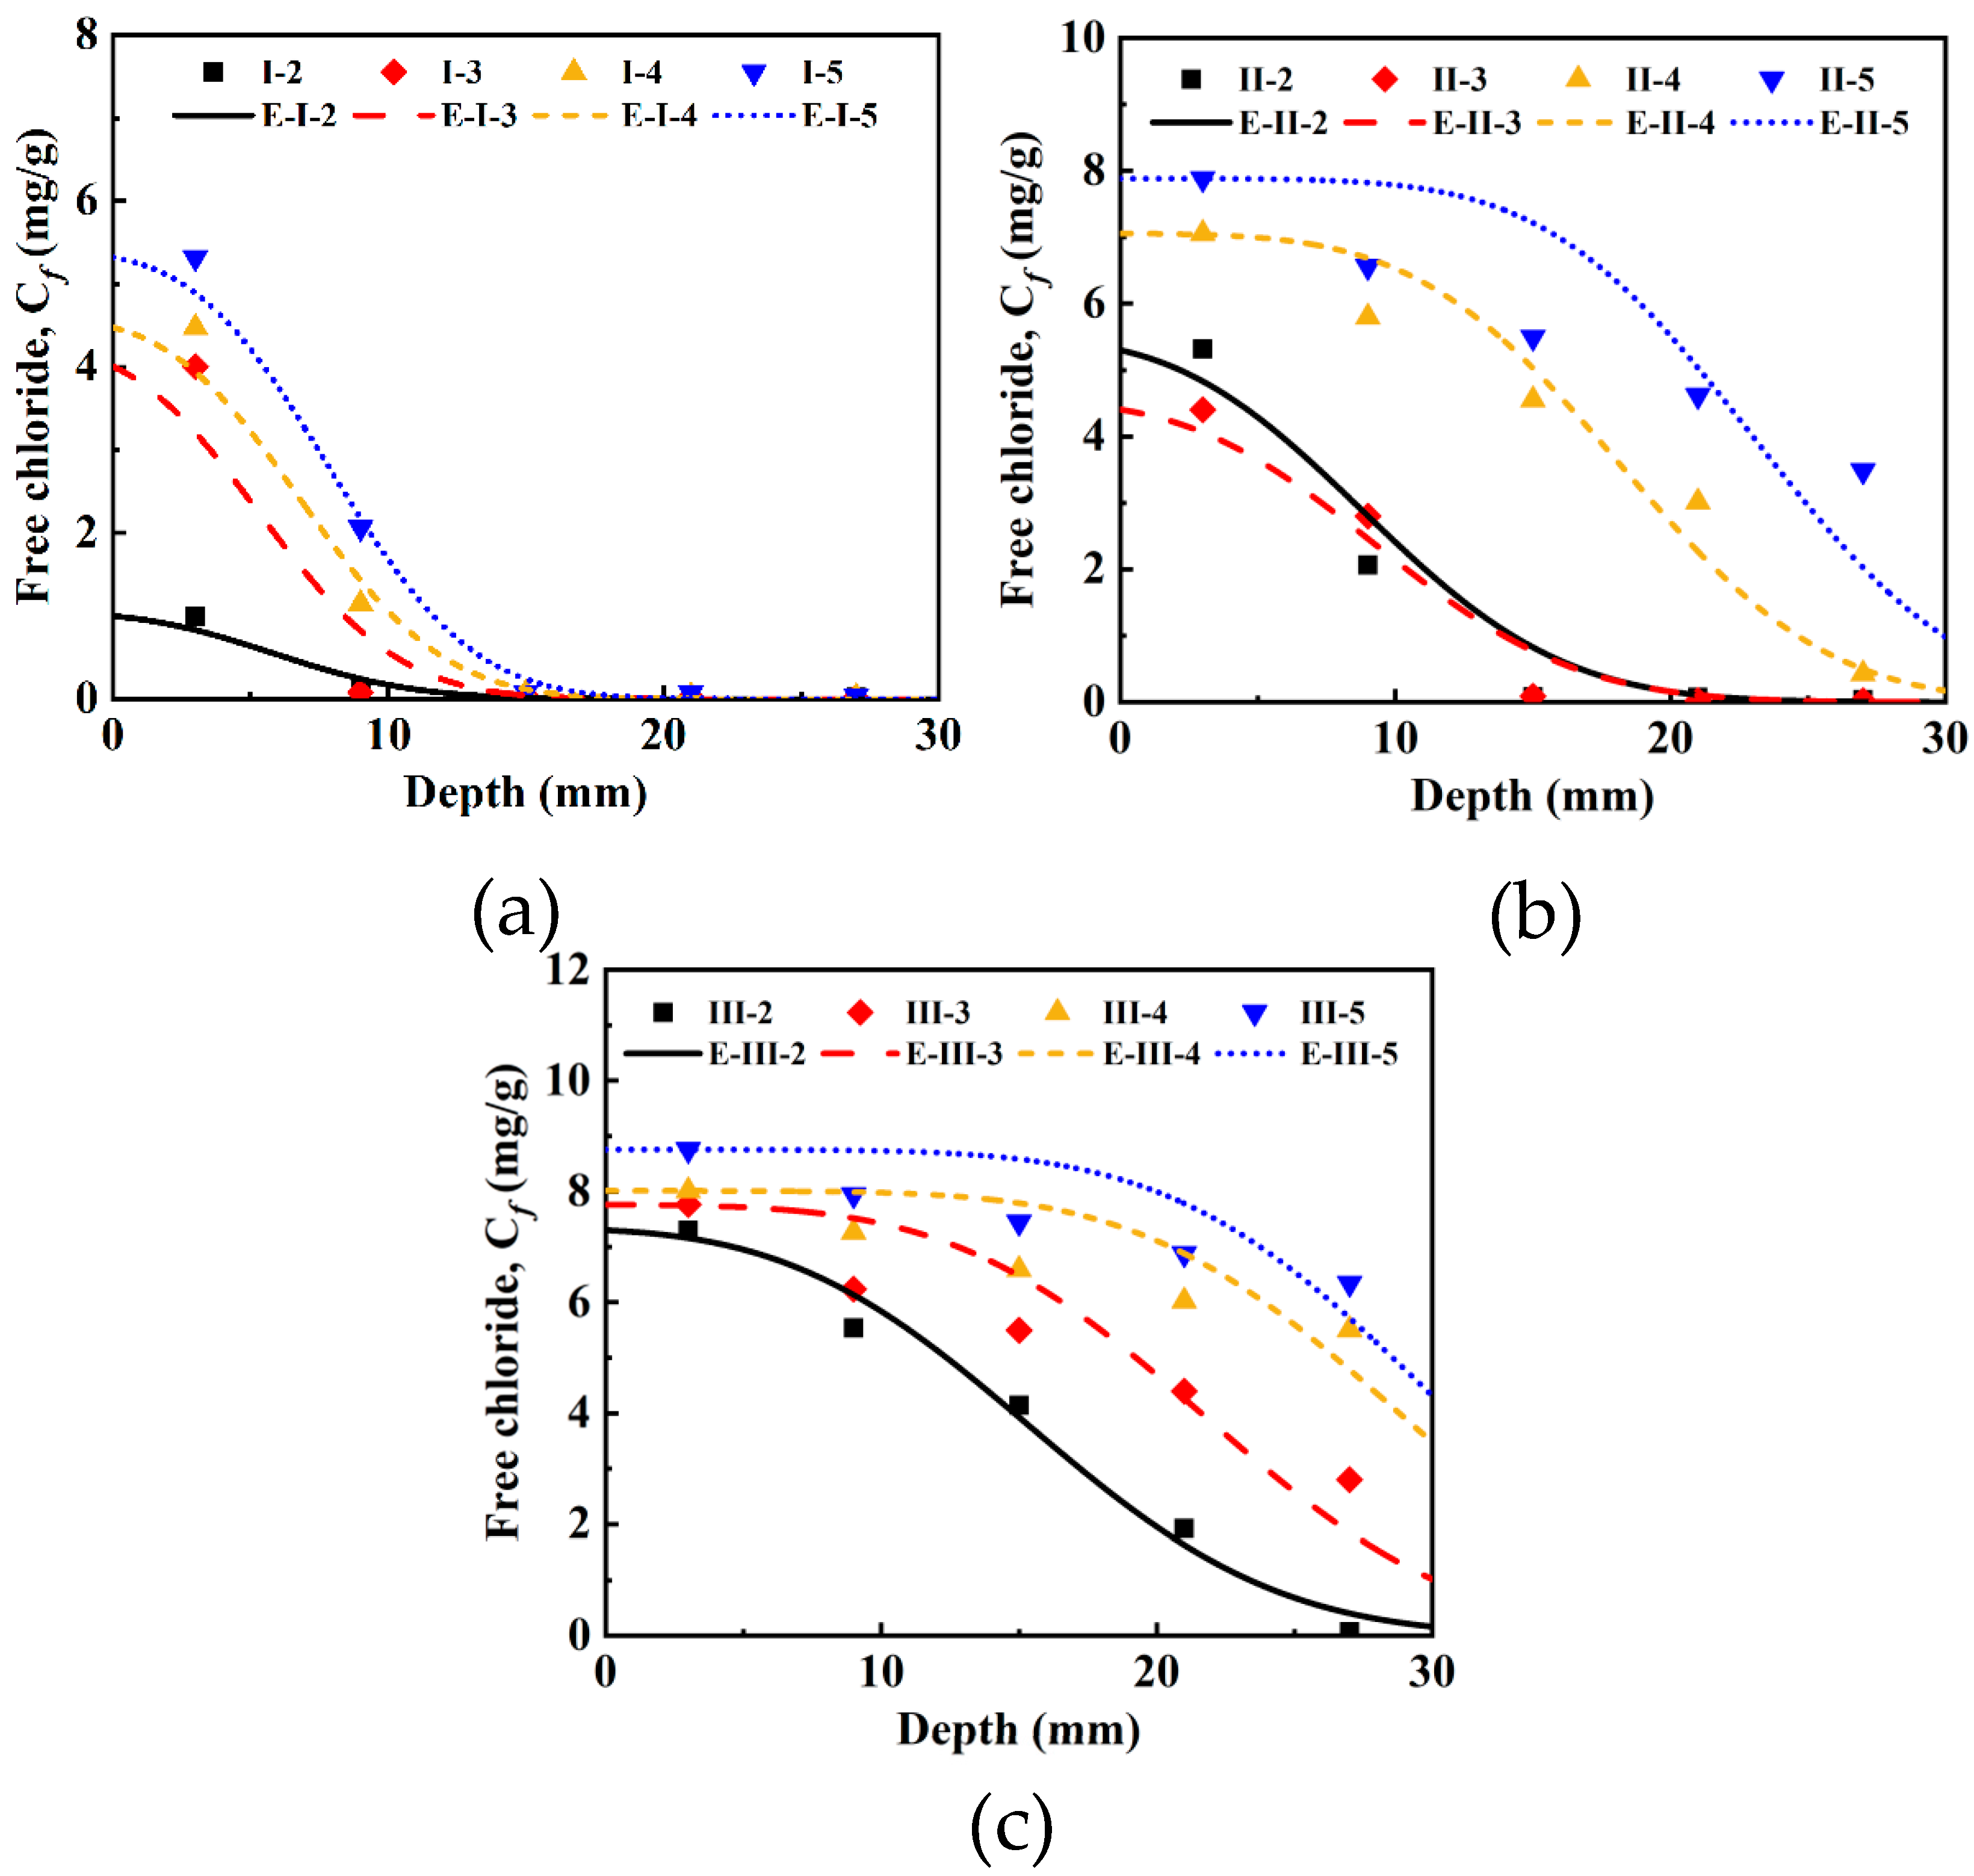
According to the experimental data, the values of D e l fitted according to Equation (22) are shown in Table 7, Table 8 and Table 9. Figure 7 and Figure 8 present the electromigration curves of chloride ion concentrations and the D e l distribution with different current densities. Through the analysis of the correlation coefficient R2, it was found that the discreteness was effectively controlled. This proves the reliability of this fitting scheme. The negative value of D e l is due to the negative charge of chloride ions as the object of study. From the above derivation process, it can be seen that D e l is related to material properties, but not to the erosion time and current density. It is noteworthy that the absolute value of D e l is much higher than the rest when the current density is 0.3 A / m 2 , as shown in Figure 8. This may be due to differences in the binding ability of chloride ions under different corrosion current densities. This phenomenon will be discussed in detail in the following text.
Moreover, it is worth noting that, at higher current densities and longer durations, the D m model tends to show a better fitting performance than the D e l model, since it directly reflects the measured diffusion behavior. By contrast, the D e l model, which incorporates binding corrections, is more suitable for moderate current density conditions where the chloride binding capacity plays a significant role.

3.4.3. Relationship Between Electromigration Coefficient and Diffusion Coefficient

Based on the Nernst–Planck theory, there is a linear relationship between the electromigration coefficient and diffusion coefficient of particles in ideal porous media materials. But cementitious material is special. It has a certain binding ability to chloride ions under an electric field. At present, the relationship between the electromigration coefficient and the apparent diffusion coefficient (or pure effective diffusion coefficient) of chloride ions is not clear. Here, we will discuss them separately.
Firstly, we construct a linear relationship between the electromigration coefficient and the apparent diffusion coefficient, i.e., the following:
D e l = η · D
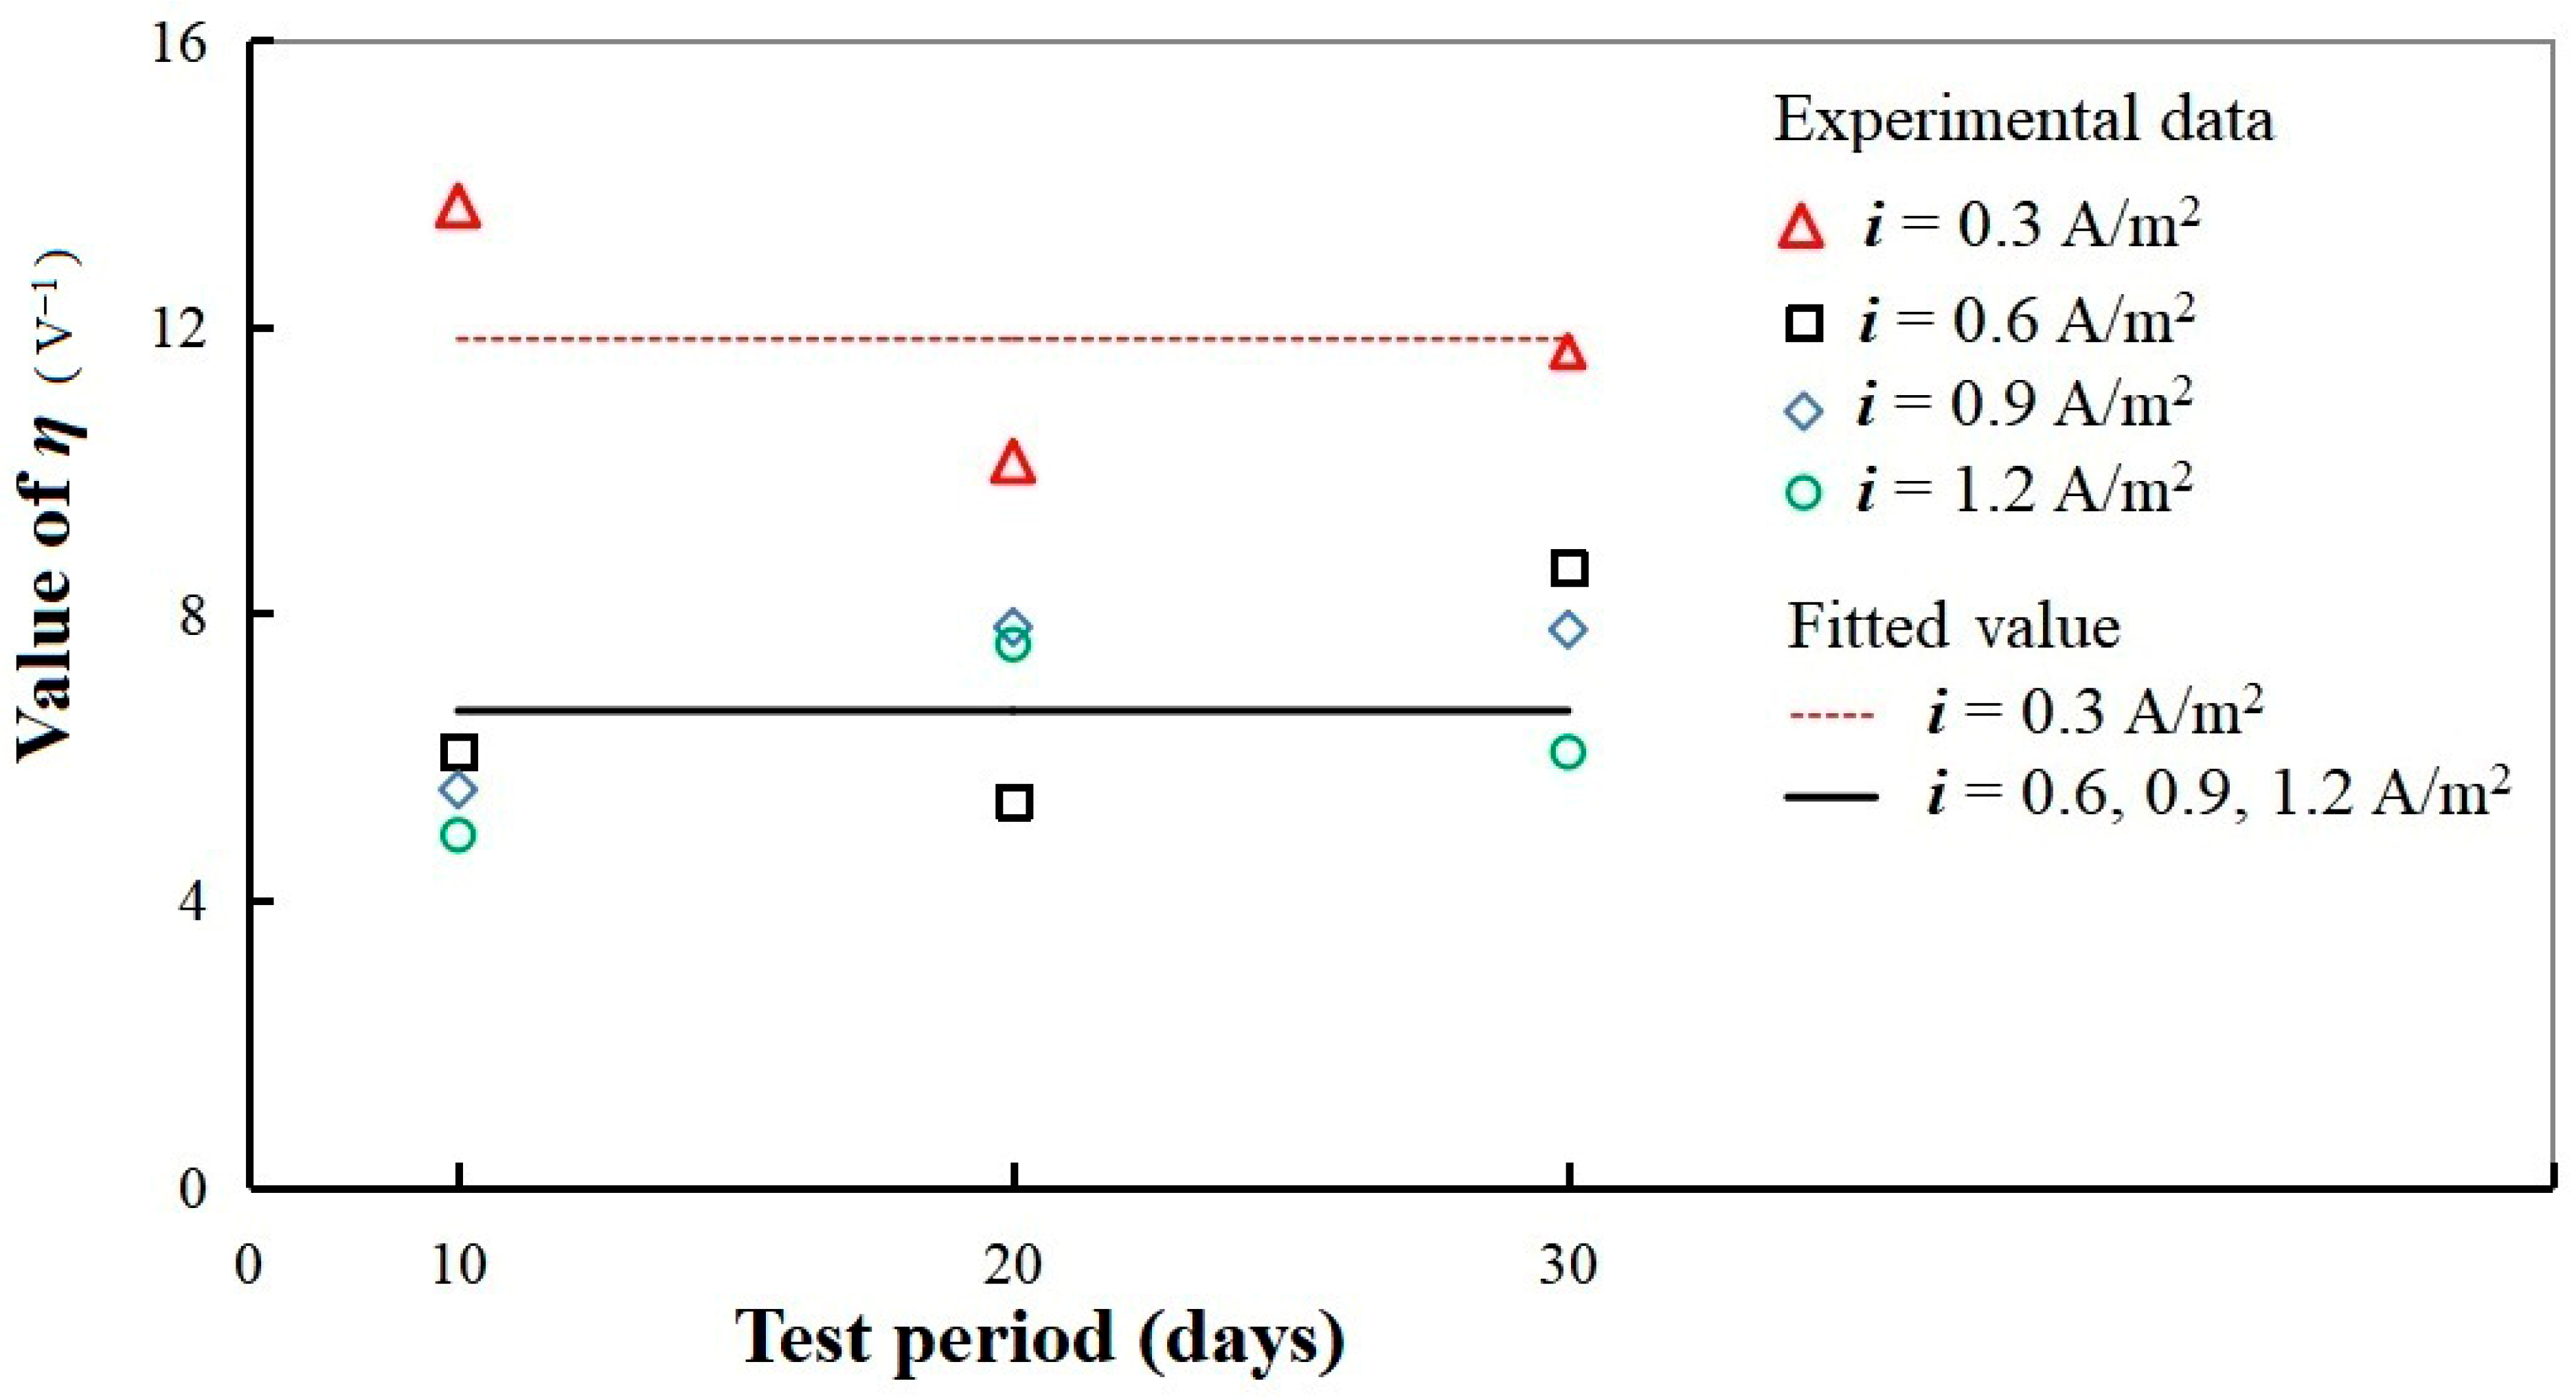
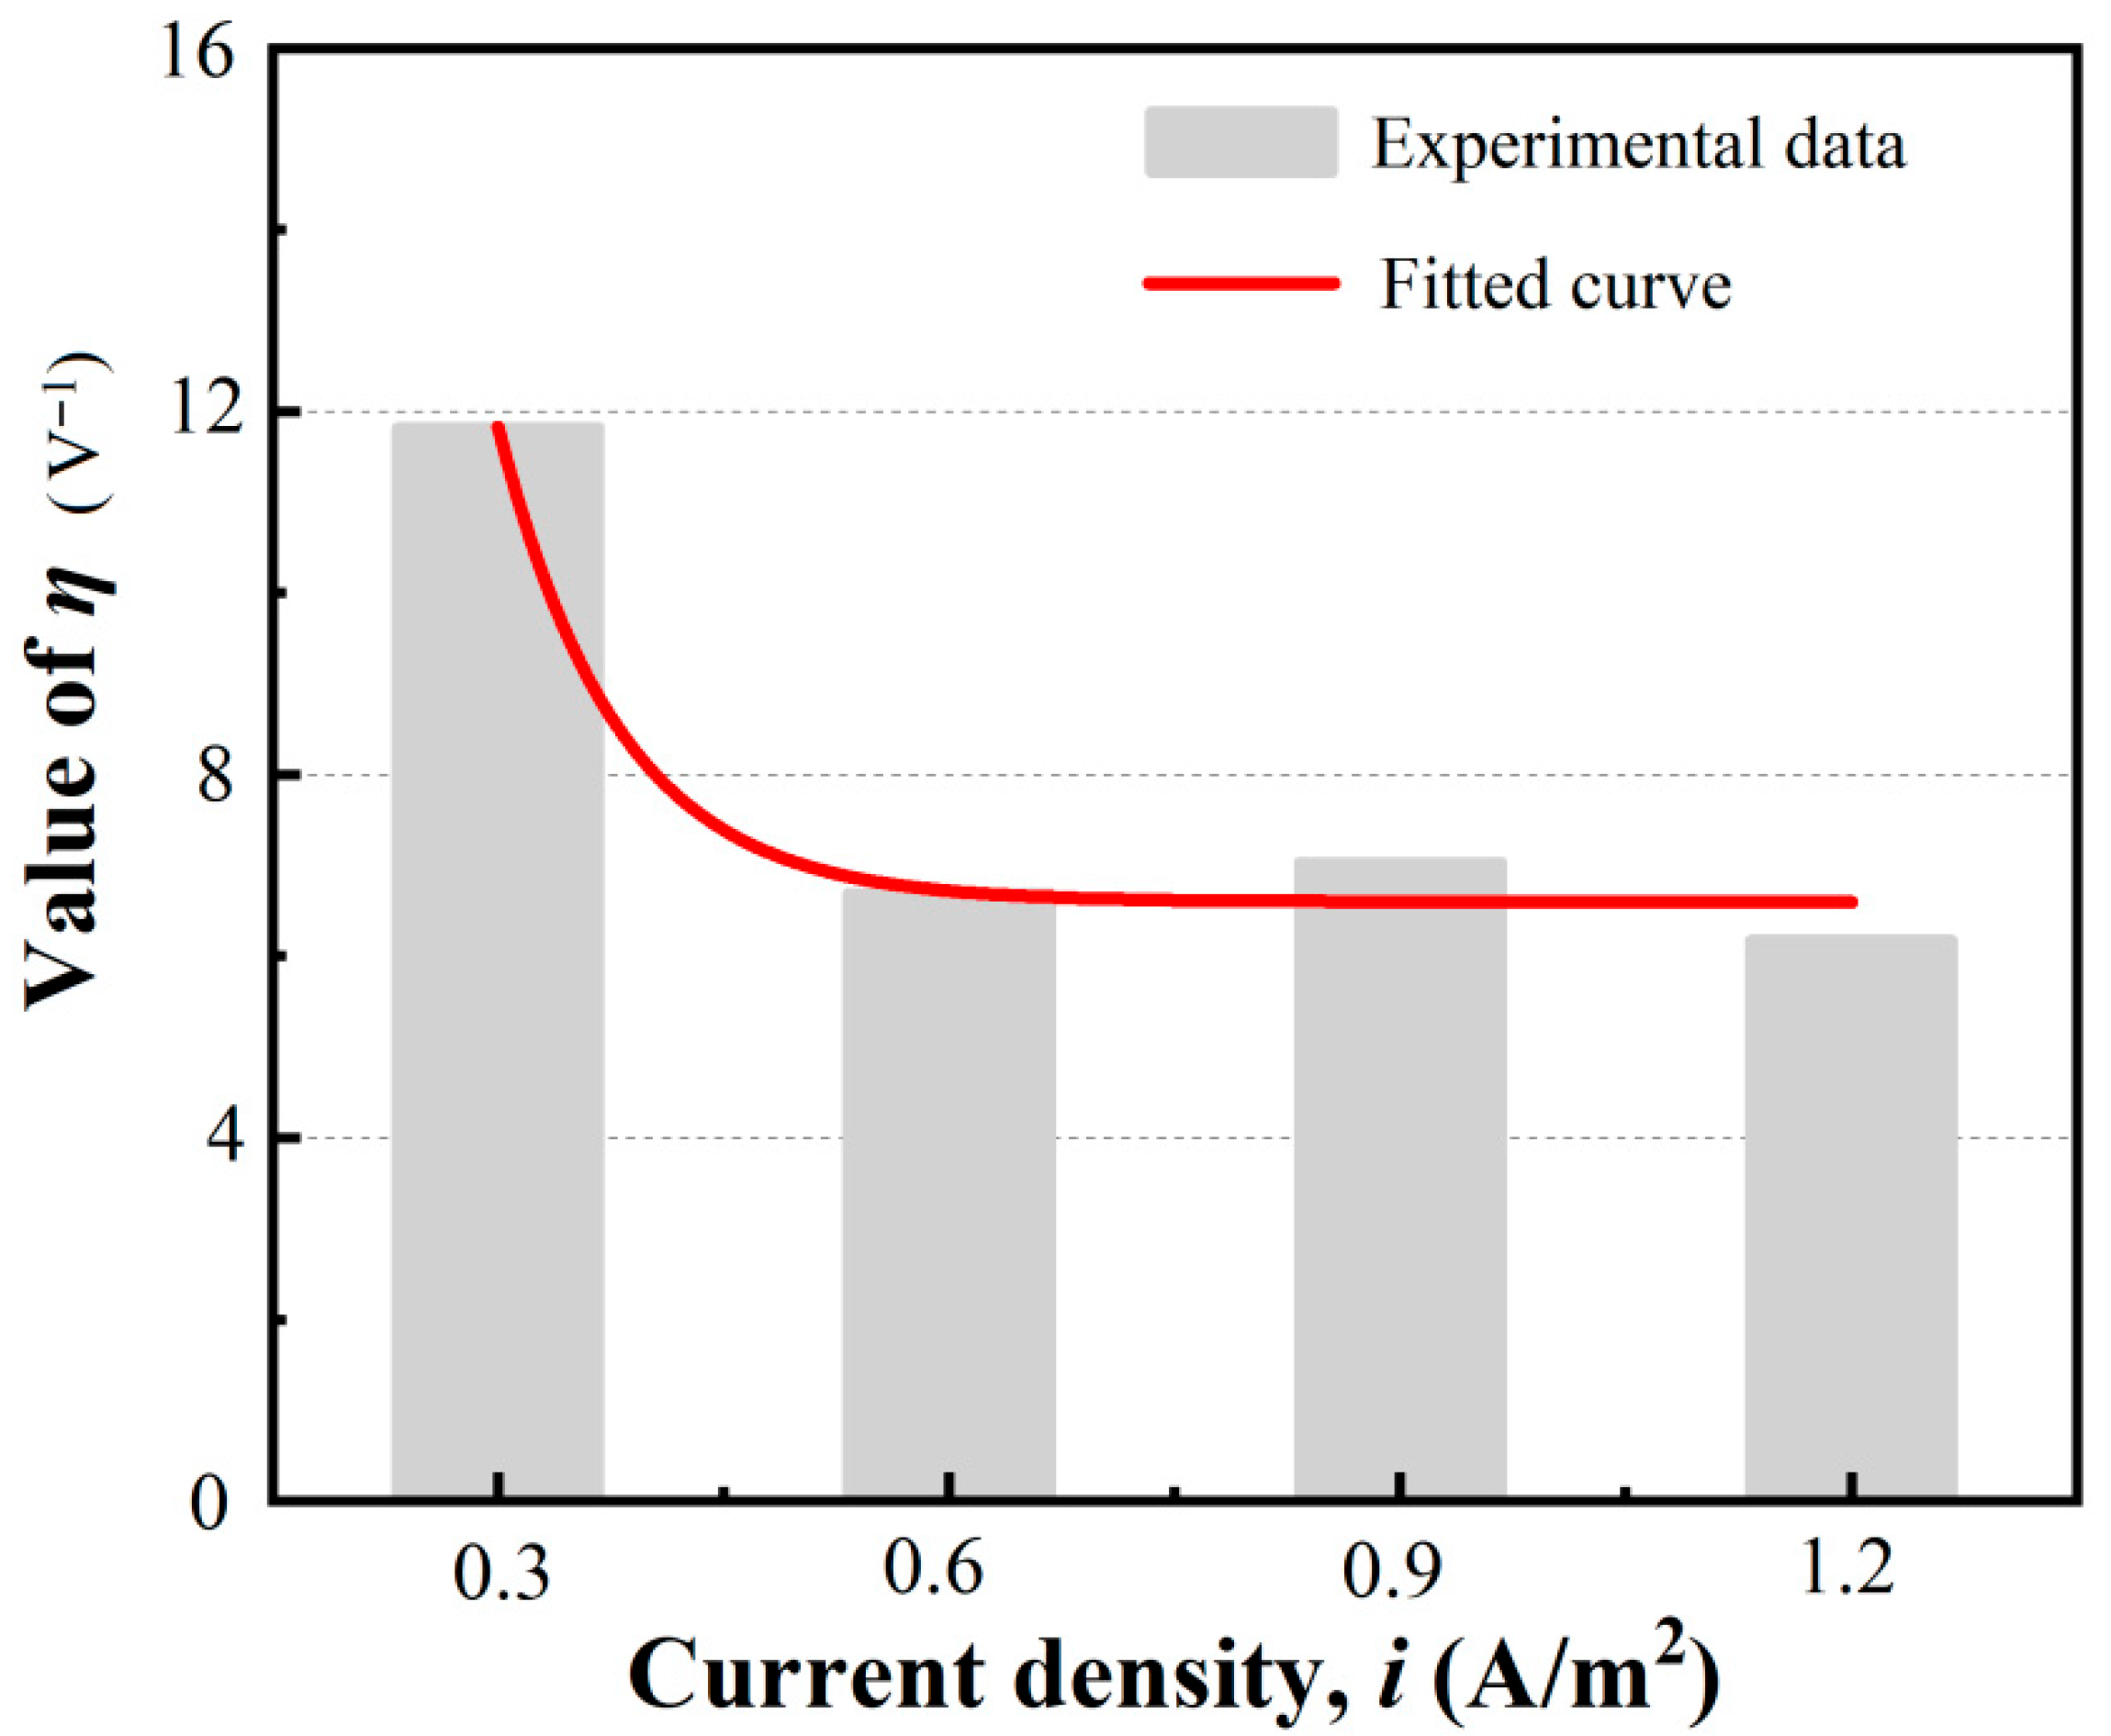
where η is a set parameter, ( V 1 ). Based on experimental data, the value of η can be fitted, as shown in Figure 9. It can be observed that the value of η with a 0.3 A / m 2 current density is significantly higher than the values fitted with the other three sets of data. The evolution trend of η corresponding to different current densities is given in Figure 10. Its expression can be given by the following:
η   = 6.6 + 226.8 · e i 0.08
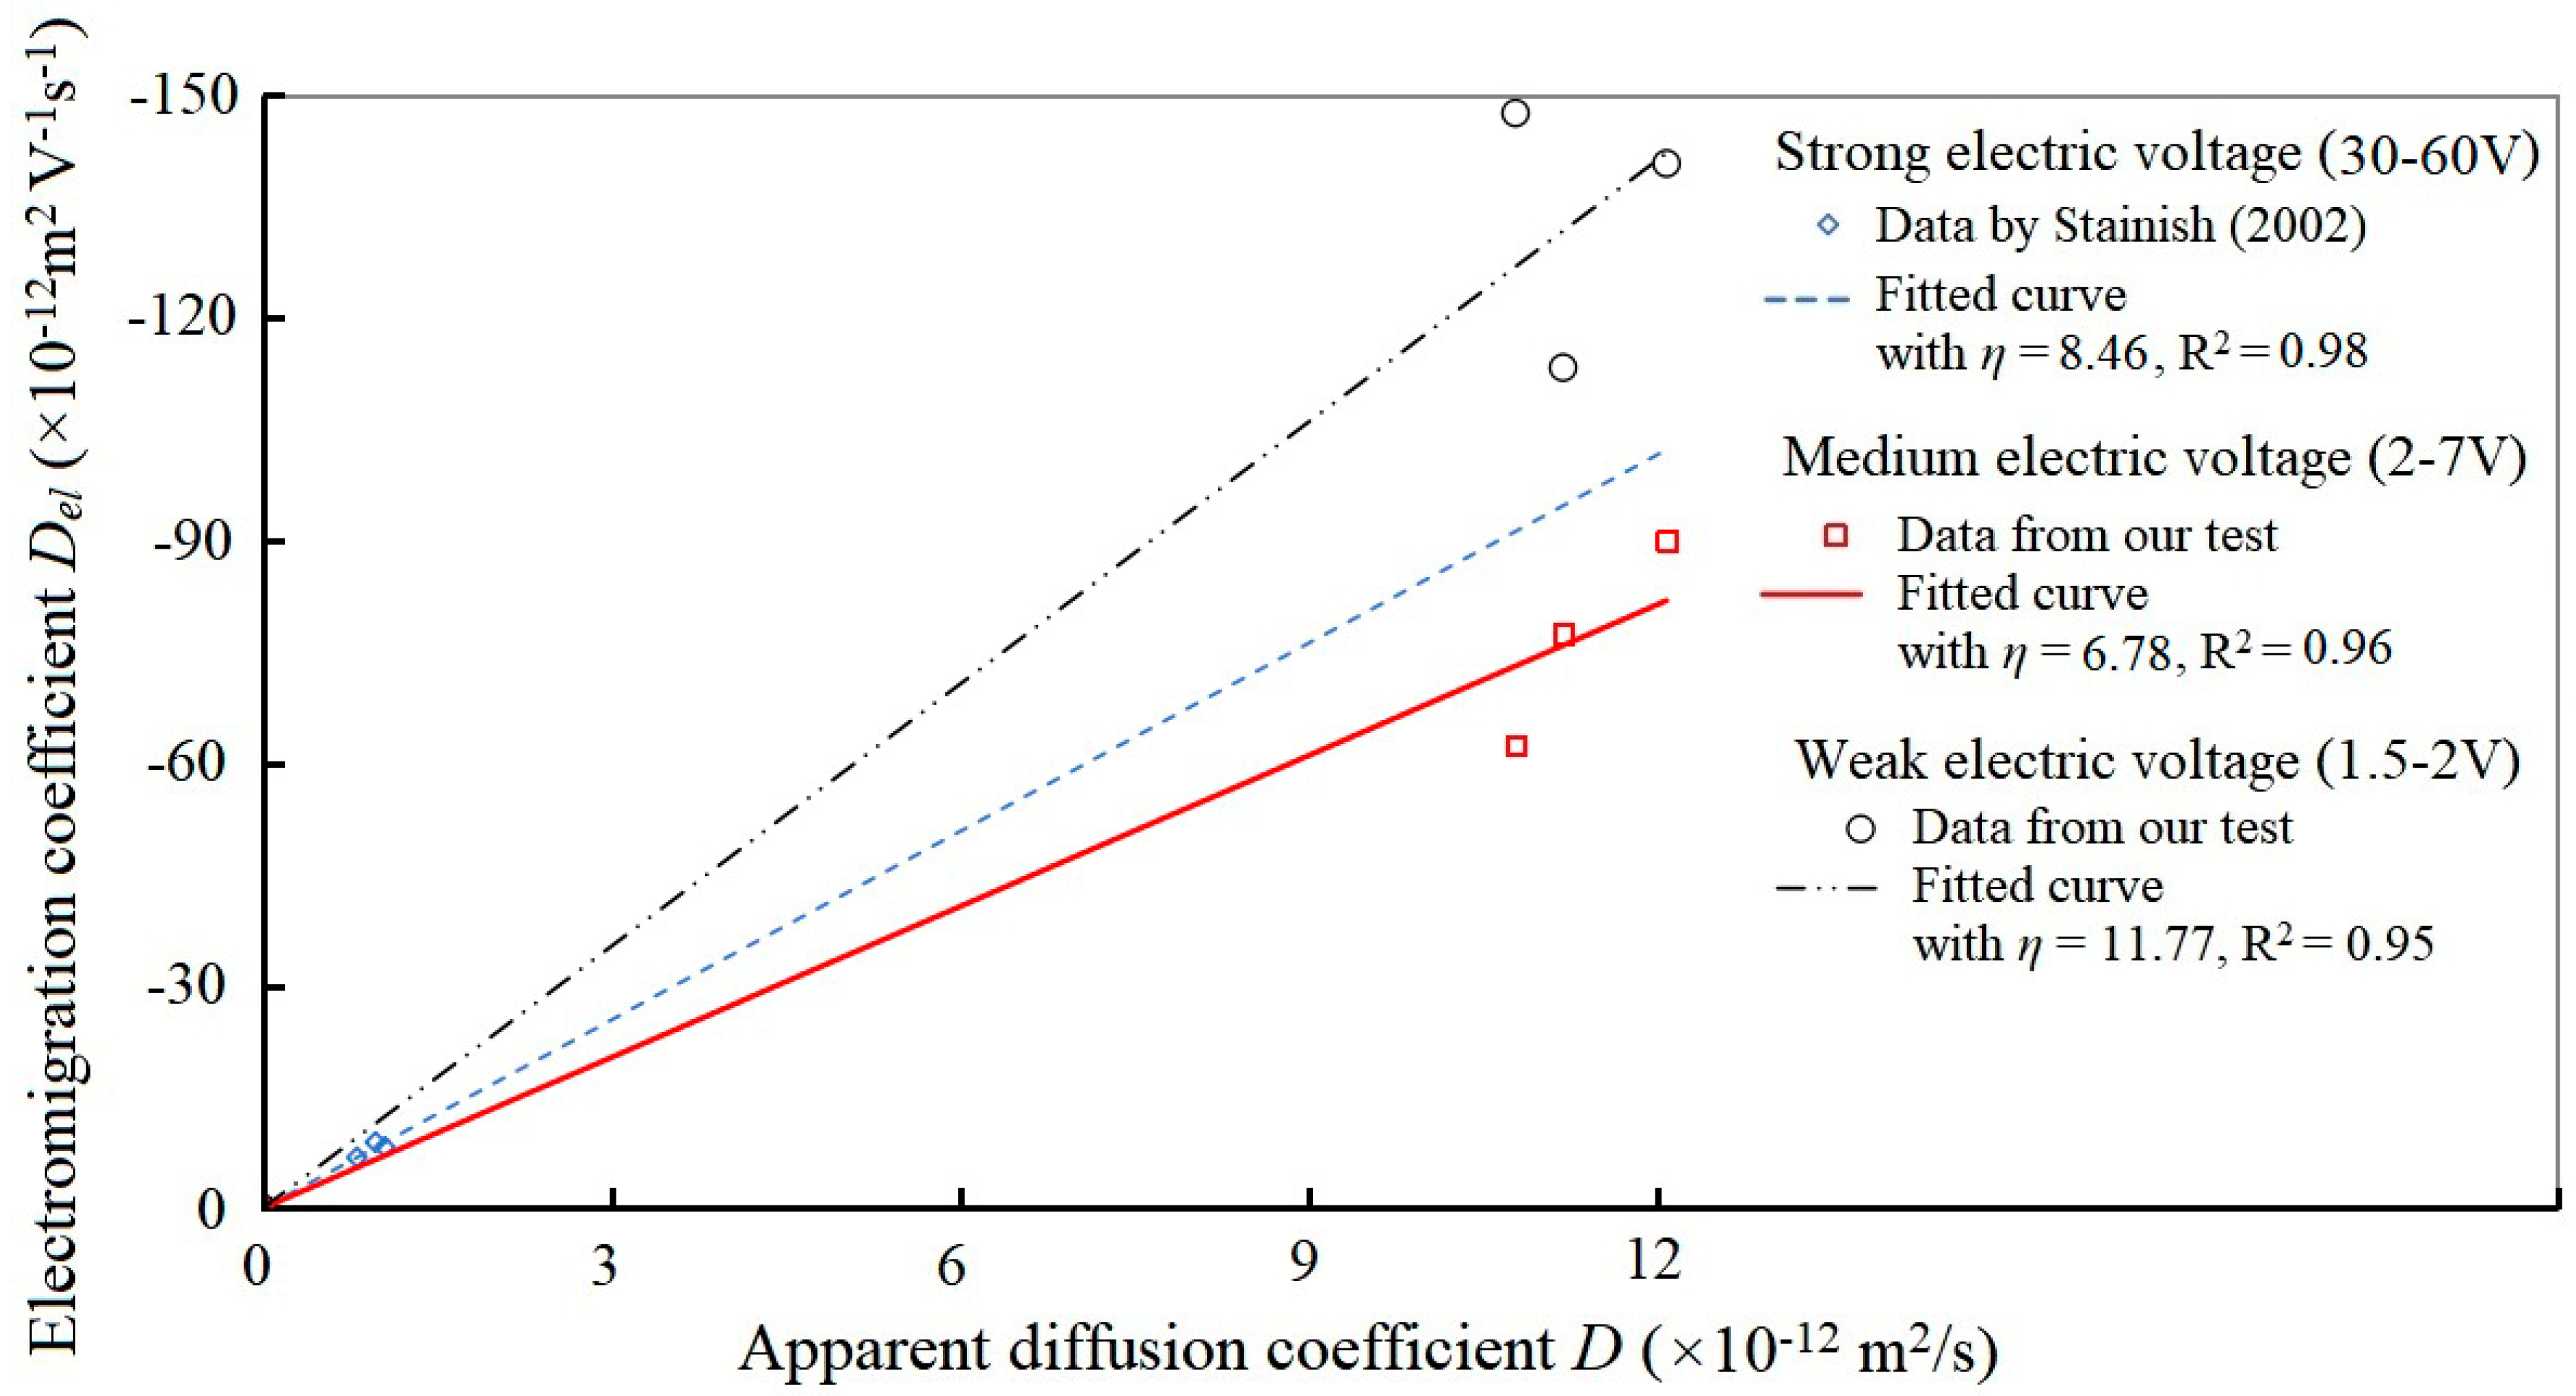
The relationship between the electromigration coefficient and apparent diffusion coefficient of chloride ions under strong, medium, and weak voltages was fitted linearly in segments based on experimental data from [62] and our test, as presented in Figure 11. As shown in this figure, a unified linear relationship cannot be found between them at different voltage intensities. This indicates that using z i F · D / R T in the Nernst–Planck equation to reflect the influence of the electric potential can cause evaluation errors.
Meanwhile, note that the relationship between the electromigration coefficient and the apparent diffusion coefficient of chloride ions given in Equation (24) was forcibly fitted based on experimental data. Although it can be used as an empirical formula, it cannot demonstrate the relationship between the electromigration coefficient and diffusion from a mechanistic perspective. We consider that the special situation that occurs when the current density is 0.3 may be caused by differences in the binding ability of chloride ions. Therefore, we reconstructed a linear relationship between the electromigration coefficient and the pure effective diffusion coefficient of chloride ions, i.e., the following:
D e l = η * · D f
where η * is a set parameter which displays the relationship between the electromigration coefficient and the pure diffusion coefficient, ( V 1 ); D f is the effective diffusion coefficient of chloride ions, and its relationship with the apparent diffusion coefficient can be expressed as follows:
D f = 1 + C b C f · D
The linear relationship between the electromigration coefficient and the pure electromigration diffusion coefficient of chloride ions under various voltage intensities was fitted based on experimental data from [58,63] and our test, as presented in Figure 12. It can be found that the chloride electromigration coefficient shows a high degree of linear fit with the effective diffusion coefficient. The value of η * can be fitted to 2.97 with a correlation coefficient R2 of 0.93. Then, we can further extend and improve the Nernst–Planck equation, which is only applicable to ideal porous media materials. Considering the different binding capacity to chloride ions under various current densities, the transport equation of free chloride ions in cementitious materials under an electric field can be constructed as follows:
C f t = · D C f   + · η * 1 + C b C f D C f Φ

3.5. Microscopic Investigation and Pore Distribution

3.5.1. Microscopic Investigation of Bound Chloride Content

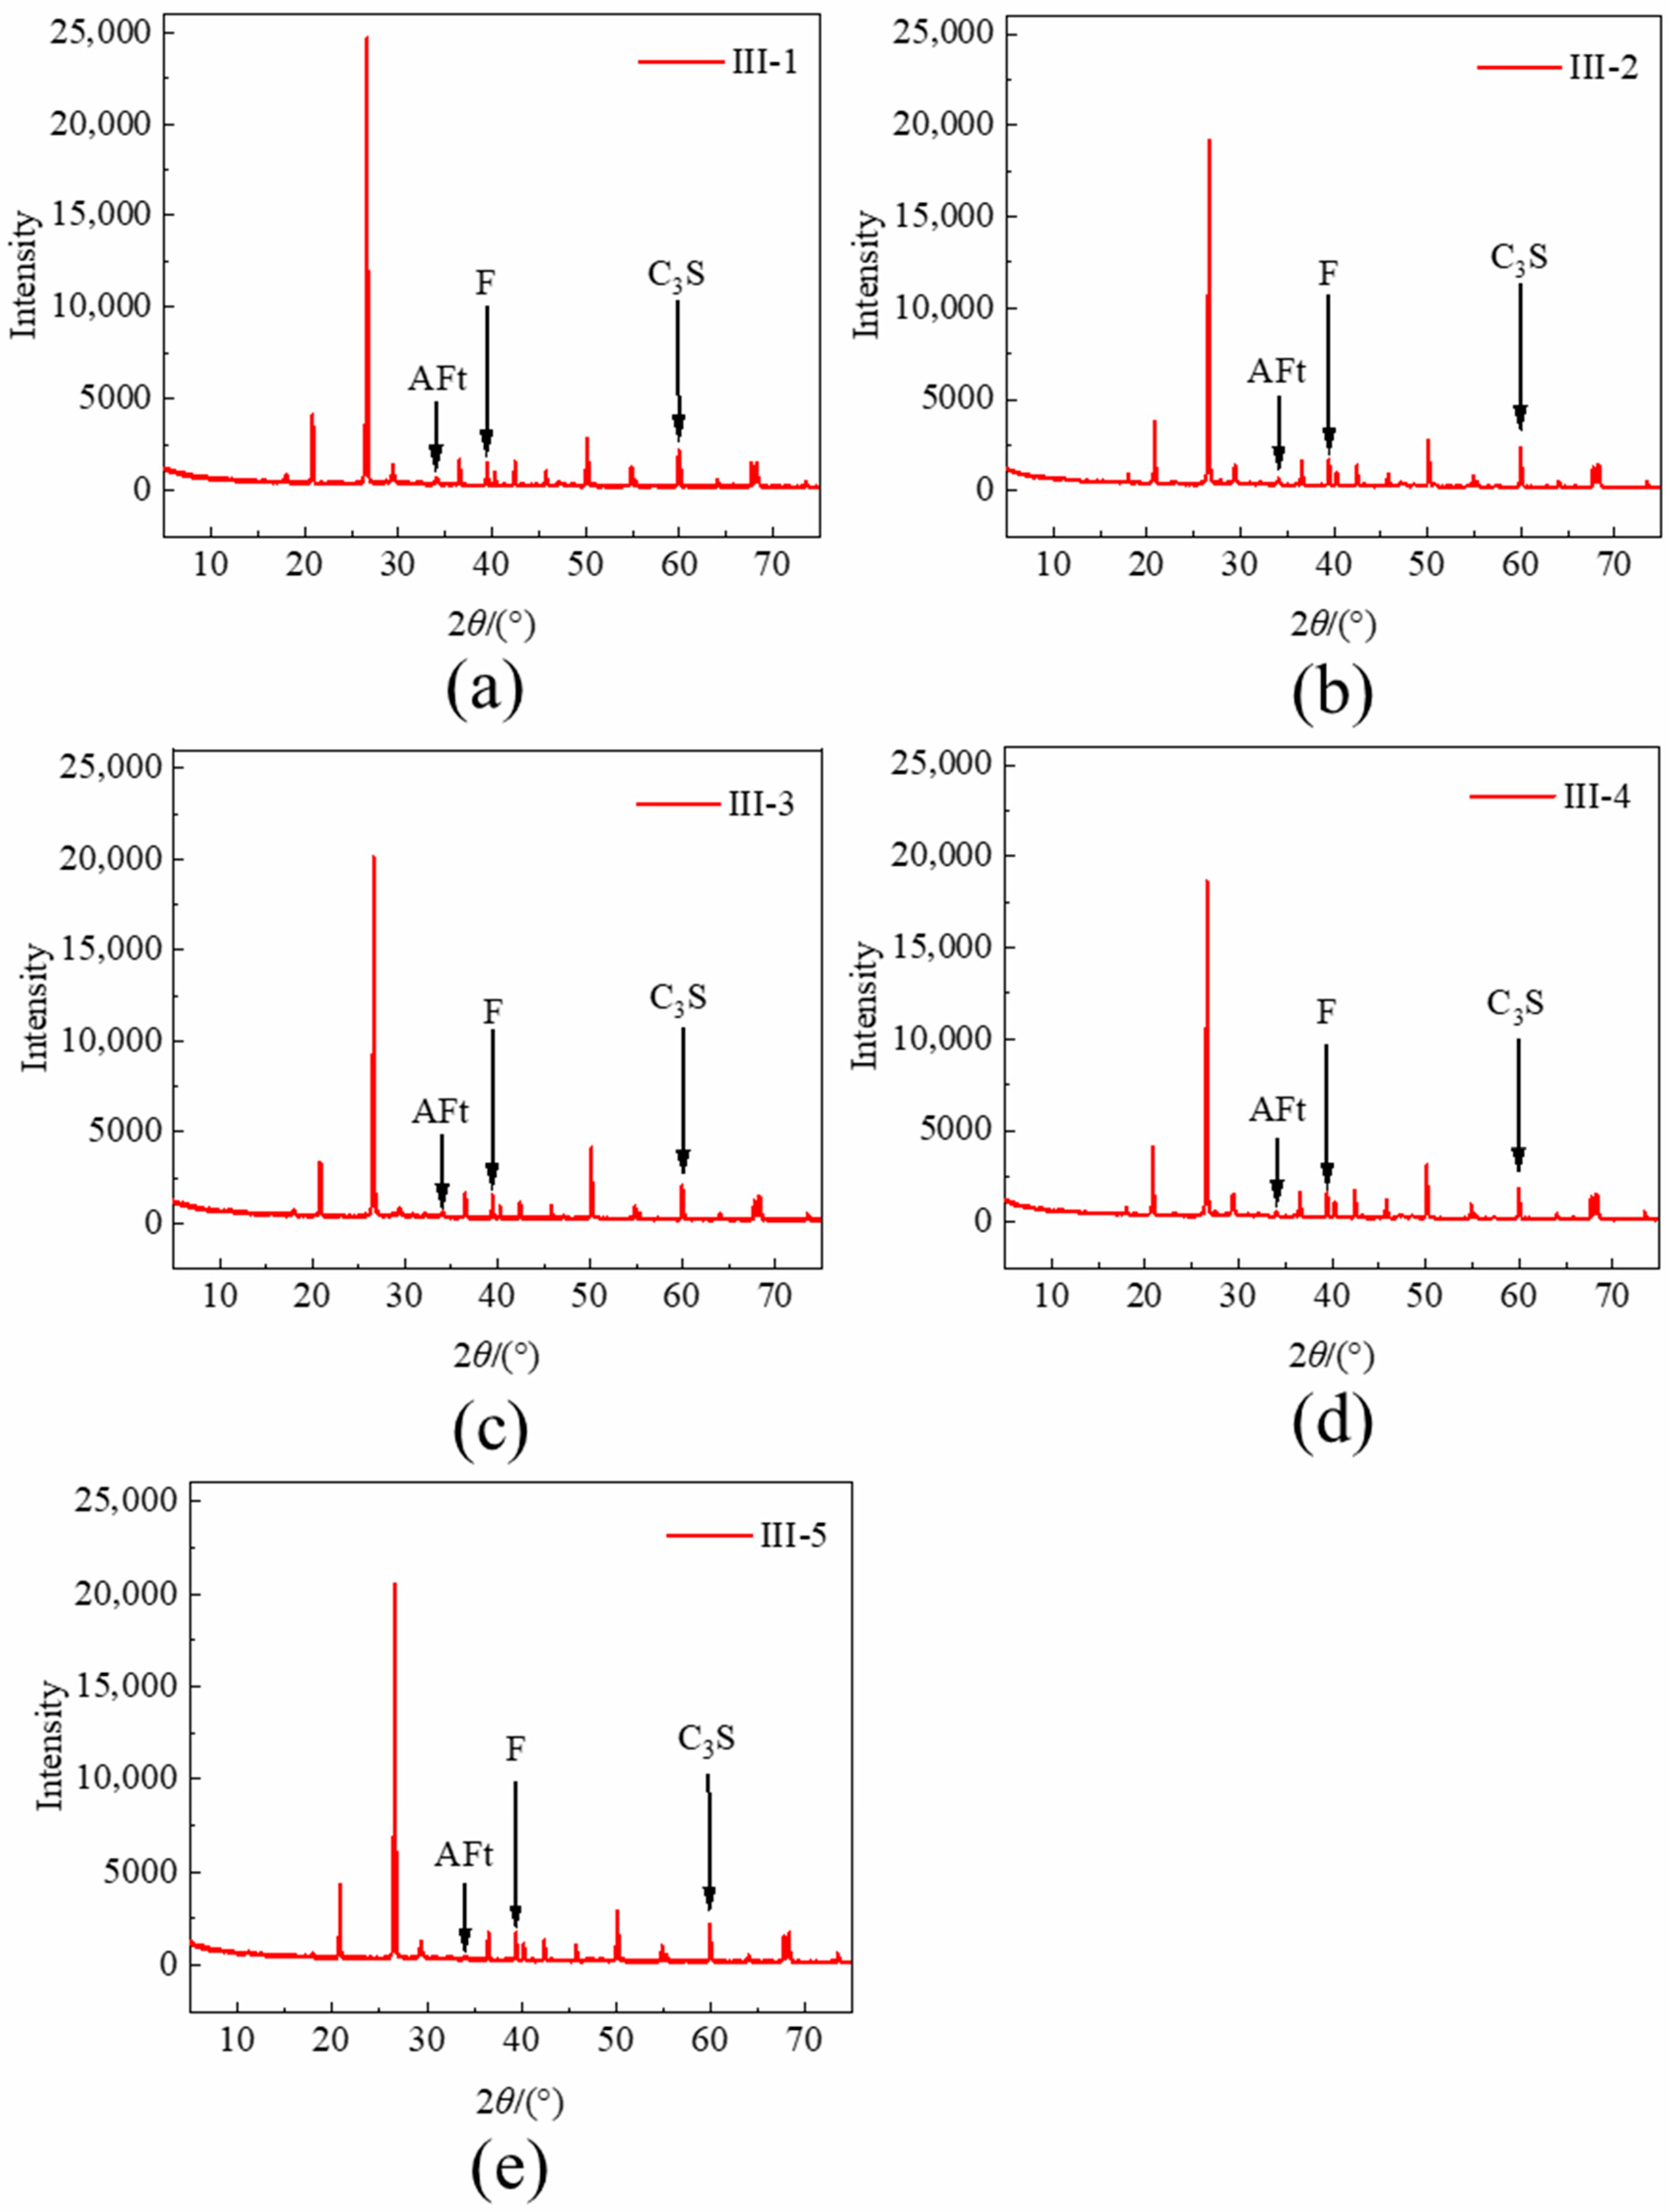
To further investigate the kinds and specific content changes in binding chloride in electrochemical tests, an XRD test was conducted to analyze the material composition of the test specimens. The change in phase content of chloride binding to related substances was shown in Figure 13, where the detailed values of the corresponding peak energy of Friedel’s salt, AFt, and C3S are listed in Table 10.
Friedel’s salt is the main crystal form of chloride ions chemically bound with cementitious materials, while AFt and C-S-H gel have a certain physical adsorption effect on chloride ions [64,65]. Note that physical binding chloride ions are mainly adsorbed in the hydrated calcium C-S-H gel in cement. Due to the variety and complex composition of C-S-H gel in mortar, it is difficult to obtain its content information using XRD. Therefore, the content of the hydration reactant C3S(Ca3SiO5) before its formation was analyzed in this experiment. From Figure 13 and Table 10, it can be found that the contents of Friedel’s salt and C3S in the samples are much higher than Aft. Because of the discreteness of the materials and the randomness of the sampling, the obvious regular changes cannot be summarized when chloride binding happens on a very small scale. Despite this, it still can be noticed that the content of Aft decreases with the increase in the current density. Hence, it may show that the binding capacity of the physical adsorption of chloride ions weakens at larger current densities, which is consistent with the analysis in the previous section.

3.5.2. Investigation of Pore Distribution of Specimen

An MIP test was conducted to analyze the pore size and distribution of specimens under the electrical field. Figure 14 shows the pore distribution of samples at an erosion period of 30 days under current densities of 0, 0.3, and 0.9 A / m 2 , respectively, where the specific data are listed in Table 11.
By observing Figure 14 and Table 11, it can be found that the porosity and total specific pore volume of the test samples under the electric field are larger than those without the electric field. The porosity of the samples with a current density of 0.3 and 0.9 A / m 2 increased by 14.70% and 6.49%, respectively, and the total specific pore volume increased by 16.59% and 7.5%, respectively, compared with the samples without an electric field. This phenomenon may indicate that the number of chloride ion migration paths in the mortar increases and the chloride ion transport channels become larger under an electric field. In addition, the slow growth rate indicates that the chloride ion transport channels gradually become stable, which is also consistent with the experiment results in Section 3.3. Meanwhile, a 7.77% reduction in total specific pore volume was observed for III-4 compared to III-2, which may explain the larger absolute value of D e l at the current density of 0.3 A / m 2 .

4. Conclusions

(1)
An analytical solution of the Nernst–Planck equation with an independent electromigration coefficient was derived, and its value was quantitatively measured corresponding to various current densities. At weak current densities, the electromigration coefficient is significantly higher, and at medium or high current densities, the electromigration coefficient remains at a constant value. For current densities of 0.3, 0.6, 0.9, and 1.2 (A/m2), the average electromigration coefficients of the specimens used in our test were determined to be 133 × 10−12, 76.6 × 10⁻¹², 80.3 × 10⁻¹², and 70.3 × 10⁻¹² m 2   V 1   s 1 , respectively.
(2)
The chloride binding capacity of cementitious material rapidly decreases with the increase in current density. But, at weak or moderate current densities, its binding ability is to some extent preserved. For current densities of 0.3, 0.6, 0.9, and 1.2 (A/m2), the decay ratio of the binding ability was measured as 52.6%, 71.8%, 83.2%, and 85.6%, respectively.
(3)
There is no clear linear relationship between the electromigration coefficient and the apparent diffusion coefficient for chloride ions, especially at weak current densities. This indicated that the traditional Nernst–Planck equation has significant errors in predicting particle transport in non-ideal porous media such as cementitious material. However, the electromigration coefficient shows a high degree of linear fit with the pure effective diffusion coefficient at all electric field strengths, and the ratio of the two was measured as −2.97 V−1.

Author Contributions

Methodology, X.Z.; Validation, J.W.; Data curation, Y.H. and C.X.; Writing—original draft, X.Z. and C.X.; Writing—review & editing, Y.H. and J.W.; Project administration, X.Z.; Funding acquisition, X.Z. All authors have read and agreed to the published version of the manuscript.

Funding

This work was supported by the Natural Science Foundation of Hubei Province (No. 2024AFB949), and the Natural Science Foundation of Shandong Province (No. ZR2022ME172).

Data Availability Statement

Research data are available from the authors upon reasonable request. If you want to request the data, please contact Yujin Wang (yujinwang@jhun.edu.cn).

Conflicts of Interest

The authors declare that they have no known competing financial interests or personal relationships that could have appeared to influence the work reported in this paper.

References

  1. Tang, S.W.; Yao, Y.; Andrade, C.; Li, Z. Recent durability studies on concrete structure. Cem. Concr. Res. 2015, 78, 143–154. [Google Scholar] [CrossRef]
  2. Van Damme, H. Concrete material science: Past, present, and future innovations. Cem. Concr. Res. 2018, 112, 5–24. [Google Scholar] [CrossRef]
  3. Wang, Y.; Song, Y.; Yan, B.; Yuan, C.; Wang, D.; Guo, W. Experimental study of chloride transport law in concrete considering the coupling effects of dry-wet ratio and freeze–thaw damage. Constr. Build. Mater. 2022, 351, 128940. [Google Scholar] [CrossRef]
  4. Tong, L.-y.; Xiong, Q.X.; Zhang, M.; Meng, Z.; Meftah, F.; Liu, Q.-f. Multi-scale modelling and statistical analysis of heterogeneous characteristics effect on chloride transport properties in concrete. Constr. Build. Mater. 2023, 367, 130096. [Google Scholar] [CrossRef]
  5. Angst, U.; Elsener, B.; Larsen, C.K.; Vennesland, Ø. Critical chloride content in reinforced concrete—A review. Cem. Concr. Res. 2009, 39, 1122–1138. [Google Scholar] [CrossRef]
  6. Jakobsen, U.H.; De Weerdt, K.; Geiker, M.R. Elemental zonation in marine concrete. Cem. Concr. Res. 2016, 85, 12–27. [Google Scholar] [CrossRef]
  7. Kenny, A.; Katz, A. Steel-concrete interface influence on chloride threshold for corrosion—Empirical reinforcement to theory. Constr. Build. Mater. 2020, 244, 10.1016. [Google Scholar] [CrossRef]
  8. Chalhoub, C.; François, R.; Carcasses, M. Critical chloride threshold values as a function of cement type and steel surface condition. Cem. Concr. Res. 2020, 134, 106086. [Google Scholar] [CrossRef]
  9. Bolzoni, F.; Brenna, A.; Ormellese, M. Recent advances in the use of inhibitors to prevent chloride-induced corrosion in reinforced concrete. Cem. Concr. Res. 2022, 154, 106719. [Google Scholar] [CrossRef]
  10. Xu, L.; Wu, P.; Zhu, X.; Zhao, G.; Ren, X.; Wei, Q.; Xie, L. Structural characteristics and chloride intrusion mechanism of passive film. Corros. Sci. 2022, 207, 110563. [Google Scholar] [CrossRef]
  11. Collepardi, M.; Marcialis, A.; Turriziani, R. Penetration of chloride ions into cement pastes and concretes. J. Am. Ceram. Soc. 1972, 55, 534–535. [Google Scholar] [CrossRef]
  12. Mangat, P.; Molloy, B. Prediction of long term chloride concentration in concrete. Mater. Struct. 1994, 27, 338–346. [Google Scholar] [CrossRef]
  13. Nilsson, L.; Massat, M.; Tang, L. Effect of non-linear chloride binding on the prediction of chloride penetration into concrete structures. In Proceedings of the ACI International Conference on Durability of Concrete, Gothenburg, Sweden, 1 May 1994; pp. 469–486. [Google Scholar]
  14. Thomas, M.D.; Bamforth, P.B. Modelling chloride diffusion in concrete: Effect of fly ash and slag. Cem. Concr. Res. 1999, 29, 487–495. [Google Scholar]
  15. Sun, W. Durability Evaluation and Service Life Prediction of Modern Concrete; China Architecture & Building Press: Beijing, China, 2015. [Google Scholar]
  16. Amey, S.L.; Johnson, D.A.; Miltenberger, M.A.; Farzam, H. Predicting the service life of concrete marine structures: An environmental methodology. Struct. J. 1998, 95, 205–214. [Google Scholar]
  17. Kassir, M.K.; Ghosn, M. Chloride-induced corrosion of reinforced concrete bridge decks. Cem. Concr. Res. 2002, 32, 139–143. [Google Scholar] [CrossRef]
  18. Xu, Y.; Wang, M.; Pickering, H. On electric field induced breakdown of passive films and the mechanism of pitting corrosion. J. Electrochem. Soc. 1993, 140, 3448. [Google Scholar] [CrossRef]
  19. Bertolini, L.; Carsana, M.; Pedeferri, P. Corrosion behaviour of steel in concrete in the presence of stray current. Corros. Sci. 2007, 49, 1056–1068. [Google Scholar] [CrossRef]
  20. Hernández, F.R.; Plascencia, G.; Koch, K. Rail base corrosion problem for North American transit systems. Eng. Fail. Anal. 2009, 16, 281–294. [Google Scholar] [CrossRef]
  21. Wang, J.; Niu, D.; Wang, Y.; He, H.; Liang, X. Chloride diffusion of shotcrete lining structure subjected to nitric acid, salt–frost degradation, and bending stress in marine environment. Cem. Concr. Compos. 2019, 104, 103396. [Google Scholar] [CrossRef]
  22. Wu, P.; Zhu, X.; Xu, L.; Peng, W.; Zhao, G. Effect of stray current coupled with chloride concentration and temperature on the corrosion resistance of a steel passivation film. Electrochem. Commun. 2020, 118, 106793. [Google Scholar] [CrossRef]
  23. de Almeida Souza, L.R.; de Medeiros, M.H.F.; Pereira, E.; Capraro, A.P.B. Electrochemical chloride extraction: Efficiency and impact on concrete containing 1% of NaCl. Constr. Build. Mater. 2017, 145, 435–444. [Google Scholar] [CrossRef]
  24. Zhu, Z.; Chu, H.; Guo, M.-z.; Shen, M.; Jiang, L.; Yu, L. Effect of silica fume and fly ash on the stability of bound chlorides in cement mortar during electrochemical chloride extraction. Constr. Build. Mater. 2020, 256, 119481. [Google Scholar] [CrossRef]
  25. Xia, J.; Cheng, X.; Liu, Q.F.; Xie, H.B.; Zhong, X.P.; Jin, S.J.; Mao, J.H.; Jin, W.L. Effect of the stirrup on the transport of chloride ions during electrochemical chloride removal in concrete structures. Constr. Build. Mater. 2020, 250, 118898. [Google Scholar] [CrossRef]
  26. Li, L.; Dong, S.; Wang, W.; Hu, R.; Du, R.; Lin, C.; Zhuo, X.; Wang, J. Study on interaction between macrocell and microcell in the early corrosion process of reinforcing steel in concrete. Sci. Sin. Technol. 2010, 40, 1104–1108. [Google Scholar] [CrossRef]
  27. Kranc, S.; Sagüés, A.A. Detailed modeling of corrosion macrocells on steel reinforcing in concrete. Corros. Sci. 2001, 43, 1355–1372. [Google Scholar] [CrossRef]
  28. Yu, Y.; Gao, W.; Castel, A.; Chen, X.; Liu, A. An integrated framework for modelling time-dependent corrosion propagation in offshore concrete structures. Eng. Struct. 2021, 228, 111482. [Google Scholar] [CrossRef]
  29. Feng, G.; Jin, Z.; Zhu, D.; Xiong, C.; Li, Z.; Wang, X. Corrosion propagation of steel reinforcement in pre-cracked mortar attacked by seawater using wire beam electrode. Corros. Sci. 2022, 208, 110655. [Google Scholar] [CrossRef]
  30. Zhu, X.; Zi, G. A 2D mechano-chemical model for the simulation of reinforcement corrosion and concrete damage. Constr. Build. Mater. 2017, 137, 330–344. [Google Scholar] [CrossRef]
  31. Zhu, X.; Meng, Z.; Liu, L.; Xu, L. An equivalent smeared layer method for simulating the non-uniform corrosion-induced damage of concrete. Eng. Fract. Mech. 2020, 224, 106791. [Google Scholar] [CrossRef]
  32. Xua, F.; Han, J.; Wang, S.; Liu, W. Progress in Theoretical Models of Chloride Ion Transport in Cement-based Materials. Mater. Rev. 2014, 28, 172–178. [Google Scholar]
  33. Liu, Q.-f.; Feng, G.-l.; Xia, J.; Yang, J.; Li, L.-y. Ionic transport features in concrete composites containing various shaped aggregates: A numerical study. Compos. Struct. 2018, 183, 371–380. [Google Scholar] [CrossRef]
  34. Spiesz, P.; Brouwers, H.J.H. The apparent and effective chloride migration coefficients obtained in migration tests. Cem. Concr. Res. 2013, 48, 116–127. [Google Scholar] [CrossRef]
  35. NT Build. Concrete, Mortar and Cement-Based Repair Materials; NORDTEST: Espoo, Finland, 1999. [Google Scholar]
  36. Tang, L.; Lars-Olof, N. Rapid determination of the chloride diffusivity in concrete by applying an electric field. ACI Mater. J. 1993, 89, 49–53. [Google Scholar] [CrossRef] [PubMed]
  37. McGrath, P.F.; Hooton, R.D. Influence of voltage on chloride diffusion coefficients from chloride migration tests. Cem. Concr. Res. 1996, 26, 1239–1244. [Google Scholar] [CrossRef]
  38. Chen, M.-Y.; Chen, R.-P.; Chen, Y.-Q.; Ma, X.-Y.; Kang, X. Stray current induced chloride ion transport and corrosion characteristics of cracked ultra-high performance concrete. Constr. Build. Mater. 2023, 398, 132536. [Google Scholar] [CrossRef]
  39. Li, Y.; Chen, X.; Jin, L.; Zhang, R. Experimental and numerical study on chloride transmission in cracked concrete. Constr. Build. Mater. 2016, 127, 425–435. [Google Scholar] [CrossRef]
  40. Wang, K.; Zha, X.; Zhang, X.; Zhai, X. Mesoscale numerical simulation of chloride ion penetration in geopolymer concrete under the externally applied electric field. Constr. Build. Mater. 2023, 394, 131380. [Google Scholar] [CrossRef]
  41. Xu, W.; Li, Y.; Li, H.; Wang, K.; Zhang, C.; Jiang, Y.; Qiang, S. Corrosion mechanism and damage characteristic of steel fiber concrete under the effect of stray current and salt solution. Constr. Build. Mater. 2022, 314, 125618. [Google Scholar] [CrossRef]
  42. Elsener, B.; Molina, M.; Böhni, H. The electrochemical removal of chlorides from reinforced concrete. Corros. Sci. 1993, 35, 1563–1570. [Google Scholar] [CrossRef]
  43. Fajardo, G.; Escadeillas, G.; Arliguie, G. Electrochemical chloride extraction (ECE) from steel-reinforced concrete specimens contaminated by “artificial” sea-water. Corros. Sci. 2006, 48, 110–125. [Google Scholar] [CrossRef]
  44. Orellan, J.; Escadeillas, G.; Arliguie, G. Electrochemical chloride extraction: Efficiency and side effects. Cem. Concr. Res. 2004, 34, 227–234. [Google Scholar] [CrossRef]
  45. Tritthart, J.; Pettersson, K.; Sorensen, B. Electrochemical removal of chloride from hardened cement paste. Cem. Concr. Res. 1993, 23, 1095–1104. [Google Scholar] [CrossRef]
  46. Chu, H.; Zhang, B.; Zhao, S.; Guo, M.; Liang, Y.; Jiang, L.; Song, Z. Effect of electric current on the stability of bound chloride. Cem. Concr. Compos. 2019, 103, 71–79. [Google Scholar] [CrossRef]
  47. Zhu, X.; Peng, W.; Xiao, C.; Ma, L.; Hou, J. Effect of electric field intensity on chloride binding capacity of concrete. J. Mater. Res. Technol. 2023, 23, 4466–4478. [Google Scholar] [CrossRef]
  48. Zhu, X.; Zi, G.; Cao, Z.; Cheng, X. Combined effect of carbonation and chloride ingress in concrete. Constr. Build. Mater. 2016, 110, 369–380. [Google Scholar] [CrossRef]
  49. Zhu, X.; Zi, G.; Lee, W.; Kim, S.; Kong, J. Probabilistic analysis of reinforcement corrosion due to the combined action of carbonation and chloride ingress in concrete. Constr. Build. Mater. 2016, 124, 667–680. [Google Scholar] [CrossRef]
  50. GB 175-2007; Common Portland Cement. State Administration for Market Regulation and Standardization Administration of China: Beijing, China, 2007.
  51. GB/T 17671-2021; Test Method of Cement Mortar Strength (ISO Method). State Administration for Market Regulation and Standardization Administration of China: Beijing, China, 2021.
  52. Sui, S.; Wilson, W.; Georget, F.; Maraghechi, H.; Kazemi-Kamyab, H.; Sun, W.; Scrivener, K. Quantification methods for chloride binding in Portland cement and limestone systems. Cem. Concr. Res. 2019, 125, 105864. [Google Scholar] [CrossRef]
  53. Noushini, A.; Castel, A.; Aldred, J.; Rawal, A. Chloride diffusion resistance and chloride binding capacity of fly ash-based geopolymer concrete. Cem. Concr. Compos. 2020, 105, 103290. [Google Scholar] [CrossRef]
  54. Ishida, T.; Iqbal, P.O.N.; Anh, H.T.L. Modeling of chloride diffusivity coupled with non-linear binding capacity in sound and cracked concrete. Cem. Concr. Res. 2009, 39, 913–923. [Google Scholar] [CrossRef]
  55. Ishida, T.; Miyahara, S.; Maruya, T. Chloride Binding Capacity of Mortars Made with Various Portland Cements and Mineral Admixtures. J. Adv. Concr. Technol. 2008, 6, 287–301. [Google Scholar] [CrossRef]
  56. Azad, A.K. Chloride diffusion in concrete and its impact on corrosion of reinforcement. In Proceedings of the Symposium on Performance of Concrete Structures in the Arabian Gulf Environment, Dhahran, Saudi Arabia, 15–17 November 1998; pp. 262–273. [Google Scholar]
  57. Tang, L. Chloride Transport in Concrete-Measurement and Prediction. Ph.D. Thesis, Chalmers University of Technology, Gothenburg, Sweden, 1996. [Google Scholar]
  58. Spiesz, P.; Brouwers, H.J.H. Influence of the applied voltage on the Rapid Chloride Migration (RCM) test. Cem. Concr. Res. 2012, 42, 1072–1082. [Google Scholar] [CrossRef]
  59. Kribes, Z.E.; Cherif, R.; Aït-Mokhtar, A. Modelling of Chloride Transport in the Standard Migration Test including Electrode Processes. Materials 2023, 16, 6200. [Google Scholar] [CrossRef]
  60. Yang, P.; Sant, G.; Neithalath, N. A refined, self-consistent Poisson-Nernst-Planck (PNP) model for electrically induced transport of multiple ionic species through concrete. Cem. Concr. Compos. 2017, 82, 80–94. [Google Scholar] [CrossRef]
  61. Rios, R.T.; Rigaud, T.; Kopp, T.; Lolli, F.; Kurtis, K.E. Impact of curing solution on concrete surface resistivity and formation factor. Constr. Build. Mater. 2024, 426, 136070. [Google Scholar] [CrossRef]
  62. Stanish, K.D. The Migration of Chloride Ions in Concrete; University of Toronto: Toronto, ON, Canada, 2002. [Google Scholar]
  63. Yuan, Q. Fundamental Studies on Test Methods for the Transport of Chloride Ions in Cementitious Materials. Ph.D. Thesis, Ghent University, Gent, Belgium, 2009. [Google Scholar]
  64. Zibara, H. Binding of External Chlorides by Cement Pastes. Ph.D. Thesis, University of Toronto, Toronto, ON, Canada, 2001. [Google Scholar]
  65. Birnin-Yauri, U.; Glasser, F. Friedel’s salt, Ca2Al(OH)6(Cl,OH)·2H2O: Its solid solutions and their role in chloride binding. Cem. Concr. Res. 1998, 28, 1713–1723. [Google Scholar] [CrossRef]
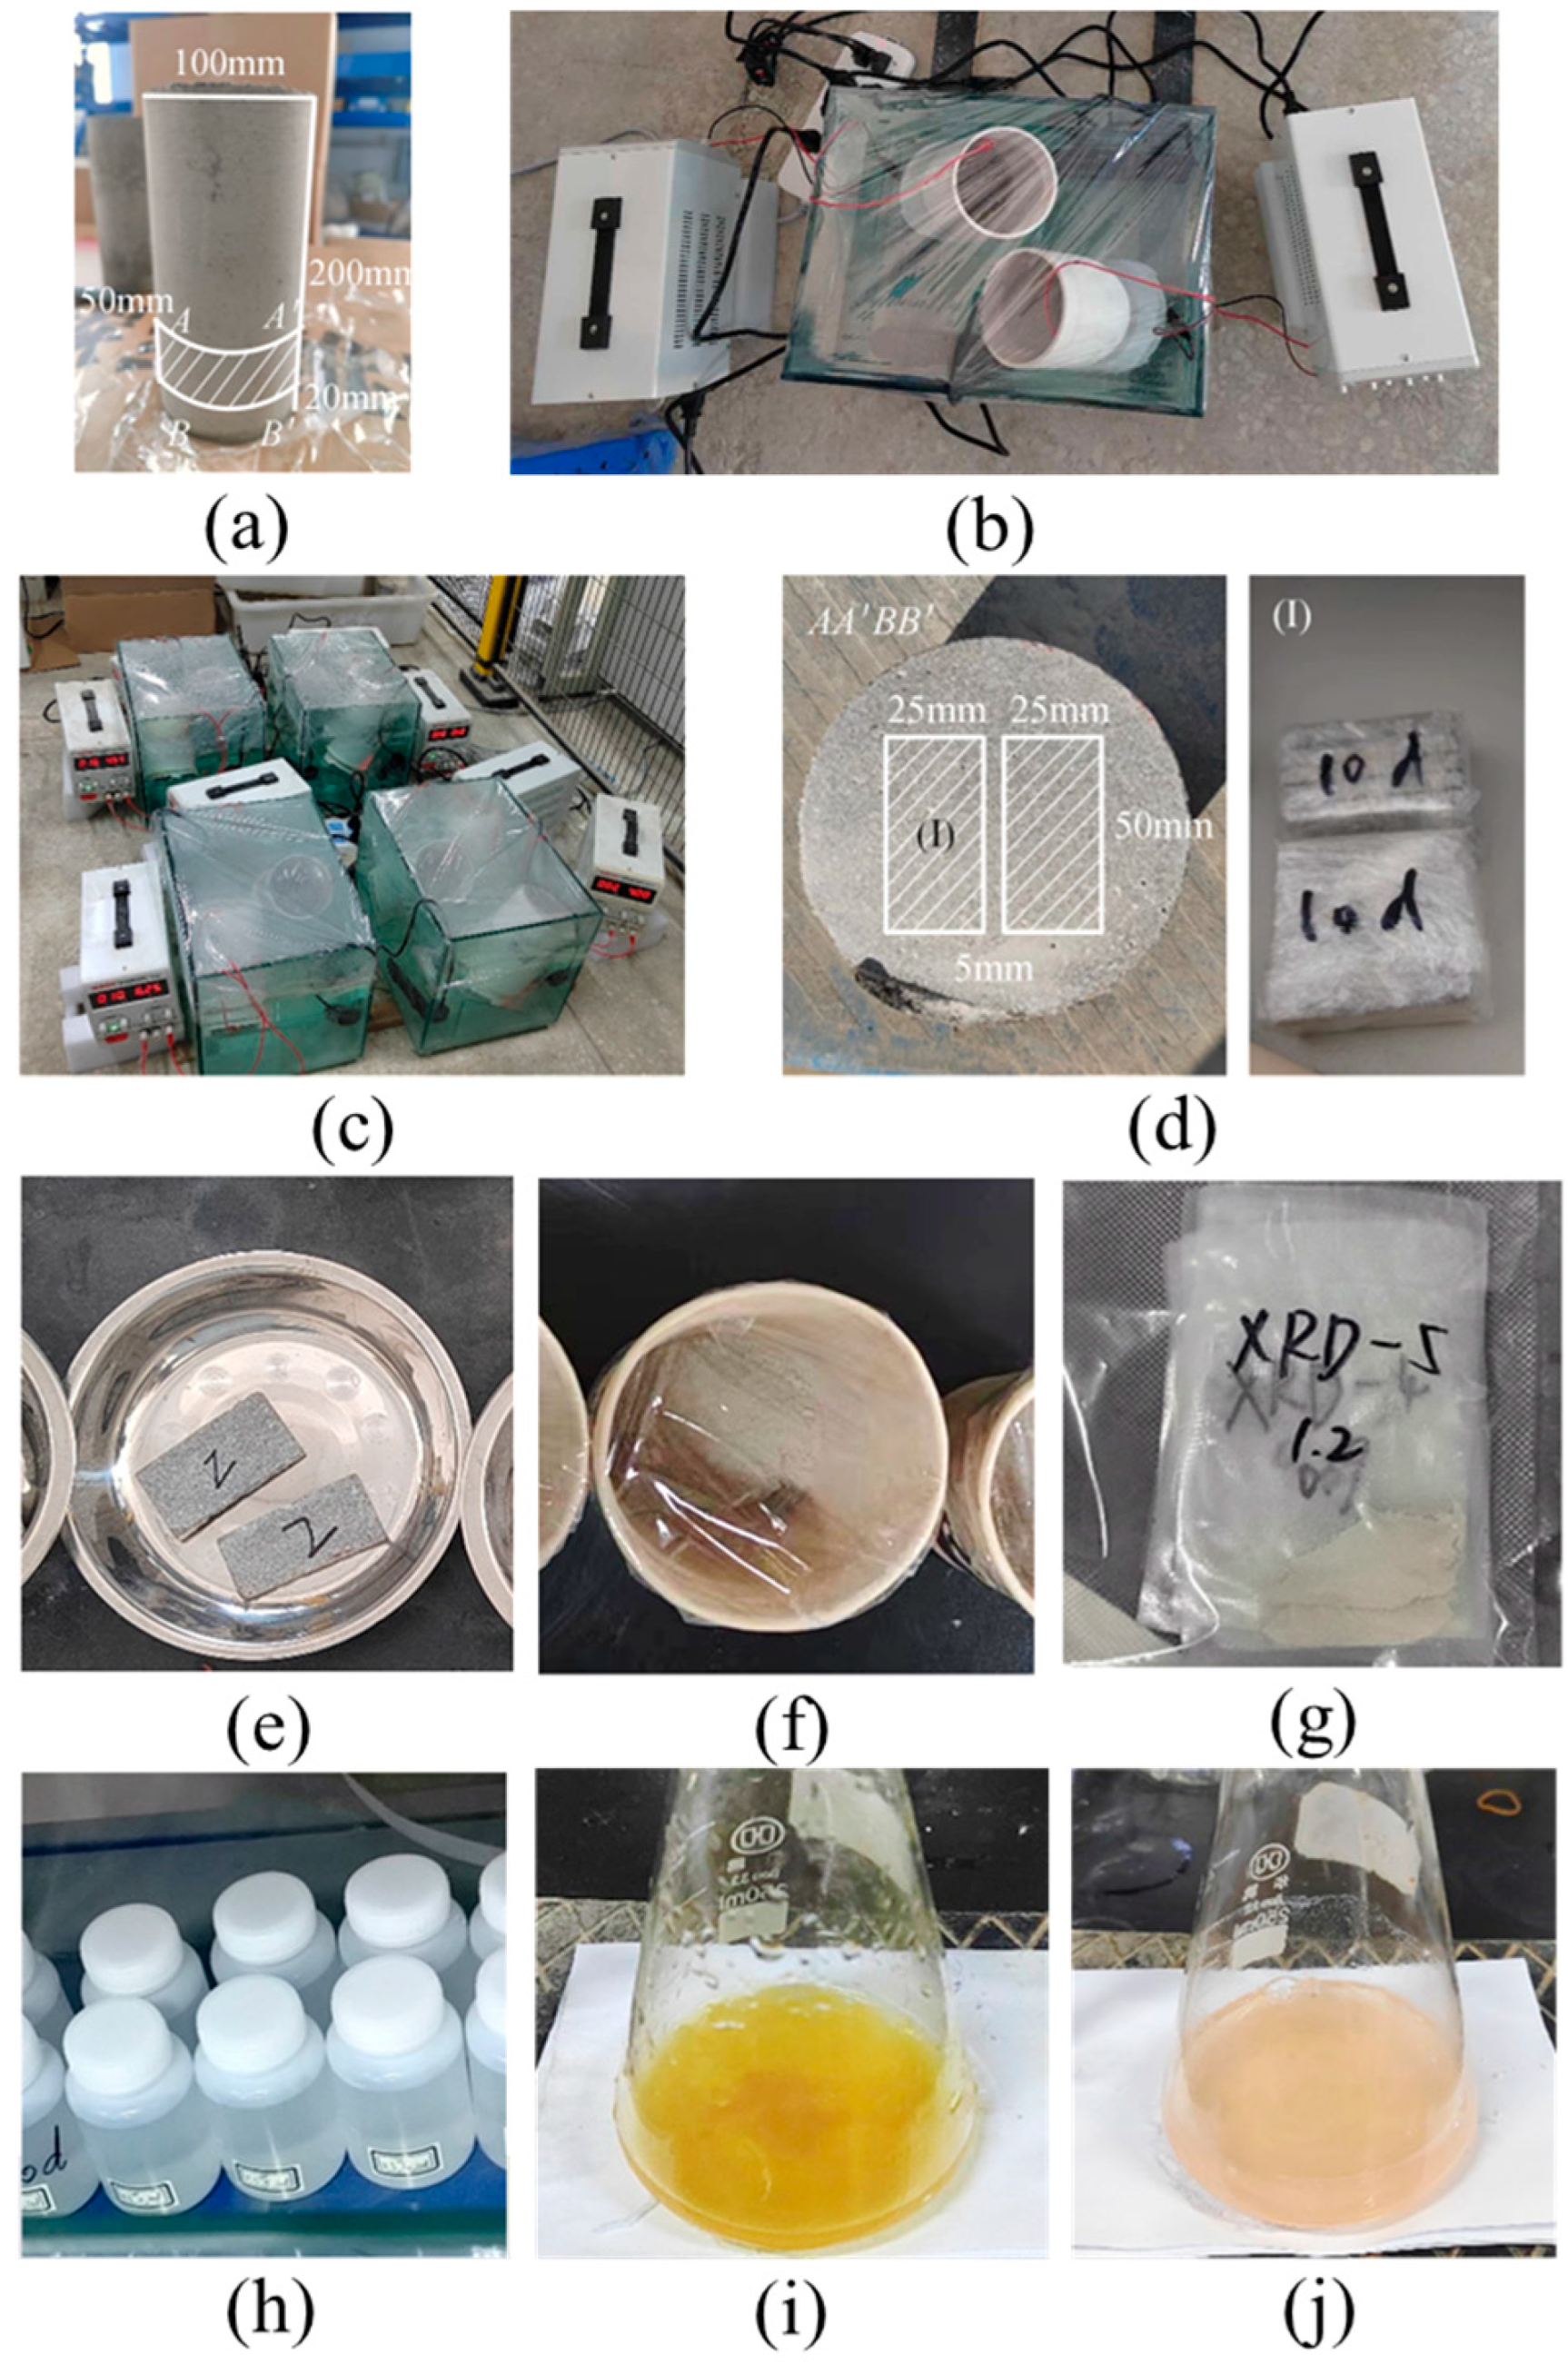
Figure 1. Experimental program for (a) specimen preparation, (b) installation of the RCM equipment, (c) accelerated test of chloride transport, (d) specimen selection, (e) slicing, (f) power grinding, (g) microscopic specimen, (h) solution mixing, and titration test to determine the content of (i) free chloride and (j) total chloride.
Buildings 15 03429 g001
Figure 2. Experimental procedure.
Buildings 15 03429 g002
Figure 3. Variation in free chloride profile with different current densities along the depth direction of specimen: erosion age of (a) 10 days, (b) 20 days, and (c) 30 days for free chloride ions.
Buildings 15 03429 g003
Figure 4. Chloride binding isotherms corresponding to various current densities based on the test data in ref. [46].
Buildings 15 03429 g004
Figure 5. Evolution of Langmuir binding constant α corresponding to various current densities.
Buildings 15 03429 g005
Figure 6. Comparison between the experimental data and the fitting curves of the distribution of chloride ion concentrations for erosion periods of (a) 10 days, (b) 20 days, and (c) 30 days.
Buildings 15 03429 g006
Figure 9. Value of η fitted by the experimental data.
Buildings 15 03429 g009
Figure 10. Evolution trend of η values corresponding to different current densities.
Buildings 15 03429 g010
Figure 11. Segmented linear fitting of the relationship between the electromigration coefficient and apparent diffusion coefficient of chloride ions under various electric voltage intensities [62].
Buildings 15 03429 g011
Figure 12. Fitting of the linear relationship between the electromigration coefficient and the pure equivalent diffusion coefficient of chloride ions under various electric voltage intensities [58,63].
Buildings 15 03429 g012
Figure 13. XRD patterns of the test specimen at erosion age of 30 days with current densities of (a) 0 A/m2, (b) 0.3 A/m2, (c) 0.6 A/m2, (d) 0.8 A/m2, and (e) 1.2 A/m2, where AFt, F, and C3S are Ettringite, Friedel’s salt, and Tricalcium silicate, respectively.
Buildings 15 03429 g013
Figure 14. Pore size distribution of samples obtained by MIP test.
Buildings 15 03429 g014
Figure 7. Fitting curves of the distribution of chloride ion concentrations for erosion periods of (a) 10 days, (b) 20 days, and (c) 30 days.
Buildings 15 03429 g007
Figure 8. Variation of Del with different current densities.
Buildings 15 03429 g008
Table 1. Chemical compositions and physical properties of cement.
ComponentContent (%)
C a O 55.5
A l 2 O 3 7.2
S i O 2 24.0
F e 2 O 3 3.9
M g O 3.2
S O 3 2.9
LOI1.9
Specific surface area356 ( c m 2 /g)
Density3.15 (g/ c m 3 )
Table 2. Mix proportion of specimen used in the test.
Cement
( k g / m 3 )
Sand
( k g / m 3 )
Water
( k g / m 3 )
Superplasticizer
( k g / m 3 )
w/c
6361273.2235.63.180.37
Table 3. Group of test specimens.
0   A / m 2 0.3   A / m 2 0.6   A / m 2 0.9   A / m 2 1.2   A / m 2
10 d I-1I-2I-3I-4I-5
20 d II-1II-2II-3II-4II-5
30 d III-1III-2III-3III-4III-5
Table 4. D m obtained by the error function of Fick’s second law at erosion period of 10 days.
i   ( A / m 2 ) D m m 2 / s R 2
I-1 0 1.08 × 10 11 0.938
I-2 0.3 3.76 × 10 11 0.849
I-3 0.6 3.05 × 10 11 0.819
I-4 0.9 4.85 × 10 11 0.894
I-5 1.2 6.05 × 10 11 0.896
Table 7. D e l obtained by Equation (22) at erosion period of 10 days.
i ( A / m 2 ) D e l m 2   V 1   s 1 R 2
I-2 0.3 1.47 × 10 10 0.935
I-3 0.6 6.55 × 10 11 0.905
I-4 0.9 5.97 × 10 11 0.975
I-5 1.2 5.29 × 10 11 0.989
Table 10. Peak energy of Friedel’s salt, AFt, and C3S obtained by XRD test.
i   ( A / m 2 )FAFtC3S
III-1015187082185
III-20.317217022395
III-30.615646072115
III-40.916155691910
III-51.217464662211
Table 11. Pore data of different samples obtained by MIP test.
Porosity
(%)
More Harmful Holes
(>200 nm) (%)
Harmful Holes
(50–200 nm) (%)
Less Harmful Holes
(20–50 nm) (%)
Harmless Holes
(<20 nm) (%)
Total Specific Pore Volume (mL/g)
III-113.82128.46420.37522.82628.3330.065
III-215.85430.58716.82824.51128.0720.076
III-414.71830.81813.26126.55929.3610.070
Table 5. D m obtained by the error function of Fick’s second law at erosion period of 20 days.
i   ( A / m 2 ) D m m 2 / s R 2
II-1 0 1.12 ×   10 11 0.949
II-2 0.3 4.12 × 10 11 0.881
II-3 0.6 4.26 × 10 11   0.865
II-4 0.9 1.73 × 10 10 0.854
II-5 1.2 4.09 ×   10 10 0.970
Table 6. D m obtained by the error function of Fick’s second law at erosion period of 30 days.
i   ( A / m 2 ) D m m 2 / s R 2
III-1 0 1.21 × 10 11 0.825
III-2 0.3 7.94 × 10 11 0.891
III-3 0.6 2.27 × 10 10 0.945
III-4 0.9 8.90 × 10 10 0.976
III-5 1.2 1.17 × 10 9 0.978
Table 8. D e l obtained by Equation (22) at erosion period of 20 days.
i ( A / m 2 ) D e l m 2   V 1   s 1 R 2
II-2 0.3 1.13 × 10 10 0.977
II-3 0.6 6.03 ×   10 11   0.957
II-4 0.9 8.74 × 10 11 0.941
II-5 1.2 8.47 × 10 11 0.907
Table 9. D e l obtained by Equation (22) at erosion period of 30 days.
i   ( A / m 2 ) D e l m 2   V 1   s 1 R 2
III-2 0.3 1.41 × 10 10 0.981
III-3 0.6 1.04 × 10 10 0.936
III-4 0.9 9.39 × 10 11 0.919
III-5 1.2 7.33 × 10 11 0.908
Disclaimer/Publisher’s Note: The statements, opinions and data contained in all publications are solely those of the individual author(s) and contributor(s) and not of MDPI and/or the editor(s). MDPI and/or the editor(s) disclaim responsibility for any injury to people or property resulting from any ideas, methods, instructions or products referred to in the content.