Simulation Study on Age-Friendly Design of Community Park Activity Spaces Based on AnyLogic: A Case Study of Qiaokou Park in Wuhan
Abstract
1. Introduction
2. Materials and Methods
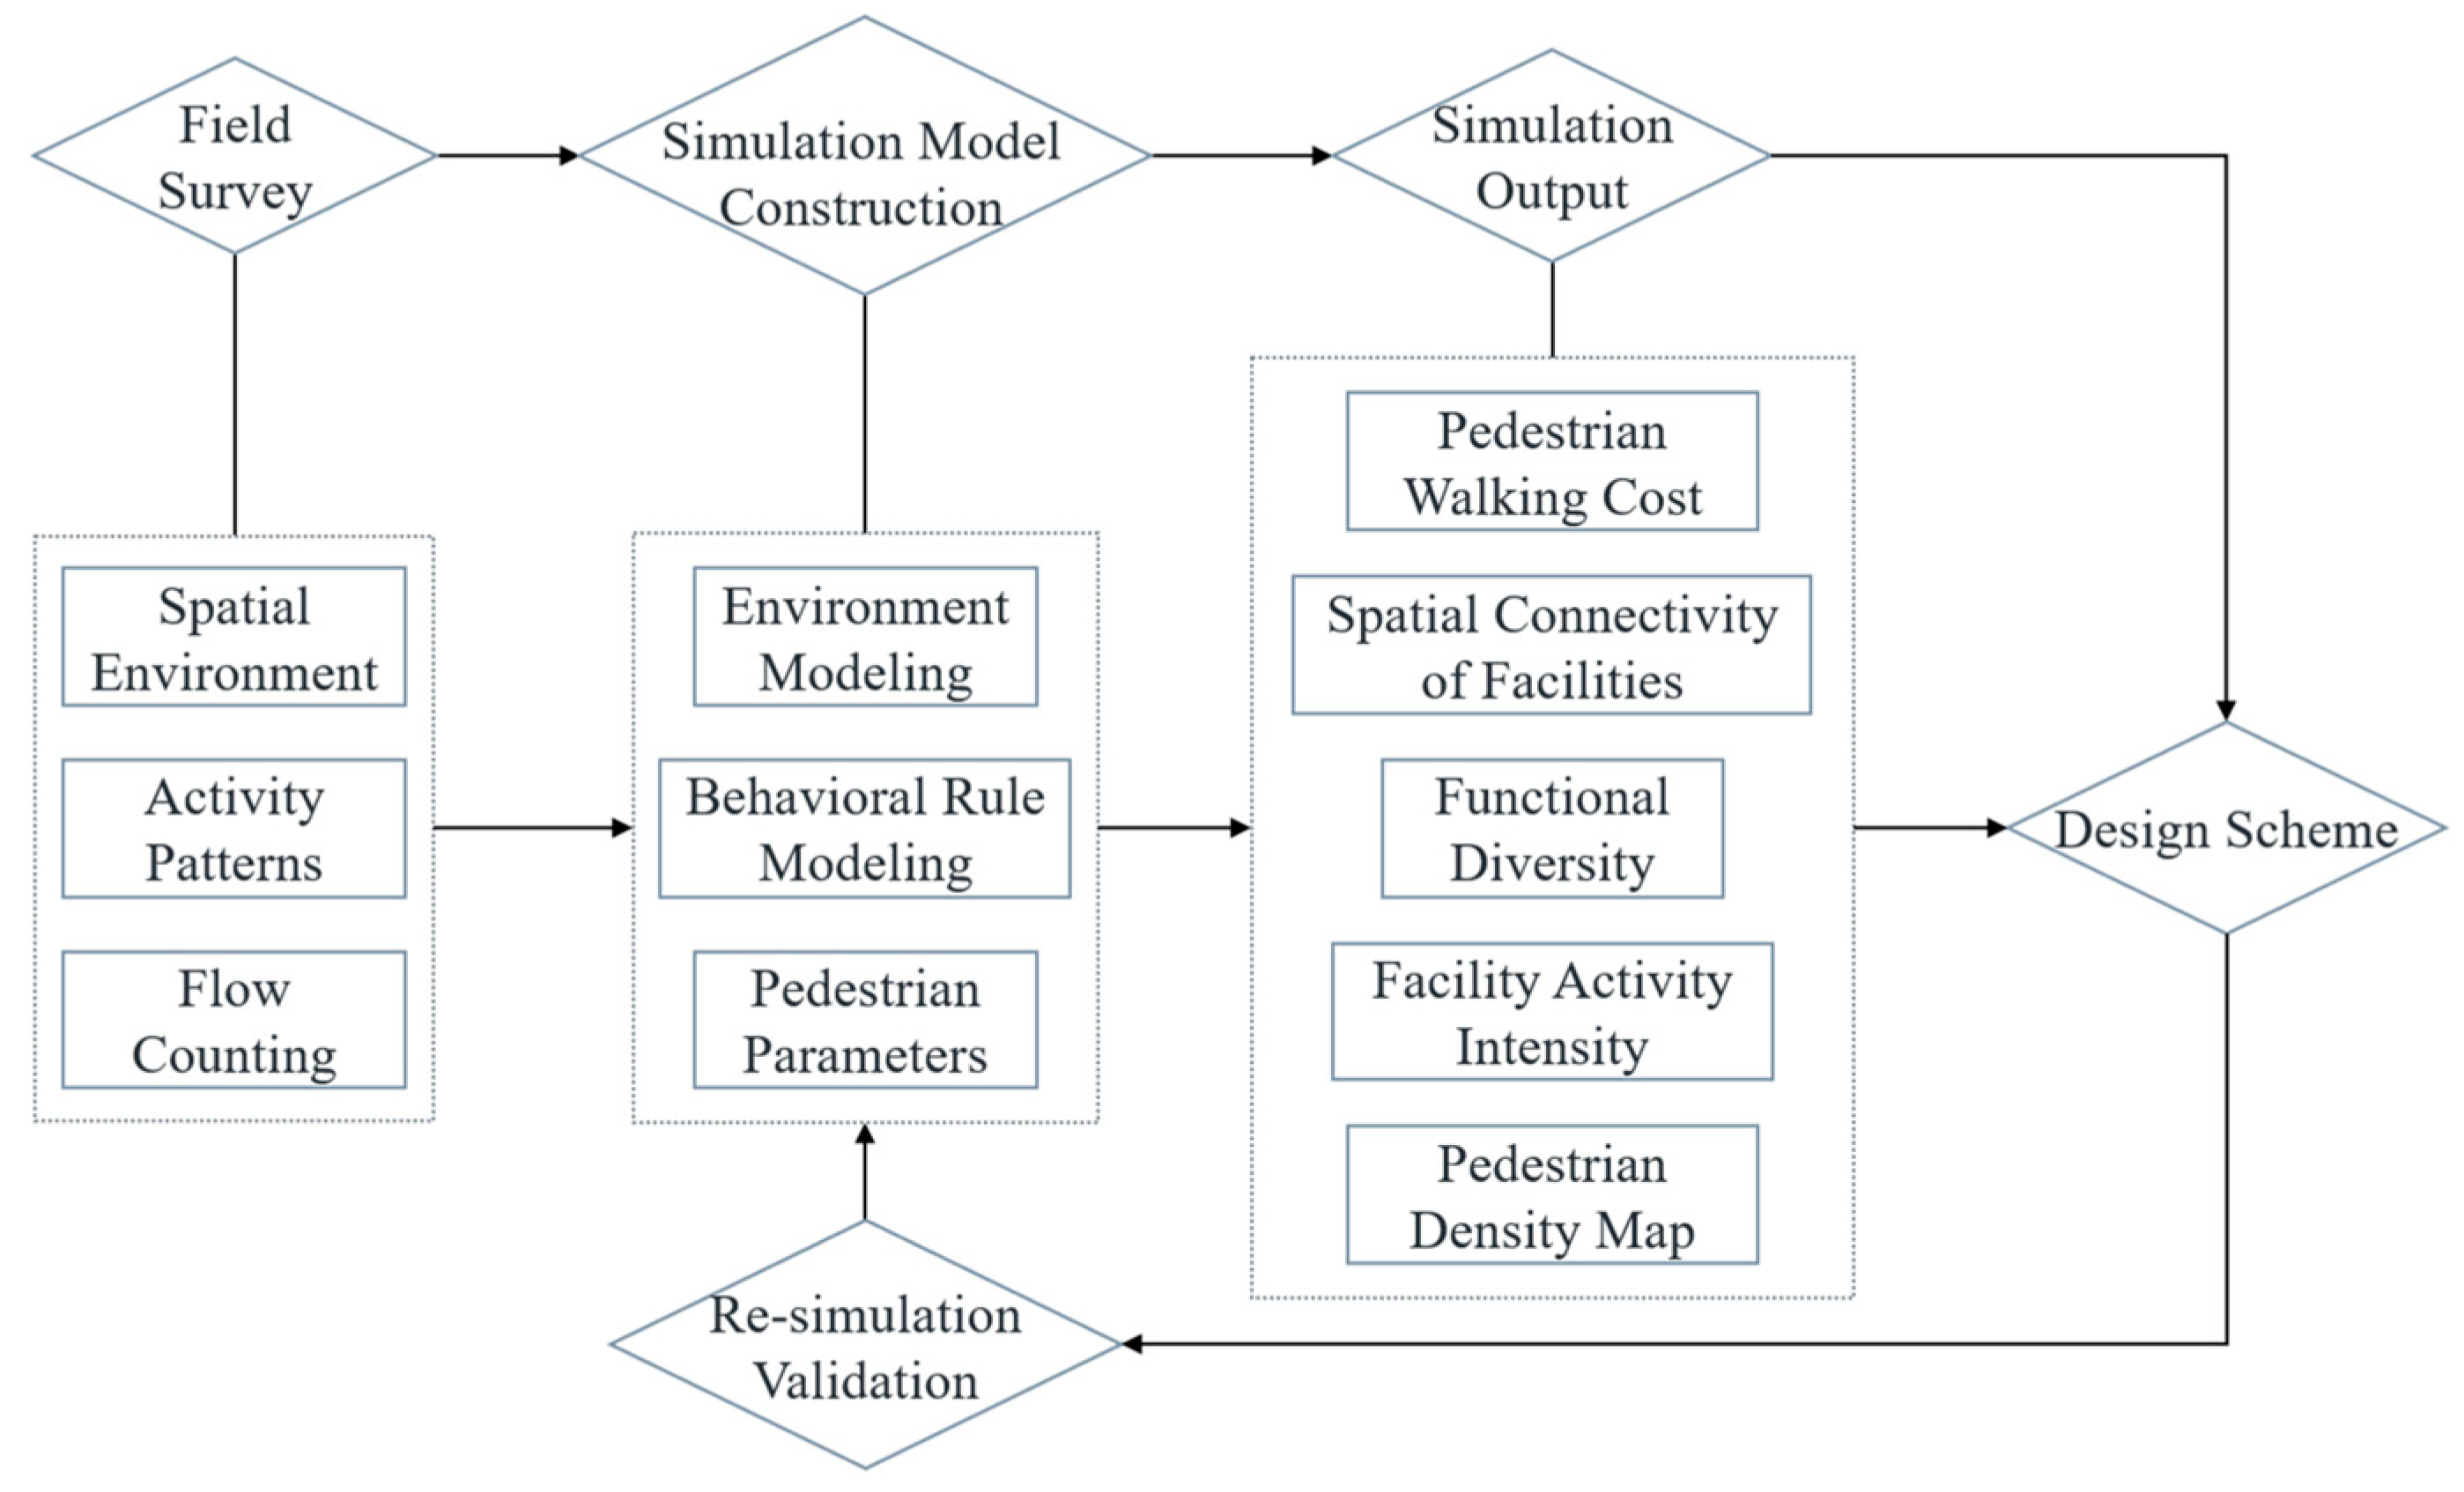
2.1. Research Framework
2.2. Field Study
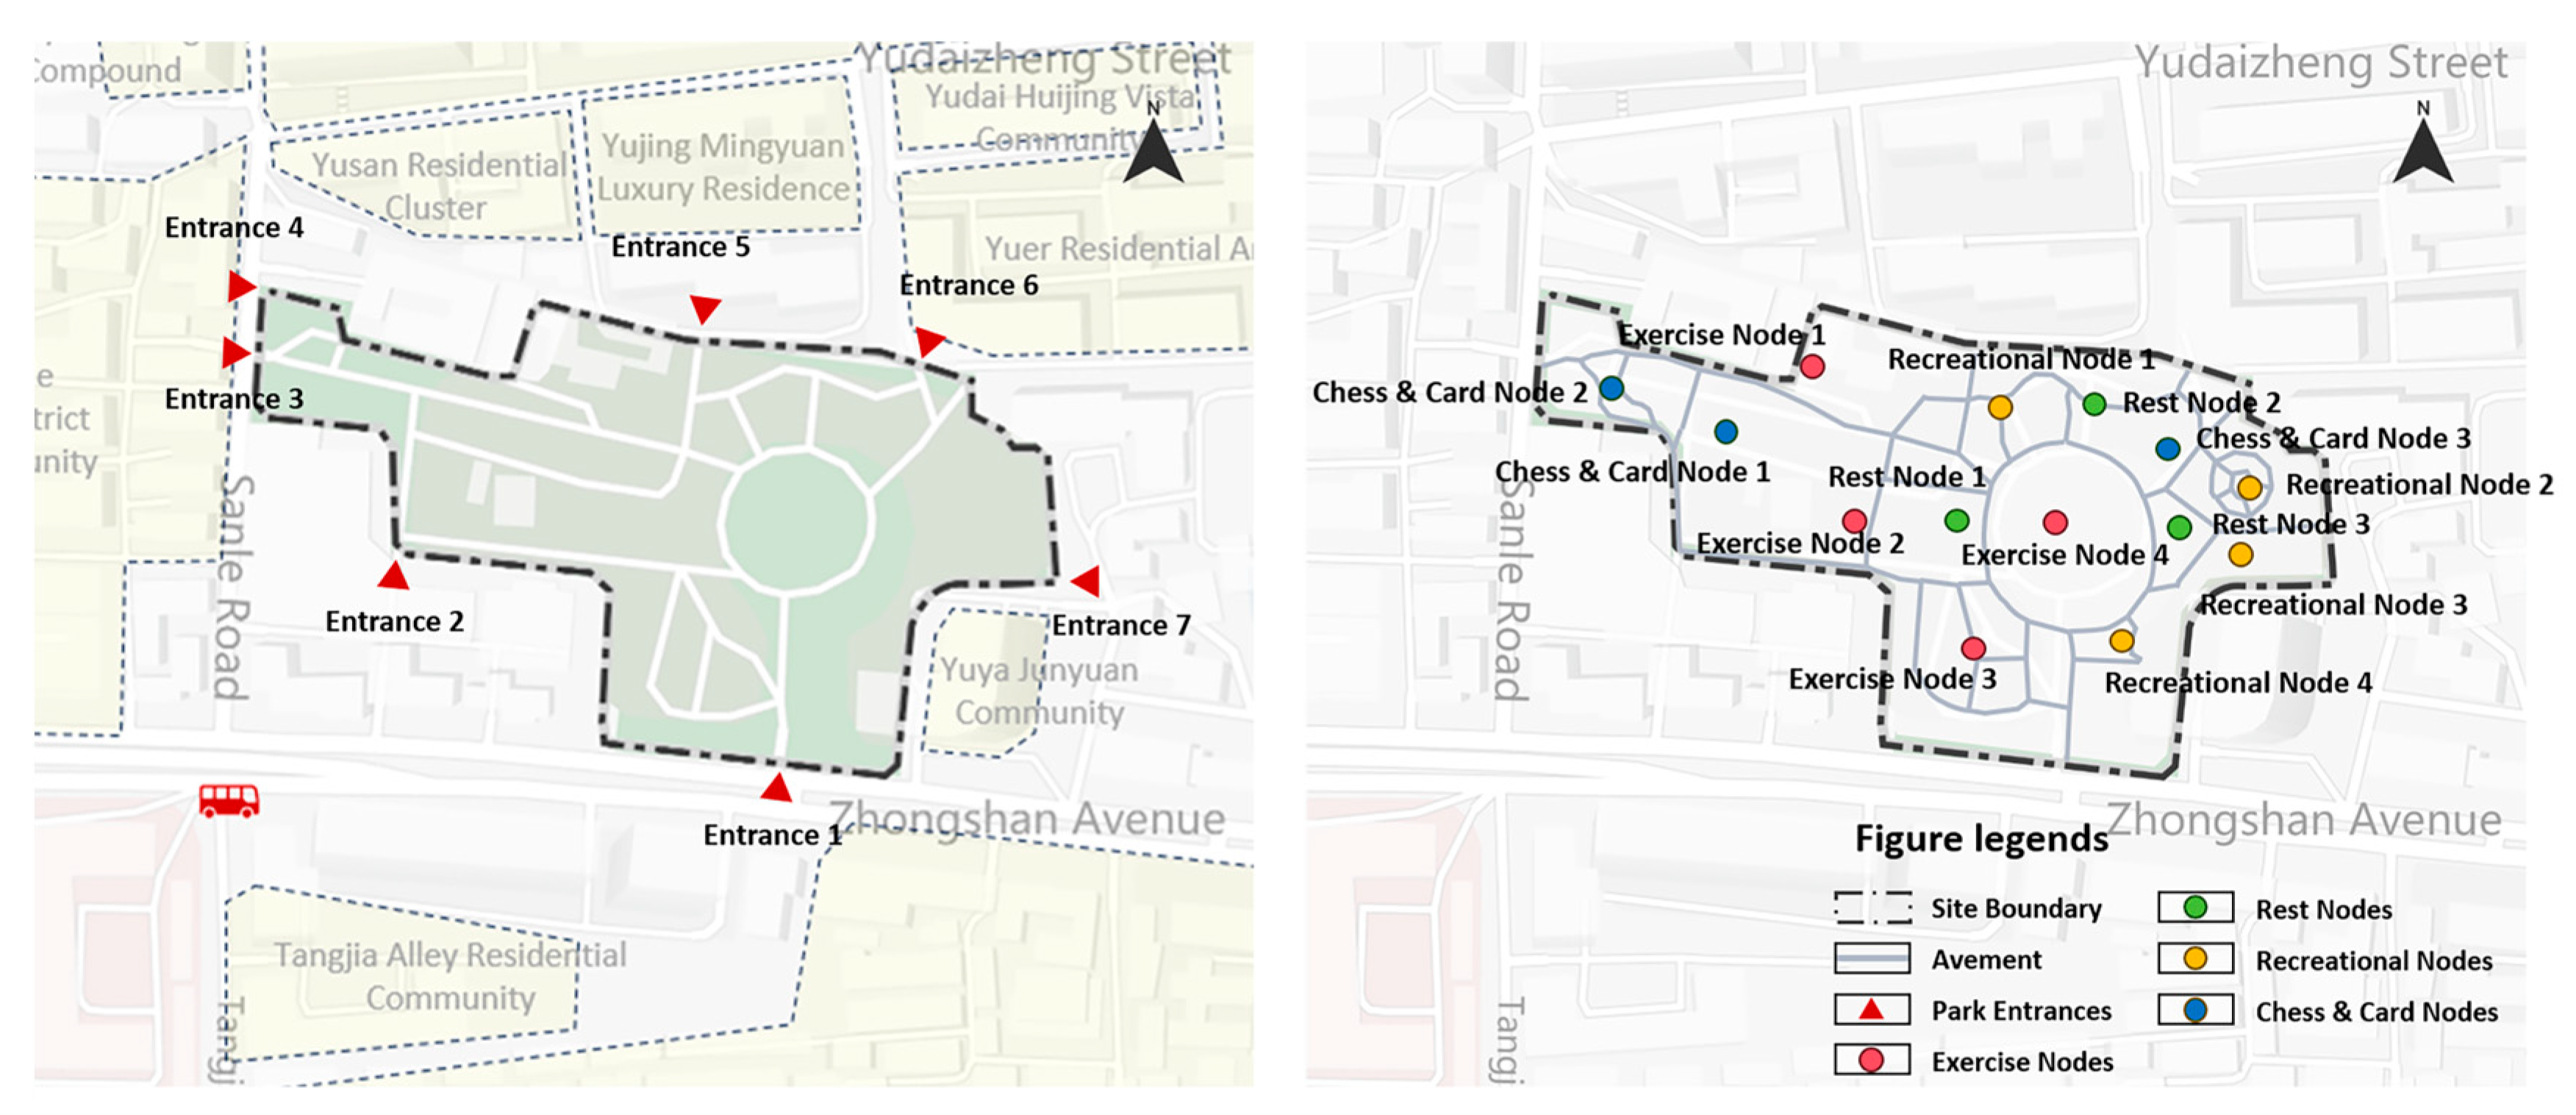
2.2.1. Study Area
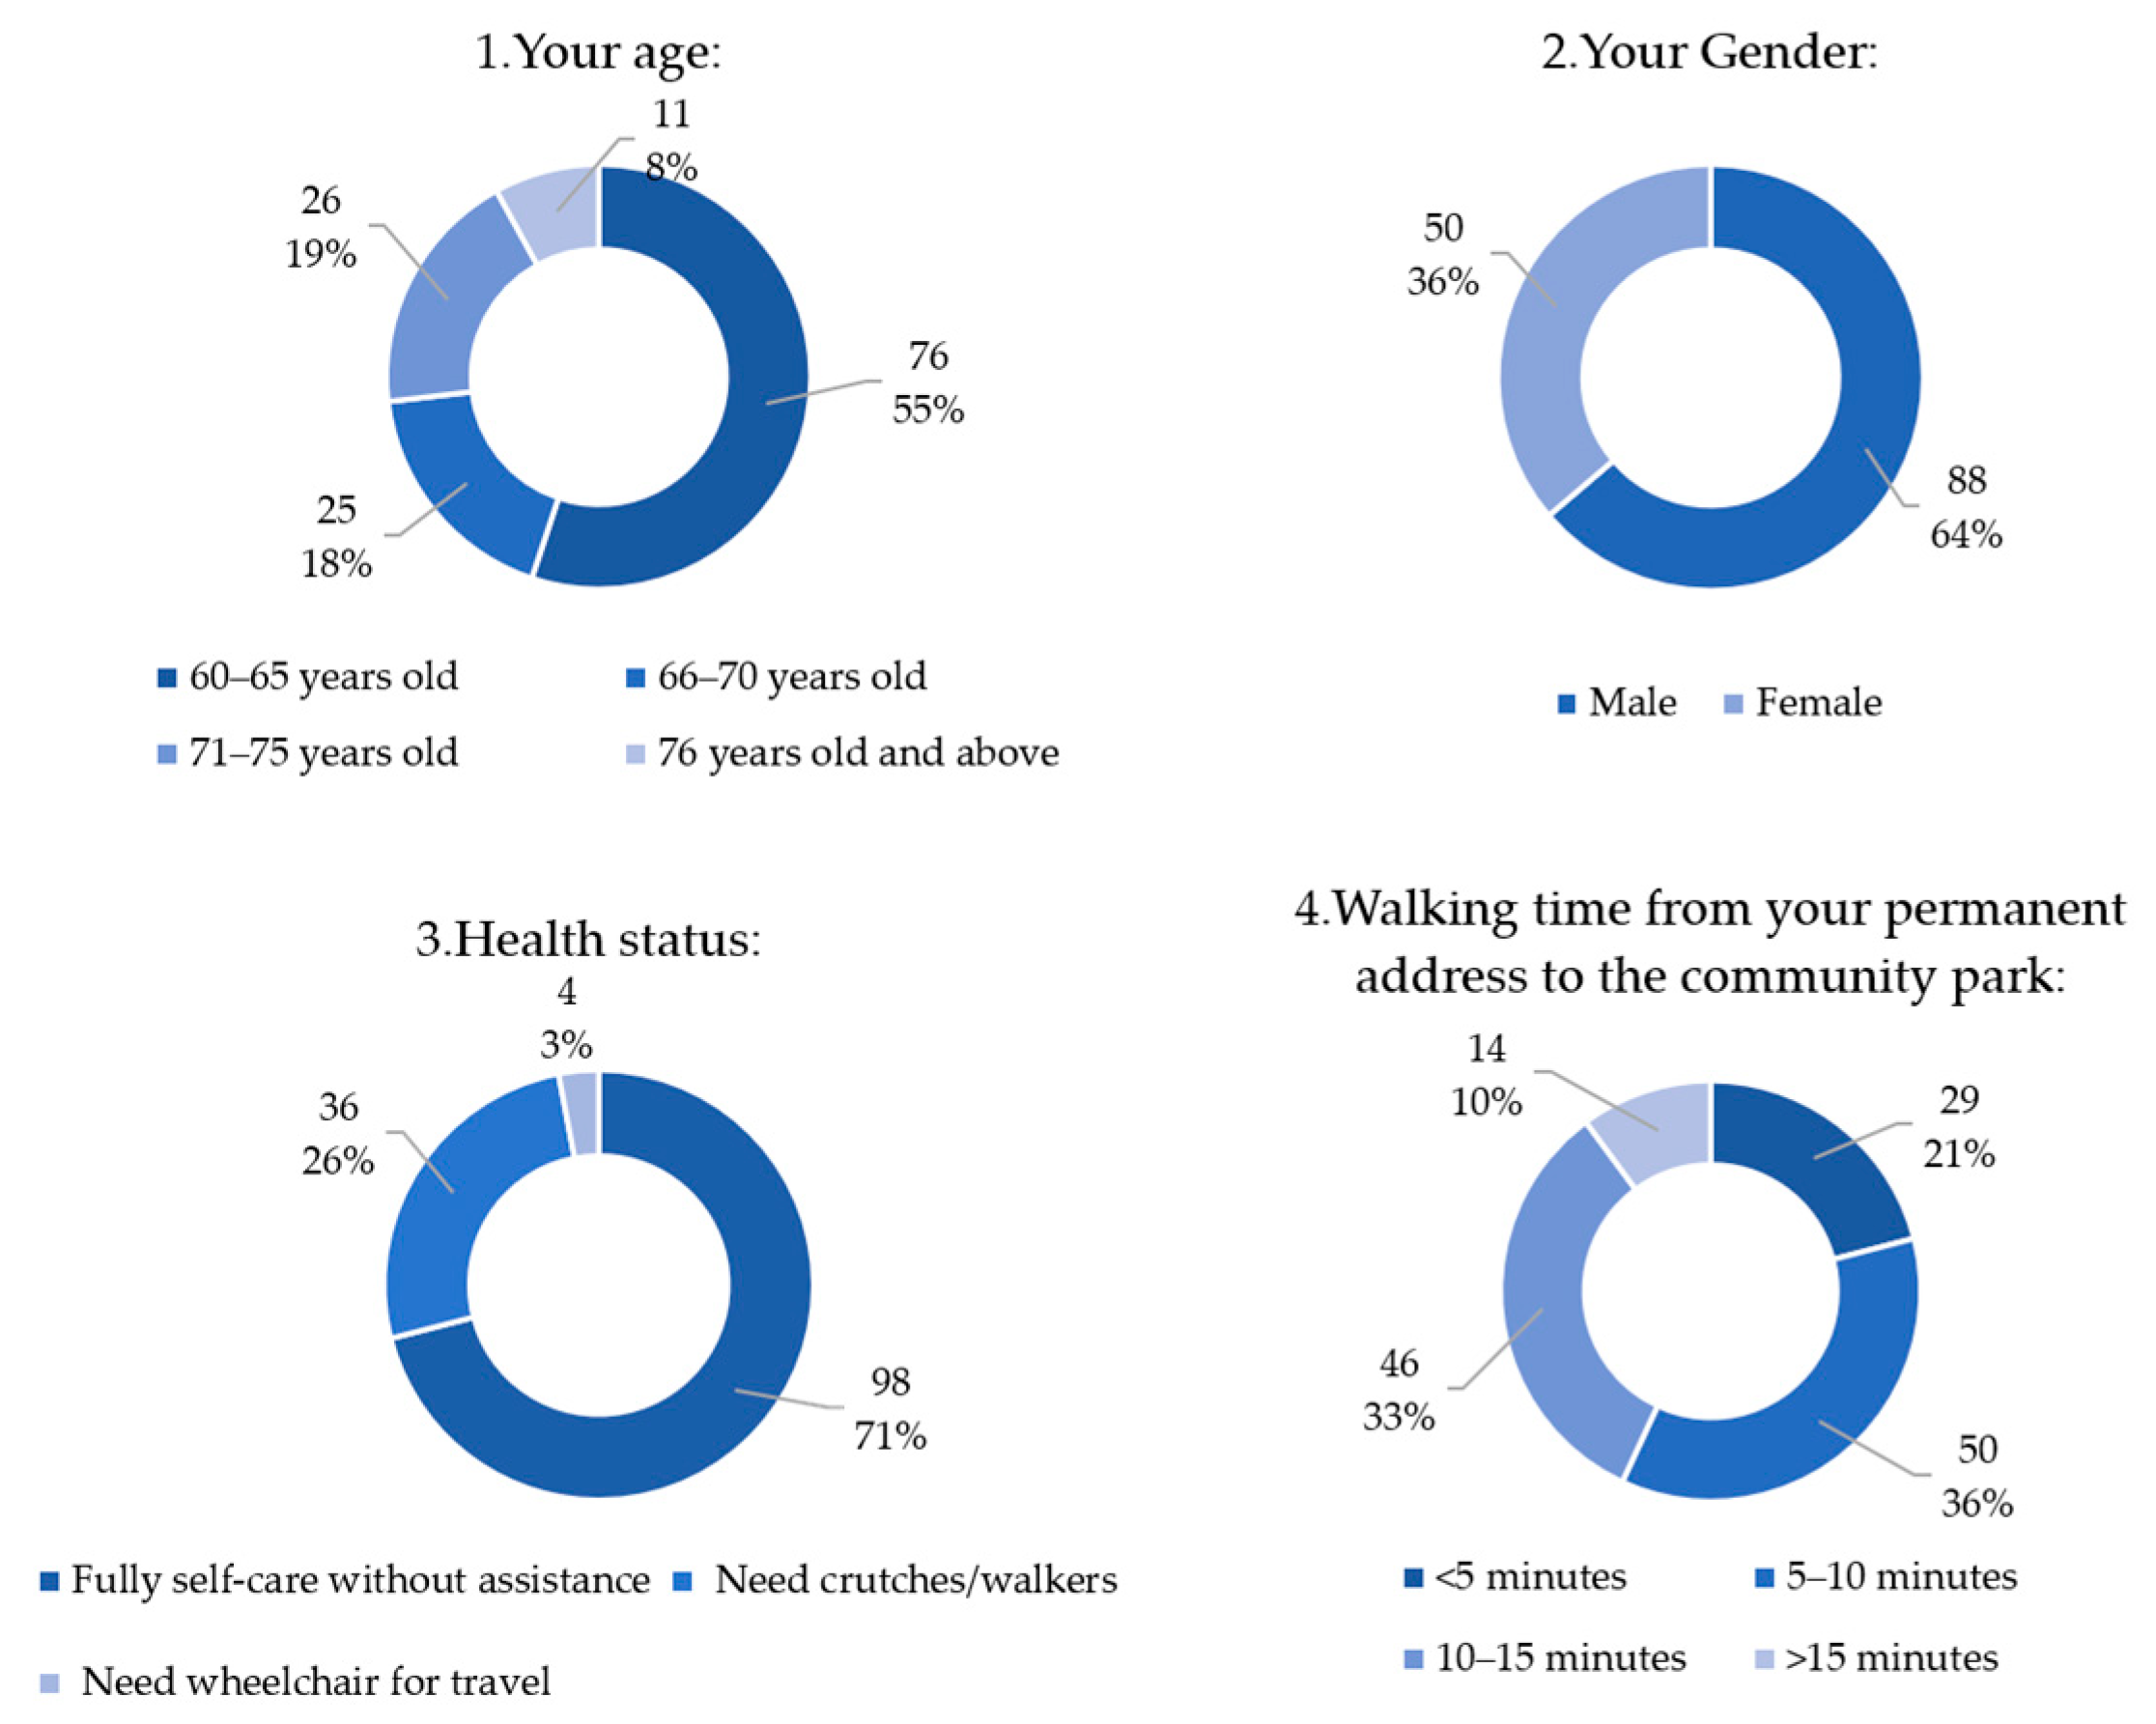
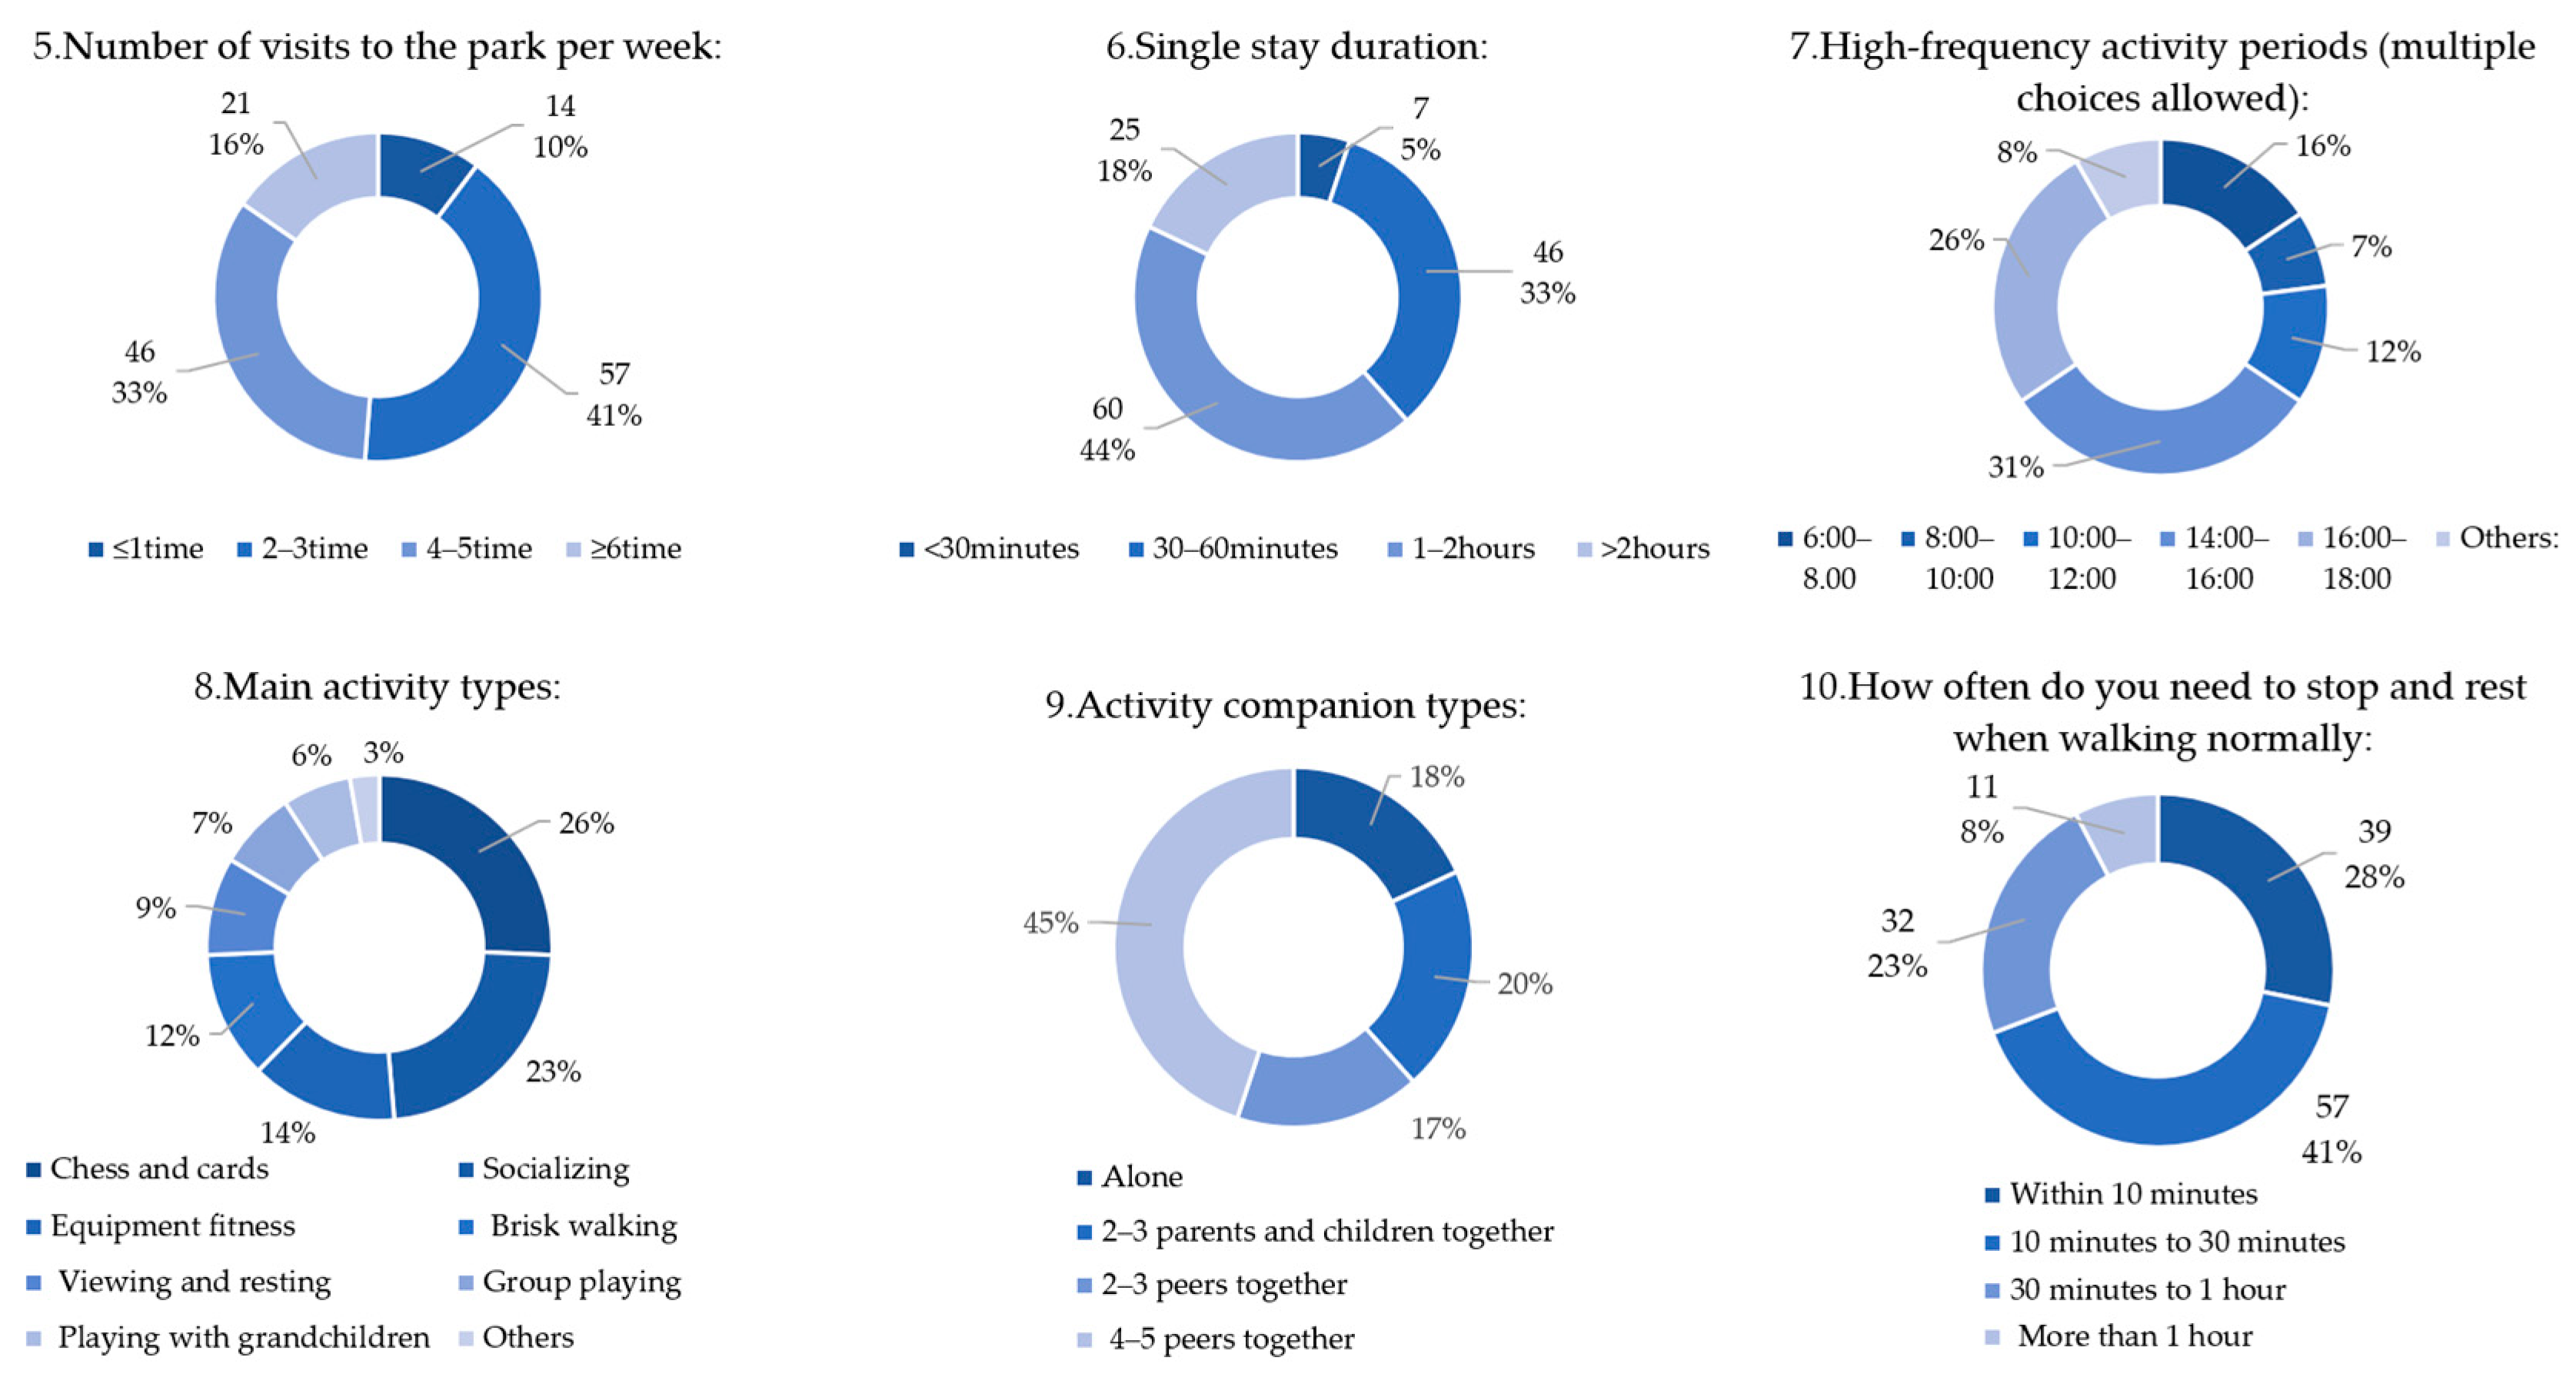
2.2.2. Questionnaire Design and Result Analysis
- (1)
- Questionnaire Design and Distribution
- (2)
- Data Summary and Application to Model Input
2.2.3. Pedestrian Flow Data
2.3. Simulation-Based Indicators
2.3.1. Pedestrian Walking Cost
- C: Pedestrian walking cost (unit: minutes);
- N: Sample size (i.e., number of older adult individuals);
- Ti: The travel time of the i-th older adult individuals from the starting point to the activity destination.
2.3.2. Connectivity of Activity Space Nodes
- C: Connectivity of activity space nodes (unit: minutes);
- N: Sample size (i.e., number of older adult individuals);
- Mi: Number of activity node pairs actually visited by the i-th older adult individual;
- Tij: Travel time of the i-th older adult individuals between the j-th pair of activity nodes.
2.3.3. Functional Mix Efficiency
- D: Functional Mix Efficiency (unit: minutes);
- N: Sample size (i.e., number of older adult individuals);
- ki: Number of different functional activity node pairs visited by the i-th older adult individuals;
- Tik: Travel time of the i-th older adult individuals between the k-th pair of different functional activity nodes.
2.3.4. Activity Intensity of Activity Space Nodes
2.3.5. Pedestrian Density Map
2.4. Pedestrian Simulation Model Construction
3. Simulation of Age-Friendly Adaptation of Community Park Activity Spaces Based on AnyLogic
3.1. Output and Analysis
3.1.1. Simulation Results: Pedestrian Walking Cost
3.1.2. Simulation Results: Connectivity of Activity Space Nodes
3.1.3. Simulation Results: Functional Mix Efficiency

3.1.4. Simulation Results: Activity Intensity of Activity Space Nodes
3.1.5. Simulation Results: Pedestrian Density Map
3.2. Cause Analysis
- (1)
- The pedestrian walking cost at high-frequency activity nodes is relatively low, while it is higher at low-frequency activity nodes. In Qiaokou Park, walking costs for exercise and chess/card activity nodes are relatively favorable, whereas those for rest and recreational nodes require improvement. Specifically, exercise nodes are highly accessible, with 50% of older adult individuals able to reach these facilities within five minutes. Exercise nodes 2 and 4 are located less than 100 m from major entrances, conforming to the design principle that “high-frequency use nodes should be close to entrances.” However, there is a stratified disparity in accessibility for chess and rest nodes; some nodes are situated in remote locations (chess node 3, rest nodes 2 and 3), resulting in poor accessibility. Considering older adult behavioral characteristics, it is found that the main activity purposes of older adults in Qiaokou Park focus on exercise and chess rather than rest or recreation.
- (2)
- The park achieves a balance between overall functional segregation and accessibility of activity nodes. Due to the relatively small scale of Qiaokou Park, nodes in the core area are densely distributed, with an average node connectivity time of approximately 11 min, which meets the physiological needs and activity habits of older adult individuals. Furthermore, the park’s functional segregation and node accessibility create a balanced advantage. Although the cluster of chess nodes on the west side shows reduced connectivity due to soundproofing requirements, this effectively controls adverse effects.
- (3)
- Service capacity and attractiveness are key factors influencing node activity intensity. The chess and exercise areas attract a large number of older adult participants. This not only reflects the strong demand among older adults for chess and exercise activities but also indicates that the layout and environmental atmosphere of these nodes adequately meet their social and exercise needs. Notably, chess node 1 has the highest number of participants, demonstrating the direct influence of site scale and facility service capacity on activity numbers. Activity intensity in rest and recreational areas is relatively low; except for rest node 1, which attracts more older adults due to its advantageous location and higher service capacity, other rest and recreational nodes have lower utilization rates due to smaller scale and limited attractiveness. This suggests that increasing node service capacity and enhancing facility attractiveness can further lower participation barriers and encourage broader older adult engagement.
- (4)
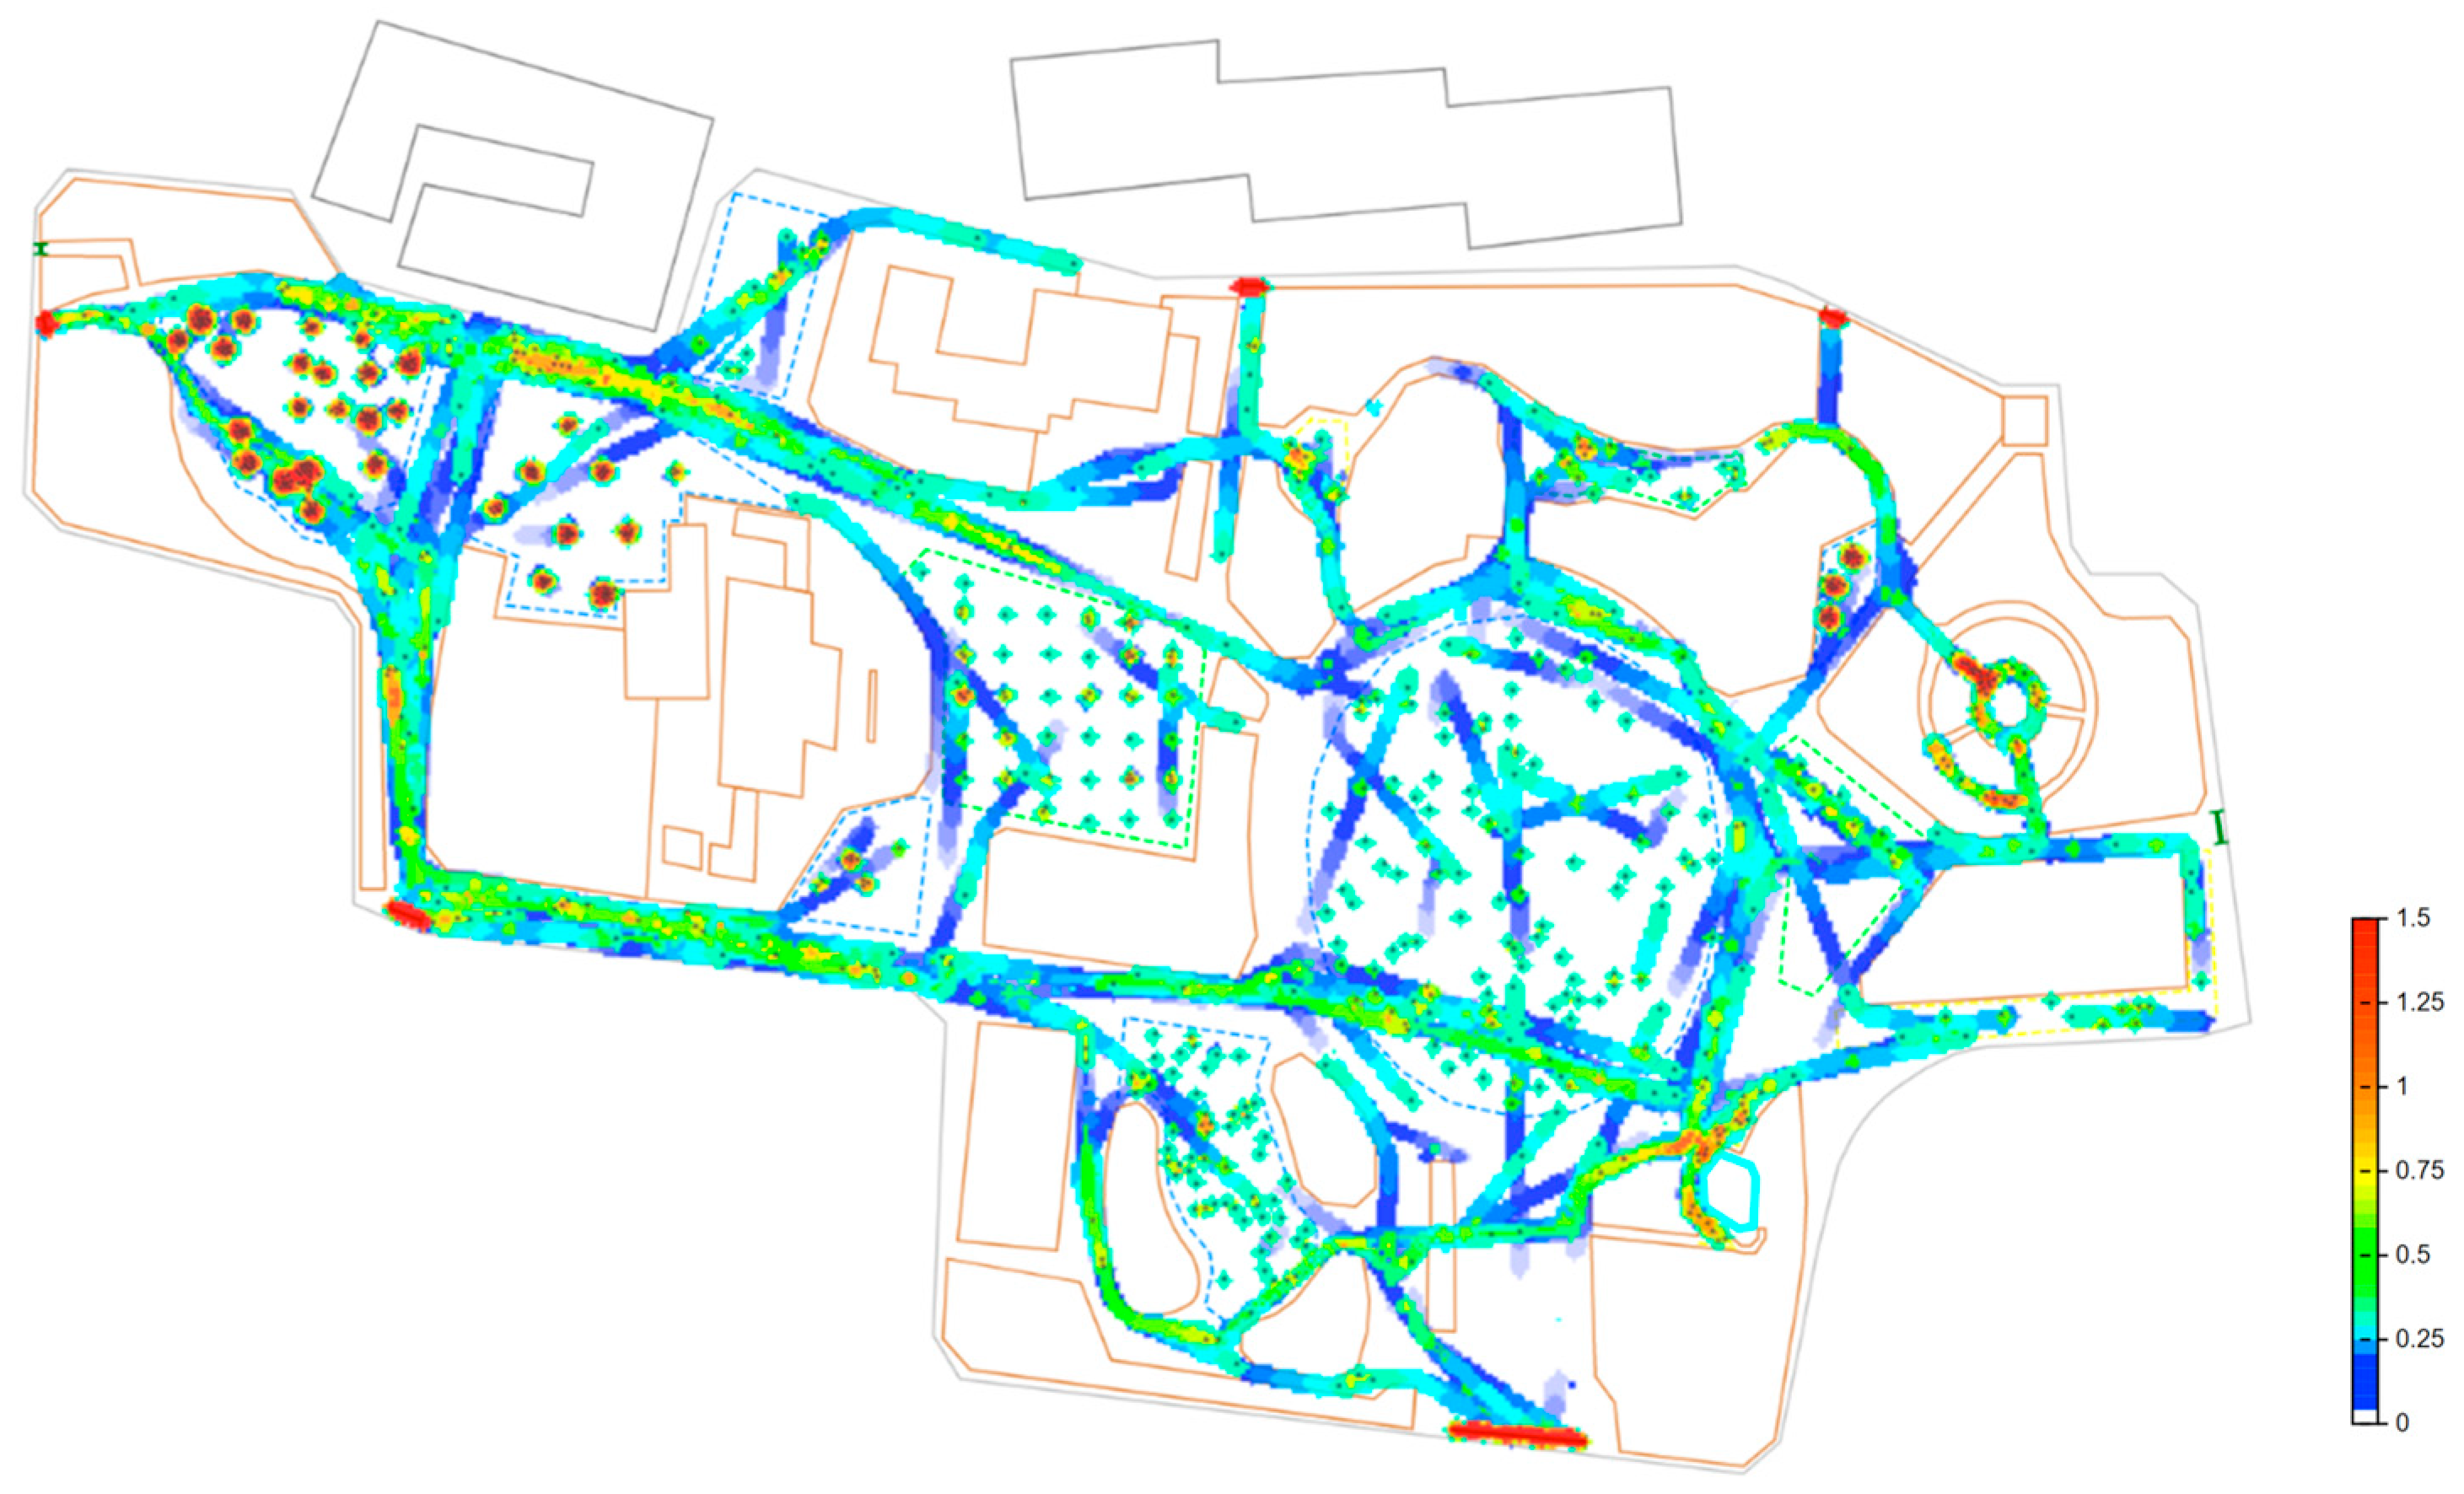
- There is a significant supply–demand contradiction in the park’s peripheral areas. High-density older adult pedestrian zones mainly concentrate around major entrances, core activity plazas, and popular activity nodes. In contrast, peripheral areas exhibit concentrated pedestrian flows, smaller spatial scales, and denser facilities, potentially causing older adult users to feel crowded during activities, which negatively impacts their experience. Specifically, paths near recreational nodes 2 and 4 are narrow with poor accessibility, while rest node 2, recreational node 1, and chess node 3 have limited spatial scales and pronounced supply–demand conflicts.
- (5)
- There is a spatial adaptation imbalance in the chess activity areas. Compared with chess node 2, chess node 1 has a significantly larger number of tables and chairs—more than twice that of node 2—yet its spatial scale is relatively smaller, resulting in a high table-and-chair density of 2.8 per 10 square meters. The excessive number of tables and chairs makes the space feel crowded and markedly reduces visual permeability. Older adult participants may experience spatial oppression during activities, and the high-density crowd can restrict air circulation, increasing the risk of secondhand smoke exposure and heat accumulation. Due to physiological decline with aging, older adult individuals are more sensitive to temperature changes, which can affect their concentration and overall enjoyment during activities.
3.3. Optimization Plan
- (1)
- Enhance spatial quality and service capacity to increase the overall attractiveness of the park.
- (2)
- Implement functional integration and micro-renovations by adding embedded rest facilities to reduce walking costs.
- (3)
- Optimize the path network to divert older adult pedestrian flows.
3.4. Simulation Modeling and Results Comparison
- (1)
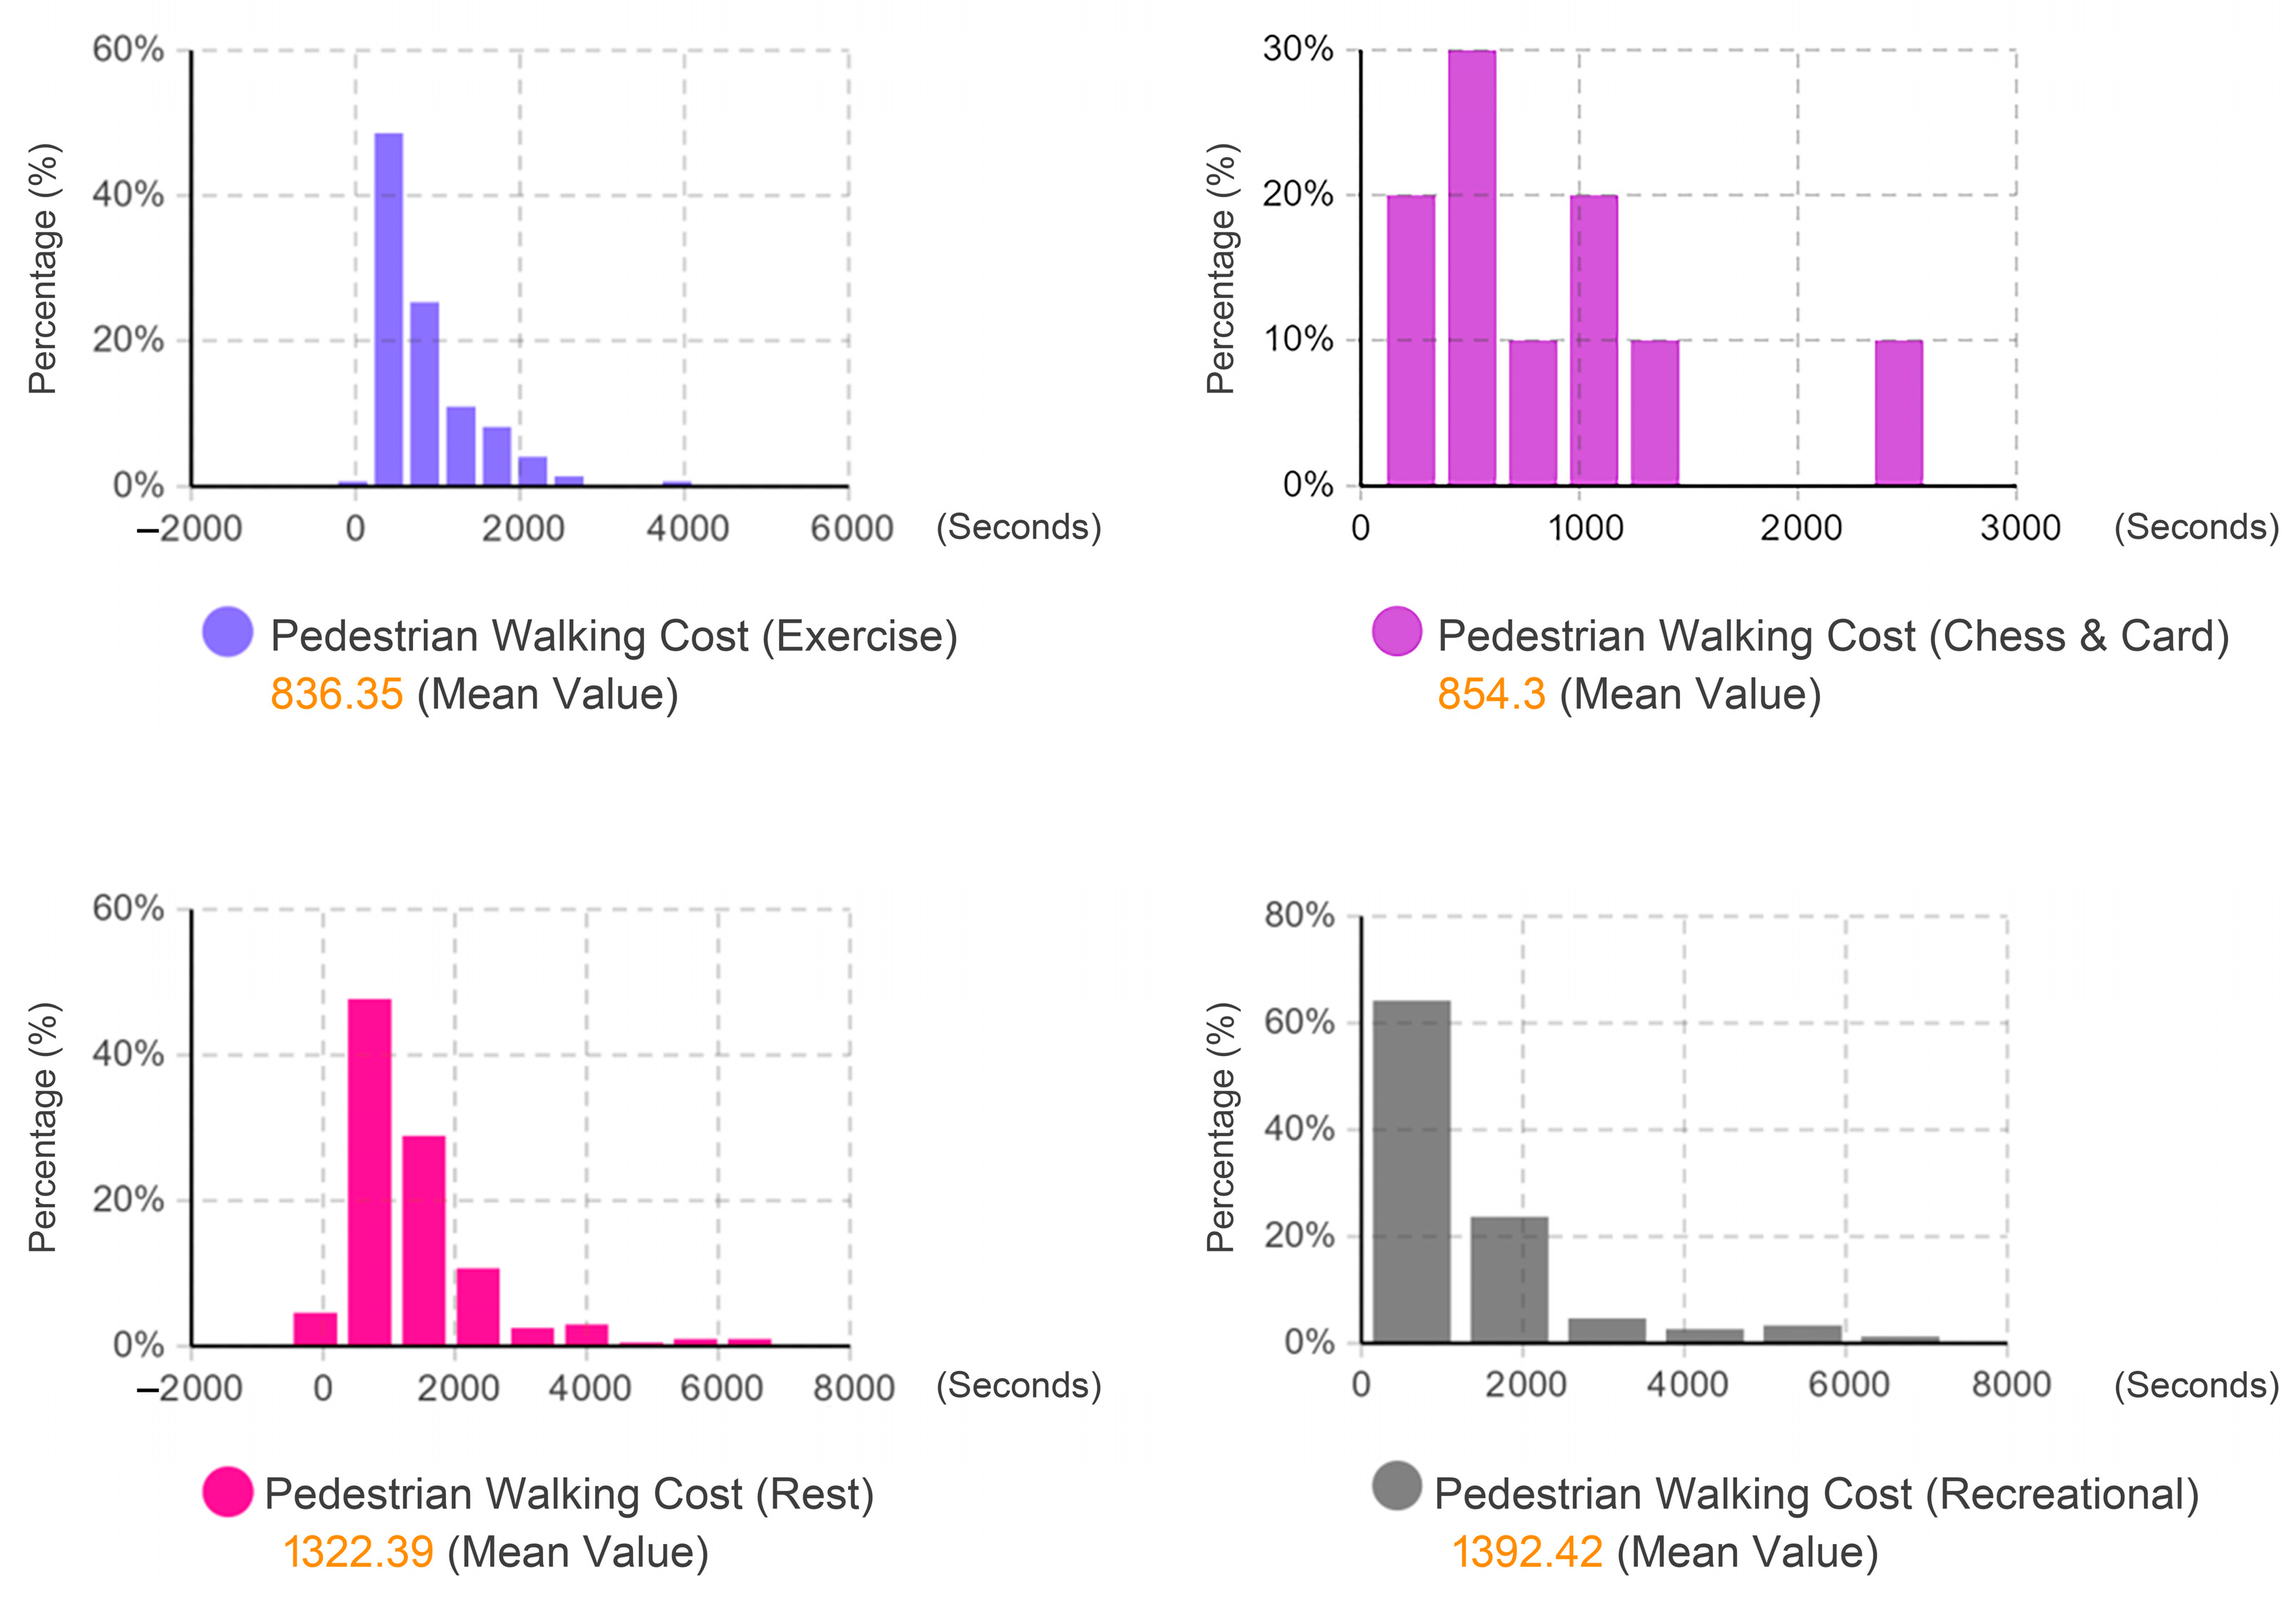
- The pedestrian walking costs for chess & card, exercise, rest, and recreational activities all decreased, reaching 667.39 s, 675.12 s, 1256.96 s, and 1155.81 s, respectively, with reductions of 186.92 s, 161.23 s, 65.94 s, and 236.61 s. Although two additional rest nodes were added, their embedding within the western chess & card area and the southern entrance, combined with older adult users’ habit of resting only after completing other activities, resulted in the smallest decrease in walking cost for rest nodes (65.94 s). With the improvement in the recreational activity environment quality, older adults’ interest in recreational nodes increased, leading to the largest decrease in walking cost (236.61 s) (see Figure 13 for details).
- (2)
- The average travel time between nodes decreased by 117.11 s, indicating an improvement in the connectivity of activity space nodes; the average travel time between nodes of different types decreased by 144.76 s, reflecting an increase in Functional Mix Efficiency. Taken together, the plan’s addition of rest nodes, enhancement of recreational node environment quality, and reorganization of chess & card node layouts led to a greater increase in Functional Mix Efficiency (see Figure 14 for details).
- (3)
- The spatial scale and facility capacity of chess & card node 1 were expanded, resulting in increased usage activity, while chess & card node 2 remained unchanged. After converting chess & card node 3 into a recreational area, noise pollution in the northern part of the park decreased, with the north and east sides being developed into a quiet, high-quality scenic viewing and touring area. Despite the improvement in spatial quality, the real-time activity number in the recreational area remains low due to the limited spatial scale of Qiaokou Park (see Figure 15 for details).
- (4)
- The pedestrian network was optimized by addressing dead-end paths and widening narrow roads. Meanwhile, the densely populated chess & card area was consolidated, with increases in spatial scale and facility capacity. According to the simulation results of older adult pedestrian density, older adult pedestrian density at recreational nodes 2, 4, and 5 (formerly chess & card node 3) significantly decreased, resulting in more comfortable walking routes. Furthermore, by adjusting the spatial scale and table–chair spacing of chess & card nodes 1 and 2, older adult pedestrian density also decreased, improving the activity experience (See Figure 16 for details).
4. Conclusions
- (1)
- Improve the relationship between activity nodes and park entrances. The pedestrian walking cost analysis indicated that longer entrance-to-node distances significantly reduce accessibility for older adults. Therefore, positioning major activity nodes closer to entrances, and installing rest areas and orientation signage, can directly reduce walking burdens and improve spatial usability.
- (2)
- Enhance connectivity among nodes to support continuous activity flows. Designing coherent circulation routes, clear wayfinding, and transitional landscape features can facilitate smoother movements and increase engagement across multiple facilities.
- (3)
- Optimize the pathway network to reduce congestion and barriers. Classifying pathways by function, creating diversion routes, and applying barrier-free designs with appropriate turning radii can alleviate crowding and ensure inclusive mobility.
- (4)
- Promote functional diversity to stimulate active and social use. Integrating multiple functions within activity nodes and arranging them strategically can enhance spatial vitality, encourage intergenerational interaction, and meet diverse preferences of older adults.
- (5)
- Strengthen service capacity of nodes to accommodate user demand. Expanding node areas, providing safe and comfortable equipment, and balancing facility spacing can reduce disorder, enhance satisfaction, and increase the attractiveness of community parks.
- (1)
- Deepening the analysis of older adults’ needs: Future studies should move beyond physiological and safety concerns to systematically incorporate higher-level needs such as social interaction, respect, and self-actualization. In addition, more attention should be paid to individual differences and the dynamic evolution of older adults’ needs over time, thereby establishing a more refined and personalized framework for demand analysis.
- (2)
- Expanding the system of spatial evaluation indicators: Beyond the five simulation indicators adopted in this study (Pedestrian Walking Cost, Connectivity of Activity Space Nodes, Functional Mix Efficiency, Pedestrian Density Map, etc.), future research could develop additional multi-dimensional indicators to capture other aspects of attractiveness and adaptability of community parks for older adults.
- (3)
- Integrating community parks into a broader community-level framework: Age-friendly renewal of community parks should not be carried out in isolation. Instead, future work could integrate parks with residential areas, healthcare institutions, and commercial facilities into a unified community-scale simulation model, thus enabling a more holistic understanding of older adults’ daily needs and spatial behaviors.
Author Contributions
Funding
Institutional Review Board Statement
Informed Consent Statement
Data Availability Statement
Conflicts of Interest
References
- Jun, W. Economic and social impact of China’s aging population and public policy response. China Econ. 2021, 16, 78–107. [Google Scholar]
- Dang, J.W.L.; Wang, L.; Yang, X.; Zhang, Q. China Report of the Development on Ageing Industry (2021–2022); Social Sciences Academic Press: Cambridge, MA, USA, 2023. [Google Scholar]
- Colglazier, W. Sustainable development agenda: 2030. Science 2015, 349, 1048–1050. [Google Scholar] [CrossRef]
- World Health Organization. Global Age-Friendly Cities: A Guide; World Health Organization: Geneva, Switzerland, 2007. [Google Scholar]
- Carr, K.; Weir, P.L.; Azar, D.; Azar, N.R. Universal design: A step toward successful aging. J. Aging Res. 2013, 2013, 324624. [Google Scholar] [CrossRef]
- Ramírez-Saiz, A.; Baquero Larriva, M.T.; Jiménez Martín, D.; Alonso, A. Enhancing Urban Mobility for All: The Role of Universal Design in Supporting Social Inclusion for Older Adults and People with Disabilities. Urban Sci. 2025, 9, 46. [Google Scholar] [CrossRef]
- Verma, I. Adapting Cities for Older Adults Through Universal Design. In Proceedings of the International Conference on Universal Design: Shaping a Sustainable, Equitable, and Resilient Future for All, Oslo, Norway, 20–22 November 2024; IOS Press: Amsterdam, The Netherlands, 2024; pp. 255–262. [Google Scholar]
- Steels, S. Key characteristics of age-friendly cities and communities: A review. Cities 2015, 47, 45–52. [Google Scholar] [CrossRef]
- Jackisch, J.; Zamaro, G.; Green, G.; Huber, M. Is a healthy city also an age-friendly city? Health Promot. Int. 2015, 30 (Suppl. 1), i108–i117. [Google Scholar] [CrossRef]
- Veeroja, P.; Foliente, G.; McCrea, R.; Badland, H.; Pettit, C. The Role of Neighbourhood Social and Built Environments—Including Third Places–in Older Adults’ Social Interactions. Urban Policy Res. 2024, 42, 184–203. [Google Scholar] [CrossRef]
- Wang, W.; Li, Y.; Li, L.; Wang, R.; Wang, Y. Study on thermal comfort of elderly in community parks: An exploration from the perspectives of different activities and ages. Build. Environ. 2023, 246, 111001. [Google Scholar] [CrossRef]
- Carstens, D.Y. Site Planning and Design for the Elderly: Issues, Guidelines, and Alternatives; John Wiley & Sons: Hoboken, NJ, USA, 1993. [Google Scholar]
- Marcus, C.C.; Francis, C. (Eds.) People Places: Design Guidlines for Urban Open Space; John Wiley & Sons: Hoboken, NJ, USA, 1997. [Google Scholar]
- Özgüner, H. Cultural differences in attitudes towards urban parks and green spaces. Landsc. Res. 2011, 36, 599–620. [Google Scholar] [CrossRef]
- Ho, C.H.; Sasidharan, V.; Elmendorf, W.; Willits, F.K.; Graefe, A.; Godbey, G. Gender and ethnic variations in urban park preferences, visitation, and perceived benefits. J. Leis. Res. 2005, 37, 281–306. [Google Scholar] [CrossRef]
- Mak, B.K.; Jim, C.Y. Linking park users’ socio-demographic characteristics and visit-related preferences to improve urban parks. Cities 2019, 92, 97–111. [Google Scholar] [CrossRef]
- Gascon, M.; Zijlema, W.; Vert, C.; White, M.P.; Nieuwenhuijsen, M.J. Outdoor blue spaces, human health and well-being: A systematic review of quantitative studies. Int. J. Hyg. Environ. Health 2017, 220, 1207–1221. [Google Scholar] [CrossRef]
- Veitch, J.; Flowers, E.; Ball, K.; Deforche, B.; Timperio, A. Designing parks for older adults: A qualitative study using walk-along interviews. Urban For. Urban Green. 2020, 54, 126768. [Google Scholar] [CrossRef]
- Pleson, E.; Nieuwendyk, L.M.; Lee, K.K.; Chaddah, A.; Nykiforuk, C.I.; Schopflocher, D. Understanding older adults’ usage of community green spaces in Taipei, Taiwan. Int. J. Environ. Res. Public Health 2014, 11, 1444–1464. [Google Scholar] [CrossRef]
- Veitch, J.; Ball, K.; Rivera, E.; Loh, V.; Deforche, B.; Best, K.; Timperio, A. What entices older adults to parks? Identification of park features that encourage park visitation, physical activity, and social interaction. Landsc. Urban Plan. 2022, 217, 104254. [Google Scholar] [CrossRef]
- Gaikwad, A.; Shinde, K. Use of parks by older persons and perceived health benefits: A developing country context. Cities 2019, 84, 134–142. [Google Scholar] [CrossRef]
- Wang, W.L.; Li, H.C.; Rong, J.Y.; Fan, Q.Q.; Han, X.; Cong, B.H. A modified heuristics-based model for simulating realistic pedestrian movement behavior. Chin. Phys. B 2022, 31, 094501. [Google Scholar] [CrossRef]
- Fruin, J.J. Designing for Pedestrians a Level of Service Concept. Ph.D. Thesis, Polytechnic University, Ann Arbor, MI, USA, 1970. [Google Scholar]
- Gipps, P.G.; Marksjö, B. A micro-simulation model for pedestrian flows. Math. Comput. Simul. 1985, 27, 95–105. [Google Scholar] [CrossRef]
- Blue, V.J.; Adler, J.L. Emergent fundamental pedestrian flows from cellular automata microsimulation. Transp. Res. Rec. 1998, 1644, 29–36. [Google Scholar] [CrossRef]
- Mueller, C.; Klein, U.; Hof, A. An easy-to-use spatial simulation for urban planning in smaller municipalities. Comput. Environ. Urban Syst. 2018, 71, 109–119. [Google Scholar] [CrossRef]
- Jaros, M.; Di Angelo, M.; Ferschin, P. Modeling and simulation of pedestrian behaviour: As planning support for building design. In Proceedings of the 2016 6th International Conference on Simulation and Modeling Methodologies, Technologies and Applications (SIMULTECH), Lisbon, Portugal, 29–31 July 2016; IEEE: New York, NY, USA, 2016; pp. 1–8. [Google Scholar]
- Schaumann, D.; Pilosof, N.P.; Date, K.; Kalay, Y.E. A study of human behavior simulation in architectural design for healthcare facilities. Ann. Dell’istituto Super. Sanità 2016, 52, 24–32. [Google Scholar]
- Ha, V.; Lykotrafitis, G. Agent-based modeling of a multi-room multi-floor building emergency evacuation. Phys. A Stat. Mech. Its Appl. 2012, 391, 2740–2751. [Google Scholar] [CrossRef]
- Shirzadi Babakan, A.; Alimohammadi, A. An agent-based simulation of residential location choice of tenants in Tehran, Iran. Trans. GIS 2016, 20, 101–125. [Google Scholar] [CrossRef]
- Tan, L.; Wu, L.; Lin, H. An individual cognitive evacuation behaviour model for agent-based simulation: A case study of a large outdoor event. Int. J. Geogr. Inf. Sci. 2015, 29, 1552–1568. [Google Scholar] [CrossRef]
- Kirik, E.; Malyshev, A. On validation of SigmaEva pedestrian evacuation computer simulation module with bottleneck flow. J. Comput. Sci. 2014, 5, 847–850. [Google Scholar] [CrossRef]
- Kielar, P.M.; Borrmann, A. Modeling pedestrians’ interest in locations: A concept to improve simulations of pedestrian destination choice. Simul. Model. Pract. Theory 2016, 61, 47–62. [Google Scholar] [CrossRef]
- Borgers, A.; Timmermans, H. A model of pedestrian route choice and demand for retail facilities within inner-city shop areas. Geogr. Anal. 1986, 18, 115–128. [Google Scholar] [CrossRef]
- Nasir, M.; Lim, C.P.; Nahavandi, S.; Creighton, D. A genetic fuzzy system to model pedestrian walking path in a built environment. Simul. Model. Pract. Theory 2014, 45, 18–34. [Google Scholar] [CrossRef]





| Evaluation Dimension | Specific Item | Mean Score | Standard Deviation |
|---|---|---|---|
| A Entrances and exits | A-1 Distance from residence to park entrance | 6.89 | 1.79 |
| A-2 Number of entrances and exits | 7.49 | 1.69 | |
| A-3 Distance to your primary activity space | 8.83 | 3.33 | |
| B Walking paths | B-1 Width/circulation capacity | 7.27 | 1.88 |
| B-2 Safety | 7.43 | 1.74 | |
| B-3 Continuity of the pedestrian network | 7.31 | 1.59 | |
| C Exercise activities | C-1 Capacity of exercise spaces/facilities | 7.22 | 1.82 |
| C-2 Diversity of exercise activity types | 6.94 | 1.70 | |
| C-3 Location of exercise spaces | 7.23 | 1.83 | |
| D rest activities | D-1 Capacity of rest spaces/facilities | 7.10 | 1.73 |
| D-2 Diversity of rest activity types | 6.94 | 1.93 | |
| D-3 Location of rest spaces | 7.38 | 1.65 | |
| E Recreational activities | E-1 Capacity of recreational spaces/facilities (e.g., chess, performances, parent–child play) | 6.84 | 1.86 |
| E-2 Diversity of recreational activity types (e.g., chess, performances, parent–child play) | 6.78 | 2.04 | |
| E-3 Location of recreational activity spaces (e.g., chess, performances, parent–child play) | 7.03 | 1.90 |
| Activity Space Node | Average Duration (Minutes) | 6:00–8:00 | 8:00–10:00 | 10:00–12:00 | 14:00–16:00 | 16:00–18:00 |
|---|---|---|---|---|---|---|
| Chess & Card Node 1 | 10 | 0 | 2 | 0 | 152 | 148 |
| Chess & Card Node 2 | 10 | 0 | 0 | 1 | 81 | 88 |
| Chess & Card Node 3 | 10 | 2 | 0 | 0 | 32 | 29 |
| Exercise Node 1 | 10 | 0 | 2 | 2 | 2 | 4 |
| Exercise Node 2 | 10 | 8 | 7 | 13 | 17 | 14 |
| Exercise Node 3 | 10 | 24 | 19 | 8 | 10 | 13 |
| Exercise Node 4 | 10 | 69 | 123 | 62 | 107 | 53 |
| Rest Node 1 | 10 | 6 | 18 | 23 | 34 | 28 |
| Rest Node 2 | 10 | 0 | 2 | 4 | 3 | 4 |
| Rest Node 3 | 10 | 2 | 4 | 0 | 2 | 1 |
| Recreational Node 1 | 10 | 0 | 4 | 2 | 2 | 5 |
| Recreational Node 2 | 10 | 2 | 2 | 3 | 4 | 2 |
| Recreational Node 3 | 10 | 0 | 0 | 2 | 0 | 6 |
| Recreational Node 4 | 10 | 0 | 7 | 6 | 3 | 4 |
| Parameter | Value/Distribution | Data Source | Remarks |
|---|---|---|---|
| Gender (Male:Female) | Discrete distribution (64, 36) | Questionnaire Survey | Reflects the actual gender composition of park users |
| Age | Discrete distribution (55, 18, 19, 8) | Questionnaire Survey | Used to differentiate behavioral characteristics among age groups |
| Speed | Triangular (0.2, 0.4, 0.6) m/s | Field Survey | The distance elderly individuals move per unit time, affected by resting, sightseeing, and social interaction |
| Radius | Uniform (0.45, 1.30) | Field Survey | Perception radius for interactions such as avoidance and following |
| Probability of walking in groups | Bernoulli (0.9) | Field Survey | Probability that elderly individuals enter the park as a group or alone |
| Group distance | member.moveTo (leaderX + 0.8, leaderY + 0.8) | Field Survey | Ensures group members maintain approximately 0.8 m distance around the leader |
| Activity Space Node | Activity Delay Setting | Activity Space Node | Activity Delay Setting |
|---|---|---|---|
| Chess & Card Node 1 | triangular (95, 178, 253) | Rest Node 1 | triangular (25, 64, 117) |
| Chess & Card Node 2 | triangular (82, 160, 205) | Rest Node 2 | triangular (2, 8, 17) |
| Chess & Card Node 3 | triangular (54, 130, 200) | Rest Node 3 | triangular (7, 13, 22) |
| Exercise Node 1 | triangular (12, 30, 45) | Recreational Node 1 | triangular (1, 3.6, 7) |
| Exercise Node 2 | triangular (19, 38, 68) | Recreational Node 2 | triangular (3, 6, 11) |
| Exercise Node 3 | triangular (30, 47, 58) | Recreational Node 3 | triangular (2, 8, 17) |
| Exercise Node 4 | triangular (45, 77, 115) | Recreational Node 4 | triangular (5, 14, 25) |
Disclaimer/Publisher’s Note: The statements, opinions and data contained in all publications are solely those of the individual author(s) and contributor(s) and not of MDPI and/or the editor(s). MDPI and/or the editor(s) disclaim responsibility for any injury to people or property resulting from any ideas, methods, instructions or products referred to in the content. |
© 2025 by the authors. Licensee MDPI, Basel, Switzerland. This article is an open access article distributed under the terms and conditions of the Creative Commons Attribution (CC BY) license (https://creativecommons.org/licenses/by/4.0/).
Share and Cite
Zhou, Y.; Zhao, Q. Simulation Study on Age-Friendly Design of Community Park Activity Spaces Based on AnyLogic: A Case Study of Qiaokou Park in Wuhan. Buildings 2025, 15, 3419. https://doi.org/10.3390/buildings15183419
Zhou Y, Zhao Q. Simulation Study on Age-Friendly Design of Community Park Activity Spaces Based on AnyLogic: A Case Study of Qiaokou Park in Wuhan. Buildings. 2025; 15(18):3419. https://doi.org/10.3390/buildings15183419
Chicago/Turabian StyleZhou, Yuting, and Qian Zhao. 2025. "Simulation Study on Age-Friendly Design of Community Park Activity Spaces Based on AnyLogic: A Case Study of Qiaokou Park in Wuhan" Buildings 15, no. 18: 3419. https://doi.org/10.3390/buildings15183419
APA StyleZhou, Y., & Zhao, Q. (2025). Simulation Study on Age-Friendly Design of Community Park Activity Spaces Based on AnyLogic: A Case Study of Qiaokou Park in Wuhan. Buildings, 15(18), 3419. https://doi.org/10.3390/buildings15183419


