Article

Study on Carbon Emission Accounting and Influencing Factors of Chinese Buildings in Materialization Stage

1
Department of Management Science and Engineering, Guangxi University of Finance and Economics, Nanning 530007, China
2
Department of Logistics and Infrastructures, Guangxi University, Nanning 530004, China
*
Author to whom correspondence should be addressed.
Buildings 2025, 15(18), 3414; https://doi.org/10.3390/buildings15183414
Submission received: 21 July 2025 / Revised: 29 August 2025 / Accepted: 17 September 2025 / Published: 21 September 2025
(This article belongs to the Section Building Energy, Physics, Environment, and Systems)

Abstract

Carbon emissions in the building materialization stage are highly significant and concentrated. Quantification at this stage is essential for assessing carbon reduction potential, guiding energy-saving strategies, and supporting China’s “dual carbon” goals in the construction sector. Distinct from conventional environmental and energy economics analytical approaches, the building carbon emissions in the materialization stage (BCEMS) in 30 provinces of China from 2010 to 2021 were calculated using multi-source data, and the characteristics of their spatio-temporal evolution were analyzed. The key influencing factors were identified using a geographic detector, and their spatial heterogeneity was analyzed with the Geographically and Temporally Weighted Regression (GTWR) model from a geographical analysis perspective. The results indicated the following: (1) From 2010 to 2021, BCEMS exhibited a trend of an “initial increase followed by a decrease and subsequent fluctuation”, with an average annual growth rate of 4.28%. Building materials were the largest contributor to BCEMS, particularly cement and steel. Spatially, the emissions displayed a pattern of “higher in the east, lower in the west”. High–high-agglomeration areas remained stable over time, primarily in Zhejiang and Fujian provinces, while low–low-agglomeration areas were concentrated in Xinjiang. (2) Single-factor detection revealed that fixed assets, population density, and the liabilities of construction enterprises were the dominant factors driving the emissions’ spatial evolution. Two-factor interaction detection identified the economic society and the construction industry as the key influencing domains. (3) The economic development level and the total population showed a positive correlation with BCEMS, with the effect intensity increasing from west to east. The urbanization level and fixed assets also generally showed a positive correlation with BCEMS; however, their effect intensity initially increased positively from west to east and then turned into a negative enhancement. The findings provide references for implementing regionally differentiated carbon reduction measures and promoting green and low-carbon urban transformation in China’s construction industry.

1. Introduction

Against the backdrop of global warming, the international community has been paying increasing attention to greenhouse gas emissions [1]. In 2023, the United Nations Environment Program (UNEP) highlighted that the construction industry is the world’s largest emitter of greenhouse gases, accounting for 37% of global emissions. It ranks alongside industry and transport as one of the three major sectors for global energy consumption and CO2 emissions [2,3]. Meanwhile, the construction industry is a major contributor to carbon emissions in China, with its emissions accounting for 35% to 50% of the national total emissions [4]. It has huge potential for reducing carbon emissions [5] and is an important part of China’s steady progress toward achieving a carbon peak and carbon neutrality [6]. Therefore, thoroughly investigating the current status of carbon emissions in the construction industry and identifying key influencing factors will lay the groundwork for cities to develop tailored carbon reduction strategies. This approach will contribute to China’s achievement of its “dual carbon” goals and advances global climate mitigation efforts [7].
Research on carbon emissions in the construction industry has drawn considerable academic attention, centering primarily on carbon accounting and analysis of influencing factors. Carbon accounting serves as the foundation for quantifying trends and designing emission reduction pathways. Most existing studies have explored carbon emission levels in multiple fields from a macro perspective, covering global, national, provincial, and urban agglomeration scales [8,9,10]. These studies have revealed the status of regional energy consumption and carbon emissions, providing a basis for governments to formulate carbon reduction policies. The internationally recognized accounting methods include the emission factor method, the life cycle assessment (LCA) method, and the input–output analysis method [11]. Most of the research on carbon emissions in China adopts the widely used and authoritative carbon emission factor method [12]. The research perspective of carbon accounting in the construction industry has shifted from solely focusing on operational energy consumption to progressively encompassing the entire life cycle, including building material production, construction, building operation, and demolition [13]. Research findings from developed countries, such as those in Europe and North America, consistently indicate that the operation stage constitutes a relatively high proportion of building carbon emissions (>60%) [14,15]. Research in China reveals that building carbon emissions exhibit three key characteristics: a substantial total volume, significant regional disparities, and a considerable reduction potential [5,16]. However, while some studies identify the operation stage as contributing the highest proportion (approximately 60%) to the entire life-cycle carbon emissions [17], others demonstrate that the materialization stage (covering material production and construction stages) constitutes the largest share (approximately 54%) [18,19]. The differences in the above results may be due to differences in the statistical quality of the accounting data, geographical location, climate conditions, energy structure, and other factors. Studies have revealed a more pronounced issue regarding carbon emissions during the material production and construction phases in developing countries undergoing rapid urbanization [20], which has remained a key focus for energy conservation and emission reduction efforts.
The influencing factors of carbon emissions in the construction industry are primarily classified into social, economic, energy, and architectural dimensions. Studies utilize selected indicators—including population size, income levels, energy intensity effects, and urbanization rates—to investigate their impacts on regional building carbon emissions [21,22]. Most studies have found that economy, population, and energy consumption have a positive impact on emissions [23]. Increase in the economy and population are accompanied by a rising building demand, serving as a key factor for carbon emission growth. Conversely, a decline in energy consumption is a critical factor for carbon emission reduction and has significant potential for further decrease. The urbanization level mostly exerts a negative impact on building carbon emissions via behaviors such as optimizing infrastructure and transforming energy structures [24]. The analytical models for influencing factors mainly include LMDI, STIRPAT, regression analysis, and spatial econometric models [12,25,26,27]. Spatio-temporal studies on building carbon emissions across various countries have revealed the following main observations: Firstly, a “core-periphery” differentiation is universally present, where high emission density concentrates in economically developed and densely populated metropolitan areas. Secondly, while emission hotspots predominantly occur within built-up urban zones in developed countries, these hotspots tend to be located in industrial areas or raw material production sites in developing nations [28,29]. Research in China has examined carbon emissions in the construction industry and their influencing factors at national and provincial levels, yet spatial heterogeneity analysis of these factors remains limited. Given China’s vast territory with regions at varying developmental stages—where construction industry conditions differ substantially—even identical factors exert divergent impacts on carbon emissions across different regions. It is, therefore, imperative to incorporate spatial heterogeneity into econometric models [30], enhancing the precision and scientific rigor of research outcomes.
China has proposed to peak carbon dioxide emissions before 2030 and achieve carbon neutrality before 2060. The period of 2026–2030 is a critical stage for China’s construction industry to achieve carbon peak and lay a foundation for carbon neutrality [7,31,32]. Nevertheless, the construction industry faces significant challenges in achieving the “dual carbon” goals, primarily due to persistent issues, including the continuous expansion of construction scale, rigid growth in energy consumption, and low adoption rates of low-carbon clean energy sources [3]. Therefore, this study focused on 30 provinces in China. Using data from building materials, fossil fuels, and electricity, the BCEMS from 2010 to 2021 were calculated using the emission factor method. The spatiotemporal evolution and agglomeration characteristics of BCEMS were analyzed, and key influencing factors were explored from the perspectives of economy, society, and enterprises. The research results can provide references for differentiated carbon emission governance policies in the construction sector.

2. Materials and Methods

2.1. Data Sources

The study focused on 30 provinces (excluding the Tibet Autonomous Region, Taiwan Province, and the Hong Kong/Macao Special Administrative Regions) in China, and the research period was from 2010 to 2021. This study treated provinces as spatial units to ensure data accessibility and consistency. Data on fossil fuels and electricity were sourced from the China Energy Statistical Yearbook. Consumption data for building materials (including cement, glass, steel, aluminum, timber, etc.) were obtained from the China Construction Industry Statistical Yearbook. Data such as real value added in construction were derived from the China Statistical Yearbook and provincial Statistical Yearbooks. Carbon emission factors for various fossil fuels in construction were sourced from the General Principles for Comprehensive Energy Consumption Calculation (GB/T 2589-2008) [33] and the Guidelines for Compiling Provincial Greenhouse Gas Inventories. Provincial and municipal grid carbon emission factors were sourced from official datasets published by Chinese authorities, including 2010 China Regional and Provincial Grid Average CO2 Emission Factors; 2011–2015 China Regional Grid CO2 Baseline Emission Factors; 2016–2019 Emission Reduction Projects: China Regional Grid Baseline Emission Factors; 2020 China Regional Grid CO2 Emission Factors; and 2021 Emission Reduction Projects: China Regional Grid Baseline Emission Factors. These documents provide average carbon emission data per unit of electricity supplied across China’s regional power grids.

2.2. Methods

2.2.1. BCEMS Quantification

(1)
Carbon accounting
Given that the primary sources of carbon emissions in China are fossil energy and electricity consumption, carbon emissions were quantified using the emission factor approach proposed by the Intergovernmental Panel on Climate Change (IPCC), using the following calculation [24,34]:
C = E × E f
where C denotes CO2 emissions, E represents activity data, and E f is the emission factor corresponding to unit activity data.
(2)
Components of BCEMS
BCEMS mainly comprise three sub-items corresponding to two stages: (1) carbon emissions from building materials, (2) emissions from fossil fuel consumption (primary energy), and (3) emissions from electricity consumption (secondary energy). These align with the building material production stage and building construction stage. The calculation formula of BCEMS is as follows:
C = C M + C F + C E
where C represents BCEMS, CM, CF, and CE denote emissions from building materials, fossil fuel consumption, and electricity consumption, respectively.
(3)
Carbon emissions from building materials
Building materials include steel, non-ferrous metals, glass, and timber. According to studies, building materials exhibit certain recyclability [35]. The recycling coefficients and emission factors of building materials are detailed in Table 1. The calculation formula for carbon emissions from building materials is as follows:
C M = k = 1 5 C K = i = 1 5 V k × Q k × 1 α k
where K denotes the type of material (i = 1, 2, …, 5); Ck denotes the carbon emissions of the k-th material; Vk denotes the emission coefficient of the k-th material; Qk denotes the consumption of the k-th material; and αk denotes the recycling coefficient of the k-th material.
(4)
Carbon emissions from fossil fuel consumption
The emissions from fossil fuels were calculated according to the IPCC-recommended method. Fossil fuel data were determined according to the actual terminal consumption in the construction, using the following calculation formula:
C F = i = 1 n ( C O 2 ) = i = 1 n E i × N C V i × C E F i
C E F i = C C i × C O F i × 44 / 12 × 10 3
where i denotes the type of fossil fuel (i = 1, 2, …, 11); Ei refers to the terminal consumption volume of the i-th type fossil fuel; NCVi denotes the average net calorific value corresponding to fossil fuels; CEFi stands for the emission factor for the 13 types of fossil fuels; CCi indicates the carbon content of fossil fuels; and COFi is the carbon oxidation factor of fossil fuels, where the values 44 and 12 correspond to the molecular weights of carbon dioxide and carbon, respectively.
(5)
Carbon emissions from electricity consumption
The emissions from electricity consumption were calculated by considering the actual conditions of power transmission and distribution in each province of China and the provincial electricity emission factors. The calculation formula is as follows:
C E = j = 1 30 C E j = j = 1 30 E j × C E j
where j represents different provinces (j = 1, …, 30); Ej is the terminal electricity consumption of the construction industry in the j-th province; and EFj is the carbon emission factor of the provincial power grid corresponding to the j-th province.

2.2.2. Spatial Correlation Analysis

Both global and local autocorrelation models were introduced for exploration to clarify the spatial relationships and disparities of the BCEMS in China. Global autocorrelation primarily reflects whether spatial clustering or outliers exist, measuring the overall pattern of provincial carbon emissions (clustered, dispersed, or random). The statistical indicator, global Moran’s I (I), is expressed as [23]:
I = n i = 1 n j = 1 n W i j ( X i X ¯ ) ( X j X ¯ ) i = 1 n j = 1 n W i j i = 1 n ( X i X ¯ ) 2
where n represents the total number of spatial samples in the study area; Xi and Xj correspond to the attribute values of different spatial units; and Wij is the spatial weight coefficient matrix reflecting the adjacency relationship between spatial units. The value range of global Moran’s I is [−1, 1]. A positive value, zero, or a negative value indicates as spatial positive correlation, a random distribution, or a spatial negative correlation of carbon emissions, respectively.
Local spatial autocorrelation measures the spatial association and degree of disparity in building carbon emissions between a specific Chinese province and its surrounding provinces at a local scale. The statistical indicator, local Moran’s I, is expressed as:
I = Z i j = 1 n W i j Z j
where Zi and Zj are the standardized carbon emissions of provinces i and j, respectively. Study units can be classified into four types of spatial correlation, specifically including high-high (H-H), low-low (L-L), high-low (H-L), and low-high (L-H) patterns.

2.2.3. Geographical Detector

The geographic detector is an analytical model designed to pinpoint the spatial differentiation characteristics of geographic phenomena and examine their associations with potential impact factors [38]. During the process of detecting the spatial differentiation of the dependent variable y i , this model also provides a degree of reflection on the explanatory capacity of the independent variable x i with respect to y i [39]. Dominant and ineffective factors can be identified by utilizing this model to examine the relationships between BCEMS and potential influencing factors, thereby avoiding potential issues of multicollinearity [40]. The calculation formula is as follows:
q = 1 1 N σ 2 i = 1 h N i σ i 2
where q stands for the contribution degree of a driving factor to the spatial heterogeneity of BCEMS; i = 1, …, h denotes the quantity of grid points; N i and N represent the number of grid points in the h-th layer and in the entire study area, respectively; σ i 2 and σ 2 refer to their corresponding variances; and the value range of q is [0, 1]. When h is derived from the independent variable x i , a larger q-value, indicates that x i has a stronger explanatory capacity for y i , whereas a smaller q-value implies that the explanatory capacity of x i for y i is weaker [41].
Referring to the relevant research results [24,26,27] and considering the multi-factor influence characteristics of carbon emissions in the construction industry, the data availability, and the typicality, scientificity, and relevance of factors, 13 influencing factors were selected for this research (Table 2).

2.2.4. Geographically and Temporally Weighted Regression Model

GTWR is a representative spatial regression model, that can integrate dependent variables and explanatory variables at the local scale to calculate the regression coefficient of each explanatory variable for every sample point [42]. Beyond considering spatial heterogeneity, the GTWR model further incorporates a temporal dimension, thereby efficiently resolving issues related to spatio-temporal non-stationarity. Its specific formula is presented below [43,44]:
y t i = β 0 ( u i , v i , t i ) + j = 1 n β j ( u i , v i , t i ) X t i j + ε t i
β ^ u i , v i , t i = [ X t W u i , v i , t i X ] 1 X T W u i , v i , t i Y
where y t i is the explained variable, n is the number of cities, X t i j represents the explanatory variable, β 0 is the regression constant, β j denotes the regression parameter, ε t i represents the residual error, and W u i , v i , t i = diag a i 1 , a i 2 , , a i n , where a i j are space-time distance functions of u i , v i , t i corresponding to the weights when adjusting the weighted regression adjacent to province i .

3. Results

3.1. Spatial and Temporal Variations in BCEMS Accounting in China

3.1.1. Temporal Variation in BCEMS Accounting

The total BCEMS in China from 2010 to 2021 are shown in Table 3 and Supplementary Material Table S1. According to Table 3, the BCEMS fluctuated and increased from 1135.90 million tons to 2197.67 million tons, with an average annual growth rate of approximately 6.18%. During 2010–2012, the BCEMS grew rapidly, reaching a peak of 2976.91 million tons in 2012. From 2013 to 2015, emissions first increased and then decreased, dropping to 1861.50 million in 2015. From 2016 to 2021, the BCEMS fluctuated between 1925.24 and 2236.14 million tons, showing an overall stable trend. In terms of the components of emissions, the multi-year average proportions of emissions from building materials, fossil fuels, and electricity were 92.62%, 4.02%, and 3.36%, respectively, which indicates that building materials were the core emission components. The emissions of cement and steel contributed most significantly to building material emissions, with multi-year average carbon emissions accounting for 85% and 16%, respectively. Therefore, the consumption volume of building materials is critical for emission reduction.
The proportion of BCEMS in the nationwide carbon emissions of all industries [45] from 2010 to 2021 is shown in Figure 1. According to Figure 1, the proportion of BCEMS rose from 15.66% to 30.19% during 2010–2012, significantly decreased to 19.05% during 2013–2015, and fluctuated between 21.43% and 18.53% during 2016–2021. Overall, the BCEMS first increased and then fluctuated downward, with a notable decline during 2013–2015, indicating that the construction industry achieved certain effects in energy conservation and emission reduction.

3.1.2. Spatial Variation in BCEMS Accounting

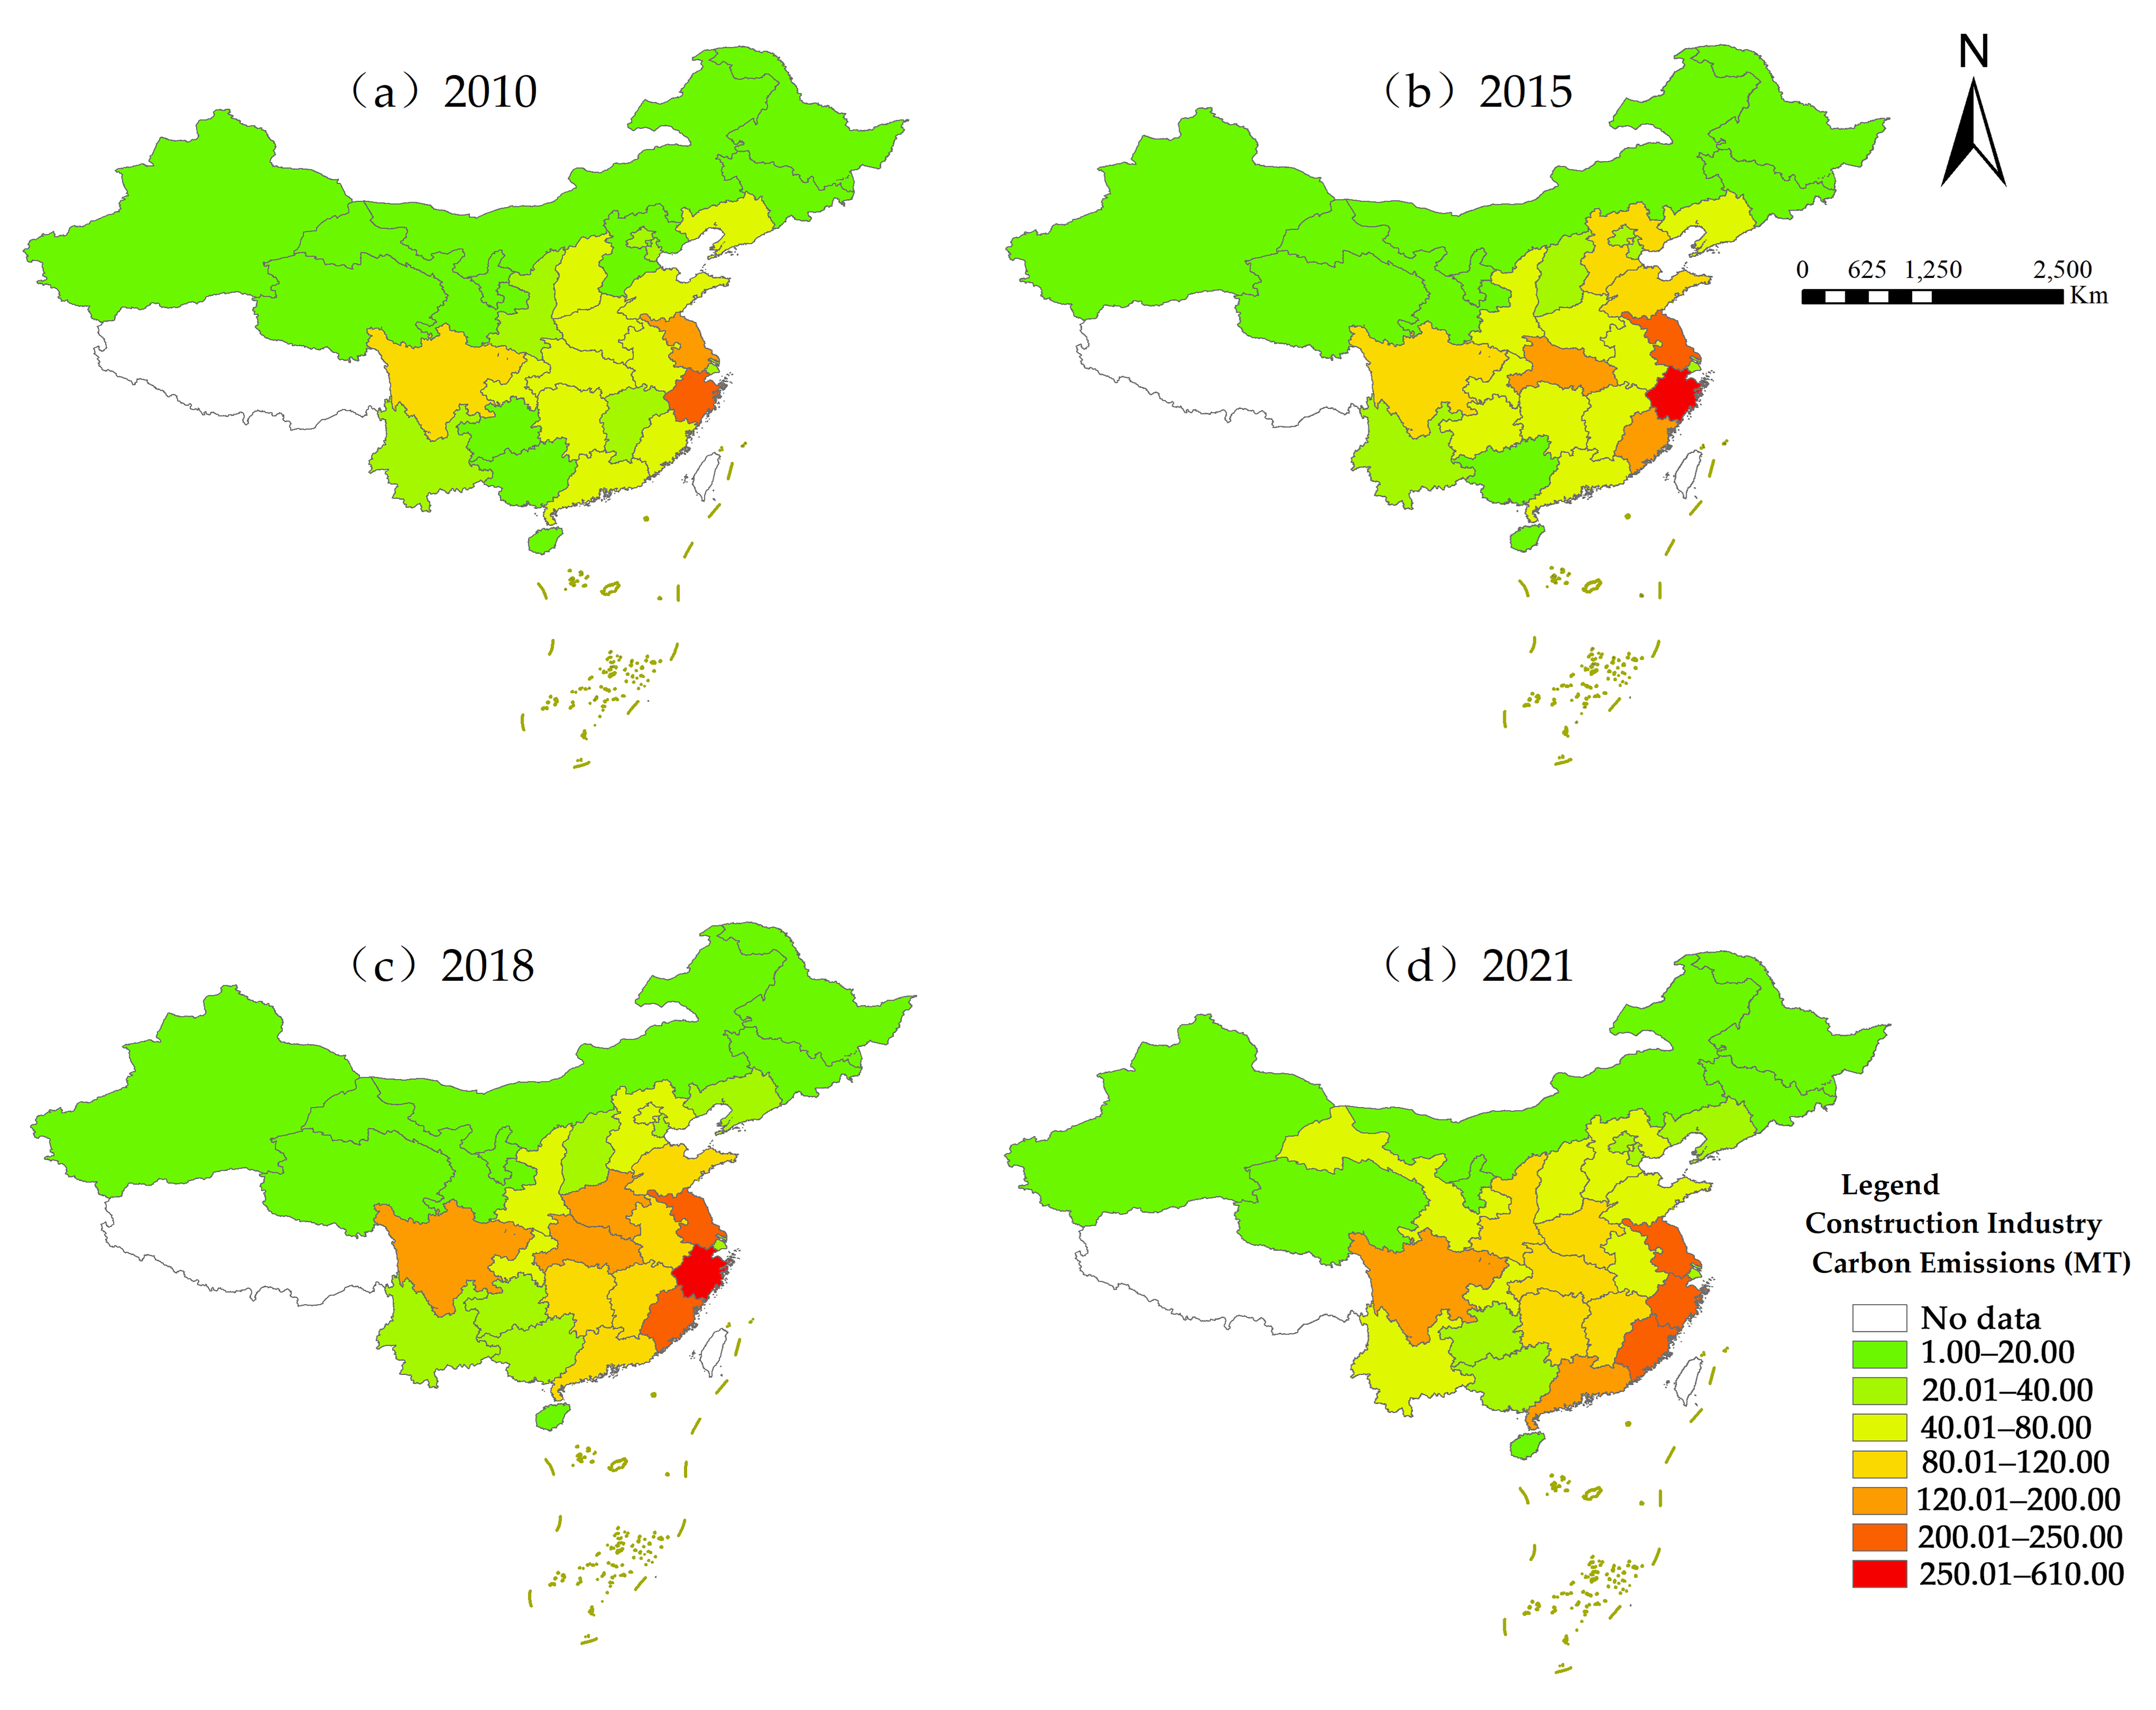
The BCEMS in China showed an overall fluctuating downward trend, with a multi-year average of 2152.67 million tons, presenting an “east high–west low” spatial pattern (Figure 2). During the study period, high-value zones of BCEMS were mainly distributed in eastern China (Zhejiang, Jiangsu, and Fujian). Among them, Zhejiang Province had the highest average value of BCEMS, reaching 270.97 million tons, exceeding the national mean by 3.88 times. Jiangsu and Sichuan followed, at 3.67 and 2.15 times the national average, respectively. Low-value zones were concentrated in western China (Xinjiang, Qinghai, Inner Mongolia, etc.), and Qinghai had the lowest emissions with only a 0.56% proportion of the national average.
High-value zones of BCEMS require special attention, with their spatial evolution roughly divided into expansion and contraction phases. The period of 2010–2018 was an expansion phase, where high-value zones expanded from two provinces (Zhejiang and Jiangsu) in 2010 to six provinces (Fujian, Sichuan, Hebei, and Henan) in 2018. Then, 2018–2021 was a contraction phase, where high-value zones shrank to five provinces (Zhejiang, Jiangsu, Fujian, Guangdong, and Sichuan) in 2021.
Low-value BCEMS zones have evolved from “areal concentration to fragmented dispersal,” manifesting a contracting spatial pattern after 2018. The year 2018 marked a pivotal turning point in the spatial redistribution of carbon emissions, characterized by a contraction in high-emission zones alongside a significant expansion of moderate-emission areas.

3.2. Spatial Correlation Analysis of BCEMS in China

3.2.1. Global Spatial Autocorrelation

The global Moran’s I index of the BCEMS in China from 2010 to 2021 is shown in Table 4. In Table 4, the BCEMS show a significant positive spatial correlation between the spatial distributions in 2010 and 2015–2021 (p < 0.05).

3.2.2. Local Spatial Autocorrelation

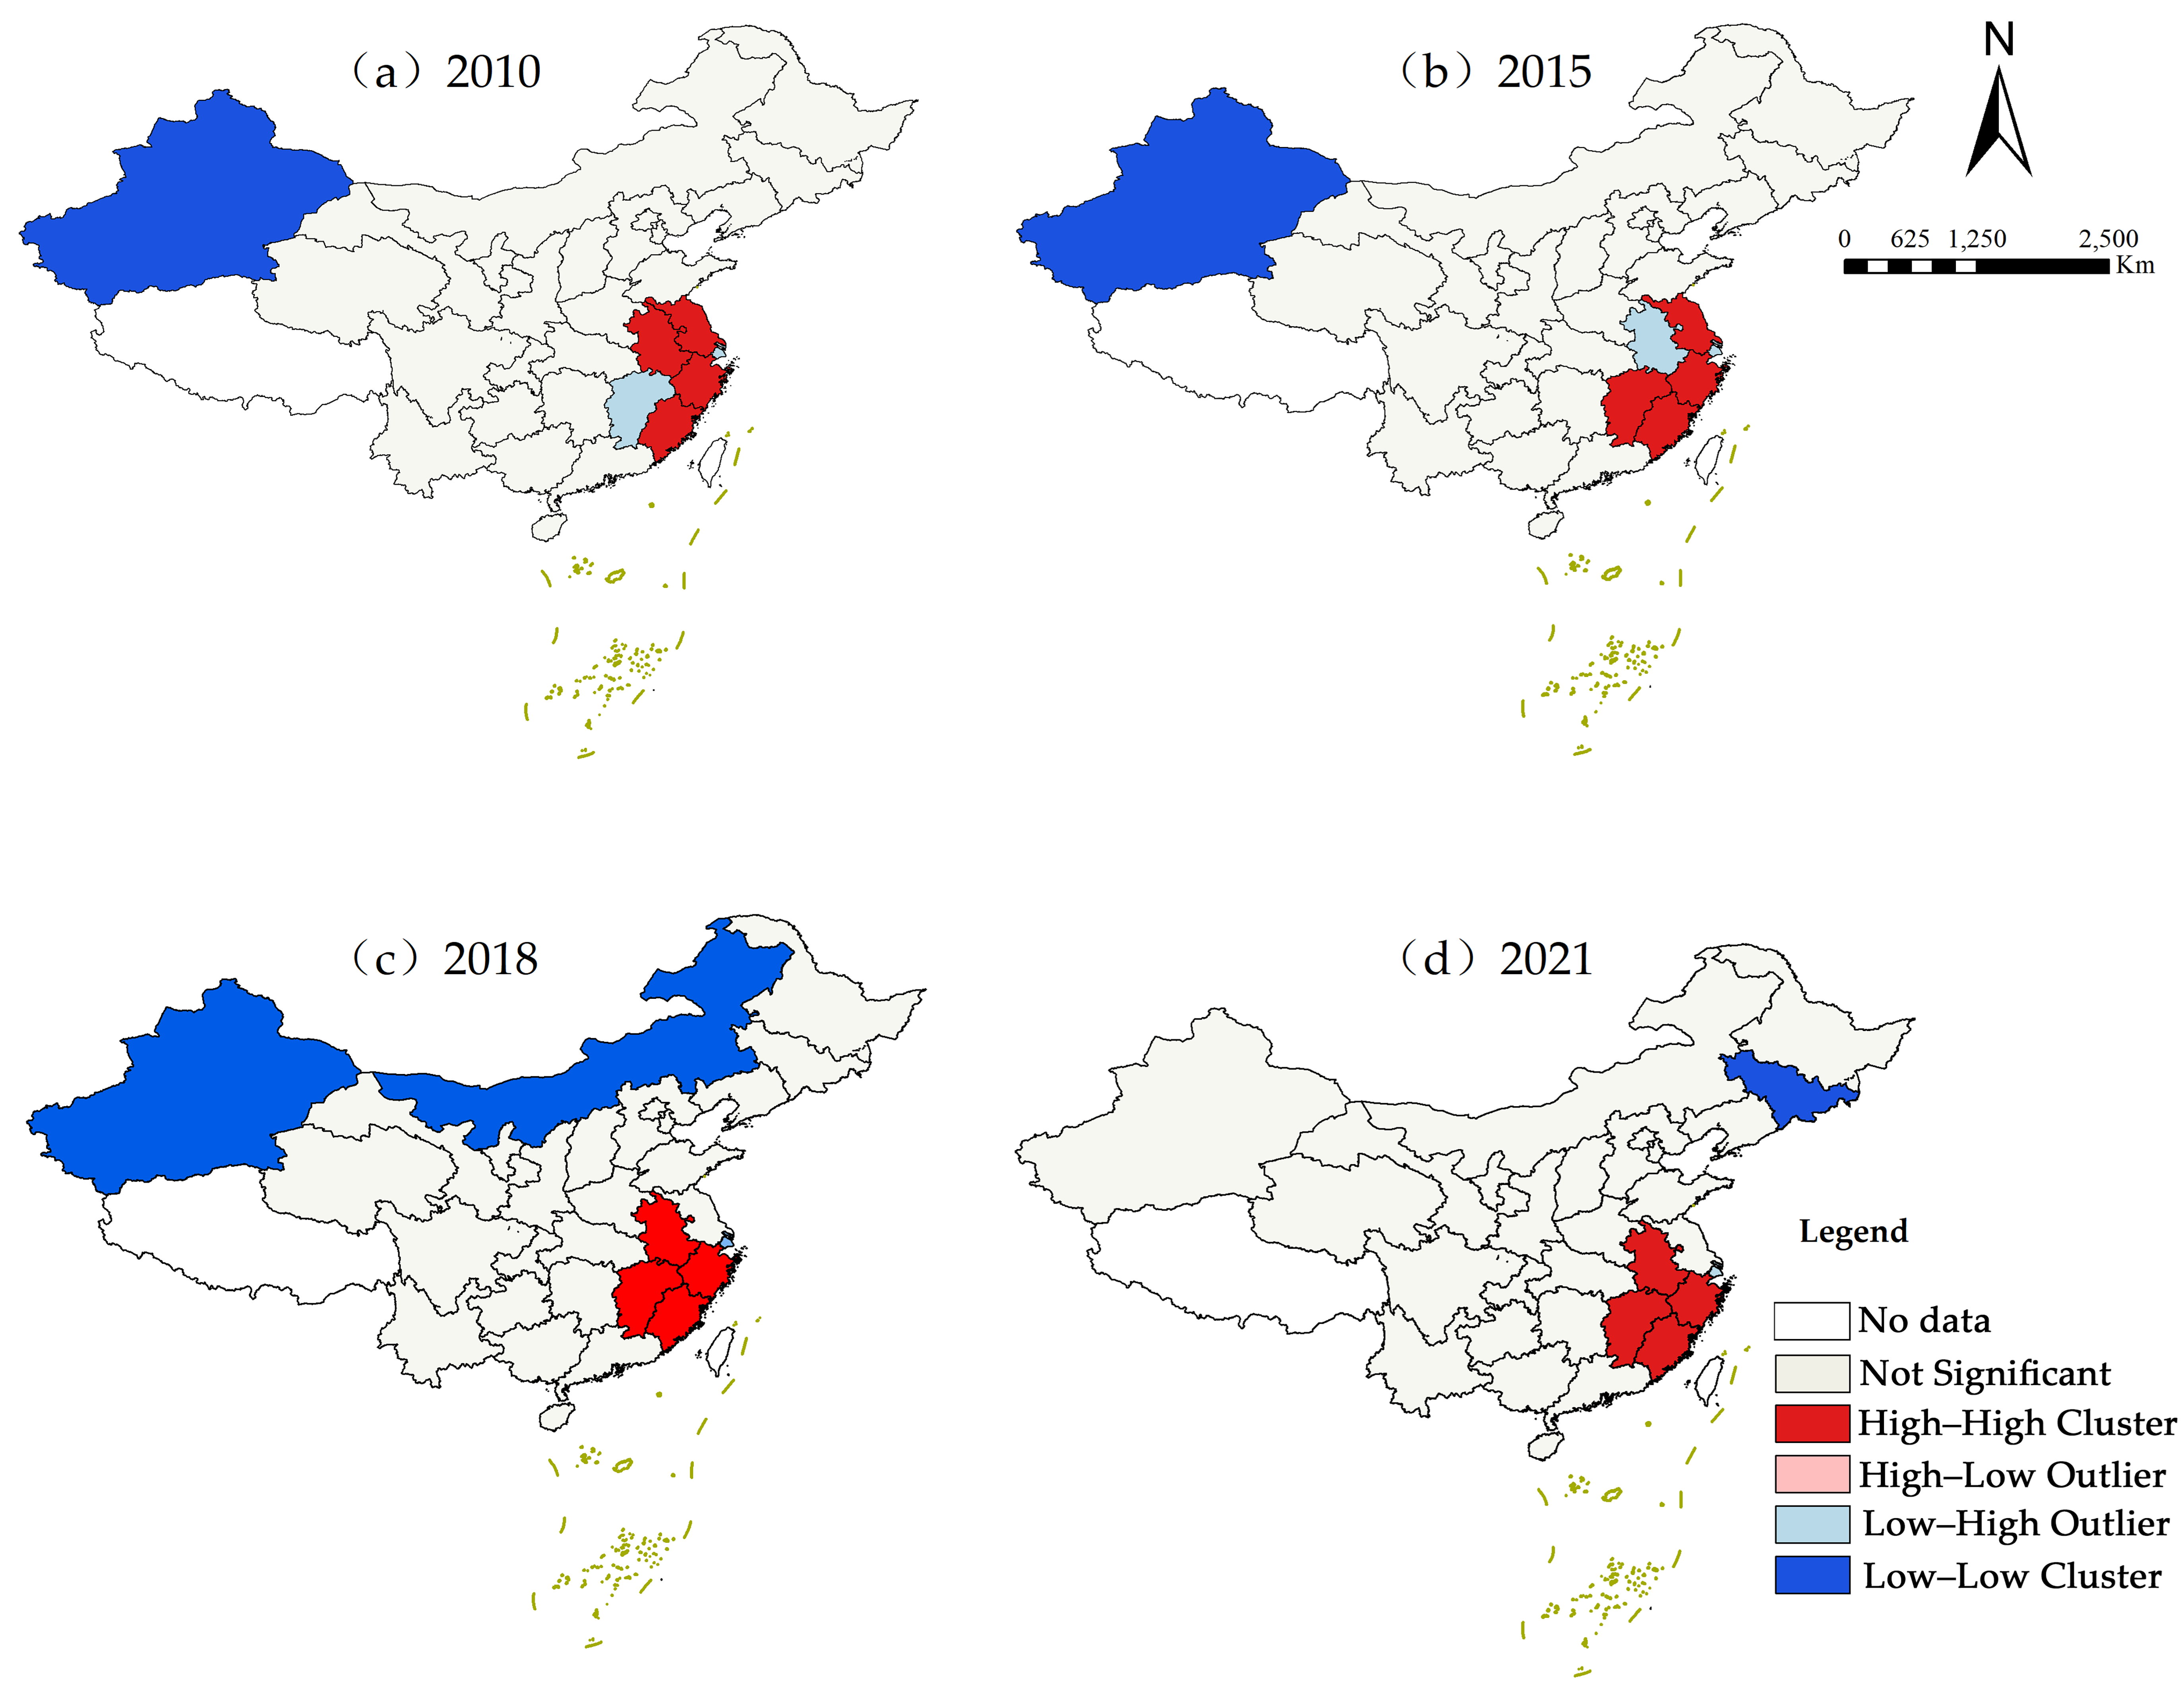
The local spatial autocorrelation of BCEMS in 2010 and 2015–2021 was investigated. LISA cluster maps for the representative years of 2010, 2015, 2018, and 2021 are shown in Figure 3. In Figure 3, Zhejiang and Fujian consistently remained in the high-high (H-H) clustering throughout the study period. Notably, Jiangxi and Anhui stably joined this cluster starting from 2017. Conversely, Xinjiang and Inner Mongolia frequently appeared in the low-low (L-L) cluster. Shanghai consistently belonged to the low-high (L-H) cluster, which is related to Shanghai’s emphasis on energy-efficiency technology applications, industrial upgrading, and the transfer of industries to neighboring provinces (e.g., Jiangsu and Anhui) [46].

3.3. Identification of Influencing Factors

3.3.1. Impact Factor Detection

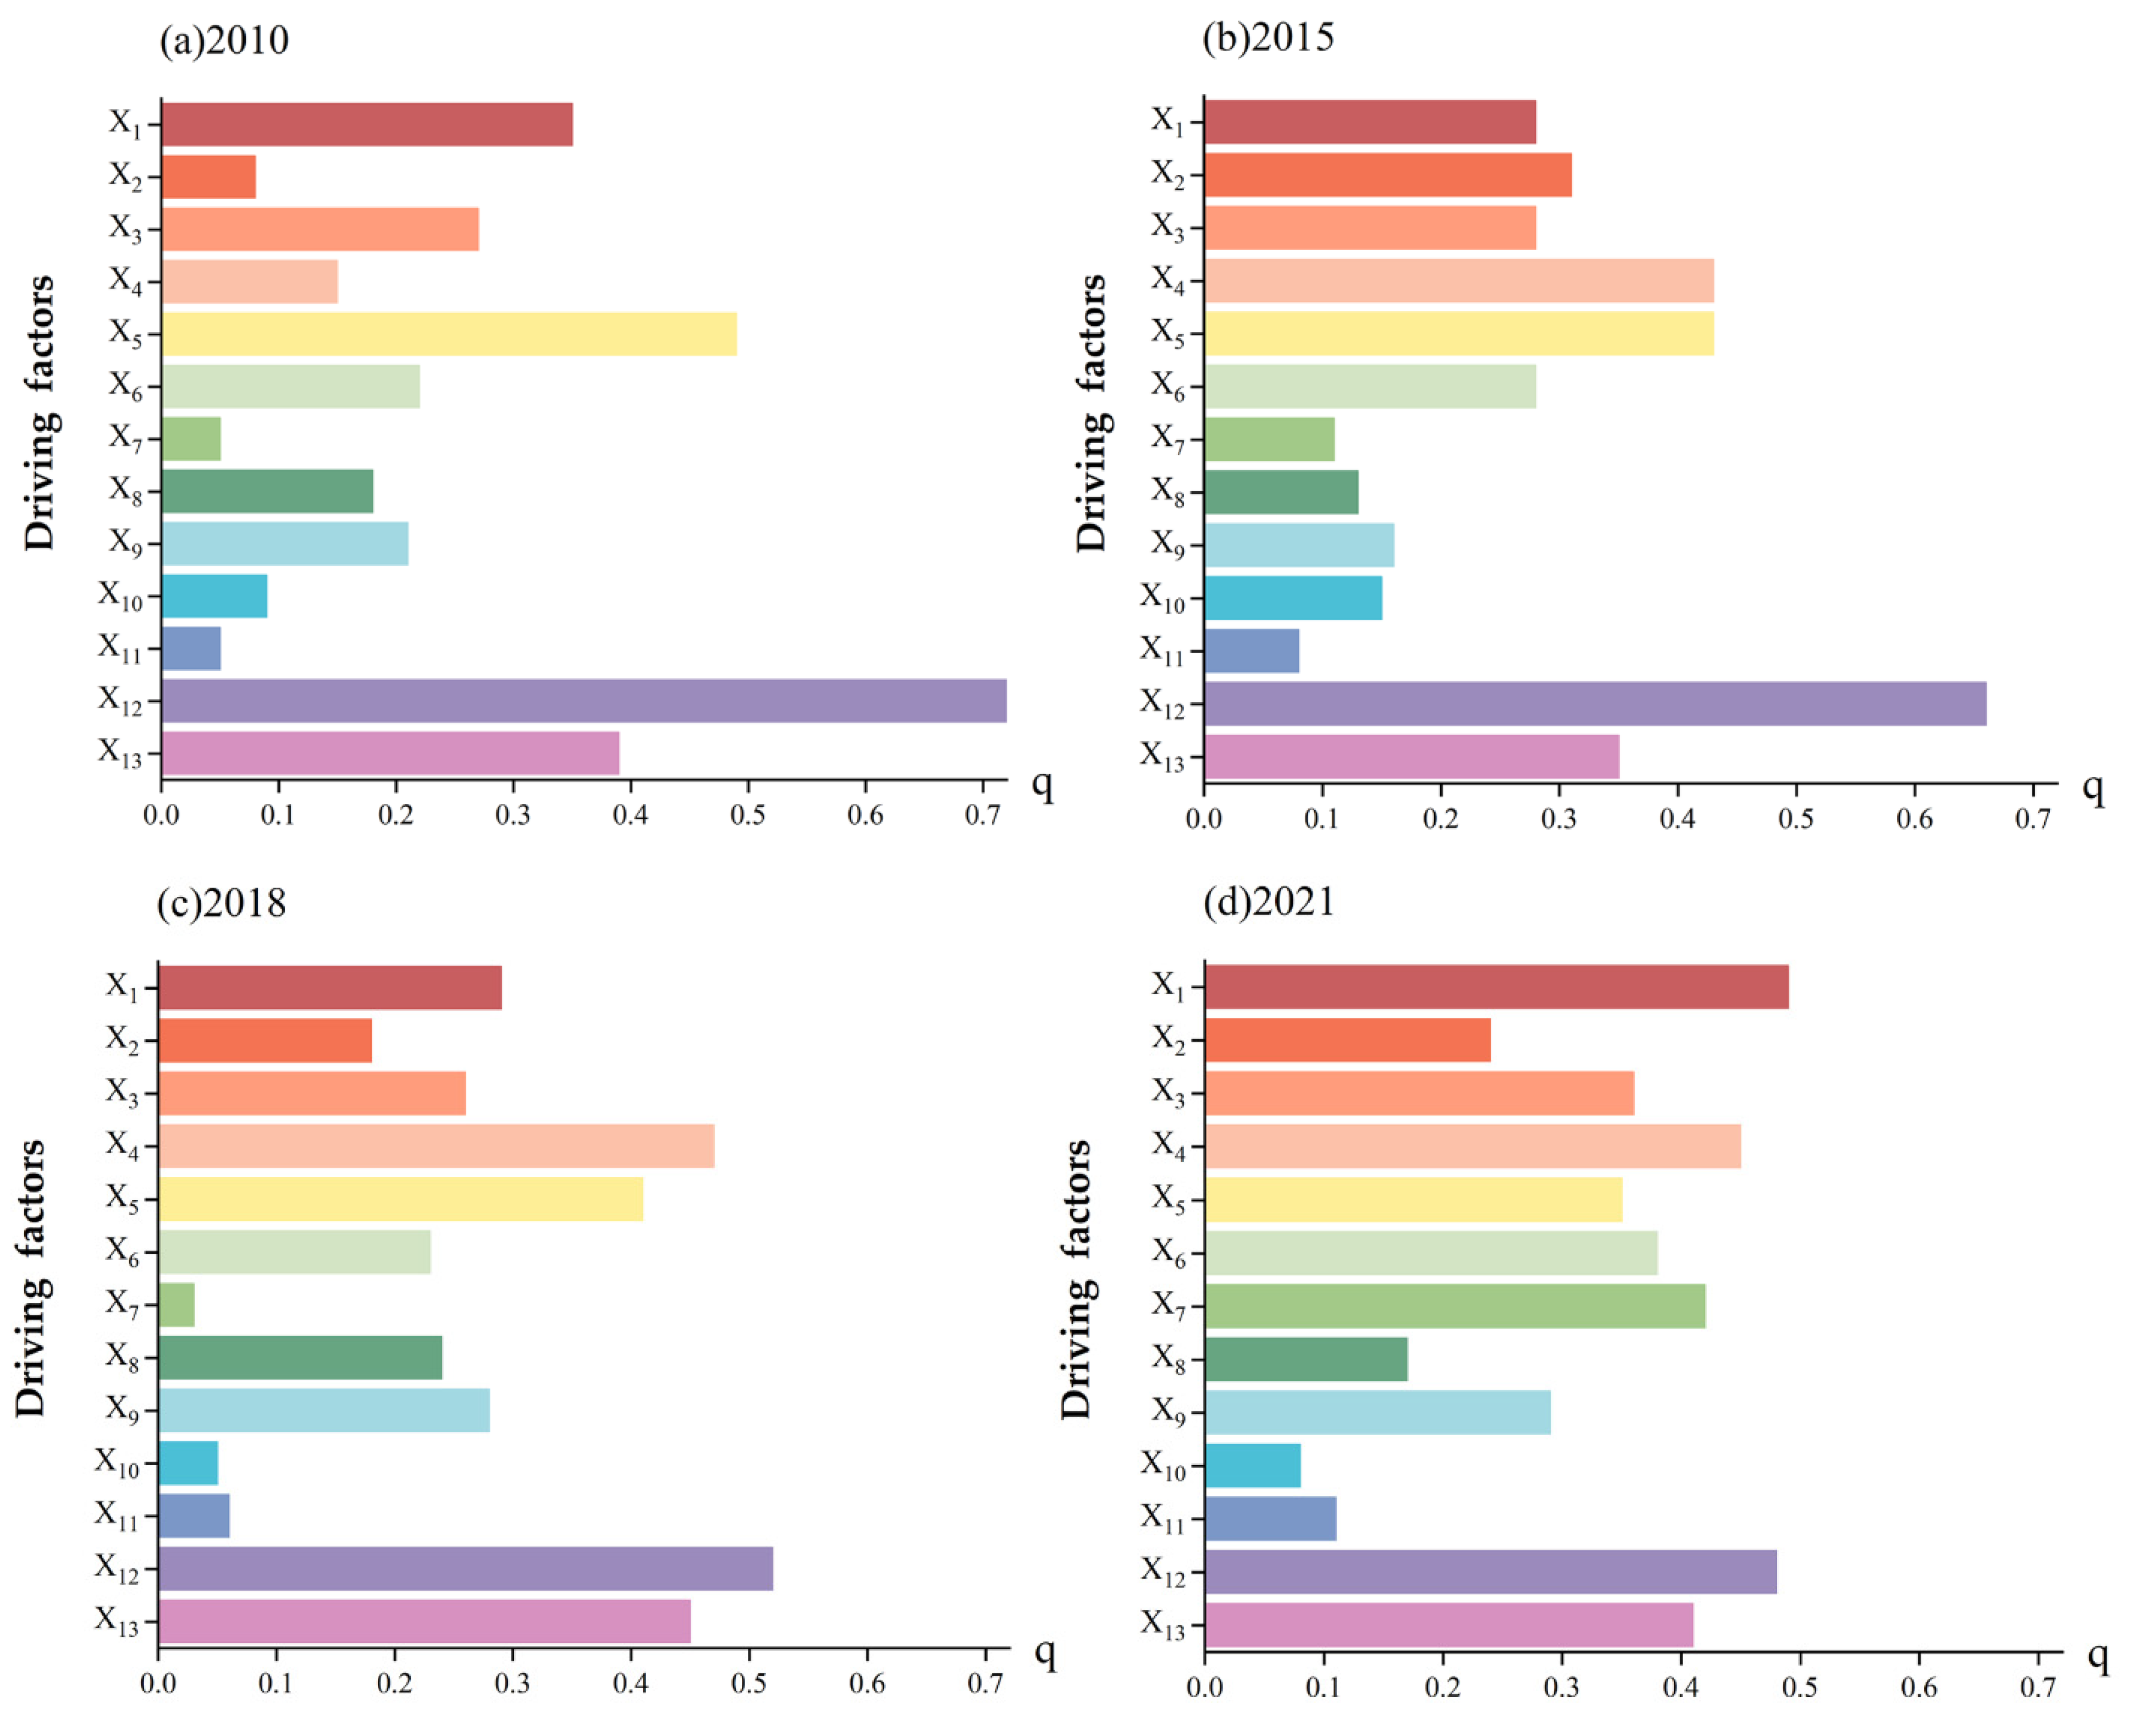
The relative contributions of influencing factors to the spatial differentiation of BCEMS are shown in Figure 4. During the study period, eight factors (fixed assets, population density, debt amount of construction enterprises, total population, economic development level, disposable income of urban residents, urbanization level, and power equipment ratio) were the dominant influencing factors for the spatial evolution of the BCEMS in China. The factors with a relatively high explanatory contribution (with a mean value of q of > 0.20) to the spatial differentiation of the BCEMS in China were ordered as follows: fixed assets (0.60) > population density (0.42) > debt amount of construction enterprises (0.40) > total population (0.38) > economic development level (0.35) > disposable income of urban residents (0.29) > urbanization level (0.28) > power equipment ratio (0.24). The explanatory contributions of socioeconomic and enterprise factors were higher than those of technical and energy factors. Furthermore, the q-value of the industrialization level was 0.28 in 2015, but only 0.08 and 0.18 in 2010 and 2018, respectively. The explanatory power of industrialization levels demonstrated strong statistical significance in specific years but exhibited temporal constraints. Its diminishing impact on BCEMS is attributable to synergistic effects from energy-efficient technology adoption, green building proliferation, and economic restructuring [47].

3.3.2. Interaction Detection

Significant interaction effects (p < 0.05) are evidenced in Figure 5. The q-values for bivariate interactions consistently exceeded those of single-factor effects from 2010 to 2020, confirming that dual-factor combinations exhibited stronger explanatory power and more significant impacts on spatial carbon emission patterns than individual factors. Furthermore, nonlinear synergistic interactions demonstrated greater prominence than simple additive effects. In 2010, bivariate enhancement interactions constituted 70% of factor combinations, with nonlinear synergistic effects accounting for 30%. By 2020, nonlinear synergies rose significantly to 54%, indicating increasingly complex and diversified interaction mechanisms among influencing factors. Specifically, the strongest interaction in 2010 was fixed assets ∩ disposable income of urban residents, with a q-value as high as 0.97. In 2015, the strongest interactions were total population ∩ technical equipment ratio and labor productivity ∩ disposable income of urban residents, both with q-values of 0.94. In 2018 and 2021, the strongest interactions were total population ∩ disposable income of urban residents and urban development level ∩ debt amount of construction enterprises, with q-values of 0.88 and 0.93, respectively. Analysis demonstrates that socioeconomic and enterprise-level factors dominated interaction mechanisms among BCEMS drivers from 2010 to 2021, with fixed-asset investment and urban disposable income exhibiting paramount influence, followed sequentially by economic development level, total population, and construction enterprise debt volumes.

3.4. Analysis of Spatial Heterogeneity of Influencing Factors

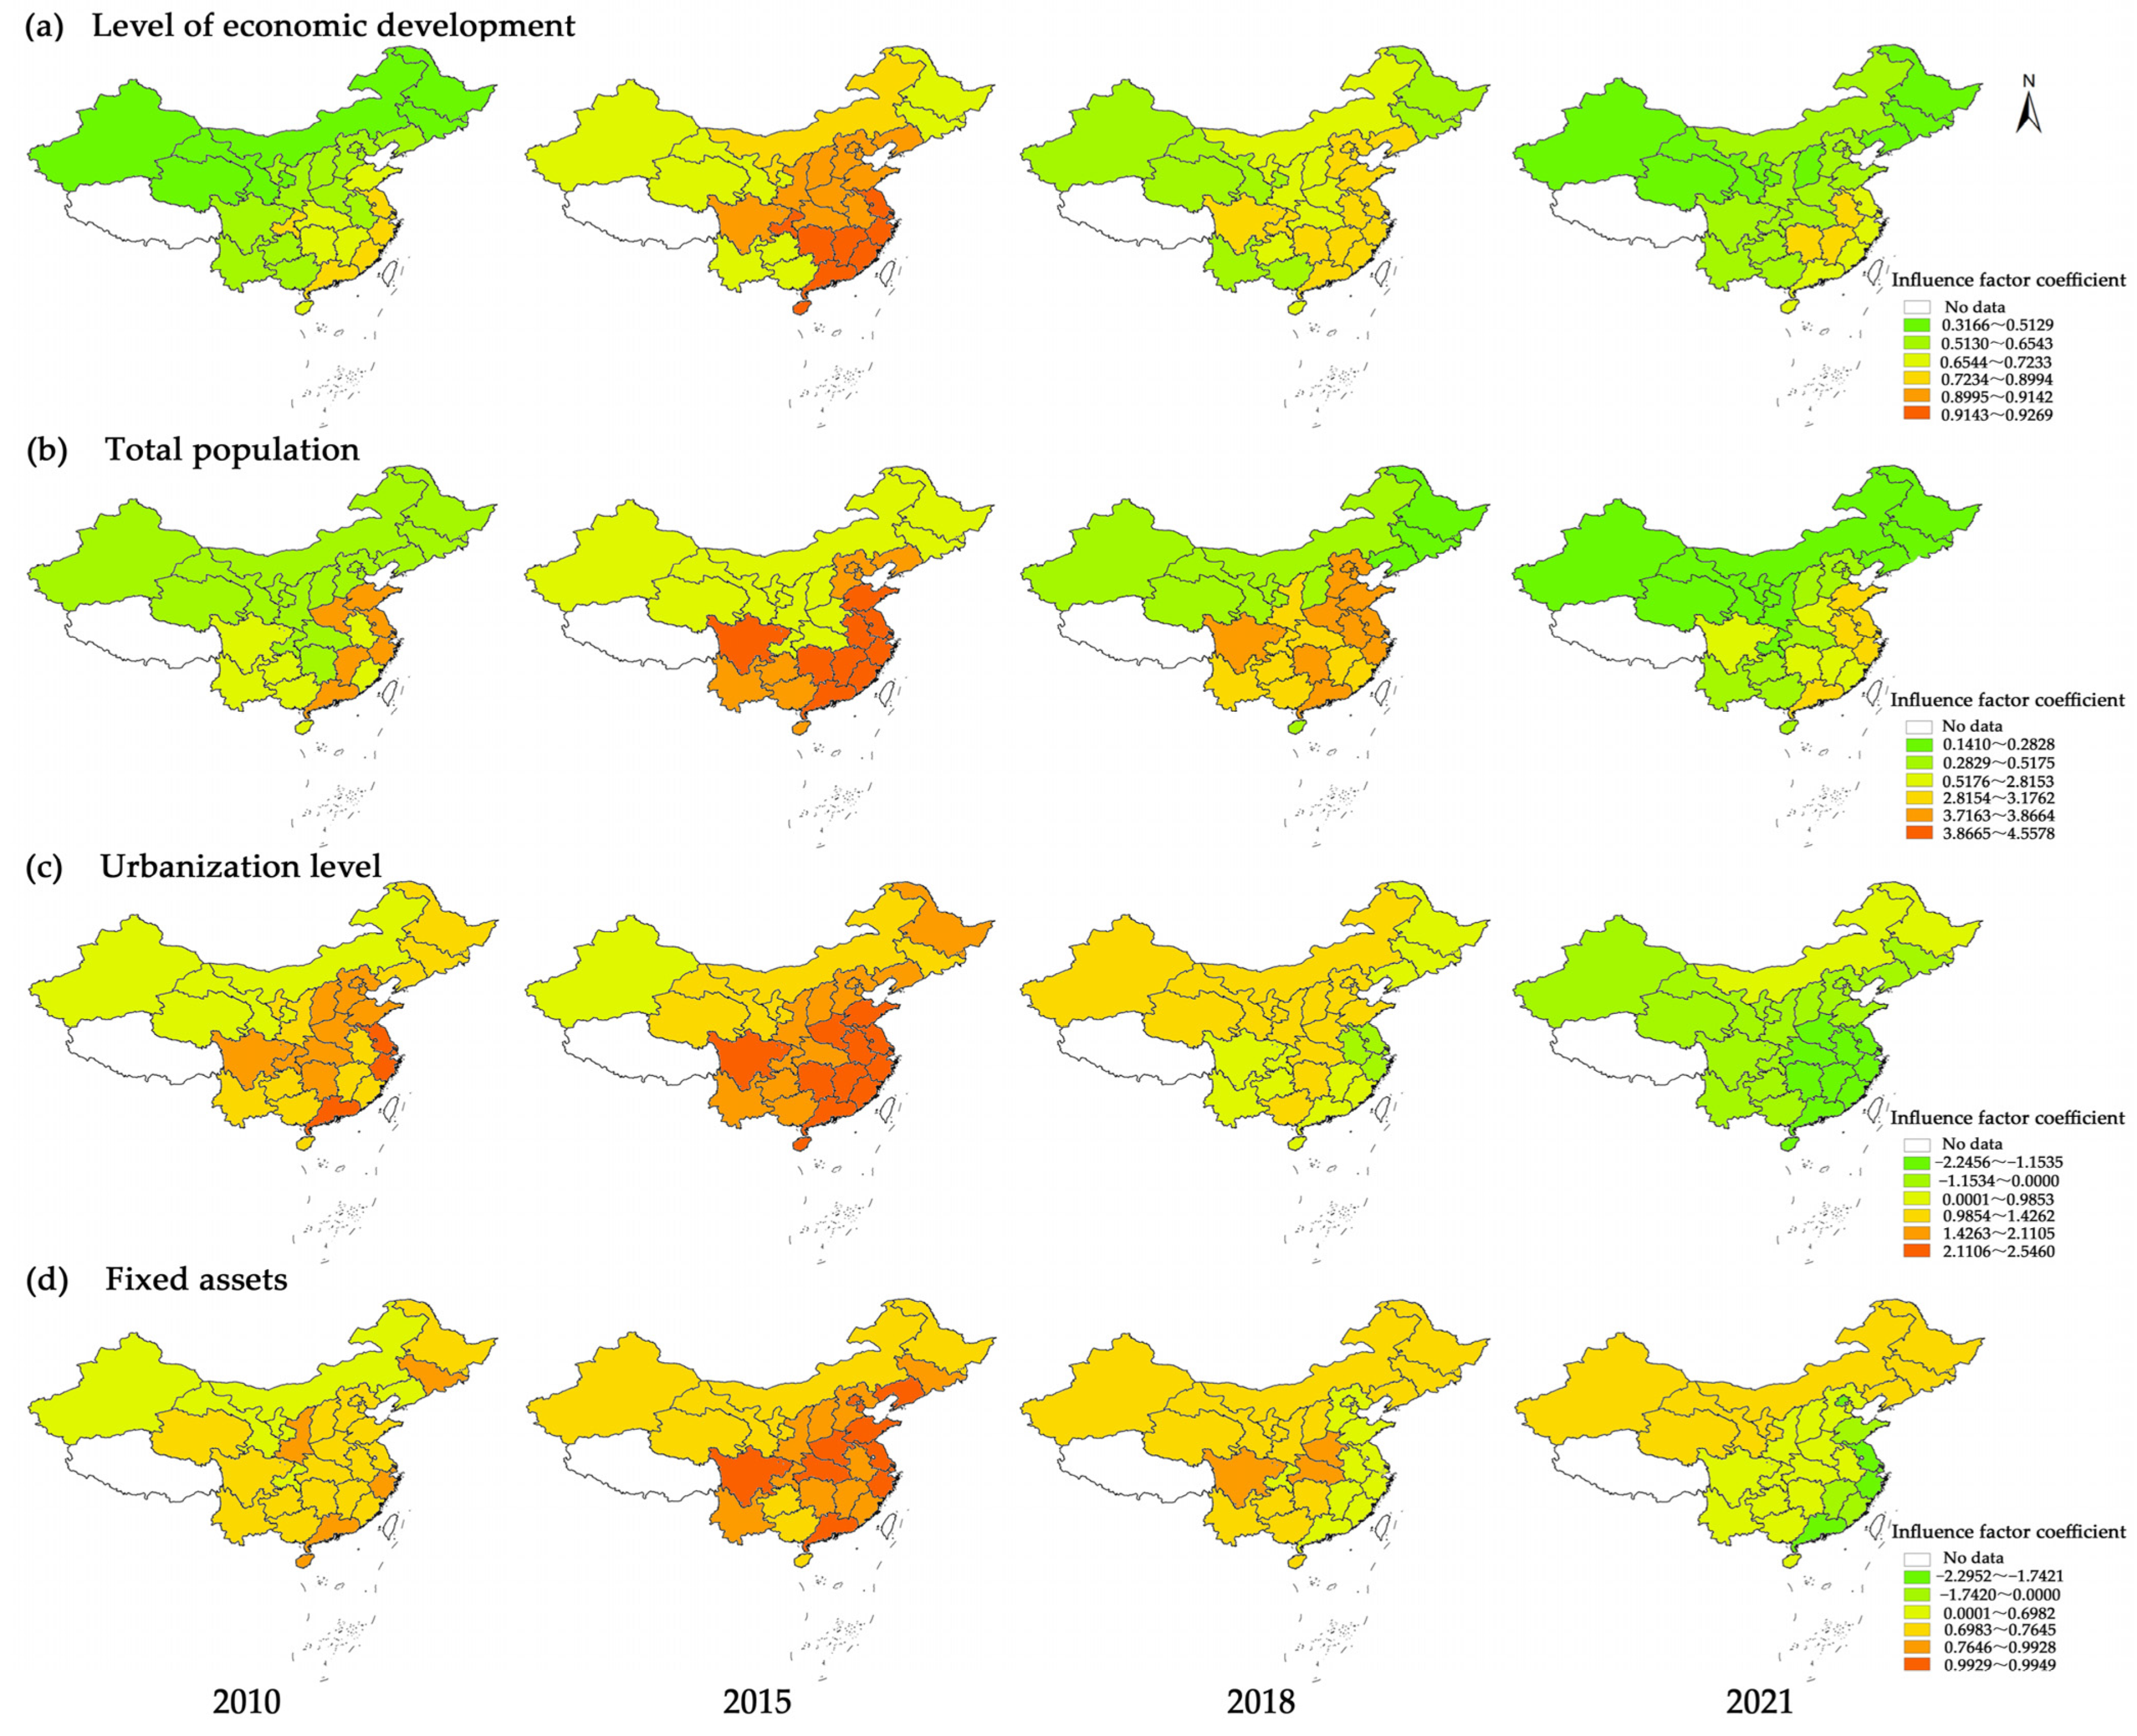
Based on the dominant factors explored above, and integrating the results of the GEODA spatial autocorrelation (Supplementary Material: Table S2) and the OLS analysis (Supplementary Material: Table S3) [24,30], four key indicators (economic development level, total population, urbanization level, and fixed assets) were selected as explanatory variables for the GTWR model to investigate the spatial heterogeneity of influencing factors for the BCEMS in China. The results are shown in Figure 6.
(1) The impact coefficients of economic development level were all positive from 2010 to 2021 (Figure 6a), indicating that economic development has a positive impact on emissions, but this impact has gradually weakened over time. In the later part of the study period, the impact of the economic development level fluctuated and declined, primarily because the Chinese government proposed goals for economic transformation, upgrading, and low-carbon economic development [23] from 2011 to 2015. The policies promoted the gradual optimization of economic development patterns, thereby controlling carbon emissions in the construction industry. The spatial distribution of BCEMS generally exhibited an “east high–west low” pattern, with high-value zones concentrated in provinces such as Zhejiang and Jiangsu, and low-value zones mainly in Inner Mongolia, Xinjiang, Qinghai, etc. The results are related to the unbalanced and inadequate economic development in China.
(2) During the study period, the impact coefficients of total population were all positive (Figure 6b), indicating that population promoted the growth of BCEMS in each province. The reason was that population growth increased the demand for residential housing, drove the development of the construction industry, and raised energy consumption in building construction and operation, thereby increasing carbon emissions. The impact coefficient of total population showed a trend of first increasing and then decreasing over time, and it has decreased since 2015. This might be because local governments have been continuously intensifying their efforts to reduce emissions, guiding residents to save energy, cut emissions and improve energy utilization efficiency via enhanced publicity. Among the 30 provinces, the total populations of Guangdong, Jiangsu, Zhejiang, and Shandong Provinces had a greater impact on BCEMS, as the expanding population sizes in these provinces stimulated housing demand, leading to increased related carbon emissions. The northern regions were less affected by the total population, mainly due to their smaller populations and relatively backward economic development, which had a very small impact on BCEMS, such as Xinjiang, Qinghai, Ningxia, Inner Mongolia and other provinces.
(3) The urbanization level showed a positive correlation with BCEMS from 2010 to 2015, while the impact coefficient gradually decreased and then turned negative in the later stage (2015–2021) (Figure 6c). The absolute values of the impact coefficients were significantly higher in eastern coastal regions and lowest in western regions. During the pre-2015 phase, the rapid improvement of China’s urbanization level was accompanied by extensive infrastructure construction and housing development, which sustained progressive growth in BCEMS. The negative impact of urbanization level on BCEMS in the later study period indicates that higher urbanization can inhibit the growth of construction carbon emissions.
(4) Fixed assets mostly showed a positive correlation with BCEMS, indicating that fixed assets promoted the growth of BCEMS. During the early stage (2010–2015), eastern coastal regions were the main contributors of BCEMS due to a “high investment, high-emission” fixed asset investment model; hence, its regression coefficients were highly positive. In the mid-term (2016–2021), fixed asset investment was increasingly allocated to stock optimization (energy-saving retrofits and urban renewal) and high-quality new construction (high-standard green buildings) due to enterprise industrial upgrading, a high proportion of the service industry, strict policy implementation, and the application of green technologies. Thus, its regression coefficients were relatively low, or even negative. However, some of the central and western regions (Sichuan and Hubei) were in the critical period of urbanization and industrialization and had a strong demand for new construction investment, so its regression coefficients were significantly positive. Incremental fixed asset investment was insignificant in most of the western and northeastern regions, and its impact coefficients showed little variation.

4. Discussion

4.1. Overall Characteristics of BCEMS in China

The BCEMS in China can be generally divided into three periods: a rapid growth period from 2010 to 2012 (with an average annual growth rate of 61.89%), a fluctuation period from 2013 to 2015 (with a negative growth rate of −15.42%), and a stable period from 2016 to 2021 (with an average annual growth rate of 2.68%). (1) The first period was the rapid development stage of the construction industry, which was related to China’s “ CNY 4 trillion” economic stimulus plan, the hard indicators for affordable housing construction, the large-scale expansion of high-speed rail networks, and other policies. Moreover, during this period, China’s urbanization process entered a rapid development stage, and many rural populations were flocking to cities, leading to a sharp increase in demand for various buildings, such as urban housing and commercial facilities. In 2012, the total output value of the construction industry reached CNY 1.37 trillion, 1.43 times higher than that of 2010 [24]. (2) The second period was the transformation and upgrading stage of the construction industry, which was mainly related to relevant policies in China. These policies included restrictions and elimination of high-emission building material production in response to serious environmental problems (especially air pollution), energy conservation and emission reduction policies from 2011 to 2015, raising building energy efficiency standards, and promoting green buildings. Meanwhile, the cyclical adjustment of the macroeconomy and the real estate market were also important factors leading to the overall decline of BCEMS. (3) The third period was the low-carbon development stage of the construction industry. From 2016 to 2021, the BCEMS growth stagnated, remaining in a high-platform stable phase before reaching the carbon peak. In this period, the government attached great importance to energy conservation and emission reduction in the construction industry, improving energy efficiency, and promoting the rapid development of green buildings. National statistics indicate that energy-efficient buildings comprised over 63% of the floor area of urban civil buildings in China in 2020, while the penetration rate of prefabricated construction reached 31% in 2023 [48]. Furthermore, China’s construction industry structure has been continuously optimized, with increasing industrial concentration and the enhanced influence of leading enterprises. By 2021, China had registered 16,000 construction enterprises with special-grade or grade-one qualifications, a 64.96% increase since 2016. The evolutionary trajectory of BCEMS, transitioning from scale expansion to structural optimization, and ultimately, low-carbon transition, is fundamentally interlinked with the sustained advancement of national urban–rural development policies.
In terms of the components of BCEMS, the emissions of building material consumption accounted for as high as 95.34%. of the total emissions. The research findings were consistent with the 2022 report by the China Association for Building Energy Efficiency, which stated that emissions from steel and cement production account for over 95% of emissions from China’s building material production [49]. This result was related to the “high-energy consumption and high-emission” attributes of building material production [50].
In summary, policy regulation, technological innovation, and industrial structure optimization have significant regulatory effects on the BCEMS in China [18,51].

4.2. Spatial Characteristics of BCEMS in China

The BCEMS in China exhibited significant spatial heterogeneity due to the imbalance in regional climatic conditions, resource endowments, society, and the economy.
The eastern regions stably presented a high–high cluster centered on Zhejiang and Fujian, which aligned with the findings of Zheng et al. [1] and Ou et al. [28] regarding the spatial concentration of high building carbon emissions in China. The regions feature high economic development levels, dense populations, and urbanization rates exceeding 70%, serving as the core hub for construction industry development and an important gateway for manufacturing, energy, and commodity flows [1]. Additionally, the building material production capacity is concentrated in the eastern region, with Jiangsu and Zhejiang being major provinces for cement and steel production. In 2021, the cement and steel outputs of these two provinces accounted for 15.04% and 20.15% of the national total, respectively.
The central regions, serving as a bridge between the east and west, are a key transit hub for energy, raw materials, and energy-intensive products. They have undertaken numerous infrastructure construction and industrial projects, driving the development of the construction industry and leading to higher carbon emissions. Statistical analysis revealed that the construction industry output value of the central region in 2021 reached 1.67 times its 2012 level, representing a significantly higher growth rate than other regions.
The western and northeastern regions mainly form a low–low cluster centered on Xinjiang, reflecting differences in regional economic development and resource endowments. This spatial distribution is consistent with the findings of Ou et al. [28] regarding low-value agglomerations of building carbon emissions in China. The result could be related to the relatively lagging economic development, low urbanization level, and population density in these regions. In addition, the terrain of these areas is mainly composed of mountains and basins, which also pose significant constraints on their development.

4.3. Influencing Factors of BCEMS

In terms of economic factors, according to the “siphon effect” principle, regions with a high economic development level can promote industrial agglomeration locally and drive the accelerated development of related industries such as construction. As one of the highly energy-consuming industries, the construction industry makes a significant contribution to carbon emissions. Therefore, the economic development level is closely related to carbon emissions in the construction industry [52]. Li et al. [53] and Liu et al. [54] identified the GDP as the most critical driving factor for carbon emissions in the construction industry, which is consistent with the results of this study.
In terms of social factors, population growth within a certain range can generate agglomeration and scale effects, while an excessively large total population leads to increased energy consumption and higher carbon emissions [55]. Accelerated urbanization drives significant growth in construction-related carbon emissions. Empirical analysis demonstrated that in China, each 1% increase in the urbanization rate corresponds to an average 2.37% rise in building carbon emissions [56]. However, as the growth rate of urbanization slows, agglomeration effects reduce the demand for new and renovated buildings. Meanwhile, technological innovations (double improvements in production efficiency and energy utilization) can also reduce carbon emissions, inhibiting the growth of construction carbon emissions [57], which is consistent with previous research findings [58,59].
Enterprise factors had a high explanatory contribution to the BCEMS in China, with an explanatory power of over 0.50. Among them, fixed assets were a particularly significant factor influencing spatial heterogeneity, mostly showing a positive correlation. In the stage of rapid economic and urbanization development, the growth of fixed assets intensified demand for building materials and energy, leading to increased carbon emissions. In the stage of structural adjustment and slowed growth, intensified quality standards coupled with mandatory policies requiring enterprises to adopt eco-certified building materials and implement technological retrofitting have collectively curbed carbon emissions in the construction industry.

5. Conclusions and Policy Implications

5.1. Conclusions

The spatial and temporal variation in BCEMS in China from 2010 to 2021 was investigated, alongside the spatial heterogeneity exhibited by key influencing factors. The main conclusions were as follows:
(1) Temporally, the BCEMS in China exhibited a “rise–decline–fluctuation” trajectory from 2010 to 2021, segmented into three phases: rapid growth (2010–2012), oscillating transition (2013–2015), and stabilization (2016–2021). The BCEMS was high, especially the proportion of building material emissions. Cement and steel significantly contributed to the BCEMS in China. Spatially, the BCEMS in China presented a spatial pattern of “east high–west low”, and the high-value zones were related to the regional economic development level, total population, and industrial structure.
(2) Economic development level, total population, urbanization level, and fixed assets were the most significant factors influencing the spatial pattern of the BCEMS in China. Economic development level and total population showed a positive correlation with BCEMS, with the influence intensity increasing from west to east, and high-value zones being concentrated in Zhejiang and Jiangsu. Urbanization levels and fixed asset investment generally demonstrated positive correlations with BCEMS. The intensity of their influence transitioned from strongly positive to negative along the west–east gradient, with significant positive effects observed in regions such as Xinjiang and Qinghai.

5.2. Policy Implications

Based on regional resource endowments and the characteristics of BCEMS in this study, China’s construction industry needs to optimize resource allocation through differentiated paths to achieve low-carbon transformation and coordinated economic development. Firstly, regional differentiated emission reduction and carbon reduction measures need to be implemented. As the most developed and urbanized region in China, the eastern region can achieve precision carbon management by leveraging urban renewal as the primary vehicle for incorporating cutting-edge low-carbon technologies. For central regions, emissions are efficiently and centrally controlled from the perspectives of optimizing industrial and energy structures and increasing population concentration. The western region can increase precise investment in fixed assets, activate local resource endowments (such as solar and wind energy), build a low-carbon building material production technology industry chain, transform ecological advantages into low-carbon building technology output advantages, and promote eco-friendly industries. Secondly, enhancing the integration of green technology innovation with the construction industry will optimize the energy consumption structure of the building sector.
Finally, this study has certain limitations. Critical variables such as Building Information Modeling (BIM) and carbon tax policies were not incorporated due to data accessibility constraints. BIM enables precise quantification of building material usage at the spatial scale of cities and counties; it is possible to analyze the correlation between BIM and macro carbon emissions to improve the accessibility of basic data. Future research should investigate the implementation of green building technologies and carbon taxation mechanisms in major cities to enhance the research framework for construction industry carbon emissions.

Supplementary Materials

The following supporting information can be downloaded at: https://www.mdpi.com/article/10.3390/buildings15183414/s1: Table S1. The BCEMS of each province in China from 2010 to 2021; Table S2. The main parameters of the GTWR model; and Table S3. Results of the OLS regression analysis.

Author Contributions

Writing the draft, J.Y. and J.P.; data curation, J.P., G.L., Y.Y. and L.M.; writing—review and editing, J.Y.; methodology, J.Y. and J.P.; supervision, G.L. All authors have read and agreed to the published version of the manuscript.

Funding

This research was supported by the Guangxi First-Class Discipline Statistics Construction Project Fund, the funding of ”Construction of High-level Discipline Team for Environmental Safety and Governance” from the School of Management Science and Engineering, Guangxi University of Finance and Economics, and Guangxi Philosophy and Social Sciences Foundation (23FGL019).

Data Availability Statement

The data presented in this study are available upon request from the corresponding author.

Conflicts of Interest

The authors declare no conflicts of interest.

References

  1. Zheng, S.; He, X.; Liang, X.; Yu, L. Research on the Decoupling Relationship and Driving Factors of Carbon Emissions in the Construction Industry of the East China Core Economic Zone. Buildings 2024, 14, 1476. [Google Scholar] [CrossRef]
  2. Wang, Q.; Zhang, X.; Guo, C.; Zhou, H.; Zhao, Y.; Lin, B. Analysis of carbon emission differences between Chinese and Japanese buildings based on qualitative and quantitative comparisons. J. Build. Eng. 2024, 89, 109260. [Google Scholar] [CrossRef]
  3. Xiong, L.; Wang, M.; Mao, J.; Huang, B. A Review of Building Carbon Emission accounting Methods under Low-Carbon Building Background. Buildings 2024, 14, 777. [Google Scholar] [CrossRef]
  4. Li, X.; Zhu, C. Summary of research on account of carbon emission in building industry and analysis of its influential factors. J. Saf. Environ. 2022, 20, 317–327. [Google Scholar] [CrossRef]
  5. Zhang, S.; Wang, M.; Zhu, H.; Jiang, H.; Liu, J. Impact factors and peaking simulation of carbon emissions in the building sector in Shandong Province. J. Build. Eng. 2024, 87, 109141. [Google Scholar] [CrossRef]
  6. Liu, Y.; Gan, L.; Cai, W.; Li, R. Decomposition and decoupling analysis of carbon emissions in China’s construction industry using the generalized Divisia index method. Environ. Impact Assess. Rev. 2024, 104, 107321. [Google Scholar] [CrossRef]
  7. Yuan, S.S.; Chen, X.J.; Du, Y.C.; Qu, S.L.; Hu, C.M.; Jin, L.; Xu, W.; Yan, G. Pathway of Carbon Emission Peak of China’s Building Sector. Res. Environ. Sci. 2022, 35, 394–404. [Google Scholar] [CrossRef]
  8. Liu, Z. Near-real-time methodology for assessing global carbon emissions (in Chinese). Chin. Sci. Bull. 2023, 68, 830–840. [Google Scholar] [CrossRef]
  9. Zhang, S.; Wang, M.; Jiang, H.; Guan, D. Deep learning-based stepwise peaking roadmap of carbon emissions in Chinese provincial building sector. Build. Environ. 2025, 270, 112505. [Google Scholar] [CrossRef]
  10. Zou, Y.; Huang, M.; Huang, H.; Lu, Y. Spatiotemporal Evolution and Associated Influencing Factors of Carbon Emissions in the Middle Reaches of the Yangtze River Urban Agglomerations. Resour. Environ. Yangtze Basin 2025, 34, 976–992. [Google Scholar]
  11. Guo, X.; Qu, X.; Xu, D. Current status and prospects of carbon emission accounting system under the "dual carbon" background. J. Environ. Eng. Technol. 2025, 15, 819–832. [Google Scholar]
  12. Chen, Y.; Wu, Y.; Chen, N.; Kang, C.; Du, J.; Luo, C. Calculation of Energy Consumption and Carbon Emissions in the Construction Stage of Large Public Buildings and an Analysis of Influencing Factors Based on an Improved STIRPAT Model. Buildings 2022, 12, 2211. [Google Scholar] [CrossRef]
  13. Guo, J.; Bai, Y.; Qi, J.; Li, N.; Xu, M. Comparative study of international standards for carbon emission accounting methods in building life cycles. China Popul. Resour. Environ. 2025, 35, 55–67. [Google Scholar]
  14. Kumanayake, R.; Luo, H. Life cycle carbon emission assessment of a multi-purpose university building: A case study of Sri Lanka. Frontiers of Engineering. Front. Eng. Manag. 2018, 5, 381–393. [Google Scholar] [CrossRef]
  15. Lai, K.; Abdul Rahiman, N.; Othman, N.; Ali, K.; Lim, Y.; Moayedi, F.; Mat Dzahir, M. Quantification process of carbon emissions in the construction industry. Energy Build. 2023, 289, 113025. [Google Scholar] [CrossRef]
  16. Wen, L.; Yan, X. Research on the Distribution Characteristics and Regional Impact of Carbon Emissions in China’s Construction Industry. J. Eng. Manag. 2024, 38, 7–12. [Google Scholar] [CrossRef]
  17. Zhang, L.; Han, C.; Liu, X. Analysis on the Space-time Pattern and Influencing Factors of Carbon Emissions in China Construction Industry. J. Qingdao Univ. (Nat. Sci. Ed.) 2023, 36, 135–140. [Google Scholar]
  18. Ren, X.; Liang, Y.; Zhao, M.; Gao, C.; Xue, X. Analysis of Spatial Convergence and Driving Factors of Synergistic Effects of Pollution and Carbon Reduction in China′s Construction Industry. Res. Environ. Sci. 2025, 38, 724–735. [Google Scholar] [CrossRef]
  19. Wang, Y. Impact Mechanism of Biased Technological Progress on Building Embodied Carbon Emissions. Ph.D. Thesis, Liaoning Technical University, Fuxin, China, 2024. [Google Scholar] [CrossRef]
  20. Zhang, X.; Sun, J.; Zhang, X.; Wang, F. Assessment and regression of carbon emissions from the building and construction sector in China: A provincial study using machine learning. J. Clean. Prod. 2024, 450, 141903. [Google Scholar] [CrossRef]
  21. Xu, S.; Li, X.; Dong, X. Spatial characteristics and influencing factors of carbon emission intensity of construction industry in China. Sci. Technol. Rev. 2024, 42, 103–111. [Google Scholar] [CrossRef]
  22. Huang, G.; Li, K. Spatial-Temporal Analysis of Carbon Emissions in China Construction Industry. J. Eng. Manag. 2024, 38, 13–18. [Google Scholar] [CrossRef]
  23. Yang, H.; Yang, G. Spatial-temporal evolution and influencing factors of provincial carbon emissions in China based on modernization. Clim. Change Res. 2023, 19, 457–471. [Google Scholar]
  24. Shi, Z.; Bi, A. Spatiotemporal pattern and influencing factors of carbon emissions from construction sector in the Yangtze River Delta urban agglomeration. J. Xi’an Univ. Technol. 2024, 40, 182–192. [Google Scholar]
  25. Jiang, B.; Huang, B.; Zhang, H. Study on Influencing Factors of Construction Industry Carbon Emissions in Jiangsu Province Based on LMDI Model. Environ. Sci. Technol. 2021, 44, 202–212. [Google Scholar] [CrossRef]
  26. Yan, H.; Liu, H.; Qiu, R.; Zhang, Y. Influencing Factors Analysis of Construction Industry Carbon Emissions Based on Stepwise Regression. J. Eng. Manag. 2021, 35, 16–21. [Google Scholar] [CrossRef]
  27. Wang, Y.; Shi, H.; Yan, H.; Huang, W.; Hao, Z. Analysis of Carbon Emission Intensity Distribution and Spatial Effect of China’s Construction Industry Based on the Spatial Durbin Model. J. Eng. Manag. 2021, 35, 1–6. [Google Scholar] [CrossRef]
  28. Ou, J.P.; Xie, J.T.; Liu, X.P. Large disparities in spatiotemporal distributions of building carbon emissions across China. Build. Environ. 2025, 274, 112778. [Google Scholar] [CrossRef]
  29. Huo, T.F.; Zhang, Y.J.; Qiao, Y.F.; Hao, X.H.; Cong, X.B.; Cai, W.G. What is the internal peaking law of the building carbon emissions? Evidence from developed countries. J. Build. Eng. 2025, 110, 113054. [Google Scholar] [CrossRef]
  30. Wu, M. Analysis of Spatiotemporal Characteristics and Influence Factors of Carbon Intensity in China’s Construction Industry based on GTWR model. Master’s Thesis, Chang’an University, Xi’an, China, 2019. [Google Scholar]
  31. The Central People’s Government of the People’s Republic of China. Available online: https://www.gov.cn. (accessed on 23 August 2025).
  32. China Association for Building Energy Efficiency. Available online: https://www.cabee.org. (accessed on 23 August 2025).
  33. GB/T 2589-2008; General Principles for Comprehensive Energy Consumption Calculation. The Standardization Administration of the People’s Republic of China: Beijing, China, 2008.
  34. Cheng, S.; Zhou, X.; Zhou, H. Study on Carbon Emission Measurement in Building Materialization Stage. Sustainability 2023, 15, 5717. [Google Scholar] [CrossRef]
  35. Qi, S.; Zhang, Y. Research on the Influencing Factors and Reduction Strategies of Carbon Emission of Construction Industry in China. Soft Sci. 2013, 27, 39–43. [Google Scholar]
  36. Wu, D. Research on Carbon Emissions Caculation and Green Building Analysis Based on BIM. Master’s Thesis, Harbin Institute of Technology, Harbin, China, 2015. [Google Scholar]
  37. Yu, P.; Zhen, X.; Ma, L. Review on Studies of Life Cycle Carbon Emission from Residential Buildings. Build. Sci. 2011, 27, 9–12+35. [Google Scholar] [CrossRef]
  38. Shao, J.; Li, J.; Yan, X.; Ma, T.; Zhang, R. Analysis of spatiotemporal variation characteristics and driving forces of NPP in Shanxi Province from 2000 to 2020 based on geodetector. Environ. Sci. 2023, 44, 312–322. [Google Scholar] [CrossRef]
  39. Xu, Y.; Zheng, Z.; Guo, Z.; Dou, S.; Huang, W. Dynamic variation in vegetation cover and its influencing factor detection in the Yangtze River Basin from 2000 to 2020. Environ. Sci. 2022, 43, 3730–3740. [Google Scholar] [CrossRef]
  40. Chen, M.; Yue, H.; Hao, Y.; Liu, W. The Spatial Disparity, Dynamic Evolution and Driving Factors of Ecological Efficiency in the Yellow River Basin. J. Quant. Technol. Econ. 2021, 38, 25–44. [Google Scholar] [CrossRef]
  41. Pang, J.; Lu, G.; Yin, J.; Tan, M.; Mo, L.; Hou, X. A Study of the Spatiotemporal Evolution and Influencing Factors of Forest Ecological Product Value in Guangxi, China. Forests 2024, 15, 2199. [Google Scholar] [CrossRef]
  42. Li, M.; Han, L.; Liu, H.; Zhang, Y.; Shi, S. Dynamic Change of Per Capita Three-Dimensional Ecological Footprint in Shule River Basin Based on GTWR Model and Its Influencing Factors. Ecol. Econ. 2024, 40, 147–154. [Google Scholar]
  43. Wu, X.; Yang, S.; Yin, S.; Xu, H. Spatial-temporal Dynamic Characteristics and Its Driving Mechanism of Urban Built-Up Area in Yangtze River Delta Based on GTWR Model. Resour. Environ. Yangtze Basin 2021, 30, 2594–2606. [Google Scholar]
  44. Jiang, F.; Chen, B.; Li, P.; Jiang, J.; Zhang, Q.; Wang, J.; Deng, J. Spatio-temporal evolution and influencing factors of synergizing the reduction of pollution and carbon emissions—Utilizing multi-source remote sensing data and GTWR model. Environ. Res. 2023, 229, 115775. [Google Scholar] [CrossRef]
  45. Mi, K.; Zhang, C.; Wang, J. Characteristics of China’s Net Carbon Emissions from the Perspective of Carbon Neutrality Optimization of National Land Space. Energy Res. Manag. 2025, 17, 40–51. [Google Scholar] [CrossRef]
  46. Xiao, W.; Song, W.; Pei, X.; Wang, L. Drivers of Carbon Emissions in China’s Construction Industry: A Perspective from Interregional Carbon Transfer. Buildings 2025, 15, 1667. [Google Scholar] [CrossRef]
  47. Hong, J.; Liu, Y.; Chen, Y. A spatiotemporal analysis of carbon lock-in effect in China’s provincial construction industry. Resour. Sci. 2022, 44, 1388–1404. [Google Scholar] [CrossRef]
  48. Huang, J. Research on the Carbon Emission Characteristics and Reduction Paths of Building Decoration and Renovation Projects. Constr. Archit. 2025, 5, 62–65. [Google Scholar]
  49. Research Report on Energy Consumption and Carbon Emissions of Buildings in China (2022). Constr. Archit. 2023, 2, 57–69.
  50. Zhou, X.; Hu, P.; Cheng, P. Carbon Emission Accounting and Peak Carbon Prediction of China’s Construction Industry from a Whole Life Cycle Perspective. Environ. Sci. 2022, 44, 1388–1404. [Google Scholar] [CrossRef]
  51. Zhang, X.; Nie, D.; Chen, Z.; Wang, R.; Su, J. Spatial-temporal Evolution Characteristics and Influencing Factors of Carbon Emissions from Construction Industry in Western China. Environ. Sci. 2025, 1–22. [Google Scholar] [CrossRef]
  52. Kong, F.; Li, L. Analysis on Spatial Distribution and Driving Factors of Carbon Emissions in Provincial Construction Industry. Constr. Econ. 2019, 40, 102–106. [Google Scholar] [CrossRef]
  53. Li, B.; Han, S.; Wang, Y.; Li, J.; Wang, Y. Feasibility Assessment of the Carbon Emissions Peak in China’s Construction Industry: Factor Decomposition and Peak Forecast. Sci. Total Environ. 2020, 706, 135716. [Google Scholar] [CrossRef]
  54. Liu, W.S.; Ren, D.C.; Ke, C.B.; Ying, W. Carbon Emission Influencing Factors and Scenario Prediction for Construction Industry in Beijing–Tianjin–Hebei. Adv. Civ. Eng. 2023, 7074, 2286573. [Google Scholar] [CrossRef]
  55. Wang, Z.; Wang, Y.; Wang, T.; Zhao, N. Spatial Correlation Network Characteristics and Drivers of Carbon Reduction-Construction Waste Reduction-Green Expansion-Economic Growth Synergy Effect in construction industry. China Environ. Sci. 2025, 45, 4064–4079. [Google Scholar] [CrossRef]
  56. Li, M.; Chen, T. Influencing Factors and Peak Prediction of Operating Carbon Emission in Public Buildings of Jijin Province. Build. Energy Effic. 2024, 52, 142–150. [Google Scholar]
  57. Zhang, J.; Lu, H.; Peng, W.; Zhang, L. Analyzing carbon emissions and influencing factors in Chengdu-Chongqing urban agglomeration counties. J. Environ. Sci. 2025, 151, 640–651. [Google Scholar] [CrossRef] [PubMed]
  58. He, J.; Yang, J. Spatial–Temporal Characteristics and Influencing Factors of Land-Use Carbon Emissions: An Empirical Analysis Based on the GTWR Model. Land 2023, 12, 1506. [Google Scholar] [CrossRef]
  59. Yan, H.; Guo, X.; Zhao, S.; Yang, H. Variation of net carbon emissions from land use change in the Beijing-Tianjin-Hebei region during 1990–2020. Land 2022, 11, 997. [Google Scholar] [CrossRef]
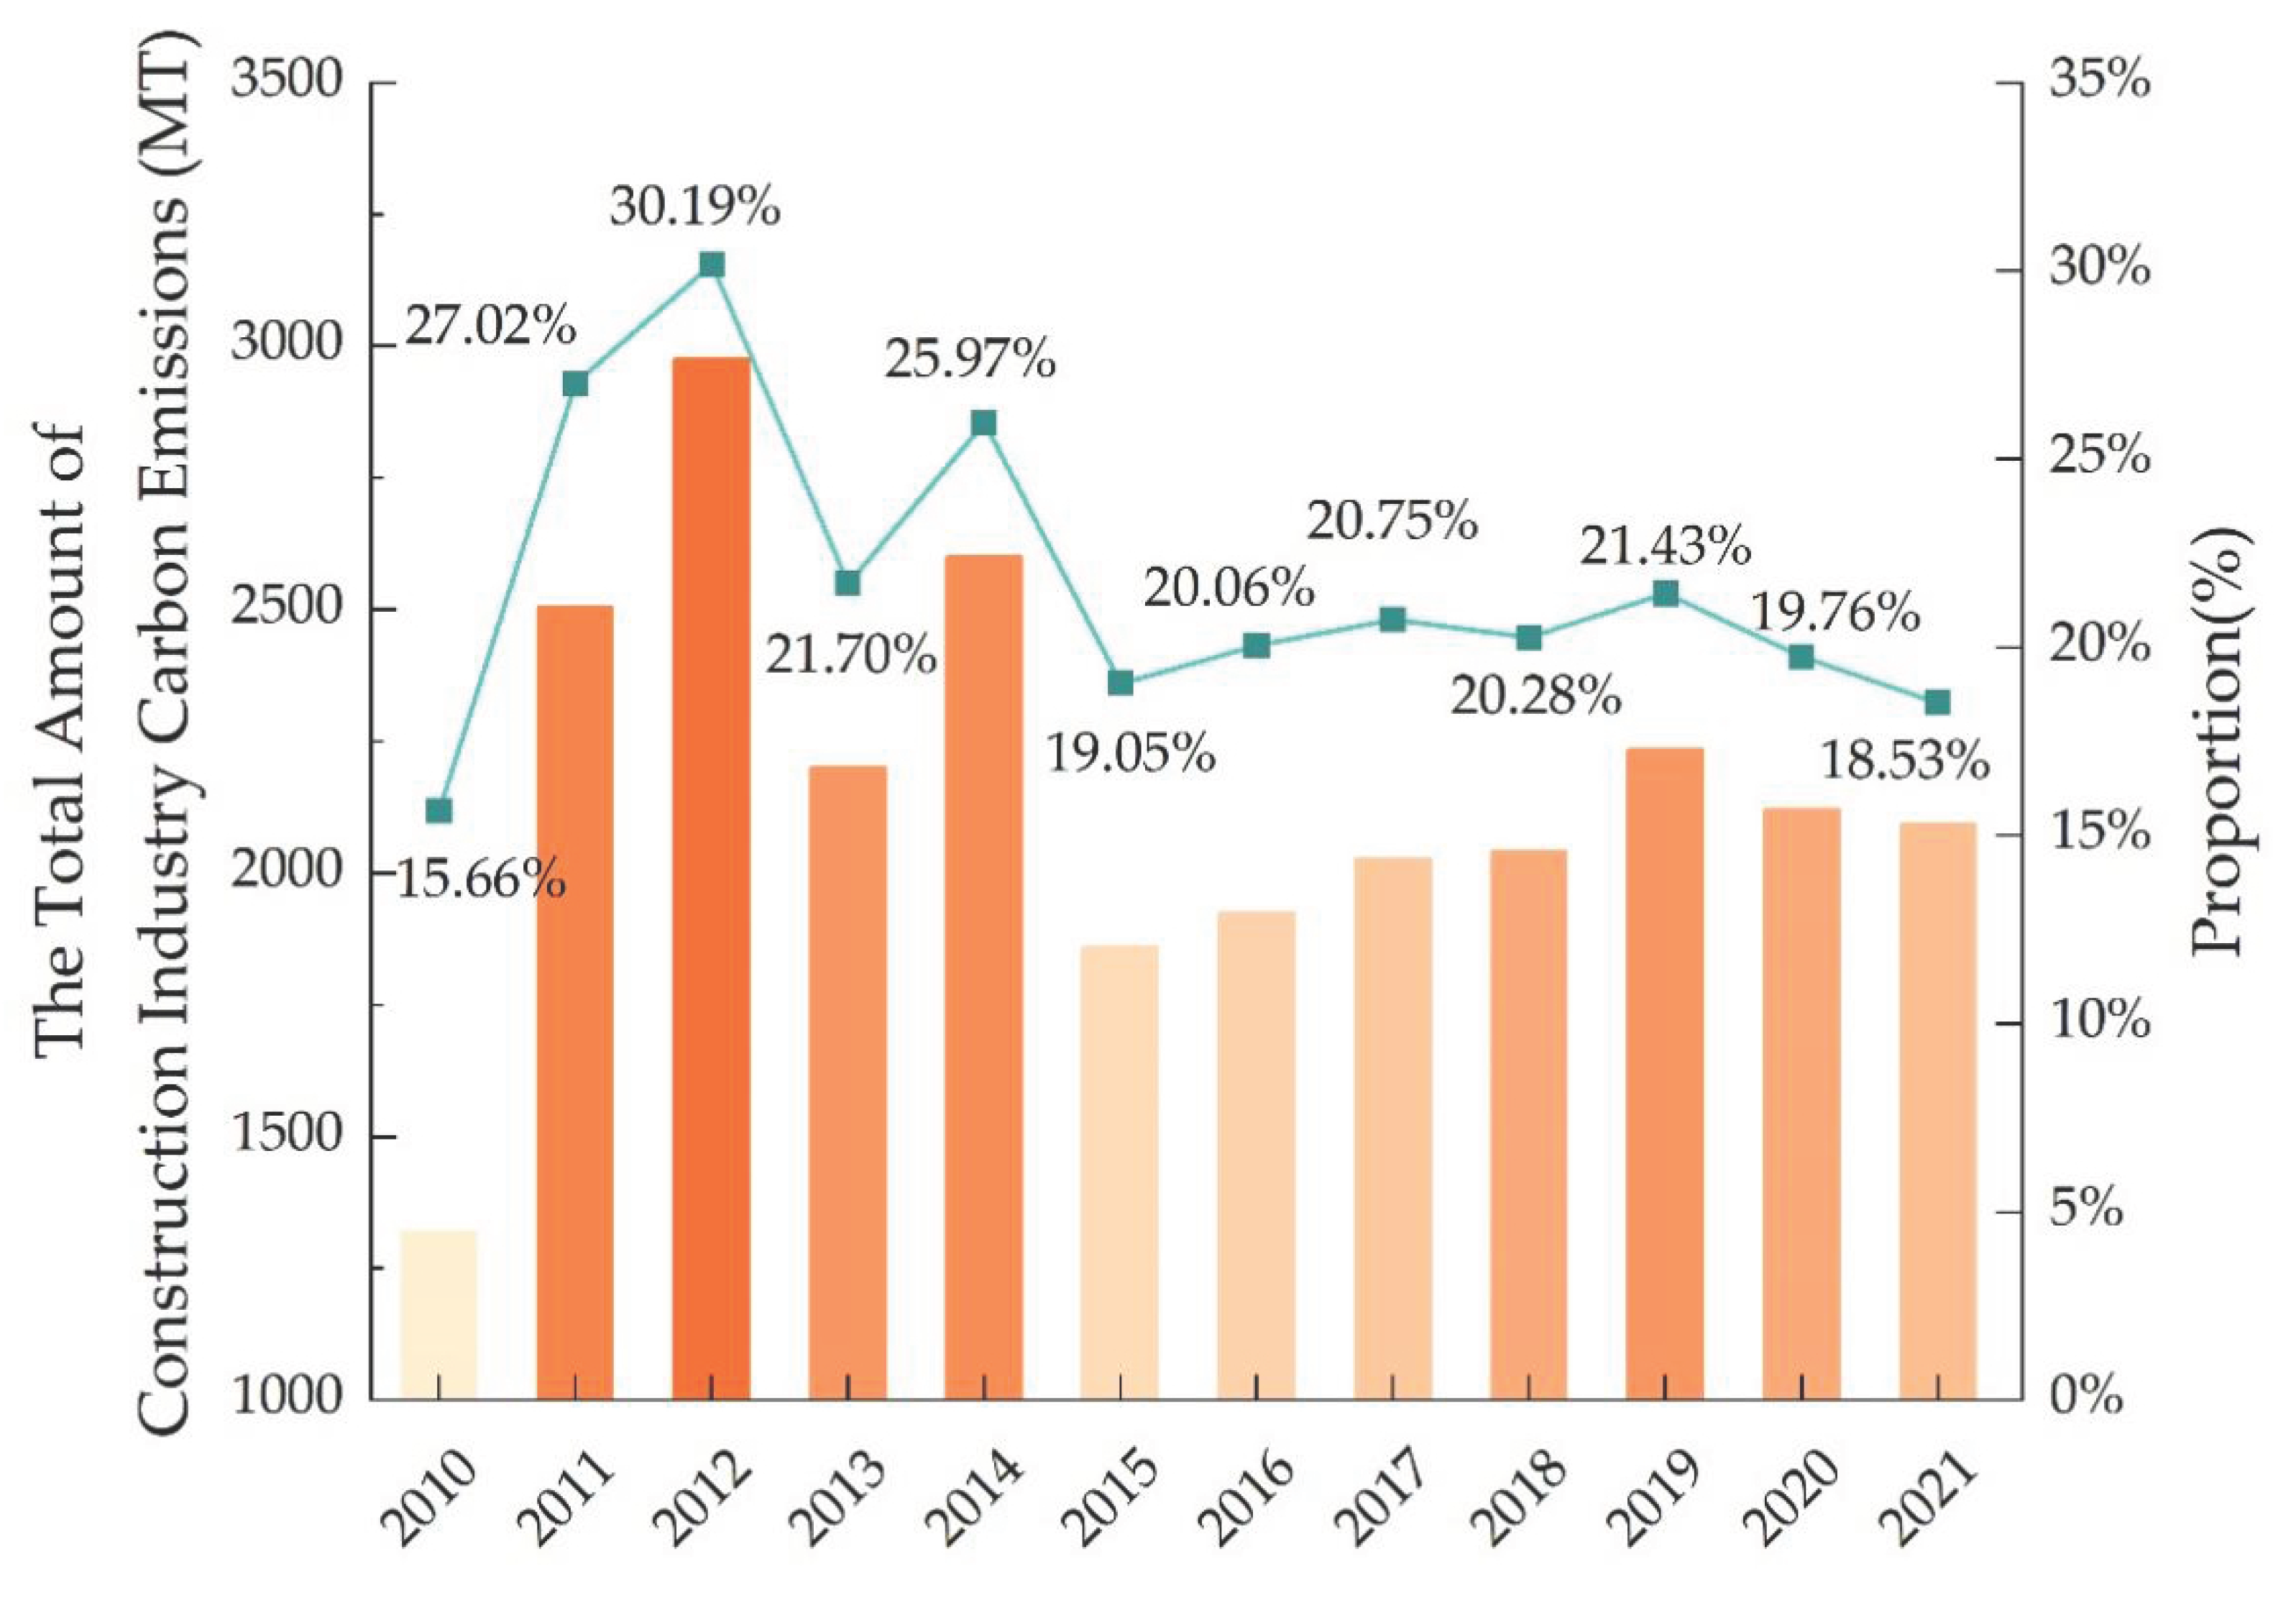
Figure 1. Proportion of BCEMS in China’s total carbon emissions from 2010 to 2020.
Buildings 15 03414 g001
Figure 2. Distribution of BCEMS from 2010 to 2021.
Buildings 15 03414 g002
Figure 3. LISA of BCEMS from 2010 to 2021.
Buildings 15 03414 g003
Figure 4. Explanatory power (q-values) of influencing factors on BCEMS’ spatial differentiation from 2010 to 2021.
Buildings 15 03414 g004
Figure 5. Interaction effects of influencing factors on BCEMS’ spatial differentiation from 2010 to 2021.
Buildings 15 03414 g005
Figure 6. Spatial distributions of influencing factor coefficients.
Buildings 15 03414 g006
Table 1. Carbon emissions and recycling coefficients of major building materials.
Building
Material
CementGlassSteelAluminumTimber
Emission
factor
0.8150 kg/kg0.9655 kg/kg1.7890 kg/kg2.6000 kg/kg−842.8000 kg/m3
Recycling
coefficient
——0.700.800.850.20
Note: The carbon emission coefficient of timber is negative because it is an environmentally friendly building material that can absorb CO2 during the production process [36,37].
Table 2. Driving factors for spatial differentiation of BCEMS in China.
FactorsVariablesAbbreviation (Unit)Description
economic factorsEconomic development levelX1 (RMB/capita)Ratio of regional GDP to permanent population
Level of industrializationX2 (%)Proportion of gross industrial output value in regional GDP
Disposable income of urban residentsX3 (RMB)Disposable income of urban residents
Social factorsTotal populationX4 (10,000 persons)Total population of a region over a specified period
Population densityX5 (people/km2)Population density
Urbanization levelX6 (%)Proportion of urban permanent population in total regional population
technical factorsLabor productivityX7 (RMB/capita)Ratio of gross output value of construction industry to labor input
Technical equipment rateX8 (RMB/capita)Ratio of net value of owned mechanical equipment to number of employees in construction enterprises
Power equipment rateX9 (kw/person)Ratio of number of power equipment to number of employees in construction enterprises
energy factorsEnergy consumption levelX10 (Tons/square meter)Ratio of carbon emissions to completed floor area in construction industry
Energy intensityX11 (tce/ten thousand RMB)Ratio of energy consumption to regional GDP
enterprise factorsFixed assetsX12 (ten thousand RMB)Total tangible assets of construction enterprises calculated by gross output value of construction industry
Liabilities of construction enterprisesX13 (ten thousand RMB)Total liabilities of enterprises
Table 3. Three component values and total of BCEMS from 2010 to 2021 (unit: million tons).
Time201020112012201320142015201620172018201920202021Sum
Category
Building Materials1064.172373.682838.122045.562433.481693.331765.711863.041866.302083.571940.381992.2223,959.56
Fossil
Energy
37.3776.0379.5789.9096.45100.9291.4292.1995.7663.8391.45105.721065.21
Electricity34.3656.0559.2265.5370.2967.2568.1172.8080.1588.7489.6799.73851.91
Sum1135.902505.762976.912200.992600.221861.501925.242028.032042.212236.142121.502197.6725,876.68
Table 4. Global Moran’s I index of BCEMS from 2010 to 2021.
YearMoran’s I IndexZ-Scorep-Value
20100.47338 *1.914003 *0.045620 *
2011−0.0063970.2390550.811063
20120.0667570.9133390.361064
20130.0679330.8604990.389514
20140.0687090.8549590.392574
20150.243198 *2.566112 *0.010285 *
20160.005513 *2.775450 *0.005513 *
20170.298060 *3.017784 *0.002546 *
20180.312492 *2.959506 *0.003081 *
20190.399551 *3.645945 *0.000226 *
20200.328481 *3.052004 *0.002273 *
20210.202364 *1.989491 *0.046647 *
Note: * denotes that the result has statistically significant spatial clustering characteristics.
Disclaimer/Publisher’s Note: The statements, opinions and data contained in all publications are solely those of the individual author(s) and contributor(s) and not of MDPI and/or the editor(s). MDPI and/or the editor(s) disclaim responsibility for any injury to people or property resulting from any ideas, methods, instructions or products referred to in the content.