1. Introduction
The dynamic shear modulus ratio and dynamic damping ratio are two fundamental parameters that characterize the dynamic behavior of soils. They serve as essential inputs for both seismic response analysis of soil layers and seismic safety evaluation of engineering sites. The accuracy with which these parameters are determined directly influences the reliability of the analytical results. Typically, the dynamic shear modulus ratios decrease with increasing shear strain, while the dynamic damping ratios increase accordingly. Research on the variation patterns of the soil dynamic shear modulus ratio and dynamic damping ratio with shear strain originated in the 1970s. In a pioneering study published in 1970, Seed et al. [
1] first proposed curves describing the relationship between dynamic shear modulus ratios and dynamic damping ratios with shear strain for both sandy and cohesive soils. Since then, numerous researchers [
2,
3,
4,
5,
6] have conducted extensive investigations into the empirical relationships between these soil dynamic parameters and shear strain, resulting in significant progress in this research field.
Due to differences in regional soil formation and sedimentary environments, the dynamic shear modulus ratios and dynamic damping ratio exhibit significant regional variability. Consequently, many researchers have determined these parameters for typical regional soils based on experimental data. Yuan et al. [
7] proposed the recommended values for dynamic shear modulus ratios and dynamic damping ratios across different depths for six soil types based on resonant column test data from multiple regions including Beijing and Shanghai. Chen et al. [
6,
8,
9] developed fitted curves and corresponding parameter recommendations for the variation in dynamic shear modulus ratio and dynamic damping ratio with shear strain based on free-vibration column tests conducted on typical soils from Nanjing and its surrounding regions. Shi et al. [
10] carried out a statistical analysis of the average dynamic shear modulus ratios and dynamic damping ratios of silty clay in the Beijing region across different depths. Liu et al. [
11] statistically analyzed the nonlinear dynamic parameters of soils in the New Region of Xiong’an. Chen [
12], Zhang et al. [
13], Lian et al. [
14], Cai et al. [
15], Shi et al. [
16], and Xia et al. [
17] conducted statistical analyses on experimental data for typical soils from different coastal regions of China and proposed corresponding recommended values for the dynamic shear modulus ratio and dynamic damping ratio. Lu et al. [
18] and Wu et al. [
19] conducted experimental studies on the dynamic shear modulus ratios and dynamic damping ratios of representative marine soils in China. Wu [
20] performed experimental research on the dynamic shear modulus ratios and dynamic damping ratios of frozen soils on the Qinghai-Tibet Plateau.
Although extensive research has been conducted on the dynamic parameters of typical soils across various regions, samples targeting specific regions remained relatively limited, particularly in the Beijing-Tianjin-Hebei (BTH) region. With the rapid advancement of regional integration and large-scale infrastructure development, there was an increasing need to accurately determine soil dynamic parameters in this region. This study aimed to utilize laboratory dynamic test data of five representative soil types from the BTH region, in combination with statistical analyses and numerical modeling, to derive the statistical characteristics of key parameters that described the dynamic shear modulus ratio and dynamic damping ratio. The study further investigated the influencing factors of these parameters and evaluated their impacts on structural seismic response, with the goal of providing a practical method for selecting soil dynamic parameters in site seismic response analyses for boreholes lacking laboratory test data.
This paper introduced firstly the spatial distributions of the statistical data as well as their shear velocity and depth, and then the Hardin–Drnevich Hyperbolic Model and its modified version was used to describe the trends of dynamic shear modulus and dynamic damping ratios with shear strain. Nonlinear parameters including the reference shear strain, maximum damping ratio, and damping ratio nonlinearity coefficient were calculated from the statistical data, and their statistical characteristics and the correlations between nonlinear parameters and site factors including sampling depth, shear wave velocity at the sampling depth, overburden thickness, 30 m average shear wave velocity, and 20 m equivalent shear wave velocity were obtained. The dynamic response of a two-storied structure on a one-dimensional site model was conducted in order to reveal the influence of the variations in soil dynamic parameters on the seismic response of structures founded on these soils. Finally, according to the comparisons between different studies, a method to predict the dynamic shear modulus ratio and dynamic damping ratio of soil in the BTH region were proposed.
2. Data Overview
The statistical data were derived from dynamic triaxial tests and resonant column tests conducted on 5208 soil sample sets collected from 2500 boreholes located across Beijing, Tianjin, and Hebei Province in the northern part of the North China Plain. The samples included 564 clay specimens, 2483 silty clay specimens, 1029 silt specimens, 876 silty sand specimens, and 256 fine sand specimens.
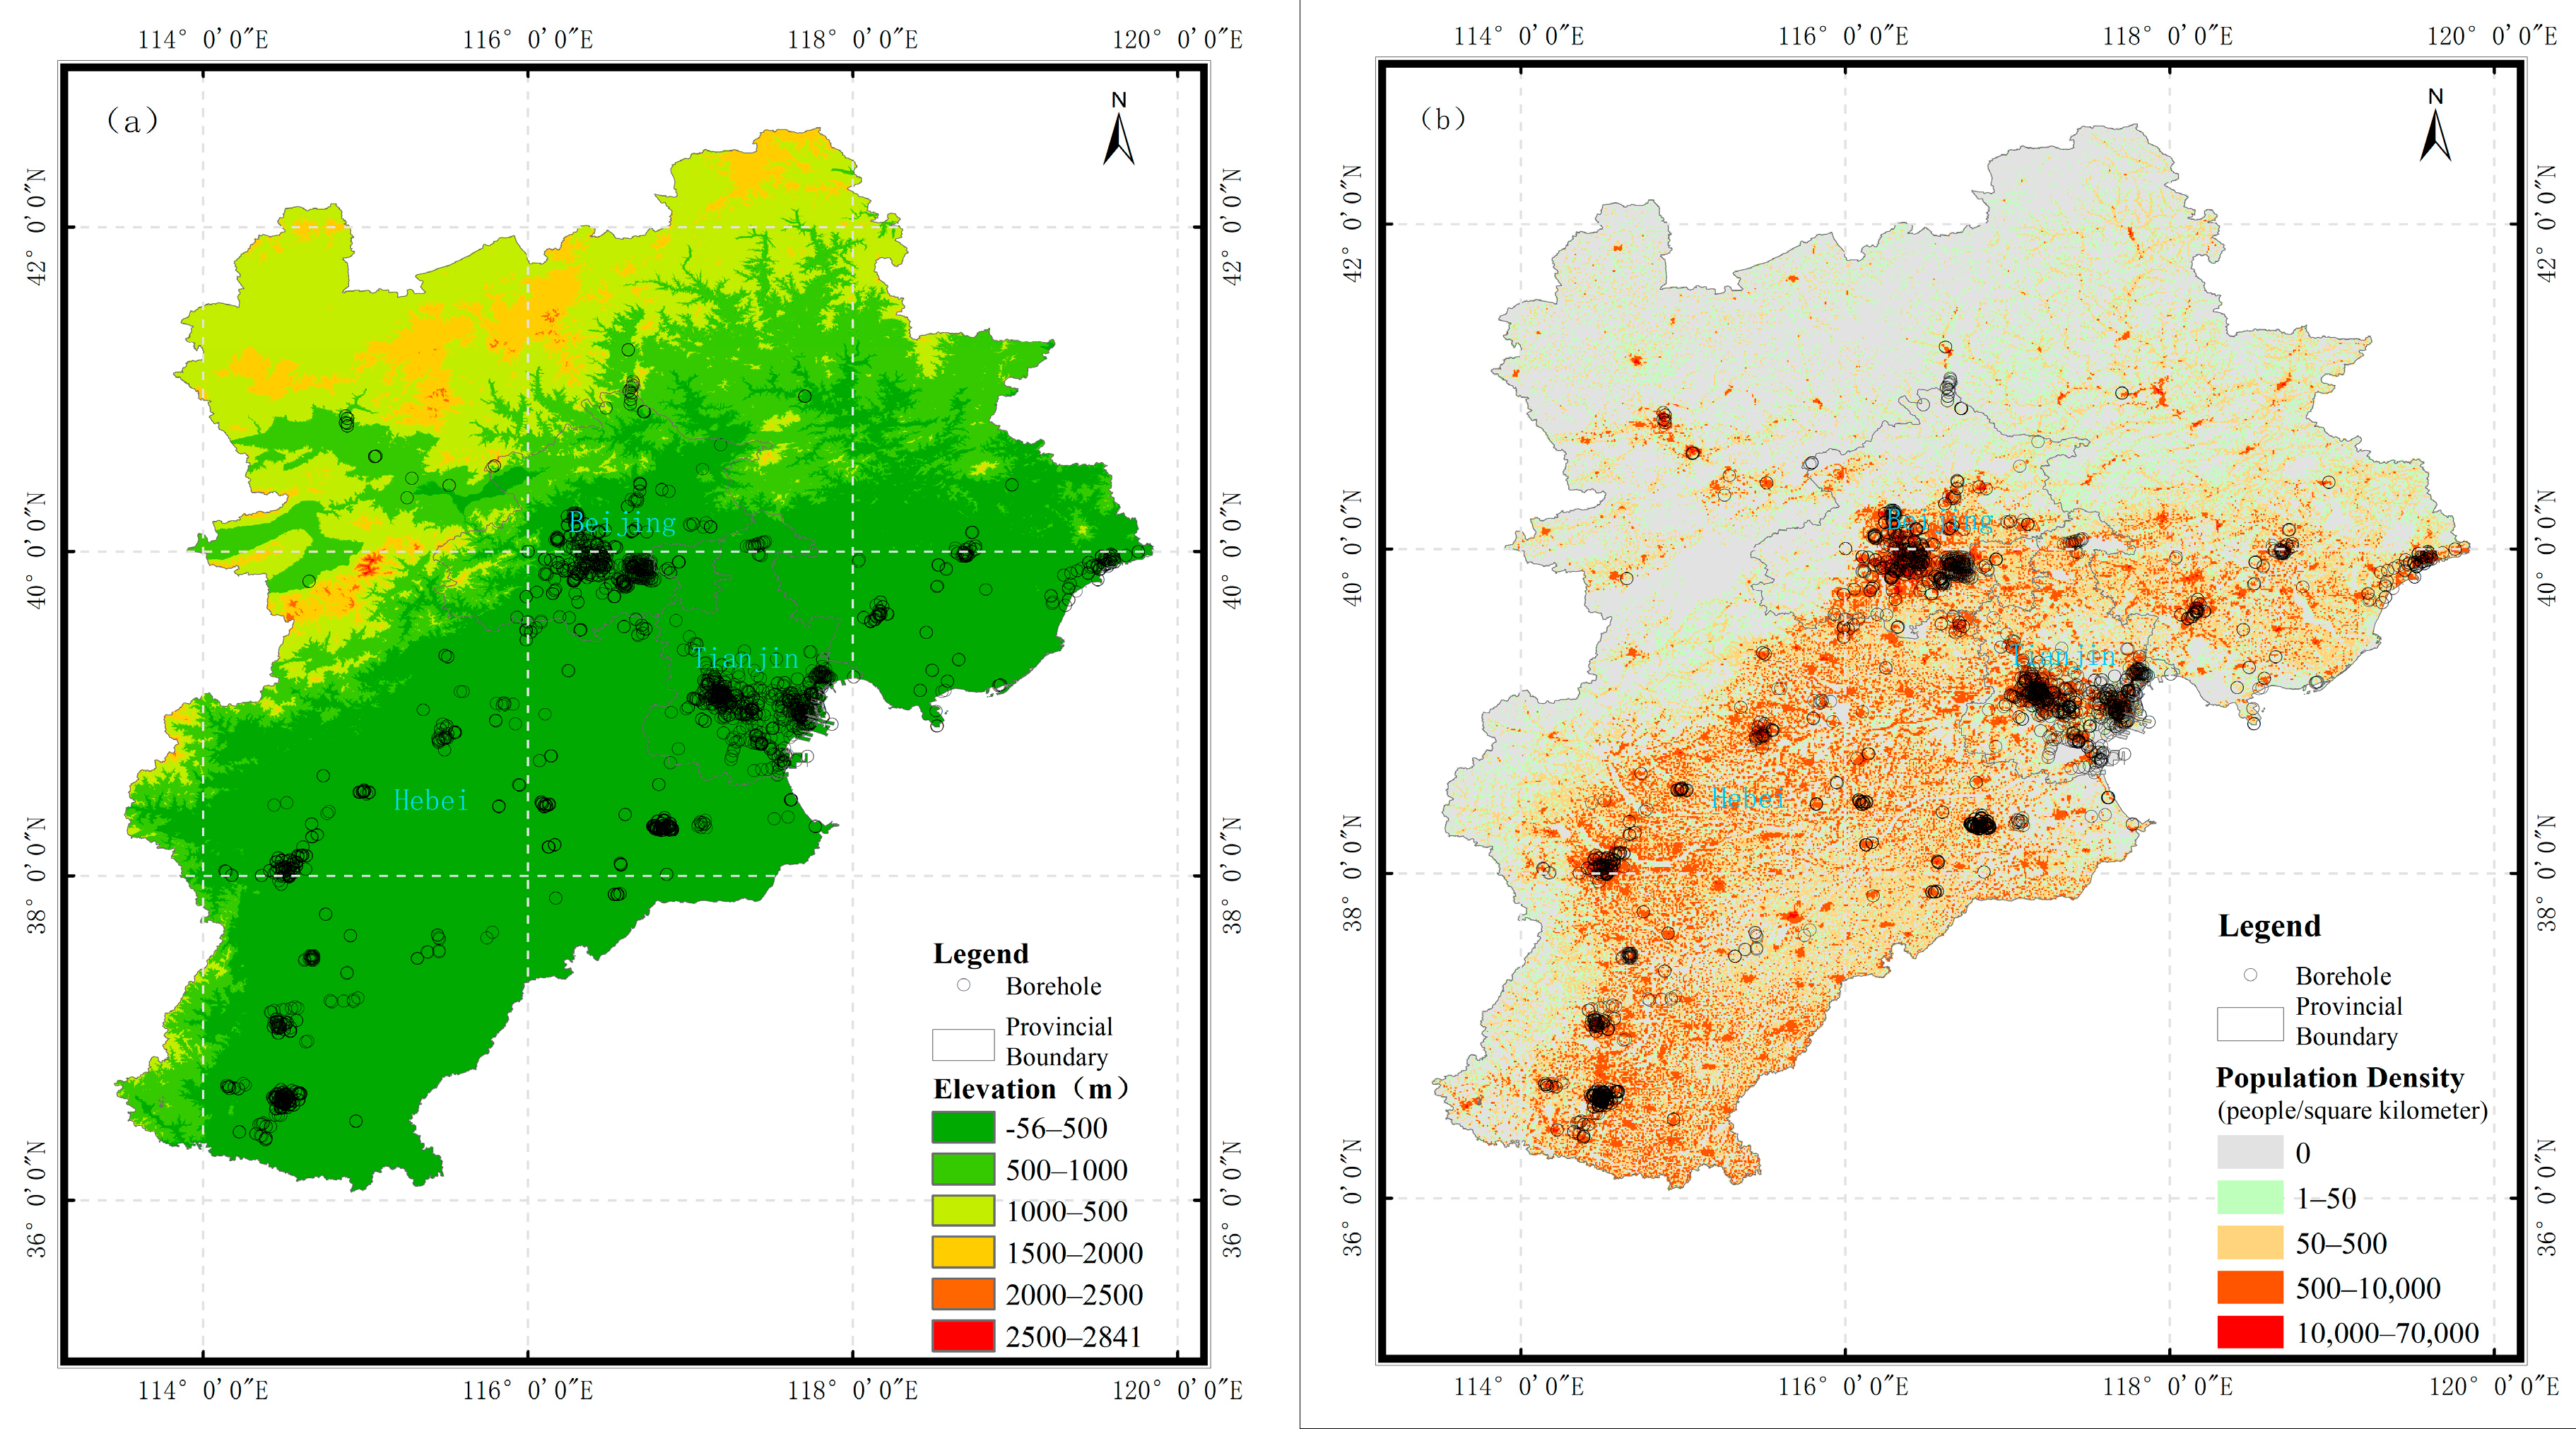
As shown in the borehole location distribution map (
Figure 1), the boreholes were primarily concentrated in the southeastern plain areas of this region, particularly within medium and large-sized cities such as Beijing, Tianjin, and Shijiazhuang. In contrast, boreholes were sparsely distributed in other areas, with especially limited coverage in the northwestern mountainous regions. Based on this spatial distribution, the collected soil samples were considered representative of the dynamic properties of site soils in the densely populated southeastern plain but might not adequately reflect the geotechnical characteristics of the less populated northwestern mountainous zone.
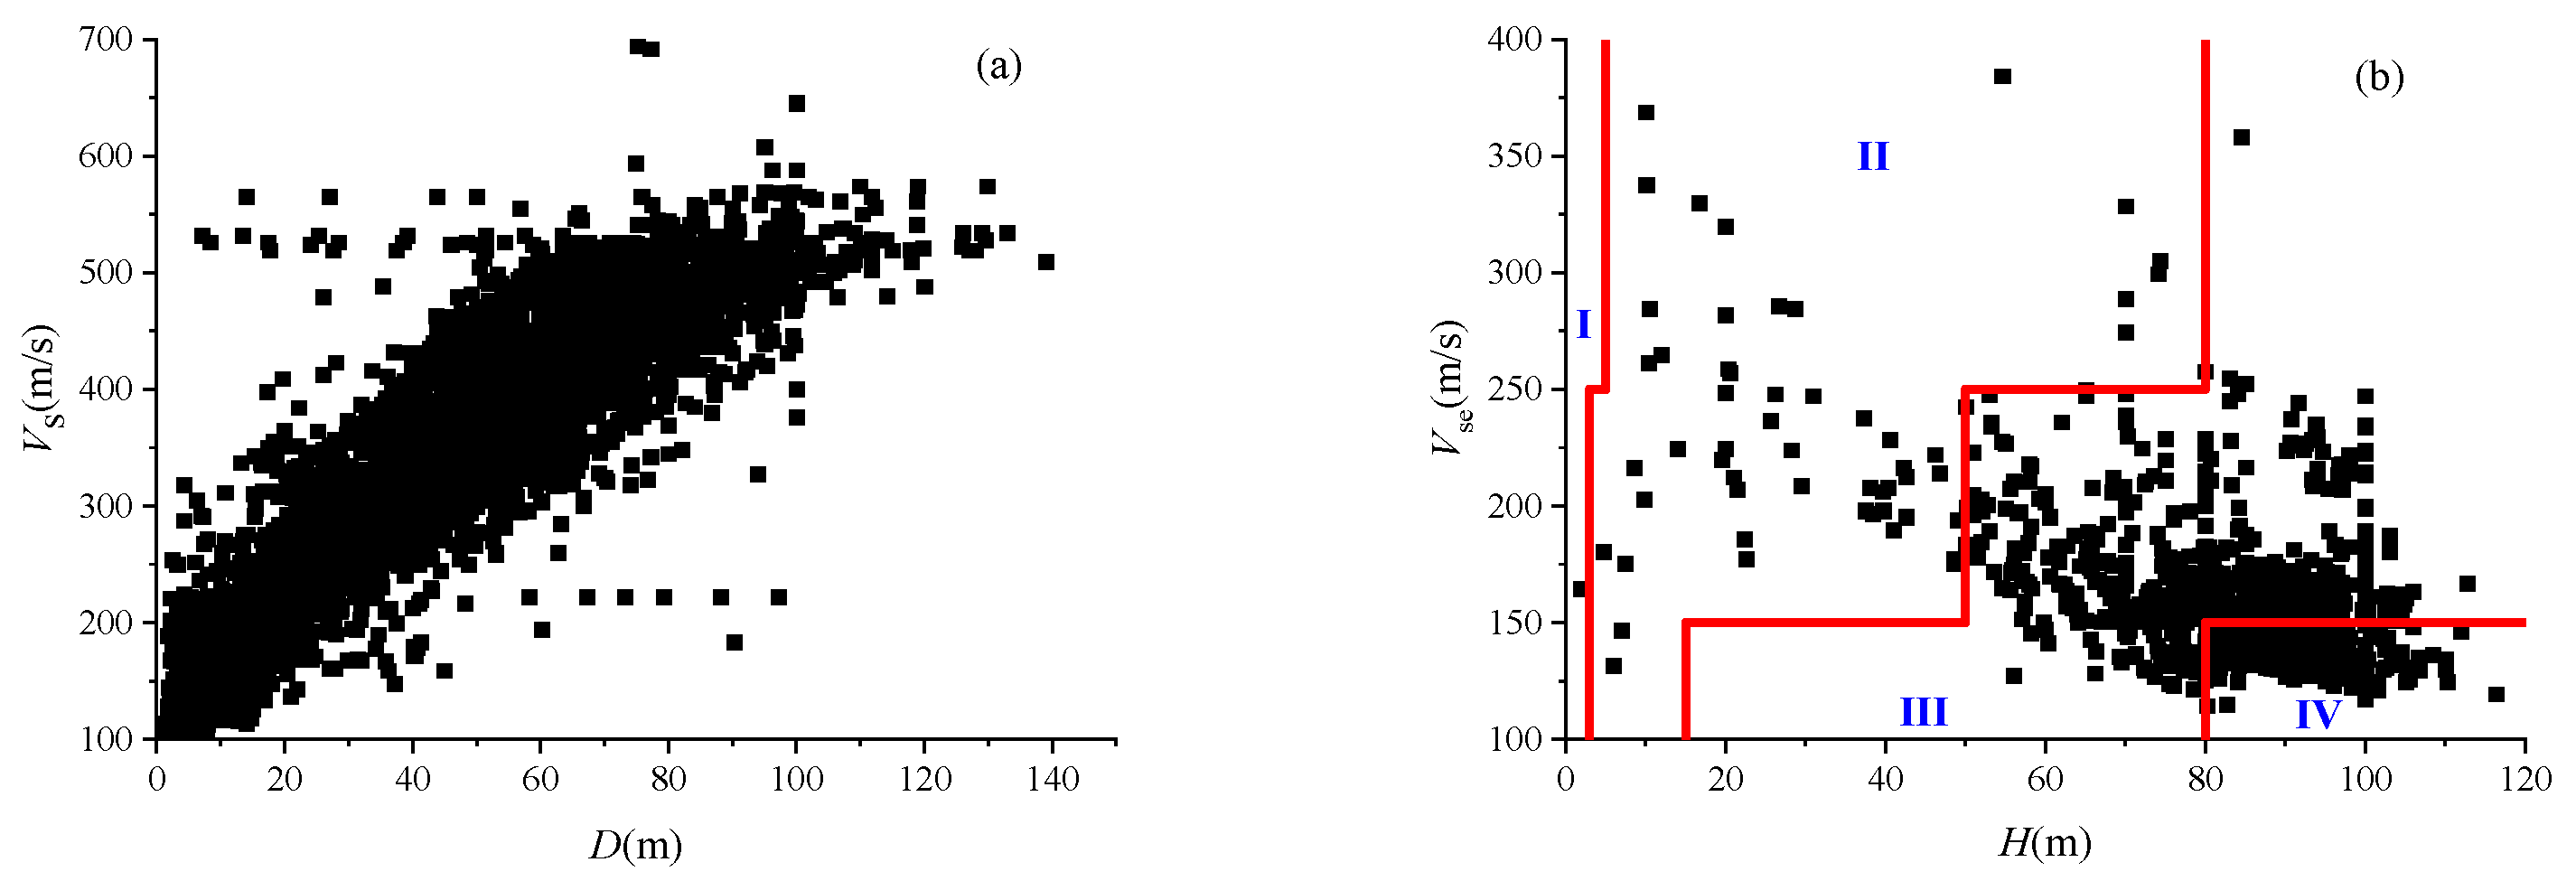
Based on the sampling depth of the soil specimens and the corresponding shear wave velocity at each sampling location (
Figure 2a), it was observed that soil samples were distributed throughout depths less than 140 m, with a relatively uniform distribution within the depths less than 100 m. In terms of shear wave velocity, samples spanned the range of 100 to 700 m/s, with a more uniform distribution between 100 and 550 m/s. This comprehensive coverage indicated that the experimental soil data sufficiently represented the dynamic properties of the investigated soil types at various depths and across sites with different shear wave velocity conditions.
The relationship between overburden thickness and 20 m equivalent shear wave velocity (
Vse), as revealed by the borehole data and illustrated in
Figure 2b, showed that most sites had an overburden thickness between 50 and 110 m and a
Vse range between 120 and 250 m/s. According to the site classification system defined in the Chinese Code for Seismic Design of Buildings (GB 50011) [
21], these characteristics corresponded to Site Classes III and IV. Soil samples from Site Classes III and IV accounted for 57.8% and 39.6% of the total, respectively, whereas those from Site Classes I and II comprised only 0.1% and 2.5%. Consequently, the experimental data could be considered highly representative of the dynamic properties of soils in Site Classes III and IV. Conversely, the representativeness of the dataset for Site Classes I and II was limited.
3. Statistical Characteristics of Soil Dynamic Parameters
Currently, two empirical models have been widely adopted for describing the relationships between the dynamic shear modulus ratio and dynamic damping ratio with shear strain:
(1) Hardin–Drnevich Hyperbolic Model (H–D Model) [
2]
where
G is the dynamic shear modulus,
Gmax is the maximum dynamic shear modulus,
γ is the dynamic shear strain,
γr is the reference shear strain,
λ is the dynamic damping ratio, and
λmax is the maximum dynamic damping ratio.
(2) Davidenkov Model [
3]
where
G,
Gmax,
γ,
λ, and
λmax are defined as above.
A,
B,
n, and
γ0 are fitting coefficients.
Among the two models, Model (1) was the standard empirical formulation for the relationship between shear modulus ratio, damping ratio, and shear strain used in seismic response analyses of soil layers as part of China’s seismic safety evaluation procedures [
5] because Model (1) had less coefficients to be determined by soil tests. In comparison, Model (2) involved more fitting coefficients without standardized values, which could lead to irregular or inconsistent fitting results when dealing with large datasets [
22]. Nevertheless, experimental data also indicated that the variation of soil damping ratio with shear strain was relatively complex and could not be fully captured by either the H–D model or the Davidenkov model [
8]. More important, the coefficients in Model (1) were more easily obtainable, which was essential in engineering applications, so almost all of dynamic shear modulus curves and dynamic damping ratio curves in China were given by Model (1) or its modified version. Therefore, based on the experimental data compiled in this study, the dynamic damping ratio was expressed using the following empirical formula:
where
G,
Gmax,
λ,
λmax are defined as previously.
α denotes the damping ratio nonlinearity coefficient.
In this study, Equations (1) and (5) were employed to perform statistical analyses of the empirical relationships between the dynamic shear modulus ratios, dynamic damping ratio, and shear strain for typical soils in the BTH region. The results indicated that fitting the dynamic shear modulus ratio of each soil sample using Equation (1) yielded a maximum standard deviation of 0.011, while fitting the dynamic damping ratio using Equation (5) resulted in a maximum standard deviation of 0.021, both of which were within an acceptable accuracy range. Meanwhile, fitting the dynamic damping ratio using Equation (2) resulted in much larger standard deviations, whose mean value was 0.034. Small standard deviations also indicated that Equations (1) and (5) were adapted to the statistical data in the BTH region.
Figure 3 presents violin plots illustrating the distributions of nonlinear dynamic parameters across different soil types. As shown, nonlinear parameters such as the reference shear strain (
γr), maximum damping ratio (
λmax), and damping ratio nonlinearity coefficient (
α) exhibited considerable variability across soil types.
Table 1 summarizes the median values of these parameters, along with the values corresponding to exceedance probabilities of 84% and 16%. Significant differences were observed among the three parameters. Therefore, further investigation into factors such as sampling depth, overburden thickness, and shear wave velocity were essential to improve the predictive accuracy of nonlinear soil dynamic parameters.
4. Analyses of Influencing Factors on Soil Dynamic Parameters
In this study, five factors characterizing the geological and geophysical conditions at the soil sampling locations were analyzed, which were sampling depth (
D), shear wave velocity at the sampling depth (
VS), overburden thickness (
H), 30 m average shear wave velocity (
VS30), and 20 m equivalent shear wave velocity (
VSe) defined in the Chinese Code for Seismic Design of Buildings (GB 50011) [
21]. The influence of these factors on the soil dynamic parameters was analyzed, including reference shear strain (
γr), maximum damping ratio (
λmax), and damping ratio nonlinearity coefficient (
α).
4.1. Reference Shear Strain (γr)
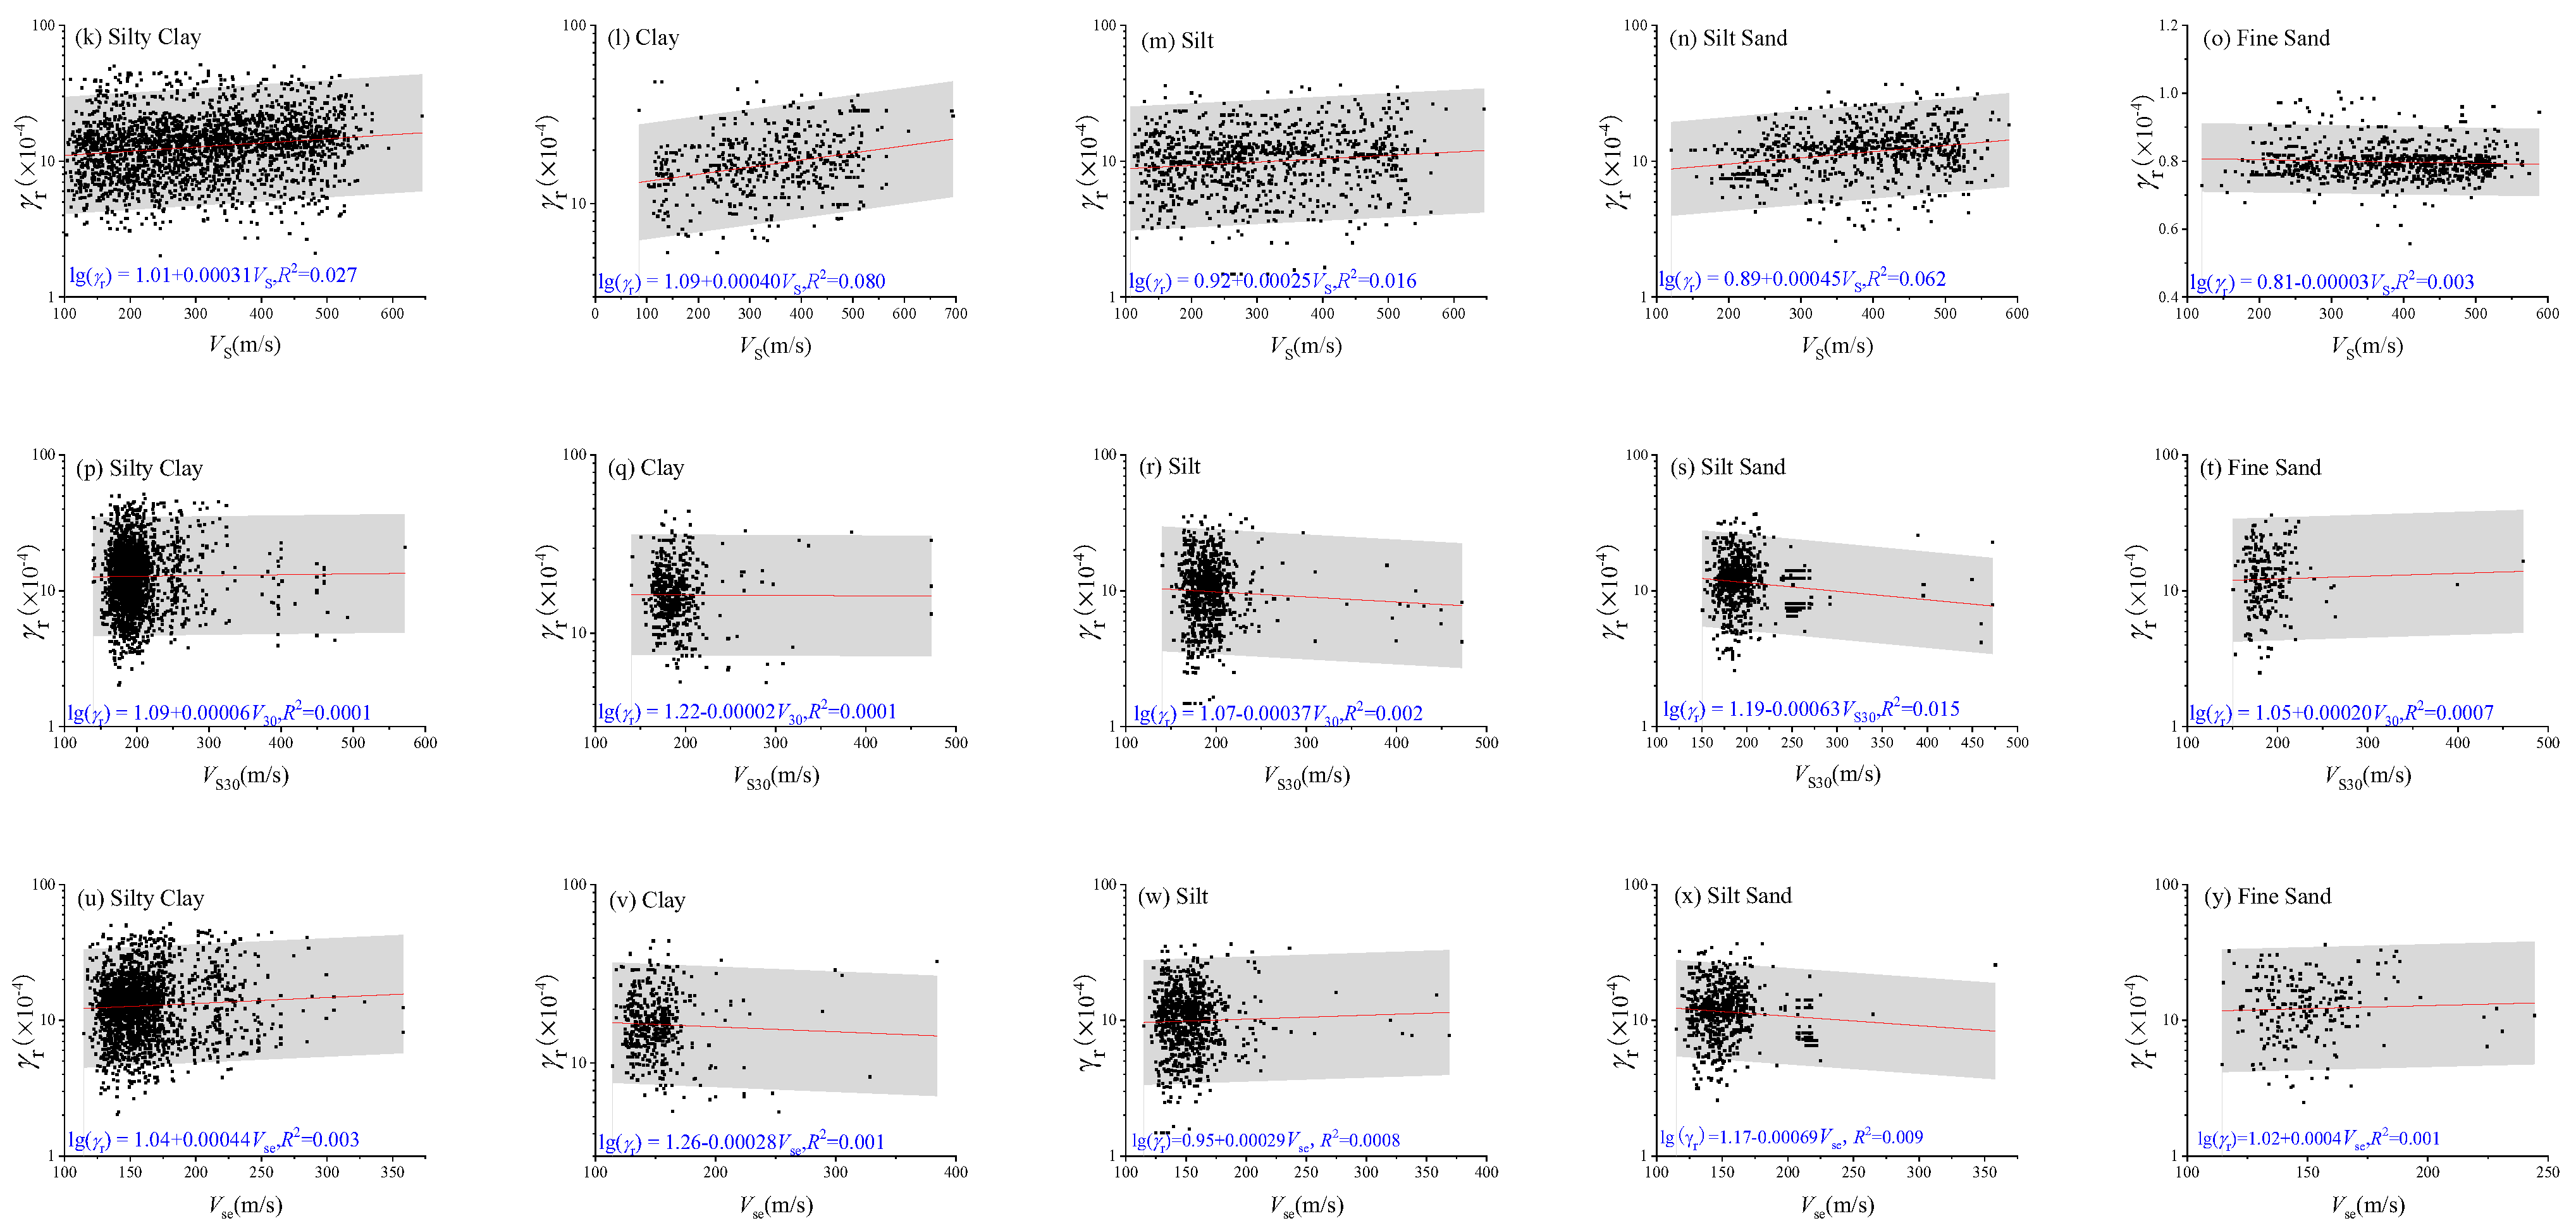
As shown in
Figure 4, the correlations between the reference shear strain (
γr) and various influencing factors exhibited considerable scatter. Despite the variability,
γr tended to increase notably with both sampling depth (
D) and the shear wave velocity (
VS) at the sampling depth across different soil types. In contrast, with increasing overburden thickness (
H), 30 m average shear wave velocity (
VS30), and 20 m equivalent shear wave velocity (
VSe), no clear patterns were observed for most soil types, except for silty clay, which showed a distinct trend.
4.2. Maximum Damping Ratio (λmax)
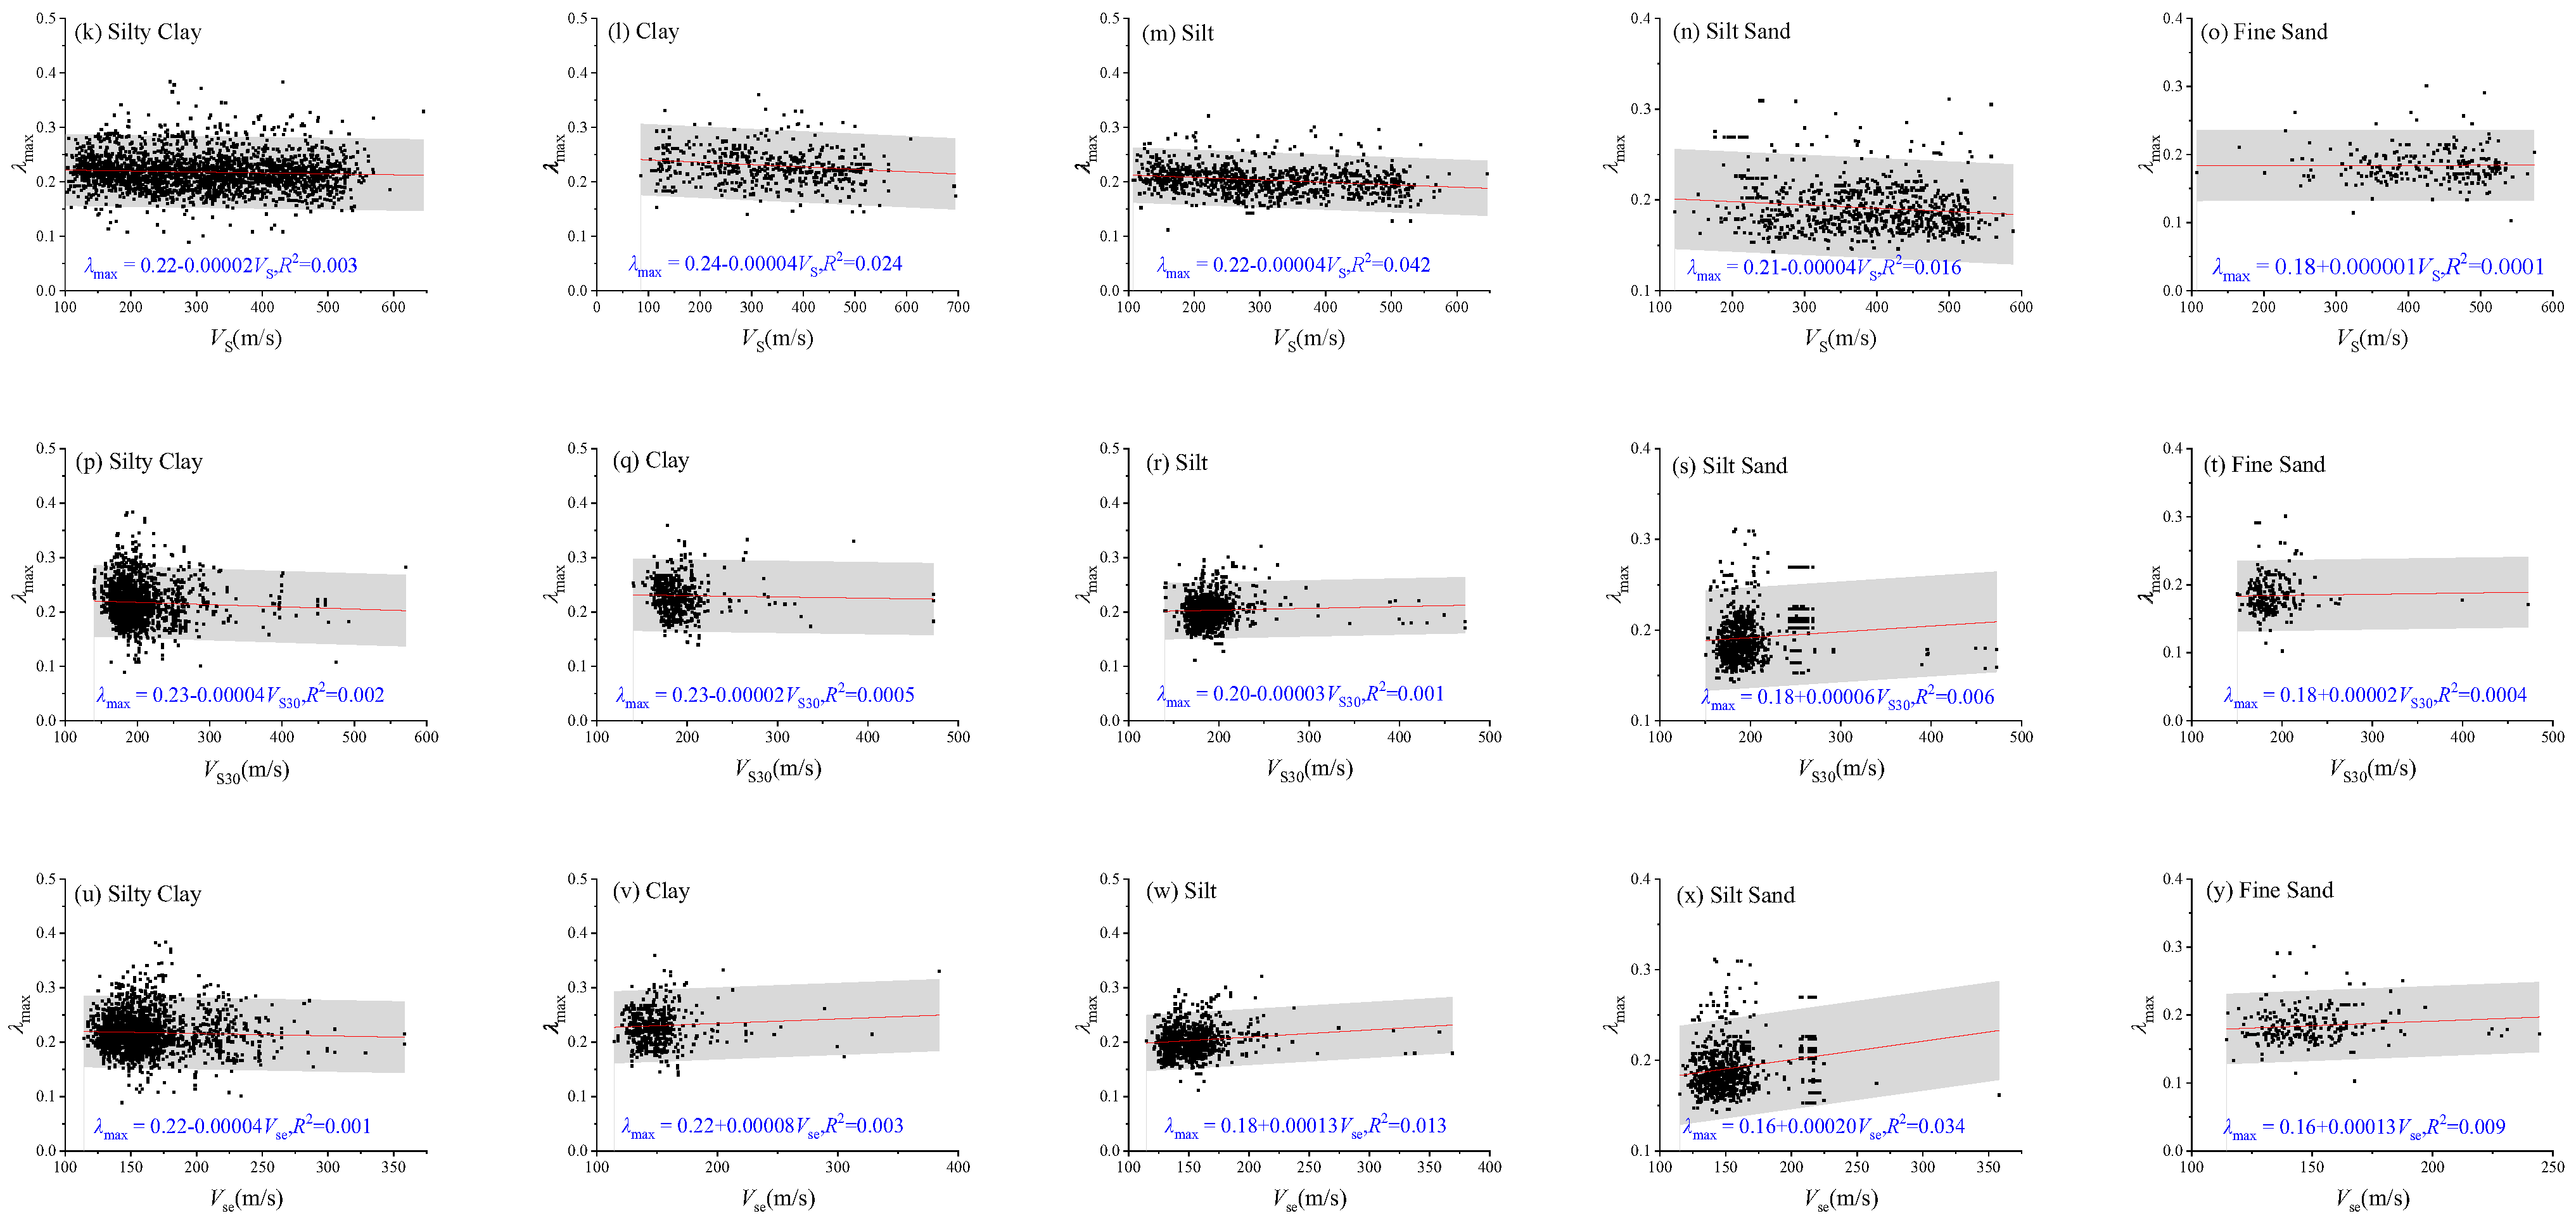
The correlation analyses between various influencing factors and the maximum ratio (
λmax), as presented in
Figure 5, revealed significant scatter across all soil types. Specifically,
λmax generally exhibited a weak decreasing trend with increasing sampling depth (
D) and shear wave velocity at the sampling depth (
VS) across most soil types, with the exception of fine sand. Conversely, a weak increasing trend of
λmax was observed with increasing overburden thickness (
H). Additionally, for 30 m average shear wave velocity (
VS30) and 20 m equivalent shear wave velocity (
VSe), most soil types showed a weak increasing trend in
λmax, except for silty clay, which demonstrated atypical behavior relative to these parameters.
4.3. Damping Ratio Nonlinearity Coefficient (α)
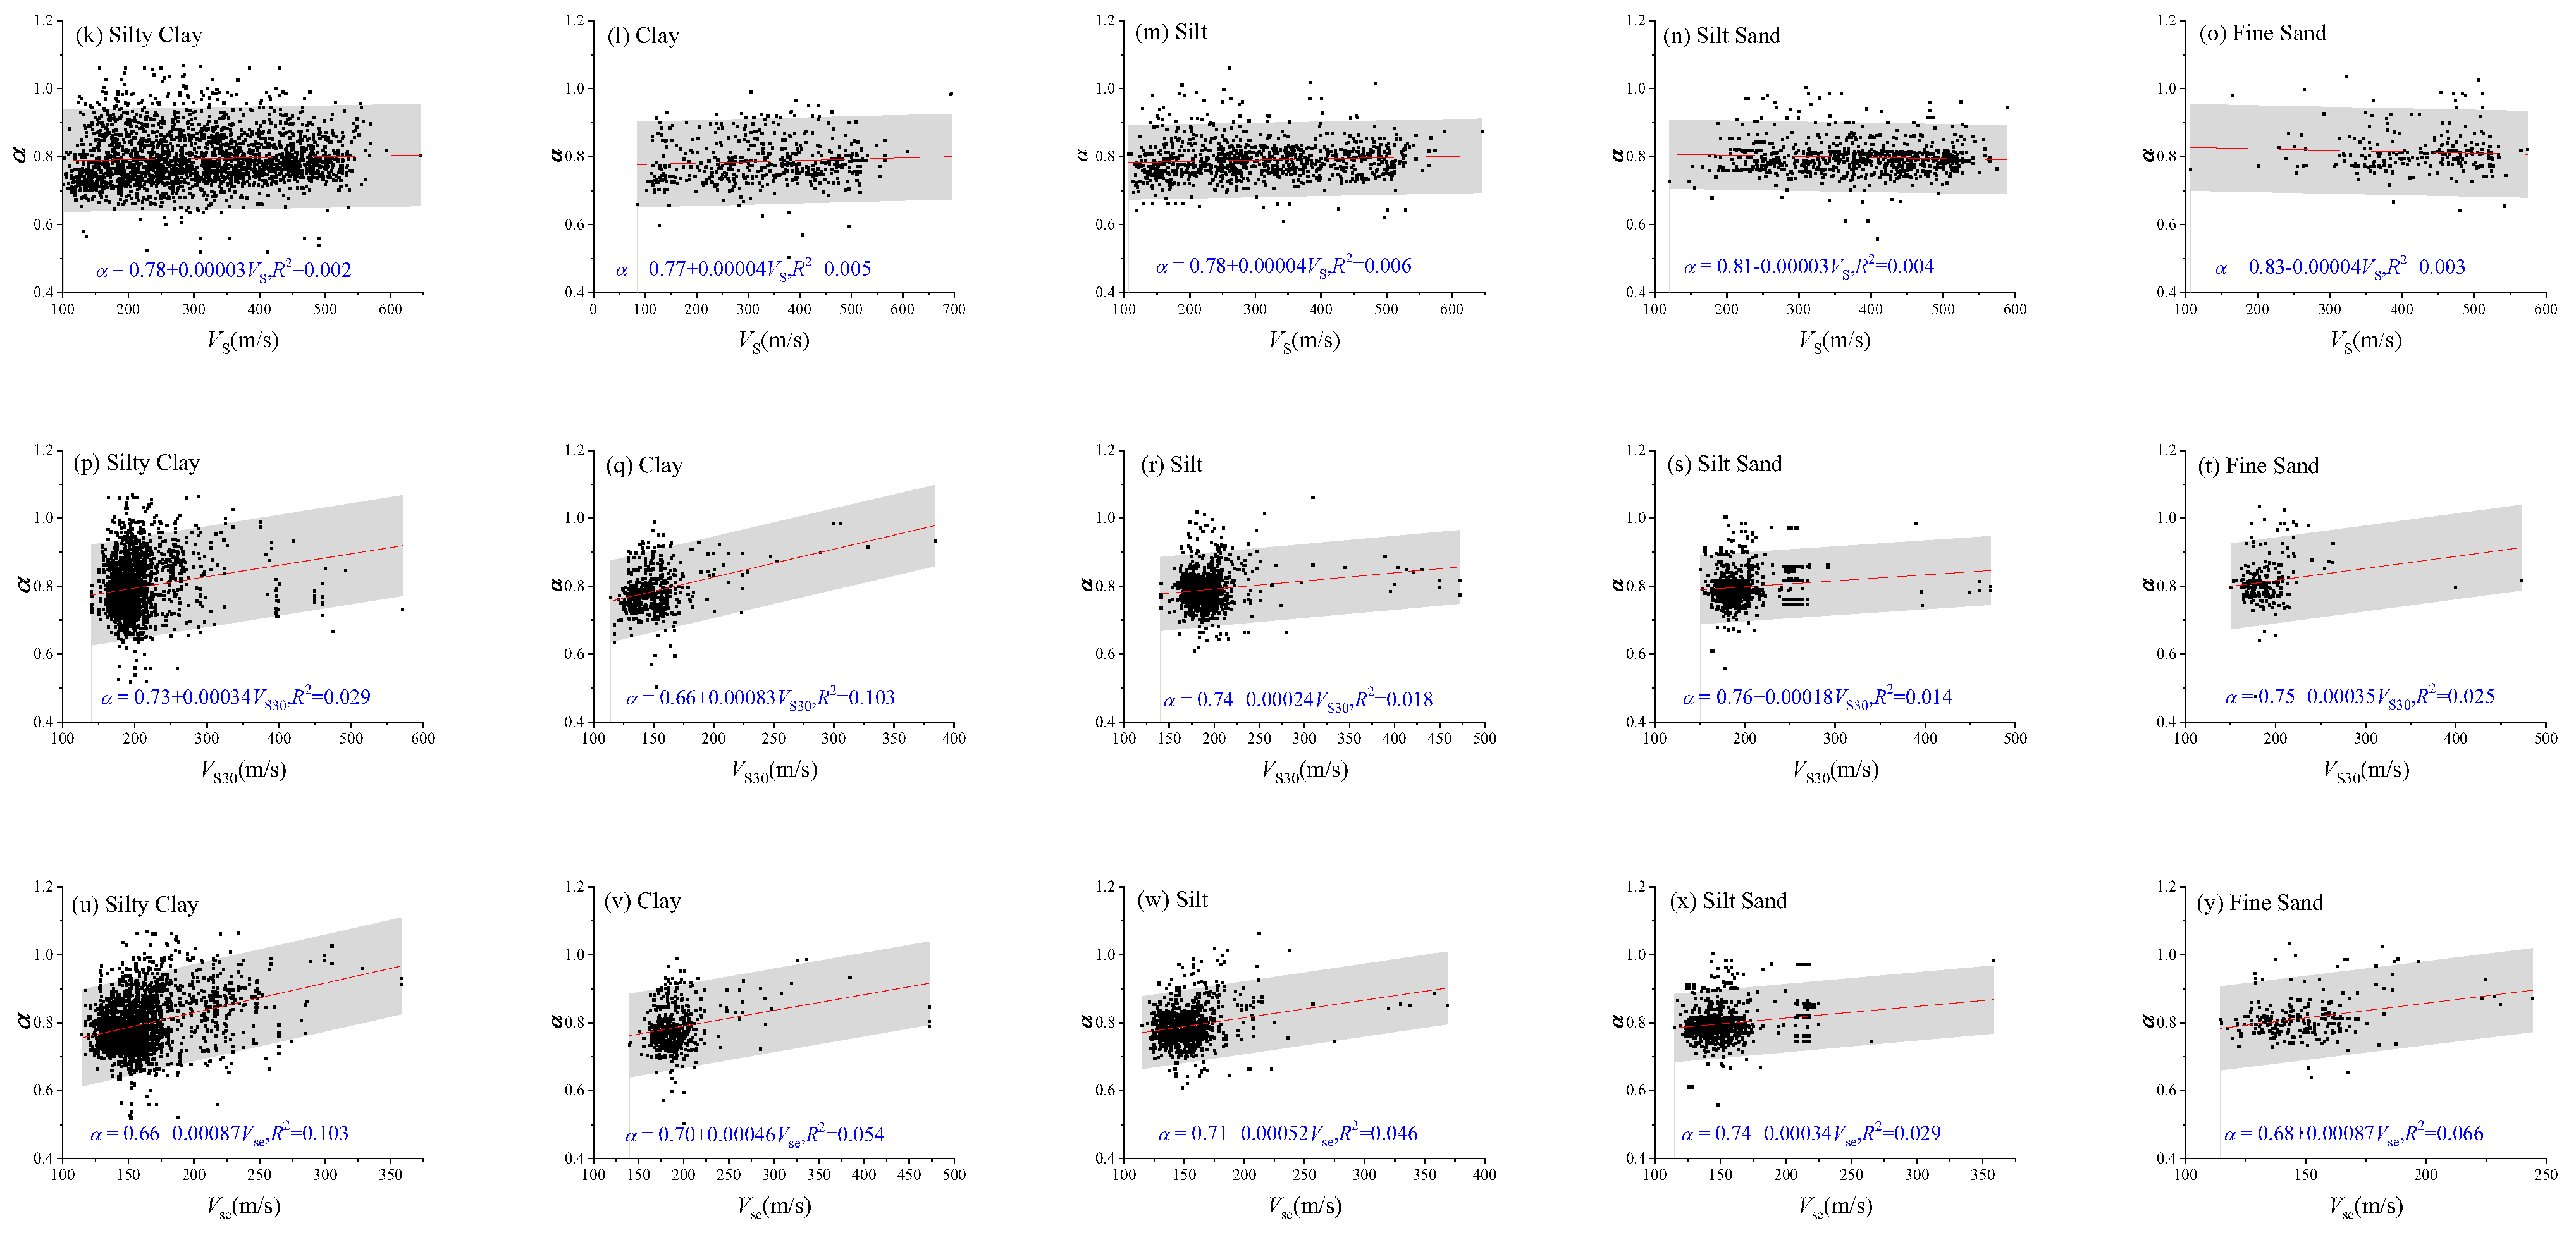
The correlation analyses between various influencing factors and damping ratio nonlinearity coefficient (
α), as presented in
Figure 6, also revealed significant scatter across all soil types. Specifically, no clear trend was observed between α and sampling depth (
D) or shear wave velocity at the sampling depth (
VS) across all soil types. Conversely,
α exhibited a weak decreasing trend with increasing overburden thickness (
H). Moreover,
α showed an increasing trend with increasing 30 m average shear wave velocity (
VS30) and 20 m equivalent shear wave velocity (
VSe).
4.4. Recommendations for the Selection of Soil Dynamic Parameters
Multivariate linear regressions were performed using two sets of input variables: one considering all the five influencing factors and the other one considering only two factors, which were sampling depth (D) and overburden thickness (H). The regression coefficients were used to estimate the predicted values and standard deviations of the soil dynamic parameters.
As shown by the standard deviations of the prediction models (
Table 2), the multiple linear regression model incorporating all five influencing factors achieved a slight reduction in standard deviation compared with directly adopting the mean values—by approximately 1.9–5.5% for reference shear strain (
γr), 0.3–3.9% for maximum damping ratio (
λmax), and 2.7–7.3% for the damping ratio nonlinearity coefficient (
α).
In contrast, when only sampling depth (D) and overburden thickness (H) were included in the regression model, the reduction in standard deviation was more limited, with corresponding improvements of approximately 1.4–5.2%, 0.0–1.8%, and 0.0–6.3%, respectively. These results indicated that incorporating multiple influencing factors in the prediction of soil dynamic parameters did not lead to a substantial improvement in accuracy compared with using mean values.
Figure 7 illustrates the correlations among reference shear strain (
γr), maximum damping ratio (
λmax), and damping ratio nonlinearity coefficient (α). As shown in the figure,
λmax increased noticeably with increasing reference shear strain (
γr), while the damping ratio nonlinearity coefficient (
α) showed a slight decrease with increasing reference shear strain (
γr) but a more evident increase with increasing maximum damping ratio (
λmax), except for fine sand.
Therefore, it was recommended that
γr,
λmax, and
α could be selected based on the median or mean values for each soil type. Alternatively, as shown in the linear regression equations in
Figure 7, the maximum damping ratio (
λmax) could be determined from the reference shear strain (
γr), and the damping ratio nonlinearity coefficient (
α) could be determined from the maximum damping ratio (
λmax). In either case, the variability of the data should be fully accounted for by incorporating the 84% and 16% exceedance probability values or by applying one standard deviation.
5. Impacts on Structural Seismic Analyses
To evaluate the impact of the variability in soil dynamic parameters on structural seismic analyses, a computational model was developed based on a selected borehole. The equivalent linearization method was applied to compute the acceleration time history of ground motions, followed by an analysis of the seismic response of an elastoplastic structural model.
5.1. One-Dimensional Borehole Model
The one-dimensional soil profile model and its corresponding parameters are summarized in
Table 3. The soil type, shear wave velocity, and density were based on in-situ measurements from borehole TJ0003. For each soil type, the reference shear strain (
γr), maximum damping ratio (
λmax), and damping ratio nonlinearity coefficient (α) were selected based on the median values, as well as the values corresponding to the 84% and 16% exceedance probabilities listed in
Table 1. These parameters were then used to determine the dynamic shear modulus ratio and dynamic damping ratio for each soil type. For cases where the dynamic shear modulus ratio was relatively large, the corresponding dynamic damping ratio was assigned a smaller value.
5.2. Two-Storied Structural Model
The structural model consisted of a two-storied reinforced concrete (RC) frame with a floor height of 3.0 m and a total of three spans. The side spans each had a length of 6.0 m, while the middle span measured 2.4 m. The structural model employed HPB300 steel [
23] for transverse reinforcement and HRB335 steel [
23] for longitudinal reinforcement, and the cement grade was C30 [
23]. The cross-sectional dimensions and reinforcement details of the beams and columns are illustrated in
Figure 8.
The open-source finite element software OpenSees version 3.8.0, widely recognized by international researchers, was employed as the computational platform for numerical modeling of the reinforced concrete frame structure. The modeling approach explicitly excluded non-structural elements. Concrete material was modeled using the Concrete02 material model, which accounts for the confinement effect provided by transverse reinforcement. Steel reinforcement was modeled using the Steel02 material model. Fiber sections were adopted for the cross-sections, and nonlinear beam–column elements based on force formulations were utilized. No special modeling was applied to beam–column joints, which were assumed to be rigidly connected. The column elements considered P-Delta effects, whereas the beam elements did not. Modal analysis results indicated that the fundamental period of the structure was approximately 0.43 s.
5.3. Analyses of Computational Results
Three target sets of spectral accelerations were selected, representing motions rich in short-period components, motions with balanced low- and high-frequency content, and motions rich in long-period components. Artificially synthesized ground motion time histories matching these target spectral accelerations were used as seismic inputs. The ground motion was calculated using a one-dimensional equivalent linear analysis program. The resulting spectral accelerations are shown in
Figure 9, where the black solid line denotes the spectral accelerations on bedrock site. As shown in
Figure 9, soft overburden layers significantly amplify longer-period components (0.3–0.5 s <
T < 2 s), with the amplification becoming more pronounced as the long-period content increased, while they substantially attenuates short-period motions. Regarding the selection of soil parameters, smaller dynamic shear modulus ratios and dynamic damping ratios (i.e., larger reference shear strain, smaller maximum damping ratio, and larger damping ratio nonlinearity coefficient) lead to greater suppression of short-period ground motions but stronger amplification of long-period components.
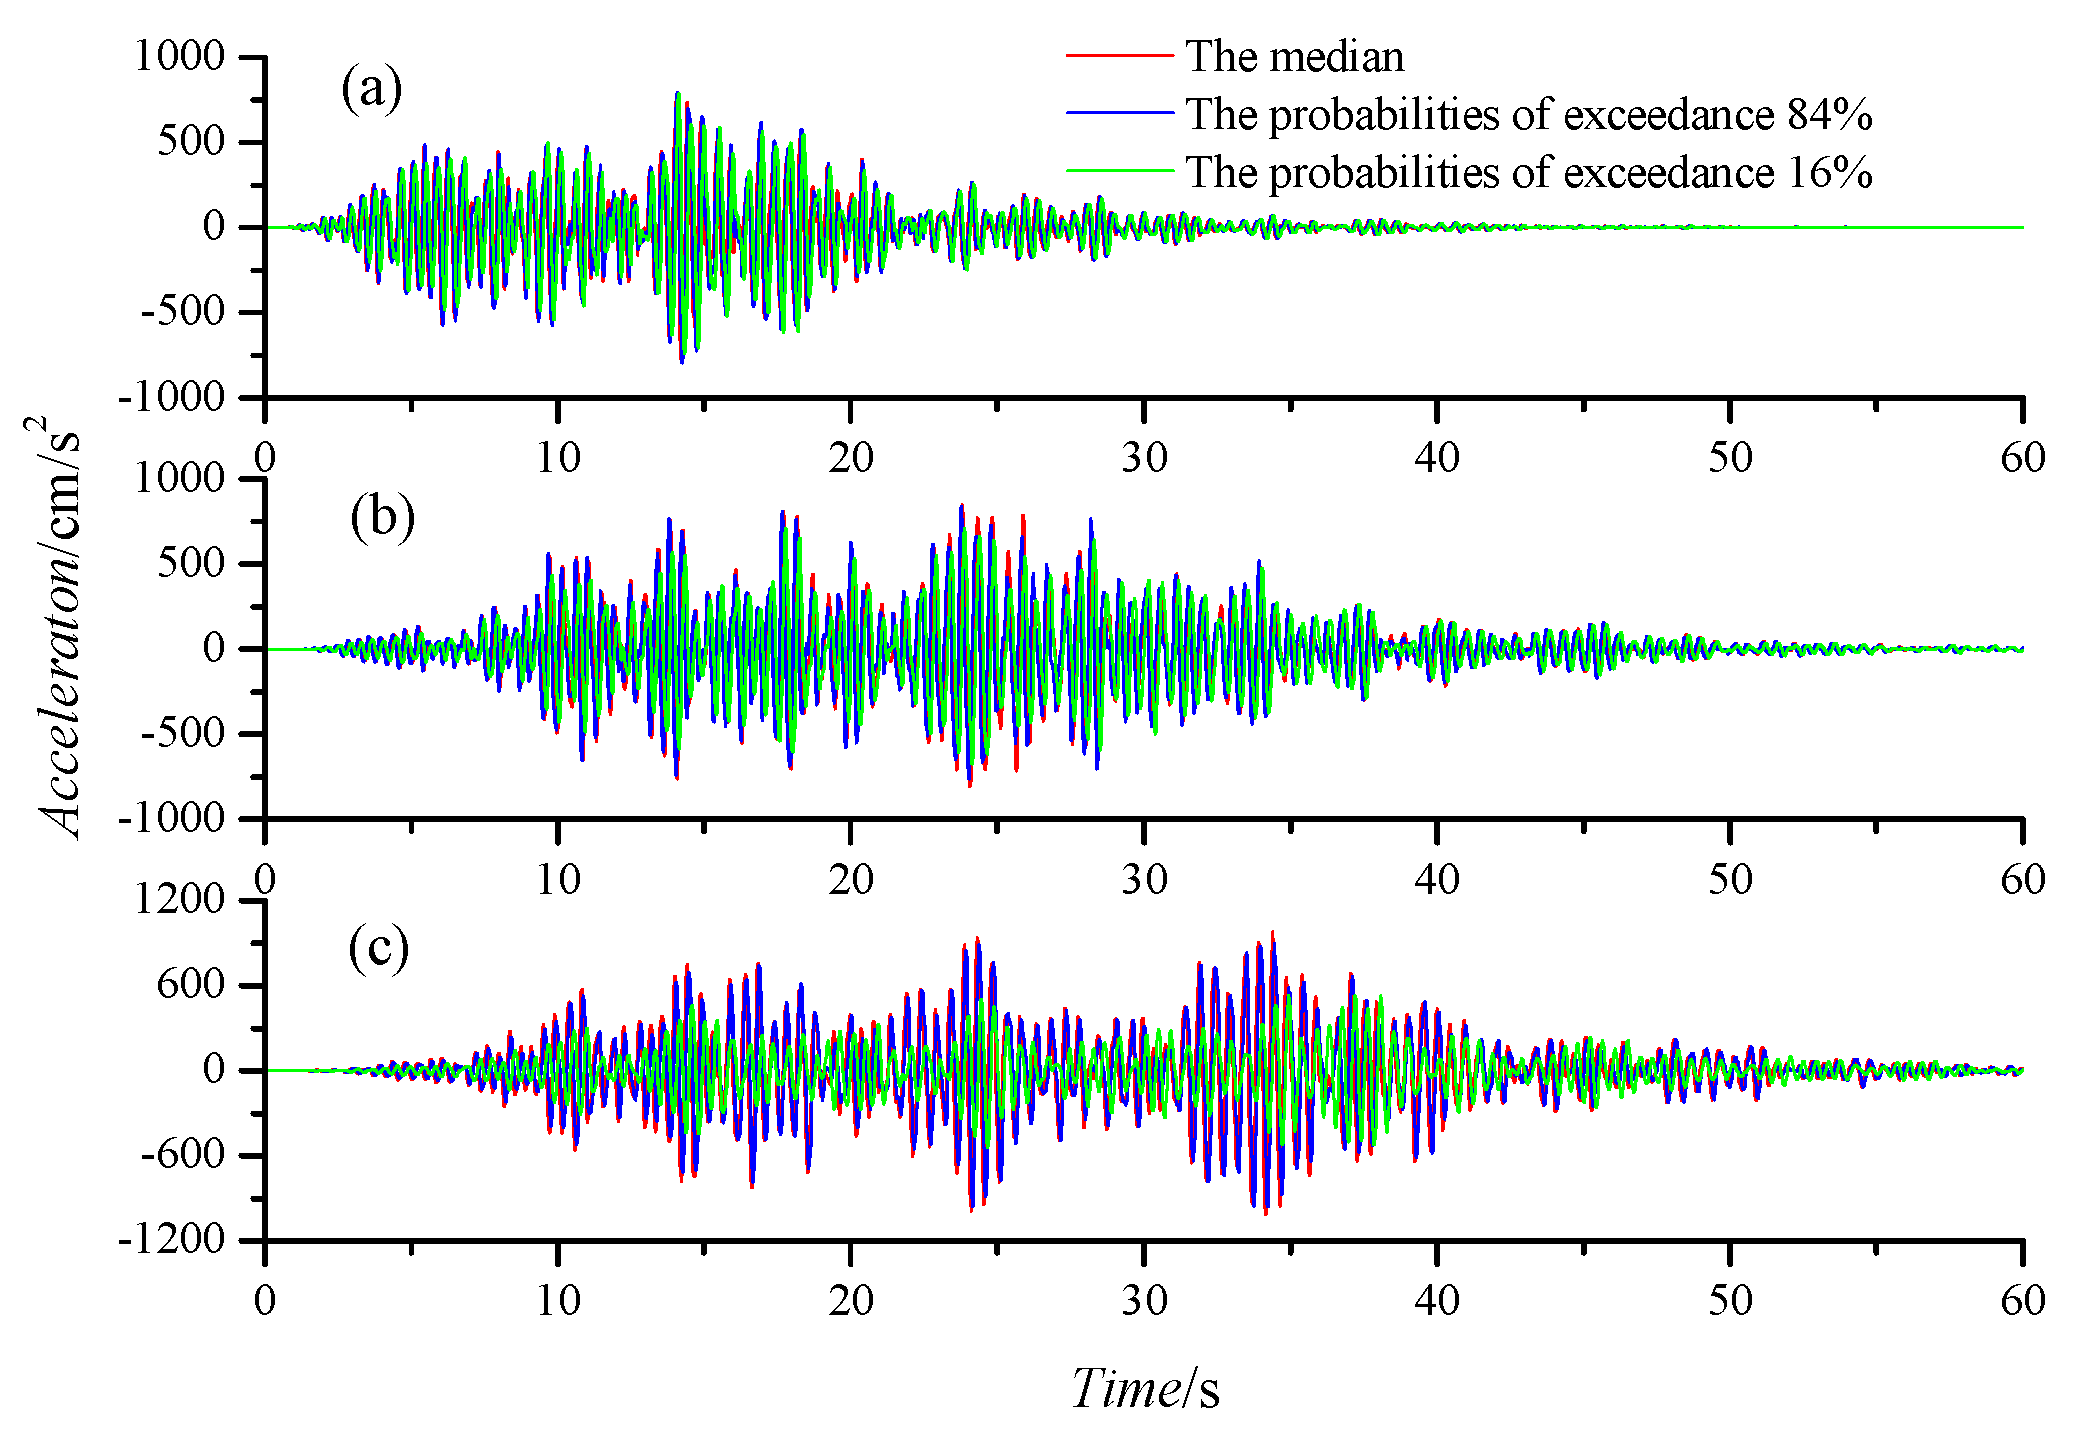
Using the acceleration time histories at the surface soil layer as input, seismic responses of the structural model were computed. The maximum seismic responses, represented by the rooftop acceleration time histories, are shown in
Figure 10. It was observed from the figure that, under identical bedrock ground motion inputs, differences in site soil dynamic parameters led to significant variations in the seismic responses of the same structure. Moreover, the magnitude of these disparities correlated directly with the spectral characteristics of the input motions, exhibiting progressively more pronounced variations as the long-period content of ground motions intensified. For the three sets of ground motion inputs, the maximum inter-storey drift ratios of the structural model differed by up to 3.6%, 18.4%, and 54.5%, respectively. This indicated that variations in soil dynamic parameters have a non-negligible impact on the seismic response of structures founded on these soils.
6. Comparisons
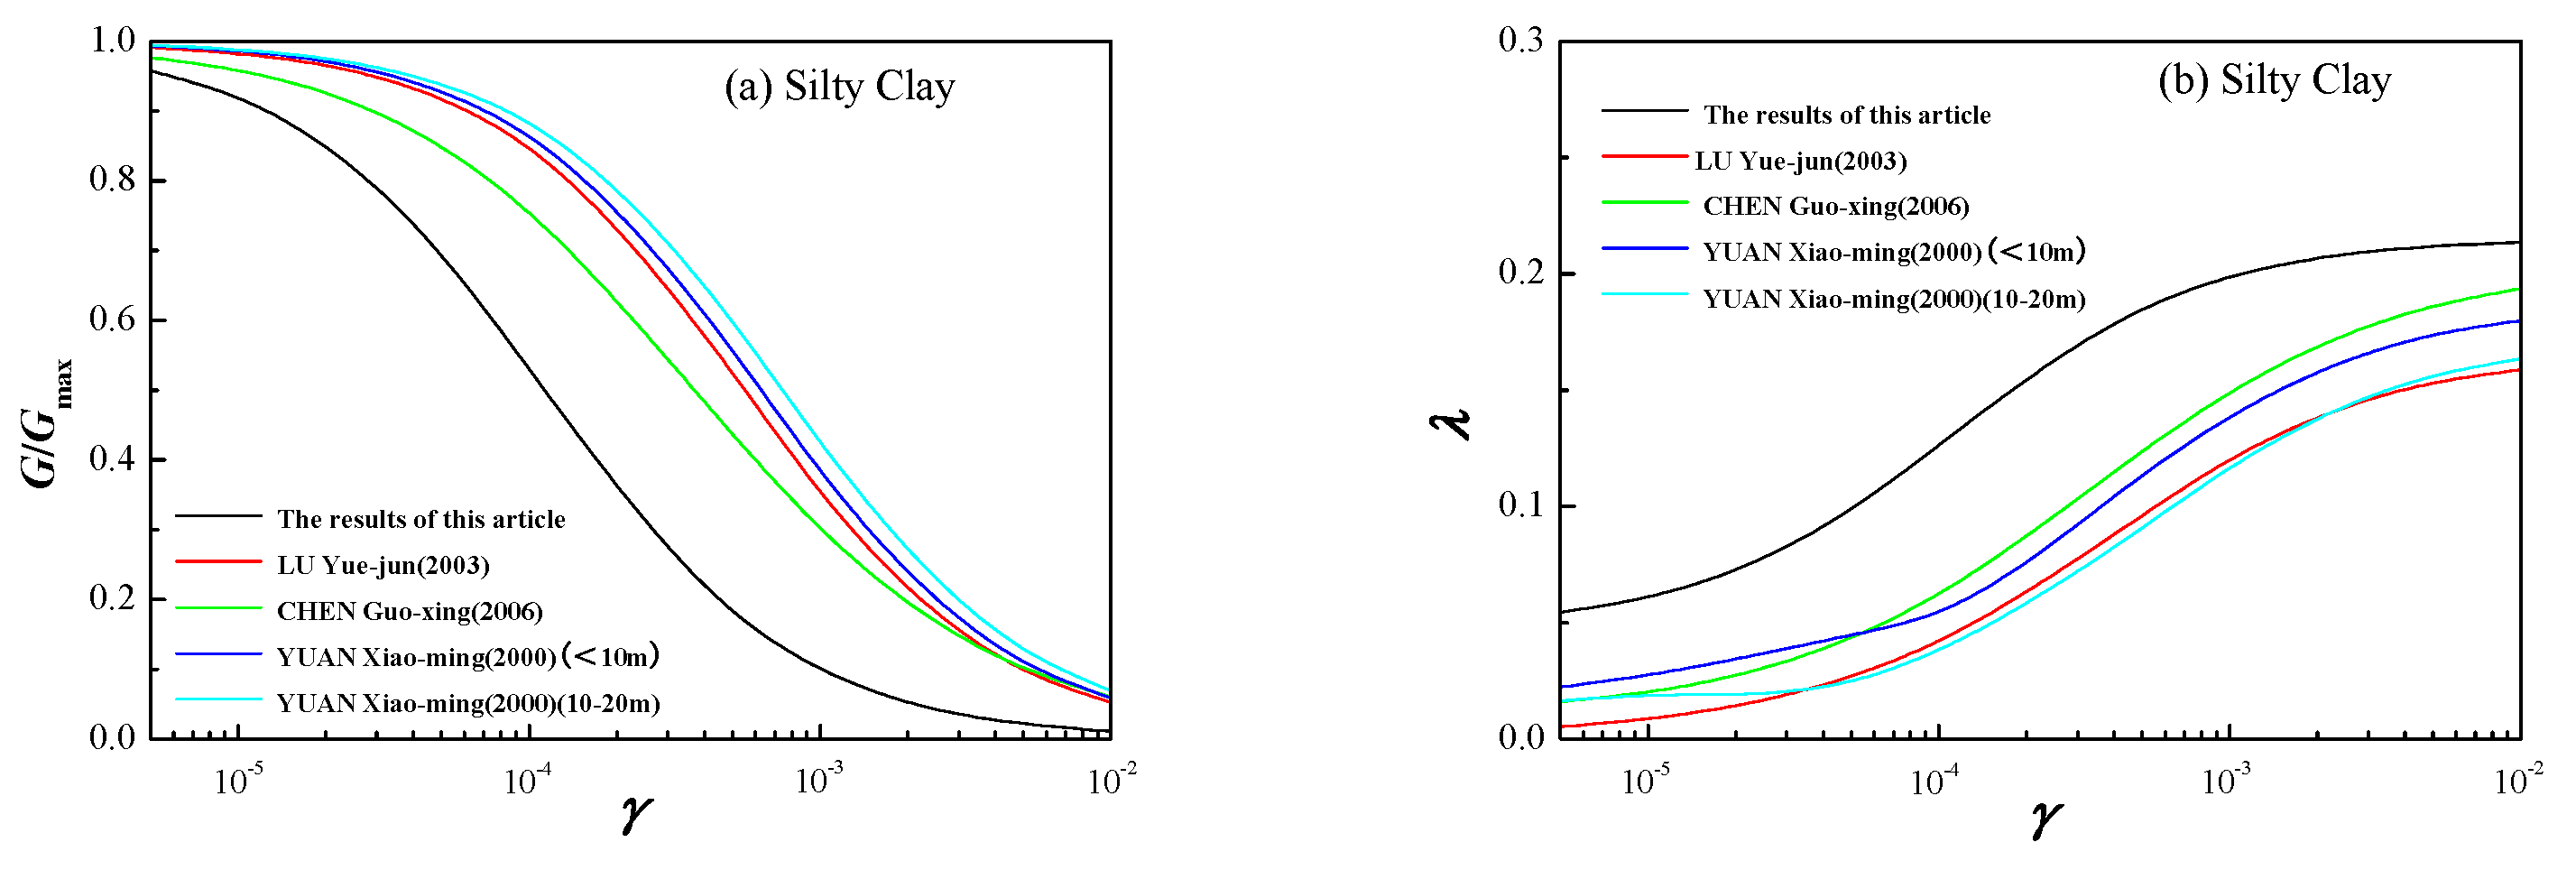
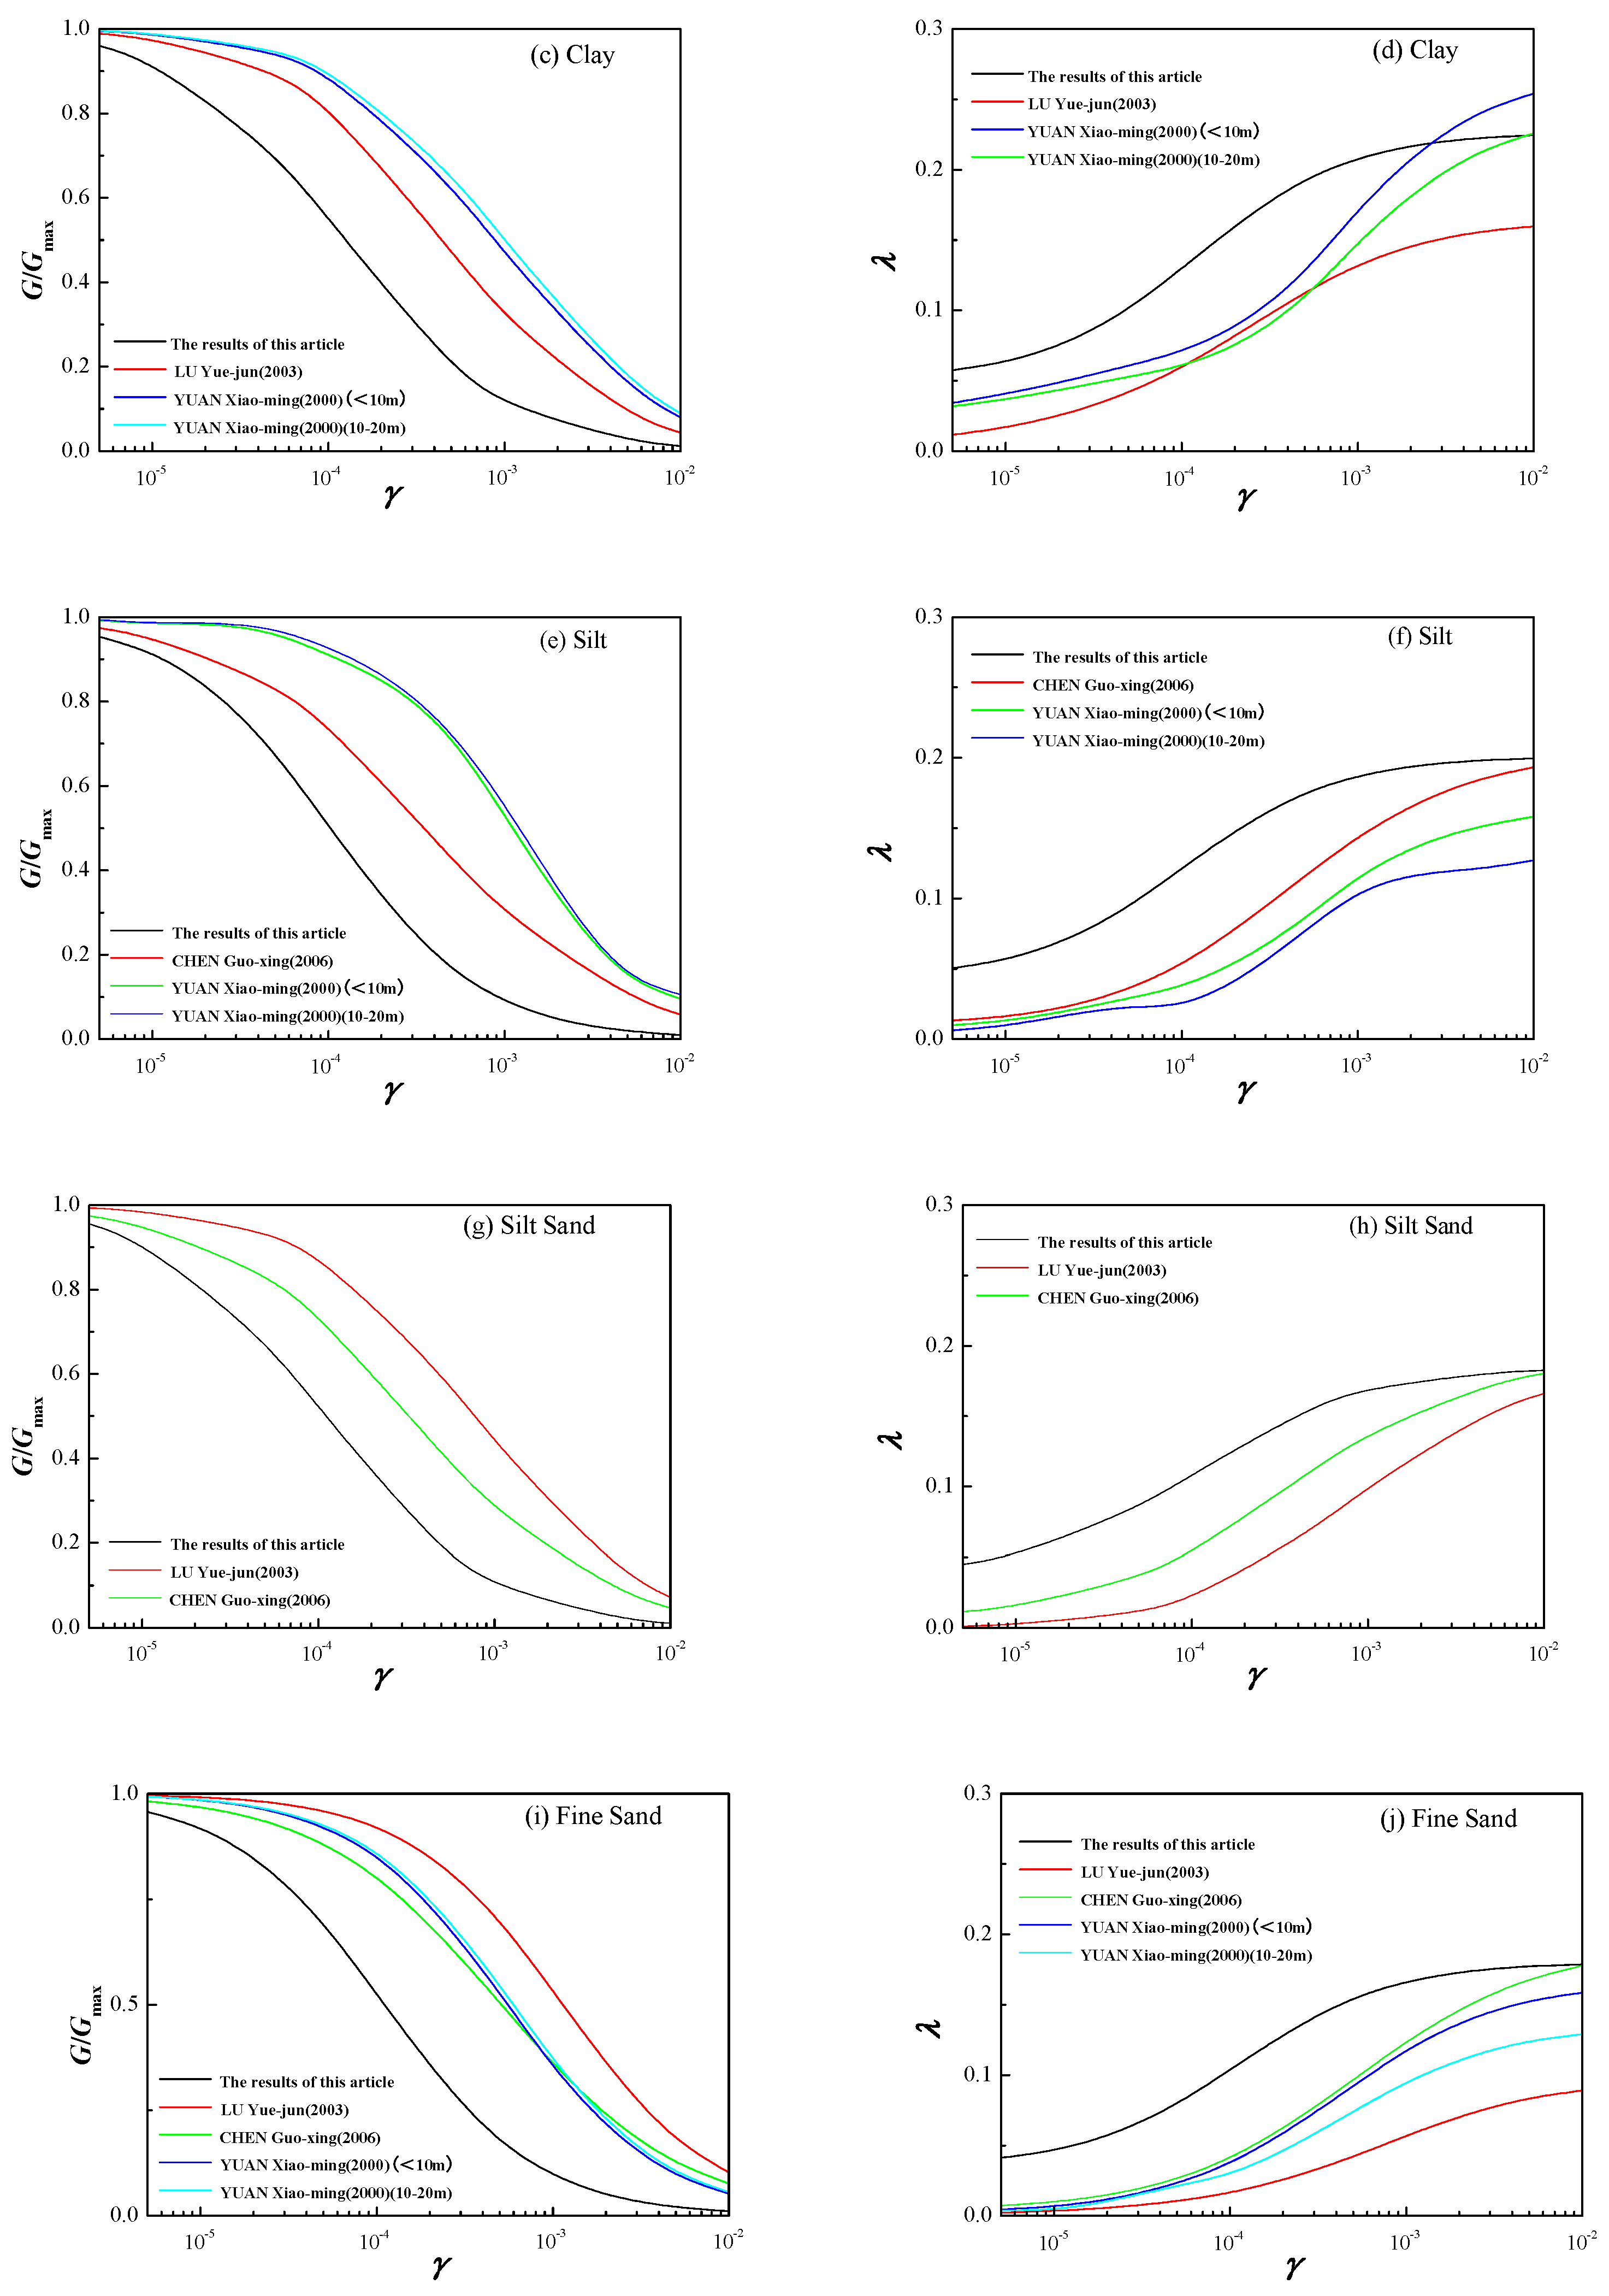
Compared with results from other studies (
Figure 11), the dynamic shear modulus ratios and dynamic damping ratios of site soils derived from the statistical values of reference shear strain, maximum damping ratio, and damping ratio nonlinearity coefficient provided herein were noticeably smaller, while the dynamic damping ratios were significantly larger. Significance testing between this study and the proximate curves in other studies was performed by two-side
t-tests. For clay and silt, the proximate curves were derived from soil samples in Bohai [
18], while for the other three soil types, the proximate curves were derived from soil samples in Nanjing [
6]. The
t-test result (
Table 4) showed that there were significant differences between the maximum damping ratio (
λmax) given in this study and those in other studies for clay and silty sand, and there were significant differences between the damping ratio nonlinearity coefficient (
α) given in this study and those in other studies for silty clay, silt, silty sand, and fine sand, meaning the dynamic shear modulus ratios and dynamic damping ratios given in this study were significantly different from those in other studies at the inspection level of 5%. This observation underscores that soil dynamic properties were intrinsically linked to sedimentary environments, exhibiting distinct regional specificity. Consequently, the conclusions of this study were applicable primarily to Class III and IV building sites in the northern part of the North China Plain. Their applicability to other site classes and other regions required further verification.
7. Conclusions and Discussions
Statistical analyses of over 5000 sets of soil dynamic test data from the BTH region indicated that soil dynamic parameters such as reference shear strain, maximum damping ratio, and damping ratio nonlinearity coefficient exhibited significant variability. These parameters showed certain correlations with site geological and geotechnical factors including sampling depth, shear wave velocity at the sampling depth, overburden thickness, 30 m average shear wave velocity, and 20 m equivalent shear wave velocity. However, these correlations were generally weak, and multivariate linear regression did not significantly reduce the dispersion of the predictive models. For borehole site models where only stratigraphic logs and velocity data were available but no laboratory soil dynamic test data, it was recommended to adopt the median values of reference shear strain, maximum damping ratio, and damping ratio nonlinearity coefficient to account for soil nonlinearity while using the 84% and 16% exceedance probability values to incorporate the observed parameter variability.
Numerical modeling results indicated that variability in soil dynamic parameters had a clear impact on site seismic response, especially on the short-period portion of the spectral acceleration, and also influenced the seismic response of overlying structures. Consequently, the effects of parameter variability should be considered in site seismic response analyses. Moreover, the specific influence patterns of soil dynamic parameter variability on both borehole site models and structural seismic response depend on the characteristics of the site models and structural models. Thus, the conclusions derived from the case-specific numerical simulations presented herein lacked universality and should be interpreted within their modeling constraints.
In summary, given the strong variability of soil dynamic parameters revealed by the statistical data, it was recommended that laboratory tests on soil samples be conducted for each engineering site to obtain the site-specific dynamic shear modulus ratio and dynamic damping ratio curves. For Class III and IV building sites in the BTH region where no laboratory soil tests had been performed, the dynamic shear modulus ratio and dynamic damping ratio curves could be determined according to
Table 1 of this study while explicitly accounting for parameter uncertainties.
This study had the limitation that the statistical data on Class I1 and II building sites were insufficient, so the reliability of the statistical results in the BTH northwestern mountainous regions needed to be modified by more data. Furthermore, the statistical result that the soil dynamic shear modulus ratio and dynamic damping ratio were slightly related with site parameters including the sampling depth and the shear wave velocity at the sampling depth could not be explained by current understandings. More data were needed in order to discover the primary factor influencing the soil dynamic parameters and improve the accuracy of their prediction models.
Author Contributions
Conceptualization and data preparation, P.L.; methodology and program, X.L.; influencing factors analysis and supervision, Y.W.; site seismic analysis and visualization, L.W.; structural seismic analysis, Z.S. All authors have read and agreed to the published version of the manuscript.
Funding
This research was funded by Science for Earthquake Resilience of China, grant number XH24053A, National Key R&D Program of China, grant number 2022YFC3003503, and National Natural Science Foundation of China, grant number 52192675.
Data Availability Statement
The raw data supporting the conclusions of this article will be made available by the authors on request.
Acknowledgments
During the preparation of this study, the authors used the strong motion data from National Earthquake Data Center, China; the structural seismic analysis program of open-source finite element software OpenSees version 3.8.0. The authors have reviewed and edited the output and take full responsibility for the content of this publication.
Conflicts of Interest
The authors declare no conflicts of interest.
References
- Seed, H.B.; Idriss, I.M. Soil Moduli and Damping Factors for Dynamic Response Analyses; Technical Report No. EERC-70-10; Earthquake Engineering Research Center, University of California: Berkeley, CA, USA, 1970. [Google Scholar]
- Hardin, B.O.; Drnevich, V.P. Shear Modulus and Damping in Soils: Design Equations and Curves. J. Soil Mech. Found. Div. 1972, 98, 667–692. [Google Scholar] [CrossRef]
- Martin, P.P.; Seed, H.B. One-Dimensional Dynamic Ground Response Analyses. J. Geotech. Eng. Div. 1982, 108, 935–952. [Google Scholar] [CrossRef]
- Xie, D.Y. Soil Dynamics; Xi’an Jiaotong University Press: Xi’an, China, 1988. [Google Scholar]
- Hu, Y.X. Technical Manual for Seismic Safety Assessment; Seismological Press: Beijing, China, 1999. [Google Scholar]
- Chen, G.X.; Liu, X.Z.; Zhu, D.H.; Hu, Q.X. Experimental Studies on Dynamic Shear Modulus Ratio and Damping Ratio of Recently Deposited Soils in Nanjing. Chin. J. Geotech. Eng. 2006, 28, 1023–1027. [Google Scholar] [CrossRef]
- Yuan, X.M.; Sun, R.; Sun, J.; Meng, S.J.; Shi, Z.J. Laboratory Experimental Study on Dynamic Shear Modulus Ratio and Damping Ratio of Soils. Earthquake Eng. Eng. Vibration 2000, 19, 133–139. [Google Scholar] [CrossRef]
- Chen, G.X.; Liu, X.Z. Testing Study on Ratio of Dynamic Shear Moduli and Ratio of Damping for Recently Deposited Soils in Nanjing and Its Neighboring Areas. Chin. J. Rock Mech. Eng. 2004, 23, 1403–1410. [Google Scholar] [CrossRef]
- Chen, G.X.; Liu, X.Z.; Zhu, D.H.; Hu, Q.X. Study on Dynamic Characteristics of Recently Deposited Soils in Southern Area of Jiangsu Province. Chin. J. Undergr. Space Eng. 2005, 1, 161–164. [Google Scholar] [CrossRef]
- Shi, C.H.; Lü, Y.J.; Peng, Y.J. Statistical Analysis of Dynamic Parameters of Silty Clay in Beijing Area. Technol. Earthq. Disaster Prev. 2009, 4, 69–74. [Google Scholar] [CrossRef]
- Liu, H.S.; Chen, P.Y.; Sun, Q.Q.; Song, D.S. Analysis of Non-linear Dynamic Parameters of the Cohesive Soil in the Xiong’an New District. Seismol. Res. 2024, 47, 273–279. [Google Scholar] [CrossRef]
- Chen, G.X.; Wang, B.H.; Liu, J.D. Experimental Study on Dynamic Shear Modulus and Damping Ratio of Recently Deposited Soils. Chin. J. Undergr. Space Eng. 2008, 3, 539–543+594. [Google Scholar] [CrossRef]
- Zhang, Y.J.; Lan, H.L.; Cui, Y.G. Statistical Studies on Shear Modulus Ratios and Damping Ratios of Soil in Shanghai Area. World Earthquake Eng. 2010, 26, 171–175. [Google Scholar]
- Lian, Y.P.; Zhang, Y.; Cai, H.T.; Zhang, J.; Zheng, S.; Zhao, Z.; Wei, F. Testing Study on the Dynamic Properties of Typical Soils in Zhangzhou Area, Fujian Province. Northwest Seismol. J. 2010, 32, 363–366. [Google Scholar] [CrossRef]
- Cai, H.T.; Li, Y.M.; Ou, B.S. Testing Study of Dynamic Shear Modulus and Damping Ratio of Typical Soils in Fuzhou Area. Rock Soil Mech. 2010, 31, 361–365. [Google Scholar] [CrossRef]
- Shi, B.X.; Zhang, L.F.; Lü, Y.J.; Qian, H.T.; Peng, Y.J. Research on Dynamic Parameters of Soil Site in Tianjin Coastal Area. Technol. Earthq. Disaster Prev. 2010, 5, 288–298. [Google Scholar] [CrossRef]
- Xia, F.; Song, C.K.; Meng, Q.X. Analysis of Soil Dynamic Parameters of Overburden in the Tianjin Area. China Earthq. Eng. J. 2015, 37, 48–54. [Google Scholar] [CrossRef]
- Lu, Y.J.; Tang, R.Y.; Sha, H.J. Experimental Study on Dynamic Shear Modulus Ratio and Damping Ratio of the Soils of Bohai Seafloor. J. Disaster Prev. Mitig. Eng. 2003, 23, 35–42. [Google Scholar] [CrossRef]
- Wu, Q.; Xiao, X.; Zhu, E.; Chen, S.; Chen, G.; Du, X. Experimental Investigation on Dynamic Shear Modulus of Undisturbed Marine Soils in the East Coast of China. Ocean Eng. 2023, 289, 116130. [Google Scholar] [CrossRef]
- Wu, Z.; Zhang, D.; Zhao, T.; Ma, J.; Zhao, D. An Experimental Research on Damping Ratio and Dynamic Shear Modulus Ratio of Frozen Silty Clay of the Qinghai–Tibet Engineering Corridor. Transp. Geotech. 2019, 21, 100269. [Google Scholar] [CrossRef]
- GB 50011–2010; Ministry of Housing and Urban-Rural Development of the PRC. Code for Seismic Design of Buildings. Construction Standard of China: Beijing, China, 2024.
- He, W.M.; Li, D.Q.; Yang, J.; Li, Y.Q. Recent Progress in Research on Dynamic Shear Modulus, Damping Ratio, and Poisson Ratio of Soils. China Earthq. Eng. J. 2016, 38, 309–317. [Google Scholar] [CrossRef]
- GB/T50010-2010; Ministry of Housing and Urban-Rural Development of the PRC. Code for Design of Concrete Structures. Construction Standard of China: Beijing, China, 2024.
Figure 1.
Spatial distribution of boreholes corresponding to soil sample data. (a) The borehole distribution on a topographic map; (b) The borehole distribution on a population density map.
Figure 1.
Spatial distribution of boreholes corresponding to soil sample data. (a) The borehole distribution on a topographic map; (b) The borehole distribution on a population density map.
Figure 2.
Relationship between site parameters of soil samples. (a) The relationship between sampling depth and shear wave velocity at the corresponding locations; (b) The relationship between site overburden thickness and the 20-m equivalent shear wave velocity.
Figure 2.
Relationship between site parameters of soil samples. (a) The relationship between sampling depth and shear wave velocity at the corresponding locations; (b) The relationship between site overburden thickness and the 20-m equivalent shear wave velocity.
Figure 3.
Distributions of dynamic parameters for silty clay, clay, silt, silty sand, and fine sand.
Figure 3.
Distributions of dynamic parameters for silty clay, clay, silt, silty sand, and fine sand.
Figure 4.
Correlations between influencing factors and reference shear strain (γr). (a–e) Relationship between sampling depth (D) and γr; (f–j) relationship between overburden thickness (H) and γr; (k–o) relationship between shear wave velocity at sampling depth (VS) and γr; (p–t) relationship between 30 m average shear wave velocity (VS30) and γr; (u–y) relationship between 20 m equivalent shear wave velocity (VSe) and γr. 16–84% confidence intervals are shown as gray shadows.
Figure 5.
Correlations between influencing factors and maximum damping ratio (λmax). (a–e) Relationship between sampling depth (D) and maximum damping ratio (λmax); (f–j) relationship between overburden thickness (H) and maximum damping ratio (λmax); (k–o) relationship between shear wave velocity at sampling depth (VS) and maximum damping ratio (λmax); (p–t) relationship between 30 m average shear wave velocity (VS30) and maximum damping ratio (λmax); (u–y) relationship between 20 m equivalent shear wave velocity (VSe) and maximum damping ratio (λmax). 16–84% confidence intervals are shown as gray shadows.
Figure 6.
Correlations between influencing factors and damping ratio nonlinearity coefficient (α). (a–e) Relationship between sampling depth (D) and α; (f–j) relationship between overburden thickness (H) and α; (k–o) relationship between shear wave velocity at sampling depth (VS) and α; (p–t) relationship between 30 m average shear wave velocity (VS30) and α; (u–y) relationship between 20 m equivalent shear wave velocity (VSe) and α. 16–84% confidence intervals are shown as gray shadows.
Figure 7.
Correlations among reference shear strain (γr), maximum damping ratio (λmax), and damping ratio nonlinearity coefficient (α). (a–e) Correlation between maximum damping ratio (λmax) and reference shear strain (γr); (f–j) correlation between damping ratio nonlinearity coefficient (α) and reference shear strain (γr); (k–o) correlation between damping ratio nonlinearity coefficient (α) and maximum damping ratio (λmax). 16–84% confidence intervals are shown as gray shadows.
Figure 8.
Cross-sections and reinforcement details of beams and columns in the two-storey reinforced concrete frame structure. (a) Beam of side span; (b) beam of middle span; (c) column.
Figure 8.
Cross-sections and reinforcement details of beams and columns in the two-storey reinforced concrete frame structure. (a) Beam of side span; (b) beam of middle span; (c) column.
Figure 9.
Site response acceleration spectra of input ground motions and surface soil layer motions. (a) Short-period dominant, M = 6; (b) balanced frequency content, M = 7; (c) long-period dominant, M = 8.
Figure 9.
Site response acceleration spectra of input ground motions and surface soil layer motions. (a) Short-period dominant, M = 6; (b) balanced frequency content, M = 7; (c) long-period dominant, M = 8.
Figure 10.
Roof acceleration time histories of structural seismic response. (a) Short-period dominant, M = 6; (b) balanced frequency content, M = 7; (c) long-period dominant, M = 8.
Figure 10.
Roof acceleration time histories of structural seismic response. (a) Short-period dominant, M = 6; (b) balanced frequency content, M = 7; (c) long-period dominant, M = 8.
Figure 11.
Comparison of dynamic shear modulus ratio and dynamic damping ratio with other studies.
Figure 11.
Comparison of dynamic shear modulus ratio and dynamic damping ratio with other studies.
Table 1.
Statistical characteristics of dynamic parameters for silty clay, clay, silt, silty sand, and fine sand.
Table 1.
Statistical characteristics of dynamic parameters for silty clay, clay, silt, silty sand, and fine sand.
| No. | Soil Type | Reference Strain γr (×10−4) | Maximum Damping
Ratio λmax | Damping Ratio
Nonlinearity Coefficient α |
|---|
| Median | 84% | 16% | Median | 84% | 16% | Median | 84% | 16% |
|---|
| 1 | Silty Clay | 13.43 | 19.96 | 7.64 | 0.2155 | 0.2452 | 0.1886 | 0.7799 | 0.7228 | 0.8693 |
| 2 | Clay | 16.47 | 23.93 | 11.19 | 0.2266 | 0.2610 | 0.1993 | 0.7772 | 0.7331 | 0.8501 |
| 3 | Silt | 10.64 | 16.13 | 5.66 | 0.2012 | 0.2234 | 0.1790 | 0.7856 | 0.7434 | 0.8323 |
| 4 | Silty Sand | 11.98 | 16.43 | 7.97 | 0.1842 | 0.2133 | 0.1676 | 0.7911 | 0.7593 | 0.8373 |
| 5 | Fine Sand | 12.73 | 20.71 | 6.94 | 0.1803 | 0.2062 | 0.1644 | 0.8064 | 0.7711 | 0.8587 |
Table 2.
Standard deviations of different prediction methods.
Table 2.
Standard deviations of different prediction methods.
| No. | Soil Type | Reference Shear Strain (γr) | Maximum Damping Ratio (λmax) | Damping Ratio Nonlinearity Coefficient (α) |
|---|
| Mean | 5-Var Reg | 2-Var Reg | Mean | 5-Var Reg | 2-Var Reg | Mean | 5-Var Reg | 2-Var Reg |
|---|
| 1 | Silty Clay | 0.2176 | 0.2134 | 0.2142 | 0.0328 | 0.0327 | 0.0327 | 0.0750 | 0.0704 | 0.0747 |
| 2 | Clay | 0.1686 | 0.1597 | 0.1598 | 0.0330 | 0.0317 | 0.0324 | 0.0629 | 0.0583 | 0.0628 |
| 3 | Silt | 0.2293 | 0.2244 | 0.2261 | 0.0257 | 0.0250 | 0.0254 | 0.0546 | 0.0525 | 0.0535 |
| 4 | Silty Sand | 0.1776 | 0.1678 | 0.1686 | 0.0277 | 0.0267 | 0.0275 | 0.0507 | 0.0495 | 0.0507 |
| 5 | Fine Sand | 0.2257 | 0.2182 | 0.2212 | 0.0259 | 0.0257 | 0.0259 | 0.0636 | 0.0600 | 0.0632 |
Table 3.
Parameters of the borehole model for calculation.
Table 3.
Parameters of the borehole model for calculation.
| No. | Layer Thickness (m) | Soil Type Code | Soil Type | Shear Wave Velocity (m/s) | Density (g/cm3) |
|---|
| 1 | 4.0 | 1 | Silty Clay | 125 | 1.85 |
| 2 | 3.7 | 1 | Silty Clay | 133 | 1.85 |
| 3 | 8.1 | 2 | Clay | 165 | 1.85 |
| 4 | 8.4 | 1 | Silty Clay | 236 | 1.90 |
| 5 | 7.2 | 1 | Silty Clay | 266 | 1.90 |
| 6 | 6.3 | 2 | Clay | 288 | 1.90 |
| 7 | 7.1 | 3 | Silt | 288 | 1.90 |
| 8 | 5.6 | 4 | Silty Sand | 303 | 1.95 |
| 9 | 6.2 | 4 | Silty Sand | 355 | 1.95 |
| 10 | 8.2 | 5 | Fine Sand | 412 | 1.95 |
| 11 | 11.7 | 3 | Clay | 450 | 1.98 |
| 12 | 7.4 | 1 | Silty Clay | 465 | 1.98 |
| 13 | 8.0 | 3 | Silt | 465 | 1.98 |
| 14 | 10.5 | 5 | Fine Sand | 515 | 2.05 |
Table 4.
t-tests between this study and the proximate curve in other studies.
Table 4.
t-tests between this study and the proximate curve in other studies.
| Soil Type | Parameter | Mean Value of Proximate Study | Degree of Freedom | t Value | t (p < 0.05) Value |
|---|
| Silty Clay | lg(γr/10−4) | 0.8062 | | 1.479 | 1.964 |
| λmax | 0.2065 | 564 | 0.274 |
| α | 0.9354 | | 2.073 |
| Clay | lg(γr/10−4) | 0.6568 | | 3.321 | 1.961 |
| λmax | 0.1736 | 2483 | 1.606 |
| α | 0.8742 | | 1.542 |
| Silt | lg(γr/10−4) | 0.7892 | | 1.037 | 1.962 |
| λmax | 0.2028 | 1029 | 0.062 |
| α | 0.9714 | | 3.403 |
| Silty Sand | lg(γr/10−4) | 0.6936 | | 2.167 | 1.963 |
| λmax | 0.1886 | 876 | 0.159 |
| α | 0.9671 | | 3.471 |
| Fine Sand | lg(γr/10−4) | 0.9154 | | 0.839 | 1.969 |
| λmax | 0.1917 | 256 | 0.440 |
| α | 0.9792 | | 2.717 |
| Disclaimer/Publisher’s Note: The statements, opinions and data contained in all publications are solely those of the individual author(s) and contributor(s) and not of MDPI and/or the editor(s). MDPI and/or the editor(s) disclaim responsibility for any injury to people or property resulting from any ideas, methods, instructions or products referred to in the content. |
© 2025 by the authors. Licensee MDPI, Basel, Switzerland. This article is an open access article distributed under the terms and conditions of the Creative Commons Attribution (CC BY) license (https://creativecommons.org/licenses/by/4.0/).
