1. Introduction
Steel-reinforced concrete members play a key role in the construction industry since they are crucial components of various kinds of structures, from residential houses to high-rise buildings or mega-dams [
1,
2]. Even though steel has numerous superior features that allow it to become a perfect partner of concrete, it can be attacked by chemicals and its structural durability will be reduced, especially in the case of marine structures. Under environmental factors such as chemical attacks or oxidation, steel bars can be deteriorated, leading to the load-carrying capacity of concrete structures declining [
3]. These phenomena contribute to reducing the service life of structures and increasing maintenance costs. To cope with this problem, fiber-reinforced polymer (FRP) bars are utilized to replace traditional steel bars in concrete elements, since they have a lightweight nature, high tensile strength, and a strong capability of chemical resistance [
4,
5,
6]. However, fire can have certain influences on the behavior of FRP-reinforced concrete structures [
7,
8,
9], which can limit the application of FRP as reinforcing bars.
Among FRP-reinforced concrete structures, FRP-reinforced concrete beams have drawn great attention from researchers with different kinds of studies on their behavior [
10,
11,
12,
13,
14,
15,
16,
17,
18,
19]. Notably, FRP bars used to reinforce concrete beams are manufactured mainly from basalt-fiber-reinforced polymer (BFRP) and glass-fiber-reinforced polymer (GFRP). The application of carbon-fiber-reinforced polymer (CFRP) bars as a type of reinforcement of concrete beams is quite limited due to their expensive cost. FRP is a brittle material with a linear stress–strain relationship, and the tensile strength and the elastic modulus of FRP bars (BFRP and GFRP) are in the range from 0.48 GPa to 4.9 GPa and 51.7 GPa to 110 GPa [
4,
20], respectively. In contrast, steel is a ductile material with an elastic–plastic stress–strain relationship and a much higher elastic modulus. Hence, the behavior and the failure mechanism of beams reinforced with steel and FRP are different. In addition, a comprehensive design process needs to be established for FRP-reinforced concrete beams, as they consist of two brittle materials (concrete and FRP bars). Currently, the design of FRP-reinforced concrete beams can be found in ACI 440.1R [
21], CSA S806 [
22], or CEB-FIB [
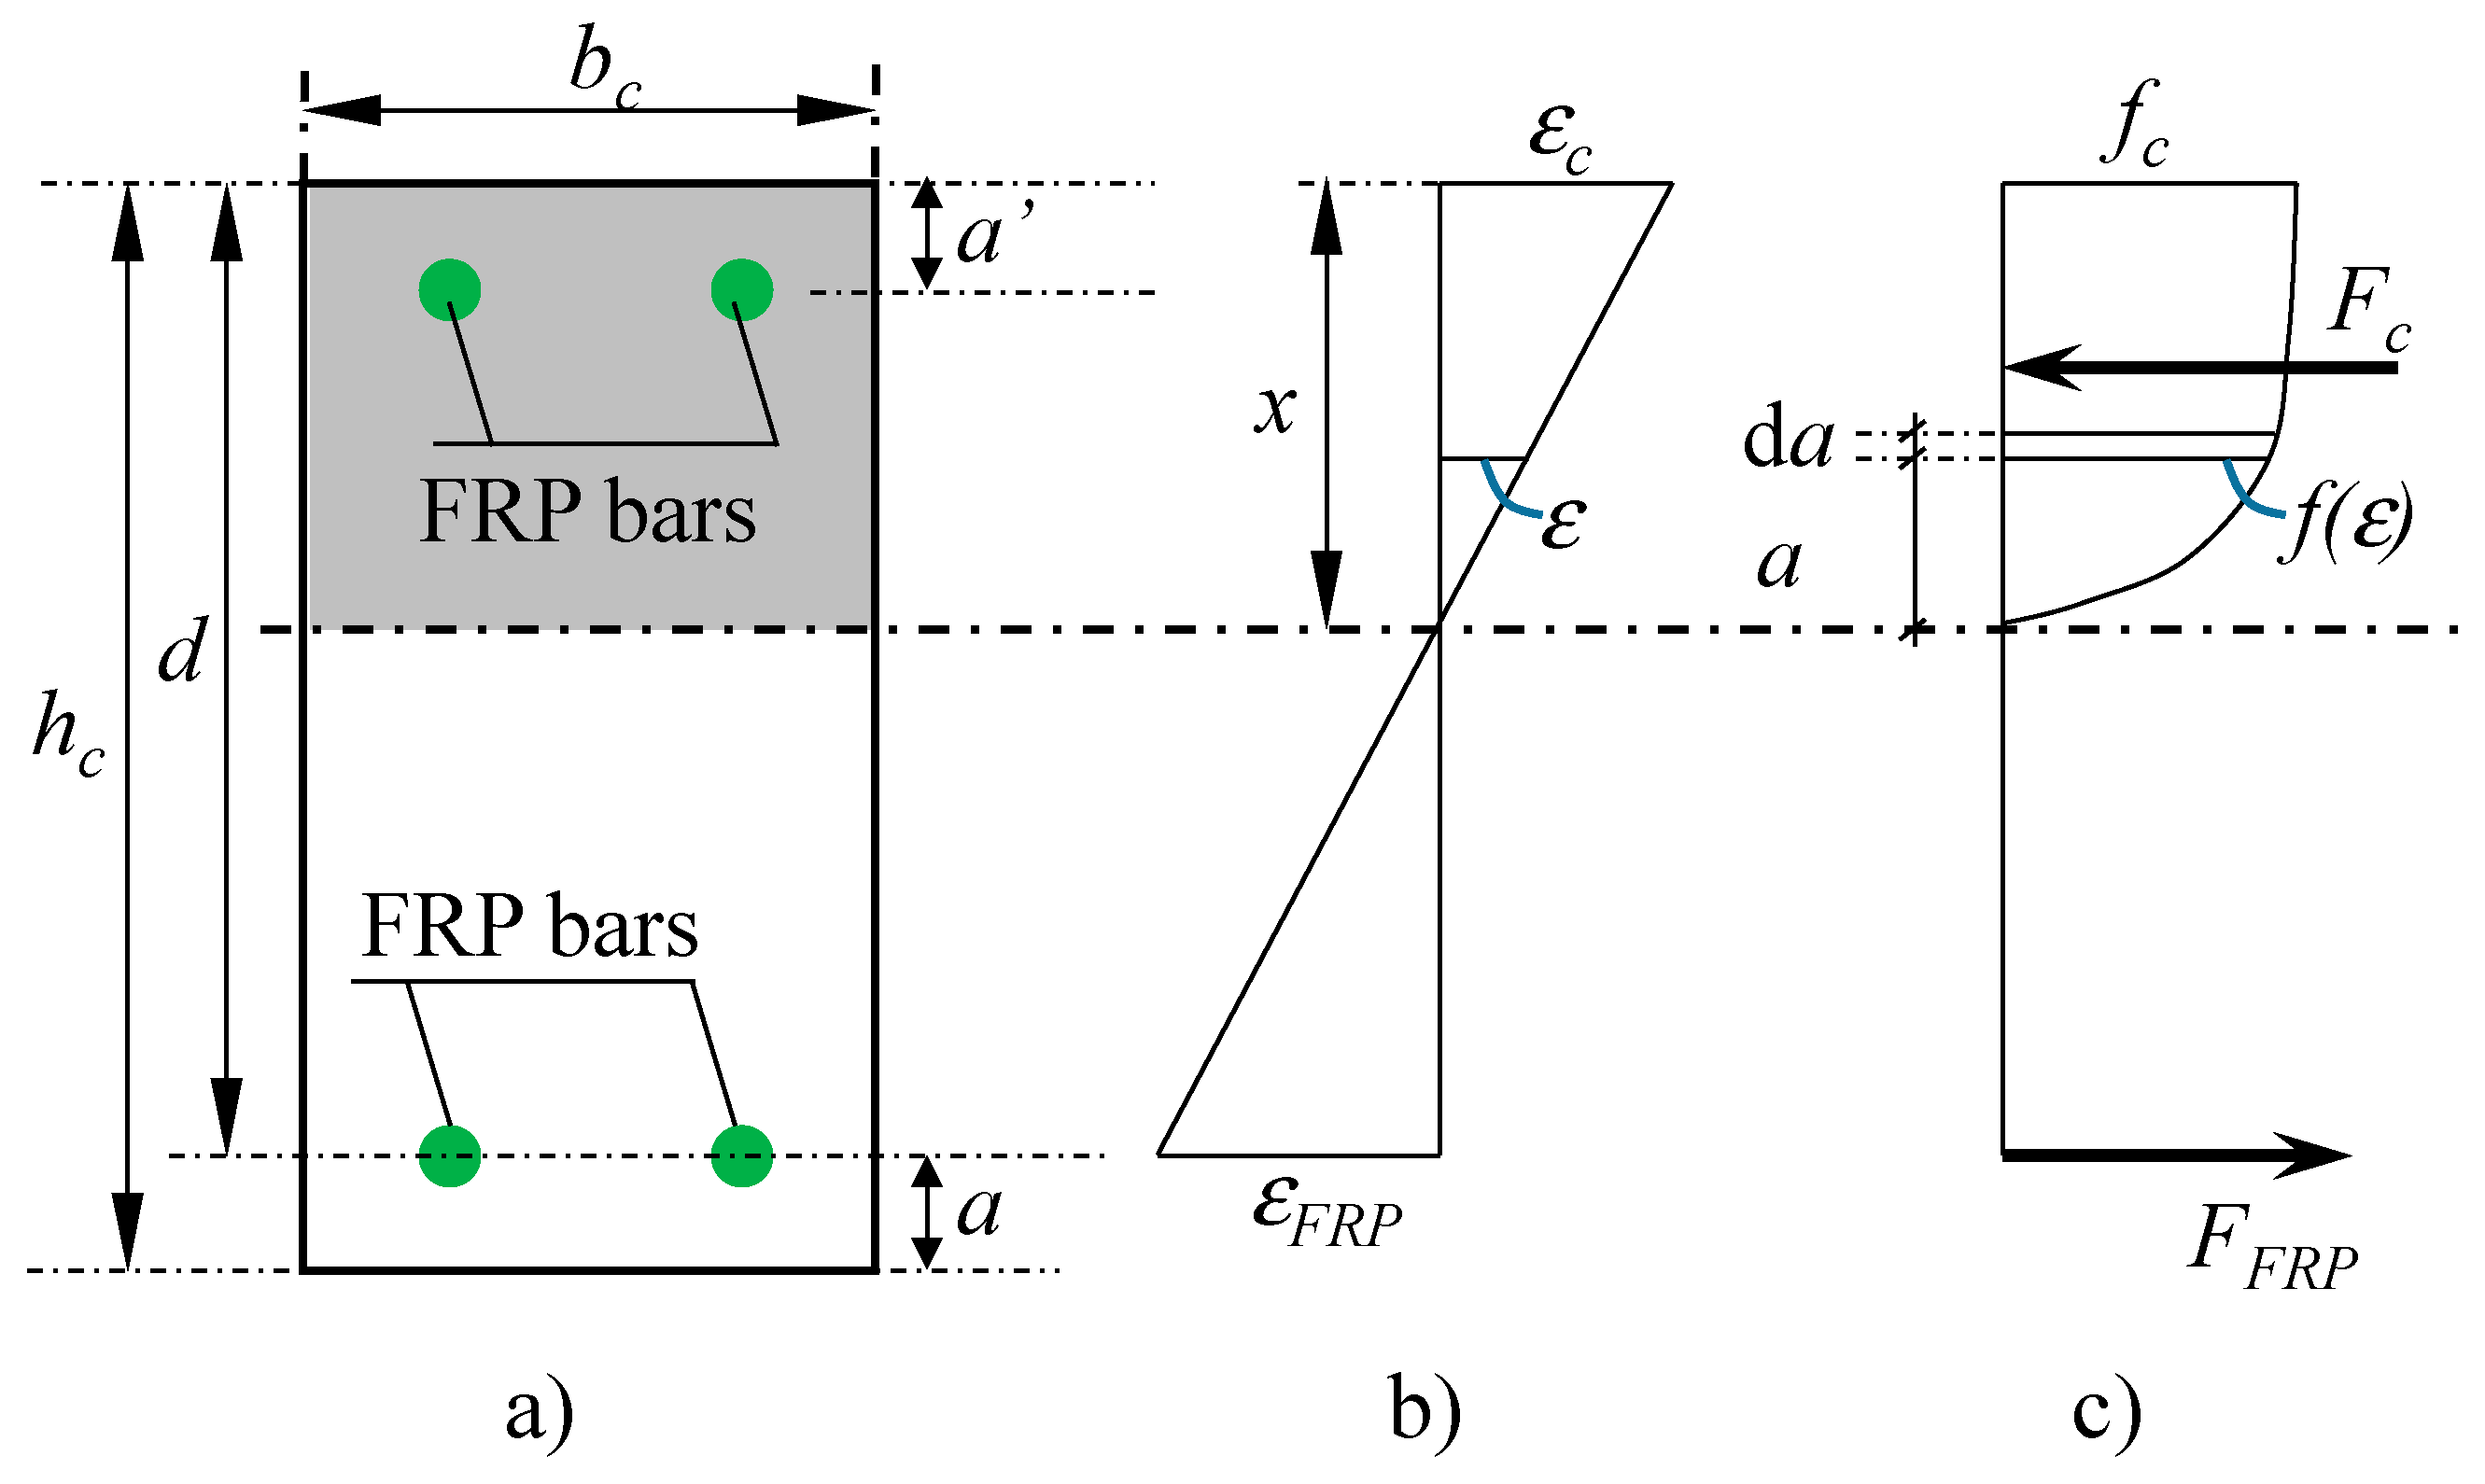
23]. The common hypothesis of these design documents is that the section of the beam remains planar under loading conditions, sectional strain is linearly distributed, and the stress distribution of the concrete compression zone is converted to a rectangular stress block to simplify the calculation. Based on these assumptions and the equivalent equations, the loading capacity of the beam is determined, and this is multiplied with the reduction factors to find the allowable applied loads. There are two general forms indicated in the design documents [
21,
22,
23] to check the safety of the designed structures, as follows:
The aforementioned design documents acknowledge that FRP-reinforced concrete beams should be designed to meet certain target reliability indices. Reliability indices reflect the failure probability of a structure. The higher the reliability index of a structure, the lower the failure probability of the structure and the safer that structure. In ACI 440.1R-15, the target reliability index is recommended to be 3.5, whilst the value of the target reliability index in CSA S806 and CEB-FIB can be taken as 3.8. Using the target reliability index and the reliability analysis, the resistance reduction factors and the partial safety factors can be evaluated. However, current studies on the reliability analysis and the assessment of prevalent design guidelines and standards of FRP-reinforced concrete beams are still limited. Hassanzadeh et al. [
24] assessed ACI440.1R-15 using a first-order reliability method (FORM). Their study found that the provisions given by ACI for the design of FRP-reinforced concrete beams are quite conservative. They also proposed modified reduction factors for the design of these beams. Behnam and Eamon [
25] conducted a reliability analysis based on the Monte Carlo method to optimize the design of FRP-reinforced concrete decks and beams. The purpose of their study was to minimize costs while making sure that the designed structures still met the safety requirements. He and Qiu [
26] applied the Rackwitz–Fiessler method to carry out the reliability assessment of ACI 440.1R. Their study showed that the design using ACI 440.1R is conservative. They also proposed a new resistance reduction factor of 0.8 for the design of FRP-reinforced beams. Ribeiro and Diniz [
27] calibrated the design recommendations given in ACI 440.1R based on the Monte Carlo method. Their study demonstrated that reliability indices of under-reinforced beams were higher than those in the transition zone and over-reinforced. Although some studies have been conducted to evaluate the design guidelines of FRP reinforced concrete beams, there are still areas to be improved. Most of the previous studies only focus on ACI 440.1R and ignore other prevalent design guidelines and standards. Hence, studies on other design documents need to be carried out. In addition, a set of up-to-date tested specimens is necessary and useful for future studies on the flexural behavior of FRP-reinforced concrete beams, but such specimens are not fully available yet. Moreover, while the Monte Carlo method is a good reliability analysis approach and has been widely applied in many previous studies, it requires a large number of simulations and consumes lots of computational time. Therefore, a comprehensive study with an efficient reliability analysis procedure should be conducted to evaluate the reliability of FRP-reinforced concrete beams and to evaluate the current prevalent design documents. In this paper, a reliability analysis procedure based on subset simulation and the Monte Carlo method is developed in Matlab to assess the design guidelines and standards of FRP-reinforced concrete beams. It should be noted that this reliability analysis process only focuses on evaluating the ultimate flexural strength and the serviceability limit state is not considered. First, an up-to-date test database which includes 299 tested specimens has been collected to determine the model error of current design documents. These specimens can serve as a useful resource for future studies to calibrate their numerical models. Additionally, an extensive set of designed specimens is considered in the reliability analysis. Many key parameters are also investigated to explore their effects on the failure probability of FRP beams. Based on the results of the study, the design provisions of ACI 440.1R, CSA S806 and CEB-FIB are evaluated, and recommendations are provided.
3. Test Database
In this section, 299 simple supported beams reinforced with FRP bars have been collected from current studies [
29,
30,
31,
32,
33,
34,
35,
36,
37,
38,
39,
40,
41,
42,
43,
44,
45,
46,
47,
48,
49,
50,
51,
52,
53,
54,
55,
56,
57,
58,
59,
60,
61,
62,
63,
64,
65,
66,
67,
68]. The main criteria for selecting these beams include the type of failure (flexural failure), type of concrete, and type of FRP bars. The failure mode of these beams is flexural failure that includes concrete crushing or FRP rupture. Most of the collected beams are cast from normal or high strength Portland cement concrete, while several beams are cast from geo-polymer concrete and coral aggregate concrete. However, the type and strength of the concrete do not significantly affect the accuracy of the equations used to predict the ultimate moment of FRP-reinforced concrete beams. In the collected studies, GFRP, BFRP, AFRP, and CFRP are used to reinforce concrete beams. Among these types of FRP, GFRP is the most commonly used reinforcement as they are applied to reinforce almost 68.6% of the tested beams (around 205 beams). Beams reinforced by BFRP bars make up 15.7% with 47 beams. Beams reinforced by CFRP bars account for 11% with 33 beams. Beams reinforced with AFRP only account for approximately less than 4.7%. The type of FRP bars has certain influences on the accuracy of the equations used to predict the ultimate moment. Particularly, the ultimate moments of beams reinforced with GFRP, BFRP and AFRP predicted by the design equations (
Mpre) agree quite well with experimental results (
Mtest) because the mean of
Mtest/Mpre is in the range from 0.98 to 1.11. In contrast, the mean of
Mtest/Mpre in the case of CFRP beams ranges from 1.15 to 1.3, which is slightly higher. This difference can be attributed to the higher modulus of CFRP. This parameter can affect the deformation, crack formation, crack propagation, and the height of the beam’s compression zone, which leads to the influence on the ultimate moment of the beam. Due to the unique material properties of FRP, the flexural failure of FRP-reinforced concrete beams is relatively brittle and it includes two typical failure modes, concrete crushing and FRP rupture. Among the 299 collected specimens, 242 beams (approximately 81%) fail by concrete crushing, whilst 57 beams fail by FRP rupture. It shows that FRP rupture is not a desired failure mode since it is brittle, and it can lead to sudden damage. CSA S806 even does not allow FRP rupture to occur in the design [
22].
The summary of the tested specimens is presented in
Table 1, which includes the number of beams for each failure mode (number of specimens), and the range of basic parameters such as the width of the section (
bc), the height of the section (
hc), the compressive strength of concrete (
fc), the elastic modulus of FRP bars (
Ef), and the ultimate tensile strength of FRP bars (
ffu). More details about the geometry and material properties of these beams can be found in
Appendix A of the paper. Based on the test results of the collected beams, two typical failure modes, i.e., concrete crushing and FRP rupture, have been observed. In the case of FRP rupture, the failure is very brittle as it occurs suddenly without any clear warning due to the linear behavior of FRP. In contrast, the failure by concrete crushing is more ductile as cracks appear at the compression zone of the beam. Since the failure modes result in different stress and strain distributions in concrete and FRP, the calculation of the ultimate moment is also not similar. Therefore, in the current design documents, the calculation of ultimate moment is classified by the type of failure mode. According to ACI 440.1R [
21] and CEB-FIB [
23], the failure modes of FRP-reinforced concrete beams are classified by the reinforcement ratio (
ρf), and the balanced reinforcement ratio (
ρfb). Particularly, it is assumed in the design that concrete crushing occurs when
ρf >
ρfb, and FRP will rupture when
ρf ≤
ρfb. However, in practice, FRP rupture can also happen when
ρf >
ρfb. Therefore, ACI 440.1R recommends that the range from
ρfb to 1.4
ρfb is the transition zone, where either concrete crushing or FRP rupture can occur.
The distributions of parameters including the section dimensions and material properties are depicted in
Figure 3. As can be seen from this figure, the collected beams cover both normal and high strength concrete, reinforced with either normal or high-strength FRP bars. Particularly, the values of
bc,
hc,
fc,
Ef, and
ffu of the tested specimens fluctuate in a wide range from 80 mm to 500 mm, 120 mm to 550 mm, 20 MPa to 114.9 MPa, 35.6 GPa to 200 GPa, and 489.3 MPa to 2069 MPa, respectively. Among these specimens, 92% of the tested beams have a width from 100 mm to 250 mm, while 84% of the beams a height from 150 mm to 350 mm. Beams with concrete compressive strengths ranging from 25 MPa to 50 MPa account for 74%. In addition, 72% of the collected beams have an FRP modulus between 30 GPa and 60 GPa, while 73% of the beams have an FRP tensile strength from 600 MPa to 1200 MPa.
Based on the collected data and equations given in the considered design documents,
Mtest/Mpre ratios are determined. Subsequently, the Anderson–Darling goodness of fit test [
69] is conducted to identify the distribution of the model error for each design guideline and standard. In this test, the
p-value of each distribution is calculated. The type of distribution with the largest
p-value, provided it exceeds 0.05, is chosen to represent the model error. Regarding ACI 440.1R, when the failure mode is concrete crushing, the values of mean and coefficient of variation (
CoV) of the model error are 1.07 and 0.19, respectively. When FRP rupture is the dominant failure mode, the values of mean and
CoV are 1.1 and 0.21, respectively. Based on the values of
Mtest/Mpre ratios, it has been found that Gumbel distribution (
Figure 4) can reflect well the distribution of the model errors of both concrete crushing and FRP rupture because the
p-values obtained from Anderson–Darling test are larger than those of other distributions (see
Table 2).
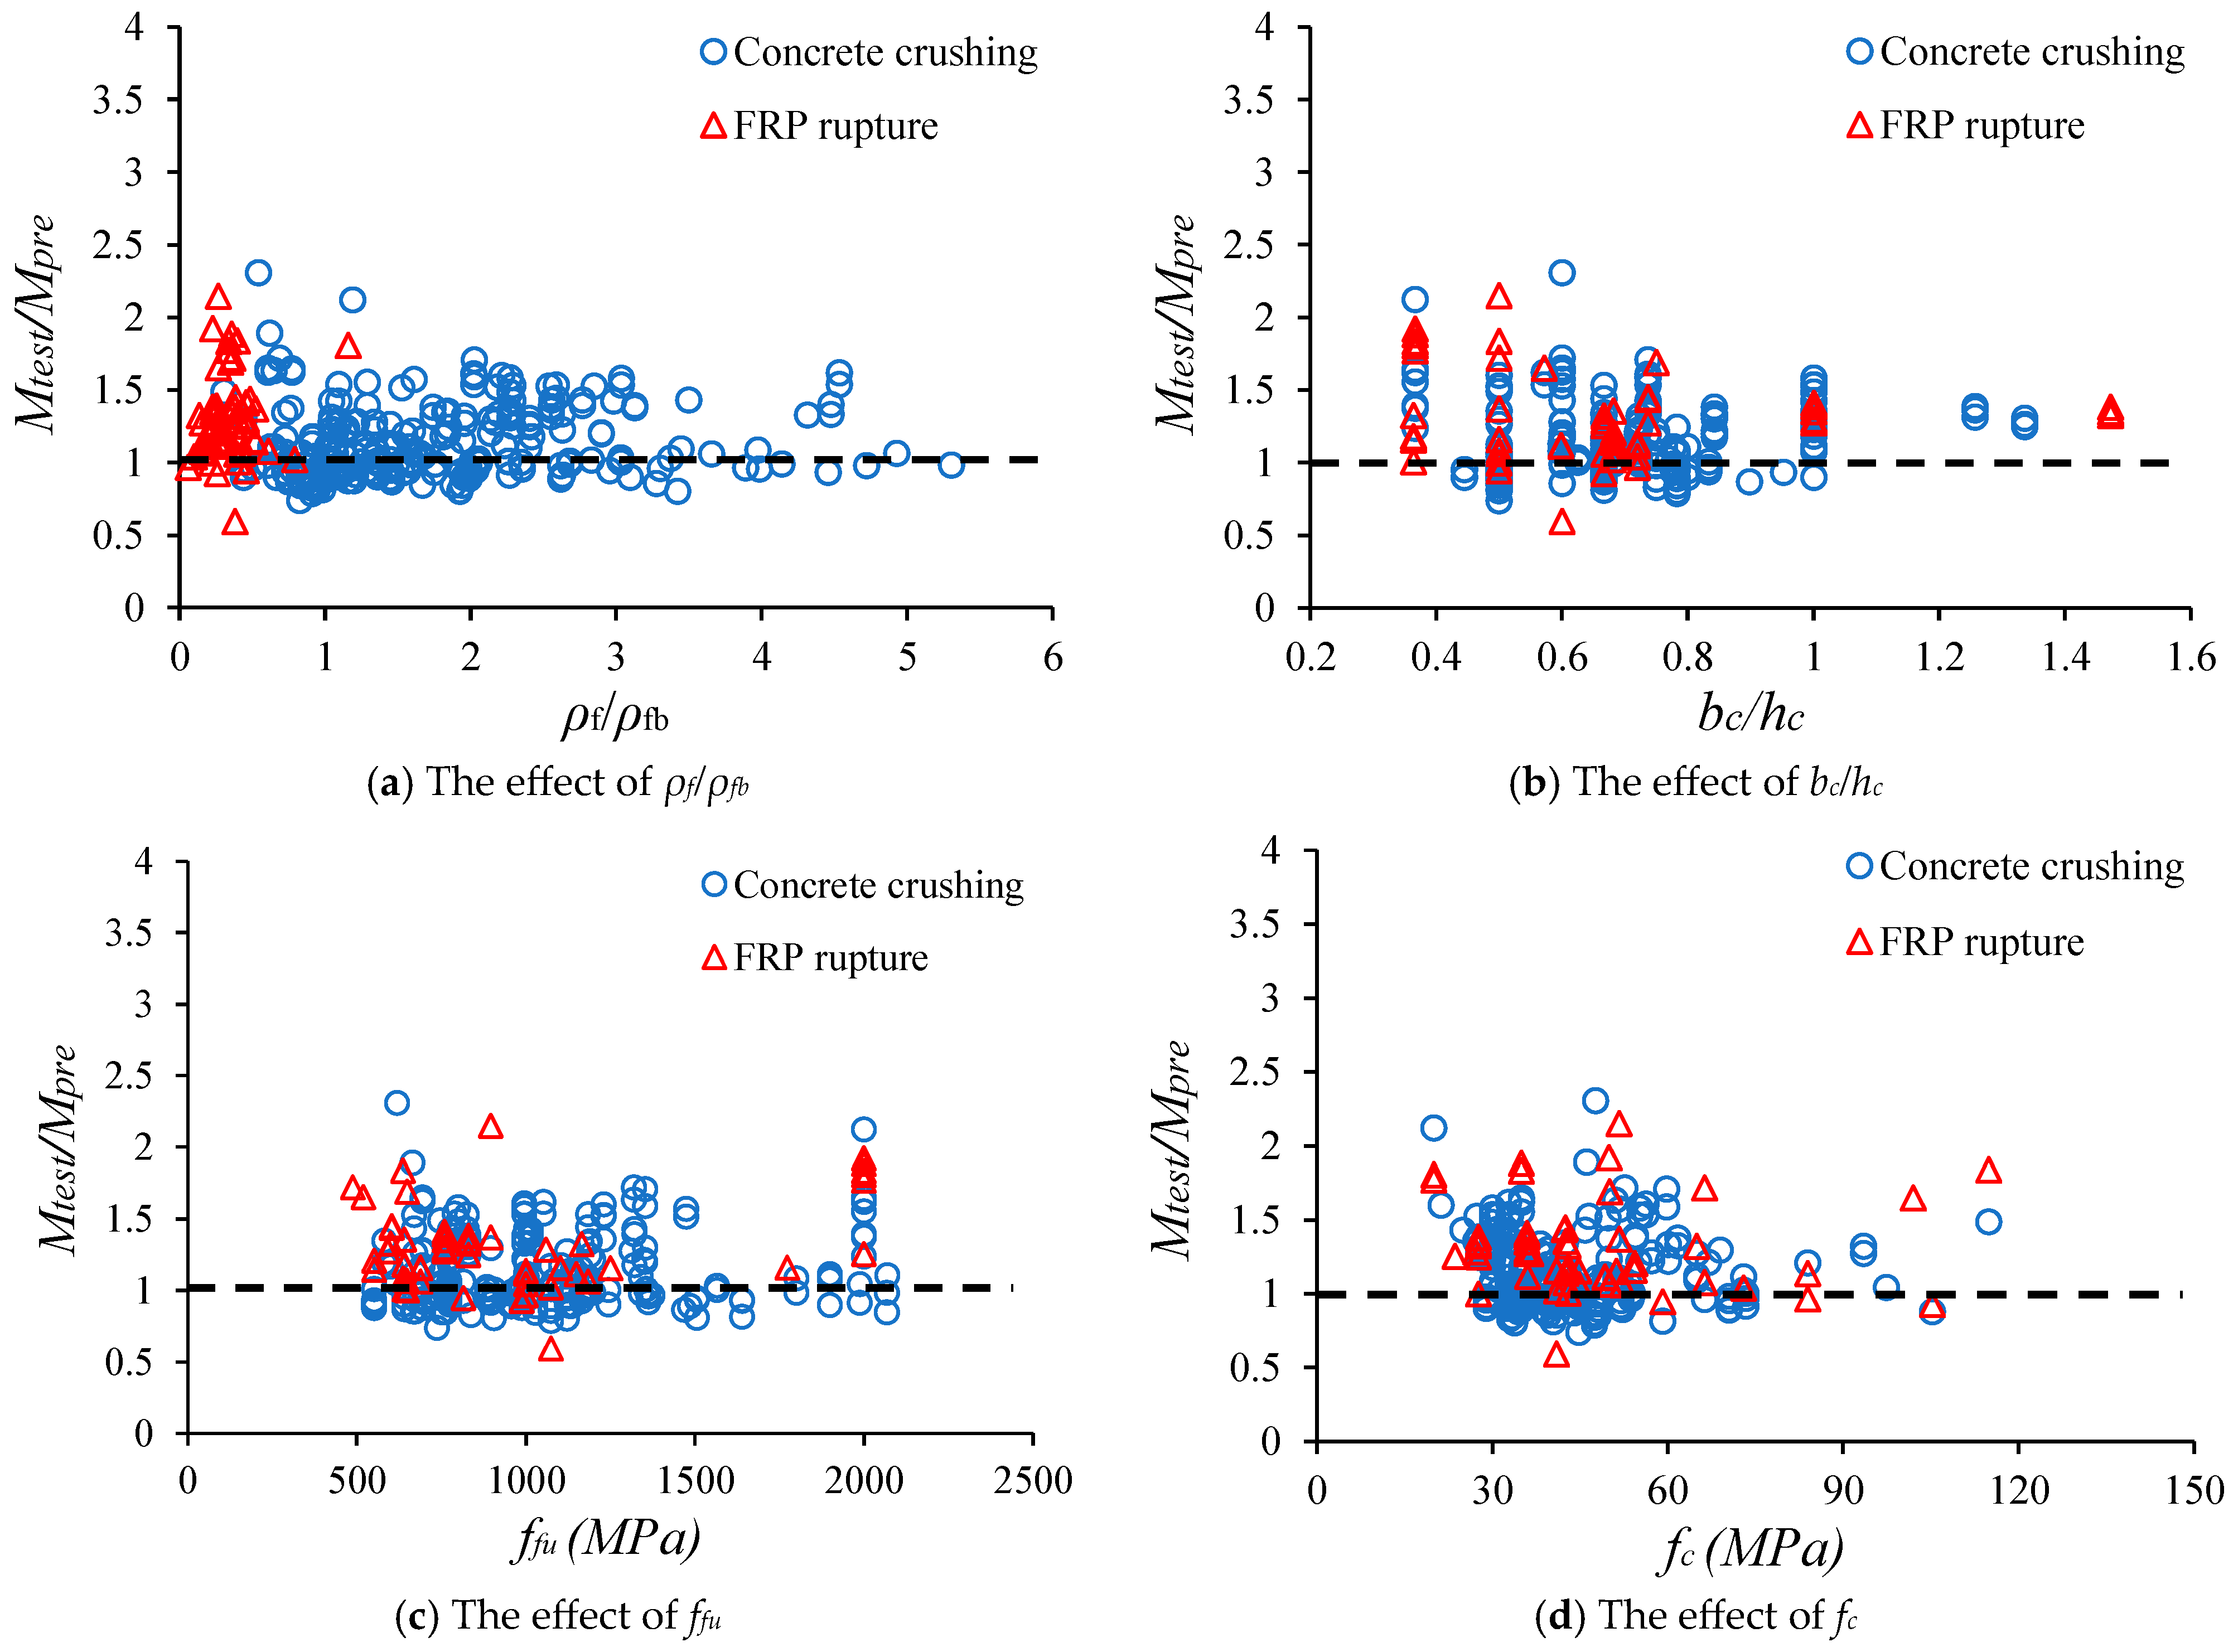
In
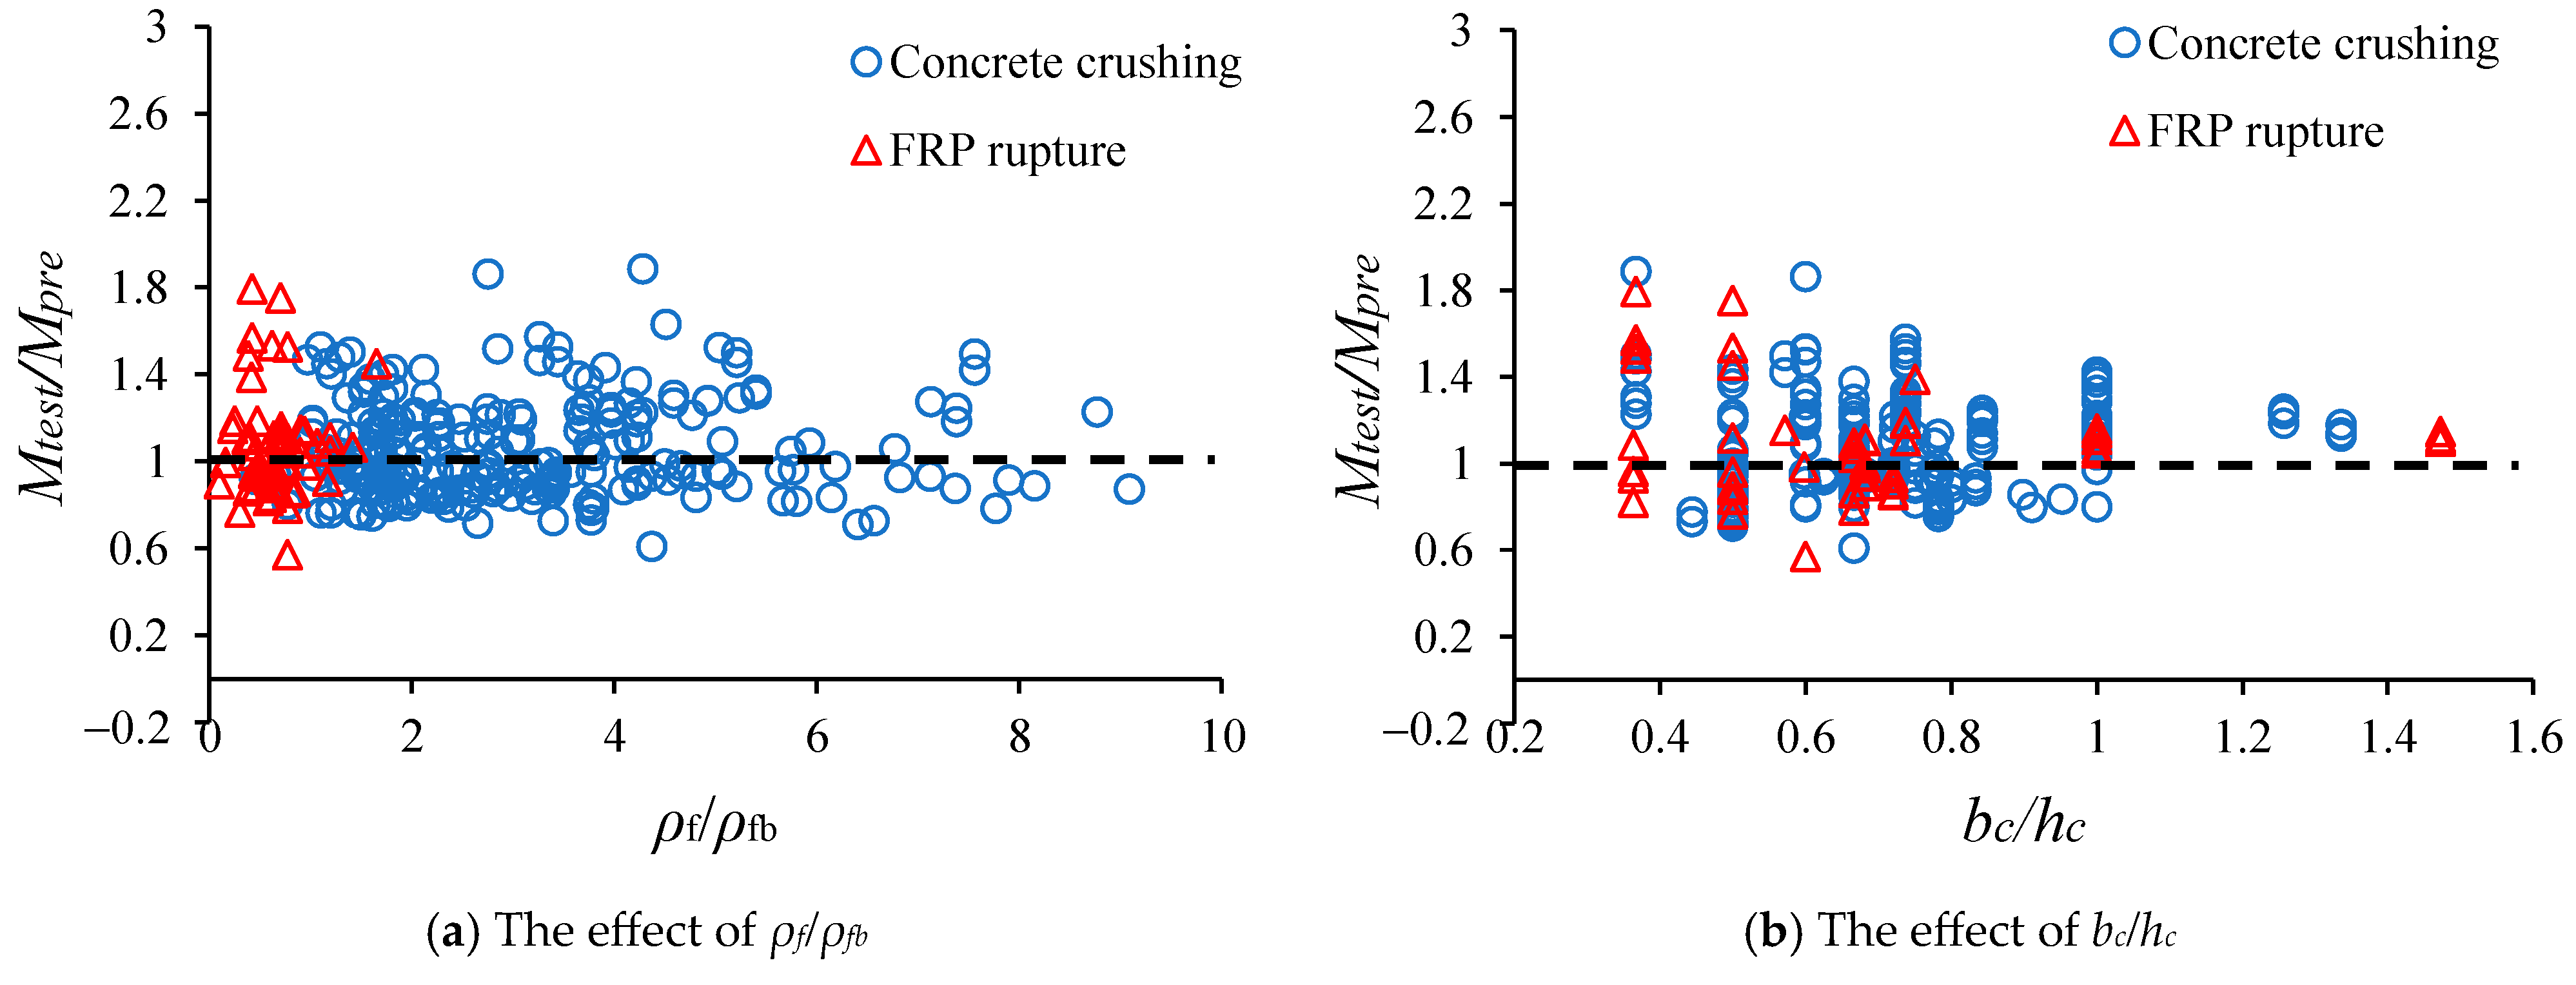
Figure 5, the influences of some basic parameters on the test-to-prediction moment ratios (
Mtest/Mpre) and the failure mode are depicted. As can be seen from this figure, ACI 440.1R obviously underestimates the moment capacity of FRP beams.
Figure 5a demonstrates that
ρf/ρfb can affect the type of failure mode significantly since the rise of this ratio can lead to the change in the failure mode of tested beams. When
ρf/ρfb < 1, almost all the beams fail by FRP rupture, whilst most specimens fail by concrete crushing if
ρf/ρfb > 1.4. When 1 <
ρf/ρfb < 1.4, either FRP rupture or concrete crushing can occur. As can be seen from
Figure 5b, the section width-to-height ratio (
bc/hc) also affects the values of
Mtest/Mpre and the type of failure mode. When this ratio rises, less fluctuation in the values of
Mtest/Mpre has been observed. When
bc/hc is over 0.8, most of the collected beams fail by concrete crushing. Similarly, when FRP tensile strength increases over 1200 MPa, the failure mode of most of the collected beams is concrete crushing (
Figure 5c). The fluctuation of concrete strength (
fc) also results in the variation of
Mtest/Mpre ratios, but they do not have significant influence on the failure modes as shown in
Figure 5d.
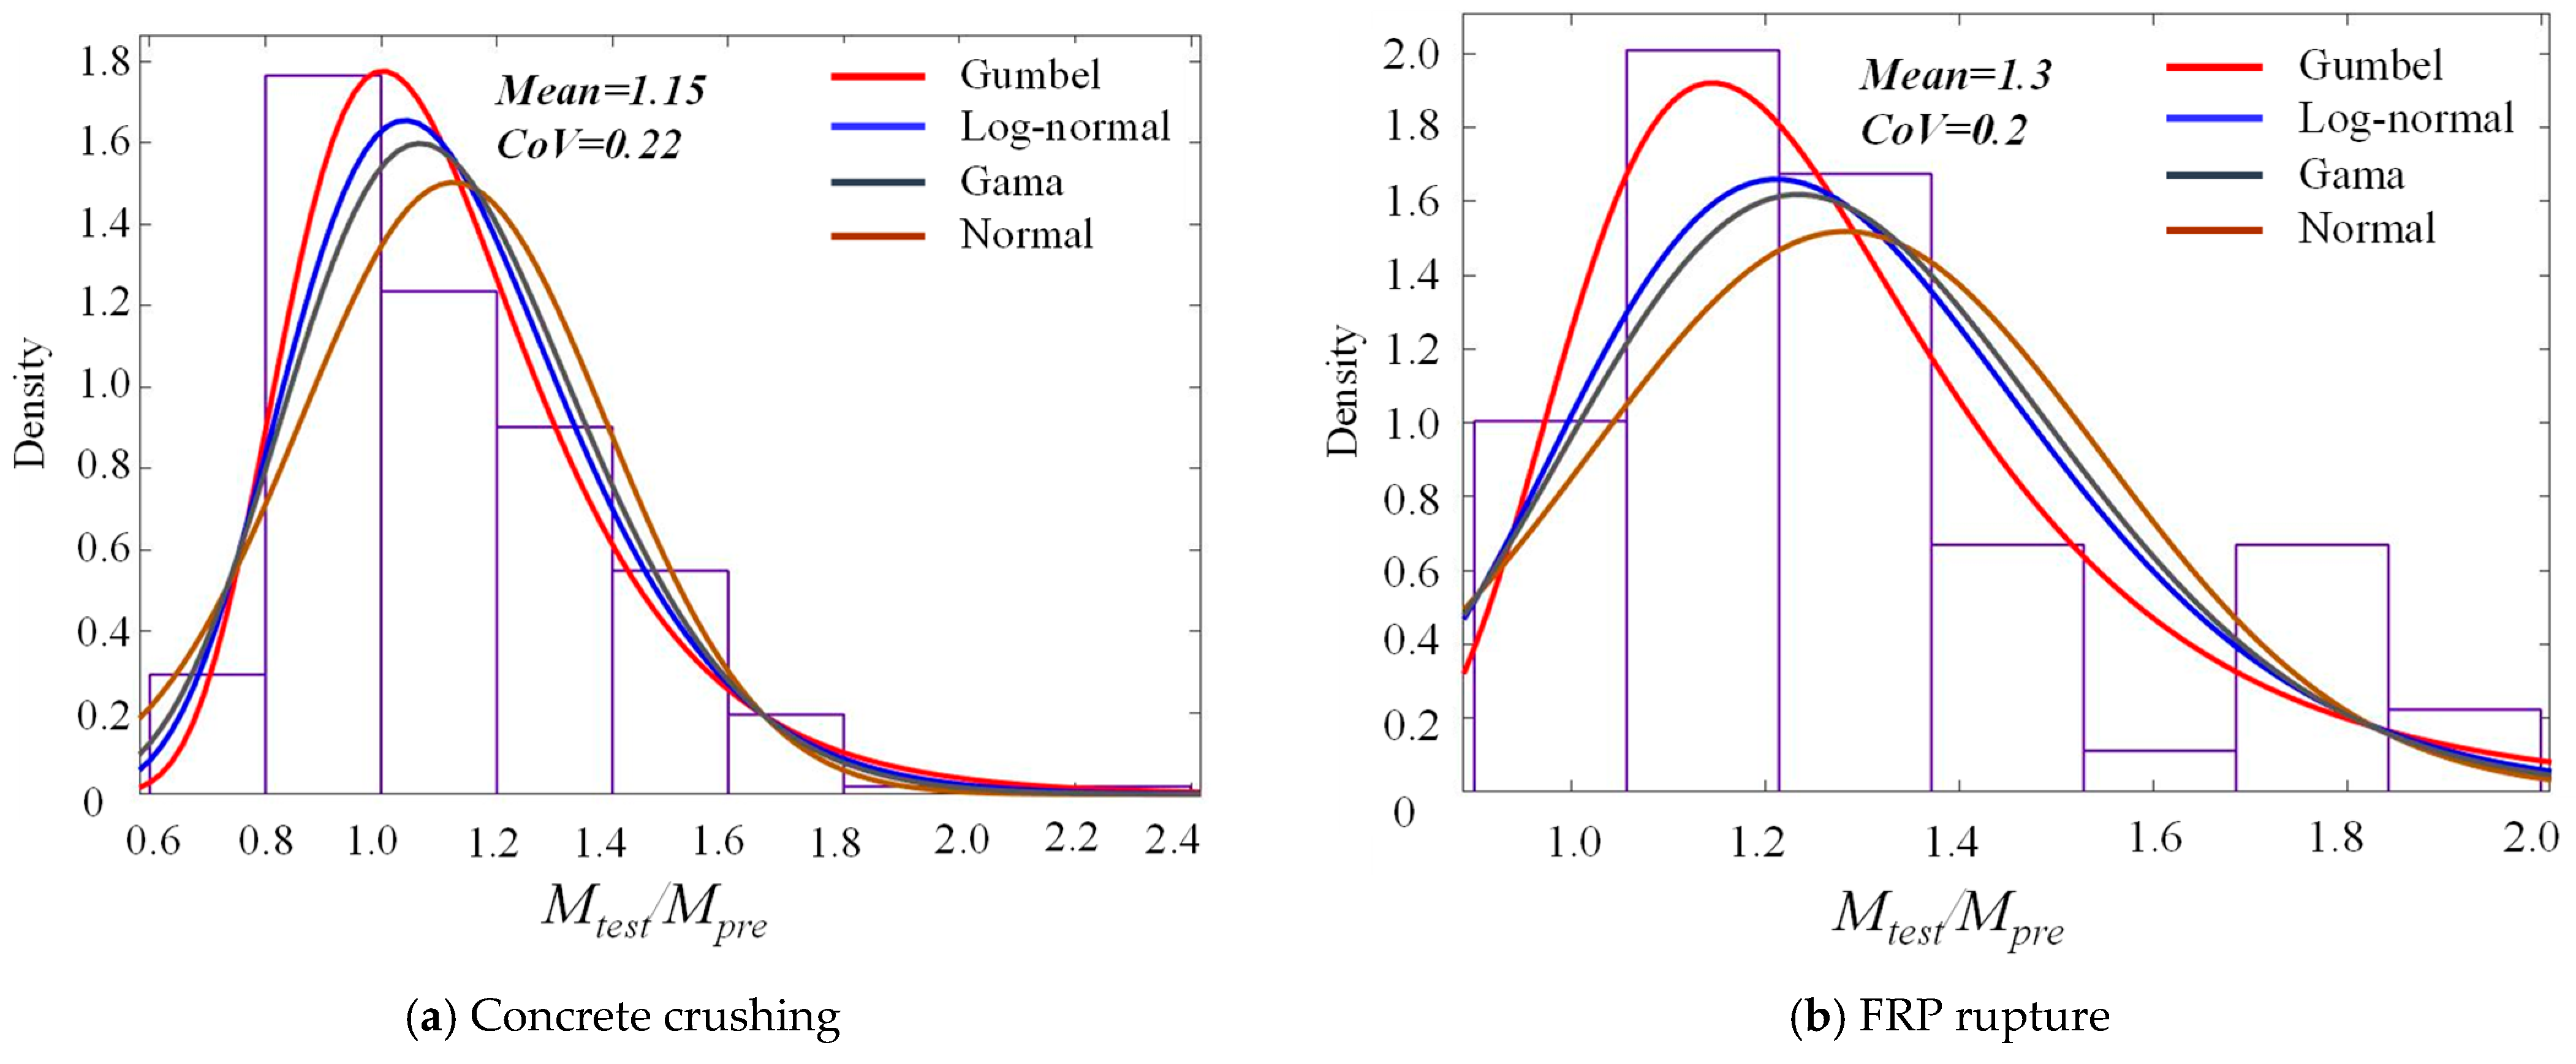
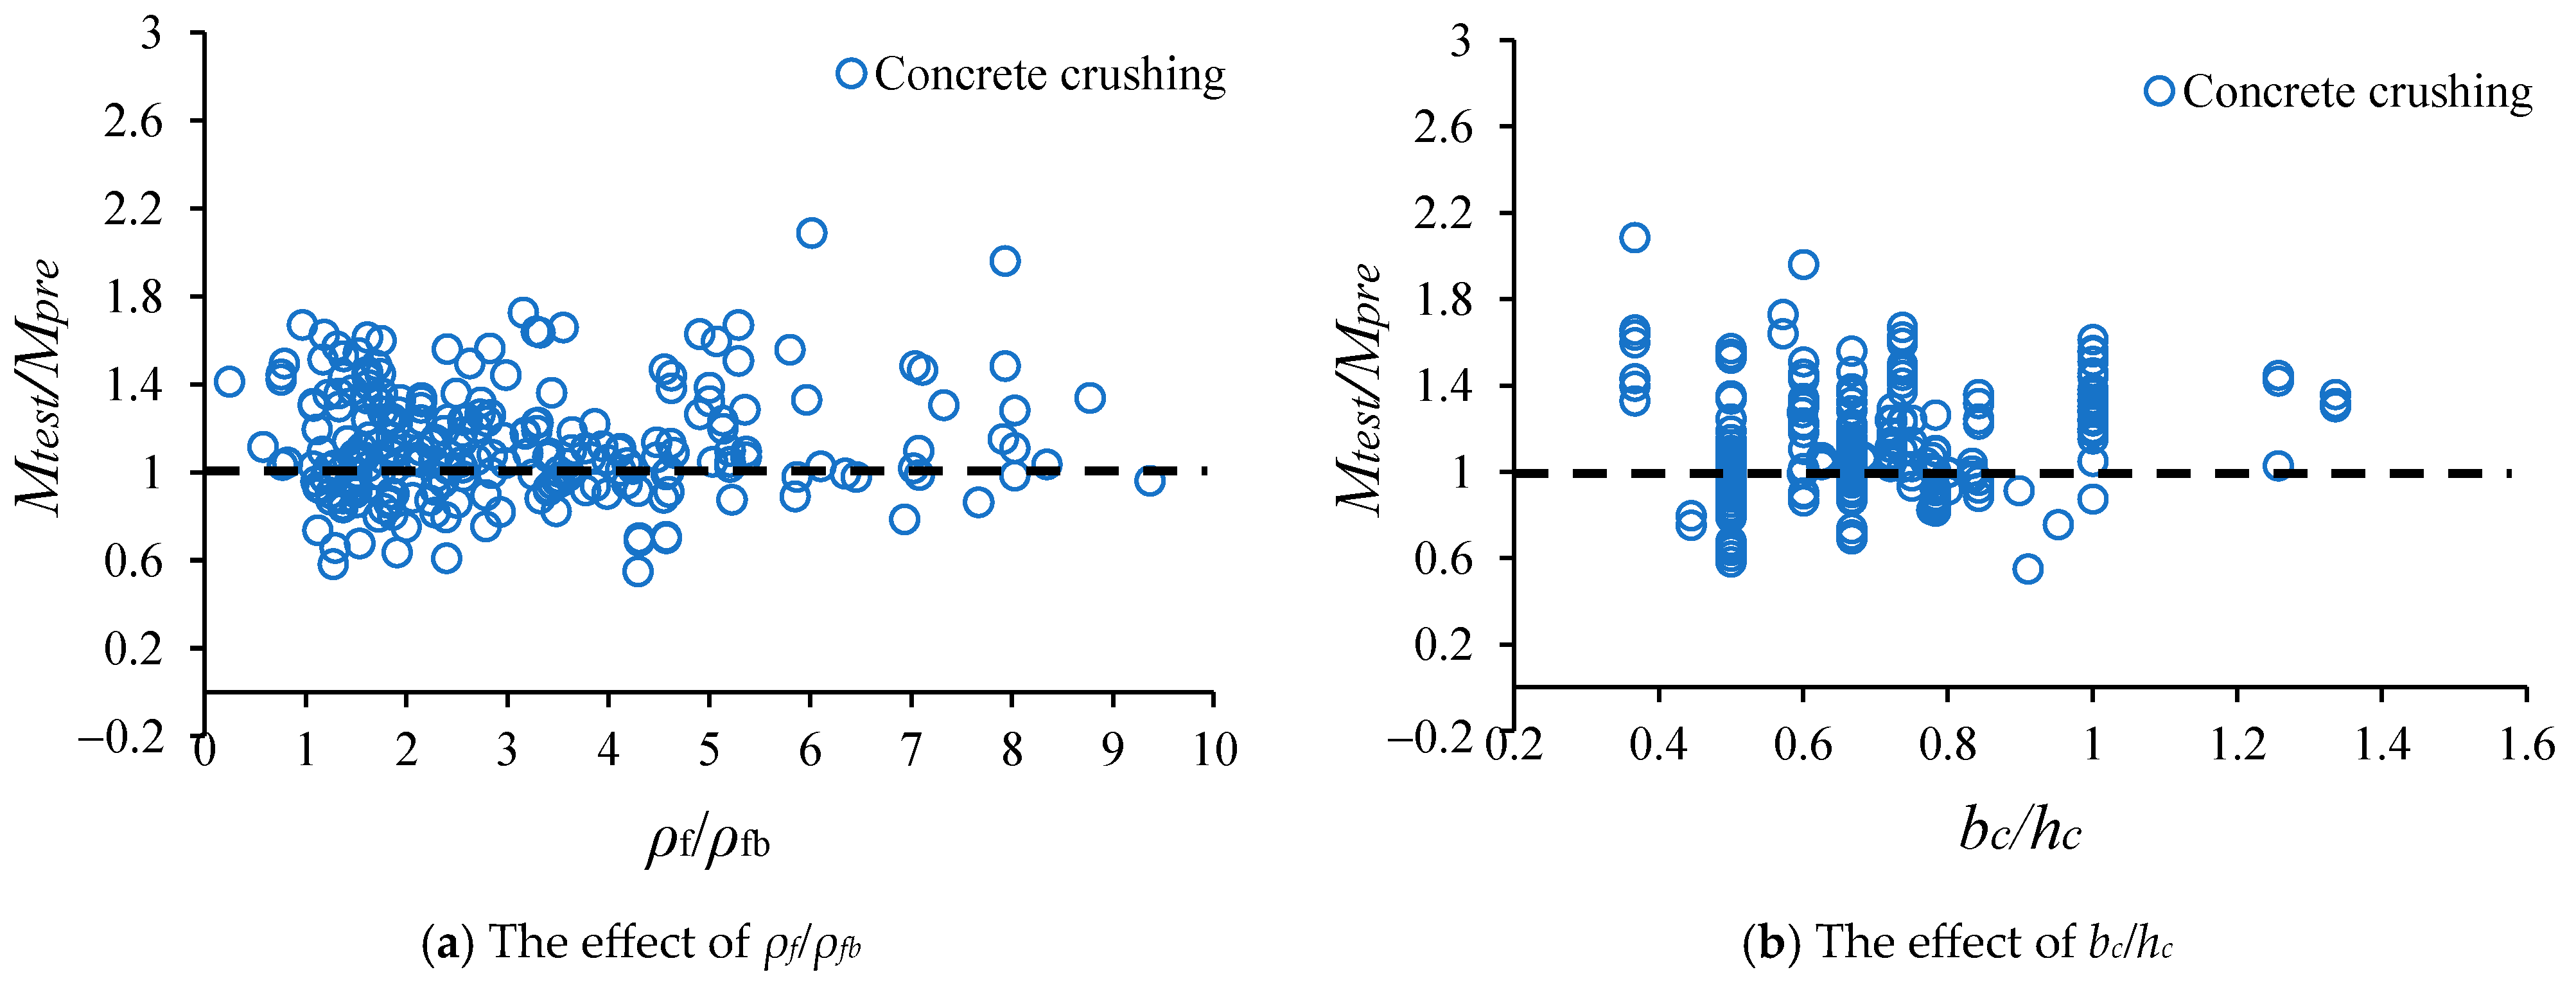
Using the design provisions given by CEB-FIB, the failure mode and the ultimate moment are predicted.
Mtest/Mpre ratios are then calculated to determine the distribution of the model error. As can be seen from
Table 2, Gumbel distribution provides the best fit for both concrete crushing and FRP rupture failure modes. The values of mean and
CoV in the case of concrete crushing and FRP rupture are 1.15, 0.22 and 1.3, 0.2, respectively. More details about the distribution of the model error can be found in
Figure 6.
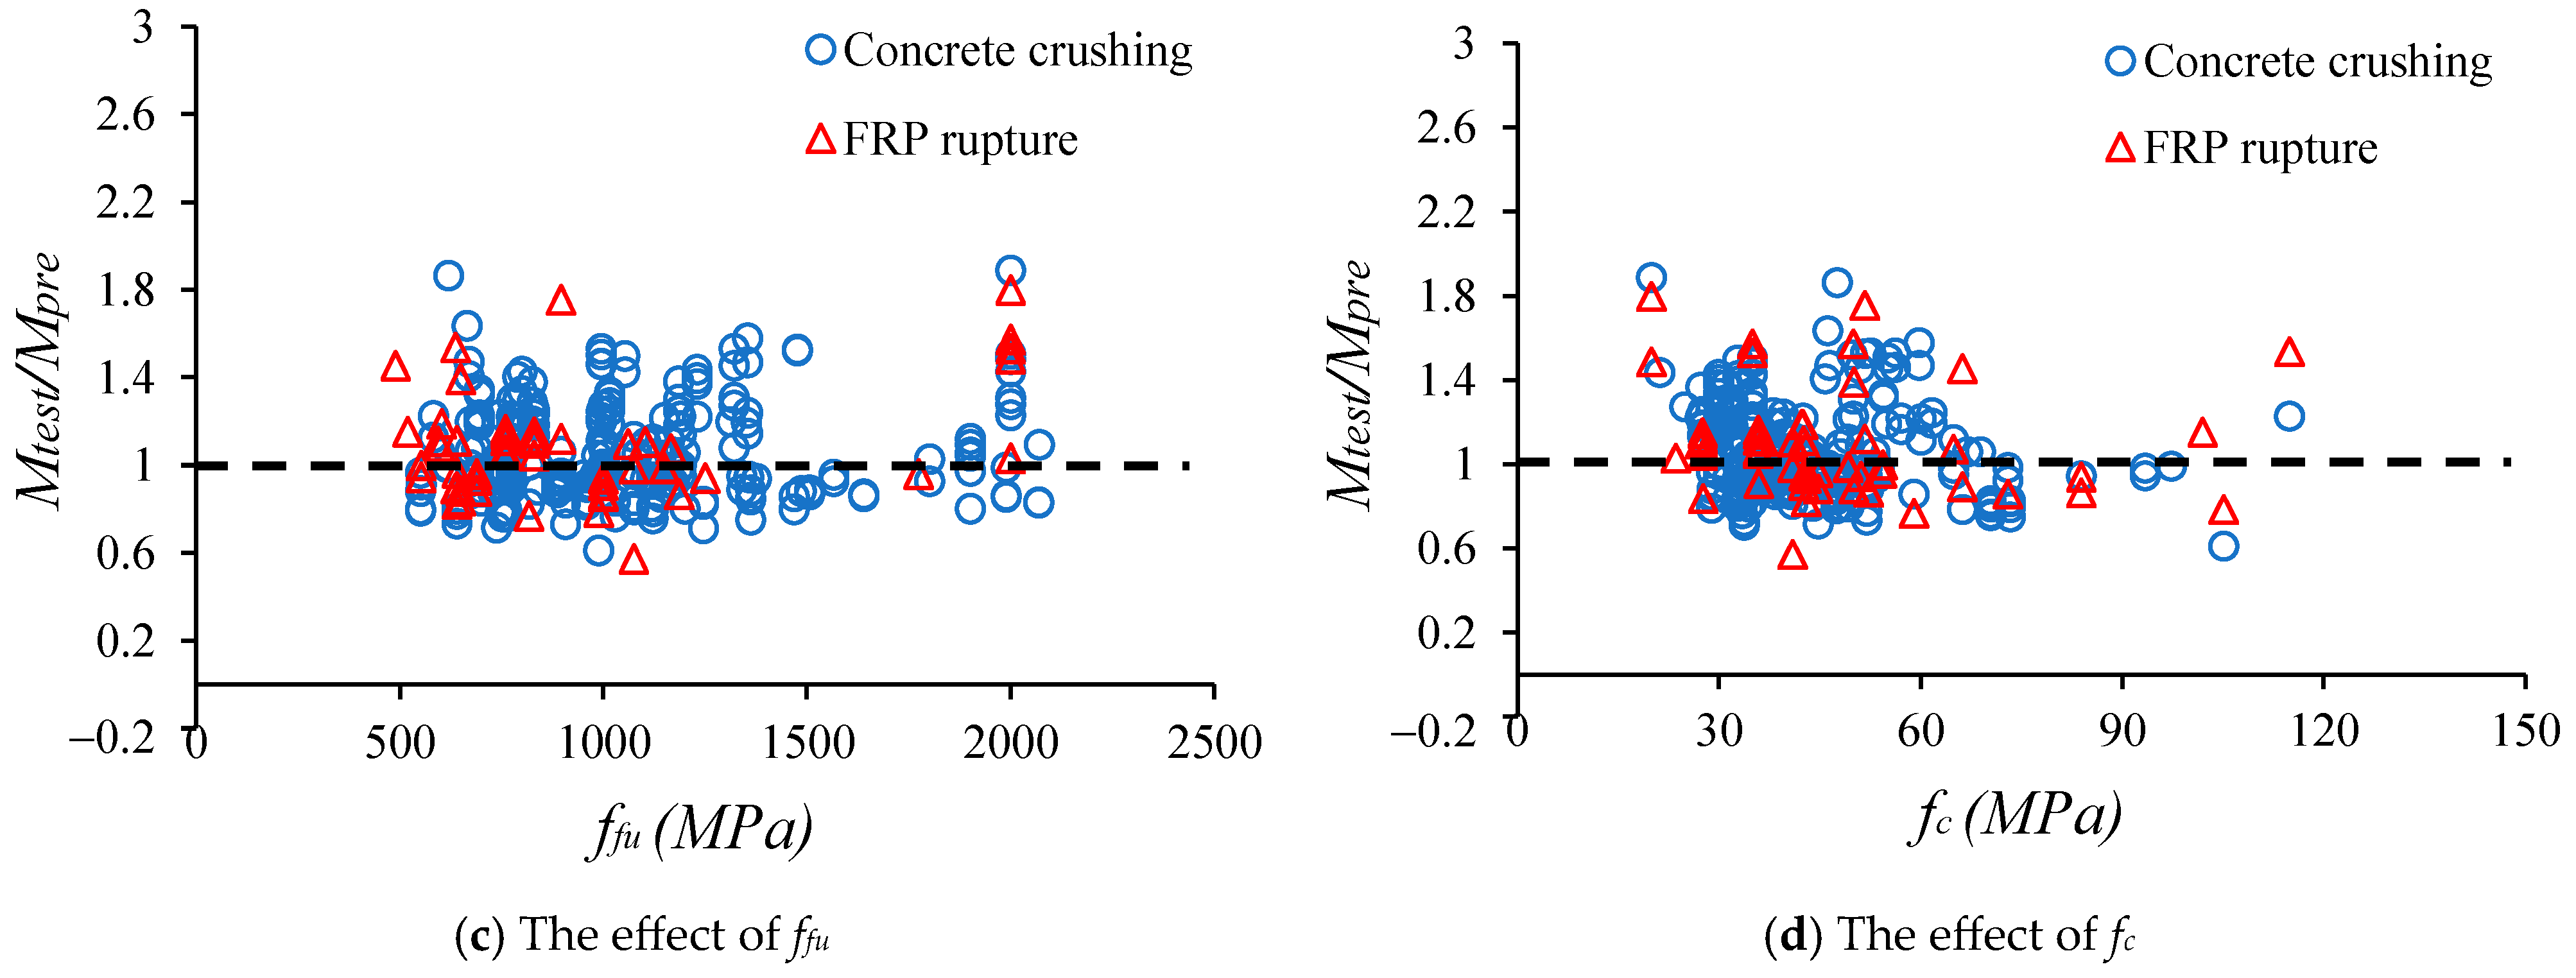
Figure 7 illustrates the effects of some principal parameters on the failure mode and the
Mtest/Mpre ratio. As can be seen from
Figure 7a, the
ρf/ρfb ratio can affect not only the
Mtest/Mpre ratio but also the type of failure mode. When
ρf/ρfb rises,
Mtest and
Mpre converge. When
ρf/ρfb < 1, the main failure mode is FRP rupture, while
ρf/ρfb > 1 leads to concrete crushing in almost all specimens.
Figure 7b illustrates that when the section width-to-height ratio (
bc/hc) increases, the
Mtest/Mpre ratio decreases. As shown in
Figure 7c, the main failure mode of the collected beams is concrete crushing when the tensile strength of FRP bar (
ffu) is larger than 1200 MPa.
Figure 7d demonstrates that concrete compressive strength (
fc) does not significantly affect the failure mode or
Mtest/Mpre ratio.
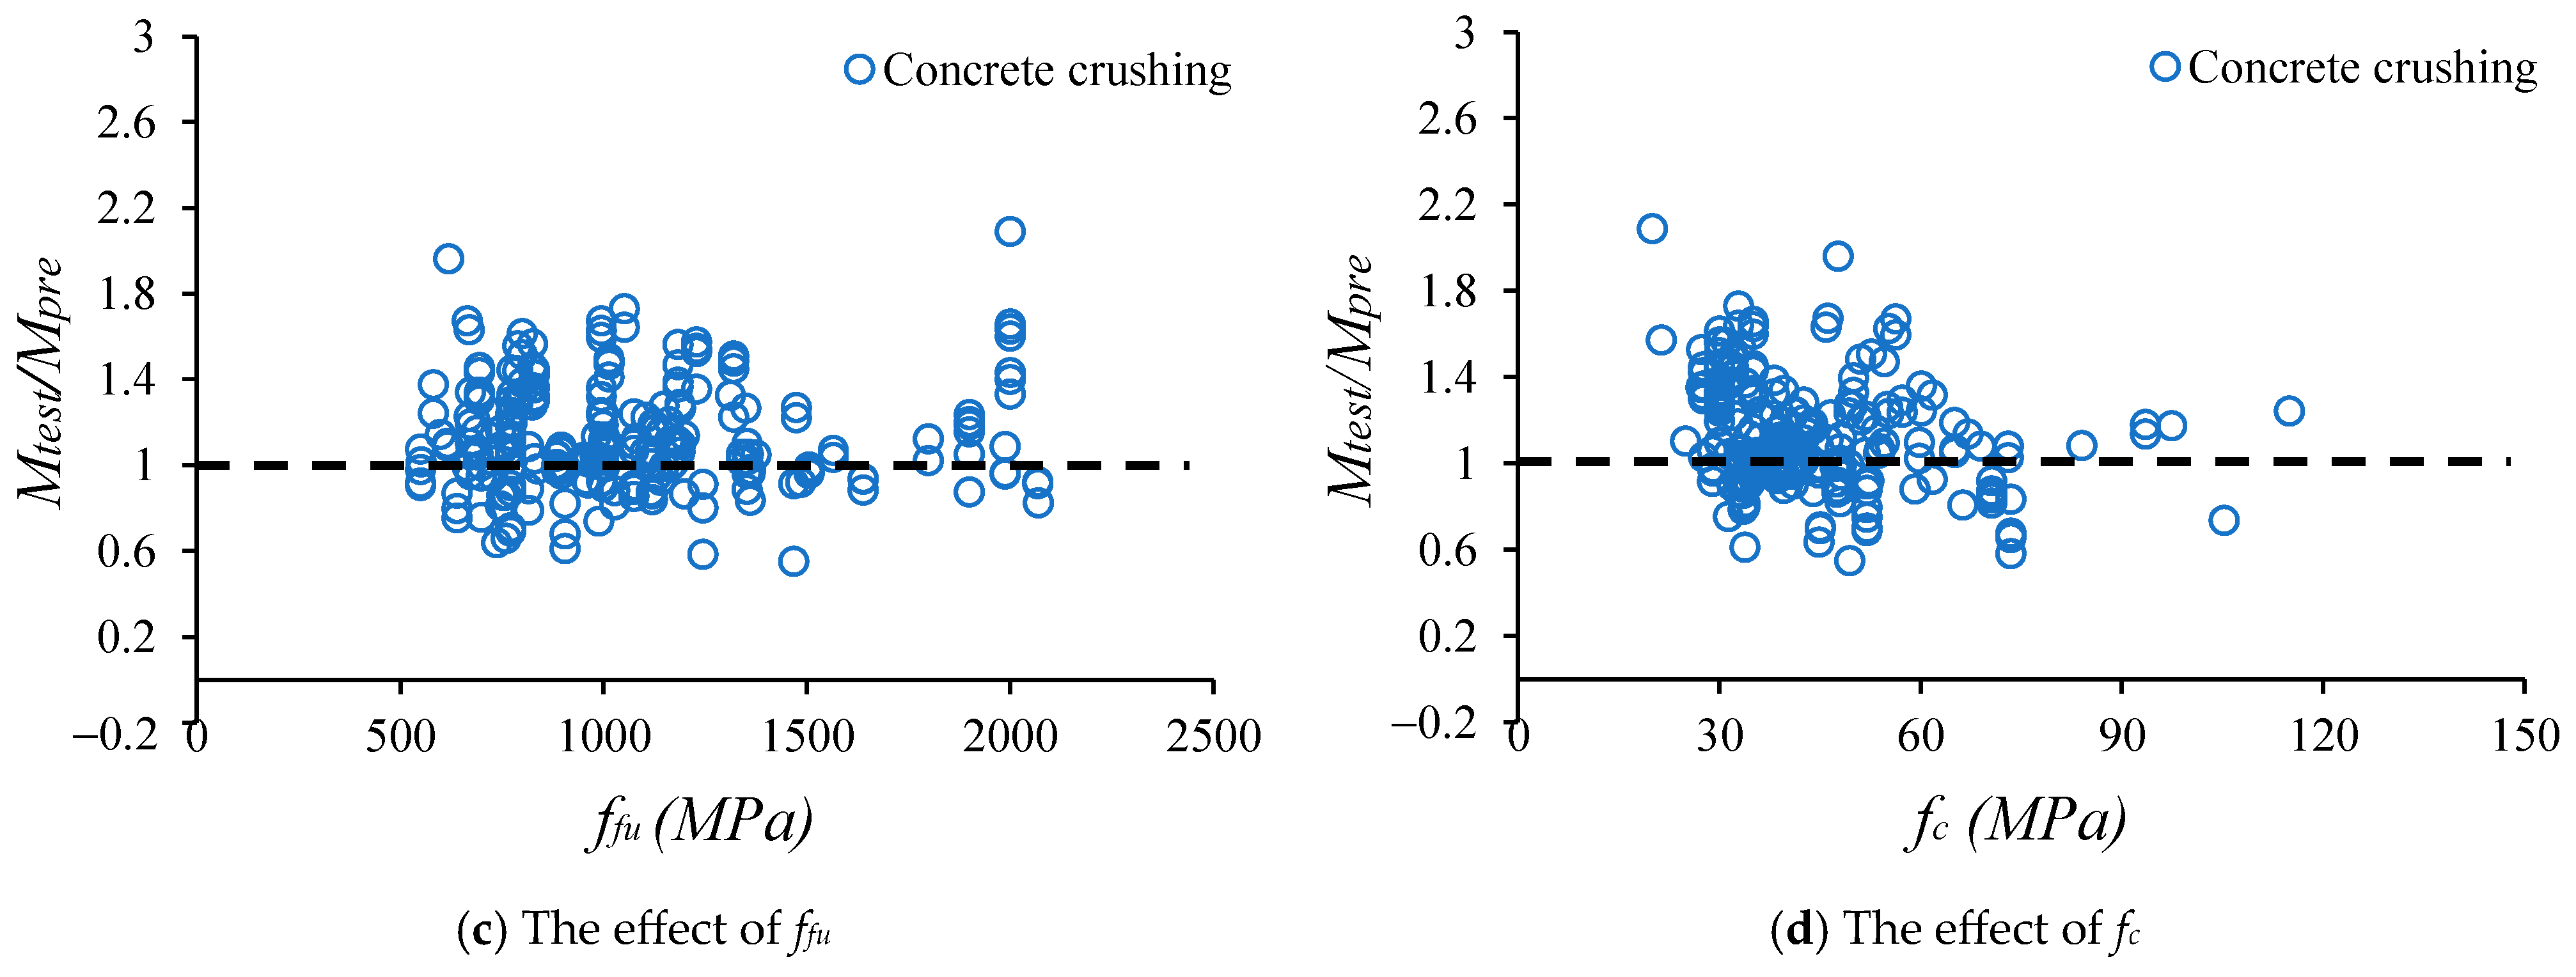
The designed equations of CSA S806 are applied to determine the moment capacities of the collected beams. The comparison between the results calculated by CSA S806 and experimental results is depicted
Figure 8. This figure shows that the formulas given in CSA S806 underestimate the moment capacities of the tested beams. Based on
Mtest/Mpre ratios, it has been found that the lognormal distribution (shown in
Figure 9 and
Table 2) with a mean of 1.13 and
CoV of 0.21 can be the best fit for the model error in the case of CSA S806.
4. Reliability Analysis of FRP-Reinforced Concrete Beams
In this section, reliability analysis is utilized to evaluate the failure probability and reliability index of FRP-reinforced concrete beams. Based on reliability indices, the safety of the designed beam can be evaluated and the reduction factor for the design can be calibrated. In this paper, an efficient and highly reliable procedure is developed to evaluate the reliability indices of beams designed by equations presented above.
4.1. Reliability Analysis Methods
Due to the uncertainty of variables such as concrete compressive strength, FRP bar tensile strength, the section width/height, or FRP bar area, the designed load-carrying capacity of FRP-reinforced concrete beams can differ from the predicted value. As a result, the designed beams can fail with a certain failure probability even when they are subjected to allowable loads. This failure probability is determined by reliability analysis, and it is defined by Equation (40) [
70]. The reliability index is calculated based on failure probability by Equation (41) [
71].
where
Pf is the probability of failure;
Pr is the probability of the event in the bracket;
G(y) is the limit state function;
y1, …,
yn are the random variables such as applied loads, model errors, or material properties; Φ is the standard normal cumulative distribution function; Φ
−1 is the inverse of the standard normal cumulative distribution function, which computes a value (in this case, it is the reliability index) corresponding to a particular probability. The limit state function plays a key role in the reliability analysis. Since this study only focuses on the strength limit state, the form of limit state function can be expressed as follows:
where
ME is the model error that accounts for the difference between the experimental results and the results obtained from the design equations as presented in
Figure 4,
Figure 6 and
Figure 9.
Since the model error is dependent on the failure mode, the failure mode of each beam is determined by comparing the reinforcement ratio with the balanced reinforcement ratio calculated by each design document. After that, the model error for each failure mode will be applied in the reliability analysis procedure conducted by either Monte Carlo method or subset simulation. After obtaining the limit state function, Equation (40) can be solved by several approaches to achieve the failure probability. In this paper, two methods that are Monte Carlo method [
72] and subset simulation [
73] are utilized. The details of Monte Carlo method are presented as follows:
- (a)
At the beginning of the method, a set of
N samples of the initial beams of the investigated beam is created using the statistical values of random variables given in
Table 3.
- (b)
For each generated sample, the failure mode is determined and the ultimate flexural moment (MR) is calculated by the design equations. The moment caused by applied loads (ML) is also computed.
- (c)
Based on the values of these moments, the limit state function G(M) = ME × MR − ML(Equation (42)) is computed to determine whether the sample fails. It should be noted that a sample fails if the value of G(M) is less than 0. Then, the number of failure samples can be calculated as follows: Nf = Nf + 1.
- (d)
After all samples are analyzed, the value of
Pf is defined as the ratio between the number of failure samples (
Nf) and the initial
N samples as given in Equation (43). The error of the result is calculated by Equation (44). More details of this calculation procedure are depicted in
Figure 10 and
Figure 11.
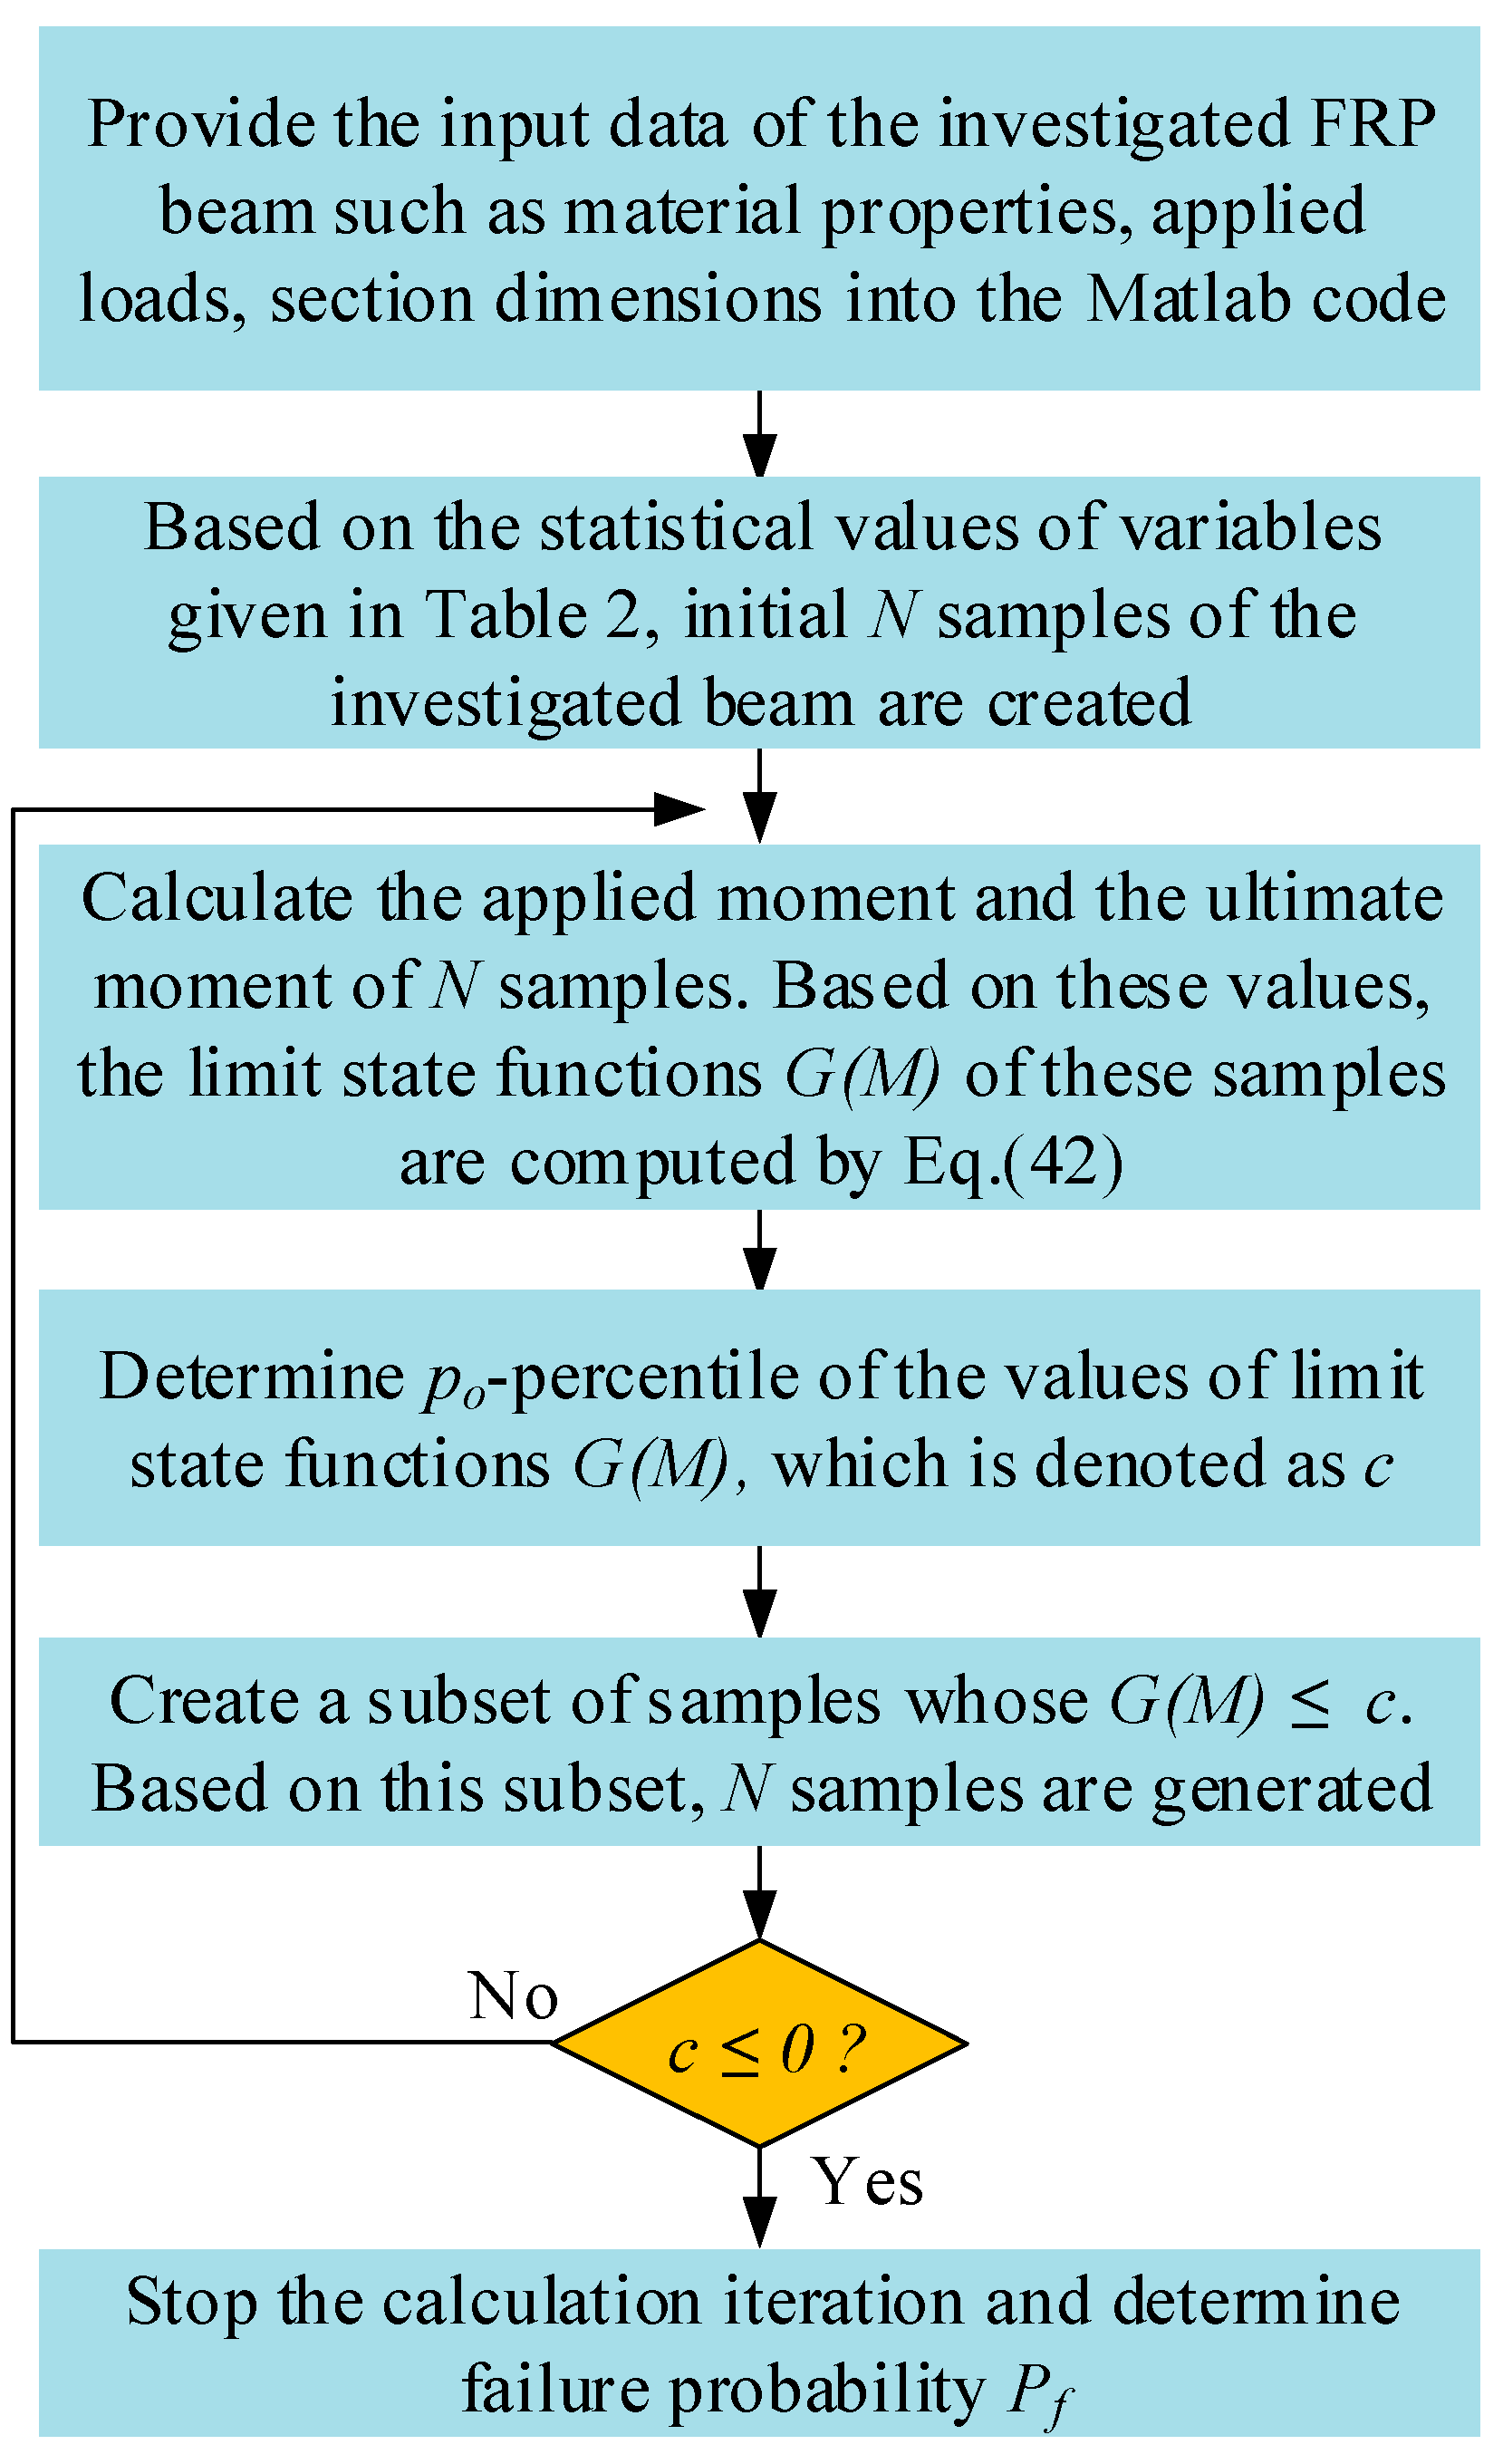
Regarding subset simulation approach, the calculation procedure is presented as follows:
- (i)
At the first step of the approach, the initial
N samples of the investigated beam are generated by using their statistical values in
Table 3.
- (ii)
For each generated sample, the failure mode is determined and the ultimate flexural moment (MR) is calculated by the design equations. The moment caused by applied loads (ML) is also computed.
- (iii)
In the third step, the values of G(M) = ME × MR − ML (Equation (42)) of all samples are calculated. The total number of failed samples Nf is counted if G(M) is less than 0, and the failure probability of at the iteration number k-th is calculated as follows: Pf,k = Nf/N.
- (iv)
In the next step, the
po-percentiles of the values of
G(
M) in step 3, namely
c, are determined (
po is taken as 0.1 [
73]). Then, a set of samples whose
G(
M) values are less than
c will be extracted. This subset is used to generate new
N samples and return to step 2.
- (v)
Steps 2 to 4 are iterated until the value of
c is less than 0. Then, the number of failure samples
Nf of the last iteration is determined. The failure probability and the error are calculated by Equations (45) and (46), respectively. More details of this procedure are illustrated in
Figure 12 and
Figure 13.
where
n is the total number of iterations,
γk is the coefficient given in [
73] and
Pf,k is the failure probability at iteration
k-th.
The calculation processes of these two approaches are used to verify each other by conducting a reliability analysis of an FRP-reinforced concrete beam. This beam has a section width of 200 mm and a section height of 300 mm. The concrete compressive strength
fc, FRP tensile strength
ff and FRP elastic modulus
Ef are 30 MPa, 483 MPa, and 50 GPa, respectively. The value of
ρf//
ρfb ratio fluctuates from 1.0 to 2.5. The uncertainty of variables, their mean-to-nominal ratios,
CoV and type of distribution are presented in
Table 3. The results of the reliability analysis are shown in
Table 4, which demonstrates that the developed procedure is reliable since the reliability indices obtained from Monte Carlo method and subset simulation agree well with each other (the disparity is less than 5.0%). The number of samples are varied to investigate its influence on the reliability index. It can be seen from
Table 5 that this parameter does not significantly affect the reliability index. However, to ensure an error of less than 10%, 5 × 10
6 samples are generated using the Monte Carlo method, while 7000 samples are used in the subset simulation.
4.2. Designed Beams for the Reliability Analysis
To evaluate the presented design documents and investigate the effect of some basic parameters on the reliability indices of FRP-reinforced concrete beams, a group of beams is designed. The compressive strength of concrete ranges from 20 MPa to 120 MPa. Particularly, fc = {20, 50, 80, 100, 120} MPa. The values of FRP tensile strength are ffu = {483, 885, 1230, 1506, 1800, 2540} MPa. The values of the modulus of FRP are Ef = {35, 50, 100, 150, 200} GPa. The width of the section is bc = {150, 200, 300, 400, 500}. The width-to-height ratio of the section is bc/hc = {0.25, 0.55, 0.85, 1.2, 1.5}. Another important parameter is the pf/pfb ratio, which is taken as ρf/ρfb = {0.2, 0.35, 0.5, 0.75, 0.95, 1.02, 1.5, 2.0, 2.5, 5.0}. In summary, the total number of specimens that will be used as the input for the reliability analysis is 5 × 6 × 5 × 5 × 5 × 10 = 37,500 specimens for each design guideline and standard. Regarding the applied loads, it is assumed that the nominal dead load Dn is equal to the nominal live load Ln throughout the study to conduct the analysis, and the effect of Ln/Dn ratio is only considered in the parametric study. It should be noted that other types of loads such as wind, snow, and earthquakes are not considered in this study. The load combinations in the case of combined Dn and Ln to determine the total applied load G are dependent on each design guideline and standard. Particularly, the load combinations are G = 1.2Dn + 1.6Ln, G = 1.25Dn + 1.5Ln, and G = 1.35Dn + 1.5Ln, corresponding to ACI, CSA, and CEB-FIB.
5. Results and Discussions
Based on the developed reliability analysis procedure, 37,500 FRP-reinforced concrete beams are analysed. The results of the analysis are presented in
Figure 14 and
Figure 15,
Table 6 and
Table 7. In
Table 6, the range of the reliability indices is illustrated. In the case of concrete crushing,
β is in the range from 3.02 to 5.06, 2.91 to 5.54, and 3.58 to 4.87 corresponding to ACI 440.1R, CEB-FIB, and CSA S806 standards. In the case of FRP rupture,
β ranges from 3.48 to 5.01, and 3.21 to 5.23 corresponding to ACI 440.1R, and CEB-FIB model code.
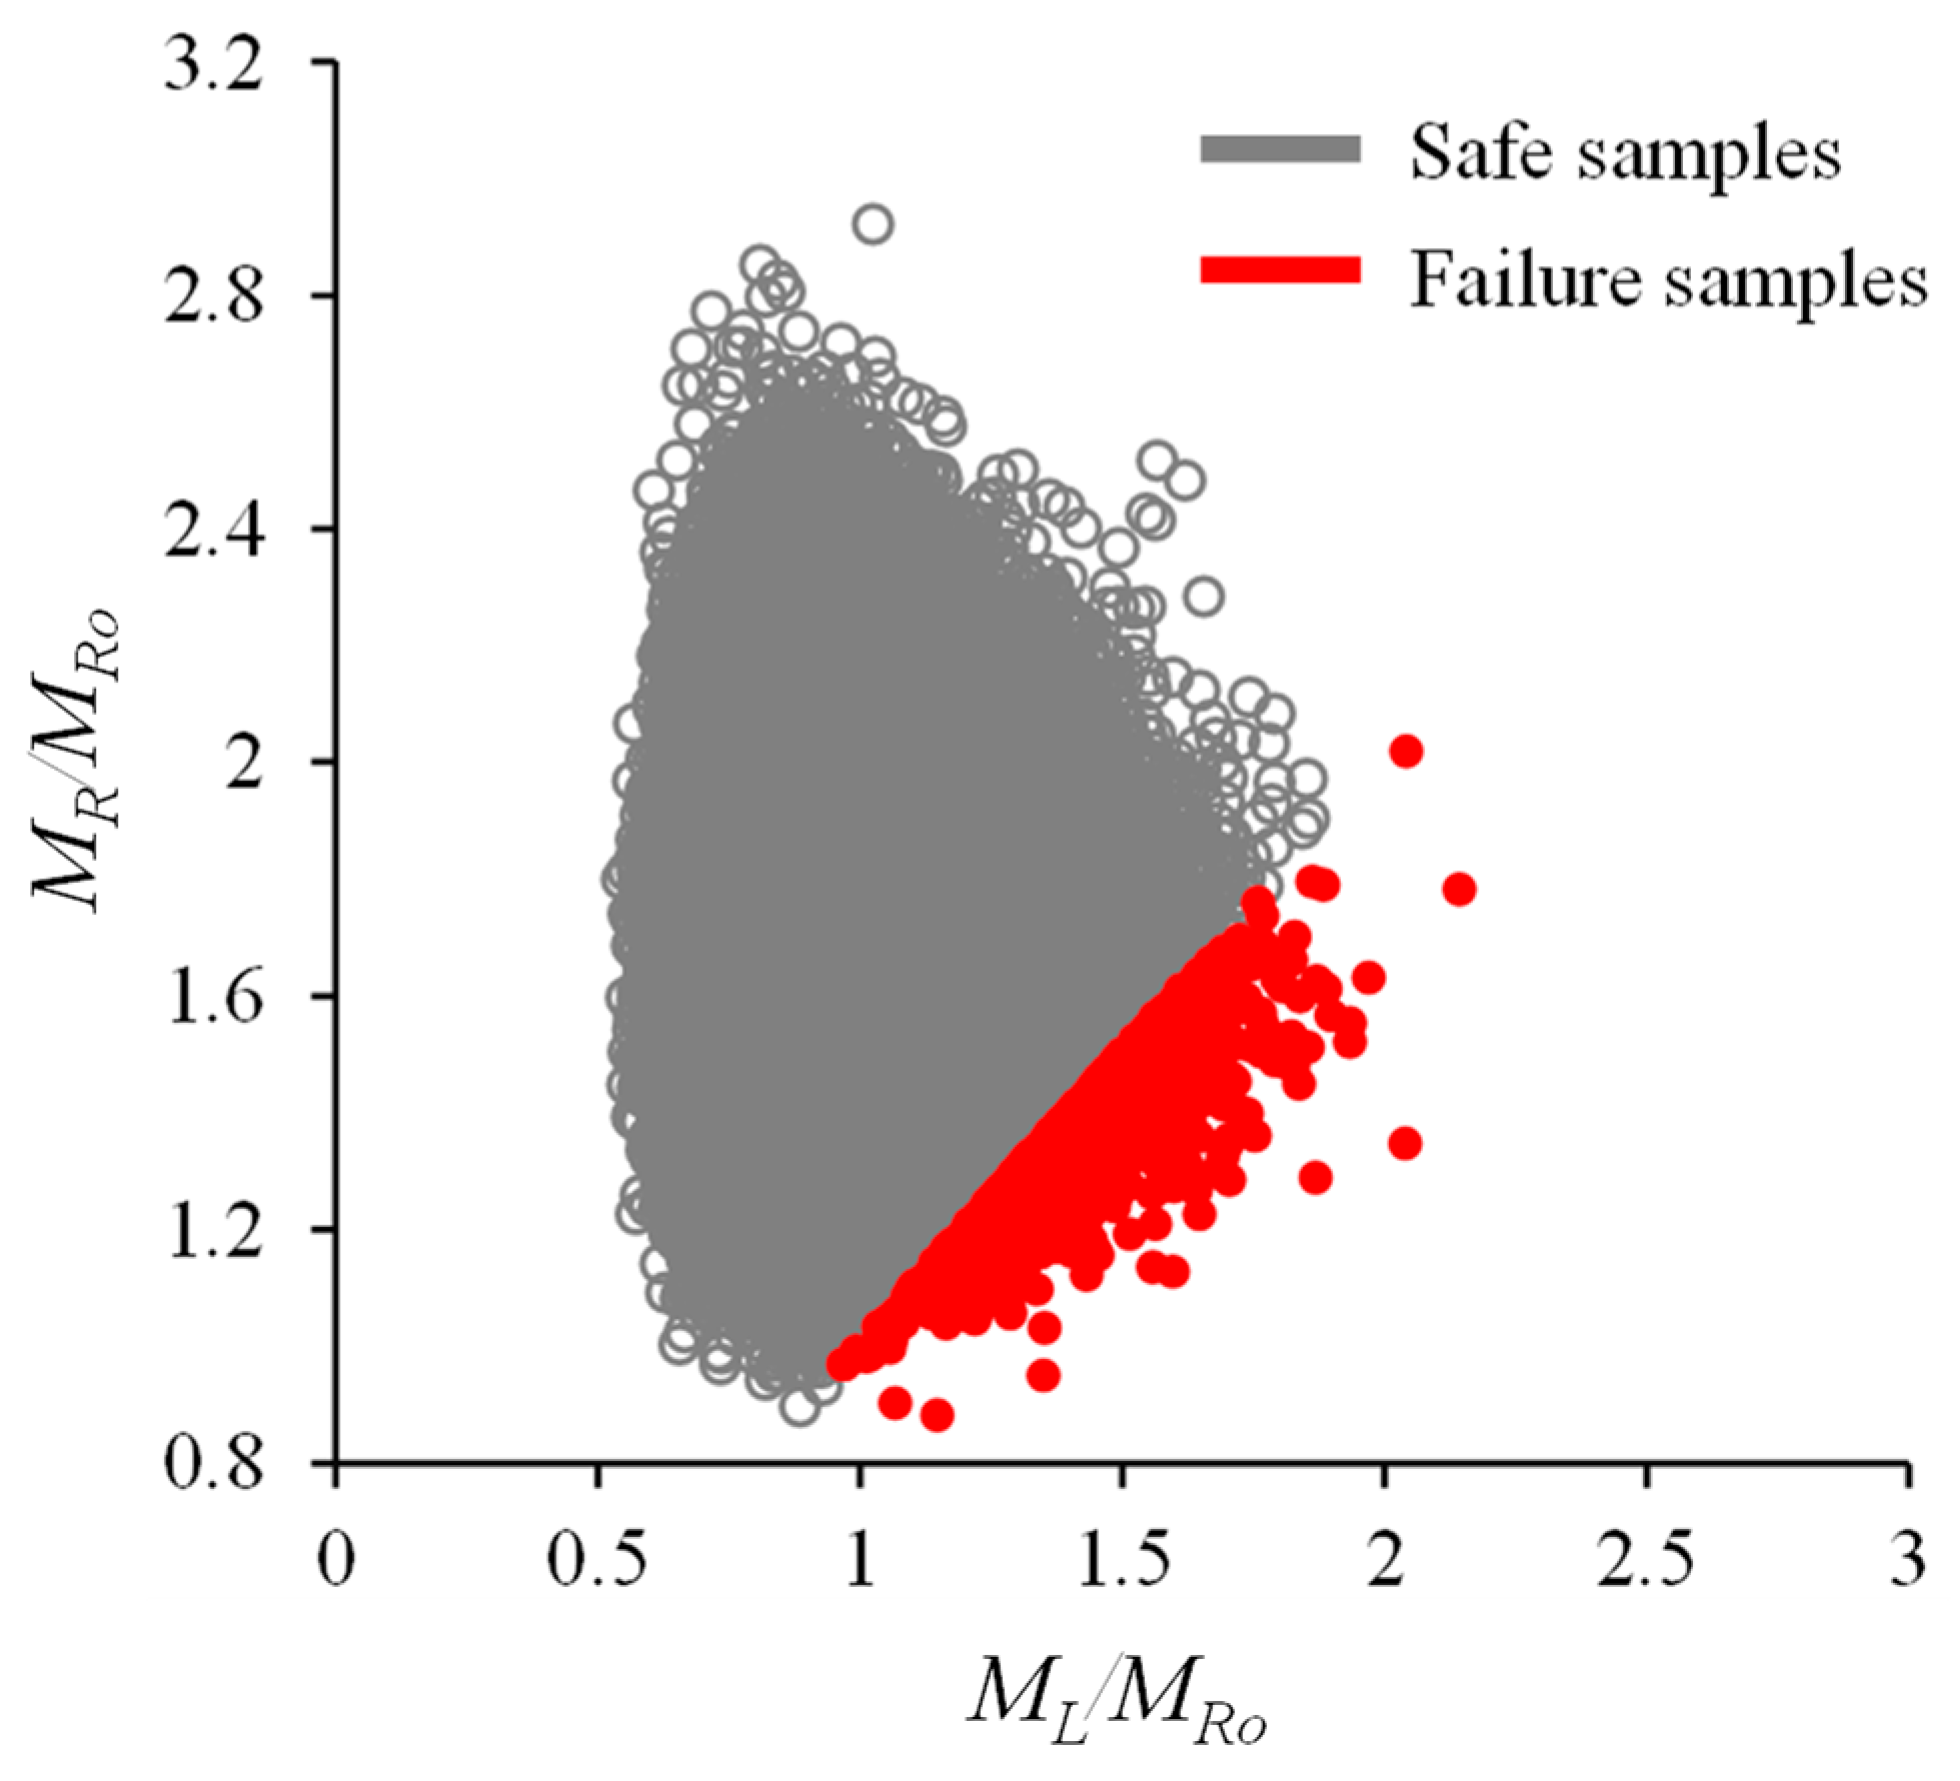
Figure 14 illustrates the range of reliability indices of the investigated beams. It should be noted in this figure that safe samples are beams with a reliability index higher than the target reliability index
βT, while failed samples have a reliability index smaller than
βT. As can be seen from the figure, the percentage of failed samples in the case of concrete crushing are higher than those in the case of FRP ruptures. Especially, there are no failed samples in the case of FRP rupture when beams are designed by ACI 440.1R (
Figure 14a). The design by CSA S806 is also quite safe since very few beams fail (
Figure 14e).
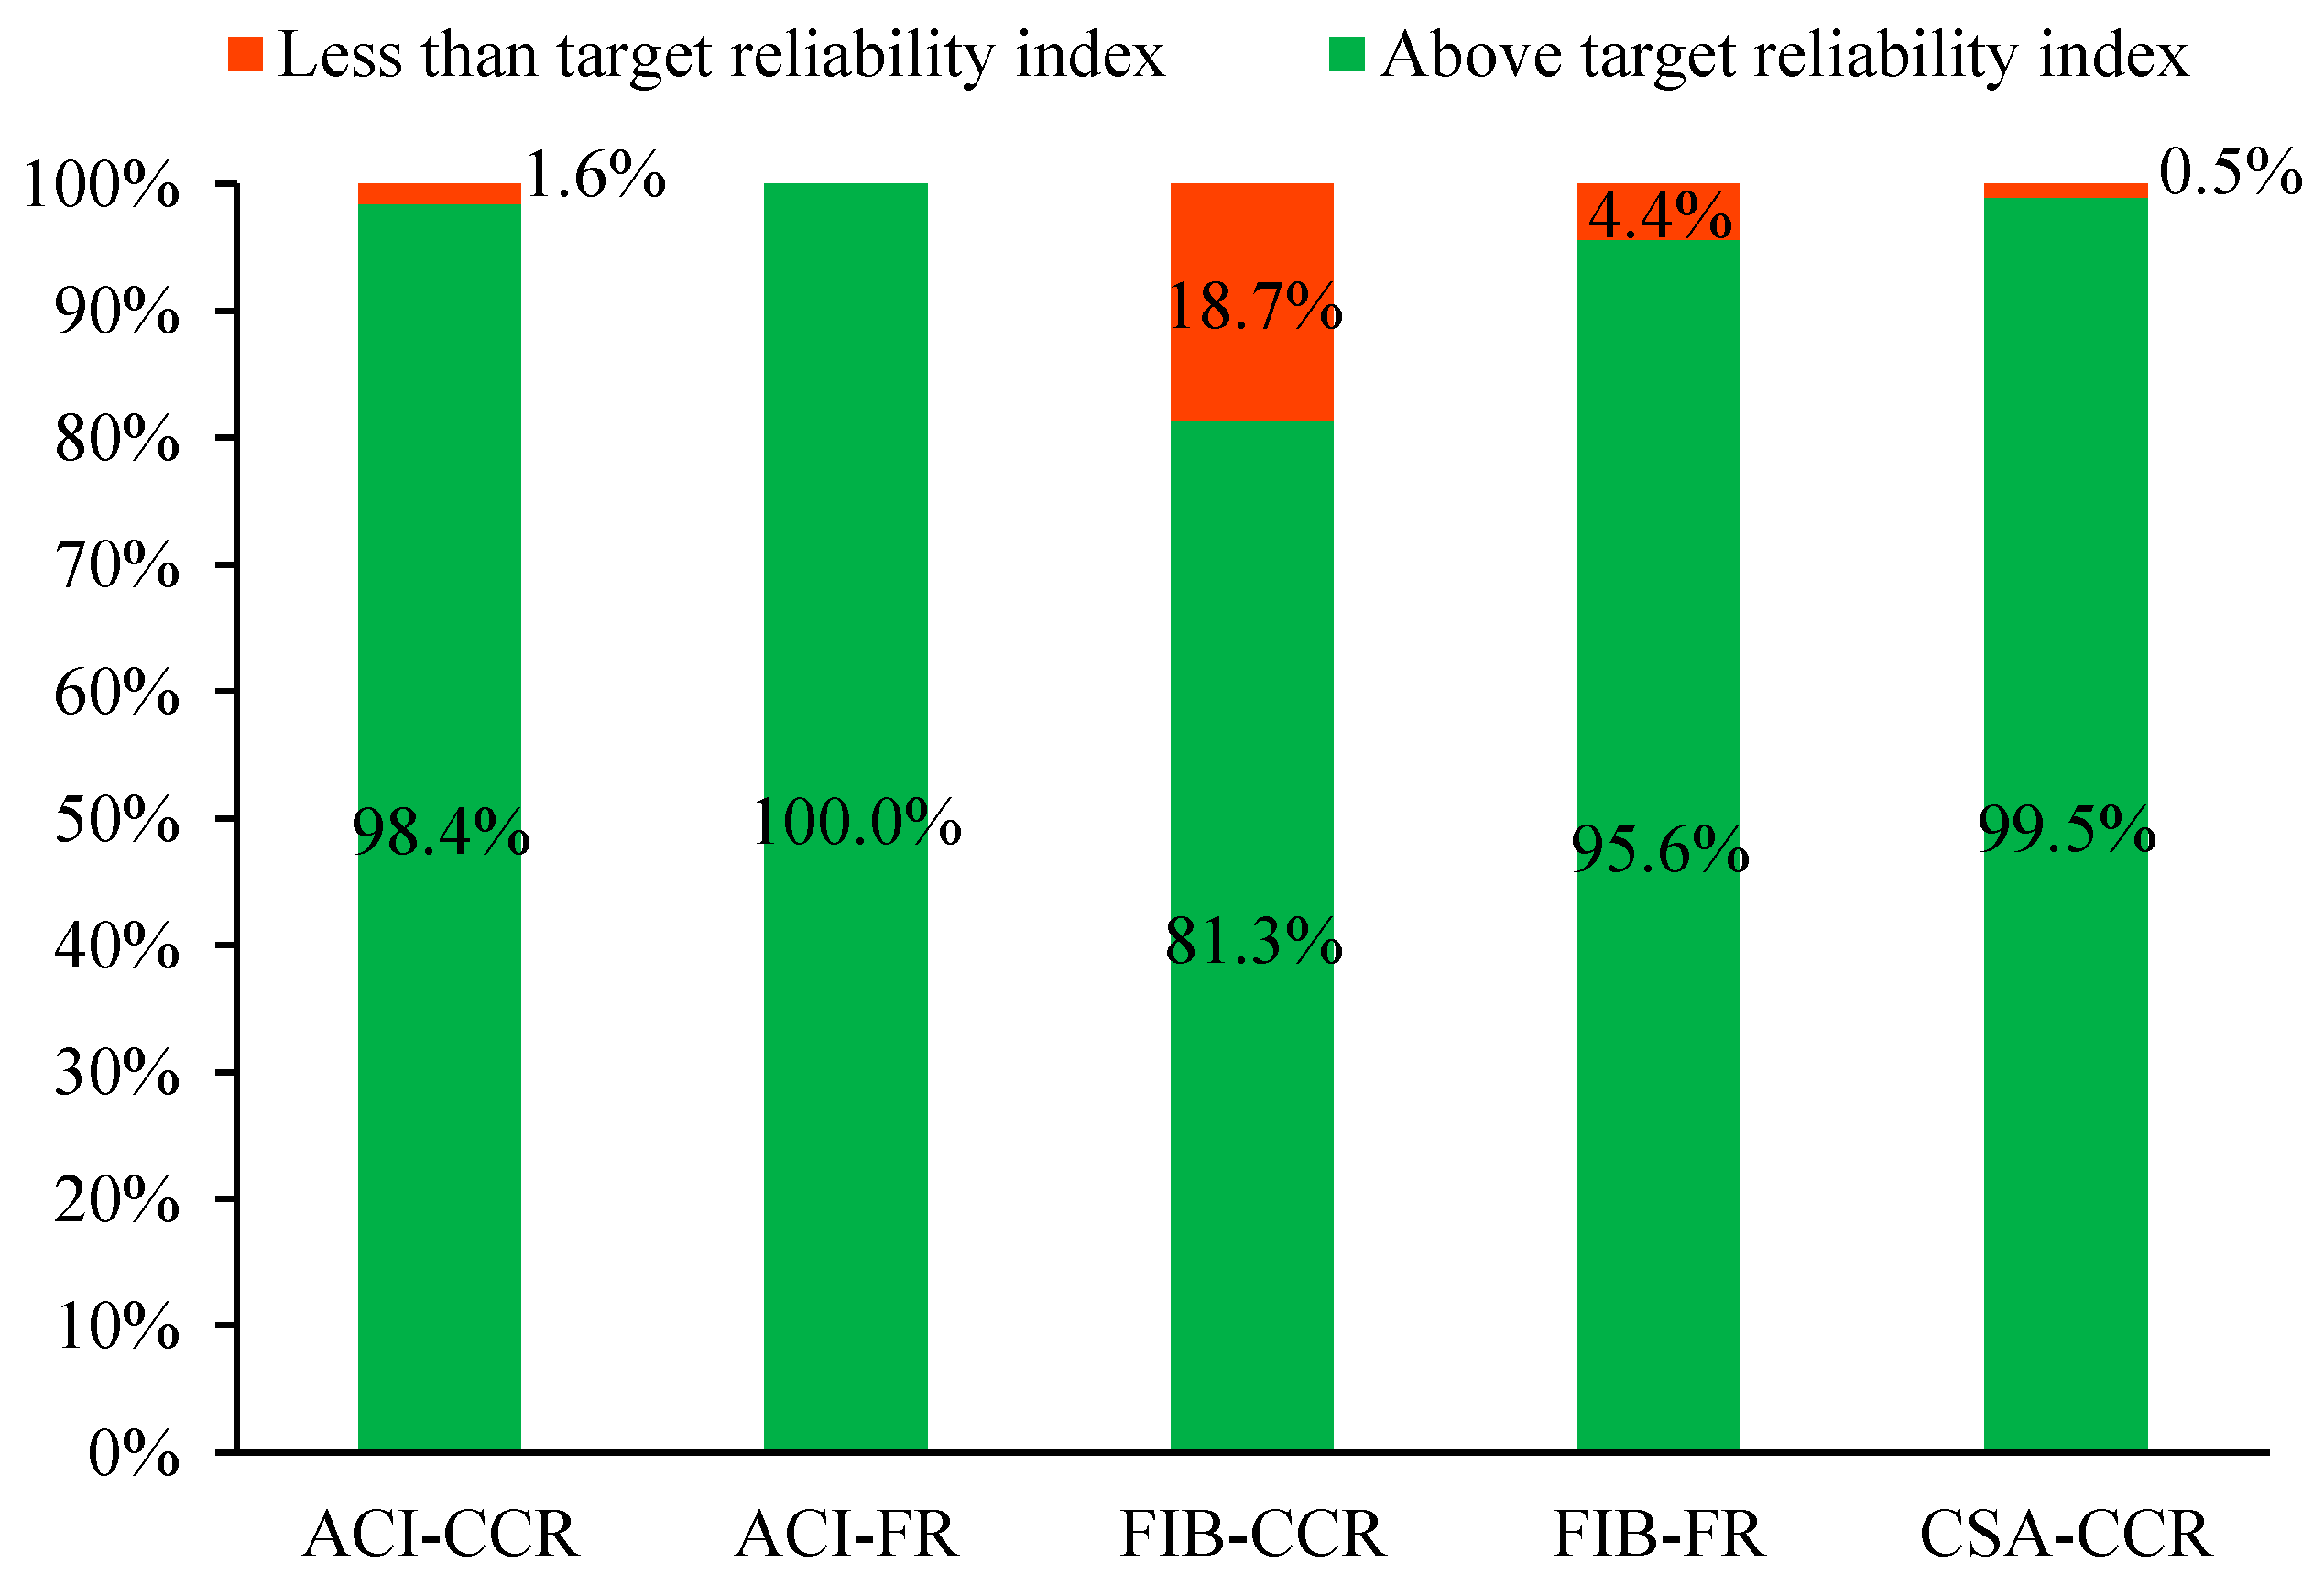
Table 7 and
Figure 15 present the percentage of specimens with the reliability indices exceeding the target reliability index
βT. In the case of ACI 440.1R, the percentage of specimens with a reliability index higher than
βT are 98.4% and 100% corresponding to concrete crushing and FRP rupture. In the case of the CEB-FIB model code, 95.6% of specimens exceed
βT when FRP rupture occurs. However, when the failure mode is concrete crushing, only approximately 81.3% of specimens exceed
βT. Hence, it is recommended to increase the safety factor for the design in this case. In the case of CSA, the percentage of specimens that have the reliability indices higher than
βT are 99.5%, which is quite high.
To investigate the influence of key parameters on the reliability indices of FRP-reinforced beams, a typical beam is selected. The width of the beam is 200 mm, the height of the beam is 300 mm, the compressive strength of concrete is 30 MPa, the tensile strength of FRP bars is 483 MPa, ρf/ρfb is 1.5 and the elastic modulus of FRP bars is 50 GPa.
5.1. The Effect of Ln/Dn Ratio
The influence of
Ln/Dn ratio on the reliability indices of FRP-reinforced concrete beams is investigated by changing this ratio from 0.5 to 2.5. The specific values of
Ln/Dn considered in this part are 0.5, 1.0, 1.5, 2.0, 2.5. The reliability indices
β of beams corresponding to these ratios are determined by the proposed reliability analysis procedure, and the relationships between
β and
Ln/Dn are shown in
Figure 16 and
Table 8.
Table 8 indicates that the reliability indices of beams designed by CSA S806 and CEB-FIB are obviously higher than those of beams designed by ACI 440.1R. This phenomenon occurs because the mean values of the live load given in CSA S860 and CEB-FIB are much smaller than that of ACI 440.1R (see
Table 3). Moreover,
Table 8 also reveals that the reliability indices go down when the
Ln/Dn ratio rises.
Figure 16 demonstrates the effects of
Ln/Dn ratio and the model error (ME) on the reliability indices. In the case of ACI 440.1R, when the
Ln/Dn ratio rises from 0.5 to 2.5, the values of the reliability indices diminish from 5.1 to 4.17, 3.75 to 3.395, and 4.61 to 4.02 corresponding to the simulation without model error, with model error (
CoV = 0.19) and with
CoV = 0.1. In the case of CSA S806, a similar trend to that of ACI440.1R has been observed. When the
Ln/Dn ratio rises from 0.5 to 2.5, the values of the reliability indices reduce from 6.02 to 4.95, 4.22 to 3.91, and 5.8 to 4.75 corresponding to the simulation without model error, with model error (
CoV = 0.21) and with
CoV = 0.1. In the case of the CEB-FIB model code, the increase in
Ln/Dn ratio from 0.5 to 2.5 also leads to a reduction in the reliability indices from 5.21 to 4.3, 4.09 to 3.81, and 4.97 to 4.05 corresponding to the simulation without model error, with model error (
CoV = 0.22) and with
CoV = 0.1. The reduction in the values of reliability index occurs because the
CoV of the
Ln (which is 0.25) is slightly larger than the
CoV of the
Dn (which is 0.1). As a result, when the value of
Ln/Dn ratio grows, the failure probability increases, and the reliability index of the investigated beams decreases. In addition, it is obvious that the reliability indices decline significantly when the model error is applied (
Figure 16).
5.2. The Effect of bc/hc Ratio
The influence of the
bc/hc ratio on the reliability indices of the investigated FRP-reinforced concrete beams is illustrated in
Figure 17 and
Table 9. As can be seen from
Table 9, the
bc/hc ratio has a negligible effect on the reliability indices of the investigated beams. When
bc/hc ratio is increased from 0.25 to 1.5, the reliability indices of beams designed by ACI 440.1R, CSA S806, and CEB-FIB fluctuate by approximately 3.7% (from 3.51 to 3.64), 0.27% (from 4.086 to 4.075), and 4.8% (from 3.72 to 3.9), respectively. More visible details are depicted in
Figure 17. This figure also indicates that model error can affect the reliability indices of FRP-reinforced concrete beams significantly. When the model error is applied, the maximum reliability indices of the beams designed by ACI 440.1R, CSA S806 and CEB-FIB are 3.64, 4.1, and 3.92, respectively. However, when the model error is not considered, these values increase substantially to 4.91, 5.56, and 4.79 corresponding to significant increases of 34.9%, 35.6%, and 22.1%.
5.3. The Effect of ρf/ρfb Ratio
The
ρf/ρfb ratio plays a critical role in the behavior of FRP-reinforced concrete beams. It also has certain influences on the reliability index of the beams as shown in
Figure 18 and
Table 10. In the case of the ACI design code (
Figure 18a), the value of
β almost remains constant when
ρf/ρfb is less than 1.0. When
ρf/ρfb increase from 0.95 to 1.5,
β reduces gradually from 5.96 to 4.73, 5.54 to 4.56, 4.42 to 3.63 corresponding to the simulation without model error, with
CoV = 0.1 and with model error. When
ρf/ρfb exceeds 1.5,
β almost remains constant. A notable observation is that when
ρf/ρfb is larger than 1.0, the values of
β in the case of ACI 440.1R decline gradually before it remains constant when
ρf/ρfb is larger than 1.5. This phenomenon appears because the resistance of the beam is reduced by a safety factor which increases from 0.55 to 0.65 when
ρf/ρfb increases in this range (see Equation (11)). In the case of the CEB-FIB model code (
Figure 18b), when
ρf/ρfb rises from 0.75 to 1.02,
β decreases significantly from 5.5 to 4.76, 5.1 to 4.57, 4.5 to 3.88 corresponding to the simulation without model error, with
CoV = 0.1 and with model error. Once
ρf/ρfb exceeds 1.0, the fluctuation in the value of
β becomes negligible. In the case of CSA S806 (
Figure 18c), the values of
β vary slightly when
ρf/ρfb is increased. It should be noted that FRP rupture is not permitted in the design by CSA; therefore, only
ρf/ρfb >1.0 is considered in the analysis.
5.4. The Effect of ffu and fc
Figure 19 demonstrates that concrete compressive strength
fc has minimal influences on the reliability indices of the investigated beams. When
fc rises from 20 MPa to 120 MPa, the reliability indices of beams almost remain constant. In contrast, the model error affects the reliability indices dramatically. When the model error is accounted in the analysis, the maximum reliability indices of the beams designed by ACI 440.1R, CEB-FIB, and CSA S806 are 3.66, 3.97, and 4.13, respectively. However, when the model error is not considered, the maximum reliability indices of the beams increase significantly to 4.89, 4.72, and 5.58 corresponding to beams designed by ACI 440.1R, CEB-FIB, and CSA S806.
Figure 20 illustrates that the effect of
ffu on the reliability indices of FRP-reinforced concrete beams is negligible.

