1. Introduction
Granite residual soil is commonly found in regions where weathering effects are pronounced, often demonstrating reduced strength upon water infiltration [
1,
2,
3]. Some completely weathered granite residual soils possess a high content of fine grains, endowing them with characteristics such as better water retention, higher liquid limits, and higher moisture content in the natural environment [
4,
5]. When utilized as subgrade fillings, compacted granite residual soils typically exist in an unsaturated state, with densities and moisture contents near optimum conditions. In the presence of external wetting factors such as groundwater elevation or rainfall infiltration, compacted soil layers will experience a decrease in void ratio, an increase in degree of saturation, and a decrease in soil suction [
6]. Instances of excessive deformation and even failure in rockfill dams and highways attributed to wetting-induced settlement have been reported [
1,
7,
8]. This raises concerns regarding the potential for subgrade constructed using granite residual soil with high liquid limits to experience significant increases in moisture content during operational periods, owing to their enhanced water retention characteristics. Therefore, it is imperative to investigate the deformation induced by wetting in high-fill embankments to mitigate the risk of structural failure, particularly in the case of granite residual soil, which has been demonstrated to be sensitive to water infiltration [
9,
10].
Triaxial tests [
11,
12,
13] and one-dimensional oedometer tests [
14,
15,
16] are commonly utilized in measuring wetting deformation for unsaturated soils. These test methods are further classified based on the wetting and loading path as single-line method and double-line method [
12,
13], as indicated in
Figure 1. In the double-line method, two identical soil samples are initially compressed to the desired vertical stress, following which one sample is fully soaked and saturated. Subsequently, both samples are compressed to the target vertical stress, and the difference in deformation after stabilization between these samples is considered the wetting deformation. Conversely, in the single-line method, a soil sample is directly compressed to the target vertical stress and then fully saturated with water. The wetting deformation is determined as the difference between the deformation measured before water infiltration and that measured after saturation. The single-line method is often regarded as more representative of practical conditions, as it accounts for the influence of wetting on the stress path [
12]. In contrast, the double-line method overlooks this influence, potentially resulting in measurement bias [
13,
17].
To evaluate the wetting deformation in unsaturated soils, significant efforts have been dedicated to establishing functions that correlate initial states, such as void ratio and moisture content, based on data obtained from oedometer tests or triaxial tests [
18,
19,
20]. For numerical simulations, various constitutive models have been explored. Some models are based on the nonlinear elastic assumption, such as the modified Duncan-Chang model proposed by Chen et al. [
21] and Gao et al. [
22]. And some are founded on the elastoplastic assumption, such as the Barcelona Basic model [
23]. To better account for the influence of saturation variation resulting from changes in stress or suction, some models incorporate hydraulic components [
24,
25]. However, as models become more detailed by considering additional influential factors, the calibration of more parameters becomes necessary, which can hinder practical application. In practical engineering, it is crucial to develop models that rely on easily measurable indicators [
26].
The deformation of unsaturated soil is intricately linked to the wetting process. However, in current single-oedometer tests, samples are typically fully soaked in water, allowing only the initial and saturated conditions to be measured in the void ratio-moisture content plane [
15,
27]. In this study, a novel one-dimensional odometer was developed to control the moisture content change for soil samples. Multi-step wetting tests were designed and conducted to examine the influence of water infiltration using the newly devised device. Furthermore, wetting deformation based on both double-line and single-line methods using conventional oedometers was performed to analyze the influence of test methods. Previous studies have highlighted the close relationship between the wetting deformation of soil samples and microstructure changes [
28,
29,
30]. Therefore, the pore size distribution curves of soil samples were measured using Mercury Intrusion Porosimetry (MIP) tests, and differences between soil samples with different initial states were analyzed. By analyzing the relationship between soil’s initial states and wetting deformation, a prediction model was established by combining an equation proposed by Gao et al. [
15] with a piecewise function derived from the multi-wetting test results. The matric suction before and after wetting, determined through the measurement of the soil water characteristic curve (SWCC), were incorporated into the established prediction models, enabling the direct evaluation of wetting deformation using the parameters of the soil’s states.
2. Materials and Methods
2.1. Materials
The tested granite residual soil was sampled from an excavation site for a highway under construction in Jiangxi Province, southeast China. Sieving tests, hydrometer analysis, and Atterberg tests were conducted based on China Test Methods of Soils for Highway Engineering (MOT CNS JTG3430-2020) [
31]. The physical parameters of the tested soil are indicated in
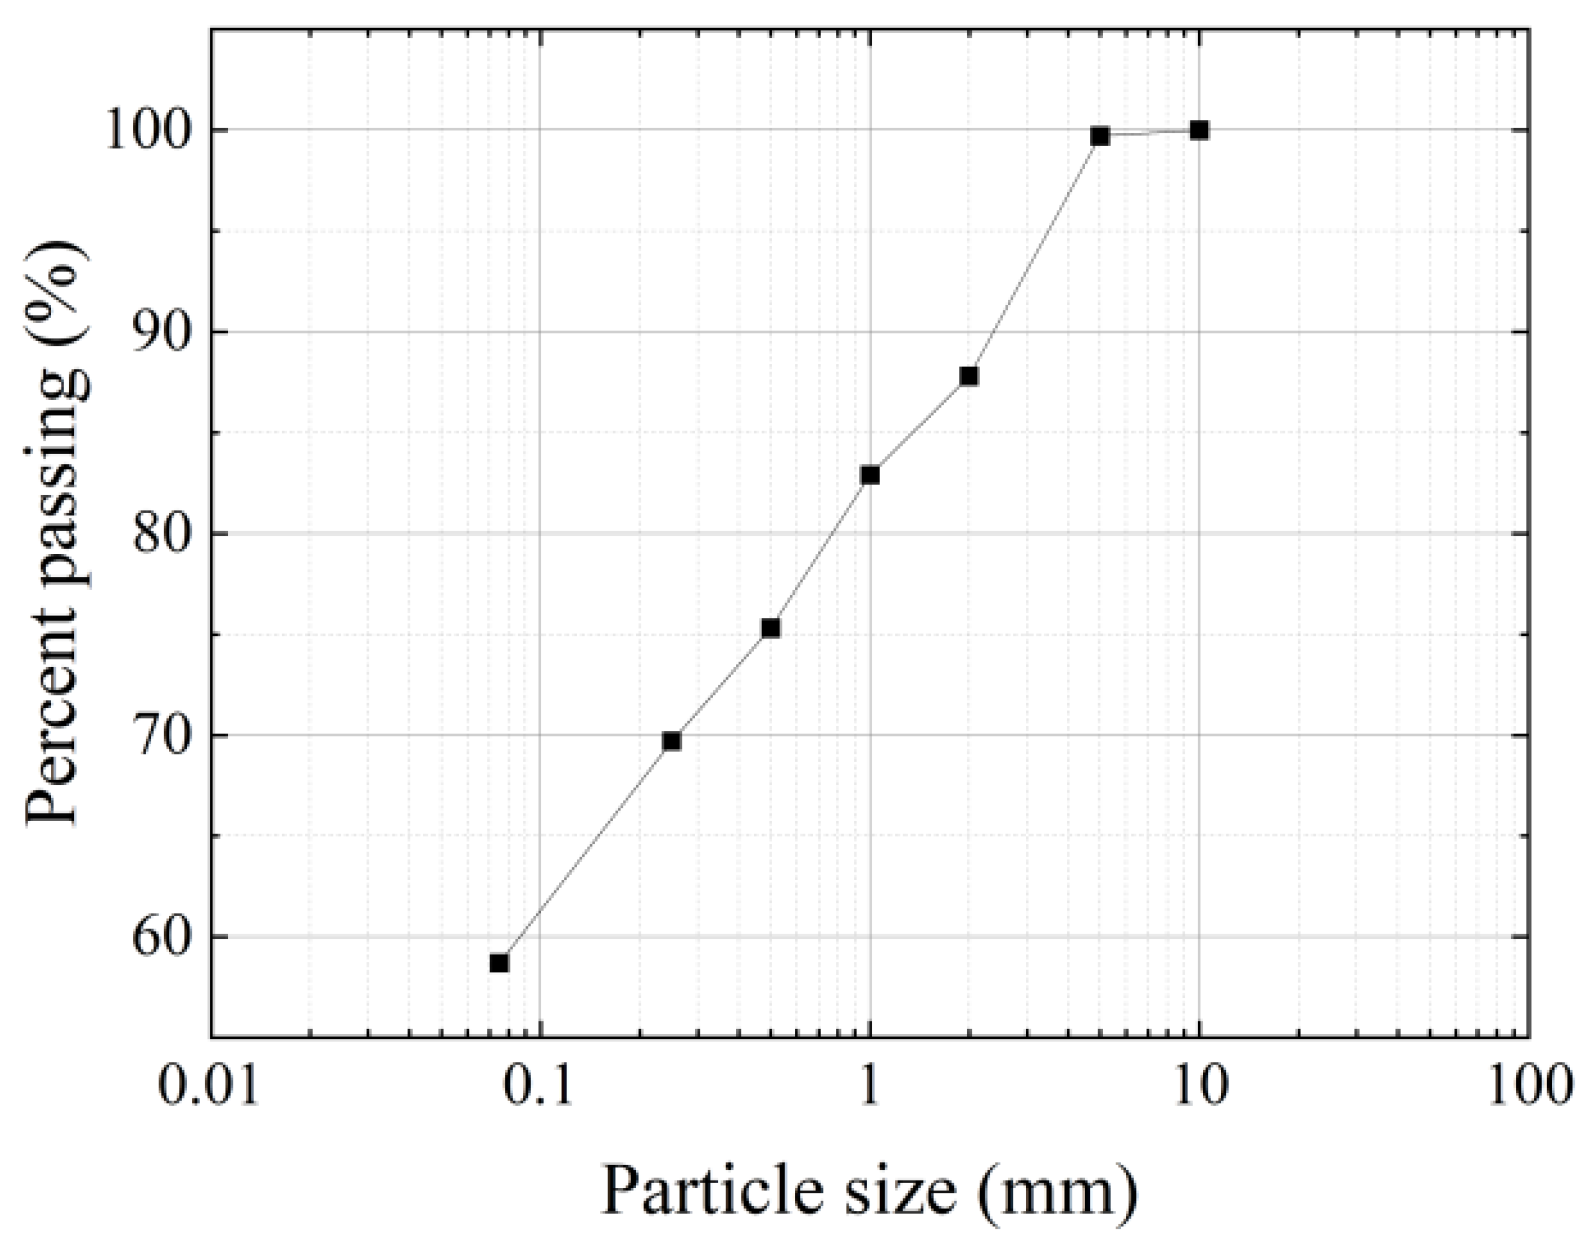
Table 1, and the cumulative particle-size distribution curve is plotted in
Figure 2. Test results indicated that the moisture content of the tested soil in nature had reached 29%, and the liquid limit was 62%. Based on the Unified Soil Classification System (ASTM D2487) [
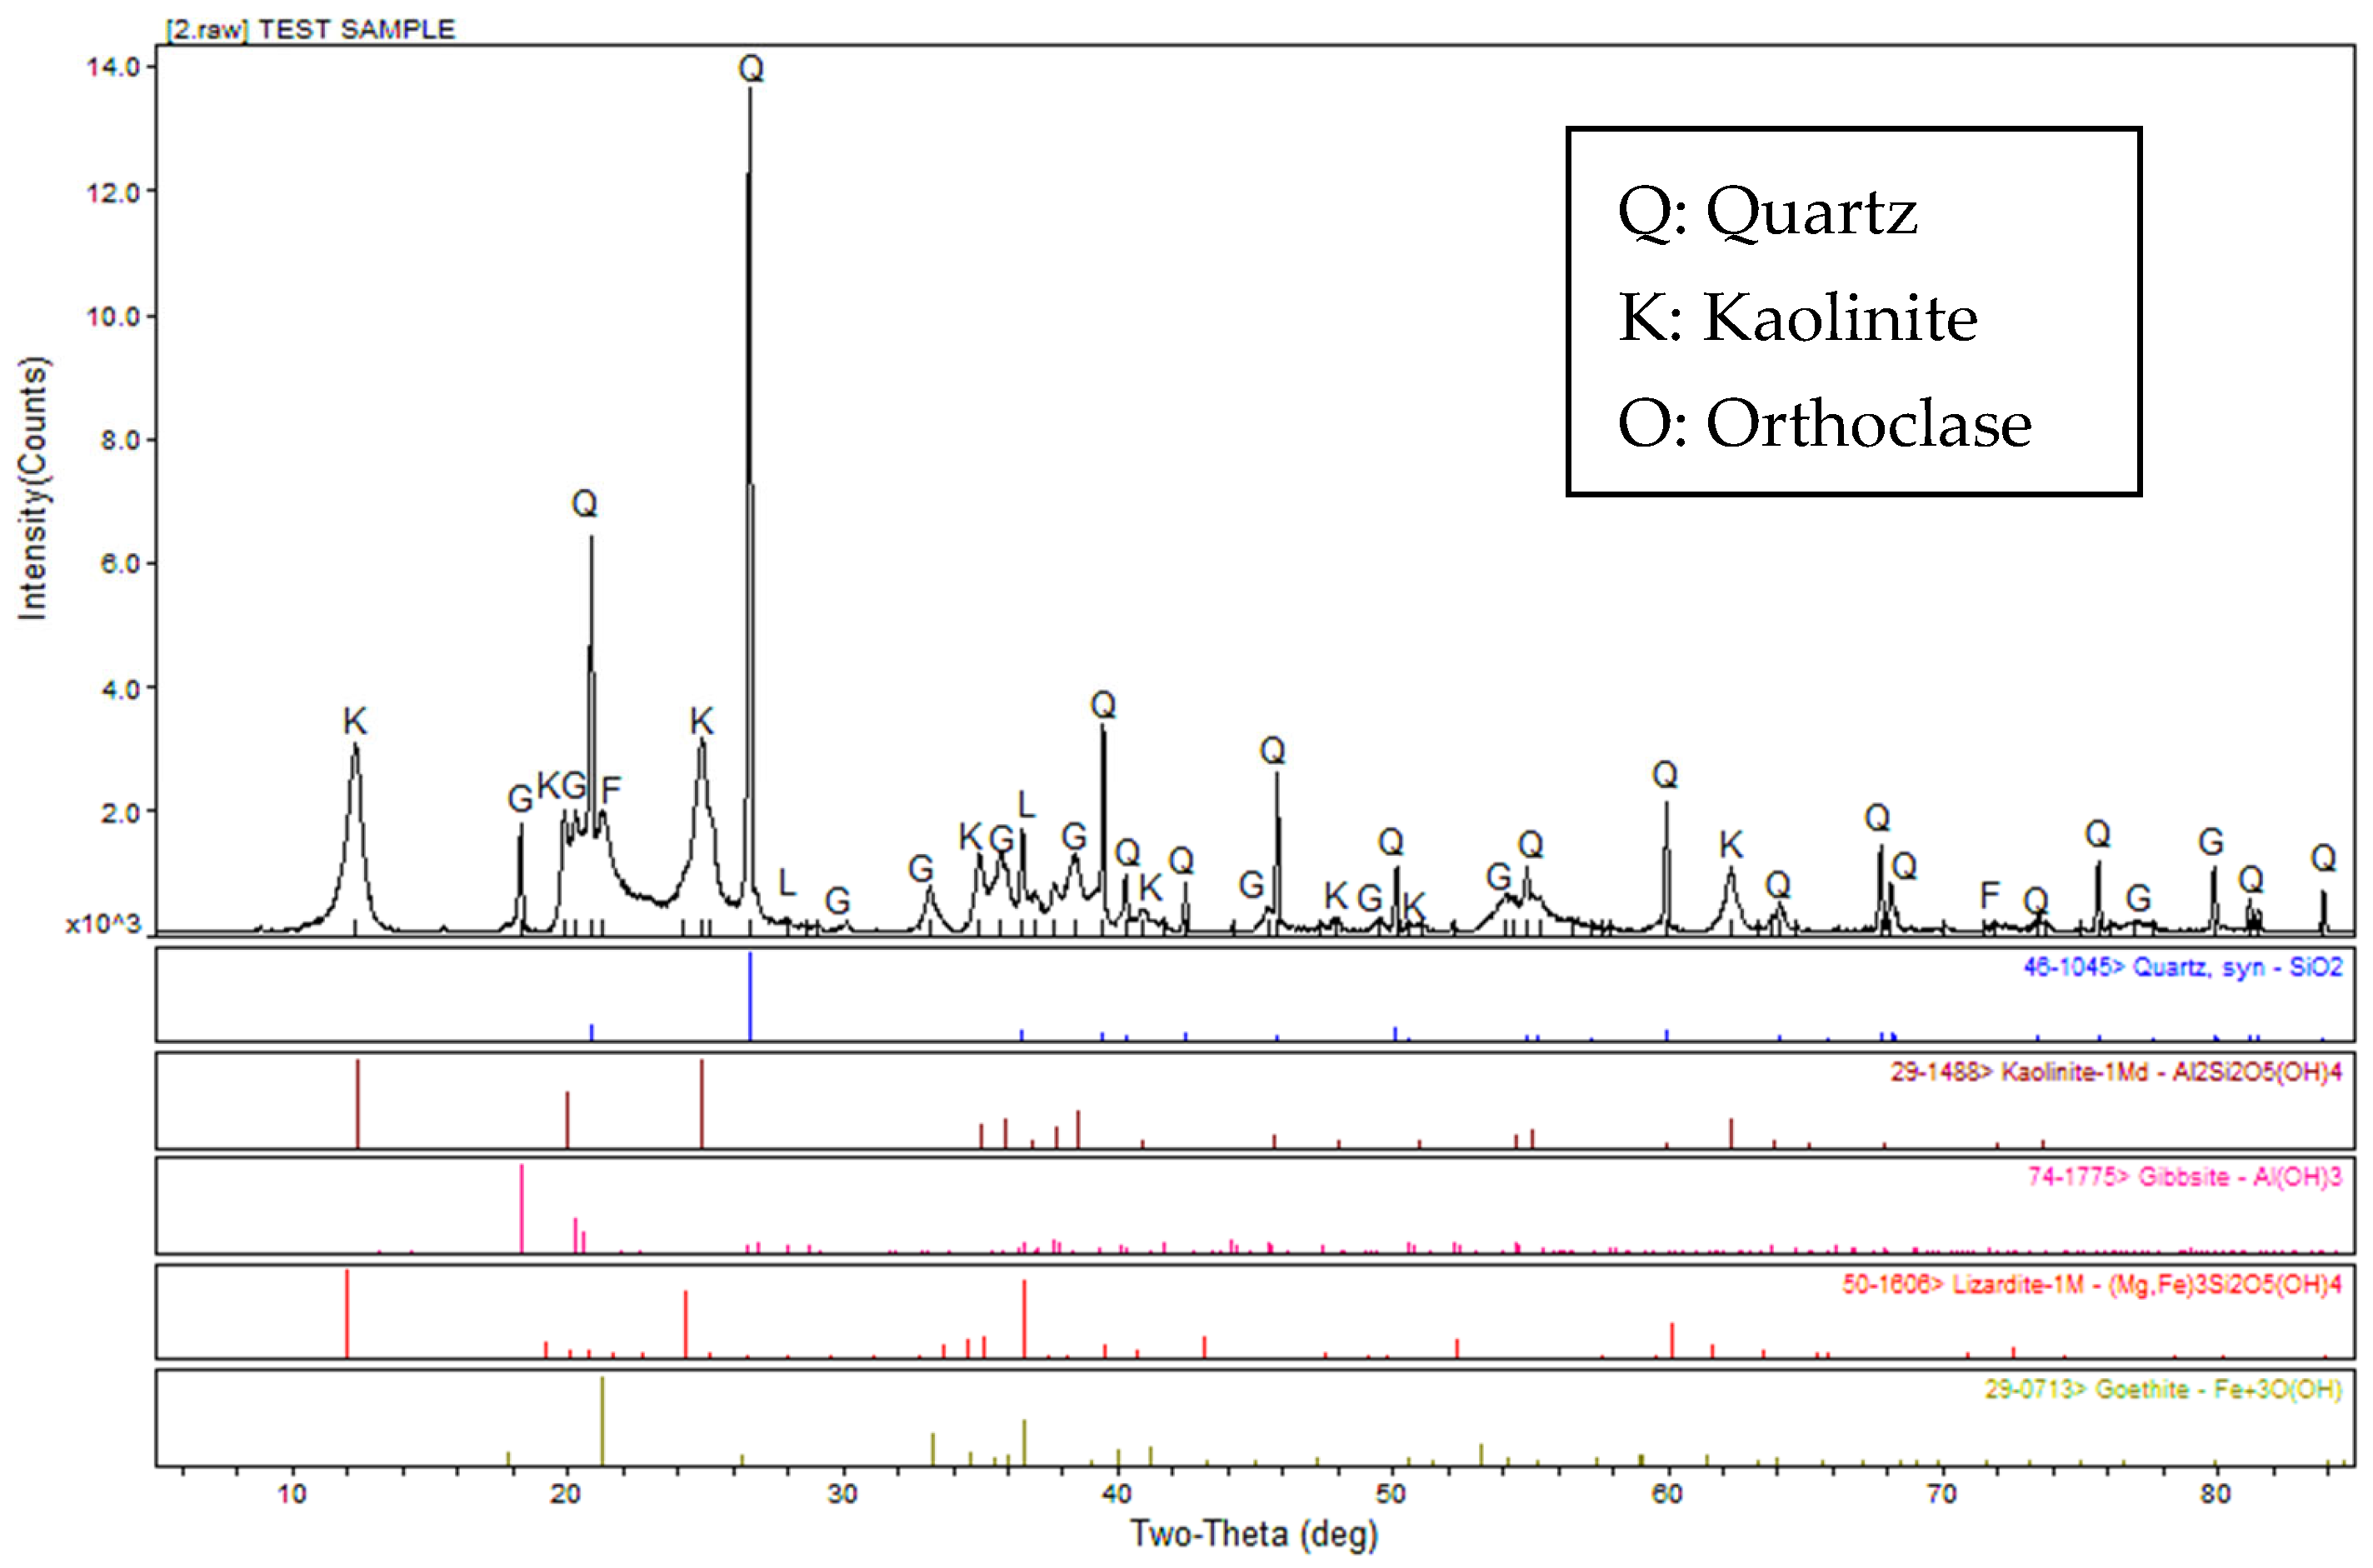
32], the sampled granite residual soil is classified as fat clay (CH). An X-ray diffraction test was conducted as indicated in
Figure 3. The existence of quartz and kaolinite indicated that the tested sample was sensitive to water. Moreover, the bauxite, chlorite, and ferric minerals were found in the tested granite residual soil, which made the sampled soil appear red in color and explained the existence of abundant fine grains.
2.2. Sample Preparation
A series of compaction tests with three different load levels were conducted based on China Test Methods of Soils for Highway Engineering (MOT CNS JTG3430-2020) [
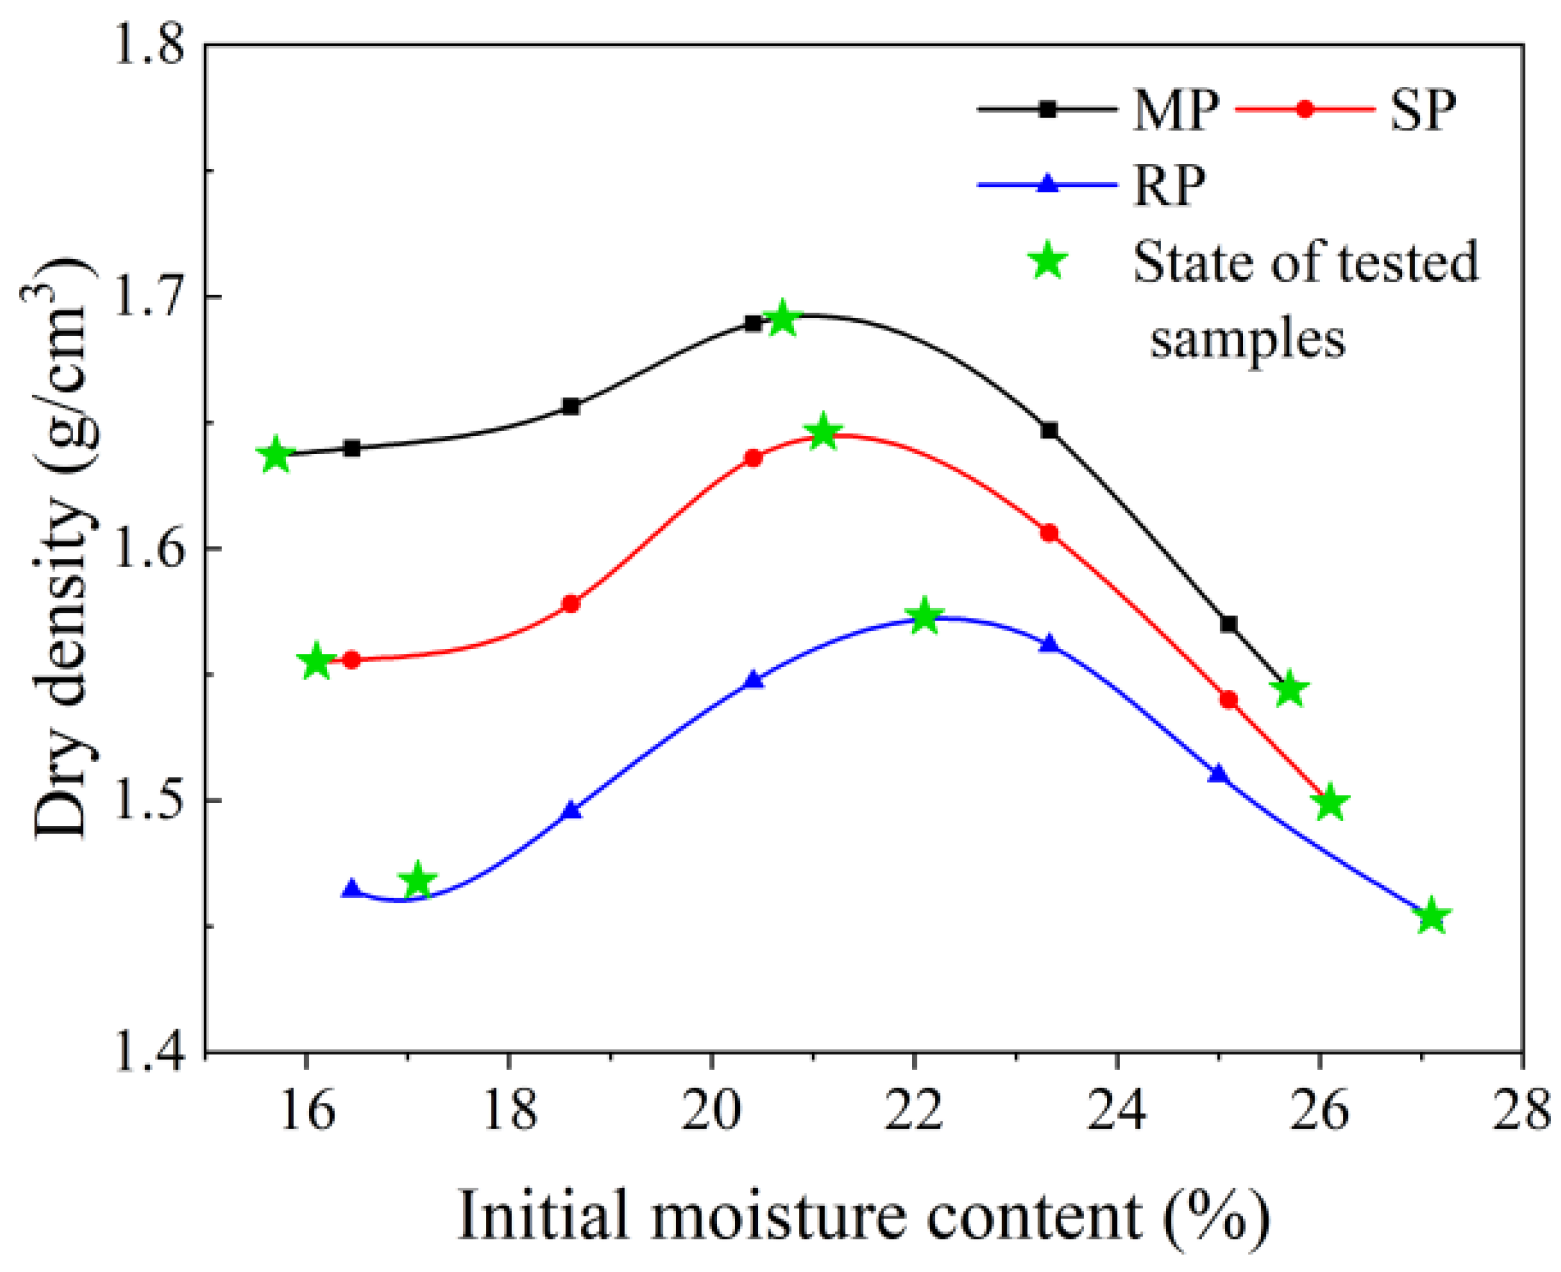
31]. The compaction effort level was controlled by setting the compaction numbers as 98, 50, and 30 times, respectively, which were regarded as Modified Proctor (MP), Standard Proctor (SP), and Reduced Proctor (RP). The corresponding density and moisture content curves were plotted in
Figure 4. To compare the influence of initial moisture content and densities, nine different initial states were selected from the compaction curve as indicated in
Figure 4 and
Table 2.
Sampled soils with natural moisture content were air-dried first, crushed, and then passed through a 2 mm sieve. Due to the high natural moisture content, the sampled soil was air-dried to the target moisture content and then sealed in plastic bags for 24 h. Next, the moisture content of soil was tested using the gravimetric method to ensure that the actual value was almost identical to the target. Then the soil was compacted by static loading into a specimen ring, which was 20 mm in height and 61.8 mm in diameter.
2.3. Saturated Wetting Odometer Tests Using Single-Line and Double-Line Method
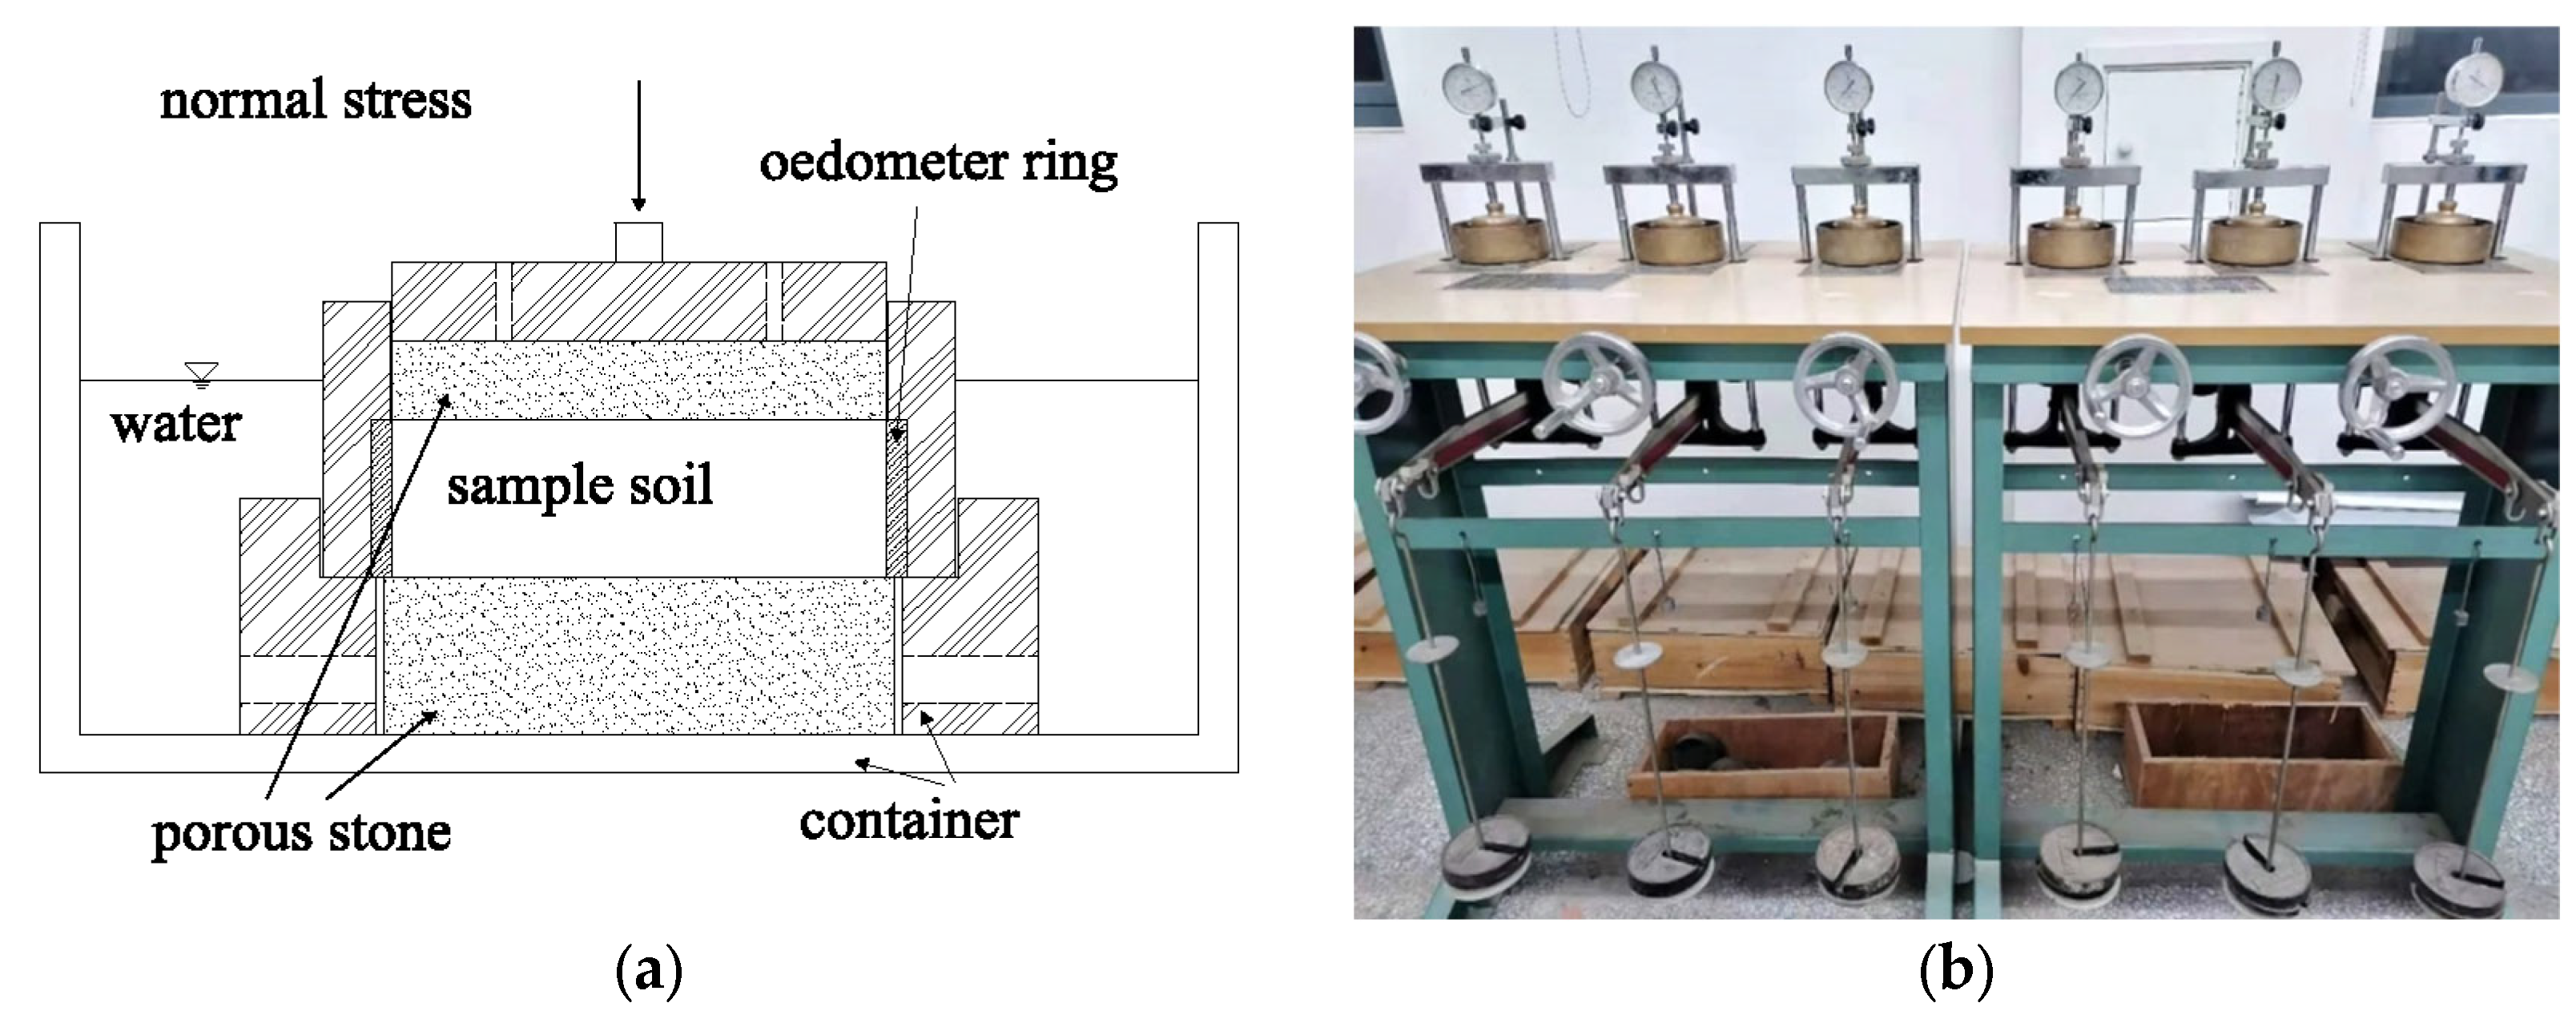
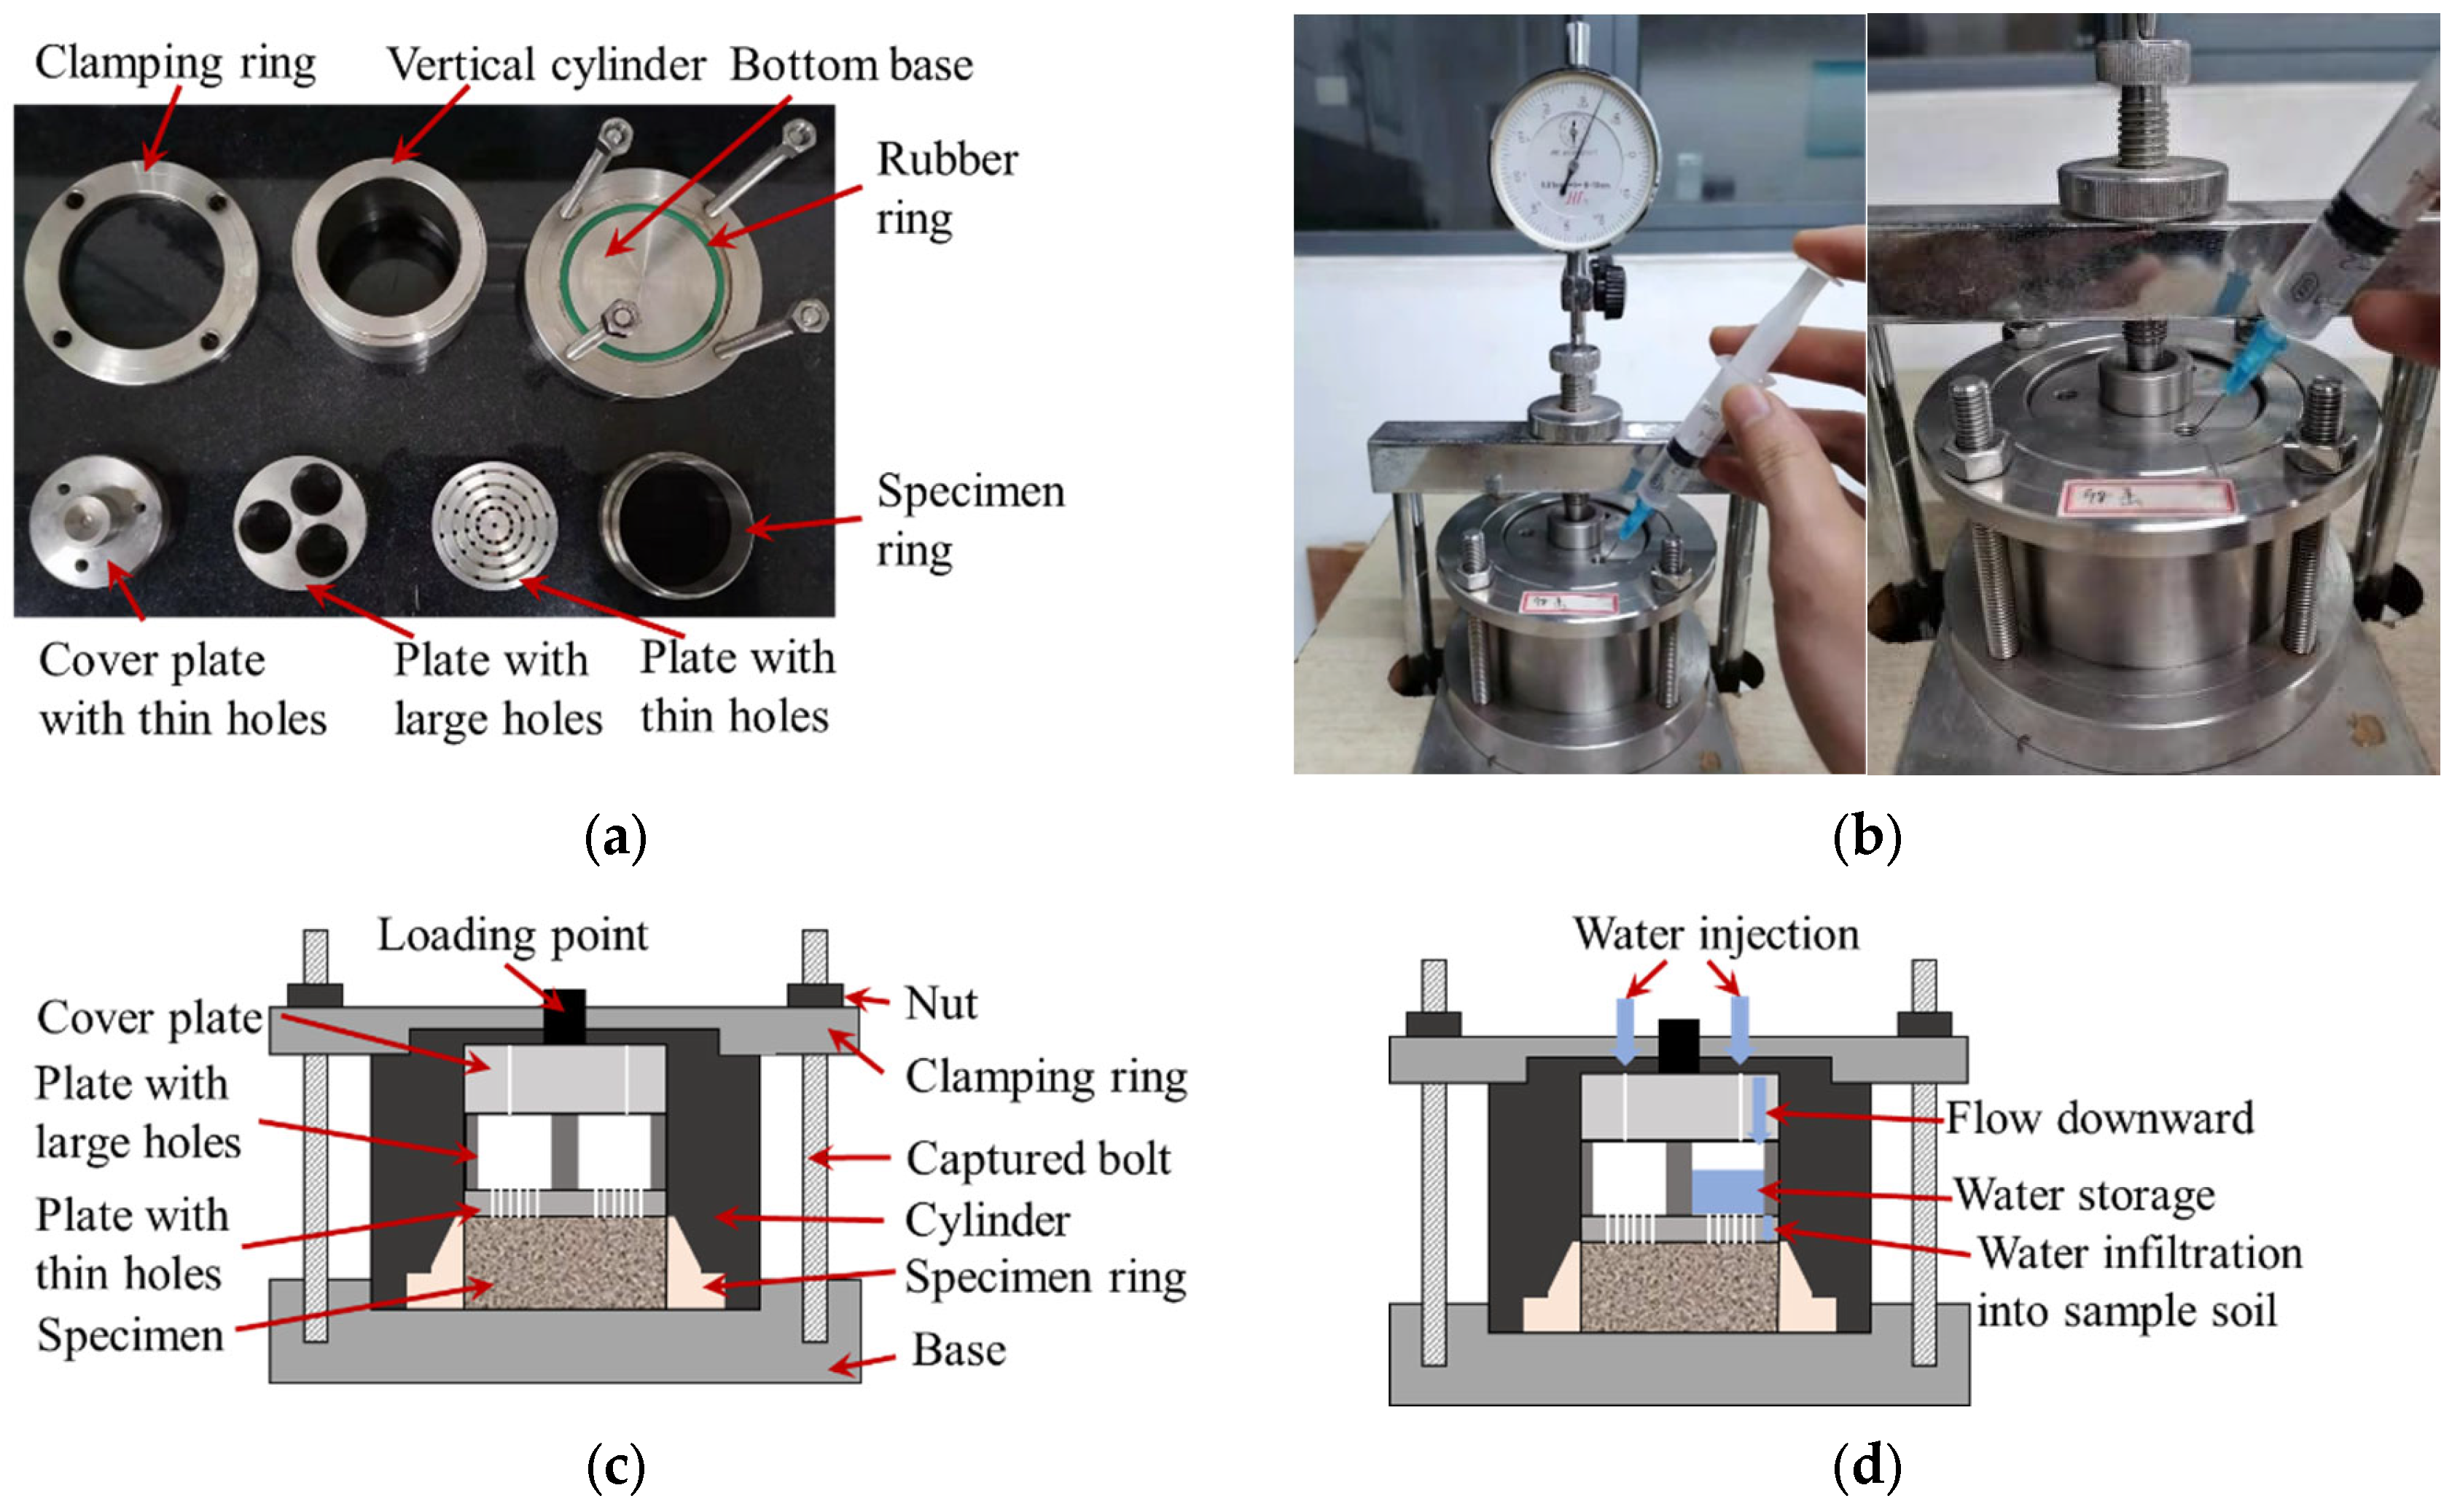
The saturated wetting odometer tests were conducted using both single-line and double-line methods. In the single-line test method, soil samples were initially placed into the oedometers and compressed to a vertical stress of 1 kPa for pre-consolidation. Subsequently, the load was increased to the target loading stress step by step. At each loading level, the deformation of the soil samples was monitored until stabilization was achieved. In this study, the deformation was regarded as stabilized when the deformation rate was less than <0.01 mm/h. Following this, water was poured into the container (as depicted in
Figure 5a), saturating the soil sample. The deformation was then continuously monitored until stabilization was reached once more. The target stresses for the single-line method include 1 kPa, 12.5 kPa, 25 kPa, 50 kPa, 100 kPa, 200 kPa, 400 kPa, and 800 kPa.
In the double-line method, two identical soil samples underwent pre-consolidation by compression to a vertical stress of 1 kPa (MOT CNS JTG3430-2020), after which they were compressed to 12.5 kPa. For the saturated group, water was introduced into the container. Upon stabilization of the deformation in the saturated group, both the saturated and unsaturated groups were compressed to the target stress. For the double-line method, the target stresses include 12.5 kPa, 25 kPa, 50 kPa, 100 kPa, 200 kPa, 400 kPa, and 800 kPa.
2.4. Multi-Step Wetting Odometer Test
To measure the intermediate state during the increase in moisture content, a new type of odometer was developed in this study, which was used for multi-step wetting, as indicated in
Figure 6. In the newly developed oedometer, samples with an initial state are placed at the bottom inside a vertical cylinder. A rubber ring under the vertical cylinder is used to guarantee the tightness of the cylinder’s bottom. Then a perforated plate with many thin holes, an intermediate plate with three large holes, and a cover plate with three small holes were placed on the sample in turn. The small holes in the cover plate serve as the water injection channel, and the large holes in the intermediate plate serve as water storage and a channel for flowing downward. The small holes in the perforated plate serve as the channel for water infiltration into the soil sample and gas escape from the soil when the sample is being wetted. After being assembled, the apparatus will be placed under the loading axle in a conventional one-dimensional oedometer system. When the sample is loaded into the target, a certain amount of water is injected into the apparatus through the water inlet. After that, the apparatus is covered by a wet cloth to prevent the evaporation of injected water, which also favors the air escape from the tested sample. After water injection, record the deformation induced by the increase in moisture content in each hour until the deformation stabilizes. And the current soil moisture content can be calculated using the tested sample mass, the moisture content before injection, and injected water volume, as indicated in Equation (1):
where
is the moisture content after wetting;
is the weight of dry soil (g);
is the injected volume of water (mL);
is the density of water, which is 1 g/mL. Compared with traditional oedometers, the increase in moisture content can be controlled in this apparatus. Thus, the multi-step wetting deformation can be measured during the tests.
In this study, the injected water volume was controlled to guarantee that the increase in moisture content is in the range of 2~3% in each wetting step. The load target in the unsaturated wetting test is selected as 1 kPa, 100 kPa, and 200 kPa.
2.5. Mercury Intrusion Porosimeter (MIP) Tests
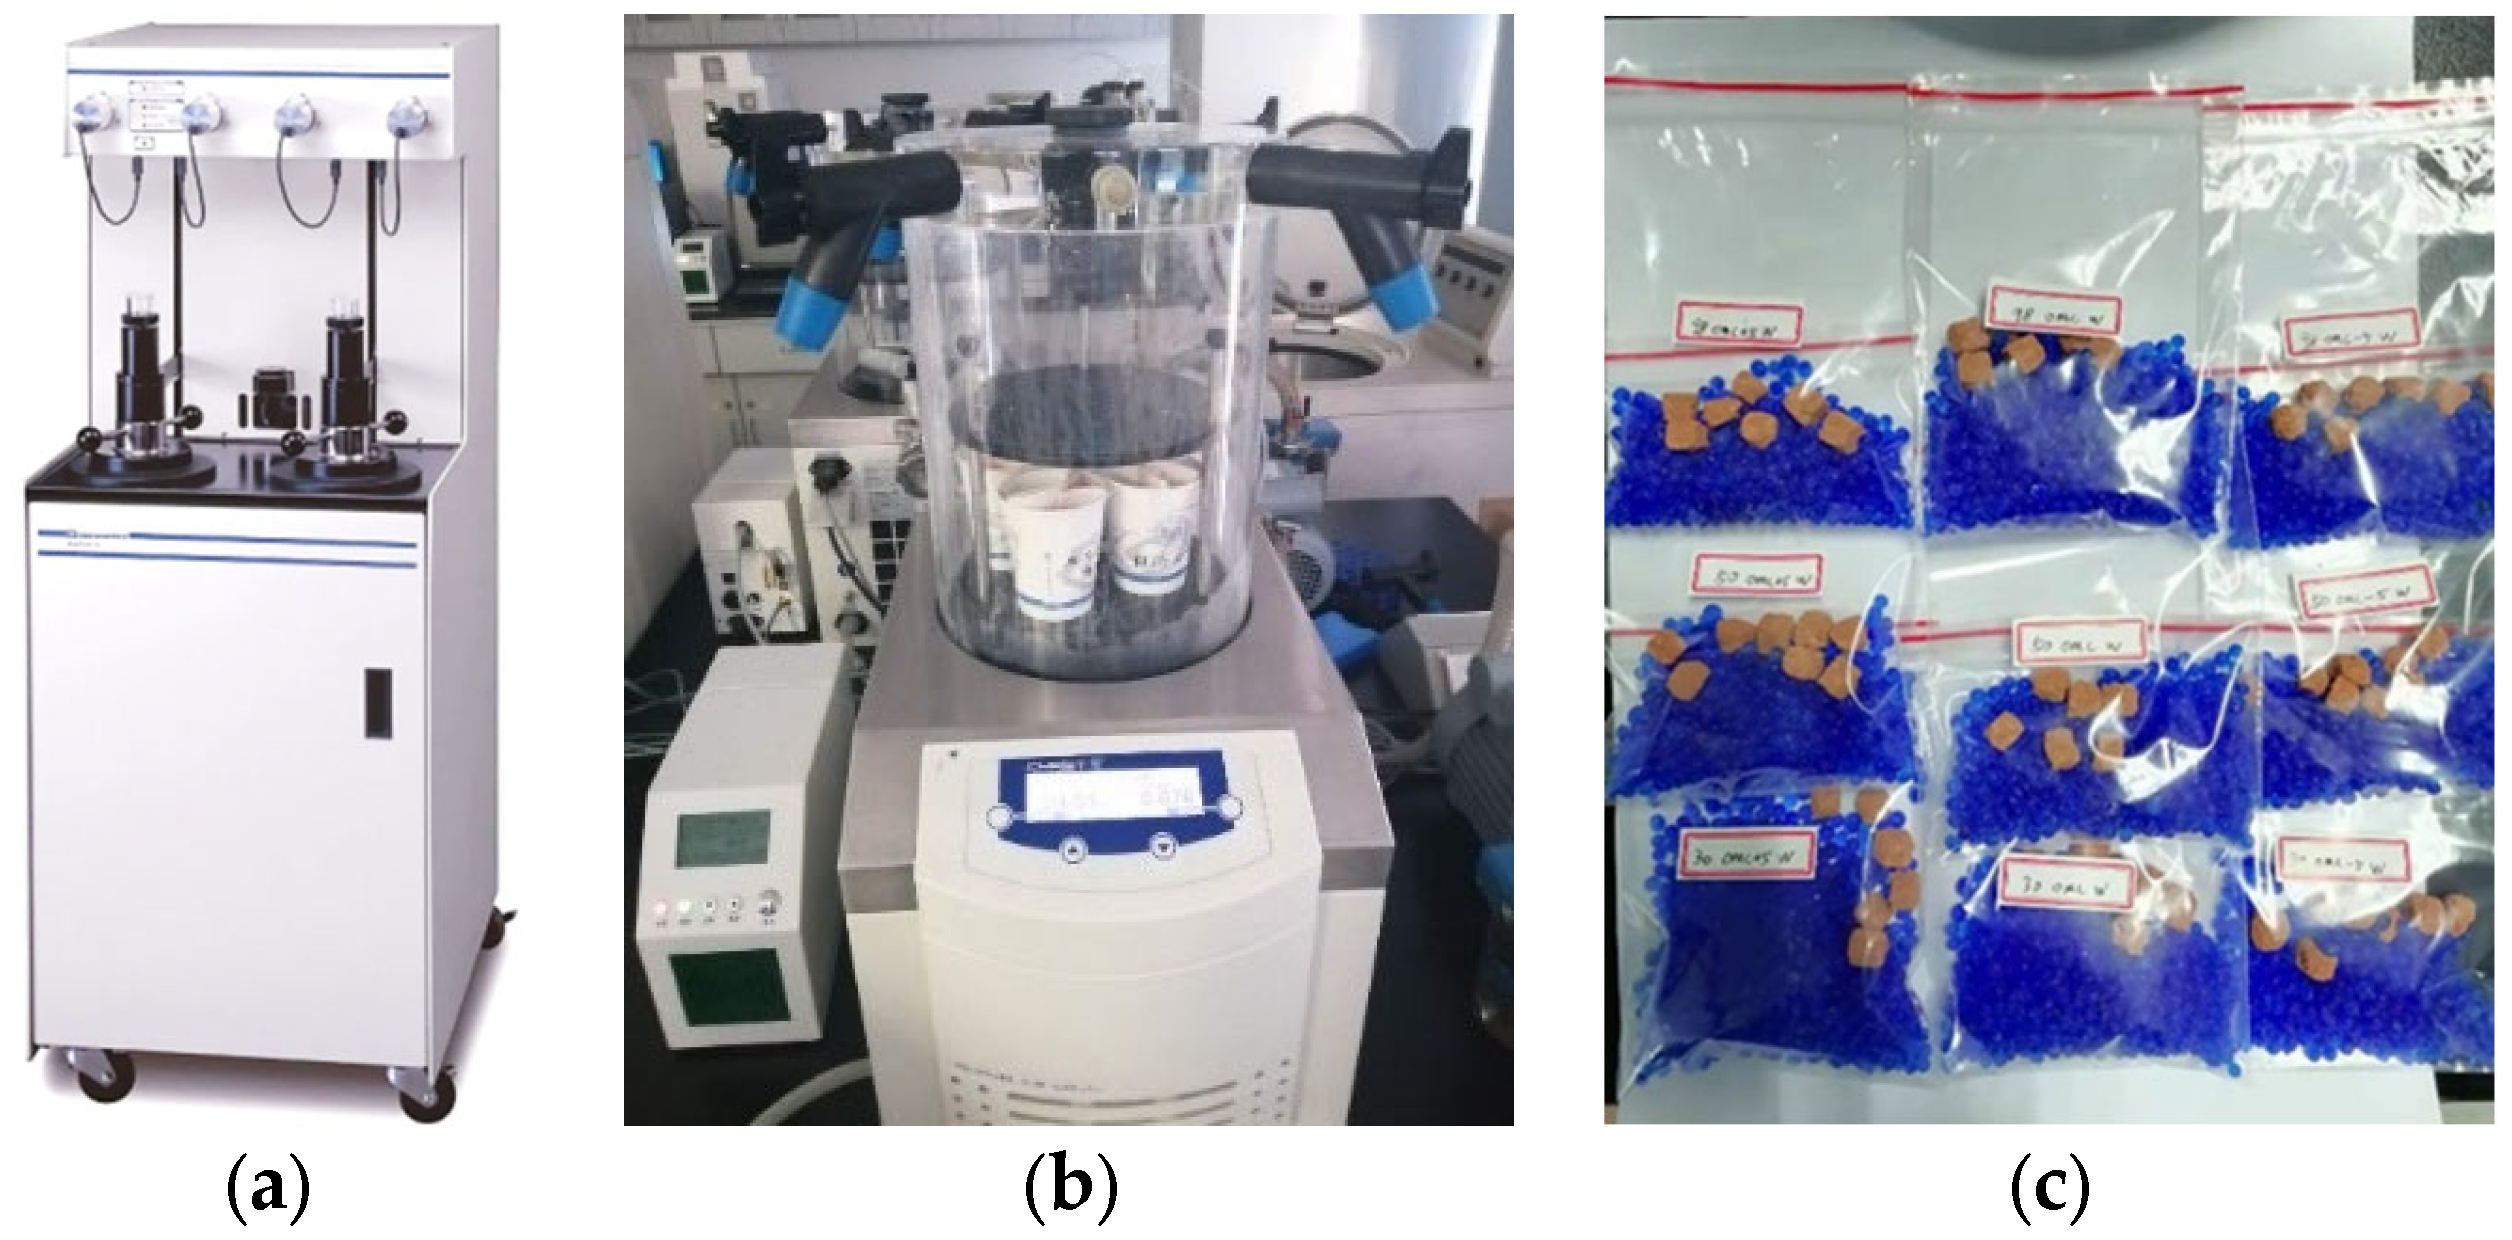
MIP tests were conducted in this study to compare the microstructure of soil samples with different initial density and moisture content. The samples were cut into cubes of less than 1 cubic centimeter after molding. Then, freeze-drying, which can dehydrate the soil with less damage than other methods [
33], was used to dehydrate the soil specimens, in which the temperature was controlled at minus 50 °C. The apparatus used was ALPHA12LD-plus (
Figure 7b), and the mercury injection apparatus used is AutoPoreIV9510 (
Figure 7a) with a maximum intrusion pressure of 413.7 MPa. The prepared samples are indicated in
Figure 7c.
Except for the MIP test, three replicate specimens were used in each of the other experiments.
3. Results
3.1. Pore Size Distribution Curve for Tested Samples
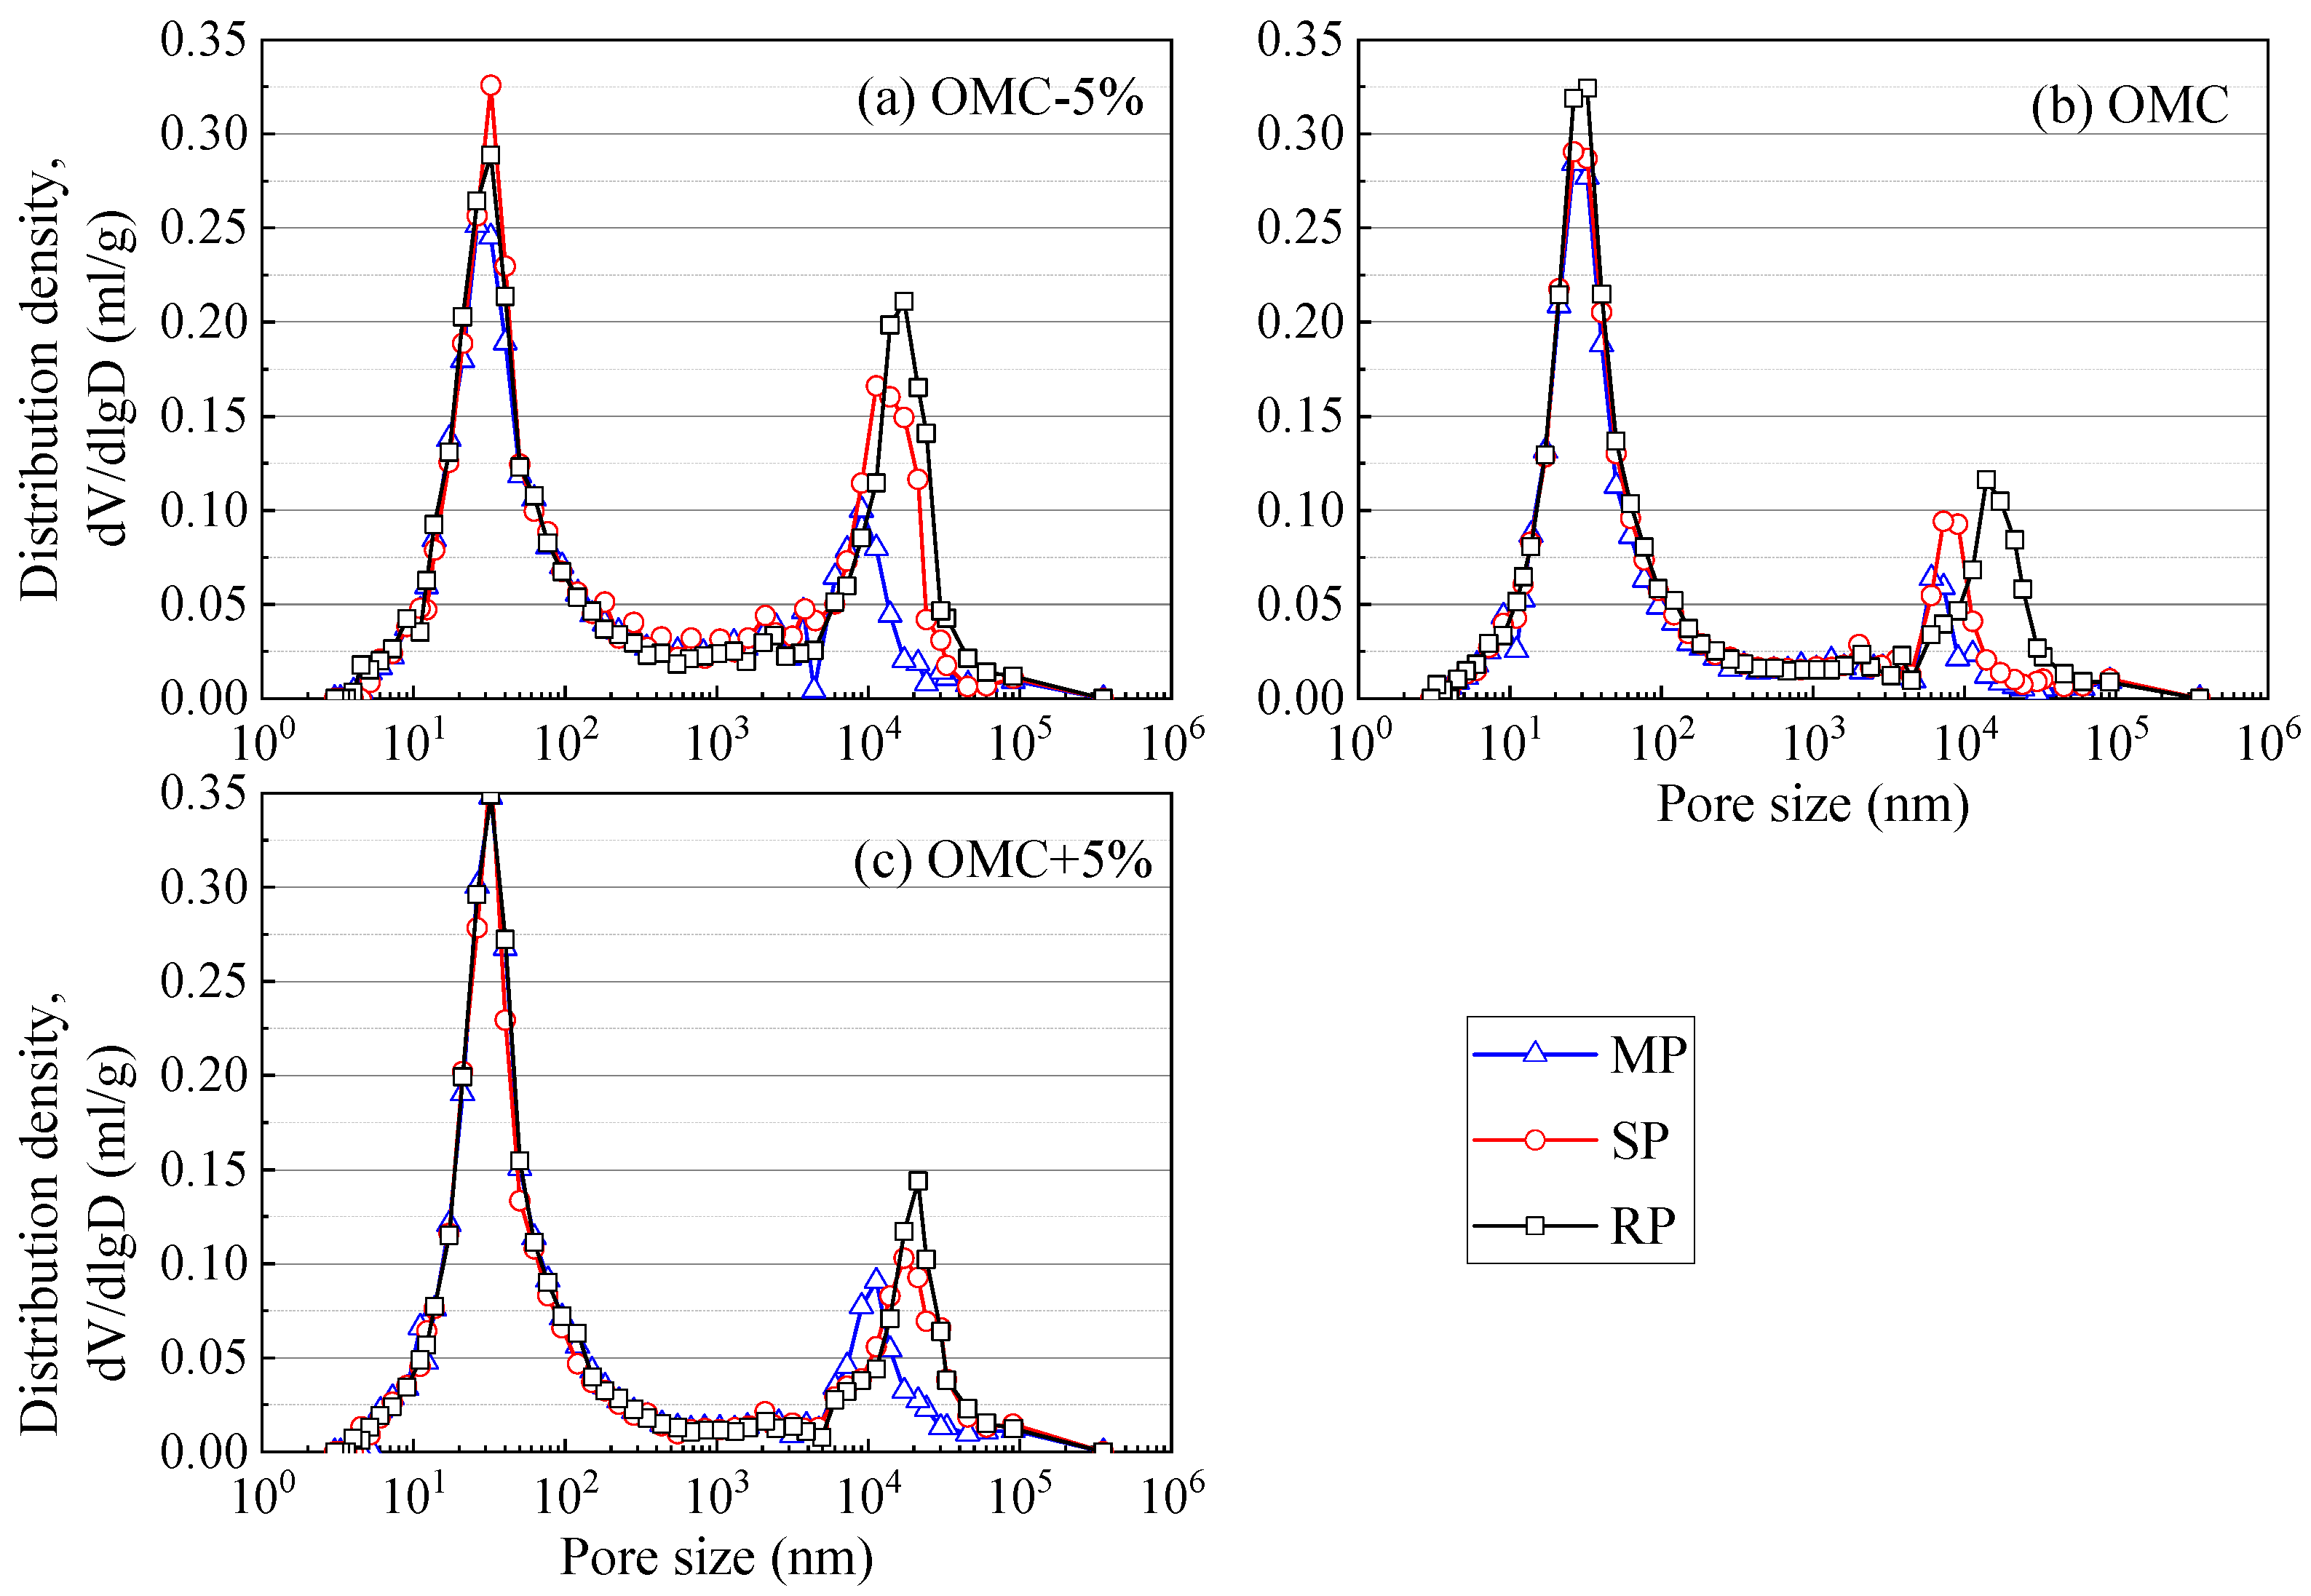
The measured pore size distribution curves for the soil sample with different initial states are illustrated in
Figure 8. Test results reveal that the pores within the tested soil are generally distributed in the range of 1~200 nm and the range of 3000~20,000 nm, exhibiting a dual-structure pore-size distribution. Based on previous studies [
30,
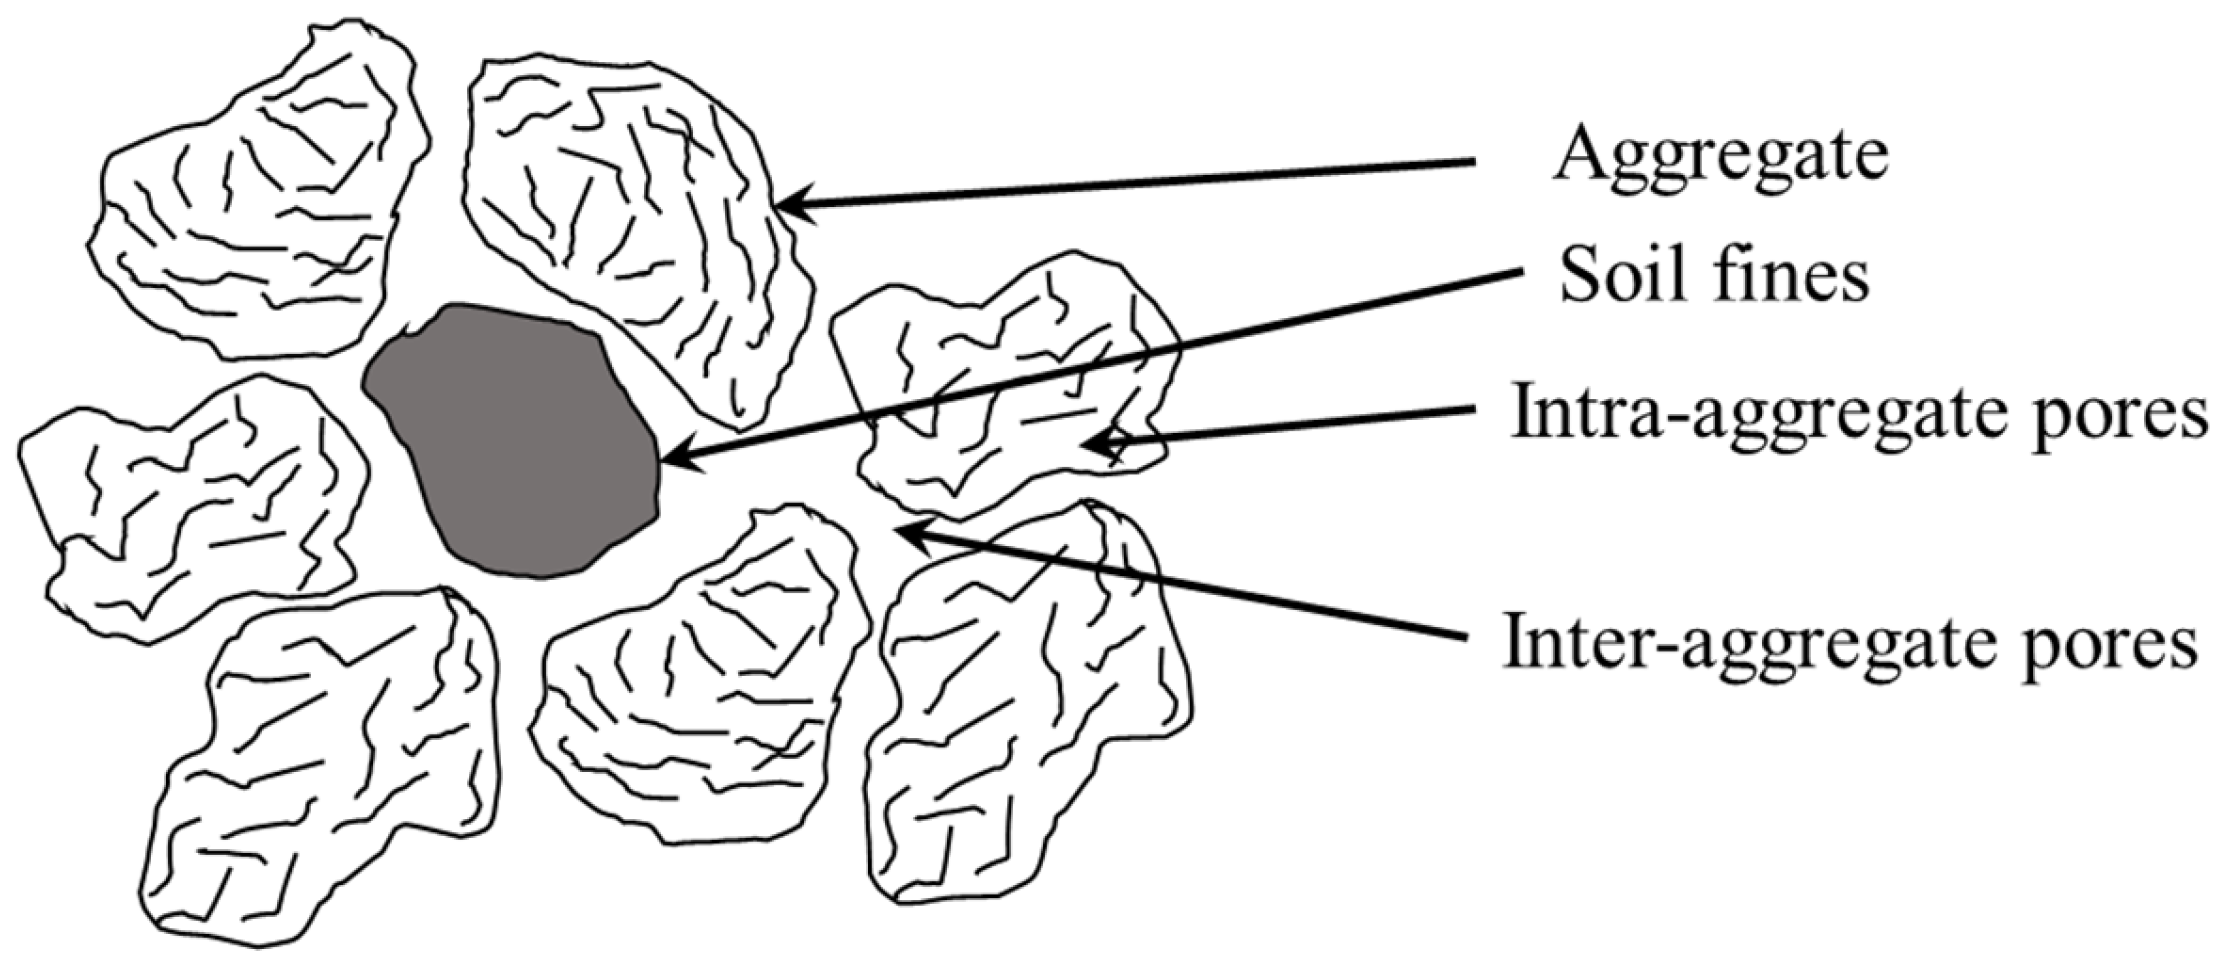
34], the size of particles or aggregates in soil is generally in the range of 1000~3000 nm. Thus, the pores in the tested soil sample can be categorized as inter-aggregate pores and intra-aggregate pores (
Figure 9). In comparison to samples with optimal and higher initial moisture content, the sample with lower moisture content displays a higher proportion of inter-aggregate pores and a diminished presence of intra-aggregate pores. This agrees with previous studies that the increase in initial moisture content during the molding of the sample can lead to more intra-aggregate pores during [
30,
35]. Moreover, the expansion of intra-aggregate pores in aggregate and the squeezing of inter-aggregate pores are the major influential factors of deformation during water infiltration [
34]. And the inter-aggregate pores will be squeezed by vertical stress during water infiltration [
30]. Consequently, the more inter-aggregate pores in soil samples enhance their susceptibility to wetting collapse, with more inter-aggregate pores transitioning to intra-aggregate pores during this process. Moreover, the increase in compaction effort apparently declines the inter-aggregate pores while having little effect on the intra-aggregate pores.
3.2. Saturated Wetting Deformation Using Double-Line Method
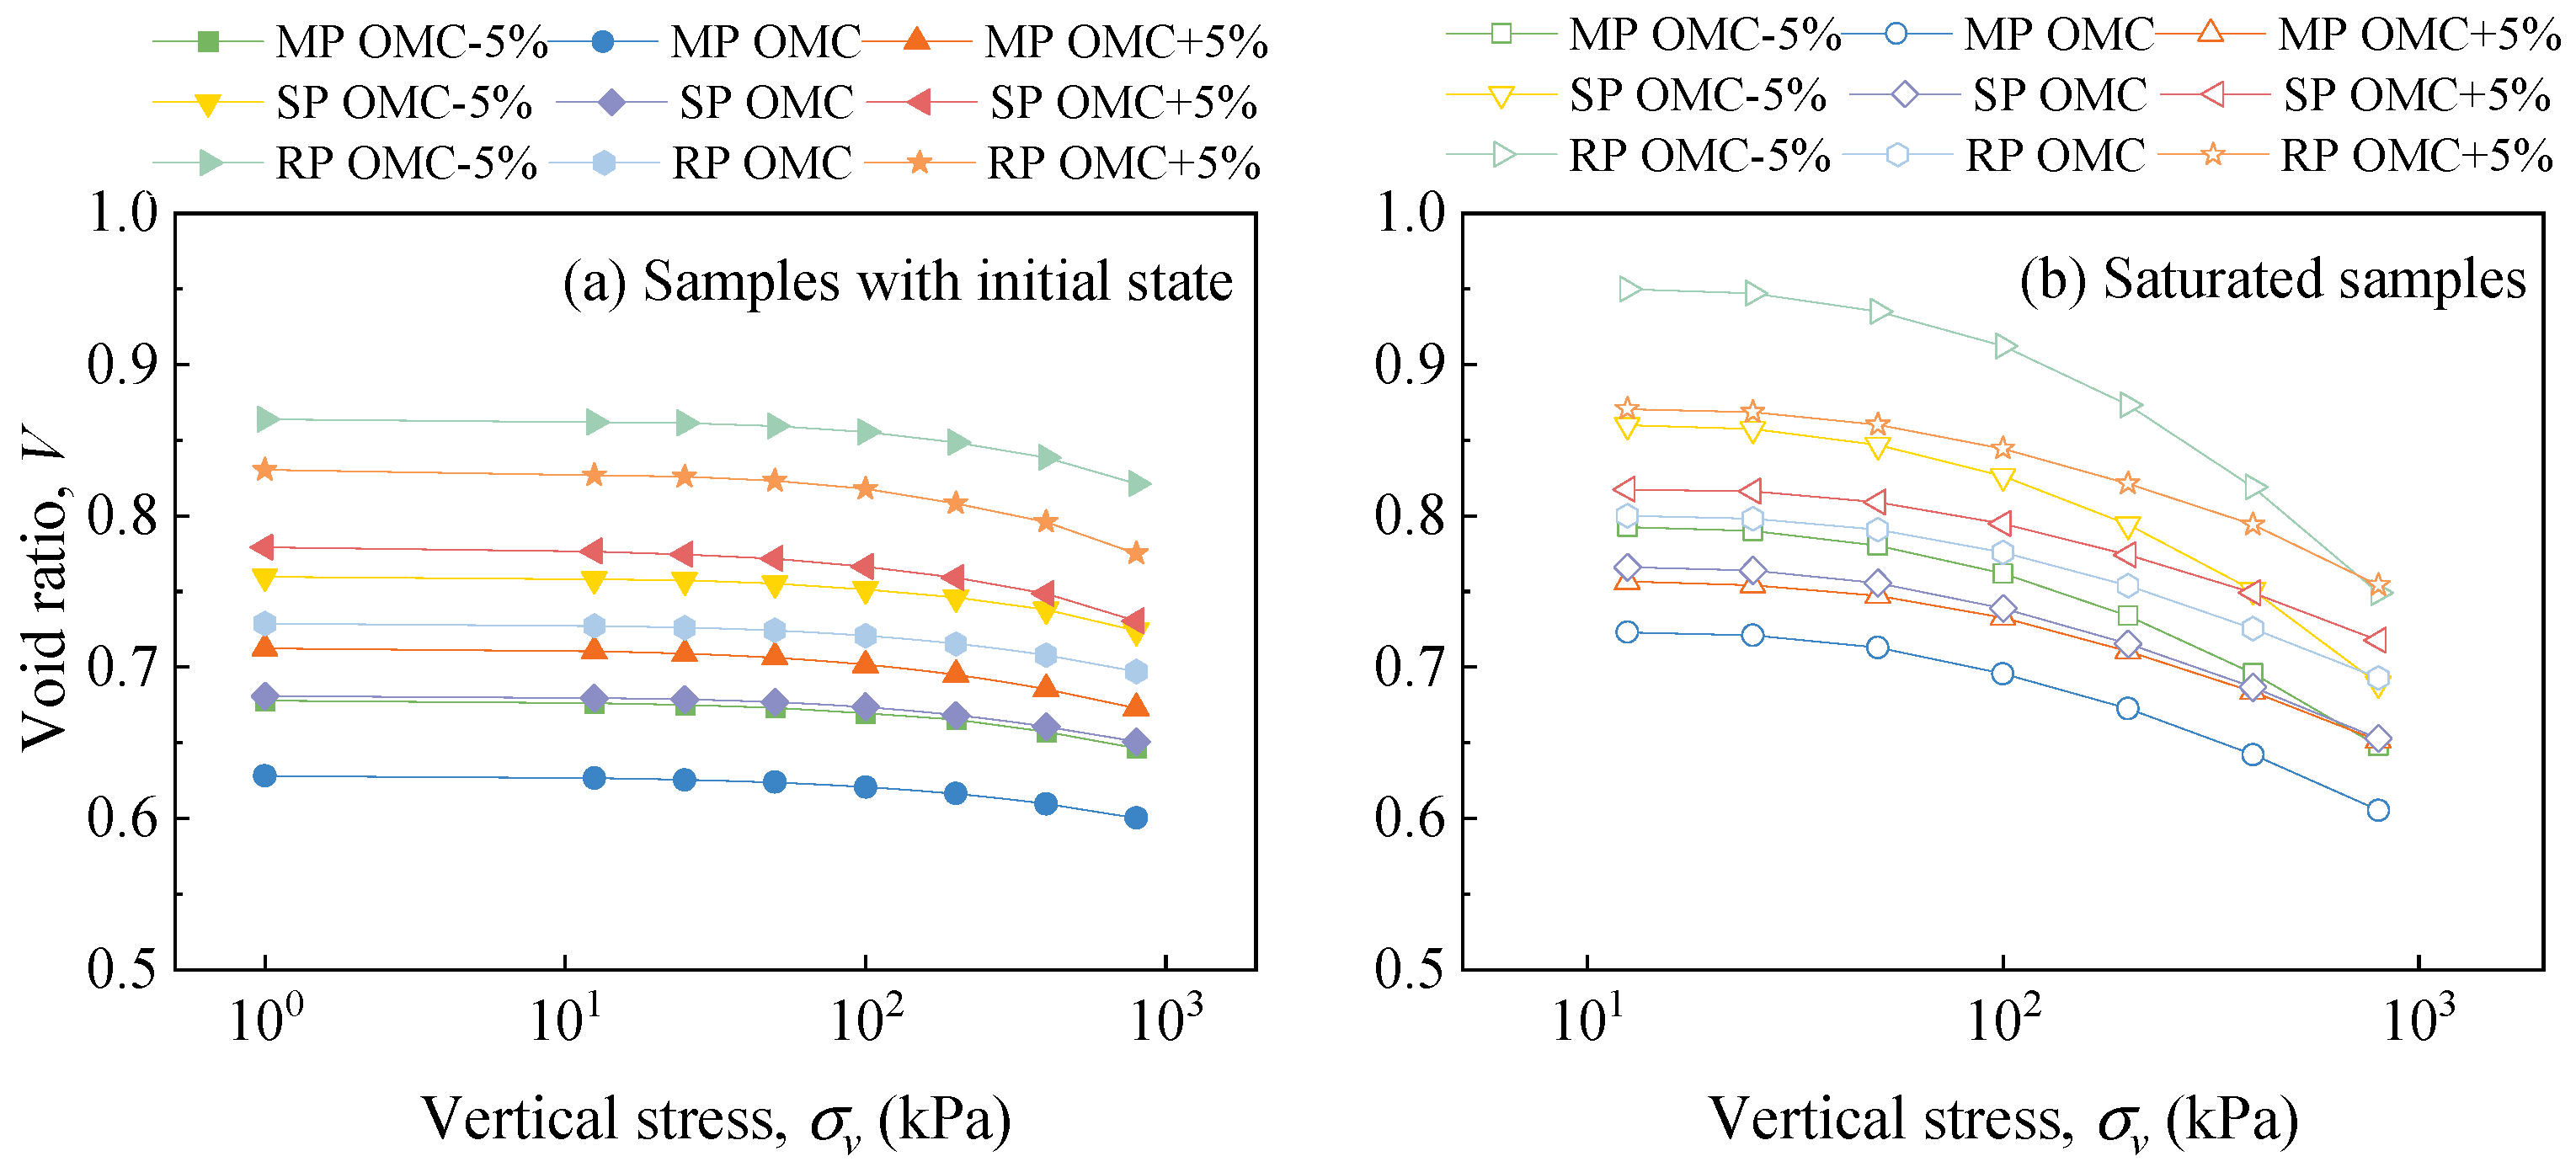
Figure 10 illustrates the variation in void ratio under vertical stress for saturated and unsaturated sample groups in the tests using the double-line method. To assess the deformation resulting from wetting, Equations (2) and (3) were introduced by Vilar and Rodrigues [
36] as follows:
where
is the wetting deformation ratio,
is the void ratio after wetting,
is the void ratio before wetting.
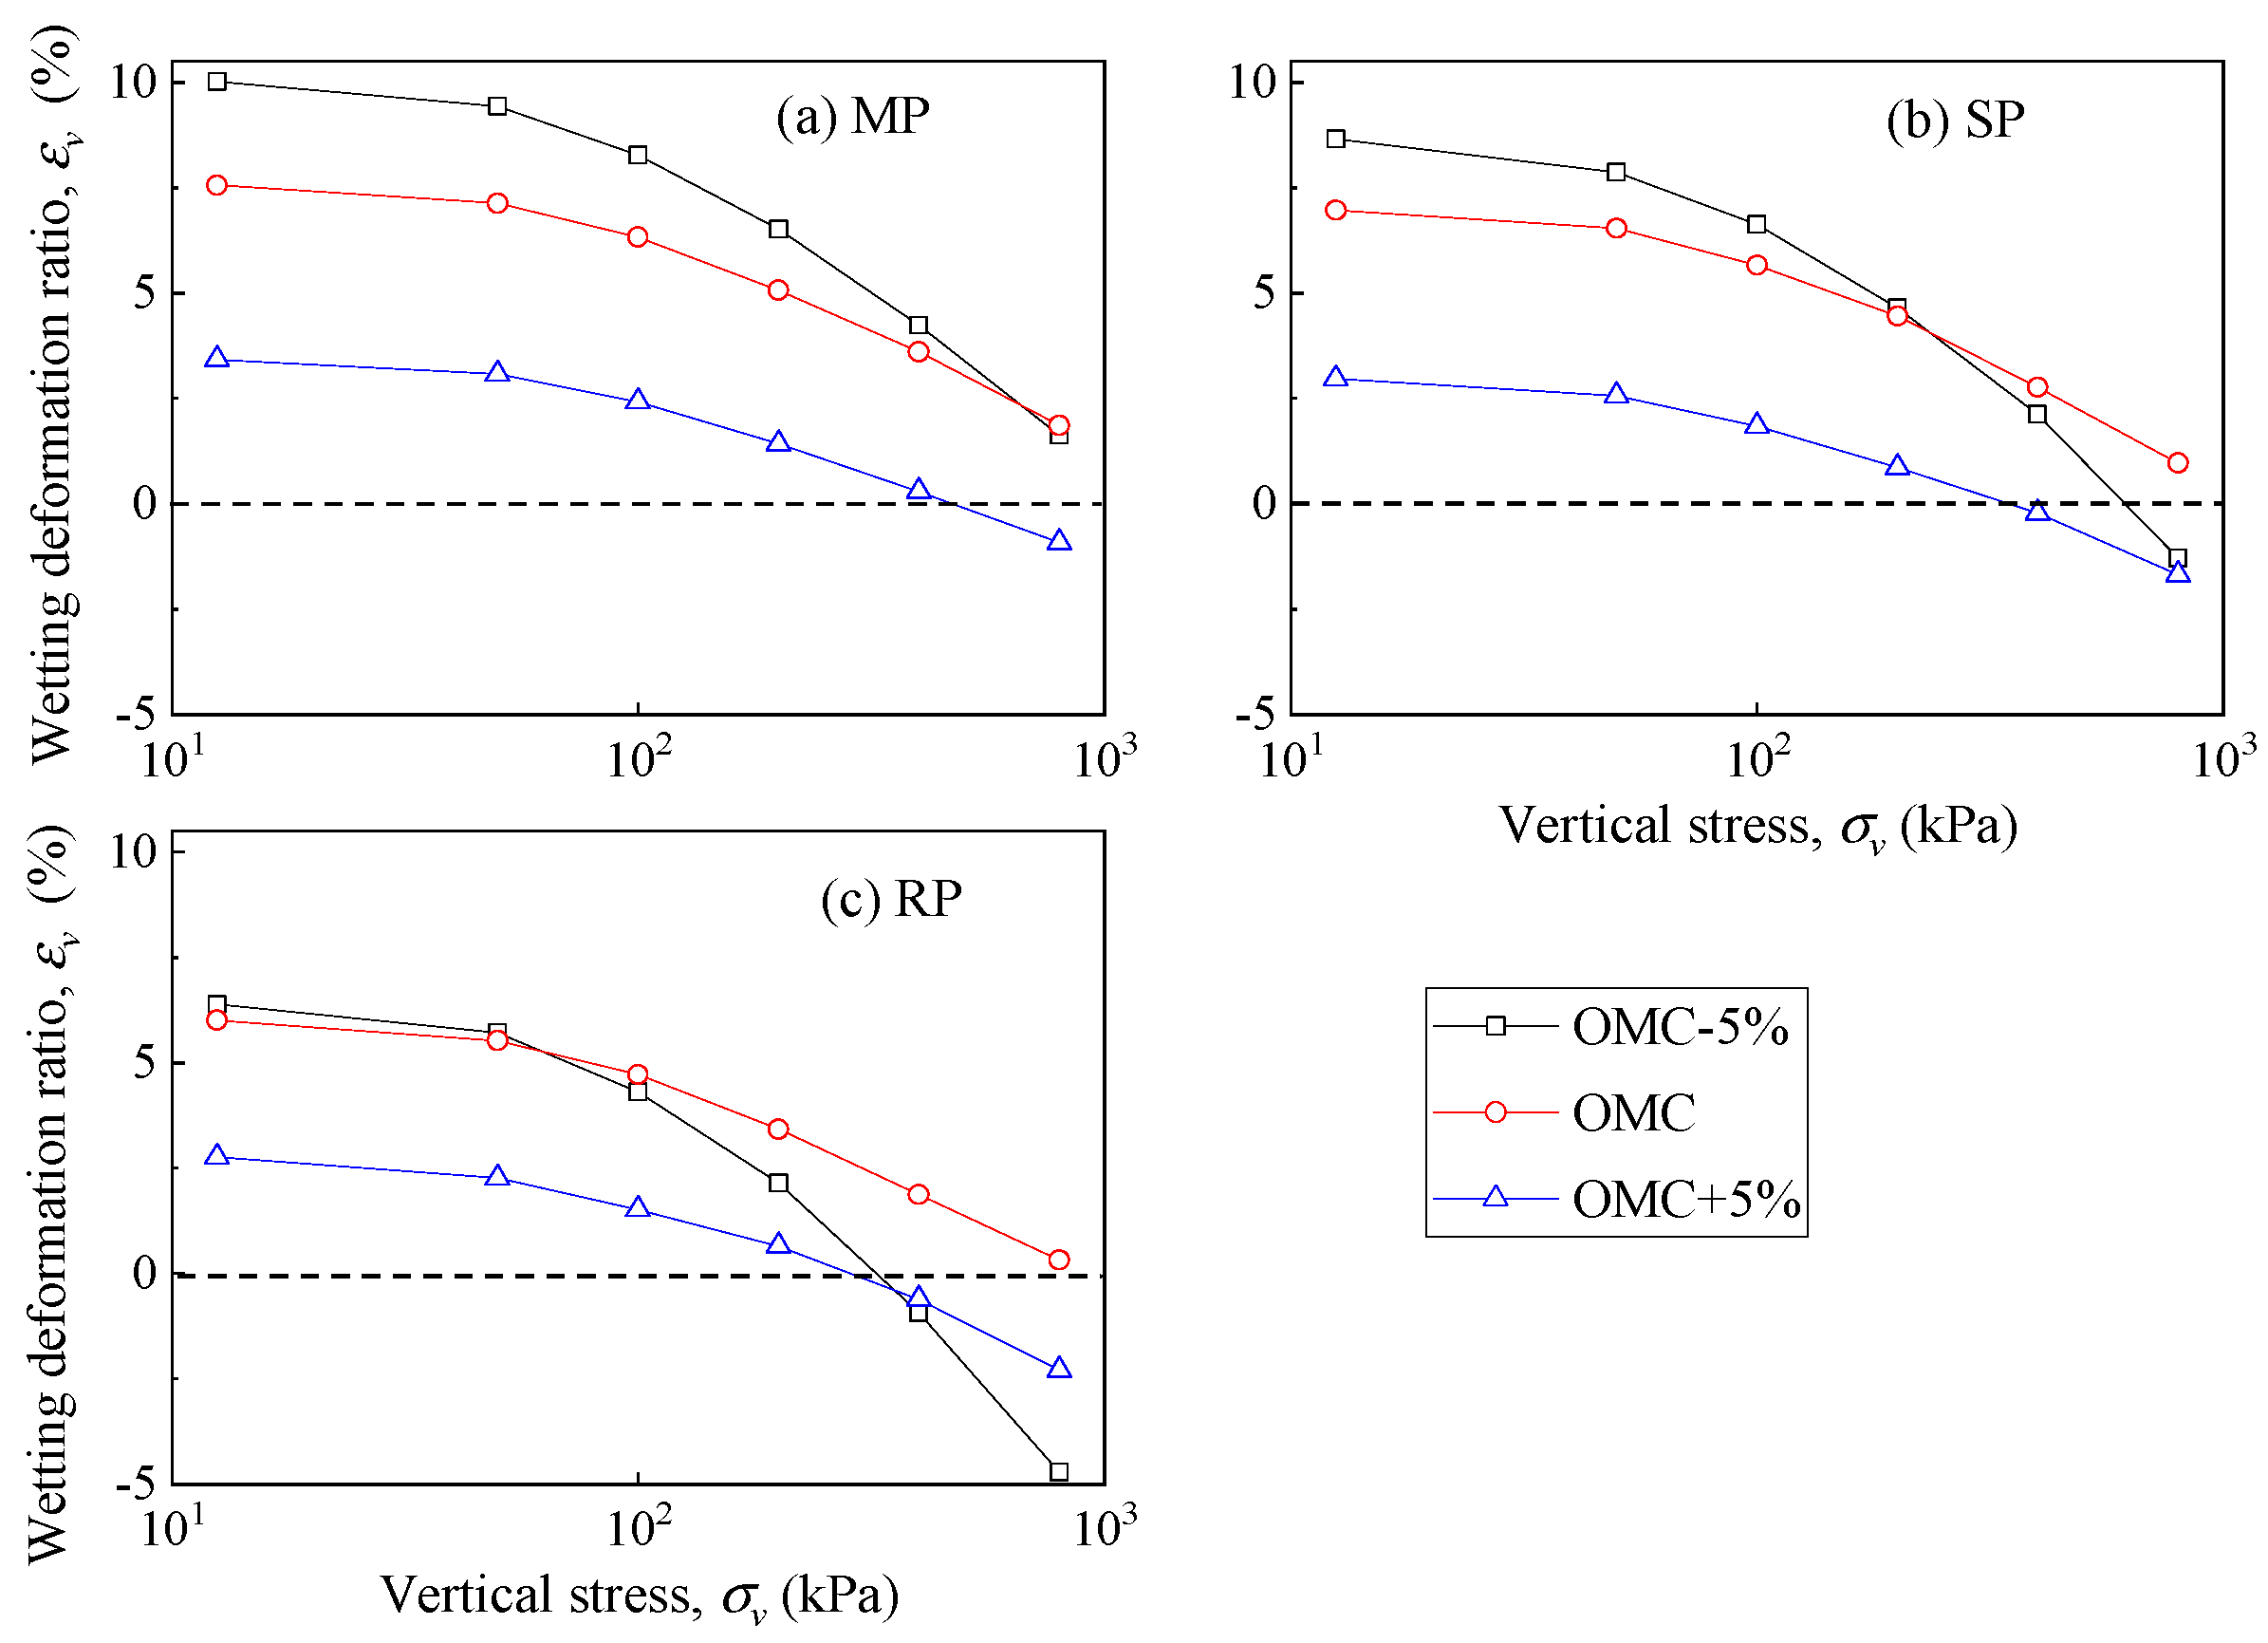
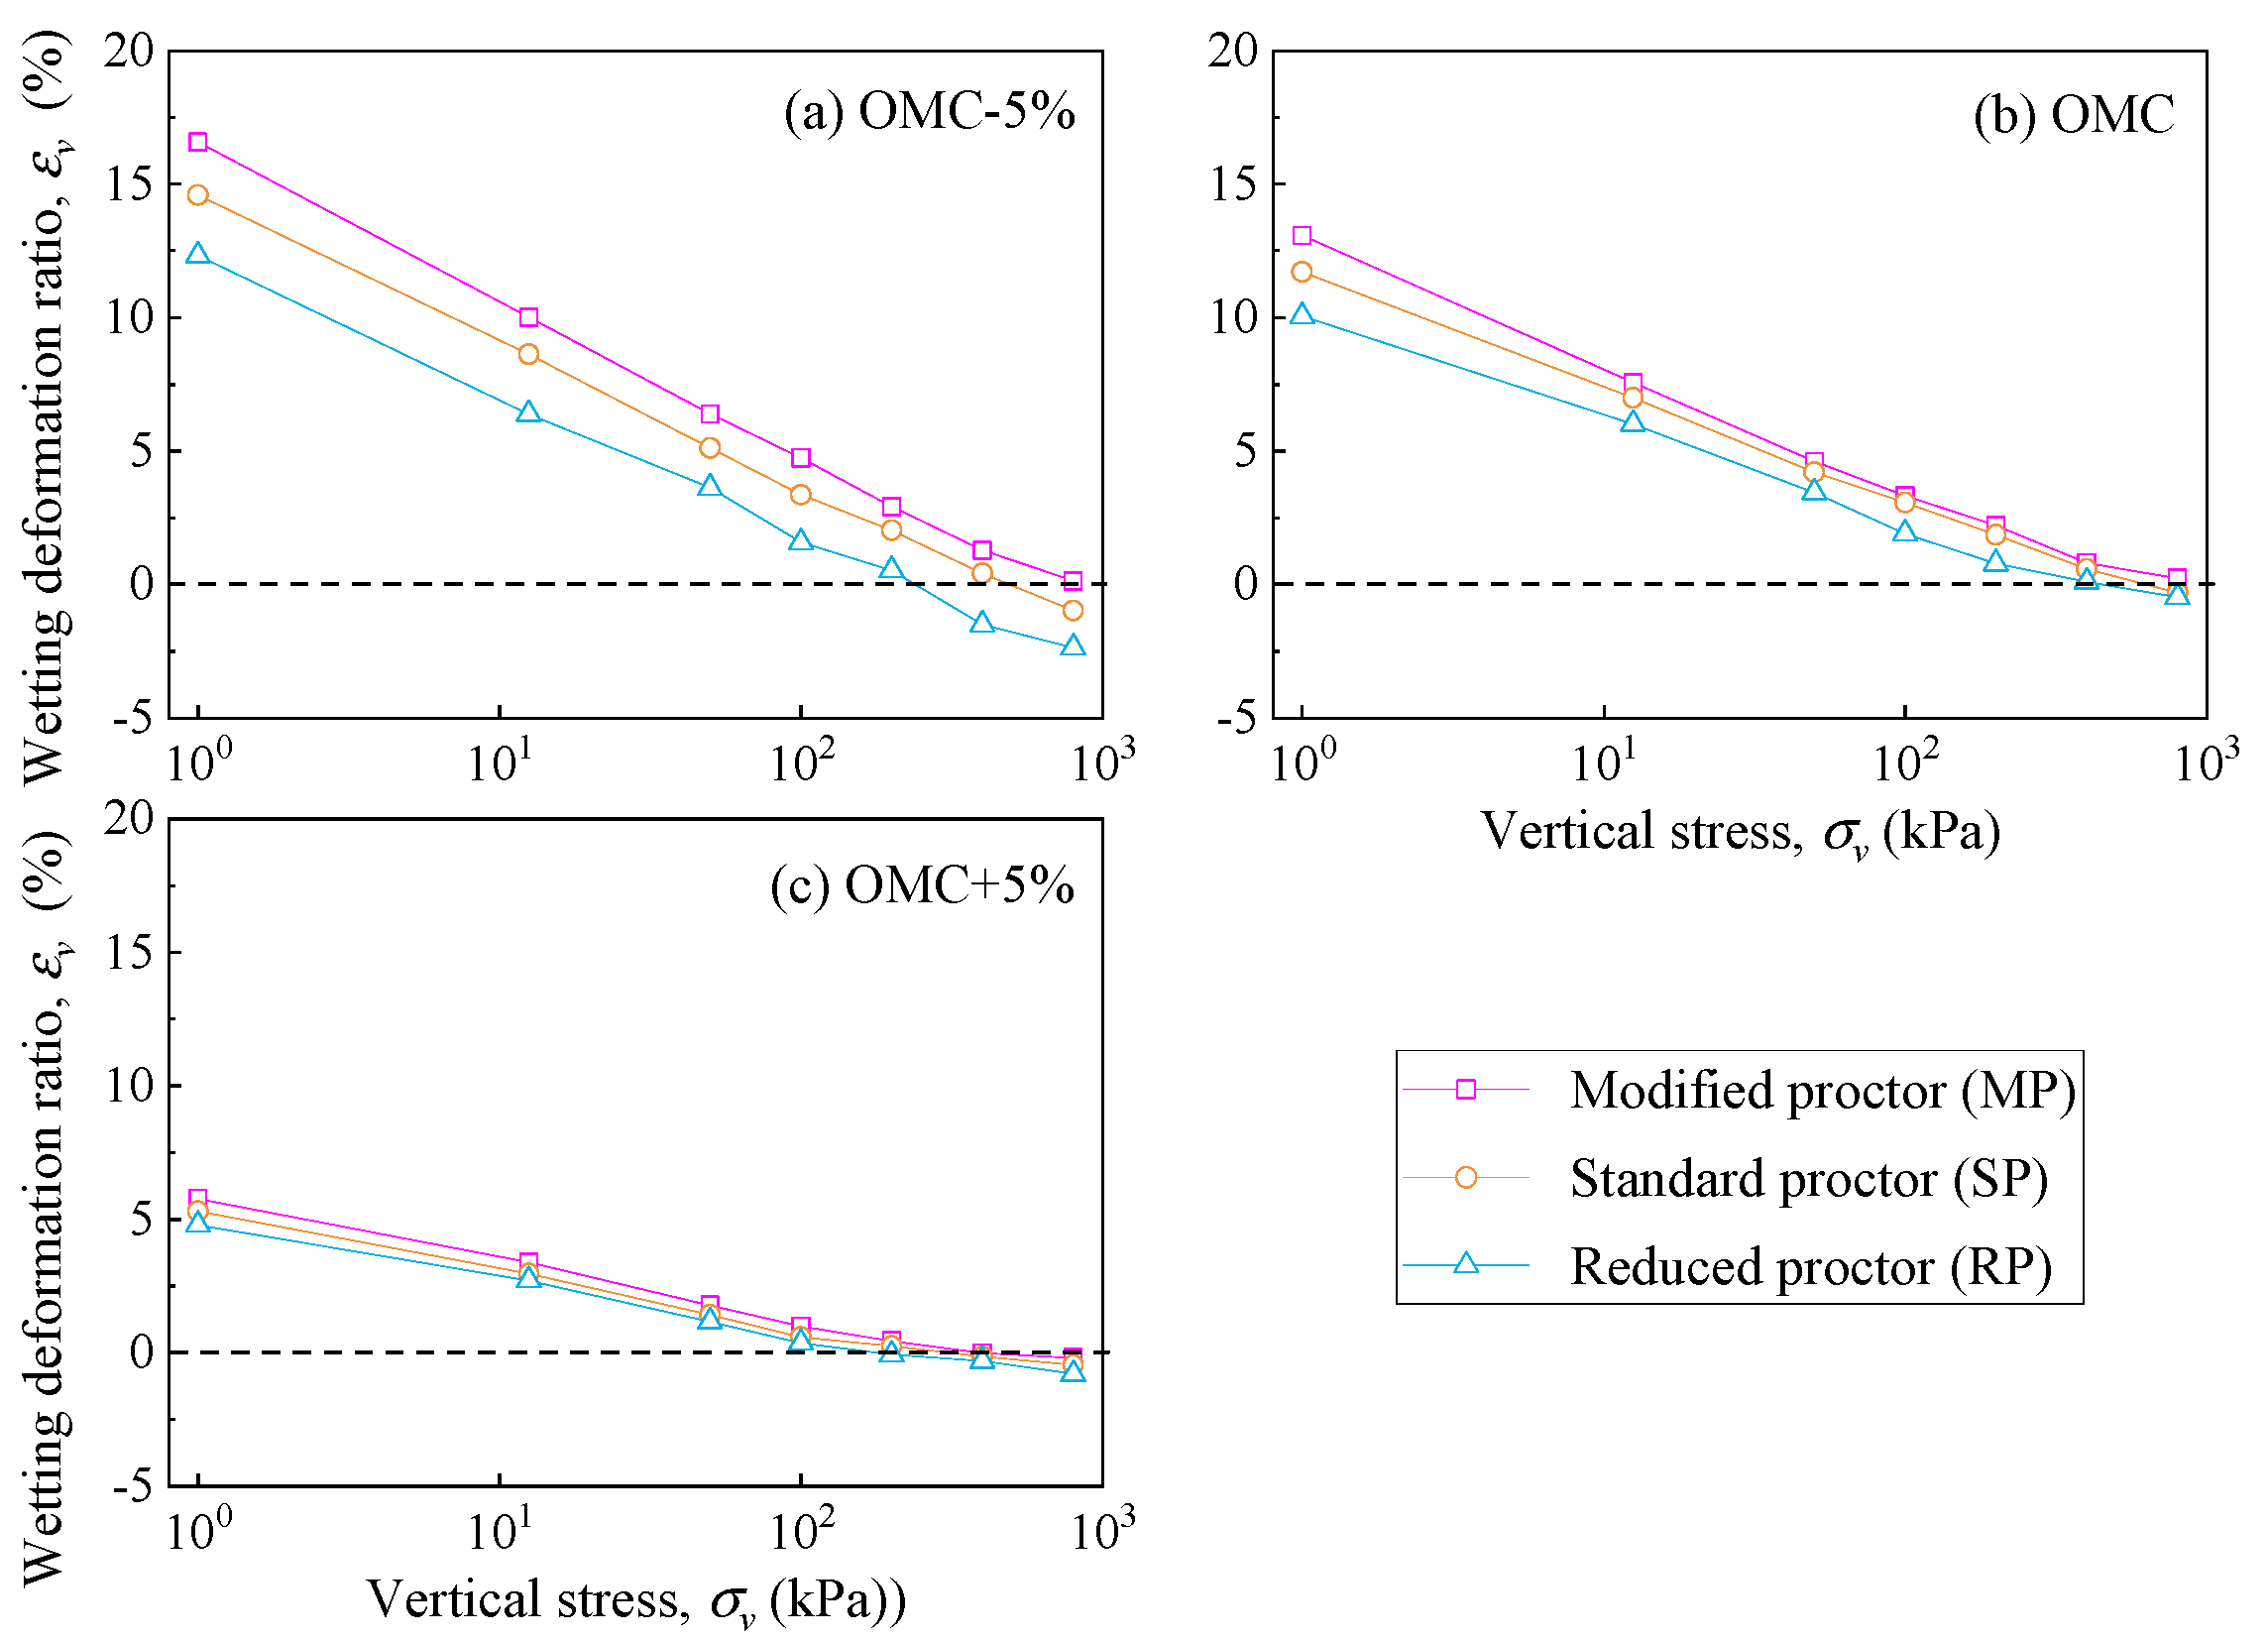
The calculated wetting deformation of the tested samples using the double-line method is depicted in
Figure 11 and
Figure 12. As the applied vertical stress increases, the wetting deformation of the tested samples undergoes a conversion from swelling to shrinkage, and the change speed is gradually accelerating. Generally, the
-lg
p curve corresponding to higher compaction effort is positioned above that associated with lower compaction effort, suggesting that increased compaction effort results in more pronounced swelling deformation. This phenomenon is ascribed to the higher density and more soil particles of soil samples molded with greater compaction effort. Thus, the swelling potential is higher in denser soil samples as there are more soil aggregates to absorb water and fewer inter-aggregate pores to be squeezed.
With varying initial moisture content, the -lgp curve for samples subjected to different compaction efforts remains parallel. This observation suggests that the disparities in wetting deformation induced by a specific vertical load are controlled by the initial moisture content and compaction effort. Furthermore, as the initial moisture content increases, the wetting deformation for samples subjected to different compaction efforts gradually converges. This trend implies that the influence of compaction effort on soil samples with high moisture content is limited. This aligns with the compaction curve, which also converges gradually at high moisture content under different compaction efforts.
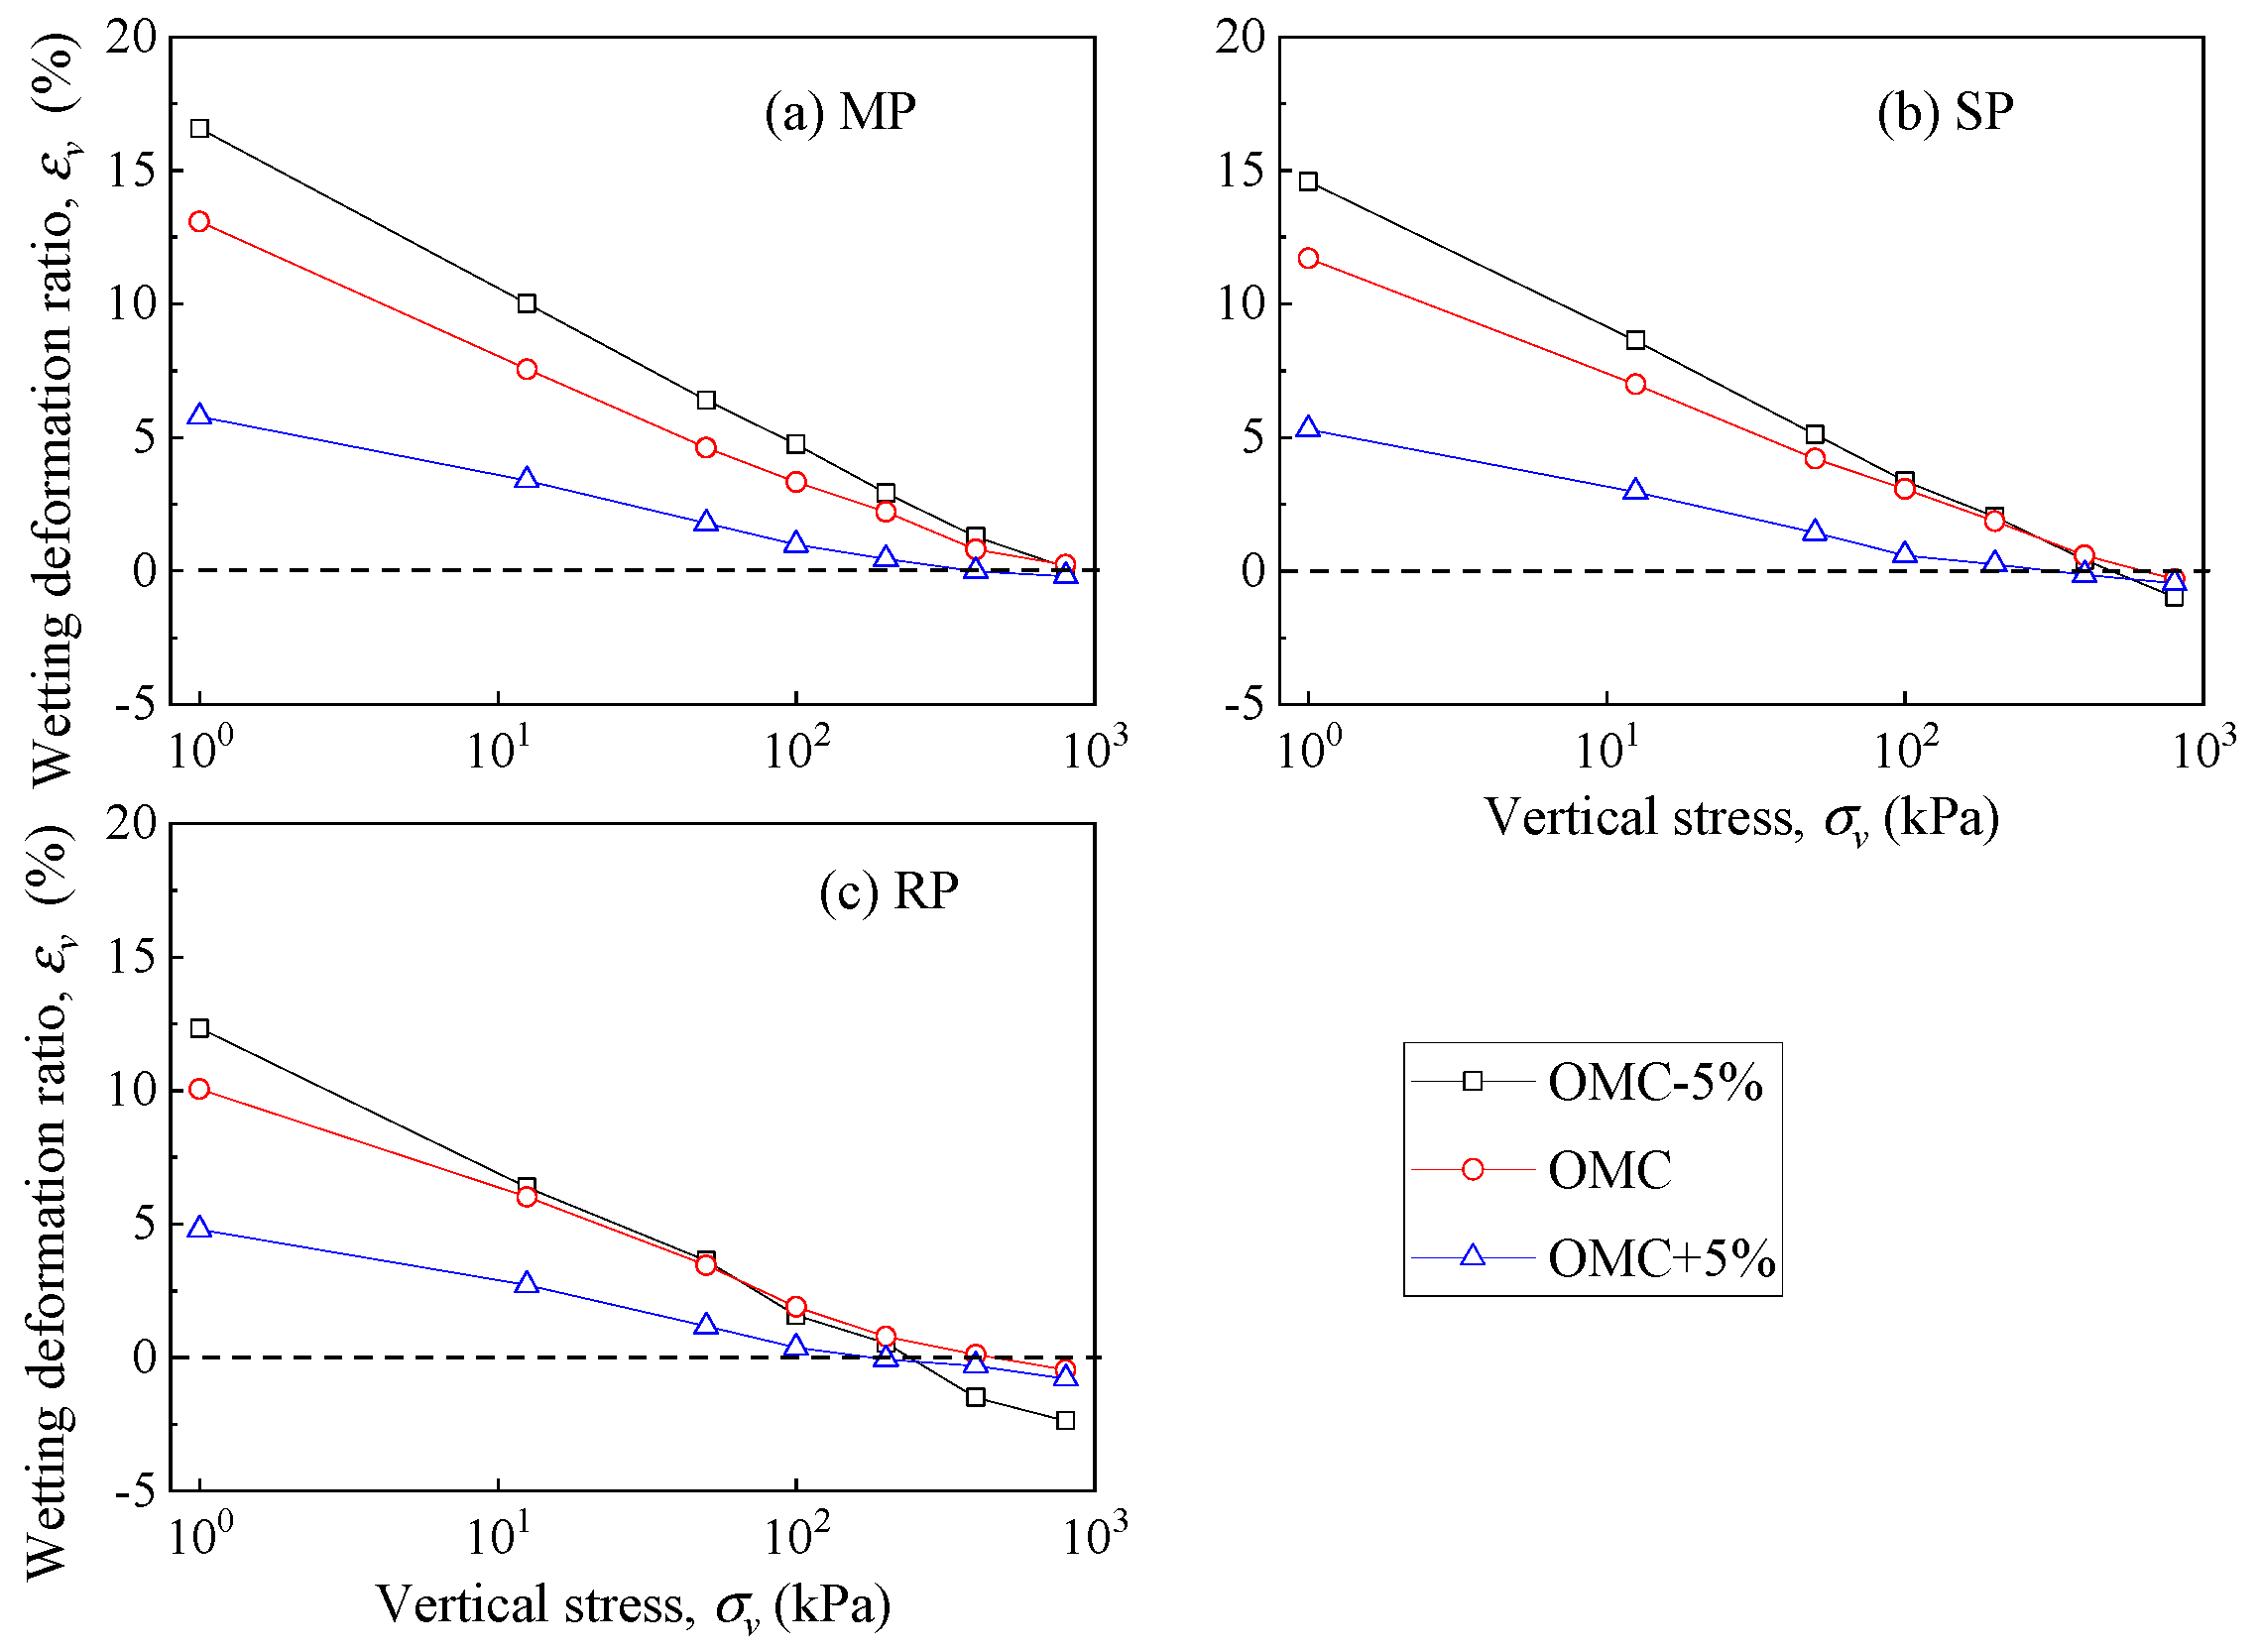
The wetting deformation for soil samples with different initial moisture content is depicted in
Figure 12. Under the same compaction efforts, wetting deformation of samples for varying initial moisture content displays distinct trends. Samples with low initial moisture content exhibit a more rapid downward trend in wetting deformation across three compaction effort levels. Upon MP compaction effort, the sample with low moisture content demonstrates increased swelling deformation under lower vertical stress. Conversely, with RP compaction effort, the sample with lower initial moisture content manifests more pronounced shrinkage deformation under higher vertical stress.
This observation implies that samples with low moisture content can absorb more water and exhibit higher swelling potential, but this effect is mitigated by the applied vertical stress. The phenomenon becomes particularly conspicuous when subjected to heavier vertical stress, particularly for samples with lower initial moisture content. It appears that the influence of initial moisture content on wetting deformation is intricate. The structure of samples molded with lower moisture content is evidently more responsive to water. Consequently, upon water absorption, the structure weakens, rendering it more susceptible to breakage under vertical stress.
3.3. Saturated Wetting Deformation Using Single-Line Method
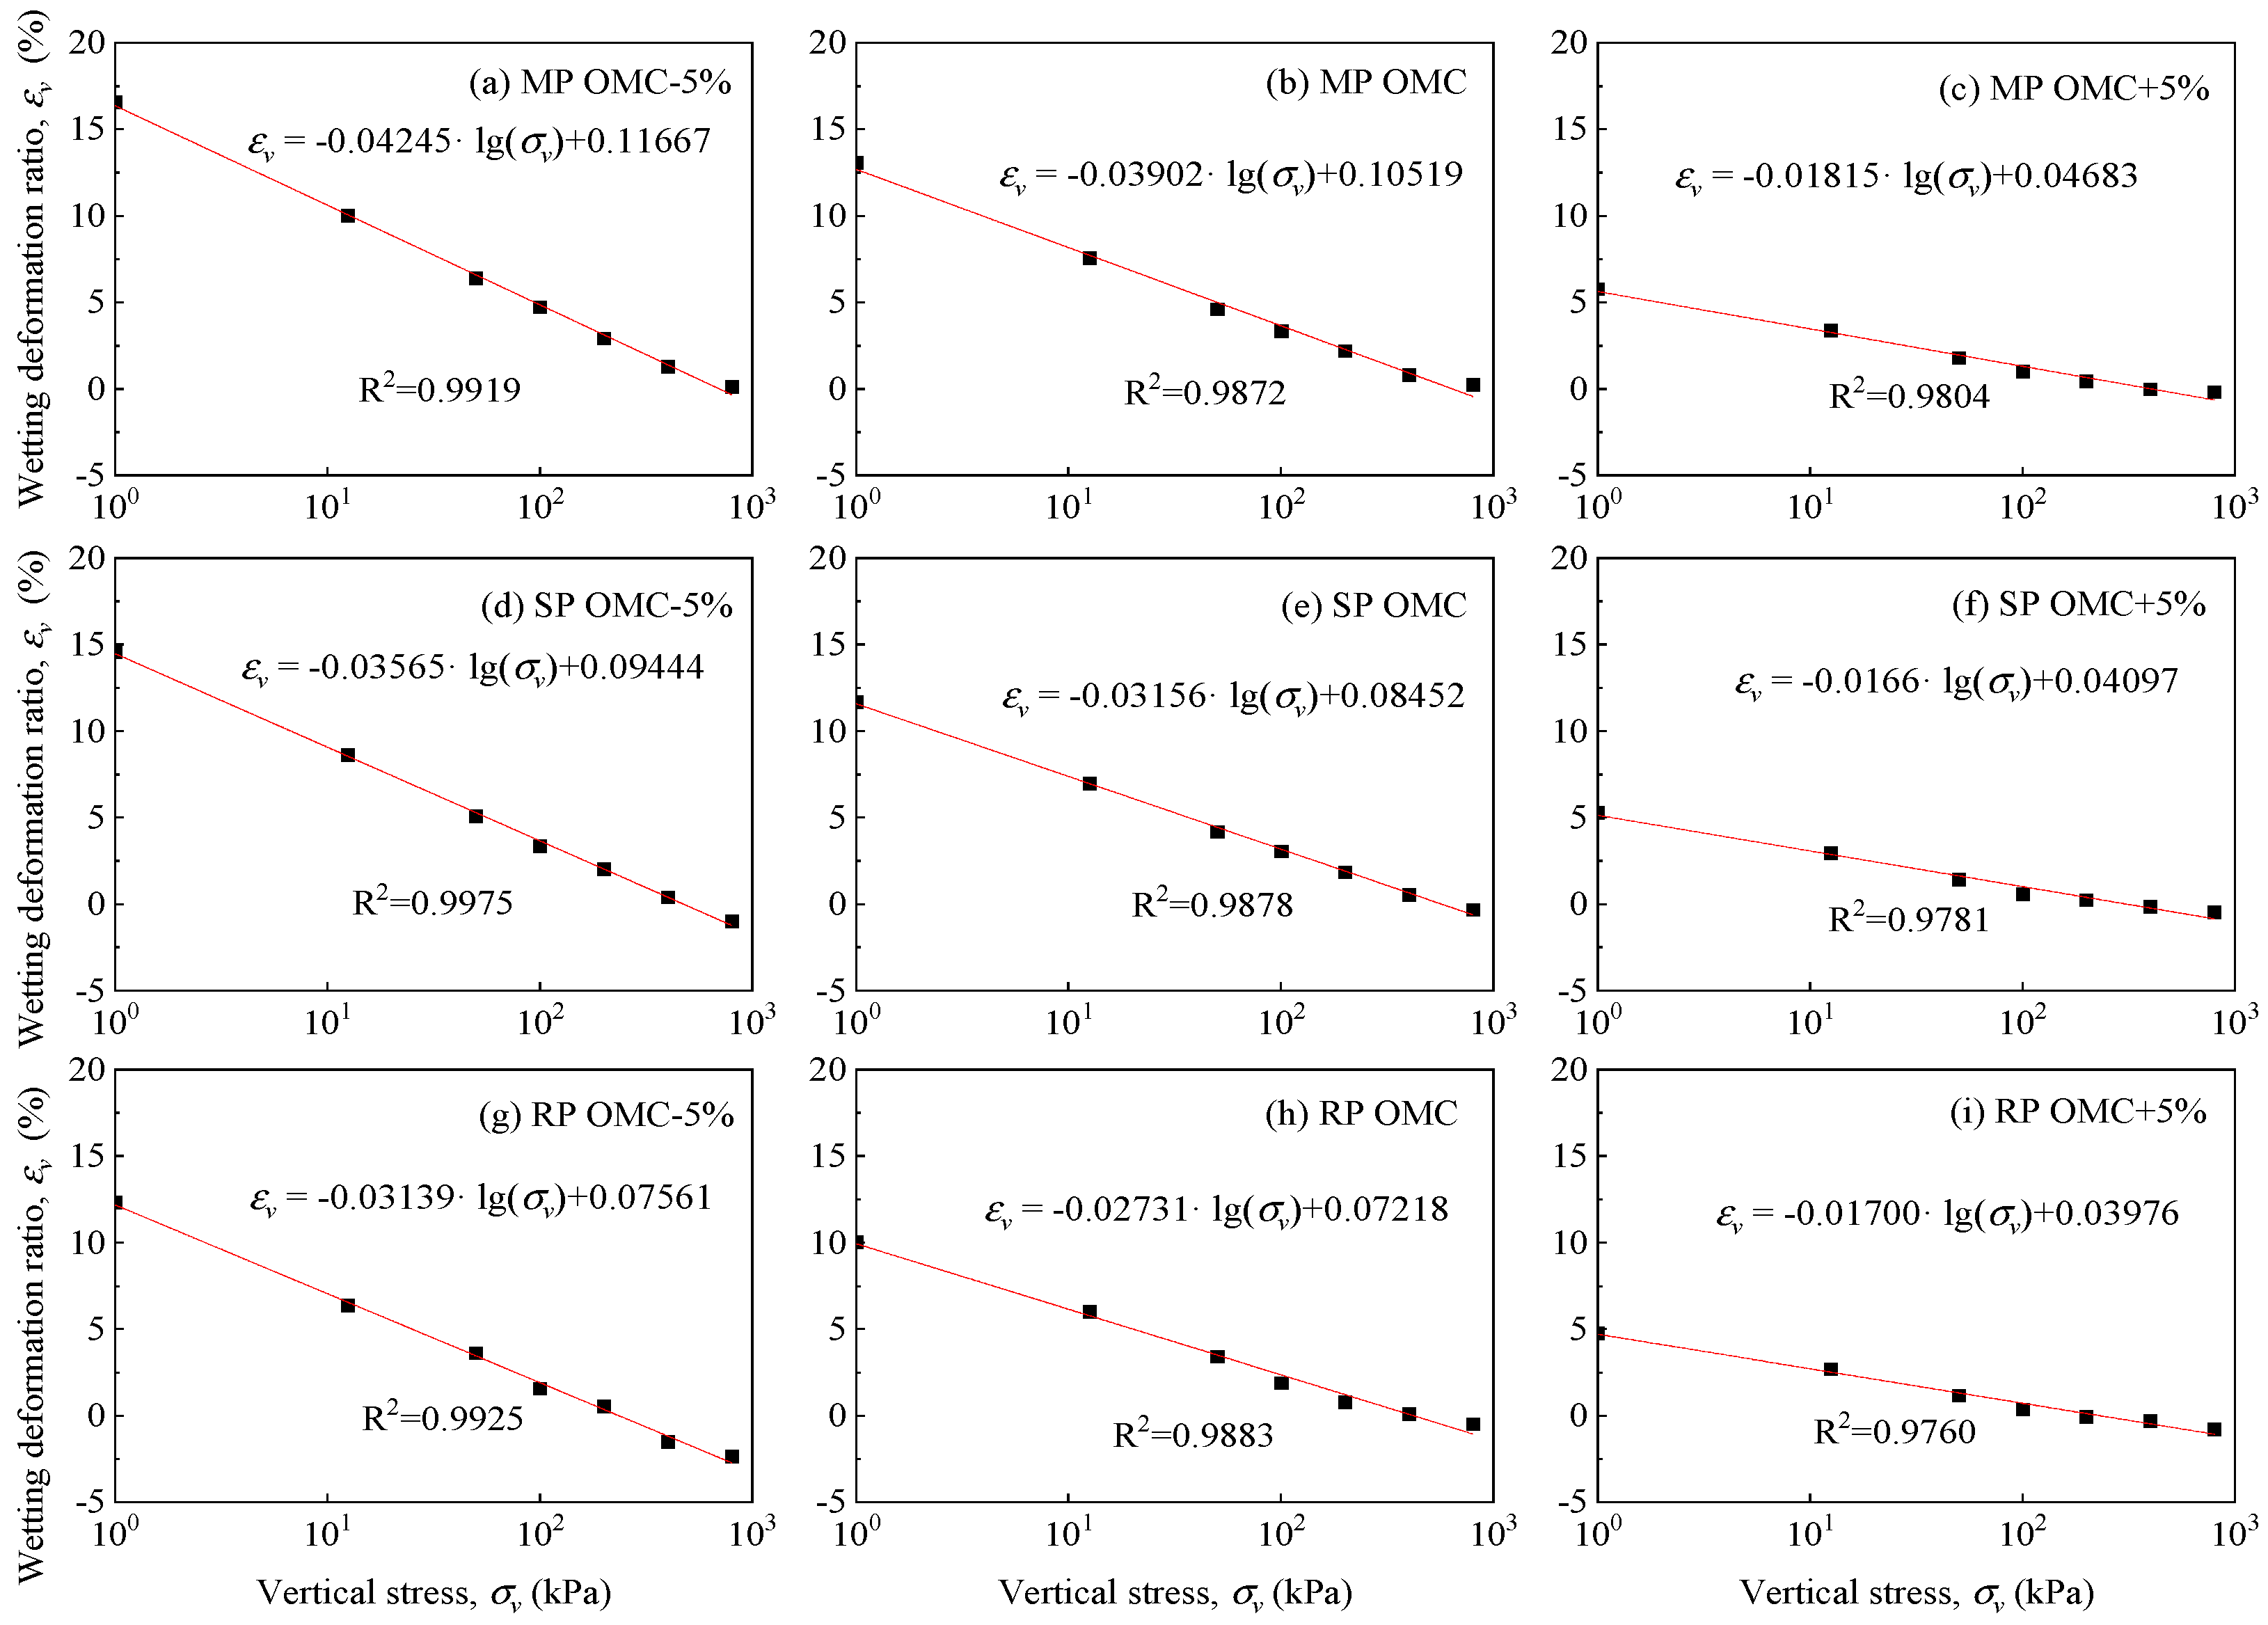
The saturated wetting deformation for soil samples, as determined through the single-line method, is depicted in
Figure 13. The test results reveal that the
-lg
p curves obtained using the single-line method are nearly parallel to each other with lower initial moisture content, which agrees with the results obtained using the double-line method. Moreover, the distance between
-lg
p curves with optimal and higher initial moisture content decreases, as previously analyzed. But under higher vertical stress, the
-lg
p curves tend to stabilize to an approaching line gradually, which contrasts with that using the double-line method.
The impact of initial moisture content on soil samples is shown in
Figure 14. Under identical compaction efforts, wetting deformation for soil samples with optimal and higher initial moisture content demonstrates similarity when subjected to higher vertical loads. For soil samples with lower initial moisture content and subjected to MP or SP compaction effort, the wetting deformation under higher vertical stress closely approximates that observed for samples with optimal and higher moisture content. However, with the RP compaction effort, the samples exhibit more wetting collapse under higher vertical stress. This indicated that the increase in compaction effort could prevent wetting collapse but increase swelling deformation under lower vertical stress.
3.4. Comparison of Saturated Single-Line and Double-Line Methods
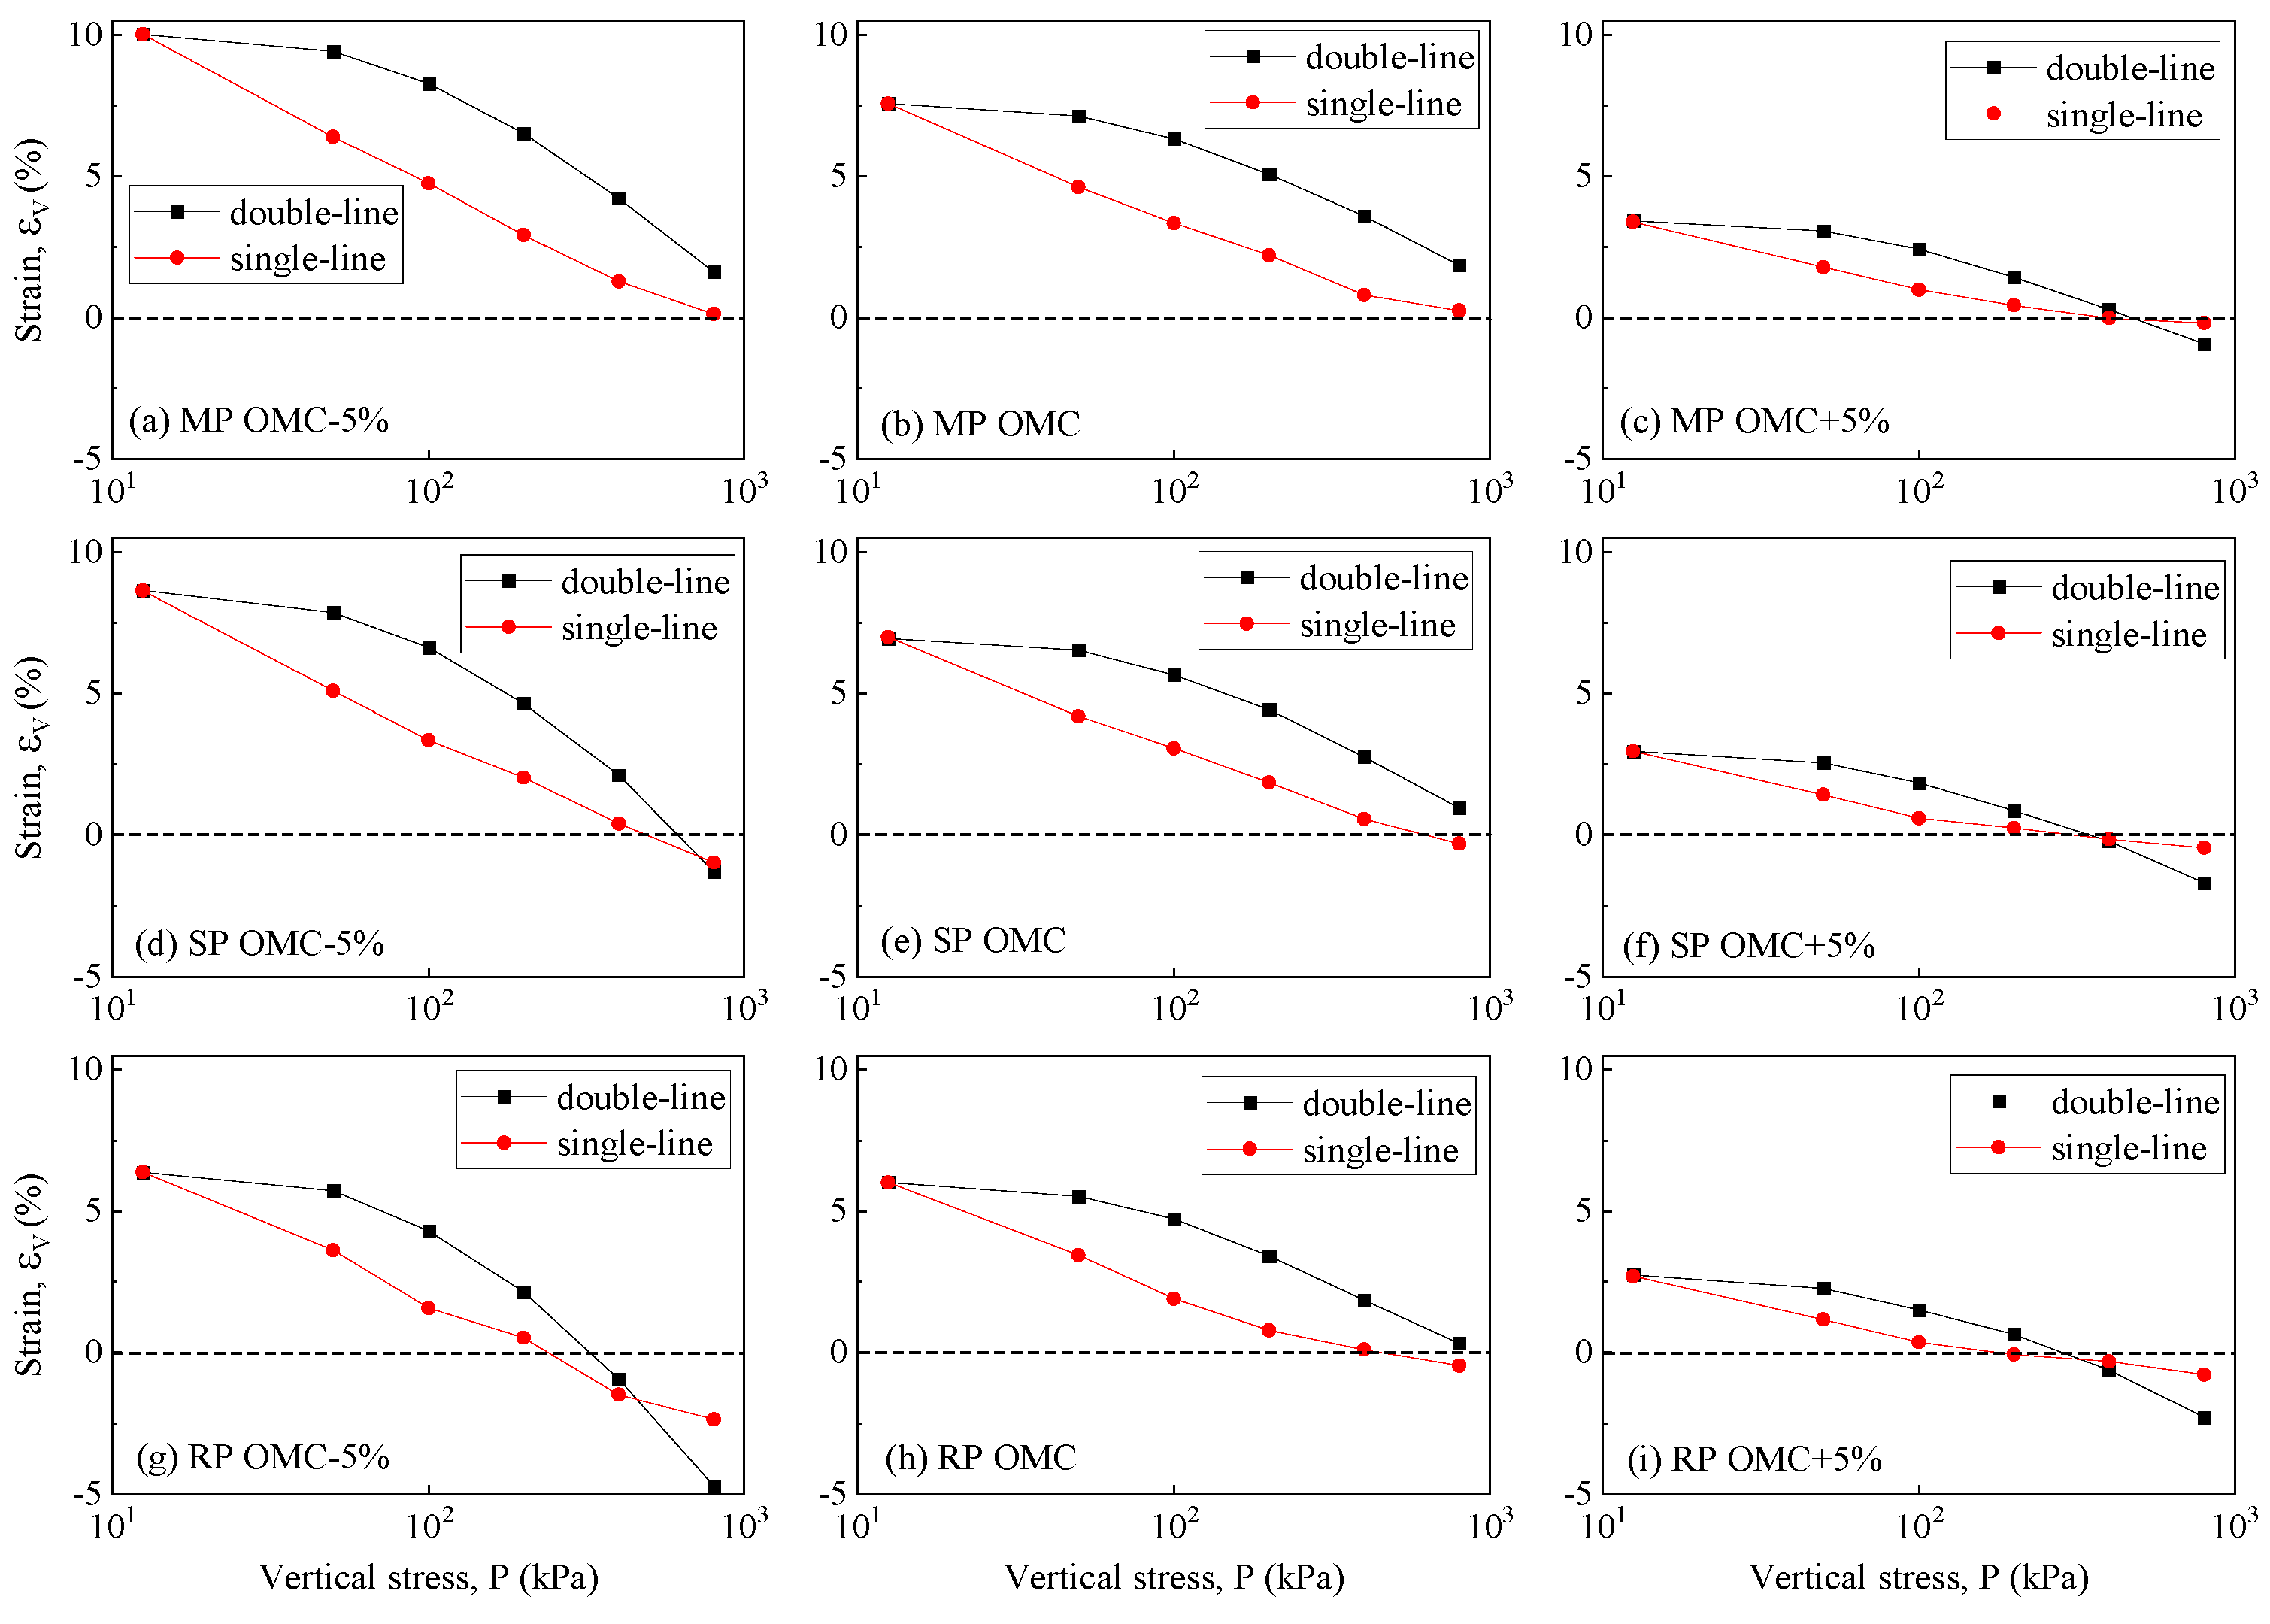
The comparison of wetting deformation between the single-line method and double-line method is presented in
Figure 15. Test results indicate a distinct difference in the declining trend between the two methods. Due to that, the starting points of these two methods are almost identical in the hydraulic path, and the wetting deformation of the starting points is similar. However, the rate of descent differs, with the double-line method showing an increasing trend, while the single-line method displays a decreasing one.
In the single-line method, the soil sample was first loaded to the target stress and then saturated. In this process, the pores in the soil sample had been squeezed and saturated under higher vertical stress; thus, the infiltration of water had little effect on the soil particles and skeleton, and little wetting deformation was observed. In the double-line method, the soil sample was saturated under pre-consolidation stress, and the unsaturated pores were saturated during this process; the soil skeleton still could absorb water and expand. The increase in vertical stress could weaken the soil skeleton, thus wetting collapse was still observed when higher vertical stress was applied in the double-line method. The saturation and loading process of these two methods are different, among which the wetting and loading path of the single-line method is closer to the practical condition. Thus, the test results of the single-line method were adopted in the following prediction model establishment.
3.5. Multi-Step Wetting Deformation Using Single-Line Method
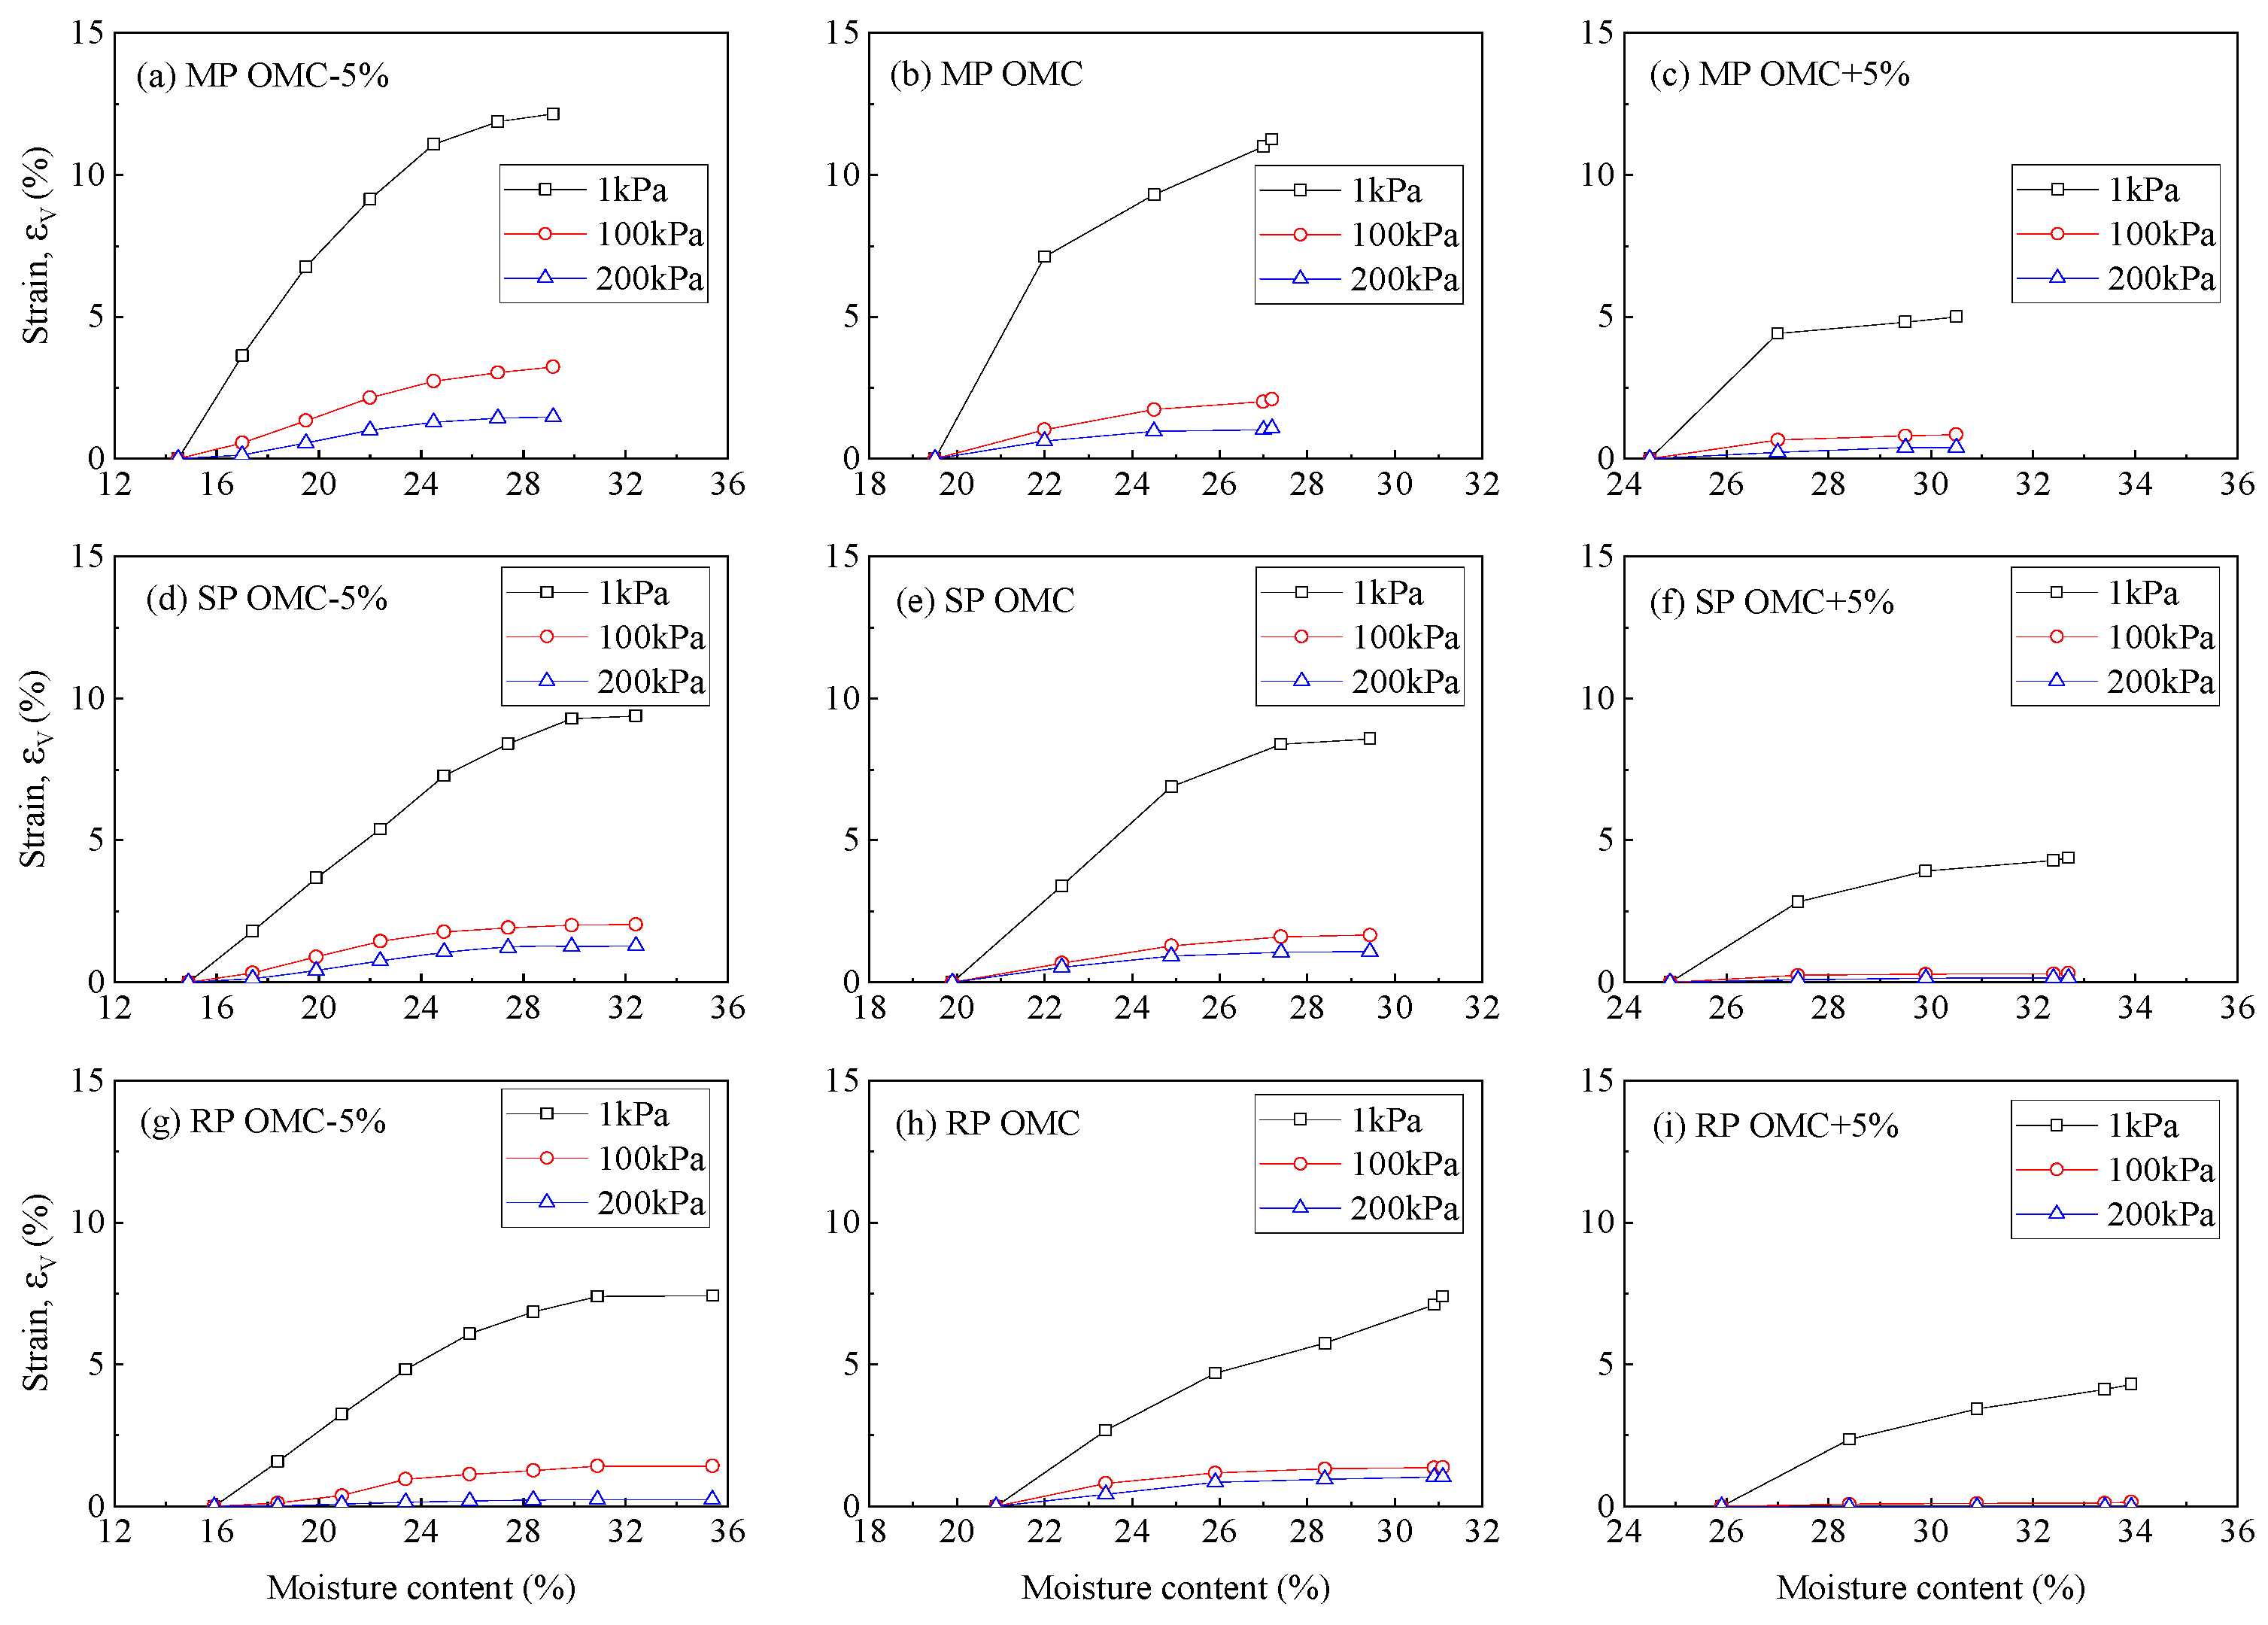
The deformation induced by multi-step wetting using the single-line method is illustrated in
Figure 16. The theoretically calculated saturated moisture content and the wetting deformation measured in saturated wetting using the single-line method are also depicted in each
-lg
p curve as the endpoint. With the progressive injection of water, wetting deformation steadily increases and approaches the endpoint measured in saturated wetting tests. This observation indicates that the results obtained through the saturated single-line method align with those obtained using the multi-step wetting method, affirming the effectiveness of the multi-step unsaturated wetting apparatus developed in this research. In general, the augmentation of vertical stress tends to prevent wetting-induced swelling. However, due to the limitation of the applied vertical load, no collapse was observed in the unsaturated wetting deformation.
Matric suction serves as an important parameter in the characterization of mechanical behavior for unsaturated soil. Thus, the soil water characteristic curve (SWCC), which was characterized by the soil’s initial moisture content and matric suction, was first measured. Then, the relationship between wetting deformation and the matric suction of the tested soil sample was investigated. The SWCC curves utilized in this research were determined through a combination of the filter paper method, vapor equilibrium method, and pore size distribution curve, as detailed in the referenced study [
37,
38]. Due to the bimodal characteristic of the tested soil sample, Equation (4) proposed by Li et al. [
39] was applied to characterize the SWCC curve. In these studies [
37,
38], the relationship between SWCC fitting parameters of Li’s model and the initial void ratio of the tested soil sample was established. Thus, the measured matric suction with different initial states and the fitted 3D surface were determined in
Figure 17.
where
is the saturation degree;
is matric suction (kPa);
is the saturation degree of saturated soil, which is 1.0 generally;
is residual saturation degree;
and
are the residual suction of inter-aggregate pores and intra-aggregate pores, respectively (kPa);
and
are the air entry values of inter-aggregate and intra-aggregate pores, respectively (kPa).
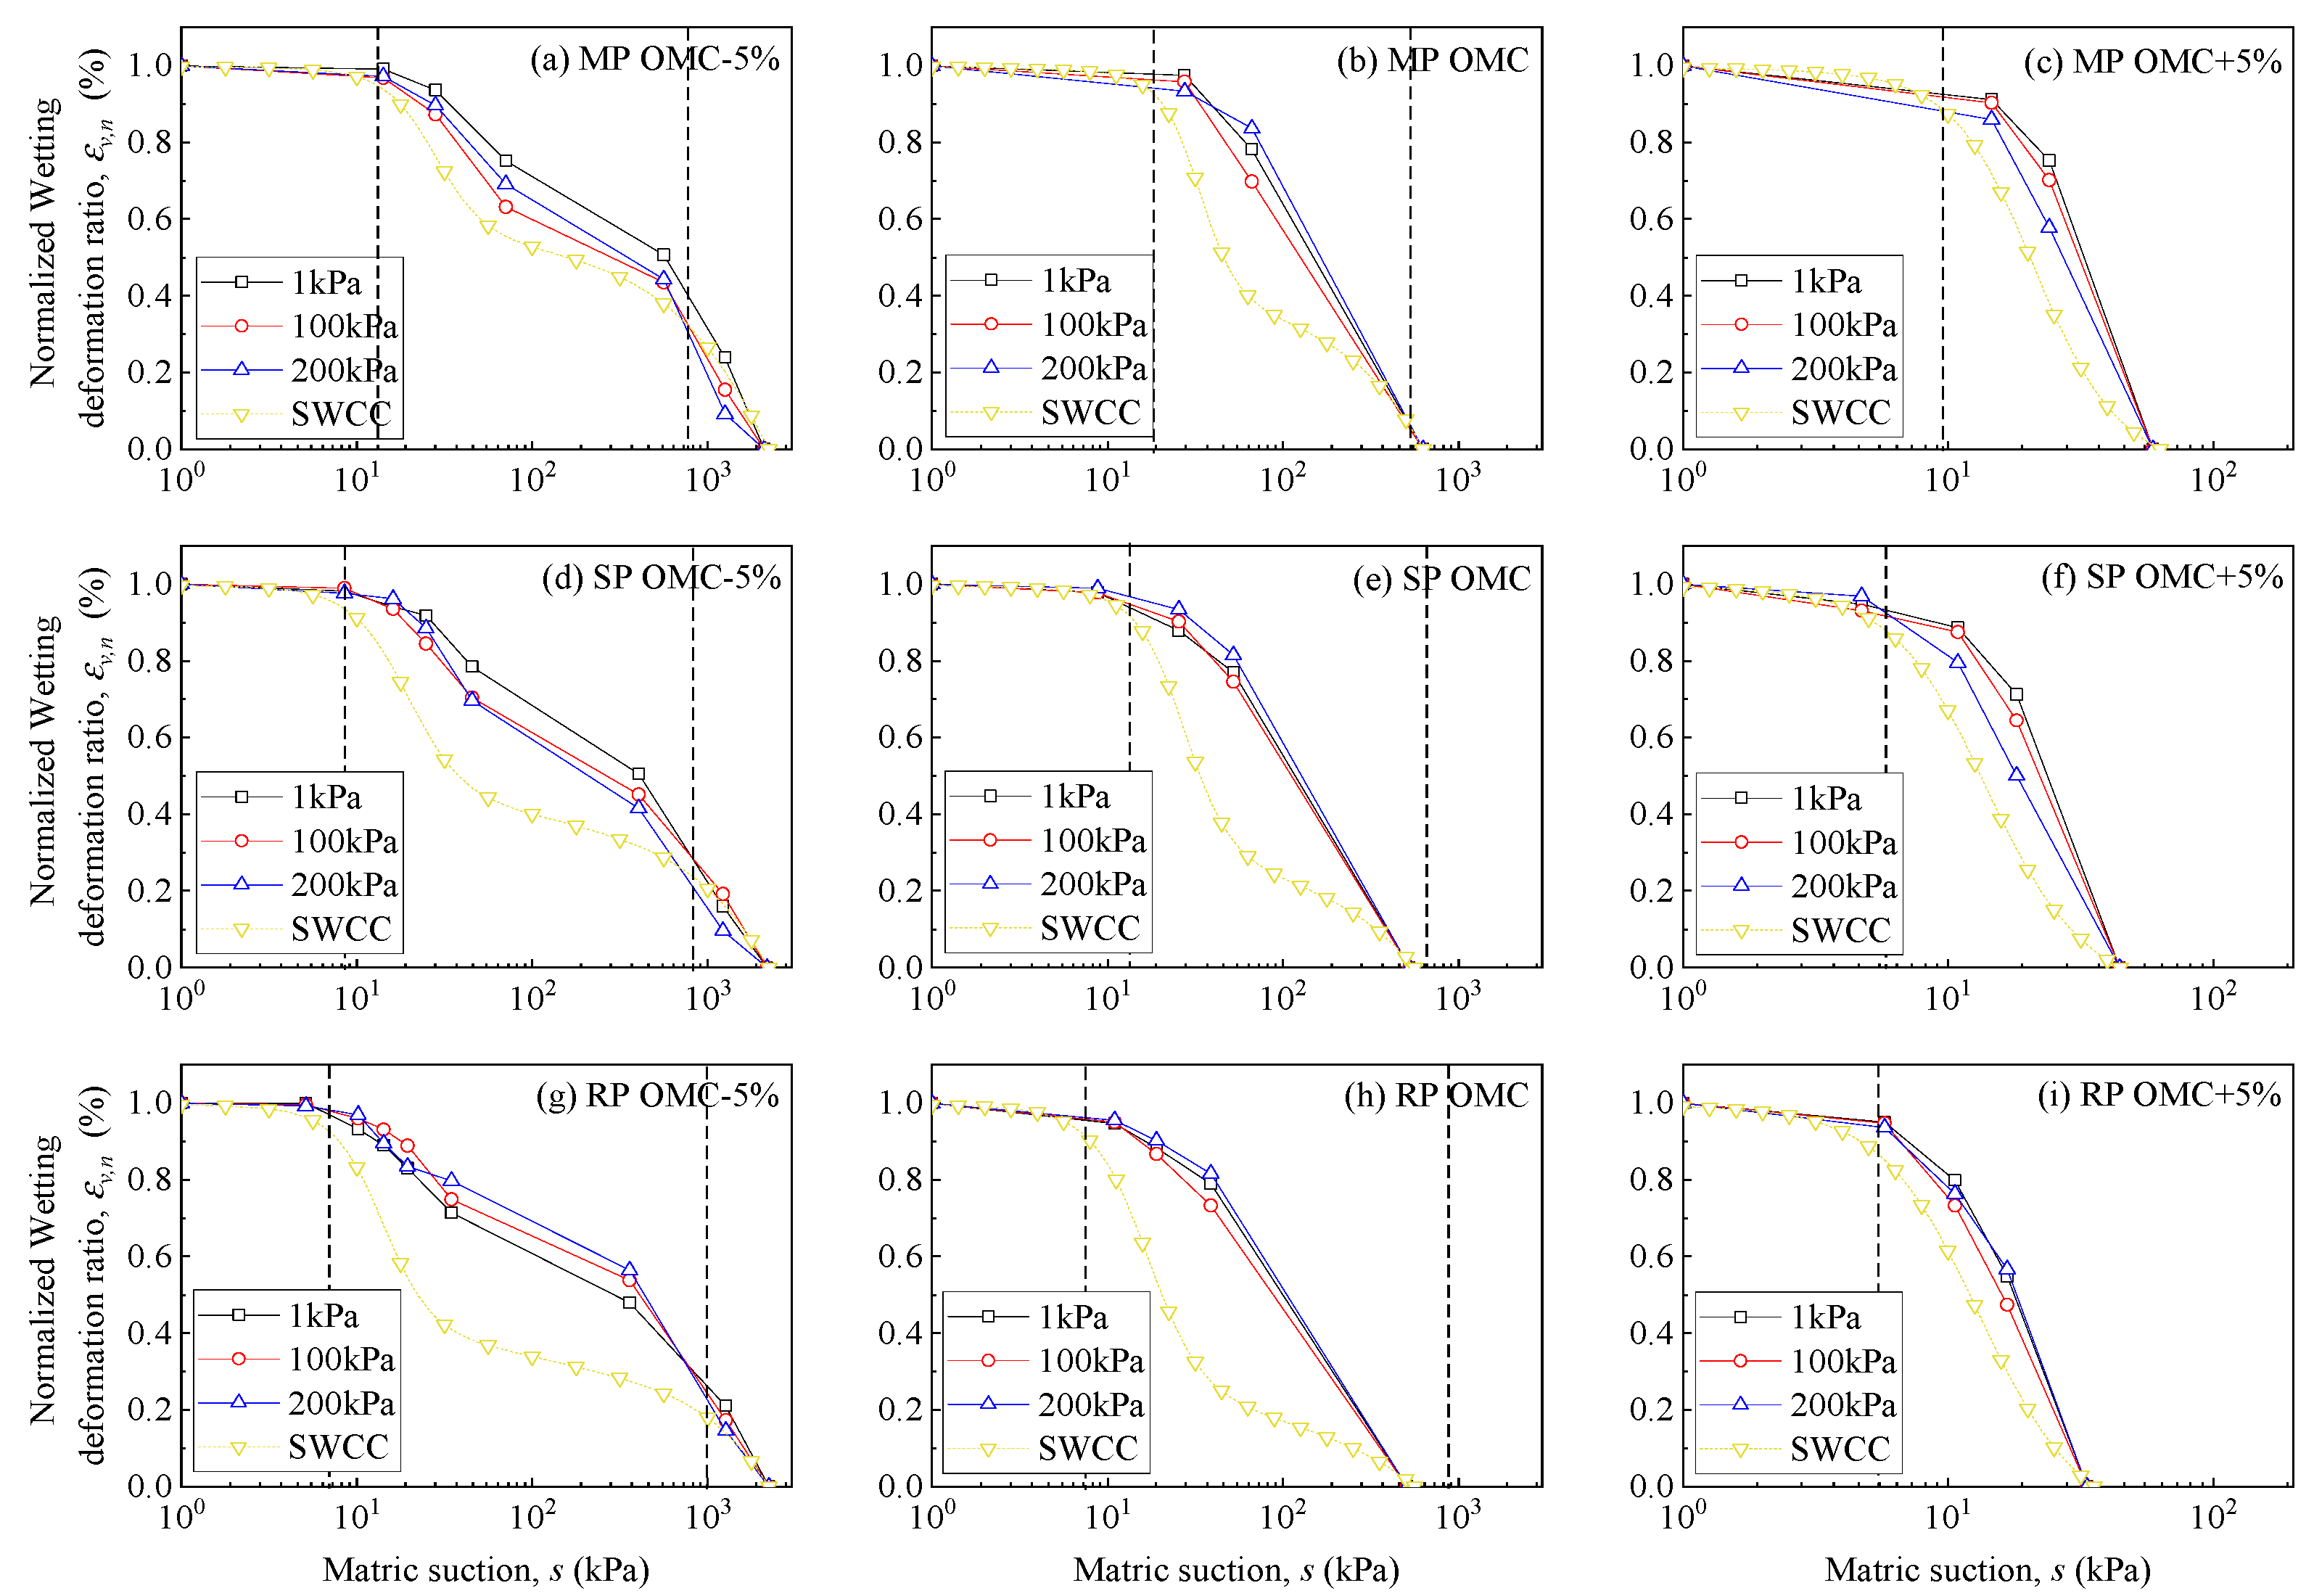
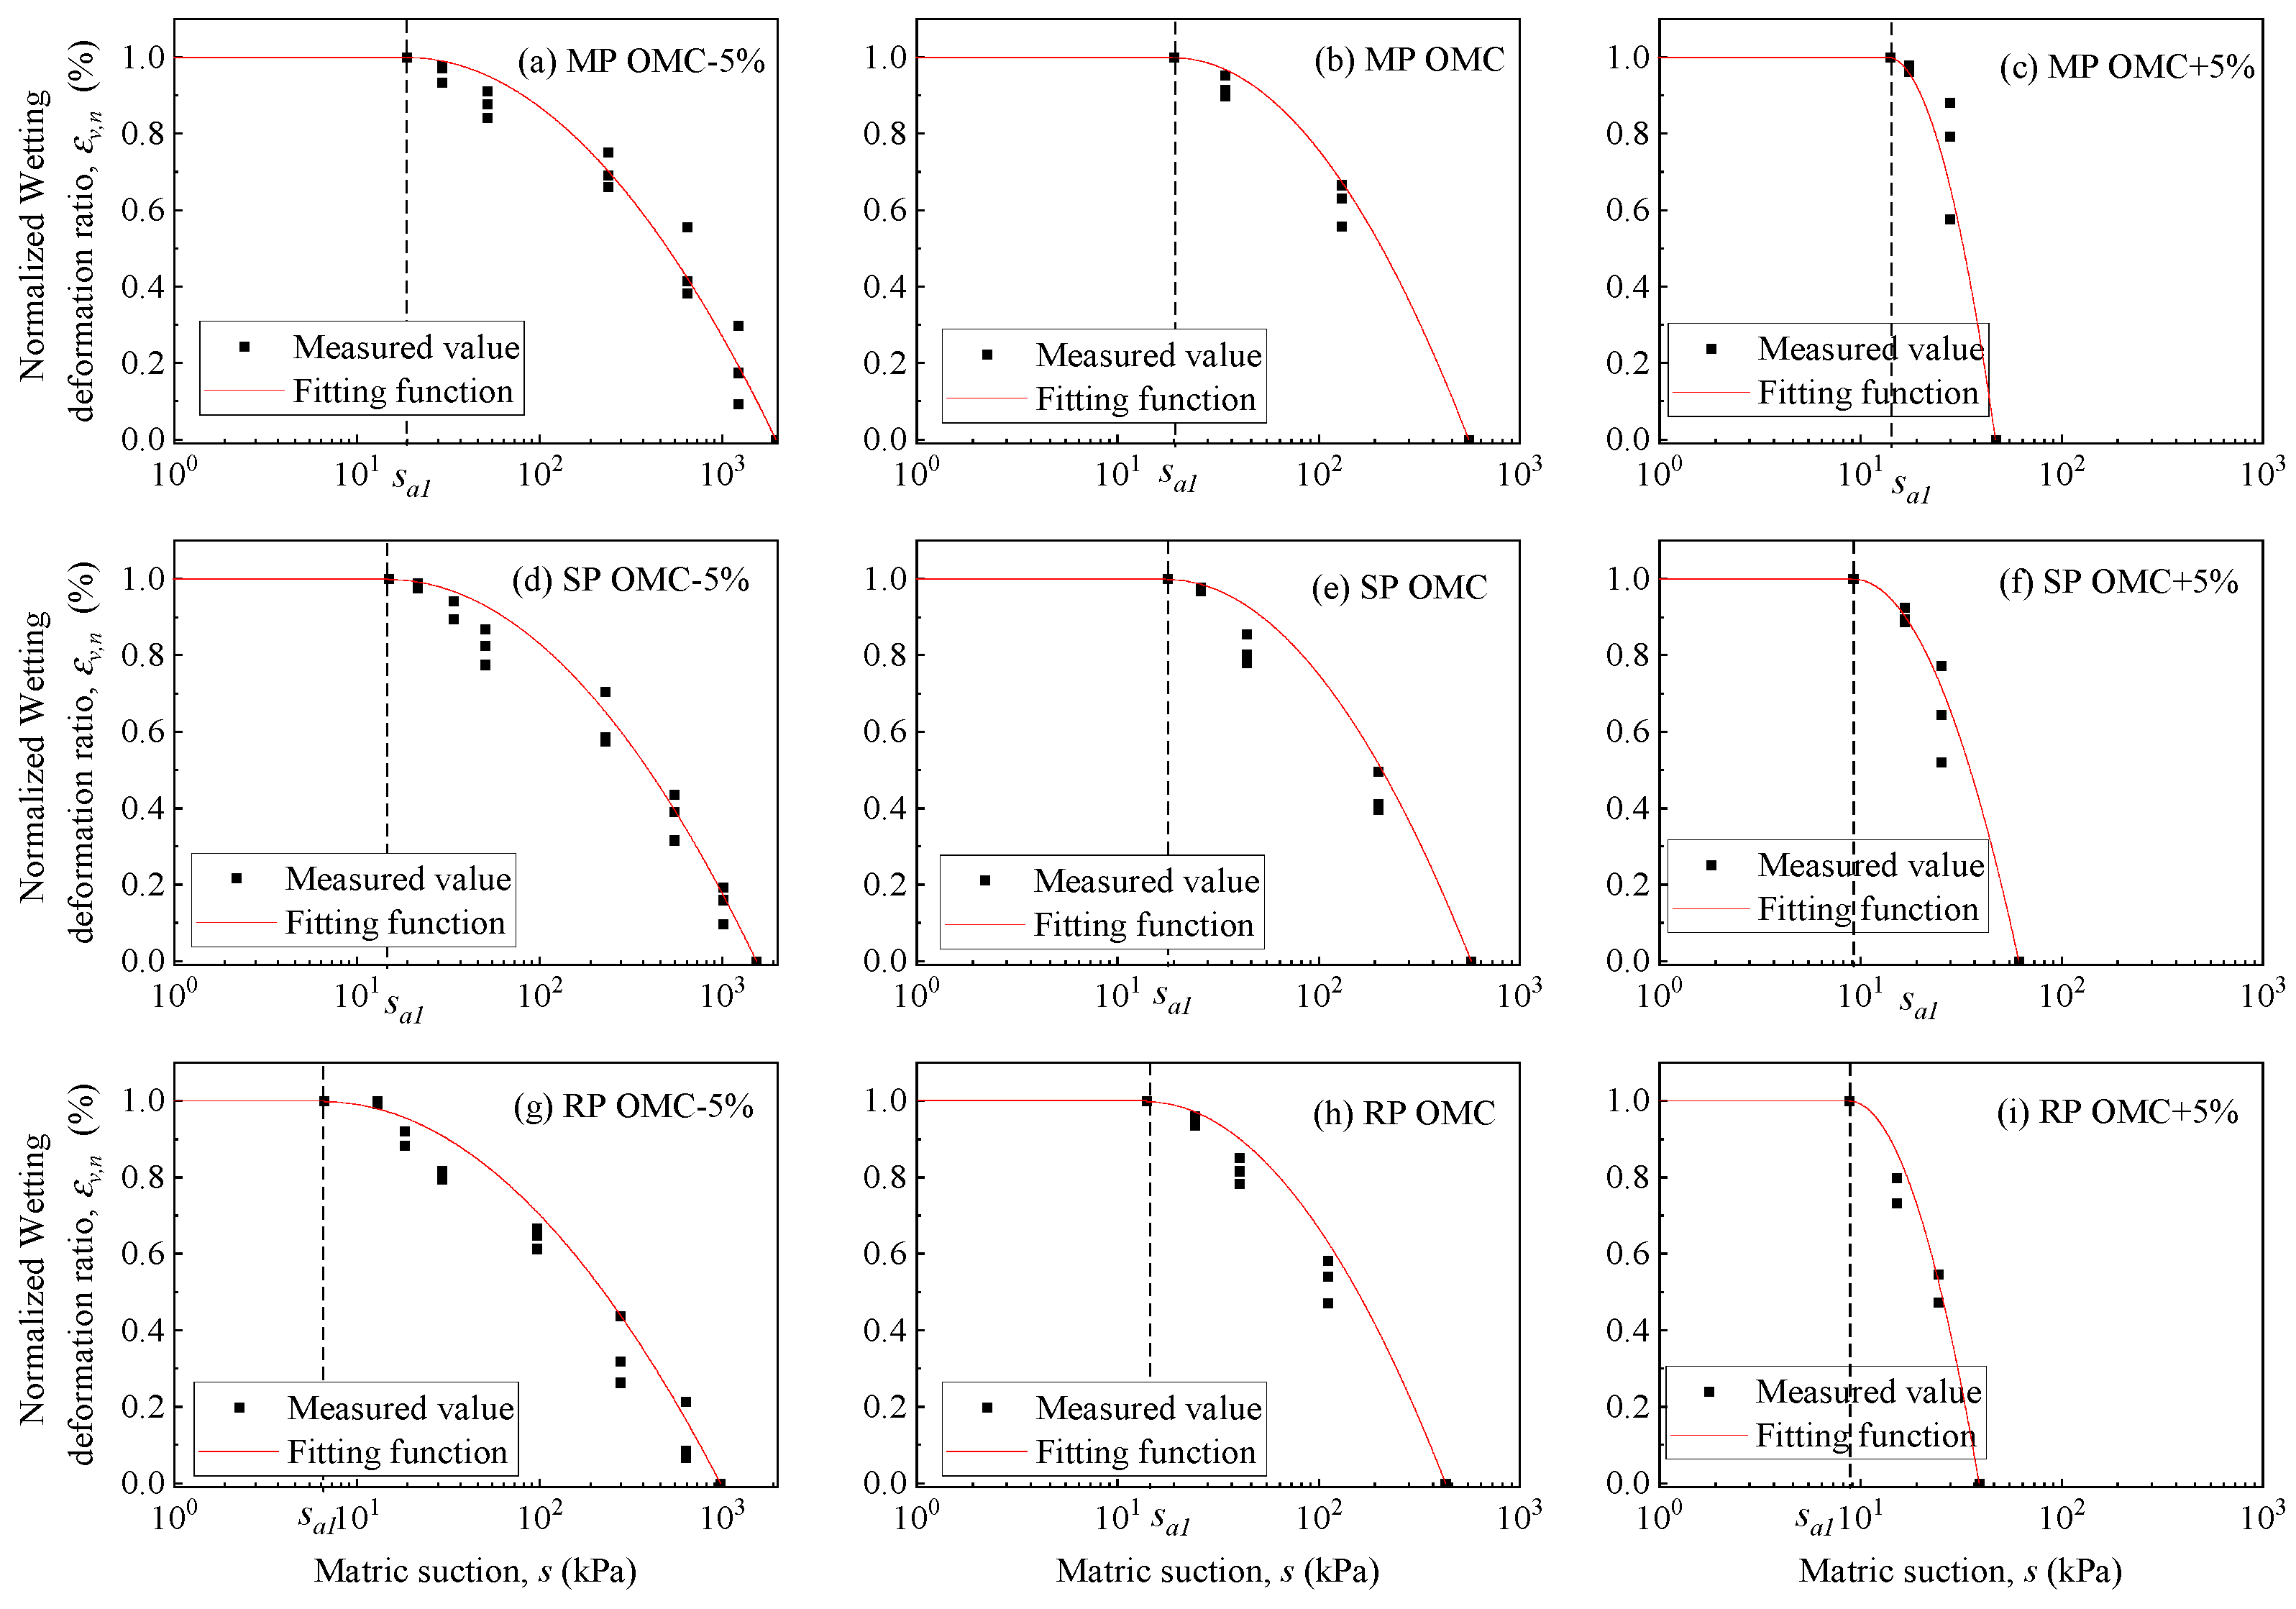
To facilitate a comprehensive comparison of wetting deformation among samples subjected to different test settings, the multi-step wetting deformation for each sample is initially normalized based on Equation (5). As depicted in
Figure 18, the relationship between normalized wetting deformation and matric suction is primarily influenced by the initial state of the soil sample and remains unaffected by vertical stress during multi-step wetting. Before the air entry value of intra-aggregate pores, little wetting deformation was observed. Moreover, the variation trend between normalized wetting deformation and matric suction generally aligns with the SWCC curves, but is not identical. The matric suction range where saturation increases closely corresponds to the range where normalized wetting deformation increases. However, the characteristic stepped curves observed in the SWCC are not evident in the multi-step wetting deformation curves. Notably, samples with lower initial moisture content exhibit stepped curves, while for samples with optimal and higher initial moisture content, the multi-step wetting deformation in matric suction ranges higher than the second entrance value is not measured; thus, the stepped stages were not observed in this study.
where
is the normalized wetting ratio,
is the saturated wetting ratio,
is the wetting ratio during multi-step wetting tests.

