Article

Research on NSGA-II-Based Low-Carbon Retrofit of Rural Residential Building Envelope Structures in Low-Latitude, High-Altitude, Warm-Climate Regions

College of Architectural Engineering, Yunnan Agricultural University, Kunming 650201, China
*
Author to whom correspondence should be addressed.
Buildings 2025, 15(18), 3366; https://doi.org/10.3390/buildings15183366
Submission received: 15 August 2025 / Revised: 9 September 2025 / Accepted: 12 September 2025 / Published: 17 September 2025
(This article belongs to the Section Building Energy, Physics, Environment, and Systems)

Abstract

Rural residential structures account for a substantial share of carbon emissions within the construction industry. Enhancing building envelopes can diminish structural carbon emissions, thereby facilitating the attainment of “dual carbon” objectives. Current algorithm-driven research on the low-carbon retrofitting of residential building envelopes generally neglects temperate regions in low-latitude plateaus, often misses embodied carbon, and utilizes rather limited methodologies for issue identification. This study focuses on rural dwellings in Lijiang, utilizing a cross-validation method that incorporates sensitivity analysis, infrared thermal imaging, and energy efficiency criteria to systematically identify vulnerable regions in the building envelope. Consequently, critical issues are converted into optimization variables for the NSGA-II method, aiming to minimize both embodied carbon and operational energy usage. BAPV is concurrently implemented to partially mitigate renovation expenses. A weighted summation approach delineates stakeholder preferences, resulting in three optimum options. The findings reveal that all three methods correspond to their unique preferences, illustrating distinct trade-offs among energy efficiency, carbon reduction, and economic feasibility. The government-oriented approach attained an energy saving rate (ESR) of 45.11%, a life cycle carbon reduction (LCCR) of 1215.76 kgCO2/m2, and a dynamic payback period (DPP) of 3.65 years. The architect-oriented approach realized the highest energy savings and carbon reduction (45.41%, 1218.96 kgCO2/m2), with a payback period of 3.99 years. The villager-oriented approach emphasized economic viability, achieving an energy savings rate of 41.55%, a carbon reduction of 1149.46 kgCO2/m2, and the shortest payback period of 2.87 years. This study provides an optimization process and reference parameters for building envelopes in a low-carbon design for residential buildings in temperate regions of low-latitude plateaus.

1. Introduction

In response to the escalating peril of global warming, 178 signatory parties ratified the Paris Agreement, committing to peak emissions promptly, attain net-zero emissions by mid-century, and restrict the rise in global temperature to below 2 °C [1]. In this context, China declared its “dual carbon” objectives during the 75th session of the United Nations General Assembly: aiming to peak carbon emissions by 2030 and attain carbon neutrality by 2060 [2]. The nation later released pertinent policy documents to facilitate implementation. Lijiang City, designated as a “Zero-Carbon Cultural Tourism Demonstration Zone”, has unveiled its Low-Carbon Development Plan, advocating for rooftop photovoltaic systems and green building renovations to mitigate carbon emissions in the construction industry. In 2022, rural residential structures contributed substantially to the construction sector’s carbon emissions: operational emissions totalled 480 million tCO2, comprising 21% of all operational building emissions, while embodied carbon emissions reached 231 million tCO2, representing 16.7% of the nation’s total embodied carbon emissions [3]. As a result, working together to lower both the operational and embodied carbon emissions from rural houses in Lijiang aligns with the national “dual carbon” goals and helps local efforts for low-carbon development.
Preliminary studies predominantly concentrated on urban residential structures, investigating the effects of energy retrofits on indoor CO2 levels [4], the significance of governmental measures in mitigating building emissions [5], and the impact of occupant behaviour on carbon emissions from buildings [6]. As research progressed, the focus broadened from urban dwellings to rural structures [7], while low-carbon retrofitting strategies advanced from conventional energy-efficient design to include renewable energy technologies [8], innovative materials [9], passive building techniques [10], and intelligent optimization algorithms [11]. Integrating optimization algorithms for the low-carbon retrofitting of residential building envelopes has progressively emerged as a significant focus and prominent topic in the architectural domain [12]. Since building envelopes significantly influence both operational and embodied carbon throughout a structure’s entire life cycle, optimizing them can substantially reduce carbon emissions [13]. Optimization algorithms facilitate more rational parameter settings. Existing research has extensively addressed carbon emissions across multiple climate zones, building types, various algorithms, and diverse stages of the building life cycle. Song, J. et al. [14] integrated deep neural networks (DNNs) with NSGA-II to execute low-carbon design for wall and roof insulation, exterior window types, and window-to-wall ratios in rural homes in arid and hot climates; Fang, H. et al. [15] utilized parametric analysis to enhance insulation materials, outside windows, and exterior doors for homes in extremely cold climates; Deng, Q. et al. [16] offered optimal high-performance combinations of external and interior walls for rural residences in locations characterized by hot summers and cold winters, utilizing simulation-driven parametric analysis and optimization based on DeST-h. These studies generally focused on typical climate zones. Due to the substantial variations in the structure and thermal efficiency of building envelopes across different climatic conditions, it is imperative to execute low-carbon optimization of building envelopes customized for certain climate zones. Recognizing envelope issues before upgrading is an essential step. Current methodologies predominantly encompass the identification of essential characteristics through analysis of variance (ANOVA) and the quantification of their influence utilizing partial effect size (η2) [17], the acquisition of pivotal variables through field and online surveys [18], and the application of simulation-based parametric screening techniques [19]. Exclusively depending on singular data sources or research methods poses the danger of identification bias and resource inefficiency due to insufficient cross-validation. Simultaneously, algorithmic low-carbon envelope retrofits mostly concentrate on operational-phase carbon emissions [20,21,22], while giving comparatively little consideration to alterations in embodied carbon due to material selection. Embodied carbon from insulating materials and other components represents a significant amount of the envelope’s lifespan carbon emissions and must not be disregarded [13].
In conclusion, while considerable advancements have been achieved in computational methodologies for low-carbon building exterior design, research focused on low-latitude plateau temperate regions is markedly inadequate. Simultaneously, the focus on embodied carbon in renovation procedures has been inadequate, and techniques for detecting exterior flaws require further enhancement. This study aims to create low-carbon retrofitting solutions for rural homes in low-latitude plateau temperate regions that accommodate various stakeholder interests. Consequently, rural residences in Lijiang, China—a prototypical low-latitude plateau temperate region—constitute the focus of the study. This work thoroughly evaluates thermal faults in building envelopes by cross-validation of sensitivity analysis, infrared thermal imaging, and energy efficiency standards, identifying critical elements that influence their thermal performance. The identified factors function as optimization variables. An evaluation model is developed based on the NSGA-II algorithm, using embedded carbon and operational energy consumption as optimization objectives, focusing on energy savings, carbon reduction, and cost reduction. We evaluate the comprehensive advantages of various solutions in conjunction with BAPV technology. The weighted sum technique delineates the desires of many stakeholders, resulting in an optimum solution that satisfies the requirements of three principal groups: the government, designers, and villagers.

2. Methods

This paper’s research methodology is segmented into six components: initially, an investigation of the research object’s location is conducted to identify the case subject; subsequently, the case subject is analyzed to ascertain the optimization variables and objectives. Energy simulation software, DesignBuilder-7.0.2.006, equipped with NSGA-II algorithms, is employed for multi-objective optimization to generate the Pareto solution set. Using life cycle carbon reduction (LCCR), annual operational carbon (AOC), annual energy savings (AES), energy savings rate (ESR), incremental cost (IC), and dynamic payback period (DPP) as evaluation indicators and embodied carbon and annual operational energy consumption (AOEC) as optimization targets, a multi-objective optimization plan is formulated that combines BAPV technology with multi-attribute decision-making methods to achieve carbon reduction, energy conservation, and cost reduction. Finally, the optimization solutions are validated through comparative analysis of analogous cases and correlation analysis of optimization variables and objectives, among other methodologies. Figure 1 delineates the precise flow of the methodology.

2.1. Research on Research Sites

2.1.1. Climatic Conditions

The current research site is in Lijiang City, northwest Yunnan Province, China, near the juncture of the Yunnan–Guizhou Plateau and the Tibetan Plateau. The region is classified within the thermal zoning for structures in temperate areas, characterized by a subtropical monsoon climate featuring elevated temperatures and precipitation during the summer, reduced temperatures and rainfall in the winter, and clearly defined hot and cold seasons. In 2020, the meteorological data indicated that the average annual temperature in Lijiang City was 12.49 °C, with January being the coldest month with an average temperature of 5.23 °C and July being the warmest month with an average temperature of 18.85 °C. The mean annual precipitation is approximately 1000 mm, the average frost-free duration is 267 days, and the mean annual wind velocity is 3.11 m/s. During winter, solar conditions are optimal, with an insolation rate of 77%, an average monthly solar radiation of 469 MJ/m2, and an annual total solar radiation of 6157 MJ/m2. The annual sunshine hours amount to 2373, positioning solar energy resources at a superior level nationally [23].

2.1.2. Architectural Features

The site is situated in a temperate area of the low-latitude plateau, and its architecture exhibits distinct geographic features relative to structures in other regions. Aerial photography from a drone was utilized to identify the general appearance of local rural dwellings, while specific parameters of each enclosure structure were gathered through household surveys. The research indicates that local rural dwellings predominantly utilize adobe structures, employing uniform building materials throughout the enclosure, with minimal variation in structural parameters. The area of the living room and the bedroom differs by 0 to 2 square meters. The net height of the interior, the thickness of the south-facing exterior wall (Swall), and the thickness of the east-, west-, and north-facing exterior walls (EWNwall) vary by 0 to 0.2 m, 0 to 3 mm, and 0 to 5 mm, respectively. Additionally, the parameters of the enclosure structure, including the exterior window, are largely consistent. Table 1 presents the structural parameters of local rural houses.

2.1.3. Heating Patterns

To examine how locals use heating equipment, a survey was carried out. Electric blankets, electric heaters, electric heating tables, “Little Sun,” and other portable electric heating devices are among the most frequently used, indicating a typical hybrid heating mode. The results indicate that residents in the area primarily rely on electric heating. Even though this kind of heating is adaptable and does not need to be installed, it typically has low thermal efficiency, high power consumption, and only localized heating capabilities, which makes it challenging to meet the needs of the entire house for thermal comfort, particularly during the winter months, when the indoor thermal environment performs poorly.

2.2. Case Object Selection and Modelling

2.2.1. Case Object Selection

The research findings indicate that local rural dwellings exhibit a high degree of uniformity in outer form and construction features, with few variations. This article selects a representative one-story bungalow as the research subject. The home is oriented north–south to maximize daylight in winter, minimize direct sunlight in summer, and optimize inside lighting and natural ventilation, thus improving living comfort and energy efficiency. The primary functional areas, including the bedroom and living room, are situated on the southern side, facilitating increased solar exposure. The overall building area measures 72.03 m2, with a depth of 4.2 m and a clear height of 2.35 m. The arrangement, from left to right, includes a living area, a bedroom, a storage room, a corral, and a bathroom. The integration of the questionnaire survey and electricity billing data yielded an annual energy use of 4316 kWh for the average household in this study. Figure 2 presents the real photograph, exploded view, and floor plan of the subject case.

2.2.2. Modelling and Validation

Utilizing fundamental elements such as structural configurations, design parameter dimensions, and types of doors and windows from field measurements, the energy consumption analysis software Design Builder is employed to construct a model of a typical residential dwelling and establish the simulation parameters.
Building Envelope Configurations. Table 2 delineates the precise parameter configurations for the building envelope.
Fundamental parameter configurations. The personnel density, duration of occupancy, and lighting duration in the living room and bedroom were established through field research; the average thermal resistance of clothing during winter and summer, lighting power density, electrical equipment power density, air change frequency, and indoor design temperature were derived from the JGJ 475-2019 energy-saving design standard for residential buildings in temperate regions [23]. Table 3 delineates the precise parameter configurations for model simulation.
Installation of a heating system. Air source heat pumps are extensively utilized for their superior energy efficiency in moderate climates compared to heating systems like gas boilers and electric heaters, with individual heating demands predominantly concentrated in the southern region [24]. Radiators facilitate uniform indoor heat distribution, enhancing comfort and temperature stability while also providing rapid responses and flexible temperature adjustments. Furthermore, devoid of air movement, radiators function silently and are not prone to stirring dust, so they contribute to a healthy and comfortable living environment. The construction is straightforward, easily installed and maintained, suitable for retrofitting buildings, and enhanced with a heat pump that uses air as its source [25]. This work establishes a heat pump that uses air as the heat source, utilizing radiators as the heating terminal. Table 4 delineates the precise parameter configurations of the heating system.
Validation of the Model. Mean squared error (MSE) is a prevalent metric for quantifying the error of predictive models. The MSE quantifies the divergence between the observed and predicted values; a reduced MSE signifies enhanced model precision. Root mean squared error (RMSE) is the square root of MSE, offering a clear assessment of the discrepancy between observed and predicted values. On 13 January 2025, we gathered 24 sets of temperature data and 24 sets of PMV measurements at hourly intervals. The data were subsequently compared with 24 sets of simulated temperature and PMV values produced using DesignBuilder software. The model’s reliability was assessed using MSE and RMSE. The computed MSE for temperature was 0.086, with an RMSE of roughly 0.293; for PMV, the MSE was 0.012, with an RMSE of approximately 0.11. Both the measured and simulated values demonstrated continuous trends with negligible error, validating the model’s high accuracy and appropriateness as the study framework for this paper. Point P in Figure 2 denotes the site of the temperature and humidity measurement, as well as the PMV value assessment point. Table 5 enumerates the precise specifications of the testing device. The formulas for calculating the mean square error and root mean square error are (1) and (2).
M S E = 1 n i 1 n y i y i 2
R M S E = 1 n i 1 n y i y i 2
In the formula, MSE signifies the mean square error, RMS indicates the root mean square error, yi represents the observed value, yi′ denotes the predicted value, and n refers to the sample size.

2.3. Case Object Analysis

2.3.1. Single-Factor Sensitivity Analysis and Ranking of Key Parameters in Envelope Structures

Factors affecting building energy consumption include the thermal conductivity coefficients of east-, west-, and north-facing exterior walls (EWNWall(U)), the thermal transmittance of south-facing exterior walls (Swall(U)), the thermal transmittance of the roof (Roof(U)), the thermal transmittance of the floor (Floor(U)), the thermal transmittance of external doors (External door(U)), the thermal transmittance of partition walls (Partition(U)), the thermal transmittance of external windows (External window(U)), and the window-to-wall ratio (WWR). We employ a single-factor sensitivity analysis to determine the principal factors affecting the energy consumption impact of building envelopes. Utilizing established building envelope characteristics as a reference, we modify each parameter to align with the energy efficiency code limit values, compute the resultant variations in energy usage, and prioritize the significance of each aspect accordingly. Parameter ranges were established based on the constraints outlined in the General Specification for Energy Conservation and Renewable Energy Utilisation in Buildings (GB55015-2021) [26]. The precise ranges for each element are outlined in Table 6. Simulations were executed with DesignBuilder software, with the design period chosen from the software as the simulation duration. All other settings were consistent with those presented in Table 3. Figure 3 illustrates the disparities in energy usage resulting from variations in several envelope characteristics. The effects of WWR, External Door (U), and Partition (U) on energy usage were minimal, totalling 0.078 kWh, 0.043 kWh, and 0.22 kWh, respectively. The importance ranking of eight factors affecting energy consumption is as follows: EWNwall(U) > Swall(U) > Roof(U) > External window(U) > Floor(U) > WWR > External door(U) > Partition(U). All entries under “Reference Sources” in Table 6 are cited from Building Energy Efficiency and Renewable Energy Utilization (GB55015-2021).

2.3.2. Thermal Defect Analysis of Building Envelope Based on Infrared Thermal Spectroscopy

According to the sensitivity analysis conducted in the preceding section, we discovered five factors that significantly influence building energy use. Subsequently, infrared thermal imaging was used for on-site verification to precisely locate thermal faults in the building’s exterior.
Examination Program. The envelope infrared thermography test was performed on 14 January 2025, aimed at characterizing the thermal distribution of the building envelope to obtain an initial assessment of its thermal performance and identify potential thermal deficiencies, including hot and cold bridging, inadequate insulation, and areas of discontinuity. The testing apparatus employed was a Fluke TiS20 infrared thermal imaging camera, with the precise technical specifications detailed in Table 7. In accordance with the stipulations of the “Energy Efficiency Inspection Standard for Residential Buildings” [27], to mitigate the impact of solar radiation, wind velocity, and other environmental variables on infrared imaging results, this assessment was conducted in the evening when there was a significant temperature differential between indoor and outdoor environments, approaching sunset, thereby enhancing the thermal map’s contrast and the precision of defect identification.
The test yielded results and underwent analysis. A preliminary qualitative investigation of thermal anomalies in the building envelope was performed utilizing infrared thermography. Figure 4 illustrates the infrared thermal spectra of the envelope, where darker hues denote lower temperatures and lighter hues signify higher temperatures. Analysis of the infrared thermal spectrum diagram reveals an uneven distribution of surface colour across the external wall, ceiling, and window areas, indicating significant colour variation. This suggests an irregular surface temperature distribution and potential deficiencies in thermal insulation performance. The region where the ceiling meets the wall exhibits a darker hue and a lower temperature than the adjacent areas, initially suggesting a thermal bridge phenomenon; the colour distribution across the floor is relatively uniform, with no discernible anomalies; conversely, the window area displays pronounced low-temperature characteristics, indicating substantial heat dissipation in this locale. To further validate the issues revealed in the infrared thermograms, we conducted a field investigation of the building envelope and discovered that the residential structures in the area were predominantly uninsulated and that the windows consisted solely of standard 3 mm single-pane flat glass. These conditions may have resulted in inadequate thermal performance and an inability to effectively mitigate heat exchange between the interior and exterior, corroborating the problems identified through the infrared thermograms.

2.3.3. Comparative Analysis of Envelope Heat Transfer Coefficients Based on Building Energy Codes

The heat transfer coefficients (U) are a crucial metric for assessing the thermal insulation efficacy of building envelopes, indicating the heat transfer ability per unit area at a unit temperature differential. Upon comparing the U-values of the building envelope in the case study with those outlined in GB55015-2021 General Specifications for Building Energy Conservation and Renewable Energy Utilization [26] for temperate regions, it was determined that the U-values of the building envelope predominantly surpass the stipulated requirements, thereby not conforming to the energy-saving design standards. Table 8 illustrates a comparison between the U-values of the existing building envelope structures and those stipulated in the standard.

2.4. Multi-Objective Optimization Modelling

2.4.1. Multi-Objective Optimization Tool and NSGA-II Algorithm

This research utilizes DesignBuilder software, equipped with the NSGA-II algorithm, as the optimization tool, which is more user-friendly and less susceptible to errors compared to alternative optimization approaches. NSGA-II is a rapid, non-dominated multi-objective genetic algorithm that incorporates an elite retention method. It is extensively utilized in optimizing building efficiency and is regarded as extremely dependable [28]. This algorithm proficiently manages nonlinear, discrete choice variables and objective functions [29], exhibiting remarkable convergence characteristics that produce solution sets closely resembling the genuine Pareto frontier. Moreover, NSGA-II does not necessitate predetermined objective weights or priority, facilitating equitable optimization across all objectives and offering thorough, balanced decision-making references [30]. Our study is a dual-objective, five-variable investigation with computational budget constraints. NSGA-II achieves a uniformly distributed Pareto solution set through “rapid non-dominated sorting + crowding factor maintenance + elite retention”, even with limited evaluation attempts. In contrast, NSGA-III primarily targets multi-objective problems with three or more objectives, and its reference point mechanism shows limited advantage in two-objective scenarios [31]. MOPSO exhibits greater sensitivity to hyperparameters and often requires larger populations and archives to maintain diversity, resulting in higher computational overhead [32].

2.4.2. Optimization Variable Selection

Informed by concerns revealed through sensitivity analysis, infrared thermal imaging, and energy efficiency standards, the type and thickness of insulation materials for EWNwall, Swall, roof, and floor slabs, as well as the types of exterior windows, were established as optimization variables. Table 9 enumerates each optimization variable together with its respective numerical range.

2.4.3. Optimization Modelling

As the quantity of optimization objectives escalates, the efficacy of optimization algorithms diminishes, and the conflicts among many objectives become increasingly challenging to reconcile. This approach not only generates a substantial quantity of Pareto front solutions but also complicates the decision-making process for stakeholders [33]. The embedded carbon of building exterior materials and operational energy usage constitute a substantial amount of a structure’s total carbon emissions, revealing an inherent contradiction between the two factors. This study establishes the embodied carbon and the annual operating energy consumption (AOEC) of the building as optimization objectives, with both metrics targeting reduction. The precise objective function is delineated in Equation (3):
m i n f 1 x , f 2 x , x = x 1 , x 2 . . . . . x n
where f1(x) is the embodied carbon function, f2(x) is the annual operating energy consumption function, and x is the optimization variable.
The calculation method for embodied carbon in building materials originates from Section 6 of GB/T 51366-2019 [34]. Carbon emissions during the production and transportation phases of building materials are calculated as follows: Carbon emission factors for the production phase are sourced from Table D.0.1, “Carbon Emission Factors for Building Materials”, in GB/T 51366-2019. Transportation phase carbon emission factors are sourced from Appendix E, “Carbon Emission Factors for Building Material Transportation”, in GB/T 51366-2019. Research indicates that all building materials, except locally sourced timber and adobe bricks, originate from Kunming. The distance from Kunming to Hainan Village in Lijiang City is approximately 500 km, thus establishing a transportation distance of 500 km. A 2-tonne gasoline-powered light truck is used as the transport vehicle. The carbon emission factor for transportation per unit mass is set at 0.334 kgCO2e/(t·km). Table 10 shows the carbon emission factors of the materials.
f 1 x = i = 1 n M i F i
where Mi is the consumption of the ith material, Fi is the embodied carbon emission factor of the ith material, and f1(x) has the same meaning as Expression (1).
f 2 x = E h + E l + E e
where Eh is the annual heating energy consumption of the building, El is the annual lighting energy consumption of the building, Ee is the annual equipment energy consumption of the building, and f2(x) has the same meaning as Expression (1). There is no cooling in the local building, and the ventilation is natural.

2.4.4. Setting of NSGA-II Algorithm Parameters

In the NSGA-II method, the population size denotes the total number of initial optimization solutions generated during the initial optimization phase. The iteration count indicates the number of rounds during which candidate schemes are systematically evaluated and refined. The crossover rate denotes the ratio of existing effective systems merged to produce new schemes in each iteration. The mutation rate denotes the likelihood that a limited number of new or existing schemes will experience random slight alterations in each iteration. Over the past two decades, research in journals such as IEEE Transactions on Evolutionary Computation and Building Energy Conservation has shown that in two-objective optimization, over 80% of NSGA-II applications—ranging from mechanical design to architectural optimization—employ parameter ranges of 50–100 for population size, with 100–300 iterations, a crossover rate of 0.7–0.9, and a mutation rate between 0.01 and 1. This study executed tests with the following parameters: a population size increment of 10, an iteration increment of 50, a crossover rate increment of 0.1, and a mutation rate increment of 0.05. The results demonstrate that with a population size of 100, 200 iterations, a crossover rate of 0.7, and a mutation rate of 0.05, the optimized solutions not only neared the ideal optimal state but also exhibited a generally equal distribution. They addressed a range of needs, and no solution was markedly suboptimal or showed low performance in any regard. Concurrently, the method operated efficiently, achieving quick stabilization without unnecessary computational duration. This method circumvents the drawbacks of inadequate iterations, which can lead to suboptimal solutions, as well as the inefficiency associated with excessive processing. Table 11 delineates the precise parameters of the NSGA-II genetic algorithm.

2.5. Optimization Results Evaluation Index Establishment

2.5.1. Life Cycle Carbon Reduction and Annual Operational Carbon

According to the “Building Carbon Emission Calculation Standard” [34], the carbon emissions of a building throughout its entire life cycle can be divided into three main parts: the production and transportation of building materials, the construction and demolition stages, and the building operation stage. Considering that the study region emphasizes the conservation of traditional architectural elements, mostly through repair and renovation with minimum demolition, and that construction predominantly employs manual labour with minimal machinery, this divergence is anticipated to be negligible. Consequently, carbon emissions from the construction and demolition stages were excluded from consideration. Therefore, this study temporarily excluded these stages from the scope of carbon emission calculations. In calculating carbon reduction within the life cycle, the defined system boundary includes the production and transportation stages of building materials, as well as the building operation stage. Life cycle carbon reduction (LCCR) and the annual operational carbon (AOC) are used as evaluation indicators for the carbon reduction effect. The formulas for LCCR and AOC are given in (6) and (7).
L C C R = A O E C b β n i = 1 n M i F i + A O E C a β n
A O C = A O E C a β
where LCCR is the life cycle carbon reduction; AOECb is the annual operational energy consumption before optimization, with a value of 4316 kWh/year; AOECa is the annual operational energy consumption after optimization; n is the building’s service life, with a value of 50 years; β is the power carbon emission coefficient, with a value of 0.6205 kgCO2e/kWh; Mi and Fi have the same meanings as in Equation (2); and AOC is the annual operational carbon.

2.5.2. Annual Energy Savings and Energy Saving Rate

During the building operation phase, compared with existing buildings, optimized buildings have lower energy consumption in terms of lighting, heating, and other aspects. Annual energy savings (AES) and energy saving rate (ESR) are used as the main indicators to measure the energy-saving effects of optimization schemes. The formulas for AES and ESR are provided in (8) and (9).
A E S = A O E C b A O E C a
E S R = 1 A O E C a A O E C b
where AES is the annual energy savings, ESR is the energy saving rate, and AOECa and AOECb have the same meanings as in Equation (4).

2.5.3. Incremental Cost and Dynamic Payback Period

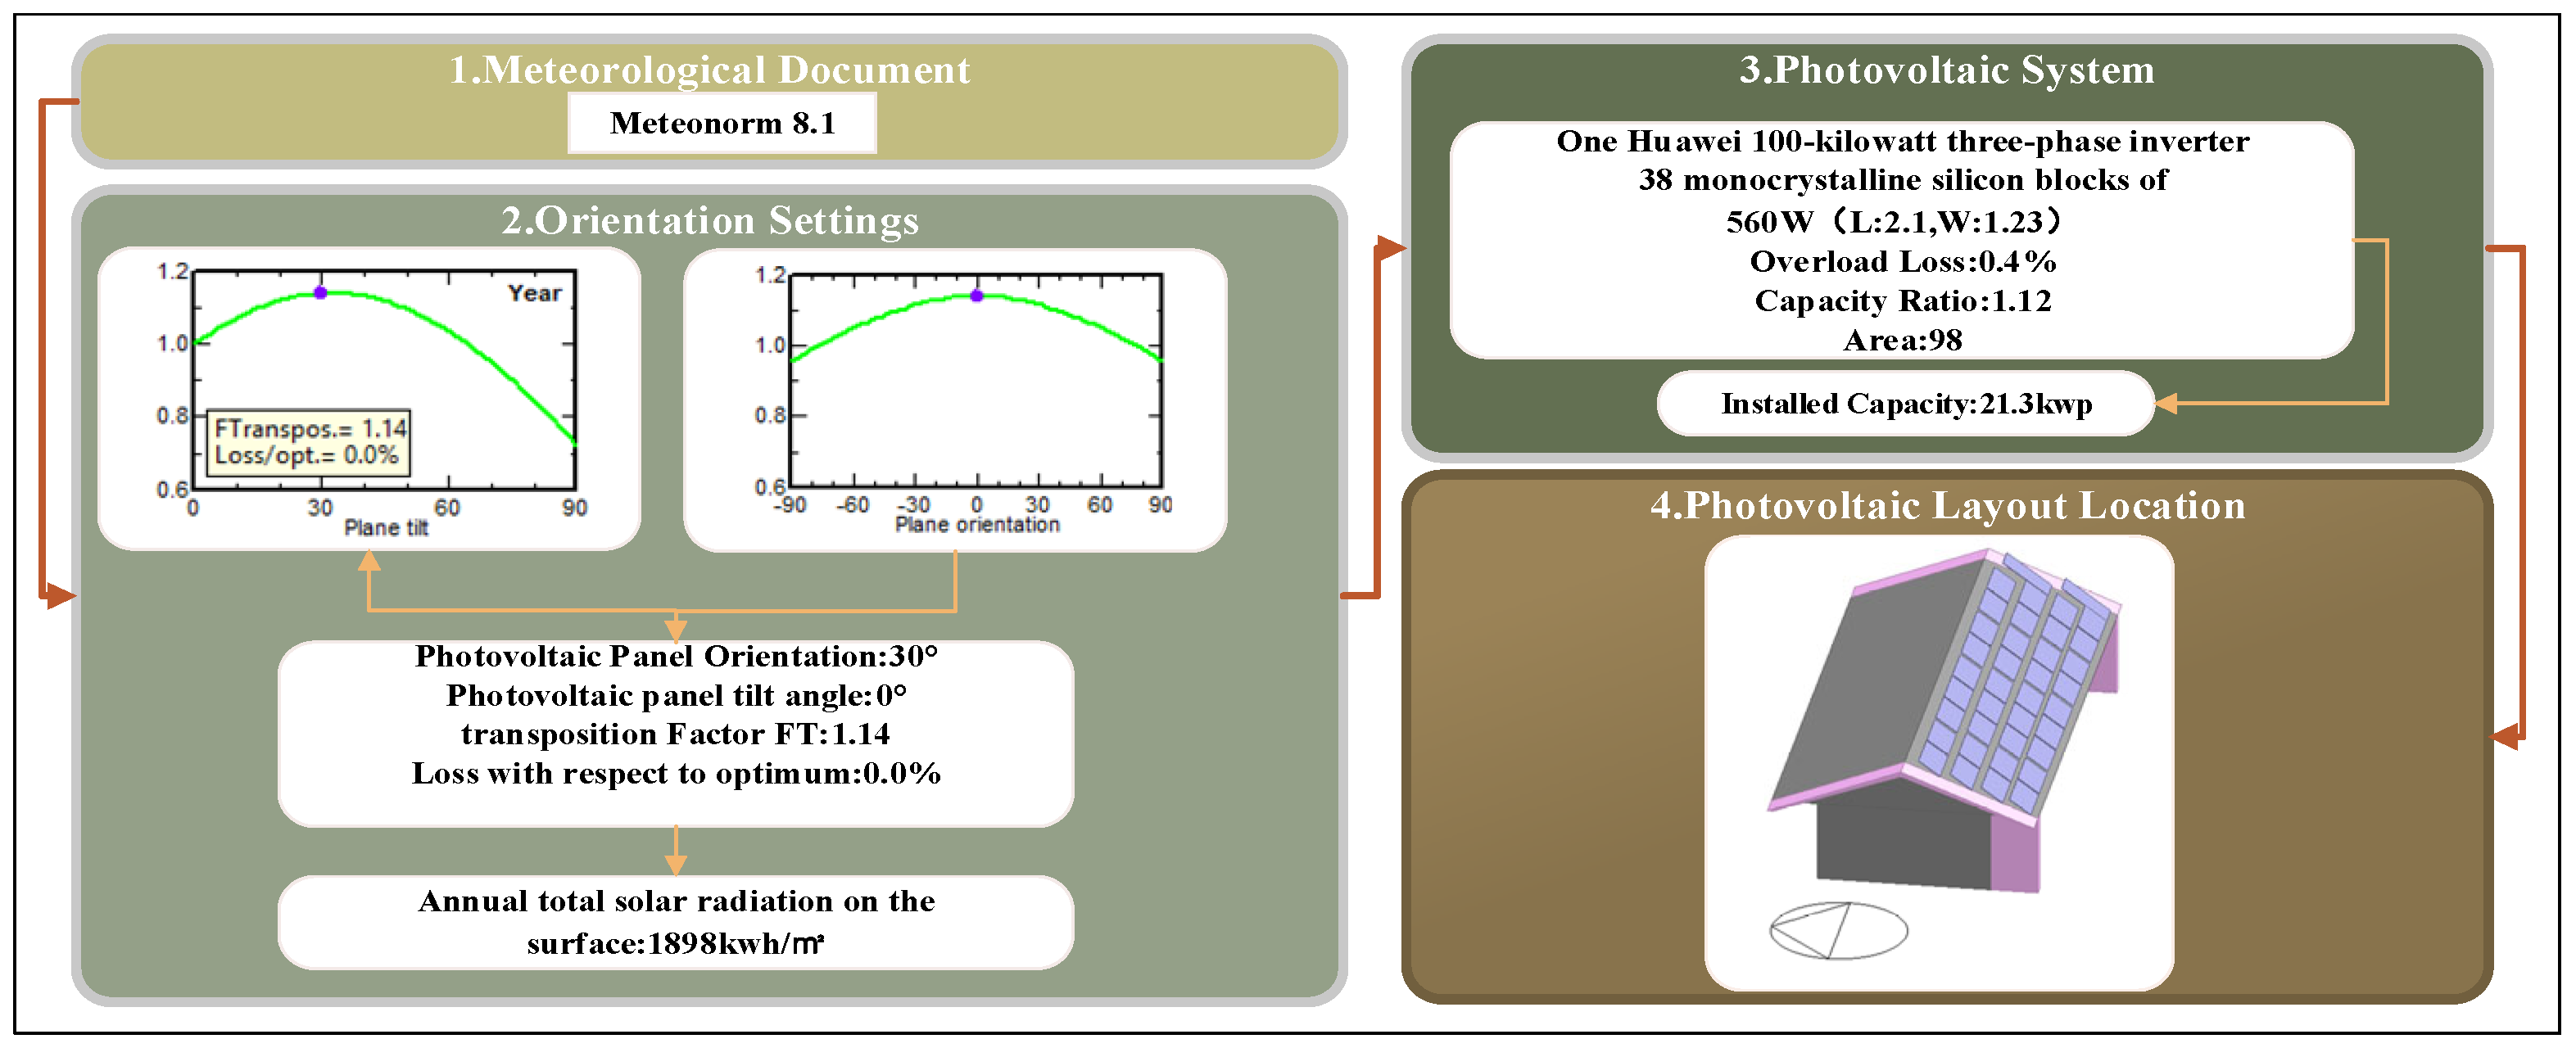
PVsyst7.4 software, created by the School of Environmental Sciences at the University of Geneva, facilitates the modelling and simulation of solar power generation systems. It evaluates several parameters influencing power generation and eventually determines the system’s power generation capacity. This paper employs the software to ascertain critical parameters, including the optimal tilt angle of photovoltaic panels and the ideal capacity ratio between photovoltaic modules and inverters, thereby offering data support for subsequent calculations of power generation costs and the economic advantages of electricity sales. Figure 5 depicts the integration process of the simulation object with the solar system using PVsyst software.
The formula for determining photovoltaic power generation is derived from the Design Code for Photovoltaic Power Plants [35]. To more accurately represent the annual fluctuations in power generation, the calculation includes the annual decay rate of photovoltaic modules. The equation for photovoltaic power generation is (10).
E p , t = H A P A Z E S K ( 1 α ) t
where Ep,t is the photovoltaic power generation in year t; HA is the total radiation of the light harvesting surface; PAZ is the installed capacity of PV modules; ES is the irradiance under the standard conditions, which takes the value of 1 kWh/m2; K is the integrated efficiency coefficient, which takes the value of 0.85; α is the annual attenuation rate of PV modules, which takes the value of 0.5%; and t is the lifetime of the photovoltaic power plant, which takes the value of 25 years.
Incremental cost (IC) refers to the cost incurred by optimizing existing buildings. The level of IC can be used to measure the economic feasibility of a plan. Table 12 shows the IC for materials and equipment during the renovation process. The formula for calculating IC is (11).
I C = i = 1 n P i Q i
where IC is the incremental cost, Pi is the price of the ith material, and Qi is the consumption of the ith material.
The dynamic payback period (DPP) is an indicator that measures the time required for a project to recover its initial investment through net cash flows in future years, taking into account the time value of money. In contrast, the static payback period does not consider the time value of money and may underestimate the investment risks and return efficiency of long-term projects. The former can more accurately reflect the true economic viability of an investment [36]. Therefore, DPP is adopted as an indicator to measure the economic feasibility of building optimization schemes. The formula for calculating the DPP is provided in (12).
t = 0 D P P C I t C O t 1 + r t = 0
where DPP is the dynamic payback period; CIt is the annual energy savings and the cost of selling electricity from PV power generation, and the price of electricity is taken to be 0.3358 CNY/kwh; COt is the cash outflow in years, the incremental cost of the initial investment, including the incremental cost of the PV system, which is zero except for the incremental cost of the initial investment; r is the discount rate, which takes the value of 5%; and t is the service life of the PV system, which has a maximum value of 25 years.

2.6. Multi-Attribute Decision-Making Methods

Various multi-attribute decision-making methods, such as TOPSIS and the weighted summation method, can be employed for the analysis of Pareto solution sets. The weighted summation approach, a classical and prevalent multi-attribute decision-making tool, is useful owing to its straightforward model structure and easy calculation process. The approach attains a thorough review by normalizing each assessment criterion and assigning weights based on the significance of each objective to the decision maker, thereby facilitating the weighted summation of several alternatives [37]. The equation for the weighted summation approach is (13).
F t o t a l x = j = 1 m a j g j x g j m i n g j m a x g j m i n
where Ftotal(x) is the weighted sum-objective function, which represents the combined result of all objectives; gj(x) is the jth objective function, and gjmax and gjmin are the maximum and minimum values of this objective function, respectively; αj is the weight of the objective function, and the sum of the weights is 1; and m is the total number of the objective functions (k ≥ 2).

3. Optimization Results and Analysis

3.1. Optimal Results

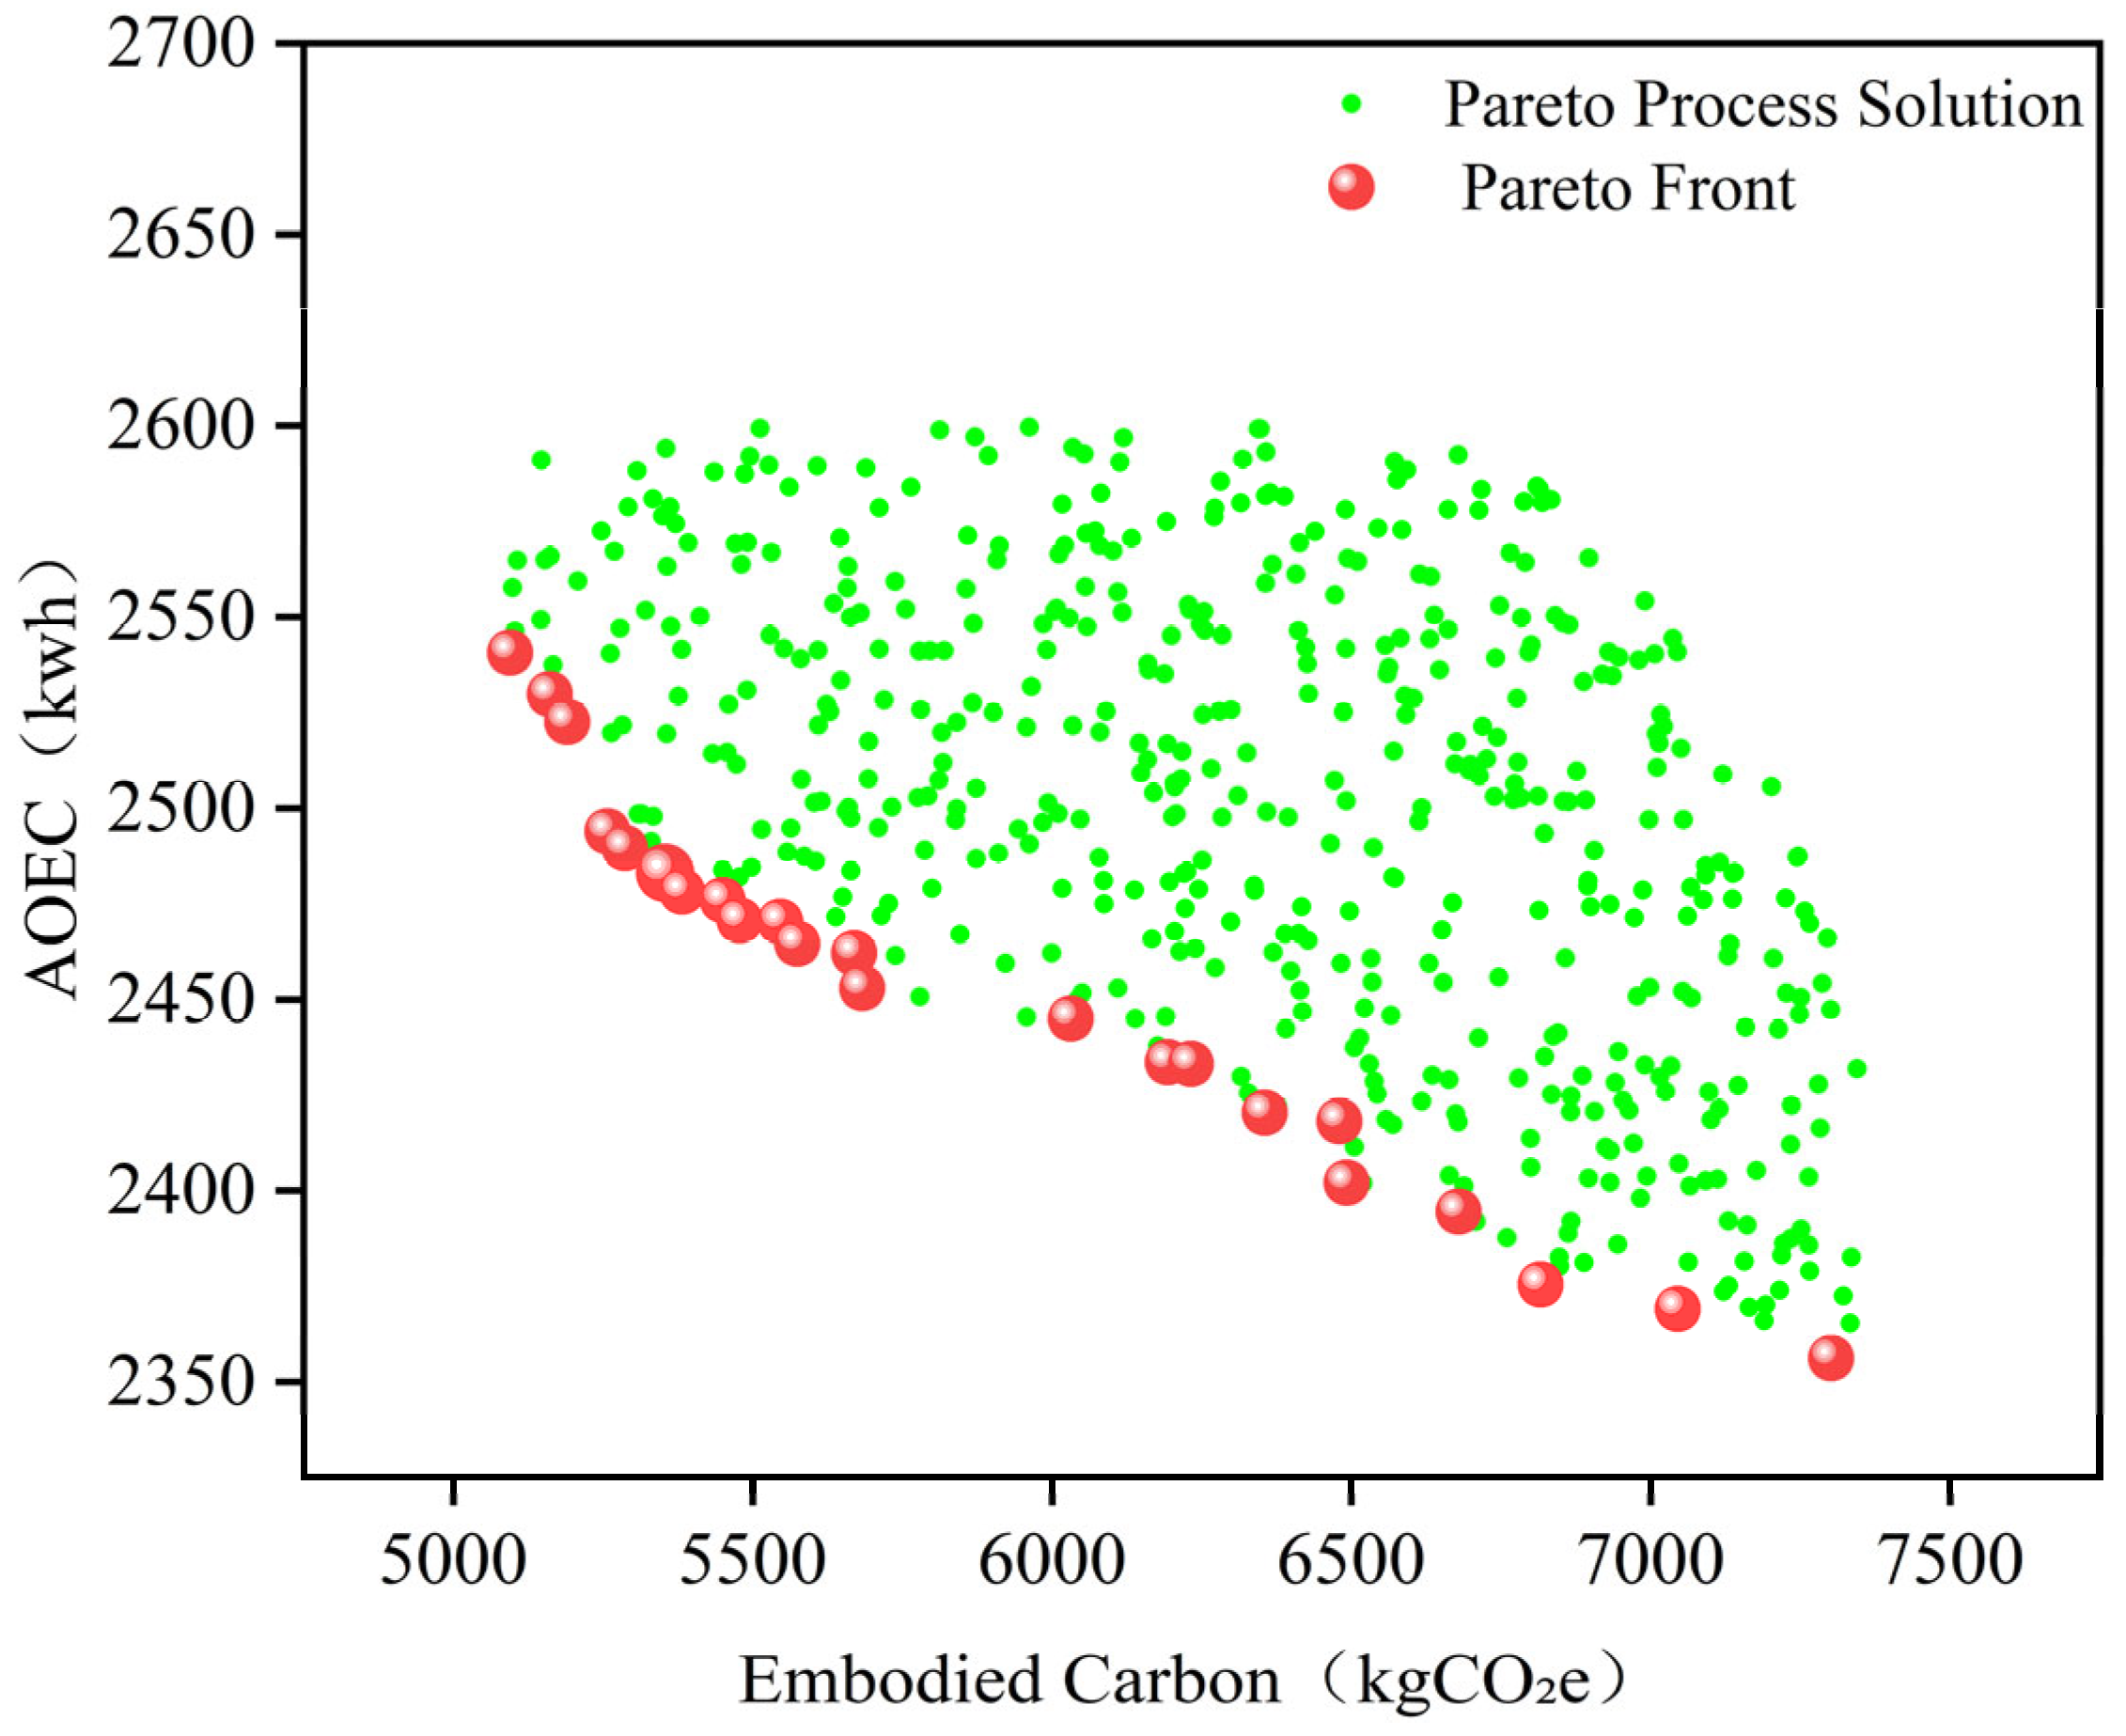
Multi-objective optimization yields a group of trade-off solutions, referred to as Pareto frontier solutions, rather than unique answers. Figure 6 depicts the Pareto optimization procedure. The red dots signify Pareto frontier solutions, comprising a total of 24 viable technological solutions. The annual operational energy consumption (AOEC) and embodied carbon demonstrate a Pareto distribution, characterized by an inverse correlation between the two variables. As embodied carbon rises, AOEC diminishes. This is mainly attributable to the heightened carbon emissions from insulation materials within the building envelope, resulting in thicker materials that decrease the U-value, enhance insulation efficacy, and thus diminish indoor heat load and heating energy consumption. The distribution of target values indicates that the AOEC range for the 24 viable schemes is 2356.23–2540.65 kWh, with a mean of 2453.64 kWh; the embodied carbon range is 5094.69–7301.65 kgCO2e, with a mean of 5872.82 kgCO2e.

3.2. Optimization Effect Evaluation and Program Selection

3.2.1. Assessment of Carbon Reduction Effectiveness

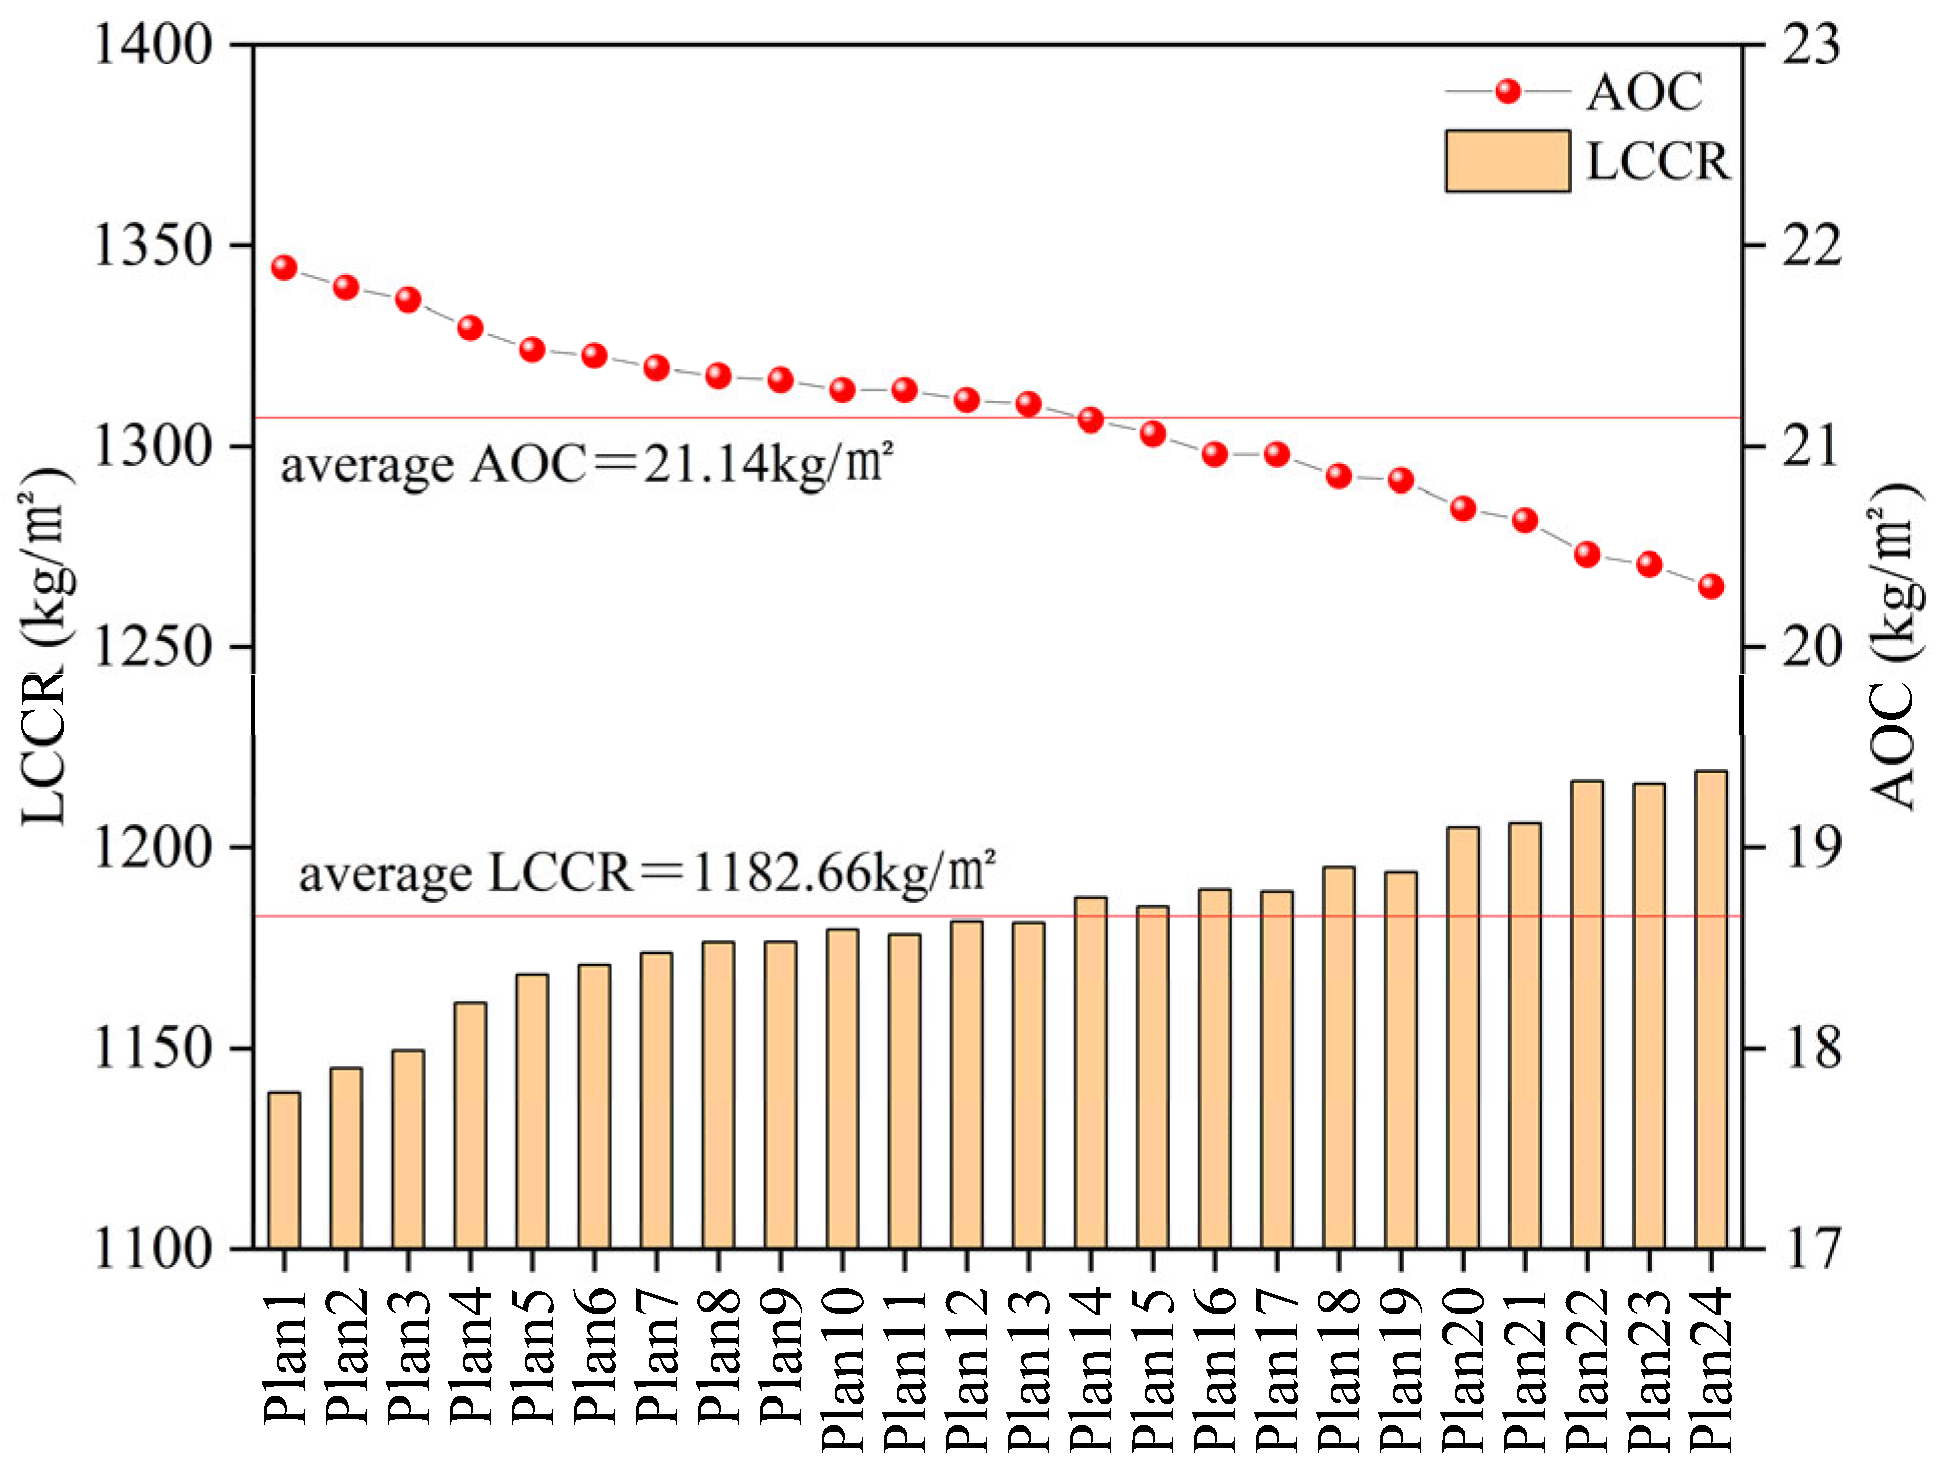
The carbon reduction impacts of each optimization strategy were assessed using life cycle carbon reduction (LCCR) and annual operating carbon (AOC). Figure 7 illustrates the LCCR and AOC values for the 24 schemes. The LCCR values for the 24 viable schemes varied from 1138.88 to 1218.96 kg/m2, with a mean of 1182.66 kg/m2; the AOC values ranged from 20.3 to 21.89 kg/m2, with an average of 21.14 kg/m2. In comparison to the values of 27.05 kg/m2 and 23.39 kg/m2, attained by Sun, B. et al. [38] using energy-efficient restoration strategies, the approaches in this study are much more beneficial. This suggests that in the examined region, augmenting the thermal insulation efficacy of the building envelope and optimizing the efficiency of the system components can substantially improve carbon reduction outcomes. Plan 24 possesses the greatest LCCR value. In comparison to the original structure, the EWNwall insulation layer was augmented by 220 mm utilizing XPS insulation material; the Swall, roof, and floor insulation layers were enhanced by 100 mm, 140 mm, and 20 mm, respectively, employing RW insulation material; and the exterior window type was changed by 6Low-E + 12Ar + 6. In comparison to the smallest LCCR plan, the principal factor contributing to the enhanced carbon reduction effect is the augmented thickness of the outside wall insulating layer.

3.2.2. Assessment of Energy Efficiency

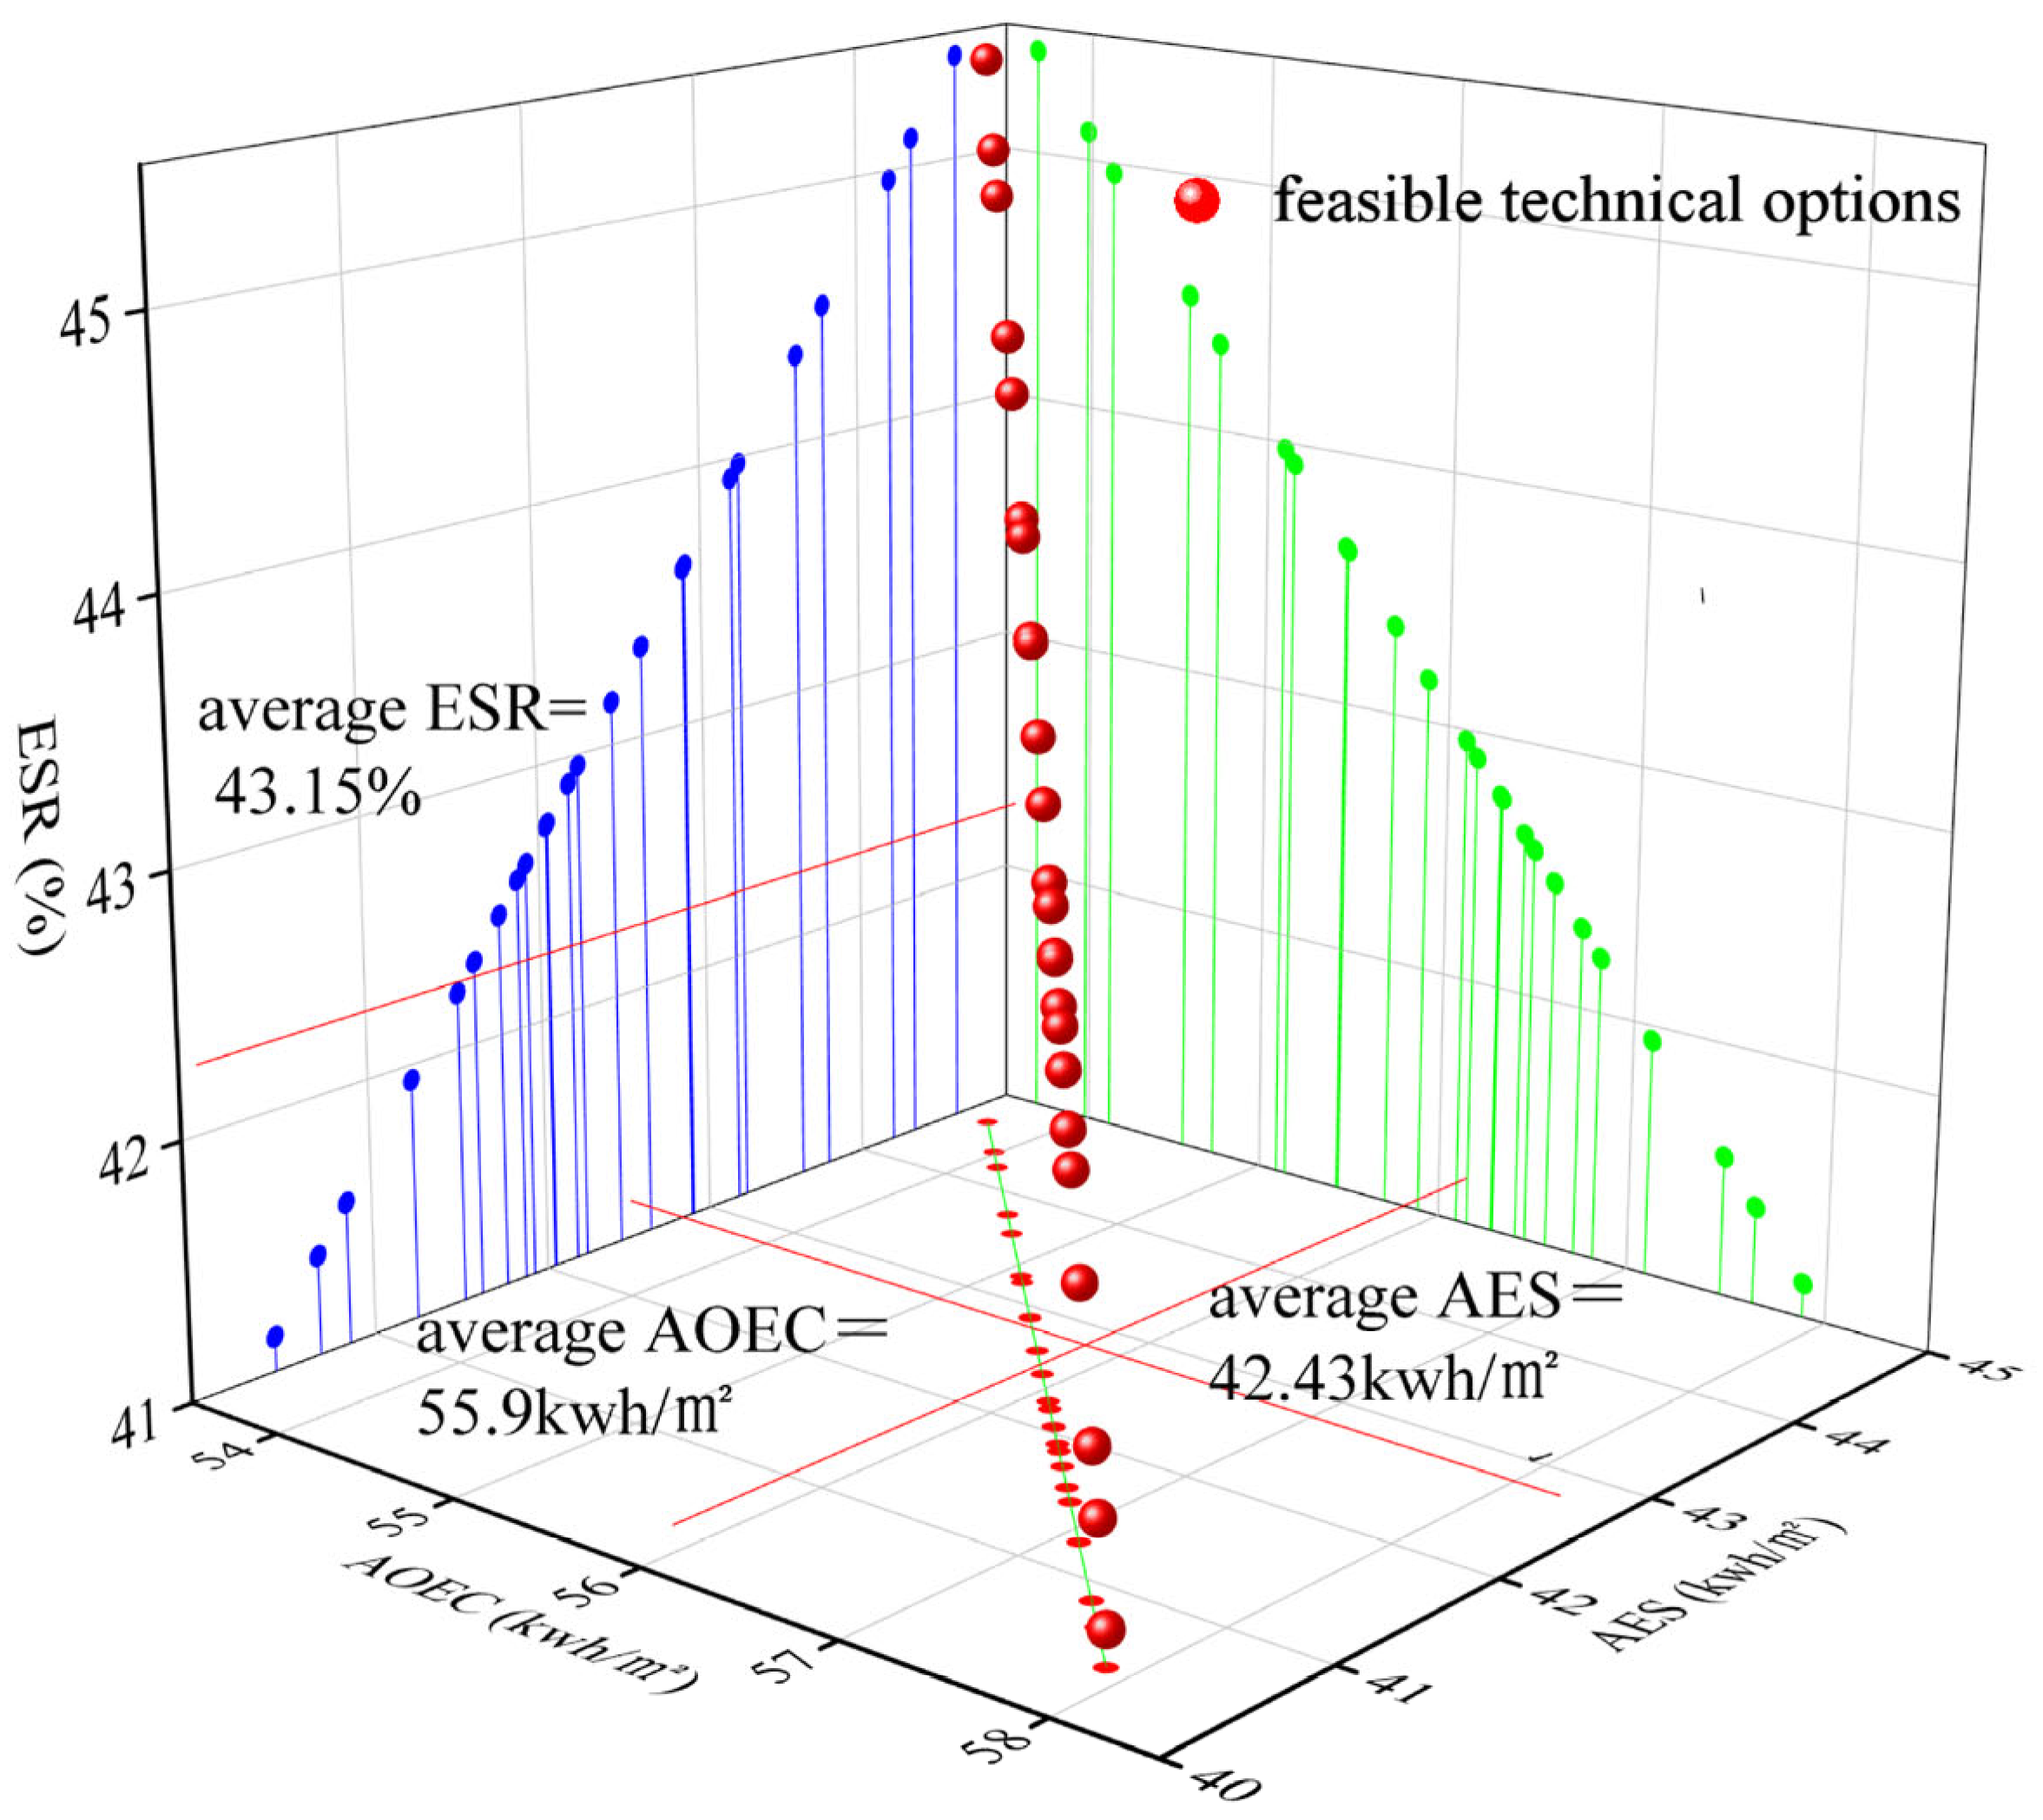
The energy conservation impacts of each optimization strategy were assessed based on annual operational energy consumption (AOEC), annual energy saving (AES), and energy saving rate (ESR). Figure 8 presents the AOEC, AES, and ESR values for the 24 viable methods. All schemes exhibited AOEC values below 57.89 kWh/m2, with a mean of 55.9 kWh/m2. In comparison to the original structure, the ESR of all schemes surpasses 40%, with a peak of 45.41% and an average of 43.15%. In contrast to the findings of Zou Dezhi et al. [39], who employed a genetic algorithm for the multi-objective optimization of rural residential buildings, resulting in an AOEC of 129.41 kWh/m2 and an ESR of 42.85%, the energy-saving outcomes of the schemes in this study are markedly more favourable. This indicates that in the study area, improving the thermal performance of building envelopes and the efficiency of mechanical systems can significantly enhance building energy efficiency. The AES values for all schemes range from 40.44 to 44.66 kWh/m2, with an average of 42.43 kWh/m2. The scheme with the highest AES value is Plan 24, which features an additional 220 mm of insulation in the EWNwall layer compared to the original building, using XPS insulation material; the Swall, roof, and floor insulation layers increased by 100 mm, 140 mm, and 20 mm, respectively, all using RW insulation material; and the exterior window type was changed to 6Low-E + 12Ar + 6. By combining the carbon reduction optimal scheme from Section 3.2.2, it can be observed that the carbon reduction optimal scheme and the energy efficiency optimal scheme are the same, indicating that the building’s energy efficiency and carbon reduction primarily stem from the operational phase of the building.

3.2.3. Economic Assessment

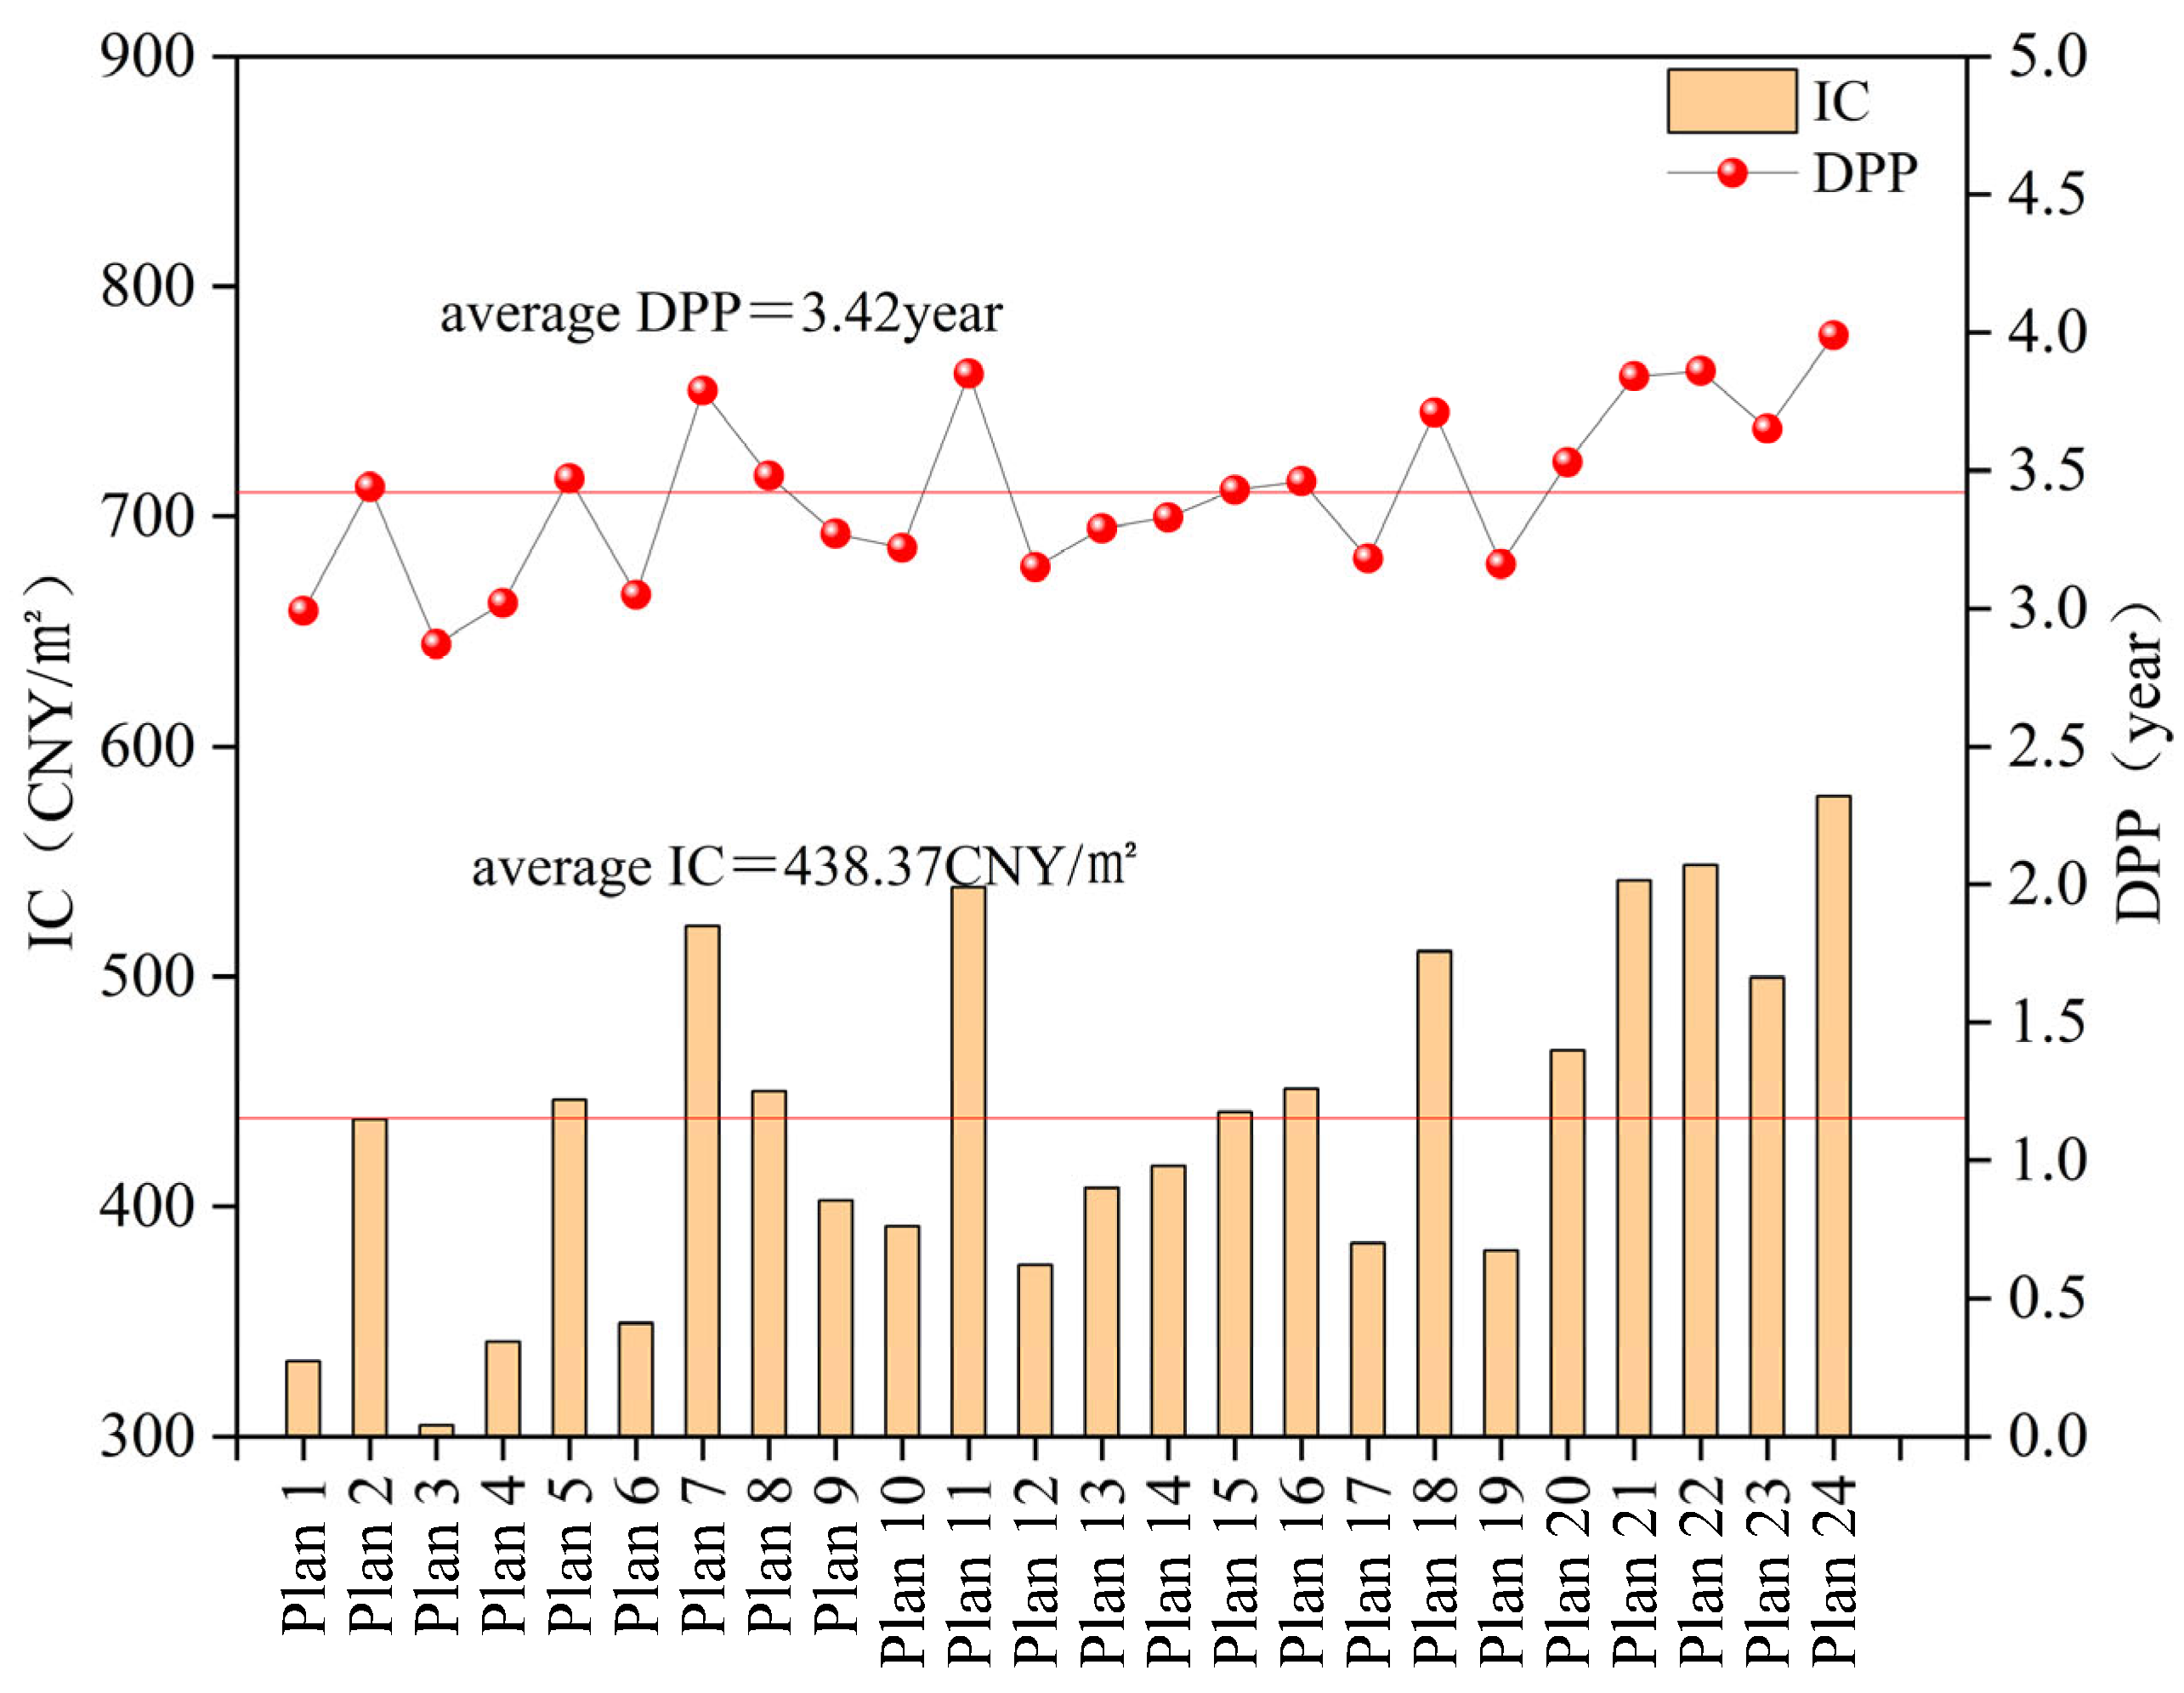
Financial constraints have consistently represented a significant barrier to low-carbon retrofitting in buildings [40]. A reduced payback period can markedly elevate owners’ propensity to refit, thus improving the plan’s practicality. This research employs two metrics, incremental cost (IC) and dynamic payback period (DPP), to assess the economic feasibility of the optimized plan. Figure 9 illustrates the IC and DPP values for the 24 optimal methods. Among the 24 viable plans, Plan 3 exhibits the lowest IC at 304.66 CNY/m2, whereas Plan 24 demonstrates the greatest IC at 578.44 CNY/m2, resulting in an average value of 438.37 CNY/m2. Utilizing DPP as a screening criterion, the mean DPP is 3.42 years, with Plan 24 exhibiting the longest DPP at 3.99 years. Nevertheless, in contrast to the 4.98 years attained by Chiradeja P et al. [41] through the optimization of the building envelope, lighting, and HVAC systems for energy conservation and emissions reduction, it remains at a sophisticated level. Plan 3 has the minimal DPP. In comparison to the original structure, the thickness of the EWNwall, roof, and floor insulation layers was augmented by 40 mm, 80 mm, and 20 mm, respectively, utilizing EPS as the insulation material; the thickness of the Swall insulation layer increased by 20 mm, employing RW as the insulation material; and the exterior window type was changed to 6 + 12A + 6. A low-carbon rehabilitation scheme utilizing photovoltaic technology can significantly reduce the investment payback period, thereby facilitating the promotion and implementation of low-carbon building restorations.

3.2.4. Integrated Impact Assessment

Stakeholders exhibit varying preferences; for example, governments frequently weigh costs, energy consumption, and carbon emissions to achieve optimal societal benefits. In contrast, architects generally emphasize energy efficiency or carbon reduction, while rural residents prioritize initial investment costs to maintain the economic viability of renovations. To synchronize optimization outcomes with practical requirements, we used LCCR, AES, and IC as assessment metrics. We performed a thorough evaluation of 24 viable options using a weighted summation method across three separate analysis scenarios. Scenario 1 assigns equal importance to all three objectives, emphasizing total, comprehensive performance. Scenario 2 prioritizes LCCR and AES over IC. Scenario 3 prioritizes IC over LCCR and AES. Table 13 displays the weighting values for optimization targets across the three scenarios.
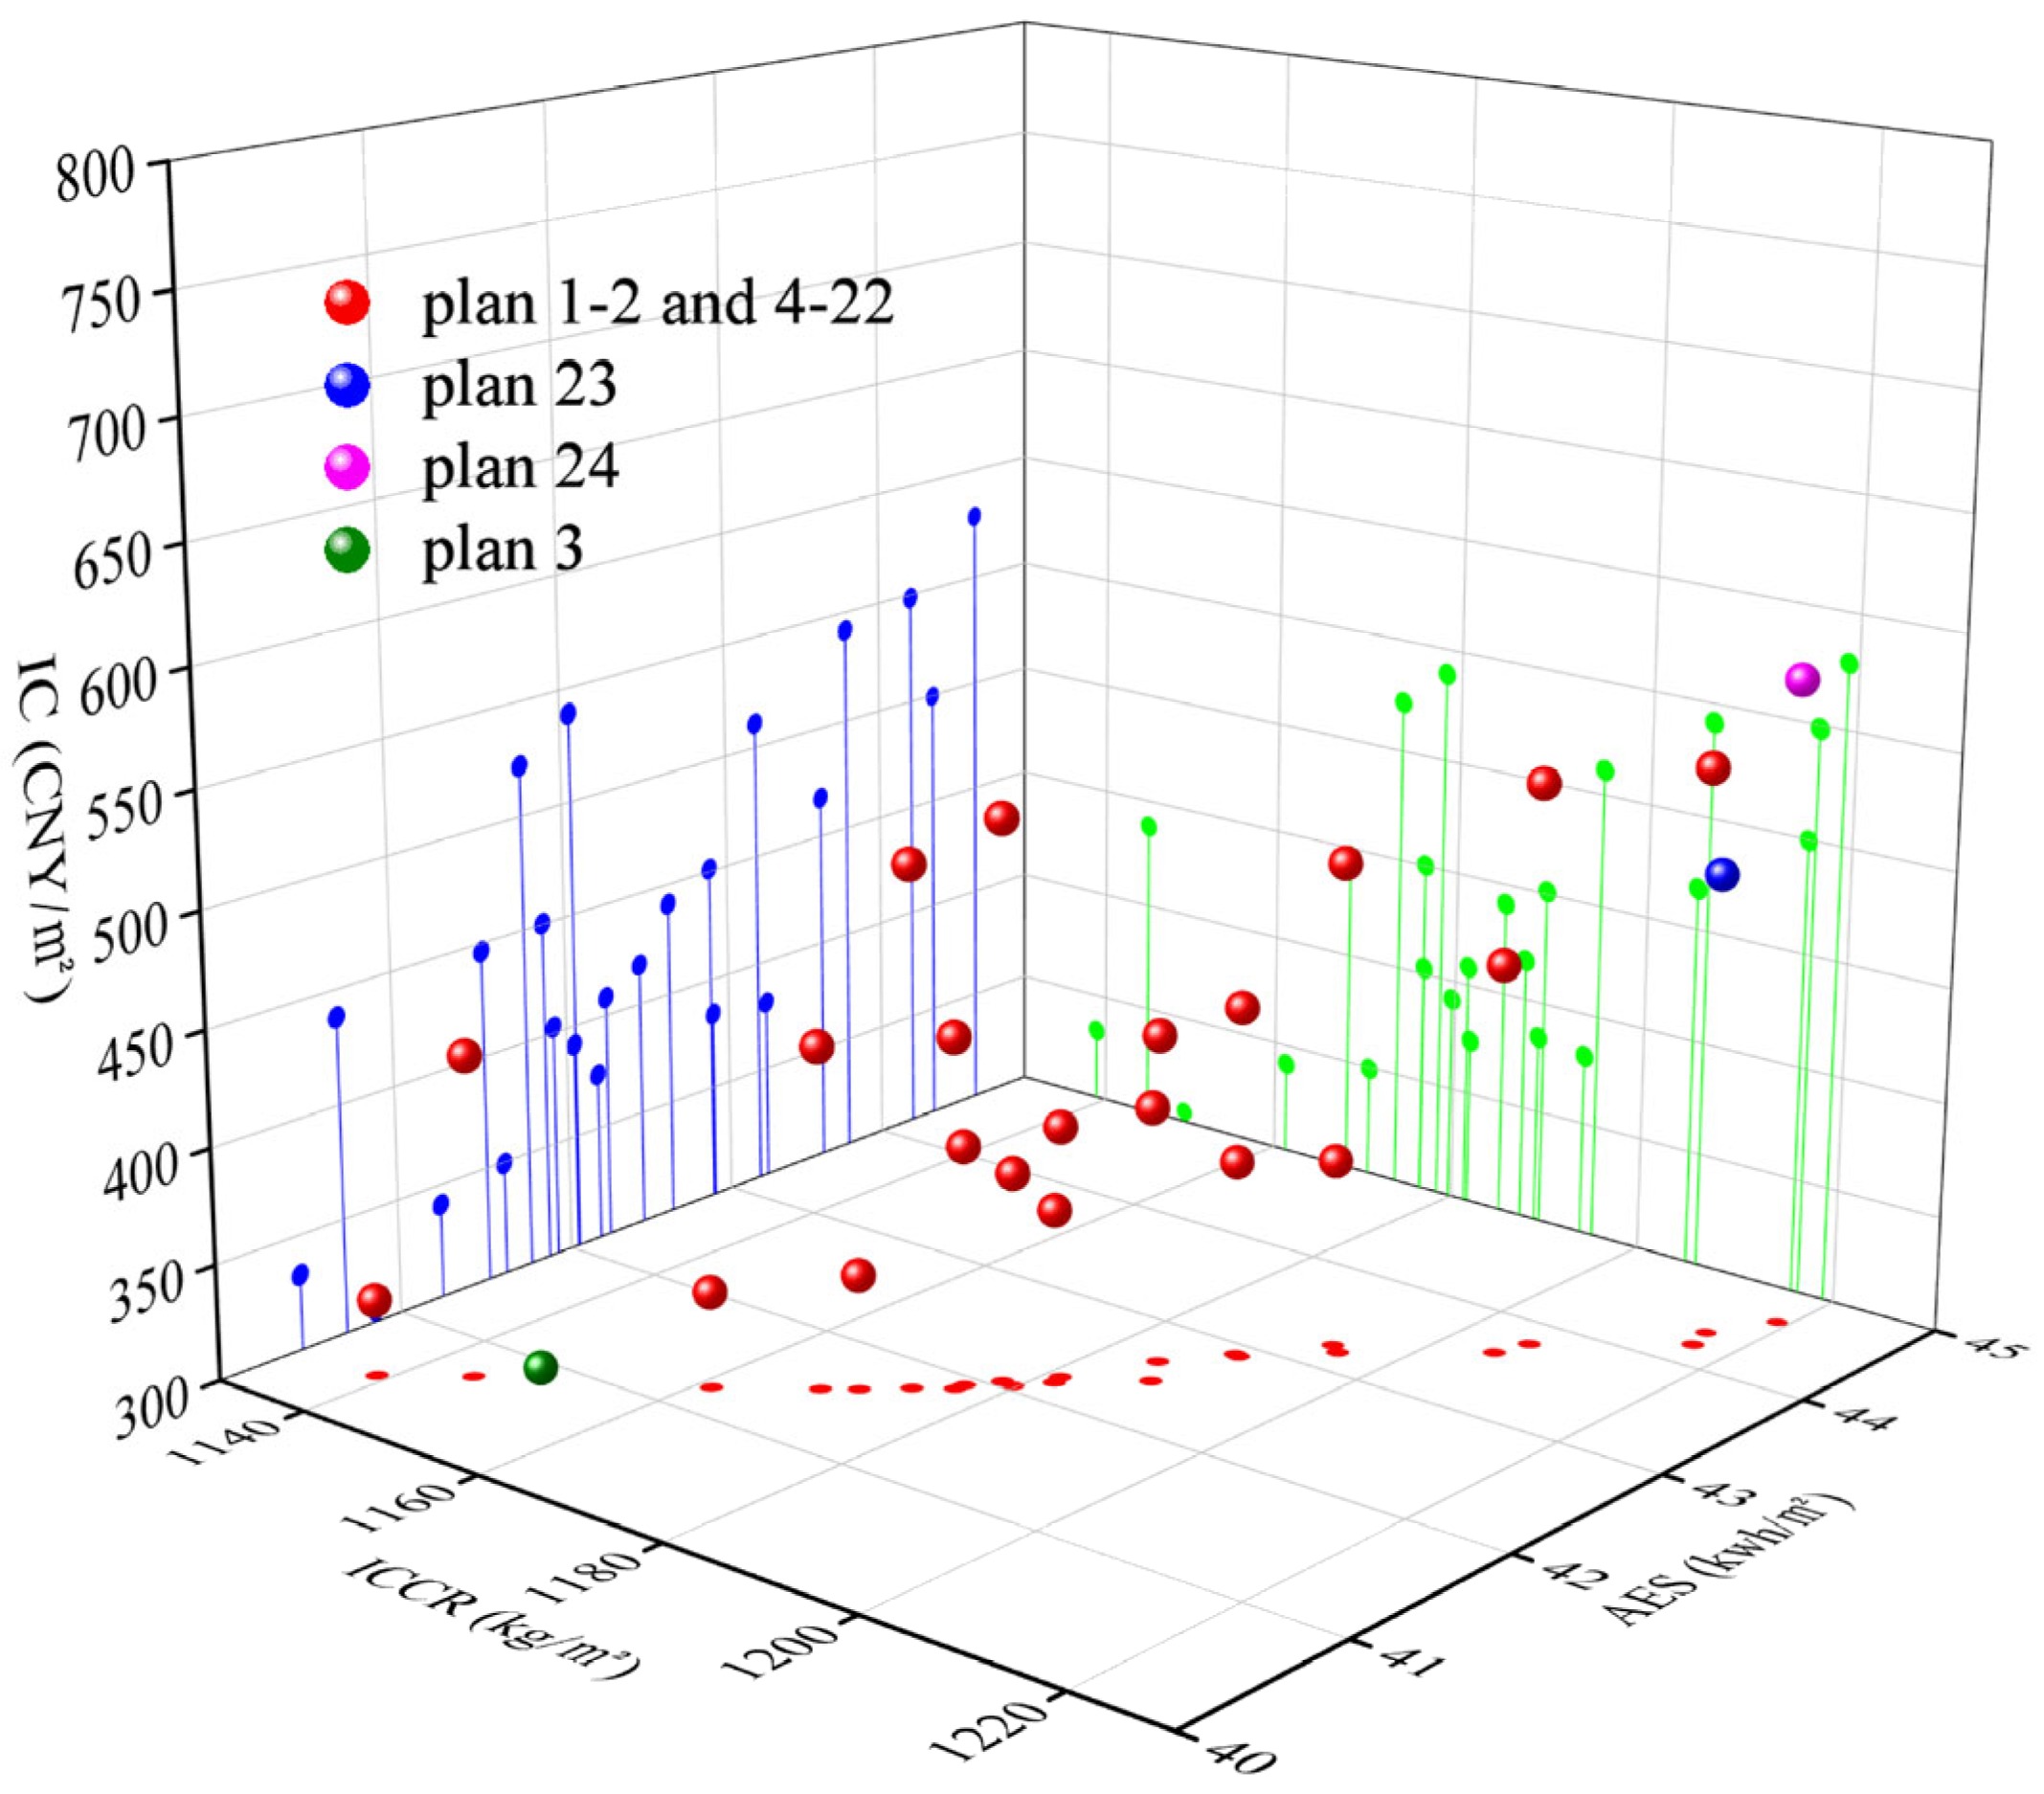
After calculation, Scenario 1 corresponds to optimization plan 23, Scenario 2 corresponds to optimization plan 24, and Scenario 3 corresponds to optimization plan 3. Figure 10 displays the LCCR, AES, and IC values for the optimization plans of the three scenarios. Plan 23 achieves an LCCR of 1215.76 kg/m2, an AES of 53.98 kWh/m2, and an IC of 499.49 CNY/m2. Compared to Plan 24, its LCCR decreased by only 0.26% and AES decreased by just 0.66%. Compared to Plan 3, Plan 23’s IC increased by 21.37%, but this rise remained within an acceptable range. This plan effectively balances energy conservation, carbon reduction, and economic benefits, aligning with the government’s overarching demand for optimal social benefits. Plan 24 features an LCCR of 1218.96 kg/m2, an AES of 53.68 kWh/m2, and an IC of 578.44 CNY/m2. This plan prioritises low-carbon objectives while considering energy efficiency, exhibits low cost sensitivity, and aligns with architects’ energy-saving and carbon reduction requirements. Plan 3 features an LCCR of 1149.46 kg/m2, an AES of 40.86 kWh/m2, and an IC of 304.66 CNY/m2. This plan prioritizes cost control with only basic carbon reduction and energy efficiency, meeting rural residents’ demand for low-cost building retrofits. Table 14 shows the design parameters for the three scenarios.

3.2.5. Review of Heat Transfer Coefficients for the Envelope of the Optimized Solution

This section aims to determine whether the U-values of building envelopes in the balanced optimal solution (Plan 23), energy-saving and carbon-reduction optimal solution (Plan 24), and cost-optimal solution (Plan 3) comply with energy-saving design standards. Additionally, by analyzing the deviation between the U-values of each solution and the minimum thresholds specified in GB55015-2021 “General Specifications for Building Energy Conservation and Renewable Energy Utilization,” the energy-saving potential of each solution is evaluated.
Figure 11 illustrates the range of variation between the envelope U-value of the optimal solution and the standard limit value. In Plans 23 and 24, the U-values of EWNwall diminished by 78.17% and 79.83%, respectively, from the minimum standard value of 0.6 W/(m2·K). The U-values of Swall diminished by 70.06% and 75.31%, respectively, from the minimum threshold of 1.6 W/(m2·K) established in the standard. The U-values of the roof decreased by 0.75% and 26.5%, respectively, relative to the minimum standard value of 0.4 W/(m2·K), while the U-values of the exterior window diminished by 40% compared to the minimum standard value of 2.5 W/(m2·K). In Plan 3, the U-value of the EWNwall decreased by 13.33% and the Swall by 16.94% from the minimum threshold established in the standards; however, the roof’s U-value increased by 11.25%, with the exterior window staying unchanged. With the exception of Plan 3, which has a roof U-value marginally beyond the threshold, the U-values of all other plans are well below the energy-saving limits established by the standards, demonstrating substantial energy-saving potential across all plans.

3.2.6. Dynamic Payback Period Evaluation of Schemes Based on Orthogonal Experimentation Methodology

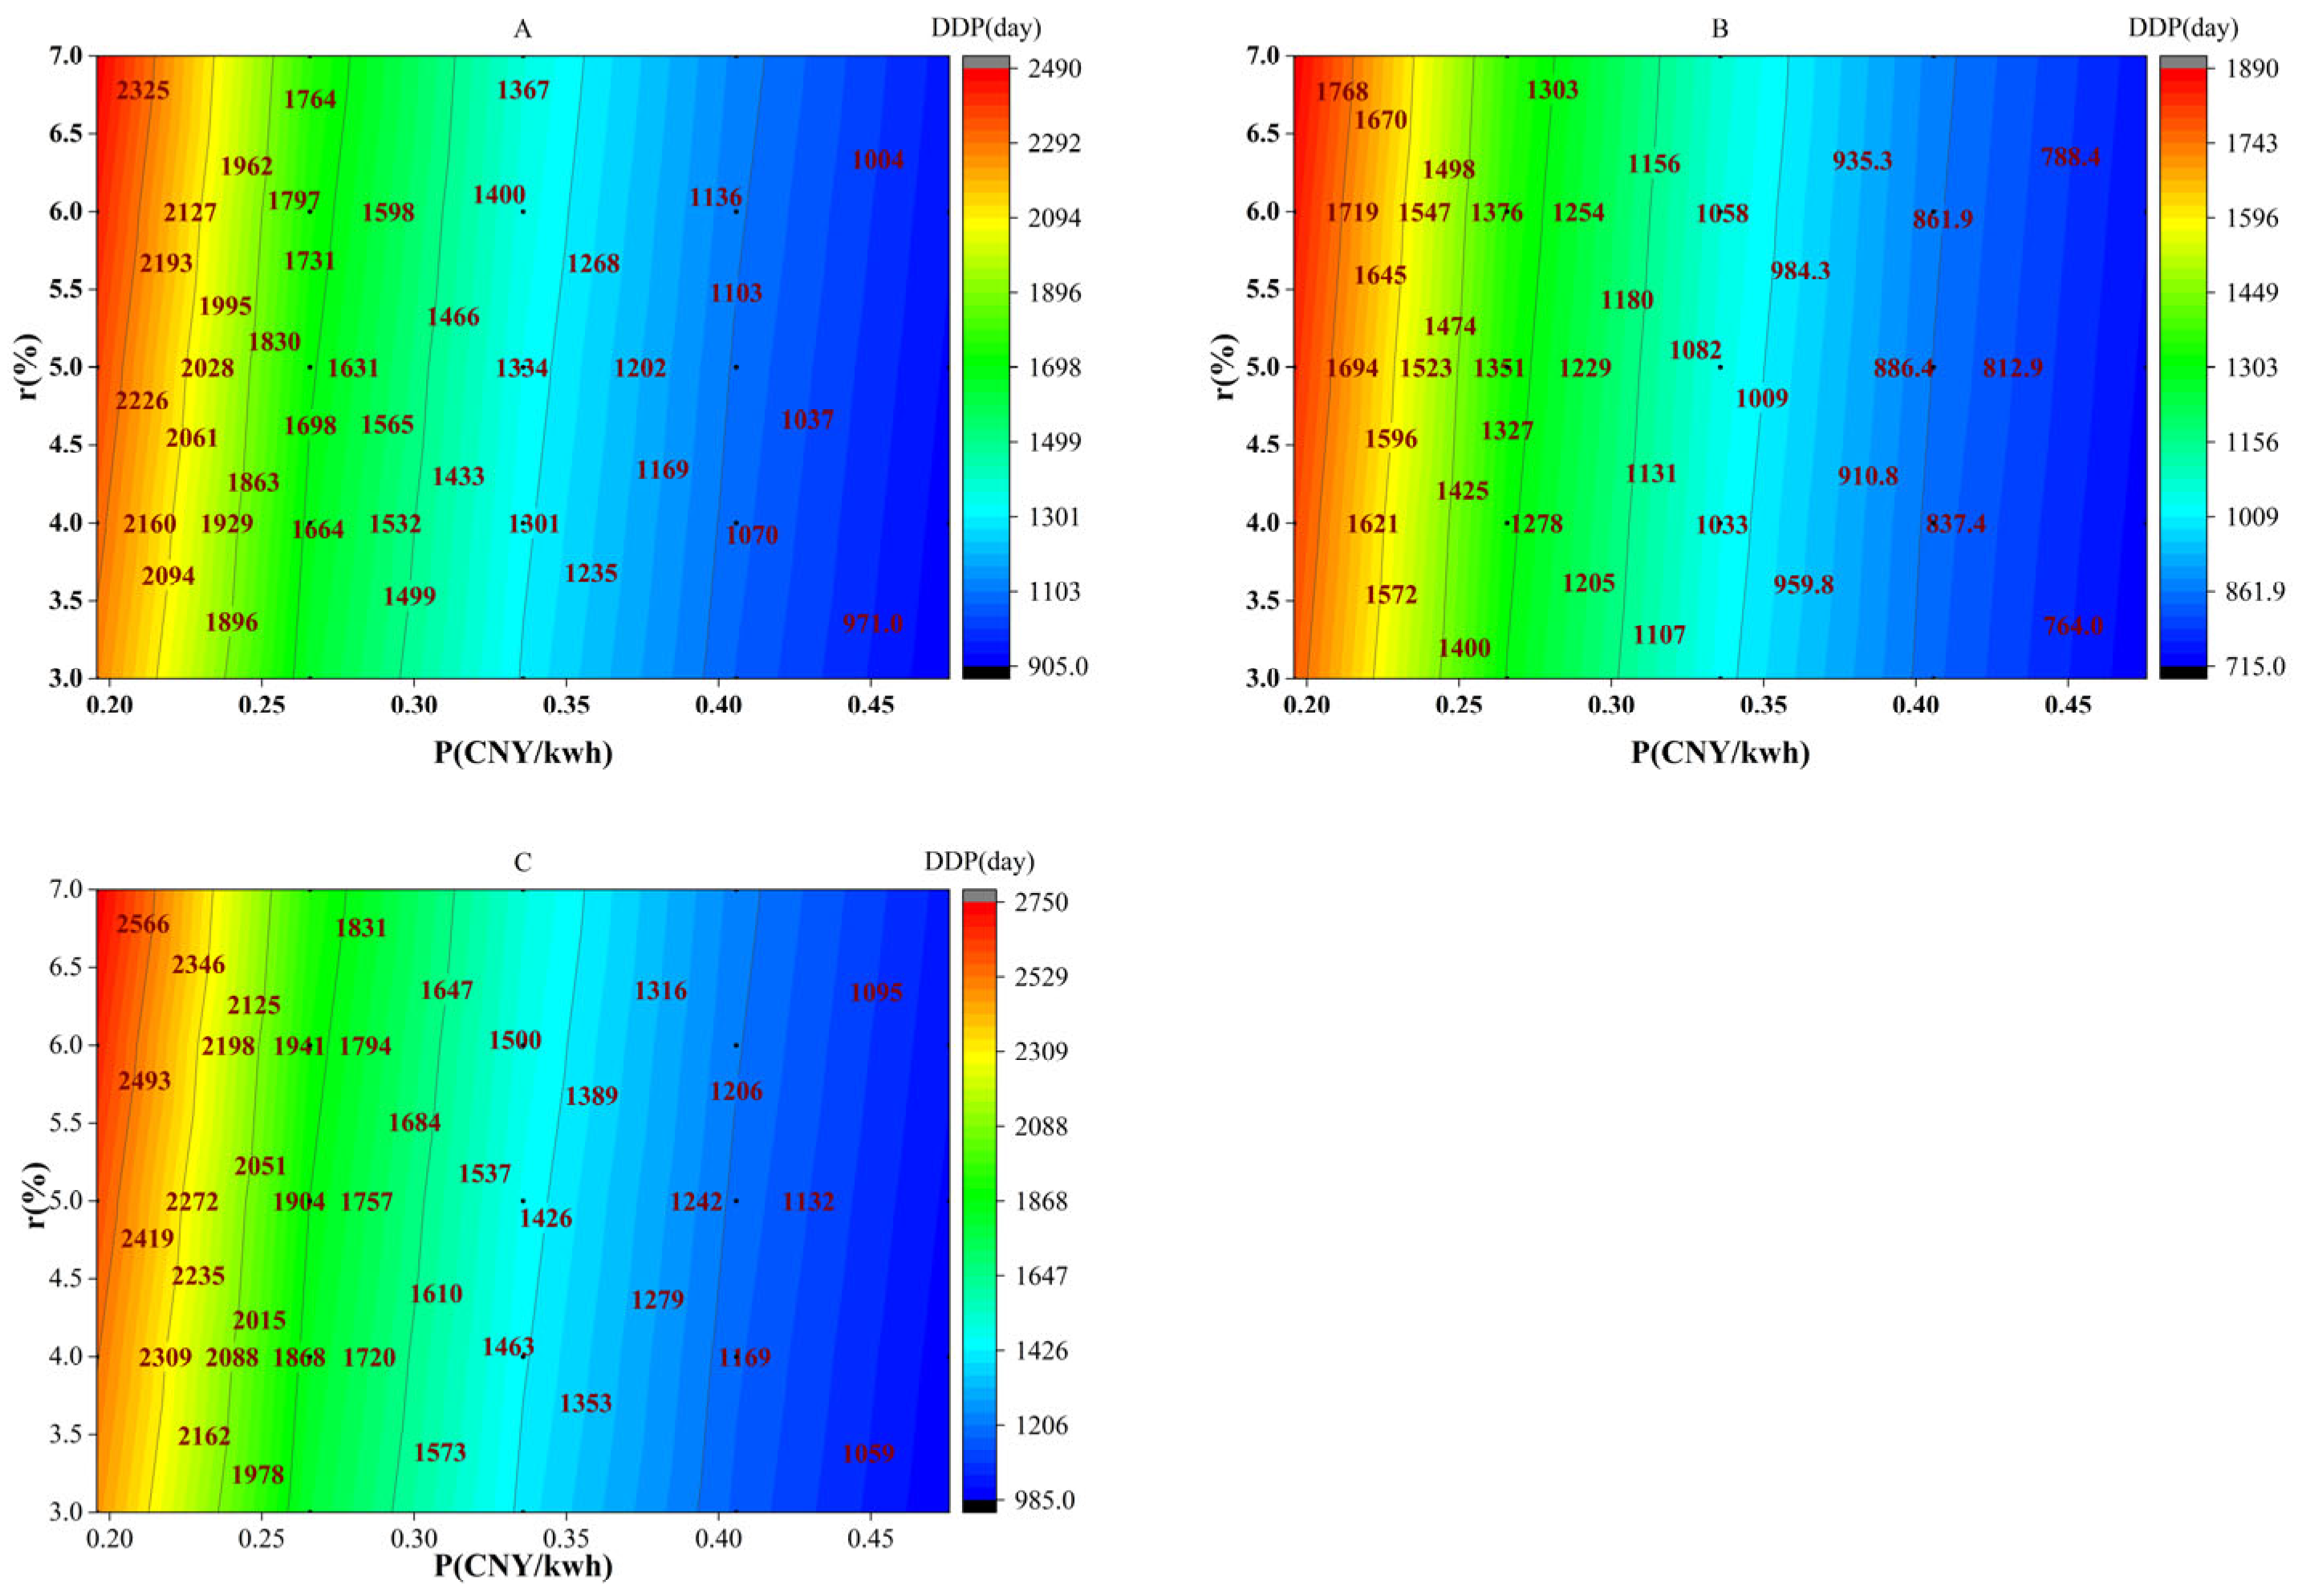
Given that the trend of the dynamic payback period (DPP) varying with discount rate (r) and electricity price (P) remains consistent across all scenarios, only the three operational condition scenarios obtained earlier (Plan 3, Plan 23, Plan 24) are subjected to comparative evaluation. To assess the impact of discount rate (r) and electricity price (P) fluctuations on the dynamic payback period (DPP) and quantify potential extensions or reductions in the payback period, this study employs a two-factor orthogonal experimental design. Both r and P are set at five levels each. The r values reference the annual changes in the discount rate by the People’s Bank of China, with increments of 1% and a baseline discount rate of 5%. Considering the multiple adjustments to the national feed-in tariff for photovoltaic power in recent years, with an average annual decrease of approximately 0.07 RMB/kWh, the increment for the P factor was set at 0.07 RMB/kWh, with a benchmark electricity price of 0.3358 RMB/kWh. Figure 12 presents the contour plot generated by this orthogonal experimental design, visually illustrating the patterns of DPP variation with changes in r and P.
The results indicate that electricity price P is the primary factor influencing the DPP. When r = 5% and electricity prices range from 0.1958 to 0.4758 RMB/kWh, the DPP is significantly shortened. Plan 3’s DPP decreased from 1829.2 to 733.1 days, Plan 24’s DPP decreased from 2602 to 1013 days, and Plan 23’s DPP decreased from 2371.7 to 931.1 days. In contrast, the impact of r was relatively minor. When P is 0.3358 RMB/kWh and r ranges from 3% to 7%, the DPP increases only slightly. Plan 3’s DPP rises from 1022.5 to 1071.5 days, Plan 24’s DPP increases from 1409 to 1507 days, and Plan 23’s DPP climbs from 1294.5 to 1371.3 days. The extreme ranges of the three plans further illustrate the regulatory effects of r and P on the DPP. Plan 3 spans 718.4–1888 days, Plan 24 spans 2749–986 days, and Plan 23 spans 2486–920 days. Among the three plans, P is the primary influencing factor, while r is secondary. The DPP shortens significantly with increasing P and increases only slightly with rising r. To further reduce the DPP, beyond reasonable electricity pricing, it is recommended to prioritize boosting effective generation capacity while optimizing initial investment costs.

3.3. Correlation Analysis Between Optimization Variables and Optimization Objectives

In order to investigate the potential relationship between the selection and thickness of insulation materials for building envelopes and carbon emissions, energy consumption, and costs, and to verify the correctness of the selected building envelope parameters, SPSS 19.0 data analysis software was used in this paper to analyze the optimization scheme’s data and calculate the Spearman correlation coefficient. Then, a correlation heat map was drawn using Origin 2024b plotting software to visualize the correlation between each variable and the optimization objectives.

3.3.1. Correlation Analysis Between Heat Transfer Coefficient of Insulation and Optimization Objective

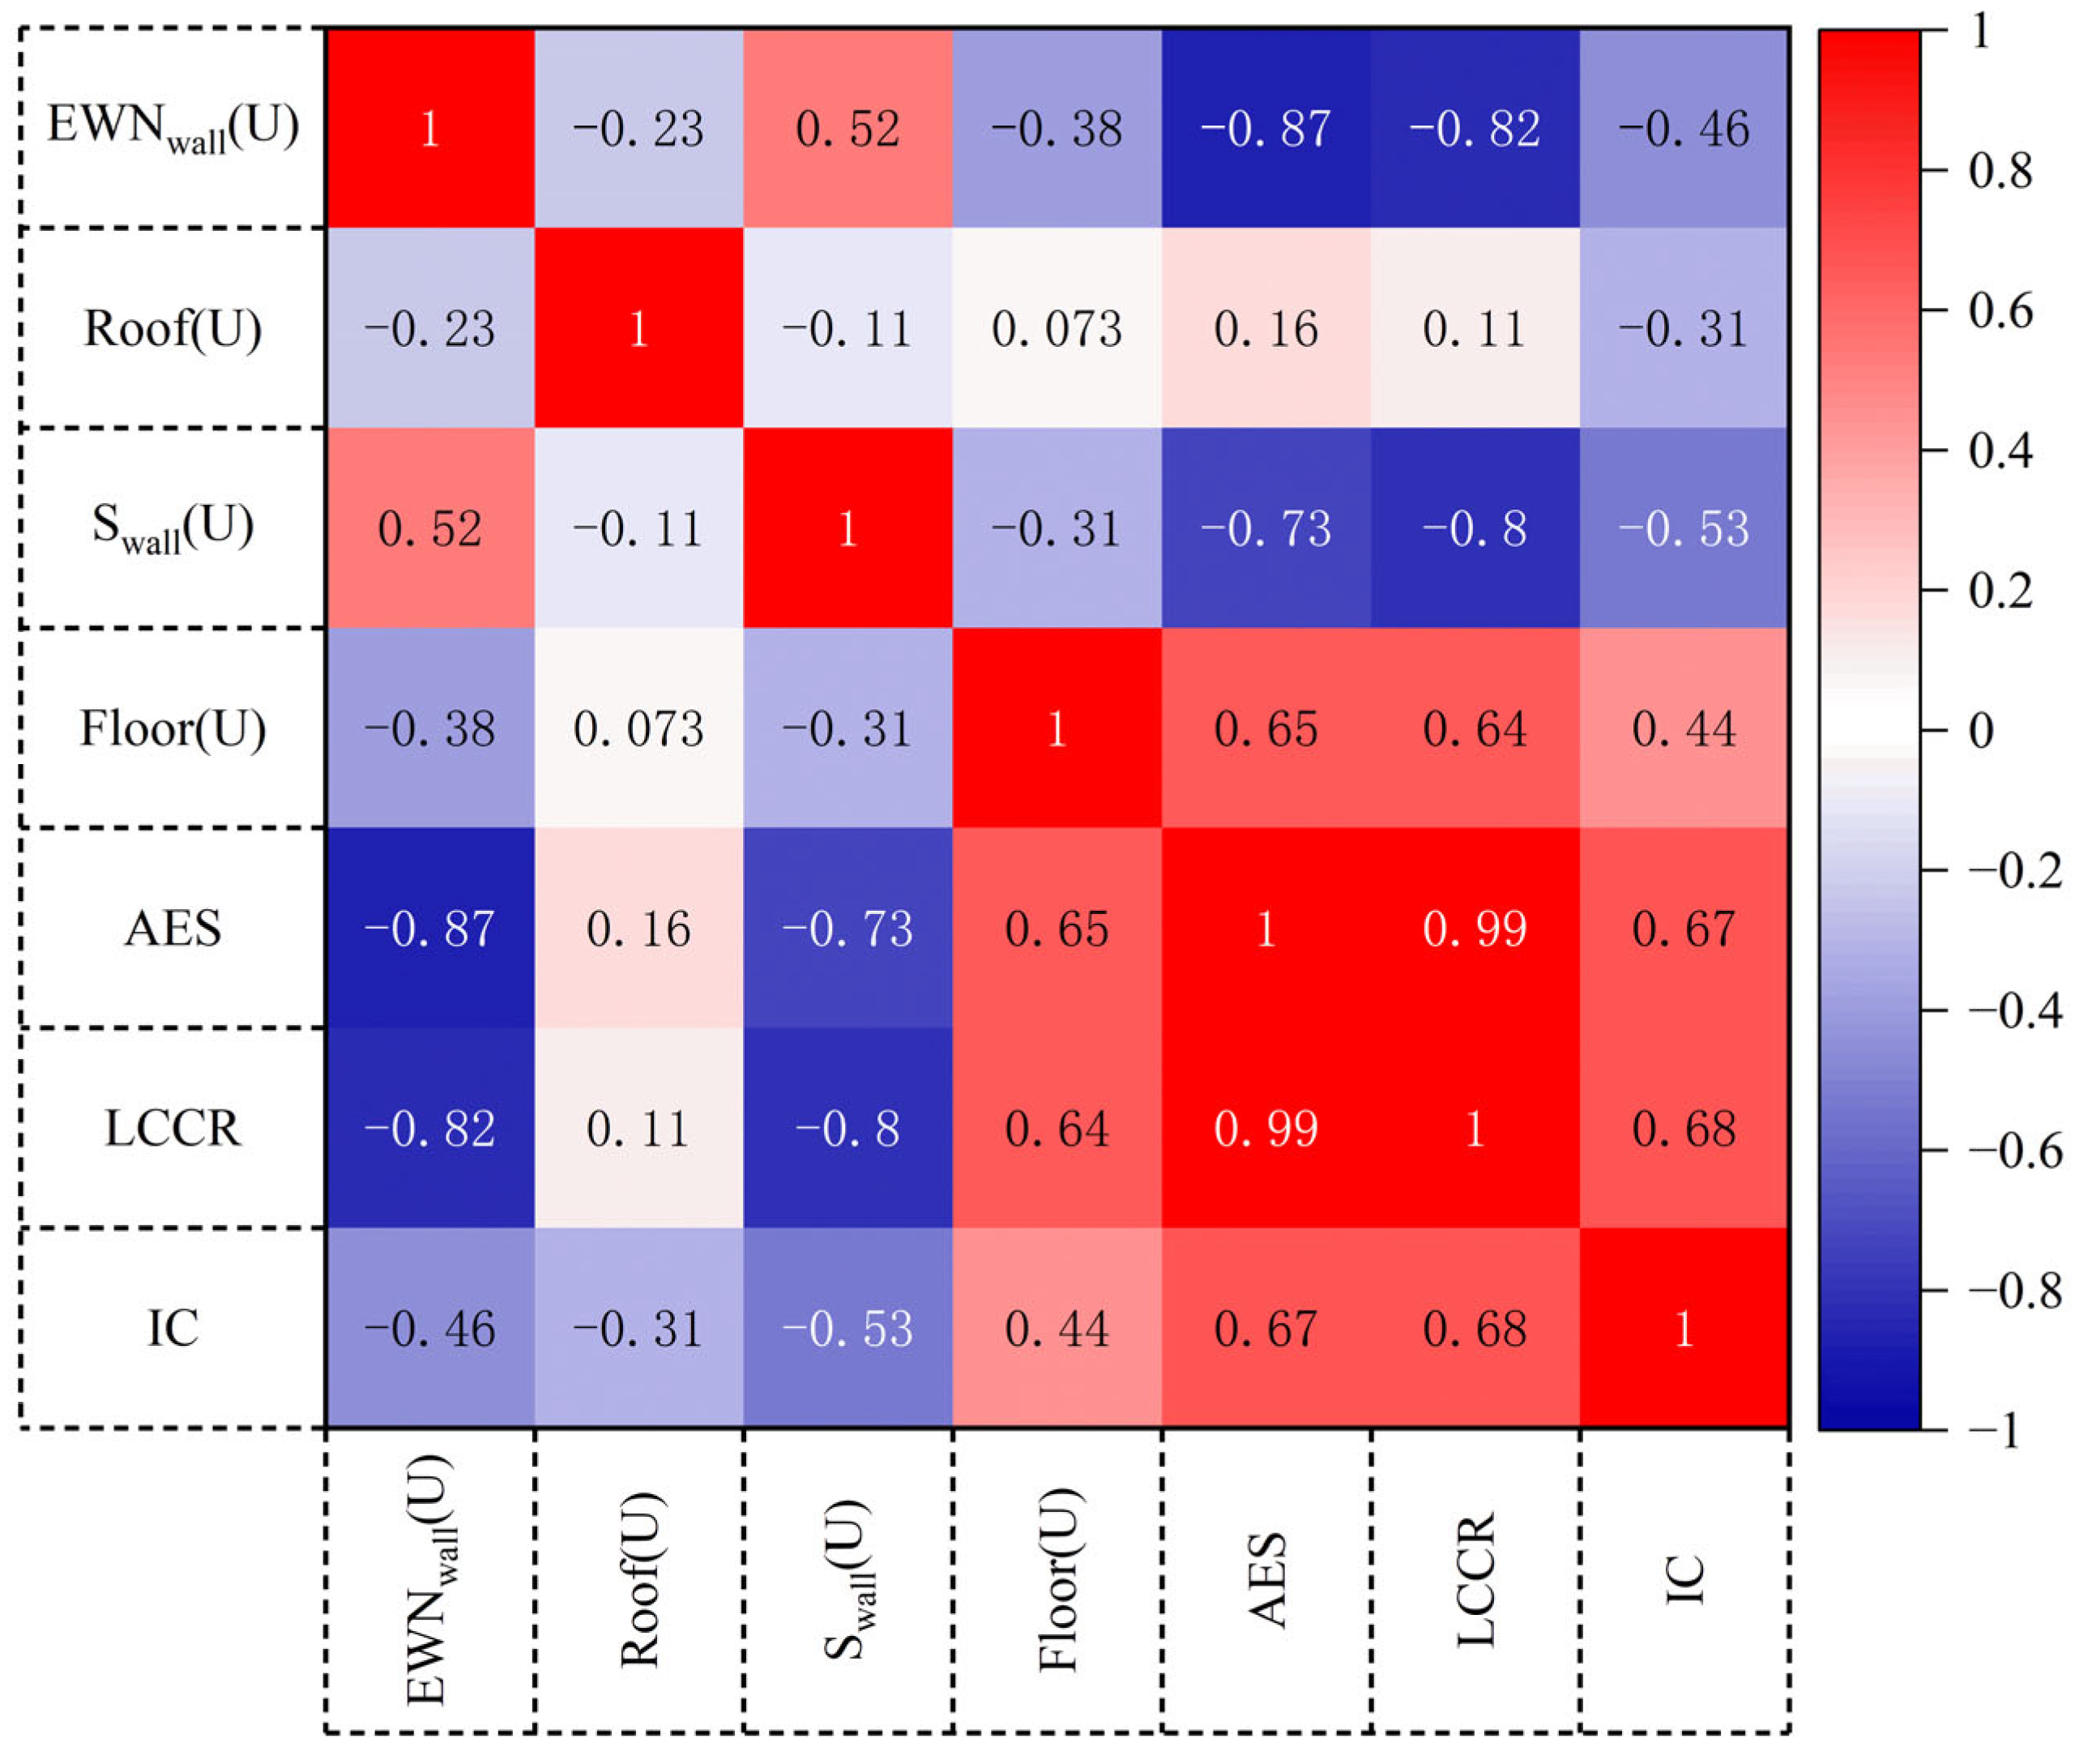
Figure 13 illustrates the relationship between the U-value of the building envelope insulation layer and the AES, LCCR, and IC. AES, LCCR, and IC exhibit a significant correlation with the U-values of the EWNwall, Swall, roof, and floor insulation layers. AES and LCCR show a significant negative correlation with the U-values of the EWNwall and Swall insulation layers, with the negative correlation coefficients for EWNwall (−0.87, −0.82) being higher than those for Swall (−0.73, −0.8). They exhibit a significant positive correlation with the U-values of floor insulation layers (0.65, 0.64), but the correlation with roof U-values is relatively low (0.16, 0.11). This indicates that improving wall insulation performance can positively impact building energy efficiency and carbon emissions reduction, while over-optimizing floor insulation may have negative effects, consistent with the results presented in the infrared thermal spectrum analysis of the floor at the beginning of this paper. Consequently, in optimization efforts focused on energy saving and carbon reduction, priority should be assigned to enhancing outer wall insulation performance while refraining from excessive enhancement of floor insulation performance. This result corresponds with the relevant technical criteria for viable options. Based on the magnitude of the relevant coefficients, when focusing on energy conservation and carbon reduction, the priority order for optimizing the thermal insulation performance of each component is as follows: EWNwall > Swall > roof > floor. There is a significant negative correlation between IC and the U-values of EWNwall, roofs, and Swall (−0.46, −0.31, −0.53), while there is a significant positive correlation between IC and the U-value of the floor (0.44). Based on the correlation coefficients, when cost is the primary consideration, the optimal sequence for optimizing the thermal insulation performance of different components is floor > roof > EWNwall > Swall.

3.3.2. Correlation Analysis of Insulation Thickness and Material Type with Optimization Objectives

Figure 14 illustrates the relationship between the thickness of diverse insulating materials in various sections of the building envelope and AES, LCCR, and IC. AES, LCCR, and IC exhibit correlation with the thickness of diverse insulating materials throughout various sections of the building envelope. AES and LCCR exhibit a notable positive association with the thickness of XPS material in EWNwall and the thickness of RW material in Swall, but they have a substantial negative correlation with the thickness of other insulation materials. This suggests that in the pursuit of energy conservation and carbon reduction objectives, XPS material is optimal for EWNwall, while RW material is advised for Swall; concurrently, the use of EPS, PU, and RW materials in EWNwall is discouraged, as is the use of XPS, EPS, and PU materials in Swall. The aforementioned conclusions align with the material choices in the previously established energy-saving and carbon-reduction optimization plan (Plan 24).
In terms of floor and roof insulation materials, AES and LCCR are negatively correlated with the thickness of each material. Among floor insulation materials, the negative correlation coefficients between material thickness and energy conservation and carbon reduction, ranked from highest to lowest, are RW < EPS < XPS < PU. This indicates that when prioritizing energy conservation and carbon reduction, RW should be the preferred choice for floor insulation materials. For roof insulation materials, although AES and LCCR are positively correlated with RW thickness, they are negatively correlated with the thickness of other materials. However, the overall correlation is not strong. Therefore, when pursuing energy conservation and carbon reduction, it is recommended to use RW materials as roof insulation materials. The above conclusions are consistent with the previously mentioned optimal energy conservation and carbon reduction scheme (Plan 24) in terms of material selection.
The thickness of PU and RW materials in EWNwall exhibits a substantial positive association with IC; however, the correlation with the thickness of XPS and EPS materials is rather minor. Consequently, when cost management is the principal aim, EWNwall should refrain from utilizing PU and RW materials. The thickness of Swall RW demonstrates a substantial negative association with IC, while other materials display differing levels of positive correlation, suggesting that the utilization of RW materials in Swall can efficiently lower expenses. The thickness of PU materials for the floor and roof exhibits a substantial positive correlation with IC, although the correlation with other material thicknesses is less pronounced. Consequently, the utilization of polyurethane as an insulating material for the floor and roof is not advisable.

4. Discussion

The research findings suggest that enhancing ground insulation has a minimal marginal effect on the overall objective. This data corroborates the prior conclusions derived from sensitivity analysis, infrared thermal imaging, and the concurrent evaluation of optimization variables in accordance with energy efficiency criteria, thus reinforcing the scientific rationale for variable selection. During optimization, the embedded carbon of the insulating materials varied from 5094.69 to 10,177.79 kgCO2e, corroborating the introduction’s claim that embedded carbon from insulation materials represents a substantial fraction of life cycle emissions, thereby necessitating its optimization. The solutions obtained from the suggested optimization approach exhibit significant practicality. In comparison to current case studies on building envelope retrofitting, of the three methods outlined in this article, the maximum energy savings rate achieved was 41.55%, and the minimum payback period was 3.99 years. This surpasses residential optimization scenarios in colder regions (33.03%, 5 years) [42] and extremely cold regions (38.39%, 13.07 years) [43], as well as a case employing BAPV to mitigate expenses (39%, 7.7 years) [44].
The findings of this study can provide low-carbon optimization processes and envelope parameter references for residential buildings in low-latitude plateau temperate regions—particularly those with predominantly earthen structures—tailored to different stakeholders. For instance, earthen houses in Diqing Prefecture, Yunnan, and the ancient town of Haiwozi in Pengzhou, Sichuan, share structural forms and climatic conditions similar to those in Lijiang. Common features include the absence of insulation, standard clear glass windows, and hybrid heating systems. Future research may extend to typical buildings in low-latitude plains (e.g., northern Hainan dwellings) and mid-latitude plateau cold regions (e.g., loess plateau cave dwellings). Regarding full-life-cycle carbon emissions accounting, this study excludes construction and demolition phases, potentially introducing some bias. However, considering that the study area prioritizes traditional architectural preservation through renovation rather than demolition and that construction relies primarily on manual labour with minimal machinery use, this bias is expected to be minimal. Future research should incorporate carbon emissions from the construction and demolition phases into assessments based on practical conditions.

5. Conclusions

This work employs Lijiang as a case study to formulate low-carbon retrofit options for rural dwellings in low-latitude plateau temperate zones while accommodating various stakeholder requirements. The NSGA-II algorithm is used to optimize designs for roofs, exterior walls with diverse orientations, ground surfaces, and exterior windows, thereby minimizing both embodied and operational carbon emissions in buildings. BIPV technology is employed to reduce retrofitting expenses and decrease the payback duration. The research results are as follows:
(1)
Optimized solution meeting government requirements: EWNwall insulation employs 200 mm-thick XPS insulation boards; Swall, roofs, and floor utilize 80 mm, 100 mm, and 20 mm-thick RW insulation materials, respectively. The exterior window type is 6Low-E + 12Ar + 6. The ESR, LCCR, and DPP are 45.11%, 1215.76 kg/m2, and 3.65 years, respectively.
(2)
Solution meeting the designer’s requirements: The EWNwall insulation layer is 220 mm thick, using XPS insulation material; the Swall, roof, and floor insulation layers increased by 100 mm, 140 mm, and 20 mm, respectively, using RW insulation material. The window type is 6Low-E + 12Ar + 6. The ESR, LCCR, and DPP are 45.41%, 1218.96 kg/m2, and 3.99 years, respectively.
(3)
Solution meeting farmer requirements: EWNwall, roof, and floor insulation thicknesses increased by 40 mm, 80 mm, and 20 mm, respectively, using EPS insulation material; Swall insulation thickness increased by 20 mm, using RW insulation material. The window type is 6 + 12A + 6. The ESR, LCCR, and DPP are 41.55%, 1149.46 kg/m2, and 2.87 years, respectively.
(4)
When energy conservation and emission reduction are the primary objectives, XPS should be selected for EWNwall insulation, while RW should be chosen for Swall, roof, and floor insulation. The optimization priority for the building envelope is EWNwall > Swall > roof > floor. If economic efficiency is the primary objective, EWNwall should not use RW or PU; Swall should use RW; and roofs and floors should not use PU. The optimization priority in this case is floor > roof > EWNwall > Swall.

Author Contributions

Conceptualization, L.C. and X.L.; methodology, L.C.; software, L.C. and X.L.; validation, L.C. and X.L.; formal analysis, L.C.; investigation, L.C. and X.L.; resources, X.L.; data curation, L.C.; writing—original draft preparation, L.C.; writing—review and editing, X.L.; visualization, L.C.; supervision, L.C.; project administration, X.L.; funding acquisition, X.L. All authors have read and agreed to the published version of the manuscript.

Funding

This research was supported by the Yunnan Provincial Department of Science and Technology’s Key Research and Development Program for Social Development, “Research and Demonstration of Key Technologies for Digital Intelligence-Empowered Zero-Carbon Villages in Lijiang” (202403AC100042).

Data Availability Statement

Data are contained within the article.

Conflicts of Interest

The authors declare no conflicts of interest.

Abbreviations

The following abbreviations are used in this manuscript:
LCCRLife cycle carbon reduction
AOCAnnual operational carbon
AESAnnual energy savings
ESREnergy saving rate
ICIncremental cost
DPPDynamic payback period
AOECAnnual operational energy consumption
EWNwallEast-, west-, and north-facing exterior walls
SwallSouth-facing exterior wall
EPSExpanded polystyrene
XPSExtruded polystyrene
PUPolyurethane
RWRock wool

References

  1. Paris Agreement. Available online: https://unfccc.int/most-requested/key-aspects-of-the-paris-agreement (accessed on 5 February 2025).
  2. Unpacking China’s 2060 Carbon Neutrality Pledge. Available online: https://www.oxfordenergy.org/publications/unpacking-chinas-2060-carbon-neutrality-pledge/ (accessed on 6 February 2025).
  3. China Building Energy Efficiency Association Building Energy Consumption and Carbon Emissions Data Special Committee. China Urban and Rural Development Sector Carbon Emissions Research Report; Chongqing University Press: Chongqing, China, 2024. [Google Scholar]
  4. Thomsen, K.E.; Rose, J.; Mørck, O.; Jensen, S.Ø.; Østergaard, I.; Knudsen, H.N.; Bergsøe, N.C. Energy consumption and indoor climate in a residential building before and after comprehensive energy retrofitting. Energy Build. 2016, 123, 8–16. [Google Scholar] [CrossRef]
  5. Olonscheck, M.; Walther, C.; Lüdeke, M.; Kropp, J.P. Feasibility of energy reduction targets under climate change: The case of the residential heating energy sector of the Netherlands. Energy 2015, 90, 560–569. [Google Scholar] [CrossRef]
  6. Serrano-Jiménez, A.; Lizana, J.; Molina-Huelva, M. Barrios-Padura Á Decision-support method for profitable residential energy retrofitting based on energy-related occupant behaviour. J. Clean. Prod. 2019, 222, 622–632. [Google Scholar] [CrossRef]
  7. Abouaiana, A.; Battisti, A. Insights and Evidence on Energy Retrofitting Practices in Rural Areas: Systematic Literature Review. Buildings 2023, 13, 1586. [Google Scholar] [CrossRef]
  8. Xu, K.; Song, S.; Xiang, C. Parametric design for combined solar facades for high-rise residential buildings. Sustain. Energy Technol. Assess. 2025, 74, 104167. [Google Scholar] [CrossRef]
  9. Galimshina, A.; Moustapha, M.; Hollberg, A.; Lasvaux, S.; Sudret, B.; Habert, G. Strategies for robust renovation of residential buildings in Switzerland. Nat. Commun. 2024, 15, 2227. [Google Scholar] [CrossRef] [PubMed]
  10. Tang, H.; Chai, X.; Jing, W.; Li, Y.; Li, C. Assessment of photovoltaic power generation and radiative cooling potentials in old residential districts: A case study of Shenzhen. Energy Build. 2024, 319, 114493. [Google Scholar] [CrossRef]
  11. Chen, R.; Feng, X.; Li, C.; Chen, H. Reduction in carbon dioxide emission and energy saving obtained by renovation of building envelope of existing residential buildings. Aerosol Air Qual. Res. 2021, 21, 210084. [Google Scholar] [CrossRef]
  12. Li, R.; Shari, Z.; Ab Kadir, M.Z.A. A review on multi-objective optimization of building performance-Insights from bibliometric analysis. Heliyon 2025, 11, e42480. [Google Scholar] [CrossRef]
  13. Echenagucia, T.M.; Moroseos, T.; Meek, C. On the tradeoffs between embodied and operational carbon in building envelope design: The impact of local climates and energy grids. Energ. Buildings 2023, 278, 112589. [Google Scholar] [CrossRef]
  14. Song, J.; Wang, W.; Ni, P.; Zheng, H.; Zhang, Z.; Zhou, Y. Framework on low-carbon retrofit of rural residential buildings in arid areas of northwest China: A case study of Turpan residential buildings. Build. Simul-China 2023, 16, 279–297. [Google Scholar] [CrossRef]
  15. Fang, H.; Li, W.K.; Dai, P. Parametric analysis of passive ultra-low energy building envelope performance in existing residential buildings. Sci. Rep. 2025, 15, 23407. [Google Scholar] [CrossRef] [PubMed]
  16. Deng, Q.; Zhang, S.; Shan, M.; Li, J. Research on envelope thermal performance of ultra-low energy rural residential buildings in China. Sustainability 2023, 15, 6931. [Google Scholar] [CrossRef]
  17. Gao, P.; Nor, M.F.I.M. Climate-Responsive Envelope Retrofit Strategies for Aged Residential Buildings in China Across Five Climate Zones. Buildings 2025, 15, 2842. [Google Scholar] [CrossRef]
  18. Zhao, S.; Diao, J.; Yao, S.; Yuan, J.; Liu, X.; Li, M. Seasonal optimization of envelope and shading devices oriented towards low-carbon emission for premodern historic residential buildings of China. Case Stud. Therm. Eng. 2024, 64, 105452. [Google Scholar] [CrossRef]
  19. He, Q.; Ng, S.T.; Hossain, M.U.; Skitmore, M. Energy-efficient window retrofit for high-rise residential buildings in different climatic zones of China. Sustainability 2019, 11, 6473. [Google Scholar] [CrossRef]
  20. Xi, H.; Gao, H.; Hou, W.; Yin, B.; Zuo, J.; Zhao, H. Multi-objective optimization for winter heating retrofit in rural houses of cold regions: A case study in the Wusu Area. Appl. Sci. 2024, 14, 3760. [Google Scholar] [CrossRef]
  21. Rached, E.; Anber, M. Energy retrofitting strategies for office buildings in hot arid climate. Int. J. Low-Carbon. Tec. 2022, 17, 506–512. [Google Scholar] [CrossRef]
  22. Wang, D.; Dong, Q.; Sun, C. Evaluating the adaptation potential and retrofitting effectiveness of existing residential buildings in severe cold regions of China under climate change. Build. Environ. 2025, 278, 112982. [Google Scholar] [CrossRef]
  23. JGJ 475-2019; Energy Efficiency Design Standards for Residential Buildings in Temperate Regions. Ministry of Housing and Urban-Rural Development of the People’s Republic of China: Beijing, China, 2019.
  24. Yang, Z.; Xiao, H.; Shi, W.; Zhang, M.; Wang, B. Analysis and determination of a seasonal performance evaluation for air source heat pumps. J. Build. Eng. 2021, 43, 102574. [Google Scholar] [CrossRef]
  25. Chua, K.J.; Chou, S.K.; Yang, W.M. Advances in heat pump systems: A review. Appl. Energy 2010, 87, 3611–3624. [Google Scholar] [CrossRef]
  26. GB55015-2021; General Specifications for Energy Efficiency in Buildings and the Use of Renewable Energy. Ministry of Housing and Urban-Rural Development of the People’s Republic of China: Beijing, China, 2021.
  27. JGJ/T132-2009; Residential Building Energy Efficiency Testing Standards. Ministry of Housing and Urban-Rural Development of the People’s Republic of China: Beijing, China, 2009.
  28. Deb, K.; Pratap, A.; Agarwal, S.; Meyarivan, T.A.M.T. A fast and elitist multiobjective genetic algorithm: NSGA-II. IEEE Trans. Evol. Comput. 2002, 6, 182–197. [Google Scholar] [CrossRef]
  29. Evins, R. A review of computational optimisation methods applied to sustainable building design. Renew. Sustain. Energy Rev. 2013, 22, 230–245. [Google Scholar] [CrossRef]
  30. Delgarm, N.; Sajadi, B.; Delgarm, S.; Kowsary, F. A novel approach for the simulation-based optimization of the buildings energy consumption using NSGA-II: Case study in Iran. Energy Build. 2016, 127, 552–560. [Google Scholar] [CrossRef]
  31. Chaudhari, P.; Thakur, A.K.; Kumar, R.; Banerjee, N.; Kumar, A. Comparison of NSGA-III with NSGA-II for multi objective optimization of adiabatic styrene reactor. Mater. Today 2022, 57, 1509–1514. [Google Scholar] [CrossRef]
  32. Reyes-Sierra, M.; Coello, C.C. Multi-objective particle swarm optimizers: A survey of the state-of-the-art. Int. J. Comput. Intell. Res. 2006, 2, 287–308. [Google Scholar] [CrossRef]
  33. Deb, K.; Jain, H. An evolutionary many-objective optimization algorithm using reference-point-based nondominated sorting approach, part I: Solving problems with box constraints. IEEE Trans. Evol. Comput. 2013, 18, 577–601. [Google Scholar] [CrossRef]
  34. GB/T 51366-2019; Building Carbon Emissions Calculation Standards. Ministry of Housing and Urban-Rural Development of the People’s Republic of China: Beijing, China, 2019.
  35. GB50797-2012; Photovoltaic Power Station Design Specifications. Ministry of Housing and Urban-Rural Development of the People’s Republic of China: Beijing, China, 2012.
  36. Hao, Y.; He, Q.; Zhou, Q.; Du, D. Modeling and techno-economic analysis of a novel trans-critical carbon dioxide energy storage system based on life cycle cost method. Energy Storage 2020, 28, 101273. [Google Scholar] [CrossRef]
  37. Fernandes, W.S.; Greco, M.; Almeida, V.S. Application of the smooth evolutionary structural optimization method combined with a multi-criteria decision procedure. Eng. Struct. 2017, 143, 40–51. [Google Scholar] [CrossRef]
  38. Sun, B.; Zhong, C.; Yu, D.; Han, Q.; Tang, J. Life cycle carbon emission assessment and carbon payback period analysis for the regeneration of old residential areas in cold regions: Case study in Qingdao, China. Sustain. Cities Soc. 2024, 115, 105860. [Google Scholar] [CrossRef]
  39. Zou, D.; Sun, C.; Gao, D. Multi-Objective Optimization-Driven Research on Rural Residential Building Design in Inner Mongolia Region. Energies 2025, 18, 1867. [Google Scholar] [CrossRef]
  40. Zhao, D.; Mo, Y. Construction cost decomposition of residential building energy retrofit. Buildings 2023, 13, 1363. [Google Scholar] [CrossRef]
  41. Chiradeja, P.; Thongsuk, S.; Ananwattanaporn, S.; Ngaopitakkul, A. Renovation of an academic building’s envelope, lighting, and air conditioning system according to Thailand building energy code for energy consumption reduction. Sustainability 2023, 15, 15298. [Google Scholar] [CrossRef]
  42. Yang, H.; Kikuta, K.; Hayashi, M. Research on carbon reduction of residential buildings in severe cold regions based on renovation of envelopes. Energies 2022, 15, 1873. [Google Scholar] [CrossRef]
  43. Han, Y.; Yang, S.; Sun, Z.; Li, J. Research on the green retrofitting strategies of existing residential buildings in cold areas. Energ. Buildings 2025, 116320. [Google Scholar] [CrossRef]
  44. Charles, A.; Maref, W.; Ouellet-Plamondon, C.M. Case study of the upgrade of an existing office building for low energy consumption and low carbon emissions. Energy Build. 2019, 183, 151–160. [Google Scholar] [CrossRef]
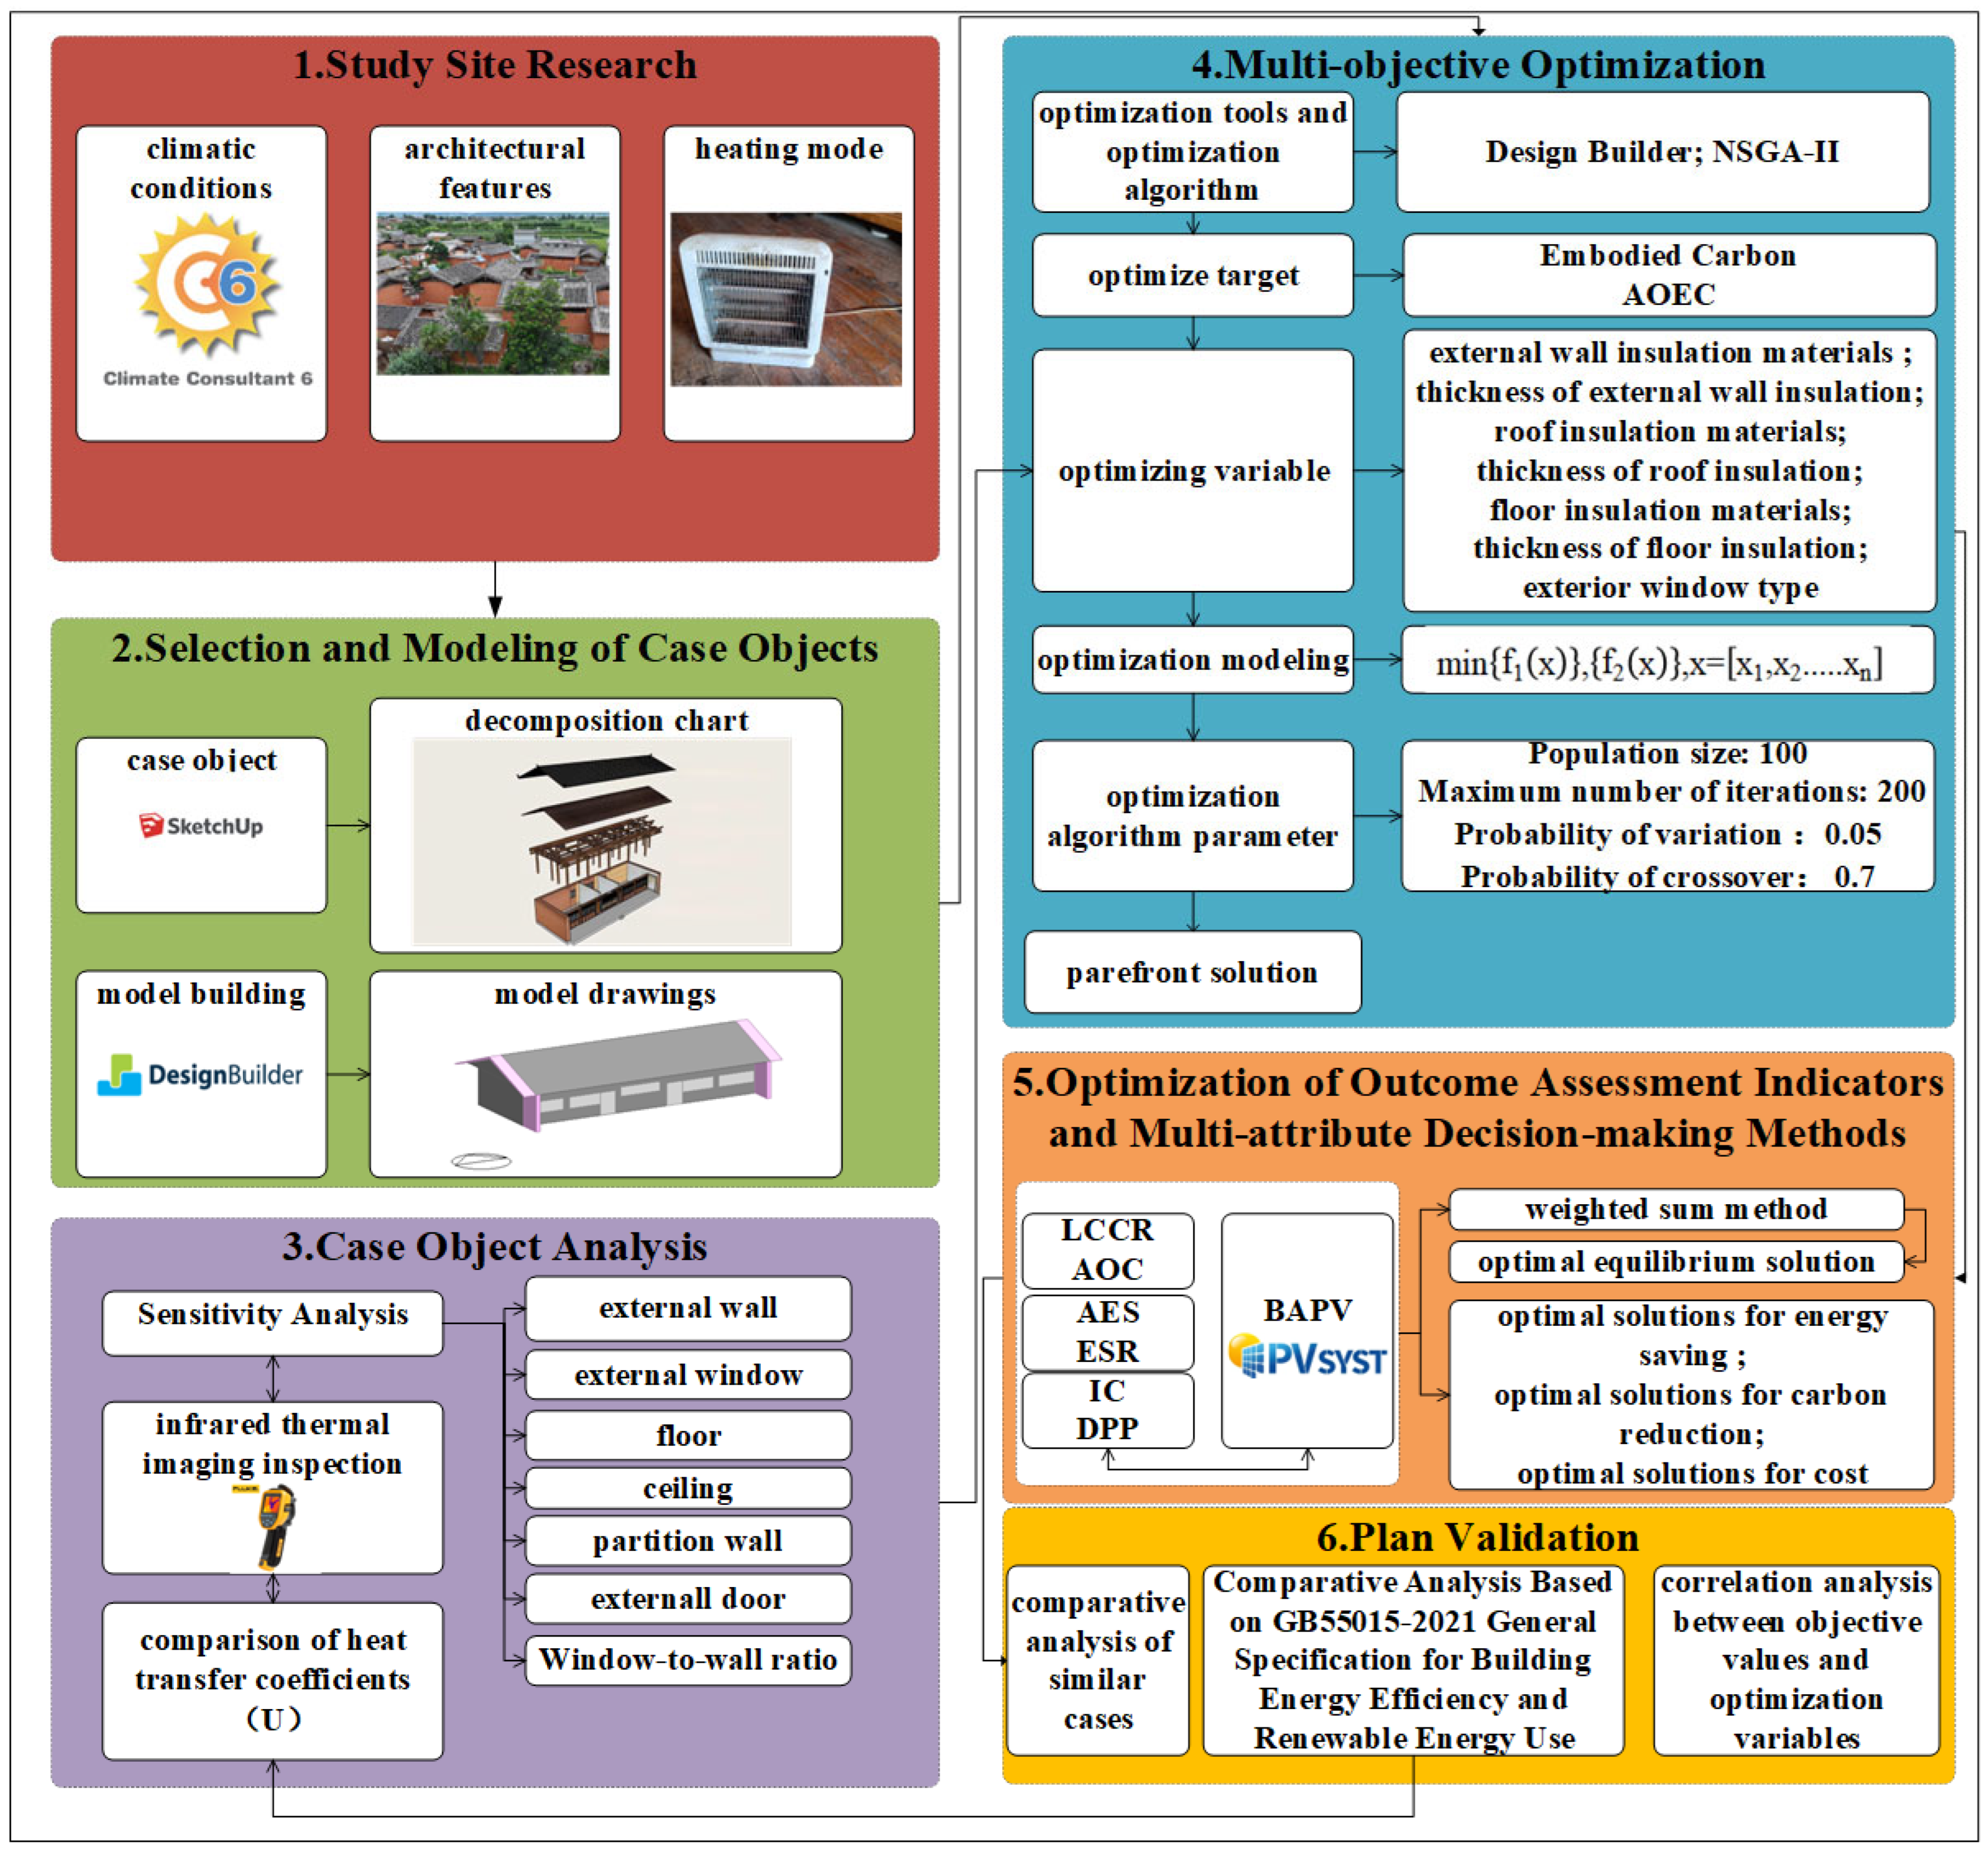
Figure 1. Methodological framework of the study.
Buildings 15 03366 g001
Figure 2. Rendering of the bungalow. (a) An actual photograph, (b) a structural breakdown, and (c) the floor plan of the bungalow.
Buildings 15 03366 g002
Figure 3. Energy consumption differences resulting from variations in envelope parameters.
Buildings 15 03366 g003
Figure 4. Infrared thermal spectra of the cottage envelope. (a) An infrared thermogram of the ceiling and exterior wall, (b) an infrared thermogram of the exterior window, and (c) an infrared thermogram of the floor.
Buildings 15 03366 g004
Figure 5. Integration process of simulation objects with photovoltaic systems using PVsyst software.
Buildings 15 03366 g005
Figure 6. Pareto solving process.
Buildings 15 03366 g006
Figure 7. LCCR and AOC in 24 feasible schemes.
Buildings 15 03366 g007
Figure 8. AOEC, AES, and ESR of 24 feasible schemes.
Buildings 15 03366 g008
Figure 9. IC and DPP for 24 feasible schemes.
Buildings 15 03366 g009
Figure 10. Optimal solutions and equilibrium optimal solutions in multiple objective directions.
Buildings 15 03366 g010
Figure 11. The range of variation between the envelope U-value of the optimal solution and the standard limit value.
Buildings 15 03366 g011
Figure 12. Contour plots of DPP versus r and P for the three schemes. (A) DPP distribution for Plan 23 under r and electricity prices. (B) DPP distribution for Plan 3 under r and P. (C) DPP distribution for Plan 24 under r and P.
Buildings 15 03366 g012
Figure 13. Correlation between the U-values of insulation layers in various building envelopes and AES, LCCR, and IC. EWNwall(U) denotes the U-value of the EWNwall insulation layer, Roof(U) denotes the U-value of the roof insulation layer, Swall(U) denotes the U-value of the wall insulation layer, and Floor(U) denotes the U-value of the floor insulation layer.
Buildings 15 03366 g013
Figure 14. Correlation between the thickness of various insulation materials in different parts of the building envelope and AES, LCCR, and IC. EWNwallPU) indicates the PU thickness of EWNwall, SwallXPS) indicates the XPS thickness of Swall, and other similar expressions have the same meaning.
Buildings 15 03366 g014
Table 1. Building structural parameters.
ItemParameters
Living Room Area43–45 m2
Bedroom Area22–24 m2
Clear Ceiling Height2.2–2.4 m
EWNwall450–455 mm thick and painted with straw art paint
SwallConstructed of pine wood; wall thickness 50–55 mm
RoofDouble-sloped roof; the main structure consists of wooden rafters, suspended boards and blue-grey shingles, with a suspended ceiling inside the house
FloorPine flooring with a thickness of 20 mm
Outer Door50 mm thick pine panel door
Exterior window6 mm thick single glazed timber windows using plain white lightly tinted plate glass
Table 2. Bungalow envelope parameters. U represents the heat transfer coefficient.
Enclosure PartsFrameworkU(W/(m2·K))
EWNwall10 mm straw art paint + 400 mm adobe + plastering0.969
Swall60 mm pine solid wood2.653
Roof20 mm cold-laid green tiles3.39
Floor20 mm pine solid wood4.185
Exterior Window6 mm transparent glass5.36
Outer Door50 mm pine solid wood2.92
Table 3. Model simulation parameter settings.
ItemParameters
Density of Persons in Living Rooms0.05 person/m2
Density of Persons in Bedrooms0.096 person/m2
Living Room Occupancy and Time in Room50%, 8:00–2:00, 14:00–22:00
Bedroom Occupancy and Time in Room100%, 00:00–8:00, 22:00–24:00; 50%, 12:00–14:00
Living Room Lighting Time19:00–22:00
Bedroom Lighting Hours22:00–22:30
Power of Electrical Equipment3.8 w/m2
Lighting Power Density5 w/m2
Average Thermal Resistance of Winter Clothing1
Average Summer Clothing Thermal Resistance0.5
Number of Air Changes1 time/h
Interior Design Temperature18 °C
Table 4. Heating system parameters.
ItemParameters
Air Source Heat Pumps + RadiatorsCOP = 3.2, Natural Ventilation
Table 5. Test instrument parameters.
NamePlace of Origin/ManufacturerMeasurement ContentSensorMeasurement RangeInaccuracies
Testo174 Shanghai, China/Testo SE & Co. KGaATemperature, humidity-(−40 °C, +150 °C)±0.05%, ±0.04 °C
JTSOFT–IAQBeijing, China/Beijing Century Janty Technology Co.PMVWind Speed Sensor(0.05 m/s, 5 m/s)±0.03 m/s
Humidity Sensor(0% RH, +100% RH)±1.5% RH
Black Ball Temperature Sensor(20 °C, +85 °C)±0.3 °C
Wet Bulb Temperature Sensor(5 °C, +40 °C)±0.5 °C
Dry Bulb Temperature Sensor(5 °C, +60 °C)±0.5 °C
Radiant Heat Sensor(0 kw/m2, 2000 w/m2)-
Table 6. Thermal performance parameters limits and variation ranges for building envelopes.
FactorLimit ValueReference SourceRange of Variation
EWNwall(U)≤0.6 w/(m2·k)Table 3.1.8-100.969–0.6 w/(m2·k)
Swall(U)≤1.6 w/(m2·k)Table 3.1.8-102.653–1.6 w/(m2·k)
Roof(U)≤0.4 w/(m2·k)Table 3.1.8-103.39–0.4 w/(m2·k)
Floor(U)≤1.8 w/(m2·k)Continued Table 3.1.8-104.185–1.8 w/(m2·k)
External door(U)≤2 w/(m2·k)Continued Table 3.1.8-102.92–2 w/(m2·k)
Partition(U)≤1.52 w/(m2·k)Continued Table 3.1.8-102.755–1.52 w/(m2·k)
External window(U)≤2.5 w/(m2·k)Table 3.1.9-55.36–2.5 w/(m2·k)
WWR0.2 ≤ WWR ≤ 0.4Table 3.1.9-50.2−0.3
Table 7. Infrared camera parameters.
NamePlace of Origin/ManufacturerMeasurement ContentMeasurement RangeInaccuracies
Fluke TiS20 Shanghai, China/Fluke CorporationThermal Distribution(−20 °C, +250 °C)±2 °C, 2%
Table 8. Comparison of heat transfer coefficients of existing building envelopes with standard limits.
PartsActual Value (W/(m2·K))Regulatory Limit (W/(m2·K))Does It Meet the Specification
EWNwall0.9690.6Nonstandard
Swall2.6531.6Nonstandard
Roof3.390.4Nonstandard
Exterior Window5.362.5Nonstandard
Table 9. Optimization variables and ranges of values.
Variable TypePracticeMaterialsU (W/(m2·K))
EWNwall; Swall;
Roof; Floor
Insulation thickness change interval [0, 240] mm in 20 mm stepsExpanded Polystyrene (EPS)1.52–0.166
Extruded Polystyrene (XPS)1.195–0.122
Polyurethane (PU)0.997–0.098
Rock Wool (RW)1.627–0.182
Exterior Window6 mm transparent glass + 12 mm air + 6 mm transparent glass(6 + 12A + 6)Glass2.5
6 mm Low-E glass + 12 mm air + 6 mm transparent glass (6 Low-E + 12A + 6)1.8
6 mm Low-E glass + 12 mm argon gas + 6 mm transparent glass (6 Low-E + 12Ar + 6)1.5
Table 10. Material carbon emission factors.
Material TypeDensity
(kg/m3)
Production Phase
(kgCO2e/m3)
Transportation Phase
(kgCO2e/m3)
Embodied Carbon
(kgCO2e/m3)
EPS1890.363.0193.37
XPS251534.17157.17
PU30156.65.01161.61
RW95188.115.86203.96
Glass25002767.5417.53185
Table 11. NSGA-II genetic algorithm related parameters.
ItemPopulation SizeMaximal AlgebraCrossover ProbabilityProbability of Mutation
Parameters1002000.70.05
Table 12. IC of materials and equipment.
ItemIncremental Cost
EPS315 CNY/m3
XPS389 CNY/m3
PU972 CNY/m3
RW527 CNY/m3
6 + 12A + 6890 CNY/m2
6Low-E + 12A + 6920 CNY/m2
6Low-E + 12Ar + 61200 CNY/m2
Air Source Heat Pumps + Radiators5000 CNY/unit
Photovoltaic Module194 CNY/m2
Table 13. Weight values for optimisation objectives across three scenarios.
Optimization ObjectiveLCCR (kg/m2)AES (kWh/m2)IC (CNY/m2)
Scenario 10.330.330.33
Scenario 20.50.30.2
Scenario 30.20.30.5
Table 14. The design parameters for the solutions under the three operating conditions. 200 XPS denotes XPS material with a thickness of 200 mm, while 80 RW denotes RW material with a thickness of 80 mm. Other notation styles convey the same meaning.
PartsEWNwall (mm)Swall (mm)Roof (mm)Floor (mm)External Window
Scenario 1200 XPS80 RW100 RW20 RW6Low-E + 12Ar + 6
Scenario 2220 XPS100 RW140 RW20 RW6Low-E + 12Ar + 6
Scenario 340 EPS20 RW80 EPS20 EPS6 + 12A + 6
Disclaimer/Publisher’s Note: The statements, opinions and data contained in all publications are solely those of the individual author(s) and contributor(s) and not of MDPI and/or the editor(s). MDPI and/or the editor(s) disclaim responsibility for any injury to people or property resulting from any ideas, methods, instructions or products referred to in the content.