Correlation Analysis and Dynamic Evolution Research on Safety Risks of TBM Construction in Hydraulic Tunnels
Abstract
1. Introduction
2. Safety Risk Index System for TBM Construction of Hydraulic Tunnel
2.1. Data Collection
- (1)
- Literature sourcesLiterature sources, as systematically studied and academically validated information, provide theoretical support and empirical reference for this research. With construction safety as the primary focus, the selection of risk factors for hydraulic tunnel TBM construction was informed by domestic and international studies. The databases China National Knowledge Infrastructure (CNKI) and Web of Science were used for data retrieval. For Chinese literature, journal sources were restricted to EI, CSSCI, and CSCD, while both Chinese and English high-quality journal papers, as well as master’s and doctoral dissertations, were included. Search topics and keywords consisted of “Tunnel construction”, “Safety risks in the construction of hydraulic tunnels”, “TBM construction”, and “Safety risks of TBM construction in hydraulic tunnels”.
- (2)
- Case reportsBoth online and offline approaches were adopted to collect case reports of TBM construction risk events in hydraulic tunnels that occurred in recent years in China. Online data were obtained from official databases and government portals, including the Ministry of Emergency Management of the People’s Republic of China, as well as provincial, municipal, and district emergency management departments. Field investigations were also conducted to complement the database records.
- (3)
- Interview recordsThe AY hydraulic tunnel project was selected as the primary subject for interviews. Participants included project managers, engineers, and frontline workers who had either full-cycle experience with TBM construction or direct involvement in handling major TBM risk events. The interviews focused on sources of risk, mechanisms of hazard formation, response measures, and subjective perceptions of TBM construction safety. The collected interview materials were standardized by consolidating similar content and eliminating colloquial expressions, resulting in structured transcripts suitable for subsequent analysis.
2.2. Grounded Theory Workflow
2.2.1. Open Coding
2.2.2. Axial Coding
2.2.3. Selective Coding
2.3. Gray Relational Analysis
3. Safety Risk Correlation Analysis of Hydraulic Tunnel TBM Construction Based on Fuzzy DEMATEL–ISM–BN Method
3.1. Fuzzy DEMATEL–ISM–BN Method
3.2. Flow Chart of Safety Risk Correlation Analysis for Hydraulic Tunnel TBM Construction
3.3. Construction of Fuzzy DEMATAL–ISM–BN Model
- Construct the direct impact matrix B. In the traditional DEMATEL method, expert scoring is used to evaluate the degree of mutual influence among factors. To effectively address the linguistic fuzziness and subjective uncertainty inherent in such expert judgments, this study improved the conventional DEMATEL method by incorporating fuzzy set theory.To ensure the convergence and reliability of expert group judgments, a multi-round anonymous consultation process based on the Modified Delphi Method was adopted. The specific steps are as follows:Step 1: Expert group formation and preparation.Ten experts with substantial theoretical knowledge and practical experience in hydraulic tunnel TBM construction, safety management, and risk analysis were carefully selected. Their backgrounds covered research institutes, universities, and frontline engineering organizations, ensuring diverse perspectives (see Table 2). Before the consultation, each expert was provided with standardized background materials, including detailed definitions of 21 risk factors, an overview of the AY project, and explicit scoring criteria (e.g., the semantic scale of triangular fuzzy numbers shown in Table 4). This preparation ensured a consistent understanding of the evaluation objects and standards.Step 2: Independent initial anonymous scoring (Round 1).Each expert independently and anonymously evaluated the influence relationships among all pairs of risk factors without interference from others. Triangular fuzzy numbers were applied to capture not only the degree of influence but also the uncertainty embedded in expert judgments. The anonymity and independence of this round aimed to eliminate authority bias or groupthink effects on the initial evaluations.Step 3: Statistical analysis and anonymous feedback (Round 2).After collecting the first-round scores, the research coordinators conducted statistical analysis of the triangular fuzzy numbers for each evaluation, calculating measures such as mean, median, and dispersion indices (e.g., standard deviation or interquartile range). An anonymous feedback report was then distributed to all experts. This report included: (1) a statistical summary of group evaluations for each item; (2) the individual expert’s own previous score; and (3) for items with high dispersion, anonymous justifications provided by experts who had given extreme ratings (highest and lowest).Step 4: Iterative revision and consensus building.After reviewing the feedback report, experts reconsidered and refined their initial judgments in light of the group consensus and the reasoning of others. They could either maintain their original scores with additional justification or adjust their ratings toward group consensus. This iterative process was repeated until the dispersion of expert opinions for all evaluation items (measured, for example, by the coefficient of variation) fell below the predefined threshold of 0.15, and the mean ratings stabilized across two consecutive rounds. This indicated that an acceptable level of consensus had been achieved. Through this rigorous iterative process, the final aggregated evaluation values were obtained and used to construct the initial direct influence matrix B, thereby enhancing the objectivity of the data and the robustness of the study’s conclusions.The evaluation grades of experts are transformed into triangular fuzzy numbers, and is used to express the scoring result of the influence degree of the i-th factor on the j-th factor in the factor set by the k-th expert, where . The CFCS method is applied to defuzzification.
- (1)
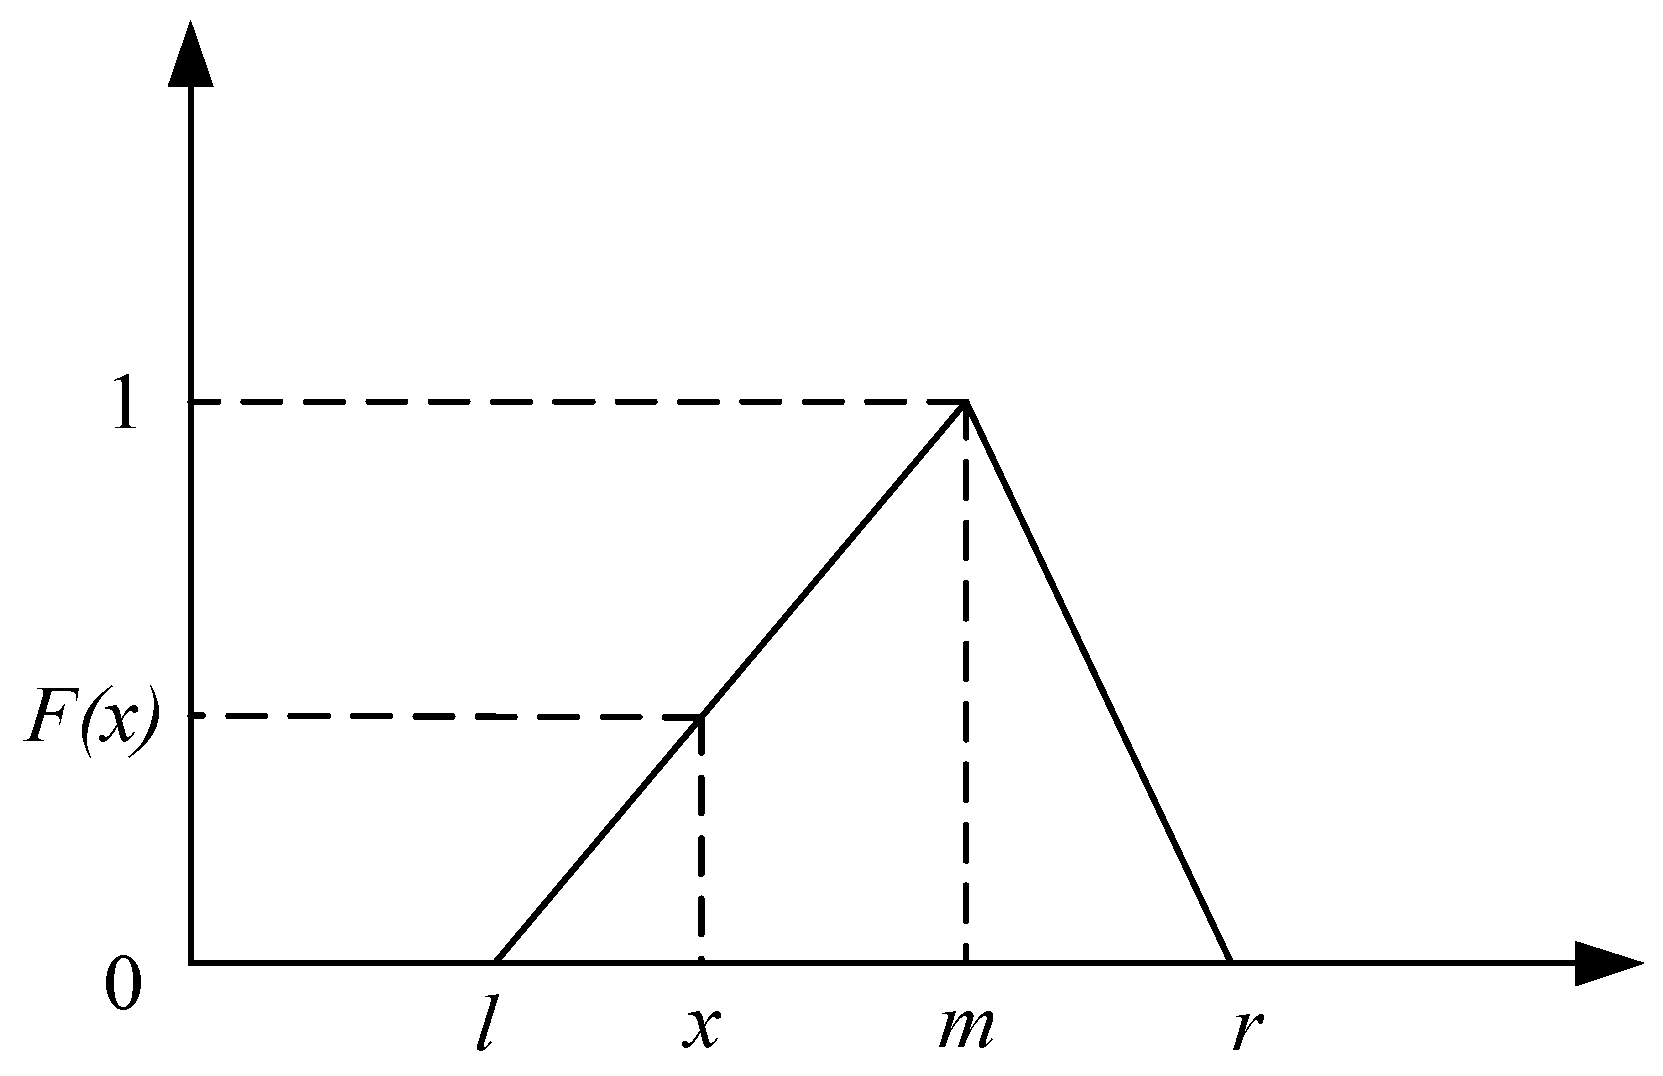
- Normalization processing of triangular fuzzy numbers. For the structural form of triangular fuzzy numbers, the process is shown in Formulae (3)–(5):
- (2)
- Calculate the standard value of triangular fuzzy number. After converting the normalized triangular fuzzy number to the left standard value and the right standard value , calculate the total standard value , as shown in Formulae (6)–(8):
- (3)
- Defuzzification. The score result of the k-th expert regarding the influence degree of the i-th factor on the j-th factor is calculated and converted to the clear value , as shown in Formula (9):According to the above steps, after the fuzzy scores of all experts on the influence degree of the i-th factor on the j-th factor are converted to clear scores, the average value of the scores of the i-th factor on the j-th factor is calculated by using Formula (10). The influence values among the factors after defuzzification are filled into the matrix to construct the direct influence matrix B, as shown in Formula (11).
- Establish a normalized influence matrix G. Normalize the direct influence matrix B by using the row sum maximum normalization method to obtain a normalized direct influence matrix G, as shown in Formula (12).
- Calculate the comprehensive influence matrix D. The comprehensive influence matrix represents the direct influence and indirect influence relationship between all factors, and the calculation process is shown in Formula (13).where I is the identity matrix.
- Based on the comprehensive influence matrix D, the influence degree (ei), affected degree (fi), centrality (Mi), and causality (Ni) of each factor can be calculated. The influence degree ei represents the total impact of a single factor on all other risk factors. A larger value indicates that the factor has a stronger driving force on the overall system. The calculation formula is expressed as follows:
- The affected degree (fi) represents the total influence that an individual factor receives from all other risk factors. A larger value indicates that the factor is more susceptible to the influence of other factors. The calculation formula is expressed as follows:
- The centrality (Mi) represents the overall importance of an individual factor within the entire complex system. It is obtained as the sum of its influence degree and affected degree. A larger value of Mi indicates that the factor has a greater impact on the overall changes in the system. The calculation formula is expressed as follows:
- The causality (Ni) represents the tendency of an individual factor in terms of its influencing attributes. It is obtained as the difference between its influence degree and affected degree. A larger value of Ni indicates that the factor is more likely to act as a driving element within system changes. If Ni > 0, factor i is classified as a cause factor; otherwise, it is regarded as an effect factor. The calculation formula is expressed as follows:
- Generate the reachable matrix K. Combine the comprehensive influence matrix D with the identity matrix I to establish the overall influence matrix O, and consider that the influence degree between some factors is small, introduce a threshold λ to optimize the matrix O, λ is the sum of the matrix of the comprehensive influence matrix D and the standard deviation. Use the Formula (19) to transform the elements in the matrix to obtain the reachable matrix K. The calculation formulas are as follows:
- Divide factor hierarchy. Reachability set Li consists of factors corresponding to columns with median 1 in each row of reachability matrix K; antecedent set Qi consists of factors corresponding to rows with median 1 in each column of reachability matrix K. If there is a certain factor hi satisfying Formula (20), it indicates that hi is the highest level factor, and then delete the rows and columns corresponding to factor hi from the reachability matrix. Repeat the above operations to form the final hierarchical structure.
- Construct factor association structure. When the value of the i-th row and the j-th column in the reachability matrix is 1, it represents that there is a directional connection between factors i and j, and the directional connection line is drawn according to the result of factor stratification, and the redundant cross-stage transmission path is transitively simplified, and finally the visualization of association relationship is realized.
- Bayesian network model transformation. Mapping the constructed association structure to Bayesian network, determining the corresponding nodes and directed edges, establishing Bayesian network structure. Obtaining the root node prior probability according to expert experience knowledge, introducing Noisy-orgate model to calculate the conditional probability table of the whole network, and carrying out inference analysis.
- Association degree calculation. Combined with the inference function of Bayesian network, according to the probability distribution of child nodes before and after the change in parent node state, select “Euclidean” as the distance function [25] to calculate the association degree between nodes.
4. Safety Risk Evolution Model of Hydraulic Tunnel TBM Construction Based on System Dynamics
4.1. Modeling Purposes and System Boundaries
4.2. Causal Relationship Diagram
4.3. Stock Flow Diagram
4.4. Model Parameters and Equations
- Determine the weight of safety risk indicatorsBefore constructing and operating the safety risk evolution model for hydraulic tunnel TBM construction, it is necessary to determine the weight values of each index. The weights are calculated by combining subjective and objective methods. The subjective weights are based on the fuzzy DEMATEL method, and the centrality is used to measure the comprehensive importance of each factor in the system. The objective weight calculation adopts the entropy weight method, and the degree of variation is calculated based on the information entropy of the index. Ultimately, the game theory combined weighting method is adopted to coordinate the differences between the subjective and objective weights.
- (1)
- Fuzzy DEMATEL method to determine subjective weightsAccording to the fuzzy DEMATEL calculation method in Section 2.2, the centrality Mi is obtained, and the weight calculation formula is shown in Formula (21).
- (2)
- Entropy weight method to determine objective weightThe importance of an indicator is determined by information entropy. The greater the information entropy of an indicator, the higher the uncertainty of the data, and its weight relatively decreases. Conversely, the weight is relatively high. The specific calculation process is as follows:Set m objects and n indexes to construct the original matrix , as shown in Formula (22).Use Formulae (23) and (24) to dimensionalize indicators of different attributes and standardize the original matrix . For positive indicators:For negative indicators:After the processing is completed, the standardized judgment matrix is obtained, as shown in Formula (25).According to the basic principle of information entropy, the entropy value of the j-th index is calculated from Formulae (26) and (27).Then the objective weight of the j-th indicator is
- (3)
- Game Theory Combinatorial WeightsThe set of weight values calculated by each weight method is , where L represents the number of weight methods used, n represents the number of indicators, and the combination coefficient is . The calculation formula of comprehensive weight is shown in (29).The objective function after optimization of the combination coefficient is shown in Formula (29), and its optimized first-order derivative is transformed into a linear equation system, as shown in Formula (30).The objective function after optimization of the combination coefficient is shown in Formula (30), and its optimized first-order derivative is transformed into a linear equation system, as shown in Formula (31).The convergence of the game-theory-based combination weighting method is strictly guaranteed by its mathematical derivation process. The linear system of equations (Formula (31)) originates from the quadratic objective function (Formula (30)), which minimizes the difference between the comprehensive weight vector and the weight vectors obtained from individual weighting methods. Since the Hessian matrix of the objective function is positive definite, the system is ensured to have a unique solution. This unique solution represents the optimal combination coefficients, indicating that the computation process has reached convergence. Subsequently, by normalizing this solution vector (Formula (32)), the final optimal comprehensive weights can be obtained.
- Determination of risk correlation coefficientIn the previous section, a risk correlation analysis was conducted based on the fuzzy DEMATEL–ISM–BN approach, where the Euclidean distance function was adopted to calculate the degree of association between nodes. This metric quantifies the absolute magnitude of the influence exerted by a parent node on its child node by computing the Euclidean distance between the child node’s probability distribution vectors before and after the parent node’s state change. It is particularly suitable for identifying critical influence paths. Compared with measures such as Kullback–Leibler divergence, which emphasize differences in information or relative entropy between probability distributions, Euclidean distance offers greater advantages in intuitively representing the magnitude of influence. Moreover, its computational simplicity ensures analytical efficiency in large-scale networks and facilitates integration with system dynamics models in subsequent analyses.
- System dynamics equationsDetermine the function expression of each variable in time dimension to quantitatively describe the dynamic interaction among safety risk factors of hydraulic tunnel TBM construction. According to different variable types, determine the system dynamics equation as shown in Formulae (31)–(35):Rate variable = ∑(state variable × correlation coefficient)State variable = INTEG (speed variable, initial risk value)Auxiliary variable = ∑(state variable × weight)
4.5. Identification and Handling of Conflicting Causal Chains
4.6. Model Operation and Analysis
5. Example Analysis
5.1. Project Overview
5.2. Correlation Analysis of Safety Risks in Hydraulic Tunnel TBM Construction
5.2.1. Risk Factor Analysis Based on Fuzzy DEMATEL
- (1)
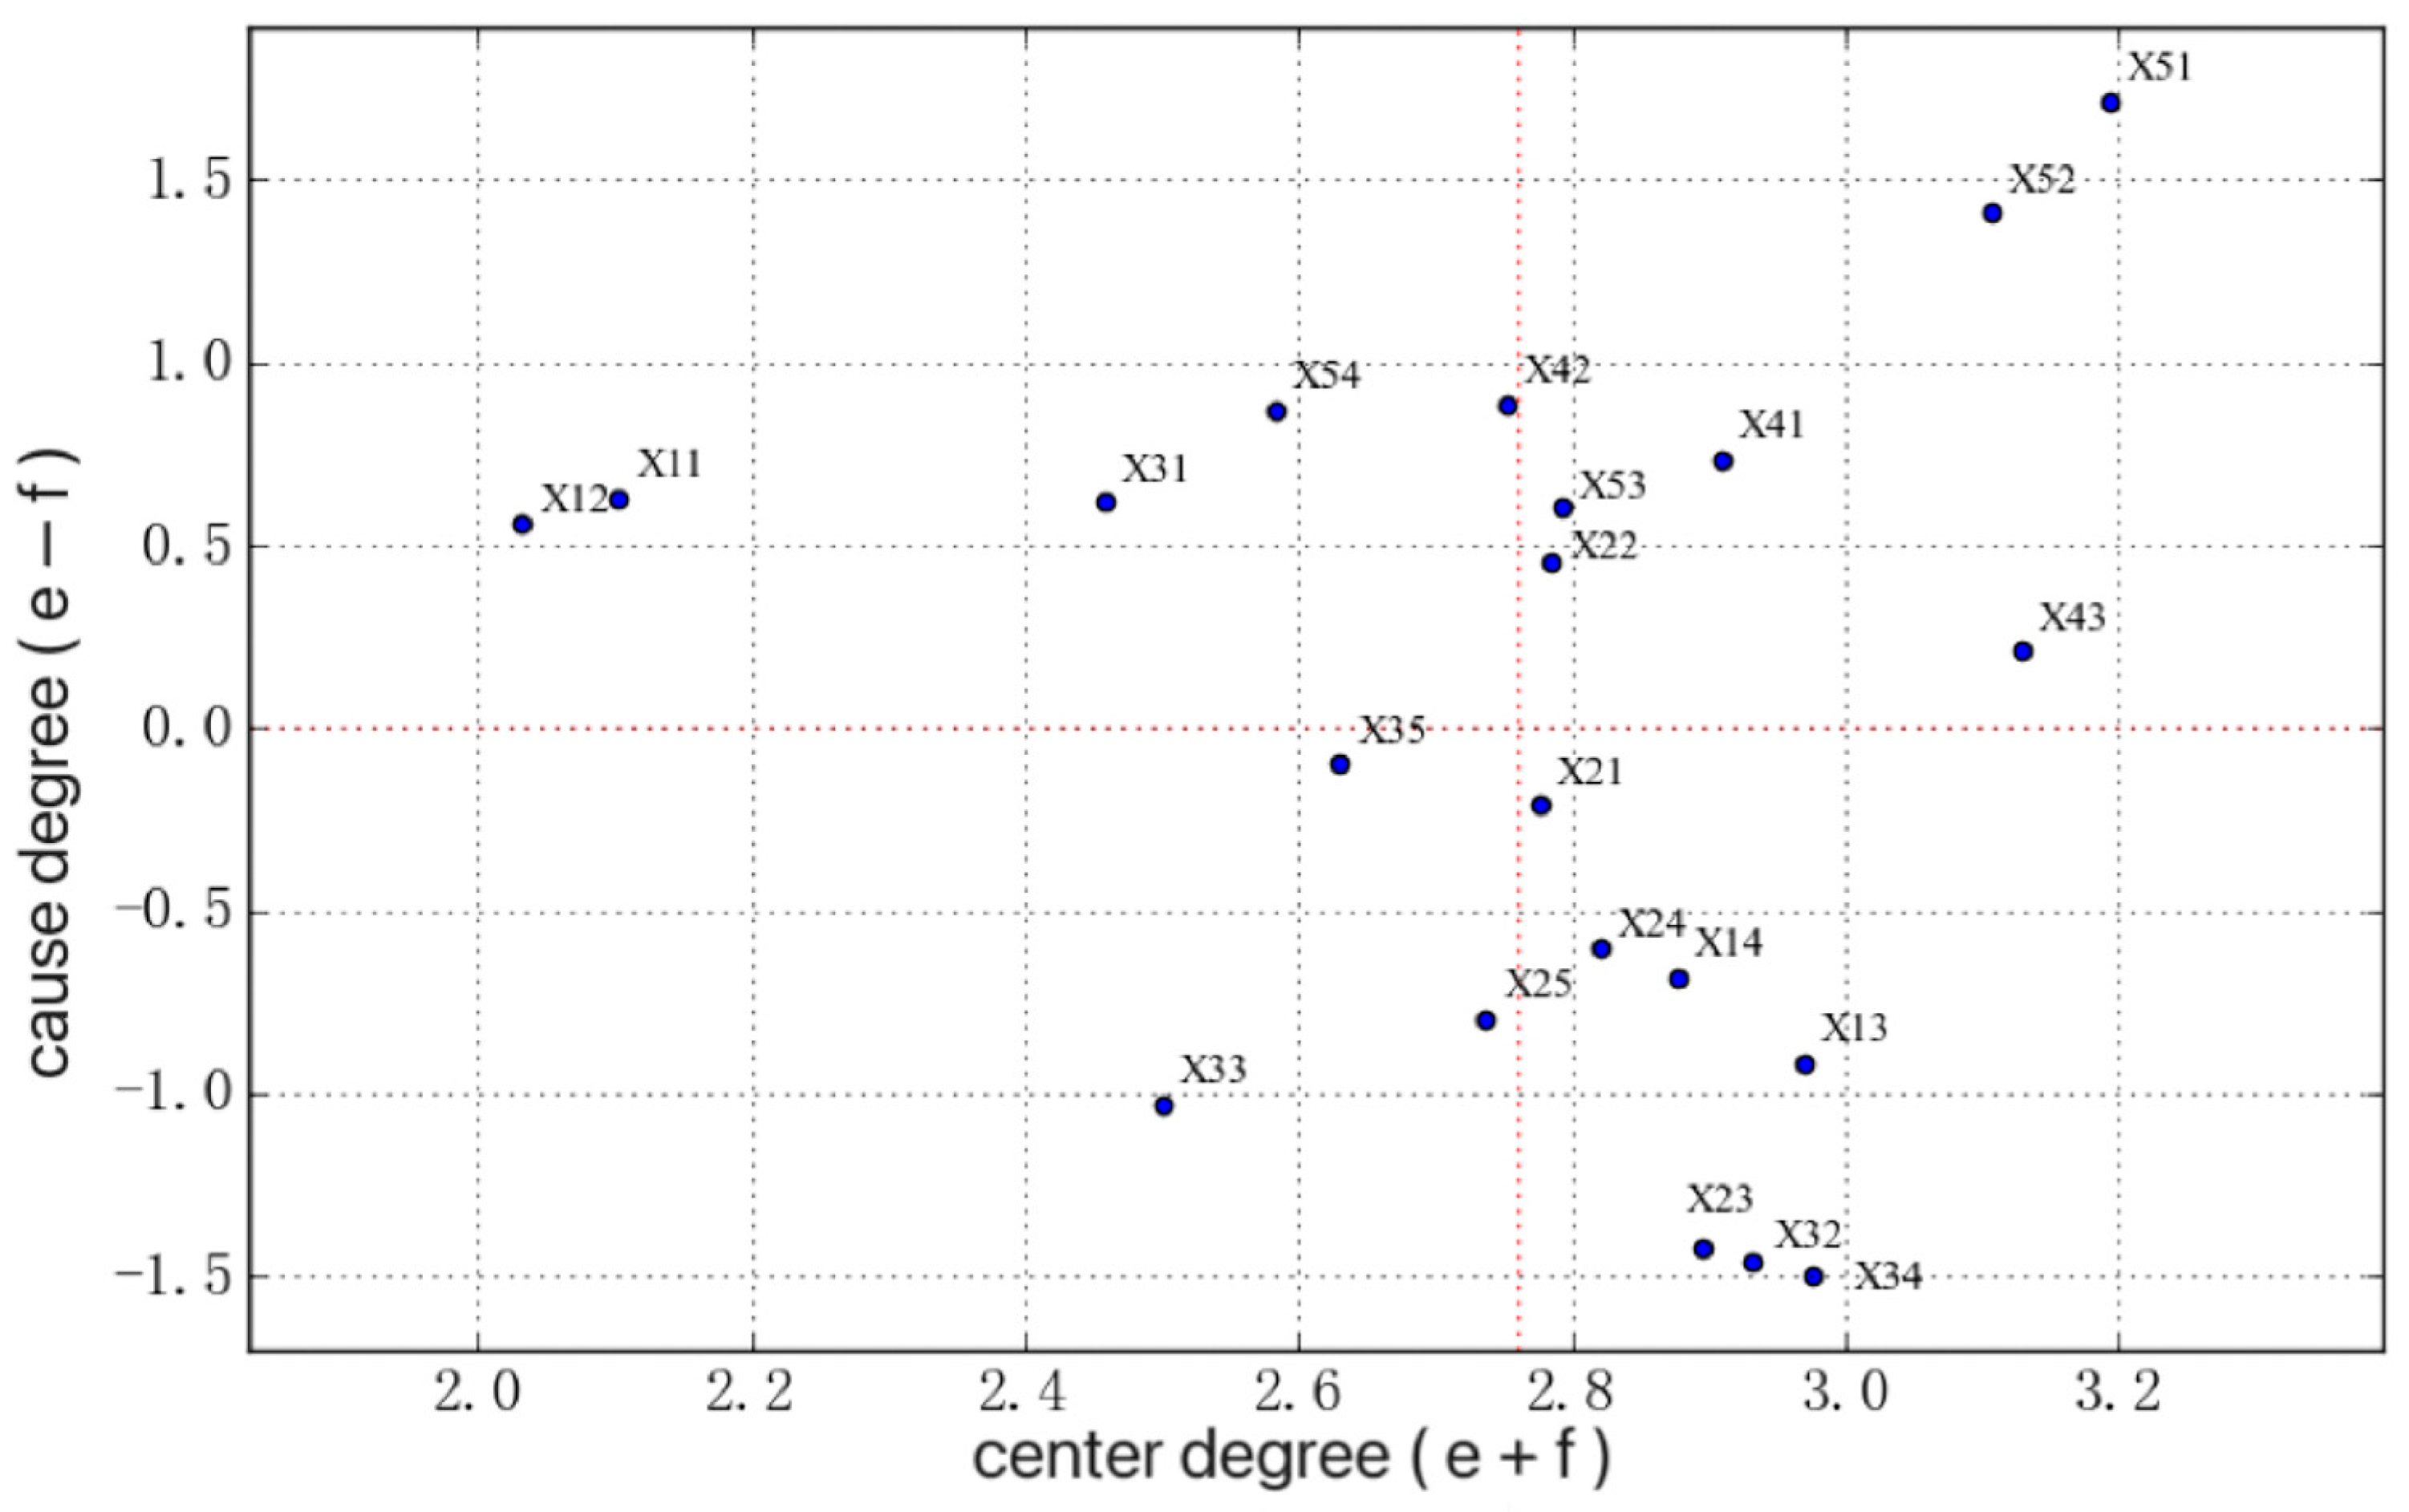
- Using the comprehensive influence matrix D and combining Formulae (14)–(17), calculate the influence degree ei, affected degree fi, center degree Mi and cause degree Ni of each risk index. The calculation results are shown in Table 5.
- (2)
- According to the above calculation results, draw a risk index causality diagram with centrality as horizontal axis and causation as vertical axis, as shown in Figure 3. Centrality indicates the comprehensive influence of factors in the system, and the larger the value, the more significant the overall influence of the factor on the system; when the causation degree is positive, it is classified as cause factor, indicating that the factor has greater influence on other factors, and vice versa, it is classified as result factor.In the horizontal dimension, elements with larger centrality values are distributed further to the right, including X51, X52, X43, X34, etc. These nodes have a strong influence in the network and threaten the construction safety of the tunnel from multiple aspects. As can be seen from Table 5 and Figure 3, there are a total of 11 cause factors. Among them, the top 5 in terms of cause degree are: incomplete management system, failure to implement safety training and technical briefings, weak safety awareness, unreasonable personnel allocation and insufficient technical level. Implementing targeted preventive measures for these cause factors can achieve the source blocking of construction safety risk governance.
5.2.2. Construction of Risk Correlation Structure Based on ISM
- (1)
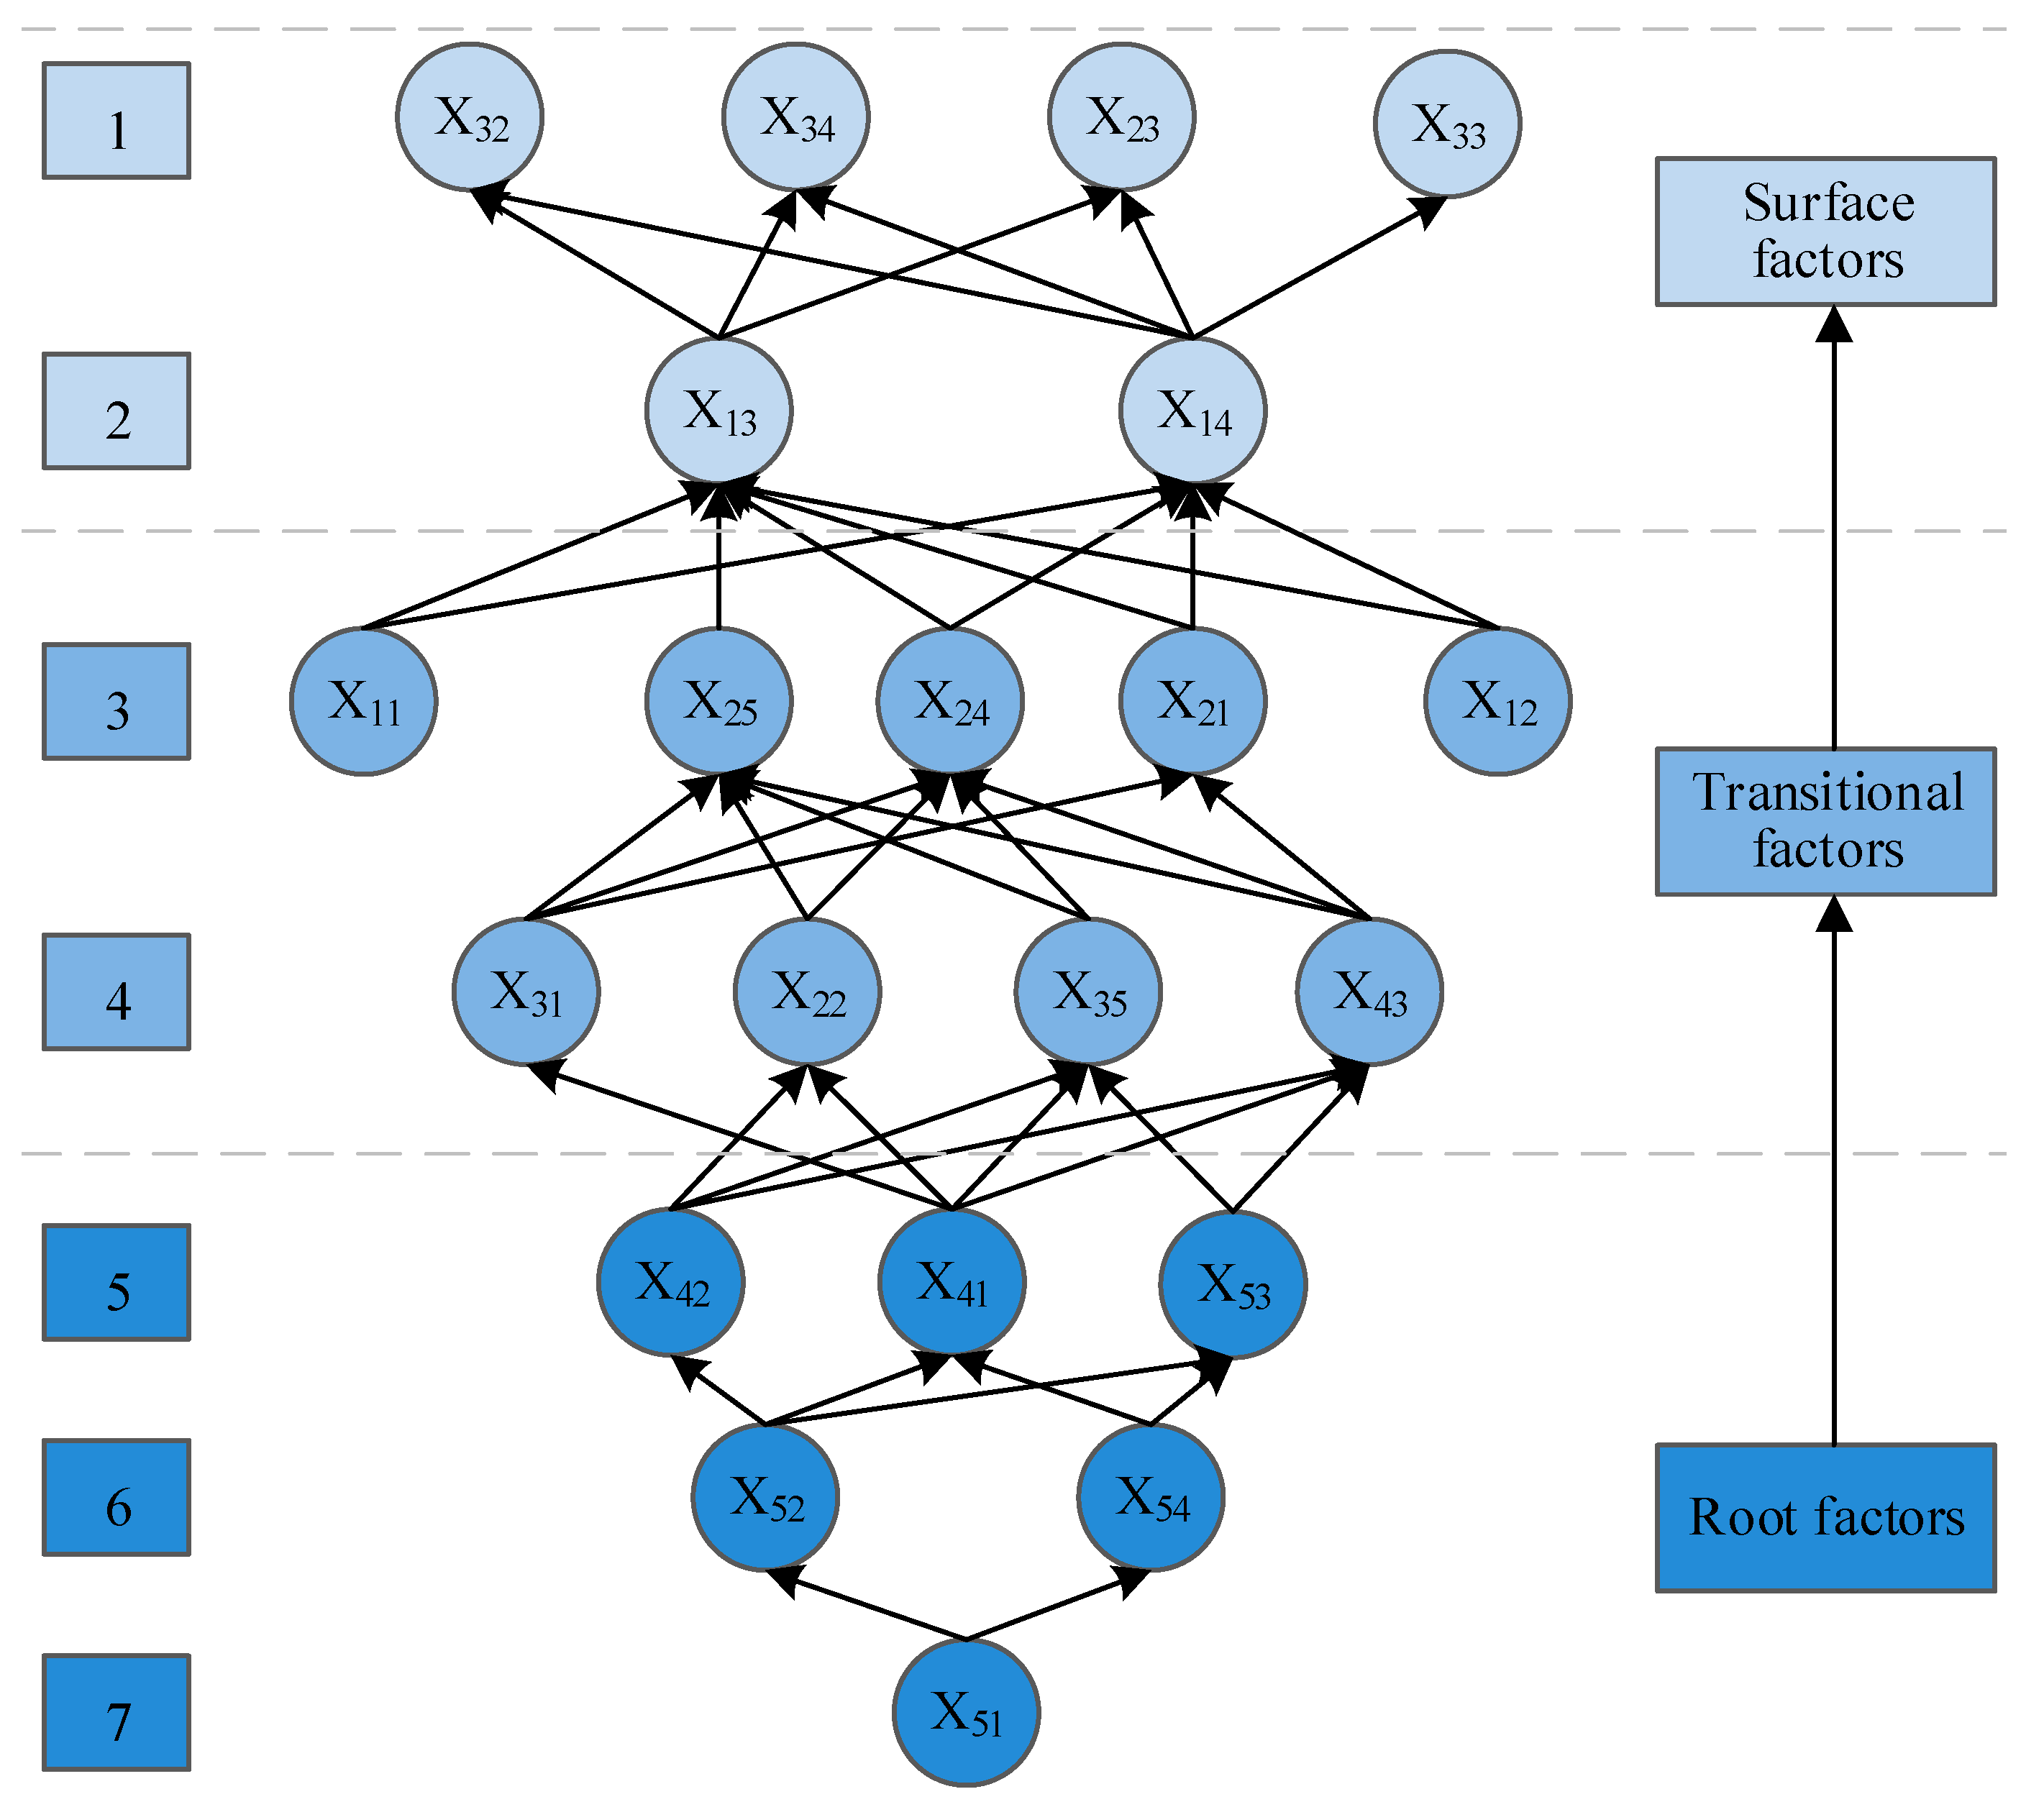
- The root factors include X51, X52, X54, X41, etc., which are the initial causes that trigger the associated transmission of risks and affect construction safety. Prioritizing the control of root causes before construction can reduce risks at the lowest cost.
- (2)
- Transition factors are the key intermediate links in the process of risk correlation transmission, which play the role of risk amplification or buffer, mainly manifested as technical risk factors.
- (3)
- Surface factors refer to specific events or phenomena that cause actual losses such as safety accidents and construction halts after the associated transmission of risks, such as specific abnormal issues like X32, X34, X23, and X33. For instance, the instability and deformation of the surrounding rock of X13 not only directly threaten the lives and safety of personnel, but also can cause the shield to get stuck or the excavation to deviate from the axis. The characteristics of surface factors are directness, observability and urgency, and they can be controlled through real-time monitoring and emergency measures.
5.2.3. Calculation of Risk Correlation Degree Based on ISM–BN
- (1)
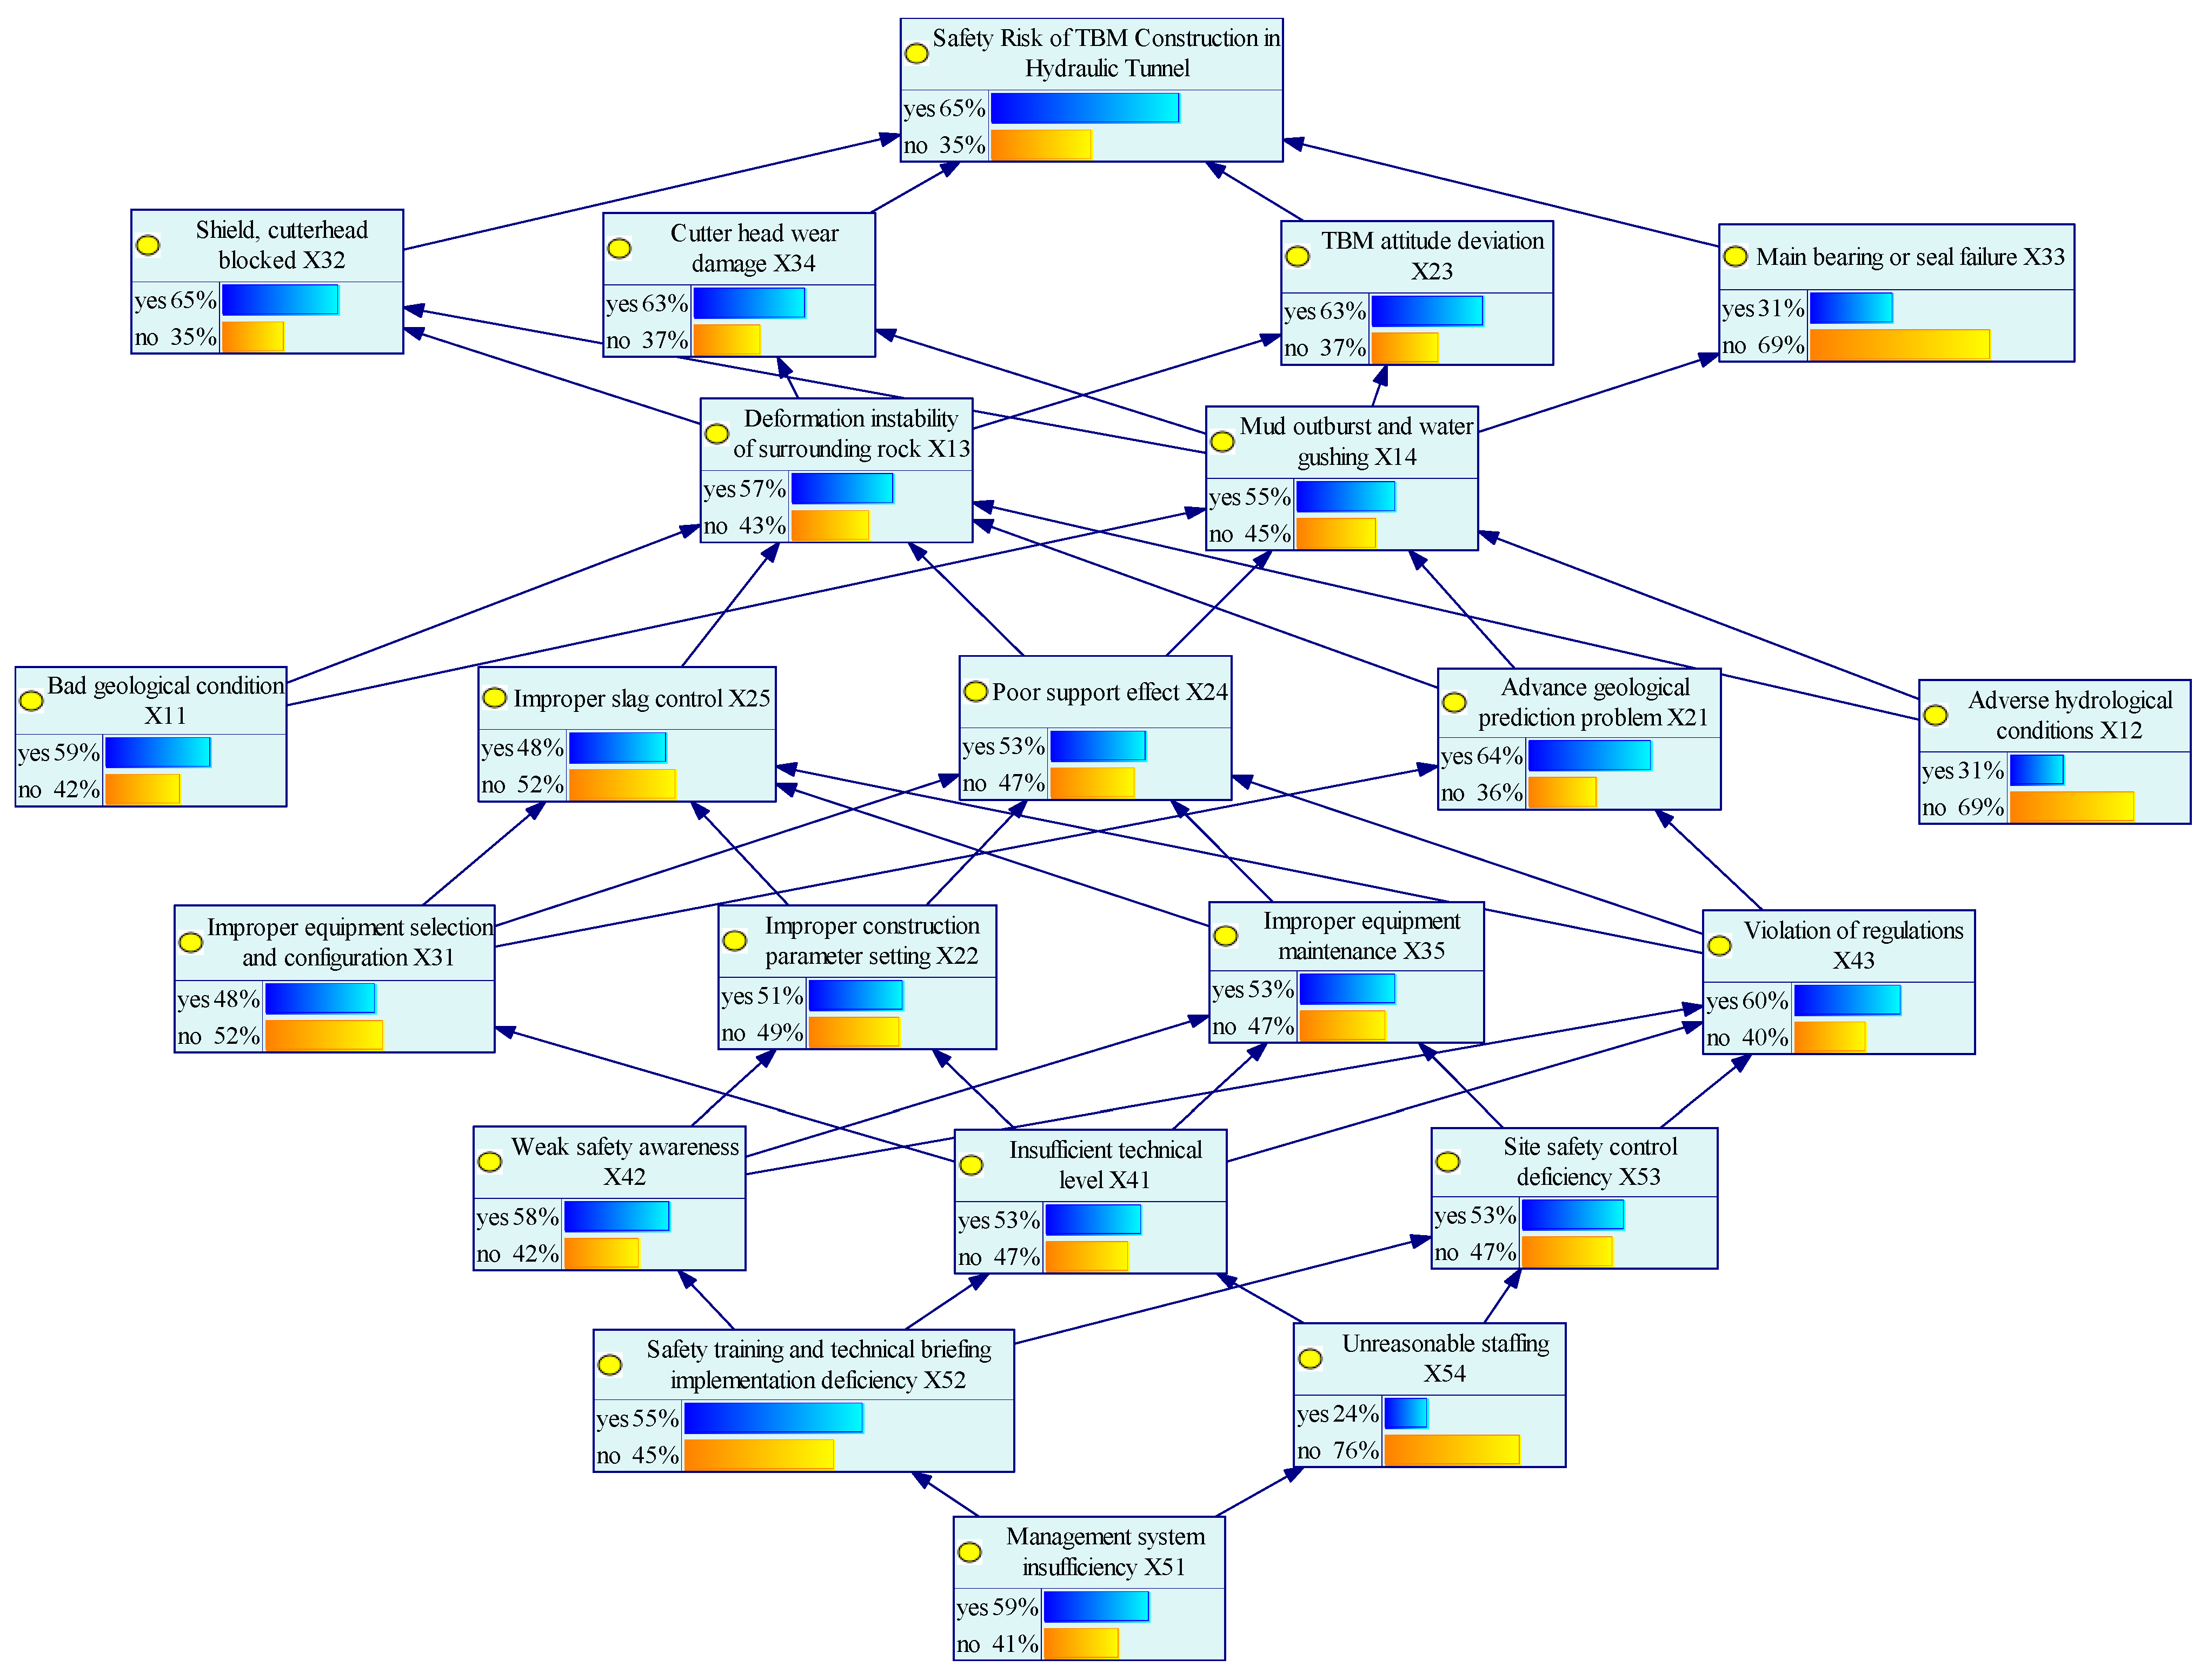
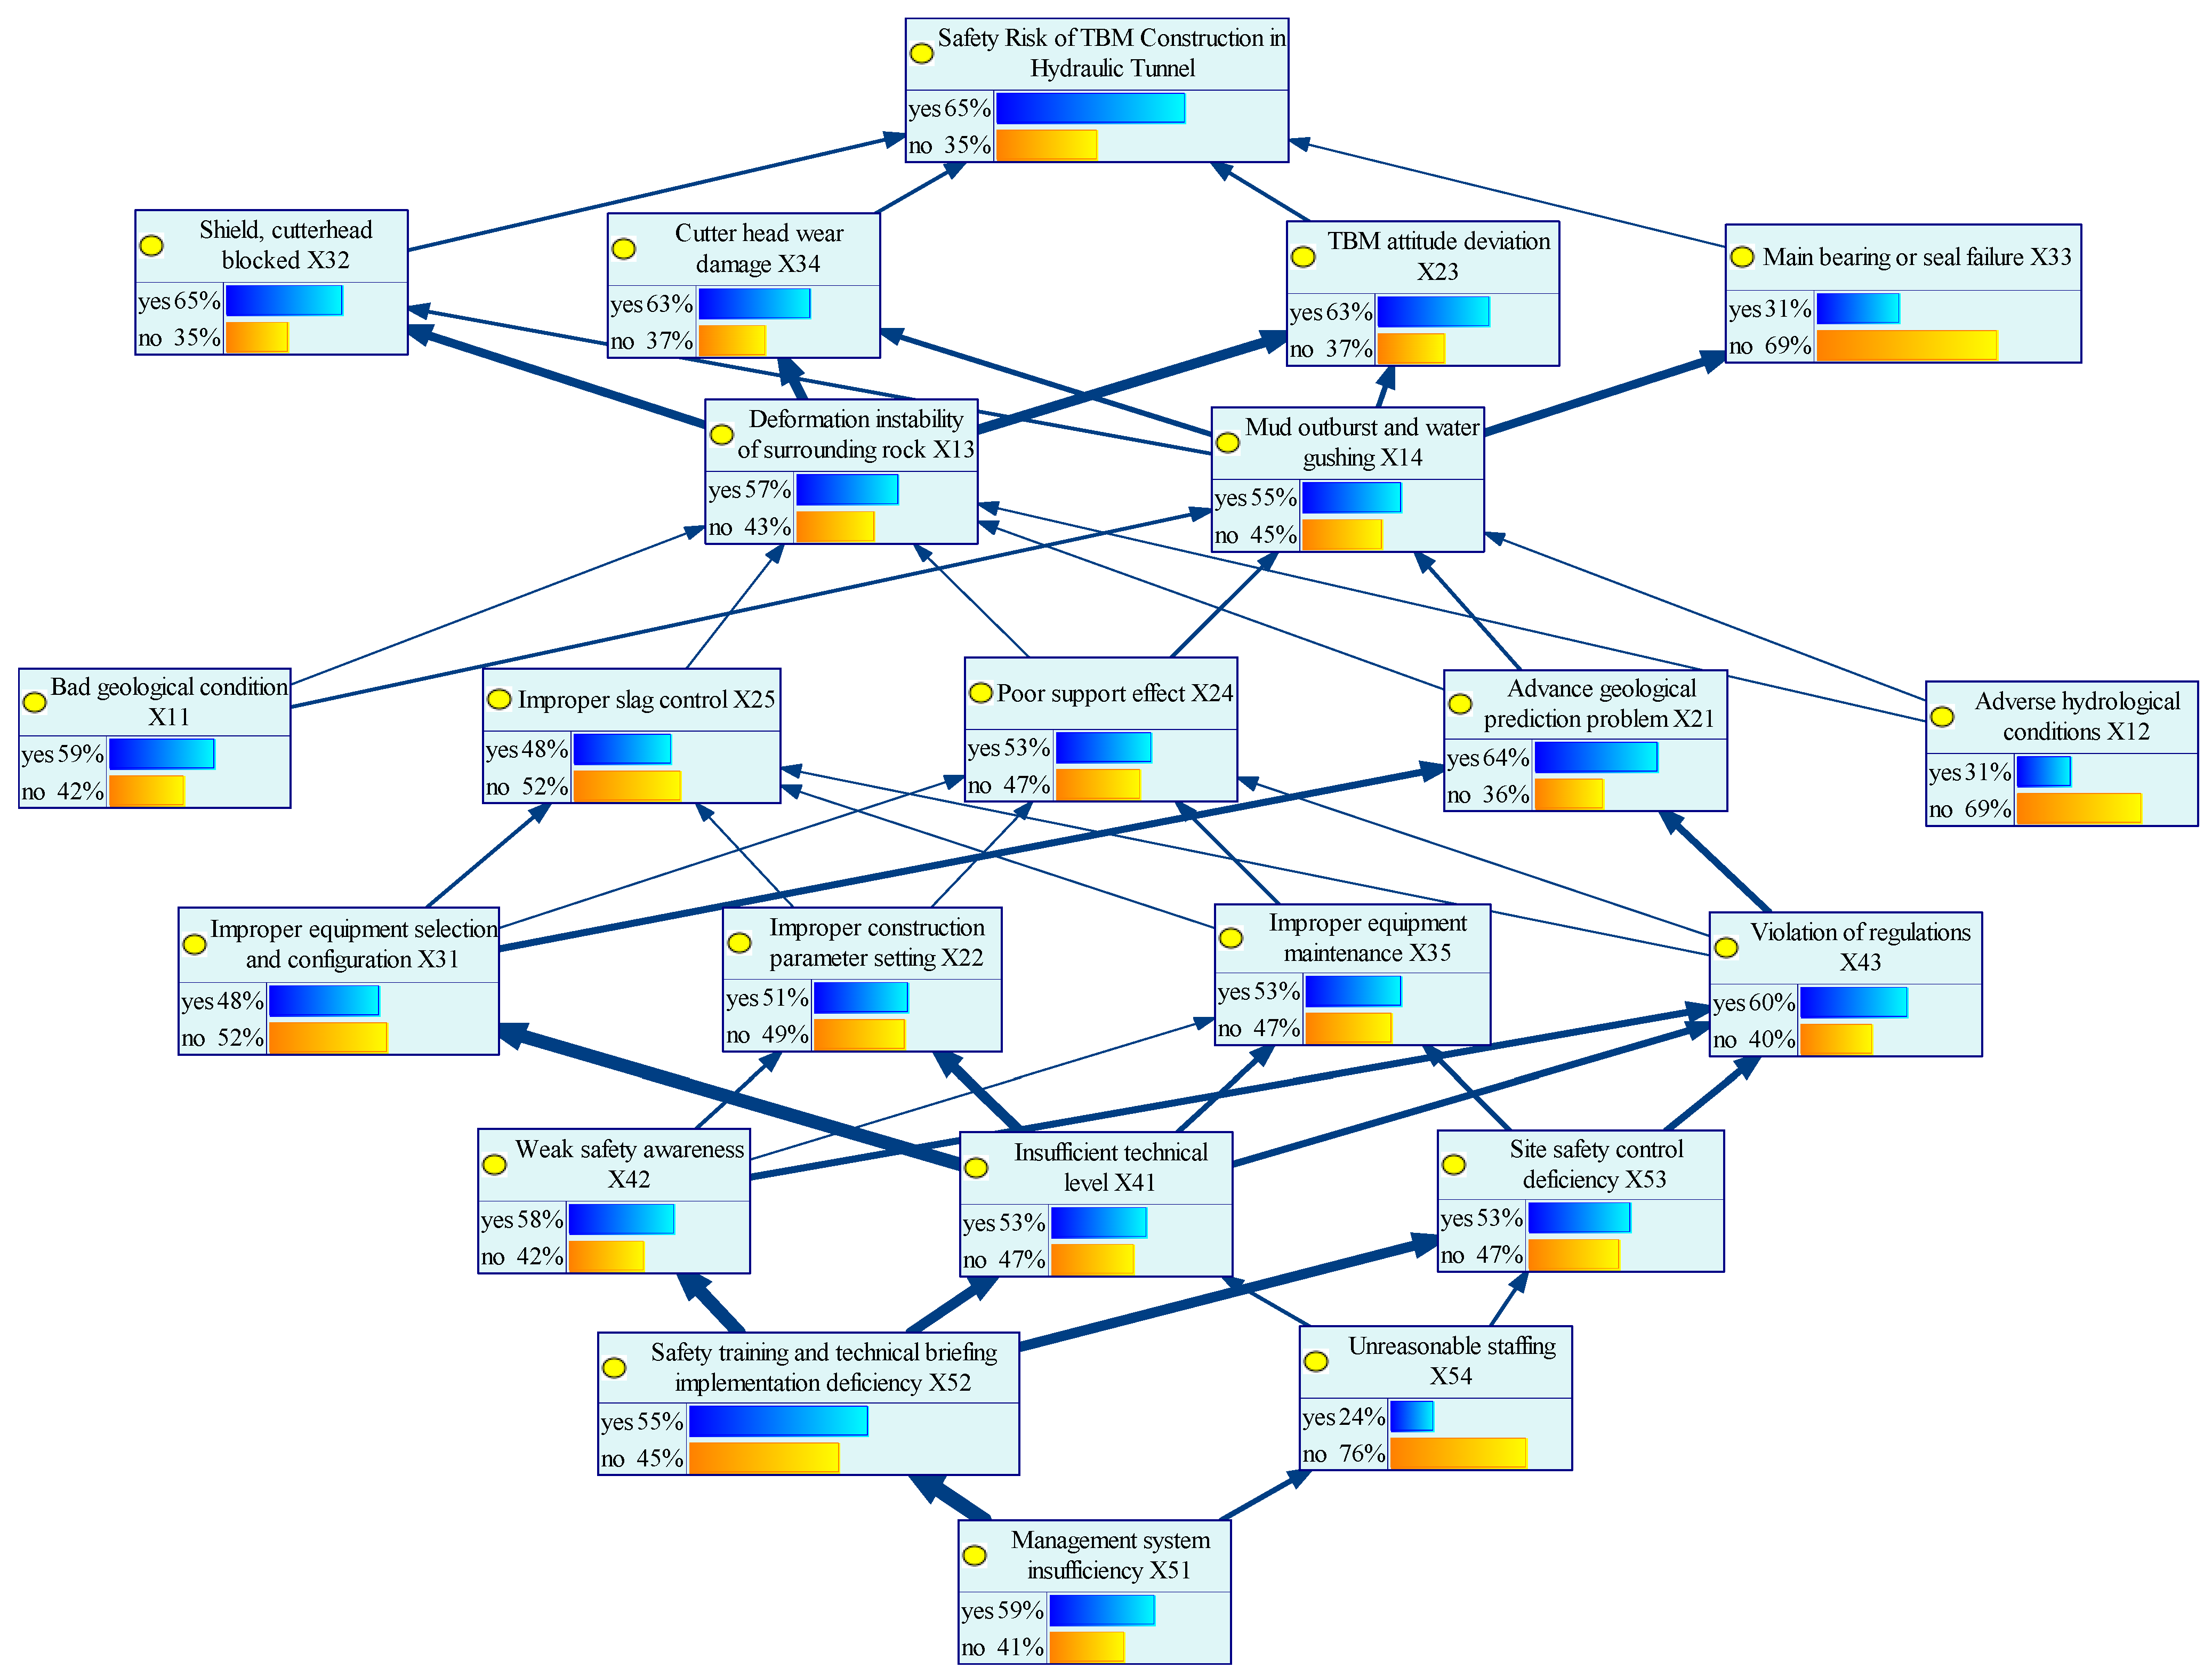
- Positive causal reasoningBased on the discussion in Section 3.3, the occurrence probabilities of risk factors were assessed by integrating expert knowledge, historical experience, TBM construction case data, and professional expertise. According to the prior probability grading criteria for root nodes and the corresponding fuzzy numbers, experts’ natural language evaluations were processed using Formulae (4) and (11). This yielded the prior probabilities for root nodes including X11 adverse geological conditions, X12 unfavorable hydrogeological conditions, and X51 inadequate management systems. For non-root nodes, the Noisy-or gate model was employed to calculate the probability of child nodes occurring under any given parent node state, thereby generating the conditional probability tables (CPTs).In the GeNIe4.1.3402 software, the calculated probability parameters were input into the corresponding nodes of the Bayesian network (BN) model for safety risk analysis of hydraulic tunnel TBM construction, completing the parameter learning process. Through forward causal inference, the posterior probability distributions of 18 risk factors were obtained. The occurrence probability data of all factors were then exported and summarized, with the inference results presented in Figure 5.The forward inference results of the model indicate that the probability of construction safety risk occurrence in the AY project is 0.6517, with 77% of the node probabilities falling within the range of 0.5–0.7. This value suggests that the system operates at a relatively high risk level. Among the root risks, inadequate management systems (X51) exhibited the highest risk index, approximately 0.59, implying that it may represent a major contributor to the overall system risk. These indices provide a quantitative basis for identifying critical risk domains. Among non-leaf nodes, the basic event corresponding to the minimum occurrence probability of 0.239 is unreasonable staffing of X54, which is consistent with the actual staffing situation of the project and meets the construction requirements. However, the occurrence probability of violations is relatively high, and training and supervision efforts still need to be continuously increased. The maximum value of X34 cutterhead and shield blocked is 0.6494, which is affected by the actual geological conditions of the project. The TBM construction area of AY Project includes shallow buried and highly weathered sections and fault fracture zones, which is easy to cause collapse and block loss, resulting in TBM jamming. Geological prediction shall be strengthened during construction, and preventive measures such as advance grouting shall be taken to fully deal with the tunnel sections under adverse conditions.
- (2)
- Degree of association calculationReferring to step (9) in Section 3.3, the Euclidean function is used in the GeNIe software to calculate the degree of association between factors, and the results are visually expressed through the thickness of the transfer path. The width of the directed edge represents the degree of association. The wider the line, the greater the degree of association, as shown in Figure 6. Encode the risk association path. For example, when X13 is passed to X23, it becomes “TF1113”. The specific association degree values are shown in Table 6. From the analysis of the calculation results, it can be seen that the most significant correlation is between the incomplete management system of X51 and the failure to implement safety training and technical briefings of X52, representing the close connection between the two.
5.2.4. Validation of Bayesian Network Probabilities
- Structural logic validation.The structure of the BN (i.e., the causal relationships among risk factors) was not arbitrarily defined but was strictly derived from the hierarchical model established through fuzzy DEMATEL and ISM analysis. The ISM method itself, based on rigorous matrix operations, guarantees logical consistency of the constructed causal pathways and the absence of cyclic loops. This systematic structural modeling process provided a validated logical framework for subsequent probability assignments and represents the first step in probability validation.
- Cross-validation and convergence testing of input parameters.The input probabilities of the model, including prior probabilities for root nodes and conditional probability tables (CPTs), were primarily derived from expert knowledge. To ensure their reliability, the following measures were taken:
- (1)
- Consensus on prior probabilities. The prior probabilities of root nodes (e.g., X51 —inadequate management systems) were not determined by a simple average of one-time expert ratings. Instead, a modified Delphi method was adopted, incorporating multiple rounds of anonymous feedback and statistical analysis to guide the expert group toward consensus. This ensured convergence and stability of the input values and effectively reduced the impact of individual biases.
- (2)
- Simplification and validation of conditional probabilities. Given the difficulty and error-proneness of directly eliciting large CPTs, this study applied the widely used Noisy-or gate model in risk analysis. This model decomposes complex conditional probabilities into a set of single-causal influence probabilities that are easier for experts to understand and assess, thus reducing cognitive load. During parameterization, experts were invited to evaluate the “leak probabilities” and “causal influence strengths” of key nodes, and cross-checking was conducted to validate the internal consistency of their assessments.
- Validation of output results.Upon model construction and forward inference, the posterior probability results (see Figure 6) were subjected to validity checks:
- (1)
- Comparison with real project data. The model outputs—particularly high-probability risk nodes (e.g., X34—cutterhead wear and damage, probability = 0.6494) and critical influence paths—were compared with the AY project’s construction logs, technical meeting minutes, and interviews with site engineers. The results demonstrated high consistency between the identified risks and the actual challenges encountered in practice (e.g., severe cutterhead wear and TBM jamming during excavation through shallow-buried, heavily weathered strata and fault fracture zones). This consistency with real-world conditions provides strong macro-level validation of the model outputs.
- (2)
- Scenario analysis and sensitivity testing. “What-if” scenarios were designed to examine the logical responsiveness of the model. For instance, when the probability of “X51—inadequate management systems” was artificially set to a very low value (simulating an ideal management condition), the downstream risks such as “X52—insufficient safety training” and “X54—unreasonable personnel allocation” showed significant probability reductions, ultimately lowering the overall system risk level. The model’s behavior fully aligned with logical expectations, thereby validating the reasonableness of probability propagation throughout the network from a dynamic perspective.Finally, it is important to emphasize that since the input parameters were derived mainly from expert judgment rather than large-scale frequency statistics, the model outputs should be interpreted as a Risk Index or Relative Metric rather than absolute probabilities of occurrence. The primary value of the BN model lies in supporting trend analysis, key risk identification, and scenario comparison, rather than providing exact objective probability predictions. Through this multi-dimensional validation process, the BN model and its probability parameters are shown to offer reliable and insightful decision support for safety risk management in hydraulic tunnel TBM construction.
5.3. Simulation Analysis of Safety Risk Evolution in TBM Construction of Hydraulic Tunnels
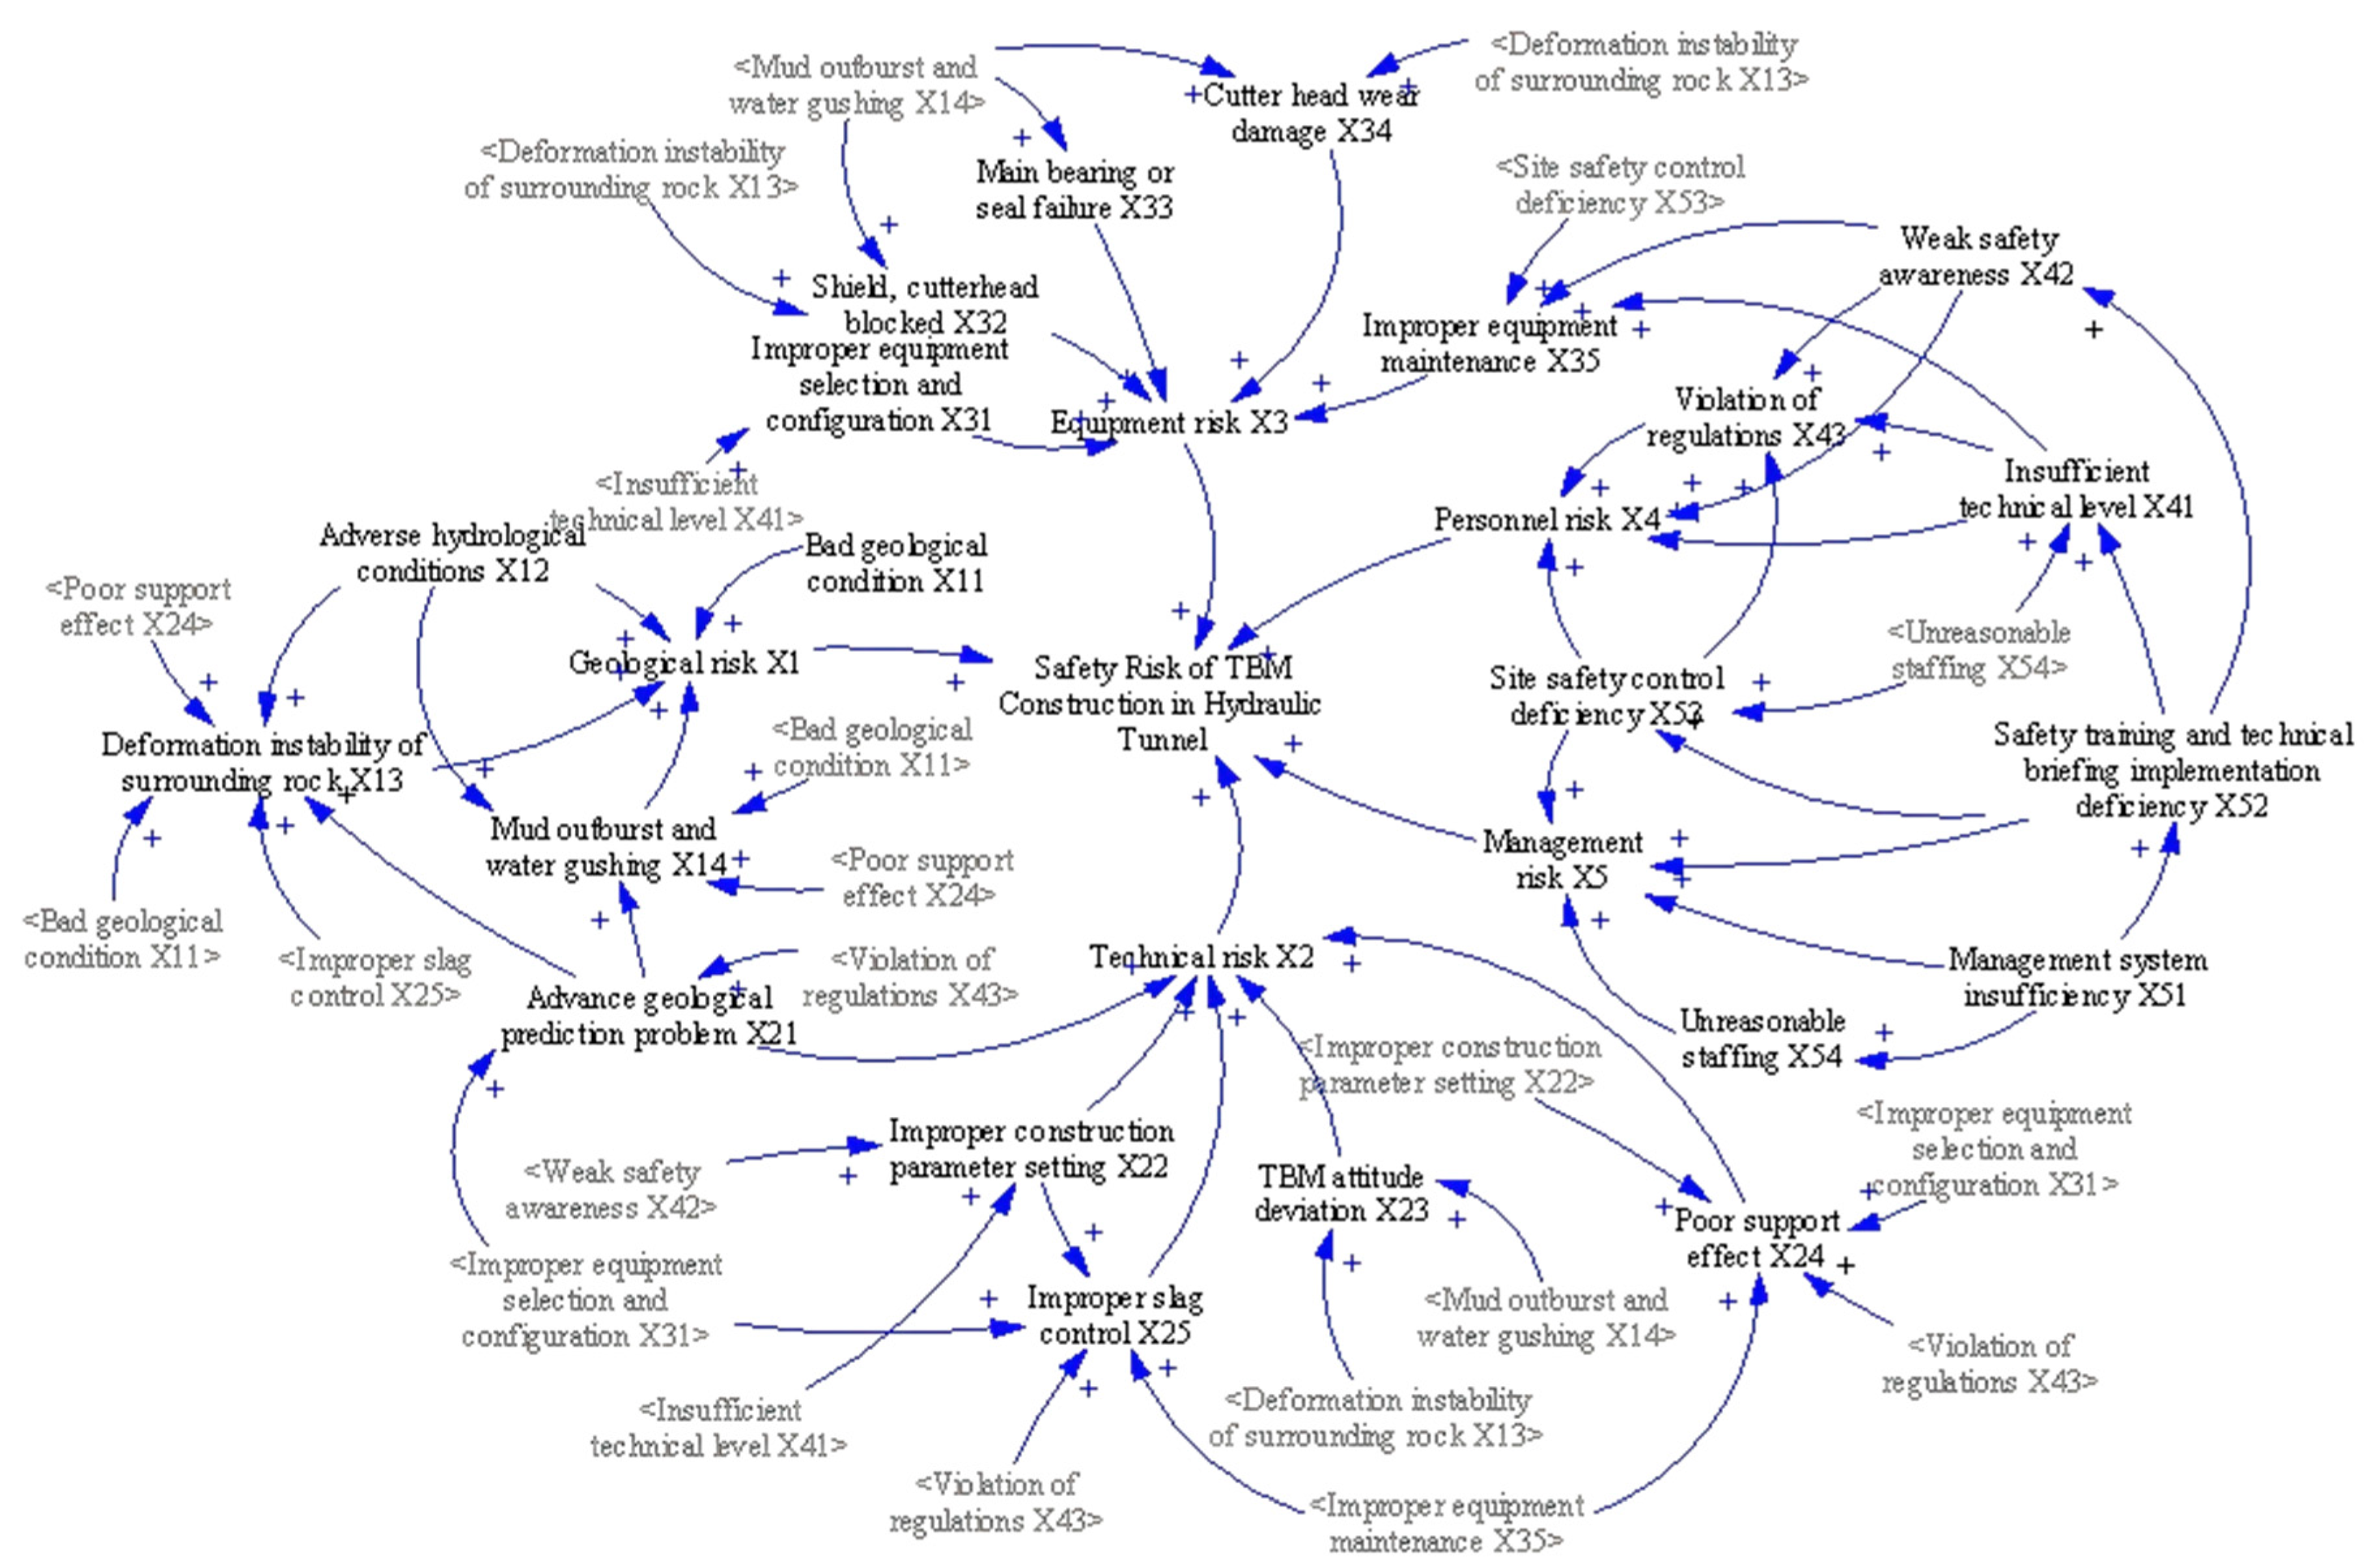
5.3.1. Causality Diagram Establishment
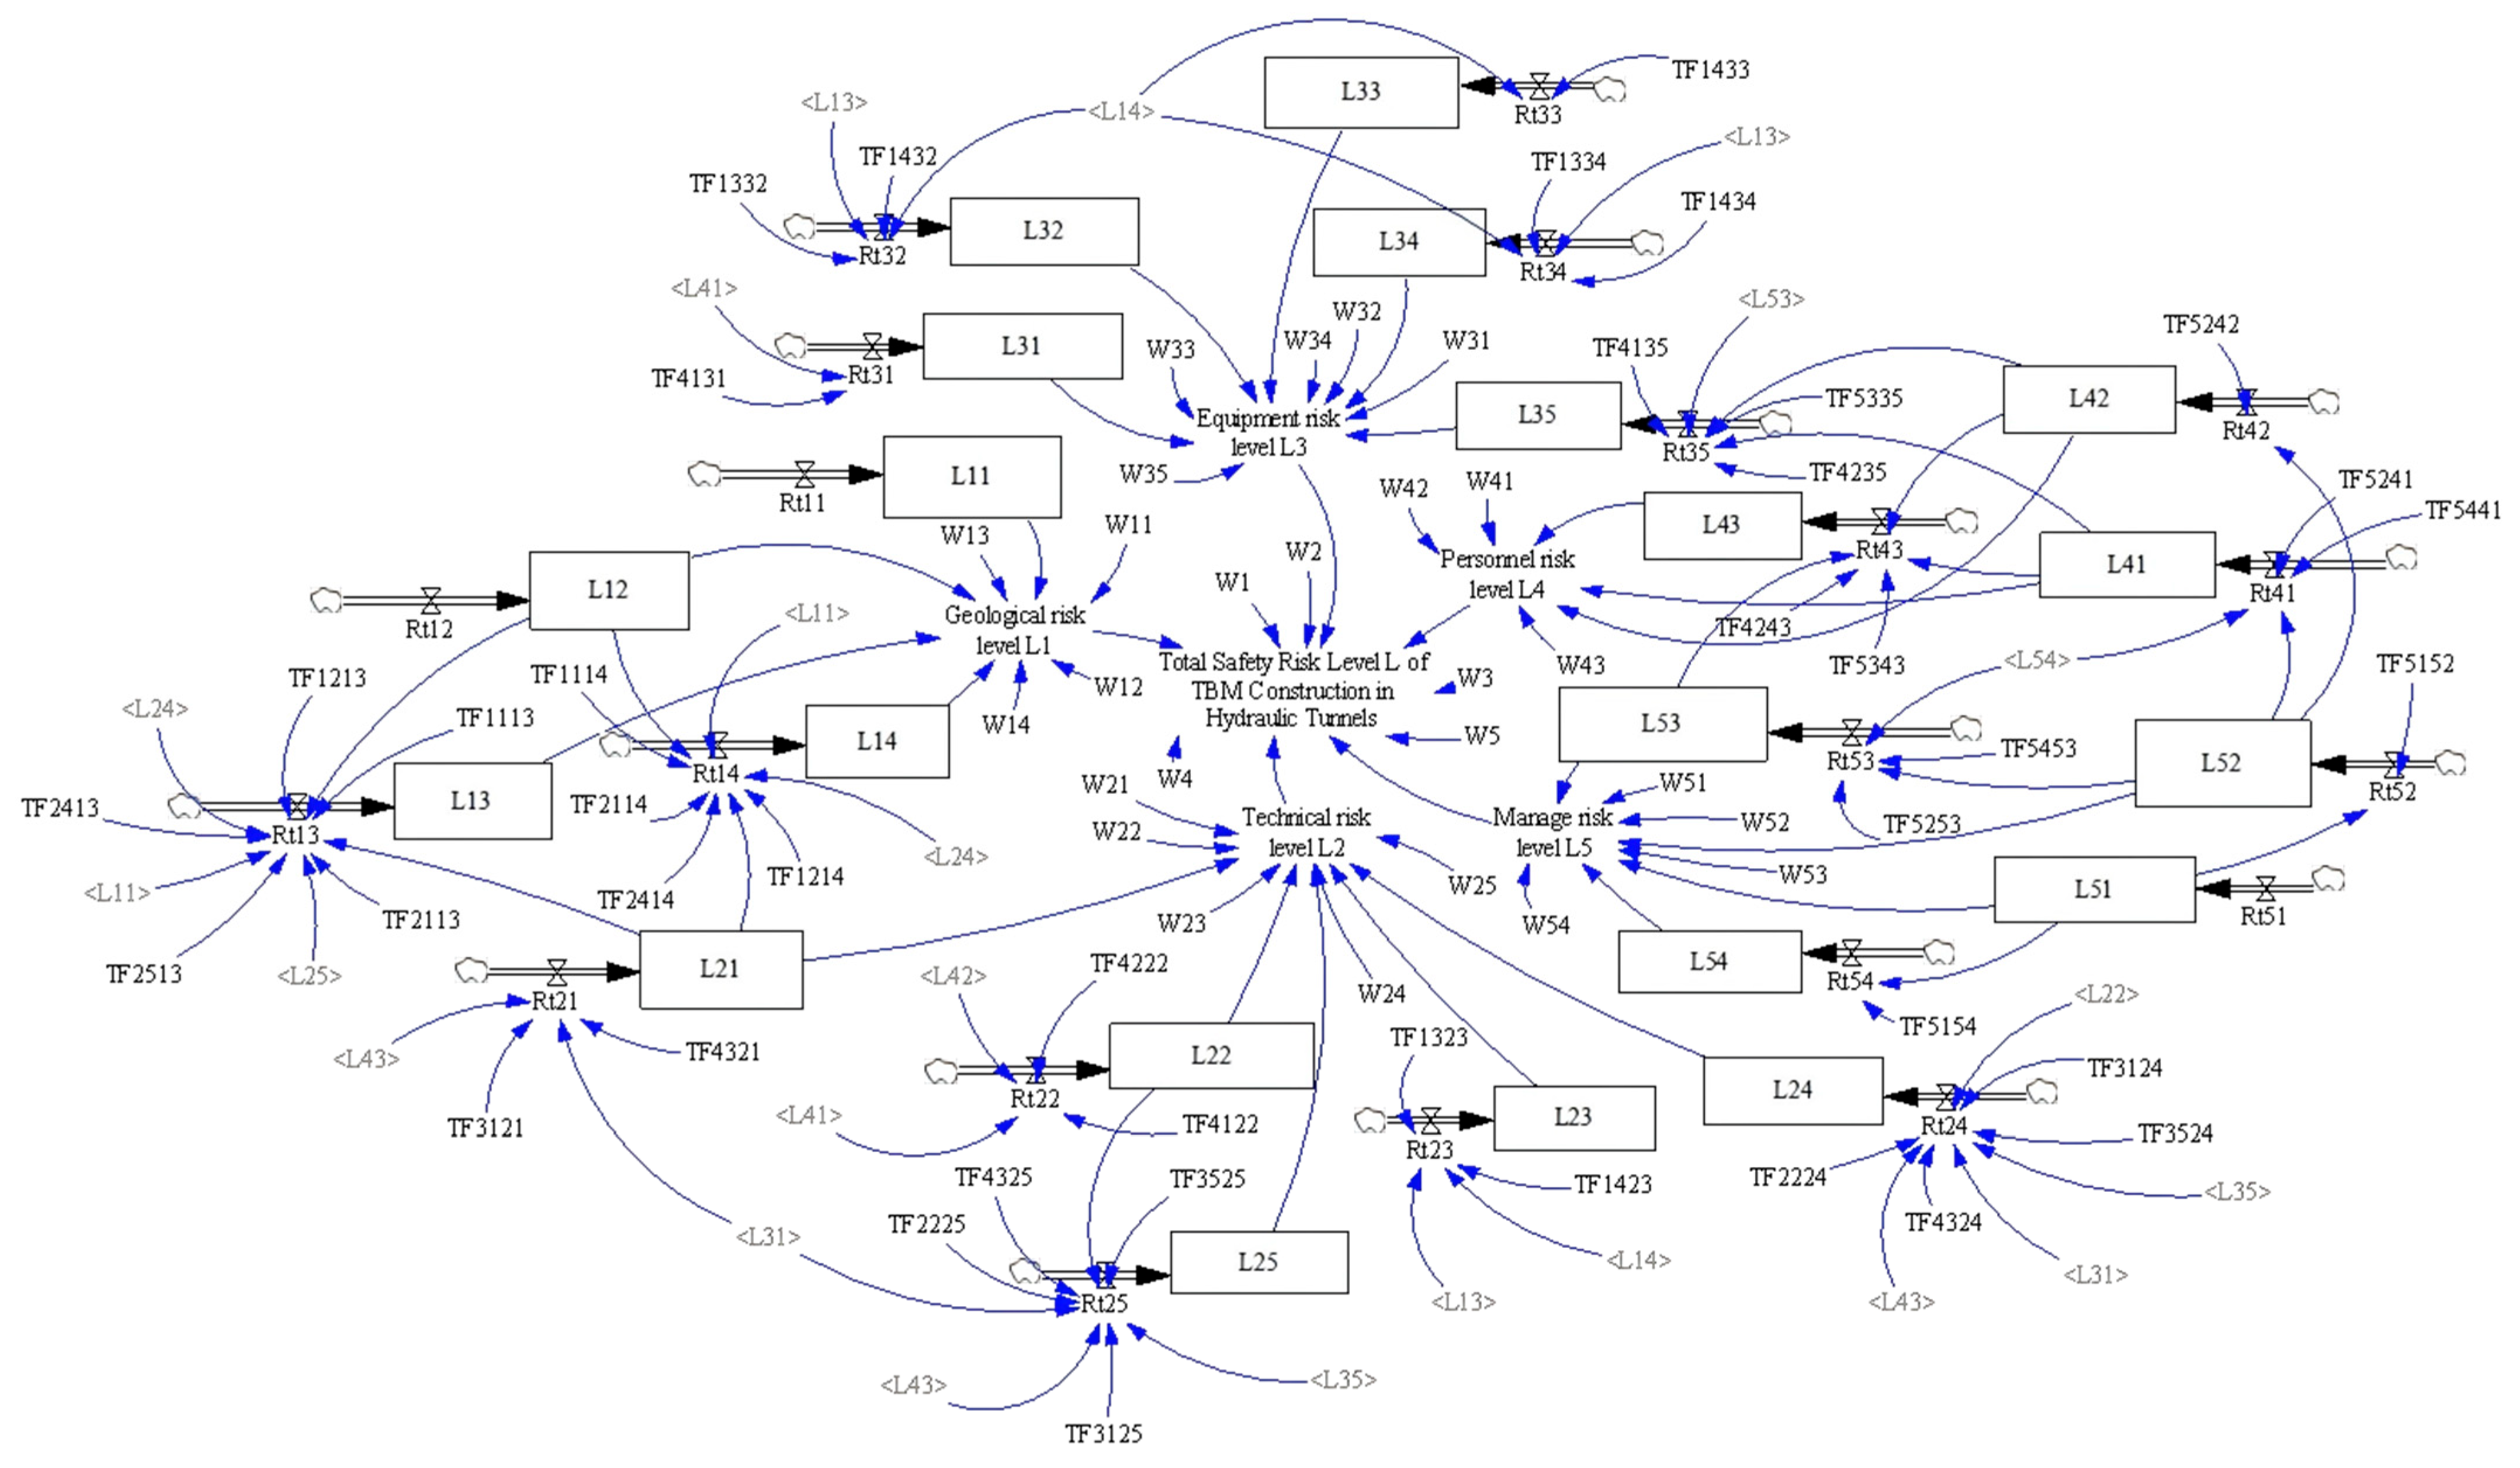
5.3.2. Establishment of the Stock Flow Diagram
5.3.3. Model Parameter Determination
- (1)
- Index weight calculationFirstly, based on the centrality values calculated by the fuzzy DEMATEL analysis in Table 5, the subjective weights of the indicators are calculated using Formula (21). Secondly, the entropy weight method was used to determine the objective weights. Five management and technical personnel who were familiar with or had participated in this construction project were invited to discuss and score the safety impact degree of each risk factor based on the collected TBM construction logs and tunneling parameter records of the AY project. The corresponding scale for the evaluation grade values was [1,2,3,4,5]. The higher the score, the greater the harm caused by the risk factors. The objective weights are determined according to Formulae (22)–(28). Finally, calculate the combined weighting results of game theory according to Formulae (29)–(31). The subjective, objective and combined weights of all indicators are shown in Table 7.
- (2)
- Calculation of risk initial valueSet the initial value range between [0, 0.05]. The higher the value, the more obvious the impact on construction safety. Invite experts and scholars to score according to their experience and knowledge in combination with the construction safety status of AY Project. Finally, take the arithmetic average value as the initial value of each risk factor, as shown in Table 8.
5.3.4. Risk Simulation Analysis
- (1)
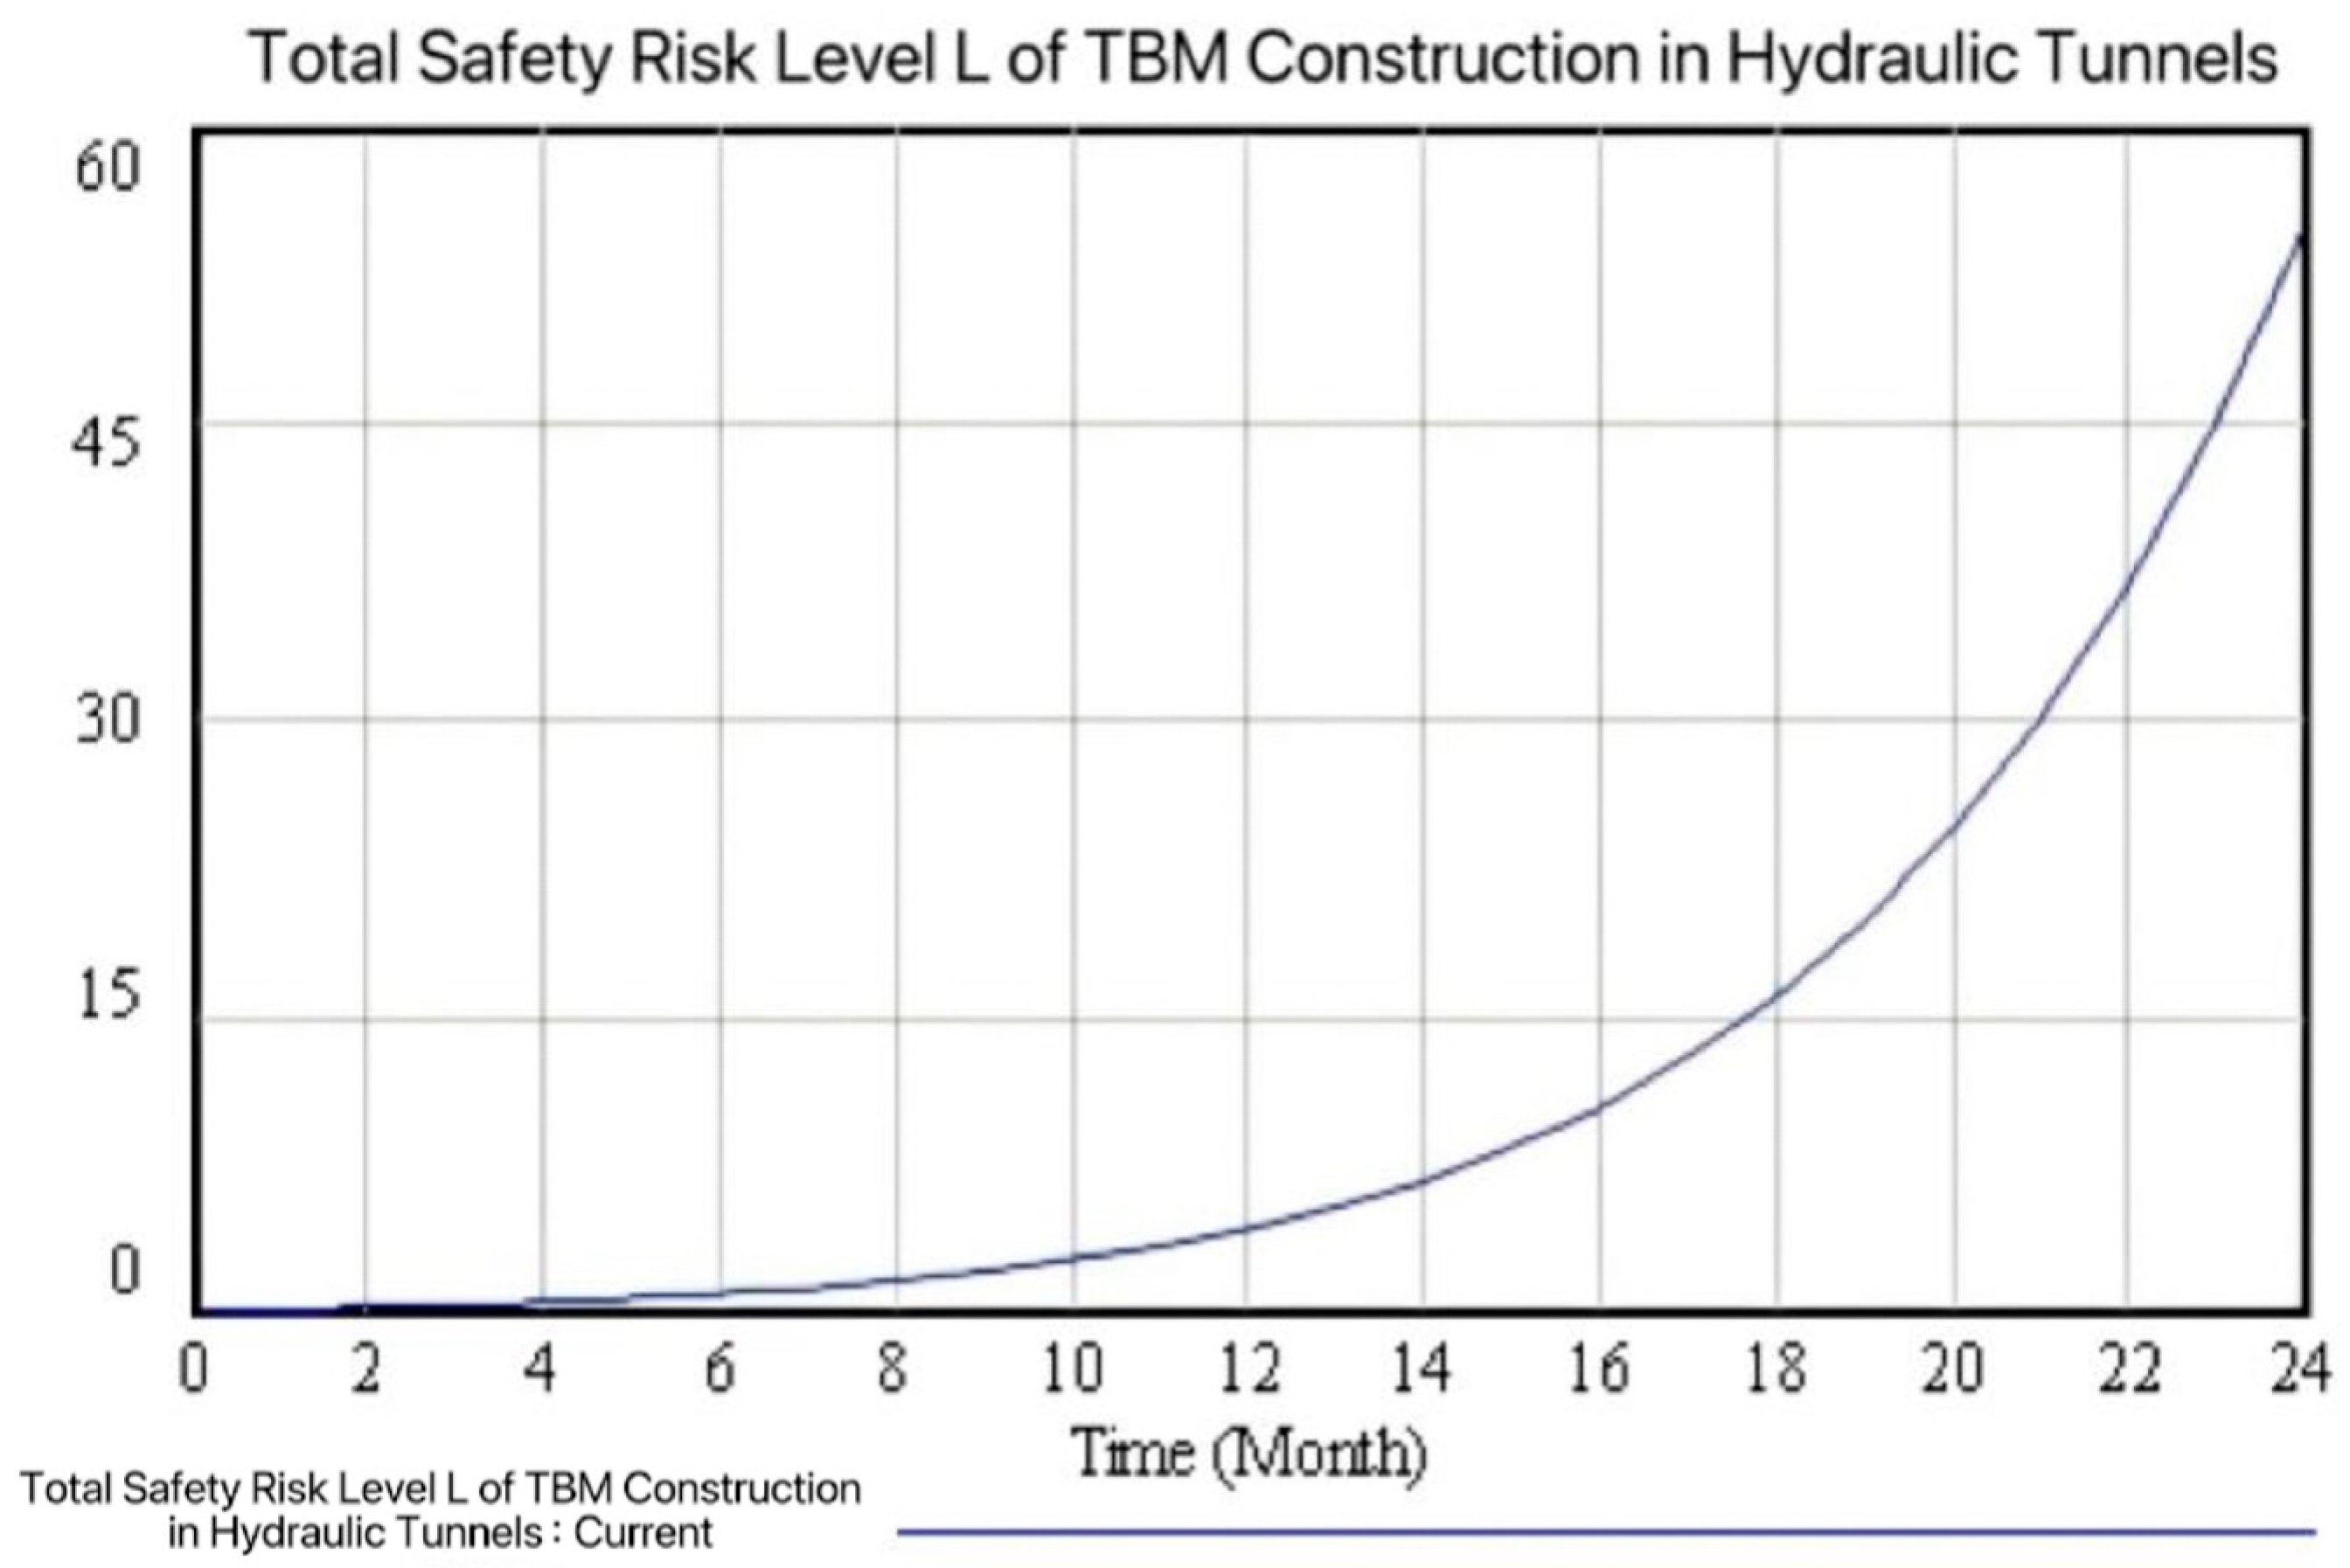
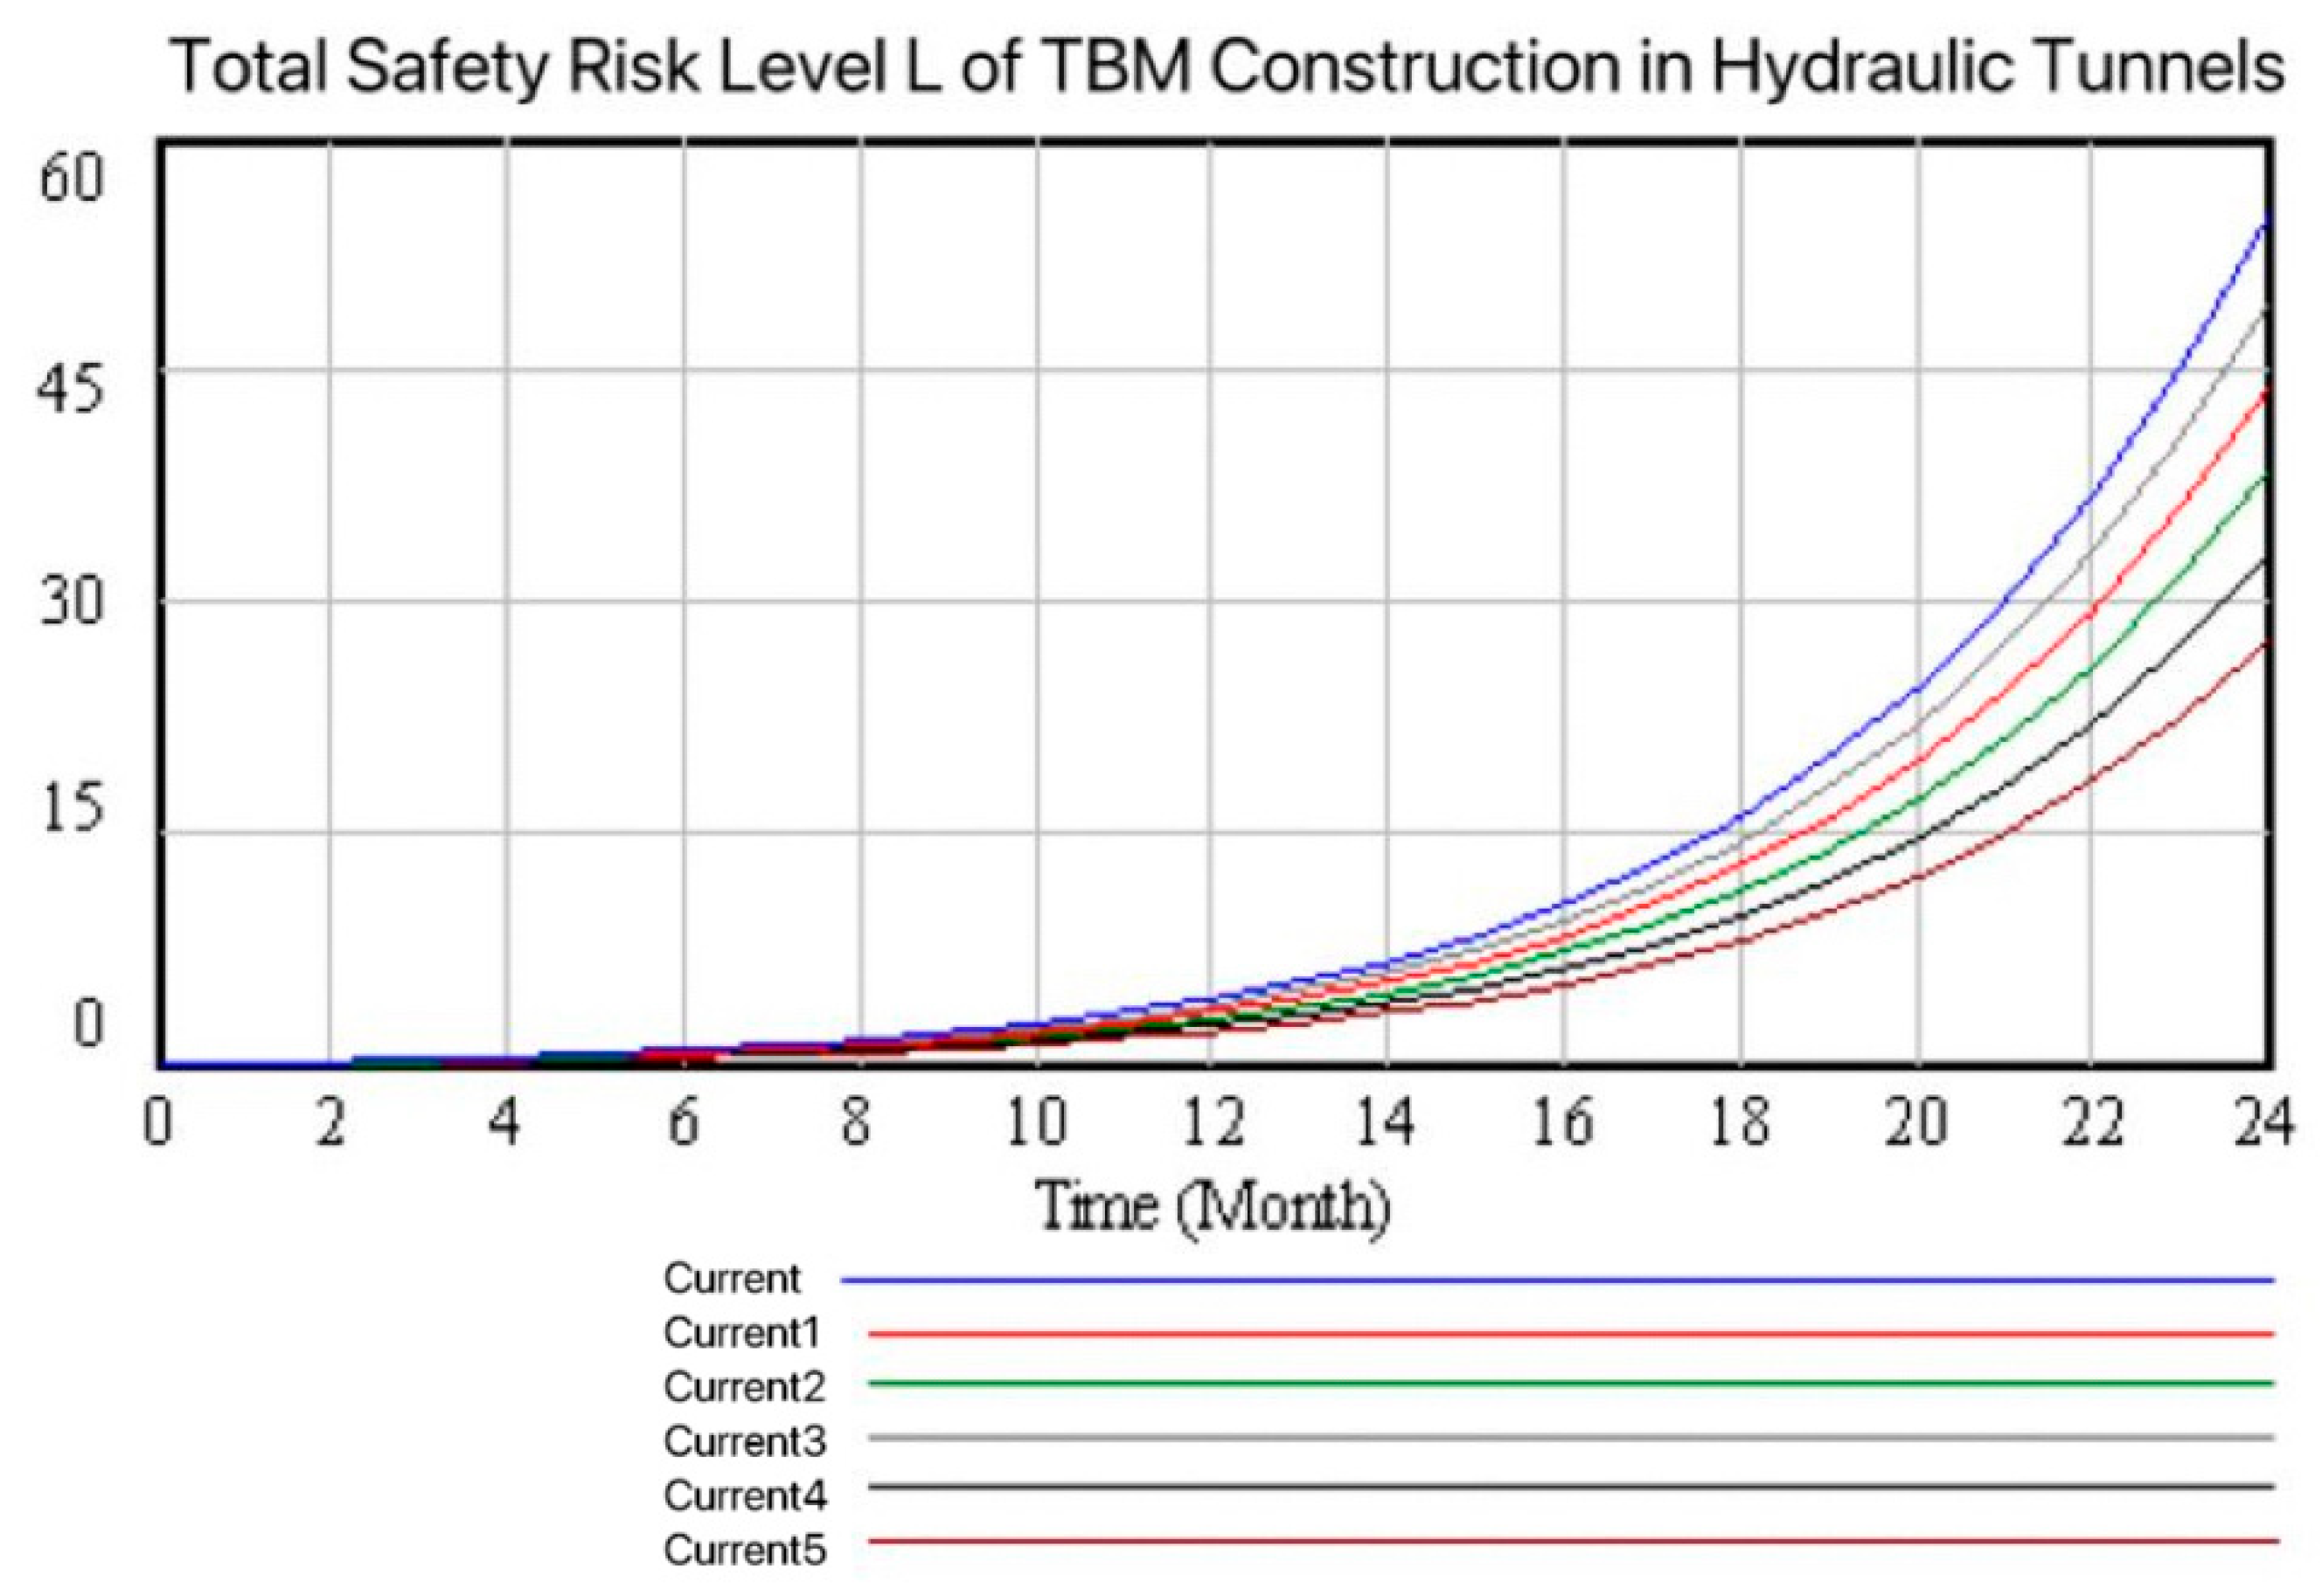
- Overall system safety risk evolution analysisAs shown in Figure 9, the increase in risk levels from the first month to the eighth month was relatively small. This was due to various influences such as safety education before the start of work and unfamiliarity with the construction environment, which led to a high level of vigilance among personnel. By strictly implementing safety regulations, risks related to human factors and management were effectively controlled. In addition, after the TBM was debugged and put into use for a relatively short period of time, the influence of factors such as mechanical equipment was relatively small, and no chain reaction was formed. As the construction progresses, the tunneling section passes through multiple adverse geological conditions, increasing the construction difficulty, intensifying the wear and tear of the TBM, and making the management and coordination of multi-process operations more challenging. The fatigue and complacency of personnel due to long-term work have also raised the probability of violations and operational errors. Under these associated circumstances, risks continue to evolve and accumulate. It can be seen from the evolution curve that the overall safety risk control effect of the TBM tunneling section of the AY project is generally good, which is consistent with the situation where no major safety accidents have occurred in reality, further verifying the accuracy and effectiveness of the model.
- (2)
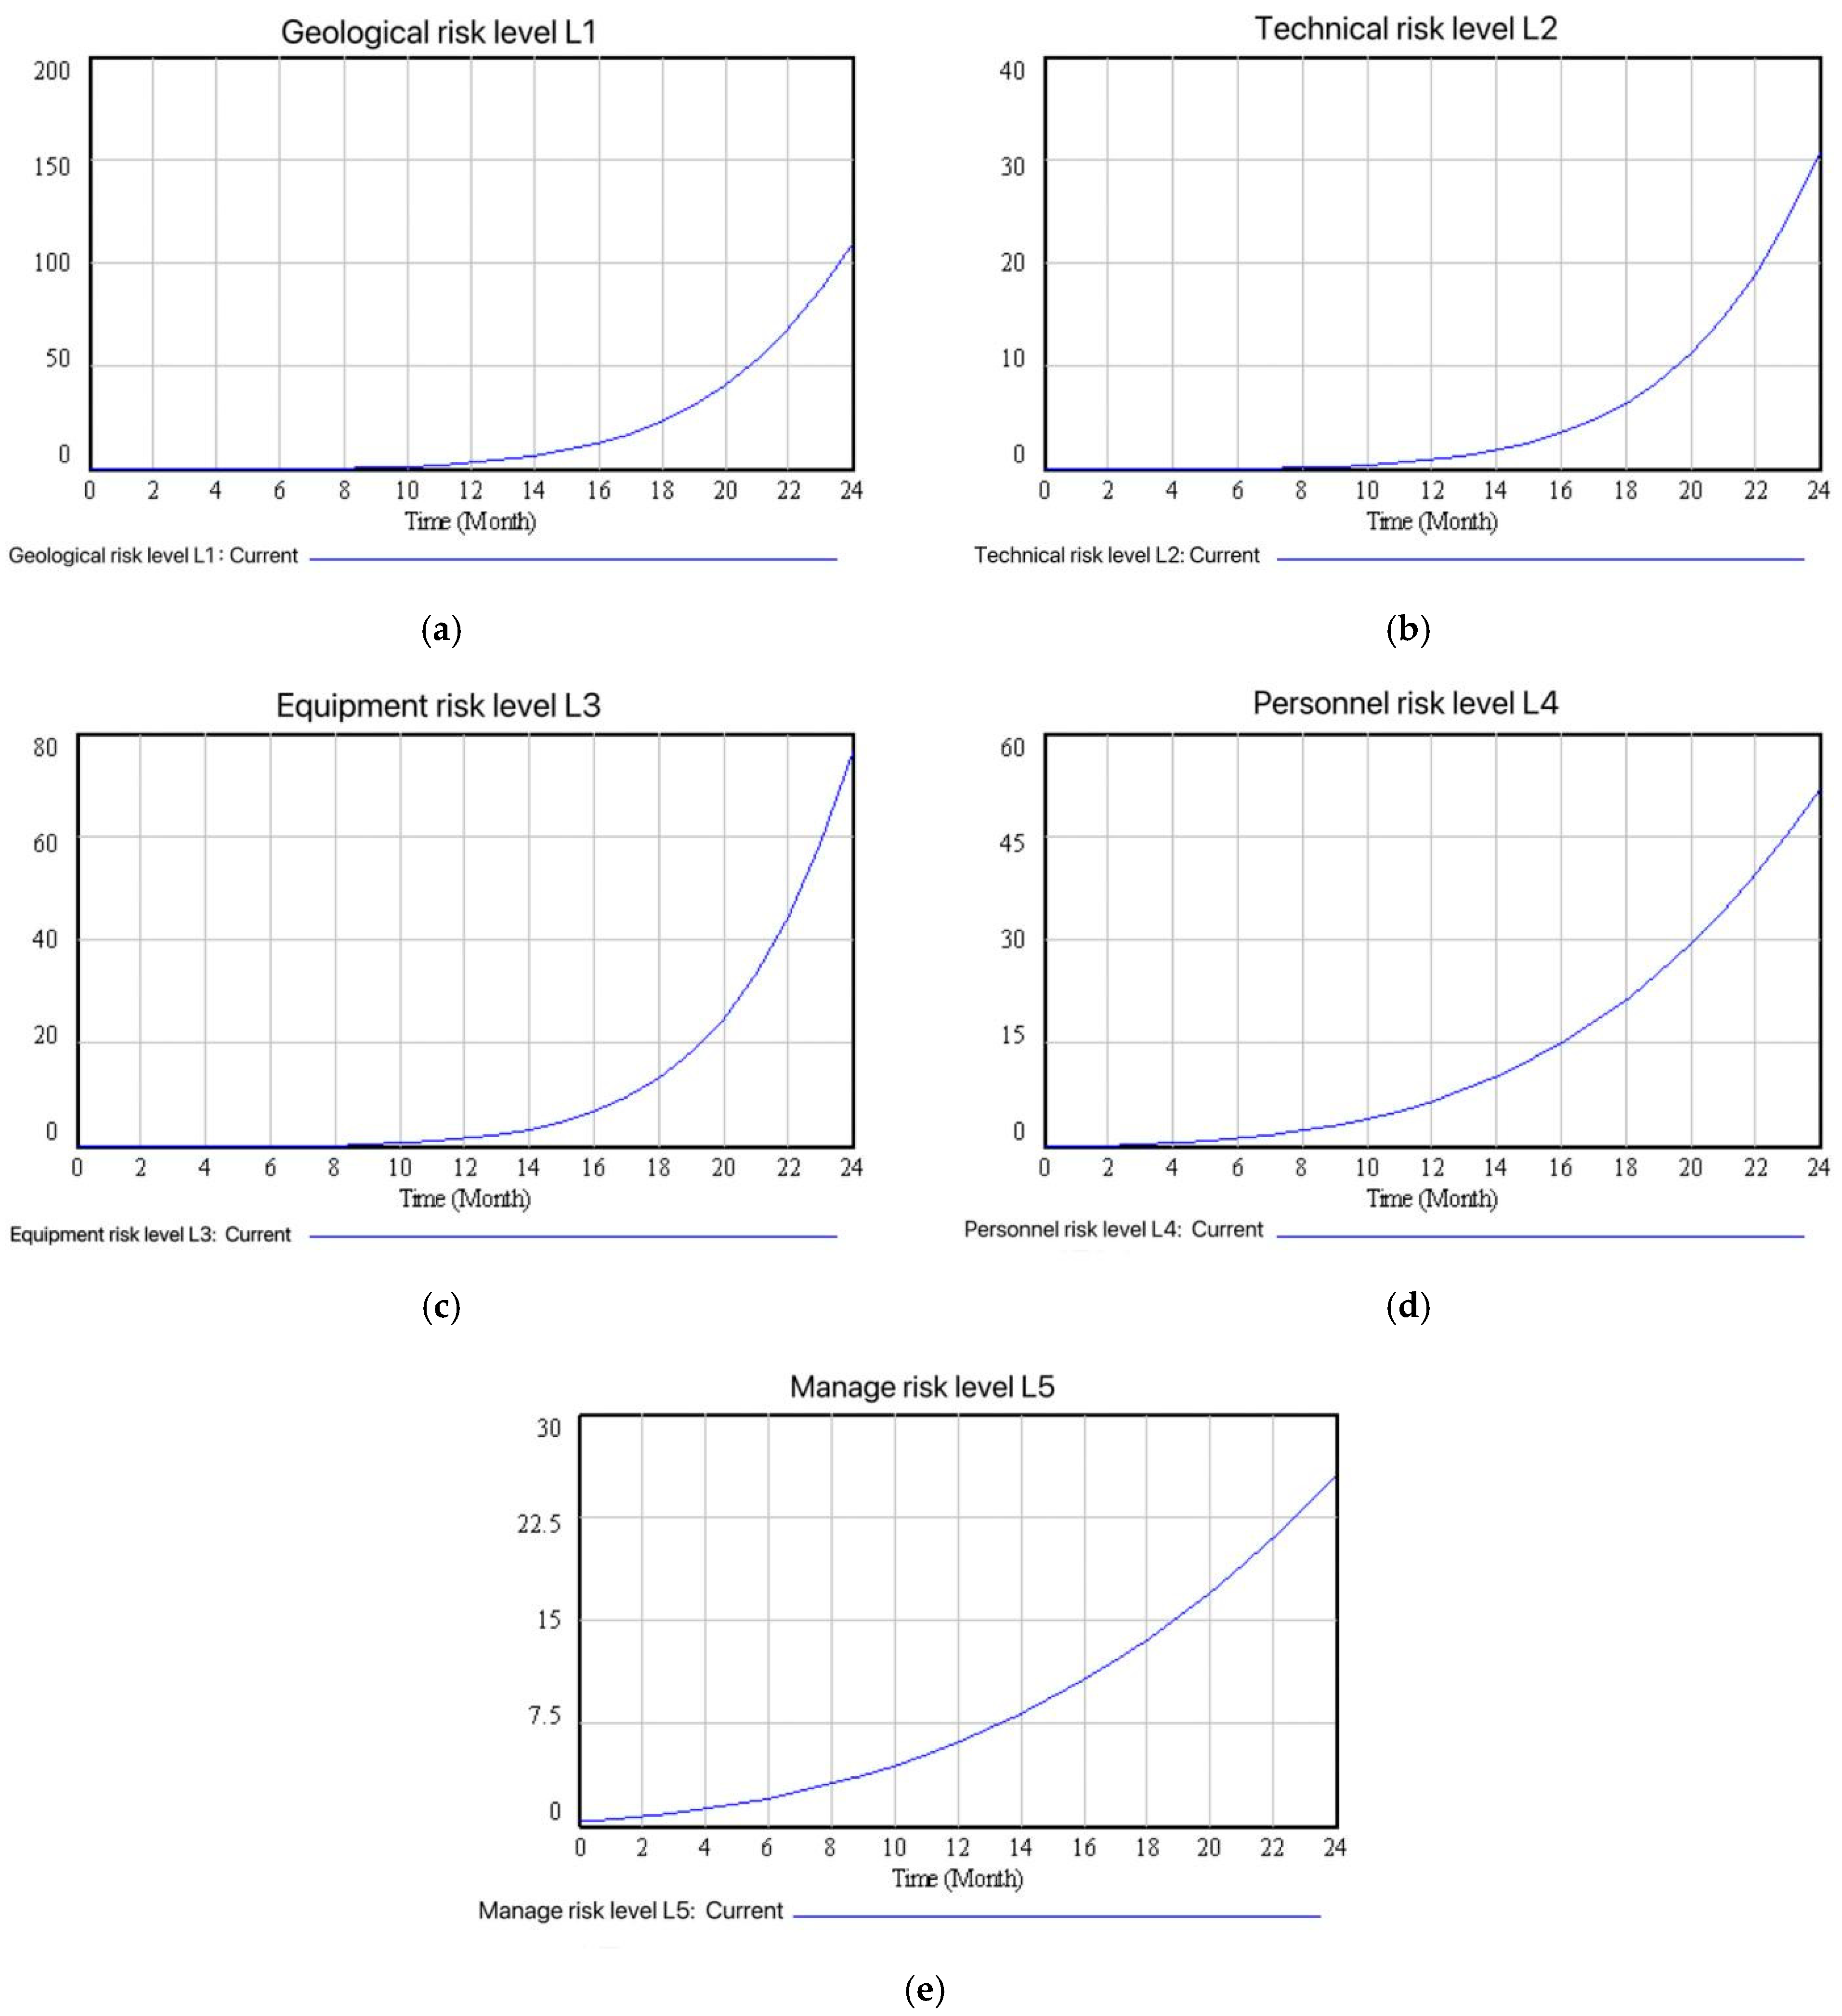
- Analysis of safety risk evolution of each subsystemThe evolution trend of the security risk levels of each subsystem is shown in Figure 10. By comparing the risk level values of the vertical axes in each figure and the slope of the curve changes, the ranking of the risk levels of each subsystem from largest to smallest at the end of the simulation cycle is geology > equipment > personnel > technology > management. Overall, the changes in the risk levels of technology and management are relatively slow, and the risk levels are also low. This is in line with the situations described in the construction report regarding the resolution of construction challenges such as soil control, the continuous implementation of safety management systems, the achievement of “zero-error” breakthrough in TBM tunneling, and the one-time qualification inspection of segment assembly quality.
5.3.5. Sensitivity Analysis
- (1)
- Sensitivity analysis of subsystemsThe correlation coefficients of the factors in the five subsystems were adjusted in sequence, and one control scheme “current” and five experimental schemes “current1–5” were set up. In the control plan, the risk correlation coefficient remains unchanged. In the experimental plan, according to the coding sequence of each subsystem, only the correlation coefficients of factors within a single subsystem are adjusted in sequence, with an adjustment range of a 50% reduction. The sensitivity comparison of each subsystem is shown in Figure 11.As can be seen from Figure 11, adjusting the degree of association in the management subsystem is the most effective in reducing the overall system security risk level, with the most obvious speed reduction. Secondly, it is personnel > technology > geology > equipment. Therefore, during construction, it is necessary to focus on reducing the transmission and correlation of management risk and personnel risk subsystem factors in the overall system.
- (2)
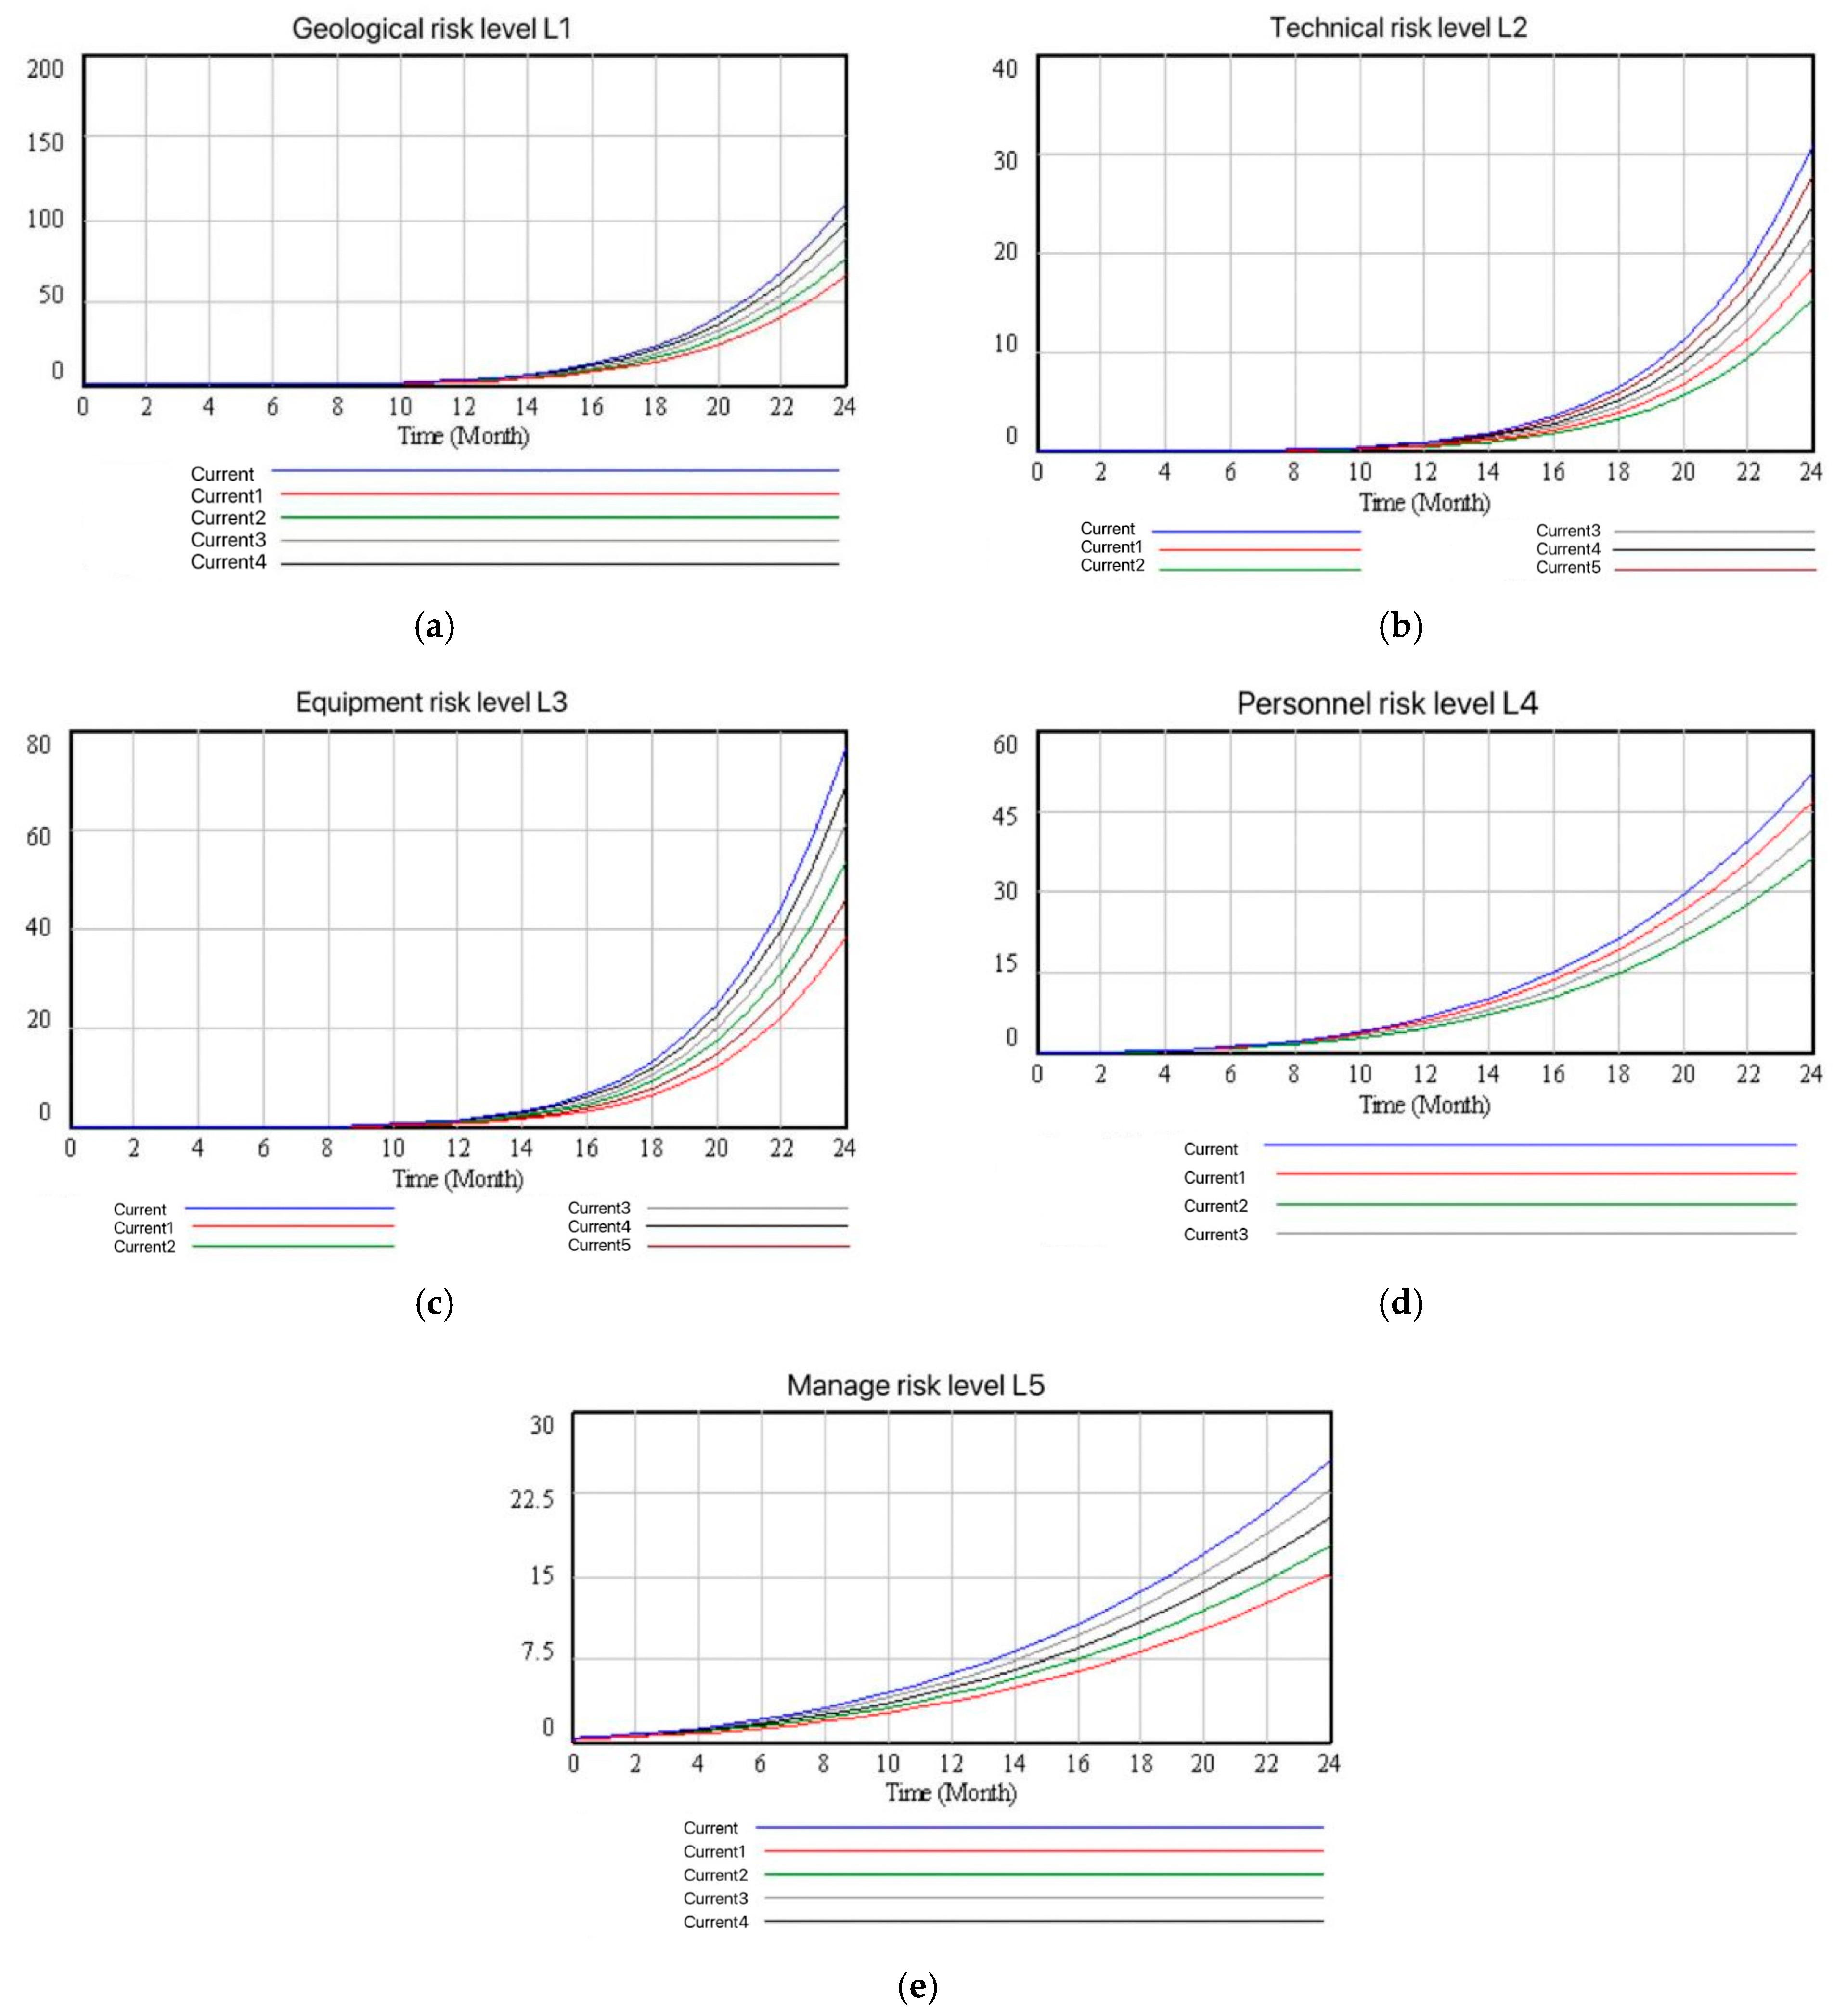
- Sensitivity analysis of risk factorsStarting from the five subsystems, respectively, when analyzing the factors within one subsystem, ensure that the factor values of the other subsystems remain unchanged, and set up the control group “current” and the experimental group. Each experimental group reduced the initial risk value of a single factor by 50% in sequence according to the coding sequence of the internal factors of the subsystem. According to the above sensitivity analysis plan, the comparison of factor sensitivity analysis within each subsystem is shown in Figure 12.
- (1)
- In response to adverse geological conditions, before construction, a comprehensive application of multi-source technical means such as ground penetrating radar and advanced drilling is carried out to conduct refined geological exploration and prediction. Meanwhile, plans for advanced grouting reinforcement and optimization of support structures are promptly formulated to enhance the adaptability and stability of TBM tunneling in complex environments.
- (2)
- In terms of construction parameter setting, special analysis shall be conducted on key technical parameters such as excavation mode and support technology in combination with detailed geological data, and the implementation of construction technical standards and operating procedures shall be strengthened to ensure operation in accordance with specification requirements.
- (3)
- According to the surrounding rock grade and hydrological characteristics of different sections, TBM equipment types with strong adaptability shall be selected to avoid propulsion obstruction or efficiency reduction due to improper equipment selection.
- (4)
- For weak safety awareness, a safety culture atmosphere shall be created, and systematic safety training shall be carried out regularly, including TBM operation procedures, risk identification, safety protection and emergency treatment knowledge, so as to prevent accidents.
- (5)
- Establish a complete set of safety management system and operating procedures, covering all aspects of construction, clarify safety management responsibilities and emergency response procedures, and avoid problems such as management gaps or system lags.
6. Conclusions
- (1)
- A systematic risk indicator system was established. Through the collection of extensive textual data from multiple sources—including literature, engineering case reports, and interview records—and the application of grounded theory and gray relational analysis, a safety risk indicator system for hydraulic tunnel TBM construction was identified and developed. The system comprises five primary dimensions—geological, technical, equipment, personnel, and management—and 21 secondary indicators. This framework comprehensively covers the key factors influencing construction safety and provides a solid foundation for subsequent risk analysis and management.
- (2)
- A safety risk correlation analysis model for TBM construction in hydraulic tunnels based on fuzzy DEMATEL–ISM–BN is proposed. It works as follows: Introduce fuzzy theory and use the DEMATEL method to analyze and calculate the causal attributes and importance of risk factors. Classify the risk factor levels in combination with the ISM model, and construct the risk factor association structure based on the hierarchical relationship and transmission relationship. Map the multi-layer hierarchical structure to the Bayesian network, and based on the conditional probability information, use the Euclidean distance to achieve the quantitative expression of risk association.
- (3)
- In the case of risk correlation, the safety risk evolution of hydraulic tunnel TBM construction is studied based on system dynamics, the basic concept of system dynamics is clarified, the calculation method of model parameters and system dynamics equations are determined, and the safety risk evolution model of hydraulic tunnel TBM construction is established.
- (4)
- Taking the AY project as an example, the validity and accuracy of the two models were verified. A risk correlation structure with a total of 7 levels was established. Further, by using the BN model, the probability of occurrence of construction safety risks in the AY project was obtained as 0.6517, and the degree of risk correlation was calculated. The simulation results of the evolution model show that the risk level is on the rise. By adopting different sensitivity analysis strategies, it is determined that the management risk subsystem has the most significant impact on the overall risk level, and it is determined that adverse geological conditions, improper setting of construction parameters, improper equipment selection and configuration, weak safety awareness and imperfect management systems are the most sensitive factors within each subsystem. Proposing preventive measures against these key risk factors can effectively enhance the safety of engineering construction.
- (5)
- The dynamic evolution patterns and critical subsystems of risks were revealed. The system dynamics (SD) simulation results indicated that, over the entire project cycle, the overall risk level exhibited a nonlinear upward trend. The risk levels of subsystems were ranked as follows: geological > equipment > personnel > technical > management. Further sensitivity analysis of subsystems confirmed that the management risk subsystem was the most sensitive to overall risk levels, and variations in its internal correlation strength exerted the most significant suppressive effect on global risk.
- (6)
- Core sensitive factors within each subsystem were identified. Factor sensitivity analysis further pinpointed the most critical risk points within each subsystem, namely, “adverse geological conditions”, “inappropriate construction parameter settings”, “improper equipment selection and configuration”, “weak safety awareness”, and “inadequate management systems”. Based on these identified key risk factors, targeted preventive and control measures were proposed, providing a scientific basis for improving safety management in TBM construction projects.
Author Contributions
Funding
Data Availability Statement
Conflicts of Interest
References
- Zhang, Z.; Wang, B.; Wang, X.; He, Y.; Wang, H.; Zhao, S. Safety-risk assessment for TBM construction of hydraulic tunnel based on fuzzy evidence reasoning. Processes 2022, 10, 2597. [Google Scholar] [CrossRef]
- Hu, K.; Wang, J.; Wu, D.; Wang, Y. Risk Assessment of Small-Diameter Shield Construction in a Deep Drainage Tunnel Based on an ISM–CRITIC–Cloud Model. Buildings 2024, 14, 3920. [Google Scholar] [CrossRef]
- Sharafat, A.; Latif, K.; Seo, J. Risk analysis of TBM tunneling projects based on generic bow-tie risk analysis approach in difficult ground conditions. Tunn. Undergr. Space Technol. 2021, 111, 103860. [Google Scholar] [CrossRef]
- Chung, H.; Park, J.; Kim, B.-K.; Kwon, K.; Lee, I.-M.; Choi, H. A causal network-based risk matrix model applicable to shield TBM tunneling projects. Sustainability 2021, 13, 4846. [Google Scholar] [CrossRef]
- Hasanpour, R.; Rostami, J.; Schmitt, J.; Ozcelik, Y.; Sohrabian, B. Prediction of TBM jamming risk in squeezing grounds using Bayesian and artificial neural networks. J. Rock Mech. Geotech. Eng. 2020, 12, 21–31. [Google Scholar] [CrossRef]
- Wang, J.; Cheng, G.; Zhou, B.; Hu, W.; Tan, H.; Xie, J. Safety risk evaluation of long-distance small-diameter tunnel bored by tunnel boring machine. Tunn. Constr. 2024, 44 (Suppl. S2), 211–223. [Google Scholar]
- Liu, W.; Yin, H.; Su, Y.; Luo, H.; Jin, C.; Dang, D. Safety risk evaluation and diagnosis of hydraulic tunnel construction based on G2-AEW-UMT Model. J. Water Resour. Water Eng. 2023, 34, 184–192. [Google Scholar]
- Wang, J.; Hu, D.; Wu, H.; Wang, M.; Liu, D. Risk assessment in construction of small-diameter deep drainage tunnel. China Saf. Sci. J. 2020, 30, 113–120. [Google Scholar]
- Li, Q.; Li, Z.; Xu, L.; Wang, Y. Identification and Analysis of Risk Sources in Shield Tunneling of Diversion Tunnel. Yellow River 2023, 45, 121–125. [Google Scholar]
- Fu, L.; Wang, X.; Zhao, H.; Li, M. Interactions among safety risks in metro deep foundation pit projects: An association rule mining-based modeling framework. Reliab. Eng. Syst. Saf. 2022, 221, 108381. [Google Scholar] [CrossRef]
- Yan, H.; Zheng, Z.; Huang, H.; Zhou, X.; Tang, Y.; Hu, P. Risk coupling evaluation of social stability of major engineering based on N-K model. Buildings 2022, 12, 702. [Google Scholar] [CrossRef]
- Li, F.; Wang, W.; Dubljevic, S.; Khan, F.; Xu, J.; Yi, J. Analysis on accident-causing factors of urban buried gas pipeline network by combining DEMATEL, ISM and BN methods. J. Loss Prev. Process Ind. 2019, 61, 49–57. [Google Scholar] [CrossRef]
- Nie, X.; Zhao, T.; Zhang, P.; Fan, T.; Wang, B. Study on risk correlation analysis and risk transmission of long-distance water diversion project. J. North China Univ. Water Resour. Electr. Power (Nat. Sci. Ed.) 2022, 43, 45–53. [Google Scholar]
- Wu, Y.; Wei, K.; Liu, Q.; Liu, F.; Li, L. Correlation Evaluation Model and Application of Construction Risk of Tunnel Freezing Method. Chin. J. Undergr. Space Eng. 2021, 17, 961–968. [Google Scholar]
- Huang, J.W.; Fang, J.; Wang, J.C. Risk coupling analysis of metro deep foundation pit construction based on complex networks. Buildings 2024, 14, 1953. [Google Scholar] [CrossRef]
- Wu, C.; Ou, B.; Zhao, H.; Hua, C.; Han, Z. Simulation Study on Construction Safety of Deep Foundation Pit Based on Multi-risk Coupling Effect. Water Power 2025, 1–10. [Google Scholar]
- Xie, L.; Wang, H. Research on risk evolution of cruise ship construction schedule based on SD. China Saf. Sci. J. 2022, 32 (Suppl. S1), 63–71. [Google Scholar]
- Liu, X.; Dou, Z.; Yang, W. Research on influencing factors of cross border E-commerce supply chain resilience based on integrated fuzzy DEMATEL–ISM. IEEE Access 2021, 9, 36140–36153. [Google Scholar] [CrossRef]
- Yuan, B.; Liang, J.; Huang, X.; Huang, Q.; Zhang, B.; Yang, G.; Wang, Y.; Yuan, J.; Wang, H.; Yuan, P. Eco-efficient recycling of engineering muck for manufacturing low-carbon geopolymers assessed through LCA: Exploring the impact of synthesis conditions on performance. Acta Geotech. 2024, 1–21. [Google Scholar] [CrossRef]
- Xu, M.; Xue, Y.; Li, F.; Zhang, Y. Analysis on risk factors of coal mine gas explosion based on PSO-BP-DEMETEL model. Saf. Coal Mines 2022, 53, 164–170. [Google Scholar]
- Xue, X.; Xin, C.; Xu, D.; Liu, T. Cause analysis of falling accidents in construction engineering based on improved ISM-MICMAC. J. Saf. Environ. 2023, 23, 2802–2809. [Google Scholar]
- Yuan, B.; Liang, J.; Zhang, B.; Chen, W.; Huang, X.; Huang, Q.; Li, Y.; Yuan, P. Optimized reinforcement of granite residual soil via a cement and alkaline solution: A coupling effect. J. Rock Mech. Geotech. Eng. 2024, 17, 509–523. [Google Scholar] [CrossRef]
- Yuan, B.; Huang, Q.; Xu, W.; Han, Z.; Luo, Q.; Chen, G.; Yuan, J.; Zhang, Q.; Sabri, S.M.M. Study on the interaction between pile and soil under lateral load in coral sand. Geomech. Energy Environ. 2025, 42, 100674. [Google Scholar] [CrossRef]
- Sajid, Z.; Khan, F.; Zhang, Y. Integration of interpretive structural modelling with Bayesian network for biodiesel performance analysis. Renew. Energy 2017, 107, 194–203. [Google Scholar] [CrossRef]
- Wares, A. Challenging problems in Euclidean geometry. Int. J. Math. Educ. Sci. Technol. 2020, 51, 626–630. [Google Scholar] [CrossRef]
- Geng, X.; Lv, Y.; Zhao, L.; Wang, Y. Measurement and simulation of risk coupling in port hazardous chemical logistics. Int. J. Environ. Res. Public Health 2023, 20, 4008. [Google Scholar] [CrossRef] [PubMed]

| Main Categories | Initial Category |
|---|---|
| Advance geological prediction problem | Inaccurate or unrealistic geological forecasts; Substandard exploration quality; lag in advance geological prediction; lack of geological monitoring |
| Improper construction parameter setting | Inappropriate cutterhead speed, torque, or thrust; Incorrect excavation speed; improper settings for gripper shoes or grouting parameters |
| TBM attitude deviation | Deviation in TBM excavation path; improper axis control; difficulty in TBM attitude control |
| Poor support effect | Deformation of support structures; insufficient support strength; leakage in permanent lining; untimely or substandard support installation; inadequate synchronous grouting; omission of secondary grouting; grout leakage; lag in backfilling procedures; improper grouting control |
| Improper slag control | Discontinuous muck removal; excessive muck volume; low muck removal rate; risks associated with conveyor belt operation; improper muck handling operations |
| Improper equipment maintenance | Lack of regular inspection and maintenance; incorrect maintenance procedures; use of poor-quality or mismatched spare parts |
| Bad geological condition | Weak interlayers or faults; fracture zones; significant variations in lithology; extremely soft rock formations; shallow burial sections |
| Adverse hydrological conditions | High groundwater concentration; excessively high groundwater table; corrosive groundwater; high groundwater head pressure |
| Insufficient technical level | Lack of operator proficiency; inadequate technical skills; insufficient construction experience; low level of workmanship |
| Poor physical and mental condition | Negative work attitude; lack of concentration; weak safety awareness |
| Violation of regulations | Non-compliance with construction procedures; rushing the construction schedule; unauthorized operations; improper command or direction |
| Unreasonable staffing | Unqualified personnel; vacant positions; poor utilization of human resources |
| Serial Number | Workplace | Research Direction | Professional Title | Years of Experience |
|---|---|---|---|---|
| 1 | Scientific Research Institute | Intelligent Construction for TBM Tunneling | Researcher | 22 |
| 2 | Hydraulic Engineering Construction Company | Application of TBM Key Technologies | Senior Engineer | 25 |
| 3 | TBM Construction Management | Engineer | 20 | |
| 4 | Higher Education Institution | Construction Management of Hydraulic Structures | Professor | 30 |
| 5 | Risk Management in Hydraulic Engineering | Associate Professor | 24 |
| Level One Risk | Level Two Risk | Number | |
|---|---|---|---|
| Safety Risk of TBM Construction in Hydraulic Tunnel | Geological risk X1 | Bad geological condition | X11 |
| Adverse hydrological conditions | X12 | ||
| Deformation instability of surrounding rock | X13 | ||
| Mud outburst and water gushing | X14 | ||
| Technical risk X2 | Advance geological prediction problem | X21 | |
| Improper construction parameter setting | X22 | ||
| TBM attitude deviation | X23 | ||
| Poor support effect | X24 | ||
| Improper slag control | X25 | ||
| Equipment risk X3 | Improper equipment selection and configuration | X31 | |
| Shield, cutterhead blocked | X32 | ||
| Main bearing or seal failure | X33 | ||
| Cutter head wear damage | X34 | ||
| Improper equipment maintenance | X35 | ||
| Personnel risk X4 | Insufficient technical level | X41 | |
| Weak safety awareness | X42 | ||
| Violation of regulations | X43 | ||
| Management risk X5 | Management system insufficiency | X51 | |
| Safety training and technical briefing implementation deficiency | X52 | ||
| Site safety control deficiency. | X53 | ||
| Unreasonable staffing | X54 |
| Rating Description | Triangular Fuzzy Number |
|---|---|
| No influence—NO | (0.0, 0.1, 0.3) |
| Weak influence—VL | (0.1, 0.3, 0.5) |
| Minimal influence—L | (0.3, 0.5, 0.7) |
| Moderate influence—H | (0.5, 0.7, 0.9) |
| Significant influence—VH | (0.7, 0.9, 1.0) |
| Risk Factor | Influence Degree ei | Affected Degree fi | Centrality Mi | Degree of Causation Ni | Centrality Sort | Factor Attributes |
|---|---|---|---|---|---|---|
| X11 | 1.3618 | 0.7334 | 2.0952 | 0.6284 | 20 | Causative factor |
| X12 | 1.2914 | 0.7334 | 2.0248 | 0.558 | 21 | Causative factor |
| X13 | 1.0229 | 1.9393 | 2.9622 | −0.9164 | 4 | Outcome factor |
| X14 | 1.094 | 1.7758 | 2.8698 | −0.6818 | 9 | Outcome factor |
| X21 | 1.2798 | 1.4884 | 2.7682 | −0.2086 | 13 | Outcome factor |
| X22 | 1.6154 | 1.1611 | 2.7765 | 0.4543 | 12 | Causative factor |
| X23 | 0.7335 | 2.1544 | 2.8879 | −1.4209 | 8 | Outcome factor |
| X24 | 1.1079 | 1.7038 | 2.8117 | −0.5959 | 10 | Outcome factor |
| X25 | 0.968 | 1.7616 | 2.7296 | −0.7936 | 15 | Outcome factor |
| X31 | 1.5344 | 0.9161 | 2.4505 | 0.6183 | 19 | Causative factor |
| X32 | 0.7335 | 2.1905 | 2.924 | −1.457 | 6 | Outcome factor |
| X33 | 0.7335 | 1.7606 | 2.4941 | −1.0271 | 18 | Outcome factor |
| X34 | 0.7335 | 2.2341 | 2.9676 | −1.5006 | 4 | Outcome factor |
| X35 | 1.2636 | 1.3589 | 2.6225 | −0.0953 | 16 | Outcome factor |
| X41 | 1.8185 | 1.0828 | 2.9013 | 0.7357 | 7 | Causative factor |
| X42 | 1.8161 | 0.9284 | 2.7445 | 0.8877 | 14 | Causative factor |
| X43 | 1.6661 | 1.4544 | 3.1205 | 0.2117 | 2 | Causative factor |
| X51 | 2.4513 | 0.7334 | 3.1847 | 1.7179 | 1 | Causative factor |
| X52 | 2.2533 | 0.8447 | 3.098 | 1.4086 | 3 | Causative factor |
| X53 | 1.6946 | 1.0886 | 2.7832 | 0.606 | 11 | Causative factor |
| X54 | 1.723 | 0.8524 | 2.5754 | 0.8706 | 17 | Causative factor |
| Associated Path | Association Degree | Associated Path | Association Degree |
|---|---|---|---|
| TF1113 | 0.198 | TF3524 | 0.253 |
| TF1114 | 0.244 | TF3525 | 0.169 |
| TF1213 | 0.166 | TF4122 | 0.685 |
| TF1214 | 0.193 | TF4131 | 0.786 |
| TF1323 | 0.636 | TF4135 | 0.352 |
| TF1332 | 0.594 | TF4143 | 0.490 |
| TF1334 | 0.611 | TF4222 | 0.296 |
| TF1423 | 0.302 | TF4235 | 0.158 |
| TF1432 | 0.261 | TF4243 | 0.490 |
| TF1433 | 0.549 | TF4321 | 0.420 |
| TF1434 | 0.307 | TF4324 | 0.169 |
| TF2113 | 0.198 | TF4325 | 0.169 |
| TF2114 | 0.244 | TF5152 | 0.812 |
| TF2224 | 0.169 | TF5154 | 0.388 |
| TF2225 | 0.169 | TF5241 | 0.596 |
| TF2413 | 0.198 | TF5242 | 0.793 |
| TF2414 | 0.244 | TF5253 | 0.593 |
| TF2513 | 0.106 | TF5335 | 0.352 |
| TF3121 | 0.472 | TF5343 | 0.490 |
| TF3124 | 0.179 | TF5441 | 0.370 |
| TF3125 | 0.253 | TF5453 | 0.266 |
| First-Level Index | Fuzzy DEMATEL Method | Entropy Weight Method | Combinatorial Weighting in Game Theory | Second-Level Index | Fuzzy DEMATEL Method | Entropy Weight Method | Combinatorial Weighting in Game Theory |
|---|---|---|---|---|---|---|---|
| X1 | 0.1723 | 0.1670 | 0.1686 | X11 | 0.2107 | 0.4848 | 0.4346 |
| X12 | 0.2036 | 0.2821 | 0.1678 | ||||
| X13 | 0.2975 | 0.1598 | 0.2849 | ||||
| X14 | 0.2882 | 0.0733 | 0.1128 | ||||
| X2 | 0.2418 | 0.1343 | 0.1666 | X21 | 0.1981 | 0.2607 | 0.2606 |
| X22 | 0.1987 | 0.2768 | 0.2767 | ||||
| X23 | 0.2066 | 0.1876 | 0.1876 | ||||
| X24 | 0.2012 | 0.1621 | 0.1621 | ||||
| X25 | 0.1953 | 0.1128 | 0.1129 | ||||
| X3 | 0.2329 | 0.1121 | 0.1484 | X31 | 0.1821 | 0.3567 | 0.3401 |
| X32 | 0.2172 | 0.2416 | 0.2393 | ||||
| X33 | 0.1853 | 0.1219 | 0.1393 | ||||
| X34 | 0.2205 | 0.1453 | 0.1313 | ||||
| X35 | 0.1949 | 0.1345 | 0.1500 | ||||
| X4 | 0.1517 | 0.3004 | 0.2557 | X41 | 0.3309 | 0.2329 | 0.2448 |
| X42 | 0.3132 | 0.4616 | 0.4435 | ||||
| X43 | 0.3559 | 0.3055 | 0.3116 | ||||
| X5 | 0.2014 | 0.2862 | 0.2607 | X51 | 0.2735 | 0.4399 | 0.4160 |
| X52 | 0.2661 | 0.2871 | 0.2841 | ||||
| X53 | 0.2391 | 0.1596 | 0.1316 | ||||
| X54 | 0.2213 | 0.1135 | 0.1685 |
| Index | X11 | X12 | X13 | X14 | X21 | X22 | X23 | X24 | X25 | X31 | X32 |
|---|---|---|---|---|---|---|---|---|---|---|---|
| Initial value | 0.0253 | 0.013 | 0.0116 | 0.0269 | 0.0173 | 0.0216 | 0.0136 | 0.0208 | 0.0164 | 0.0258 | 0.0275 |
| Index | X33 | X34 | X35 | X41 | X42 | X43 | X51 | X52 | X53 | X54 | |
| Initial value | 0.0186 | 0.0138 | 0.0177 | 0.0174 | 0.0163 | 0.0268 | 0.0166 | 0.0152 | 0.0317 | 0.0167 |
Disclaimer/Publisher’s Note: The statements, opinions and data contained in all publications are solely those of the individual author(s) and contributor(s) and not of MDPI and/or the editor(s). MDPI and/or the editor(s) disclaim responsibility for any injury to people or property resulting from any ideas, methods, instructions or products referred to in the content. |
© 2025 by the authors. Licensee MDPI, Basel, Switzerland. This article is an open access article distributed under the terms and conditions of the Creative Commons Attribution (CC BY) license (https://creativecommons.org/licenses/by/4.0/).
Share and Cite
Nie, X.; Yu, H.; Lu, J.; Zhang, P.; Fan, T. Correlation Analysis and Dynamic Evolution Research on Safety Risks of TBM Construction in Hydraulic Tunnels. Buildings 2025, 15, 3359. https://doi.org/10.3390/buildings15183359
Nie X, Yu H, Lu J, Zhang P, Fan T. Correlation Analysis and Dynamic Evolution Research on Safety Risks of TBM Construction in Hydraulic Tunnels. Buildings. 2025; 15(18):3359. https://doi.org/10.3390/buildings15183359
Chicago/Turabian StyleNie, Xiangtian, Hui Yu, Jilan Lu, Peisheng Zhang, and Tianyu Fan. 2025. "Correlation Analysis and Dynamic Evolution Research on Safety Risks of TBM Construction in Hydraulic Tunnels" Buildings 15, no. 18: 3359. https://doi.org/10.3390/buildings15183359
APA StyleNie, X., Yu, H., Lu, J., Zhang, P., & Fan, T. (2025). Correlation Analysis and Dynamic Evolution Research on Safety Risks of TBM Construction in Hydraulic Tunnels. Buildings, 15(18), 3359. https://doi.org/10.3390/buildings15183359


