Abstract
With rapid urbanization, deep foundation pit clusters (DFPCs) have become increasingly common, introducing complex and significant construction risks. To improve risk evaluation under such complexity and uncertainty, this study proposes a hierarchical assessment framework. First, fault tree analysis is used to systematically identify and decompose DFPC-related risks. Second, a Bayesian network (BN) is constructed based on the fault tree to model interactions among risks, and structural learning techniques are applied to optimize the BN structure. An analytic hierarchy process (AHP) is then used to assign prior probabilities, enabling the identification of critical risk factors. To validate the framework, numerical simulations are used to analyze the impact of support failures on pit stability. The results show that mid-span support failures have the greatest influence. Two DFPC layouts are simulated to assess the effects of failure location and pit spacing. When the spacing is 0.10H (H = excavation depth), failures in a subpit’s mid-support cause the most severe impact on adjacent pits. These results confirm the framework’s effectiveness in evaluating DFPC risk.
1. Introduction
Owing to urban population growth, rapid urbanization during the past two decades has driven the massive development of deep foundation pit (DFP) projects []. Modern DFP construction is increasingly characterized by extreme excavation depths, large-scale dimensions, and clustered layouts, resulting in a surge in associated risk factors and frequent pit collapses. These collapses can strongly affect the local environment, delay construction periods, and cause considerable economic losses for construction companies []. The collapse of a metro station construction site along Line 1 of the Hangzhou Metro System in China caused 17 fatalities and 4 missing persons, with direct economic losses exceeding RMB 50 million [].
Unlike single-pit excavations, deep foundation pit clusters (DFPCs) cause complex spatial interactions that can increase instability risk. The redistribution of stresses among nearby pits, potential progressive failure mechanisms, and interdependent support systems can significantly increase the complexity of risk assessments. Existing methodologies cannot sufficiently capture these dynamic interactions; thus, more robust and adaptive risk assessment approaches are needed. Traditional methods for assessing DFP risk include analytic hierarchy process (AHP)-based approaches and fuzzy theory integration. The AHP remains the most widely used theory because of its structured decision-making process, which is based on expert judgment. However, the AHP is strongly subjective, as expert evaluations of the same risk factor can often diverge significantly [,]. To mitigate this limitation, researchers have integrated fuzzy theory with the AHP to quantify linguistic uncertainties [,,,,,,]. Cheng and Lu [] combined fuzzy theory with failure mode and effect analysis to increase the effectiveness of risk assessment methods for pipe jacking construction. Further advancements include the cloud model [,] and a large-scale multi-attribute group decision model [], which increase assessment accuracy. While these methods improve decision consistency, fuzzy models are highly sensitive to membership function selection and yield variable results that compromise reliability in complex DFPC environments.
Recently, data-driven techniques such as deep learning [,,] and numerical simulations [,,] have gained traction. While effective in leveraging real-time monitoring data, these methods often fail to consider the highly dynamic, interdependent nature of DFPC risk factors. A probabilistic framework capable of capturing causal relationships and evolving risk dependencies is urgently needed. Bayesian networks (BNs), which are probabilistic graphical models, are feasible alternatives because they can synthesize fragmented data and infer causal relationships in complex systems. Previous applications in metro construction [,,,,] reveal the effectiveness of BNs in managing uncertainties. However, existing BNs rely on expert-defined structures, which inadequately capture spatial coupling effects and dynamic interdependencies in DFPCs.
To address these limitations, this study proposes a novel BN–AHP framework that integrates expert knowledge with data-driven structural learning. Unlike conventional single-pit risk analyses, this framework systematically quantifies risk interactions among nearby pits via fault tree analysis (FTA). The framework also optimizes the BN topology via structure learning, reducing the reliance on predefined expert assumptions. Additionally, the AHP is used to determine prior probabilities within the BN, combining systematic prioritization with probabilistic reasoning.
2. Risk Assessment Framework for DFPCs
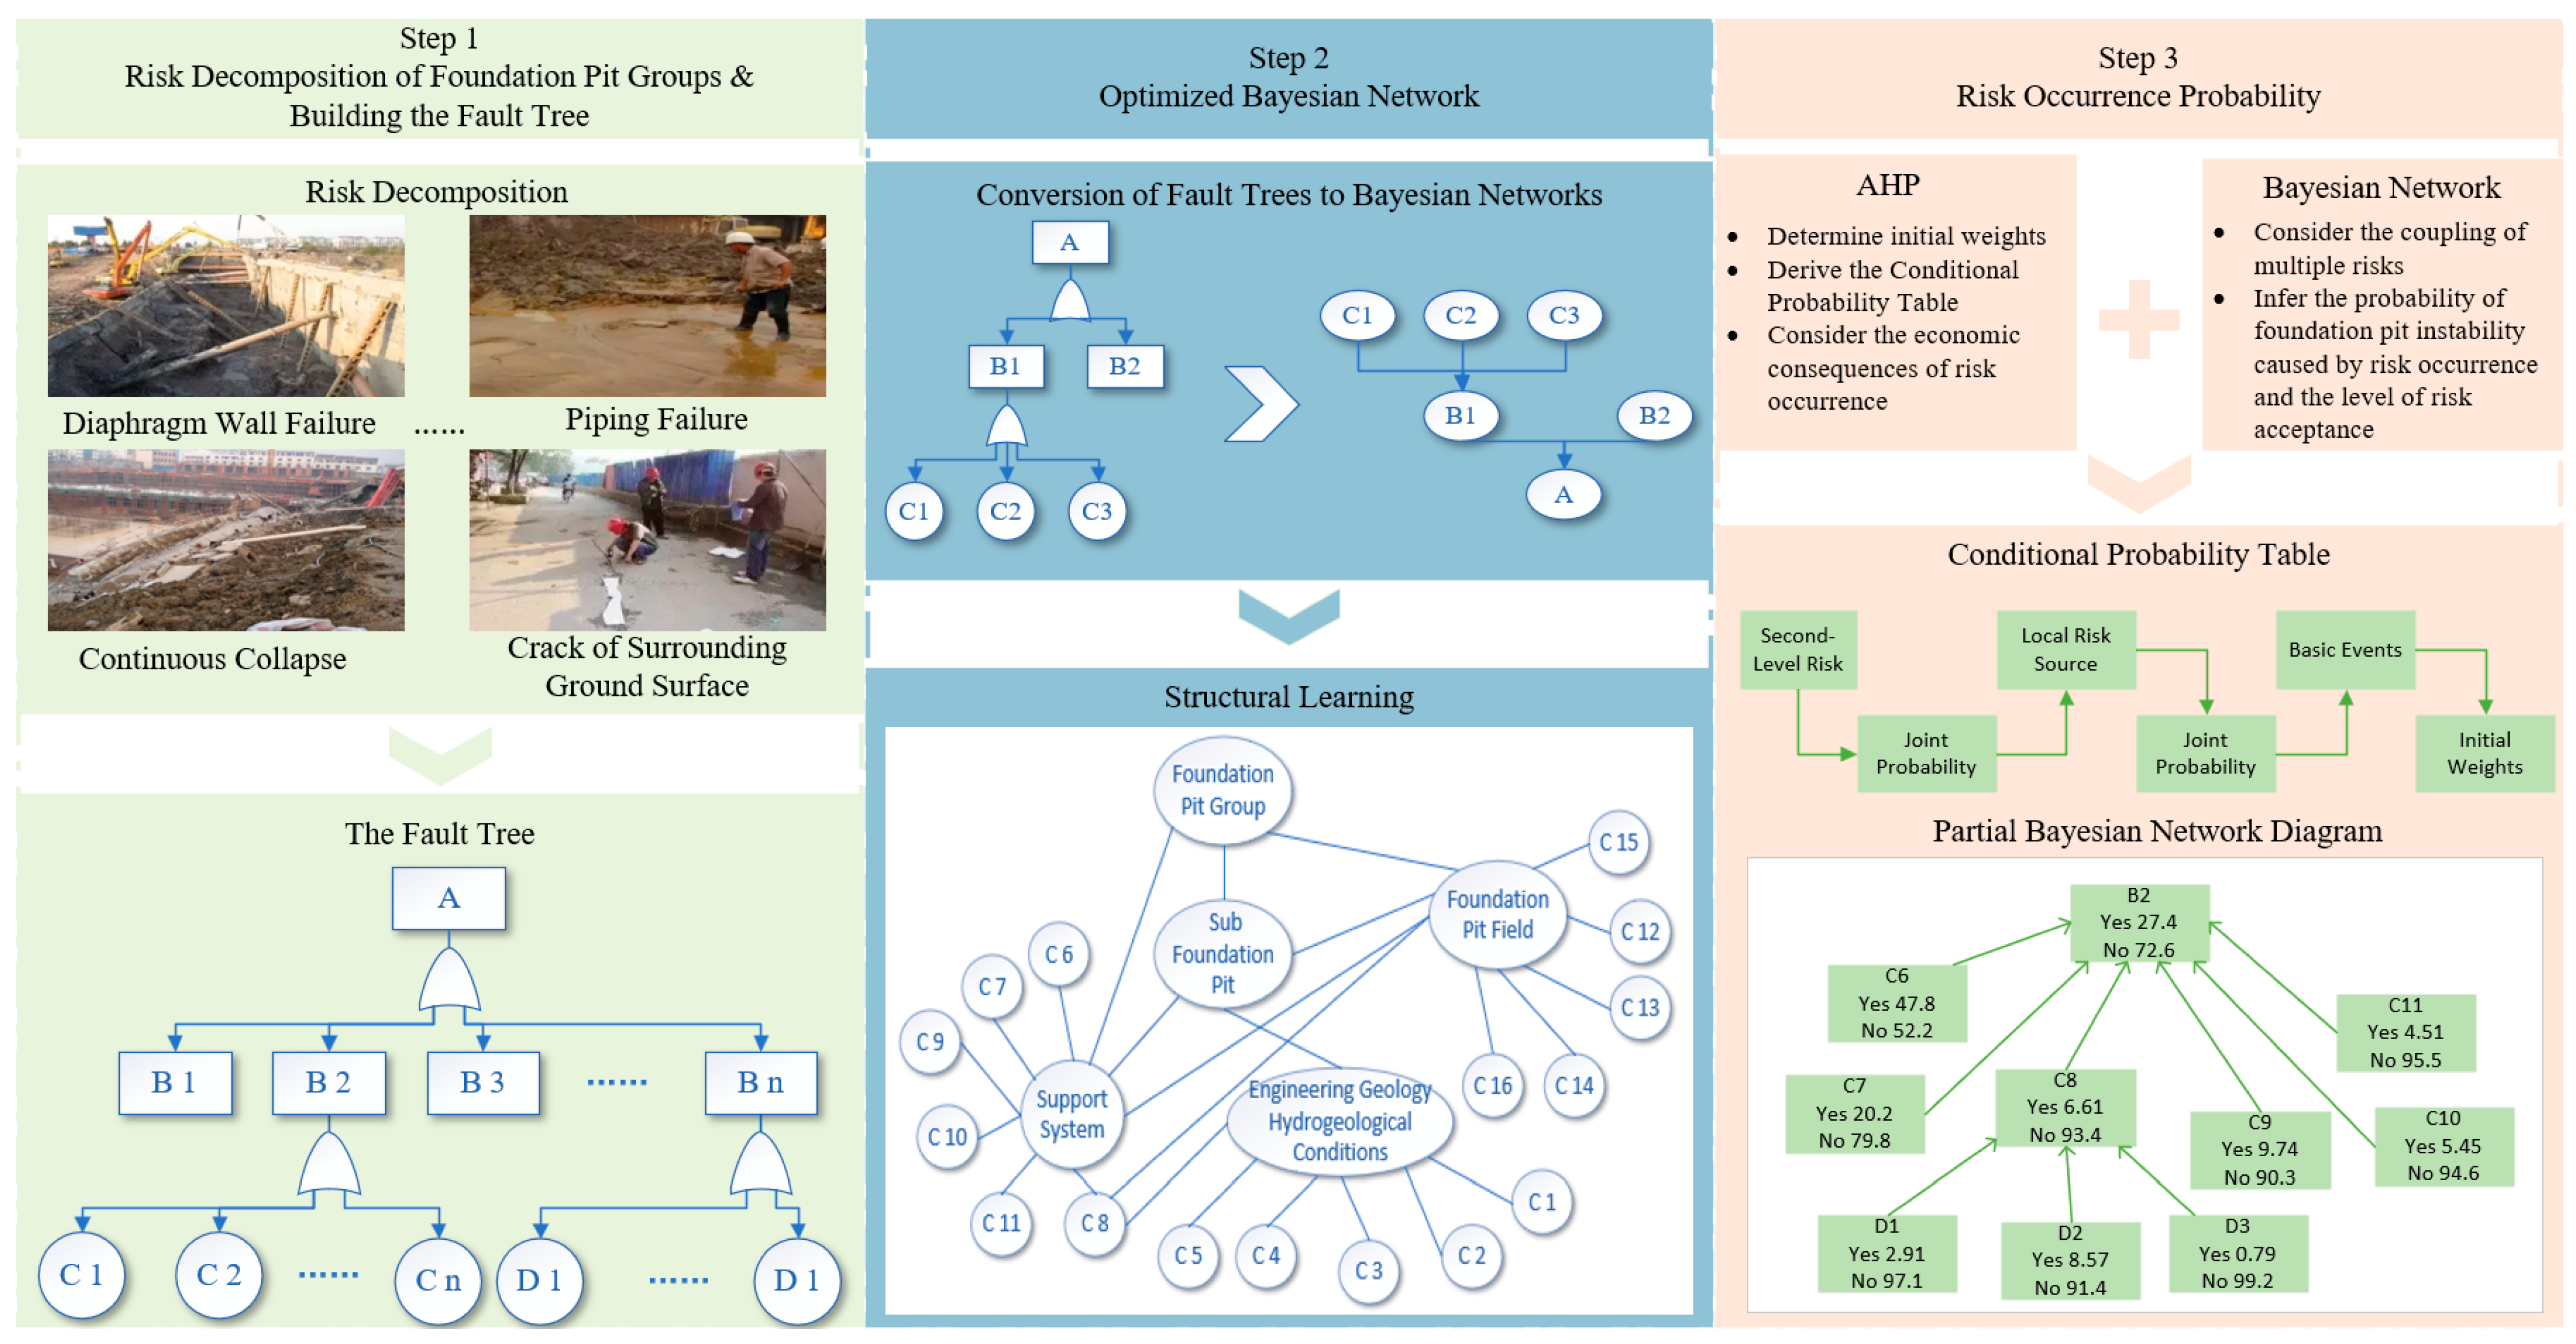
The risk assessment process is shown in Figure 1. In step 1, the process begins with FTA to identify and categorize critical risk events—such as diaphragm wall failure, piping damage, progressive collapse, and ground surface cracking—and to construct a fault tree that clarifies the logical relationships among top events, intermediate events, and basic events. In step 2, the fault tree is transformed into a BN structure, which is further optimized via structure learning to form a directed acyclic graph capable of representing multi-risk coupling interactions. In the final step, the AHP is employed to determine the prior probabilities of risk events and conditional probability tables (CPTs) within the BN. The resulting BN supports probabilistic inference under multi-risk scenarios, enabling not only the estimation of the probability of DFPC instability but also the evaluation of risk acceptability levels. This framework provides a systematic, dynamic, and probabilistic-consequential approach to risk assessment, significantly reducing the subjectivity associated with expert judgment.
Figure 1.
Risk assessment process for multilevel deep foundation pit clusters.
2.1. Risk Decomposition of DFPCs and Construction of the Fault Tree
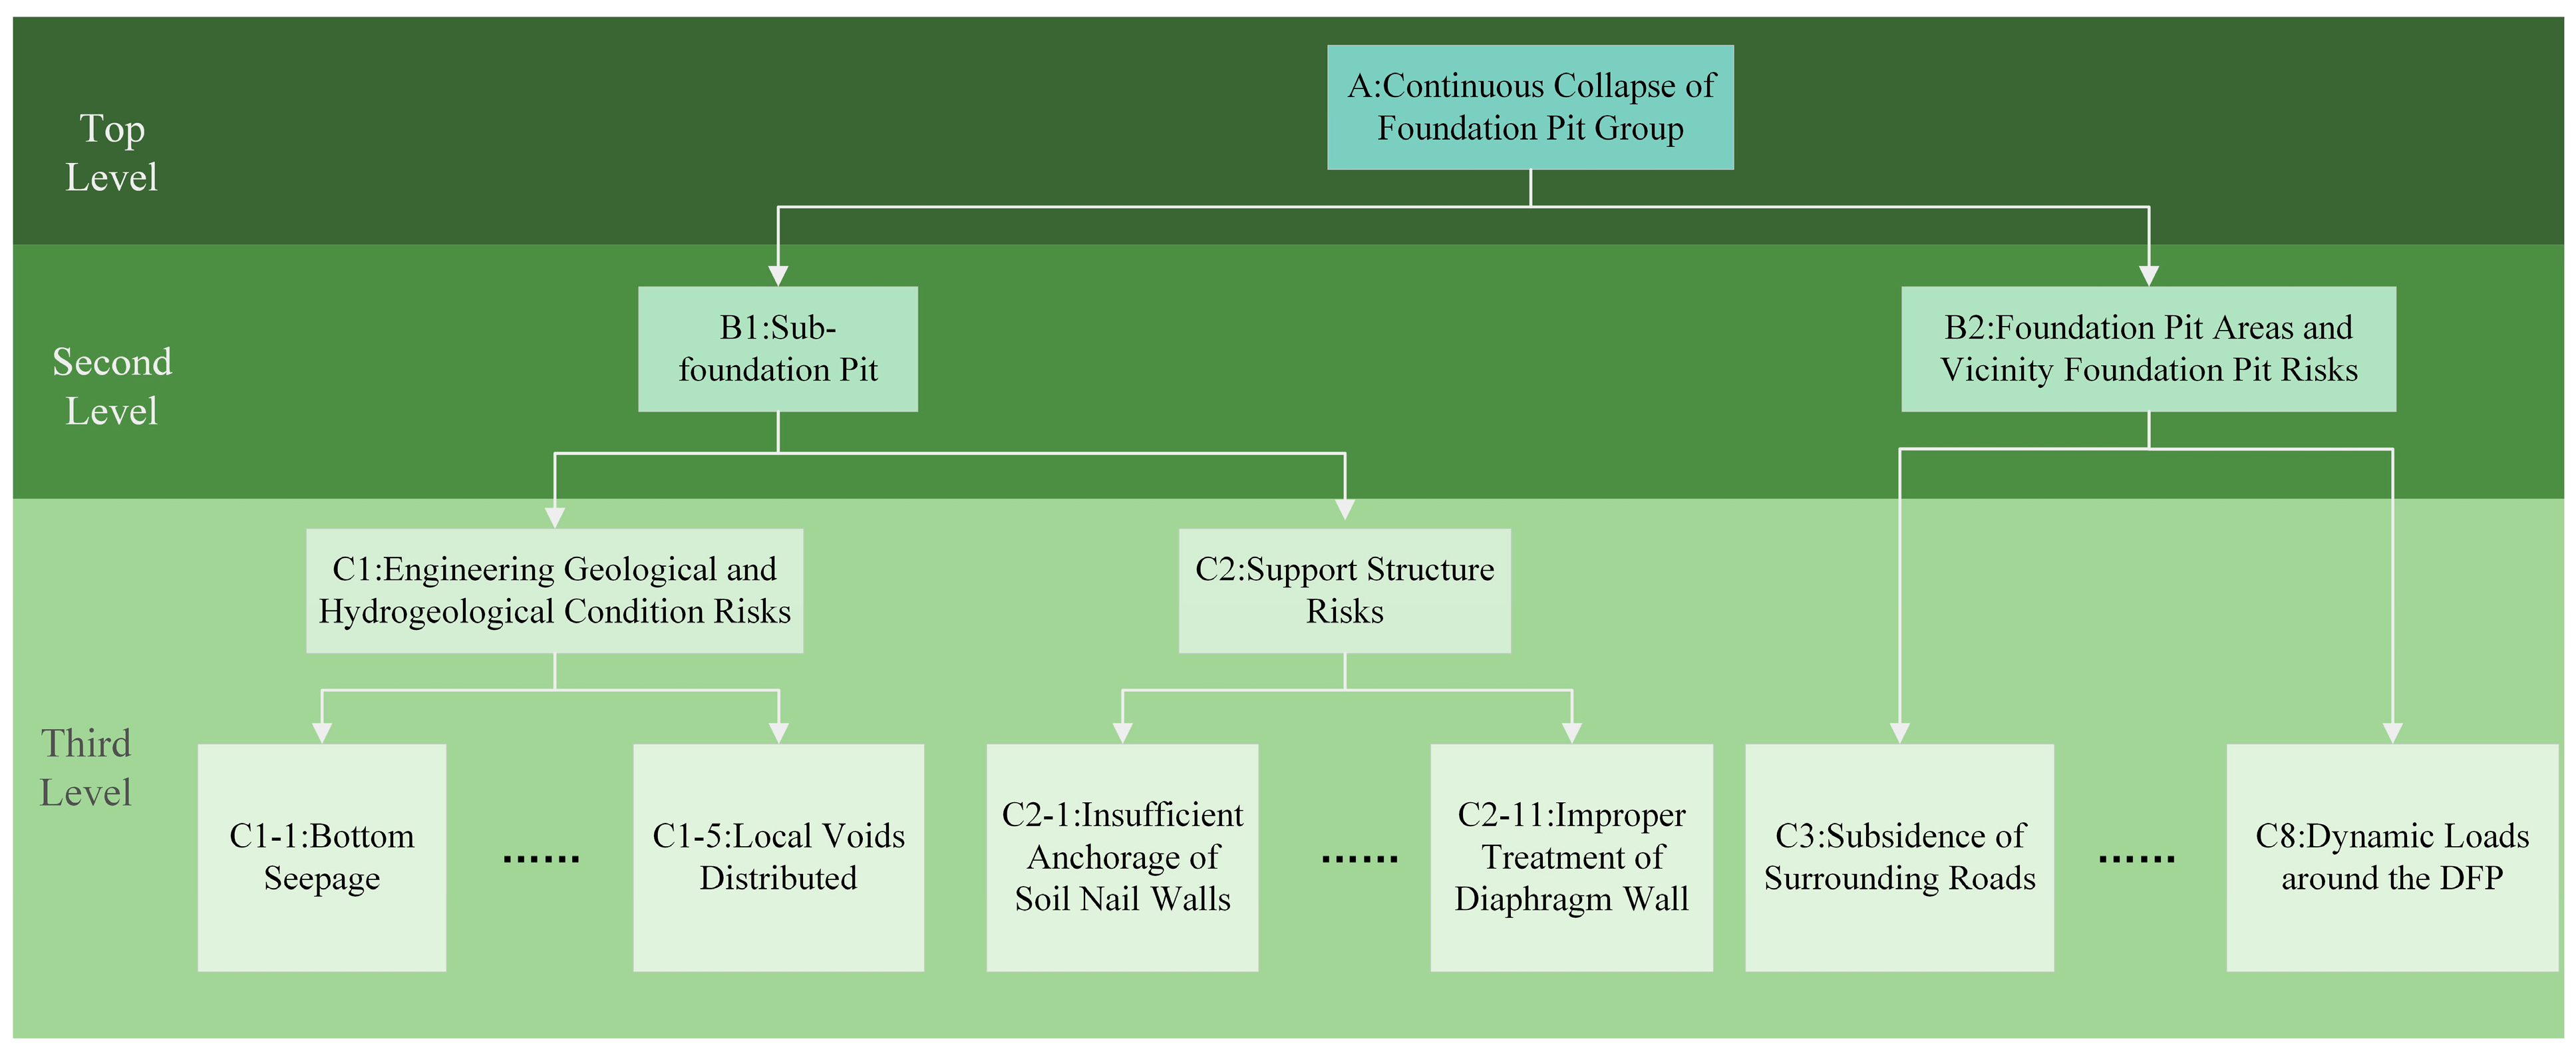
Structured FTA allows for a comprehensive assessment of risks at multiple levels to ensure a better understanding and mitigation of potential hazards within DFPCs. The three-level structure of FTA is described in Figure 2. The detailed hierarchy for each level is shown in Table 1. The third level is subdivided into subfoundation pit risk and foundation pit area risk. These risks are further divided into fundamental risks, which are listed in Table 1.
Figure 2.
Fault tree for risk decomposition of foundation pit clusters.
Table 1.
Risks in the levels associated with DFPCs.
Engineering studies [,] have revealed that localized foundation pit failures critically affect overall stability, as single support collapse and pit spacing can trigger systemic failure when residual supports lack capacity. This study specifically examines support failure (C2-8) and interpit spacing (C7), considering how excavation affects the vicinity of foundation pits. In Table 1, this figure illustrates a multilevel, systematic risk breakdown framework for identifying progressive collapse risk in DFPCs that is characterized by its rigorous structure and clear hierarchy. The framework defines the top-level risk A as “progressive collapse of deep foundation pit clusters” and decomposes it into two secondary risk categories: the intrinsic risk of individual foundation pits, B1, and the risk associated with pit zones and adjacent foundation pits, B2. These secondary risks are further elaborated into a series of specific tertiary risk components. For instance, under B1, “engineering geological and hydrogeological condition risks C1” are identified, whereas, under B2, components such as “retaining structure risk C2” and “settlement of adjacent main roads C3” are included. Each tertiary risk component, in turn, consists of several fundamental risk factors that are highly specific and actionable. For example, C1 encompasses factors such as “water seepage at the pit bottom”, “water leakage from sidewalls”, and “improper treatment of soft soil layers”. Notably, the “support failure” factor under C2 is even differentiated on the basis of its occurrence at various depth intervals in the foundation pit (0H–1/3H, 1/3H–2/3H, and 2/3H–1H). The entire system progresses logically from the top down, tracing macroscopic consequences back to microscopic causes, and thoroughly outlines all potential risk pathways that may lead to the catastrophic progressive collapse of DFPCs. These findings establish a solid foundation for subsequent risk quantification and targeted prevention and control measures.
2.2. Optimizing the Bayesian Network via Structural Learning
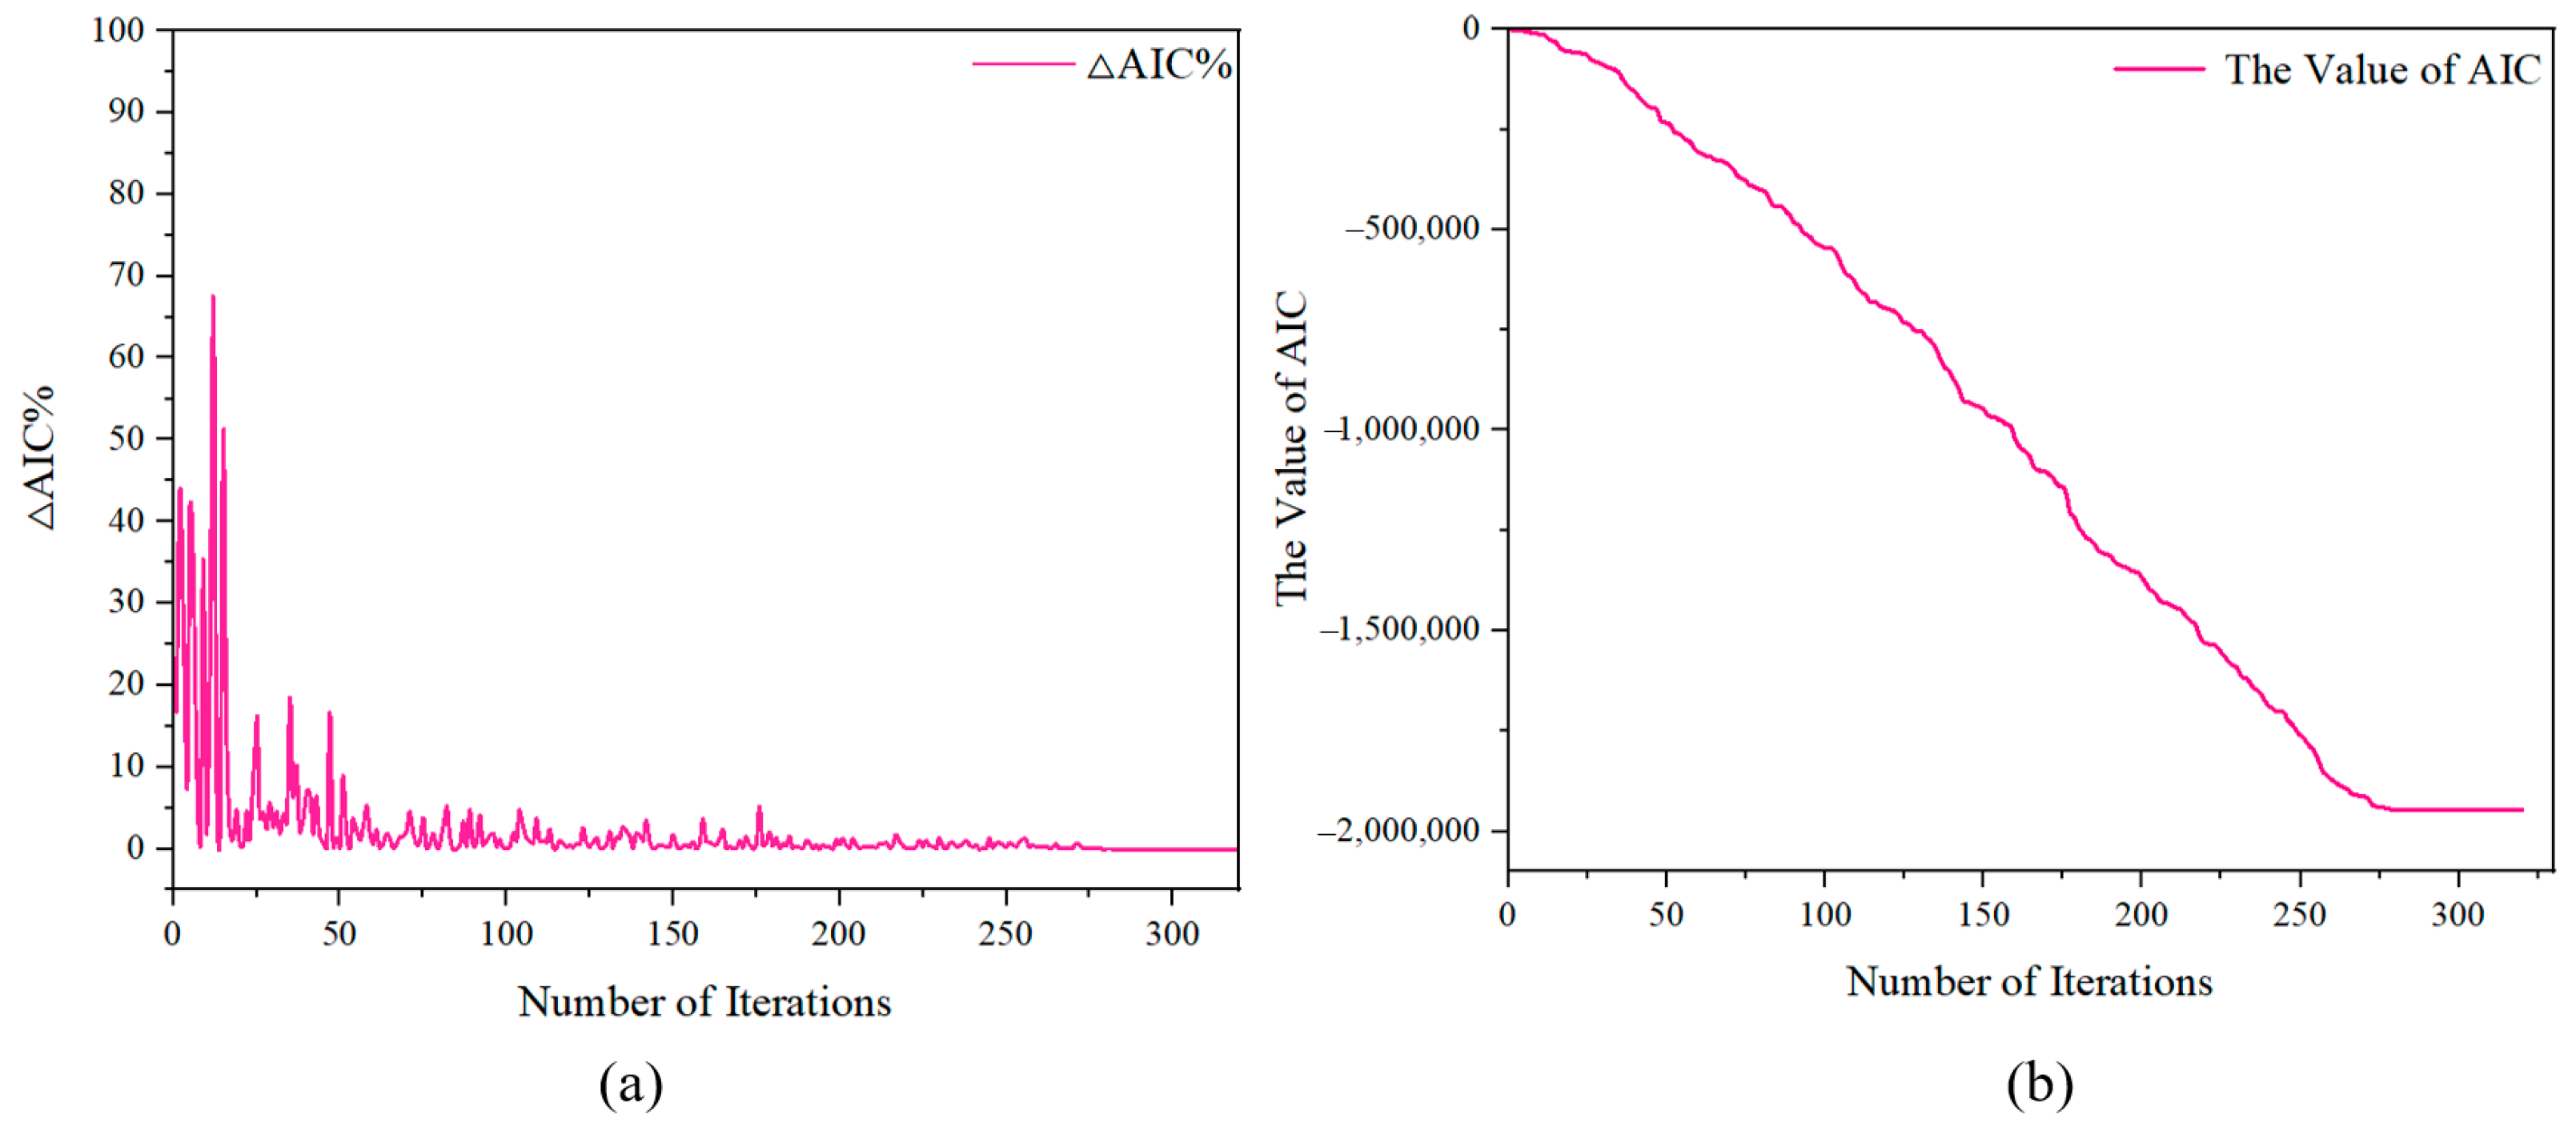
The fault tree was transformed into a BN model by treating the risks and subrisks as nodes in the BN. The identified relationships between risks are defined as directed edges between the nodes. To emphasize the interactions and reduce the strong subjectivity inherent in experts, structural learning is used to optimize the proposed BN to automatically learn the relationships between nodes from the data [,]. The Akaike information criterion (AIC), which is calculated via Equation (1), serves as the objective to evaluate the optimized network structure []. The parameter k represents the number of local risk sources given by subdivisions, and L denotes the value of the likelihood function of the model. A lower AIC value indicates a better model [,]. The tabu search algorithm was selected for structural learning to identify a lower AIC. In Figure 3a,b, the AIC value reached 1,946,218.3 after 320 iterations, and the change rate was less than 0.1% for 40 consecutive iterations.
Figure 3.
(a) AIC value and (b) rate of change in the AIC.
2.3. Probability of Risk Occurrence
To identify the major risks, this study combines the optimized BN with the AHP. An expert evaluation was conducted to assess the questionnaire designed for the root nodes in the optimized BN. This table provides a detailed overview of the composition of the 44 experts who participated in the AHP study. These experts were categorized into four distinct groups on the basis of age and professional background, forming a well-structured and comprehensive knowledge system. The youngest group, aged 25–29, consists of six PhD students specializing in machine learning and geotechnical risk prediction. The 30–39 age group comprises 15 professionals, including senior engineers and assistant professors, who serve as key personnel in project execution; their research focuses on intelligent monitoring, BIM platforms, and urban excavation control. The 14 experts in the 40–49 age group are primarily professors and chief engineers who focus on critical issues such as the progressive failure of foundation pit clusters, code and standard compliance, and parameter uncertainty. The oldest group, aged 50–59, includes nine renowned experts, such as chief scientists and nationally recognized masters, who are dedicated to resilience planning for underground spaces and engineering policy formulation. Overall, this composition ensures a range of expertise from technical implementation to macrolevel strategy and effectively integrates academic innovation with practical engineering experience. Information about the experts is shown in Table 2.
Table 2.
Information about the experts.
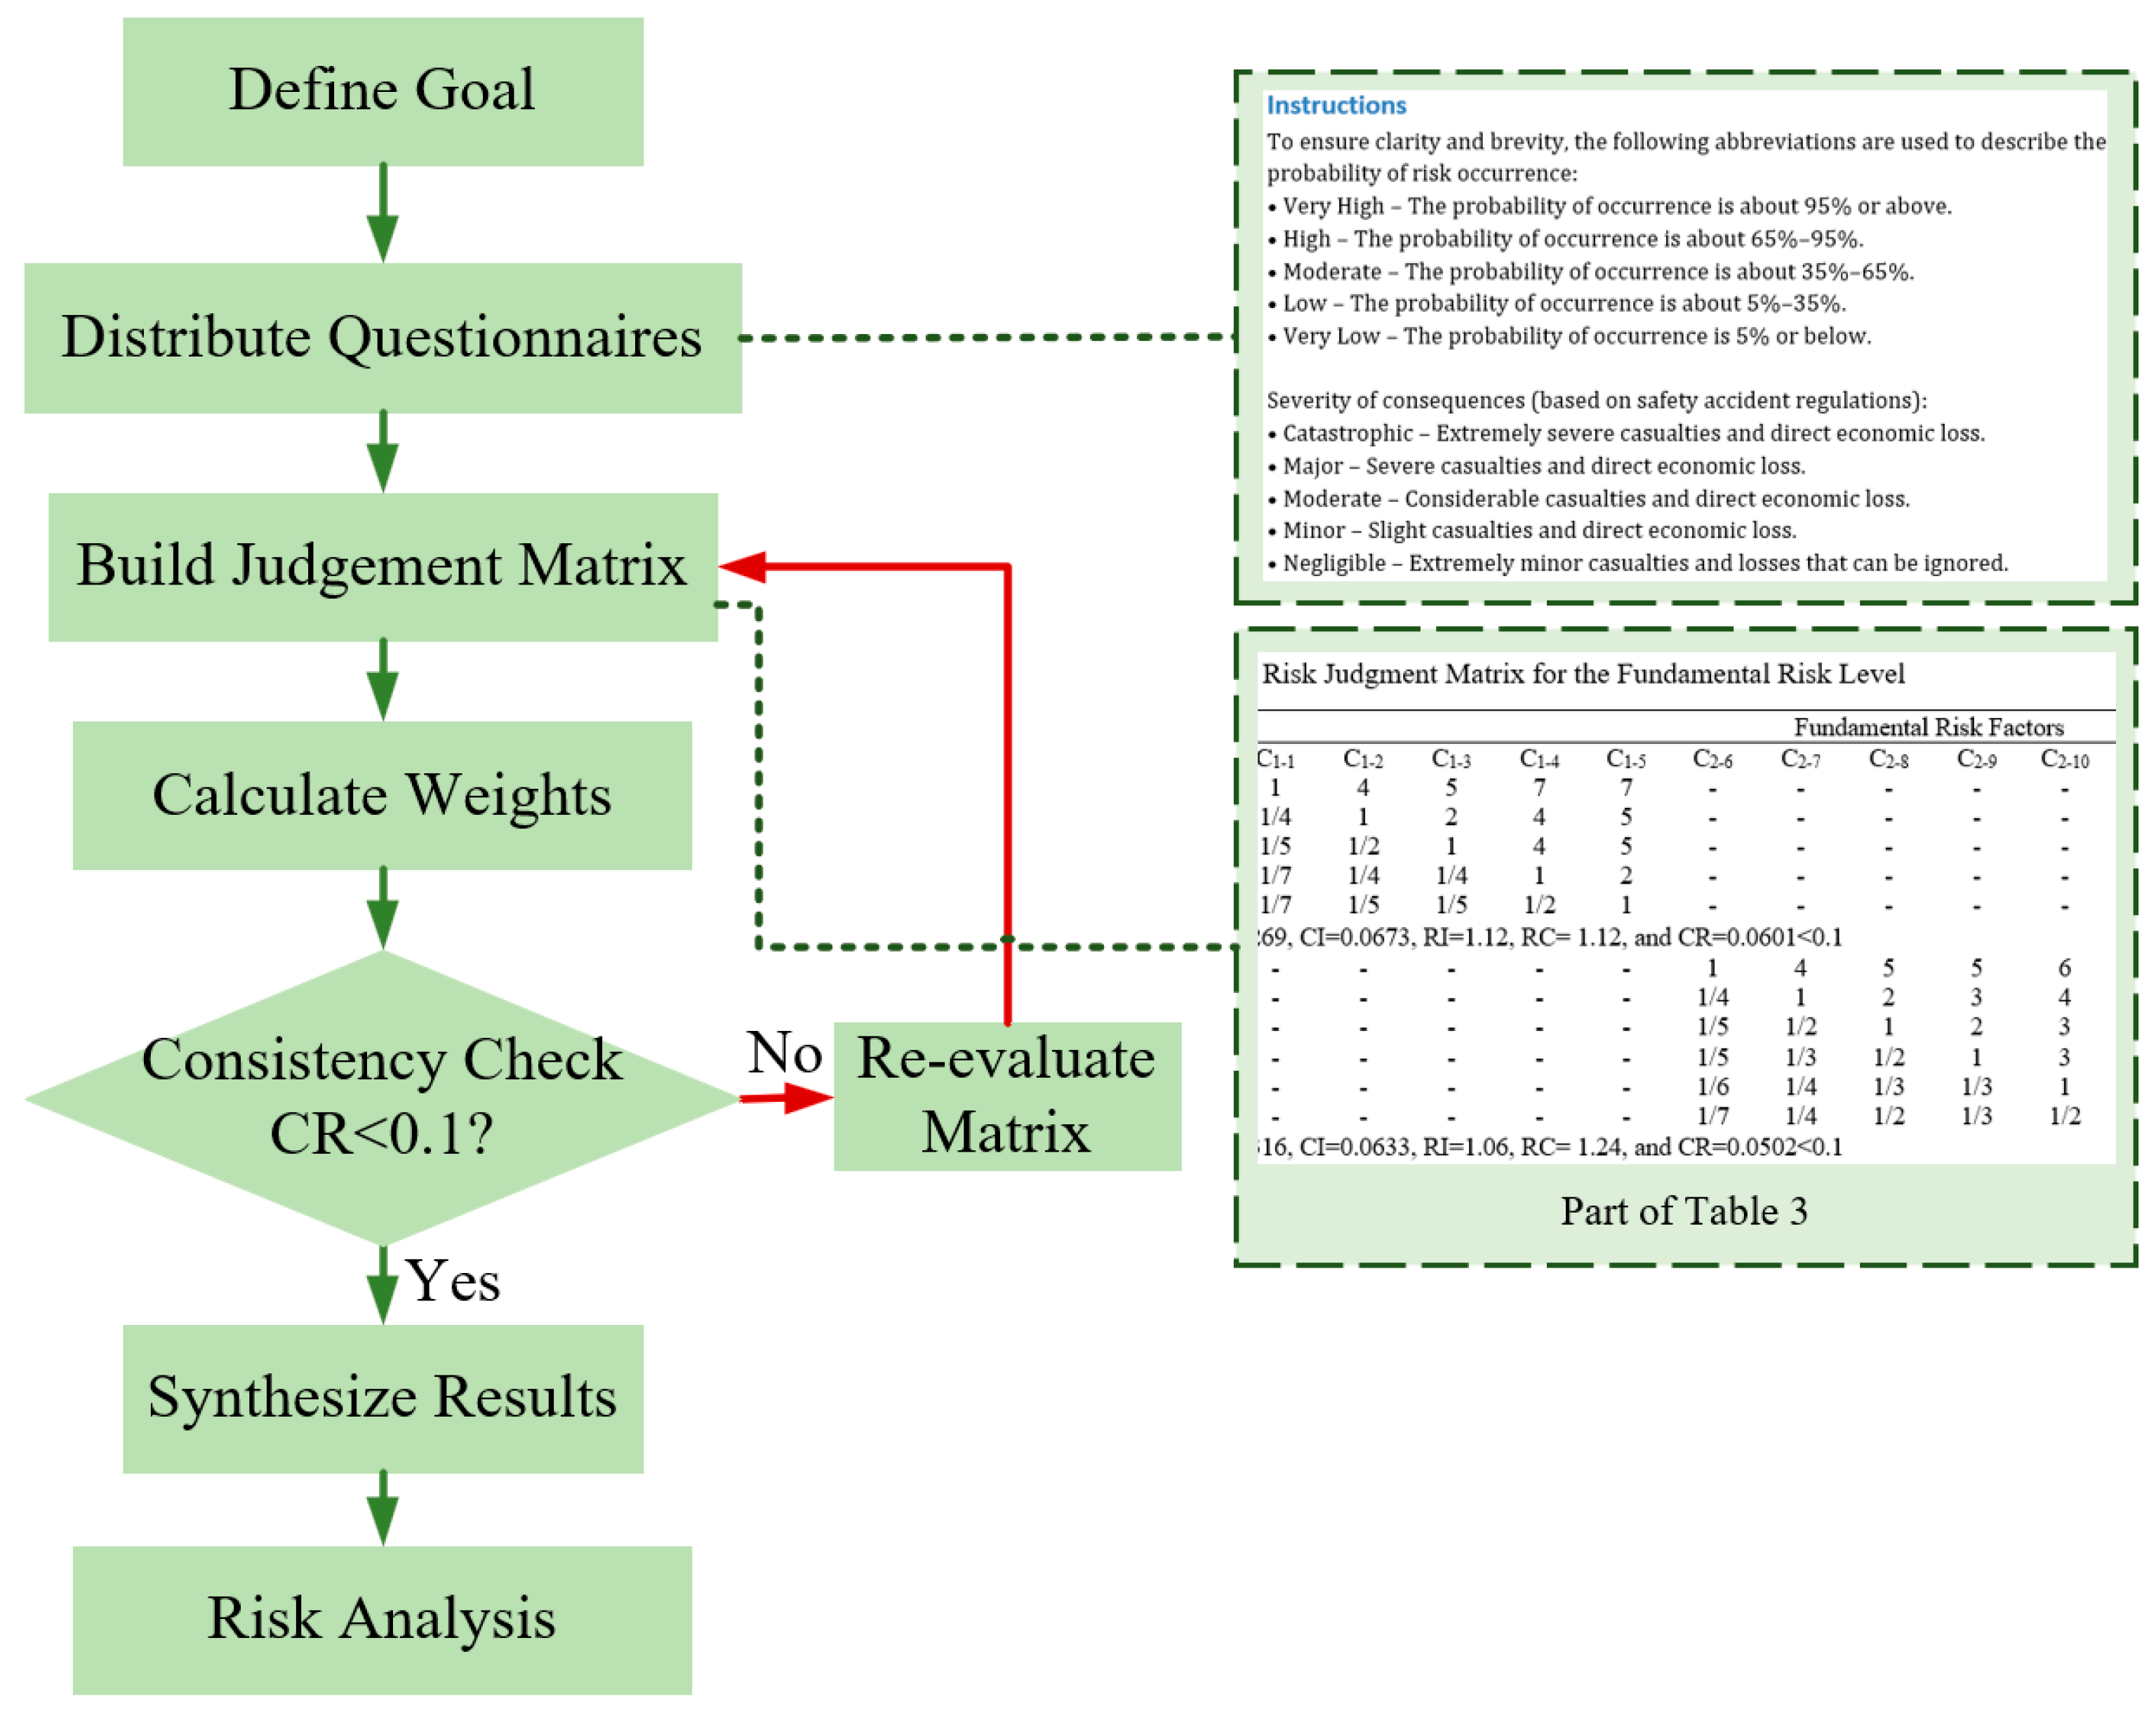
The AHP was applied to process the collected data and ultimately determine the likelihood that each risk event would affect the stability of the foundation pit. Table 3 presents the judgment matrices Aij at the three hierarchical levels of the fault tree and the evaluation indices. The risk judgment matrix Aij was determined via expert evaluations derived from structured survey questionnaires. The eigenvector associated with the maximum eigenvalue λmax of each judgment matrix Aij was calculated via Equations (2)–(4), whereas the maximum eigenvalue was computed via Equation (5). Subsequently, consistency checks were systematically performed on all the matrices to ensure analytical rigor. In Equation (6), CI represents the consistency index and n represents the order of matrix Aij. In Equation (7), RC represents the random consistency index, and the value is determined by the order of the reciprocal inverse judgment matrix Aij. Empirical studies indicate that a CR value less than 0.10 is acceptable []. Figure 4 illustrates the main steps of the AHP method.
Table 3.
Risk judgment matrix for the fundamental risk level.
Figure 4.
The main steps of the AHP.
The determined weight W represents the probability that the occurrence of specific risk events will result in DFPC failure. This study focuses on the effect of support failure locations and pit spacings on DFPC stability. Table 3 and Table 4 both present judgment matrices related to risk evaluation. As an illustration, Table 3 demonstrates the AHP judgment matrix constructed for engineering geological and hydrogeological conditions C1–C5. The pairwise comparisons among these five criteria reveal that C1 holds the highest relative importance, with a weight of 0.5318, followed by C2 0.2126 and C3 0.1541, while C4 0.0600 and C5 0.0416 contribute relatively less to the overall risk assessment. This distribution indicates that geological stability C1 is considered the dominant factor in evaluating risks under the given conditions. The consistency test results (λmax = 5.269, CI = 0.0673, RI = 1.12, CR = 0.0601) all fall within acceptable thresholds, confirming that the weight allocation is logically consistent and reliable.
Table 4.
Risk judgment matrix for the risk factors.
In the BNs, the conditional probability distribution of each risk node within a DFPC relies solely on its parent nodes. Consequently, the joint probability of each risk node refers to risk events and is represented as Xi in Equation (8), where P(Xi) denotes all parent nodes of node Xi and Fa (Xi) represents all parent nodes of Xi.
where xj denotes the subrisks under each category and Y denotes the probability of excavation instability caused by these risks. Given risk Xi = xj and instability Y in Equation (9) and assuming that the probability of pit instability being caused by risk xj is known, this probability can be denoted P(Xi = xj|Y). On the basis of the Bayesian theorem, the conditional probability of Y given Xi = xj is derived as follows:
Table 5 presents the joint probabilities of occurrence and non-occurrence of support structure risks in combination with pit area risks, calculated using Bayesian inference. For the fundamental risks, the table provides detailed probabilities for support failures occurring at different depth intervals (0H~–1/3H, 1/3H~2/3H, and 2/3H~1H). Among these, the probability ratio of failure at 1/3H–2/3H is 0.6986, corresponding to a failure probability of 8.57% relative to the overall failure of the support structure as listed in Table 3 and Table 5. In comparison, failures located at 0H~1/3H and 2/3H~1H contribute smaller portions, with instability probabilities of 0.085% and 0.006%, respectively. These results indicate that mid-depth supports (1/3H~2/3H) exert the most critical influence on the overall stability of the DFPC system. Furthermore, the table also integrates pit spacing as a coupled risk component. Following the same calculation procedure, the probability distribution associated with different pit spacings can be derived. The combined scenario of support failure at 1/3H~2/3H and a pit spacing of 0.25H yields a joint probability of 1.40%. This condition represents a significant risk scenario, as it indicates a relatively high probability of triggering instability propagation across adjacent pits, potentially leading to progressive collapse in DFPCs. Overall, Table 5 provides a hierarchical and quantitative breakdown of how specific support failure locations and pit spacings contribute to the instability of DFPCs. By explicitly linking joint probabilities to structural depth intervals and inter-pit distances, the results highlight both the most vulnerable conditions and the coupled effects that substantially increase the likelihood of cluster-scale instability.
Table 5.
Coupled probability of support structure risk and risk events in the pit area and nearby pits.
3. Case Study
The purpose of the case study is to validate the applicability and accuracy of the proposed assessment framework for urban deep foundation pit clusters. For this purpose, a numerical model was developed on the basis of a real DFP project and simulation of pit failure [,], and the observed results were successfully reproduced. The model was then employed to systematically investigate the effects of support structure failure at different locations on pit stability, as well as the influence of varying pit spacings on cluster interactions. In addition, the framework was applied to a well-documented collapse case in Singapore, where the identified dominant risks were consistent with the actual failure mechanisms. On this basis, the model was further extended to a two-pit configuration to evaluate its applicability to cluster conditions, and the risk assessment outcomes were consistent with the numerical simulation findings.
3.1. Demonstration of Deep Foundation Pit Simulation
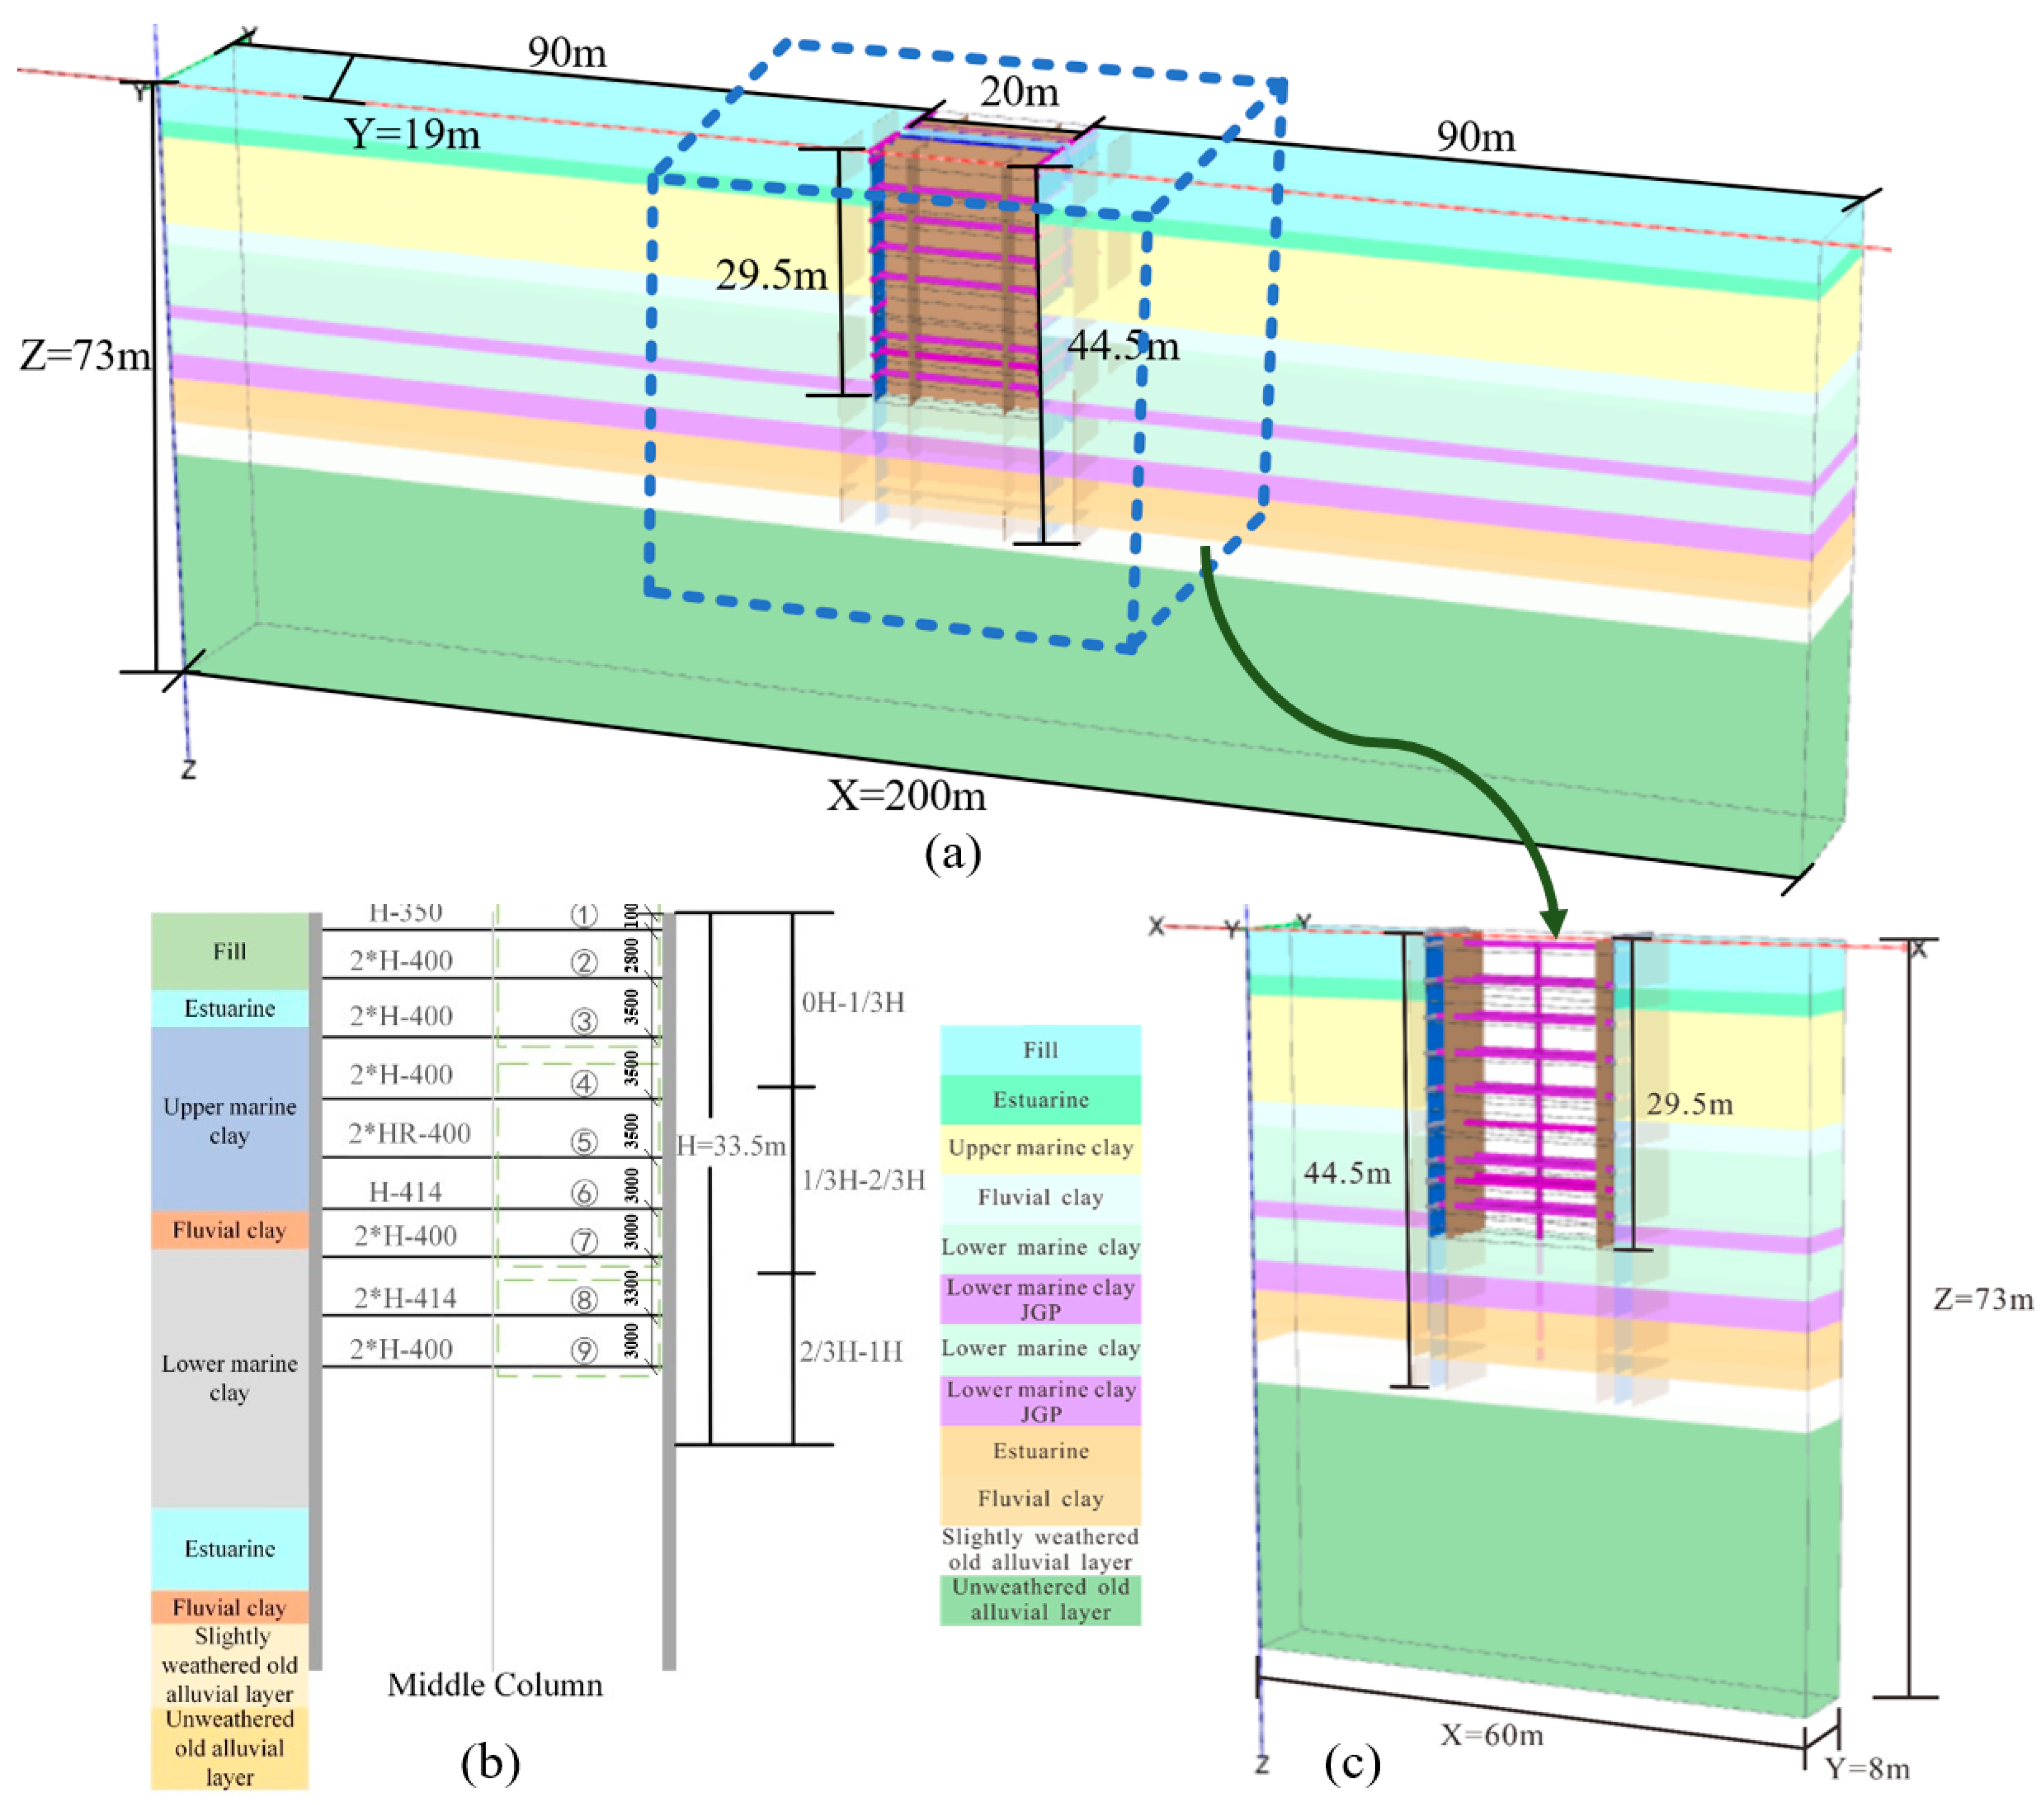
In 2004, the C824 section of the Nicoll Highway Circle Line in Singapore collapsed during excavation because of the failure of the approximately 100 m long foundation pit support system. The foundation pit in the C824 section was approximately 20 m wide, with an excavation depth of H = 33.5 m. This foundation pit employed 0.8 m thick diaphragm walls, each spanning 6 m in width, with the wall toes extending 3 m into hard soil layers. This DFP provided the parameters to develop the simulation model. In Figure 5a, the geometric dimensions of the model were 60 × 8 × 73 m in the x, y, and z directions, respectively, with an excavation depth of 29.5 m. The lateral extents of the numerical model were set to three times the excavation dimension in each direction, in strict accordance with the widely accepted empirical rule in geotechnical numerical simulation []. For clarity of visualization in the figures, only a representative portion of the model near the excavation is displayed in the paper.
Figure 5.
(a) The whole model; (b) numerical simulation model size and (c) cross-section of pit excavation.
The vibro-compacted pile reinforcement layer (hereinafter referred to as the JGP) is represented by a linear elastic model to simulate undrained construction conditions. The remaining soil layers were modeled via the hardening soil (HSS) model. The DFP was simulated using the Finite Element Method (FEM) via the PLAXIS 3D software (version 22.01.00.452) under static conditions. In terms of boundary conditions, the bottom of the model was fixed in all directions, while the lateral boundaries were constrained normal to their respective planes to approximate semi-infinite field conditions and minimize boundary effects. A staged construction analysis was performed to sequentially simulate excavation steps and the installation of supports, accounting for changes in stresses and deformations throughout the process. The primary loads considered included soil self-weight, surcharge loads, and hydrostatic pressure. Table 6 and Table 7 list the soil parameters and structural specifications. Additionally, the central columns of the support structures are designed as solid circular arc beams with a diameter of 1 m and a stiffness of 40 GPa.
Table 6.
Soil parameters for each layer.
Table 7.
Physical and mechanical structural parameters.
The detailed excavation sequence and the corresponding support installation procedures are summarized in Table 8. The excavation depth for each layer is as follows: layer 1: 1.5 m; layers 2–6: 3.5 m; and layers 7–9: 2.5 m. All struts were installed 0.5 m above the excavation surface of each respective layer.
Table 8.
The details of the excavation sequence.
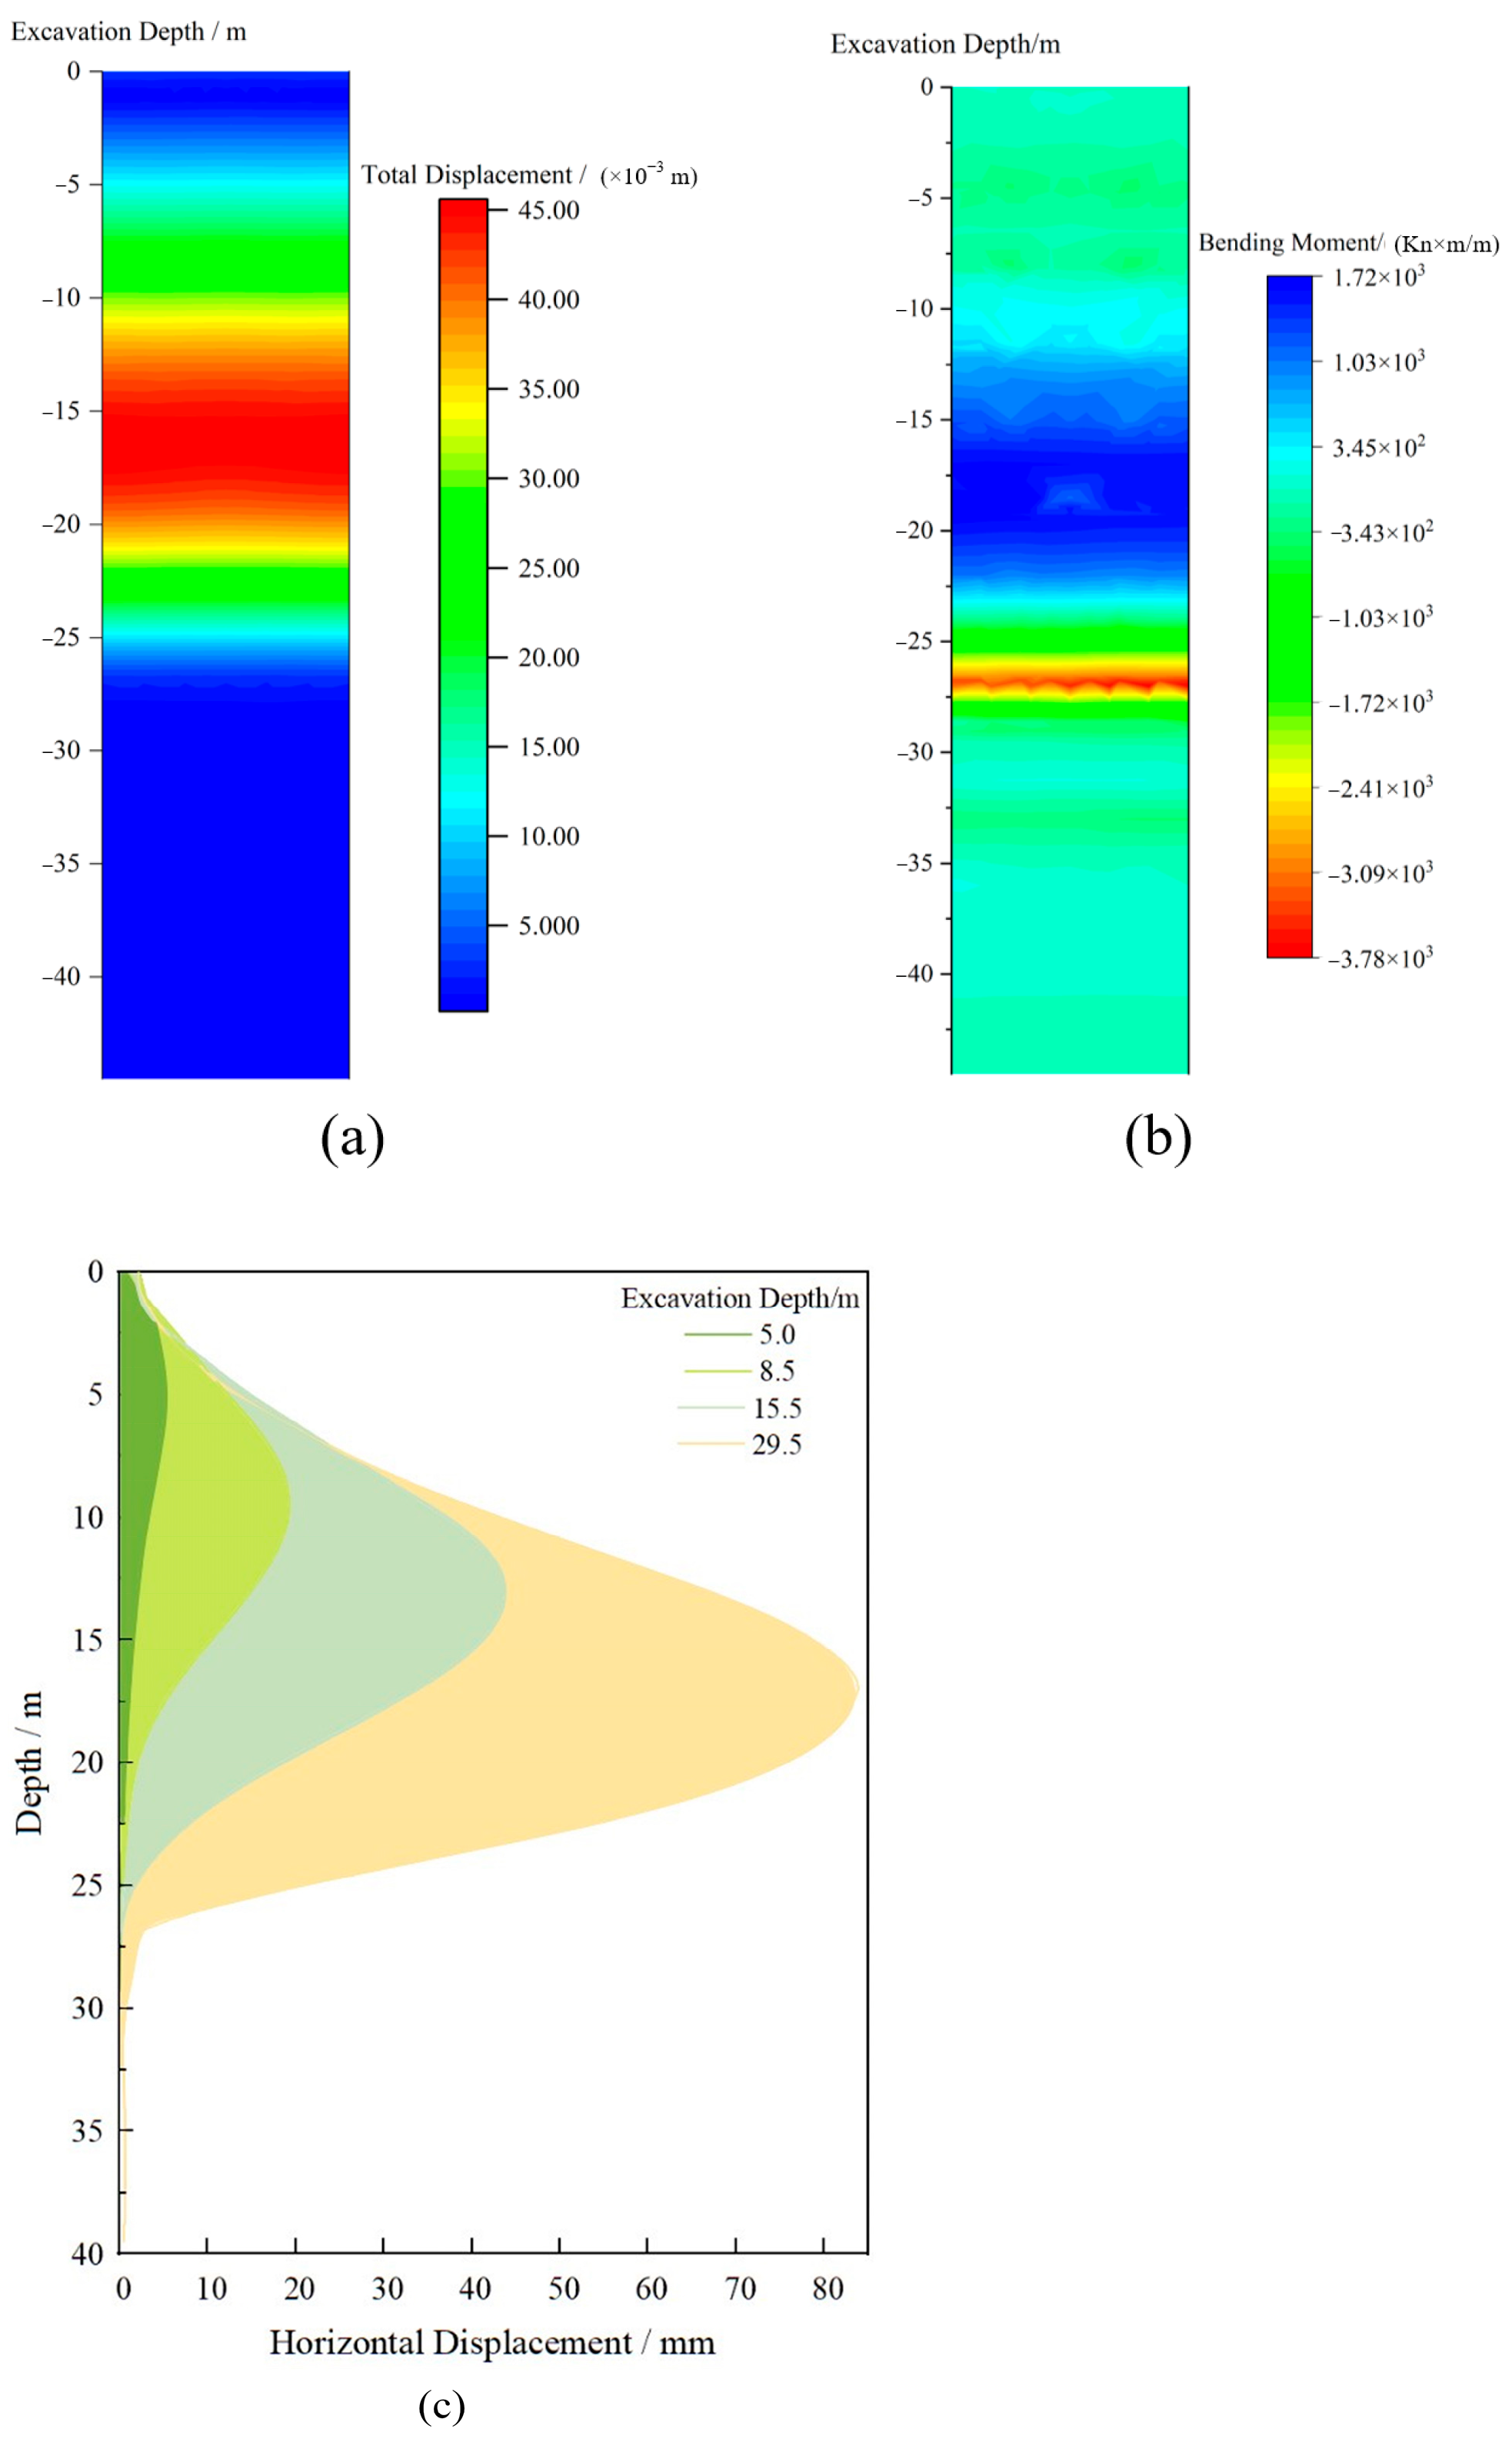
As summarized in Table 9 and Figure 6, which present key mechanical indicators of the diaphragm wall, the proposed model generally demonstrates generally consistent behavior with the reference model established by Zheng []. While most of the results are in close agreement, the positive bending moment differs by 24.89%. Although both models employed the HSS constitutive model, minor differences in soil parameters—such as stiffness moduli, strength properties, or small-strain parameters—may account for variations in the stress-strain response, consequently influencing the internal forces in the supporting structures. Importantly, despite these minor deviations that likely arise from detailed modeling assumptions, both models show strong consistency in deformation trends and bending moment patterns. The observed discrepancy remains within acceptable margins for complex geotechnical simulations, underscoring the reliability of the proposed model. This error analysis not only identifies potential sources of numerical variability but also enhances the technical rigor and credibility of the model validation.
Table 9.
Mechanical indicators of the diaphragm wall.
Figure 6.
Mechanical indicators of the diaphragm wall: (a) contour maps of horizontal displacement, (b) contour maps of bending moments, and (c) horizontal displacement of diaphragm walls at various stages of excavation.
3.2. Simulation of Support Failure in a Single Foundation Pit
The safety factor is defined as Z in Equation (10) and is calculated as the ratio of the ultimate bearing capacity to the axial force component at the final excavation stage. The axial force component at the final excavation stage was derived via numerical simulation. In Equation (10), the parameter Z1 denotes the prefailure safety factor under intact structural conditions and the parameter Z2 represents the postfailure safety factor accounting for progressive collapse mechanisms. The variable x represents the rate of change in the safety factors in the two operational states.
The rate of change rate in safety factor is positive if the failure of a particular support decreases the safety of supports in subfoundation pits or nearby foundation pits. Conversely, the rate of change in the safety factor is negative if the failure of the support affects only the safety of the supports in subfoundation pits or near foundation pits. The axial compression ultimate bearing capacities of the support layers exhibit substantial variability across different strata, with values ranging from 1.20 × 10³ kN to 9.12 × 10³ kN. Layers 3, 4, 5, 7, and 9 exhibit the highest capacity of 9.12 × 10³ kN. In contrast, Layers 1, 2, 6, and 8 present intermediate values of 3.56 × 10³ kN, 4.56 × 10³ kN, 6.34 × 10³ kN, and 1.20 × 10³ kN, respectively.
The foundation pit supports were categorized into three groups on the basis of their positions. As shown in Figure 5b, supports ① to ③ were located within 0H~1/3H, the second group of supports ④ to ⑦ were located within 1/3H~2/3H, and the remaining supports ⑧ to ⑨ were located within 2/3H~1H.
To systematically investigate the effect of support failure on DFP stability, this study categorized support systems into 24 distinct scenarios on the basis of predefined failure patterns. These scenarios are classified into three distinct failure patterns: failure of a single support, concurrent failure of two adjacent supports, and simultaneous failure of three consecutive supports. The red circle indicates the variation in axial force of adjacent supports. The green circle denotes the rates of change in the safety factor of the supports in comparison to other locations. For the failures of a single support, a pair of adjacent supports, and three adjacent supports, the rates of change in the safety factors for the remaining supports are shown in Figure 7a, where the X axis represents the rate of change in the safety factor for the remaining supports after a specific support fails and the Y axis represents the failure location. For example, in Figure 7a, when the sixth single support fails, the rate of change in the safety factors for the adjacent lower support reaches 43.08%. This value is approximately twice that of the adjacent upper support, which is 22.83%. These findings indicate that the lower adjacent support bears most of the load released by the failed support. Similarly, the same situation can be observed in Figure 7b,c for the groups of supports involving the failure of the sixth support.
Figure 7.
Rates of change in the safety factors of the remaining supports: (a) one support failure, (b) two adjacent support failures, and (c) three adjacent support failures.
When the effect of a single support failure on the overall DFP stability was analyzed, the failure of supports ranging from the third to seventh locations caused a greater rate of change in the remaining supports than the failure of the support at other locations did. In Figure 7, compared with the scenario involving the failure of the second support, the failure of the third support induced a 40% increase in the rate of change in the safety factor for its adjacent lower support. Compared with the failure of the eighth support, the failure of the seventh support resulted in a 55% reduction in the rate of change in the safety factor of its lower adjacent support. Similar patterns were consistently observed in the multisupport failure scenarios in Figure 7b,c. These findings demonstrate that the supports at the middle locations must bear substantially higher loads.
The analysis of the support failures in various scenarios indicates that the adjacent supports bear the most load released by the failed supports and that the lower supports bear greater load. The failure of supports occurring in the middle region of the DFP, specifically ranging from 1/3H to 2/3H, can substantially affect the overall stability of the DFP. The results are consistent with the conclusions of the risk assessment framework, thereby providing an empirical validation of its methodological effectiveness.
3.3. Evaluation of Support Failure in Deep Foundation Pit Clusters (DFPCs)
The stability of foundation pits is affected by both the spacing and arrangement of the pits. Different spacings of nearby foundation pits can cumulatively affect the surrounding soil []. In this section, the coupled effects of three risk factors on the stability of a subfoundation pit and the DFPC are investigated, including the failed support, arrangement of the DFPC, and spacing between pits.
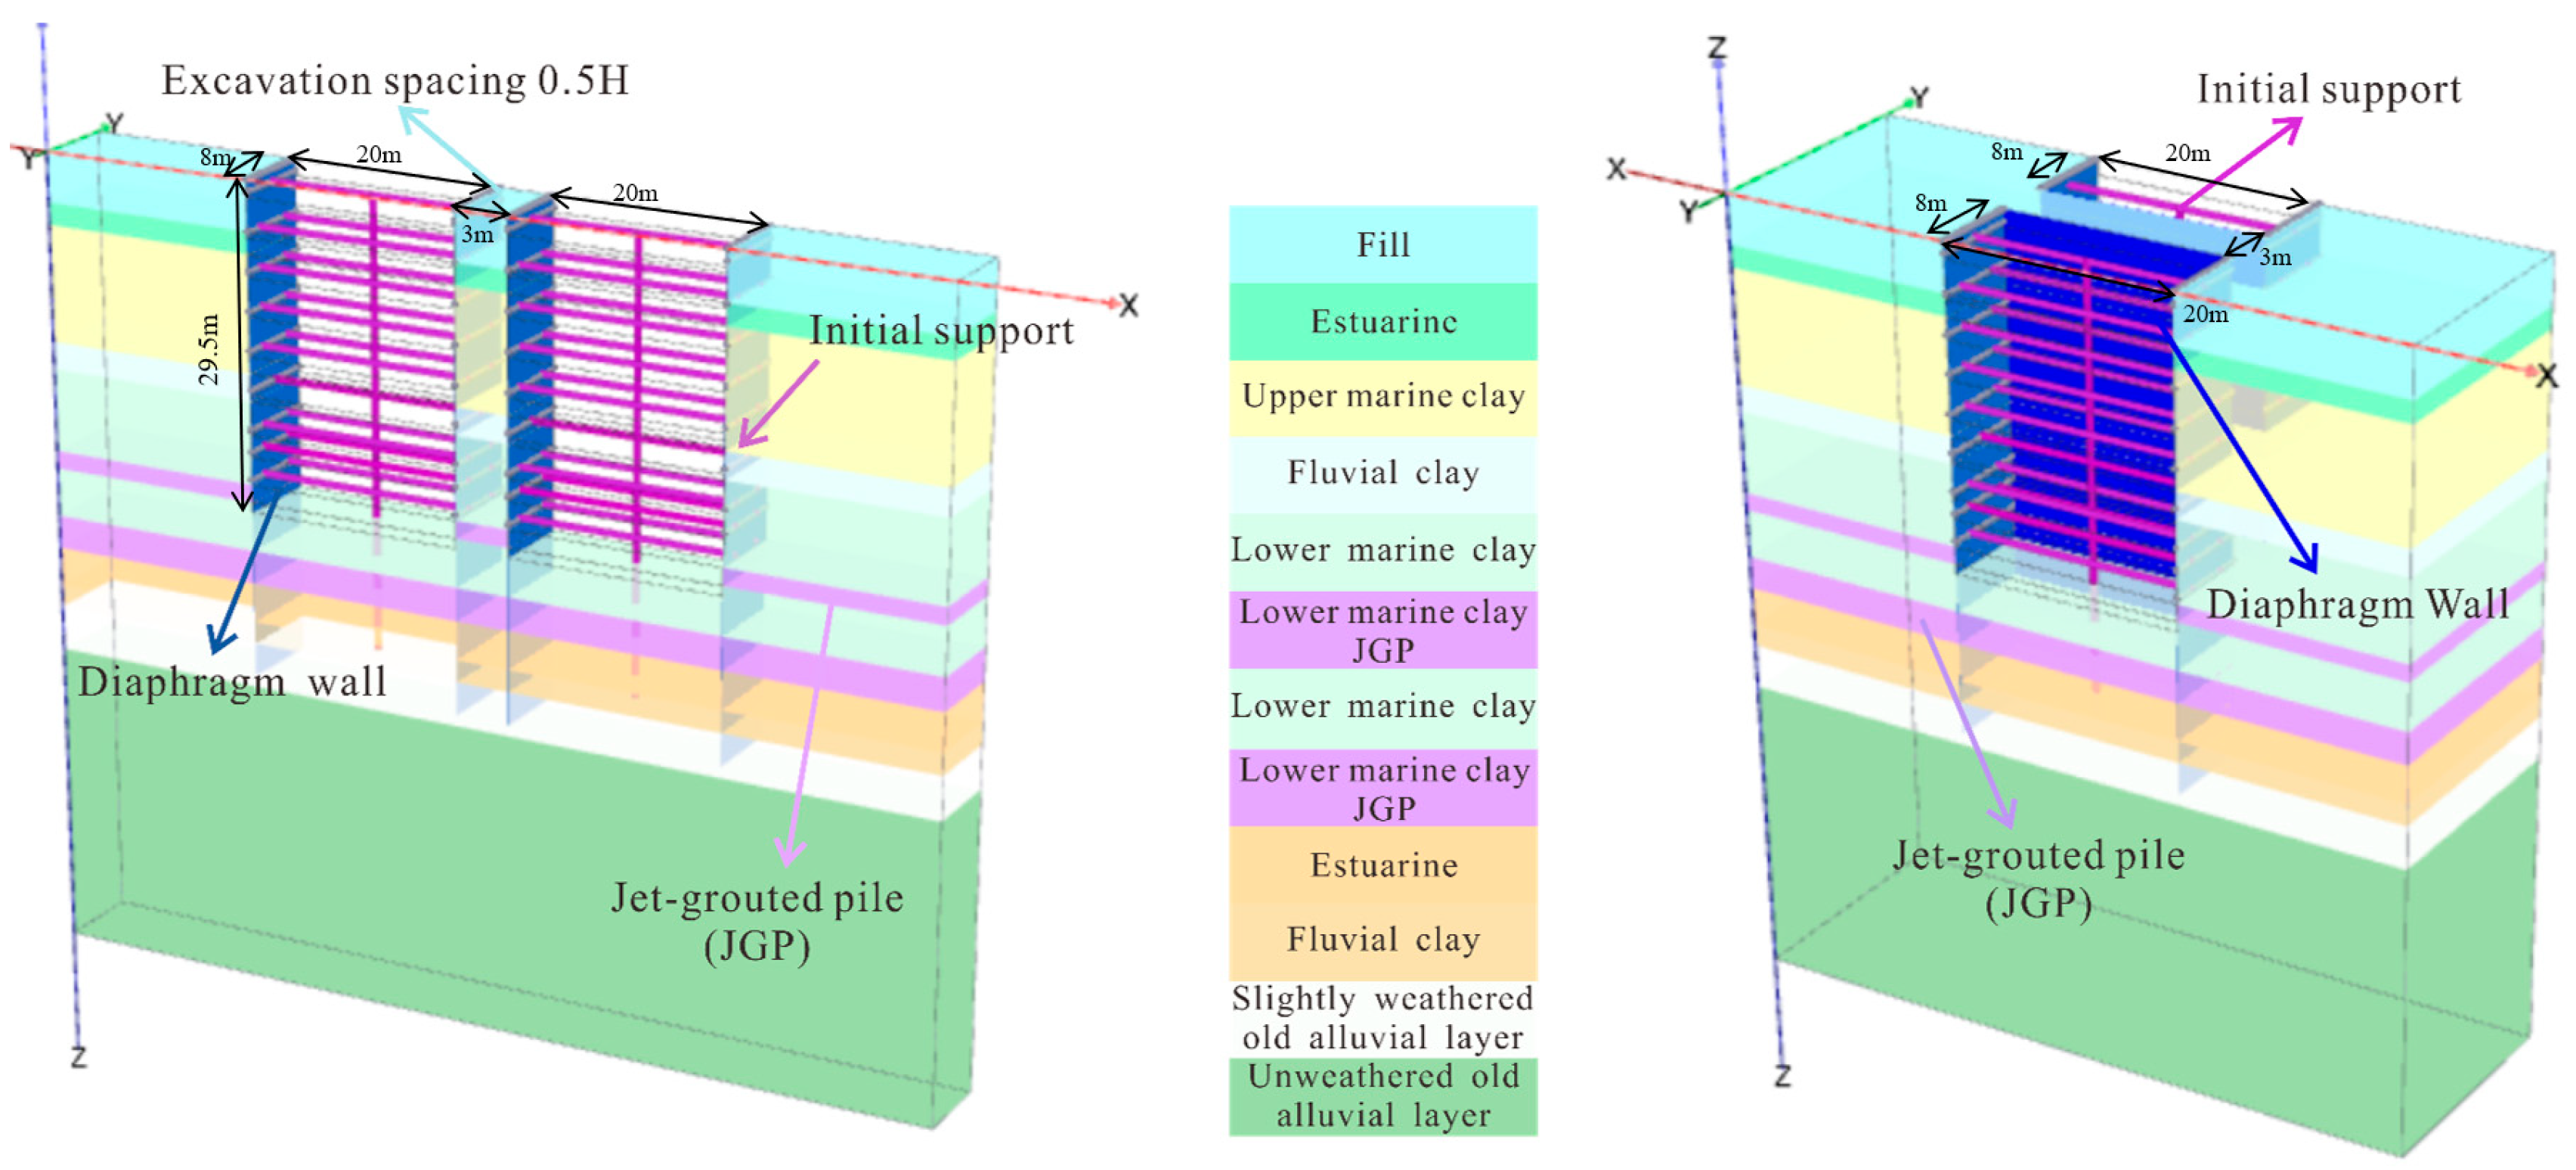
On the basis of the configurations of the pit layouts, the foundation pits can be categorized into parallel and in line, as shown in Figure 8. The configurations of the spacings between foundation pits are 2.0H, 1.0H, 0.75H, 0.5H, 0.25H, and 0.10H, where H is the depth of the DFP.
Figure 8.
Pit layout: (Type a in the left) in line and (Type b in the right) parallel.
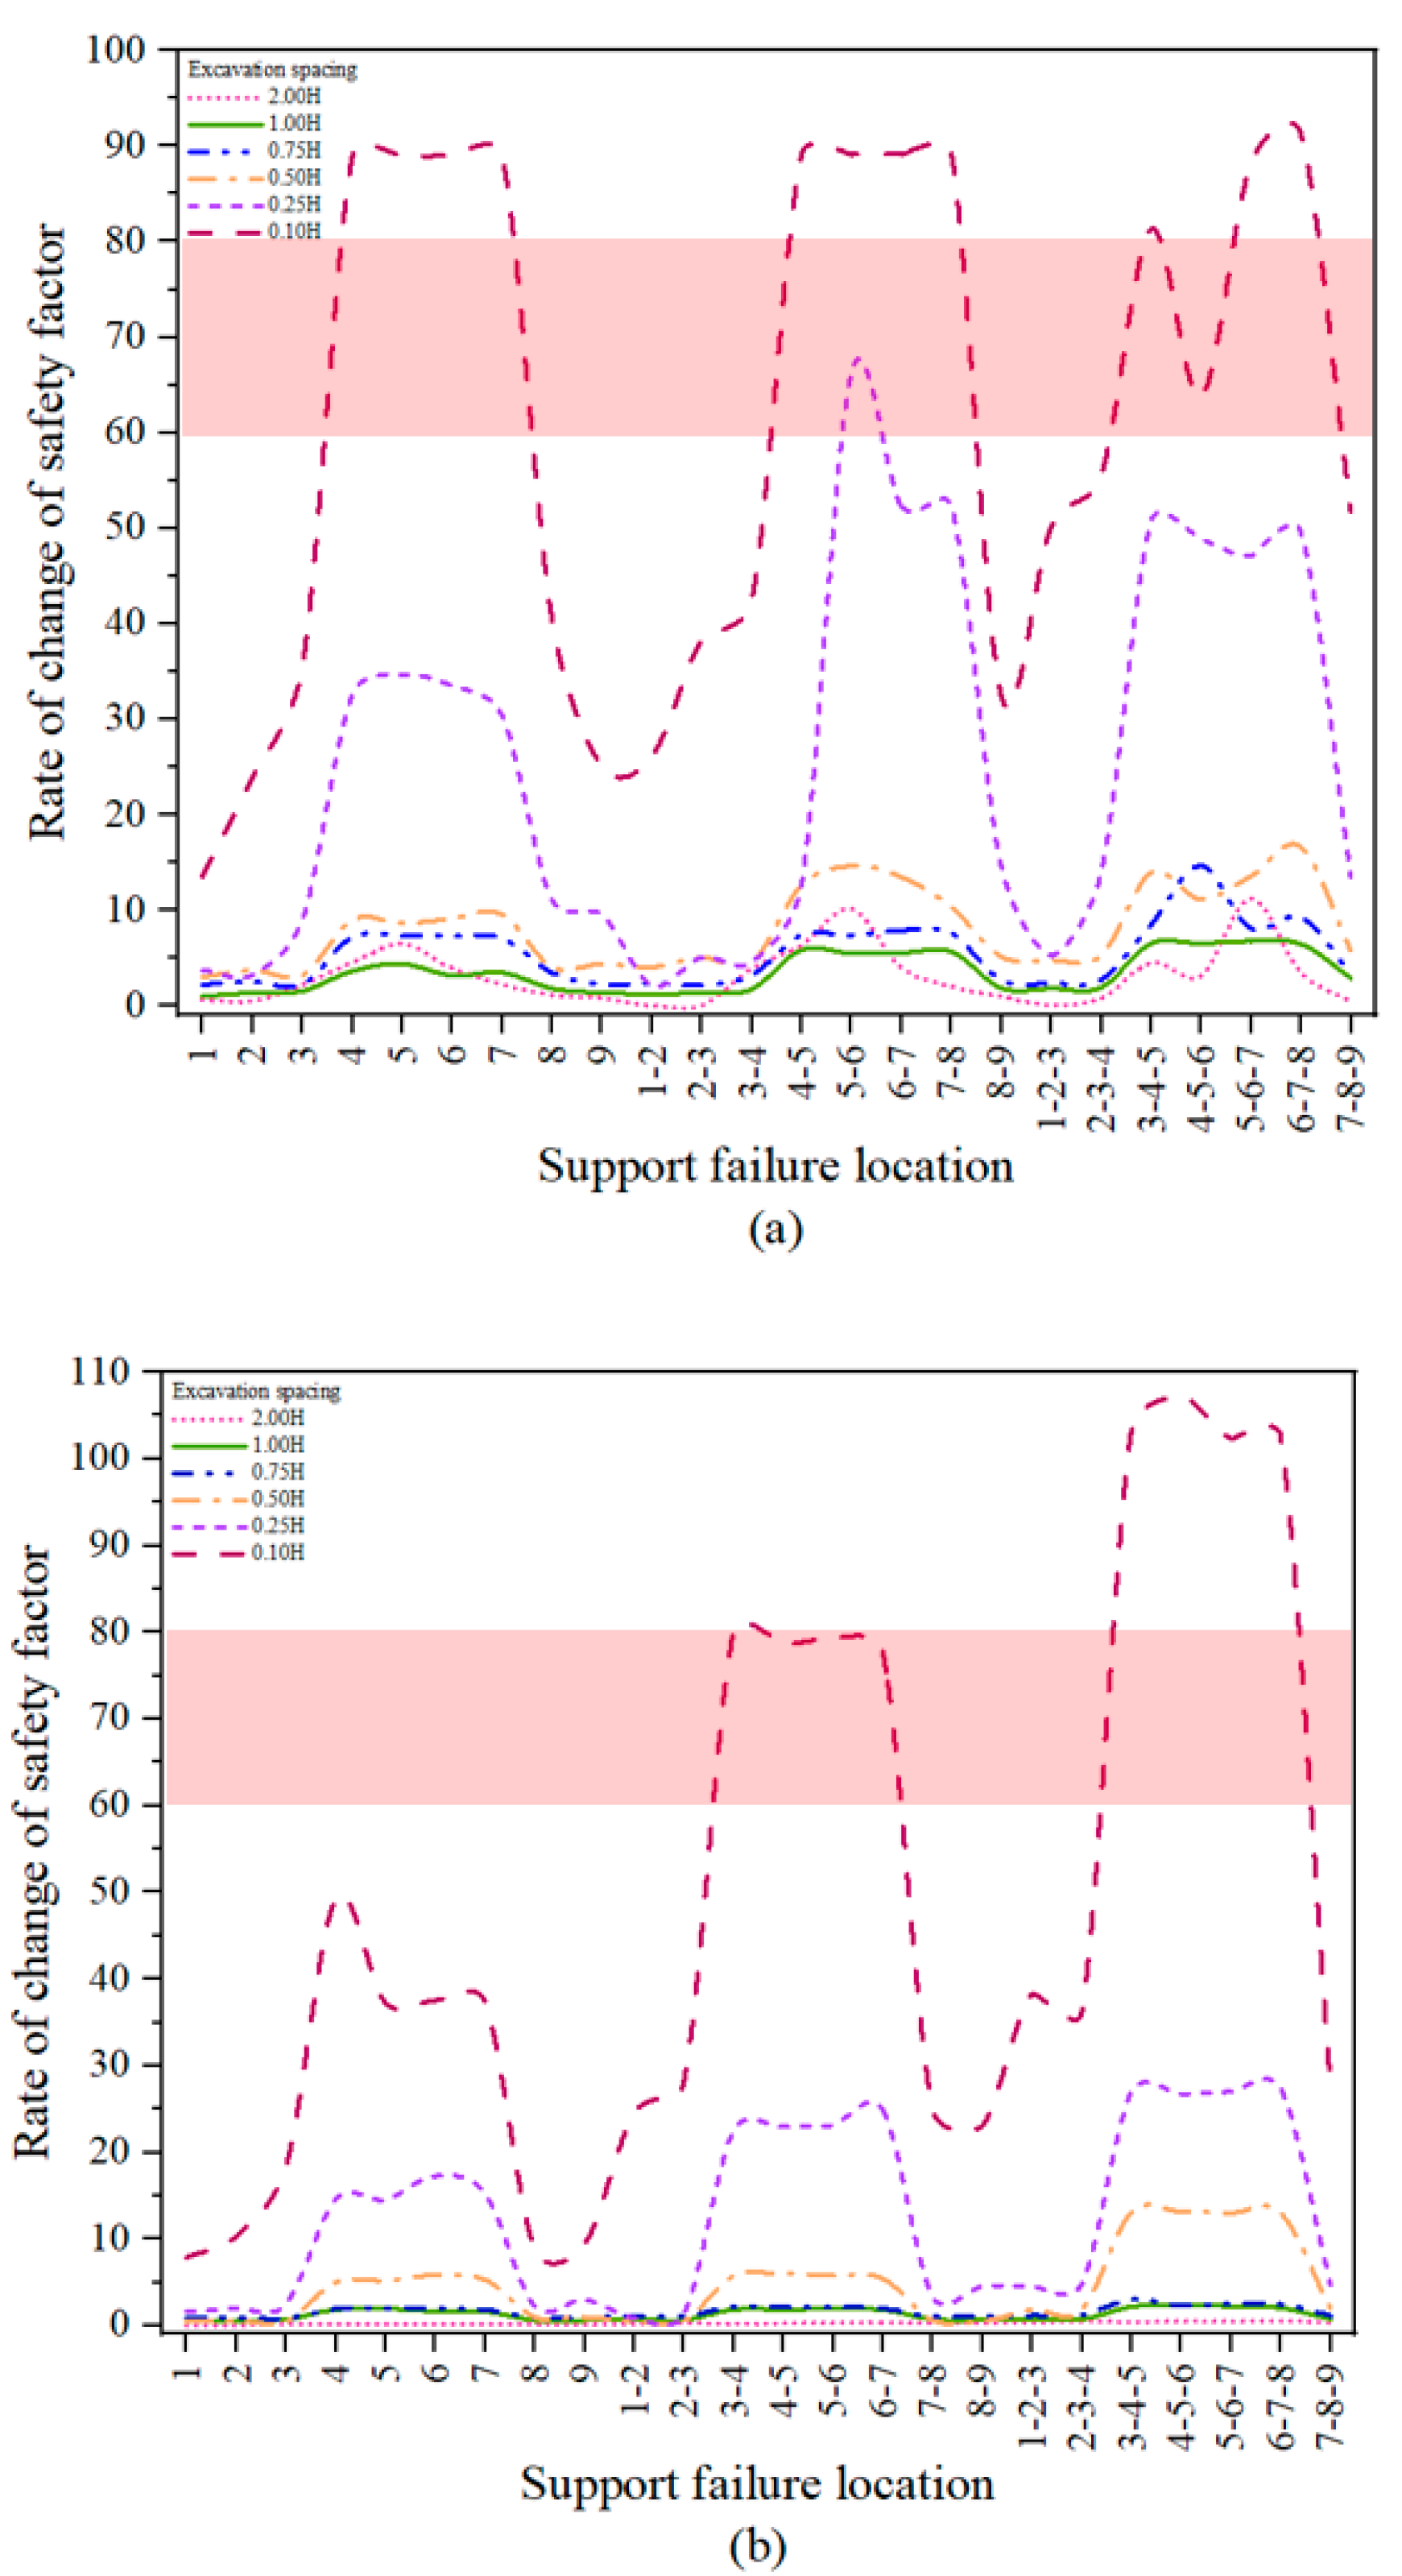
In this this study, the effects of support failures within subfoundation pits coupled with each of the other risk factors on the supports near the pit were examined. As shown in Figure 9, the rate of change in the safety factors for nearby pits in both layouts gradually increases as the pit spacing decreases. Figure 9 shows that support failure scenarios ①–③ induce significantly greater deterioration in adjacent excavation safety factors—with an impact that is at least 40% greater—than failure cases ④–⑨ do. As shown Figure 9b, middle support failures generate stepwise progression of safety factor variations, confirming that increasing the number of failures amplifies interexcavation effects. Per the Technical Code for Monitoring of Building Foundation Excavation Engineering (GB 50497-2015), early warning protocols must be activated when support axial forces reach 60–80% of the design capacity, which is indicated by the red shaded zone in Figure 9. Immediate mitigation measures are required when parameters enter or exceed this critical threshold.
Figure 9.
Rate of change in the safety factors of the adjacent pit: (a) in line pit layout and (b) parallel pit layout.
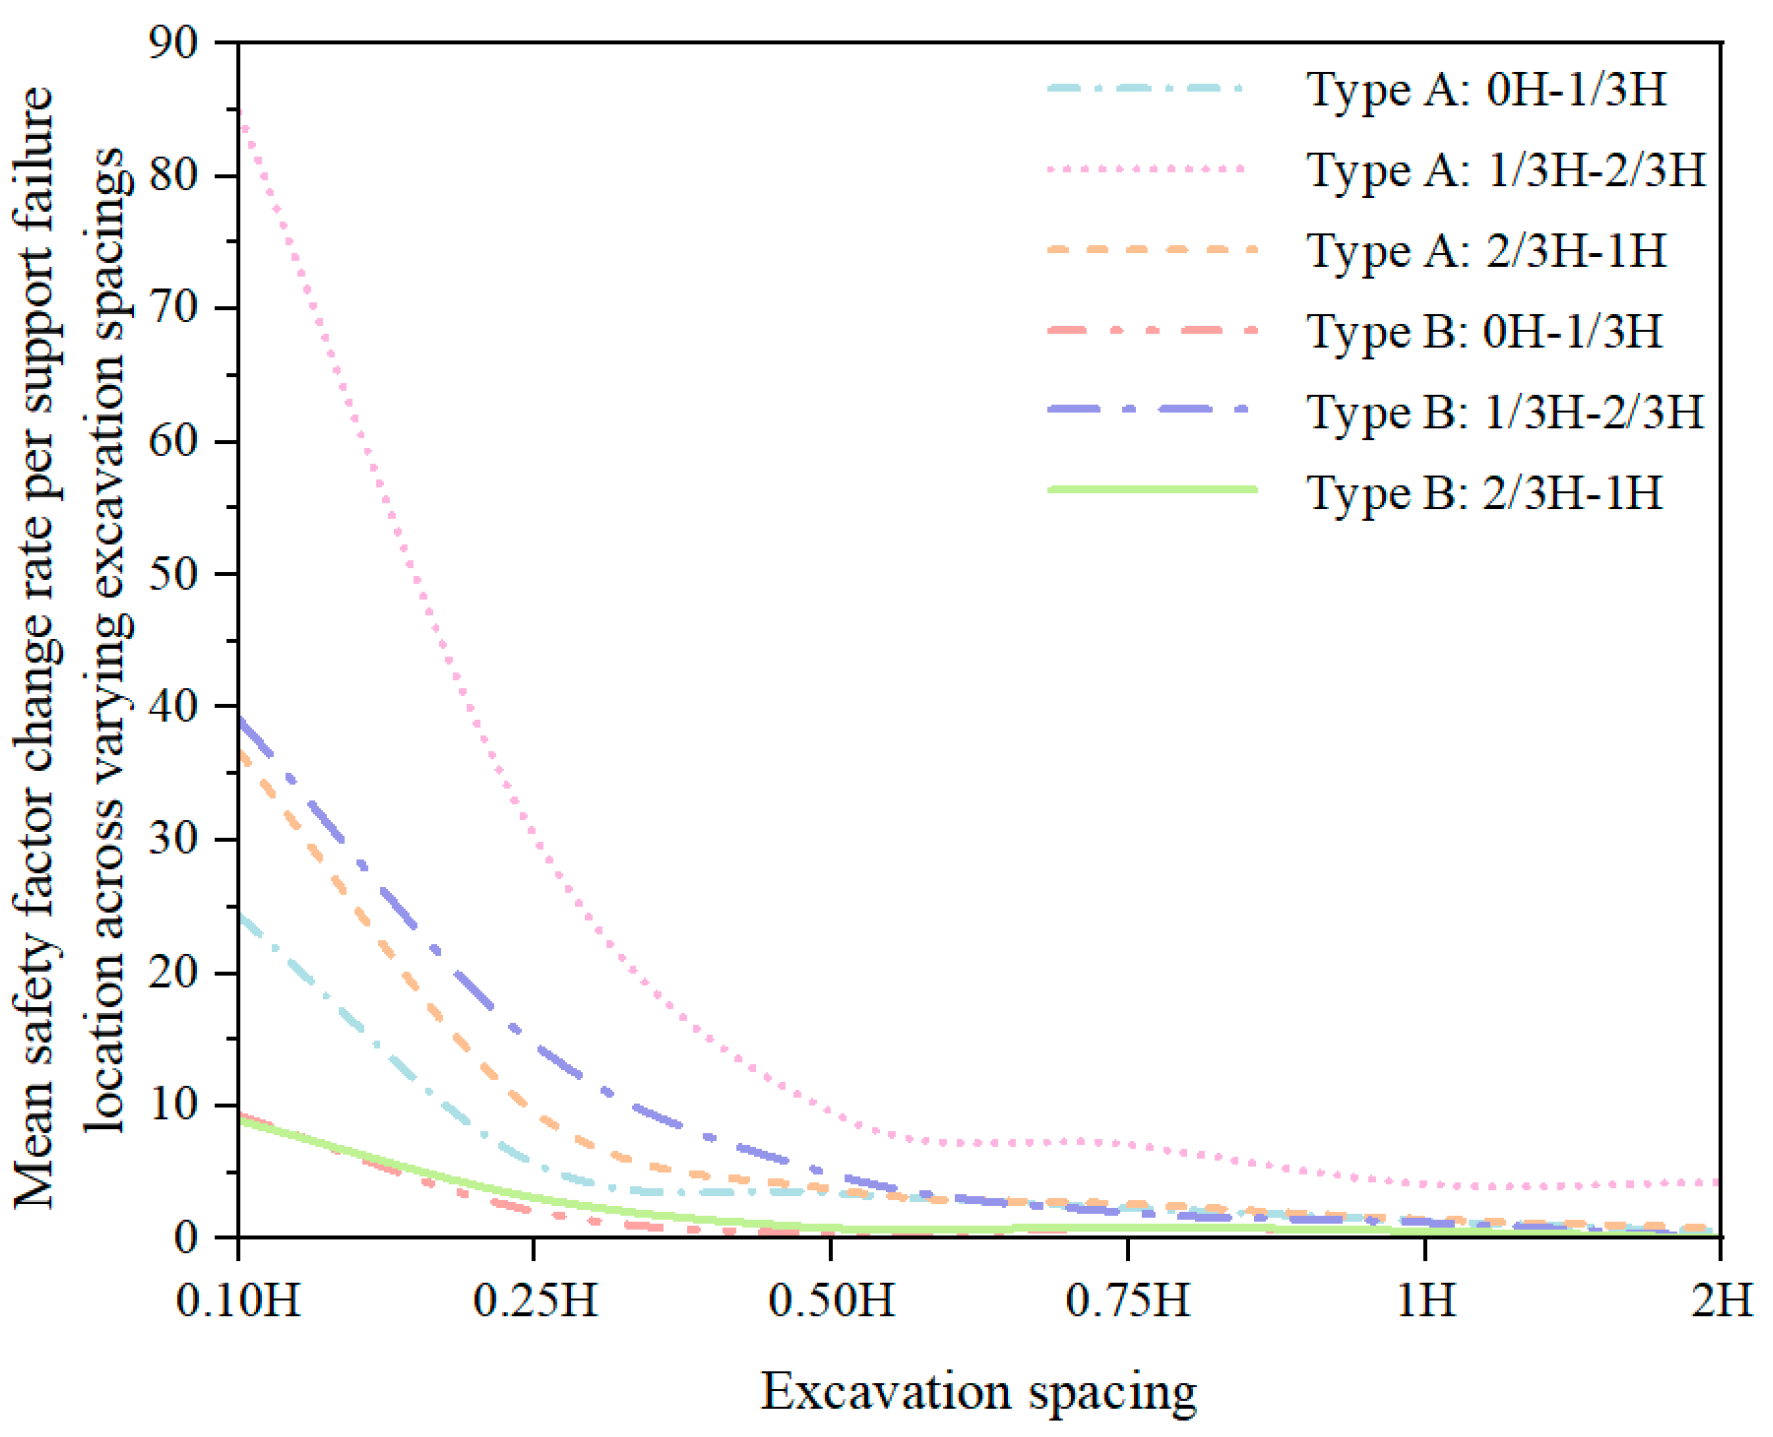
As shown in Figure 10 for type A, when the pit spacing is reduced from 2.00H to 0.10H, the rate of change in the safety factors for the supports located between 0H and 1/3H increases by approximately 73.68%. This change is larger than that for the supports located between 0H and 1/3H and between 2/3H and 1H. As shown in Figure 10 for type B, the rate of change in the safety factors for the nearby pit supports increases by 75% at all locations. The support failures within subfoundation pits in both pit layouts can affect the safety factors near the pit. Specifically, the failure of supports located at 1/3H to 2/3H has a greater impact on the vicinity of the foundation pits. Additionally, the rate of change in safety factor near the pit is high when the foundation pit is arranged in line, and the effect on the safety factors near the pit support is more pronounced.
Figure 10.
Mean rate of change in the safety factor per support failure location across varying excavation spacings.
4. Conclusions
This study developed and validated an integrated risk assessment framework for DFPCs by combining BN, AHP, and numerical simulation. The framework advances conventional single-pit analyses by explicitly modeling interdependencies across multiple pits and incorporating both expert judgment and structural learning to reduce subjectivity.
The results provide three key scientific insights. First, the BN–AHP model consistently identified mid-span support failures as the dominant risk factor, a finding that was independently confirmed through numerical simulations. Second, the framework demonstrated that pit spacing exerts a quantifiable influence on cluster stability; when the spacing is reduced to 0.10H, failures in a subpit’s mid-support markedly amplify instability in adjacent pits. This highlights the importance of spatial interaction effects, which are typically overlooked in single-pit assessments. Third, the modular structure of the framework enables systematic incorporation of additional risk modes, such as hydraulic instability or soil variability, offering a scalable approach to DFPC risk management.
By integrating probabilistic modeling with physics-based validation, the proposed framework not only enhances the accuracy of risk quantification but also strengthens its practical applicability to complex urban excavation projects. Despite its utility, the current study has limitations related to subjectivity in constructing CPTs and a lack of systematic data on DFPC failures. Future work should prioritize building a dedicated database of collapse mechanisms in DFPCs. This would allow evidence-based calibration of probabilities, significantly improve risk quantification accuracy, and enhance the framework’s practical applicability in real-world construction scenarios.
Author Contributions
Methodology, C.H., Z.Z. and Y.L.; Validation, C.H., Z.Z. and Y.L.; Formal analysis, W.L.; Investigation, C.H. and W.L.; Data curation, Y.L.; Writing—original draft, C.H.; Writing—review & editing, C.H., Z.Z., Y.L. and W.L.; Visualization, Z.Z.; Supervision, Y.L. All authors have read and agreed to the published version of the manuscript.
Funding
This research was funded by the National Key R&D Program of China, grant numbers 2023YFC3009300 and 2023YFC3009302.
Data Availability Statement
Some or all the data, models, or codes that support the findings of this study are available from the corresponding author upon reasonable request.
Conflicts of Interest
The authors declare no conflict of interest.
References
- Tan, Y.; Wang, D.; Lu, Y.; Fang, T. Excavation of middle Huai-Hai road station of Shanghai metro line 13: Challenges, risks, countermeasures, and performance assessment. Pract. Period. Struct. Des. Constr. 2017, 22, 05017003. [Google Scholar] [CrossRef]
- Lin, S.S.; Zhou, A.; Shen, S.L. Multi-status Bayesian network for analyzing collapse risk of excavation construction. Autom. Constr. 2024, 158, 105193. [Google Scholar] [CrossRef]
- Zhang, K.; Li, J. Accident analysis for 08.11.15 foundation pit collapse of Xianghu station of Hangzhou metro. Chin. J. Geot. Eng. 2010, 32, 338–342. [Google Scholar]
- Li, F.; Phoon, K.K.; Du, X.; Zhang, M. Improved AHP method and its application in risk identification. J. Constr. Eng. Manage. 2013, 139, 312–320. [Google Scholar] [CrossRef]
- Lin, S.S.; Shen, S.L.; Zhou, A.; Xu, Y.S. Risk assessment and management of excavation system based on fuzzy set theory and machine learning methods. Autom Constr. 2021, 122, 103490. [Google Scholar] [CrossRef]
- Zhou, H.B.; Zhang, H. Risk assessment methodology for a deep foundation pit construction project in Shanghai, China. J. Constr. Eng. Manag. 2011, 137, 1185–1194. [Google Scholar] [CrossRef]
- Wei, D.; Xu, D.; Zhang, Y. A fuzzy evidential reasoning-based approach for risk assessment of deep foundation pit. Tunn. Undergr. Space Technol. 2020, 97, 103232. [Google Scholar] [CrossRef]
- Abdelgawad, M.; Fayek, A.R. Risk management in the construction industry using combined fuzzy FMEA and fuzzy AHP. J. Constr. Eng. Manag. 2010, 136, 1028–1036. [Google Scholar] [CrossRef]
- Kwast-Kotlarek, U.; Hełdak, M. Evaluation of the construction and investment process of a high-pressure gas pipeline with use of the trenchless method and open excavation method. Analytic hierarchy process (AHP). Sustainability 2019, 11, 2438. [Google Scholar] [CrossRef]
- Boulaid, G.; Bahi, L.; Ouadif, L. Risk assessment of excavation work of different types of construction projects using AHP. Int. J. Civ. Eng. Technol. 2018, 9, 861–870. [Google Scholar]
- Koulinas, G.K.; Marhavilas, P.K.; Demesouka, O.E.; Vavatsikos, A.P.; Koulouriotis, D.E. Risk analysis and assessment in the worksites using the fuzzy-analytical hierarchy process and a quantitative technique–A case study for the Greek construction sector. Saf. Sci. 2019, 112, 96–104. [Google Scholar] [CrossRef]
- Soltanzadeh, A.; Mahdinia, M.; Jafarinia, E.; Golmohammadpour, H.; Sadeghi-Yarandi, M. Occupational safety risk analysis in construction sites based on fuzzy analytic hierarchy process: A case study in a large construction project. Work 2023, 76, 771–782. [Google Scholar] [CrossRef]
- Cheng, M.; Lu, Y. Developing a risk assessment method for complex pipe jacking construction projects. Autom Constr. 2015, 58, 48–59. [Google Scholar] [CrossRef]
- Xun, T. Risk assessment of foundation pit construction using cloud model. In E3S Web of Conferences; EDP Sciences: London, UK, 2020; Volume 165, p. 04070. [Google Scholar] [CrossRef]
- Zhang, W.; Huang, Z.; Zhang, J.; Zhang, R.; Ma, S. Multifactor uncertainty analysis of construction risk for deep foundation pits. Appl. Sci. 2022, 12, 8122. [Google Scholar] [CrossRef]
- Wu, J.; Gong, H.; Liu, F.; Liu, Y. Risk assessment of open-pit slope based on large-scale group decision-making method considering non-cooperative behavior. Int. J. Fuzzy Syst. 2023, 25, 245–263. [Google Scholar] [CrossRef]
- Zhou, Y.; Li, S.; Zhou, C.; Luo, H. Intelligent approach based on random forest for safety risk prediction of deep foundation pit in subway stations. J. Comput. Civ. Eng. 2019, 33, 05018004. [Google Scholar] [CrossRef]
- Xiudong, X.; Caizhen, P. Safety prediction of deep foundation pit based on neural network and entropy fuzzy evaluation. In E3S Web of Conferences; EDP Sciences: London, UK, 2021; Volume 233, p. 03001. [Google Scholar] [CrossRef]
- Hong, C.; Luo, G.; Chen, W. Safety analysis of a deep foundation ditch using deep learning methods. Gondw. Res. 2023, 123, 16–26. [Google Scholar] [CrossRef]
- Uge, B.U.; Guo, Y. Deep foundation pit excavations adjacent to disconnected piled rafts: A review on risk control practice. Open J. Civ. Eng. 2020, 10, 270. [Google Scholar] [CrossRef]
- Kang, J.; Wan, D.; Sheng, Q.; Fu, X.; Pang, X.; Xia, L.; Li, D. Risk assessment and support design optimization of a high slope in an open pit mine using the jointed finite element method and discontinuous deformation analysis. Bull. Eng. Geol. Environ. 2022, 81, 254. [Google Scholar] [CrossRef]
- Ge, C.; Yang, M.; Li, P.; Zhang, M. Influence of deep foundation pit excavation on surrounding environment: A case study in Nanjing, China. Acta Geophysa. 2025, 73, 495–516. [Google Scholar] [CrossRef]
- Sousa, R.L.; Einstein, H.H. Risk analysis during tunnel construction using Bayesian Networks: Porto Metro case study. Tunn. Undergr. Space Technol. 2012, 27, 86–100. [Google Scholar] [CrossRef]
- Wang, Z.Z.; Chen, C. Fuzzy comprehensive Bayesian network-based safety risk assessment for metro construction projects. Tunn. Undergr. Space Technol. 2017, 70, 330–342. [Google Scholar] [CrossRef]
- Ruiz-Tagle, A.; Lopez Droguett, E.; Groth, K.M. Exploiting the capabilities of Bayesian networks for engineering risk assessment: Causal reasoning through interventions. Risk Anal. 2022, 42, 1306–1324. [Google Scholar] [CrossRef]
- Schell, C.A.; Ruiz-Tagle, A.; Lewis, A.D.; Katrina, M.G.; Construction and Verification of a Bayesian Network for Third-Party Excavation Risk Assessment (BaNTERA). Probabilistic Safety Assessment and Management (PSAM16). 2022. Available online: https://drum.lib.umd.edu/items/51bd52bf-bbca-42a6-8cbd-2df1a35b5bc6 (accessed on 2 July 2025).
- Hassan, S.; Wang, J.; Kontovas, C.; Bashir, M. An assessment of causes and failure likelihood of cross-country pipelines under uncertainty using bayesian networks. Reliab. Eng. Syst. Saf. 2022, 218, 108171. [Google Scholar] [CrossRef]
- Goh, A.T.C.; Fan, Z.; Hanlong, L.; Wengang, Z.; Dong, Z. Numerical analysis on strut responses due to one-strut failure for braced excavation in clays. In Proceedings of the 2nd International Symposium on Asia Urban Geoengineering, Changsha, China, 24–27 November 2017; Springer: Berlin/Heidelberg, Germany, 2018; pp. 560–574. [Google Scholar] [CrossRef]
- Lei, H.; Zhan, B.; Feng, S.; Amin, M. Influence of Foundation pit groups’ excavation on the deformation characteristics of adjacent railway Subgrade and Protection measures. Geotech. Geol. Eng. 2023, 41, 3877–3895. [Google Scholar] [CrossRef]
- Constantinou, A.C.; Liu, Y.; Chobtham, K.; Guo, Z.; Kitson, N.K. Large-scale empirical validation of Bayesian Network structure learning algorithms with noisy data. Int. J. Approx. Reason. 2021, 131, 151–188. [Google Scholar] [CrossRef]
- Kitson, N.K.; Constantinou, A.C.; Guo, Z.; Liu, Y.; Chobtham, K. A survey of Bayesian Network structure learning. Artif. Intell. Rev. 2023, 56, 8721–8814. [Google Scholar] [CrossRef]
- Solomon, T.; Soh, L.K.; Dodd, M.D.; Esmaeili, B. Variables influencing change blindness in construction safety. Saf. Sci. 2025, 184, 106761. [Google Scholar] [CrossRef]
- Ouaissa, M.; Laidi, M.; Benkortbi, O.; Maarof, H. QSPR modeling to predict surface tension of psychoanaleptic drugs using the hybrid DA-SVR algorithm. J. Mol. Graph. Model. 2025, 134, 108896. [Google Scholar] [CrossRef]
- Aminbakhsh, S.; Gunduz, M.; Sonmez, R. Safety risk assessment using analytic hierarchy process (AHP) during planning and budgeting of construction projects. J. Saf. Res. 2013, 46, 99–105. [Google Scholar] [CrossRef]
- Zheng, G.; Zhao, J.; Cheng, X.; Yu, D.Y.; Wang, R.Z.; Zhu, X.W.; Yi, F. Mechanism and control measures of the vertical progressive collapse of deep excavations retained by a multilayer strutting system. J. Tianjin Univ. Sci. Technol. 2021, 54, 1025–1038. [Google Scholar]
- Cheng, X.; Pei, H.; Yi, F.; Zheng, G.; Zhang, Y.; Ma, Y.; Wang, S. Study on the mechanism and countermeasures of progressive collapse in deep excavation retained by multilayer struts. Structures 2024, 60, 105837. [Google Scholar] [CrossRef]
- Zucca, M.; Franchi, A.; Crespi, P.; Longarini, N. The new foundation system for the transept reconstruction of the basilica di collemaggio. In Proceedings of the International Masonry Society Conferences, Milan, Italy, 9–11 July 2018; pp. 9–11. [Google Scholar]
- Li, L.; Sun, Q.; Wang, Y.; Gao, Y. A data-driven indirect approach for predicting the response of existing structures induced by adjacent excavation. Appl. Sci. 2023, 13, 3826. [Google Scholar] [CrossRef]
Disclaimer/Publisher’s Note: The statements, opinions and data contained in all publications are solely those of the individual author(s) and contributor(s) and not of MDPI and/or the editor(s). MDPI and/or the editor(s) disclaim responsibility for any injury to people or property resulting from any ideas, methods, instructions or products referred to in the content. |
© 2025 by the authors. Licensee MDPI, Basel, Switzerland. This article is an open access article distributed under the terms and conditions of the Creative Commons Attribution (CC BY) license (https://creativecommons.org/licenses/by/4.0/).