Article

Compatibility of Polycarboxylate Ethers with Cementitious Systems Containing Fly Ash: Effect of Molecular Weight and Structure

1
Department of Civil Engineering, Bursa Uludag University, Bursa 16059, Türkiye
2
Department of Civil Engineering, Özyeğin University, İstanbul 34794, Türkiye
3
Department of Civil Engineering, Dokuz Eylül University, Izmir 35220, Türkiye
4
Department of Civil Engineering, Ege University, Izmir 35040, Türkiye
5
Department of Civil and Environmental Engineering, University of Balamand, Balamand 2960, Lebanon
6
Department of Civil and Environmental Engineering, United Arab Emirates University, Al Ain 15551, United Arab Emirates
*
Author to whom correspondence should be addressed.
Buildings 2025, 15(18), 3351; https://doi.org/10.3390/buildings15183351
Submission received: 19 August 2025 / Revised: 8 September 2025 / Accepted: 14 September 2025 / Published: 16 September 2025
(This article belongs to the Section Building Materials, and Repair & Renovation)

Abstract

Substituting cement with mineral additives like fly ash is increasingly essential for sustainable production. While replacement rates largely depend on fresh-state properties, the interaction between fly ash and polycarboxylate ether (PCE) molecular structures remains underexplored. In this regard, this study investigates the effect of PCE molecular structures and weight on the rheology, setting, and strength of cementitious systems containing up to 45% fly ash additions. Seven distinct PCE possessing different molecular weights (27,000–78,000 g/mol) as well as backbone and side chain lengths are synthesized. The interaction between PCE and solid particles was explored through total organic carbon, dynamic light scattering, and gel permeation chromatography. Test results showed that the adsorption rates of the cement and fly ash particles within the cementitious composites improved by up to 90% with fly ash replacement and upon using PCE with a medium molecular weight of 56,000 g/mol, backbone length of 21 k, and short side chain length of 1000 g/mol. This has resulted in a 75% reduction in the material’s apparent viscosity, delayed setting times of up to 38%, and improved early- and late-age compressive strengths of up to 123%. Such data can interest cement and admixture producers in proposing suitable PCEs for superior fly ash concrete performance.

1. Key Points

-
PCE with medium main and side chains improved flow, reduced viscosity, and boosted strength;
-
Viscosity dropped at 15% fly ash but increased at 30–45% due to particle agglomeration;
-
Short or long PCE backbones delayed setting and lowered adsorption;
-
Higher fly ash increased PCE demand and delayed hydration.

2. Introduction

The coal used for electricity production generates a significant amount of waste fly ash. It is estimated that about 500 million tons are produced annually, whose disposal poses both economic and ecological problems [1,2,3]. Three primary applications of fly ash in cementitious systems have been identified, including (i) partial replacement of Portland cement, (ii) pozzolanic material in composite cement, and (iii) a set retarder when used alongside cement [4,5]. ASTM C618 standard [6] distinguishes two classes of fly ash (F and C), with their SiO2 + Al2O3 + Fe2O3 content higher than 50%. Research has demonstrated that fly ash improves the workability and pumpability of concrete owing to its spherical shape and ball-bearing effect [7]. While carbon residues can affect air entrainment, studies show that fly ash concrete undergoes satisfactory strength development and durability over time [8,9].
To attain specific fresh and hardened properties in fly ash cementitious systems, water-reducing chemical admixtures are typically incorporated into the mix. In fact, polycarboxylate ethers (PCEs) have been widely employed in cementitious systems to enhance workability and/or strength by reducing the water-to-cement ratio (w/c). Nevertheless, the effectiveness of PCE to deflocculate cementitious systems containing fly ash additions is often altered by several compatibility issues that affect the cement’s aptitude to flow, including hydration kinetics and strength development over time [10,11,12]. Wang et al. [13] attributed the altered behavior to different interaction and adsorption phenomena whereby the PCE polymers were disabled (i.e., lost dispersion effect) due to some bridging and coagulation effects with the fly ash particles. Such a coagulation may negatively affect the workability of concrete. Therefore, it is advisable to consider the specific PCE properties and their chemical and physical interactions in fly ash-substituted mixtures [13].
In this context, Burgos et al. [14] investigated the interaction of limestone, fly ash, and silica fume with various admixtures, including PCE, naphthalene sulphonate, melamine, and lignosulfonate. The study showed that fly ash had the highest affinity for naphthalene- and melamine-based admixtures that functioned essentially through electrostatic mechanisms. At the same time, the PCE stabilizes cement and mineral particles through steric hindrance. The authors emphasized the need for nanoscale investigations to understand the adsorption and stabilization mechanisms fully. Tkaczewska [15] reported that PCEs were more efficient than melamine formaldehyde condensate superplasticizers, leading to higher water reduction while maintaining the workability of fly ash systems. Similar findings were reported by Wang et al. [13], who examined the interaction of various PCE types with fly ash-substituted materials, highlighting that PCE had a higher positive effect on the flow and rheology of cement pastes than naphthalene sulfonate and lignosulfonate chemicals. The authors noticed that the reduced clinker content (i.e., increased fly ash-replacement ratio) was often associated with decreased polymer addition rates to maintain the given fluidity.
Furthermore, Karakuzu et al. [16] outlined that while the superplasticizer adsorbs onto the particle grains to create repulsion (electrostatic by lignosulfonate or naphthalene sulfonate or through steric hindrance for PCE), some molecules could be weakly adsorbed due to the lower density of the positive sites of fly ash. This flocculation explains the poor dispersion of lignosulfonate or naphthalene sulfonate chemicals despite their high electrostatic repulsion. The PCEs in the liquid phase act as barriers that keep particles apart, leading to improved workability by providing both repulsive barriers and lubrication between particles [17,18]. The molecules absorbed into the fly ash pores lose dispersing efficiency, whereas others can bridge multiple particles due to higher negative charge density, causing flocculation.
In other work, Karakuzu et al. [19] investigated the influence of changes in PCE anionic charge density in fly ash systems. They reported that PCEs containing sulfonate groups with high charge densities provided the best performance in fresh-state and rheological properties. Ng et al. [20] examined the effect of main chain and side chain densities of PCE superplasticizers on the engineering properties and microstructural development of ternary blend concretes incorporating pulverized fly ash (PFA). Their findings showed that PCE with MPEG: AA in molar ratios of 1:4 and 1:8 exhibited a bridging effect by adsorbing onto multiple binder particles, thereby increasing the water/binder ratio. Furthermore, Zhang et al. [21] studied the effects and mechanisms of superplasticizers and retarders in fly ash (FA), granulated blast furnace slag (GBFS), and steel slag (SS)-based geopolymers to enhance processability and broaden their application. They found that PCE significantly increased the total pore volume, reaching 0.066 mL/g (over 50% higher than the control), while exerting limited influence on compressive strength. Moreover, Alrefaei and Dai [22] explored the impact of delayed PCE addition on adsorption, reaction kinetics, and rheology in single-component alkali-activated materials (AAMs) based on fly ash and slag. Results indicated that delayed addition mitigated the retarding effect of PCE, slightly enhanced compressive strength, and reduced viscosity and yield stress. Meanwhile, Wang et al. [23] investigated the influence of lignosulfonate (LS), polynaphthalene sulfonate (PNS), and two polycarboxylate-based (PCE-1 and PCE-2) superplasticizers on the early-stage reaction of Class F fly ash-based geopolymers (FABGs) at 60 °C. They concluded that PCE-1 and PCE-2 promoted faster dissolution compared with LS and PNS, attributable to their polyethylene oxide-dominated molecular structures. Although several studies have investigated the effectiveness of PCEs and their interactions with fly ash -substituted mixtures [10,11,16,20,21,22,23,24,25], significant gaps remain in the literature concerning the compatibility of PCE molecular structure properties—such as backbone and side chain lengths and molecular weight—with fly ash-containing cementitious systems, despite their critical influence on PCE action mechanisms.
The interaction between PCE and fly ash is likely to vary depending on the fly ash content, including the PCE molecular weight and length of the main (or backbone) and side chains. This highlights the importance of elucidating how these PCE variables interact with fly ash-substituted cementitious systems. In this context, the current study seeks to assess the effect of different PCEs on the flow, rheology, setting, and hardened properties of paste and mortar mixtures containing up to 45% fly ash. Seven different PCEs were synthesized by altering the backbone and side chain lengths or by varying both main- and side-chain lengths while maintaining a constant molecular weight. Such data can particularly interest cement and admixture producers in proposing suitable PCE–fly ash combinations for optimized concrete performance and durability.

3. Materials and Methods

3.1. Materials

CEM I 42.5R type Portland cement, adhering to the EN 197-1 standard [26], and Class F fly ash, meeting the EN 450-2 standard [27], were employed. The physical and chemical characteristics of these materials are outlined in Table 1. The cement’s 2- and 28-day compressive strengths were 25.8 and 48.5 MPa, respectively, while the fly ash’s 7-, 28-, and 56-day pozzolanic indices were 85.9%, 100.7%, and 110.2%, respectively. Figure 1 shows the scanning electron microscopy (SEM) images of the cement and fly ash; the latter consists of smooth spherical particles and yet has an irregular size and a porous surface structure. The mortars were prepared using CEN standard sand, conforming to the EN 196-1 standard [28].

3.2. Synthesis and Characterization of PCE

Seven PCEs were synthesized using the free radical copolymerization method outlined by Altun et al. [29]. HPEG-type PCEs are widely used in the Asian market, and their performance is strongly influenced by variations in molecular weight, backbone length, and side chain length. To systematically assess these effects, HPEG-type PCEs were synthesized to investigate (i) the impact of varying the main-chain length alone, (ii) the impact of varying the side chain length alone, and (iii) the combined effects of varying both main and side chain lengths.
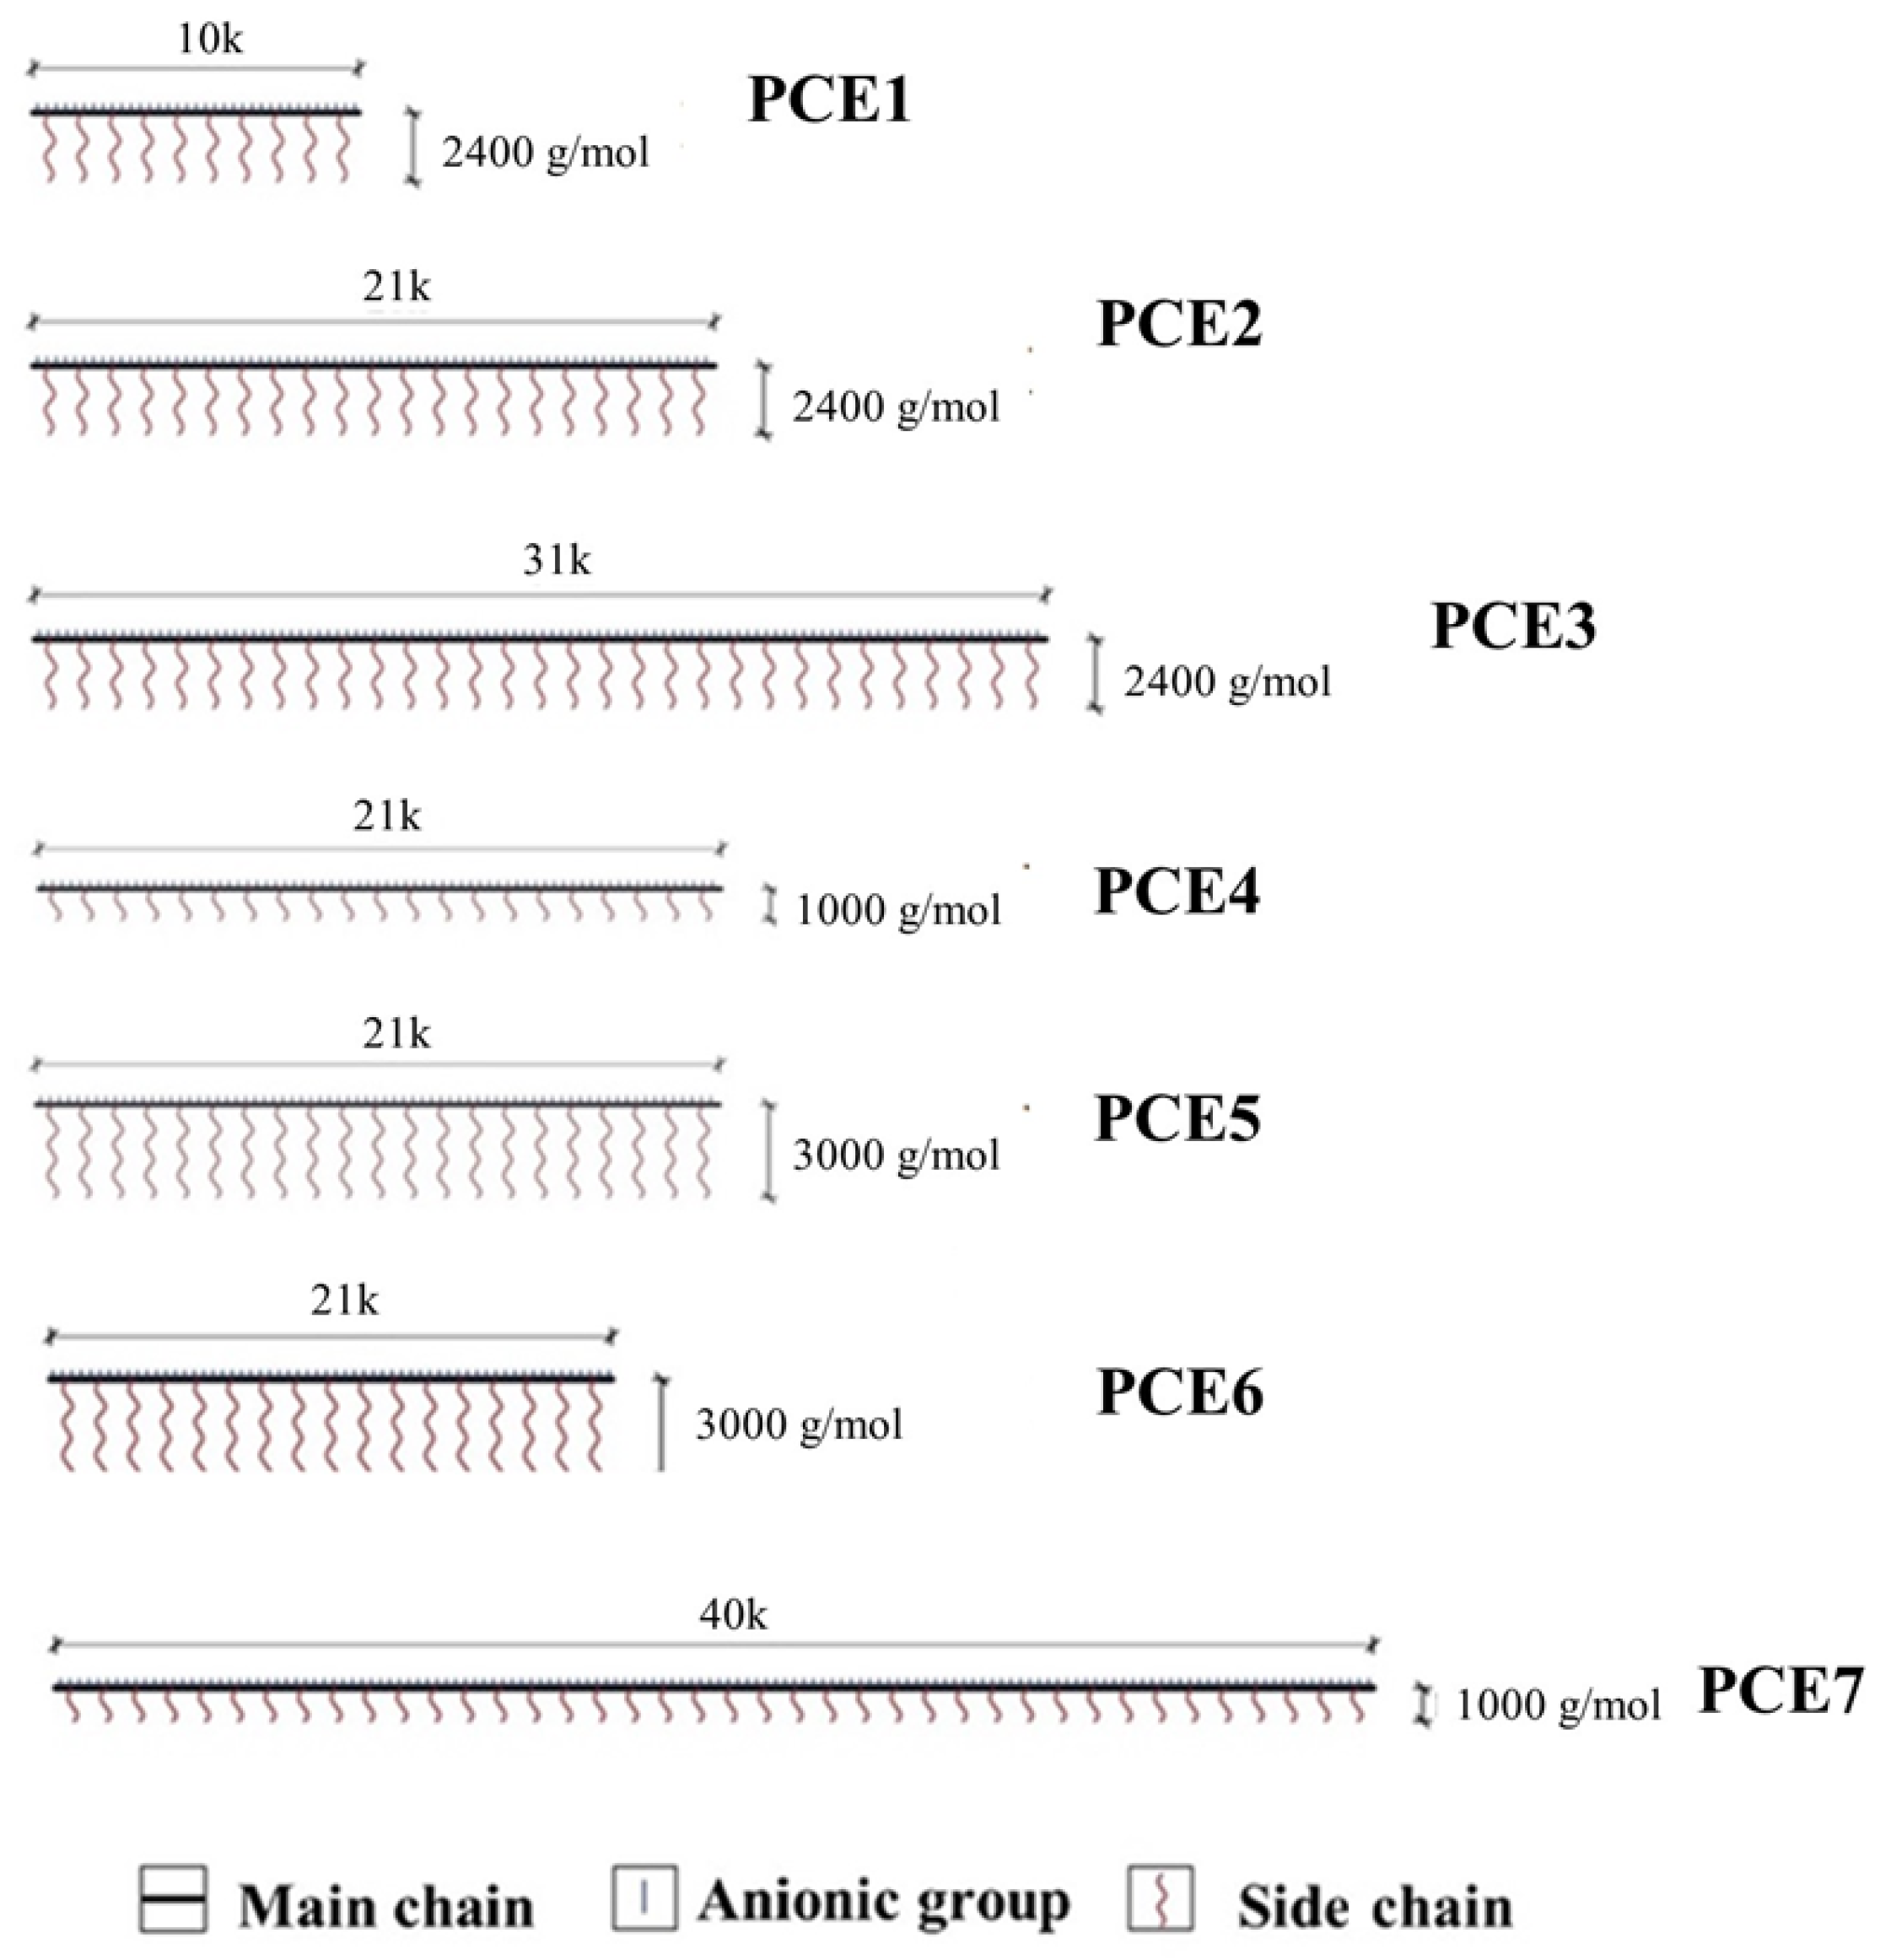
As shown in Table 2, the PCEs were grouped into three different categories with variations in three synthesis parameters, including (i) varying backbone length and molecular weight (Mw) while maintaining a constant side chain length, (ii) varying side chain lengths and Mw while keeping the backbone length fixed, or (iii) varying the main and side chains with a similar Mw of 56,000 g/mol. The Mw varied between 27,000 and 78,000 g/mol, while the main-chain lengths ranged from 10 to 40 k. The polymer side chain lengths varied from 1000 to 3000 g/mol. Such values have been selected based on the findings of the past literature [30].
Throughout the synthesis, the free nonionic content and anionic/nonionic group ratio for all PCEs remained constant at 2.78 moles and 3 moles/mol, respectively. The backbone lengths of PCEs are defined based on the number of side chains attached to a backbone, while maintaining a constant acrylic acid/polyethylene glycol (main chain/side chain) ratio in each polymer [31]. For instance, a backbone containing 21 side chains is designated as 21 k. The seven PCEs are illustrated in Figure 2.
The PCE characteristics include the hydrodynamic diameter (Rh) and polydispersity index (PDI). The Rh was obtained from dynamic light scattering (DLS) analysis using a Malvern CGS-3 device (Malvern Panalytical Ltd., Malvern, UK). Three successive measurements, each lasting 30 s, were captured at a 90-degree angle detector under a controlled temperature of 22 ± 2 °C, and the average of these measurements was recorded as Rh. Meanwhile, free nonionic content, the anionic/nonionic group ratio, and the PDI were determined using the gel permeation chromatography (GPC) diagram according to the procedure of [32].
The PCE adsorption capacity for the cement and fly ash materials was quantified using the total organic carbon (TOC) method, as outlined by [33]. Diverse PCE solutions, each consisting of 32 g at a 3.2 g/L concentration, were meticulously formulated for testing. The solutions containing 16 g of binder underwent thorough mixing using a magnetic stirrer at 2500 rpm for 60 min. Following centrifugation at 4000 rpm for 10 min, the solid and liquid phases were separated, filtered by suction, and thinned with deionized water. The concentration fluctuation observed before and after exposure to the binder is ascribed to the adsorption capacity of the admixture [33].

3.3. Preparation and Testing of Paste and Mortar Mixtures

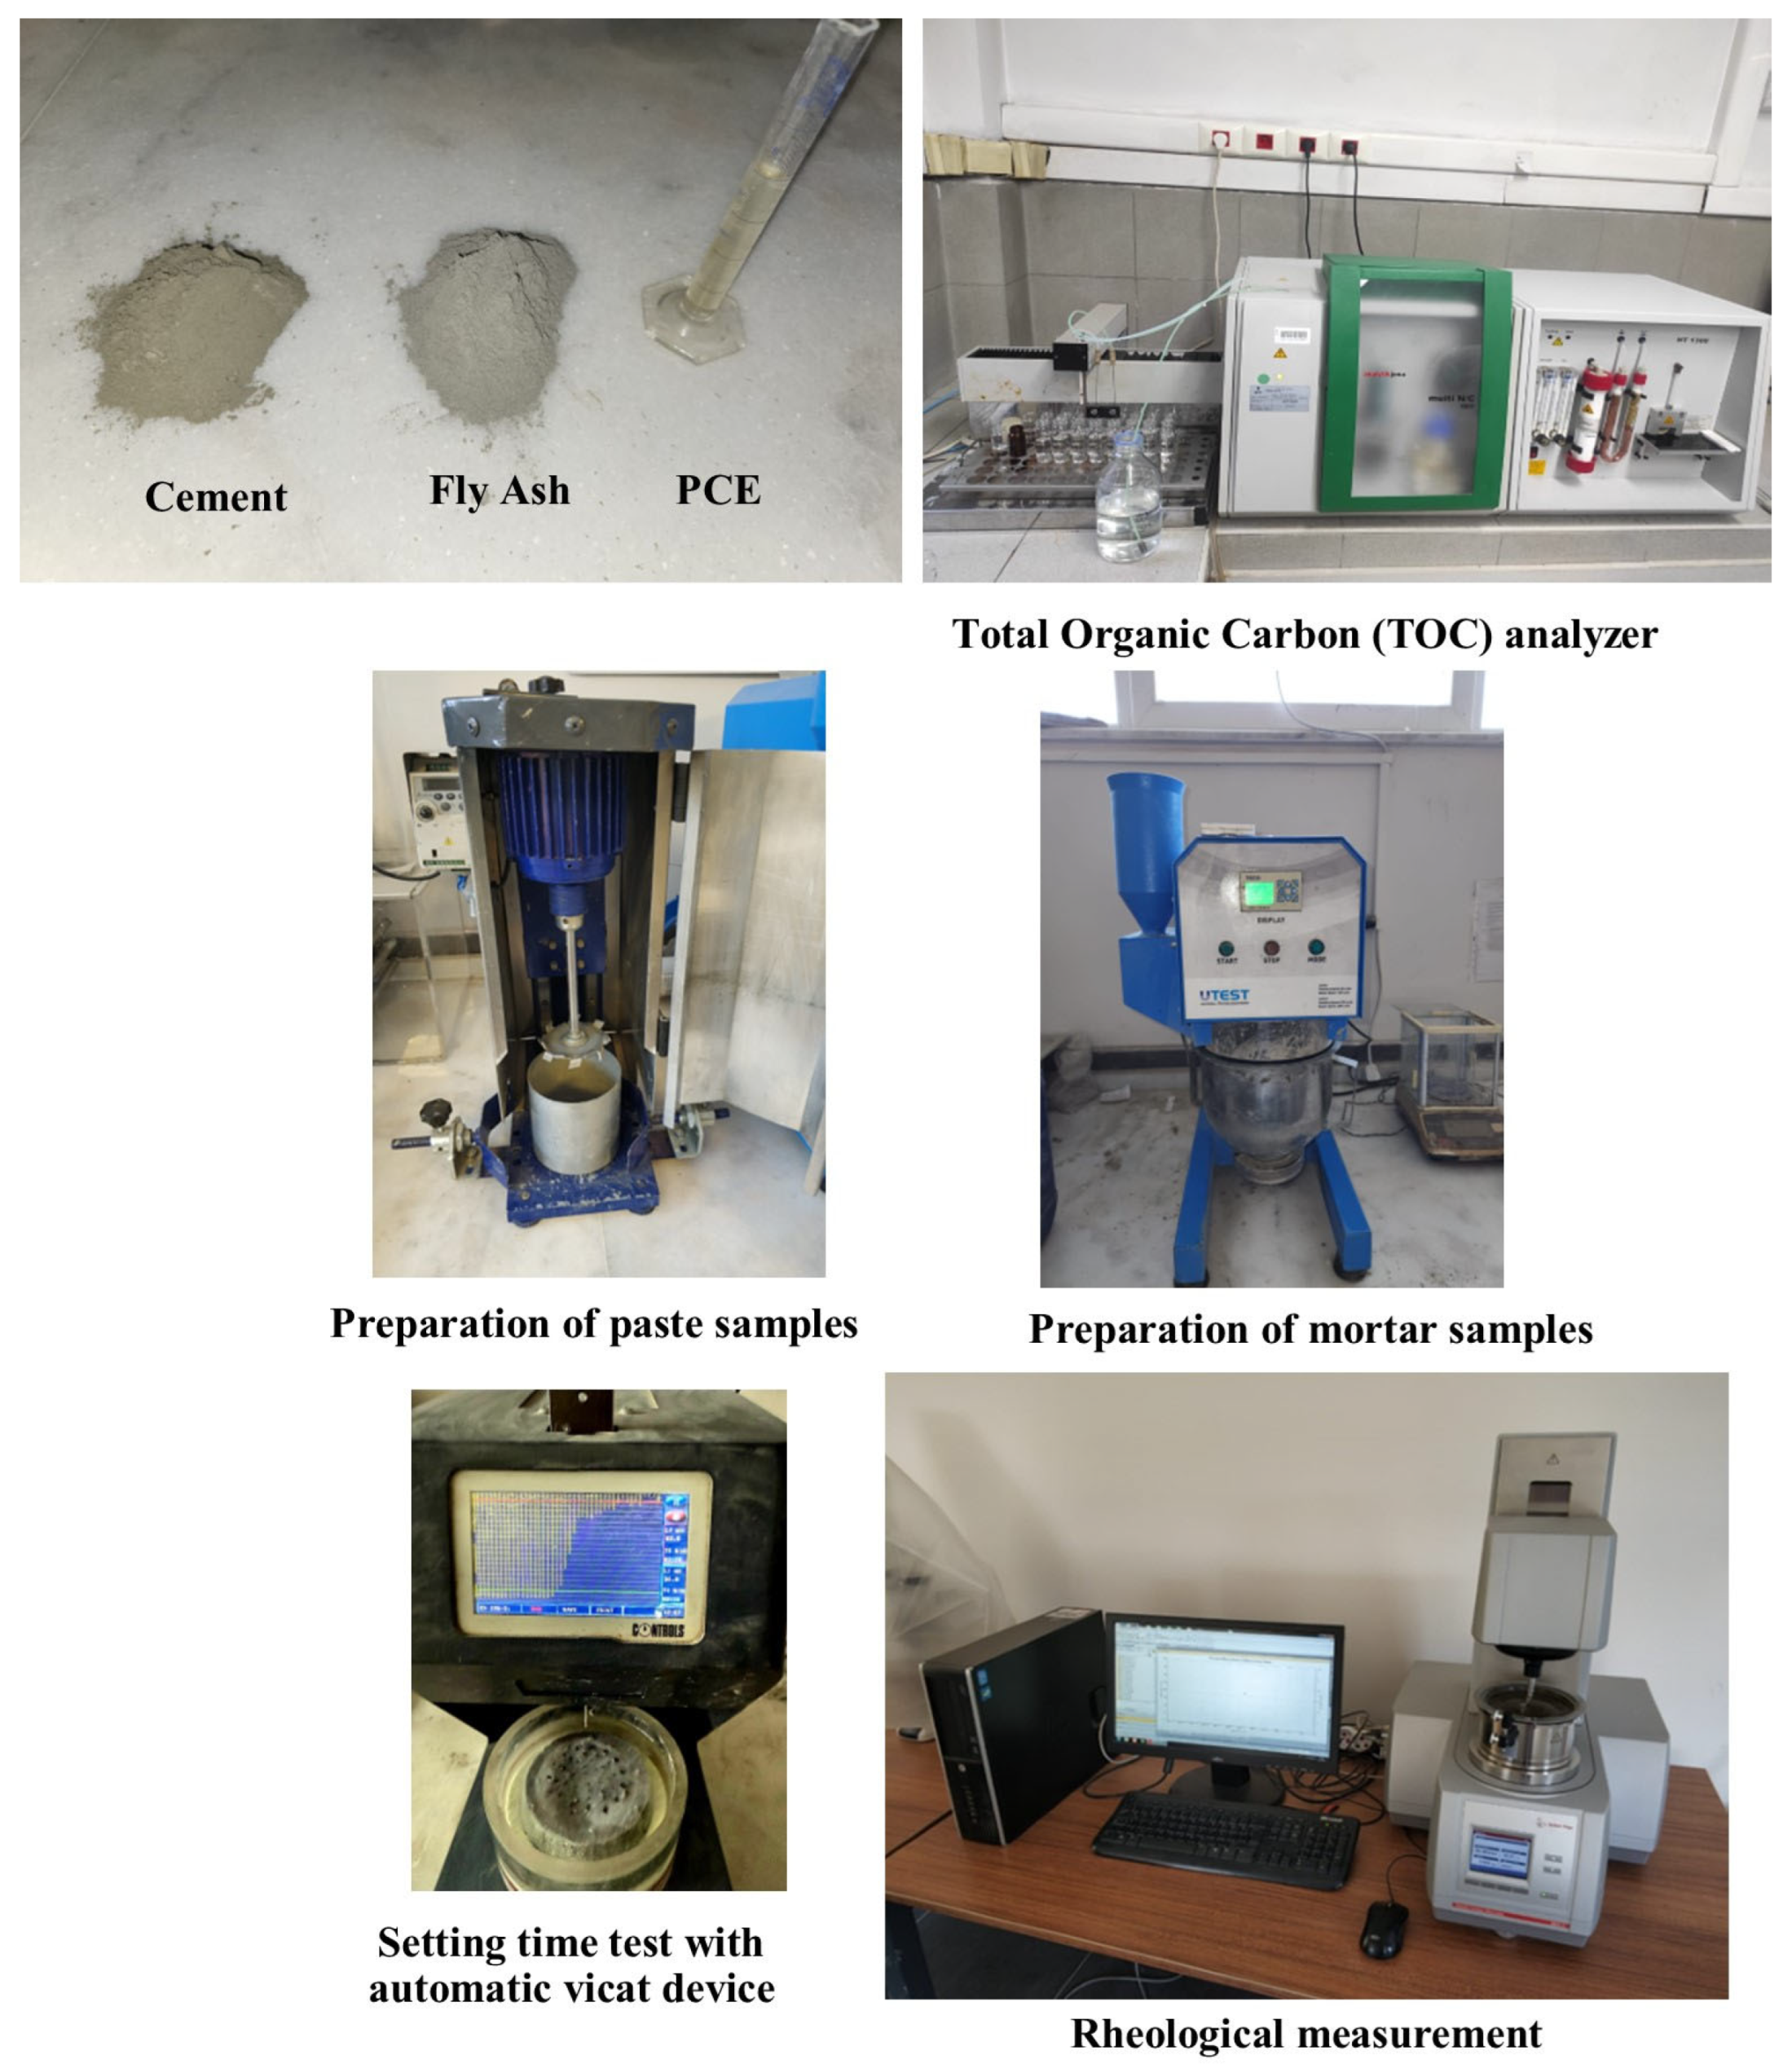
The primary materials and selected devices used in this study are presented in Figure 3. The materials and methods are briefly summarized in the flow chart presented in Figure 4. Fly ash replaced the cement at three ratios (i.e., 15%, 30%, and 45%). The mixtures were named according to the fly ash substitution rate and PCE type (FAx-PCEy); for example, mixtures containing no fly ash and PCE1 are named FA0-PCE1. The sample preparation and testing were conducted under a controlled temperature and relative humidity of 23 ± 2 °C and 50 ± 5%, respectively.
Pastes were prepared at a fixed water-to-binder ratio (w/b) of 0.32 using two PCE dosage rates of 0.1% and 0.15% by mass of binder. These mix design values were selected based on the findings of preliminary trial experiments. The apparent viscosity was determined using a ball rheometer (MCR52 Ball Measuring System—BMS, Anton Paar GmbH, Graz, Austria). Based on previous studies [34,35], the rheological protocol consisted of applying a constant shear rate of 5 s−1 to eliminate the shear history and recording the corresponding shear stress. The apparent viscosity is the ratio of the shear stress to the shear rate. Furthermore, the setting times of tested pastes containing 0.1% PCE were determined using an automatic Vicat device (Controls S.p.A., Milan, Italy), as per EN 196-3 [36]. The water demand for each mix with varying fly ash substitution rates was adjusted to achieve 10 ± 1 mm penetration. Accordingly, 28 paste mixtures were prepared for rheological tests, and another 28 were used to set time measurements.
Mortars—The mortar mixtures were prepared at fixed w/b and sand/binder ratios of 0.485 and 2.75, respectively, per ASTM C109 [37]. The PCE ratio was adjusted to attain a targeted flow value of 27 ± 2 cm. The flow evaluation was performed up to 60 min at 15 min intervals, as per ASTM C1437 [38]. The compressive strength was evaluated at curing intervals of 1, 3, 7, and 28 days, as per ASTM C109 [37]. The strengths reported in this paper represent the average of three values. Accordingly, 28 paste mixtures were prepared for flow tests, and an additional 28 mixtures were produced for compressive strength measurements.

4. Test Results and Discussion

4.1. Characterization of the PCE

Figure 5 plots a typical gel permeation chromatography (GPC) diagram for PCE1, having a short backbone and medium side chain, depicting the intensities of light scattering (LS) and the refractive index (RI). The PCE average molecular weight (Mw) and average molecular number (Mn) are determined using this diagram [32]. Zhang et al. [39] investigated PCE with five different Mws and reported that the highest PCE-weight polymers induced short-range repulsive forces, leading to enhanced adsorption on cement particles. However, the PCE with the highest Mw led to reduced flow performance, owing to bridging effects wherein the adsorption on multiple cement grains can cause agglomeration. Kobya et al. [30] highlighted that PCE having a medium Mw demonstrated the most effective performance in terms of flowability.
In the GPC chromatogram, the peak identified as the “macromonomer” originates from an unreacted or partially reacted high-molecular-weight species that remain after the polymerization process. Such macromonomers are typically formed due to incomplete chain transfer reactions or steric hindrance that prevents full incorporation into the polymer backbone. Their presence does not significantly alter the average molecular weight distribution of the final polymer; however, they may contribute to a slight shoulder or secondary peak in the chromatogram. Since the relative intensity of this peak is low, its influence on the overall results and interpretation of polymer properties is considered negligible. Nevertheless, its identification is essential for transparency in the characterization data. The PCE characteristics, including the hydrodynamic diameter (Rh) and polydispersity index (PDI), are presented in Table 3. While the PDI varied within the limited range of 2.1–2.4, the Rh parameter was remarkably affected by the PCE synthesizing process and ranged between 219 and 617 nm. The Rh refers to the distance representing the overall gyration of the entire molecule and provides insight into the conformational structure of the polymer [40]. The structural conformation of PCE adsorbed on cement particles directly affects the adsorbed layer thickness, surface coverage, and steric hindrance, all of which influence the dispersion efficiency. Similar findings have been noted in previous work [41,42,43]. Although increasing the main-chain length enhanced adsorption, it reduced steric effects and lowered the Rh value; this varied from 346 nm for PCE1 to 323 and 219 nm for PCE2 and PCE3, respectively (having backbone lengths of 10, 21, and 31 k, respectively). Conversely, increasing the side chain density and length reduced adsorption and layer thickness but enhanced steric hindrance, increasing Rh (Table 3).
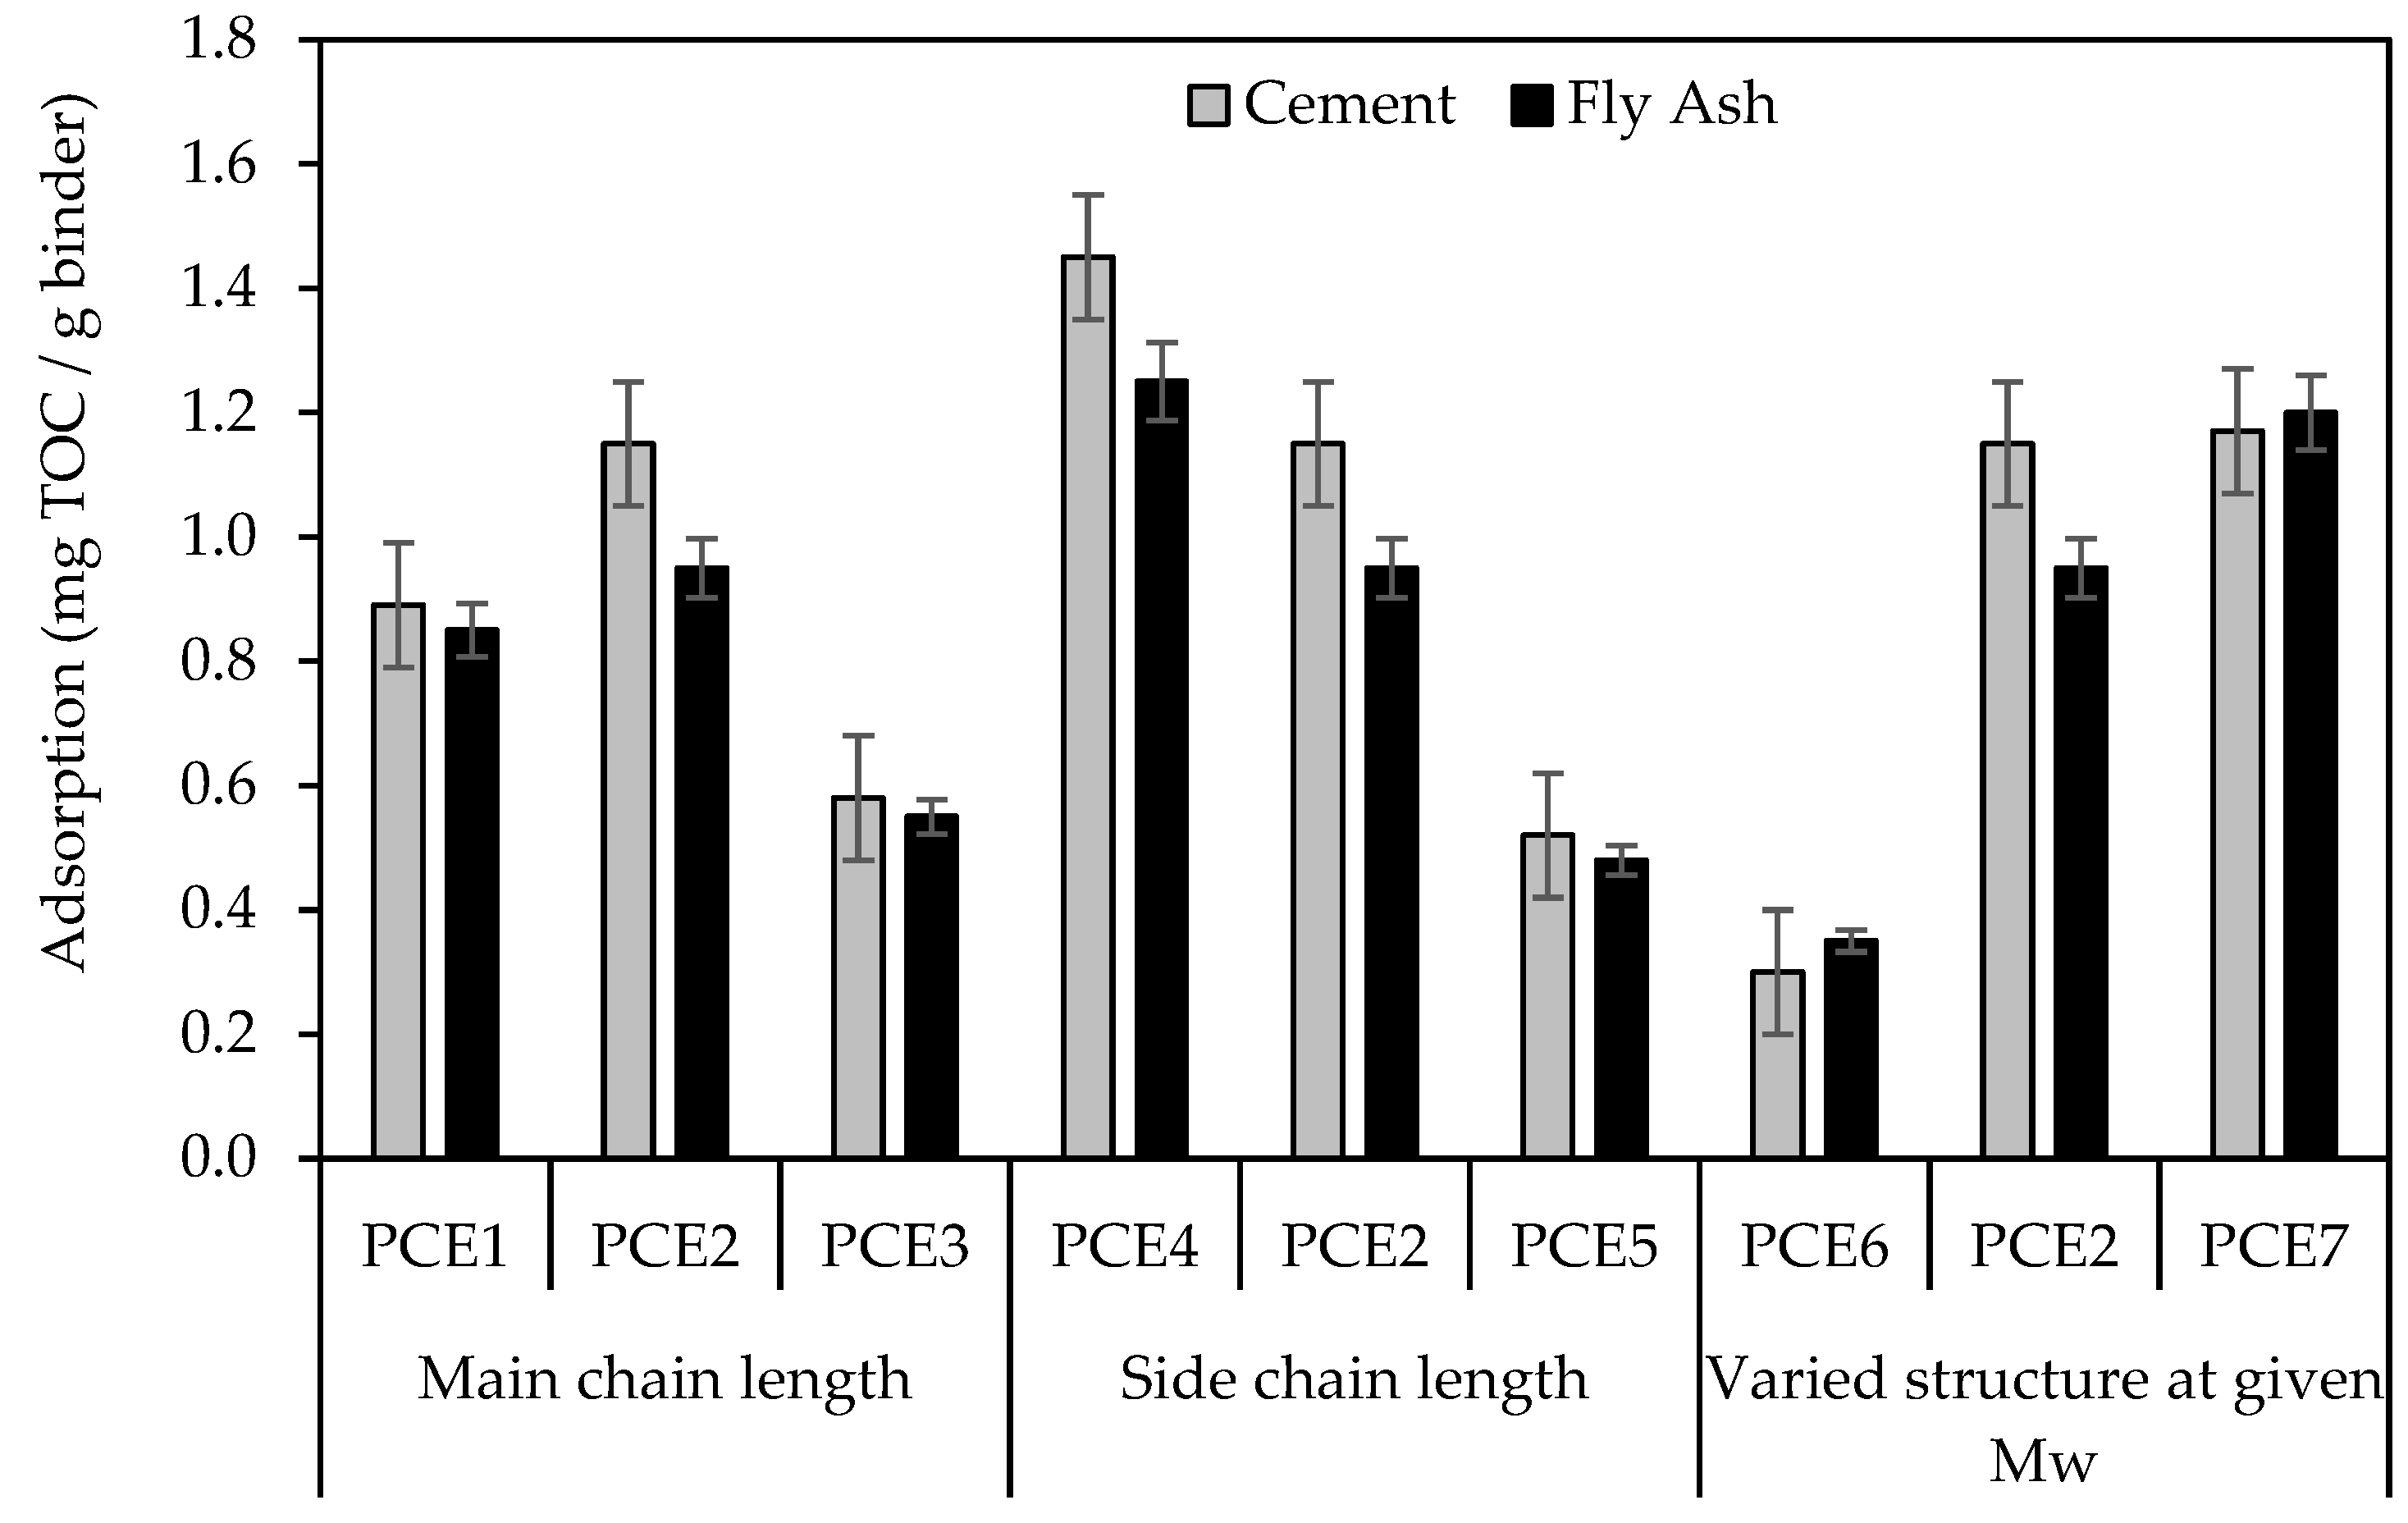
As shown in Figure 6, the synthesized PCEs yielded similar adsorption trends on the cement and fly ash particles. The results show that increasing the backbone length from 10 to 21 k (i.e., PCE1 vs. PCE2), having a fixed side chain length of 2400 g/mol, enhanced the PCE adsorption. PCE2 exhibited 27% more adsorption than PCE1 and 90% more than PCE3. The lower adsorption of PCE1 can be attributed to its lower Mw and carboxylate content. At the same time, the reduced performance of PCE3 can be associated with the reduced Rh value that hinders the polymer from maintaining a stiff structure and potential polymer intertwining [44,45,46].
The PCE adsorption on cement and fly ash particles decreased with an increase in the side chain length (Figure 6). For example, the adsorption capacity of PCE5 onto cement, characterized by the longest side chain length, was about 55% and 85% lower compared with PCE2 and PCE4, respectively. Such results agree with the Rh measurements, reflecting that the increase in the side chain length decreases adsorption onto the cement and fly ash particles [10,30,47]. At equal Mw, the adsorption of PCE6 on cement particles was 69% and 70% lower than that of PCE2 and PCE7, respectively. The PCE7 adsorption was similar to PCE2 despite its longer backbone. Past work explained that such a phenomenon was due to different molecular conformation structures that affected the adsorbed layer thickness and surface coverage [40,44]. The Rh value of PCE7 was about 30% lower than that of PCE2, attributed to its short side chains and long backbone, which may cause the molecule to curl, affecting adsorption. This trend was also observed with fly ash.

4.2. Rheology of Cement Pastes

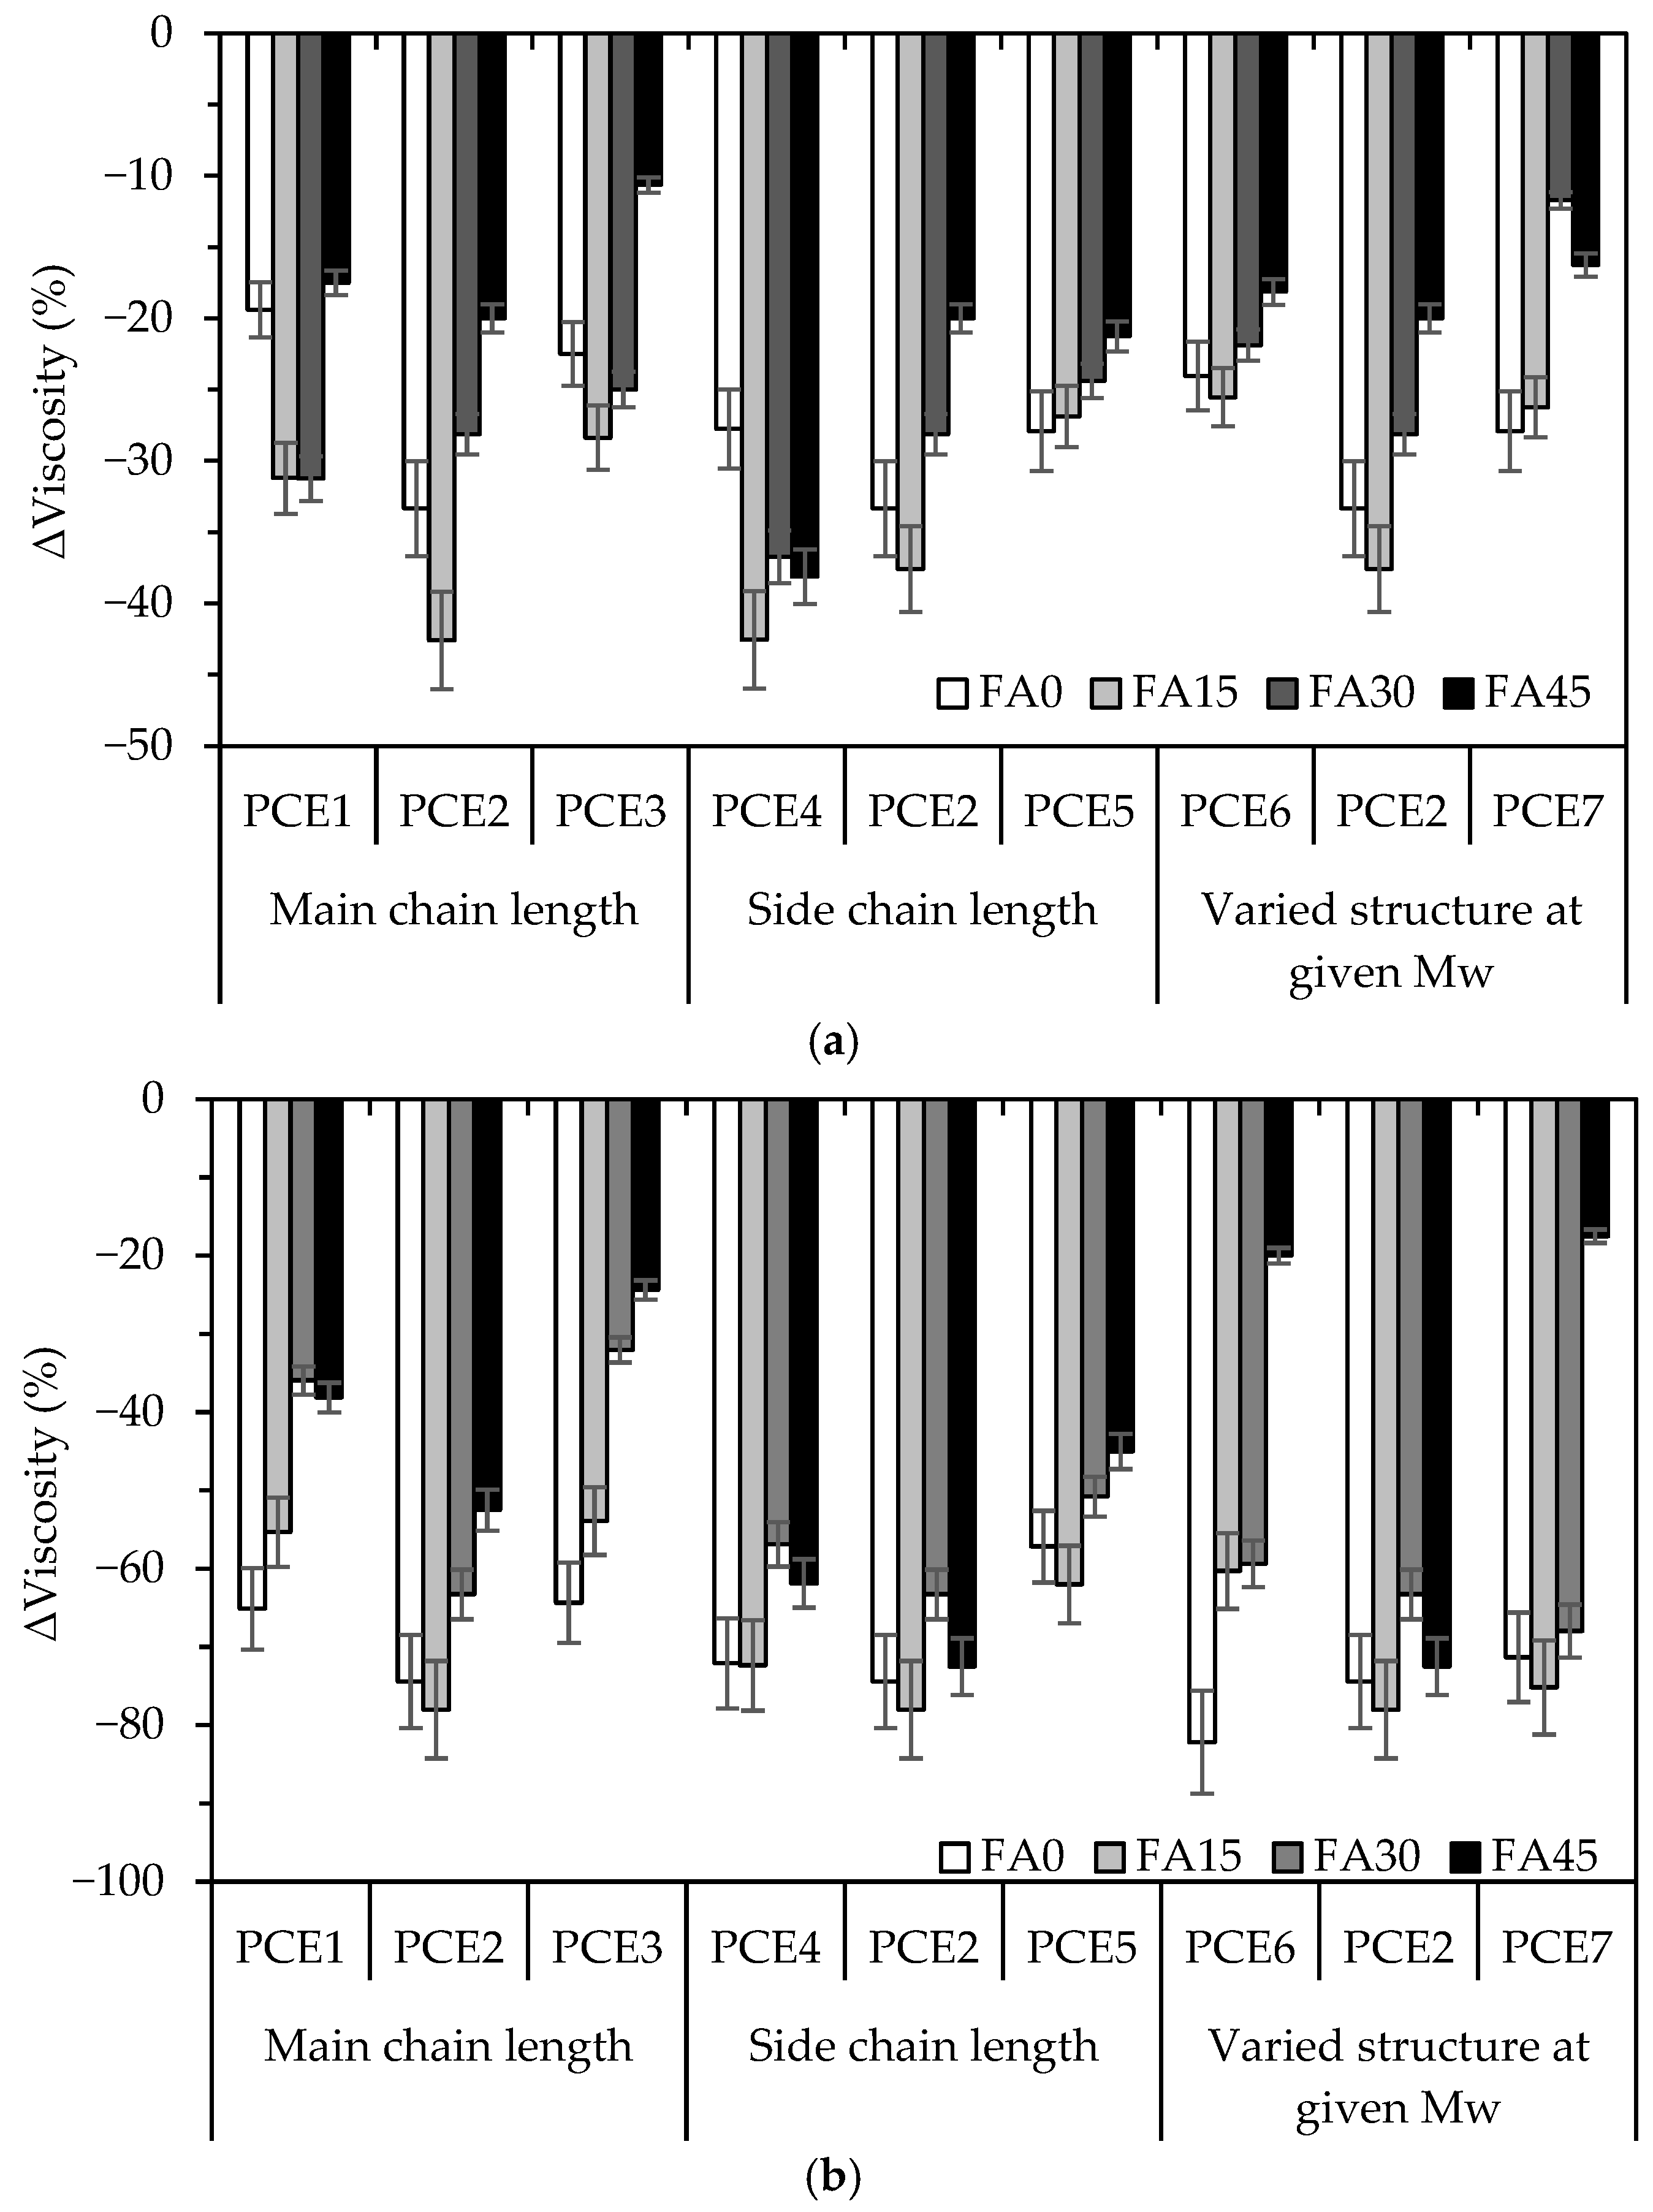
The variations in apparent viscosity [i.e., Δ(Viscosity)] for the various pastes prepared with 0.1% or 0.15% PCE additions are plotted in Figure 7. The Δ(Viscosity) values are normalized for every fly ash-replacement rate with respect to the control mix prepared without PCE. The results are grouped into three categories related to the effect of the backbone (or main chain) length, the side chain length, or varying the PCE structure while keeping a similar Mw of 56,000 g/mol. PCE2 featuring 21 anionic groups is considered the benchmark polymer, possessing a “medium” backbone of 21 k and a side chain length of 2400 g/mol [30].

4.2.1. Effect of Backbone (Or Main Chain) Length

Mixtures prepared with PCE2 having an intermediate backbone length of 21 k experienced the highest drops in apparent viscosity. For example, at a 0.1% dosage, PCE1 and PCE3 possessing 10 or 31 k backbone lengths exhibited about a 20% drop in viscosity in fly ash-free mixtures, while this reached 33% for PCE2. The same trend appeared for mixtures containing 0.15% PCE. This can be directly attributed to variations in the adsorption capacity with the increase/decrease in backbone length, as illustrated in Figure 6. The adsorbed PCE molecules are known to enhance dispersion through a steric hindrance effect induced by their main chains, leading to reduced rheological properties [10,48]. The limited dispersion ability for PCE1 can be attributed to the polymer’s low backbone length and Mw. At the same time, the adverse effect of PCE3 mixtures can be linked to a low Rh value that accentuates the entanglement of long leading chains [49,50,51]. Thus, it can be stated that short backbone lengths are not efficient in ensuring proper cement dispersion. In contrast, longer backbones can entangle and intertwine within the cementitious materials, leading to reduced efficiency.
In general, the apparent viscosity decreased by adding 15% fly ash. Still, it then increased at higher replacement rates of 30% and 45%. In the past, this has been associated with finer particles that increased the tendency towards agglomeration and the need for PCE molecules [43,52]. For example, at a 0.1% PCE2 dose, the Δ(Viscosity) reached −42% for FA15 and then dropped to −28% and −20% for FA30 and FA45 mixtures, respectively. As shown in Figure 1b–d, the fly ash particles are characterized by increased voids on their irregular surfaces, causing the PCE to be adsorbed into the voids and decreasing dispersion effectiveness. Wang et al. [13] elucidated the interaction mechanisms between PCE and fly ash as follows: (i) less pronounced adsorptions due to the lower density of positively charged sites on fly ash surfaces compared with cement, (ii) reduced dispersion capabilities as some PCE molecules become trapped within the surface voids of fly ash particles, (iii) and reduced flowabilities given that the PCE with a high negative charge density can adsorb onto multiple particles, inducing agglomeration via the bridging effect.

4.2.2. Effect of Side Chain Length

In general, the apparent viscosity of mixtures containing PCE2 and PCE4 molecules possessing short and medium side-chain lengths of 1000 and 2400 g/mol were similar; the resulting Δ(Viscosity) ranged between −30% to −42% at a PCE dose of 0.1%, and from −60% to −75% at a PCE dose of 0.15%. Nevertheless, increasing the side-chain length (i.e., PCE5) negatively impacted the rheological properties, increasing apparent viscosity. PCE5 exhibited the lowest adsorption capacity (Figure 6), which is believed to reduce the steric hindrance effect, including the dispersion of solid particles. Earlier studies showed that the steric hindrance effect was significantly more dominant than the electrostatic effect and deteriorated at longer side-chain lengths [30,53].
As shown in Figure 7, the detrimental effect of PCE5 on viscosity is particularly pronounced for mixtures containing higher fly ash-replacement rates. For example, Δ(Viscosity) varied from −62% to −50% and −45% for mixtures containing 15%, 30%, and 45% fly ash, respectively. This can be ascribed to the PCE molecules that penetrate into the fly ash pores, causing deactivation or limited surface adsorption due to the lower positive charge density. In such cases, the unadsorbed PCE molecules can lead to flocculation by forming bridges between the fly ash particles, increasing apparent viscosity.

4.2.3. Effect of Varied PCE Structure at Equal Mw

Mixtures prepared with PCE2 possessing moderate main and side-chain lengths exhibited reduced apparent viscosity. For example, at a dose of 0.1%, Δ(Viscosity) reached −38% for 15% fly ash mixtures containing PCE2, compared with −25% for those made using PCE6 or PCE7. This physically assumes that the polymer structure, including the main and side chains, must be thoroughly balanced for optimum performance at a given Mw. As described earlier, PCE6 was characterized by a short backbone length of 17 k and a high side chain of 3000 g/mol, which led to a reduced adsorption capacity and, consequently, higher viscosity. On the other hand, PCE7 has a long backbone of 40 k, which, despite high adsorption, can entangle and intertwine within the cementitious materials, reducing efficiency [47,50]. Hence, the steric hindrance effect induced by long side-chains may outweigh the electrostatic interactions associated with a shorter main chain length, and the diminished adsorption could have raised the probability of non-adsorbed PCE molecules onto the cement grains.
The performance of PCE6 and PCE7 deteriorated for mixtures containing higher fly ash-replacement rates, particularly at an increased polymer dose of 0.15% (Figure 7); the Δ(Viscosity) dropped from about −75% for the control mixtures to about −20% for those prepared with 45% fly ash. This rheological inference aligns with the earlier factors, including the contribution to agglomeration resulting from higher fly ash fineness and entrapment of PCE molecules within the pores’ surface. Zhang et al. [39] ascribed this phenomenon to the bridging effects despite the high adsorption efficiency of long main chain PCE. Accordingly, it is suggested that fly ash adsorption in the present study may also involve a bridging mechanism, leading to an increased apparent viscosity (thus, reduced Δ(Viscosity) responses).

4.3. Setting Time

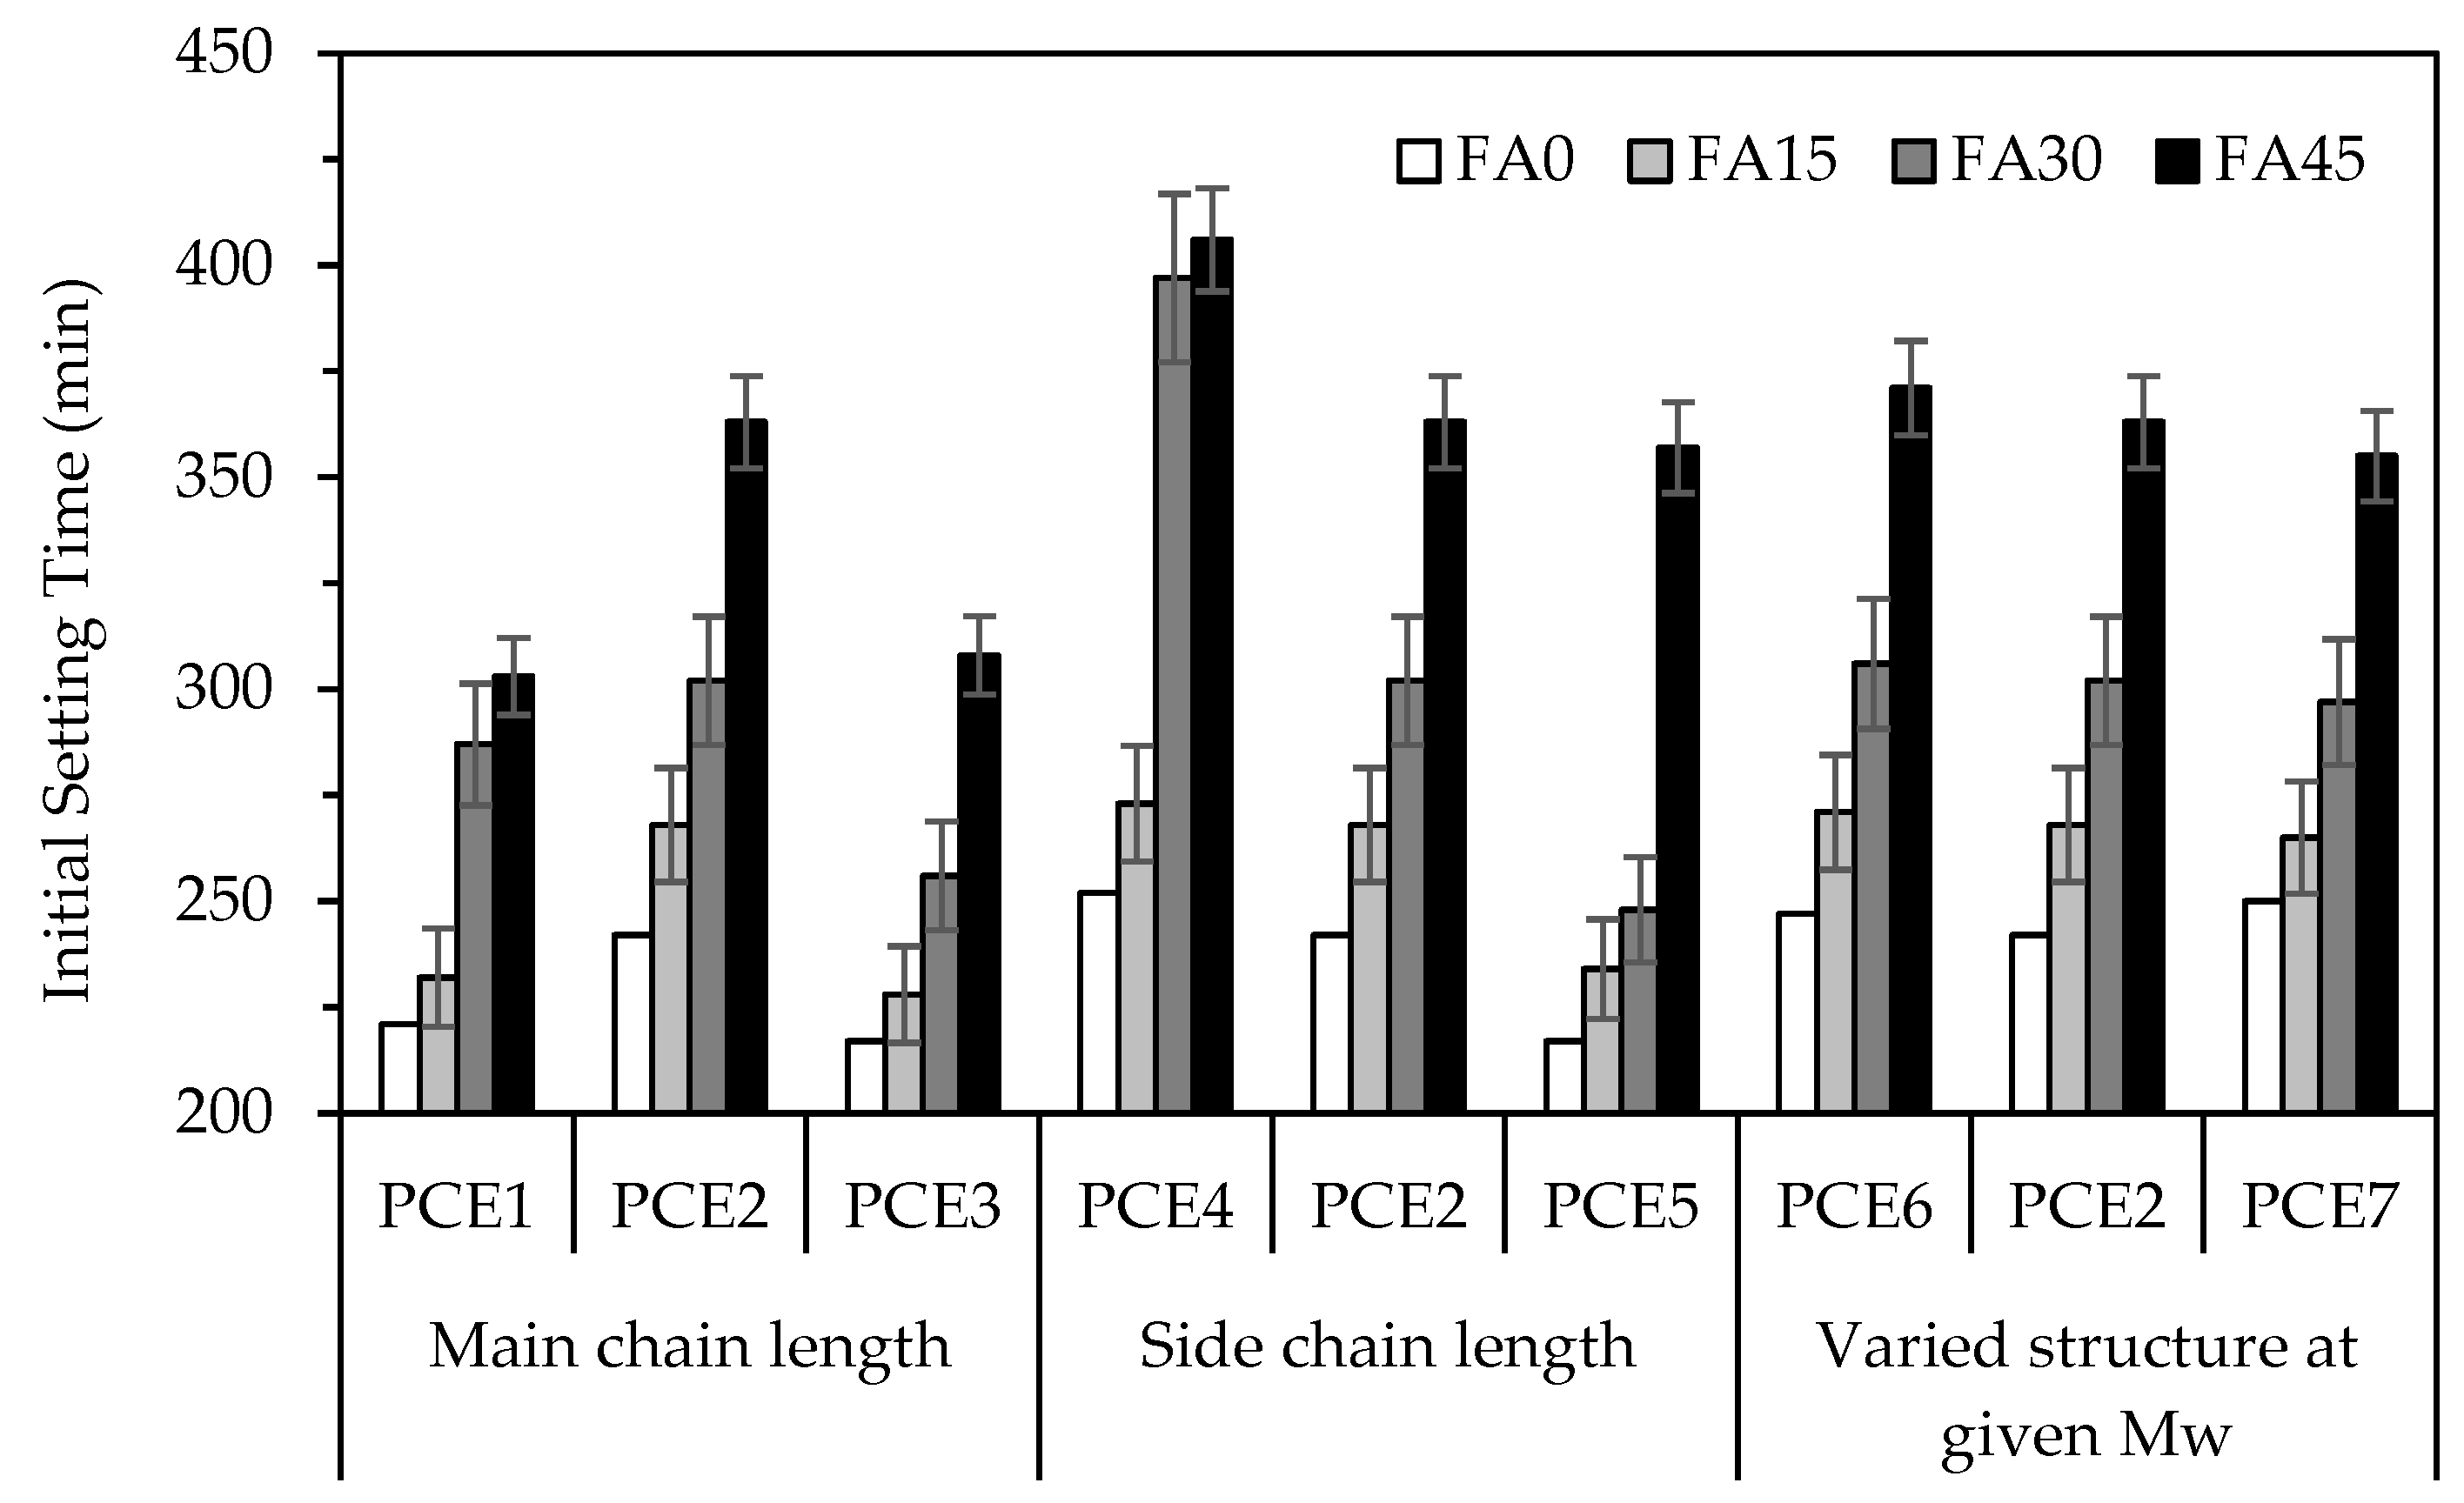
As shown in Figure 8, mixtures containing increased fly ash contents led to delayed setting. For example, this increased from 220 min for FA0-PCE1 to 287 and 303 min for equivalent pastes containing 30% and 45% fly ash, respectively. The delay in setting can mainly be attributed to a dilution effect that reduces the hydration reactions and formation of hydrated compounds [8].
Generally, the setting times varied within the repeatability of testing in the third category of pastes prepared using PCEs possessing equal Mws (i.e., PCE2, PCE6, and PCE7). In contrast, the side and main chain lengths appear to have a significant influence on cement hydration and the setting kinetics. At an equal PCE side-chain length of 2400 g/mol, the paste prepared using the shortest backbone length of 10 k (i.e., PCE1) exhibited the shortest setting time, while PCE3 and PCE2 led to gradually increased set values. It is well established that polymers having long backbone chains (i.e., such as PCE2 and PCE3) can hinder the contact between particles and water [54,55], leading to prolonged setting times. The retardation of hydrate formation due to PCE additions has been attributed to the adsorption of negatively charged molecules onto the positively charged cement particles, thereby blocking active dissolution sites [56,57]. Zhu et al. [54] reported that PCE molecules in the pore solution consume substantial amounts of hydration ions, hindering the formation of hydration products.
As shown in Figure 8, the paste prepared using PCE2 exhibited a relatively longer setting time than the one containing PCE3, each possessing 21 k and 31 k backbone lengths, respectively. This is aligned with their adsorption capacity of 1.15 and 0.58 mg/g, respectively (Figure 6). Additionally, factors such as the chelation of PCE molecules with Ca2+ ions, reduced the ion concentration in the solution, and restricted water access to cement grains contributed to delayed hydration [58]. Yamada et al. [59] observed that higher PCE adsorption levels resulted in greater hydration delays. This aligns with the TGA analysis, which suggests that the complexation of PCE molecules with free Ca2+ ions lowers solution conductivity and solubility, thereby reducing the concentration of free calcium ions, slowing down hydration rates, and delaying setting [60]. PCE molecules enhance the solubility of aluminate and sulfate ions, which may delay silicate hydration [50].
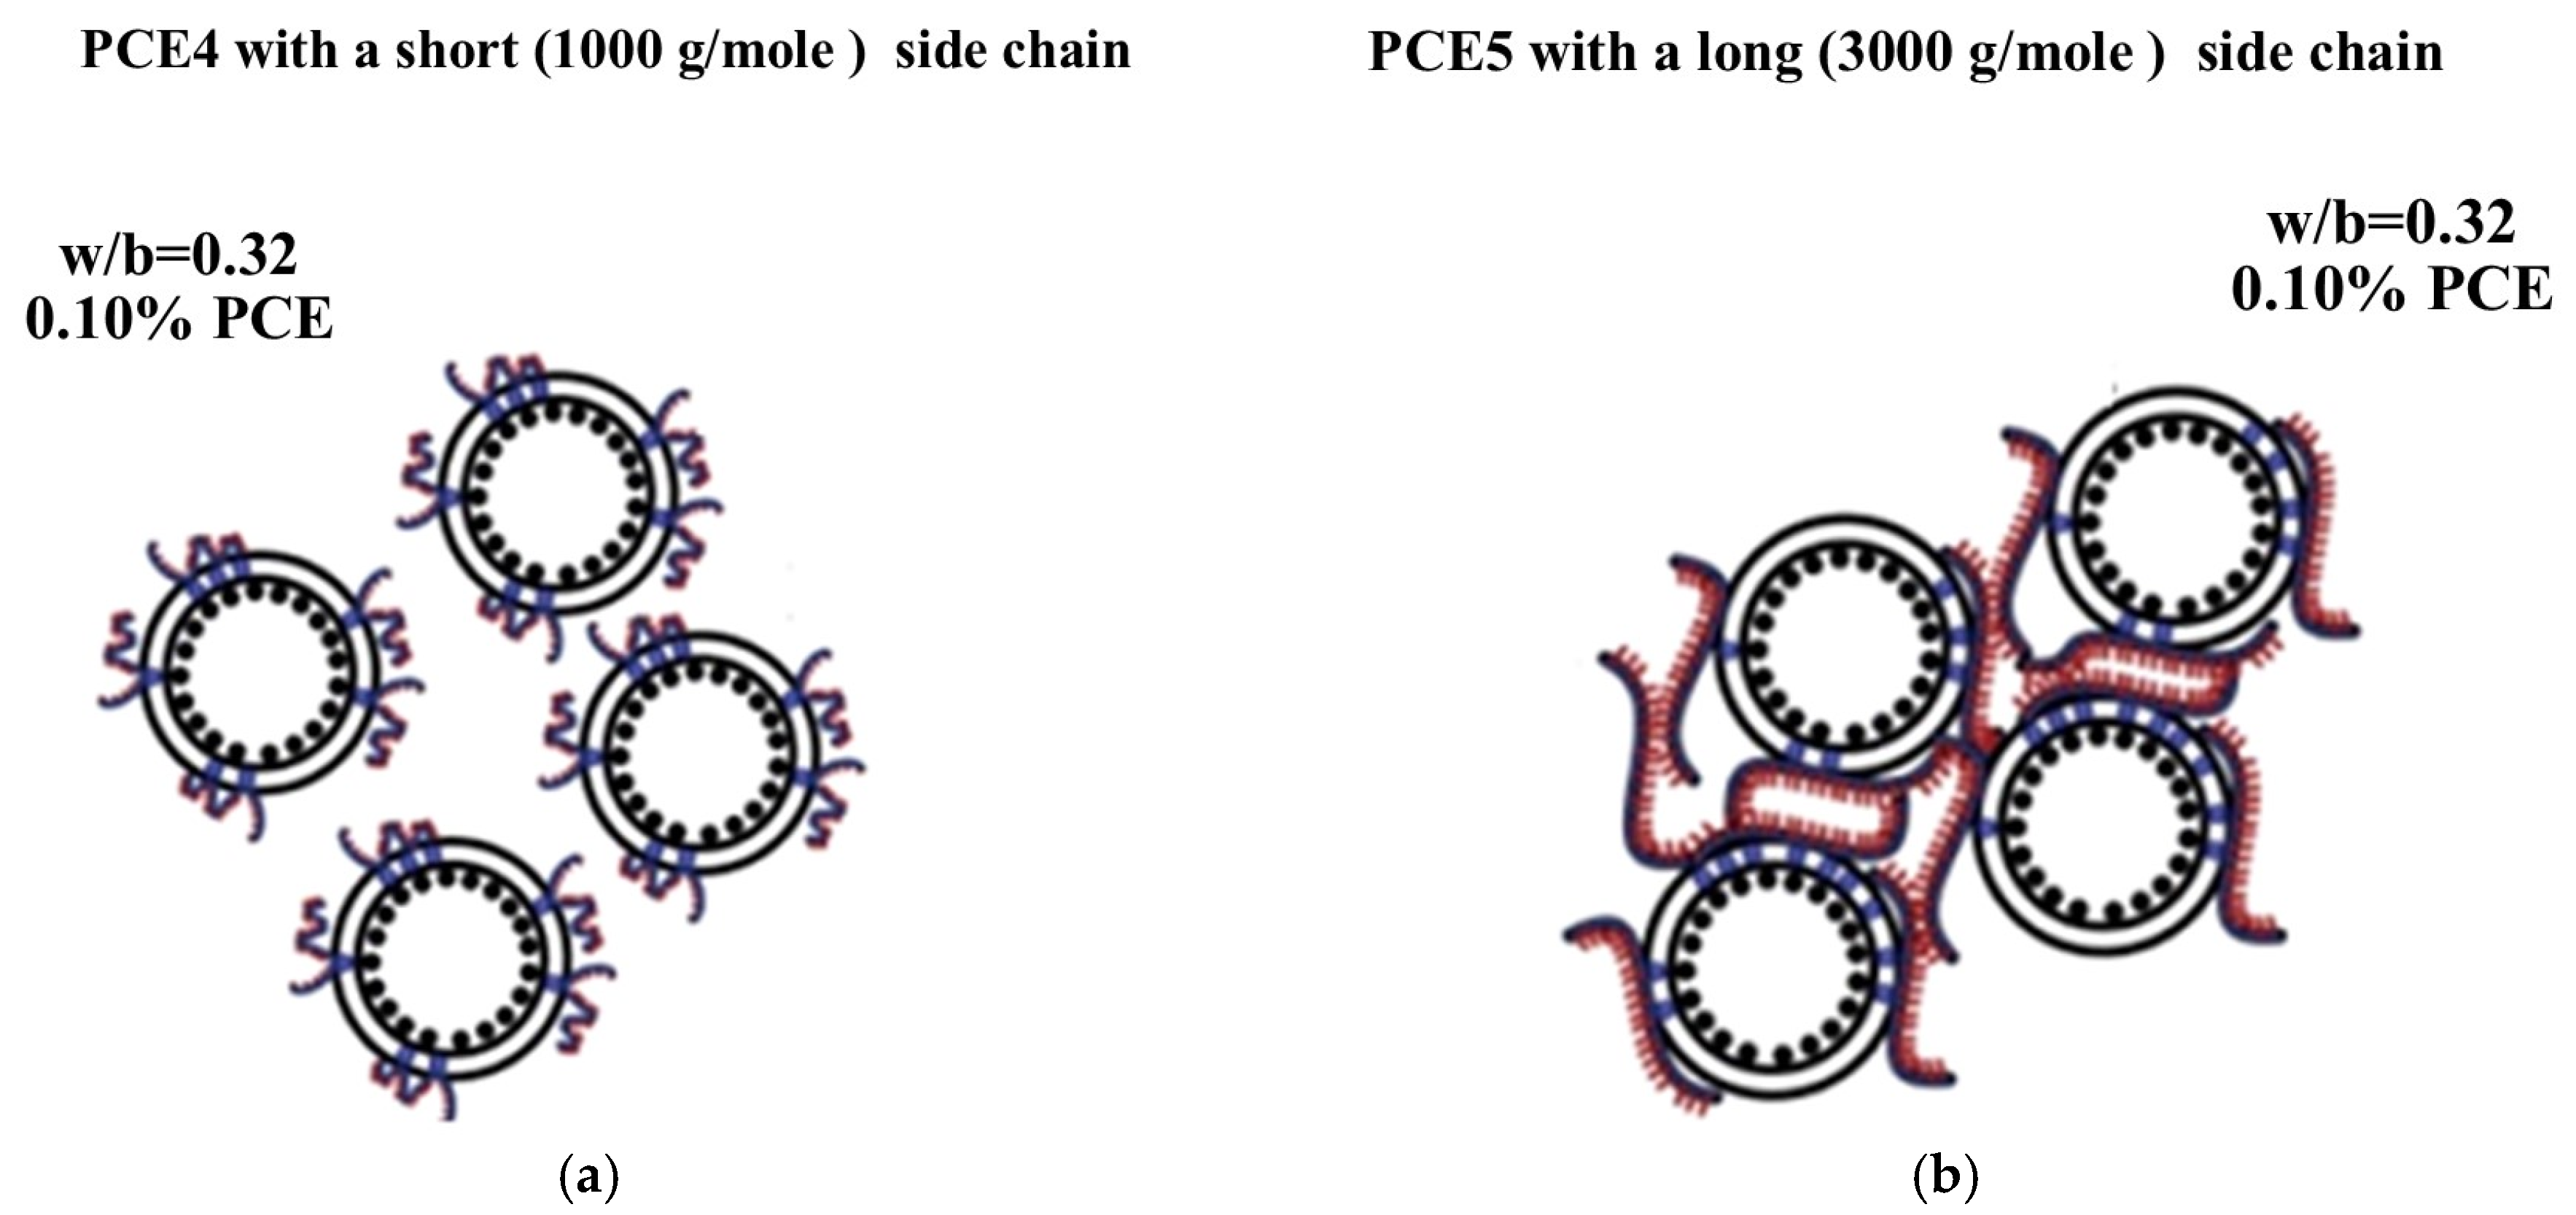
At equal PCE backbone lengths, the setting times decreased in the order PCE5 < PCE2 < PCE4, corresponding to progressively longer side chains and higher Mw values (Figure 8). For PCE5, with long side chains of 3000 g/mol, reduced adsorption on cement grains facilitated a better cement–water interaction, resulting in shorter setting. In contrast, PCE4 exhibited the highest adsorption capacity in this group, attributed to its shorter 1000 g/mol side chains and an Mw of 26,000 g/mol (Figure 6). This stronger adsorption intensified setting retardation, whereas PCE5’s lower adsorption ability diminished retardation and further enhanced the cement–water interaction. Similar findings were reported in our previous study, which investigated the interaction of PCEs with cement [26].

4.4. PCE Demand and Flow Retention of Mortars

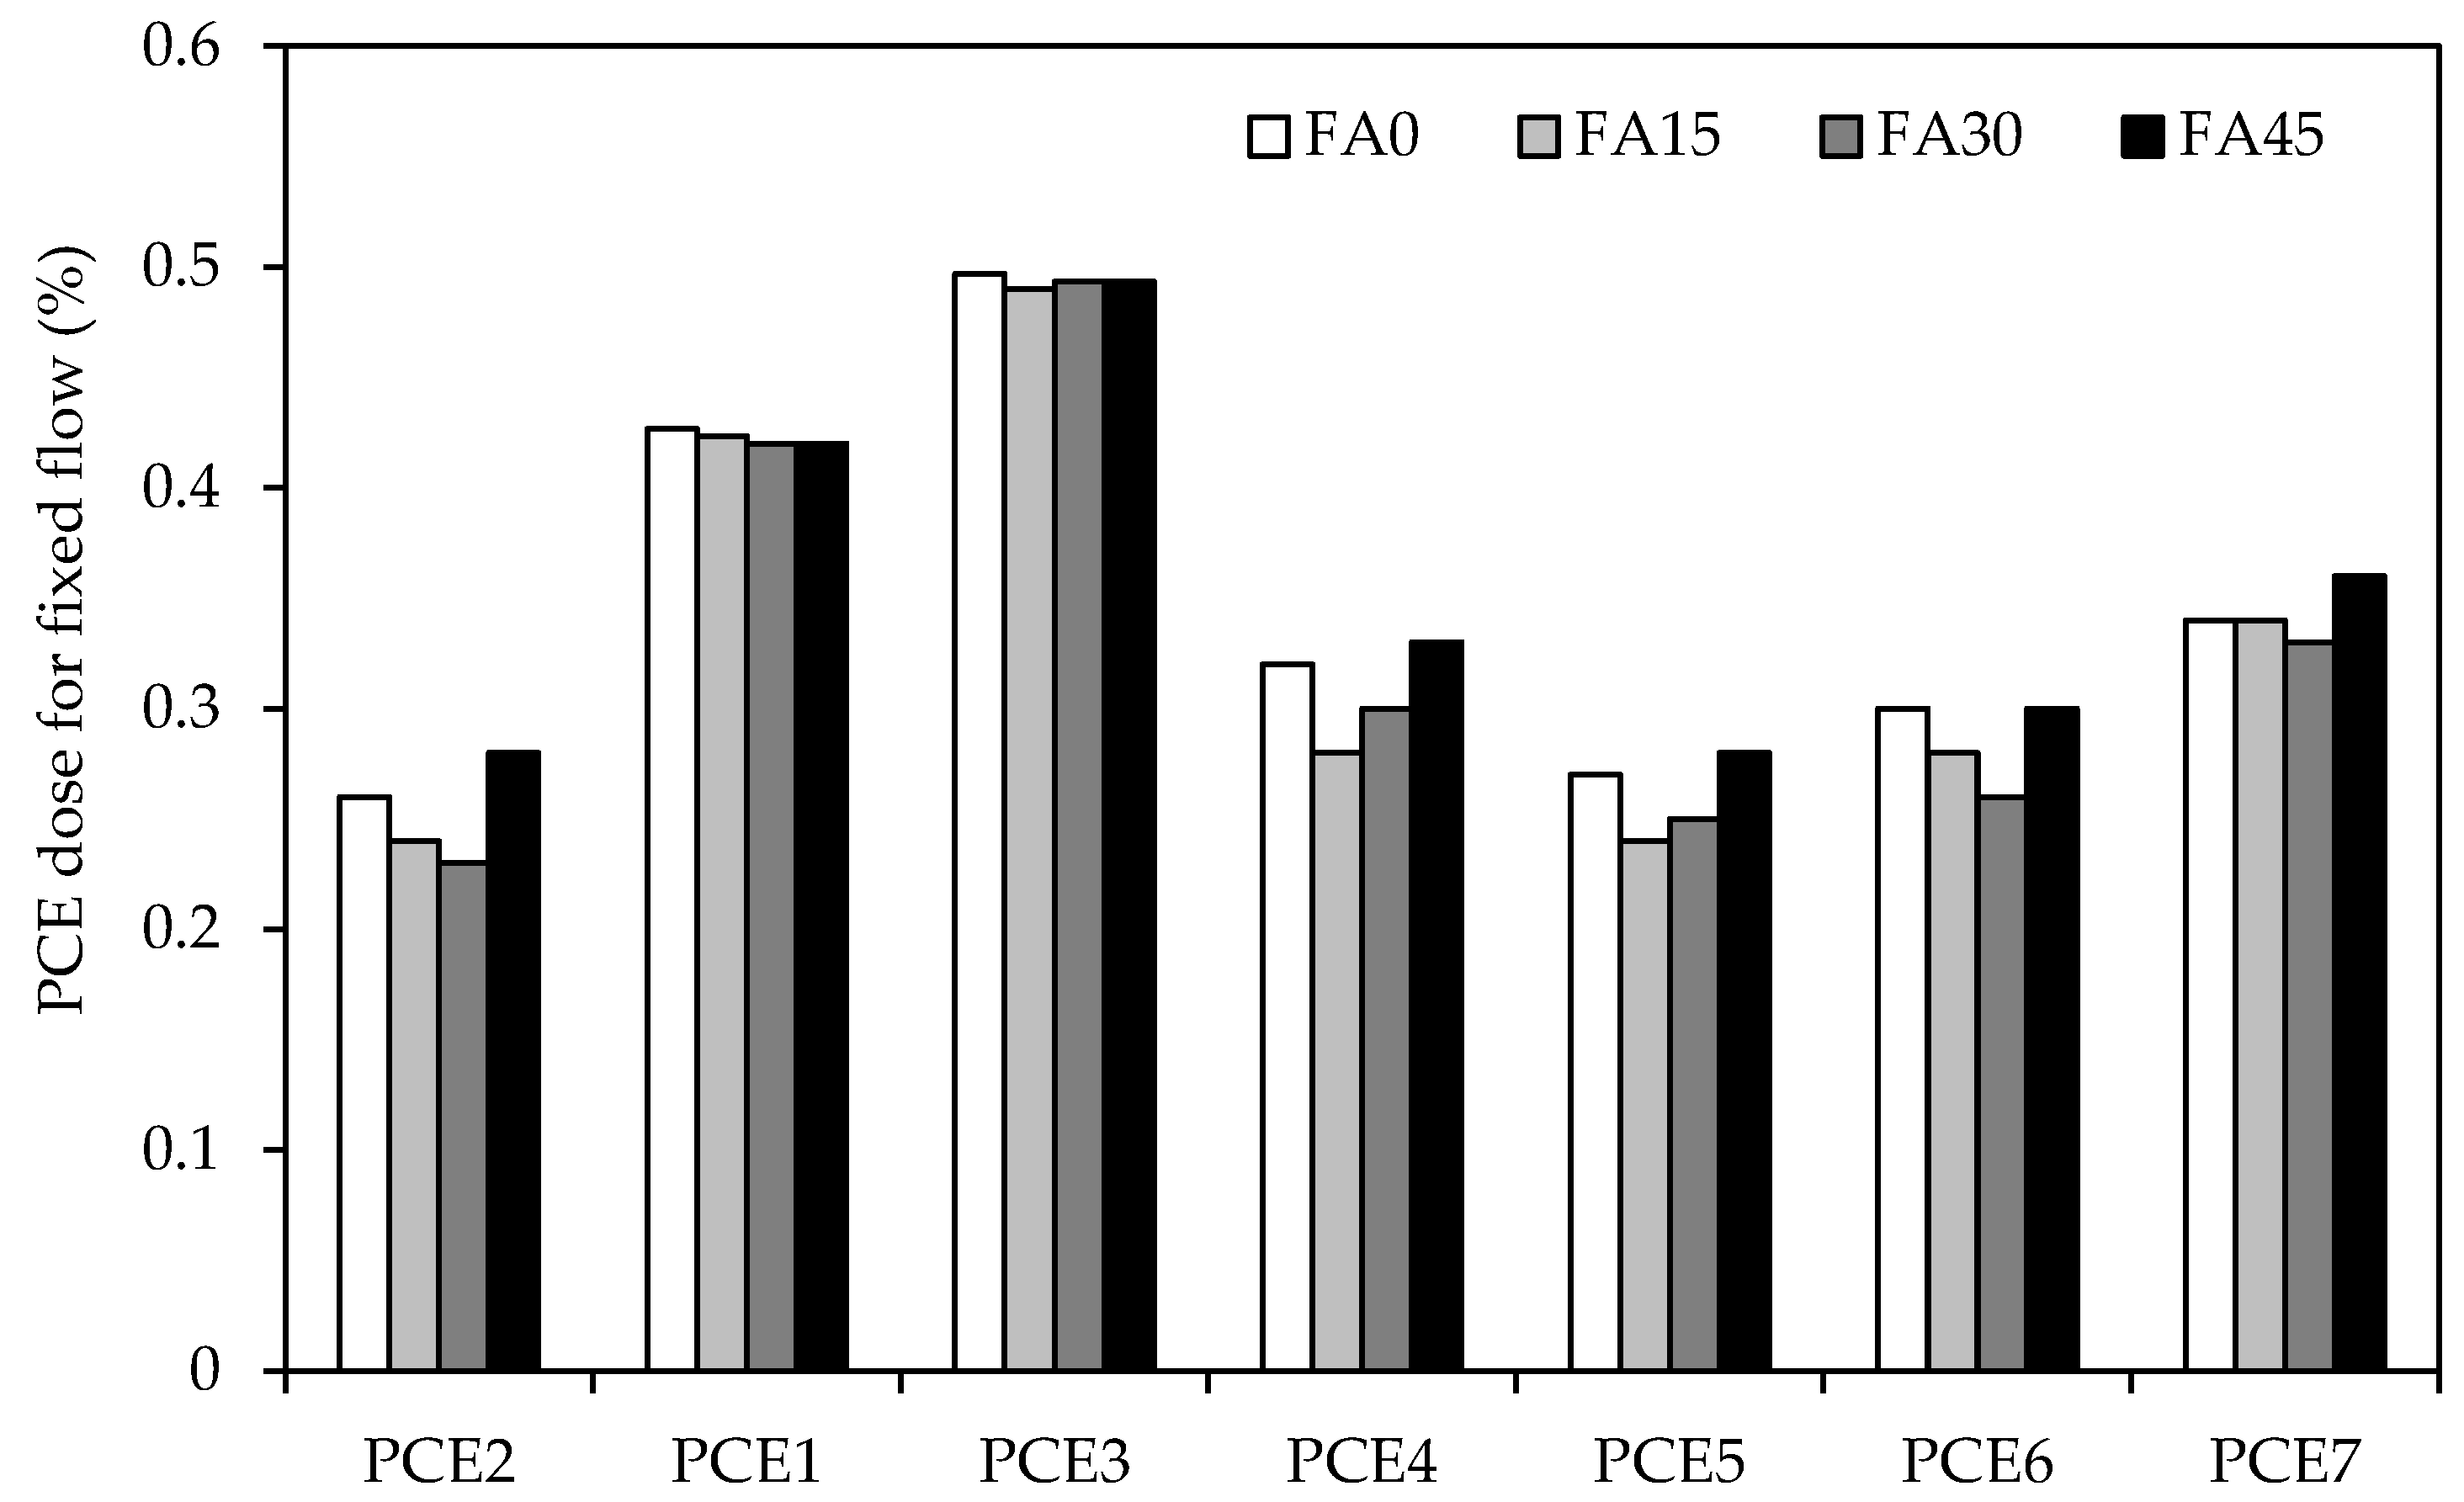
Figure 9 illustrates the PCE dosage requirements for the different mortars to achieve the desired flow of 27 ± 2 cm. Meanwhile, Table 4 summarizes typical time-dependent flow responses determined on mixtures prepared without or with 30% fly ash at a fixed PCE dose of 0.25%; also, the plots for the flow loss after 30 and 60 min are shown.

4.4.1. Impact of Backbone Length

Compared with PCE2, having an intermediate backbone length of 21 k, the demand for superplasticizing molecules to achieve a given flow substantially increased when the main chain length decreased to 10 k (i.e., PCE1) or increased to 31 k (i.e., PCE3); the resulting polymer increase was about 65% and 90%, respectively, regardless of the fly ash-replacement rate. This phenomenon can be attributed to the relatively limited adsorption capacity of PCE polymers having 10 k or 31 k backbone lengths, compared with PCE2 (Figure 6). Earlier studies showed that the non-adsorbed PCE molecules can increase the thickening of the interstitial liquid phase, leading to higher viscosity and reduced flow [31,61]. On the other hand, mortars prepared with PCE1 or PCE3 exhibited remarkably lower flow loss over time compared with PCE2. This can be related to the non-adsorbed PCE molecules that remain in the solution, which are available to lubricate the mixture over time and prevent rapid loss in flow. As shown in Table 4, the presence of fly ash did not alter this trend, and the time-dependent flow responses of PCE2 in fly ash-incorporating mortars were higher than in mixtures incorporating PCE1 or PCE3. Figure 10 shows the flow losses of the mixtures after 30 and 60 min.

4.4.2. Impact of Side Chain Length

Unlike the backbone length, the effect of varying the side-chain length from 1000 to 2400 and 3000 g/mol did not affect the PCE requirements to achieve a given flow; the resulting dose hovered around 0.25% by mass of binder (Figure 9). On the other hand, the PCE requirements tended to decrease for mortars containing 15% fly ash replacements, which followed an increasing trend for higher fly ash concentrations of 30% and 45%. This reflects the favorable effect of relatively reduced fly ash-replacement rates on workability, including the greater affinity of the PCE side-chain lengths to such additions. At higher rates, the fly ash particles characterized by increased voids on their irregular surfaces tend to decrease the PCE dispersion efficiency, reducing workability. These results are consistent with earlier apparent viscosity findings, where the increase in steric hindrance was attributed to longer PCE side-chain lengths [30,34,48].
In terms of flow-retaining properties, mortars prepared with PCE4, possessing the shortest side-chain length of 1000 g/mol, exhibited the best flow retention after 30 and 60 min, followed by PCE2 and PCE5, having 2400 and 3000 g/mol, respectively. Without fly ash, the 60 min flow loss of mixtures containing PCE2 and PCE5 was 13% and 19% higher, respectively, compared with PCE4. In the presence of fly ash, the 60 min flow losses of PCE2 and PCE5 averaged 15% and 16% higher than those of PCE4. The increase in fly ash replacement did not influence the differences in the time-dependent flow performance of PCE. Notably, despite its higher adsorption (Figure 6) and consequently lower amount of non-adsorbed polymers, PCE4 exhibited superior consistency retention compared with PCE2 and PCE5.

4.4.3. Impact of Varied PCE Structure at Equal Mw

Generally speaking, the polymer requirements for a given flow and its retention over time are similar for mortars prepared with PCE2 and PCE6 (Figure 9 and Table 4). In contrast, a slight decrease in flow performance (indicating a higher PCE requirement) was observed for mortars incorporating PCE7. This can be attributed to its limited steric hindrance caused by the shorter side-chain length of 1000 g/mol [33,61]. In the fly ash-substituted mixtures, the PCE2 requirement for desired flow was lower by 42–52% and 13–17% compared with PCE7 and PCE6, respectively, reflecting the superiority of PCE2 with fly ash replacements. This can be attributed to the optimized molecular structure of PCE2, where adsorption and steric hindrance from the side chains enhance the flow of fly ash particles [53,62]. On the other hand, PCE molecules that do not adsorb onto particles are recognized to play a key role in the time-dependent evolution of flow performance [12,63].

4.5. Compressive Strength

The compressive strength development profiles of mortars prepared with different PCE and fly ash-replacement rates are plotted in Figure 11, where the error bar represents the standard deviation (i.e., data dispersion around the mean). The 1-day compressive strengths for FA0 mortars incorporating PCE1 through PCE7 were 9.2 ± 0.5 MPa, 12.1 ± 0.7 MPa, 9.5 ± 0.5 MPa, 11.8 ± 0.7 MPa, 12.3 ± 0.7 MPa, 15.0 ± 0.8 MPa, and 11.2 ± 0.7 MPa, respectively. The mixture prepared with PCE1 had the lowest 28-day compressive strength of 47.6 ± 2.8 MPa, while the one containing PCE6 yielded the highest strength of 51.1 ± 3.0 MPa.
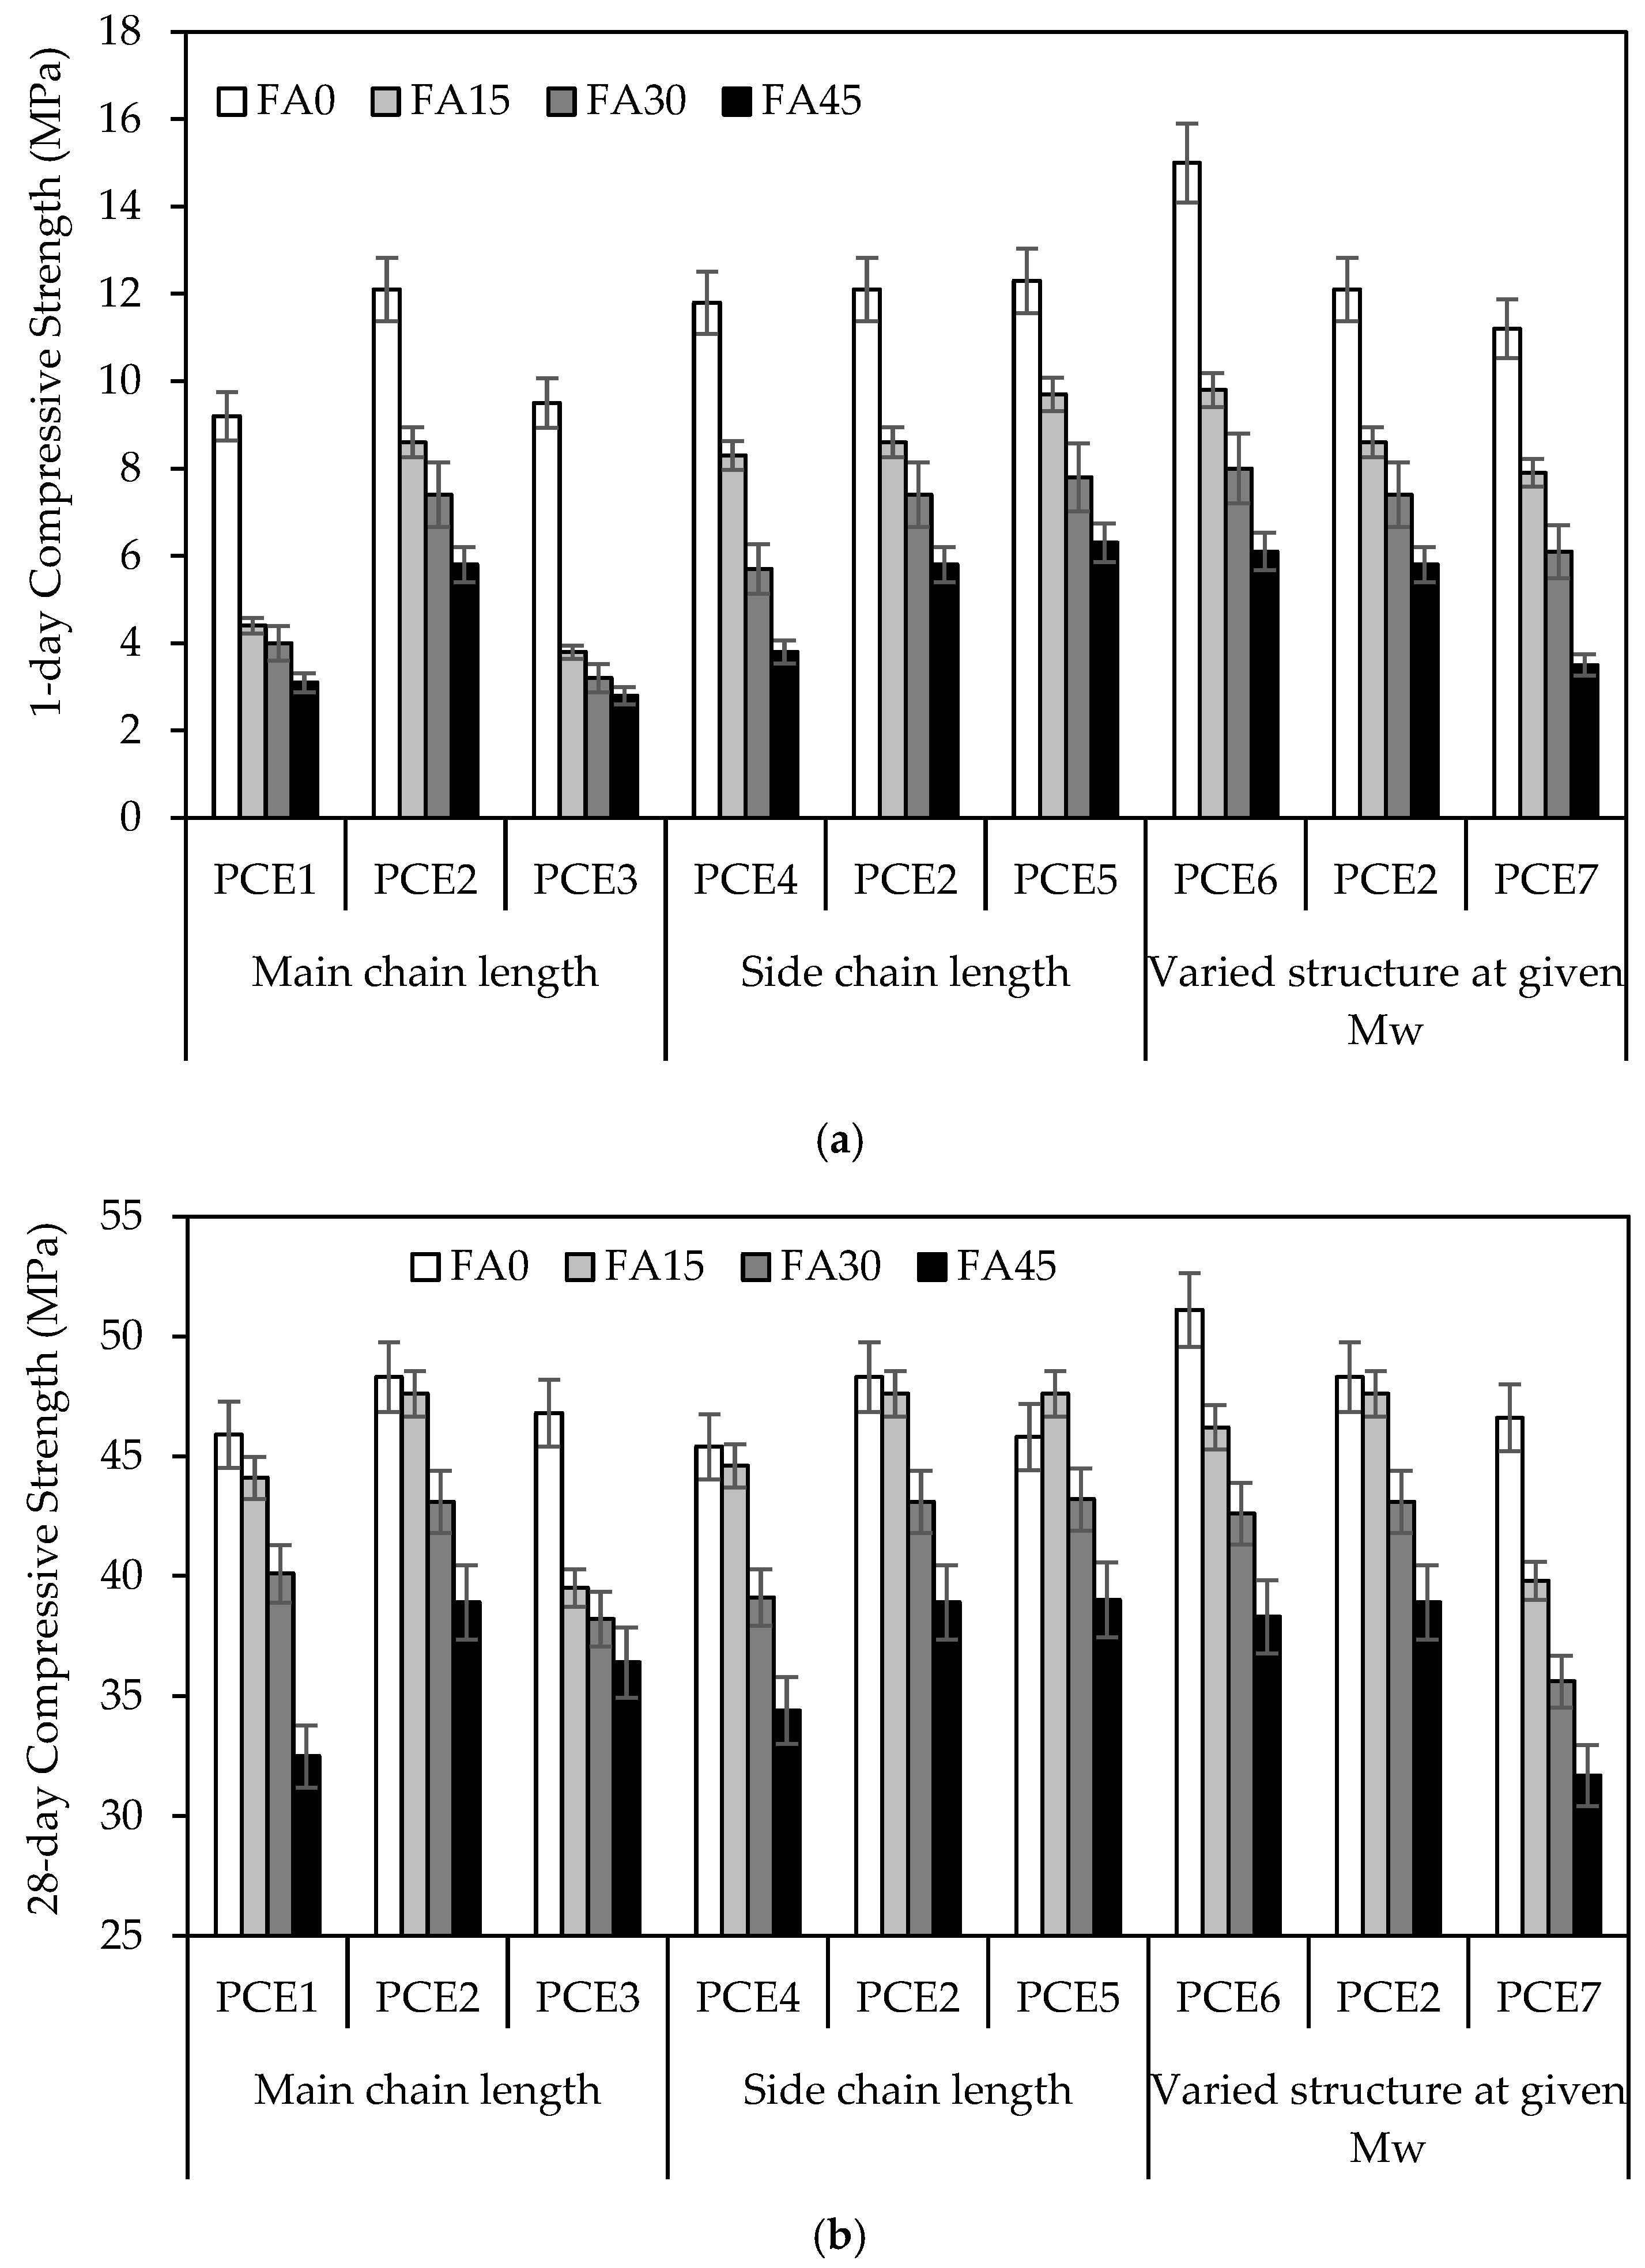
Figure 12 summarizes the 1- and 28-day compressive strengths of mortars made with different PCE types and incorporating various fly ash-replacement rates. In general, replacing cement with fly ash had a negative impact on strength, especially at an early age, when compared with the control mixtures prepared without fly ash. For instance, the 1-day strength of mortar made with PCE2 was 12.1 ± 0.7 MPa without fly ash, while this dropped to 8.6 ± 0.5 MPa, 7.4 ± 0.5 MPa, and 5.8 ± 0.4 MPa upon replacing 15%, 30%, and 45% fly ash, respectively. The corresponding 28-day strengths varied from 48.3 ± 2.9 MPa to 47.6 ± 2.8 MPa, 43.1 ± 2.5 MPa, and 38.9 ± 2.2 MPa, respectively. This performance loss is due to a dilution effect wherein the cement is replaced with fly ash, leading to reduced hydration reactions and the formation of hydrated compounds [64].

4.5.1. Influence of Backbone Length

The variation in backbone length affected the compressive strength of mortars (Figure 12). Hence, the use of short (10 k) and long (31 k) backbone lengths in PCE1 and PCE3, respectively, resulted in reduced strength compared with the counterpart mix containing the medium PCE2 backbone length of 21 k. This is applicable to all mortars regardless of the fly ash-replacement rate and testing age, reflecting the relevance of an optimum backbone length and Mw on the adsorption capacity and development of strengths over time. As earlier explained, the increase/decrease in the backbone length reduces the cement dispersion, thus hindering contact with cement water and the formation of hydration compounds [54,55,65]. As a result, the compressive strength followed a decreasing trend for PCE1 and PCE3.
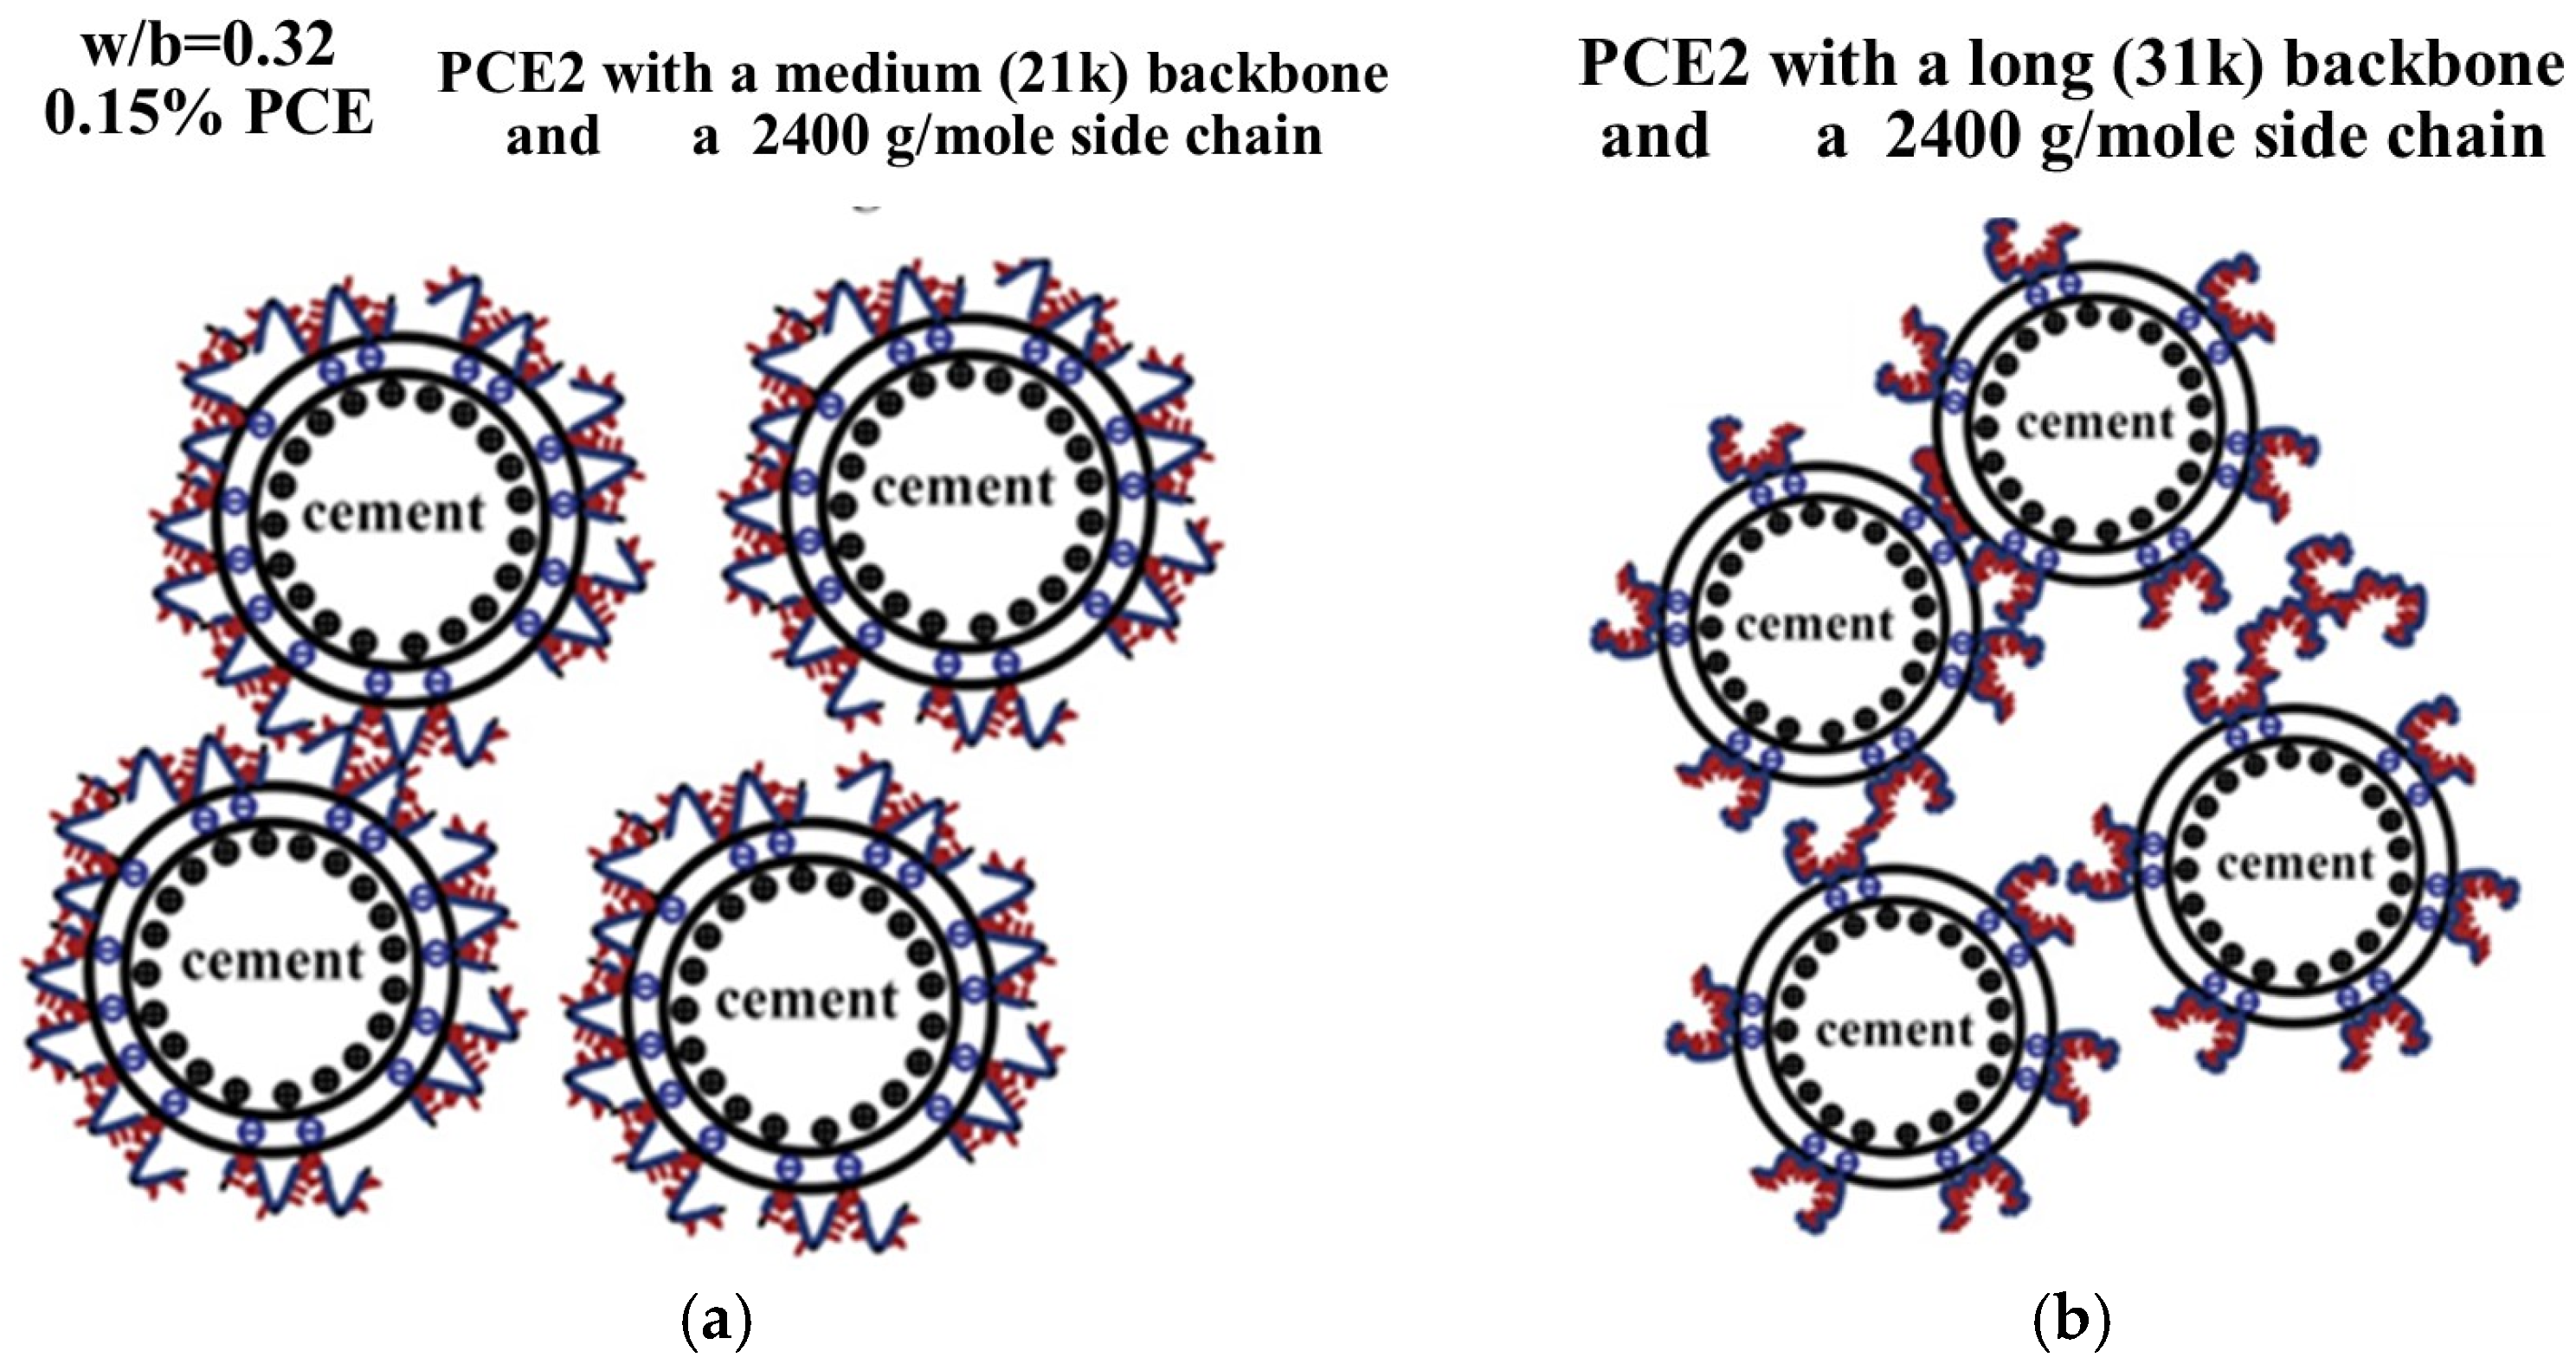
In the case of fly ash replacement, the mix incorporating PCE2 with a medium backbone and 2400 g/mol side chain outperformed other PCE in terms of rheology and compressive strength. Figure 13 illustrates these findings, with the PCE depicted based on their hydrodynamic diameter (Rh) (Table 3). Figure 13a shows the carboxylate group in PCE2 strongly adsorbing to cement via Ca2+ ions, thereby enhancing cement dispersion. As a result, the cement particles experience an increase in their interparticle distance, leading to enhanced rheology and strength development. Meanwhile, Figure 13b highlights the low adsorption and Rh of PCE3, with intertwining polymers leading to poor performance.

4.5.2. Influence of Side Chain Length

The early and late-age compressive strengths were marginally affected by the PCE side-chain length for fly ash-free mortar mixtures; the resulting strengths varied within the repeatability of responses. In contrast, the compressive strengths of fly ash-substituted mixtures containing PCE5 had a superior development rate compared with those prepared with PCE2 or PCE4. For example, the 1-day strength increased from 3.8 ± 0.2 MPa for the 45FA-PCE4 mix to 5.8 ± 0.3 MPa and 6.3 ± 0.3 MPa for the 45FA-PCE2 and 45FA-PCE5 mixtures, respectively. The same trend appeared at 28 days. This may be related to the weak PCE5 adsorption onto the fly ash particles, which may have caused enhanced hydration reactions due to the intertwining of non-adsorbed PCE molecules [39,66]. Conversely, the shorter side chains of PCE4 yielded a higher adsorption capacity that hindered the interaction between water and cement, thus leading to a retarded setting time and formation of hydration products [58]. As shown in Figure 14, the short side chains (1000 g/mol) in PCE4 led to a longer setting time and reduced strength due to a higher adsorption capacity, especially at high fly ash-replacement rates. The PCE5 possessing long side chains of 3000 g/mol exhibited a better dispersion of cementitious particles, with increased early- and late-age compressive strengths.

4.5.3. Effect of Varied PCE Structure at Equal Mw

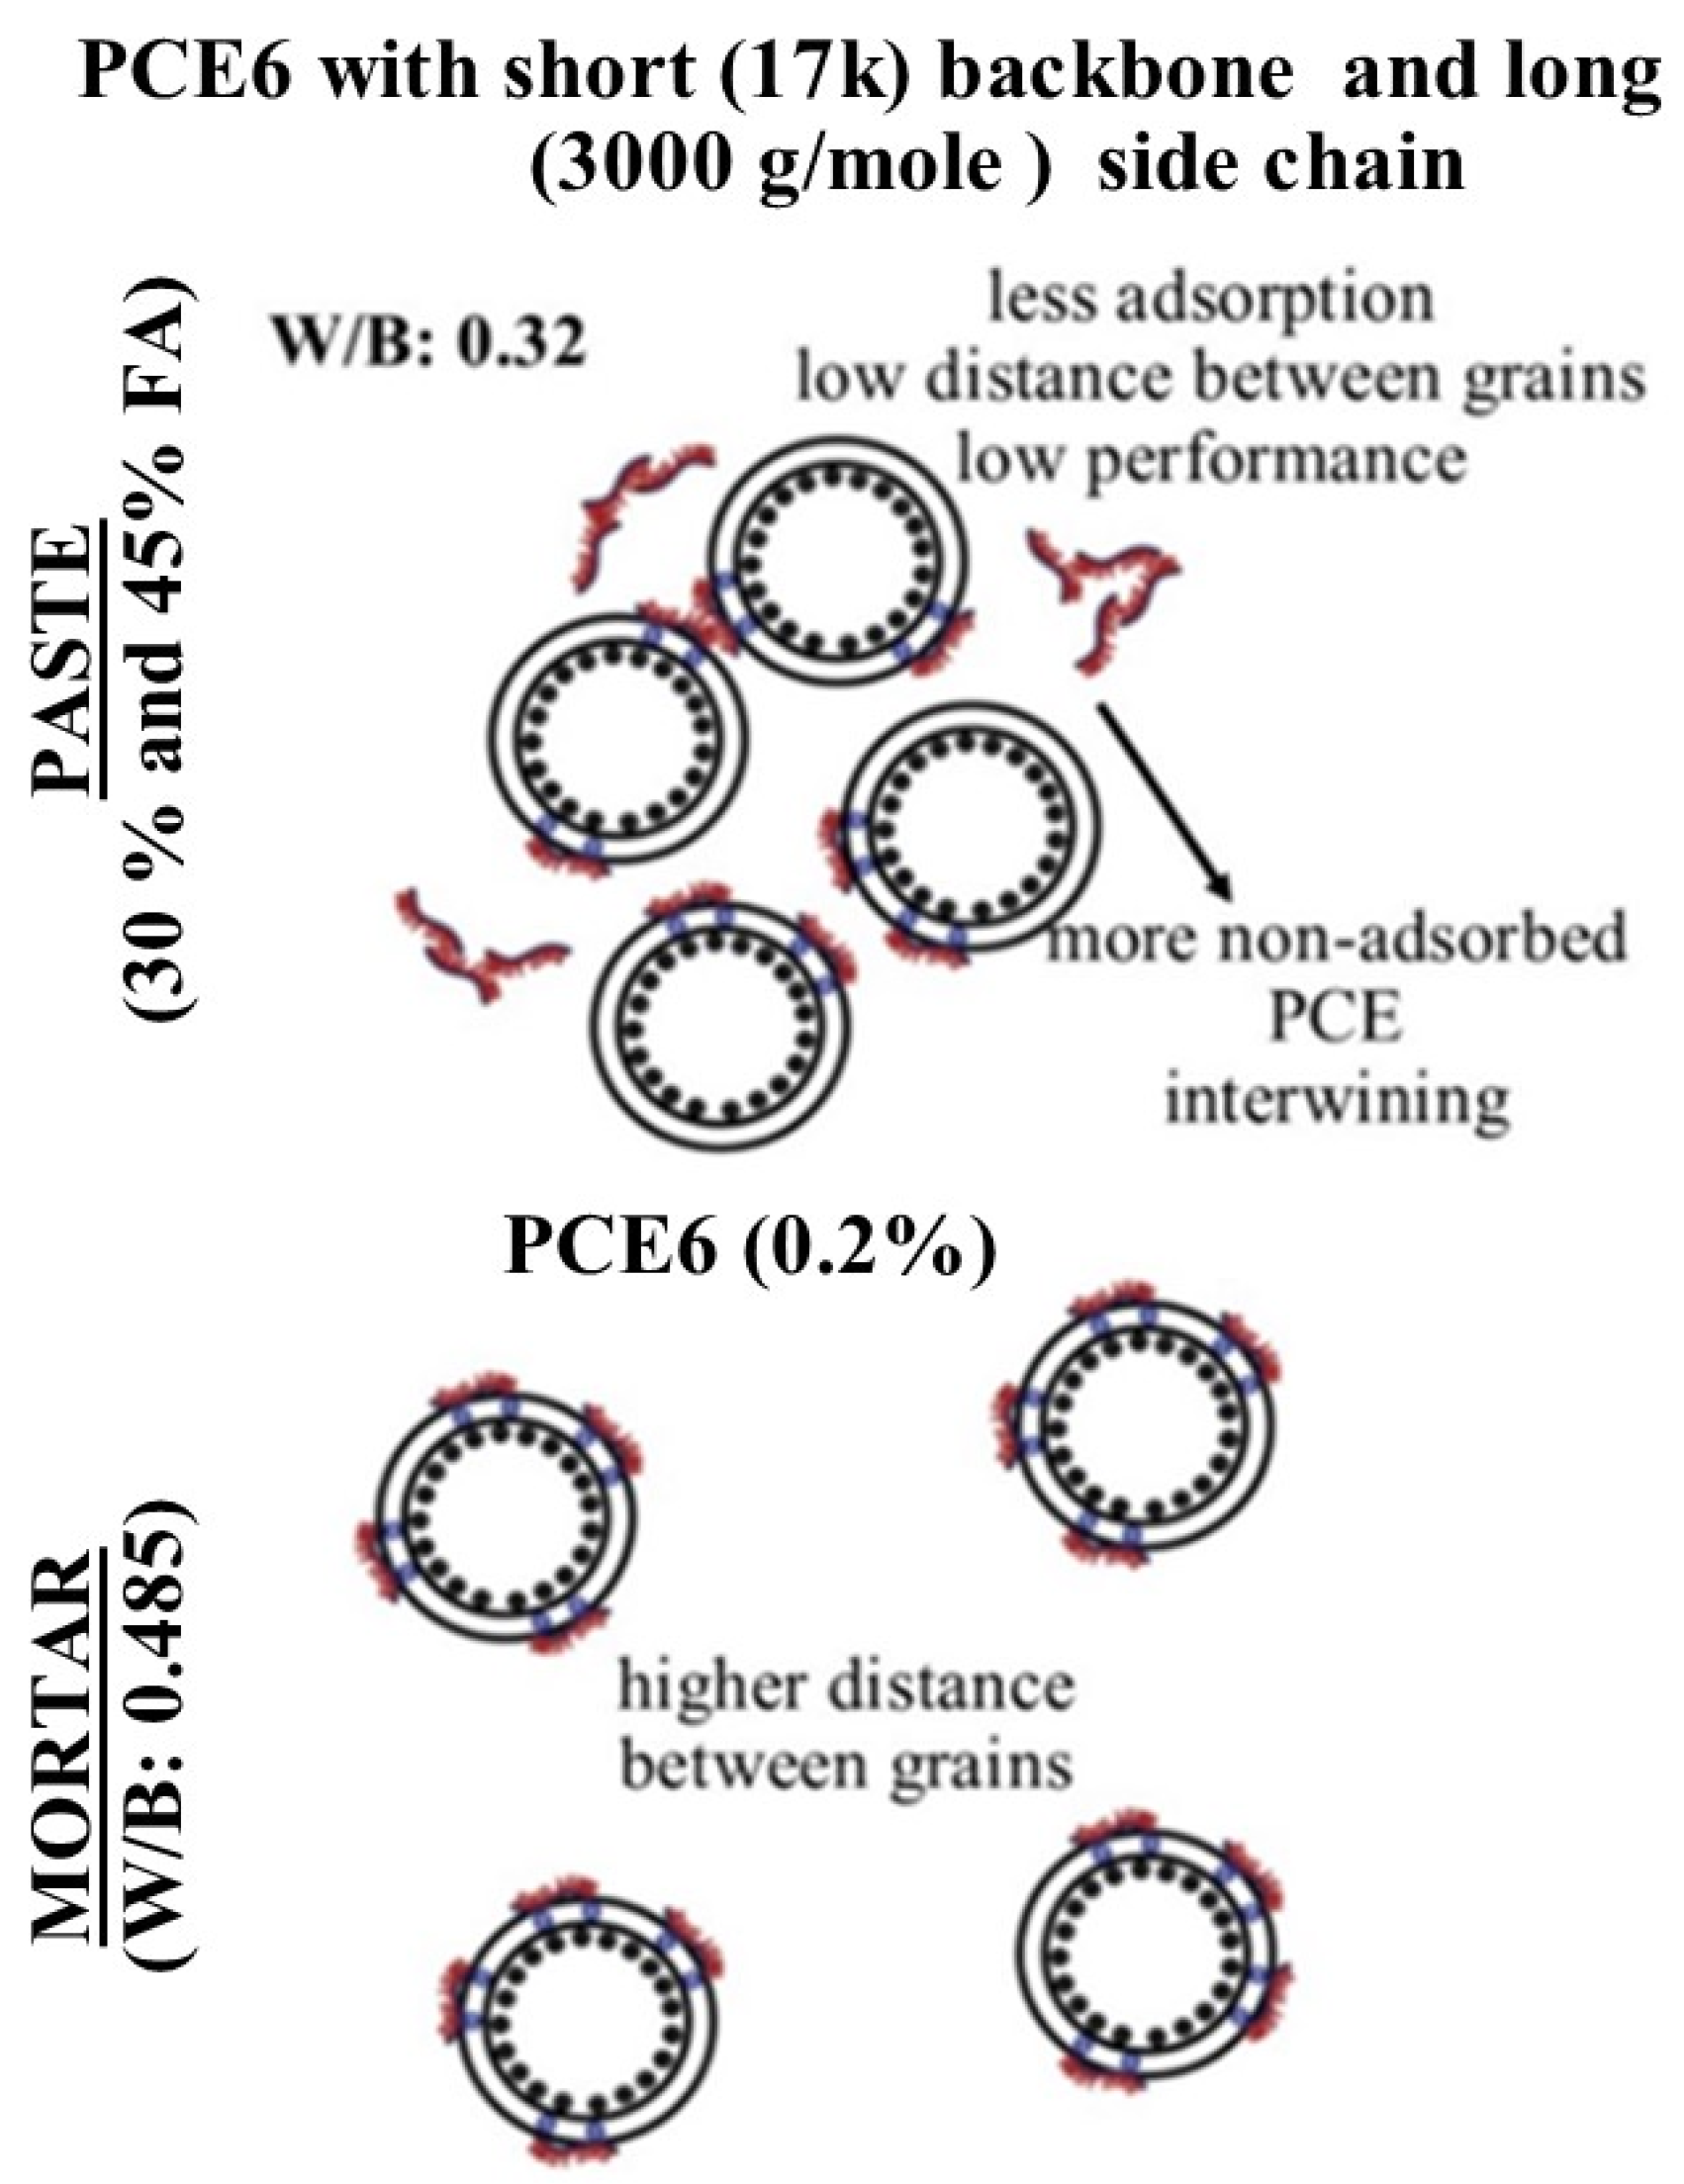
Mortars prepared with PCE6 exhibited the highest 1- and 28-day compressive strengths as compared with mixtures containing PCE2 and PCE7. The poor performance of PCE7 can be attributed to its long backbone length of 40 k, which hinders cement-water contact and the formation of hydration compounds [33,53]. As fly ash replaced cement, the performance of mortars containing PCE2 improved to obtain a similar compressive strength to PCE6 (~5% variation) and superior strength to PCE7. Apparently, the addition of fly ash caused a bridging effect and entanglement of the long PCE6 side chains as the cement volume decreased and the non-adsorbed PCE content increased [57,62]. As a result, the strength of fly ash-substituted mortars containing PCE6 decreased more significantly than those made with PCE2. Additionally, it is believed that the optimized molecular structure of PCE2, along with the adsorption and steric blocking effects of the side chains, led to improved compressive strengths. A simplified model pertaining to these findings is presented in Figure 15.

5. Conclusions

This study investigates the effect of PCE molecular structures on the fresh and hardened properties of cementitious systems incorporating up to 45% fly ash replacement. Seven PCEs possessing different Mws (27,000–78,000 g/mol), backbone lengths (10–40 k), and side chain lengths (1000–3000 g/mol) were evaluated. The following conclusions can be drawn:
  • PCEs with medium backbone lengths (21 k) and short-to-medium side chains (1000–2400 g/mol) provided higher flow and lower apparent viscosity, while long backbone lengths or high Mw reduced adsorption and efficiency due to chain entanglement and low Rh values.
  • Apparent viscosity decreased at 15% fly ash replacement but increased at 30% and 45%, likely due to fine ash particle agglomeration and surface voids trapping PCE molecules.
  • PCEs with shorter backbones, longer side chains, or higher Mws slightly reduced setting times by adsorbing onto cement particles and delaying hydrate formation. Higher fly ash additions delayed setting due to a dilution effect.
  • PCE demand increased when backbone length deviated from 21 k (10 k or 31 k) but decreased at 15% fly ash replacement, then increased at higher fly ash contents. Side chain length had little effect.
  • Medium-backbone PCEs (21 k) consistently yielded higher compressive strengths, while short (10 k) or long (31 k) backbones reduced strength, correlating with flow and rheological behavior. Early- and late-age strength was marginally influenced by side chain length in fly ash-free mortars but improved in fly ash-substituted mixtures with longer side chains due to weaker PCE adsorption on fly ash.
  • The main outcome of this study is the straightforward selection of HPEG-type PCE molecular structures for fly ash-replacement systems. Yet, it is limited to the use of systems comprising a single fly ash type (Class F) and a single PCE type (HPEG). Accordingly, future studies are recommended to evaluate the impact of multiple fly ash types and PCE types on the rheology, setting, and strength of cementitious systems. Additionally, it is worth examining the effects of PCE molecular structure variations in the early-age and long-term hydration kinetics and microstructure of cementitious systems.

Author Contributions

Conceptualization, V.K., A.M. and J.A.; methodology, V.K., A.M. and J.A.; software, V.K., K.K. and A.M.; validation, B.F., K.R., J.A. and H.E.-H.; formal analysis, V.K., A.M. and J.A.; investigation, V.K., A.M., J.A. and H.E.-H.; resources, A.M.; data curation, V.K., B.F. and K.R.; writing—original draft preparation, V.K., A.M. and J.A.; writing—review and editing, K.K., B.F., K.R. and H.E.-H.; supervision, A.M.; project administration, A.M. and J.A.; funding acquisition, A.M. All authors have read and agreed to the published version of the manuscript.

Funding

This research was funded by the Scientific and Technological Research Council of Turkey (TUBITAK), grant number 219M425. The APC was funded by United Arab Emirates University.

Data Availability Statement

All data, models, and code produced or employed in the course of the study are detailed in the submitted manuscript.

Acknowledgments

The authors appreciate the assistance provided by Polisan Construction Chemicals Company (İstanbul, Türkiye) and Bolu Cement Company (Bolu, Türkiye) in obtaining the materials and their properties.

Conflicts of Interest

The authors declare no conflicts of interest.

References

  1. Joshi, R.C.; Lohtia, R.P. Fly Ash in Concrete: Production, Properties, and Use; OPA (Overseas Publishers Association) Amsterdam B.V.: Amsterdam, The Netherlands, 1997; Volume 2. [Google Scholar]
  2. Xue, Y.; Liu, X. Detoxification, solidification and recycling of municipal solid waste incineration fly ash: A review. Chem. Eng. J. 2021, 420, 130349. [Google Scholar] [CrossRef]
  3. Hwalla, J.; El-Hassan, H.; Assaad, J.J.; El-Maaddawy, T. Performance of cementitious and slag-fly ash blended geopolymer screed composites: A comparative study. Case Stud. Constr. Mater. 2023, 18, e02037. [Google Scholar] [CrossRef]
  4. Ahmaruzzaman, M. A review on the utilization of fly ash. Prog. Energy Combust. Sci. 2010, 36, 327–363. [Google Scholar] [CrossRef]
  5. Ramachandran, D.; George, R.P.; Vishwakarma, V.; Kamachi Mudali, U. Strength and durability studies of fly ash concrete in sea water environments compared with normal and superplasticizer concrete. KSCE J. Civ. Eng. 2017, 21, 1282–1290. [Google Scholar] [CrossRef]
  6. ASTM C618; Standard Specification for Coal Fly Ash and Raw or Calcined Natural Pozzolan for Use in Concrete. ASTM: West Conshohocken, PA, USA, 2022.
  7. Karakuzu, K.; Kobya, V.; Mardani-Aghabaglou, A.; Felekoğlu, B.; Ramyar, K. Adsorption properties of polycarboxylate ether-based high range water reducing admixture on cementitious systems: A review. Constr. Build. Mater. 2021, 312, 125366. [Google Scholar] [CrossRef]
  8. Mehta, P.K.; Monteiro, J.P. Concrete Microstructure, Properties and Material; McGraw Hill: New York, NY, USA, 2006. [Google Scholar]
  9. Assaad, J.J.; Mardani, A. Limestone replacements by fine crushed concrete and ceramic wastes during the production of Portland cement. J. Sustain. Cem. Mater. 2023, 12, 1447–1459. [Google Scholar] [CrossRef]
  10. Sha, F.; Li, S.; Liu, R.; Li, Z.; Zhang, Q. Experimental study on performance of cement-based grouts admixed with fly ash, bentonite, superplasticizer and water glass. Constr. Build. Mater. 2018, 161, 282–291. [Google Scholar] [CrossRef]
  11. Sathyan, D.; Anand, K.B. Influence of superplasticizer family on the durability characteristics of fly ash incorporated cement concrete. Constr. Build. Mater. 2019, 204, 864–874. [Google Scholar] [CrossRef]
  12. Şahin, H.G.; Biricik, Ö.; Mardani-Aghabaglou, A. Polycarboxylate-based water reducing admixture—Clay compatibility; literature review. J. Polym. Res. 2022, 29, 33. [Google Scholar] [CrossRef]
  13. Wang, C.; Kayali, O.; Liow, J.-L. The effectiveness and mechanisms of superplasticisers in dispersing class F fly ash pastes. Powder Technol. 2021, 392, 81–92. [Google Scholar] [CrossRef]
  14. Burgos-Montes, O.; Palacios, M.; Rivilla, P.; Puertas, F. Compatibility between superplasticizer admixtures and cements with mineral additions. Constr. Build. Mater. 2012, 31, 300–309. [Google Scholar] [CrossRef]
  15. Tkaczewska, E. Effect of the superplasticizer type on the properties of the fly ash blended cement. Constr. Build. Mater. 2014, 70, 388–393. [Google Scholar] [CrossRef]
  16. Karakuzu, K.; Kobya, V.; Mardani, A.; Felekoğlu, B.; Ramyar, K. Investigation of anionic group characteristics of PCE on the behaviour of fly ash cementitious systems. Adv. Cem. Res. 2024, 36, 651–665. [Google Scholar] [CrossRef]
  17. Alonso, M.M.; Palacios, M.; Puertas, F. Compatibility between polycarboxylate-based admixtures and blended-cement pastes. Cem. Concr. Compos. 2013, 35, 151–162. [Google Scholar] [CrossRef]
  18. Feng, H.; Feng, Z.; Wang, W.; Deng, Z.; Zheng, B. Impact of polycarboxylate superplasticizers (PCE) with novel molecular structures on fluidity, rheological behavior and adsorption properties of cement mortar. Constr. Build. Mater. 2021, 292, 123285. [Google Scholar] [CrossRef]
  19. Karakuzu, K.; Kobya, V.; Mardani, A.; Felekoğlu, B.; Ramyar, K. Effect of PCE anionic charge density on fly ash cementitious system-PCE compatibility. J. Adhes. Sci. Technol. 2025, 39, 209–225. [Google Scholar] [CrossRef]
  20. Ng, P.G.; Cheah, C.B.; Ng, E.P.; Oo, C.W.; Leow, K.H. The influence of main and side chain densities of PCE superplasticizer on engineering properties and microstructure development of slag and fly ash ternary blended cement concrete. Constr. Build. Mater. 2020, 242, 118103. [Google Scholar] [CrossRef]
  21. Zhang, M.; Wang, K. Workability modification of fly ash-granulated blast furnace slag-steel slag geopolymers:Effects of superplasticizers and retarders. J. Build. Eng. 2025, 105, 112488. [Google Scholar] [CrossRef]
  22. Alrefaei, Y.; Dai, J.-G. Effects of delayed addition of polycarboxylate ether on one-part alkali-activated fly ash/slag pastes: Adsorption, reaction kinetics, and rheology. Constr. Build. Mater. 2022, 323, 126611. [Google Scholar] [CrossRef]
  23. Wang, C.; Kayali, O.; Liow, J.-L.; Troitzsch, U. Participation and disturbance of superplasticisers in early-stage reaction of class F fly ash-based geopolymer. Constr. Build. Mater. 2023, 403, 133176. [Google Scholar] [CrossRef]
  24. Grzegorczyk-Frańczak, M.; Janek, M.; Szeląg, M.; Panek, R.; Materak, K. Modification of the polymeric admixture based on polycarboxylate ether using silica-derived secondary materials obtained from fly ash and the efficiency of its application in concrete. Case Stud. Constr. Mater. 2024, 21, e03903. [Google Scholar] [CrossRef]
  25. Jin, J.; Zhang, G.; Qin, Z.; Liu, T.; Shi, J.; Zuo, S. Viscosity enhancement of self-consolidating cement-tailings grout by biomass fly ash vs. chemical admixtures. Constr. Build. Mater. 2022, 340, 127802. [Google Scholar] [CrossRef]
  26. BS EN 197-1; Cement—Composition, Specifications and Conformity Criteria for Common Cements. British Standards Institution: London, UK, 2011.
  27. BS EN 450-2:2005; Fly Ash for Concrete—Conformity Evaluation. British Standards Institution: London, UK, 2005.
  28. BS EN 196-1:2016-TC; Methods of Testing Cement—Determination of Strength. British Standards Institution: London, UK, 2016.
  29. Altun, M.G.; Özen, S.; Mardani-Aghabaglou, A. Effect of side chain length change of polycarboxylate-ether based high range water reducing admixture on properties of self-compacting concrete. Constr. Build. Mater. 2020, 246, 118427. [Google Scholar] [CrossRef]
  30. Kobya, V.; Karakuzu, K.; Mardani, A.; Felekoğlu, B.; Ramyar, K. Effect of Chain Characteristics of Polycarboxylate-Based Water-Reducing Admixtures on Behavior of Cementitious Systems: A Review. J. Mater. Civ. Eng. 2023, 35, 03123002. [Google Scholar] [CrossRef]
  31. Kobya, V.; Karakuzu, K.; Mardani, A.; Felekoğlu, B.; Ramyar, K. Effect of polycarboxylate-based water-reducing admixture chains length on portland cement-admixture compatibility. J. Sustain. Cem. Mater. 2024, 13, 69–86. [Google Scholar] [CrossRef]
  32. Stecher, J.; Plank, J. Novel concrete superplasticizers based on phosphate esters. Cem. Concr. Res. 2019, 119, 36–43. [Google Scholar] [CrossRef]
  33. Feng, H.; Pan, L.; Zheng, Q.; Li, J.; Xu, N.; Pang, S. Effects of molecular structure of polycarboxylate superplasticizers on their dispersion and adsorption behavior in cement paste with two kinds of stone powder. Constr. Build. Mater. 2018, 170, 182–192. [Google Scholar] [CrossRef]
  34. Mardani-Aghabaglou, A.; Kankal, M.; Nacar, S.; Felekoğlu, B.; Ramyar, K. Assessment of cement characteristics affecting rheological properties of cement pastes. Neural Comput. Appl. 2021, 33, 12805–12826. [Google Scholar] [CrossRef]
  35. Assaad, J.J.; Khayat, K.H. Rheology of Fiber-Reinforced High-Strength Grout Modified with Polymer Latexes. ACI Mater. J. 2021, 118, 49–60. [Google Scholar] [CrossRef]
  36. BS EN 196-3; Methods of Testing Cement—Determination of Setting Times and Soundness. British Standards Institution: London, UK, 2016.
  37. ASTM C109; Standard Test Method for Compressive Strength of Hydraulic Cement Mortars (Using 2-in. or [50-mm] Cube Specimens). ASTM: West Conshohocken, PA, USA, 2016.
  38. ASTM C1437; Standard Test Method for Flow of Hydraulic Cement Mortar. ASTM: West Conshohocken, PA, USA, 2015.
  39. Zhang, Q.; Shu, X.; Yu, X.; Yang, Y.; Ran, Q. Toward the viscosity reducing of cement paste: Optimization of the molecular weight of polycarboxylate superplasticizers. Constr. Build. Mater. 2020, 242, 117984. [Google Scholar] [CrossRef]
  40. Gay, C.; Raphaël, E. Comb-like polymers inside nanoscale pores. Adv. Colloid Interface Sci. 2001, 94, 229–236. [Google Scholar] [CrossRef]
  41. Houst, Y.F.; Bowen, P.; Perche, F.; Kauppi, A.; Borget, P.; Galmiche, L.; Le Meins, J.-F.; Lafuma, F.; Flatt, R.J.; Schober, I.; et al. Design and function of novel superplasticizers for more durable high performance concrete (superplast project). Cem. Concr. Res. 2008, 38, 1197–1209. [Google Scholar] [CrossRef]
  42. Liu, J.; Ran, Q.; Miao, C.; Qiao, M. Effects of Grafting Densities of Comb-like Copolymer on the Dispersion Properties of Concentrated Cement Suspensions. Mater. Trans. 2012, 53, 553–558. [Google Scholar] [CrossRef]
  43. Yang, H.; Plank, J.; Sun, Z. Investigation on the optimal chemical structure of methacrylate ester based polycarboxylate superplasticizers to be used as cement grinding aid under laboratory conditions: Effect of anionicity, side chain length and dosage on grinding efficiency, mortar workability and strength development. Constr. Build. Mater. 2019, 224, 1018–1025. [Google Scholar] [CrossRef]
  44. Ran, Q.; Somasundaran, P.; Miao, C.; Liu, J.; Wu, S.; Shen, J. Effect of the length of the side chains of comb-like copolymer dispersants on dispersion and rheological properties of concentrated cement suspensions. J. Colloid Interface Sci. 2009, 336, 624–633. [Google Scholar] [CrossRef] [PubMed]
  45. He, Y.; Zhang, X.; Shui, L.; Wang, Y.; Gu, M.; Wang, X.; Wang, H.; Peng, L. Effects of PCE with various carboxylic densities and functional groups on the fluidity and hydration performances of cement paste. Constr. Build. Mater. 2019, 202, 656–668. [Google Scholar] [CrossRef]
  46. Matsuzawa, K.; Shimazaki, D.; Kawakami, H.; Sakai, E. Effect of non-adsorbed superplasticizer molecules on fluidity of cement paste at low water-powder ratio. Cem. Concr. Compos. 2019, 97, 218–225. [Google Scholar] [CrossRef]
  47. Winnefeld, F.; Becker, S.; Pakusch, J.; Götz, T. Effects of the molecular architecture of comb-shaped superplasticizers on their performance in cementitious systems. Cem. Concr. Compos. 2007, 29, 251–262. [Google Scholar] [CrossRef]
  48. Ma, Y.; Sha, S.; Zhou, B.; Lei, F.; Liu, Y.; Xiao, Y.; Shi, C. Adsorption and dispersion capability of polycarboxylate-based superplasticizers: A review. J. Sustain. Cem. Mater. 2022, 11, 319–344. [Google Scholar] [CrossRef]
  49. Assaad, J.J.; Daou, Y. Cementitious grouts with adapted rheological properties for injection by vacuum techniques. Cem. Concr. Res. 2014, 59, 43–54. [Google Scholar] [CrossRef]
  50. Kashani, A.; Provis, J.L.; Xu, J.; Kilcullen, A.R.; Qiao, G.G.; van Deventer, J.S.J. Effect of molecular architecture of polycarboxylate ethers on plasticizing performance in alkali-activated slag paste. J. Mater. Sci. 2014, 49, 2761–2772. [Google Scholar] [CrossRef]
  51. Zhang, Y.; Kong, X.; Gao, L.; Wang, J. Rheological behaviors of fresh cement pastes with polycarboxylate superplasticizer. J. Wuhan Univ. Technol.-Mater. Sci. Ed. 2016, 31, 286–299. [Google Scholar] [CrossRef]
  52. Özen, S.; Altun, M.G.; Mardani-Aghabaglou, A. Effect of the polycarboxylate based water reducing admixture structure on self-compacting concrete properties: Main chain length. Constr. Build. Mater. 2020, 255, 119360. [Google Scholar] [CrossRef]
  53. Sha, S.; Wang, M.; Shi, C.; Xiao, Y. Influence of the structures of polycarboxylate superplasticizer on its performance in cement-based materials-A review. Constr. Build. Mater. 2020, 233, 117257. [Google Scholar] [CrossRef]
  54. Zhu, W.; Feng, Q.; Luo, Q.; Bai, X.; Chen, K.; Lin, X. Effect of a specific PCE superplasticizer on the initial dissolution and early hydration of Portland cement. J. Build. Eng. 2022, 46, 103786. [Google Scholar] [CrossRef]
  55. Kong, F.-R.; Pan, L.-S.; Wang, C.-M.; Zhang, D.-L.; Xu, N. Effects of polycarboxylate superplasticizers with different molecular structure on the hydration behavior of cement paste. Constr. Build. Mater. 2016, 105, 545–553. [Google Scholar] [CrossRef]
  56. Meier, M.R.; Rinkenburger, A.; Plank, J. Impact of different types of polycarboxylate superplasticisers on spontaneous crystallisation of ettringite. Adv. Cem. Res. 2016, 28, 310–319. [Google Scholar] [CrossRef]
  57. Kai, K.; Heng, Y.; Yingbin, W. Effect of chemical structure on dispersity of polycarboxylate superplasticiser in cement paste. Adv. Cem. Res. 2020, 32, 456–464. [Google Scholar] [CrossRef]
  58. He, Y.; Liu, S.; Luo, Q.; Liu, W.; Xu, M. Influence of PCE-type GA on cement hydration performances. Constr. Build. Mater. 2021, 302, 124432. [Google Scholar] [CrossRef]
  59. Yamada, K.; Ogawa, S.; Hanehara, S. Controlling of the adsorption and dispersing force of polycarboxylate-type superplasticizer by sulfate ion concentration in aqueous phase. Cem. Concr. Res. 2001, 31, 375–383. [Google Scholar] [CrossRef]
  60. Zingg, A.; Winnefeld, F.; Holzer, L.; Pakusch, J.; Becker, S.; Figi, R.; Gauckler, L. Interaction of polycarboxylate-based superplasticizers with cements containing different C3A amounts. Cem. Concr. Compos. 2009, 31, 153–162. [Google Scholar] [CrossRef]
  61. Özen, S.; Altun, M.G.; Mardani-Aghabaglou, A.; Ünlü, A.; Ramyar, K. Effects of anionic monomer type of water-reducing admixture on fresh properties, compressive strength and water adsorption of self-compacting concrete. J. Adhes. Sci. Technol. 2021, 35, 1203–1218. [Google Scholar] [CrossRef]
  62. Özen, S.; Altun, M.G.; Mardani-Aghabaglou, A.; Ramyar, K. Multi-effect of superplasticisers main and side-chain length on cementitious systems with fly ash. Mag. Concr. Res. 2022, 74, 727–739. [Google Scholar] [CrossRef]
  63. Biricik, Ö.; Mardani, A. Parameters affecting thixotropic behavior of self compacting concrete and 3D printable concrete; a state-of-the-art review. Constr. Build. Mater. 2022, 339, 127688. [Google Scholar] [CrossRef]
  64. AlArab, A.; Hamad, B.; Chehab, G.; Assaad, J.J. Use of Ceramic-Waste Powder as Value-Added Pozzolanic Material with Improved Thermal Properties. J. Mater. Civ. Eng. 2020, 32, 04020243. [Google Scholar] [CrossRef]
  65. Plank, J.; Schönlein, M.; Kanchanason, V. Study on the early crystallization of calcium silicate hydrate (C-S-H) in the presence of polycarboxylate superplasticizers. J. Organomet. Chem. 2018, 869, 227–232. [Google Scholar] [CrossRef]
  66. Wang, Z.; Lu, Z.; Lu, F.; Li, H. Effect of Side Chain Density of Comb-shaped Structure on Performance of Polycarboxylate Superplasticizer. J. Chin. Ceram. Soc. 2012, 40, 1570–1575. [Google Scholar]
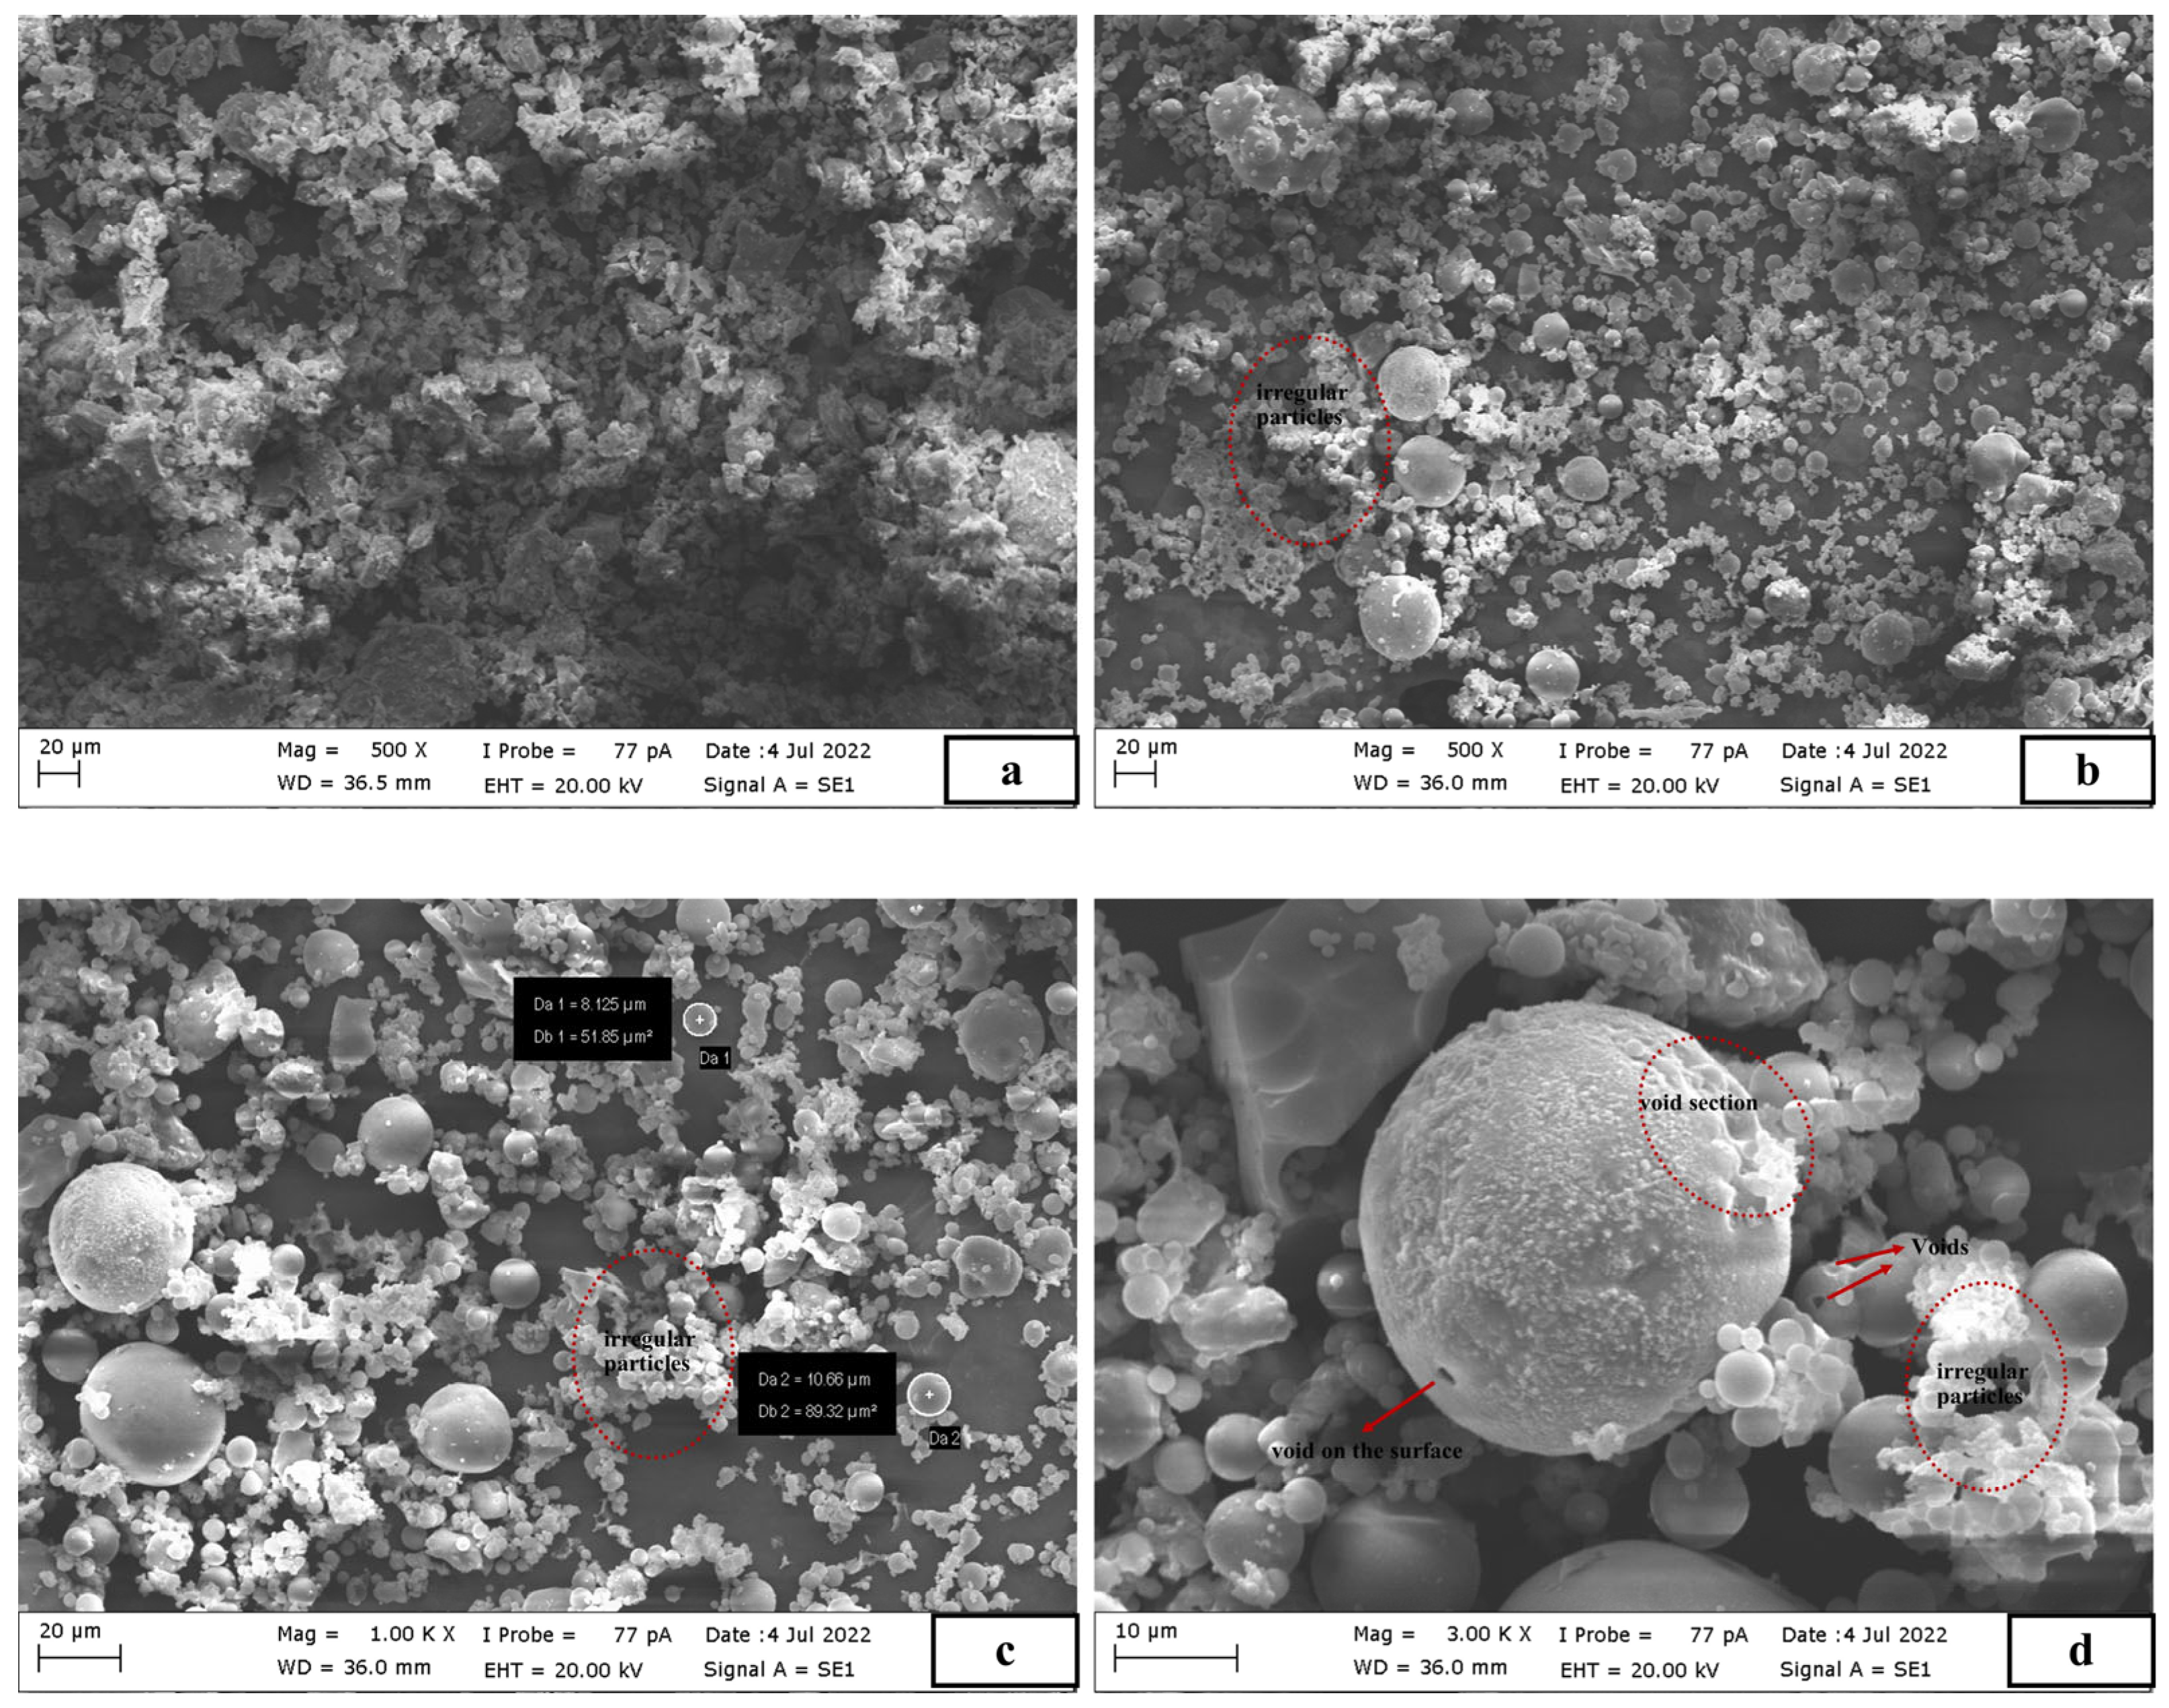
Figure 1. SEM images for cement ((a) 500×) and fly ash ((b) 500× (c) 1000× (d) 2000×).
Buildings 15 03351 g001
Figure 2. Illustration of the synthesized PCEs.
Buildings 15 03351 g002
Figure 3. The primary materials and selected devices used in this study.
Buildings 15 03351 g003
Figure 4. An experimental flow chart summarizing the methodology.
Buildings 15 03351 g004
Figure 5. GPC diagram of PCE1 having a short main chain length.
Buildings 15 03351 g005
Figure 6. Adsorption capacity of different PCEs.
Buildings 15 03351 g006
Figure 7. Variations in viscosity of pastes made with (a) 0.1% PCE and (b) 0.15% PCE.
Buildings 15 03351 g007
Figure 8. Initial setting times of pastes with different PCEs.
Buildings 15 03351 g008
Figure 9. PCE requirements for targeted mortar flow of 27 ± 2 cm.
Buildings 15 03351 g009
Figure 10. Flow loss of the mixtures (a) FA0 and (b) FA30.
Buildings 15 03351 g010
Figure 11. Strength development of mixes incorporating (a) 0% fly ash, (b) 15% fly ash, (c) 30% fly ash, and (d) 45% fly ash.
Buildings 15 03351 g011
Figure 12. Compressive strength of mortars after (a) 1 day and (b) 28 days.
Buildings 15 03351 g012
Figure 13. Overall main chain length effect for (a) PCE2 and (b) PCE3.
Buildings 15 03351 g013
Figure 14. (a) PCE4 and (b) PCE5 molecules in mixes incorporating fly ash.
Buildings 15 03351 g014
Figure 15. Overall assessment of PCE molecule main and sidechain length variation on absorption, workability, and compressive strength.
Buildings 15 03351 g015
Table 1. Chemical and physical properties of cement and fly ash.
Oxides (%)CementFly Ash
SiO218.9459.22
Al2O34.3322.86
Fe2O35.536.31
CaO61.673.09
MgO1.551.31
SO32.820.17
Na2O + 0.658 K2O0.351.40
Free CaO0.75-
LOI3.333.20
Specific gravity3.212.31
Specific surface (cm2/g)37864300
Table 2. Summary of synthesized PCE.
PCE
Group
PCE
Types
Density
(g/cm3)
Mw
(g/mol)
Main Chain
Length (k)
Side Chain
Length (g/mol)
Main-chain
length
PCE11.0927,000102400
PCE21.1056,000212400
PCE31.0878,000312400
Side chain
length
PCE41.0926,000211000
PCE51.0869,000213000
Main and side chain lengths *PCE61.0857,000173000
PCE71.0956,000401000
* Main and side chain lengths were varied at a given molecular weight.
Table 3. Characteristics of the PCE.
PCE GroupPCE
Type
PDI
(Mw/Mn)
Rh
(nm)
Main chain
length
PCE12.3346
PCE22.1323
PCE32.1219
Side chain
length
PCE42.3302
PCE52.4617
Main and side chain lengthsPCE62.1225
PCE72.3249
Table 4. Time-dependent mortar flow at a constant PCE dose of 0.25%.
FA
Content
PCE
Type
Time-Dependent Flow at a Fixed PCE Rate of 0.25% (cm)
0 min15 min30 min45 min60 min
FA0PCE122.321.020.419.819.1
PCE226.623.122.521.920.4
PCE320.519.919.619.518.9
PCE423.621.821.521.220.8
PCE526.522.521.821.319.0
PCE625.422.021.320.420.0
PCE722.421.120.820.419.9
FA30PCE119.919.719.519.219.1
PCE228.423.622.521.421.0
PCE319.819.619.419.319.1
PCE423.021.120.820.620.3
PCE528.023.122.321.820.6
PCE627.523.322.621.620.6
PCE723.122.621.921.120.3
Disclaimer/Publisher’s Note: The statements, opinions and data contained in all publications are solely those of the individual author(s) and contributor(s) and not of MDPI and/or the editor(s). MDPI and/or the editor(s) disclaim responsibility for any injury to people or property resulting from any ideas, methods, instructions or products referred to in the content.