Article

Predicting the Effects of Nano Additives and Elevated Temperatures on Concrete Compressive Strength Utilizing Machine Learning

1
Department of Civil Engineering, College of Engineering, Qassim University, Buraidah 52571, Saudi Arabia
2
Civil Engineering Department, Faculty of Engineering, Fayoum University, Fayoum 63514, Egypt
*
Author to whom correspondence should be addressed.
Buildings 2025, 15(18), 3349; https://doi.org/10.3390/buildings15183349
Submission received: 11 August 2025 / Revised: 7 September 2025 / Accepted: 13 September 2025 / Published: 16 September 2025
(This article belongs to the Section Building Structures)

Abstract

In this study, the synergistic effects of a combination of nano additives (nano-clay (NC) and nano-silica (NS)) on the compressive strength (CS) of concrete exposed to temperatures ranging between 25 °C and 800 °C were modeled with two machine learning (ML) techniques: extreme gradient boosting (XGB) and random forest (RF) algorithms. A dataset comprising 169 compressive strength results (using four input parameters: NC dose, NS dose, temperature, and duration) was utilized for the raw data for the prediction models. The results indicated the superior performance of the XGB model in terms of the high accuracy attained in the prediction and the few errors present. Furthermore, SHAP analysis demonstrated that temperature has the highest negative impact on the prediction of the CS of nano-modified concrete. The individual conditional expectation (ICE) with partial dependence plots (PDPs) demonstrated that the optimum doses of NS and NC, leading to maximum compressive strength, were (2~3%) and (5~6%) by weight of cement. The developed models can be used as tools for optimizing mix designs to enhance fire resistance, thereby contributing to more durable and sustainable concrete construction and reducing the need for costly experimental trials.

1. Introduction

Concrete suffers significant strength degradation when it is exposed to elevated temperatures [1]. Recent advances in nanotechnology have introduced nano-clay (NC) and nano-silica (NS) as effective nano-scale additives for enhancing concrete’s mechanical properties and thermal resistance [2,3]. NC and NS have emerged as promising additives for enhancing concrete properties. Studies have shown that using 2–11% NS as cement replacement can improve concrete’s strength, durability, and microstructure [4,5,6,7,8,9,10,11]. However, this may also lead to reduced concrete workability [5,6].
The reactivity of such nanoparticles is due to their large surface area and their angular and elongated structure [12]. These characteristics contribute to reinforcing the transition zone between the mixed cement paste and the aggregate, leading to increased strength, decreased permeability [13], and enhanced concrete resistance to fire [14]. During the cement-hydration process, partially replaced NS particles (at optimal percentages) create extra calcium–silicate hydrate (CSH) gels using calcium hydroxide (CH), which slows down the hydration rate by coating the anhydrate cement particles. The additional CSH gels improve concrete strength [15,16,17]. The pozzolanic reaction and the filling effect of nano-sized pores with NS and NC particles results in a denser microstructure with reduced porosity.
Numerous studies have been conducted to determine the optimal range of NC and NS as partial replacements of cement. Studies by Serag et al. [17], Prasad et al. [4], and Mokhtar et al. [7] found that about 3% NS improved the overall mechanical properties and durability of concrete compared to the reference concrete. Optimal dosages of 2% and 4% NS content were reported by Khosravi et al. [6] and Valukolaee et al. [8], respectively. NS dosages as high as 11% were reported to improve concrete tensile strength by 11.5% and compressive strength by 45% [10].
The proposed optimal contents of NC for enhancing the mechanical properties of concrete remain inconsistent, despite extensive research efforts. Studies by Hosseini et al. [18] and Hakamy et al. [19] found that using 0.75–1% NC by cement weight highly improved the mechanical properties of concrete. On the other hand, work by Hamed et al. [20] and Mokhtar et al. [7] suggest that dosages of up to 6–7.5% NC content can improve the mechanical properties of concrete. NC contents as high as 10% were reported to improve concrete tensile strength by 46.8% and compressive strength by 63.1% [21]. Noori et al. [12] revealed that 5% NC yielded the highest compressive and flexural strengths in their study.
Wang et al. [22] explored the dynamic and static properties of concrete, incorporating 2% nano-CaCO3, 2% NS, and 1.0% co-doping. Nano-CaCO3-added concrete demonstrated superior performance compared to OPC and NS-added concrete under both static and dynamic stresses. Ghouchani et al. [23] studied the microstructure and mechanical properties of cementitious composites containing NS and aqueous graphene oxide nanosheets (GONS) and as partial replacements for cement. The cementitious composite exhibited enhanced mechanical properties with the incorporation of 6% NS and 0.06% GONS.
The ability of concrete to resist elevated temperatures is one of its most important properties for maintaining structural integrity compared to other construction materials. High temperatures cause significant chemical and physical changes in concrete, leading to losses of strength and durability. The key processes here include the dehydration of binding compounds like calcium silicate hydrate (CSH) starting above 110 °C and the dissociation of calcium hydroxide at around 530 °C. These reactions, combined with aggregate expansion, create internal stresses that induce microcracking from 300 °C onwards. The damage becomes irreversible above 500 °C, which becomes evident through surface cracking and spalling. Further heating above 600 °C decomposes the critical CSH gel, causing concrete to crumble [24]. By 800 °C, the concrete is severely damaged, with a 50% reduction in its strength [25]; extreme temperatures over 1150 °C led to a notable decrease in mechanical strength and a substantial mass loss [1].
The use of nano additives in concrete, achieved by partially replacing cement content, may affect the residual strength of concrete following exposure to elevated temperatures [3,26]; this is because it affects the cement-hydration processes [27]. A study by Ibrahim et al. [28] showed that the compressive strength of mortar samples tested under temperatures exceeding 400 °C dropped significantly when hydration products disintegrate. The use of NS improved the compressive and tensile strengths of high-strength concrete (HSC) samples tested under temperature reaching up to 800 °C [29]. Polat et al. [30] conducted an experimental study to evaluate the ability of mortar samples containing NS and NC to resist high temperatures of up to 750 °C. The results showed that the compressive strength reached 54% in comparison with the reference samples. The use of NC and NS as cement partial replacements in concrete has enhanced the mechanical characteristics of concrete at temperatures up to 200 °C [2,3]. He et al. [31] revealed that the mechanical properties of hardened concrete deteriorate as temperatures increase beyond 300 °C. Several studies have revealed that the strength loss of concrete with nano additives varies with varying high temperatures [32]. Ali et al. [33] investigated the effect of the addition of up to 3% of nano-glass, nano-aluminum, and NS as partial cement replacements on the CS of concrete exposed to temperatures ranging between 200 °C and 800 °C. They concluded that the optimal dose of NS and nano-glass was 1% at temperatures up to 200 °C and 3% at temperatures up to 600 °C. They also concluded that 2% of nano-aluminum was effective at 800 °C. Hassan [34] investigated the impact of elevated temperature up to 700 °C on the CS of nano-modified concrete containing slag. The cement was replaced with NC and slag up to 0.8% and 50%, respectively. They noticed an improvement in concrete CS for temperatures up to 300 °C. Wang et al. [35] investigated the impact of elevated temperature on the mechanical properties of cement composites modified with nano-alumina.
ML involves the creation of algorithms that allow computers to learn and predict autonomously [36]. Statistical methods in machine learning algorithms are employed to identify correlations, patterns, and trends within historical data [37]. Hyperparameters should ideally remain unadjusted based on testing or training data. To mitigate overfitting, cross-validation (CV) was used by dividing the data into several distinct folds. The model’s performance was assessed by calculating the average of the results.
Much research was conducted on developing prediction models for the compressive strength of concrete containing nanomaterials as partial cement replacement using machine learning approaches. Nazar et al. [38] developed prediction models for the compressive strength of concrete containing various nanomaterials such as nano-alumina, nano-clay, carbon nanotubes, and nano-silica, utilizing two machine learning approaches (random forest and decision tree) and based on 94 collected experimental data points. They concluded that the random forest model outperforms the decision tree in predicting the CS of nano-modified concrete. Ali et al. [39] developed six prediction models for CS on concrete containing NS up to 15% as a partial cement replacement utilizing full quadratic, pure quadratic, interaction, nonlinear regression, multilinear regression, and linear regression models based on 420 data points. They concluded that the full quadratic model outperforms other developed prediction models. Nigam and Verma [40] used the random forest approach, and Garg et al. [41] used Gaussian Process Regression and Support Vector Machine to predict the CS of concrete modified by NS. Murad [42] developed prediction models for the CS of concrete modified with nano-aluminum, carbon nanotubes, NS, and NC, utilizing gene expression programming. Zeyad et al. [43] and Alkharisi et al. [44] developed prediction models for the compressive strength of concrete modified with nano-alumina and nanocarbon tubes and being exposed to elevated temperatures. They utilized artificial neural networks, a genetic algorithm, fuzzy logic algorithm, water cycle algorithm, the M5 Prime model, random forest algorithm, and extreme gradient boosting algorithm.
While many studies have tested NS or NC individually, few have systematically investigated their synergistic effects under the combined conditions of high temperatures. Existing empirical or statistical models often fail to capture the complex, nonlinear relationships between these additives, temperature, and compressive strength. Many ML applications in concrete science are “black boxes”. Our work aims to not just predict but also explain the model’s decisions using SHAP, ICE, and PDP plots, providing physical insights into the mechanisms. This study employs two ML algorithms, namely extreme gradient boosting (XGB) and random forest (RF), for predicting the synergistic effects of combining NS and NC as partial cement replacements on the CS of concrete exposed to high temperatures for varying exposure times. Four input parameters are considered for simulating the impacts on the CS of the concrete samples: nano-clay dose (NC), nano-silica dose (NS), temperature (T), and duration (D). A set of 169 data points containing the four input parameters was used, as obtained from the literature. The developed models were validated using various statistical metrics and CV. To evaluate the effect of features and data sensitivity on CS predictions, two techniques were used: SHAP analysis and ICE with PDP. The SHAP analysis quantifies each feature’s independent contribution to the predicted outcome, making it extremely useful for interpreting the outputs of complex ML models [45].

2. Research Significance

This study develops optimized RF and XGBoost models with hyperparameter tuning for accurately predicting the CS of nano-modified concrete subjected to elevated temperatures. This study implements comprehensive model evaluation using multiple statistical metrics with k-fold cross-validation. SHAP analysis, ICE, and PDP were utilized to evaluate the model predictions and detect the significant factors affecting compressive strength. This study offers clear insights into the intricate relationships among material composition, thermal exposure, and mechanical performance, presenting a data-driven methodology for optimizing NS and NC dosages in concrete mixtures to improve thermal resistance. This research illustrates the efficacy of ensemble ML techniques in the field of materials science. This research provides valuable tools for predicting and understanding the behavior of nano-modified concrete in high-temperature environments, benefiting both academic researchers and practicing engineers and contributing to the advancement of durable and sustainable construction materials.

3. Materials and Methods

The experimental dataset utilized in developing the models was adopted from previous studies [2,3]. The experimental dataset comprises 169 data samples for compressive strength after 28 days, conforming to BS188 [46] for concrete modified by NS and NC and subjected to elevated temperatures in the range from 25 to 800 °C for exposure periods from 0 to 2 h (Table A1). In the concrete mixture, the fine and coarse aggregates used were locally available natural sand and crushed stone in Egypt. Cement type I had a specific gravity of 3.15. The nano additives utilized were NS and NC. The chemical analysis of the powders used by employing X-ray fluorescence analysis is shown in Table 1.
The control concrete mixture quantities per m3 comprise 1170 kg of coarse aggregate, 656 kg of fine aggregate, 400 kg of cement, and 180 L of clean water. The cement was replaced by weight with NS and NC at replacement ratios of up to 4% and 9%, respectively. The hybrid combinations of nanoparticles were (4.5% NC + 0.5% NS), (4% NC + 1% NS), and (3.5% NC + 1.5% NS). The experimental data and the properties of the concrete ingredients are available in previously published studies [2,3].
The four input variables chosen were nano-silica dose (NS), nano-clay dose (NC), temperature (T), and exposure duration (D); these were chosen to offer a thorough picture of the variables influencing the response (concrete CS). The ratio of training data to testing data was 80:20. Min–max normalization, as presented in Equation (1), was employed to guarantee that all features would have an equal contribution to the training process:
X j = X j X m i n X m a x X m i n   ( j = 1 , 2 , , n )
where X m a x and X m i n are the maximum and minimum feature values.
A statistical description of the CS data is presented in Table 2. The variables exhibit a fair range of distributional symmetry, with skewness values ranging from −3 to +3. The variables in this study were appropriately distributed, with a suitable number of peaks, as indicated by the kurtosis, which are within the acceptable range of −10 to +10 [47].
The process for developing the ML models is shown in Figure 1. The RF and XGB models were developed using Python (version 3.12) [48], which is based on Anaconda. Four statistical metrics, namely R2, MAPE, MAE, and RMSE, were utilized to assess the models’ performances. Next, K-fold CV was utilized to test the models’ performances. To evaluate the effect of each variable on accurateness and the efficacy of predicted CS, the input variables were subjected to SHAP analysis and ICE and PDP plots.
The correlations between the input parameters and the response (CS) can be better understood by looking at the Pearson’s correlation coefficient heat map (Figure 2) regarding these variables. To find possible multicollinearity problems in regression analysis, correlation coefficients (R) are helpful. Statistically, this study looks at how the response-influencing independent variables (NS, NC, T, and D) are distributed and how they interact with one another. NS and NC are positively linked with CS, as shown by their R-values of 0.11 and 0.03, respectively. In a negative correlation with CS, it was found that T (R = −0.80) and D (R = −0.25). Figure 3 displays the input variables’ scatter plots and their relationships with the response, showing positive and negative correlations between each variable and the output (CS). The correlation coefficient between T and D is 0.37, and that between NS and NC is −0.54.
Additionally, ML models may encounter multicollinearity issues. When there is a strong correlation between two or more variables in a regression model, this statistical phenomenon is called multicollinearity. One way to determine whether the dataset is multicollinear is to utilize the variation inflation factor (VIF) [49]. It is possible to see the mathematical expression of the VIF in Equation (2):
V I F m = 1 1 R m 2
where R m 2 is the coefficient of determination for the x m parameter on the rest of the parameters. Although VIF does not have a hard-and-fast cutoff threshold for detecting multicollinearity, more than 10 indicates the existence of such a phenomenon. According to Table 3, the VIF values for NS, NC, T, and D were 1.4148, 1.4148, 1.1606, and 1.1606, respectively. There is less chance of multicollinearity in the data collected, as VIF measures are lower than the cut-off criterion.

3.1. Machine Learning (ML) Techniques

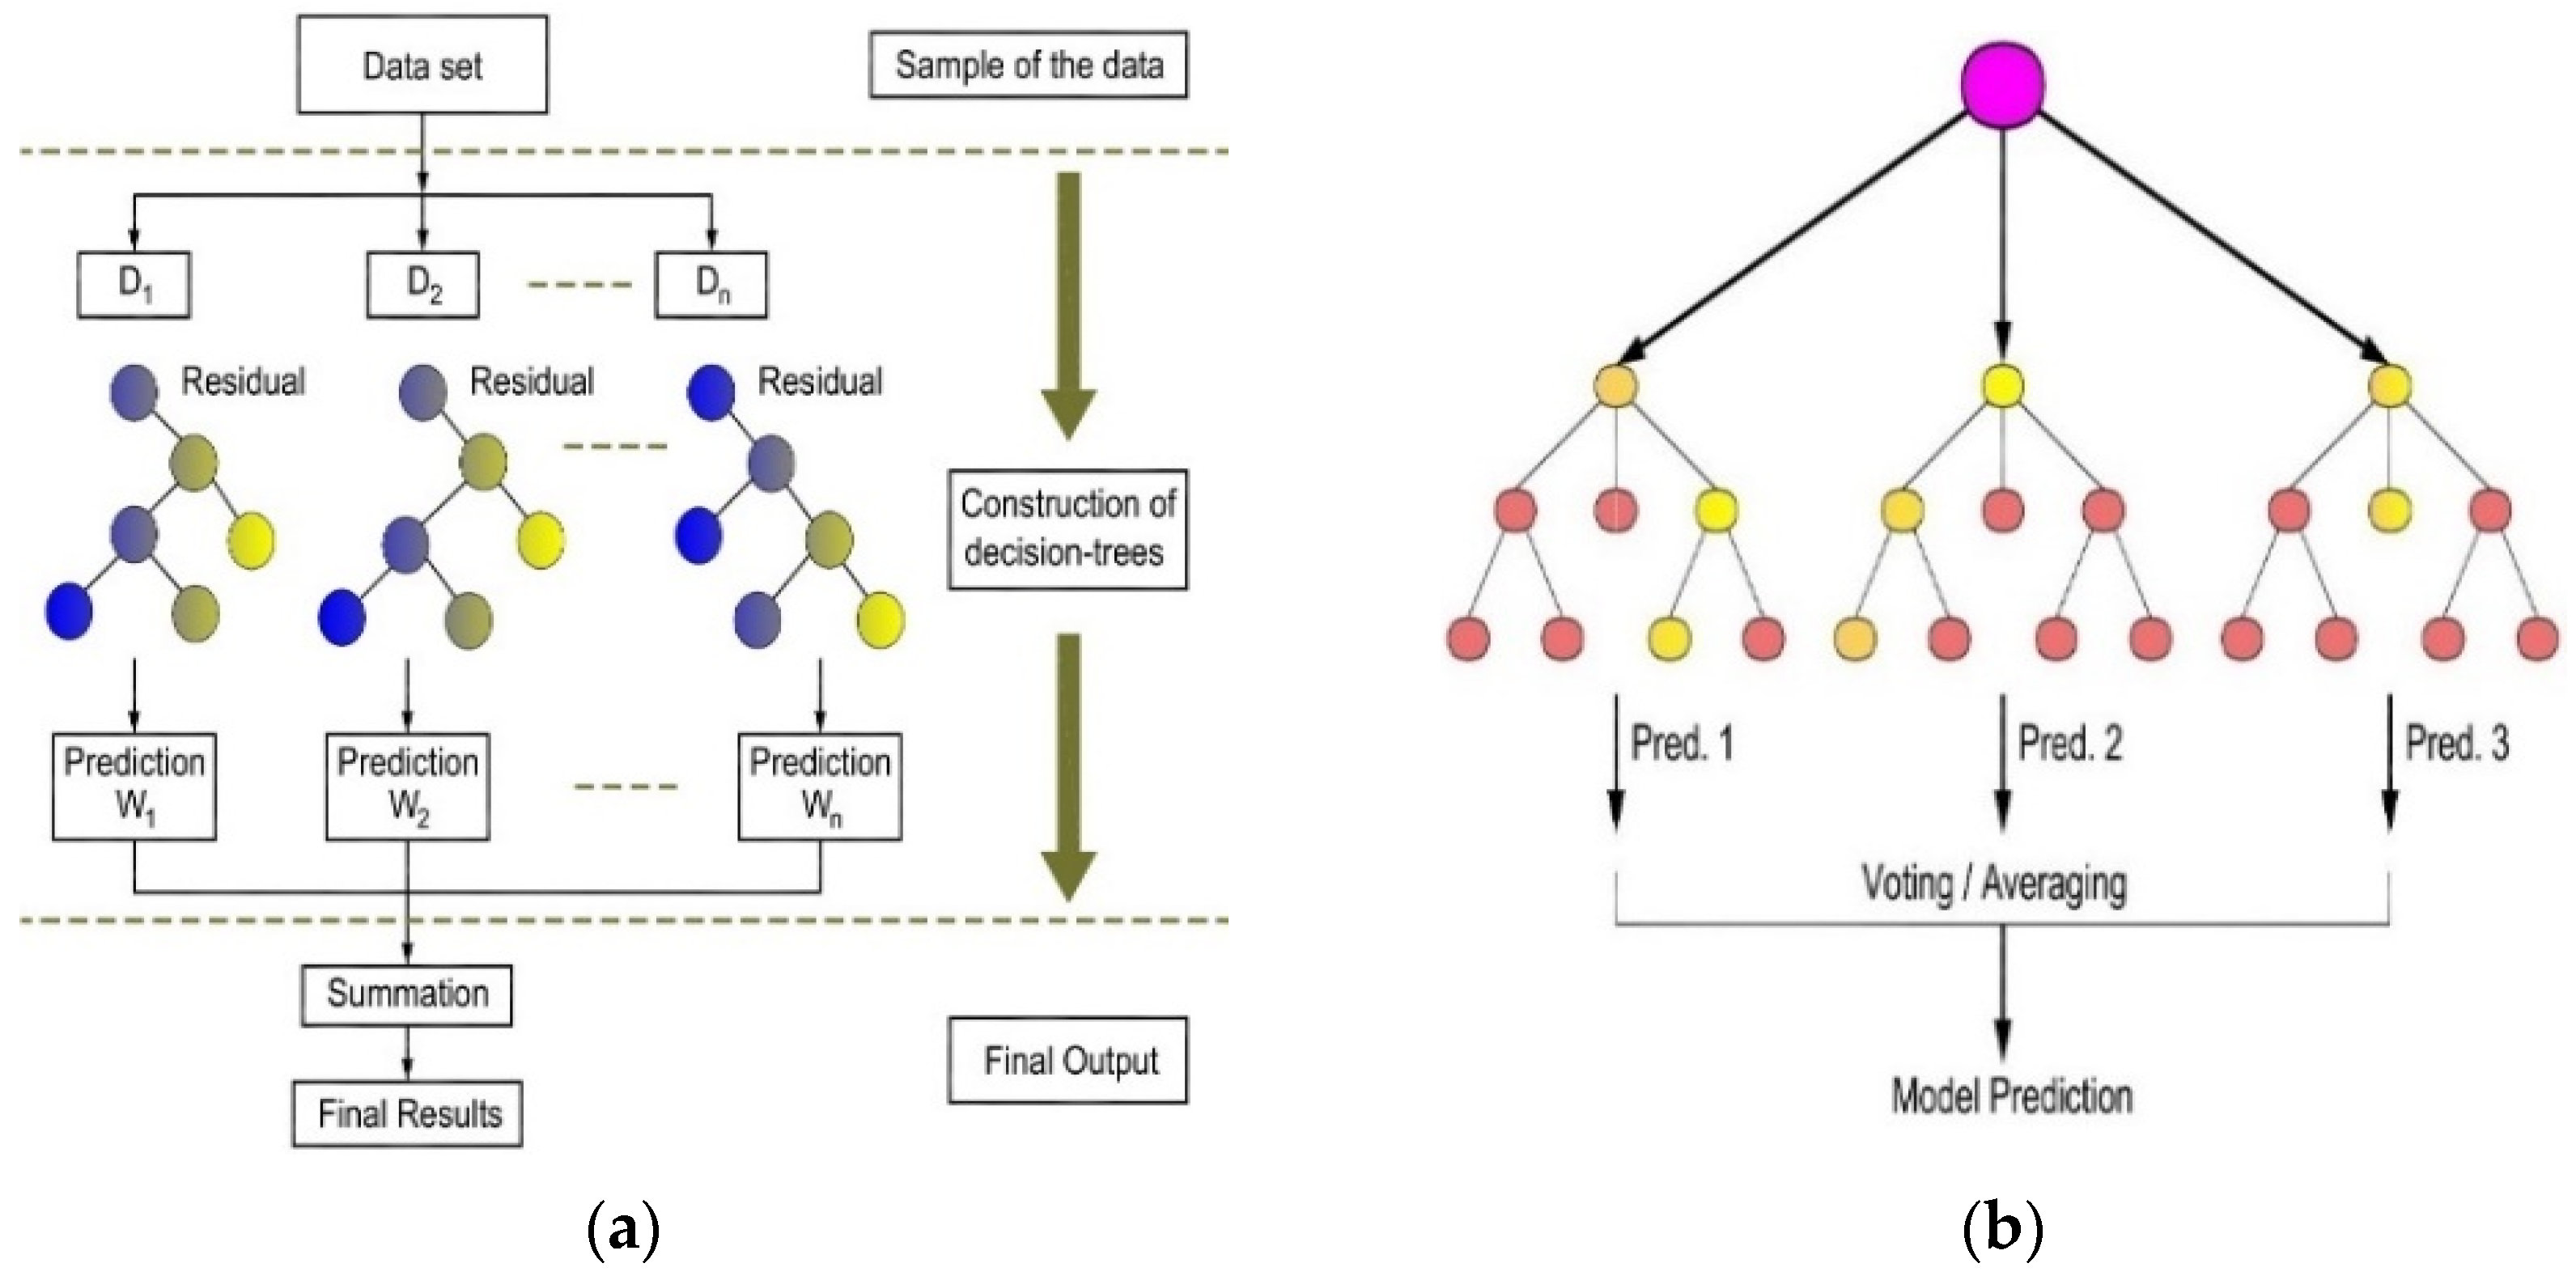
ML approaches (XGB and RF) were used for predicting the CS of concrete samples containing NS and NC under high temperatures for various periods. Chen and Guestrin [50] presented XGB, a tree-based technique that incorporates the boosting concept. XGB enhances prediction precision through a combination of the responses of many active decision trees. This approach combines decision trees with extra weak predictors to continuously enhance the ensemble by including new trees that correct prior errors [51]. The XGB technique was used to create a predictive model with improved accuracy and generalizability. Compared to other approaches, it has a greater ability to manage several attributes, performs well with data with high-dimensions, and reduces overfitting by incorporating a regulatory term [52]. Additionally, it uses a second-order Taylor series to improve the loss function. Figure 4a shows the whole procedure for XGB prediction. One decision tree is used to begin the model. The difference between the experimental and predicted outcomes is then determined. To train a new decision tree that can correct the errors made by previous tree, the first step is to calculate the residual. An additional tree was combined with the ensemble estimates to adjust for predicted outcomes. Random forest is an ensemble learning technique based on constructing several decision trees to increase predictive performance, and, during training, it outputs the average prediction of each tree, as shown in Figure 4b [44]. The mathematical representation of RF prediction is presented in the following equation:
O u t c o m e = m o d e   ( p 1 , p 2 , . , p n )
where p i is the individual decision tree prediction, and the mode yields the average prediction.

3.2. Optimization of Hyperparameters

To minimize the potential risks of overfitting and underfitting, hyperparameter tuning for both RF and XGB models was performed, utilizing an extensive grid search methodology with 5-fold cross-validation. This approach assessed a predetermined search domain of essential parameters. The ideal hyperparameter set for each method was determined using the configuration that yielded the lowest RMSE during cross-validation, guaranteeing that the selected models could be effectively generalized to new data, balancing complexity with prediction accuracy. The optimized hyperparameters are illustrated in Table 4.

3.3. Model Efficiencies

The determination coefficient (R2), mean absolute error (MAE), root mean squared error (RMSE), and mean absolute percentage error (MAPE) were the statistics used to check the accuracy of the model predictions in this study. Various applications utilize these indicators to assess the effectiveness of models, such as regression analysis and machine learning. Engineering decision making is impacted by each indicator, which displays the reliability and correctness of the model. Regression analysis relies heavily on the R2 value. It is more instructive than calculating prediction error because it assesses a model’s explanatory power. The mathematical expression for R2 is given by Equation (4). MAE is the difference between the expected and actual numbers. We can see the MAE link in Equation (5). RMSE is used to measure the dissimilarity between real and expected values and is computed using Equation (6). The MAPE is used to measure the average prediction error of a model. The mathematical representation of MAPE is presented in Equation (7).
R 2 = i = 1 n ( x i x ¯ ) ( y i y ¯ ) ( i = 1 n ( x i x ¯ ) 2 ) ( i = 1 n ( y i y ¯ ) 2 ) 2
M A E = 1 n i = 1 n ( x i y i )
R M S E = i = 1 n ( x i y i ) 2 n
M A P E = 1 n i = 1 n x i y i x i

3.4. ICE with PDP

ICE with PDP is an excellent technique for examining feature implications in ML. PDP demonstrates the average impact of a single feature on predictions, whereas ICE reveals how that feature affects the predictions for particular data points [53]. In combination, they offer an extensive understanding of feature correlations and model behavior [54].

4. Results and Discussion

4.1. Performance of ML Models

To extract important insights from the available data, RF and XGB were used to set up a foundation for assessment. In the next section, we offer the results and an analysis of the findings that were produced using this methodology. After training and hyperparameter selection, the ML models were evaluated on new and unexplored data to assess their performances and fitting effectiveness.
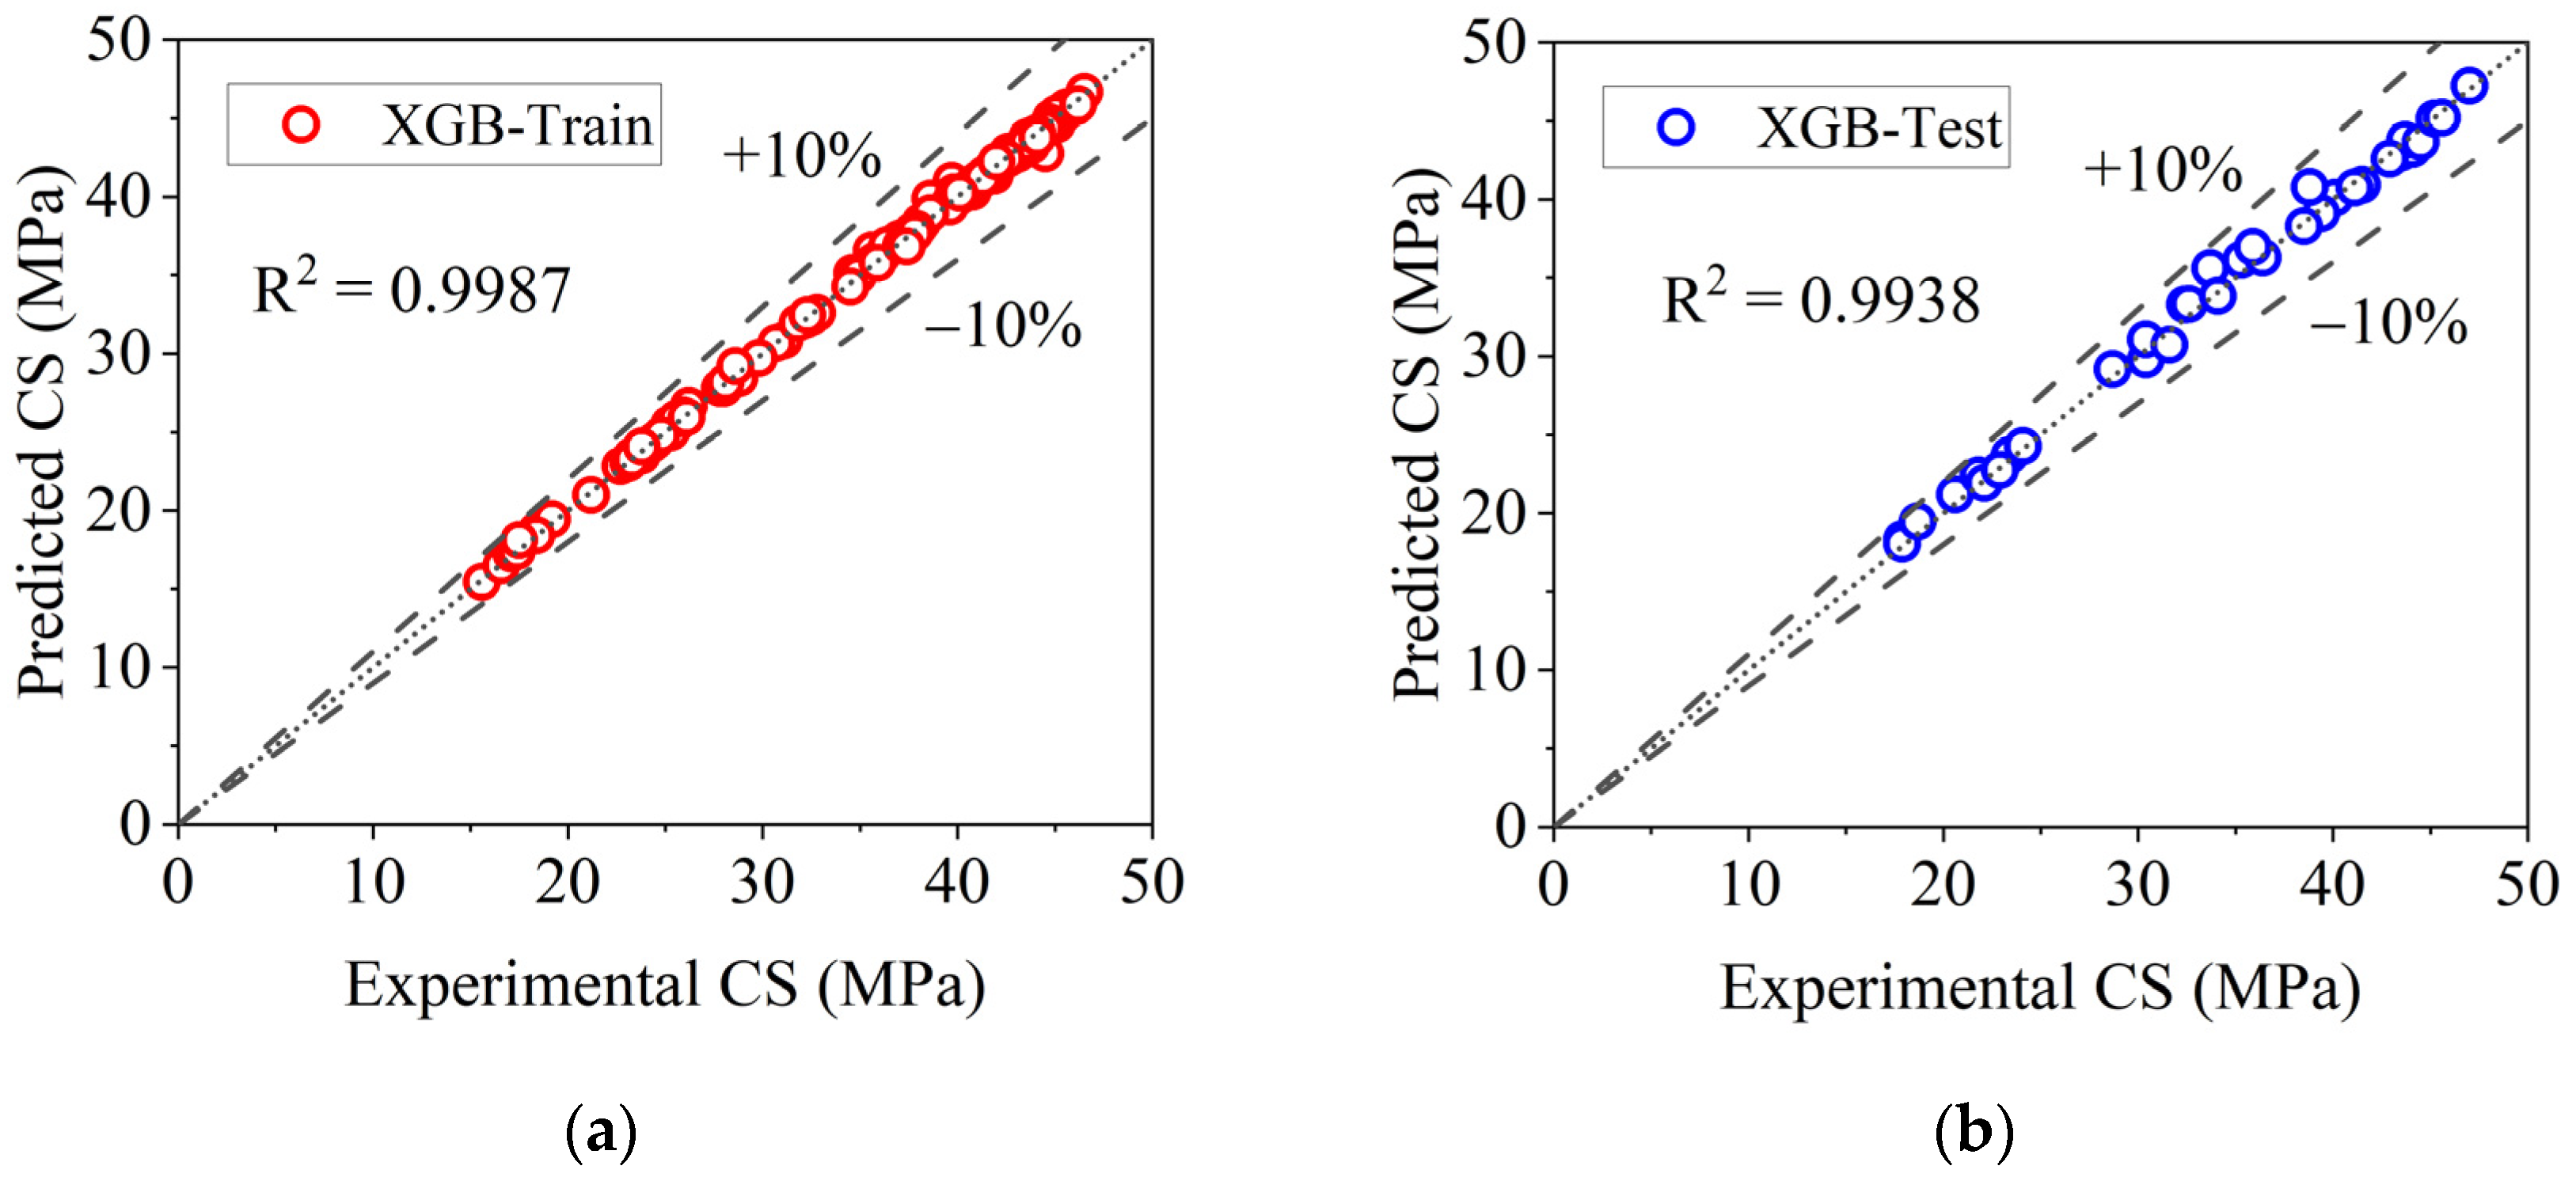
As shown in Figure 5, the XGB model’s predictive and actual compressive strength values for concrete treated with NS and NC, heated to high temperatures, were statistically analyzed. The comparison between the predicted and experimental CS results is shown in the scatter plots. The ±10% error margins encompass almost all the predictions. Points from both the training and testing datasets cluster tightly around the ideal line, according to the scatter plots. A plot for the correlation between actual compressive strength and the XGB model’s predictions is shown in Figure 5; here, we can see that the points were close to the ideal line in both datasets, indicating a match between the actual and the predicted values. The XGB model has a high determination coefficient, demonstrating precise predictions. The train dataset has R2, MAPE, RMSE, and MAE values of 0.9987, 0.5955%, 0.3179 MPa, and 0.2015 MPa, while the test dataset had values of 0.9938, 1.7121%, 0.7054 MPa, and 0.5439 MPa.
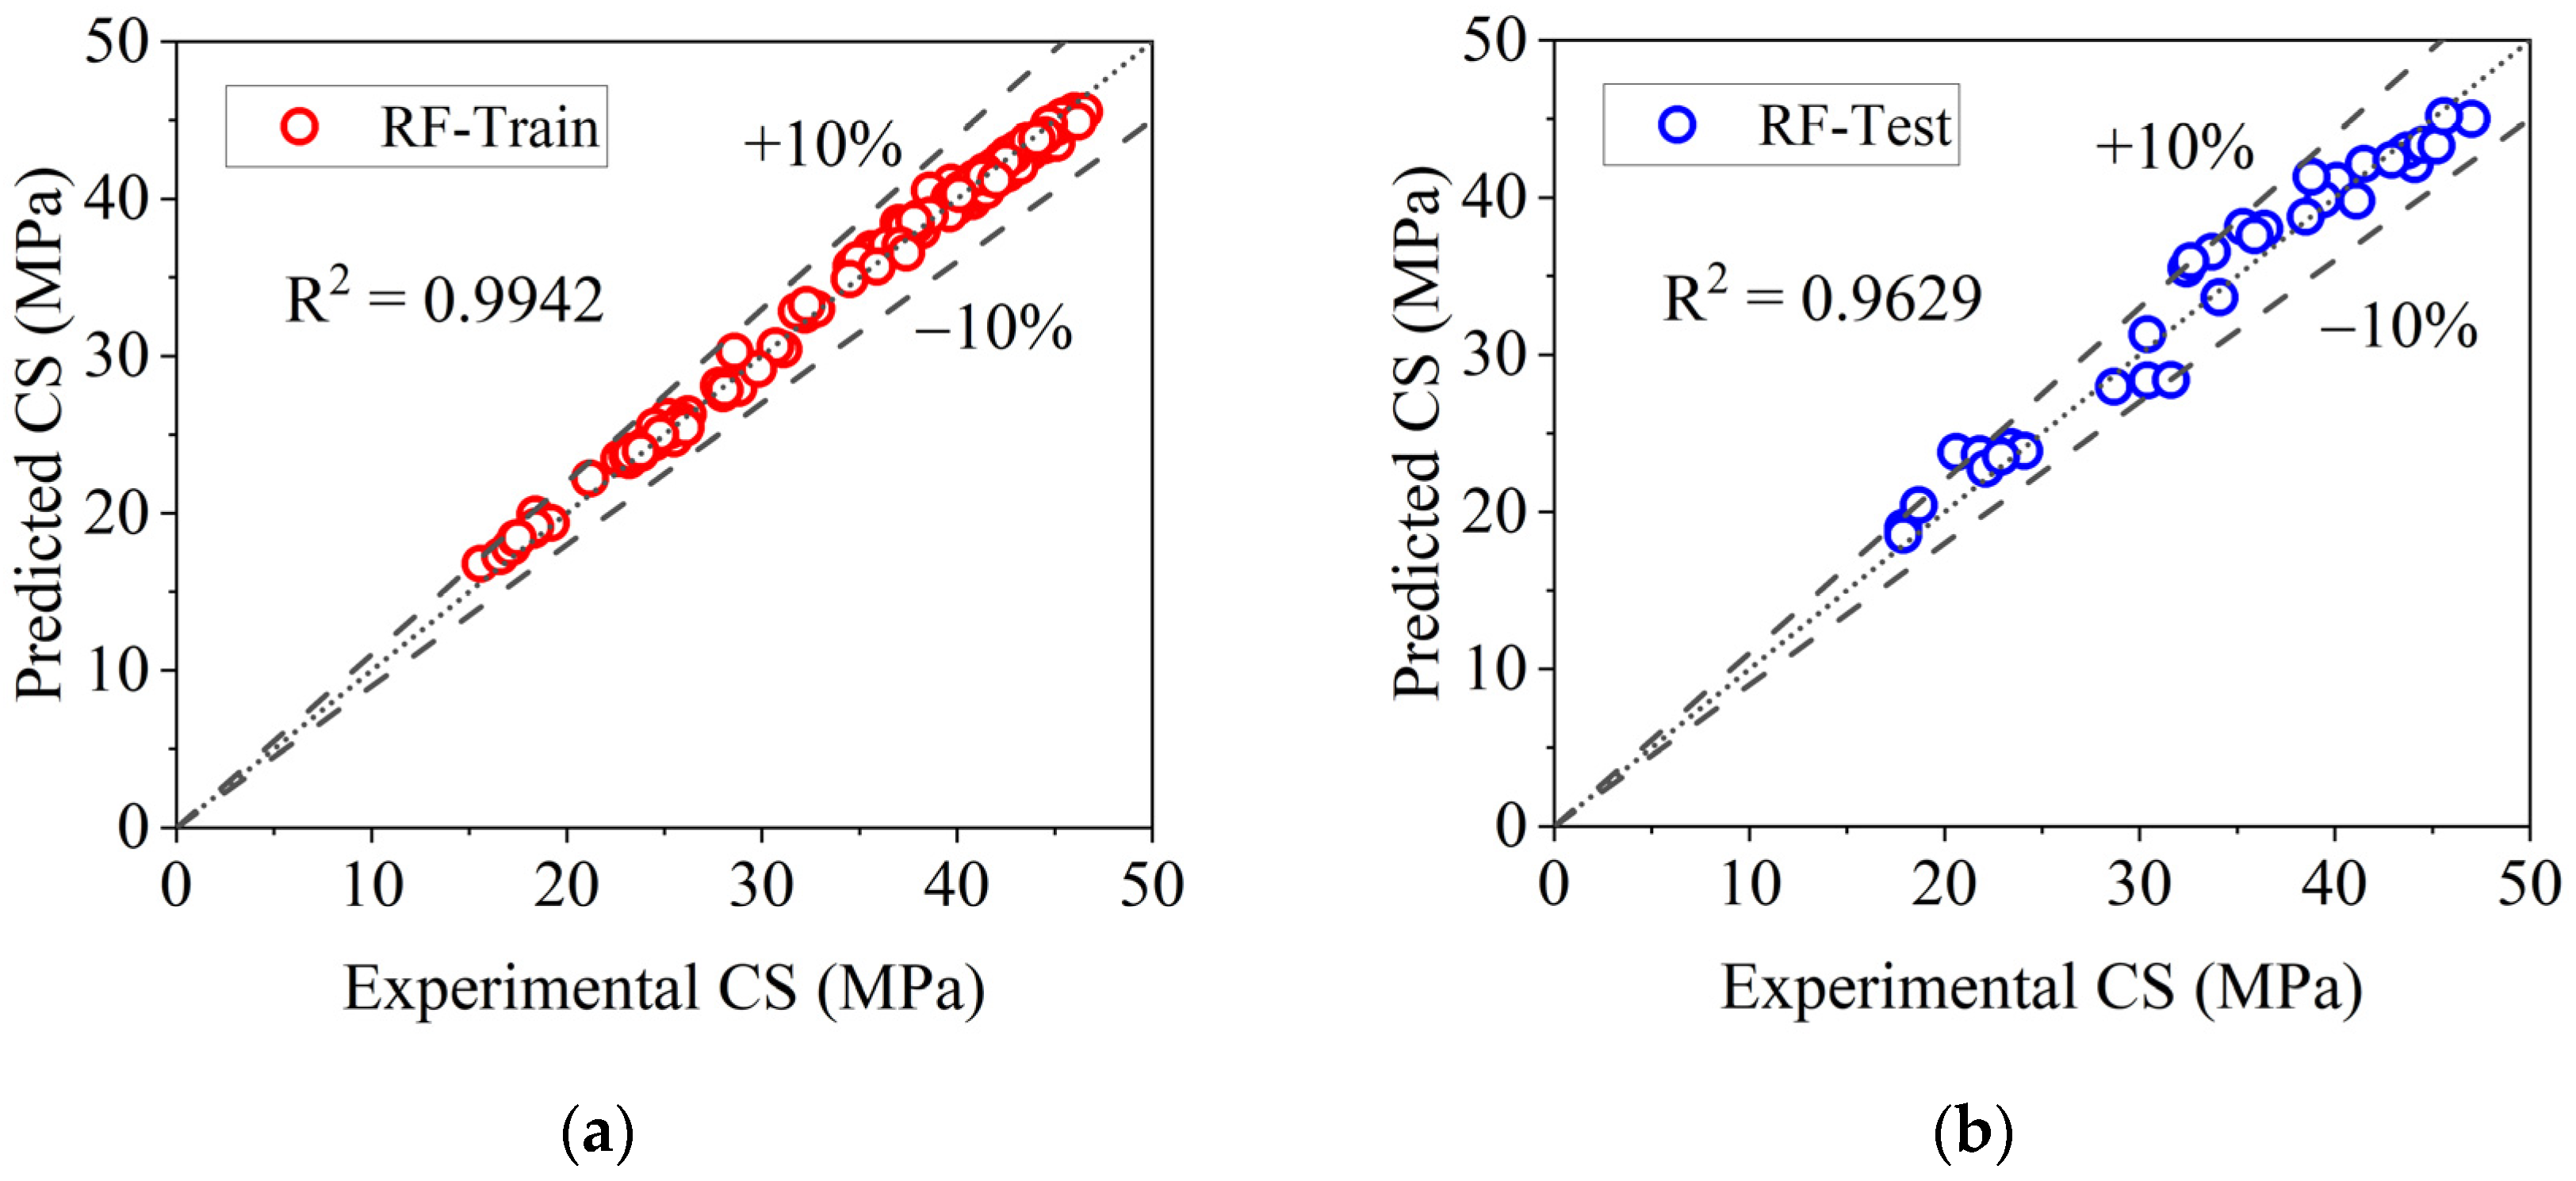
Figure 6a,b show the effectiveness of the CS prediction model using the RF technique, with predicted and real CS values and error ranges of ±10% for the steep linear fit. The scatter plots (Figure 6) show points closely packed around the ideal line in both the training and testing datasets; the testing dataset has fewer scattered values, implying that the RF predictions are near to the real values, with a 10% error margin. The training and testing datasets returned R values of 0.9942 and 0.9629, respectively. The RF model had MAE values of 0.533 MPa and 1.4415 MPa for the training and testing datasets, respectively. The RMSE for the training dataset was 0.6645 MPa; meanwhile, for the testing dataset, it was 1.7318 MPa. The MAPE values for the testing and training datasets were 1.6743% and 4.6435 percent, respectively. In terms of CS prediction accuracy, the XGB was found to outperform the RF.

4.2. Comparison Between the Developed Models

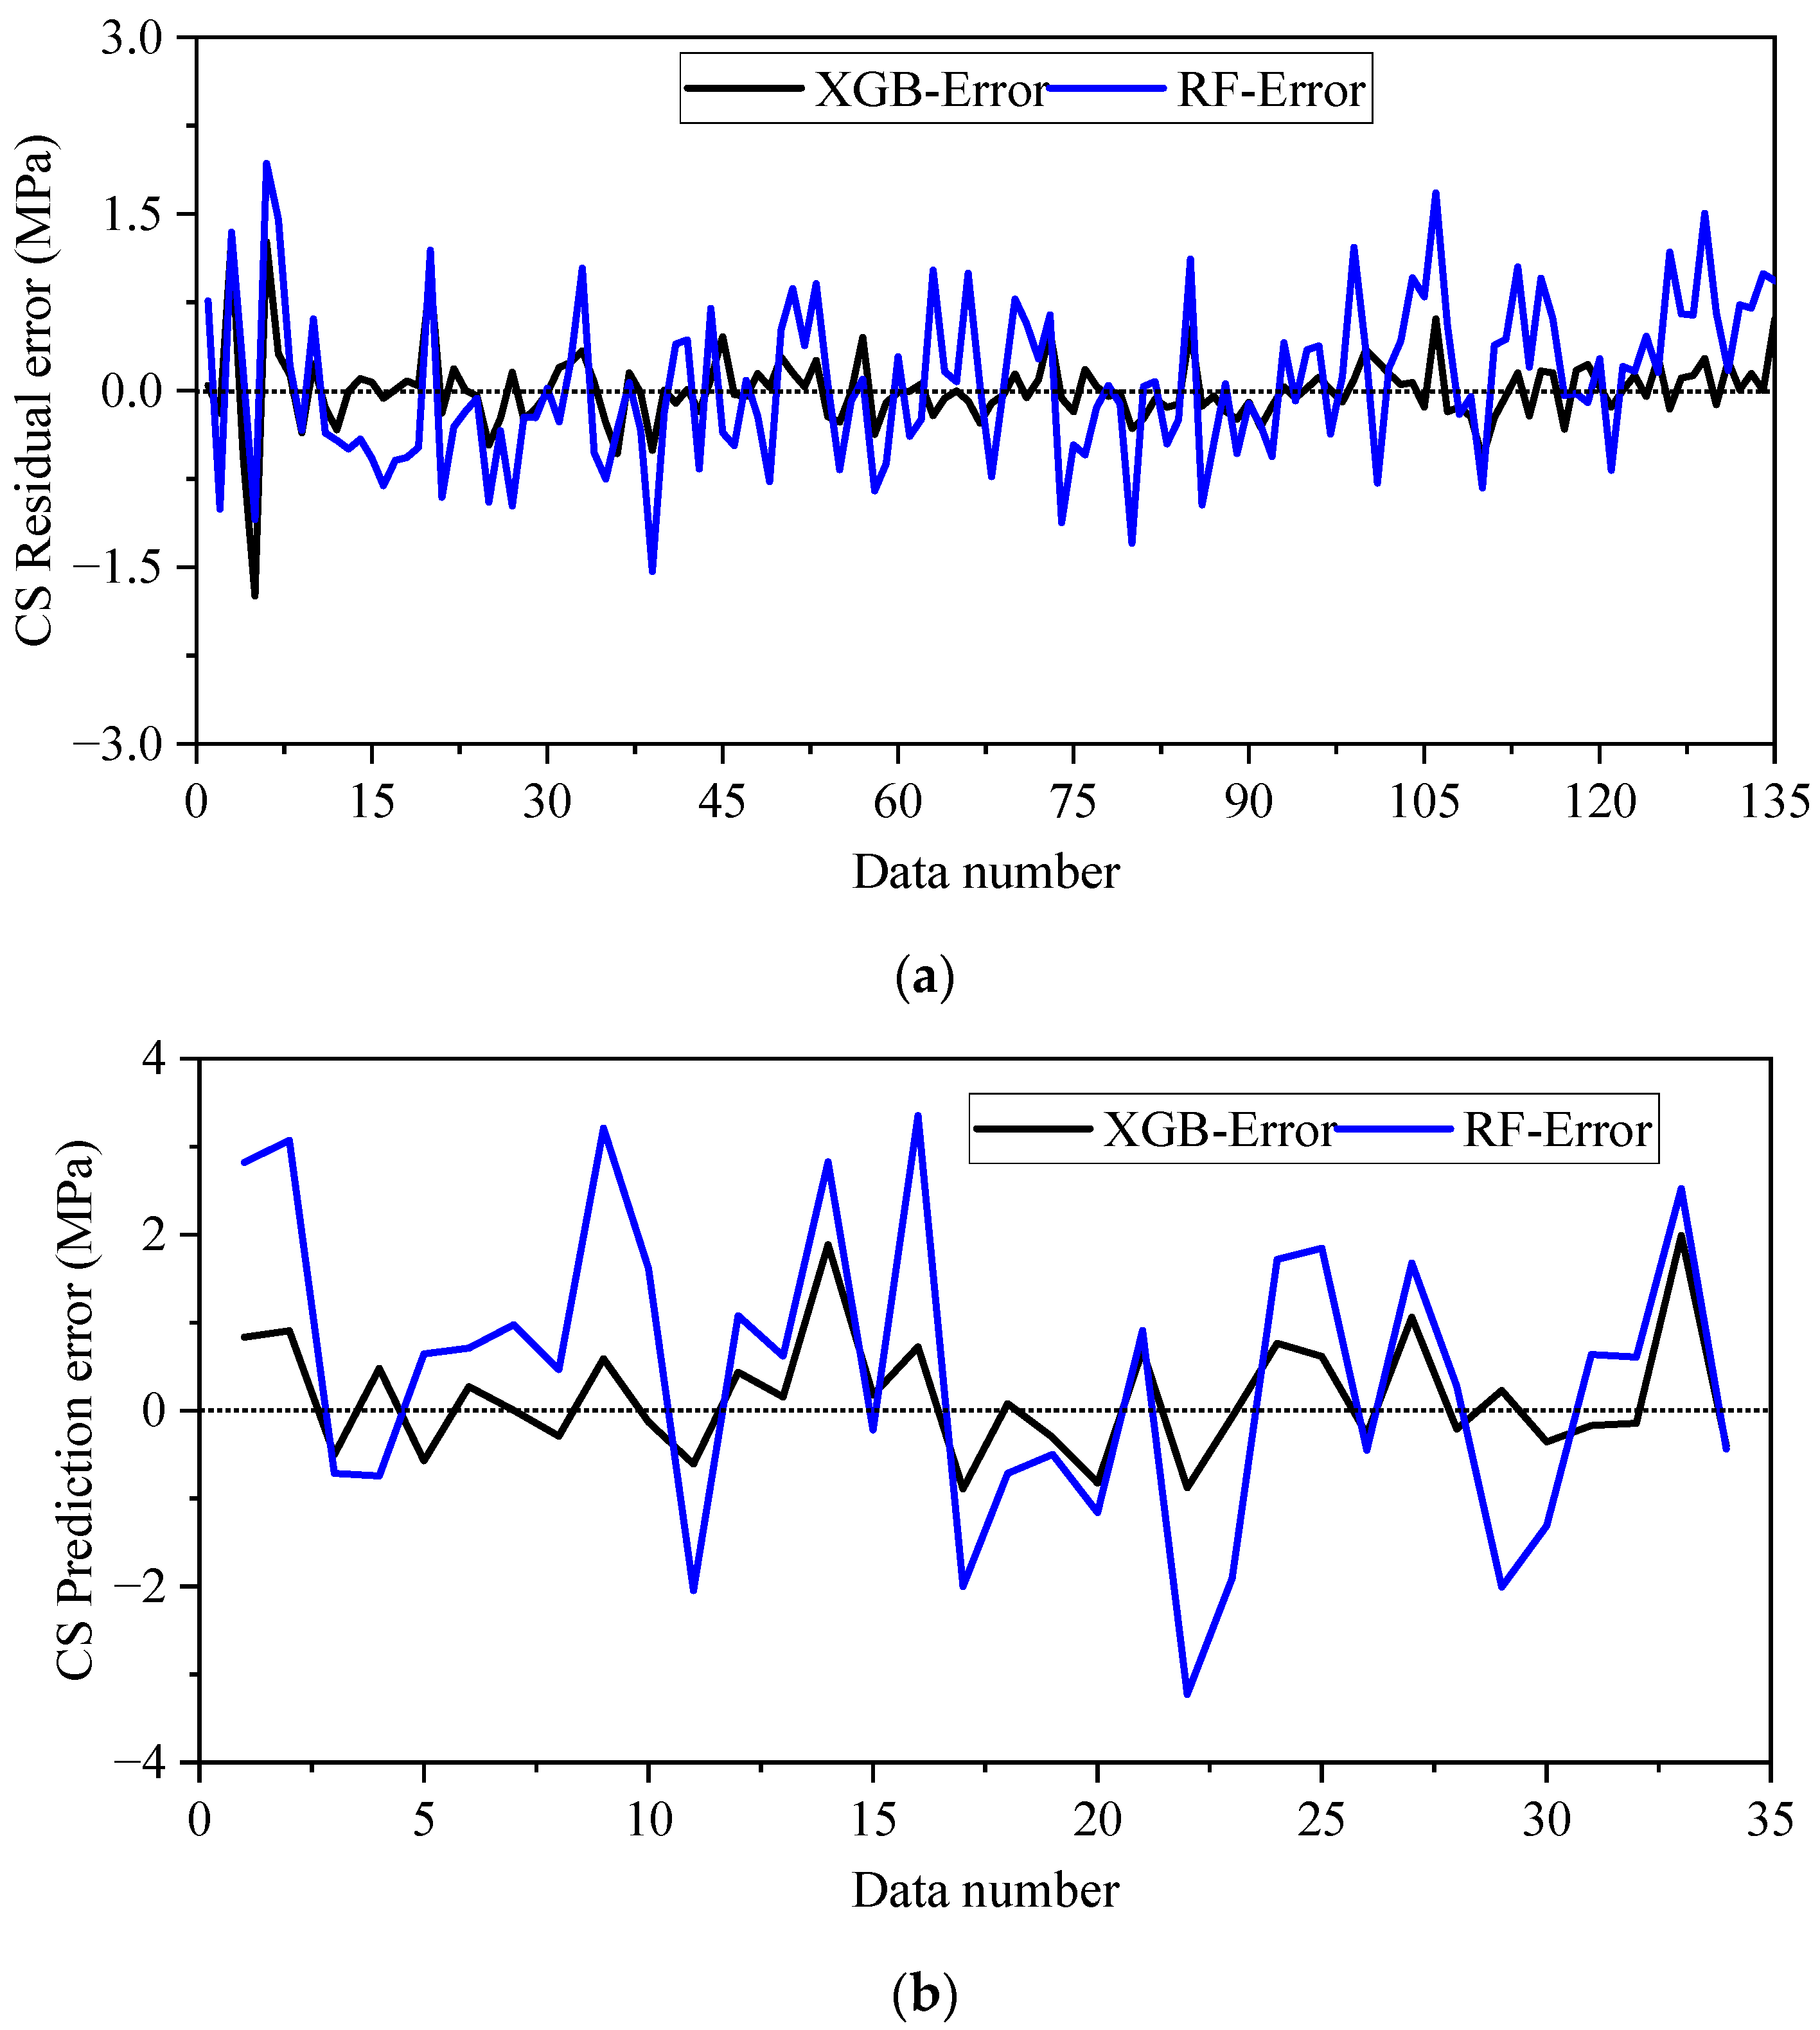
The XGB model predicted CS more accurately compared to the XGB model, as evidenced by the higher R2 and fewer prediction errors. Figure 7 shows the residual errors in the prediction of CS in the developed model for the training dataset (Figure 7a) and testing dataset (Figure 7b). The XGB model exhibited fewer errors in comparison to the RF model for both datasets, demonstrating that the XGB model led to more accurate predictions of the CS of concrete containing NC and NS under elevated temperatures.
Figure 8 shows the calculated statistical metrics to assess the developed models. The XGB model outperformed the RF model in terms of R2 and prediction error, demonstrating its greater accuracy. It is obvious that the XGB model’s predictions had lower error values than the RF model (Figure 7).

4.3. Cross-Validation

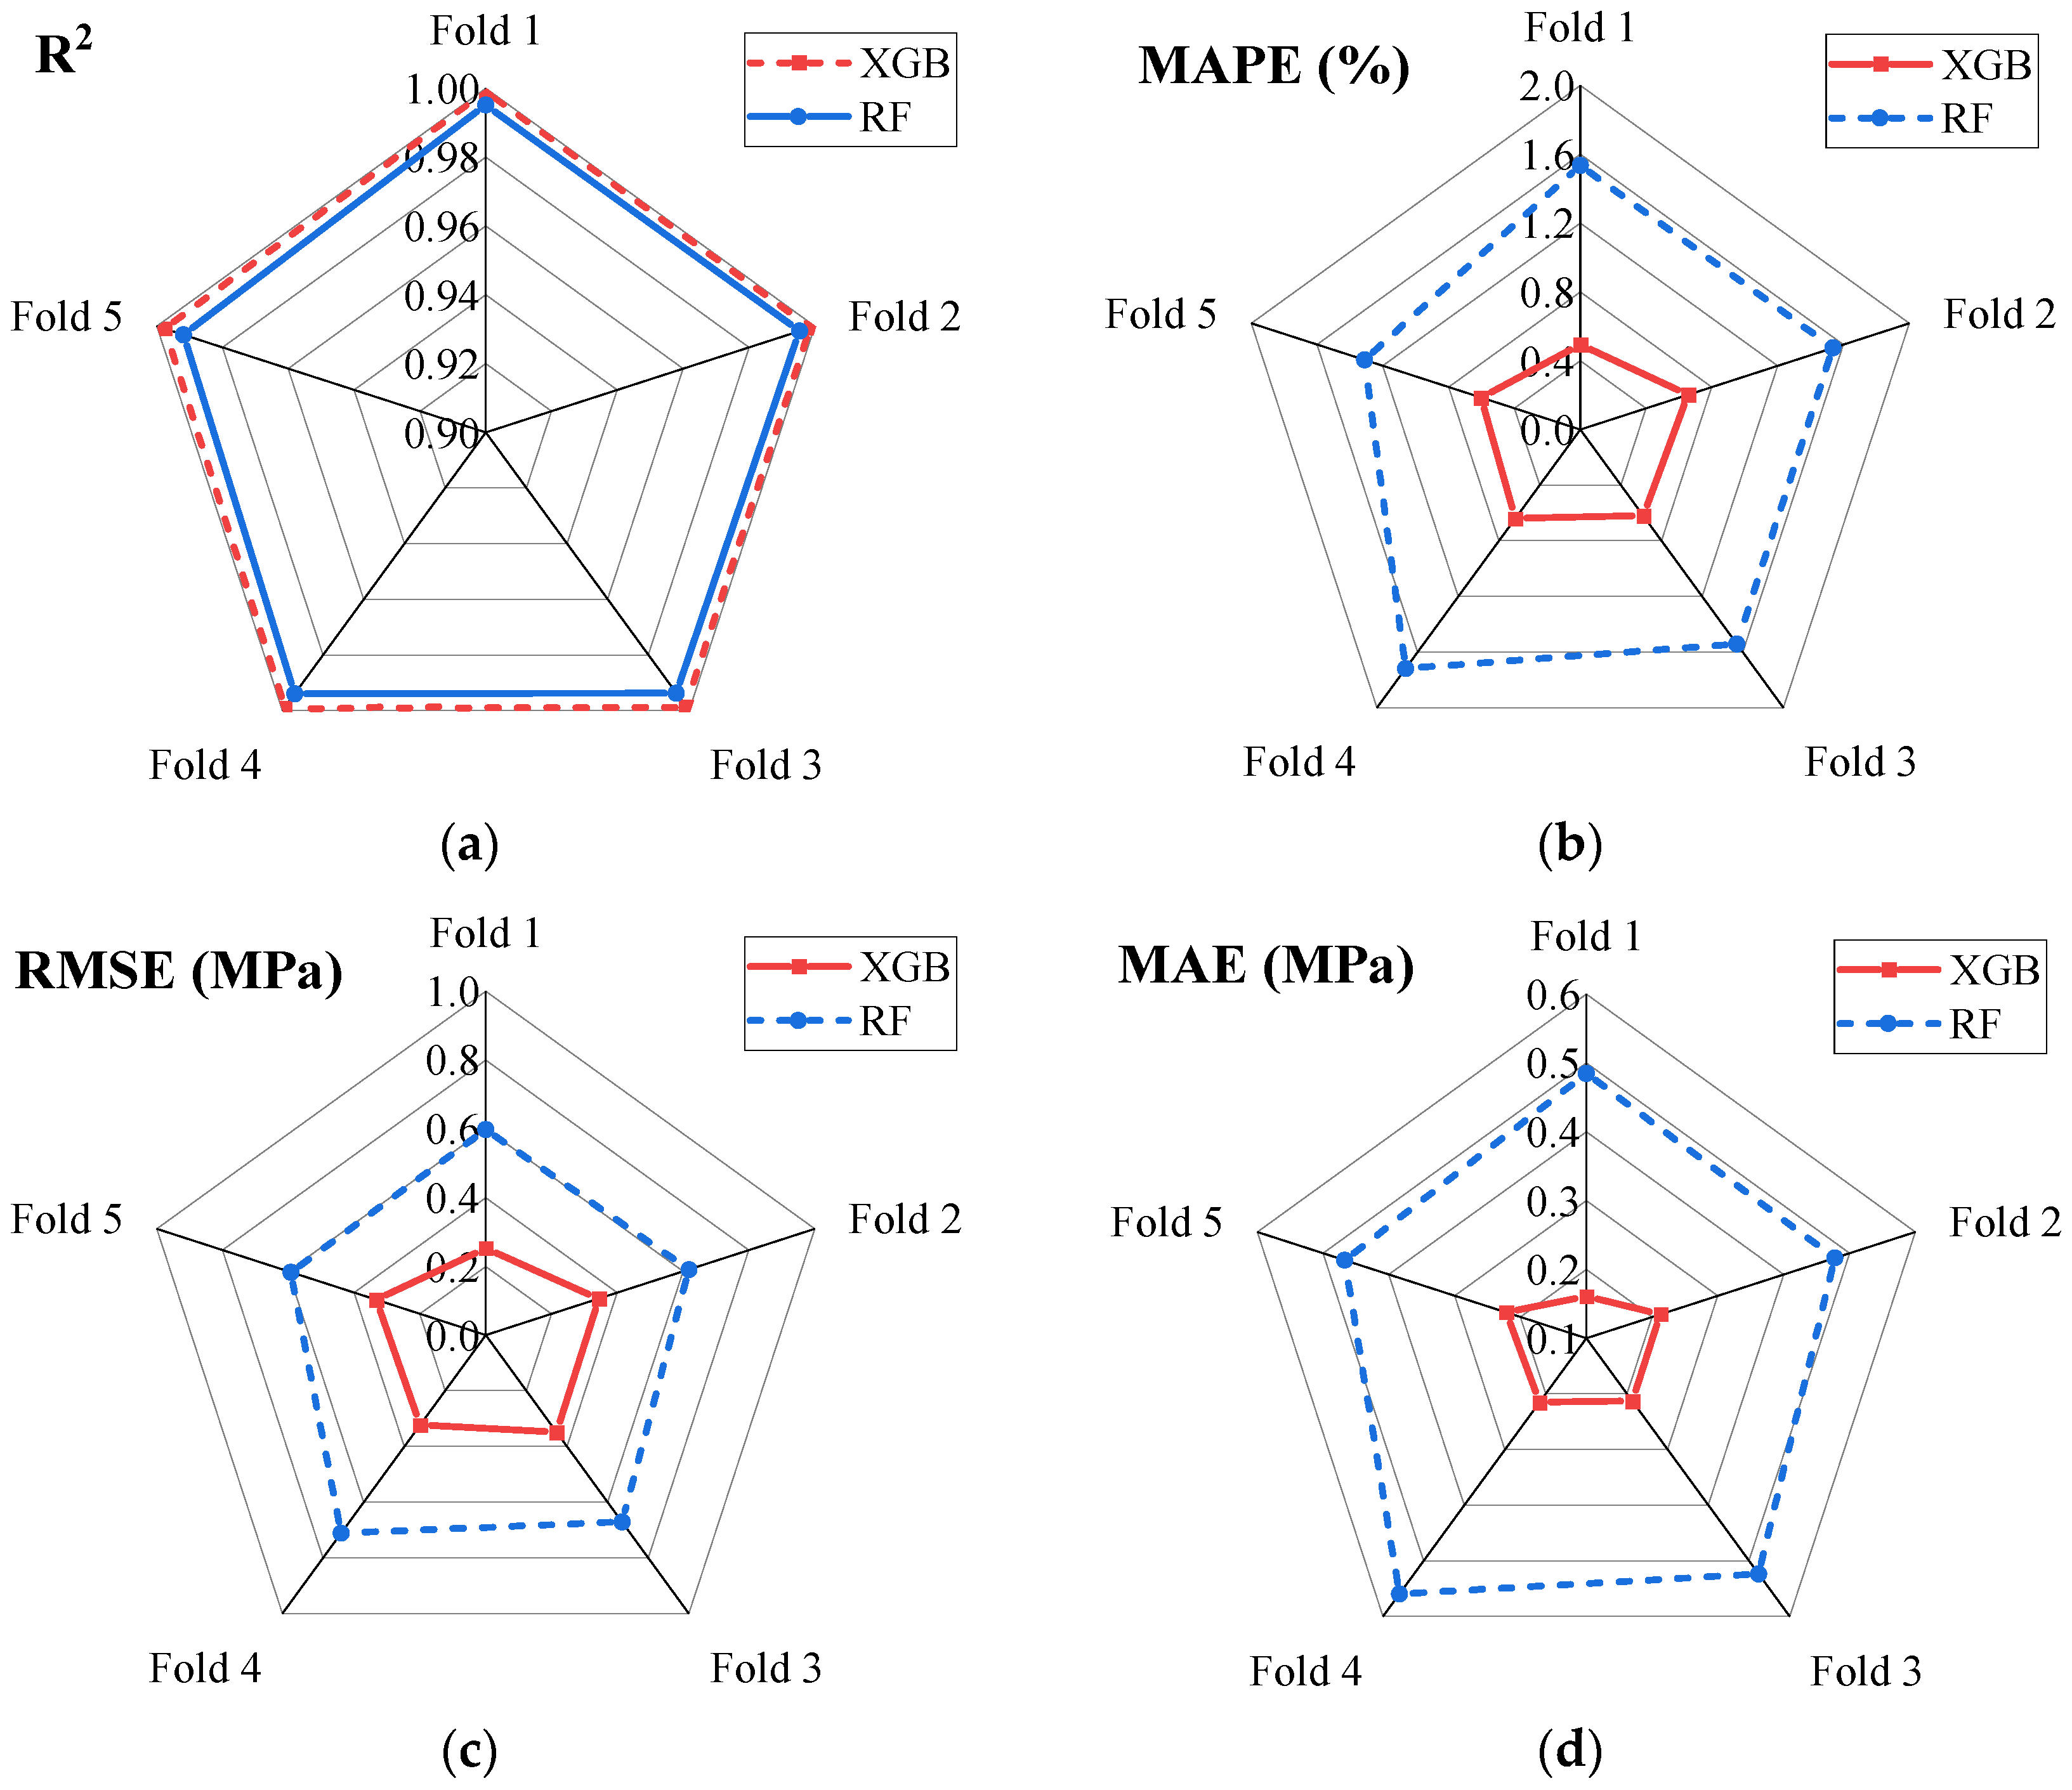
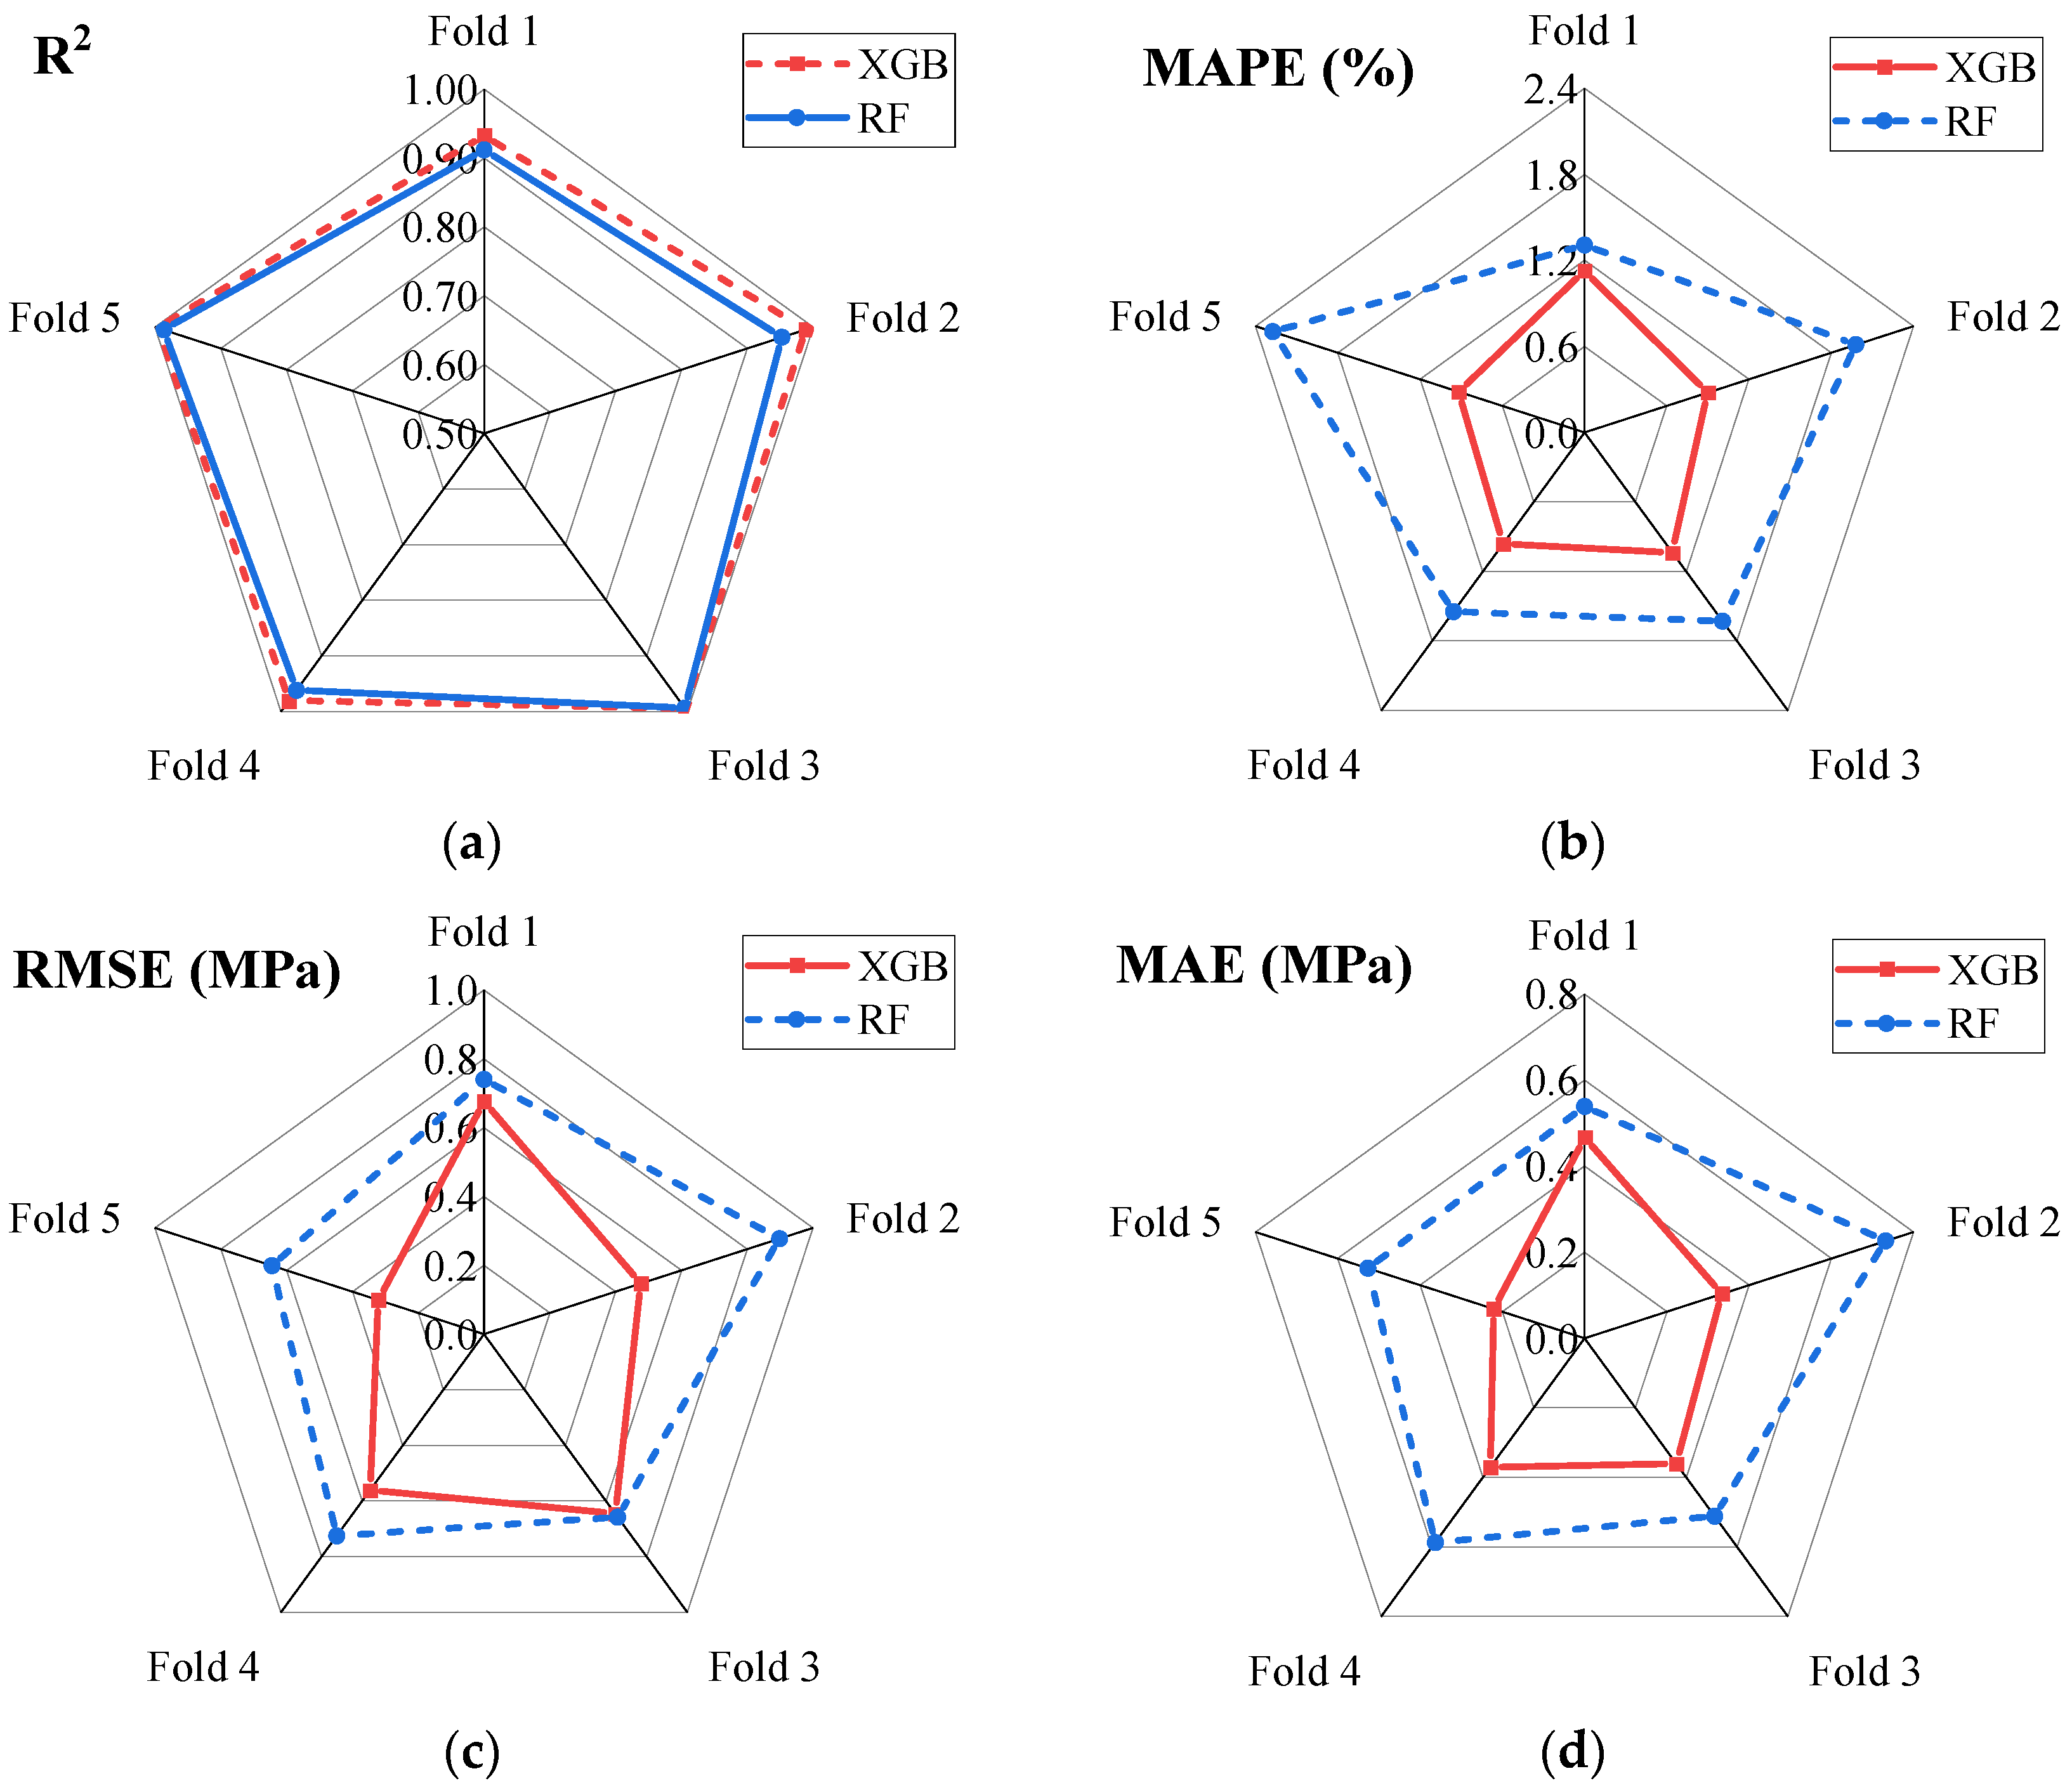
K-fold cross-validation is performed to assess the resilience of a model across different data subsets. This strategy reduces overfitting and bias throughout the train process. K-fold cross-validation employs statistical measurements to assess the effectiveness of the developed model. The ratings improved significantly after five repetitions while remaining quite exact. Eighty percent of the dataset was utilized to train the model, and the remaining data were utilized for testing the model. Figure 9 and Figure 10 show the results of 5-fold cross-validation for all created models, including the R2, MAE, RMSE, and MAPE for the training (Figure 9) and testing datasets (Figure 10).
Figure 9 displays the R2 values for the testing datasets of the XGB model, which ranged from 0.9976 to 0.9992 (average of 0.9985, standard deviation (STD) of 0.0006). The RF model’s R2 values ranged from 0.9919 to 0.9954, with an average of 0.994 and an STD of 0.0014. The MAE values for the XGB model varied from 0.1609 to 0.2215, with an average of 0.2047 and an STD of 0.0247. In the RF model, the MAE values ranged from 0.4671 to 0.5593, with an STD of 0.0383 and an average of 0.5024. The RMSE values that the XGB model generated ranged from 0.2526 to 0.3485, with an STD of 0.039 and an average of 0.3199. With RMSE values ranging from 0.5922 to 0.7112, the RF model yielded a mean of 0.6381 and an STD of 0.0513. The MAPE values of the XGB model ranged from 0.4942 to 0.6547, with a standard deviation of 0.0635 and an average of 0.6019. The MAPE values of the RF model ranged from 1.3117 to 1.7182, with an STD of 0.1443 and an average of 1.5288.
Figure 10 shows that the XGB model shows that the R2 values for testing datasets ranged from 0.9326 to 0.9972, with an average of 0.9785 and an STD of 0.0265. The R2 values for the RF model are 0.9613 on average, with a standard deviation of 0.0324 and a range of 0.9121 to 0.9936. With an STD of 0.0881 and a mean of 0.3503, the MAE values for the XGB model fall somewhere between 0.2209 and 0.4664. The RF model achieves a mean MAE of 0.5792 and an STD of 0.0898, in addition to MAE values between 0.5116 and 0.7317. The RMSE values for the XGB model are between 0.321% and 0.67566%, with an STD of 0.1429 and a mean of 0.5357%. With an STD of 0.1012 and RMSE values ranging from 0.6449 to 0.8984, the RF model produces an average of 0.7331. With MAPE values ranging from 0.8988 to 1.1274, the XGB model has an STD of 0.0937 and a mean of 0.9886. The MAPE values of the RF model varied from 1.3068 to 2.2745, producing a mean of 1.7467 and an STD of 0.3811. In the 5-fold CV investigation, the RF model was surpassed by XGB, according to the k-fold cross-validation results.

4.4. Feature Importance

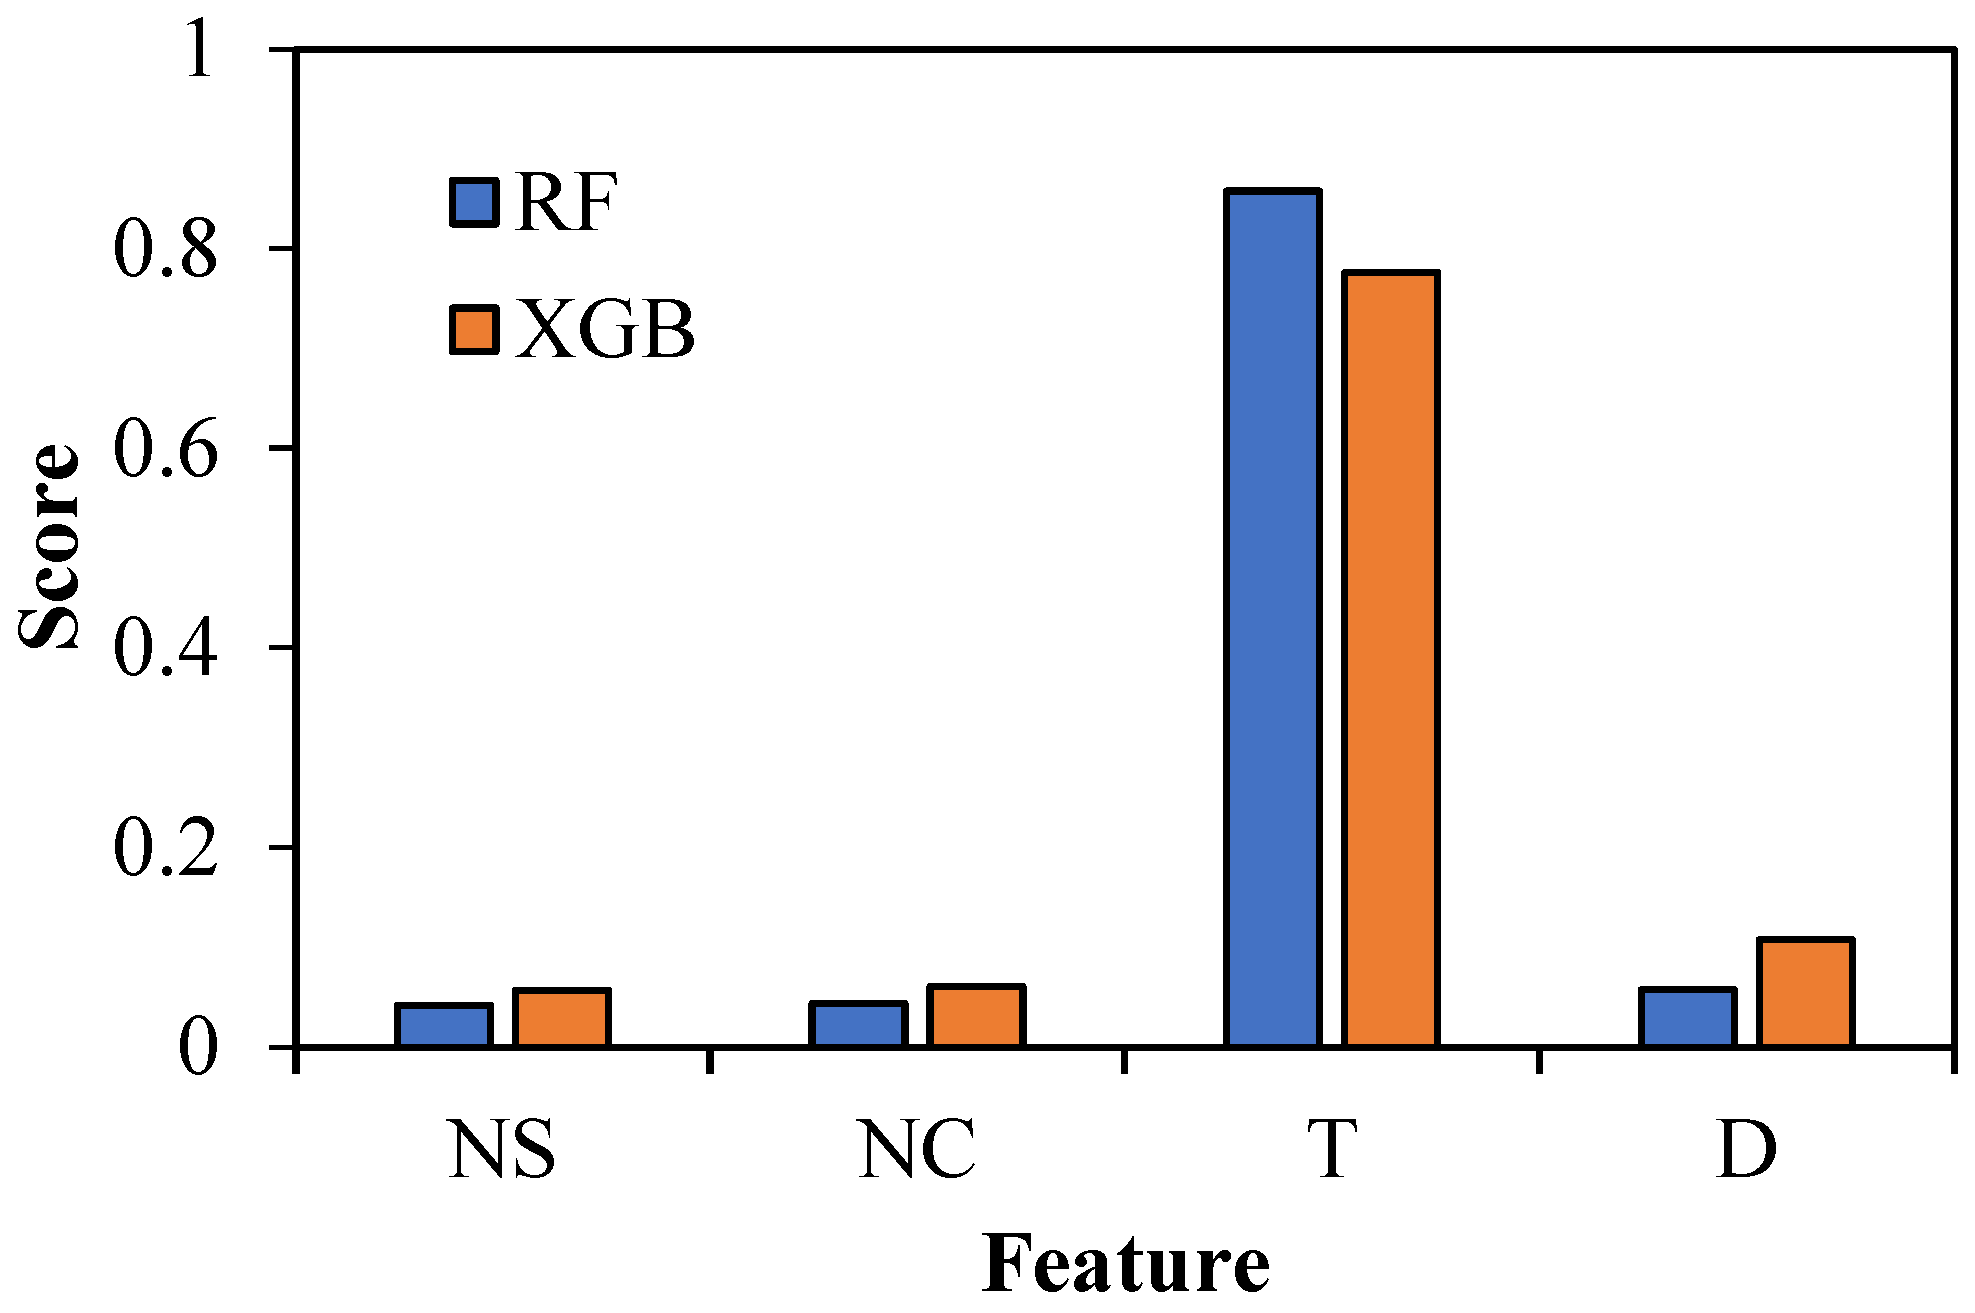
Regarding Figure 11, the temperature feature is the most significant feature in both developed models, followed by D, NC, and NS. The investigation shows that the generated models assign roughly identical weights.

4.5. SHAP Analysis

To further understand the key factors influencing the CS of nano-modified concrete under high temperatures, Lundberg and Lee [55] developed the SHAP analysis; this is a technique for evaluating machine learning models by incorporating local SHAP explanations that allows practitioners to attain a more accurate description of the variables influencing the global representation when applied to all datasets.
The SHAP analysis quantified the influence of the individual input parameters on the response. Figure 12 illustrates how the various aspects correlated with SHAP values for the CS of nano-modified concrete under high temperatures. A change in dot color from blue to red implies that the characteristic has a positive correlation with the model’s outcome. Figure 12 shows that the temperature exhibits the highest SHAP value in predicting the CS, followed by D, NS, and NC. A greater temperature correlates with a lower SHAP value, indicating that concrete CS decreases with a greater temperature. Additionally, the SHAP value is negatively correlated with increasing exposure time, indicating that concrete CS decreases with a greater exposure duration. The contributions of NC and NS to concrete CS are positive.

4.6. ICE with PDP

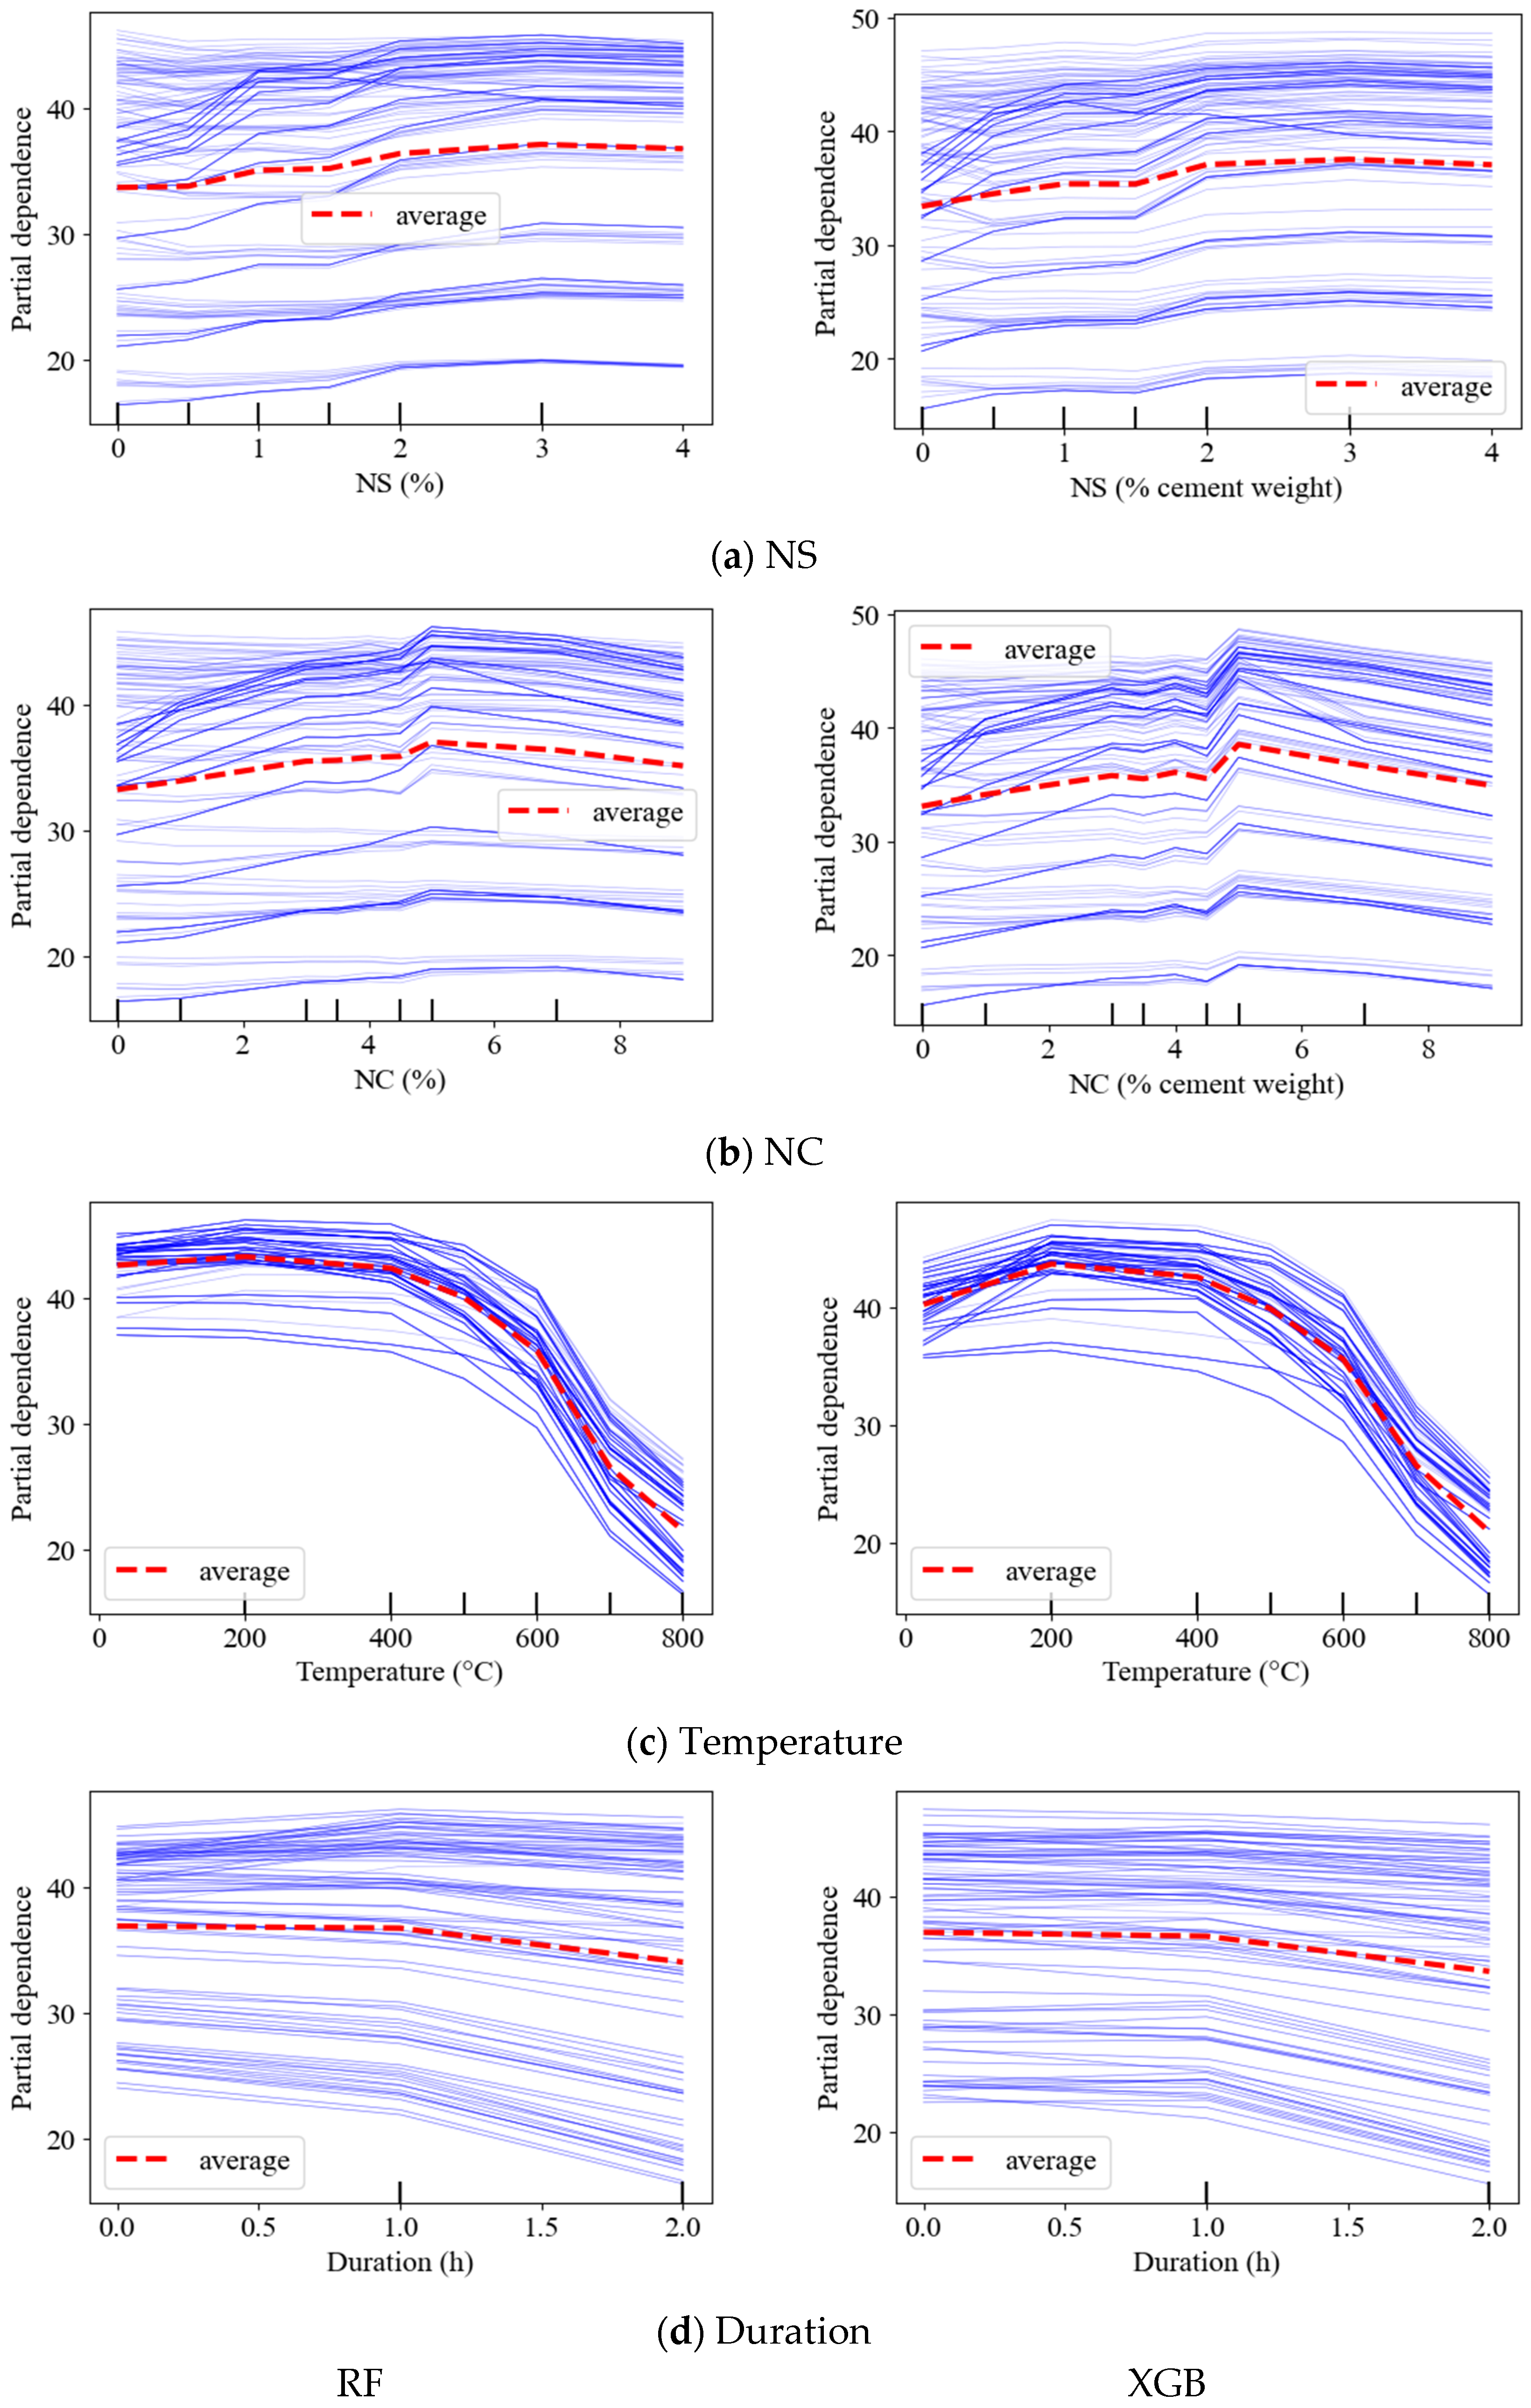
Figure 13 shows how changes in the values of each feature influence the response. The output predictions for each observation are represented by blue lines, while the average is represented by the dashed red line. The ICE graphs show that, as the NS increases, the CS increases (Figure 13a). The CS increases with the proportion of NC up to 5%, after which it falls (Figure 13b). The ICE plots show that CS improves with increasing temperature up to 200 °C (Figure 13c). The CS decreases as the duration exceeds one hour (Figure 13d).
The PDP in Figure 14 represents the average trend of ICE plots, which is represented by the dashed red line. The variation in CS in PDP is readily seen. Increasing NS from 0% to 3% raised CS from 34.11 MPa to 37.32 MPa (Figure 14a). Similarly, adding up to 5% of NC raises compressive strength from 33.69 to 37.28 MPa (Figure 14b). Temperatures beyond 400 °C have no significant impact on compressive strength. However, temperatures above 800 °C decrease compressive strength from 42.6 to 21.1 MPa (Figure 14c). When the exposure length is increased from 1 to 2 h, the compressive strength decreases from 36.7 MPa to 33.7 MPa (Figure 14d). It is possible to conclude that NS has the most positive impact on concrete’s compressive strength, whilst temperature has the greatest detrimental impact.
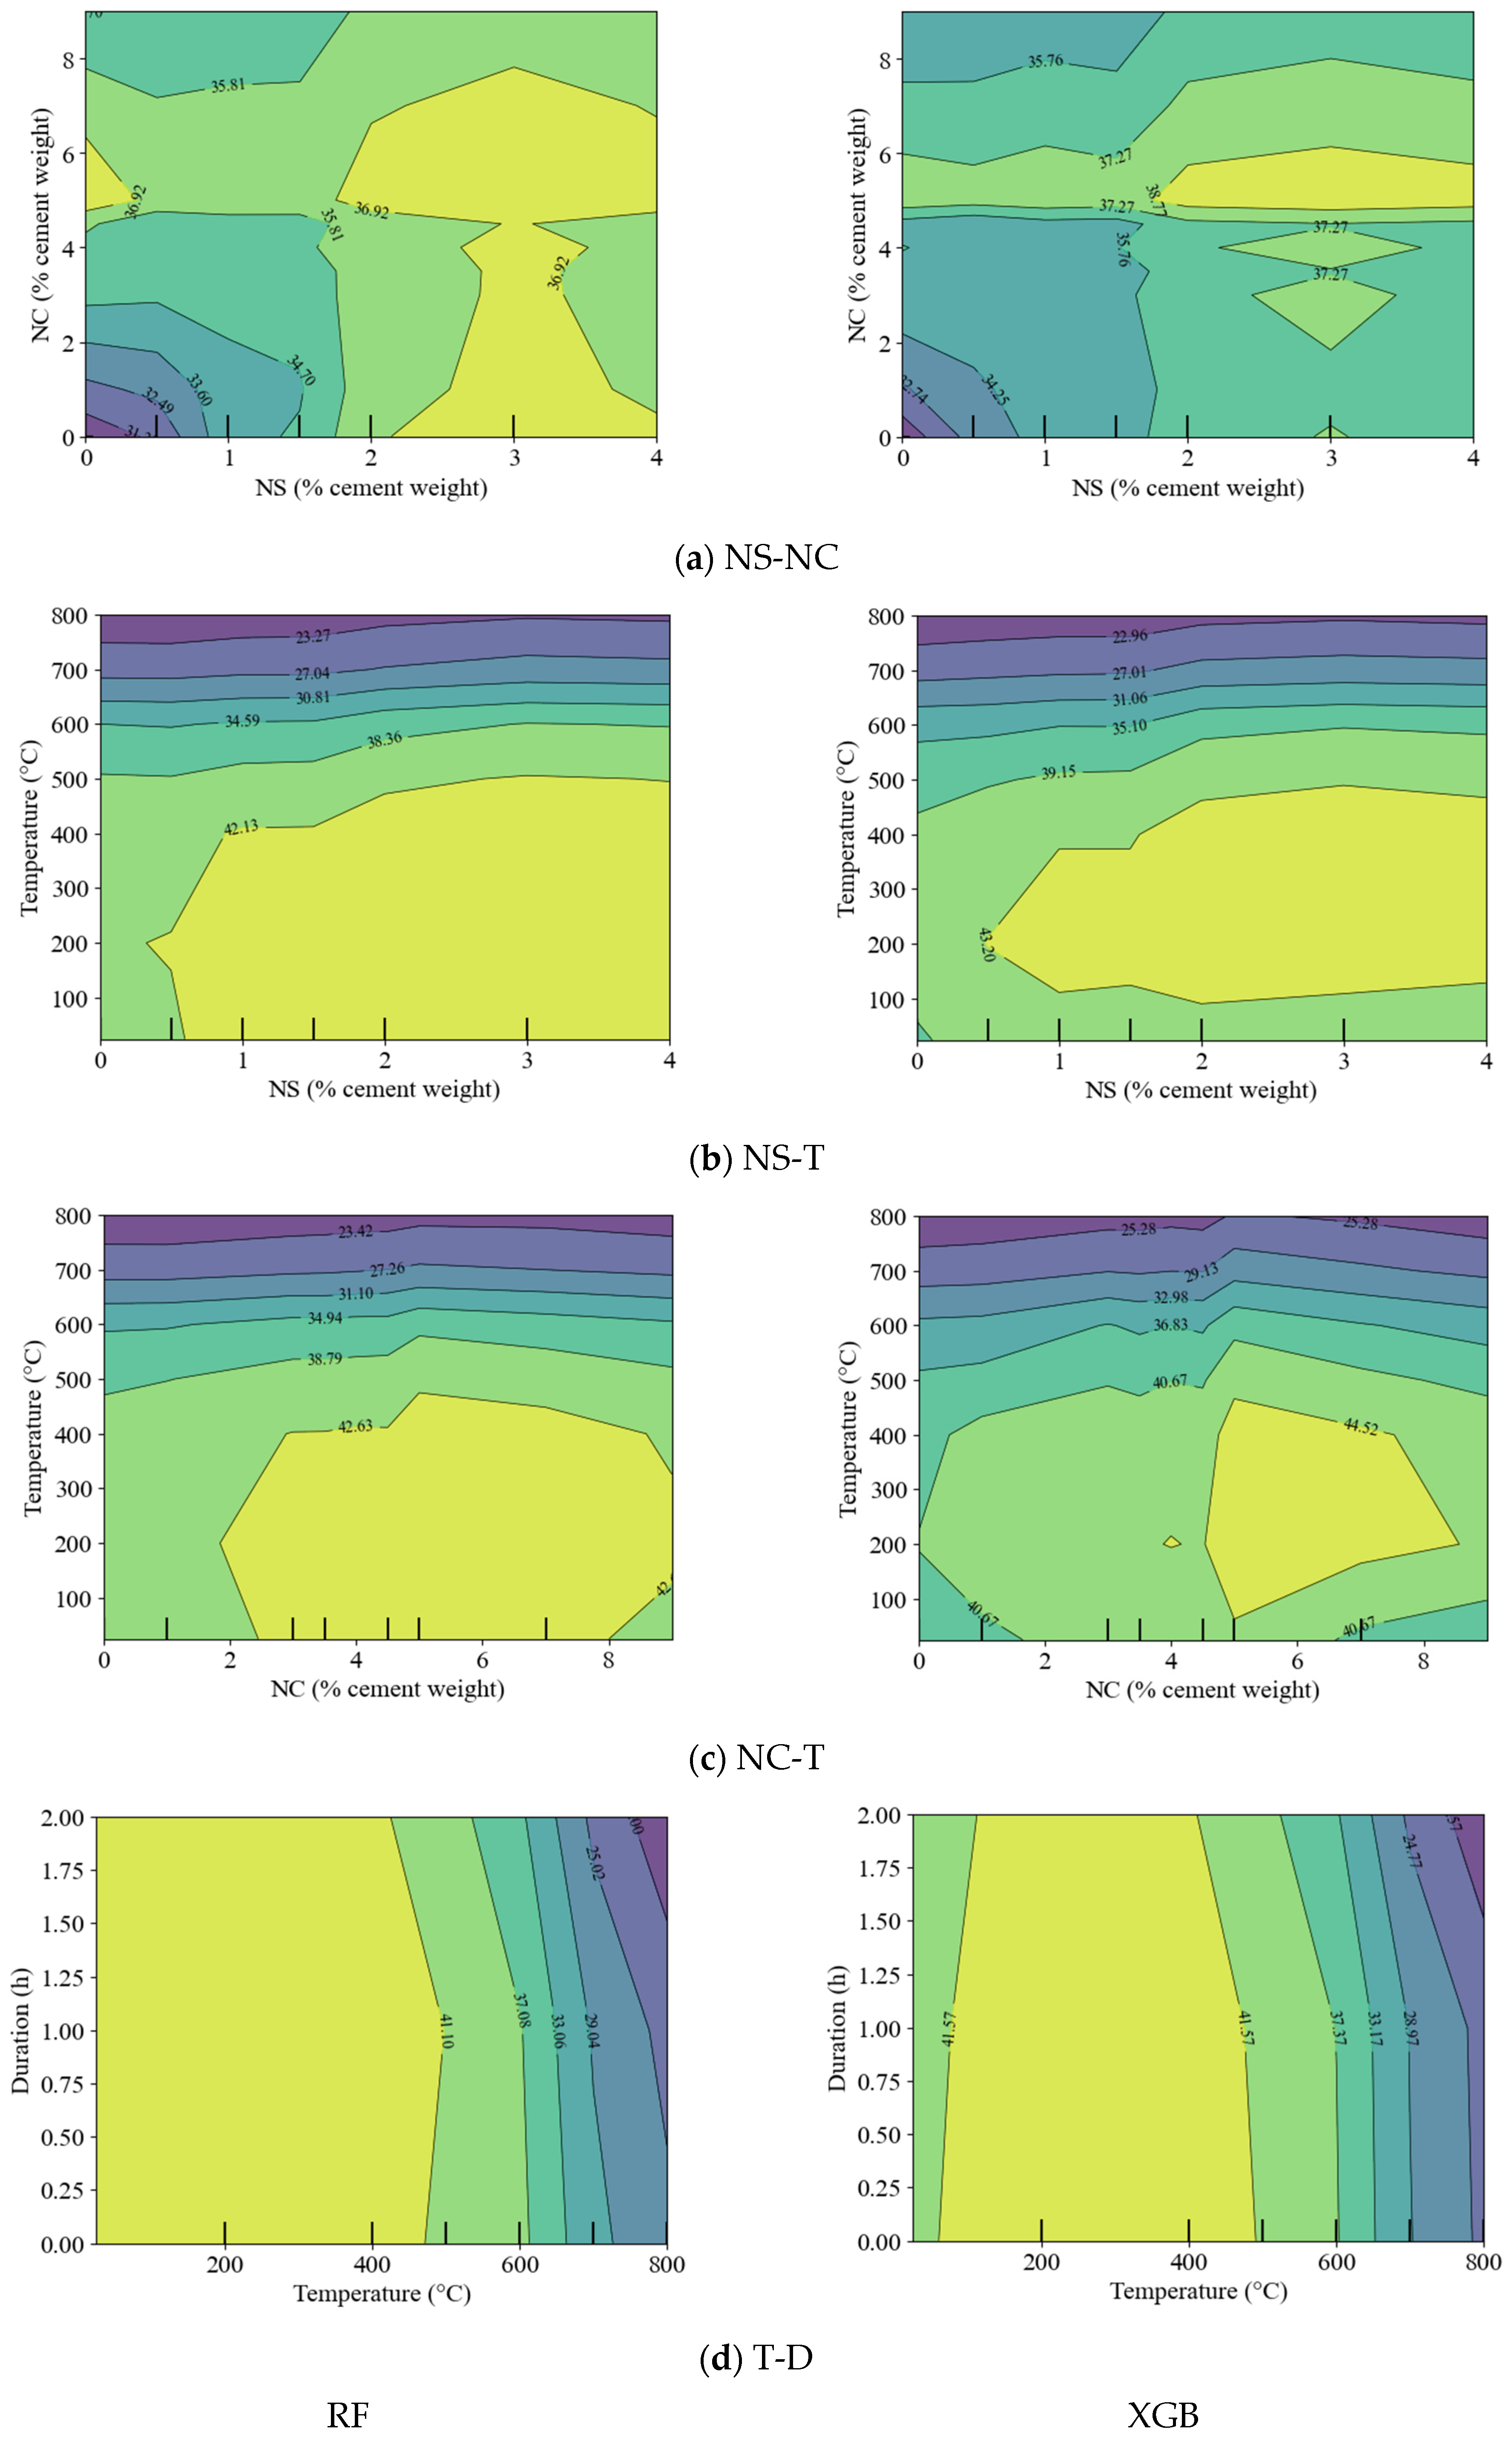
Figure 15 depicts the 2D-PDP input parameters. Figure 15a shows that the maximum CS is achieved with NS between 2% and 4% and NC content between 5% and 6%. Within these value ranges, the maximum CS is 38.77 MPa. In Figure 15b, the maximum CS is achieved with NS between 0.5% and 4% and at temperatures up to 468 °C. Within these value ranges, the maximum CS is 43.2 MPa. Figure 15c depicts the coupled effect of NC and temperature on the CS. The CS reaches a maximum value of 44.52 MPa when NC is between 5% and 8.5% and the temperature is below 469 °C. Figure 15d shows that the greatest CS, 41.57 MPa, is attained at temperatures up to 411 °C and exposure times up to 2 h.

4.7. Comparisons with Previous Models

Dahish and Almutairi [2] developed linear (LR) and quadratic (QUAD) models for predicting the post-heating CS of concrete samples incorporating NC and NS. In addition, a full quadratic model (FQM) has been developed to predict the CS of nano-modified concrete under elevated temperatures [56]. Zeyad et al. [43] utilized ML approaches (such as fuzzy logic models (FLMs), a genetic algorithm (GA), a water cycle algorithm (WCA), and artificial neural networks (ANNs)) to develop prediction models for the CS of nano-modified concrete materials under elevated temperatures. A comparison with the previously developed models was undertaken using a variety of statistical metrics (Figure 16). The XGB model outperforms the existing CS models, obtaining peak R2 values while maintaining the lowest RMSE and MAE measures.

5. Conclusions

This work modeled the CS of concrete with NS and NC exposed to high temperatures for various periods using XGB and RF approaches. The input variables were NS, NC, T, and D. The output variable was the concrete strength (CS). Four statistical measures were used to assess the performance of the model. SHAP, ICE, and PDP plots were used to assess the effect of different features on CS prediction. The following conclusions were drawn:
  • The XGB prediction model attained accurate predictions and correlated well with the experimental data. R2 values of 0.9987 and 0.9938 were obtained for the training and testing data, respectively. The values of MAPE, RMSE, and MAE attained with the XGB model for the training dataset were 0.5955%, 0.3179 MPa, and 0.2015 MPa, respectively; meanwhile, for the testing dataset, these values were 1.7121%, 0.7054 MPa, and 0.5439 MPa, respectively.
  • The XGB model showed better performance in terms of resilience and accuracy during the five-fold cross-validation compared to the RF model. In addition, the XGB model outperformed other earlier CS models: LR, QUAD, FQM, WCA, GA, ANN, and FLM.
  • The results from the SHAP analysis, generated using the XGB and RF models, indicated that T had the highest negative impact on CS prediction, followed by D.
  • The ICE and PDP plots showed that the optimal combined use of NS and NC as partial cement replacements by weight in concrete, which leads to maximum compressive strength (CS), occurs with an NS content between 2% and 4% and an NC content between 5% and 6%.
  • The developed prediction models can be used as a tool for optimizing mix designs for specific fire resistance ratings, reducing the need for costly and time-consuming experimental trial programs.

6. Limitations and Future Work

This study includes a dataset, advanced algorithms, SHAP analysis, and ICE and PDP plots. It also utilizes both RF and XGB techniques, showcasing their diversity; however, we must address their shortcomings. The performance of machine learning models depends on the optimization of their input variables. The introduction of new parameters mandates model retraining, validation, and hyperparameter tuning. This study employs four input variables and analyzes 169 data points; however, additional input variables are necessary if we are to successfully assess their significance in predicting the compressive strength of nano-modified concrete subjected to elevated temperatures. The input parameters encompass the source of nanomaterials, their types and compositions, the crushing index and absorption of aggregates, the fineness modulus of fine aggregate, the ratios of pozzolanic components, and the specific surface area of powders. The dataset volume is contingent upon the number of parameters included for the analysis. Machine learning models should be employed to predict concrete properties using a comprehensive dataset. The used data warrant investigation through supplementary machine learning models. A graphical user interface for predicting the mechanical and durability properties of nano-modified concrete subjected to elevated temperatures is essential. The assessment of the economic feasibility of using NS and NC as partial replacements of cement in concrete will provide important insights into their potential uses in high-volume applications.

Author Contributions

Conceptualization, H.A.D. and M.A.; methodology, H.A.D. and M.A.; software, H.A.D.; validation, M.A.; formal analysis, H.A.D.; investigation, H.A.D. and M.A.; resources, M.A.; data curation, H.A.D.; writing—original draft preparation, H.A.D.; writing—review and editing, M.A.; visualization, H.A.D.; supervision, M.A.; project administration, M.A.; funding acquisition, M.A. All authors have read and agreed to the published version of the manuscript.

Funding

This research received no external funding.

Data Availability Statement

All the raw data supporting the conclusion of this study were provided by the authors.

Acknowledgments

The researchers would like to thank the Deanship of Graduate Studies and Scientific Research at Qassim University for financial support (QU-APC-2025).

Conflicts of Interest

The authors declare there are no conflicts of interest.

Abbreviations

The following abbreviations are used in this manuscript:
CHcalcium hydroxide
CSHcalcium–silicate hydrate
CScompressive strength
CVcross-validation
CNTcarbon nanotubes
Dexposure duration
FQMfull quadratic model
ICEindividual conditional expectation
LRlinear regression
LOIloss on ignition
NSnano-silica
NCnano-clay
MAPEmean absolute percentage error
MAEmean absolute error
MLmachine learning
PDPpartial dependence plots
QUADquadratic
RFrandom forest
Rcorrelation coefficients
R2coefficient of determination
RMSEroot mean squared error
SHAPShapley additive explanations
STDstandard deviation
Ttemperature
VIFvariation inflation factor
XGBextreme gradient boosting

Appendix A

Table A1. Dataset.
Table A1. Dataset.
NS (%)NC (%)T (°C)D (h)CS (MPa)NS (%)NC (%)T (°C)D (h)CS (MPa)
002503810500140
1025042.620500143.6
2025041.530500144.5
3025039.740500143.8
4025038.801500137
0125039.403500141
0325041.905500145.1
0525044.507500142.5
0725038.609500140.2
09250370.54.5500139.6
0.54.525042.314500141.3
1425043.71.53.5500140.1
1.53.525043.100600132.6
00200137.110600136.1
10200144.120600139.8
20200145.530600140.9
3020014640600140.4
40200145.601600133.7
01200140.703600138.2
03200143.805600141.1
0520014707600138.1
07200145.609600135.7
09200143.80.54.5600135.3
0.54.520014414600137.3
14200145.41.53.5600135.9
1.53.5200144.800700125.2
00400135.610700128
10400142.720700130.4
20400144.830700131.1
30400145.440700130.7
40400144.901700126.2
01400140.803700128.8
03400143.505700131.6
05400146.507700129.8
07400145.409700127.8
09400143.20.54.5700128
0.54.5400142.114700128.7
14400143.61.53.5700128.1
1.53.5400142.600800121.2
20800124.330500241.7
30800125.140500241.3
40800124.501500234.9
01800122.103500238.6
03800123.805500242
05800125.507500240.1
07800124.509500237.9
09800122.70.54.5500237.3
0.54.5800123.114500238.5
14800124.11.53.5500237.8
1.53.5800123.300600228.6
00200236.410600232.5
10200243.220600235.9
20200244.530600237.1
30200245.140600236.4
40200244.701600230.4
01200239.903600234.1
03200242.905600237.4
05200246.207600234.5
07200244.709600232.2
09200242.90.54.5600231.8
0.54.5200243.114600232.8
14200244.51.53.5600232.3
1.53.5200243.900700220.6
00400234.610700223.3
10400241.520700225.3
20400243.530700225.9
30400244.140700225.6
40400243.601700221.8
01400239.603700224
03400242.205700226.1
05400245.207700224.8
07400244.109700223.2
09400241.90.54.5700223.3
0.54.5400240.914700223.8
14400242.51.53.5700223.4
1.53.5400241.400800215.6
00500232.410800217.2
10500237.720800218.3
40800218.409800217.1
01800216.60.54.5800217.4
03800217.914800217.9
05800219.21.53.5800217.5
07800218.4

References

  1. Kodur, V. Properties of Concrete at Elevated Temperatures. ISRN Civ. Eng. 2014, 2014, 1–15. [Google Scholar] [CrossRef]
  2. Dahish, H.A.; Almutairi, A.D. Effect of elevated temperatures on the compressive strength of nano-silica and nano-clay modified concretes using response surface methodology. Case Stud. Constr. Mater. 2023, 18, e02032. [Google Scholar] [CrossRef]
  3. Aly Elsayd, A.; Fathy, I.N. Experimental Study of fire effects on compressive strength of normal-strength concrete supported with nanomaterials additives. IOSR J. Mech. Civ. Eng. (IOSR-JMCE) 2019, 16, 28–37. [Google Scholar] [CrossRef]
  4. Prasad Bhatta, D.; Singla, S.; Garg, R. Experimental investigation on the effect of Nano-silica on the silica fume-based cement composites. Mater. Today Proc. 2022, 57, 2338–2343. [Google Scholar] [CrossRef]
  5. Sivamani, J. Influence of nano-silica on the behaviour of high-performance concrete—Multiscale investigation on its mechanical, durability and microstructural properties. Multiscale Multidiscip. Model. Exp. Des. 2025, 8, 283. [Google Scholar] [CrossRef]
  6. Khosravi, H.; Toloue-Hassanpour, M.R.; Lezgy-Nazargah, M. Investigating the Effects of Nano-Materials on the Mechanical and Durability Properties of Self-Consolidating Concrete. CivilEng 2025, 6, 12. [Google Scholar] [CrossRef]
  7. Mokhtar, M.M.; Morsy, M.; Taha, N.A.; Ahmed, E.M. Investigating the mechanical performance of nano additives reinforced high-performance concrete. Constr. Build. Mater. 2022, 320, 125537. [Google Scholar] [CrossRef]
  8. Fallah-Valukolaee, S.; Mousavi, R.; Arjomandi, A.; Nematzadeh, M.; Kazemi, M. A comparative study of mechanical properties and life cycle assessment of high-strength concrete containing silica fume and nanosilica as a partial cement replacement. Structures 2022, 46, 838–851. [Google Scholar] [CrossRef]
  9. Kanagaraj, B.; Anand, N.; Cashell, K.A.; Andrushia, A.D. Post-fire behaviour of concrete containing nano-materials as a cement replacement material. Case Stud. Constr. Mater. 2023, 18, e02171. [Google Scholar] [CrossRef]
  10. Ghale Noee, A.; Nasiri Rajabli, J. The effect of nano-silica powder on mechanical and non-mechanical characteristics of self-consolidating concrete (SCC) and its impact on environment protection. Innov. Infrastruct. Solut. 2023, 8, 166. [Google Scholar] [CrossRef]
  11. Yassin, A.M.; Eldin, M.M.; Omar, M.S.; Hafez, M.A.; Elnaggar, M.A. Effect of nano-silica on the flexural behavior and mechanical properties of self-compacted high-performance concrete (SCHPC) produced by cement CEM II/A-P (experimental and numerical study). Case Stud. Constr. Mater. 2024, 21, e03490. [Google Scholar] [CrossRef]
  12. Noori, A.; Lu, Y.; Saffari, P.; Zhang, Y.; Wang, M. The optimum percentage of nano clay (NC) in both direct-additive and sonicated modes to improve the mechanical properties of self-compacting concrete (SCC). Case Stud. Constr. Mater. 2022, 17, e01493. [Google Scholar] [CrossRef]
  13. Amiri, Y.; Hassaninasab, S.; Chehri, K.; Zahedi, M. Investigating the effect of adding bacillus bacteria and nano-clay on cement mortar properties. Case Stud. Constr. Mater. 2022, 17, e01167. [Google Scholar] [CrossRef]
  14. Shah, S.P.; Hou, P.; Cheng, X. Durability of Cement-Based Materials and Nano-particles: A Review. In Nanotechnology in Construction; Springer International Publishing: Berlin/Heidelberg, Germany, 2015; pp. 15–24. [Google Scholar] [CrossRef]
  15. Mohammed, B.S.; Achara, B.E.; Nuruddin, M.F.; Yaw, M.; Zulkefli, M.Z. Properties of nano-silica-modified self-compacting engineered cementitious composites. J. Clean. Prod. 2017, 162, 1225–1238. [Google Scholar] [CrossRef]
  16. Ashwini, R.M.; Potharaju, M.; Srinivas, V.; Kanaka Durga, S.; Rathnamala, G.V.; Paudel, A. Compressive and Flexural Strength of Concrete with Different Nanomaterials: A Critical Review. J. Nanomater. 2023, 2023. [Google Scholar] [CrossRef]
  17. Serag, M.I.; Yasien, A.M.; El-Feky, M.S.; Elkady, H. Effect of nano silica on concrete bond strength modes of failure. Int. J. GEOMATE 2017, 12, 73–80. [Google Scholar] [CrossRef]
  18. Hosseini, P.; Afshar, A.; Vafaei, B.; Booshehrian, A.; Molaei Raisi, E.; Esrafili, A. Effects of nano-clay particles on the short-term properties of self-compacting concrete. Eur. J. Environ. Civ. Eng. 2017, 21, 127–147. [Google Scholar] [CrossRef]
  19. Hakamy, A.; Shaikh, F.U.A.; Low, I.M. Effect of calcined nanoclay on microstructural and mechanical properties of chemically treated hemp fabric-reinforced cement nanocomposites. Constr. Build. Mater. 2015, 95, 882–891. [Google Scholar] [CrossRef]
  20. Hamed, N.; El-Feky, M.S.; Kohail, M.; Nasr, E.S.A.R. Effect of nano-clay de-agglomeration on mechanical properties of concrete. Constr. Build. Mater. 2019, 205, 245–256. [Google Scholar] [CrossRef]
  21. Ibrahem, A.M.; Al-Mishhadani, S.A.; H.Naji, Z. The Effect of Nano Metakaolin Material on Some Properties of Concrete. Diyala J. Eng. Sci. 2013, 6, 50–61. [Google Scholar] [CrossRef]
  22. Wang, Z.-H.; Bai, E.-L.; Xu, J.Y.; Du, Y.-H.; Zhu, J.S. Effect of nano-SiO2 and nano-CaCO3 on the static and dynamic properties of concrete. Sci. Rep. 2022, 12, 907. [Google Scholar] [CrossRef]
  23. Ghouchani, K.; Abbasi, H.; Najaf, E. Some mechanical properties and microstructure of cementitious nanocomposites containing nano-SiO2 and graphene oxide nanosheets. Case Stud. Constr. Mater. 2022, 17, e01482. [Google Scholar] [CrossRef]
  24. Arioz, O. Effects of elevated temperatures on properties of concrete. Fire Saf. J. 2007, 42, 516–522. [Google Scholar] [CrossRef]
  25. Malik, M.; Bhattacharyya, S.K.; Barai, S.V. Thermal and mechanical properties of concrete and its constituents at elevated temperatures: A review. Constr. Build. Mater. 2021, 270, 121398. [Google Scholar] [CrossRef]
  26. El-Sayed, A.A.; Fathy, I.N.; Tayeh, B.A.; Almeshal, I. Using artificial neural networks for predicting mechanical and radiation shielding properties of different nano-concretes exposed to elevated temperature. Constr. Build. Mater. 2022, 324, 126663. [Google Scholar] [CrossRef]
  27. Wang, Y.; Li, S.; Hughes, P.; Fan, Y. Mechanical properties and microstructure of basalt fibre and nano-silica reinforced recycled concrete after exposure to elevated temperatures. Constr. Build. Mater. 2020, 247, 118561. [Google Scholar] [CrossRef]
  28. Ibrahim, R.K.; Hamid, R.; Taha, M.R. Fire resistance of high-volume fly ash mortars with nanosilica addition. Constr. Build. Mater. 2012, 36, 779–786. [Google Scholar] [CrossRef]
  29. Wu, L.; Lu, Z.; Zhuang, C.; Chen, Y.; Hu, R. Mechanical properties of Nano SiO2 and carbon fiber reinforced concrete after exposure to high temperatures. Materials 2019, 12, 3773. [Google Scholar] [CrossRef] [PubMed]
  30. Polat, R.; Qarluq, A.W.; Karagöl, F. Influence of singular and binary nanomaterials on the physical, mechanical and durability properties of mortars subjected to elevated temperatures and freeze–thaw cycles. Constr. Build. Mater. 2021, 295, 123608. [Google Scholar] [CrossRef]
  31. He, C.; Makovicky, E.; Osbæck, B. Thermal stability and pozzolanic activity of calcined kaolin. Appl. Clay Sci. 1994, 9, 165–187. [Google Scholar] [CrossRef]
  32. Syamsunur, D.; Wei, L.; Ahmed Memon, Z.; Surol, S.; Md Yusoff, N.I. Concrete Performance Attenuation of Mix Nano-SiO2 and Nano-CaCO3 under High Temperature: A Comprehensive Review. Materials 2022, 15, 7073. [Google Scholar] [CrossRef]
  33. Ali, A.E.; Faried, A.S.; Osman, K.M. Effect of elevated temperature on properties of concrete containing different types of nano-materials. Constr. Build. Mater. 2024, 438, 136988. [Google Scholar] [CrossRef]
  34. Hassan, M.M.; Elyamany, M.A.; Khalil, A.E.-R.R.; Megahed, S.Y. Effect of High Elevated Temperature on the Behavior of Concrete Containing Slag and Nano Clay. Civ. Eng. Archit. 2025, 13, 2687–2702. [Google Scholar] [CrossRef]
  35. Wang, M.; Jiang, Y.; Liu, S.; Chen, Z.; Su, H. Experimental Study on Mechanical Properties of Nano-Alumina-Modified Cement Composites Exposed to High Temperatures. Processes 2023, 12, 94. [Google Scholar] [CrossRef]
  36. Mitchell, T.M. Machine Learning; McGraw-Hill: New York, NY, USA, 1997. [Google Scholar]
  37. Pereira, F.; Mitchell, T.; Botvinick, M. Machine learning classifiers and fMRI: A tutorial overview. Neuroimage 2009, 45, S199–S209. [Google Scholar] [CrossRef]
  38. Nazar, S.; Yang, J.; Ahmad, W.; Javed, M.F.; Alabduljabbar, H.; Deifalla, A.F. Development of the New Prediction Models for the Compressive Strength of Nanomodified Concrete Using Novel Machine Learning Techniques. Buildings 2022, 12, 2160. [Google Scholar] [CrossRef]
  39. Ali, R.; Muayad, M.; Mohammed, A.S.; Asteris, P.G. Analysis and prediction of the effect of Nanosilica on the compressive strength of concrete with different mix proportions and specimen sizes using various numerical approaches. Struct. Concr. 2023, 24, 4161–4184. [Google Scholar] [CrossRef]
  40. Nigam, M.; Verma, M. Prediction of compressive strength of nano-silica concrete by using random forest algorithm. Asian J. Civ. Eng. 2024, 25, 5205–5213. [Google Scholar] [CrossRef]
  41. Garg, A.; Aggarwal, P.; Aggarwal, Y.; Belarbi, M.O.; Chalak, H.D.; Tounsi, A.; Gulia, R. Machine learning models for predicting the compressive strength of concrete containing nano silica. Comput. Concr. 2022, 30, 33–42. [Google Scholar] [CrossRef]
  42. Murad, Y. Compressive strength prediction for concrete modified with nanomaterials. Case Stud. Constr. Mater. 2021, 15, e00660. [Google Scholar] [CrossRef]
  43. Zeyad, A.M.; Mahmoud, A.A.; El-Sayed, A.A.; Aboraya, A.M.; Fathy, I.N.; Zygouris, N.; Asteris, P.G.; Agwa, I.S. Compressive strength of nano concrete materials under elevated temperatures using machine learning. Sci. Rep. 2024, 14, 24246. [Google Scholar] [CrossRef]
  44. Alkharisi, M.K.; Dahish, H.A.; Youssf, O. Prediction models for the hybrid effect of nano materials on radiation shielding properties of concrete exposed to elevated temperatures. Case Stud. Constr. Mater. 2024, 21, e03750. [Google Scholar] [CrossRef]
  45. Das, P.; Kashem, A.; Hasan, I.; Islam, M. A comparative study of machine learning models for construction costs prediction with natural gradient boosting algorithm and SHAP analysis. Asian J. Civ. Eng. 2024, 25, 3301–3316. [Google Scholar] [CrossRef]
  46. BS 1881 P 116; Testing Concrete. Method for Determination of Compressive Strength of Concrete Cubes. BSI: London, UK, 1983.
  47. Khan, M.A.; Farooq, F.; Javed, M.F.; Zafar, A.; Ostrowski, K.A.; Aslam, F.; Malazdrewicz, S.; Maślak, M. Simulation of Depth of Wear of Eco-Friendly Concrete Using Machine Learning Based Computational Approaches. Materials 2021, 15, 58. [Google Scholar] [CrossRef] [PubMed]
  48. Anaconda Inc. Anaconda Individual Edition, Anaconda Website. 2024. Available online: https://www.anaconda.com/products/individual (accessed on 14 January 2025).
  49. Kutner, M.H.; Nachtsheim, C.; Neter, J.; Li, W. Applied Linear Statistical Models; McGraw-Hill Irwin: New York, NY, USA, 2005. [Google Scholar]
  50. Chen, T.; Guestrin, C. XGBoost. In Proceedings of the 22nd ACM SIGKDD International Conference on Knowledge Discovery and Data Mining; ACM: New York, NY, USA, 2016; pp. 785–794. [Google Scholar] [CrossRef]
  51. Wu, J.; Ma, D.; Wang, W. Leakage Identification in Water Distribution Networks Based on XGBoost Algorithm. J. Water Resour. Plan. Manag. 2022, 148. [Google Scholar] [CrossRef]
  52. Wang, T.; Bian, Y.; Zhang, Y.; Hou, X. Classification of earthquakes, explosions and mining-induced earthquakes based on XGBoost algorithm. Comput. Geosci. 2023, 170, 105242. [Google Scholar] [CrossRef]
  53. Ansari, S.S.; Ibrahim, S.M.; Hasan, S.D. Interpretable Machine-Learning Models to Predict the Flexural Strength of Fiber-Reinforced SCM-Blended Concrete Composites. J. Struct. Des. Constr. Pract. 2025, 30. [Google Scholar] [CrossRef]
  54. Quan Tran, V. Machine learning approach for investigating chloride diffusion coefficient of concrete containing supplementary cementitious materials. Constr. Build. Mater. 2022, 328, 127103. [Google Scholar] [CrossRef]
  55. Lundberg, S.M.; Lee, S.-I. A Unified Approach to Interpreting Model Predictions. In Proceedings of the 31st International Conference on Neural Information Processing Systems, Long Beach, CA, USA, 4–9 December 2017. [Google Scholar]
  56. Dahish, H.A. Predicting the Compressive Strength of Concrete Modified by Nanoparticles and Exposed to Fire. IOSR J. Mech. Civ. Eng. (IOSR-JMCE) 2022, 19, 37–50. [Google Scholar] [CrossRef]
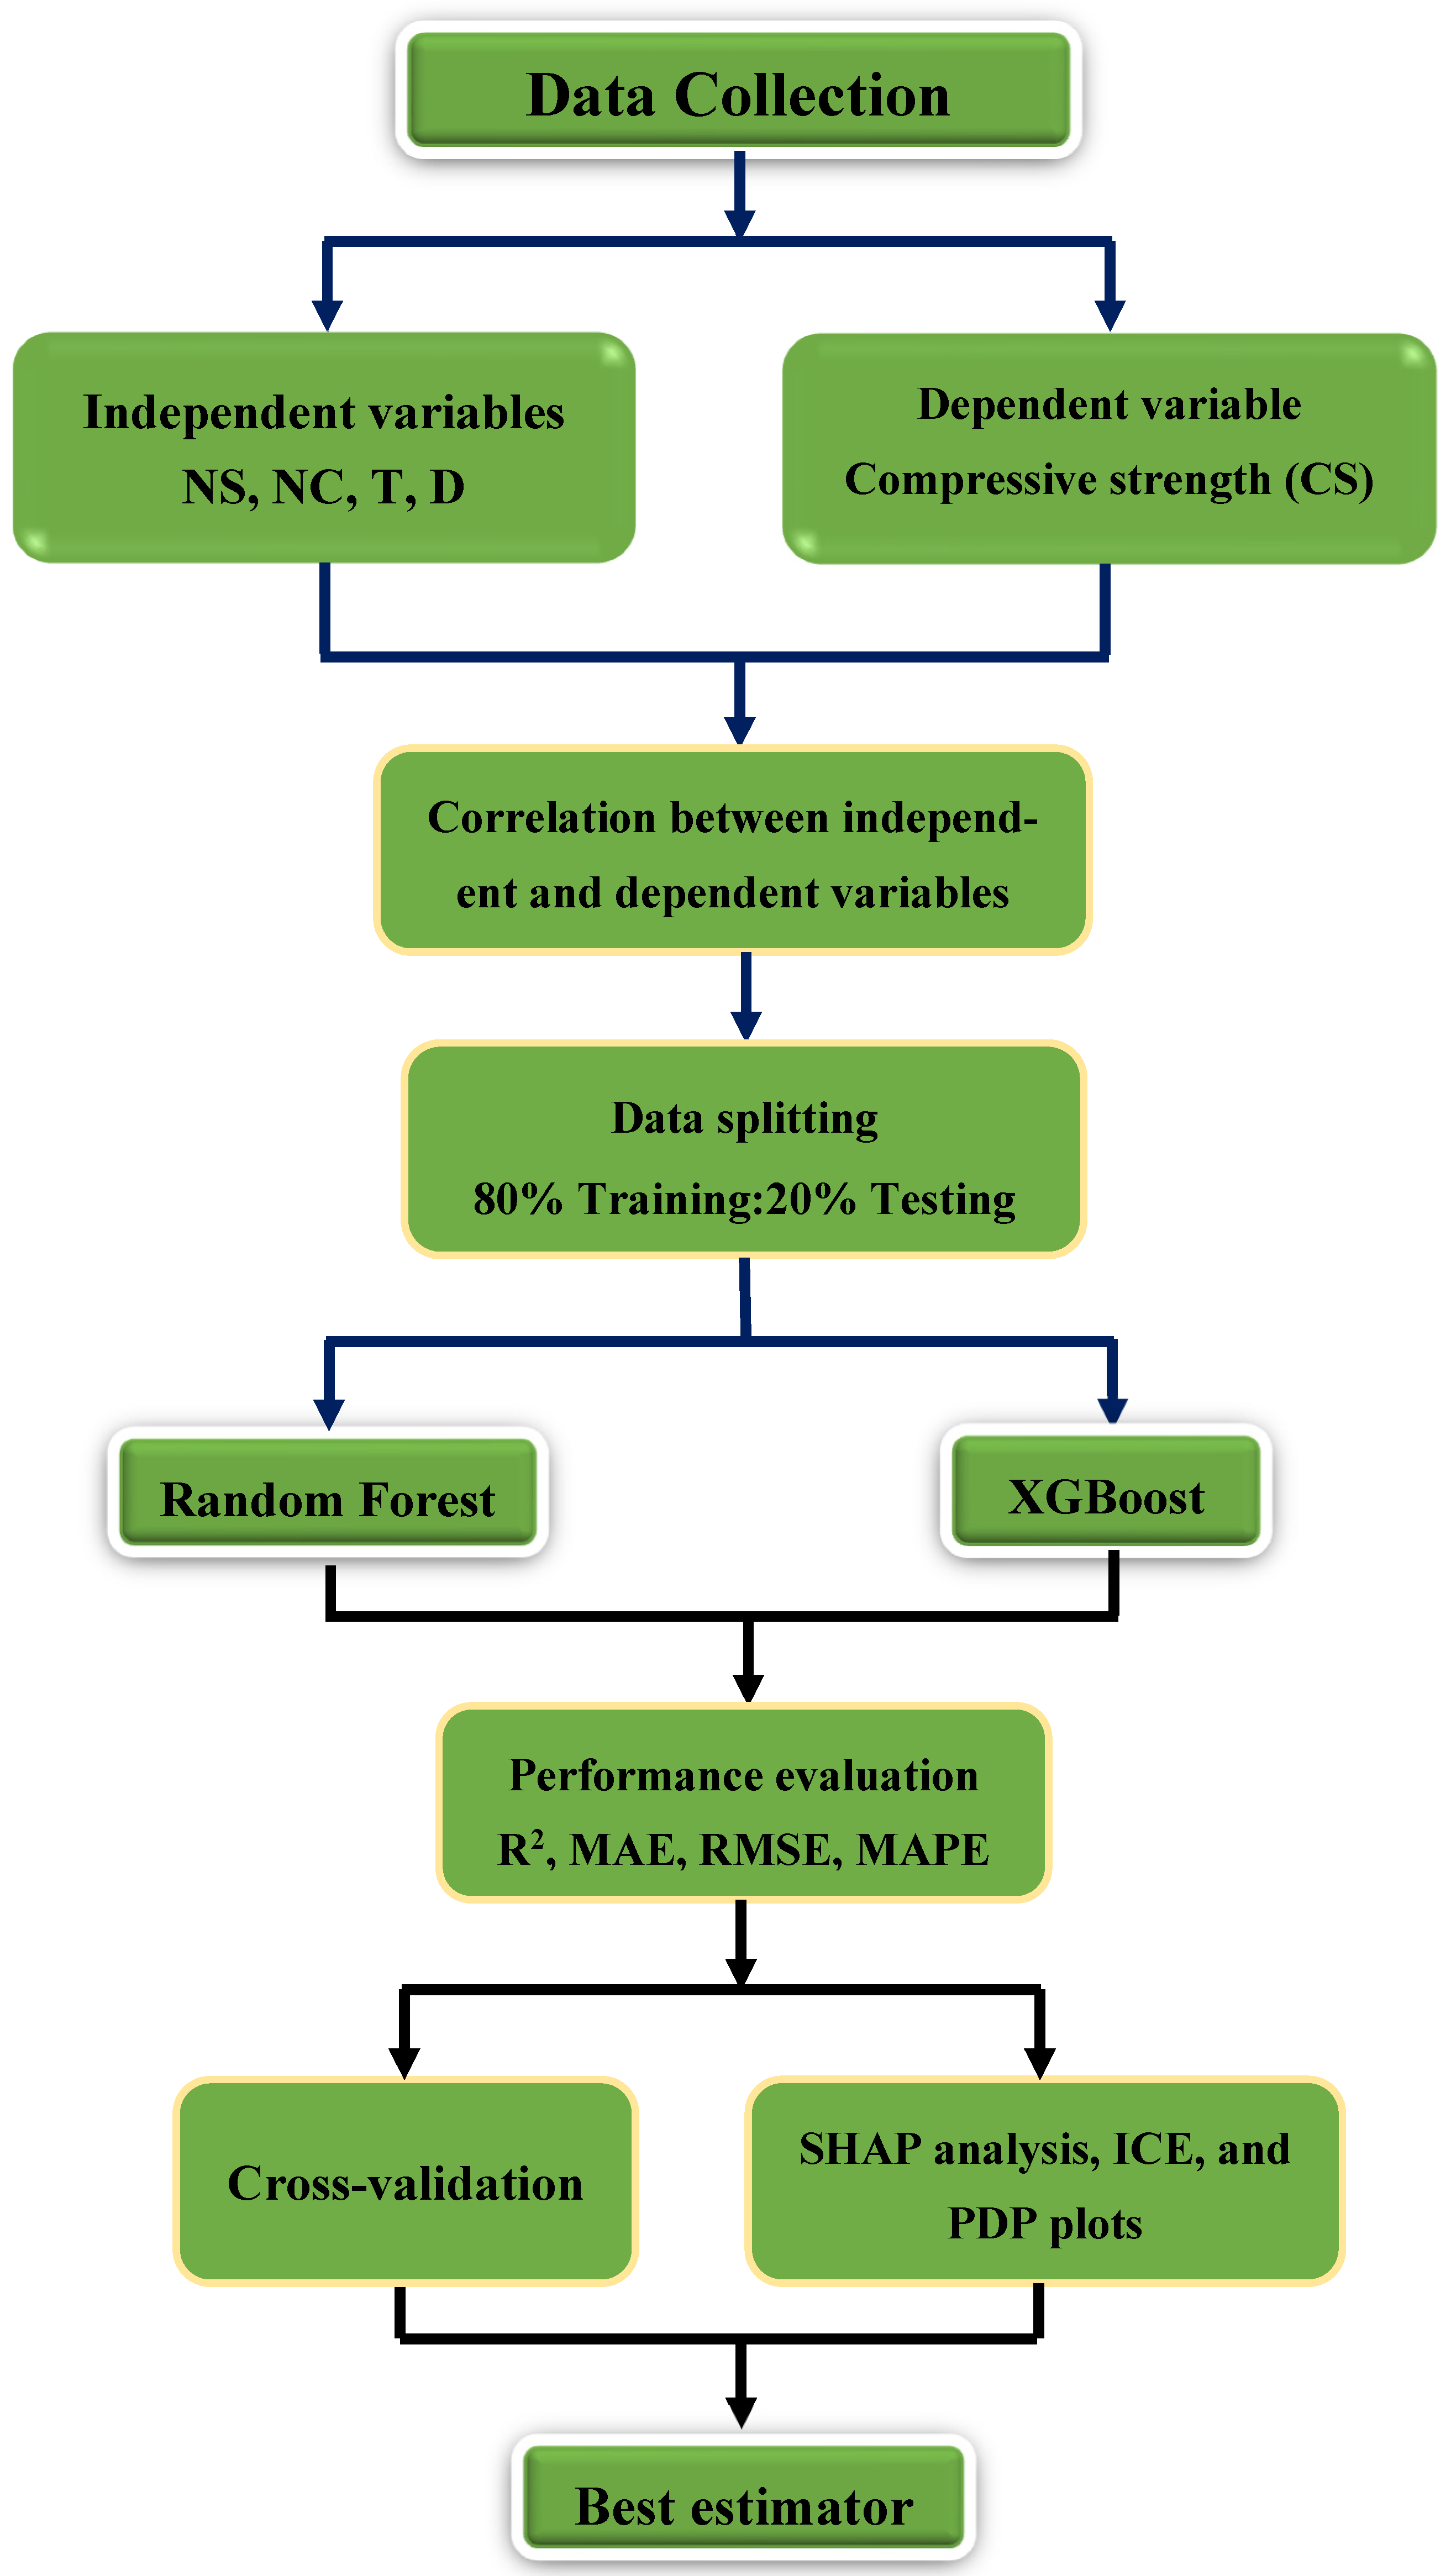
Figure 1. Methodology flowchart.
Buildings 15 03349 g001
Figure 2. Heatmap of R values.
Buildings 15 03349 g002
Figure 3. Input variables scatter plots.
Buildings 15 03349 g003
Figure 4. The structures of the ML algorithms: (a) XGB and (b) RF.
Buildings 15 03349 g004
Figure 5. Plots of regression of the developed XGB model: (a) training; (b) testing.
Buildings 15 03349 g005
Figure 6. Scatter plots of the RF model: (a) training; (b) testing.
Buildings 15 03349 g006
Figure 7. Plots of residual errors of the constructed models: (a) training; (b) testing.
Buildings 15 03349 g007
Figure 8. Values of statistical metrics.
Buildings 15 03349 g008
Figure 9. K-fold statistical metrics (training): (a) R2; (b) MAPE; (c) RMSE; (d) MAE.
Buildings 15 03349 g009
Figure 10. K-fold statistical metrics (testing): (a) R2; (b) MAPE; (c) RMSE; (d) MAE.
Buildings 15 03349 g010
Figure 11. Importance of features.
Buildings 15 03349 g011
Figure 12. SHAP plots: (a) XGB and (b) RF.
Buildings 15 03349 g012
Figure 13. ICE for input parameters.
Buildings 15 03349 g013
Figure 14. PDP for input parameters.
Buildings 15 03349 g014
Figure 15. 2D-PDP for input parameters.
Buildings 15 03349 g015
Figure 16. Comparison with earlier CS models (a) R2; (b) MAE; (c) RMSE.
Buildings 15 03349 g016
Table 1. Chemical composition of powders [2].
FormulaConcentration (%)
CementNCNS
SiO220.2251.5299.85
Fe2O33.31.230.01
Al2O36.0540.180.02
CaO62.7520.03
K2O0.850.530.01
MgO1.80.120.01
Na2O0.790.080.01
SO32.25----
TiO20.22.27--
LOI1.772.010.04
Table 2. Statistics of the test data used.
ParametersUnitMin.Max.MeanSDSkewnessKurtosis
Nano-silica dose (NS)%wt. of cement0.004.001.0001.2591.1760.264
Nano-clay dose (NC)%wt. of cement0.009.002.8462.8930.645−0.649
Temperature (T)°C25.0800494.2233.6−0.485−0.767
Duration (D)hour0.002.001.3850.627−0.508−0.629
Compressive strength (CS)MPa15.647.035.228.853−0.636−0.901
Table 3. Features of VIF values.
FeatureNSNCTD
VIF1.41481.41481.16061.1606
Table 4. Optimized hyperparameters.
ML ApproachHyperparameterRangeOptimized Value
XGBn_estimators[10, 600]91
max_depth[10, 30]18
learning_rate[0.01, 0.3]0.1
Subsample[0.1, 1.0]0.4
RFn_estimators[10, 200]89
max_depth[10, 30]12
min_samples_split[2, 20]2
′min_samples_leaf[1, 10]1
Disclaimer/Publisher’s Note: The statements, opinions and data contained in all publications are solely those of the individual author(s) and contributor(s) and not of MDPI and/or the editor(s). MDPI and/or the editor(s) disclaim responsibility for any injury to people or property resulting from any ideas, methods, instructions or products referred to in the content.