Article

A Study on the Early-Stage Mechanical Properties and Uniaxial Compression Constitutive Model of Coral Concrete with Polyoxymethylene Fiber

1
School of Civil Engineering, Chongqing Industry Polytechnic University, Chongqing 401120, China
2
School of Civil Engineering, Chongqing University, Chongqing 400045, China
3
Key Laboratory of New Technology for Construction of Cities in Mountain Area, Ministry of Education, Chongqing University, Chongqing 400045, China
*
Author to whom correspondence should be addressed.
Buildings 2025, 15(18), 3344; https://doi.org/10.3390/buildings15183344
Submission received: 18 July 2025 / Revised: 21 August 2025 / Accepted: 12 September 2025 / Published: 15 September 2025
(This article belongs to the Special Issue Research on the Crack Control of Concrete)

Abstract

To investigate the regulatory mechanism of polyoxymethylene (POM) fiber on the workability and mechanical properties of C30-grade coral aggregate concrete (CAC), this study designed six groups of CAC specimens with varying POM fiber volume fractions (0%, 0.2%, 0.4%, 0.6%, 0.8%, and 1.0%). Cube compressive test, axial compressive test, split tensile test, and flexural tests of CAC specimens after 28 days of curing were conducted, while observing their failure modes under ultimate load and stress–strain curves. The experimental results indicate that POM fiber incorporation significantly reduced the slump and slump flow of the CAC mixtures. The cube compressive strength, axial compressive strength, split tensile strength, and flexural strength of CAC initially increased and then decreased with increasing POM fiber volume fraction, peaking at 0.6% fiber content. Compared to the fiber-free group, these properties improved by 14.78%, 15.50%, 17.01%, 46.13%, and 3.69%, respectively. Analysis of failure modes under ultimate load revealed that POM fibers effectively reduced crack quantity and main crack width, producing a favorable bridging effect that promoted a transition from brittle fracture to ductile failure. However, when fiber volume fraction exceeded 0.8%, fiber agglomeration led to diminished mechanical performance. Based on experimental data, the constitutive relationship established using the Carreira and Chu model achieved a goodness-of-fit exceeding 0.99 for CAC stress–strain curves, effectively predicting mechanical behavior and providing theoretical support for marine engineering applications of coral aggregate concrete. This study provides a theoretical basis for exploiting coral aggregates as low-carbon resources, promoting CAC application in marine engineering, and leveraging POM fibers’ reinforcement of CAC to reduce reliance on high-carbon cement. Combined with coral aggregates’ local availability (cutting transportation emissions), it offers a technical pathway for marine engineering material preparation.

1. Introduction

With the rapid development of economies and the continuous advancement of infrastructure construction, the demand for building materials continues to rise. Natural aggregates are increasingly depleted in production, leading to resource exhaustion and severe ecological damage. Their extraction and transportation processes also involve substantial energy consumption and carbon emissions. Thus, exploring low-carbon, eco-friendly alternatives to concrete aggregates is essential [1,2,3]. Recent in-depth studies on coral aggregates, including those by Wang et al. [4] and Sun et al. [5,6], confirm they can be used as concrete aggregates after proper treatment.
Using coral aggregates to replace coarse aggregates in concrete construction has low-carbon and ecological value. It can not only effectively reduce environmental impact, decrease carbon emissions from land sand and gravel mining and transportation, but also significantly reduce project costs and improve the efficiency of coastal engineering projects [7,8]. Due to maritime transportation, the emission of 0.0089 kg of carbon dioxide and the consumption of 0.13 MJ of non-renewable energy are generated for each ton of materials transported for one kilometer. Using local coral waste can avoid the huge energy consumption and carbon dioxide emissions caused by transporting raw materials from the mainland [9]. However, the practical implementation of coral aggregates remains constrained by inherent material limitations such as low compressive strength, porous structure, irregular surface morphology, and higher apparent and bulk densities compared to conventional aggregates. These material properties collectively contribute to operational challenges including heightened water demand during mixing, compromised workability, and difficulties in achieving proper compaction and formwork stability during concrete placement, ultimately affecting the quality and durability of coral-based concrete structures [10,11,12,13]. Driven by the low-carbon and environmentally friendly advantages brought by coral aggregates, scholars have conducted research on the modification and enhancement of coral concrete to make up for the shortcomings of coral aggregates. The incorporation of fiber materials has been shown to enhance concrete’s crack resistance, tensile strength, and ductility by bridging microcracks and optimizing internal stress distribution [14]. Advances in polymer-based synthetic fiber technology have facilitated the development of high-performance synthetic fibers, providing an effective pathway to improve the mechanical properties of coral aggregate concrete (CAC). Furthermore, experimental studies have demonstrated that synthetic fibers significantly enhance the flexural strength, tensile resistance, and crack inhibition capacity of concrete [15,16]. For example, modified polypropylene fibers can enhance the interfacial bonding performance, fiber pull-out resistance, and fracture toughness of ultra-high performance concrete (UHPC), which in turn reduces the dependence on high cement content and lowers carbon emissions [17]. Polyethylene fibers, by contrast, can improve the interlayer adhesion, impact toughness, and compressive strength of 3D-printed cement-based composites [18], as well as the mechanical properties of fly ash/slag-based geopolymer concrete. Since geopolymers themselves possess low-carbon characteristics, their combination with fibers can further reduce the carbon footprint of the material [19].
Polyoxymethylene (POM) fiber, a novel synthetic polymeric material, exhibits exceptional mechanical properties, long-term durability, and outstanding resistance to chemical corrosion, particularly in alkaline environments and seawater immersion. Remarkably, it maintains homogeneous dispersion stability at high dosages without agglomeration, attributed to its low surface energy and high crystallinity. These synergistic properties have enabled its widespread adoption in marine engineering, fisheries, equipment manufacturing, and precision instrumentation [20].
In the field of concrete performance enhancement, Zhang et al. [21] incorporated POM fibers with varying lengths and volume fractions into notched beams and concrete cubic specimens, conducting three-point bending and splitting tensile tests. The experimental results demonstrated that the increase in fiber length and content effectively enhanced the crack resistance, tensile strength, and fracture toughness of the concrete material. Hua et al. investigated the influence of POM fibers on the bond performance between bimetallic steel bars and seawater sea-sand concrete (SWSSC) through laboratory bond tests. The experimental results revealed that the SWSSC specimens incorporating POM fibers exhibited intact stainless-steel cladding on the bimetallic bars post testing, without cracks, fracture zones, or evidence of galvanic corrosion [22]. Wang et al. [23] systematically documented the apparent morphology and mass loss of POM fiber-reinforced seawater sea-sand concrete (SWSSC) subjected to thermal cycling (heating–cooling processes), and evaluated its compressive and tensile properties. The experimental results demonstrated that SWSSC incorporating POM fibers exhibited enhanced cube compressive strength and splitting tensile strength after exposure to 400 °C, compared to unmodified specimens. Yan et al. [24] investigated the fracture behavior of airport pavement concrete with varying fiber contents. The results demonstrated that increasing fiber content enhanced crack resistance, with fracture toughness increasing by approximately 50% and crack propagation being effectively suppressed when the fiber concentration exceeded 1.1%. Xue et al. [25] studied the effects of POM fibers on the workability, early cracking behavior, and mechanical properties of SWSSC. The results showed that as the fiber volume fraction increased, the workability of SWSSC decreased accordingly. POM fibers significantly improved the early crack resistance of SWSSC. When the POM fiber volume fraction was 0.6%, the cubic compressive strength of SWSSC reached its highest value. When the POM fiber volume fraction was less than 0.6, the axial compressive strength of SWSSC initially increased and then decreased, while it increased when the fiber volume fraction exceeded 0.6. At a volume fraction of 0.6, the splitting tensile strength and flexural strength of SWSSC were also the highest. The above studies found that the length and dosage of POM fibers have certain impacts on the mechanical properties and ductility of concrete, which aligns with conclusions from other researchers [20,26,27,28]. The current research on fiber concrete mainly focuses on steel/polypropylene fibers combined with ordinary aggregate systems. However, research on the mechanisms by which POM fibers influence the mechanical properties of CAC remains limited. Specifically, studies on the deformation characteristics and reinforcement mechanisms of POM fibers in CAC under various external dosages are scarce. Therefore, in this study, through a 0–1% volume dosage gradient experiment, the strengthening mechanism of POM fibers in coral aggregate concrete (CAC) was systematically revealed, providing important data support for the research on the mechanism of POM fibers affecting the mechanical properties of CAC.
To investigate the early mechanical properties of POM fiber-reinforced CAC specimens, this study designed CAC specimens with gradient POM fiber volume fractions (0%, 0.2%, 0.4%, 0.6%, 0.8%, 1.0%) to systematically evaluate the workability of CAC mixtures and the evolution of their early mechanical behaviors. In accordance with the GB/T 50081-2019 standard [29] for test methods of concrete physical and mechanical properties, tests were conducted on cubic compressive strength, axial compressive strength, splitting tensile strength, and flexural strength. By analyzing the failure modes of the specimens under ultimate load, the synergistic mechanism at the fiber-matrix interface was elucidated. Based on experimental data and theoretical analysis, the optimal range of fiber content was determined. The deformation characteristics of CAC specimens were analyzed using stress–strain curves under different POM fiber contents, and a constitutive model for POM fiber-reinforced CAC was established. As the capacity for marine resource development continues to improve, this provides a theoretical basis for the design and application of CAC in offshore artificial islands, breakwaters, reef ports, and coastal infrastructure projects, and promotes the utilization of coral aggregate as a low-carbon resource. It is conducive to achieving the sustainable development of marine resources and the environment.

2. Property of Material

2.1. Raw Materials

The coral aggregates used in this study were sourced from the South China Sea. The coral debris waste was generated during the construction of marine projects such as ports, docks, and breakwaters. As shown in Figure 1a, the coarse aggregate in the concrete consisted of coral aggregates with a continuous particle size range of 5–16 mm. The mass proportions of particles with diameters between 4.75 and 9.5 mm and 9.5–16 mm were 50% and 50%, respectively. The physical parameters are provided in Table 1.
The POM fibers used in this study were manufactured by Yunnan Yuntianhua Co., Ltd. (Shuifu City, China). The morphological characteristics of the fibers are illustrated in Figure 1b, with their physical parameters summarized in Table 2. The POM fibers exhibit a diameter of 0.2 mm and a controlled length of 12 mm.
In the CAC specimens, fine aggregates consisted of river sand, with Portland cement Type P·O 42.5 serving as the binder. Freshwater was used as mixing water, and a polycarboxylate superplasticizer (PCE) with a water reduction rate of 35% was incorporated, complying with the requirements of GB 8076-2008 [32] concrete admixtures.

2.2. Mix Proportion and Specimen Preparation

The mixing process for CAC preparation was conducted in accordance with the JGJ/T 12-2019 [33] technical standard for the application of lightweight aggregate concrete. We weighed the coarse aggregate, fine aggregate, and cement according to the mixing ratio, poured them into the mixer, set the speed at 50 rpm, and carried out dry mixing for 1 min. Then, we added water and water reducer to the mixer and mixed for another 1 min. Finally, we evenly sprinkled POM fibers into the concrete mixture and continued to mix for 2 min. This operation ensured the uniform distribution of POM fibers in the concrete. The detailed experimental design and mass proportions of constituent materials are presented in Table 3, where NF denotes plain CAC without POM fibers and serves as the control group. Six fiber volume fractions (ρ) were investigated: 0%, 0.2%, 0.4%, 0.6%, 0.8%, and 1.0%, with corresponding specimen designations NF, FC0.2, FC0.4, FC0.6, FC0.8, and FC1.0.

3. Workability

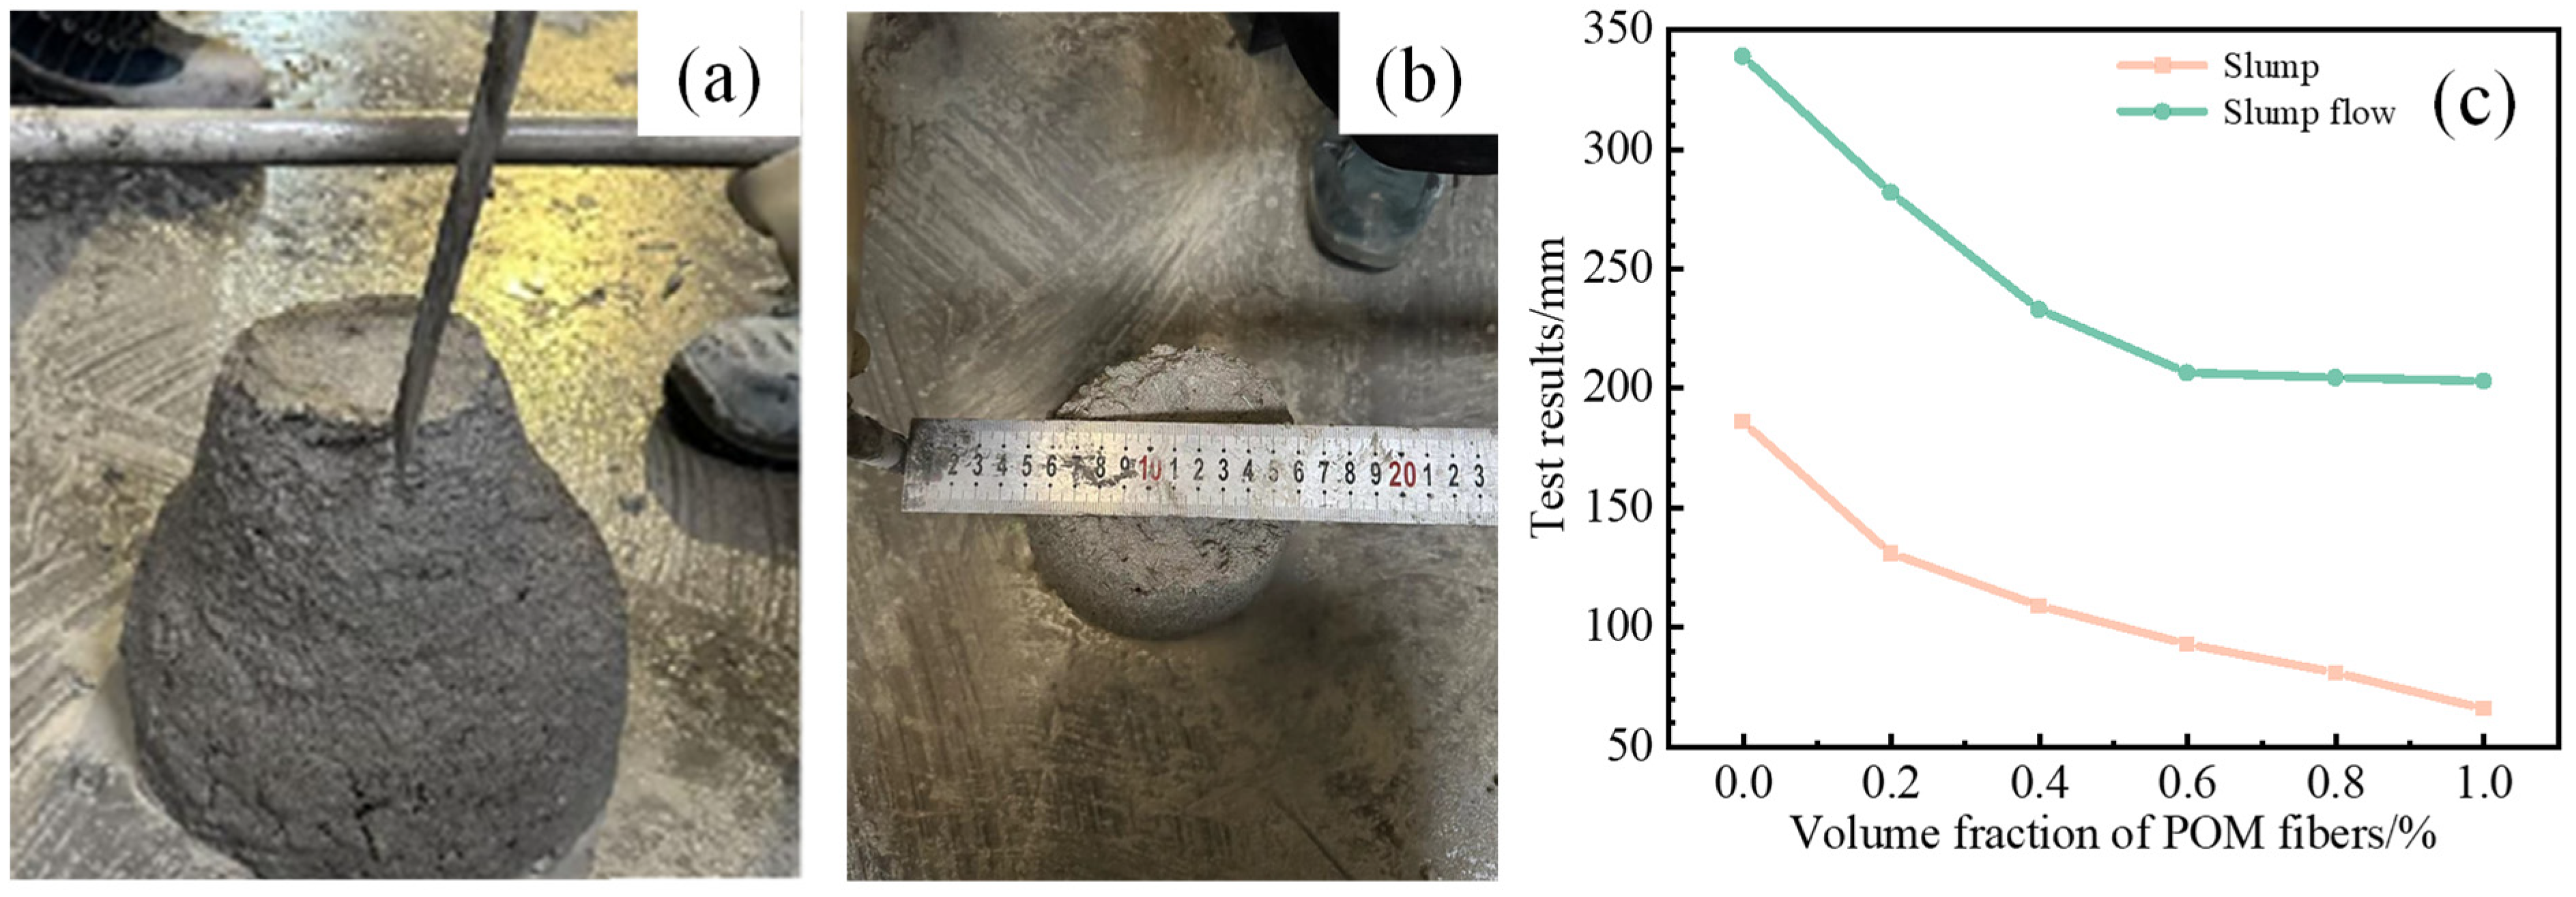
As shown in Figure 2a,b, the slump and slump flow of concrete specimens were measured using a standard slump cone, following the test methods specified in the GB/T 50080-2016 standard [34] for test methods of performance of ordinary concrete mixtures. The slump flow test was performed twice, with the average value adopted as the result. The measured slump and slump flow values are presented in Figure 2c.
From Figure 2c, it is evident that both slump and slump flow decrease with increasing POM fiber volume fraction in CAC. Compared to the control group (NF), the CAC specimen FC-1.0 exhibited reductions of 120 mm in slump and 136 mm in slump flow. Due to the addition of fibers, the fluidity of the mixture decreased significantly. Therefore, during engineering applications, the mix ratio needs to be adjusted according to actual requirements, such as using shorter and finer fibers to reduce the demand for the encapsulated slurry and adding silica fume and fly ash to reduce the friction at the fiber–slurry interface.

4. Mechanical Properties

4.1. Mechanical Test Methods and Test Results

According to the GB/T 50081-2019 standard for test methods of physical and mechanical concrete properties, CAC specimens with varying POM fiber volumes were prepared. After the specimens were cured in a standard curing room at 20 ± 2 °C and 95% relative humidity for 28 days, cube compressive strength, axial compressive strength, splitting tensile strength, and flexural strength tests were conducted. As shown in Figure 3a, the tests were performed using an SHT-series computer-controlled electro-hydraulic servo universal testing machine. The experimental procedures for these four strength tests are illustrated in Figure 3b to Figure 3e, respectively. Table 4 summarizes the specimen dimensions and strength calculation formulas for cube compressive strength, axial compressive strength, splitting tensile strength, and flexural strength. Each group consists of three specimens, making a total of 72 specimens. The tests were repeated three times, and the results were taken as the average of the three specimens. The cube compressive strength, splitting tensile strength, flexural strength, and axial compressive strength of CAC specimens with varying POM fiber volume fractions were experimentally evaluated, and the results are summarized in Table 5.

4.2. Descriptive Statistics Analysis of the Mechanical Test Results

The mechanical test results were subsequently analyzed by calculating statistical parameters including standard deviation (SD), coefficient of variation (CV), and 95% confidence intervals to quantify data variability (95% CI).
As shown in Table 5 and Table 6, the cube compressive strength of CAC ranges from 34.5 MPa to 39.6 MPa, with standard deviations fluctuating between 0.54 and 1.14. The corresponding coefficients of variation (CV) values fall within 0.0087–0.0311, indicating low data dispersion. The splitting tensile strength of CAC ranges from 1.81 MPa to 2.40 MPa, with standard deviations varying between 0.09 and 0.14, corresponding to CV values of 0.0429–0.0621, demonstrating low variability. The flexural strength of CAC ranges from 2.81 MPa to 4.71 MPa, with SD varying between 0.08 and 0.37, corresponding to CV values of 0.0197–0.0577, demonstrating low variability. The maximum mean flexural strength of CAC reaches 4.34 MPa at a POM fiber volume fraction of 0.6, with a 95% confidence interval of 3.87–4.80 MPa. The axial compressive strength of CAC varies between 30.38 MPa and 37.26 MPa. The standard deviations vary between 0.51 and 1.17, corresponding to CV values of 0.0168–0.0338, indicating low data variability.
Based on the statistical results in Table 6, all mechanical properties of CAC specimens exhibit low variability. The CV for all measured properties is less than 0.07, and the absolute values of the SD are small with gentle fluctuations. This indicates that the test data have high repeatability and stability and are less affected by random errors. Among them, the flexural strength reaches the maximum value when the POM fiber volume fraction is 0.6, and the 95% confidence interval is reasonable, providing a reliable statistical basis for optimizing the mechanical properties of the material.

4.3. Inferential Statistics of the Mechanical Test Results

To improve the scientific rigor of this study and verify whether the differences in mechanical properties under different POM fiber contents are statistically significant, inferential statistical analyses were performed on the experimental results of axial compressive strength, cube compressive strength, splitting tensile strength, and flexural strength. Both one-way analysis of variance (ANOVA) and Tukey HSD tests, two widely used statistical methods, were conducted.
The general ANOVA model is expressed as Equation (1):
Y i j = μ + α i + ϵ i j
The F-value is computed as Equation (2):
F = M S b e t w e e n M S w i t h i n = S S b e t w e e n / d f b e t w e e n S S w i t h i n   / d f w i t h i n
where Y i j is the observed value, μ is the overall mean, α i is the effect of the i-th group, and ϵ i j is the residual error, M S b e t w e e n is the mean square between groups, and M S w i t h i n is the mean square within groups.
The ANOVA results are shown in Table 7. For the four strength parameters, the p value of f t s was greater than 0.05, which is denoted by ‘×’ in the table, indicating no statistically significant differences among the splitting tensile strengths of CAC specimens with different POM fiber contents. In contrast, the p values of f c u , f f and f c p were less than 0.05, which is denoted by ‘√’ in the table, confirming the presence of statistically significant differences in cube compressive strength, flexural strength, and axial compressive strength among the specimens.
The p-value is less than 0.05 in the ANOVA test, so it is necessary to conduct a Tukey HSD test as a post hoc analysis. This ensures a more detailed understanding of the pairwise differences and provides stronger support for the interpretation of experimental results.
For post hoc comparisons, Tukey’s HSD was applied, as shown in Equation (3):
H S D = q α M S w i t h i n n
where q α is the studentized range statistic, and n is the sample size per group.
The Tukey HSD test results for the significant mechanical properties are presented in Table 8. The critical HSD values were calculated using Equation (3), with the studentized range statistic q0.05= 4.75 for α = 0.05, k = 6 groups, and df = 12.
The detailed pairwise comparison results show consistent patterns across the three significant mechanical properties. For cube compressive strength ( f c u ), the control group (NF) exhibited statistically significant differences when compared with fiber volume fractions of 0.4%, 0.6%, and 0.8%. Similarly, the FC-0.2 group showed significant differences compared to the FC-0.6 group. The mean differences ranged from 2.97 MPa to 5.08 MPa, all exceeding the HSD critical value of 2.9633 MPa.
For flexural strength ( f f ), the same pattern emerged with the NF group showing significant differences relative to FC-0.4, FC-0.6, and FC-0.8 groups, and FC-0.2 versus FC-0.6 comparison also being significant. The mean differences ranged from 0.91 MPa to 1.37 MPa, surpassing the HSD critical value of 0.8329 MPa. Regarding axial compressive strength ( f c p ), identical pairwise significant differences were observed. The mean differences varied from 2.79 MPa to 4.83 MPa, all exceeding the critical HSD value of 2.7593 MPa. The experimental results reveal that the FC-0.6 group (0.6% POM fiber volume fraction) achieved optimal performance across multiple mechanical properties. Compared to the control group (NF), significant improvements were observed as follows: cube compressive strength rose by 14.7% (34.49–39.57 MPa), flexural strength by 46.1% (2.97–4.34 MPa), and axial compressive strength by 15.5% (31.15–35.98 MPa).
The FC-0.4 and FC-0.8 groups also demonstrated significant improvements compared to the control group, indicating an effective fiber volume fraction range of 0.4% to 0.6%. However, the FC-1.0 group showed performance degradation compared to FC-0.6, suggesting that excessive fiber content may lead to diminished mechanical properties due to potential fiber agglomeration or matrix disruption.
The inferential statistical analysis confirms the reliability of the experimental findings. The low coefficient of variation values (<0.07) combined with the significant ANOVA results (p < 0.01 for three out of four properties) provide strong evidence for the effectiveness of POM fiber reinforcement in enhancing CAC mechanical properties. The splitting tensile strength, while showing numerical improvements, did not reach statistical significance (p = 0.095), indicating that POM fiber addition has limited impact on this particular mechanical property.
The comprehensive statistical analysis demonstrates that POM fiber incorporation significantly enhances the cube compressive strength, flexural strength, and axial compressive strength of CAC specimens, with the optimal fiber volume fraction identified as 0.6%. The Tukey HSD post hoc analysis provides clear evidence of significant performance differences between the control group and fiber-reinforced specimens, particularly at higher fiber volume fractions (0.4% to 0.8%). These findings provide a solid statistical foundation for optimizing POM fiber content in CAC formulations for enhanced mechanical performance.

5. Mechanical Test Results

5.1. Cube Compressive Property

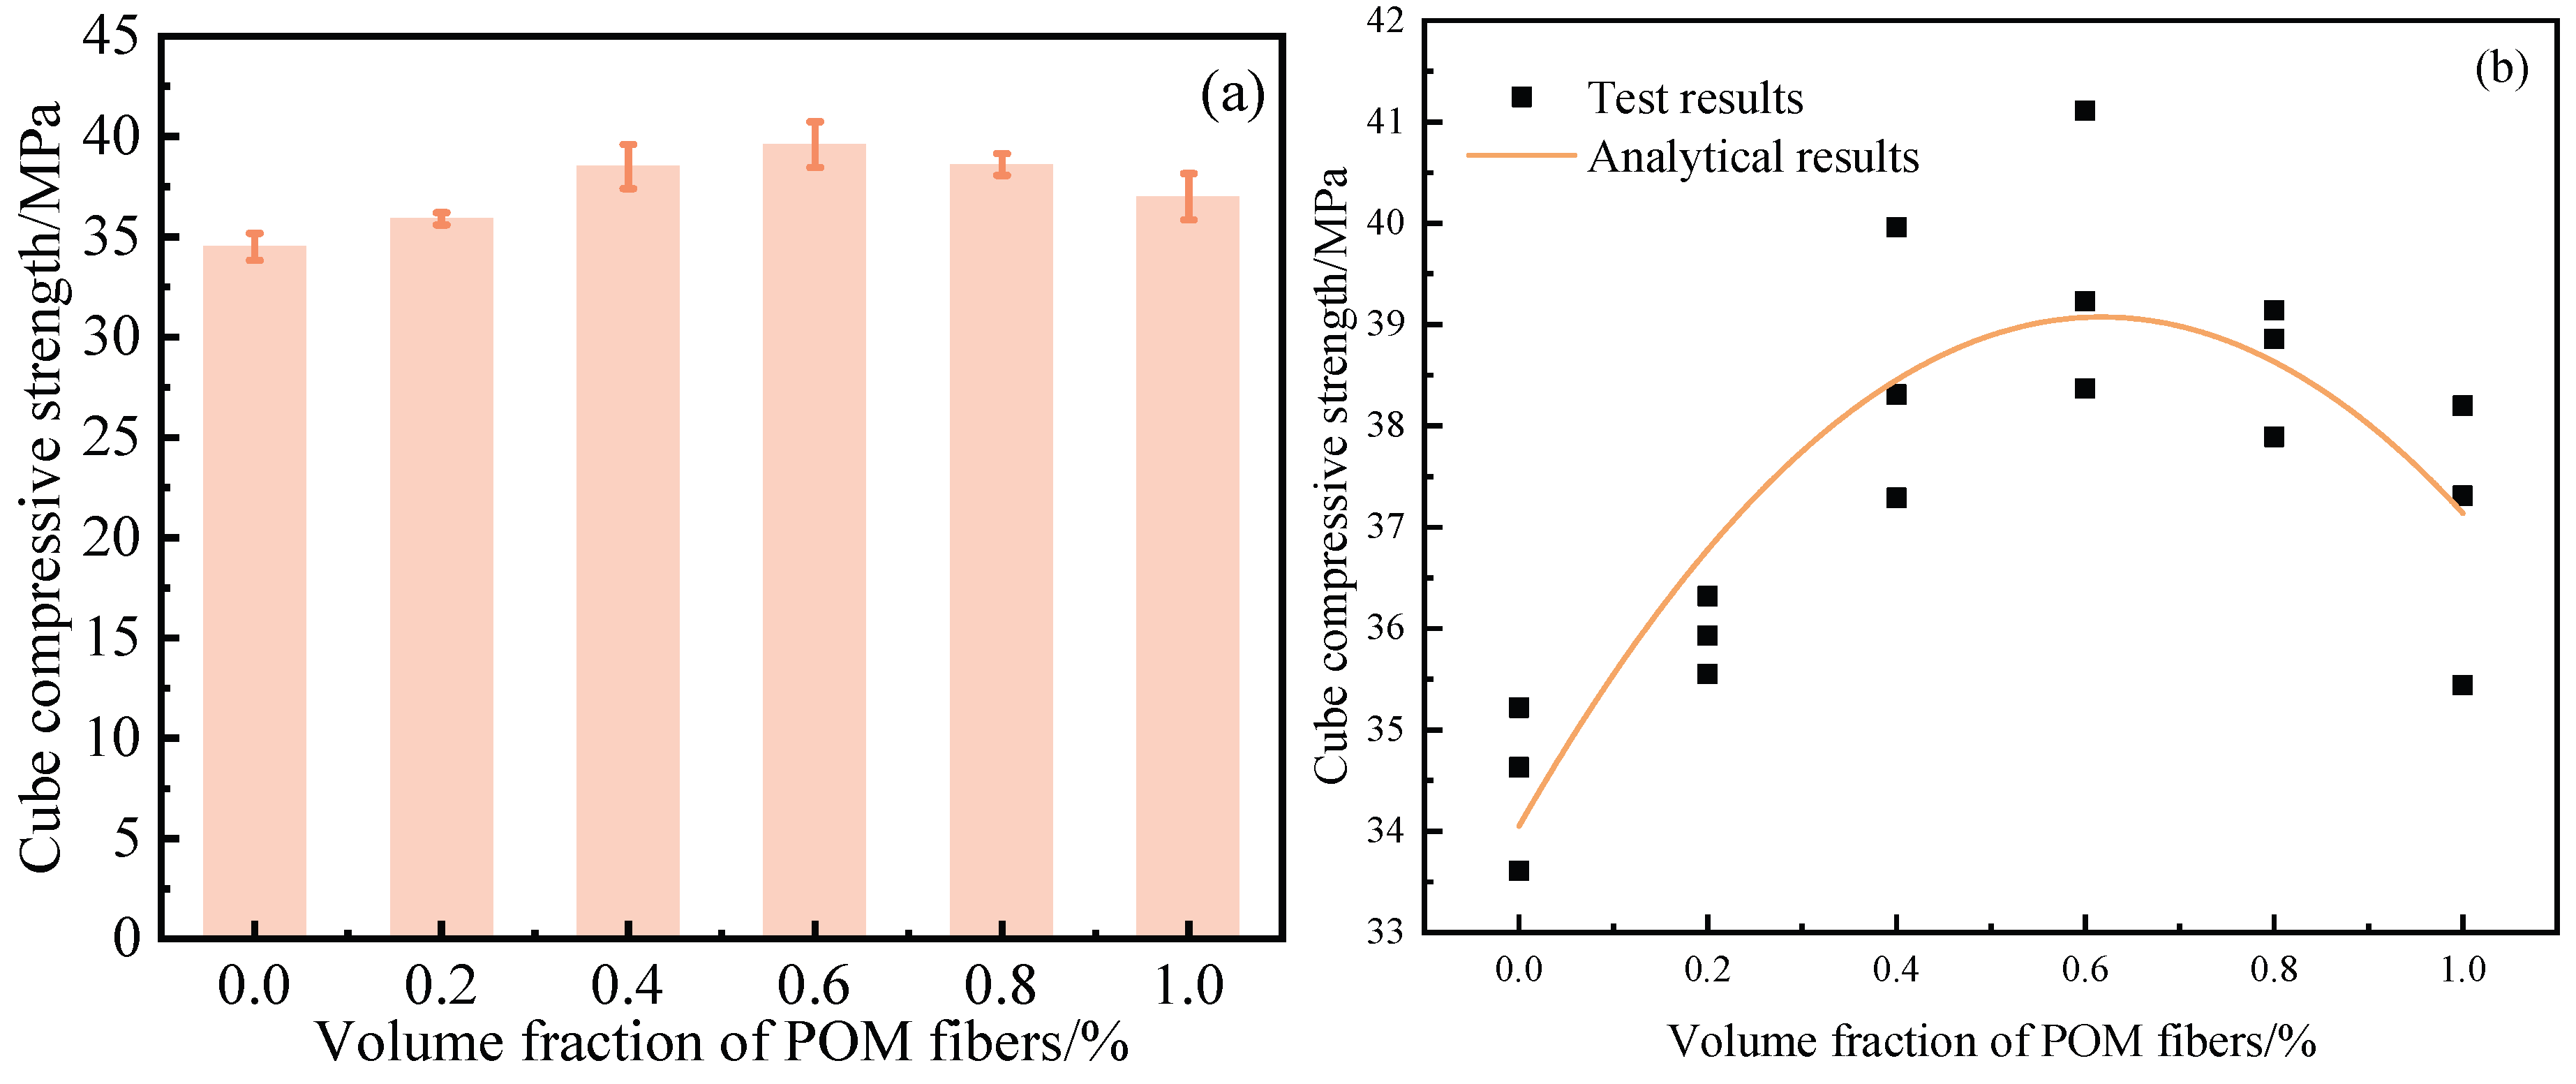
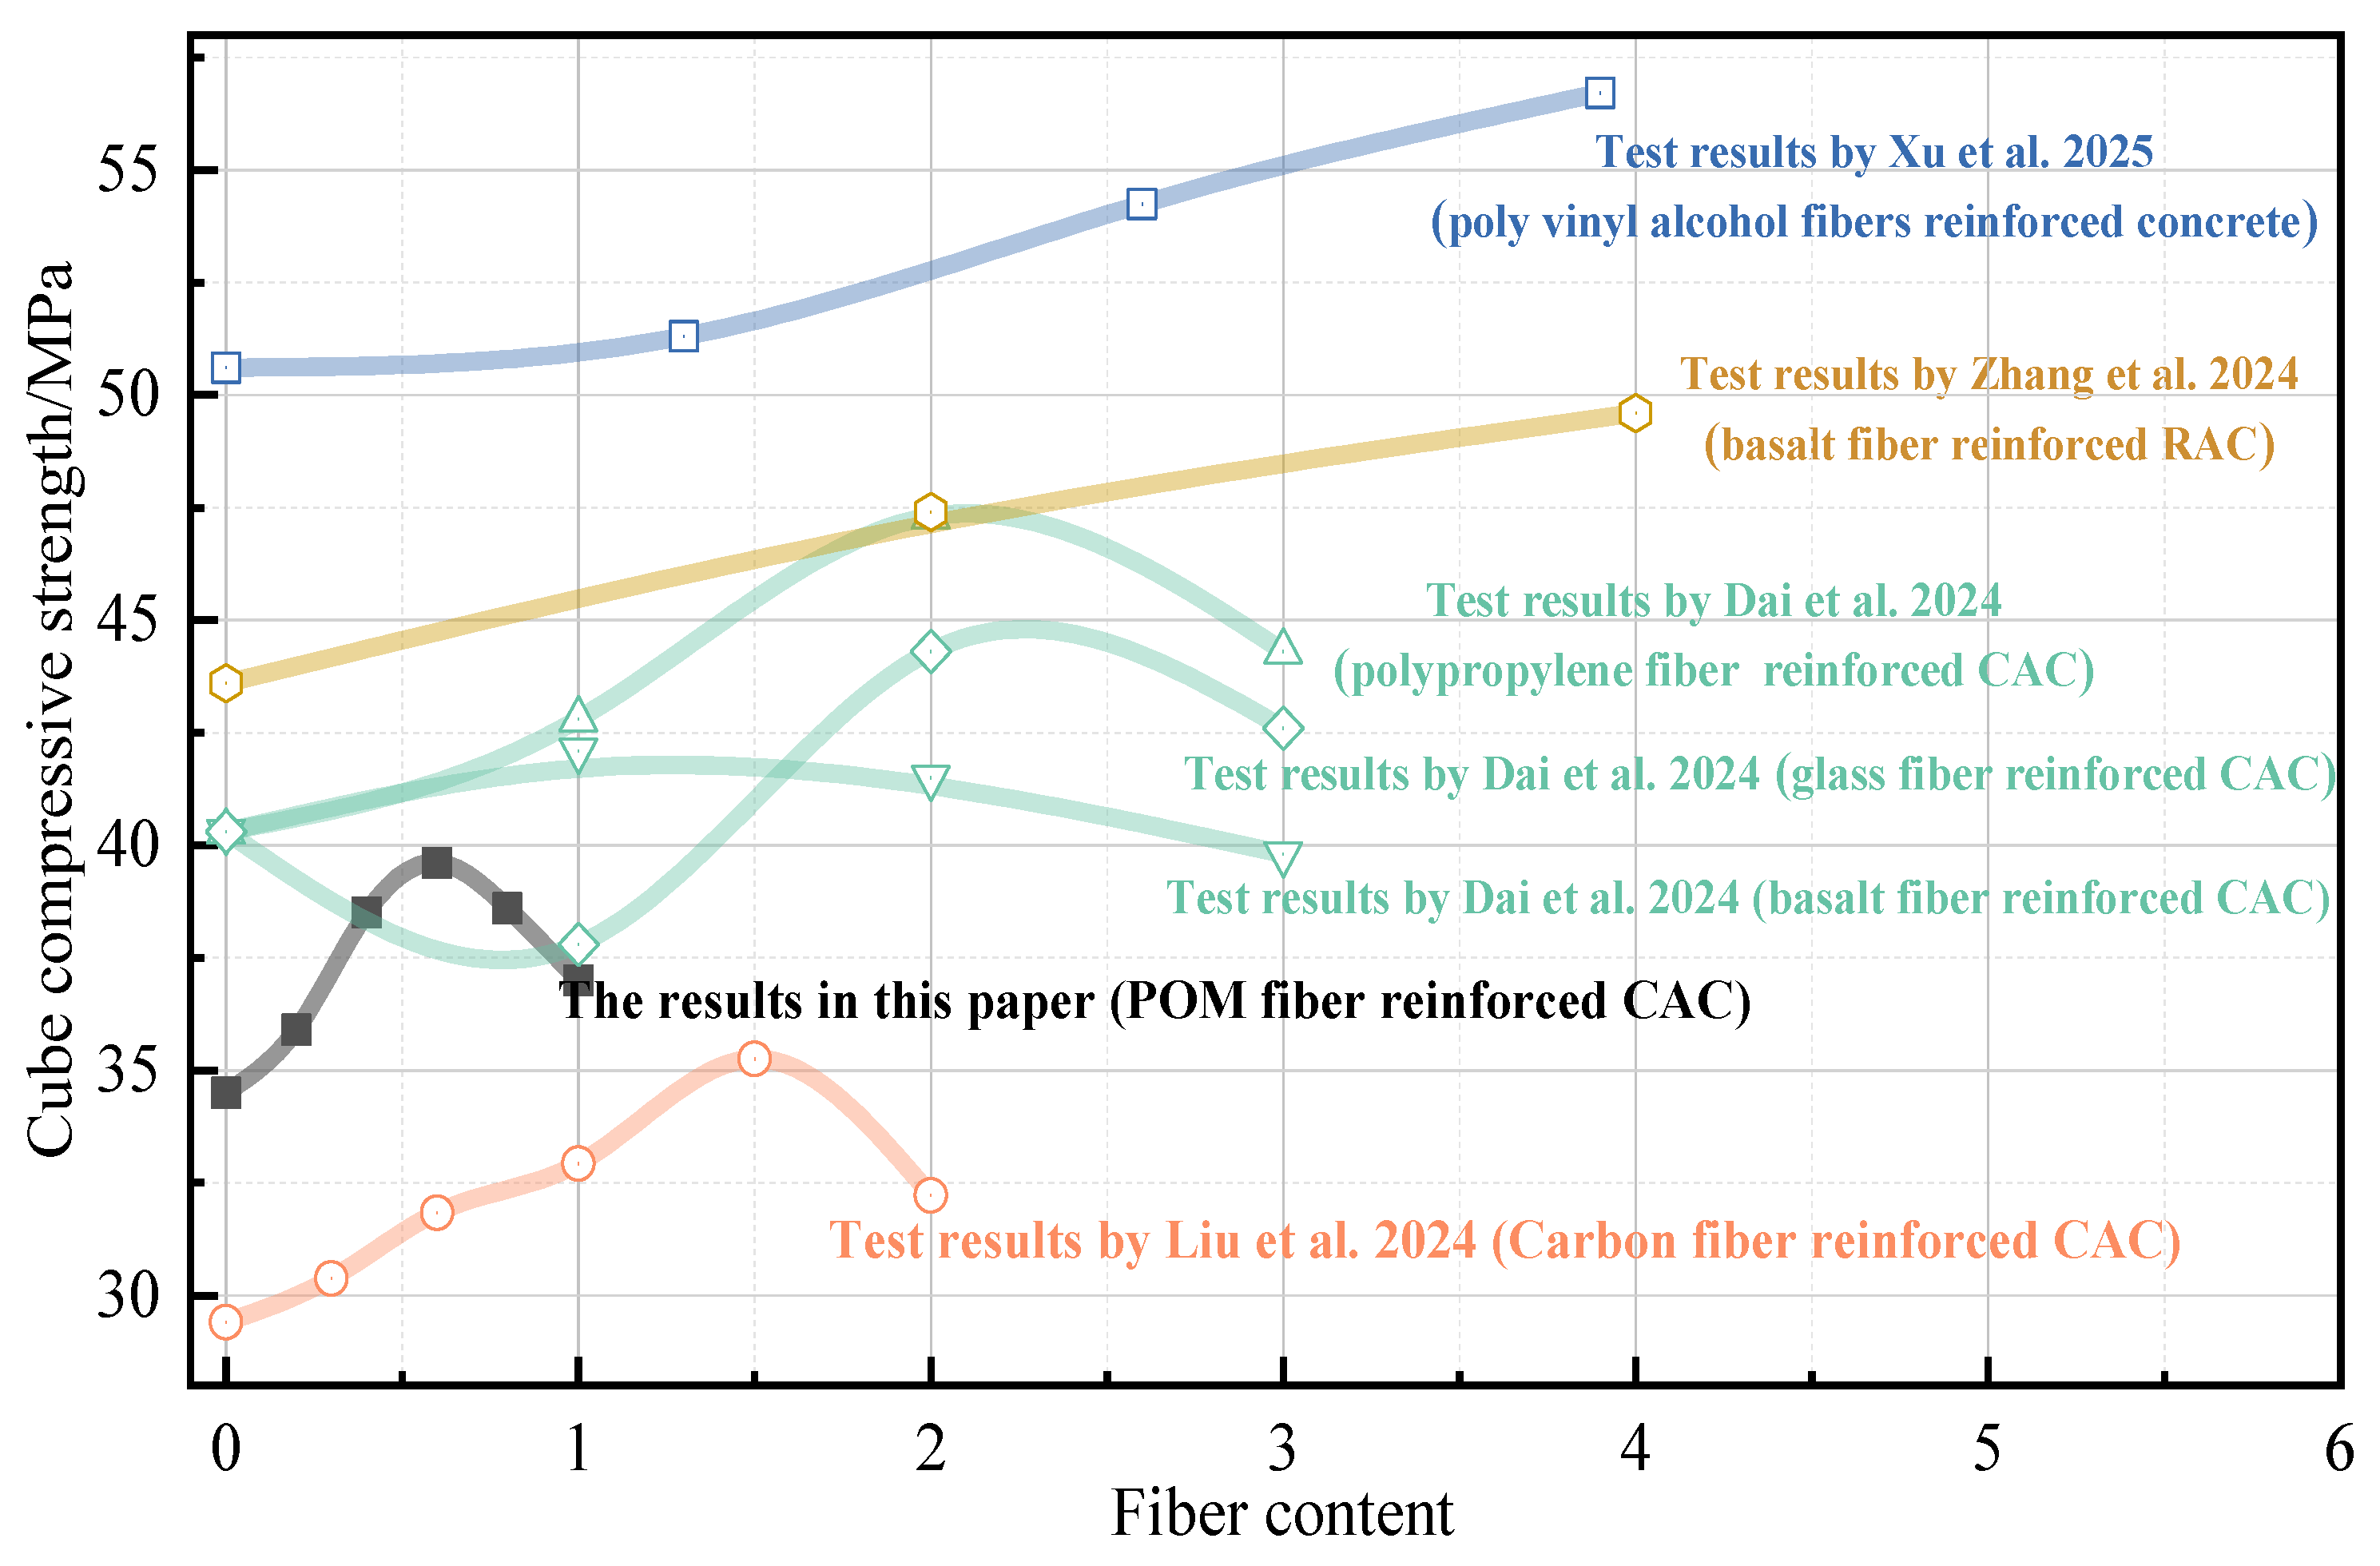
Figure 4a reveals that as the POM fiber volume fraction increases, the average cube compressive strength of CAC specimens first rises and then declines, reaching a peak value of 39.6 MPa at a ρ value of 0.6, with a 95% confidence interval of 37.7 MPa to 41.5 MPa. Compared to specimens without POM fibers, the incorporation of POM fibers enhances the cube compressive strength of CAC, with a maximum improvement of 14.78%. This aligns with previous studies demonstrating that fiber reinforcement can increase concrete compressive strength. For instance, as illustrated in Figure 5, Liu et al. [35] observed that the compressive strength of CAC gradually improved with increasing carbon fiber content, exhibiting a typical columnar failure pattern during destruction, while the addition of carbon fibers reduced the number of large cracks in concrete. Dai et al. [36] tested the cube compressive strength of coral concrete under different contents of polypropylene fiber (PPF), glass fiber (GF), and basalt fiber (BF). The results showed that the addition of fiber enhanced the strength of CAC, mitigated its brittleness, and improved its ductility during failure. Notably, PPF exhibited the most significant improvement in concrete strength. This was attributed to the formation of a dense three-dimensional network structure by PPF during compression, which effectively inhibited crack propagation at appropriate dosage levels. Xu et al. and Zhang et al. [37,38] investigated the enhancement of compressive strength in recycled aggregate concrete (RAC) with basalt fibers and in ultra-high-performance concrete with polyvinyl alcohol fibers, respectively. Their studies further explain the reinforcement mechanisms of these fibers.
The polynomial fitting relationship between the compressive strength of coral concrete cubes and the fiber content ratio is shown in Equation (4). The comparison results between analytical results and test results of f c u are shown in Figure 4b.
f c u = 13.125 ρ 2 + 16.225 ρ + 34.050
A comparative experimental study was conducted to investigate the effects of POM fibers on the compressive failure characteristics of CAC cubes. As shown in Figure 6a, the NF specimens exhibited complete fragmentation after compression testing, with extensive concrete spalling on the surface, demonstrating typical brittle failure behavior. Due to the low intrinsic strength of coral aggregates and strong aggregate–matrix interfacial bonding, all aggregates underwent penetrative fracture during failure, which significantly differs from the crack propagation pattern along aggregate interfaces observed in ordinary concrete. For specimens incorporating POM fibers (Figure 6b), surface spalling was still present but notably reduced, with only a few dominant cracks formed. As illustrated in Figure 6c, the fibers created effective bridging across vertical cracks. Compared to the control group, POM fibers enhanced material toughness by forming interfacial bonds that effectively connected adjacent cracks. Experimental results indicated that the addition of POM fibers improved the compressive integrity of specimens and delayed crack propagation through stress redistribution mechanisms.

5.2. Splitting Tensile Property

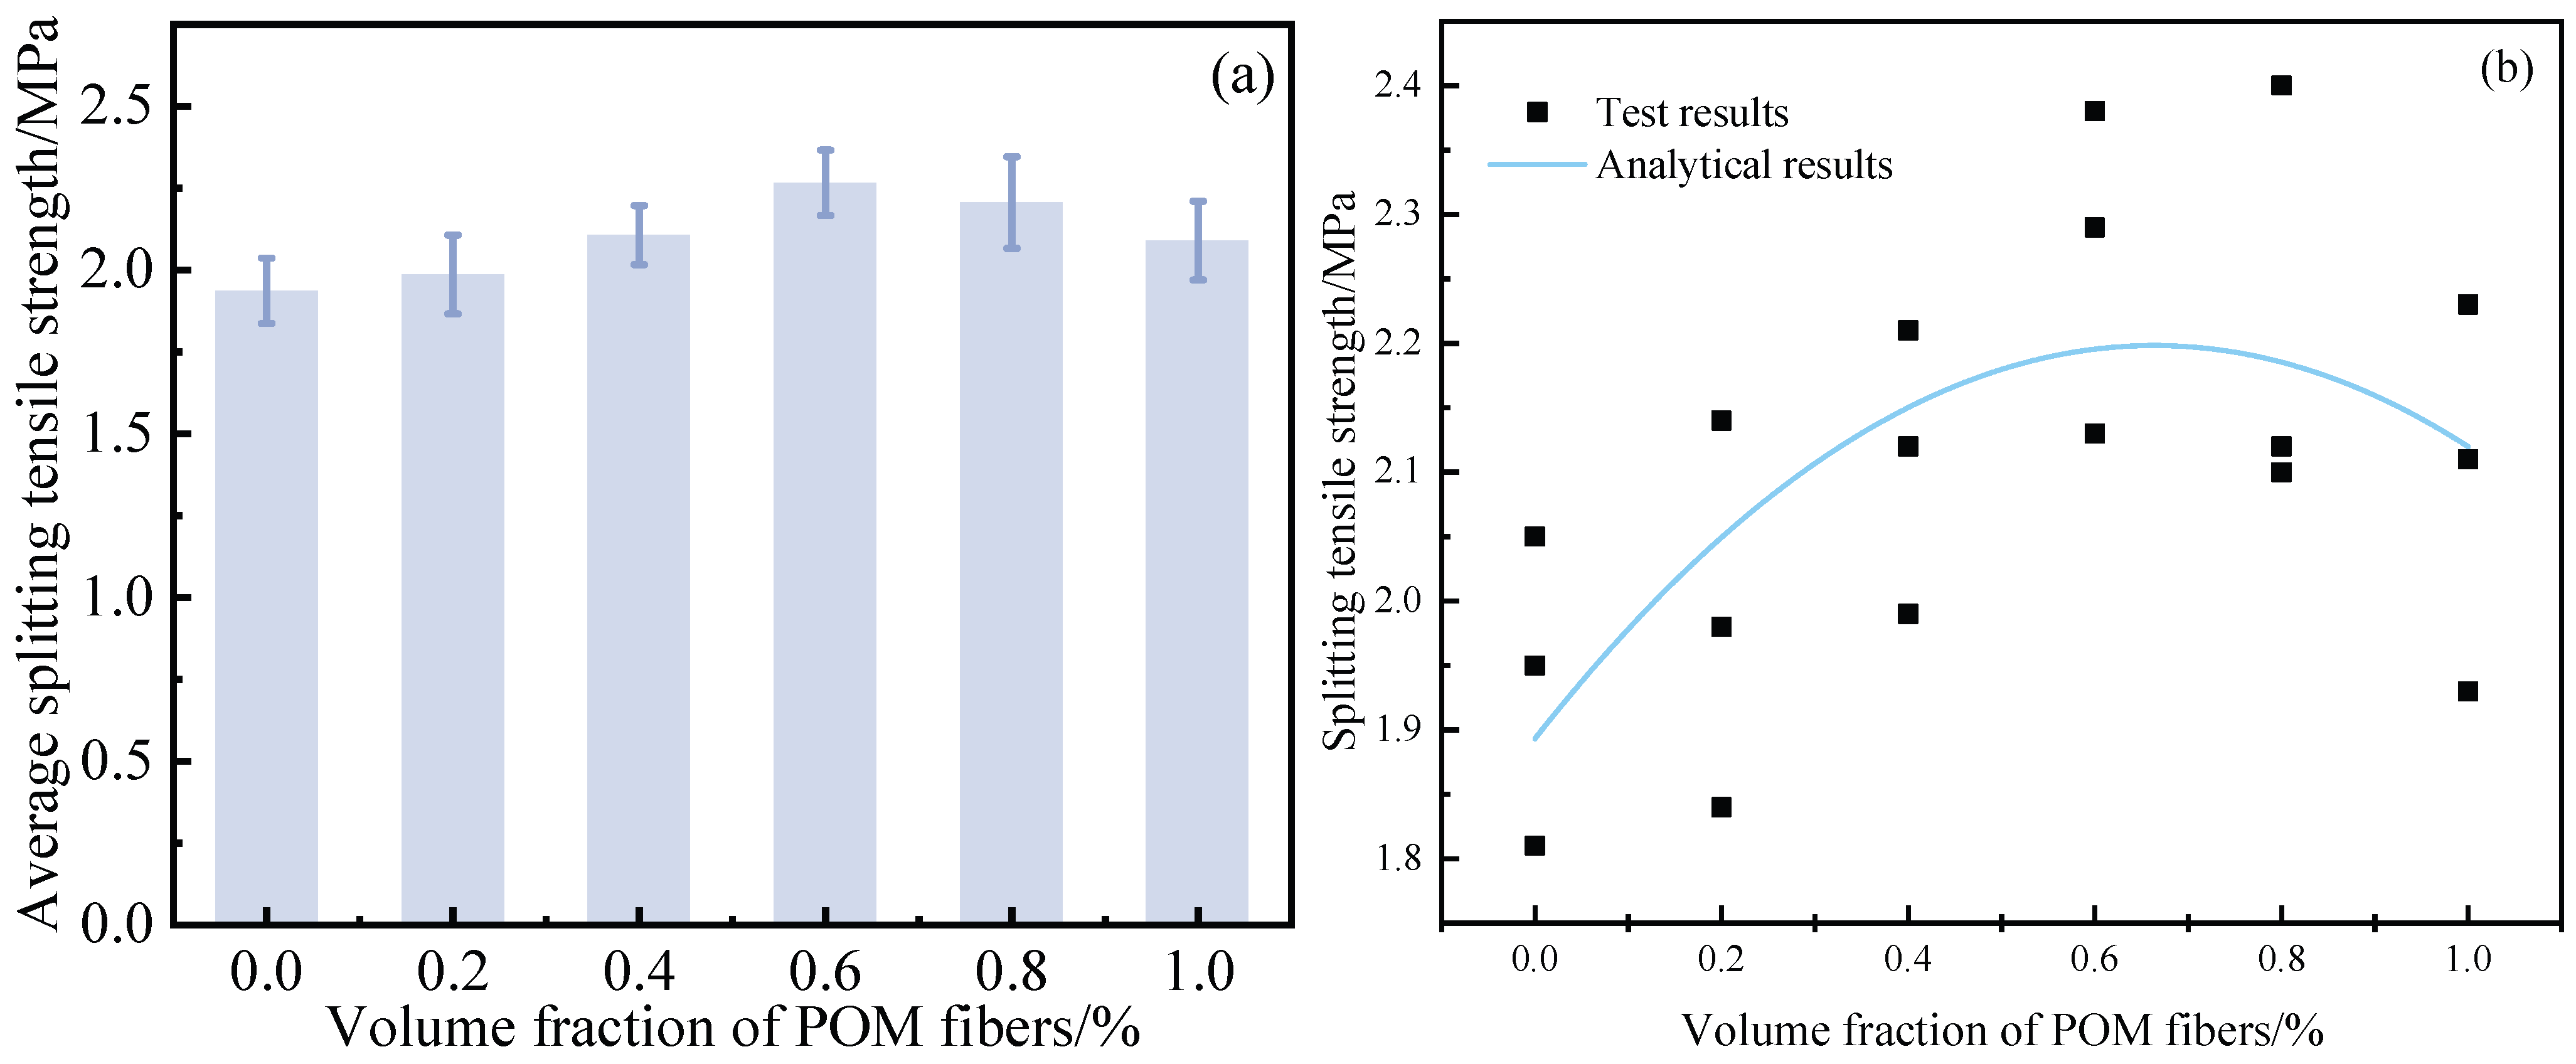
As shown in Figure 7a, the average splitting tensile strength of CAC specimens first increases and then decreases with increasing POM fiber volume fraction. The maximum splitting tensile strength of CAC reaches 2.27 MPa at a POM fiber volume fraction of 0.6. Compared to specimens without POM fibers, CAC exhibits a nearly 20% improvement in splitting tensile strength, indicating significant mechanical enhancement. Polynomial fitting is applied to the experimental data, with the fitting results shown in Figure 7b.
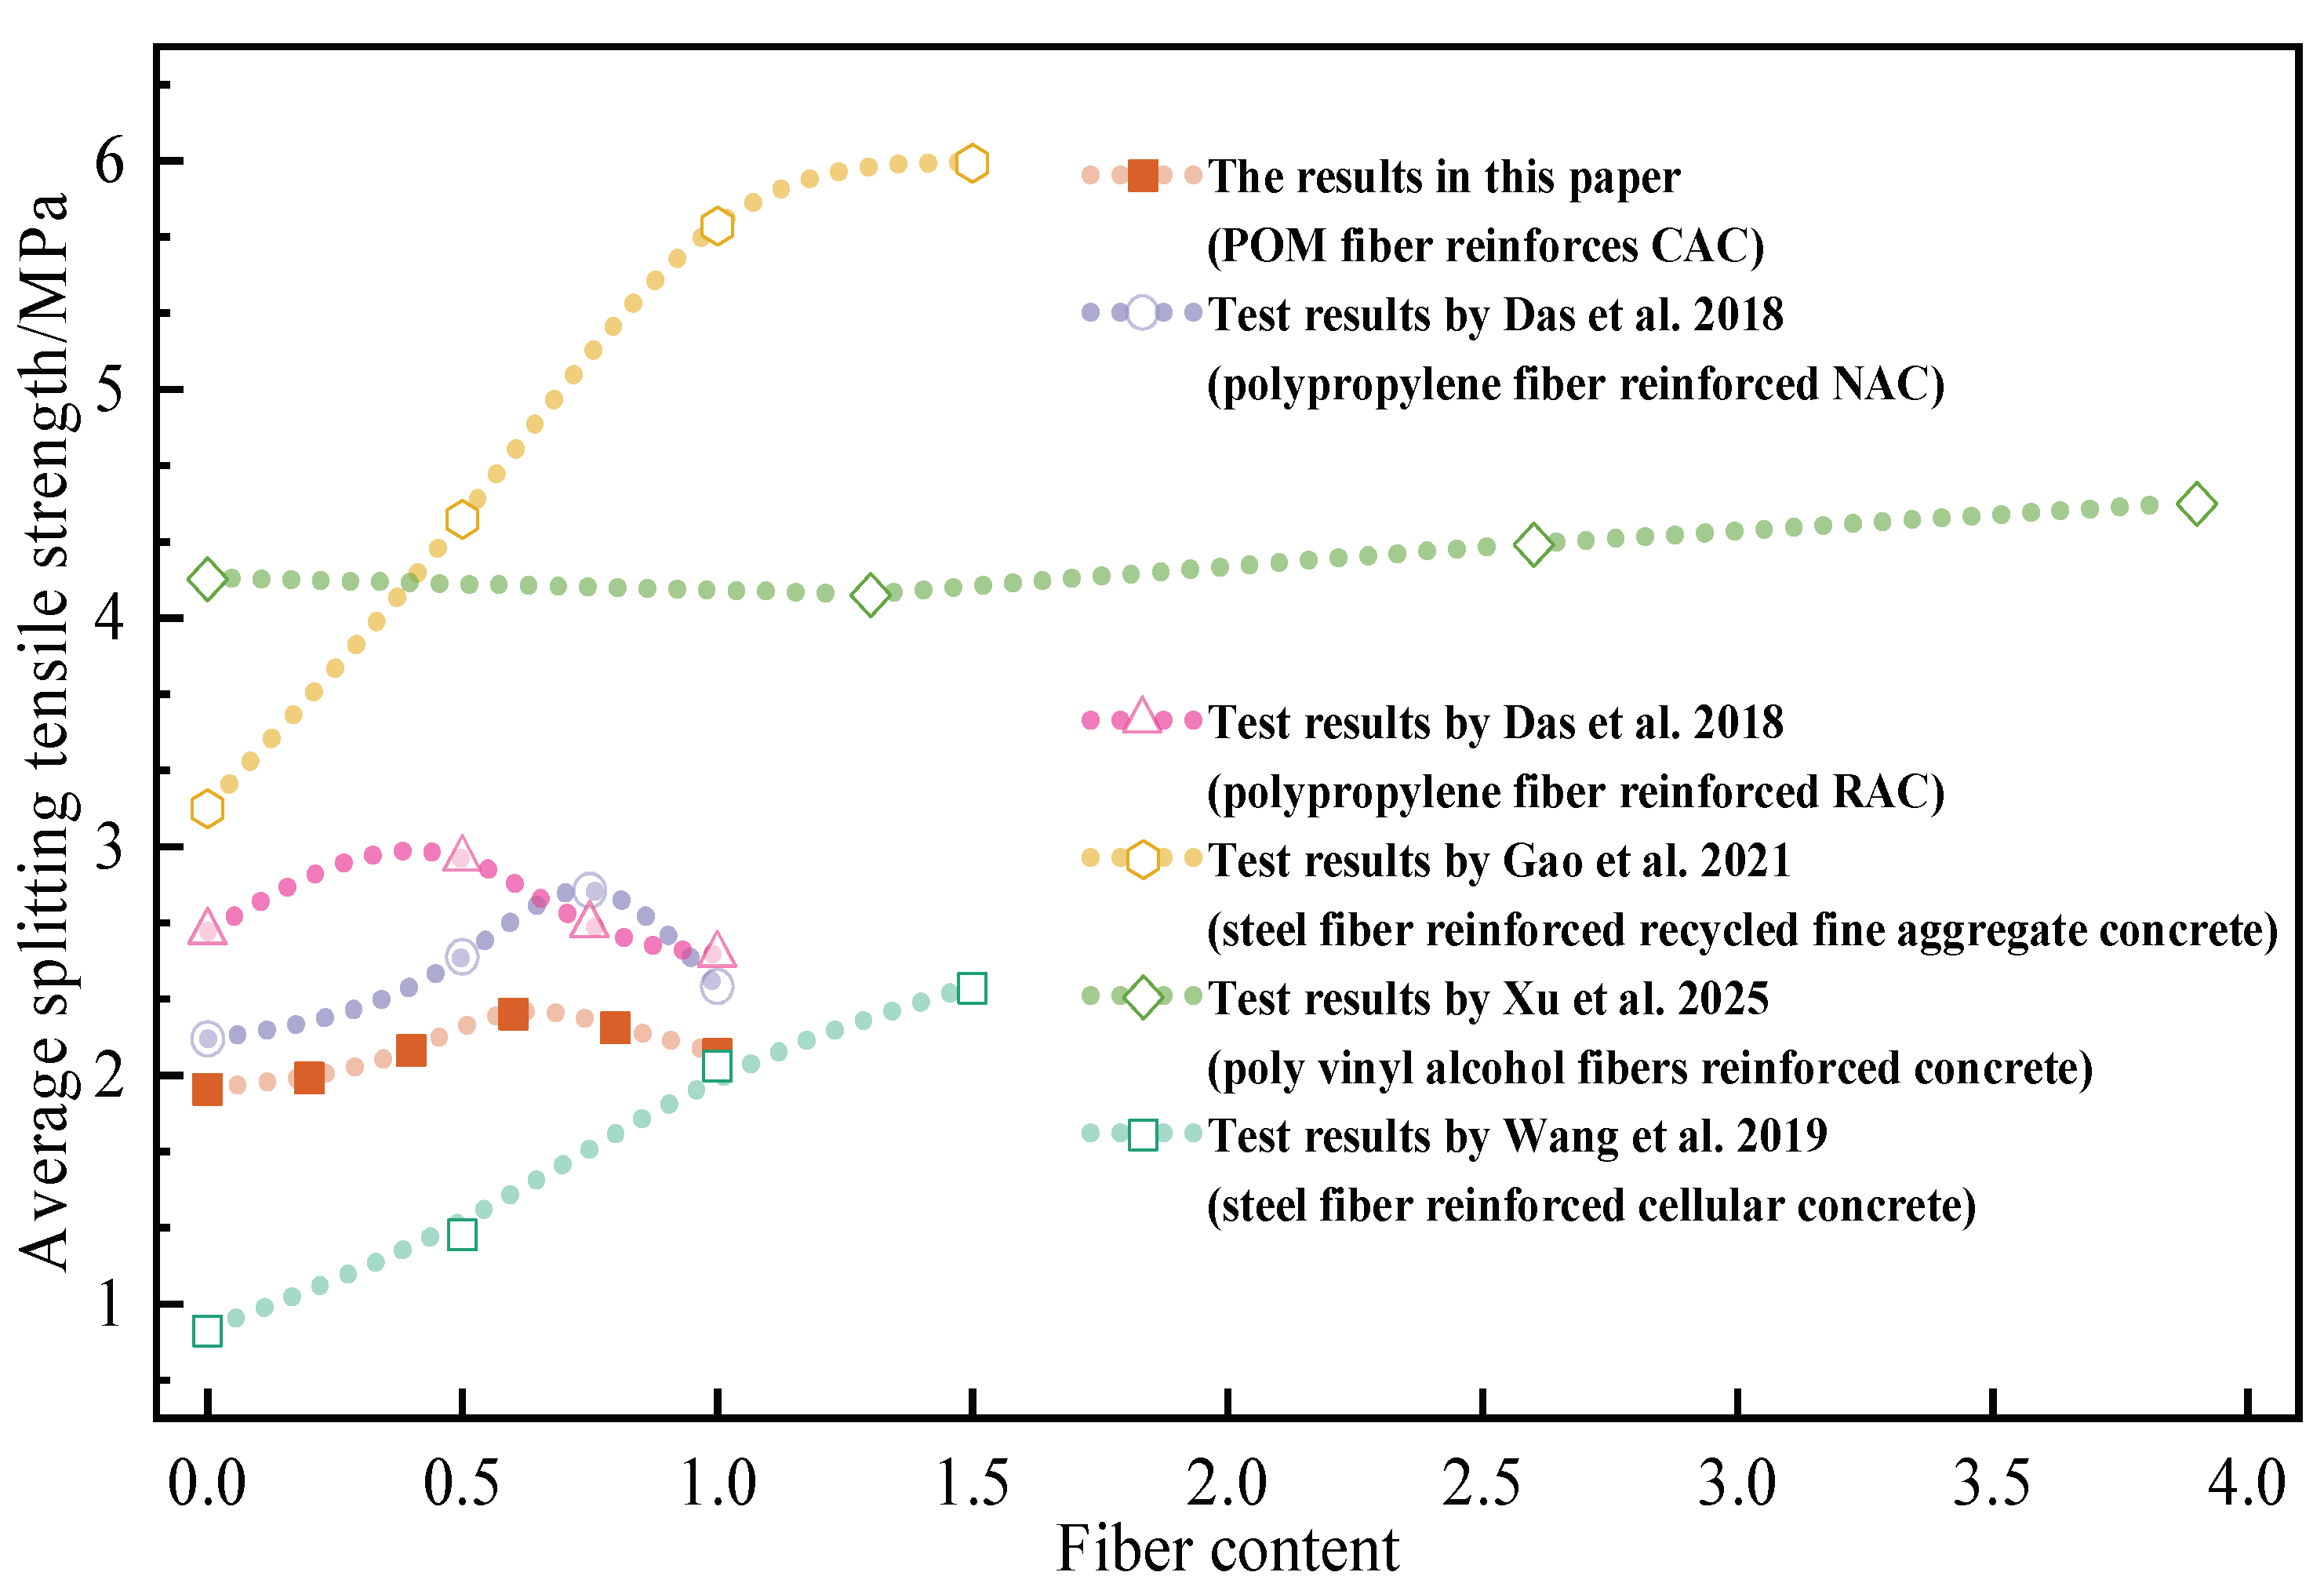
Similar conclusions were reported by other researchers when strengthening the splitting compressive strength of concrete [16,37,39,40,41]. Figure 8 demonstrates that fibrillated polypropylene fibers effectively enhance both natural aggregate concrete (NAC) and RAC, improving their splitting tensile strength [39]. The addition of steel fibers during the reinforcement of recycled fine aggregate concrete (RFAC) or ordinary concrete can also moderately improve the splitting tensile performance of RFAC [40,41].
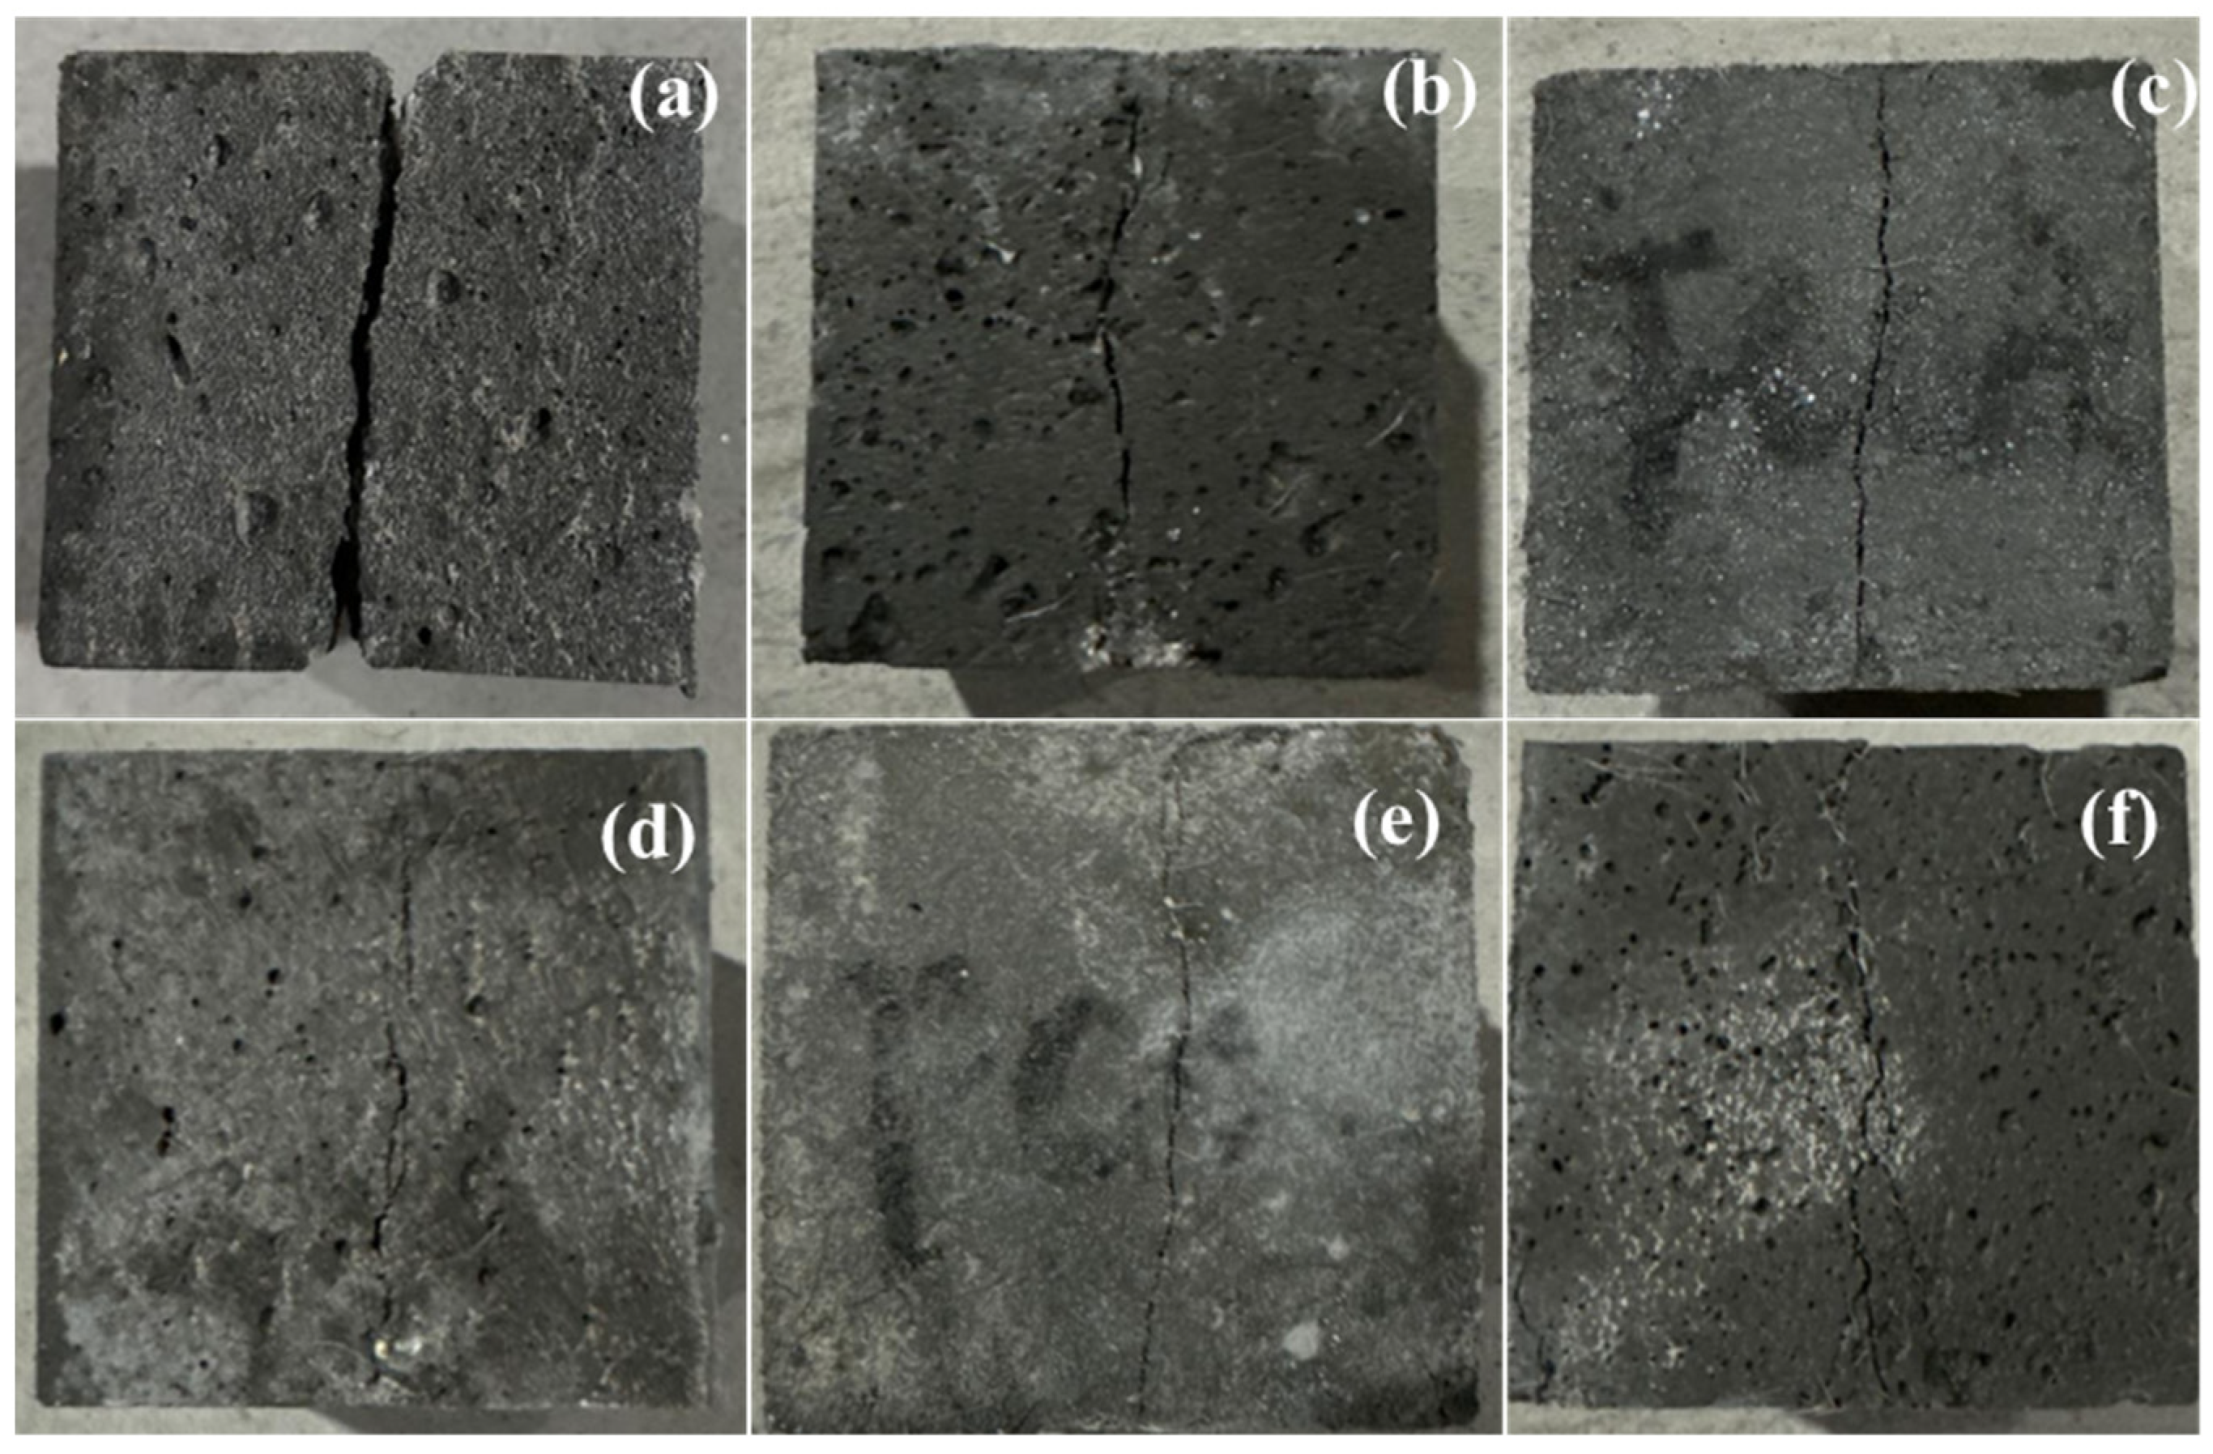
The influence of POM fiber volume fractions on the splitting tensile failure morphology of CAC specimens is illustrated in Figure 9. As shown in Figure 9a, for CAC specimens without POM fibers, the specimen fractures first at the loading end section under sustained external load, with initial cracking and final failure occurring almost simultaneously, exhibiting typical brittle failure characteristics. Coral aggregates at the fracture surface show complete fracture patterns, where most particles form smooth fractures along the splitting plane, and some even display geometrically symmetric fracture patterns—a stark contrast to the fragmentation features of conventional concrete aggregates.
In modified specimens containing POM fibers (Figure 9d), the material continues to bear partial load after initial crack formation before reaching peak stress, demonstrating a phased fracture process. At ultimate failure, crack width and propagation are significantly reduced, with fibers bridging cracks to form a mesh-like support structure. This maintains the specimen’s geometric integrity at the macroscopic level, reflecting a typical stress redistribution mechanism. As shown in Figure 9f, when the fiber content increases to 1.0%, structural integrity is preserved, but crack width and quantity exceed those observed at 0.6% and 0.8% fiber volume fractions. This is attributed to excessive fiber content increasing material porosity and reducing specimen compactness. Experimental data indicate that a fiber volume fraction of 0.6–0.8% achieves optimal fiber–matrix synergy, enhancing material ductility while maintaining CAC structural density.
As stated in Principles of Reinforced Concrete [42], the empirical regression formula between the splitting tensile strength and cube compressive strength of standard ordinary concrete specimens is given by Equation (5):
f t s = 0.19 f c u 3 / 4
Previous studies revealed that Equation (3) does not apply rigorously to concrete incorporating POM fibers [43]. Therefore, based on prior research, the coefficient k in Equation (6) is modified as follows:
f t s = k f c u 3 / 4
The values of ƒcu-mean, f c u 3 / 4 , and k are presented in Table 9. For varying POM fiber contents, k ranges from 0.1357 to 0.1438. Hence, k adopts the mean value of 0.1391 in Equation (6). The calculated splitting tensile strength values using Equation (6) are listed in Table 9. The ratio of tested to calculated splitting tensile strengths fluctuates between 0.98 and 1.03, demonstrating that the modified empirical formula for the relationship between splitting tensile strength and cube compressive strength provides reliable reference.

5.3. Flexural Property

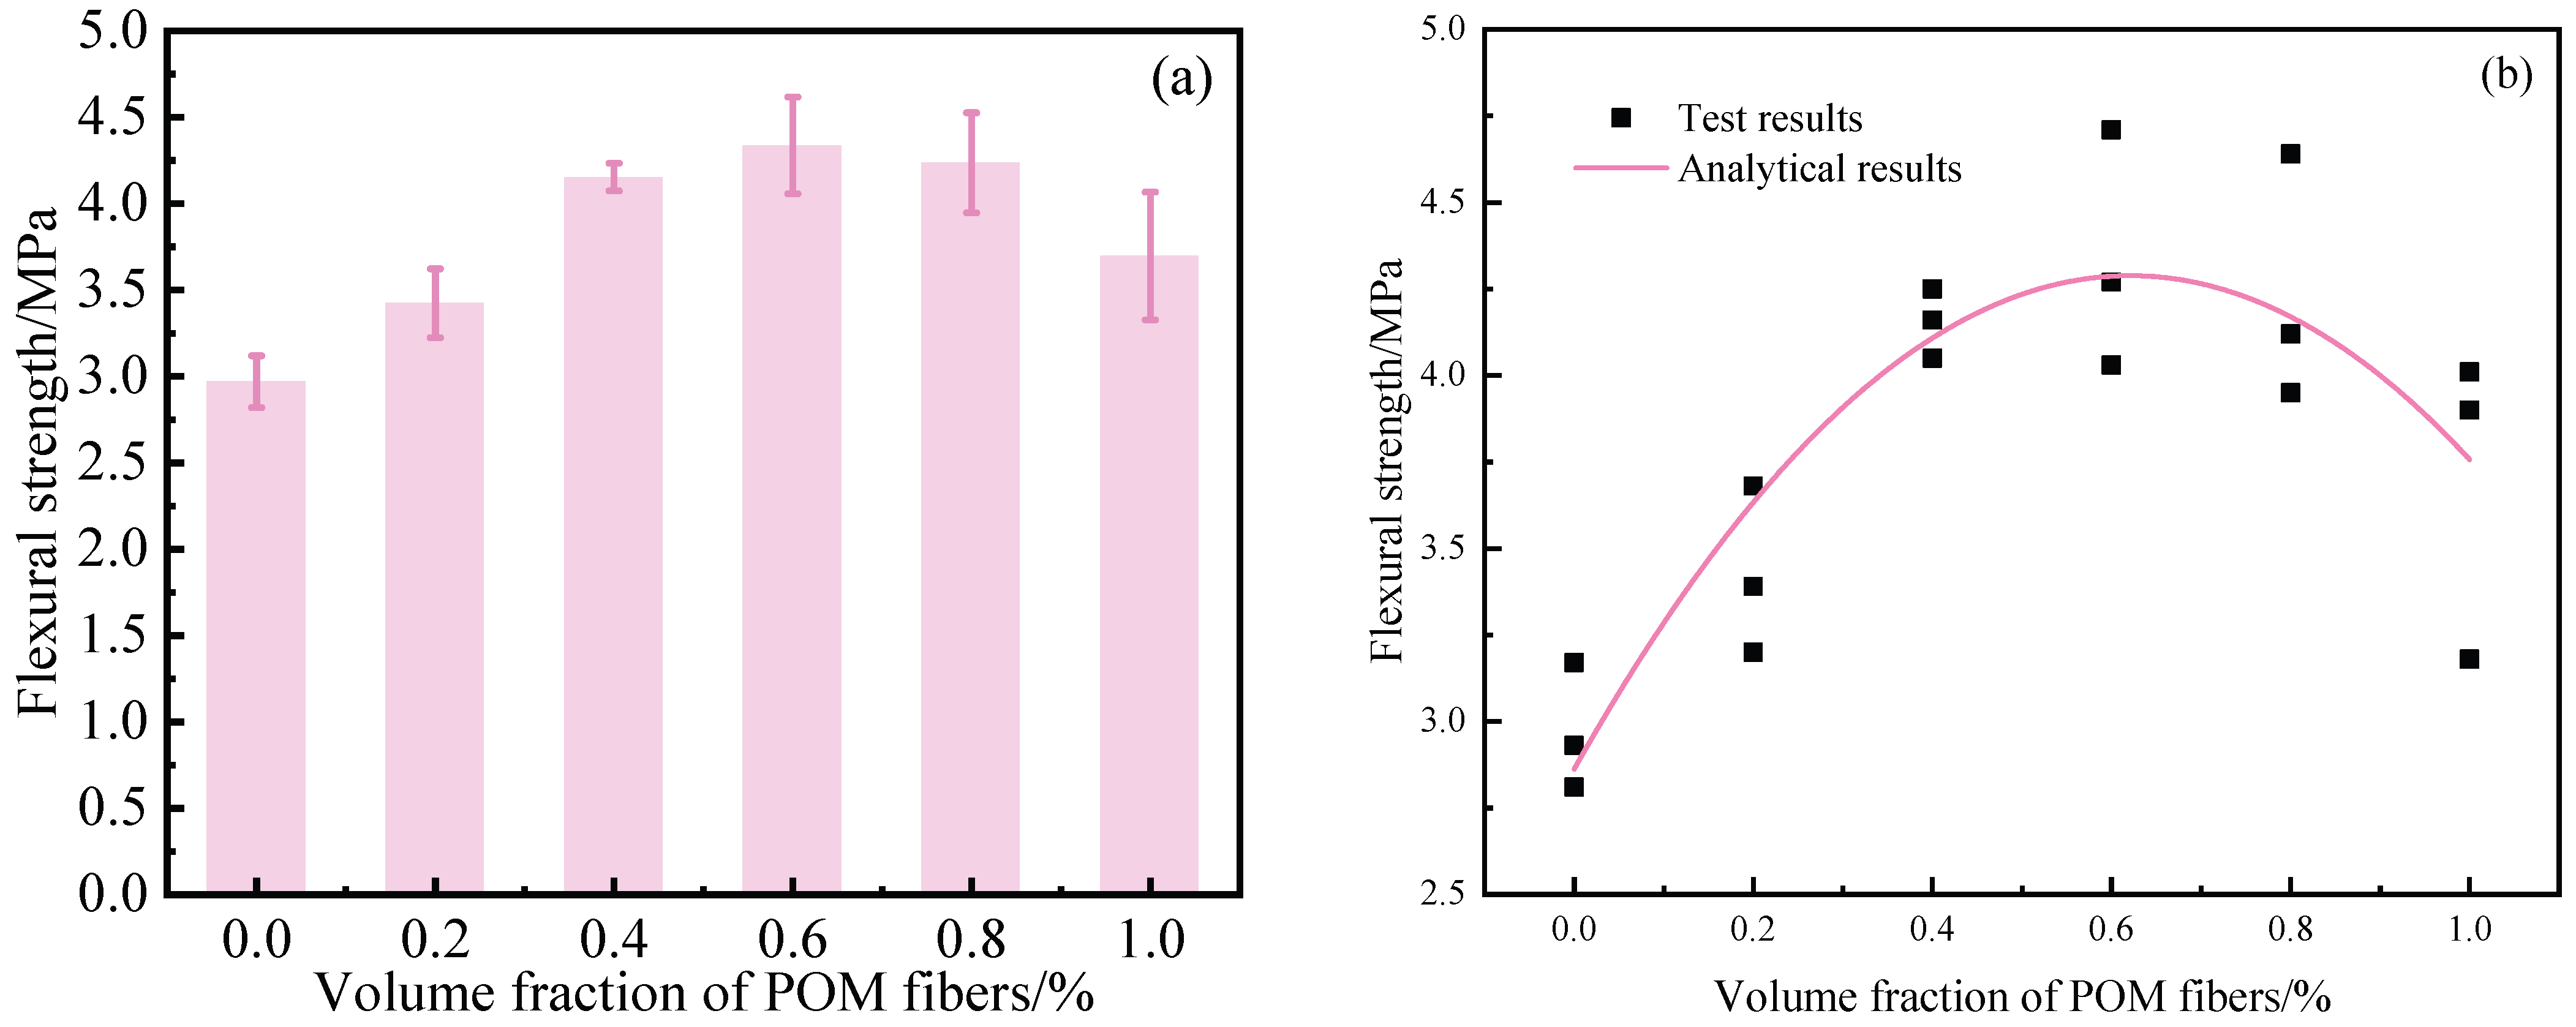
As shown in Figure 10, the average flexural strength of CAC specimens first increases and then decreases with increasing POM fiber volume fraction. The maximum flexural strength of CAC reaches 4.34 MPa at a POM fiber volume fraction of 0.6, with a 95% confidence interval of 3.87–4.80 MPa. Compared to specimens without POM fibers, CAC exhibits a significant improvement in flexural strength. Polynomial fitting was applied to the experimental data, with the fitting results illustrated in Figure 10.
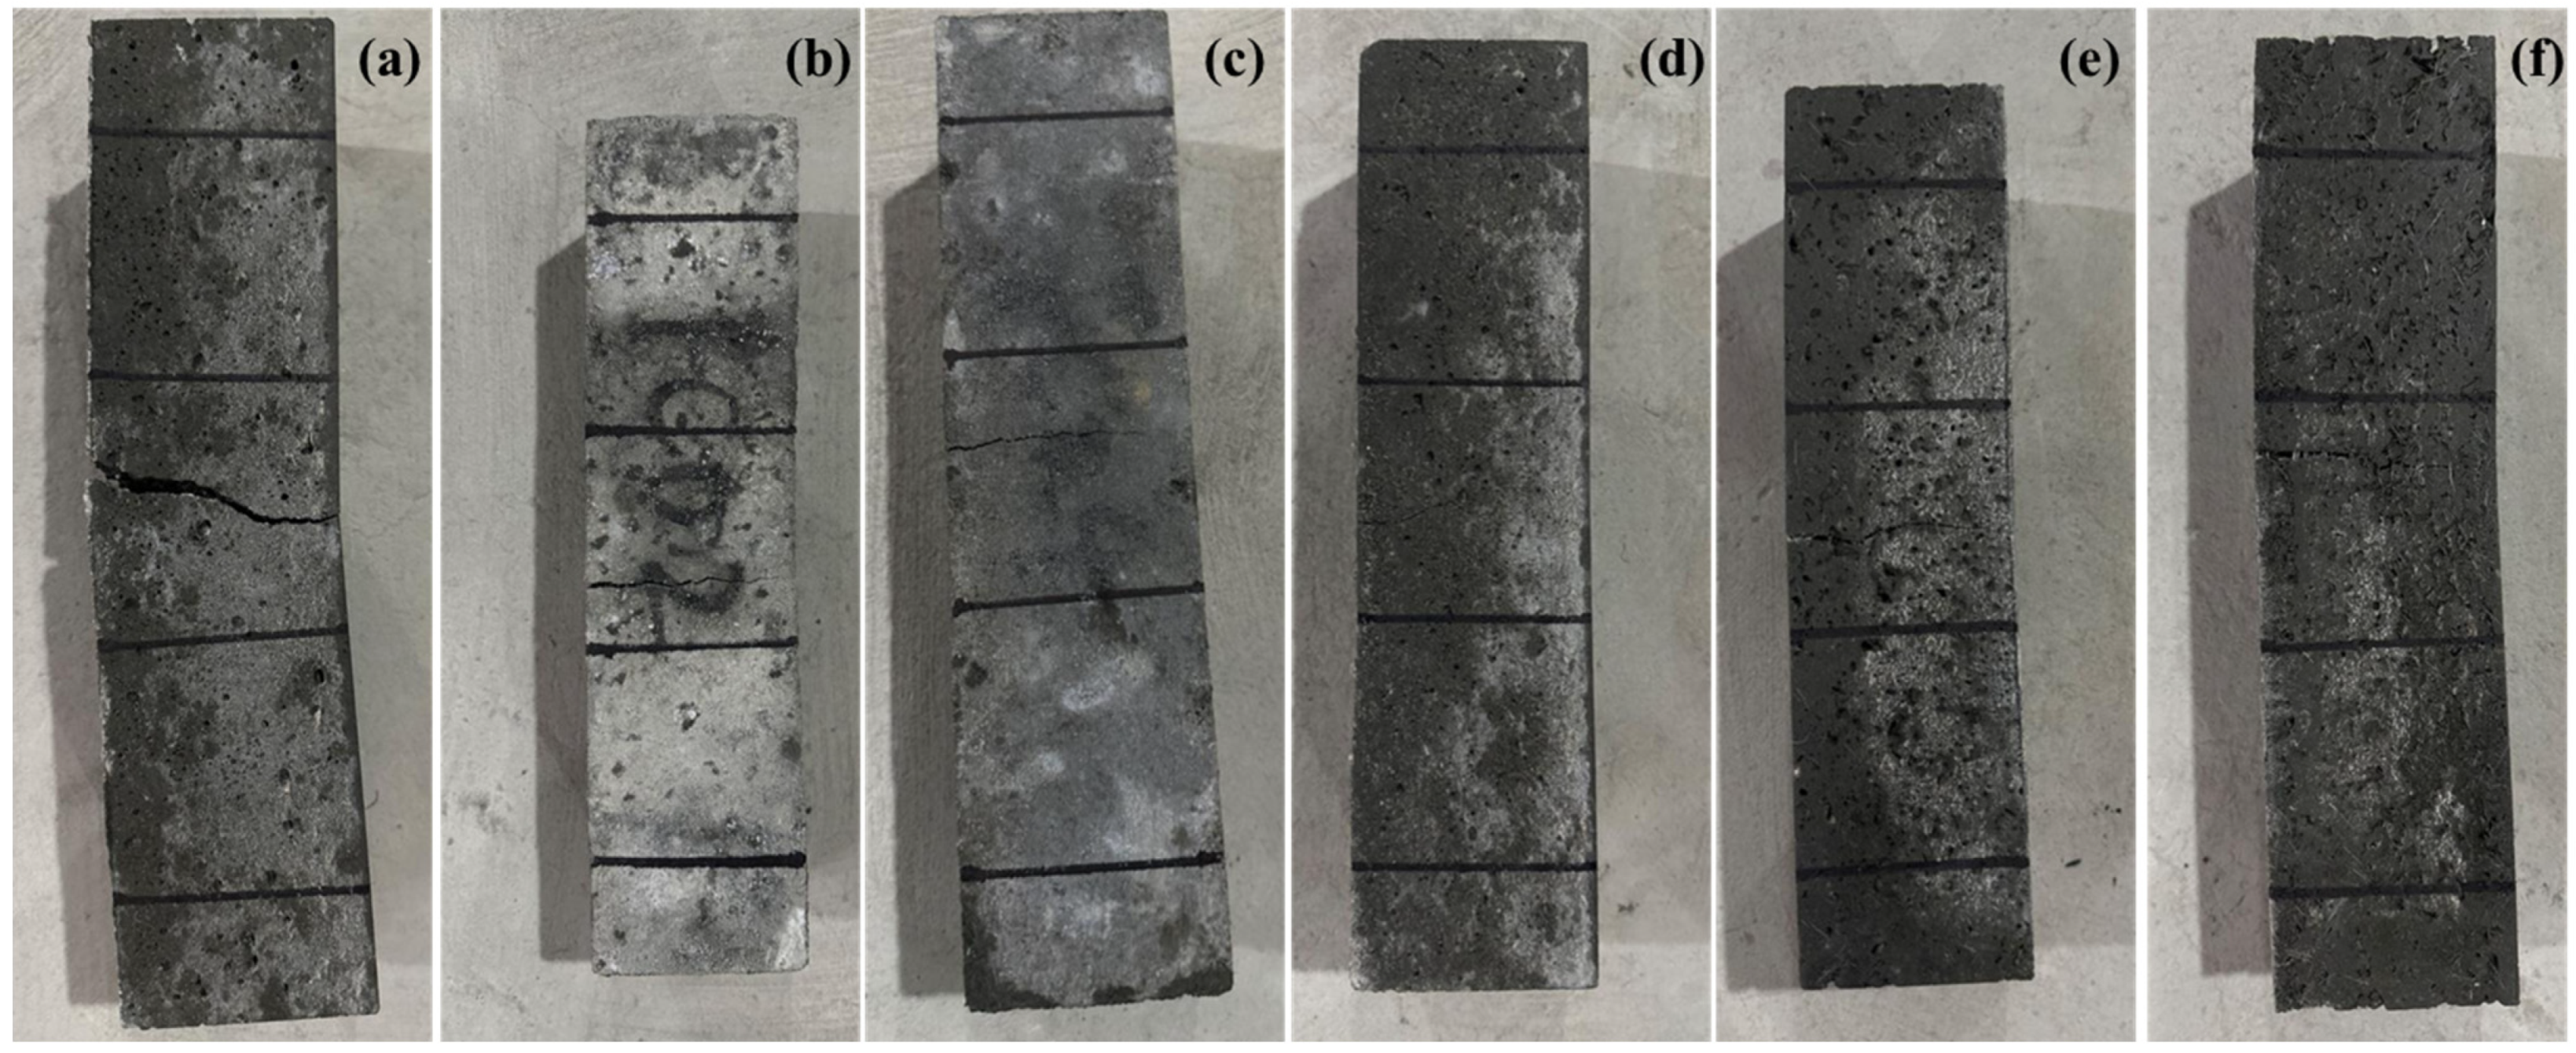
Figure 11 illustrates the influence of POM fibers on the flexural failure morphology of CAC specimens. For NF specimens, no visible cracks appear before peak load, but sudden fracture occurs at ultimate failure, with cracks instantly penetrating the cross-section. Coral aggregates at the fracture surface display geometrically symmetric fracture patterns, distinct from the random fragmentation observed in conventional concrete aggregates. In specimens containing POM fibers, residual load-bearing capacity maintains 15–46% of the peak load during the initial flexural stage due to the interfacial bonding effect between POM fibers and the matrix, demonstrating pronounced ductile fracture characteristics. At final failure, the main crack width is reduced owing to the bonding effect of POM fibers. Based on flexural test results and post-fracture morphological analysis, specimens with a POM fiber volume fraction of 0.6% exhibit optimal crack resistance performance, showing significantly slower crack propagation rates compared to the NF group and no secondary crack formation. When the fiber content increases to 0.8%, structural integrity is retained, but crack width and length increase, indicating that excessive fiber content causes localized fiber clustering, compromising matrix continuity. Thus, an appropriate POM fiber volume fraction effectively delays the development of initial microcracks and inhibits new crack formation, achieving excellent crack resistance.
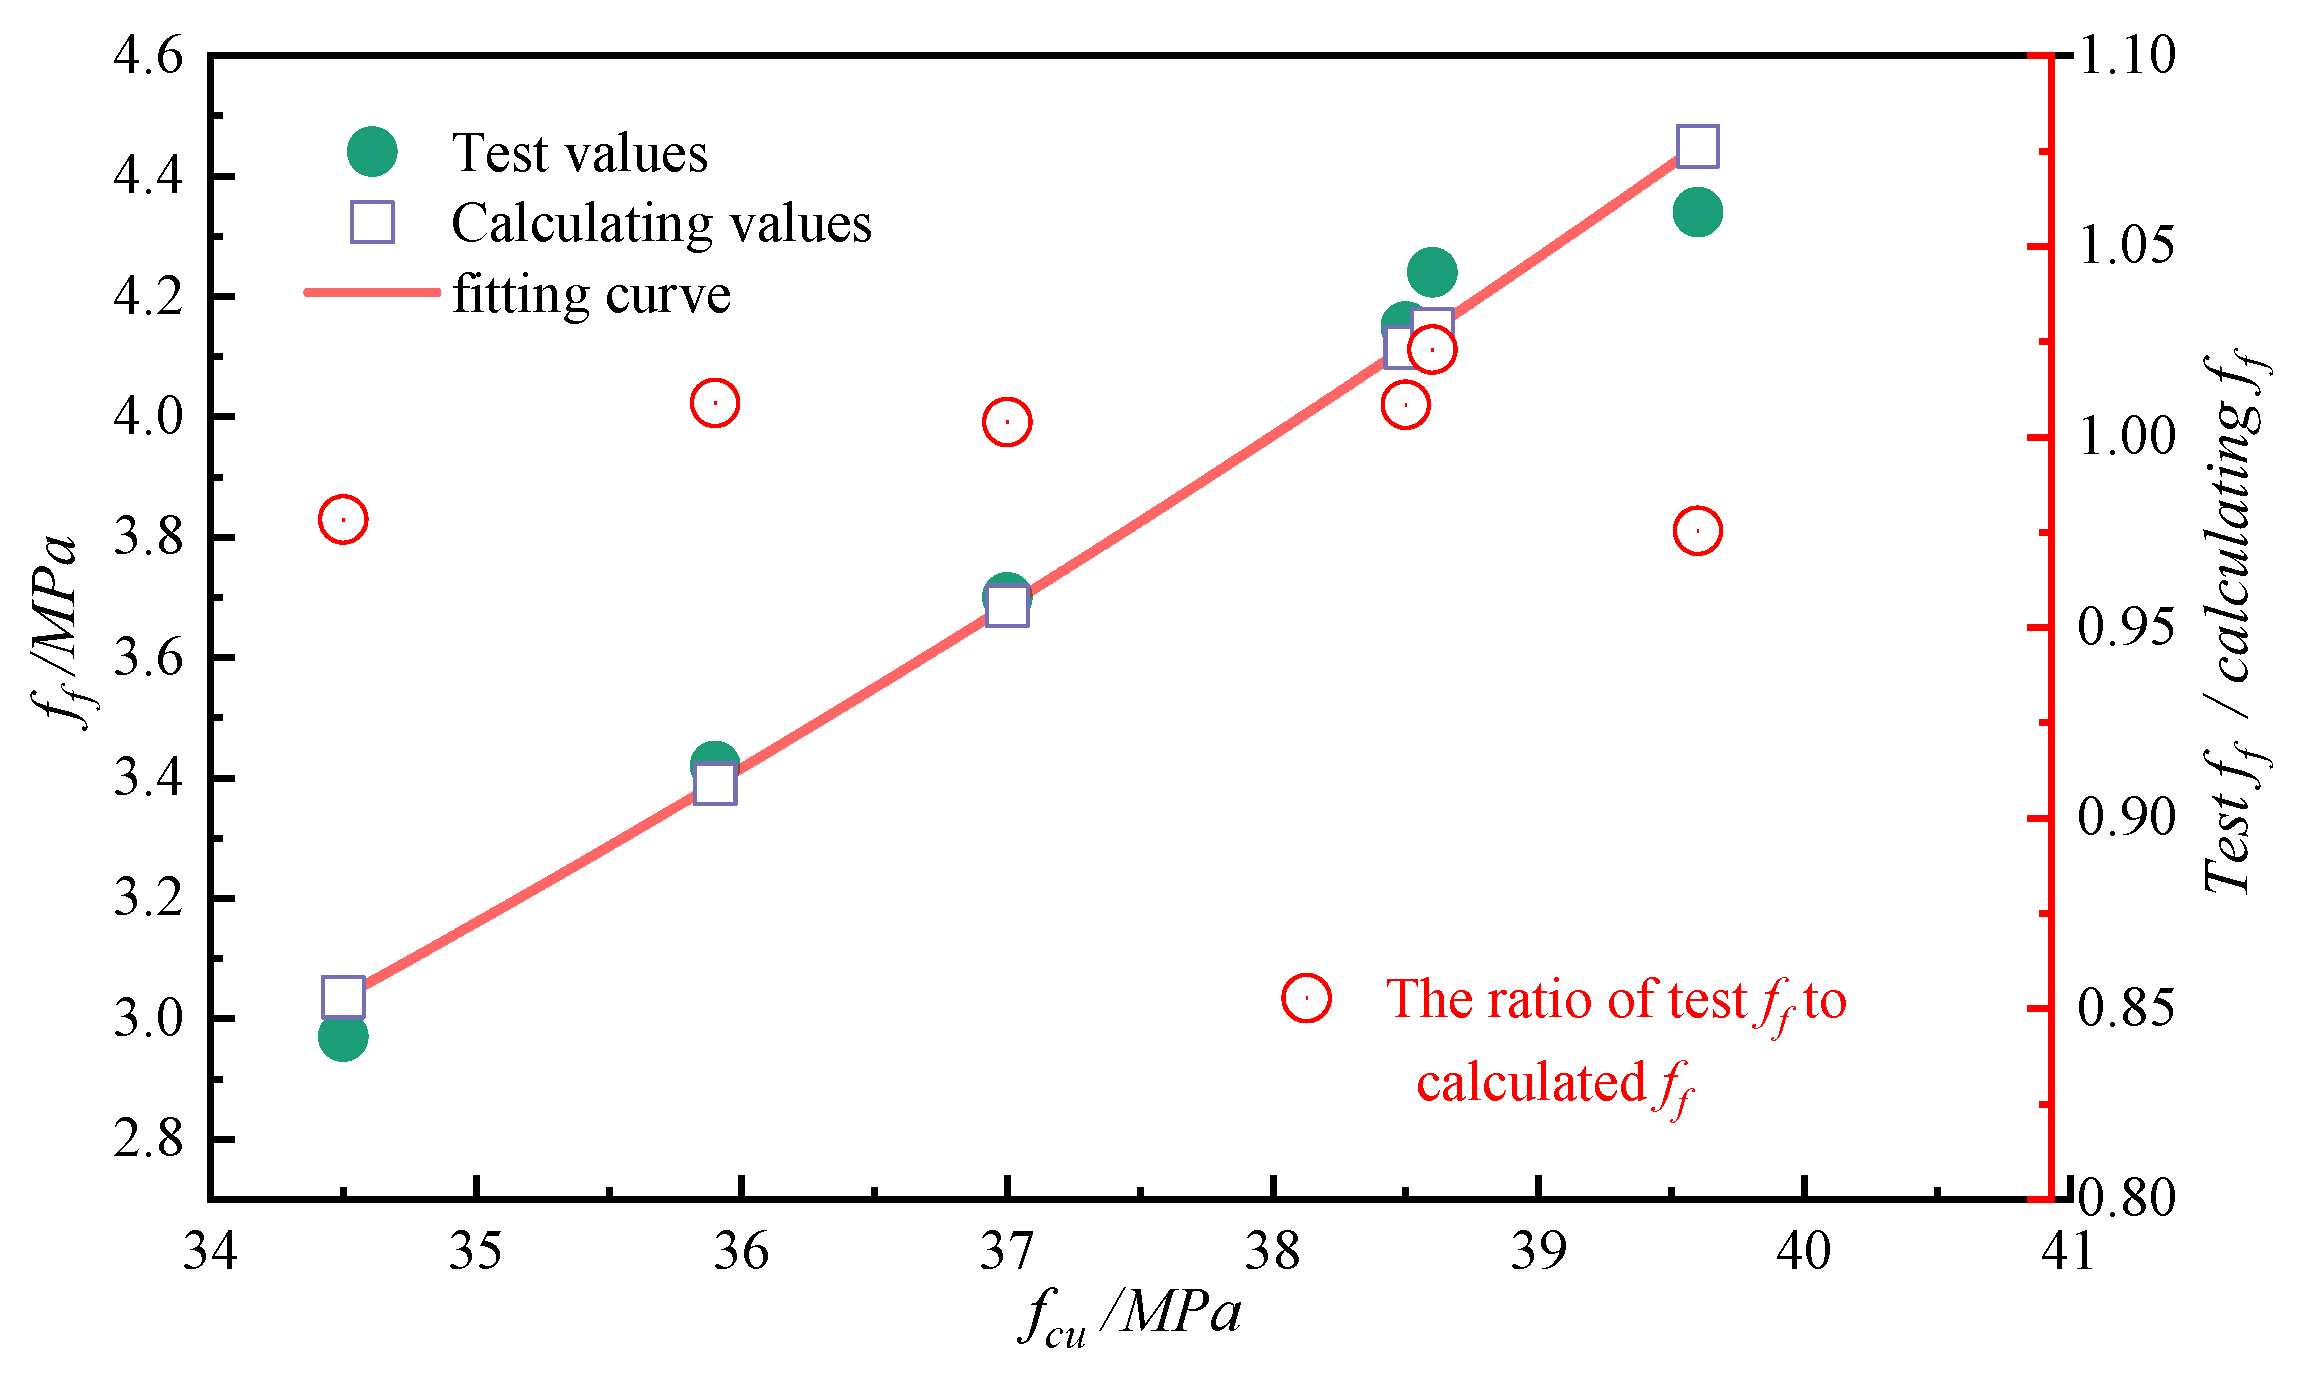
Based on previous studies [43,44], the relationship between flexural strength and cube compressive strength is hypothesized as shown in Equation (7). The fitting results are presented in Figure 12. In Equation (7), the values of a and b are 1.6486 × 10⁻⁴ and 2.7735, respectively.
Using Equation (7), the flexural strength of CAC specimens at different POM fiber volume fraction was calculated. The ratio of experimentally tested flexural strength to calculated values is shown in Table 10 and Figure 12. The ratio fluctuates between 0.98 and 1.01, indicating that the modified empirical formula can effectively predict the flexural strength of coral aggregate concrete based on cube compressive strength. Therefore, the empirical formula relating flexural strength to cube compressive strength for polyoxymethylene fiber-reinforced coral concrete is given by Equation (8).
f f = a f c u b
f f = 0.000016486 f c u 2.7735

5.4. Axial Compressive Property

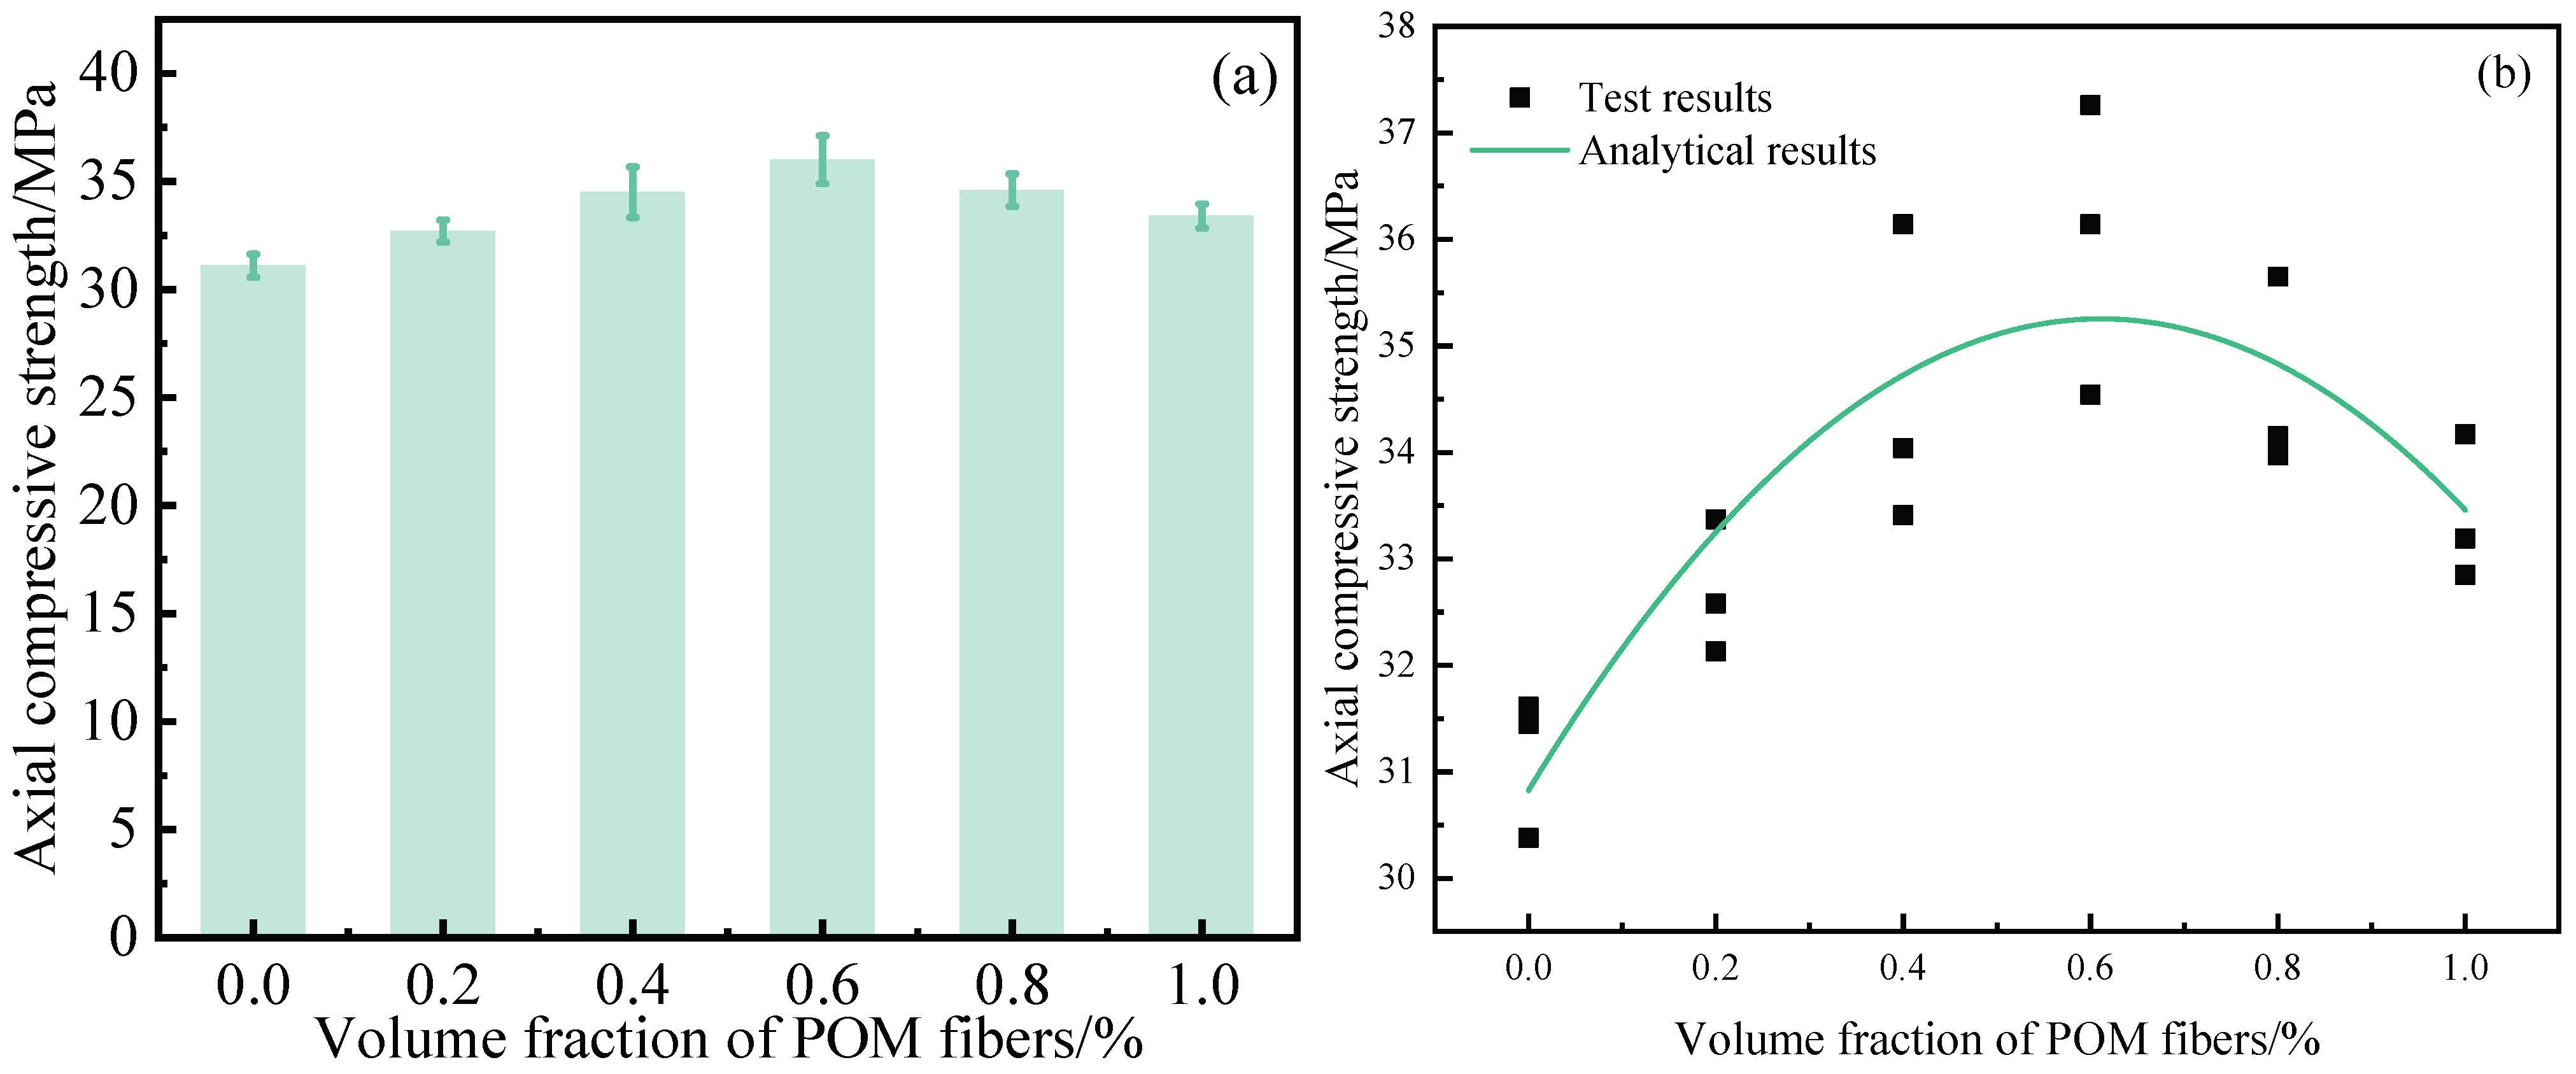
The average axial compressive strength of CAC specimens is shown in Figure 13a. A polynomial regression analysis was subsequently conducted on the experimental results, with the fitting results illustrated in Figure 13b.
As illustrated in Figure 13, the average axial compressive strength of CAC specimens initially increases and then decreases with increasing POM fiber volume fraction, mirroring the trend observed for cube compressive strength. At a POM fiber volume fraction of 0.6%, the peak axial compressive strength reaches 35.98 MPa, representing a 4.83 MPa improvement compared to NF.
Figure 14 demonstrates the distinct failure morphologies of CAC specimens under axial compression across varying fiber volume fractions. The NF group exhibited vertical microcracks during initial loading, which progressively developed into diagonal cracks, culminating in extensive concrete spalling and through-aggregate fractures—a hallmark of brittle failure. In contrast, POM fiber-reinforced specimens maintained post-failure integrity through fiber-mediated interlocking, with significantly reduced spalling volume and fragment count compared to NF. Partial fragments remained anchored by fibers, showcasing a characteristic fiber–matrix interfacial bond failure. The failure mechanisms of axial compressive specimens align with those of cubic specimens: POM fibers bridging vertical cracks effectively delayed microcrack propagation and suppressed macrocrack formation. Optimal structural integrity was achieved at 0.6% and 0.8% fiber volume fractions, with the FC0.8 group exhibiting diffuse crack patterns—a stark contrast to NF’s localized failure—attributed to fiber-induced mitigation of stress concentration. However, fiber dosages exceeding 0.8% reduced matrix densification, reintroducing diagonal cracking patterns akin to NF. These findings confirm that moderate POM fiber incorporation (0.6–0.8%) significantly enhances CAC’s ductility, while excessive dosages compromise performance. Through this toughening mechanism, catastrophic through-aggregate fractures in coral concrete are suppressed, enhancing synergistic load-bearing capacity between aggregates and the matrix.

5.5. The CAC Constitutive Model

The stress–strain full curve, the maximum strain ε c   and maximum stress σ c at failure, and the dimensionless stress–strain curve of the CAC blocks under different POM fiber content are shown in Figure 15. After the sample failure, the splitting test was stopped, so the stress–strain curve only shows the ascending part of the curve.
In the early stage of pressure loading, no initial microcracks appeared on the concrete surface, and the stress–strain curves of different blocks showed no significant difference, remaining in the linear elastic deformation stage. As the pressure increased, many microcracks were generated on the surface of the block, extending from the loading end downward and internally. The surface of the block showed no obvious cracks, and the slope of the curve gradually decreased. When the stress reached 0.85 σ c [45], the specimen exhibited noticeable lateral deformation and surface cracks, with crack development showing anisotropy. Due to the bridging effect of the POM fibers, compared with the NC group CAC specimen, the load-bearing capacity of the CAC specimen increased, the width of the surface cracks was smaller, and the curve remained relatively flat for a longer time before reaching the maximum failure stress.
Coral aggregates exhibit inherently low strength and pronounced brittle deformation characteristics. The incorporation of POM fibers enhances both the strength and toughness of the concrete. Due to its distinct deformation behavior compared to ordinary concrete, it is necessary to develop a constitutive model applicable to CAC containing POM fibers.
Based on existing research [43], the constitutive model of the coral aggregate concrete specimens was finally selected using the Guozhenhai model, the Sargin model, and the Carreira and Chu model to fit the stress–strain curves. The expressions for these curve equations are given in Equations (9)–(11), respectively.
Guozhenhai model y = a x + 3 2 a x 2 + ( a 2 ) x 3
Sargin model y = c 1 x + c 2 1 x 2 1 + c 1 x 2 x + c 2 x 2
Carreira and Chu model y = n x n 1 + x n
In the equations, x = ε / ε c , y = ε / ε c , where a , c 1 , c 2 , and n are constants specific to each model.
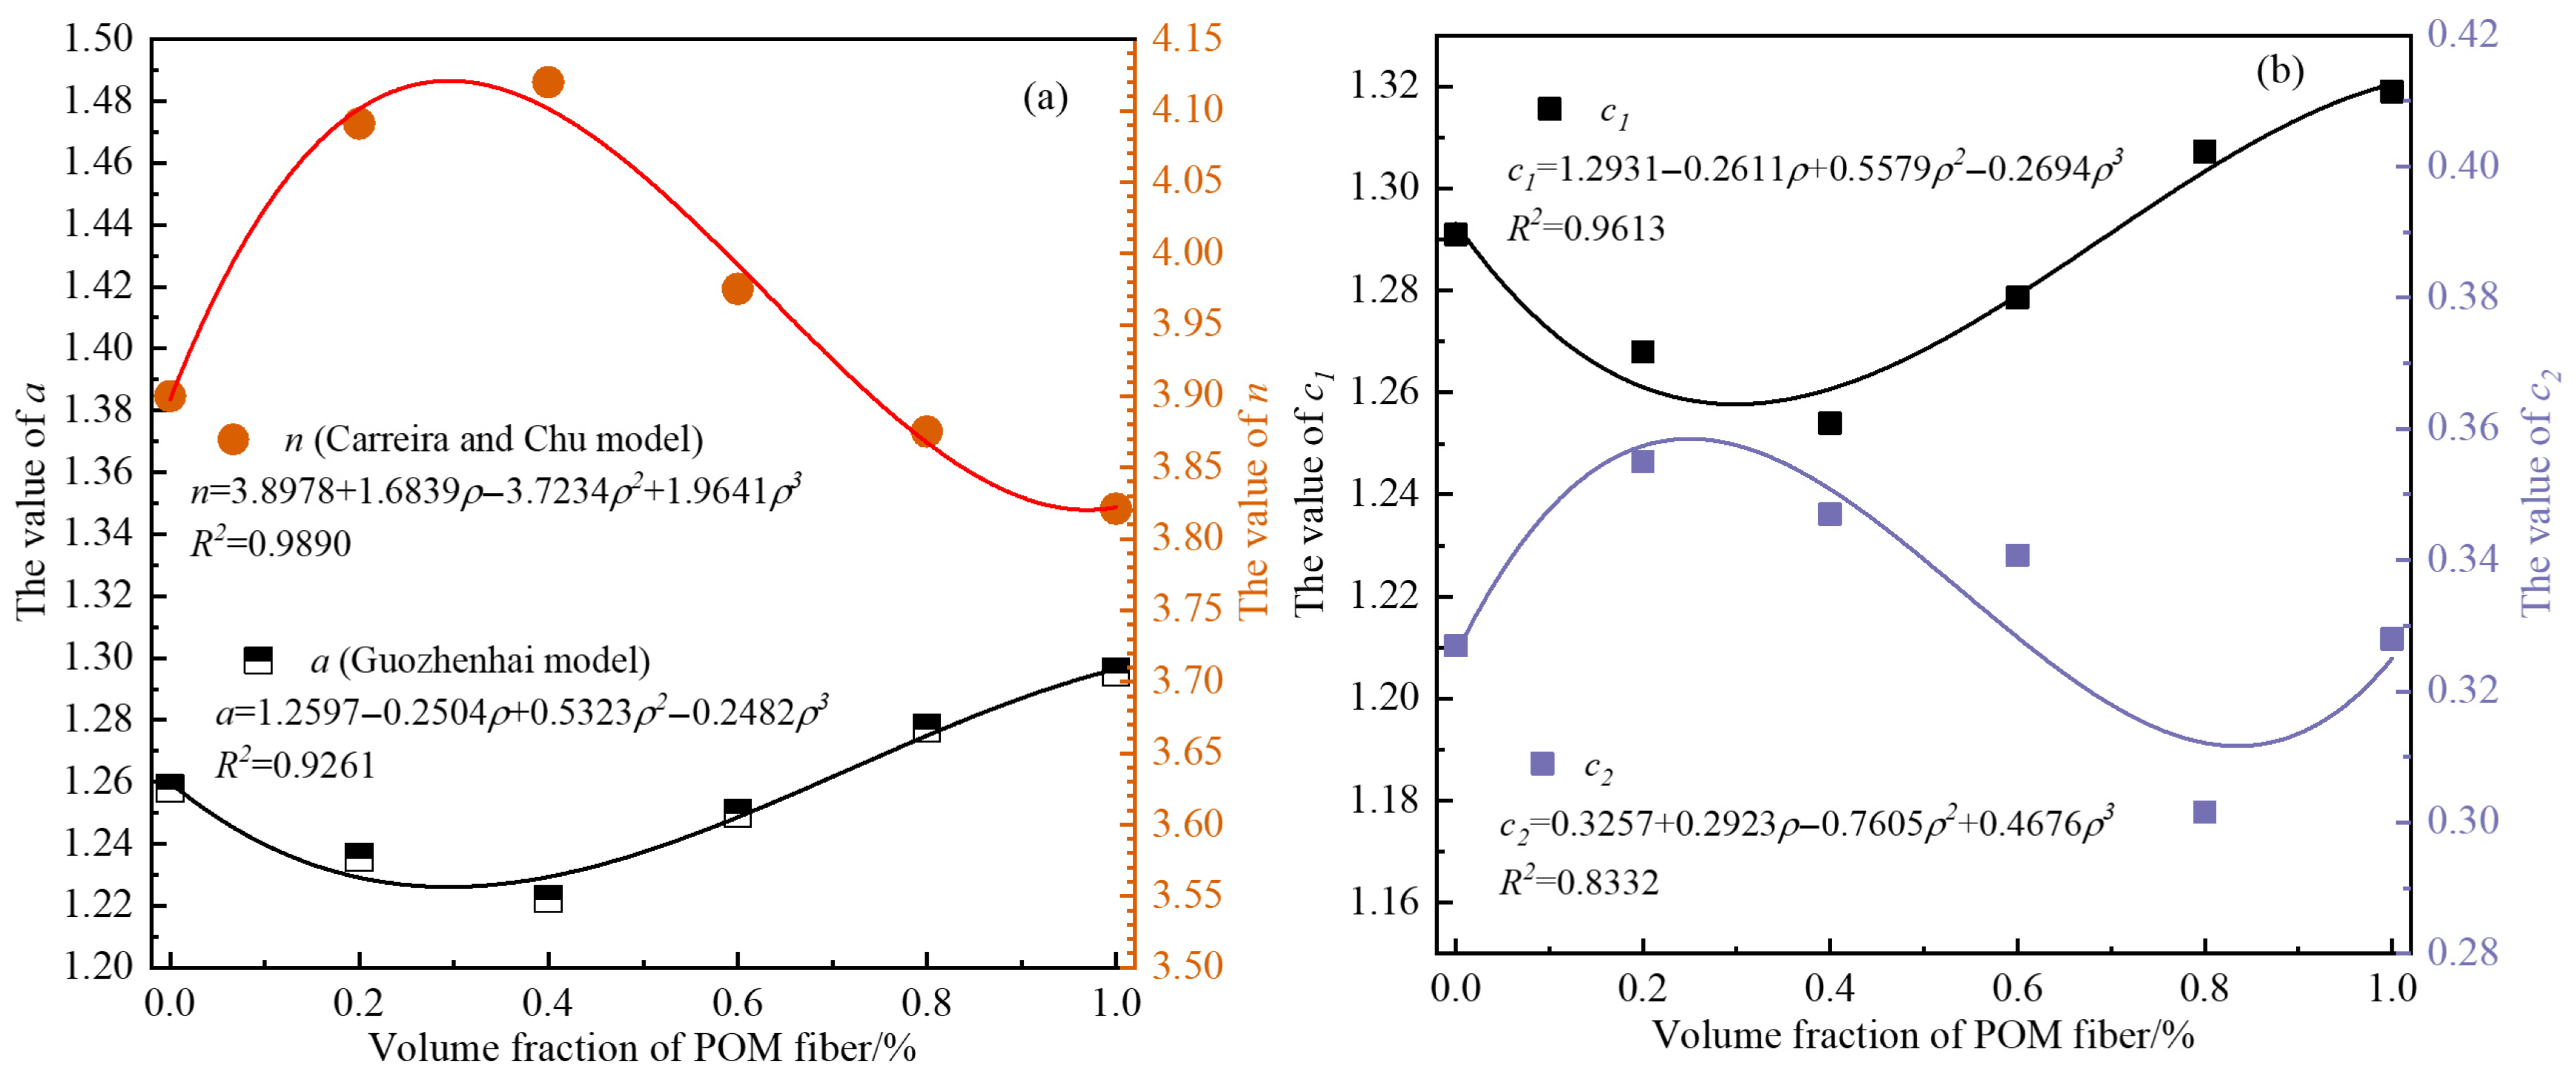
The nonlinear fitting of the dimensionless stress–strain curves of CAC specimens was performed using the above three models, yielding the governing constants a, c1, c2, and n for each constitutive equation. The computational results are presented in Table 11 and Figure 16. As shown in Figure 16, the value of a in the Guozhenhai model decreases initially then increases with increasing ρ; in the Sargin model, c1 first increases and then decreases with the value of ρ, while c2 first decreases and then increases. The variation in the control constant n in the Carreira and Chu model follows the same trend as parameter a in the Guozhenhai model. Table 11 demonstrates that all three models achieve the value of R2 exceeding 0.99 with experimental data, indicating excellent agreement and enabling accurate prediction of the stress–strain behavior in CAC specimens. R2 represents the goodness of fit of a regression model, calculated using Equation (12):
R 2 = 1 i = 1 n y i y i ^ 2 i = 1 n y i y ¯ 2
where y i is the i-th observed value, y ¯ is the mean of the observed values, y i ^ is the i-th predicted value, and n is the number of data points.
Due to the strong correlation between the governing constants of the model parameters and ρ, functional relationships were established for constants a, c1, c2, and n in the three constitutive equations. As shown in Figure 16b, the Sargin model involves two parameters with R2 values of 0.9613 and 0.8332 against ρ. Consequently, the Sargin model was excluded primarily due to its multi-parameter dependency. Figure 16a demonstrates that both the Guozhenhai and Carreira and Chu models employ a single governing parameter (a and n, respectively). The R2 values between ρ and the governing parameters a (Guozhenhai model) and n (Carreira and Chu model) are 0.9261 and 0.9890, respectively. Owing to its significantly superior correlation, the Carreira and Chu model was selected as the optimal constitutive framework for POM fiber-reinforced CAC. The functional relationship between n and ρ is given by Equation (13). Substituting Equation (13) into Equation (13) yields the modified Carreira and Chu model, expressed as Equation (14).
a = 3.8978 + 1.6839 ρ 3.7234 ρ 2 + 1.9641 ρ 3
y = 3.8978 + 1.6839 ρ 3.7234 ρ 2 + 1.9641 ρ 3 x 2.8978 + 1.6839 ρ 3.7234 ρ 2 + 1.9641 ρ 3 + x 3.8978 + 1.6839 ρ 3.7234 ρ 2 + 1.9641 ρ 3

5.6. The Model Validation

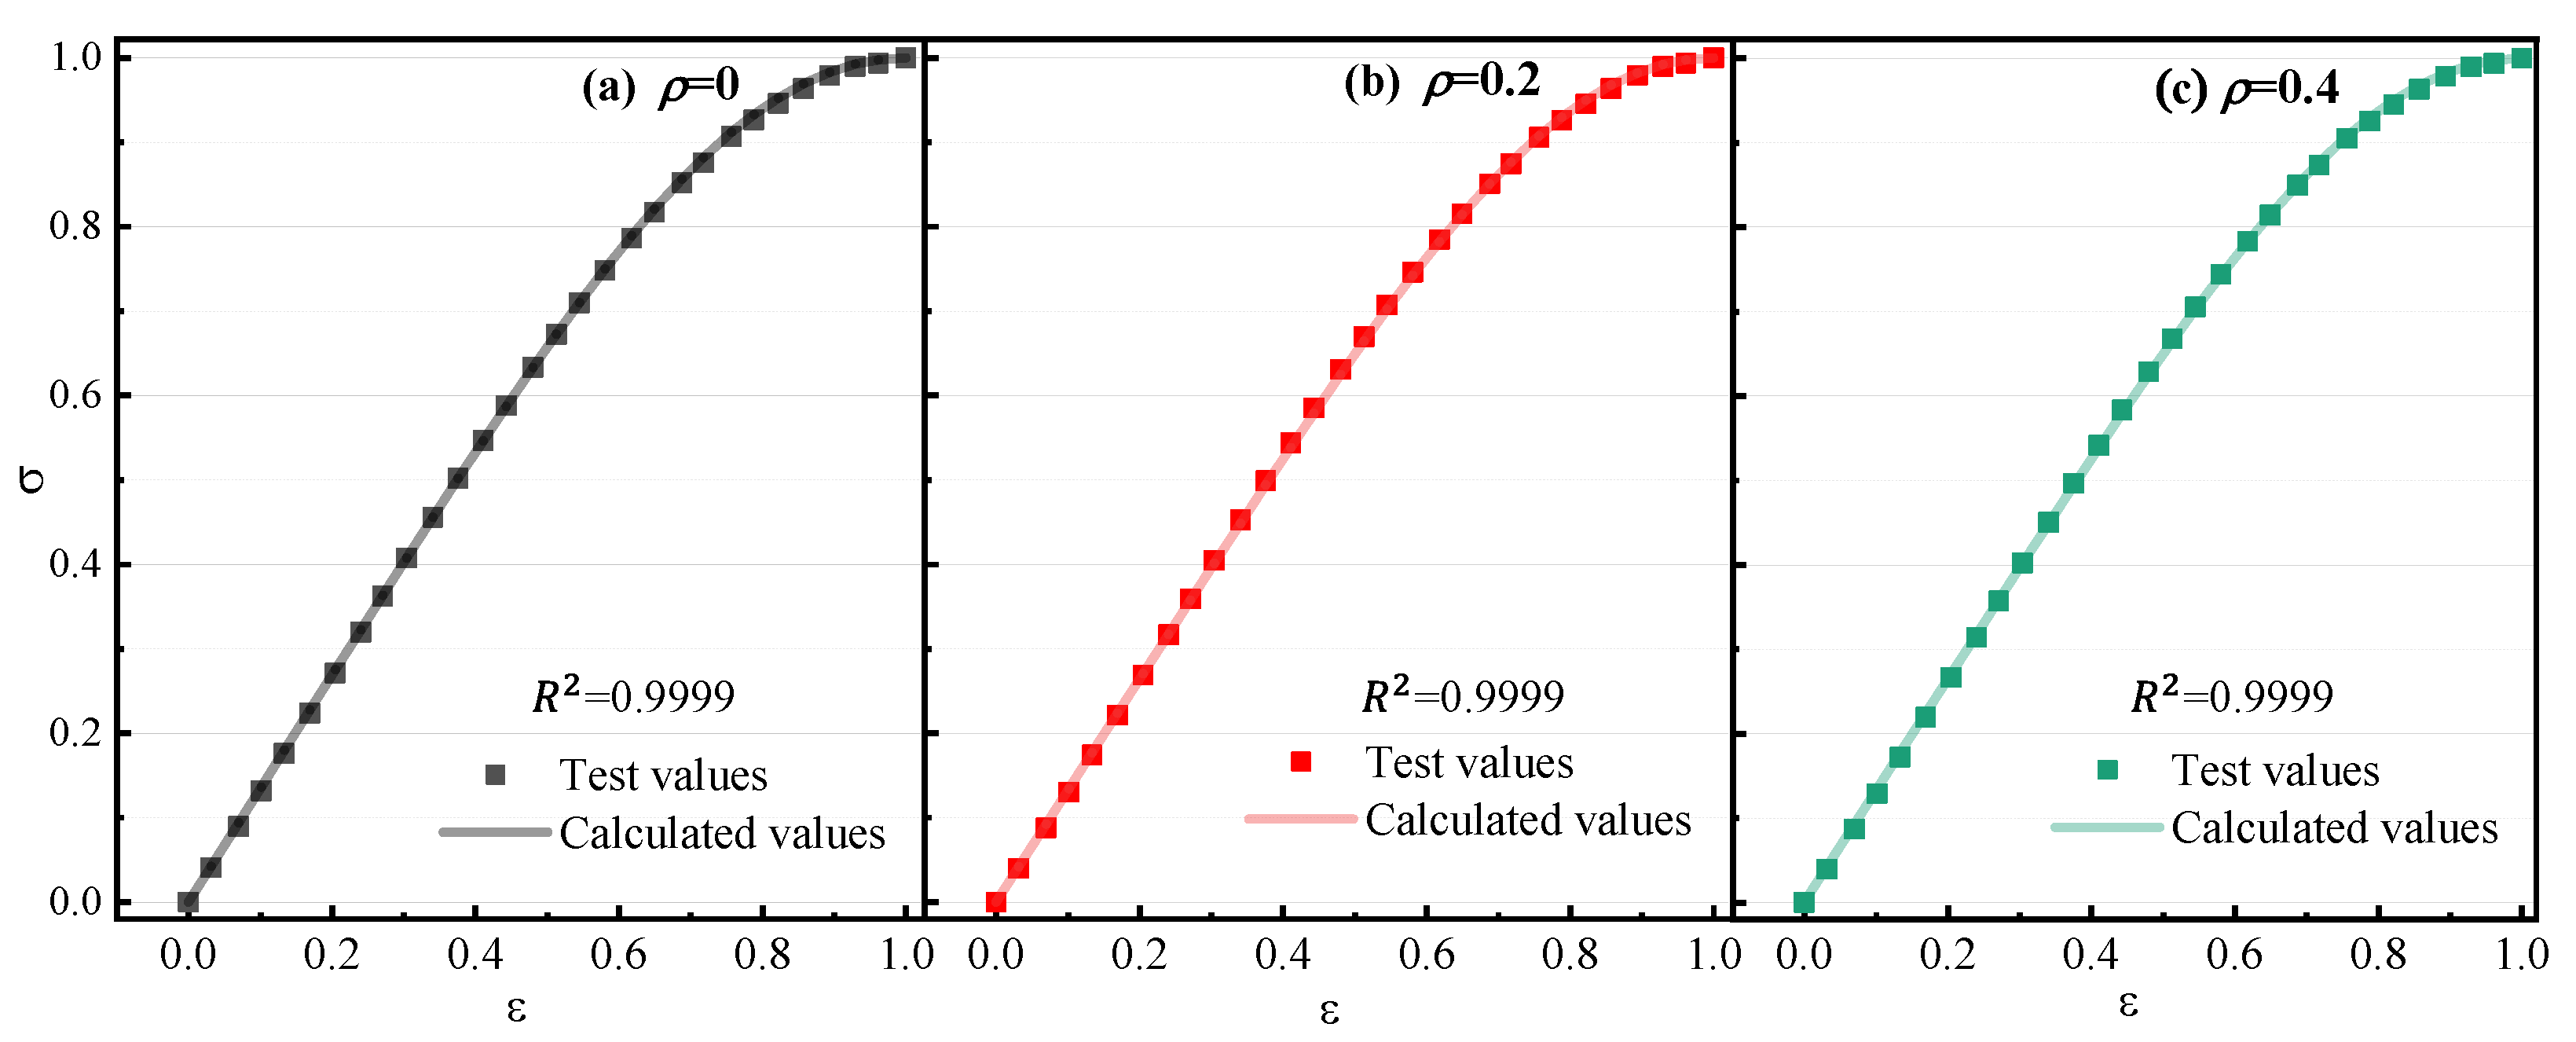
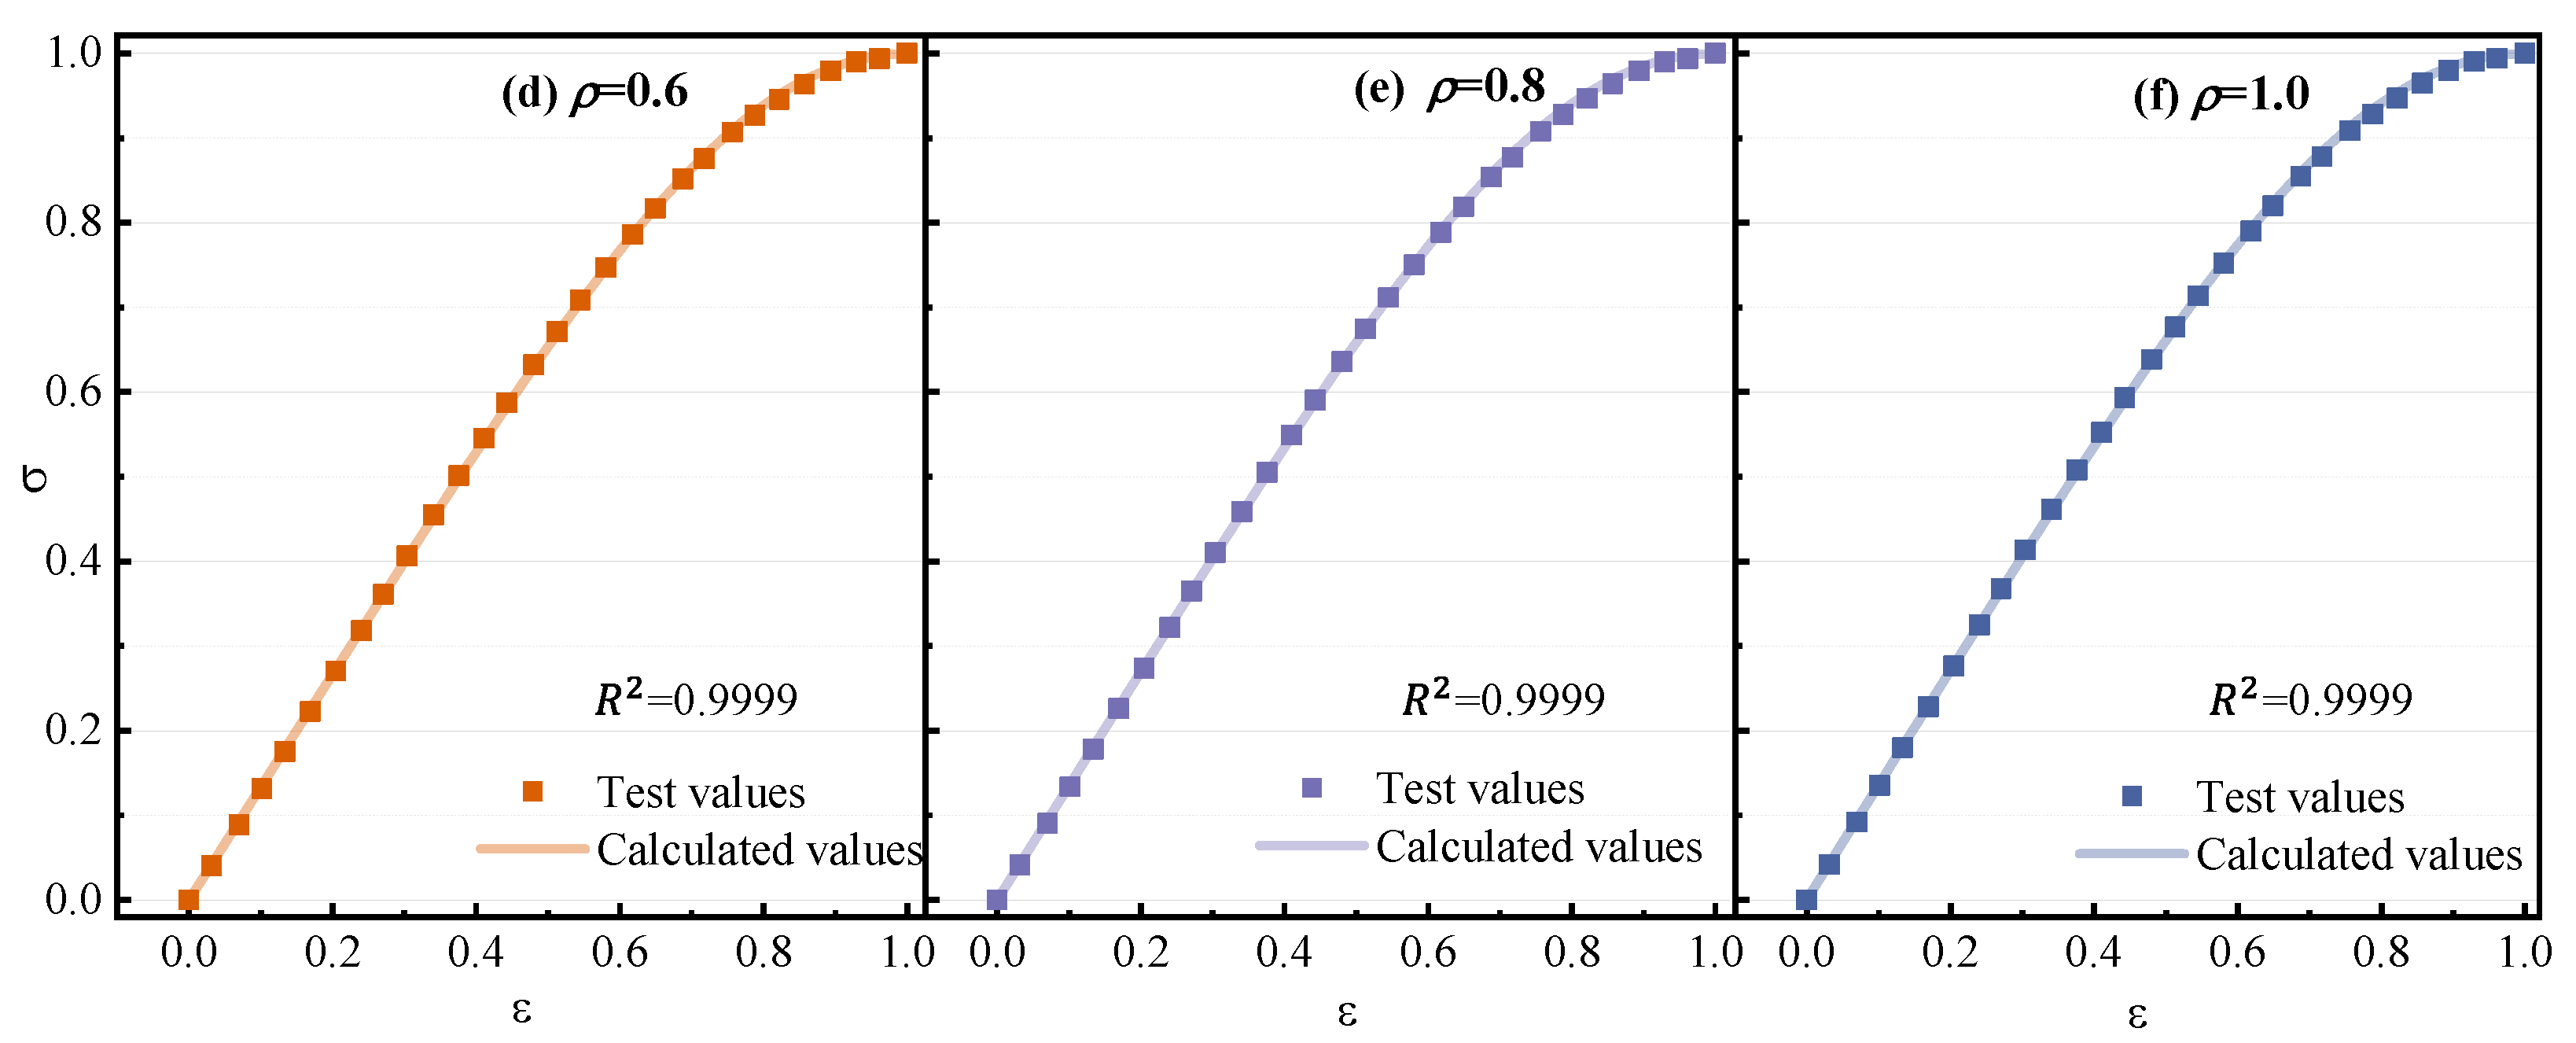
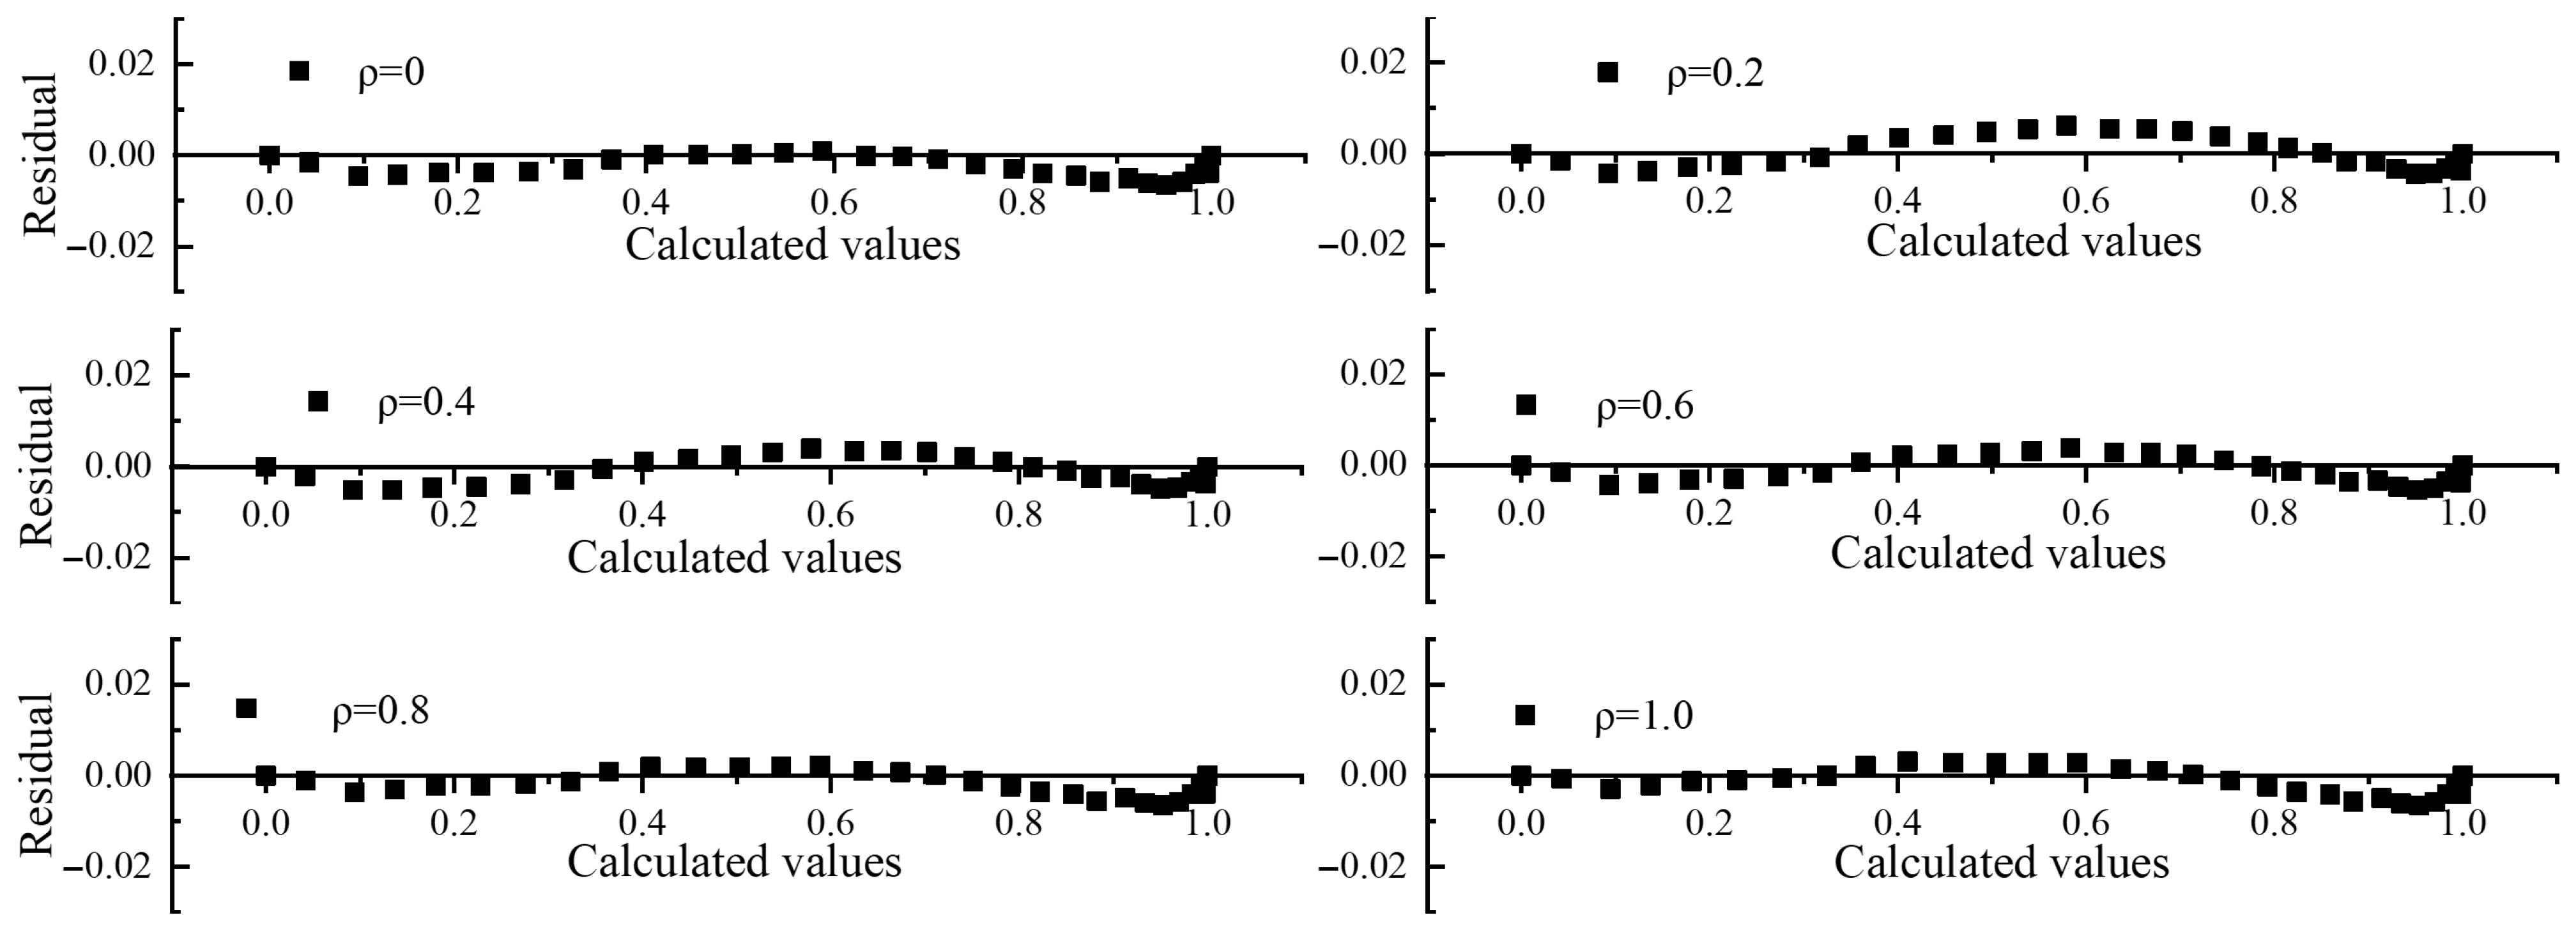
The experimental stress–strain data of CAC specimens under varying POM fiber contents and the corresponding predictions of the modified Carreira and Chu model are presented in Figure 17, with residuals shown in Figure 18. The fitted curves for all test groups achieve R2 values exceeding 0.9999, indicating near-perfect agreement between model predictions and experimental results. Calculated curves align closely with measured data points without discernible deviations, demonstrating consistent accuracy across different fiber volume fractions.
In Figure 18, residuals are randomly distributed about the zero-reference line with no systematic trends. The maximum absolute residual is approximately 0.02—a negligible deviation relative to the stress magnitude. Critically, residual distribution patterns remain consistent across all POM fiber contents, confirming stable error control despite parameter variations.
In summary, the model exhibits exceptional performance in both statistical goodness-of-fit and engineering error stability, providing a highly accurate representation of the stress–strain behavior of POM fiber-reinforced CAC specimens.

6. Conclusions

This study investigates the effect of fiber content on the early mechanical properties of coral aggregate concrete (CAC) by preparing specimens containing varying volume fractions of POM fibers. It proposes the optimal fiber content range and establishes a constitutive model suitable for CAC specimens. The main conclusions are as follows:
(1)
POM fibers reduce the slump and slump flow of CAC. With increasing POM fiber volume fraction, the cube compressive strength, axial compressive strength, split tensile strength, and flexural strength of CAC first increase and then decrease. All strength values peak at a POM fiber volume fraction of 0.6%, reaching 39.6 MPa, 35.98 MPa, 2.27 MPa, and 4.34 MPa, respectively. Compared to the NF group, these properties improved by 14.78%, 15.50%, 17.01%, 46.13%, and 3.69%, respectively. POM fiber incorporation significantly enhances the early mechanical properties of CAC specimens.
(2)
At the optimal ρ, POM fibers distribute uniformly within the specimens, forming a three-dimensional network structure that suppresses crack propagation and redistributes stress. The interfacial bonding between fibers and the matrix delays microcrack initiation, reduces the width of primary cracks, and transforms the failure mode of CAC from brittle to ductile. Additionally, fiber addition lowers specimen porosity and strengthens the synergistic load-bearing capacity between aggregates and the cementitious matrix. When the POM fiber volume fraction exceeds 0.8%, fiber agglomeration increases localized porosity and creates interfacial weak zones, which act as stress concentration points and degrade mechanical performance. Thus, the optimal synergistic effect is achieved within the fiber dosage range of 0.6–0.8%.
(3)
Based on the stress–strain curves under different POM fiber contents, a modified Carreira–Chu constitutive model incorporating volume fraction (ρ) was established. The goodness-of-fit (R2) for the entire stress process of CAC exceeded 0.99, enabling accurate prediction of its mechanical behavior. This provides a reliable theoretical tool for engineering design and technical support for the efficient conversion and green application of coral aggregates—a low-carbon resource—in marine engineering.
This study only analyzed the influence of POM fibers on the mechanical properties of coral concrete at 28 days of age. Further research can be conducted to study the durability, bonding performance, and shrinkage performance of CAC with POM fiber in marine environments, providing more comprehensive data support for the engineering application of CAC. Furthermore, within the framework of relevant administrative regulations, further investigation is needed to explore the possibility of achieving sustainable development of marine resources and environment by utilizing local materials and properly managing coral debris waste.

Author Contributions

J.W.: Writing—original draft, Conceptualization, Investigation, Methodology, Data curation, Supervision, Funding acquisition; W.S.: Writing—original draft, Writing—review and editing, Formal analysis, Supervision. L.T.: Writing—original draft, Writing—review and editing, Formal analysis, Supervision. All authors have read and agreed to the published version of the manuscript.

Funding

This article was Supported by the Key project of science and technology research program of Chongqing Education Commission of China (KJZD-K202503205).

Data Availability Statement

The original contributions presented in the study are included in the article. Further inquiries can be directed to the corresponding author.

Conflicts of Interest

The authors declare no conflicts of interest.

References

  1. Cui, Y.; Jiang, J.; Fu, T.; Liu, S. Feasibility of using Waste Brine/Seawater and Sea Sand for the Production of Concrete: An Experimental Investigation from Mechanical Properties and Durability Perspectives. Sustainability 2022, 14, 13340. [Google Scholar] [CrossRef]
  2. Ganesan, K.; Kanagarajan, V.; Dominic, J.R.J. Influence of marine sand as fine aggregate on mechanical and durability properties of cement mortar and concrete. Mater. Res. Express 2022, 9, 035504. [Google Scholar] [CrossRef]
  3. Hayek, M.; Soleimani, T.; Salgues, M.; Souche, J.C. Utilizing Fine Marine Sediment as a Partial Substitute for Sand in Self-Compacting Concrete Specially Designed for Application in Marine Environments. Sustainability 2024, 16, 2538. [Google Scholar] [CrossRef]
  4. Wang, A.; Lyu, B.; Zhang, Z.; Liu, K.; Xu, H.; Sun, D. The development of coral concretes and their upgrading technologies: A critical review. Constr. Build. Mater. 2018, 187, 1004–1019. [Google Scholar] [CrossRef]
  5. Sun, L.; Wang, C.; Zhang, C.; Yang, Z.; Li, C.; Qiao, P. Experimental investigation on the bond performance of sea sand coral concrete with FRP bar reinforcement for marine environments. Adv. Struct. Eng. 2022, 26, 533–546. [Google Scholar] [CrossRef]
  6. Sun, L.; Yang, Z.; Qin, R.; Wang, C. Mix design optimization of seawater sea sand coral aggregate concrete. Sci. China Technol. Sci. 2022, 66, 378–389. [Google Scholar] [CrossRef]
  7. Zhang, B.; Zhu, H.; Dong, Z.; Yang, Z. Mechanical properties and durability of FRP-reinforced coral aggregate concrete structures: A critical review. Mater. Today Commun. 2023, 35, 105656. [Google Scholar] [CrossRef]
  8. Zhang, X.; Niu, D. Dynamic compressive behavior of hybrid basalt-polypropylene fibers reinforced coral aggregate concrete. J. Build. Eng. 2024, 95, 110291. [Google Scholar] [CrossRef]
  9. Wang, Y.; Shui, Z.; Gao, X.; Huang, Y.; Yu, R.; Li, X. Utilizing coral waste and metakaolin to produce eco-friendly marine mortar: Hydration, mechanical properties and durability. J. Clean. Prod. 2019, 219, 763–774. [Google Scholar] [CrossRef]
  10. Chen, Y.; Li, P.; Zhang, S. Experimental investigation on triaxial mechanical properties of coral coarse aggregate-sea sand seawater concrete. Constr. Build. Mater. 2023, 409, 134213. [Google Scholar] [CrossRef]
  11. Da, B.; Huang, H.; Tao, T.; Chen, Y.; Chen, D. Experimental and numerical investigations on the mechanical properties of coral aggregate seawater concrete. Eng. Fract. Mech. 2024, 310, 110498. [Google Scholar] [CrossRef]
  12. Guo, R.; Dong, J.; Ma, L.; Long, Z.; Xu, F.; Yin, C. Three-dimensional mesoscopic investigation on the dynamic compressive behavior of coral sand concrete with reinforced granite coarse aggregate (GCA). Compos. Struct. 2025, 352, 118650. [Google Scholar] [CrossRef]
  13. Huang, Y.; Cheng, Z.; Dong, L.; Cao, P.; Zhong, J.; Wang, Q.; Loan, P. Experimental and analytical studies on the improvements in mechanical properties of coral aggregates concrete through aggregates strengthening method. Constr. Build. Mater. 2024, 438, 137243. [Google Scholar] [CrossRef]
  14. Cao, S.; Zheng, D.; Yilmaz, E.; Yin, Z.; Xue, G.; Yang, F. Strength development and microstructure characteristics of artificial concrete pillar considering fiber type and content effects. Constr. Build. Mater. 2020, 256, 119408. [Google Scholar] [CrossRef]
  15. Shafiei, S.; Mohammadi, Y. Effect of AR-glass fibers and natural micronized zeolite on mechanical and permeability properties of concrete exposed to normal, sodium chloride, and magnesium sulfate environments. Constr. Build. Mater. 2024, 457, 139288. [Google Scholar] [CrossRef]
  16. Zhu, L.; Wen, T.; Tian, L. Size effects in compressive and splitting tensile strengths of polypropylene fiber recycled aggregate concrete. Constr. Build. Mater. 2022, 341, 127878. [Google Scholar] [CrossRef]
  17. Shi, F.; Yin, S.; Pham, T.M.; Tuladhar, R.; Hao, H. Pullout and flexural performance of silane groups and hydrophilic groups grafted polypropylene fibre reinforced UHPC. Constr. Build. Mater. 2021, 277, 122335. [Google Scholar] [CrossRef]
  18. Ye, J.; Cui, C.; Yu, J.; Yu, K.; Dong, F. Effect of polyethylene fiber content on workability and mechanical-anisotropic properties of 3D printed ultra-high ductile concrete. Constr. Build. Mater. 2021, 281, 122586. [Google Scholar] [CrossRef]
  19. Adebayo, I.W.; Long, G.; Tang, Z.; Ghone, M.O.; Zaland, S.; Garba, M.J.; Yang, K.; Akhunzada, K.; Oluwasina, U.A. Effect of crumb rubber and polyethylene fiber on the strength and toughness of fly ash/slag-based geopolymer concrete. Constr. Build. Mater. 2024, 455, 139133. [Google Scholar] [CrossRef]
  20. Guo, W.; Ding, Y.; Randl, N. Effect of macro polyoxymethylene fibers on shear transfer across a crack and crack surface topography of concrete. Constr. Build. Mater. 2025, 464, 140118. [Google Scholar] [CrossRef]
  21. Zhang, J.; Li, B.; Chen, W.; Guo, R. Experimental investigations on tensile strength and fracture toughness of a polyoxymethylene fiber reinforced concrete. Theor. Appl. Fract. Mec. 2024, 130, 104250. [Google Scholar] [CrossRef]
  22. Hua, J.; Yang, Z.; Xue, X.; Huang, L.; Wang, N.; Chen, Z. Bond properties of bimetallic steel bar in seawater sea-sand concrete at different ages. Constr. Build. Mater. 2022, 323, 126539. [Google Scholar] [CrossRef]
  23. Wang, F.; Xue, X.; Hua, J.; Wang, N.; Yao, Y. Properties of polyoxymethylene fibre-reinforced seawater sea sand concrete exposed to high temperatures. Constr. Build. Mater. 2023, 409, 133854. [Google Scholar] [CrossRef]
  24. Yan, Y.; Guo, R.; Wei, Y.; Pan, T.; Li, X.; Tan, L. Strain-rate sensitivity analysis of the fracture behaviour of polyoxymethylene-fibre-reinforced airport-pavement concrete. Constr. Build. Mater. 2023, 402, 133048. [Google Scholar] [CrossRef]
  25. Xue, X.; Wang, F.; Hua, J.; Wang, N.; Huang, L.; Chen, Z.; Yao, Y. Effects of Polyoxymethylene Fiber on Fresh and Hardened Properties of Seawater Sea-Sand Concrete. Polymers 2022, 14, 4969. [Google Scholar] [CrossRef]
  26. Wang, F.; Hua, J.; Xue, X.; Wang, N.; Yao, Y. Effects of Polyoxymethylene Fiber on Mechanical Properties of Seawater Sea-Sand Concrete with Different Ages. Polymers 2022, 14, 3472. [Google Scholar] [CrossRef]
  27. Dong, J.; Zong, Y.; Shang, X.; Chen, X.; Tu, Z.; Jiang, R.; Zhu, Z. Impact of Various Erosive Environments on the Durability of POM Fiber-Reinforced Ultra-High-Performance Concrete. Buildings 2024, 14, 4048. [Google Scholar] [CrossRef]
  28. Ding, Y.; Guo, W.; Li, D.; Pacheco-Torgal, F. Exploring the effect of polyoxymethylene fiber on concrete toughness and self-sensing capability of concrete cracking under bending. Constr. Build. Mater. 2024, 454, 138933. [Google Scholar] [CrossRef]
  29. GB/T 50081-2019; Standard for Test Method of Mechanical Properties on Ordinary Concrete. Ministry of Housing and Urban-Rural Development of the People’s Republic of China and State Administration for Market Regulation: Beijing, China, 2019.
  30. GB/T 17431.2-2010; Lightweight Aggregates and Its Test Methods—Part 2: Test Methods for Lightweight Aggregates. General Administration of Quality Supervision, Inspection and Quarantine of the People’s Republic of China and Standardization Administration of the People’s Republic of China: Beijing, China, 2010.
  31. GB/T 21120-2018; Synthetic Fibres for Cement Concrete and Mortar. State Administration for Market Regulation and Standardization Administration of the People’s Republic of China: Beijing, China, 2018.
  32. GB 8076-2008; Concrete Admixtures. General Administration of Quality Supervision, Inspection and Quarantine of the People’s Republic of China and Standardization Administration of the People’s Republic of China: Beijing, China, 2008.
  33. JGJ/T 12-2019; Technical Standard for Application of Lightweight Aggregate Concrete. Ministry of Housing and Urban-Rural Development of the People’s Republic of China: Beijing, China, 2019.
  34. GB/T 50080-2016; Standard for Test Method of Performance on Ordinary Fresh Concrete. Ministry of Housing and Urban-Rural Development of the People’s Republic of China and General Administration of Quality Supervision, Inspection and Quarantine of the People’s Republic of China: Beijing, China, 2016.
  35. Liu, B.; Wang, F.; Zou, C.; Ming, Y.; Qin, J.; Qian, K. Comparison of the mechanical properties and constitutive models of carbon fiber-reinforced coral concrete cubes and prisms under uniaxial compression. J. Build. Eng. 2024, 98, 111247. [Google Scholar] [CrossRef]
  36. Dai, J.; Yin, S.; Wang, F.; Ge, M. Analysis of microstructure and compressive properties of full coral concrete under fiber reinforcement. J. Build. Eng. 2024, 93, 109826. [Google Scholar] [CrossRef]
  37. Xu, Q.; Jiang, X.; Zhang, Z.; Xu, C.; Zhang, J.; Zhou, B.; Hang, W.; Zheng, Z. Experimental study on residual mechanical properties of steel-PVA hybrid fiber high performance concrete after high temperature. Constr. Build. Mater. 2025, 458, 139735. [Google Scholar] [CrossRef]
  38. Zhang, X.; Zhu, Y.; Shen, Y.; Wang, J.; Fan, Y.; Gao, X.; Huang, Y. Compressive mechanical performance and microscopic mechanism of basalt fiber-reinforced recycled aggregate concrete after elevated temperature exposure. J. Build. Eng. 2024, 96, 110647. [Google Scholar] [CrossRef]
  39. Das, C.S.; Dey, T.; Dandapat, R.; Mukharjee, B.B.; Kumar, J. Performance evaluation of polypropylene fibre reinforced recycled aggregate concrete. Constr. Build. Mater. 2018, 189, 649–659. [Google Scholar] [CrossRef]
  40. Gao, D.; Wang, F. Effects of recycled fine aggregate and steel fiber on compressive and splitting tensile properties of concrete. J. Build. Eng. 2021, 44, 102631. [Google Scholar] [CrossRef]
  41. Wang, X.; Zhang, S.; Wang, C.; Cao, K.; Wei, P.; Wang, J. Effect of steel fibers on the compressive and splitting-tensile behaviors of cellular concrete with millimeter-size pores. Constr. Build. Mater. 2019, 221, 60–73. [Google Scholar] [CrossRef]
  42. Guo, Z.; Shi, X. Principles of Reinforced Concrete; Tsinghua University Press: Beijing, China, 2013. [Google Scholar]
  43. Yao, Y. Study on Mechanical Properties and High Temperature Resistance of Polyoxymethylene Fiber Seawater and Sea-Sand Concrete; Chongqing University: Chongqing, China, 2022. [Google Scholar]
  44. Cai, Z.; Li, S. The Experimental Correlation Between Flexural Tensile Strength and Flexural Compressive Strength of Cement Concrete Pavement. China J. Highw. Transp. 1992, 5, 14–20. [Google Scholar]
  45. Cui, T.; He, H.; Yan, W. Experimental Research on Uniaxial Compression Constitutive Model of Hybrid Fiber-Reinforced Cementitious Composites. Materials 2019, 12, 2370. [Google Scholar] [CrossRef]
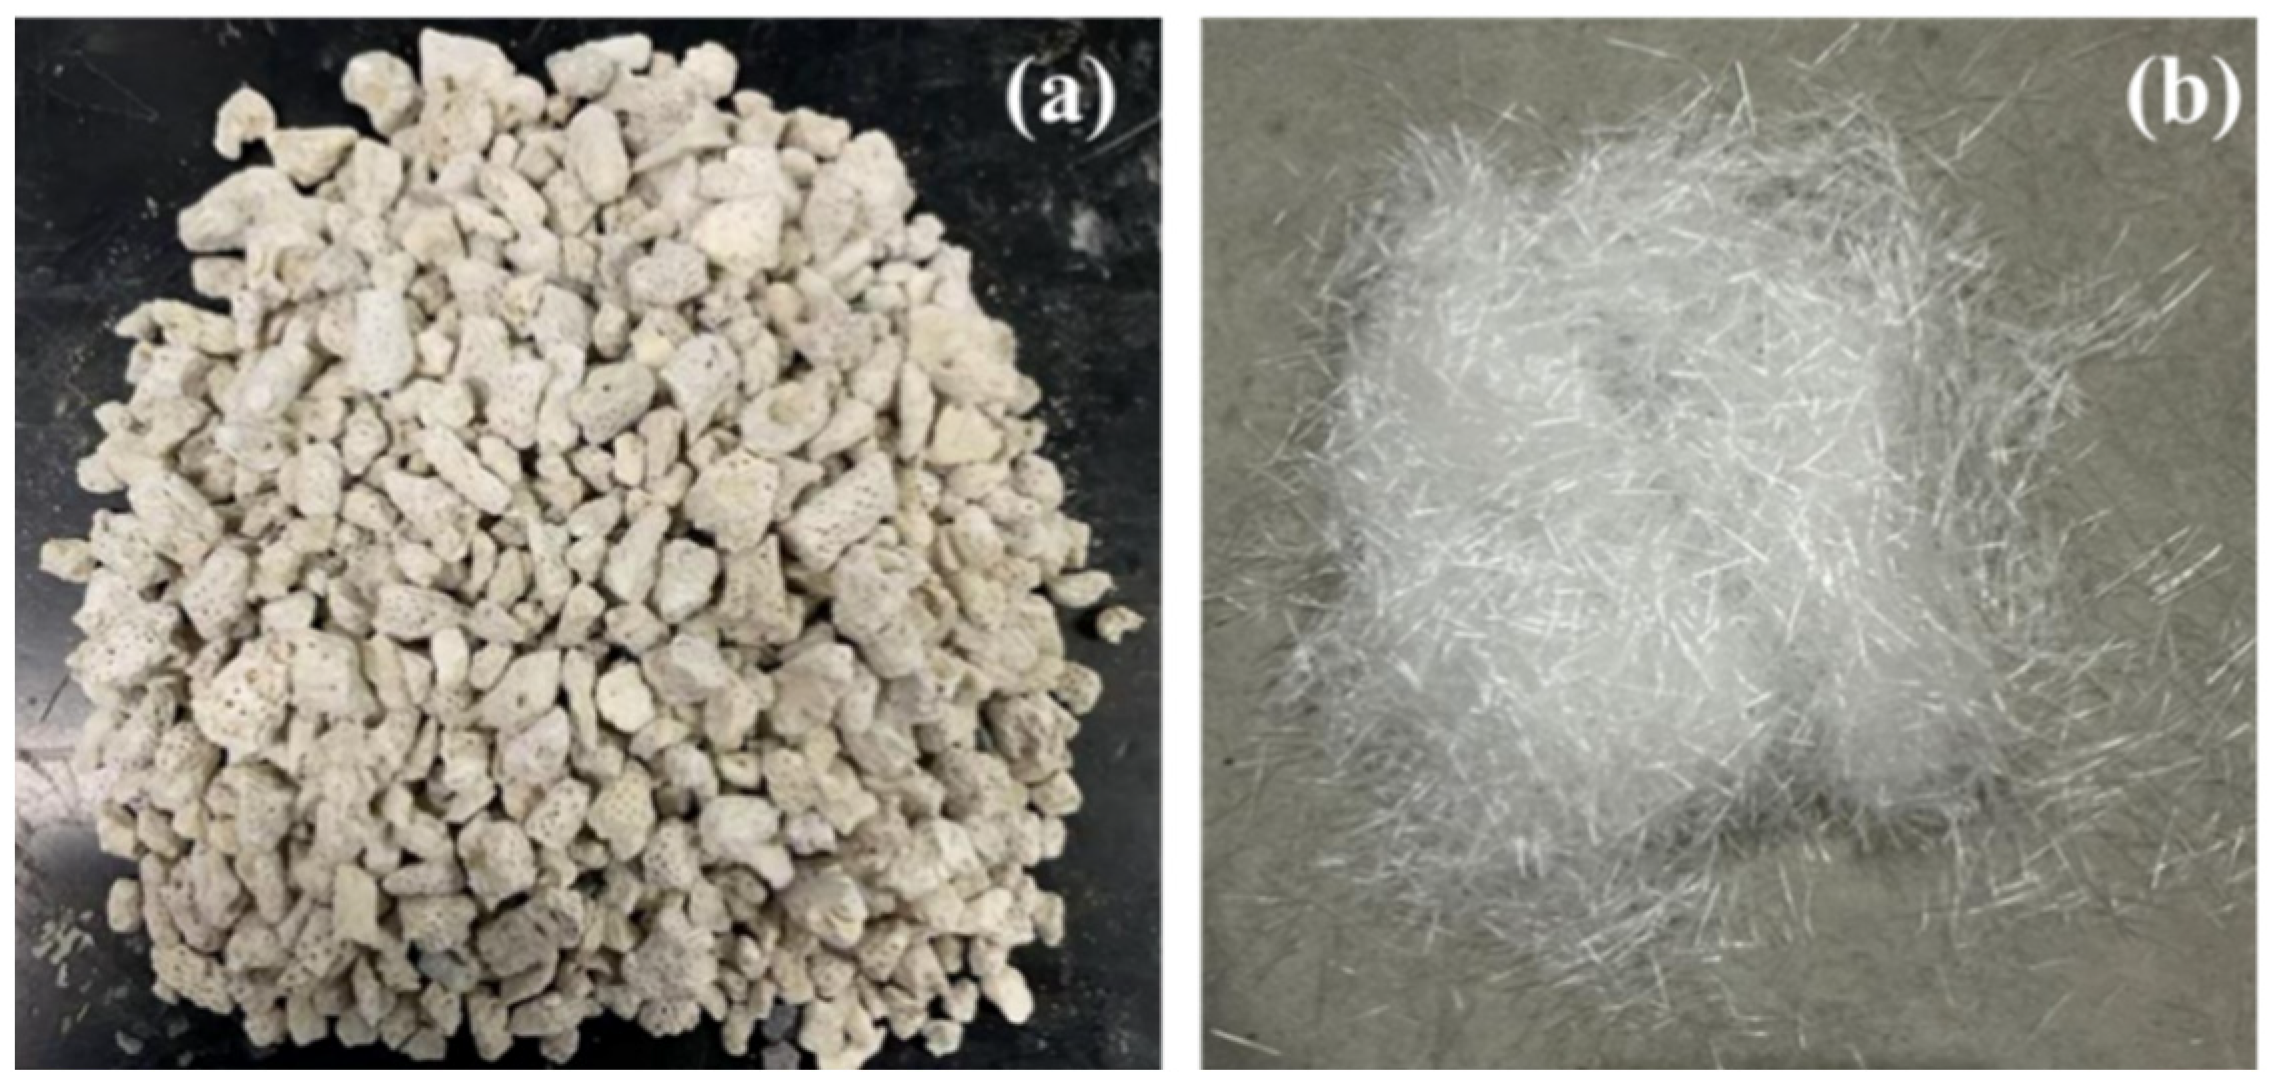
Figure 1. The material of CAC: (a) Coral aggregate; (b) POM fiber.
Buildings 15 03344 g001
Figure 2. Workability test: (a) slump test; (b) slump flow test; (c) test results of workability of coral concrete.
Buildings 15 03344 g002
Figure 3. Mechanical Test: (a) universal testing machine; (b) cube compressive test; (c) axial compressive test; (d) splitting tensile test; (e) flexural test.
Buildings 15 03344 g003
Figure 4. (a) Mean f c u of CAC specimens with different ρ; (b) Comparison between analytical results and test results of f c u .
Buildings 15 03344 g004
Figure 5. Comparison of compressive strength between POM-CAC and other types of fiber-reinforced concrete [35,36,37,38].
Buildings 15 03344 g005
Figure 6. Failure performances of CAC specimens after the cube compressive test: (a) NF; (b) FC-0.6; (c) Bridging effect from POM fiber.
Buildings 15 03344 g006
Figure 7. (a) f t s of CAC specimens with different ρ; (b) Comparison between analytical and test results of f t s .
Buildings 15 03344 g007
Figure 8. Comparison of splitting tensile between POM-CAC and other types of fiber-reinforced concrete [37,39,40,41].
Buildings 15 03344 g008
Figure 9. Failure performances of CAC specimens after the splitting tensile test: (a) NF; (b) FC-0.2; (c) FC-0.4; (d) FC-0.6; (e) FC-0.8; (f) FC-1.
Buildings 15 03344 g009
Figure 10. (a) f f of CAC specimens with different ρ; (b) Comparison between analytical and test results of f f .
Buildings 15 03344 g010
Figure 11. Failure performances of CAC specimens after the flexural test: (a) NF; (b) FC-0.2; (c) FC-0.4; (d) FC-0.6; (e) FC-0.8; (f) FC-1.
Buildings 15 03344 g011
Figure 12. Test flexural strength, calculate flexural strength, and the ratio between them.
Buildings 15 03344 g012
Figure 13. (a) f c p of CAC specimens with different ρ; (b) Comparison between analytical and test results of f c p .
Buildings 15 03344 g013
Figure 14. Failure performances of CAC specimens after the axial compressive test: (a) NF; (b) FC-0.2; (c) FC-0.4; (d) FC-0.6; (e) FC-0.8; (f) FC-1.
Buildings 15 03344 g014
Figure 15. Uniaxial compression stress–strain curves of CAC specimens: (a) Complete stress–strain curves with corresponding ε c   and σ c at failure; (b) Normalized stress–strain curves.
Buildings 15 03344 g015
Figure 16. Functional relationships between model parameters and ρ with corresponding R2 values: (a) Guozhenhai model and Carreira and Chu model; (b) Sargin model.
Buildings 15 03344 g016
Figure 17. Comparisons of experimental results with the calculated values originated from the constitutive model.
Buildings 15 03344 g017aBuildings 15 03344 g017b
Figure 18. The residual plots of the modified Carreira and Chu model.
Buildings 15 03344 g018
Table 1. Physical properties of coral aggregate.
Apparent DensityBulk DensityVoid Content1 h Water AbsorptionCylindrical Strength
1886 k g / m 3 963   k g / m 3 49.9%12.1%2.9 MPa
Note: All indexes listed here are measured referring to GB/T 17431.2-2010 [30] lightweight aggregates and its test methods—part 2: test methods for lightweight aggregates.
Table 2. Physical properties of POM fiber.
Melting PointTensile StrengthElongationElastic ModulusDensity
165 °C967 MPa18%8 GPa1400 k g / m 3
Note: All indexes listed here are measured referring to GB/T 21120-2018 [31] ynthetic fibers for cement concrete and mortar.
Table 3. Mix proportions.
TypesW/BCement
(kg/m3)
Coral Aggregate
(kg/m3)
Sand (kg/m3)Water
(kg/m3)
POM Fiber
(kg/m3)
Fiber Volume
Fraction (%)
F0.3500640107415000
FC-0.20.350064010741502.80.2
FC-0.40.350064010741505.60.4
FC-0.60.350064010741508.40.6
FC-0.80.3500640107415011.20.8
FC-1.00.35006401074150141.0
Table 4. Specimen dimensions and calculation formula of mechanical test.
Mechanical TestSpecimen Dimensions
(mm3)
Calculation FormulaParameter Definitions
Cube compressive test100 × 100 × 100 f c u = F A f c u : Cube Compressive strength, MPa
F : Specimen failure load, N
A: Specimen bearing area, m m 2
Axial compressive test150 × 150 × 300 f c p = F A f c p : axial compressive strength, MPa
Splitting tensile test100 × 100 × 100 f t s = 2 F π A f t s : splitting tensile strength, MPa
Flexural test100 × 100 × 400 f f = F l b h 2 f f : flexural strength, MPa
l : span between supports, m m
b : specimen cross-sectional width, m m
h : specimen cross-sectional height, m m
Table 5. Mechanical properties of CAC specimens with different POM fiber contents.
Number f c u
(MPa)
f c u -Mean
(MPa)
f t s
(MPa)
f t s -Mean
(MPa)
f f
(MPa)
f f -Mean
(MPa)
f c p
(MPa)
f c p -Mean
(MPa)
NF-135.2234.52.051.943.172.9730.3831.15
NF-233.611.812.9331.45
NF-334.631.952.8131.61
FC-0.2-136.3235.91.981.993.203.4232.5832.69
FC-0.2-235.551.843.6832.13
FC-0.2-335.932.143.3933.37
FC-0.4-138.3138.52.212.114.254.1536.1434.53
FC-0.4-237.291.994.1634.04
FC-0.4-339.962.124.0533.41
FC-0.6-141.1139.62.382.274.274.3437.2635.98
FC-0.6-239.232.294.7134.54
FC-0.6-338.372.134.0336.14
FC-0.8-139.1438.62.402.214.124.2435.6534.59
FC-0.8-238.862.124.6434.15
FC-0.8-337.892.103.9533.97
FC-1.0-138.2037.01.932.093.183.7034.1733.40
FC-1.0-237.312.113.9032.85
FC-1.0-335.442.234.0133.19
Table 6. The statistical analysis of descriptive parameters for mechanical test results.
Numberfcuftsfffcp
SDCV95% CISDCV95% CISDCV95% CISDCV95% CI
NF0.670.019333.4/35.60.10.05081.77/2.100.150.05042.72/3.220.550.017530.2/32.0
FC-0.20.310.008735.4/36.50.120.06171.79/2.190.20.05773.10/3.750.510.015731.8/33.5
FC-0.41.10.028636.7/40.30.090.04291.96/2.260.080.01974.02/4.291.170.033832.6/36.4
FC-0.61.140.028937.7/41.50.10.04562.1/2.440.280.06493.87/4.801.120.03134.1/37.8
FC-0.80.540.013937.7/39.50.140.06211.98/2.430.290.06933.75/4.720.750.021833.4/35.8
FC-1.01.150.031135.1/38.90.120.0591.89/2.290.370.09963.09/4.300.560.016832.5/34.3
Table 7. The results of ANOVA and Tukey HSD tests.
Mechanical PropertyANOVA F-ValueANOVA p-ValueSignificance
f c u 9.39180.000782
f t s 2.44040.095400×
f f 9.39860.000796
f c p 8.47370.001240
Table 8. Tukey HSD post hoc test results for significant mechanical properties.
Mechanical PropertyHSD Critical ValueSignificant Pairwise Comparisons (p < 0.05)
f c u (MPa)2.9633NF vs. FC-0.4, NF vs. FC-0.6, NF vs. FC-0.8, FC-0.2 vs. FC-0.6
f f (MPa)0.8329NF vs. FC-0.4, NF vs. FC-0.6, NF vs. FC-0.8, FC-0.2 vs. FC-0.6
f c p (MPa)2.7593NF vs. FC-0.4, NF vs. FC-0.6, NF vs. FC-0.8, FC-0.2 vs. FC-0.6
Table 9. Ratio of test splitting tensile strength to calculated splitting strength.
ρ 0.000.200.400.600.801.00
ƒcu-mean34.5035.9038.5039.6038.6037.00
f c u 3 / 4 14.2414.6715.4615.7915.4915.00
k0.13630.13570.13650.14380.14270.1393
Calculated f t 1.982.042.152.202.152.09
Tested f t s /Calculated f t s 0.980.980.981.031.031.00
Table 10. Test flexural strength, calculating flexural strength, and the ratio between them.
ρ 0.000.200.400.600.801.00
ƒcu-mean34.5035.9038.5039.6038.6037.00
f f 2.973.424.154.344.243.70
Calculating f f 3.043.394.124.454.143.69
Tested f f /Calculated f f 0.981.011.010.981.021.00
Table 11. Parameters and fitting performance of different constitutive models.
ModelParameterNCFC0.2FC0.4FC0.6FC0.8FC1.0
Guozhenhaia1.2581.2361.2221.2501.2771.295
R 2 0.999980.999980.999980.999980.999980.99994
Sarging c 1 1.2911.2681.2541.2791.3071.319
c 2 0.3270.3550.3470.3410.3020.328
R 2 0.999960.999950.999950.999960.999960.99994
Carreira and Chun3.9004.0914.1203.9753.8753.821
R 2 0.999880.999910.999890.999910.999910.99990
Disclaimer/Publisher’s Note: The statements, opinions and data contained in all publications are solely those of the individual author(s) and contributor(s) and not of MDPI and/or the editor(s). MDPI and/or the editor(s) disclaim responsibility for any injury to people or property resulting from any ideas, methods, instructions or products referred to in the content.