1. Introduction
With the continuous development of aseismic theory and strong earthquake motion observation technologies, structural dynamic time history analysis has gradually become a more accurate method for analyzing the seismic response of structures and evaluating seismic performance. The first task of dynamic time history analysis is to choose a rational ground motion, and the response of the structure varies greatly depending on the chosen ground motion. Therefore, the approach to making a suitable selection and adjustment of ground motion is a difficult point for the structural dynamic time history analysis [
1,
2]. Recent studies have further highlighted the impact of ground motion variability on structural performance assessments, emphasizing the necessity of refined selection methods [
3,
4].
Regarding the seismic design and evaluation of building structures, the optimal wave selection method is to directly use site-specific recorded seismic acceleration as inputs for time-history analysis; however, such an opportunity is very rare [
5]. Currently, the most widely used approach is to use seismic information such as magnitude, epicentral distance, site conditions, duration, and extra seismic information as the first judgment index for the primary selection, and then use the target response spectrum as the second assessment index for wave selection. According to China’s building seismic design code, the standard spectrum aligned with the seismic influence coefficient curve is taken as the target spectrum, and Chinese researchers have conducted extensive studies based on the code-specified response spectrum. Wang et al. [
6] proposed a ground motion selection methodology that integrates code-specified response spectra with seismic source mechanisms, structural dynamic characteristics, and site conditions. It is also verified that the input ground motion calculations selected by this method exhibit low dispersion. Yang et al. [
7] proposed a two-band controlled ground motion selection scheme based on the platform segment of the code-specified standard response spectrum and the structure’s fundamental natural vibration period. Studies have revealed [
8,
9] that the existing two-band controlled wave selection schemes do not account for the effects of time-holding and energy distribution of ground motion; thus, it is suggested to use the total ground motion elastic input energy response as a complementary index. Zhou et al. [
10] noted that higher-order vibration modes influence high-rise buildings, and when seismic waves are selected according to the standard, the results may significantly deviate from the required values. They therefore proposed a method to account for multi-mode effects. Han et al. [
11] conducted statistics and analyses on many strong ground vibration records, and proposed a long-period response spectrum fitting coefficient method for elastoplastic analysis of long-period structures. Although the ground motion selection method based on the code-specified spectrum can reduce the dispersion of structural responses, it fails to account for seismic parameters and the inherent uncertainties of earthquakes. Internationally, similar challenges have been addressed through advanced ground motion prediction models and machine learning techniques to improve selection accuracy [
12,
13].
The determination of another type of target spectrum is based on the probabilistic seismic hazard analysis, which requires the seismic safety evaluation of the field, mainly including the uniform hazard spectrum (UHS), conditional spectrum (CS), conditional mean spectrum (CMS), etc. It was found [
14,
15,
16] that using the consistent hazard spectrum as the target spectrum is conservative and will overestimate the seismic response of the structure. To overcome the deficiency, Baker and Cornell [
17] proposed a method to select ground motions using conditional mean spectra by introducing spectral shape parameters, combined with a greedy algorithm, but the conditional mean spectra did not consider the variability of the spectral values under any period. Consequently, Jayaram et al. [
18] developed an algorithm for matching both the mean and variance of target spectra. Building on Jayaram’s work, Baker and Lee [
19] proposed the Conditional Spectrum method, which explicitly accounts for spectral variability at periods beyond the conditioning period. Chinese researcher Lv et al. [
20] investigated ground motions selected using different amplitude-scaling methods with UHS, CMS, and scenario spectra as target spectra. The results show that the structural response is more sensitive to different amplitude modulation methods than to different target spectra. Chen [
21] compared the advantages and disadvantages of UHS, CMS, and wave selection methods considering spectral parameters in structural nonlinear analysis, finding that CMS has obvious superiority over the other two methods. On the basis of related research, Li et al. [
1] established a ground motion database and conducted statistical regression analyses on 141 mega earthquake records, deriving acceleration response spectrum attenuation relationships. Based on this, Li [
22] proposed a new target spectrum, the PGA target spectrum, which reflects a probability distribution and exhibits more realistic spectral patterns compared with the Code-specified Standard Spectrum. Existing literature reviews indicate that structural responses are more sensitive to different amplitude scaling methods than to variations in target spectra. This suggests that optimizing the target spectrum alone without specifying a compatible amplitude scaling method may lead to limited practical effectiveness.
The determination of the PGA target spectrum does not require site-specific safety evaluations, making it particularly suitable for general construction sites. This study selects the PGA target spectrum and the code-specified standard spectrum as the target response spectra. Within the specified period range, the response spectra of selected ground motions are matched against both target spectra. Five amplitude modulation methods are then applied to minimize the mean squared error between the recorded and target spectra in the matching period range, and the 10 sets of seismic records selected from the two target spectra and the five amplitude modulation methods are taken as input ground motion. Finally, a dynamic time history analysis of a frame-core tube structure is conducted, and the discreteness analysis of the calculation results is performed to find a reasonable method for selecting ground motions.
2. Determination of the Target Spectrum
The procedure for establishing the PGA target spectrum comprises three key steps: (1) Determine the target PGA based on seismic fortification parameters specified in the Chinese seismic code; (2) Obtain the set of ground motion parameters, such as magnitude and distance, according to the peak acceleration attenuation relationship; (3) Substitute the obtained set of magnitudes and distances into the acceleration response spectra attenuation relationship to get the corresponding set of PGA response spectra, and take the average value of the spectra, which is the PGA target spectrum. The determination of the PGA attenuation relationship is crucial in the entire process. Several scholars have conducted specialized studies and proposed region-specific attenuation relationships [
23,
24,
25,
26]. In this paper, the attenuation relationship between bedrock and soil layers in northwest China, proposed by Huo et al. [
23], is used (see Equation (1)).
where
C1 to
C5 are the coefficients;
M is the magnitude;
Y is the acceleration value, m/s
2; and
R is the epicentral distance, m. The determination of the attenuation relationship of the acceleration response spectrum has a probabilistic significance, and therefore, the PGA target spectrum also has a probabilistic significance. From the attenuation formula, it can be seen that under the condition of a certain target acceleration value, the fault distance gradually increases with the increase in the magnitude.
Considering the regional conditions of the building‘s location in the engineering example in
Section 4.1, the determination of the PGA target spectrum for a bedrock site under rare earthquakes is presented as a case study. A damping ratio of 5% was adopted. The spectrum was defined over a period range from 0.0 s to 6.0 s, and the period axis was discretized at intervals of 0.01 s to ensure sufficient resolution for subsequent ground motion matching and analysis. According to the Technical Specification for Concrete Structures of Tall Buildings [
27], the intensity of the Xi’an area is 8 degrees, the site category is Class II, and the design grouping is the second group, which determines that the peak target acceleration under rare earthquakes is 400 cm/s
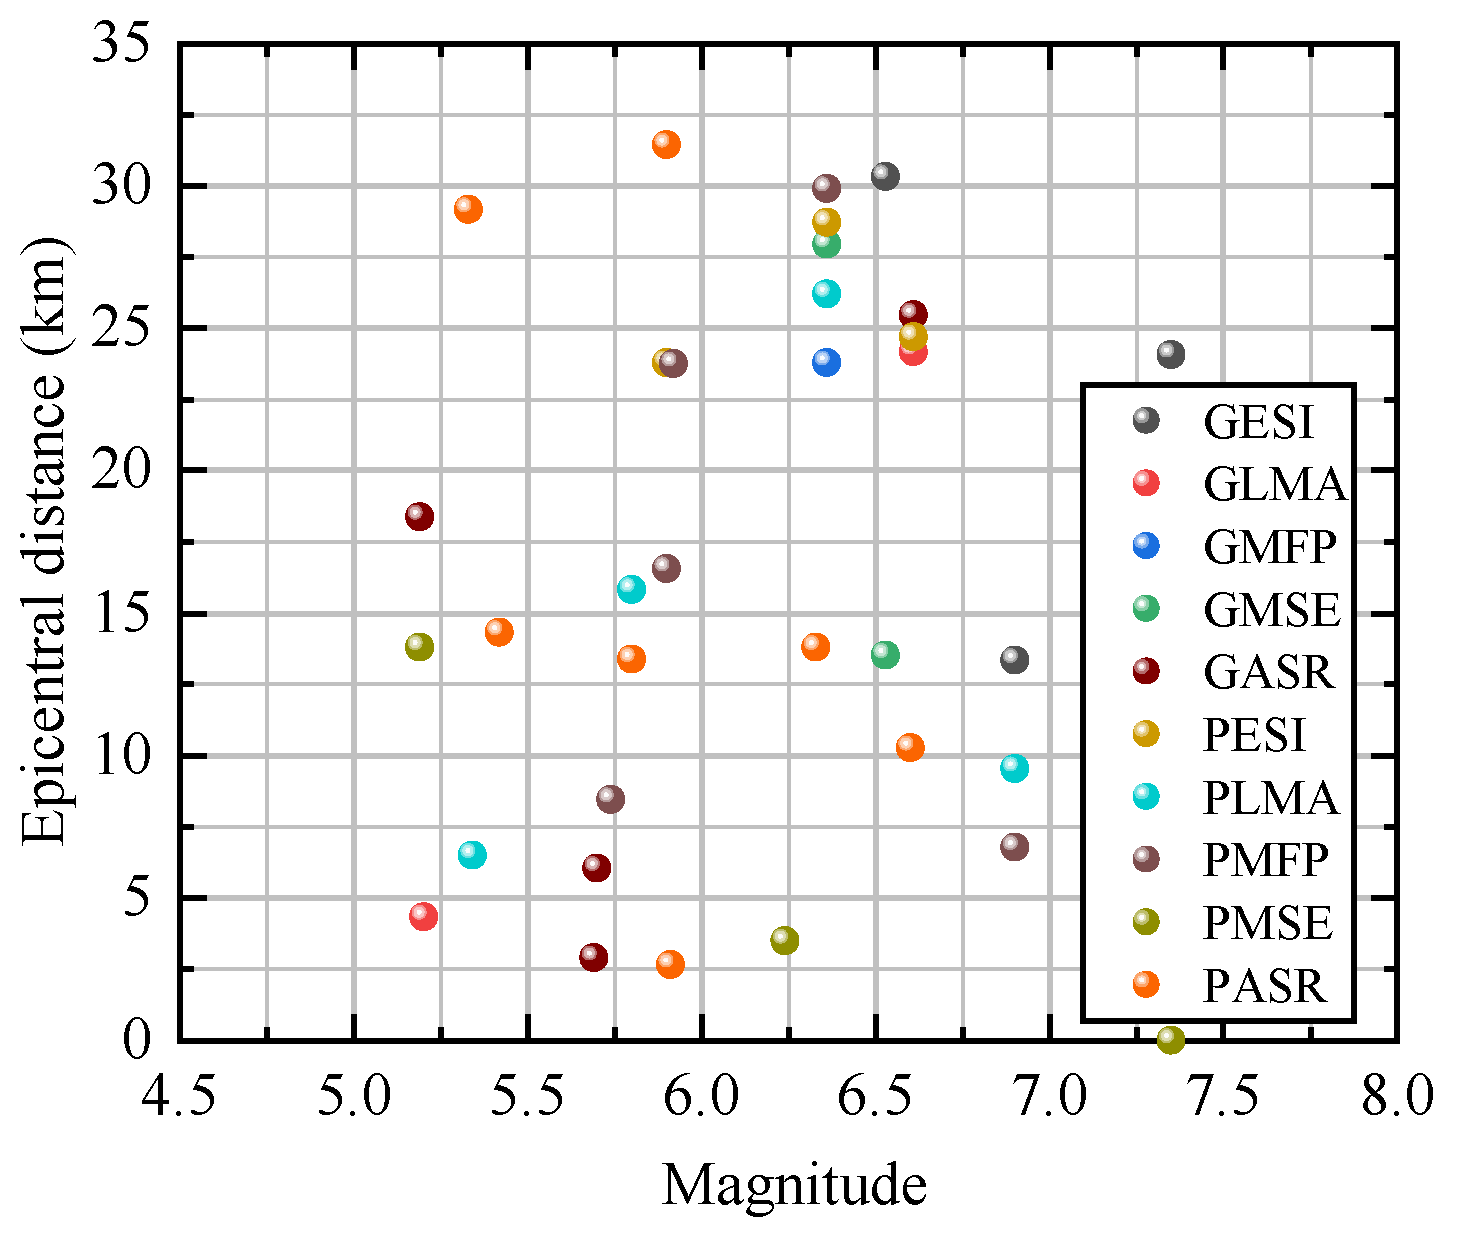
2. Given that destructive earthquakes in the region typically range from M5.0 to M8.0, the magnitude interval is divided into three equal groups with 0.1 increments, and substituted into the PGA attenuation relationship of bedrock sites along the long and short axes to obtain the corresponding fault distance. The values of the coefficients used in the acceleration attenuation relation are listed in
Table 1. The three sets of target spectra are obtained by substituting the three ground motion parameter ensembles, obtained in each direction, into the acceleration response spectrum attenuation relationship.
Figure 1 and
Figure 2 present the PGA target spectra for rock sites under rare earthquakes along the major and minor principal axes. From the figure, it can be seen that as magnitude increases, the spectral content shifts toward longer periods, often increasing the spectral acceleration at mid-to-long periods. Simultaneously, as distance increases, high-frequency content is attenuated more rapidly than low-frequency content, further accentuating the shift of spectral energy to longer periods. This evolution of the spectral shape is a fundamental characteristic of seismic attenuation [
5]. The comparison of
Figure 1 and
Figure 2 shows that, under the same conditions, the peak value of the PGA target spectrum is larger along the short-axis direction than the long-axis direction. The rationale for this is that the short-axis component imposes the highest initial acceleration impulse and often contains more energy in the high-frequency range, which can be critical for exciting stiff structural elements and for force-controlled actions. For biased safety considerations, the PGA target spectrum is selected along the short-axis direction. The average magnitude and epicentral distance of the three target spectrum groups correspond to the design earthquake groups [
22]. The second group is designed for the Xi’an area, and thus, the average value of the second set of PGA spectra in the short-axis direction was selected as the target spectrum.
The comparison between the Code-specified Standard Spectrum and the PGA target spectrum under rare earthquakes in Xi’an is shown in
Figure 3. As shown in the figure, under the same seismic fortification objectives and initial selection conditions for seismic parameters, the PGA target spectrum’s peak spectral value is much larger than that of the Code-specified Standard Spectrum. The acceleration value of the PGA target spectrum is smaller than that of the code-specified Standard Spectrum in the long-period section (T ≥ 2.5 s) because the code target spectrum has been adjusted in this section. During the long-period phase (T ≥ 2.5 s), the maximum acceleration discrepancy between the two target spectra occurs at T = 4.6 s, with a difference of 0.13 g.
4. Dynamic Time History Analysis
This study creates a finite element model of an actual engineering structure. Different target spectra and scaling methods are used to select ground motions that will be applied as input excitations. Then, dynamic time history analyses are performed using ABAQUS to evaluate the structural responses, including floor displacements, inter-story drift ratios, and inter-story shear forces. The variability of these responses is analyzed to determine the most reliable approach for selecting ground motions.
4.1. Project Overview
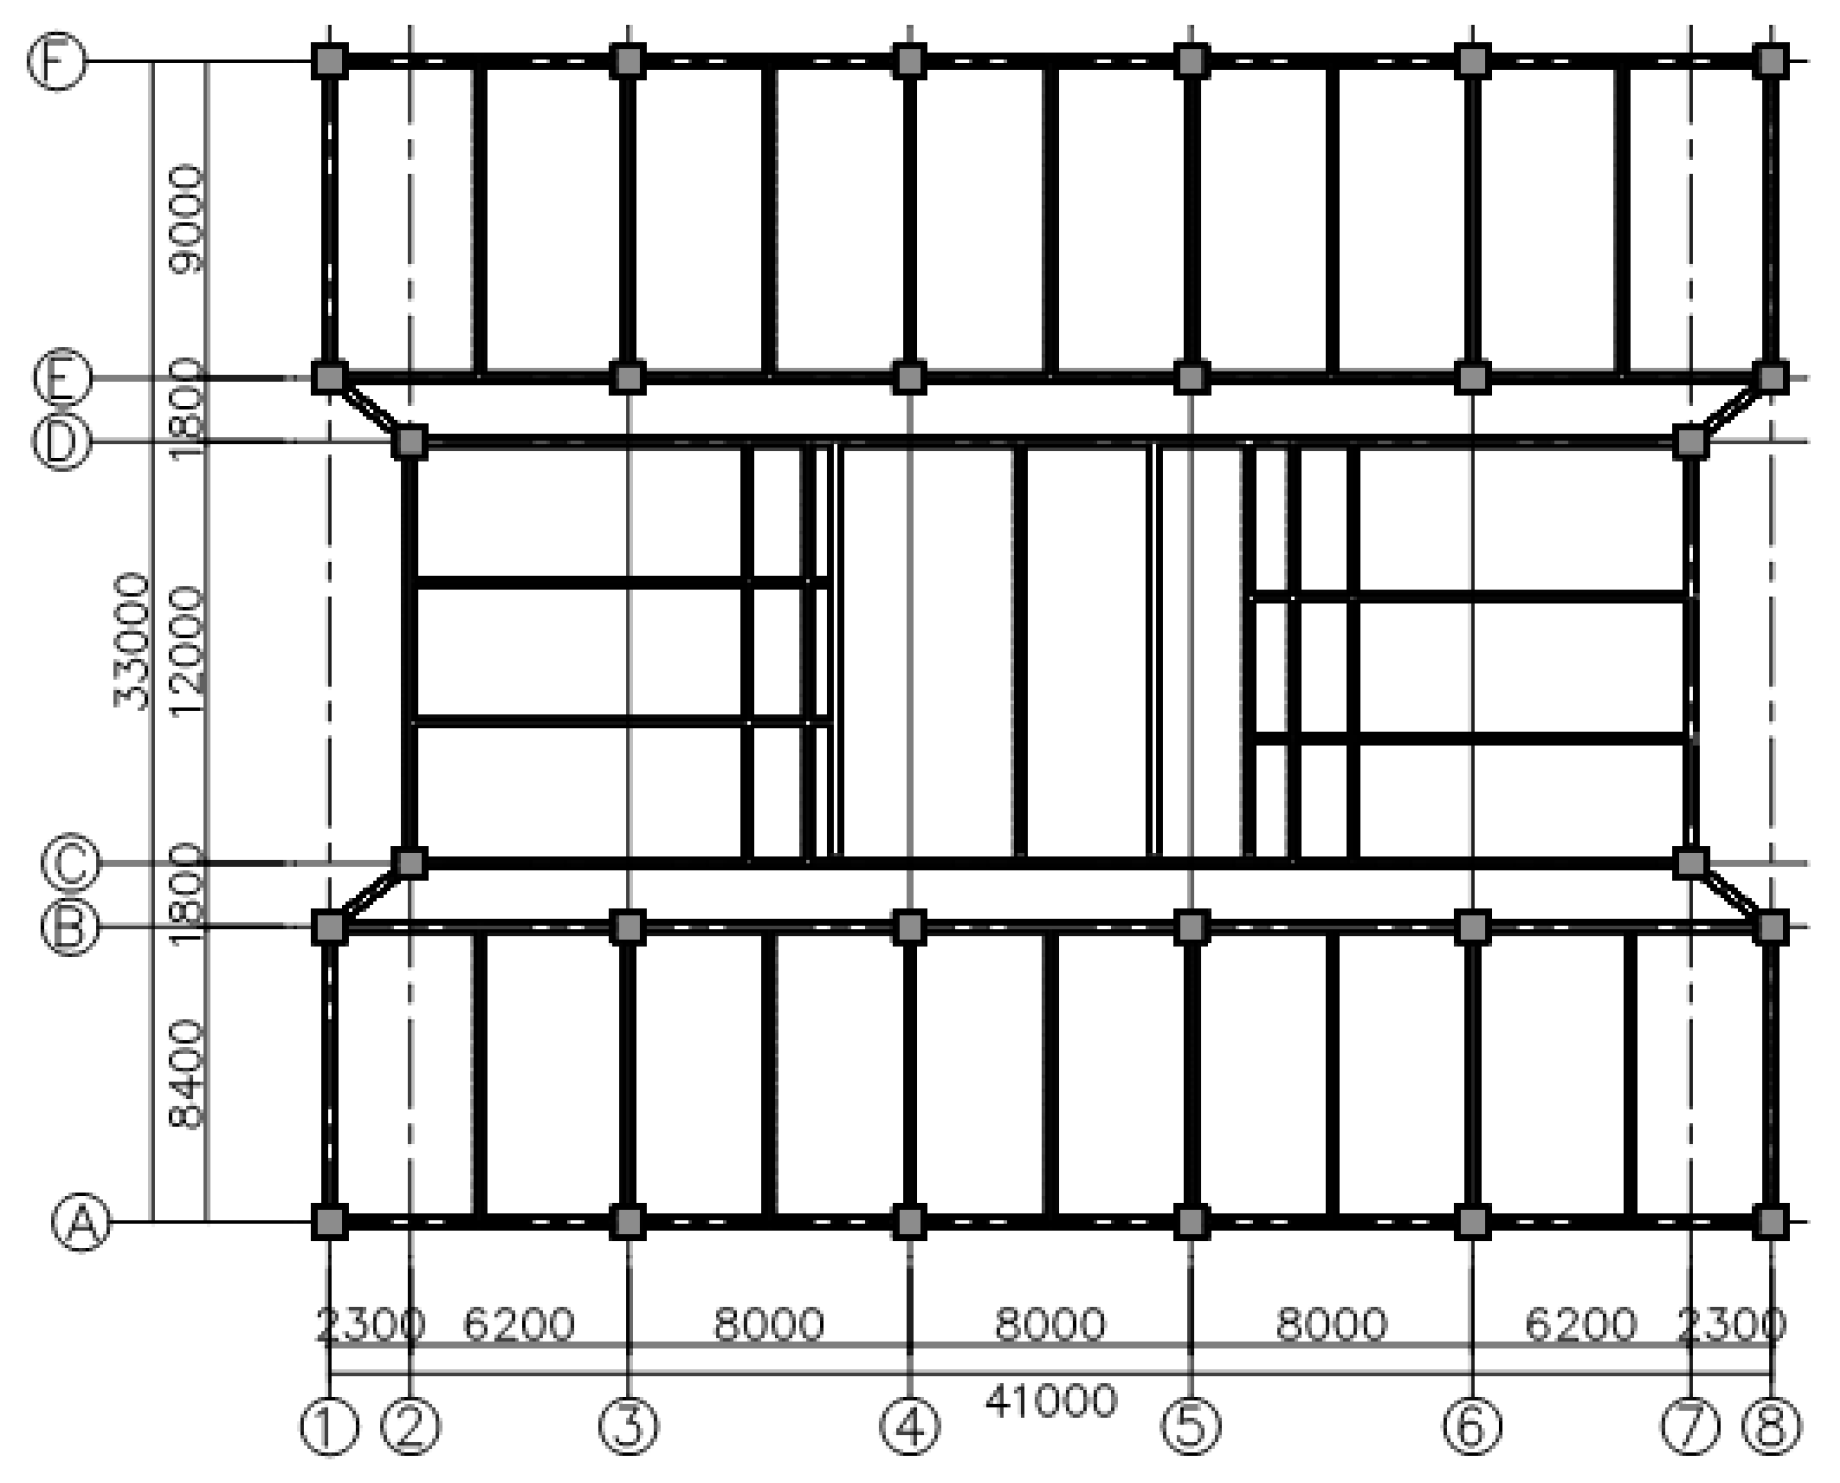
The selected project example is a high-rise, public, flat-type building with a frame-core tube structure, having a basic period of 2.1 s. It has a total structural height of 73.5 m and includes one underground floor and 24 floors above ground. Floors 1–3 serve commercial functions, and floors 4–24 are residential units. Shear walls are set up along axes A and F from the ground floor to the third floor above ground to constrain edge members. The elevator cabs protrude from the roof. The standard floor plan is shown in
Figure 6. This project employs cast-in-place reinforced concrete. The reinforcement of the main components uses HRB400 steel bars, while others use HPB300 steel bars, both of which were supplied by Zhongjin Heavy Steel Co., Ltd. (Xi’an, China). The concrete material properties used are shown in
Table 3.
4.2. Structural Finite Element Model
Dynamic time-history analysis of the structure was performed using ABAQUS 2019. The Rayleigh–Ritz method was employed to extract the first 12 vibration modes, ensuring a cumulative effective mass participation ratio of over 95% in both principal directions. Beams and columns were modeled using two-node quadratic Timoshenko beam elements (B32), which employ second-order interpolation and account for shear deformation effects—making them suitable for simulating both slender and short/deep frame members where shear deformations may significantly influence structural response. Shear walls were modeled using four-node reduced-integration shell elements (S4R) with a layered section definition. This approach directly integrates the constitutive relationships of concrete and reinforcing steel across the wall thickness, making it possible to accurately simulate coupled in-plane bending, shear, and out-of-plane bending nonlinear behavior. The floor slabs were modeled with the rigid diaphragm constraint, which enforces zero in-plane relative displacement between any two slab points while assuming zero out-of-plane stiffness. The inter-story shear force for each level was computed as the sum of the shear forces at the base of all columns and structural walls in the story below the floor diaphragm. This was achieved by defining a horizontal cross-section cut at the base of each story and requesting the resultant shear forces. The base of the structure was modeled as fixed-supported, neglecting soil-structure interaction (SSI) effects. Geometric nonlinearity (P-Δ effects) was included in the analysis. A fixed time step of 0.005 s was used throughout the analysis to ensure stability and accuracy in capturing the nonlinear response. And the maximum number of increments was set to a sufficiently high value (1,000,000) to ensure the analysis could complete without interruption, while inherent uncertainties are an integral part of computational modeling [
30,
31].
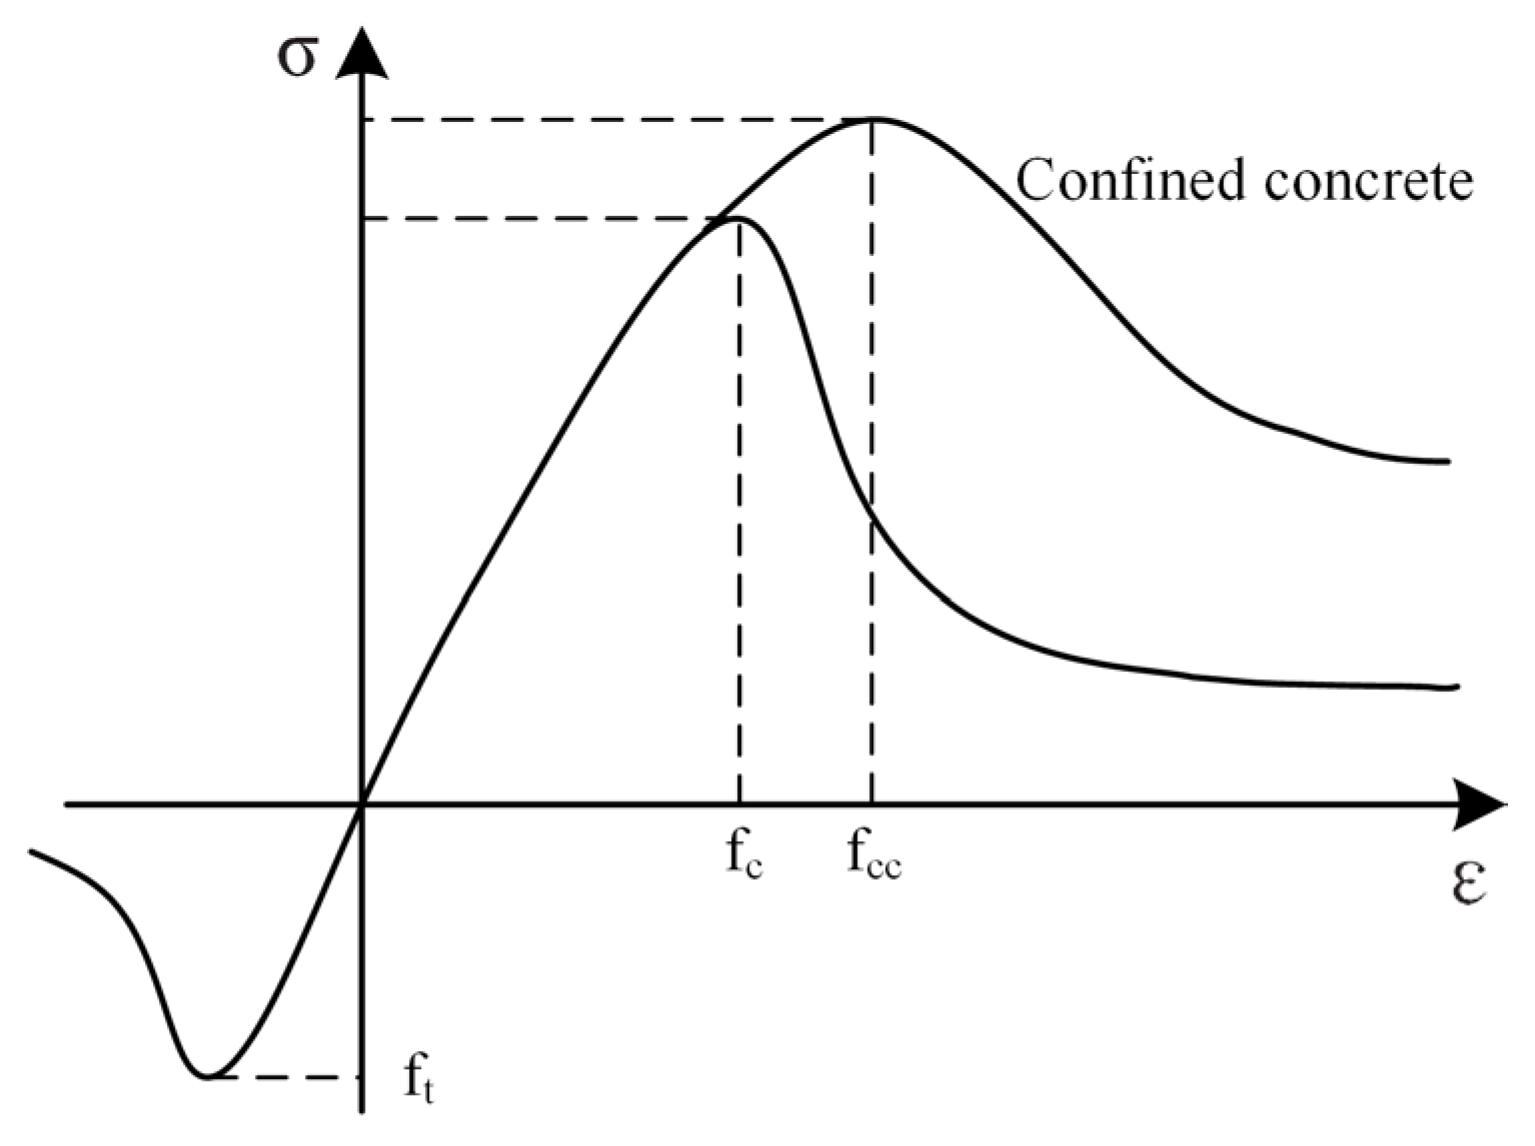
The concrete constitutive model is implemented as shown in
Figure 7. For beam and column elements, the confining effect of stirrups is considered. The peak compressive strain and stress of unconfined concrete are determined according to Table C.2.4 in Appendix C of the
Code for Design of Concrete Structures [
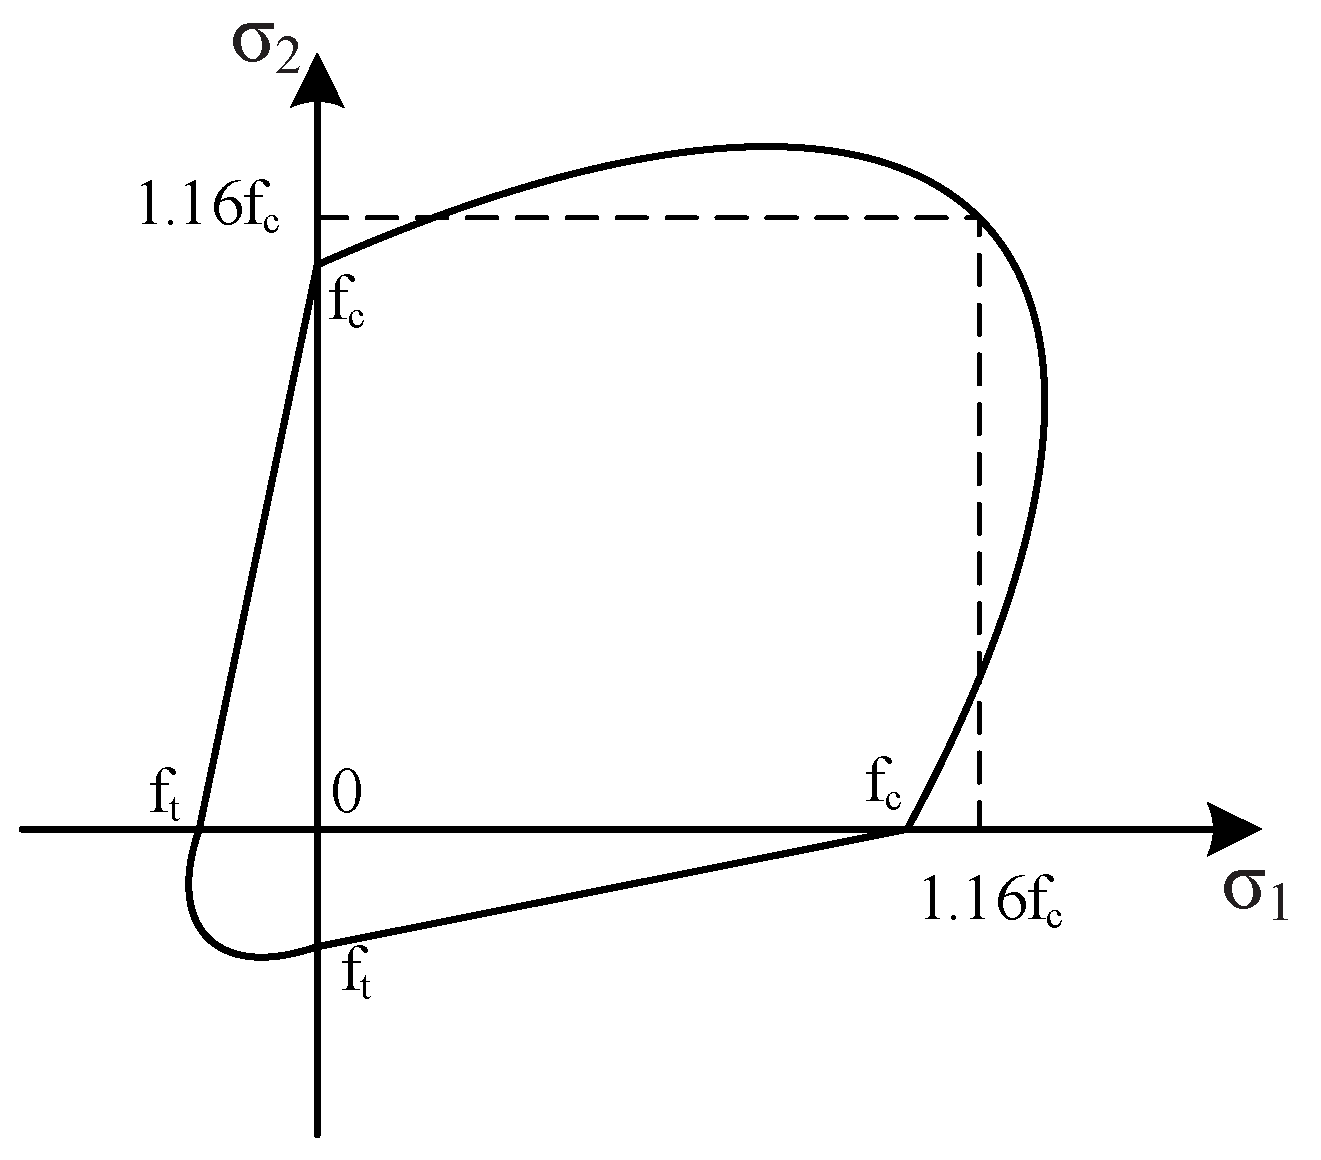
32]. For wall and slab elements, the biaxial concrete constitutive relationship illustrated in
Figure 8 is adopted. The reinforcement steel is modeled using a bilinear kinematic hardening model.
4.3. Analysis of Calculation Results
The floor displacements, interstorey displacement angles, and interstorey shear of the structure were selected as the demand parameters for the calculations.
Figure 9 shows the comparison of the average values of floor displacement, interstorey displacement angle, and interstorey shear for the structure under the selected ground motion for each method.
Table 2,
Table 3 and
Table 4 show comparisons of the coefficients of variation of floor displacements, interstorey displacement angles, and interstorey shear forces obtained under each method. In particular, the meanings of the letters in the legends are consistent with the above.
Figure 9 demonstrates consistent trends in the three demand parameters across ground motions selected using different target spectra and scaling methods. The analytical results based on the code-specified target spectrum systematically exceed those from the PGA target spectrum, indicating that the code-specified target spectrum is relatively conservative. When using the code-specified spectrum as the target, the matching at fundamental period scaling yields the maximum values for all three demand parameters, the least moving average scaling produces the minimum responses, and the other three methods show comparable results.
As shown in
Table 4,
Table 5 and
Table 6, the coefficient of variation values for floor displacements, inter-story drift ratios, and inter-story shear forces are consistently lower when obtained using the matching at fundamental period and least moving average scaling methods, compared to other approaches. This indicates superior consistency of results. Notably, the least moving average method demonstrates minimal coefficient of variation differences between the two target spectra, confirming its low sensitivity to spectrum types. In contrast, the geometric average spectral ratio and minimum squared error methods yield significantly higher coefficients of variation under both spectra, reflecting greater dispersion of results. The equal spectral intensity (ESI) method exhibits the most pronounced coefficient of variations across spectra, revealing high sensitivity to spectrum type. Additionally, inter-story shear forces consistently exhibit lower coefficients of variation than displacements and drifts, indicating more stable response characteristics.
In summary, the minimum moving average scaling, with its low sensitivity to two different target spectrums and the low dispersion of its calculation results, is an amplitude modulation method that applies to both target spectrums.
This study offers a systematic comparison of five amplitude scaling methods for ground motion selection, contextualized within Chinese seismic design standards and site conditions in the Xi’an region. Unlike broader or more limited prior studies, it provides a quantitative assessment of how each method influences key engineering demand parameters in a frame-core wall structure. Several limitations point to directions for future work, including the impact of alternative attenuation relationships on PGA target spectra, as well as expanding comparisons beyond the code spectrum to include other targets, such as the Conditional Mean Spectrum (CMS) and Uniform Hazard Spectrum (UHS).


