Article

Innovative Retrofitting for Disaster Resilience: Optimizing Steel Plate Grade and Scheme in RC Non-Seismic Frames to Prevent Progressive Collapse

by
Hussein M. Elsanadedy
*,
Tarek H. Almusallam
,
Husain Abbas
and
Yousef A. Al-Salloum
Chair of Research and Studies in Strengthening and Rehabilitation of Structures, Department of Civil Engineering, College of Engineering, King Saud University, P.O. Box 800, Riyadh 11421, Saudi Arabia
*
Author to whom correspondence should be addressed.
Buildings 2025, 15(18), 3325; https://doi.org/10.3390/buildings15183325
Submission received: 19 August 2025 / Revised: 10 September 2025 / Accepted: 11 September 2025 / Published: 14 September 2025
(This article belongs to the Section Building Structures)

Abstract

Reinforced concrete (RC) non-seismic frames in Middle Eastern multistory buildings often have beam–column connections with discontinuous bottom reinforcement, heightening the risk of progressive collapse if an outer column fails. This study aimed to reduce the potential for progressive collapse when a column is lost by investigating the use of bolted steel plates to enhance the beam–column joints of such frames. In this regard, high-fidelity finite element (FE) analysis was carried out on ten half-scale, two-span, two-story RC frames to simulate the removal of a center column. The numerical analysis accounted for the nonlinear rate-dependent response of steel and concrete, as well as the bond-slip model at steel bars/concrete interaction. The analysis matrix had three unstrengthened specimens that served as references for comparison, in addition to seven assemblies, which were strengthened using bolted steel plates. In the upgraded assemblies, the studied variables were the grade of steel plate (three grades were examined) and the upgrading scheme (three different schemes were investigated). The performance of the specimens was evaluated by comparing their failure patterns and the characteristics of load versus displacement of the middle column during both flexural and catenary action phases. Based on this comparison, the most efficient strengthening method was suggested.

1. Introduction

Progressive collapse arises from the failure of structural elements like columns under abnormal loads, leading to the disproportionate collapse of the entire structure. Events that may lead to progressive collapse include accidental failures, e.g., [1], intentional blasts, e.g., [2], and natural hazards such as earthquakes, e.g., [3]. To minimize this risk, structures need ample redundancy to provide alternative load paths. Various codes and guidelines [4,5,6,7] stipulate the selection of suitable framing plans for ensuring continuity at connections in the event of column damage. Moreover, they require the inclusion of load combinations involving column loss, informed by documented progressive collapse cases [8].
Investigations on moment-resistant RC frame structures [9,10,11] have evaluated their ability to resist progressive collapse. Other research [12,13] has delved into the significance of compressive arch action in the flexural stage and the catenary phase in mitigating the progressive collapse possibility in RC framed buildings, especially those with seismic detailing. Kim and Yu [14] examined how varying shear and flexural steel ratios influenced the resistance of RC frame assemblies to the risk of progressive collapse using numerical techniques. They found that increased flexural steel improved resistance during the catenary stage, while shear steel facilitated its formation. In structures having masonry arches, Azar and Sari [15] proposed sustainable methods of strengthening using embedded rebars to enhance their structural integrity against blast loads.
Elsanadedy et al. [16] evaluated the progressive collapse resistance of RC special moment-frame assemblies through a quarter-scale single-story test frame following single column removal. FE simulations were run using the LS-DYNA package [17] to reproduce the test frame’s response. The numerical model was calibrated, and its influence on essential parameters like continuity of column, type of assembly, number of beam spans, and axial load on columns was examined. NIST [18] investigated the resistance of intermediate and special RC moment frames against progressive collapse via testing two assemblies in the scenario of center column removal. The catenary action stage generated the highest loads within the assemblies. During this phase, the end rotation of the beams was seven to eight times greater than the limit recommended by ASCE/SEI 41-06 [19]. Nonlinear FE models were calibrated using the test findings.
Lim et al. [20] investigated four RC frame assemblies under corner and edge column removal scenarios. For each scenario, two specimens were used: one with a slab and one without. The role of the slab in enhancing collapse resistance was assessed by comparing these two assembly types. Lu et al. [21] studied five scaled RC specimens, with and without slabs, for outer column removal. The study considered factors such as slab thickness, reinforcement, and beam depth. The results showed that RC slabs increased the building’s resistance to progressive collapse by approximately 146% and 98% during the flexural and catenary phases, respectively, compared to the skeleton assembly. Yu et al. [22] developed an FE model based on the experimental results. A parametric study using the validated models evaluated the impact of loading patterns, thickness of slab, details of reinforcement, and boundary conditions.
Strengthening of existing RC structures has become common recently due to (1) aging of construction materials, thus resulting in damage to structural members, (2) structural modifications, such as new openings in slabs and removal of vertical load-carrying member(s), (3) increase and/or change in loading, (4) design and/or construction errors, (5) vulnerability to progressive collapse, and (6) seismic retrofit to fulfill current seismic code requirements [23].
Several studies have explored different strengthening techniques for RC framed buildings [24,25] and structural elements, including the use of externally bonded FRP composites [26], steel plate bonding [27,28,29], near-surface mounted reinforcement [30], advanced cementitious materials [31], and hybrid techniques [32], demonstrating their effectiveness in enhancing strength and ductility. Al-Salloum et al. [28] conducted an experimental program to strengthen precast RC frames using steel plates to mitigate (or diminish) the progressive collapse risk. Three frames were prepared: the first was a precast reference frame, the second was a monolithic frame with continuous beam bars, and the last frame was a strengthened precast assembly. To simulate progressive collapse, the specimens were tested by applying a quasi-static displacement-controlled loading on the top surface of the inner column following the removal of its support. The response of the precast frames was then compared to that of the monolithic one. As an extension of this study, Elsanadedy et al. [29] conducted FE analysis to predict the behavior of the three assemblies tested by Al-Salloum et al. [28] and conducted a parametric study of practical concern. In a similar research, Elsanadedy et al. [32] assessed experimentally the performance of a new hybrid strengthening method, in which fiber-reinforced polymer (FRP) laminates were combined with near-surface mounted (NSM) steel bars to minimize the progressive collapse threat of precast RC frames. They tested the following specimens: a control precast one, a monolithic one with continuous beam bars, and an upgraded precast one. They conducted a parametric study and predicted the response of test specimens using nonlinear FE analysis. The study examined how varying strengthening parameters influenced the response of test assemblies during a middle column missing event.
Most buildings in the Middle East were fabricated using RC non-seismic frame systems. These buildings rely solely on RC shear walls for lateral load resistance. As a result, the frames feature discontinuous bottom beam bars at the beam–column connections, increasing their vulnerability to progressive collapse if one or more exterior columns are accidentally removed, such as in a blast attack. To address this, Elsanadedy and Abadel [33] conducted FE research to explore the progressive collapse jeopardy of RC non-seismic frames, consisting of two-story columns and multi-span beams. Their FE analysis matrix had 16 half-scale specimens, investigating variables such as the number of beam spans, column axial load, and the amount of continuous bottom bars in beams. They proposed a straightforward method to evaluate the risk levels of progressive collapse in RC non-seismic framed buildings. A very high progressive collapse risk was found for specimens with partially or fully discontinuous bottom beam bars along the beam–column connection.
As a continuation of the previous study by Elsanadedy and Abadel [33], this research examined numerically the use of bolted steel plates to strengthen the beam–column joints of RC non-seismic frames for minimizing the progressive collapse potential under a missing-column event. Unlike bonded strengthening methods, bolted plates offer ease of installation, reversibility, and adaptability to post-construction retrofitting scenarios. Ten half-scale two-span, two-story frames were numerically analyzed under center column removal via the LS-DYNA package [17]. The numerical analysis considered the nonlinear rate-dependent response of steel and concrete, along with a 1D (one-dimensional) contact model at steel bars/concrete interaction. Out of the ten specimens, three assemblies were unstrengthened to be used as a reference for comparison, whereas seven assemblies were strengthened using bolted steel plates. The studied variables were the steel plate grade and upgrading scheme. The response of the frames was compared regarding failure pattern and characteristics of load versus middle column displacement at flexural and catenary action phases. Based on the comparative study, the best strengthening scheme was recommended. The innovation of this study is owing to that (1) it addresses the use of bolted steel plates, including EN 1.4301 stainless steel, for mitigating progressive collapse in non-seismic RC frames, which has not been previously investigated in the literatur; (2) the studied upgrading schemes were added on the sides of the beam without increasing its depth, which could be practical in real-world application; and (3) it compared three different steel plate grades, in which the last one (EN 1.4301) was not traditionally used in strengthening applications. The EN 1.4301 stainless steel has superior corrosion resistance and long-term durability, thereby providing a sustainable alternative to conventional carbon steel grades and potentially reducing maintenance demands and life-cycle costs. By comparing the performance of conventional and stainless-steel plates, this study not only addresses a clear research gap in the literature but also offers resilient and durable strengthening strategies.

2. FE Analysis Matrix

2.1. Control Specimens

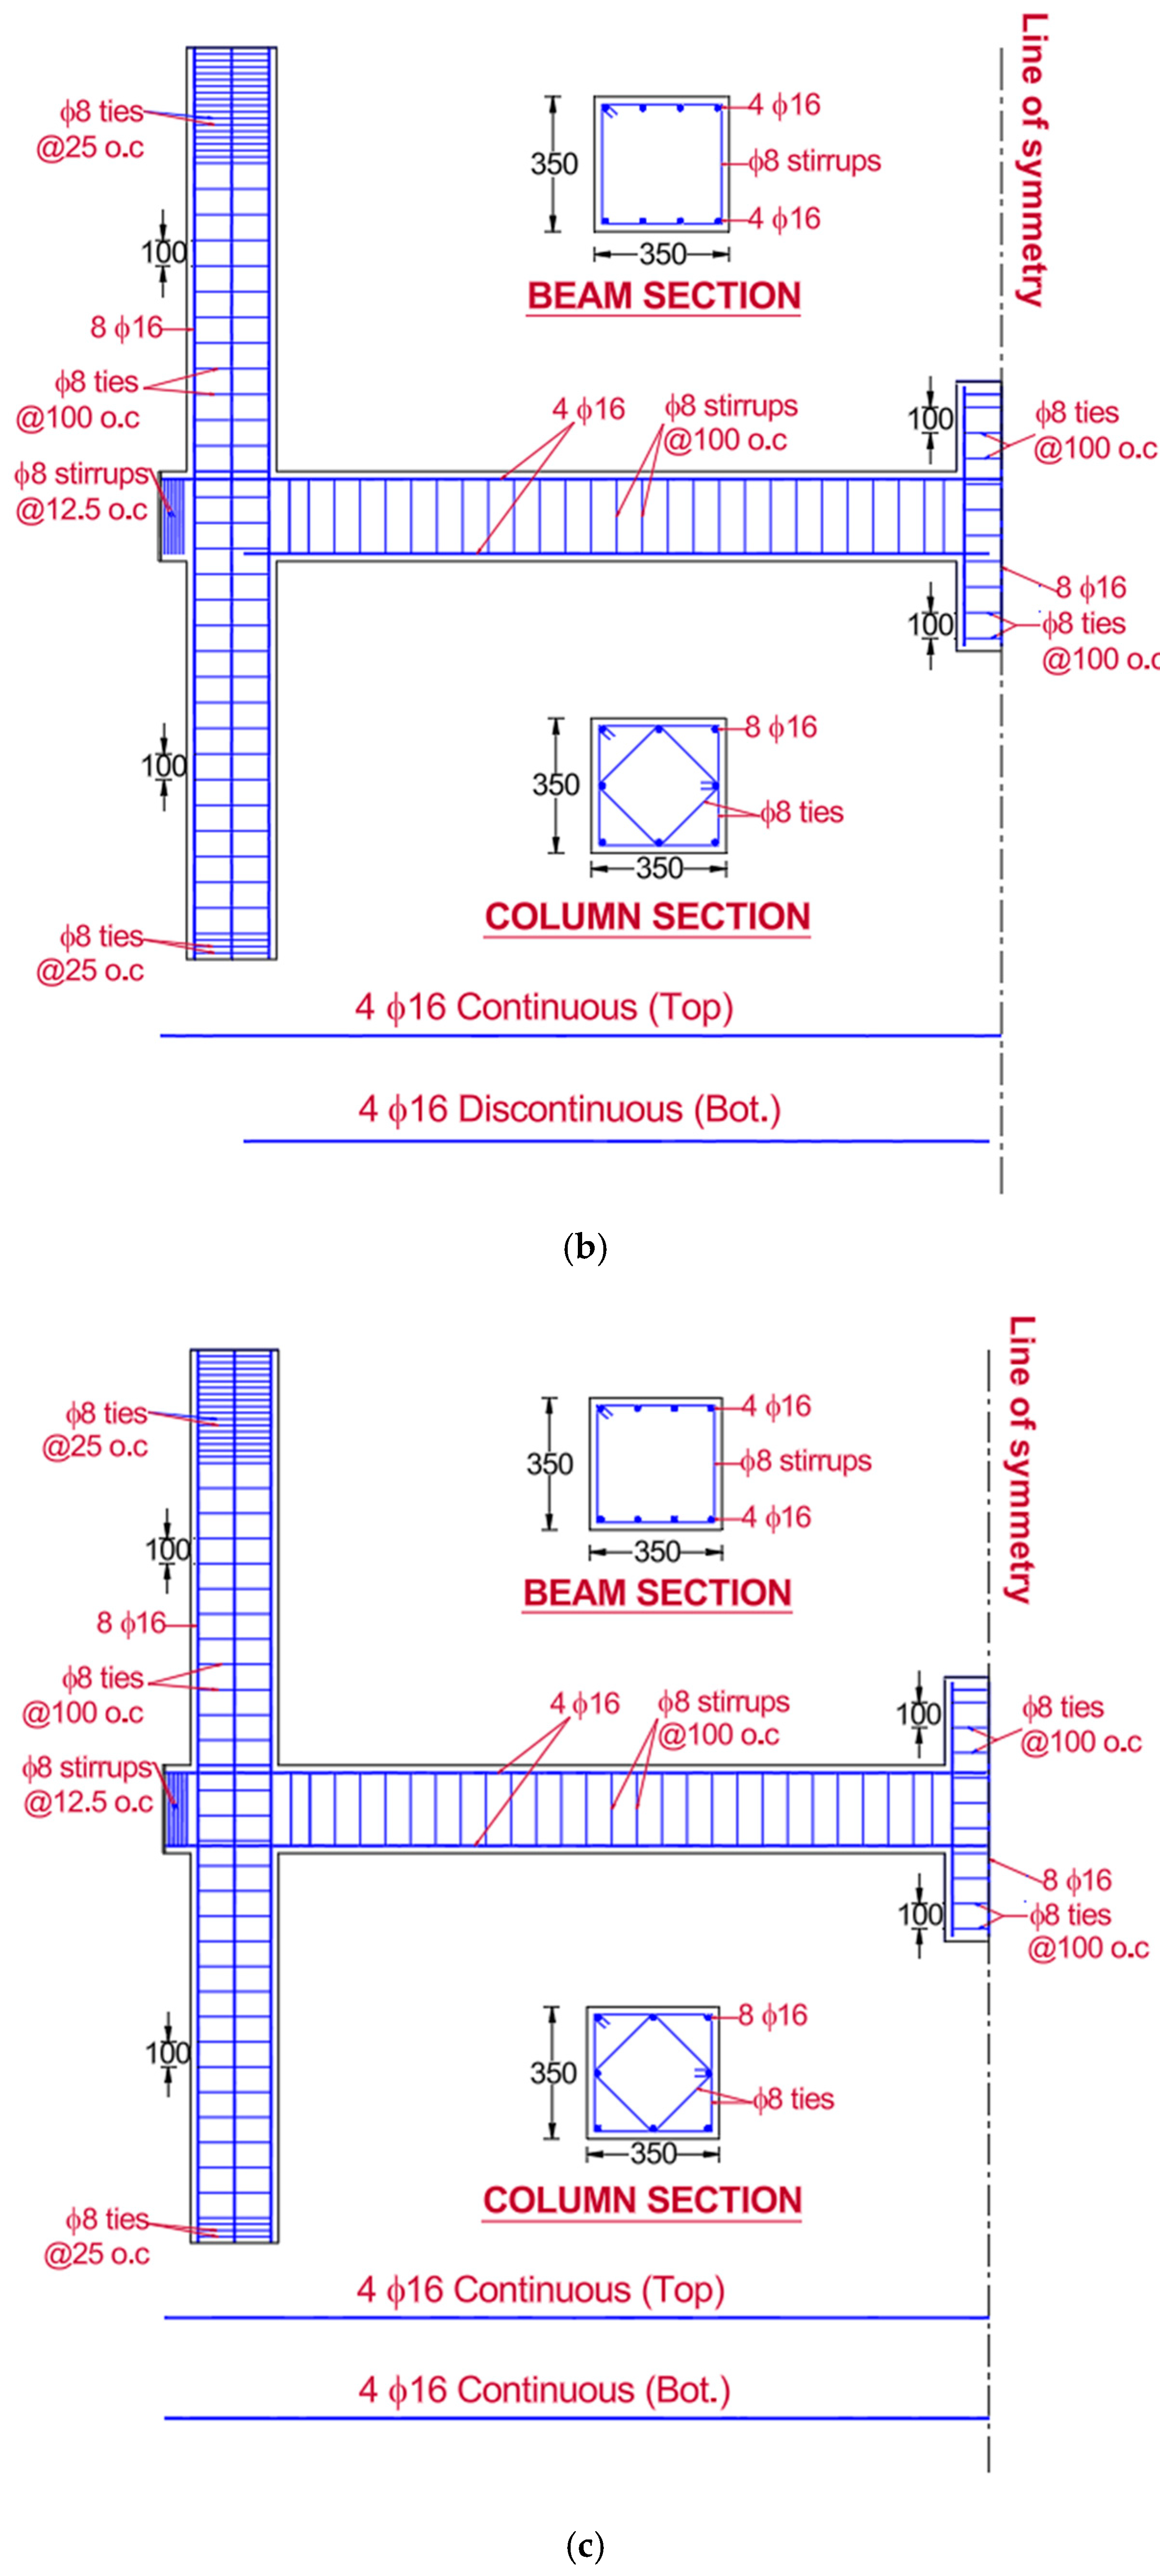
The core goal of the current investigation is to examine how the risk of progressive collapse following a column-loss event can be reduced by upgrading the beam–column joints in non-seismic frames with bolted steel plates. In order to accomplish this objective, 10 half-scale RC assemblies were analyzed numerically, focusing on the removal of the middle column. The FE analysis matrix comprises three unstrengthened frames that were utilized as control assemblies and seven upgraded specimens. Table 1 lists the three control specimens of the analysis matrix. These control assemblies were obtained from a prior study [33]. Details of control specimens are given in Figure 1 and Figure 2. It is worth noting that the control specimens were analyzed with axial load exerted on the outer columns. This axial load was taken to be equivalent to the actual load imposed on the first-story columns of real buildings during operation.
In the analysis matrix of control specimens, the investigated variable was the proportion of continuous bottom bars in beams compared to the total number of bottom bars. As seen in Table 1, three ratios were explored. The initial percentage of 0% (specimen CON-0) was selected to replicate the scenario of having discontinuous bottom bars in RC non-seismic frames. The ratio of 100% (assembly CON-100) served as the ideal case for comparison with the upgraded specimens. In Table 1, control assemblies are labeled with the acronym “CON” for control specimens, and the numbers “0”, “50”, and “100” indicate the ratios of continuous bottom bars in the beam connection relative to the total number of bottom bars.

2.2. Strengthened Specimens

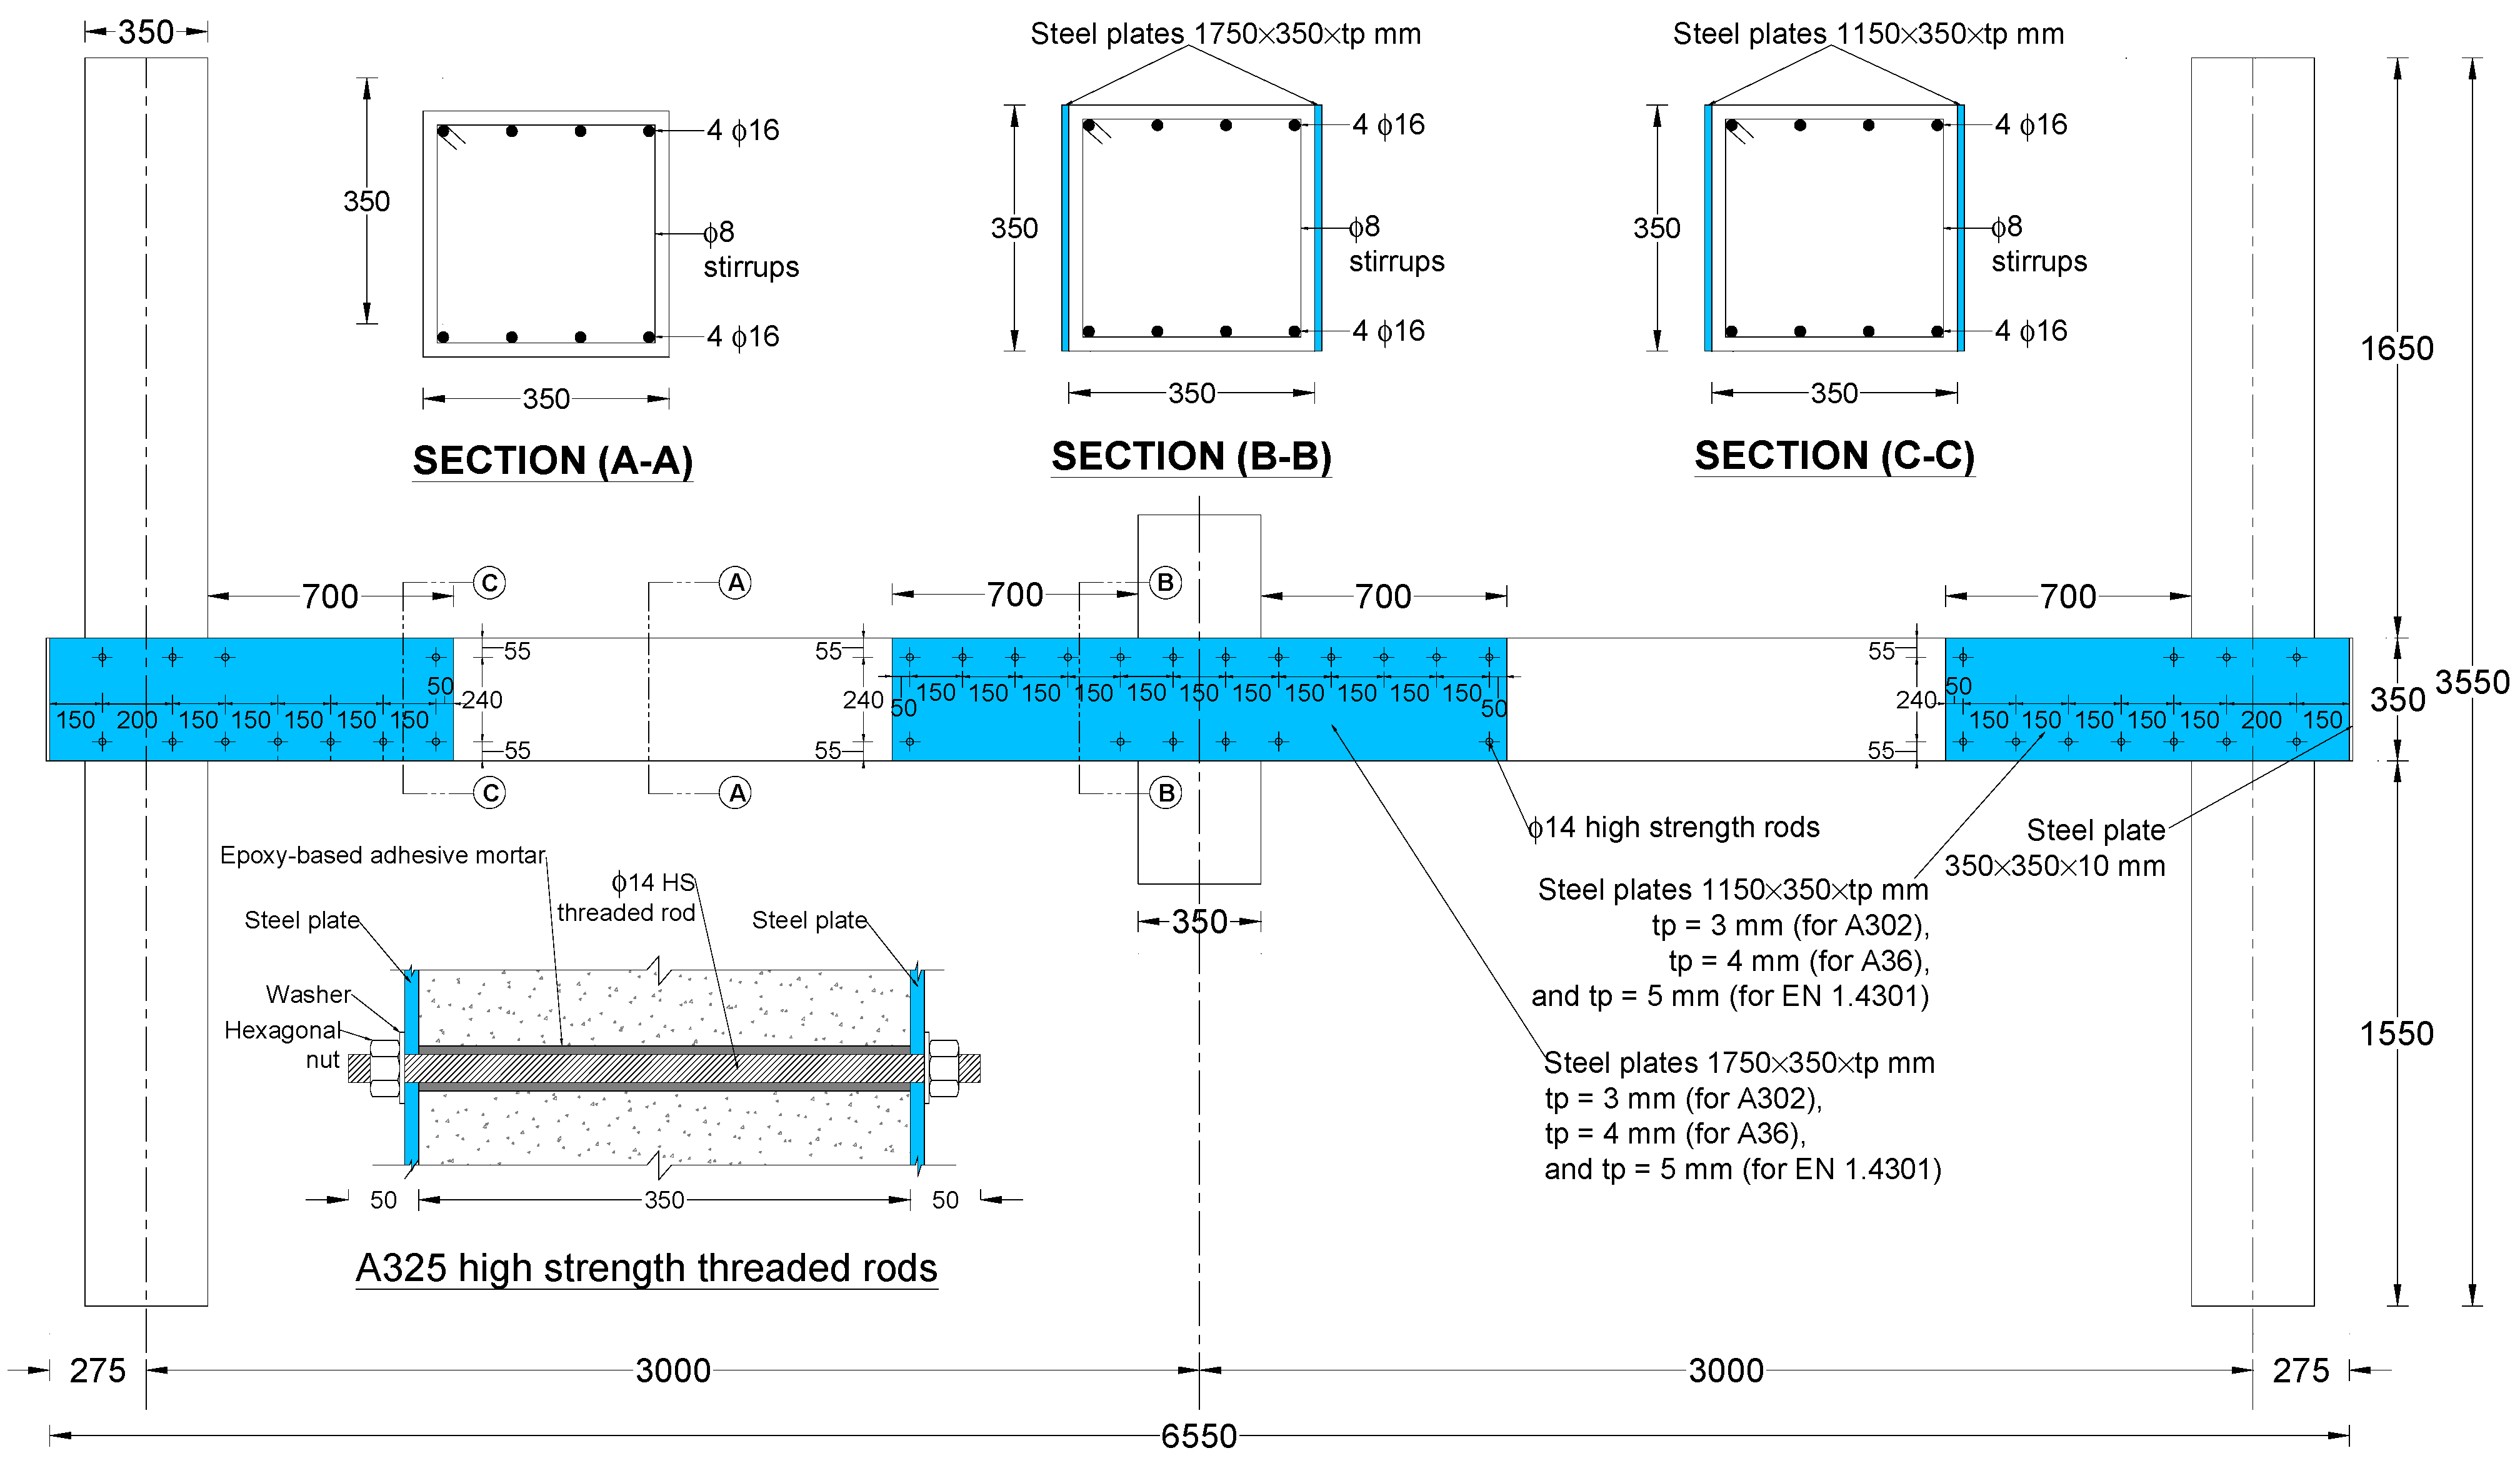
Strengthening was accomplished for the control specimen CON-0 to create continuity in the reinforcement throughout the beam–column connection for minimizing the risk of progressive collapse in the case of middle column removal. Table 2 lists the FE analysis matrix for strengthened specimens. The matrix included seven upgraded specimens. Details of the strengthened assemblies are presented in Figure 3, Figure 4 and Figure 5. As seen in Table 2, the first studied parameter in the matrix of strengthened specimens is the strengthening scheme. Three schemes were investigated.
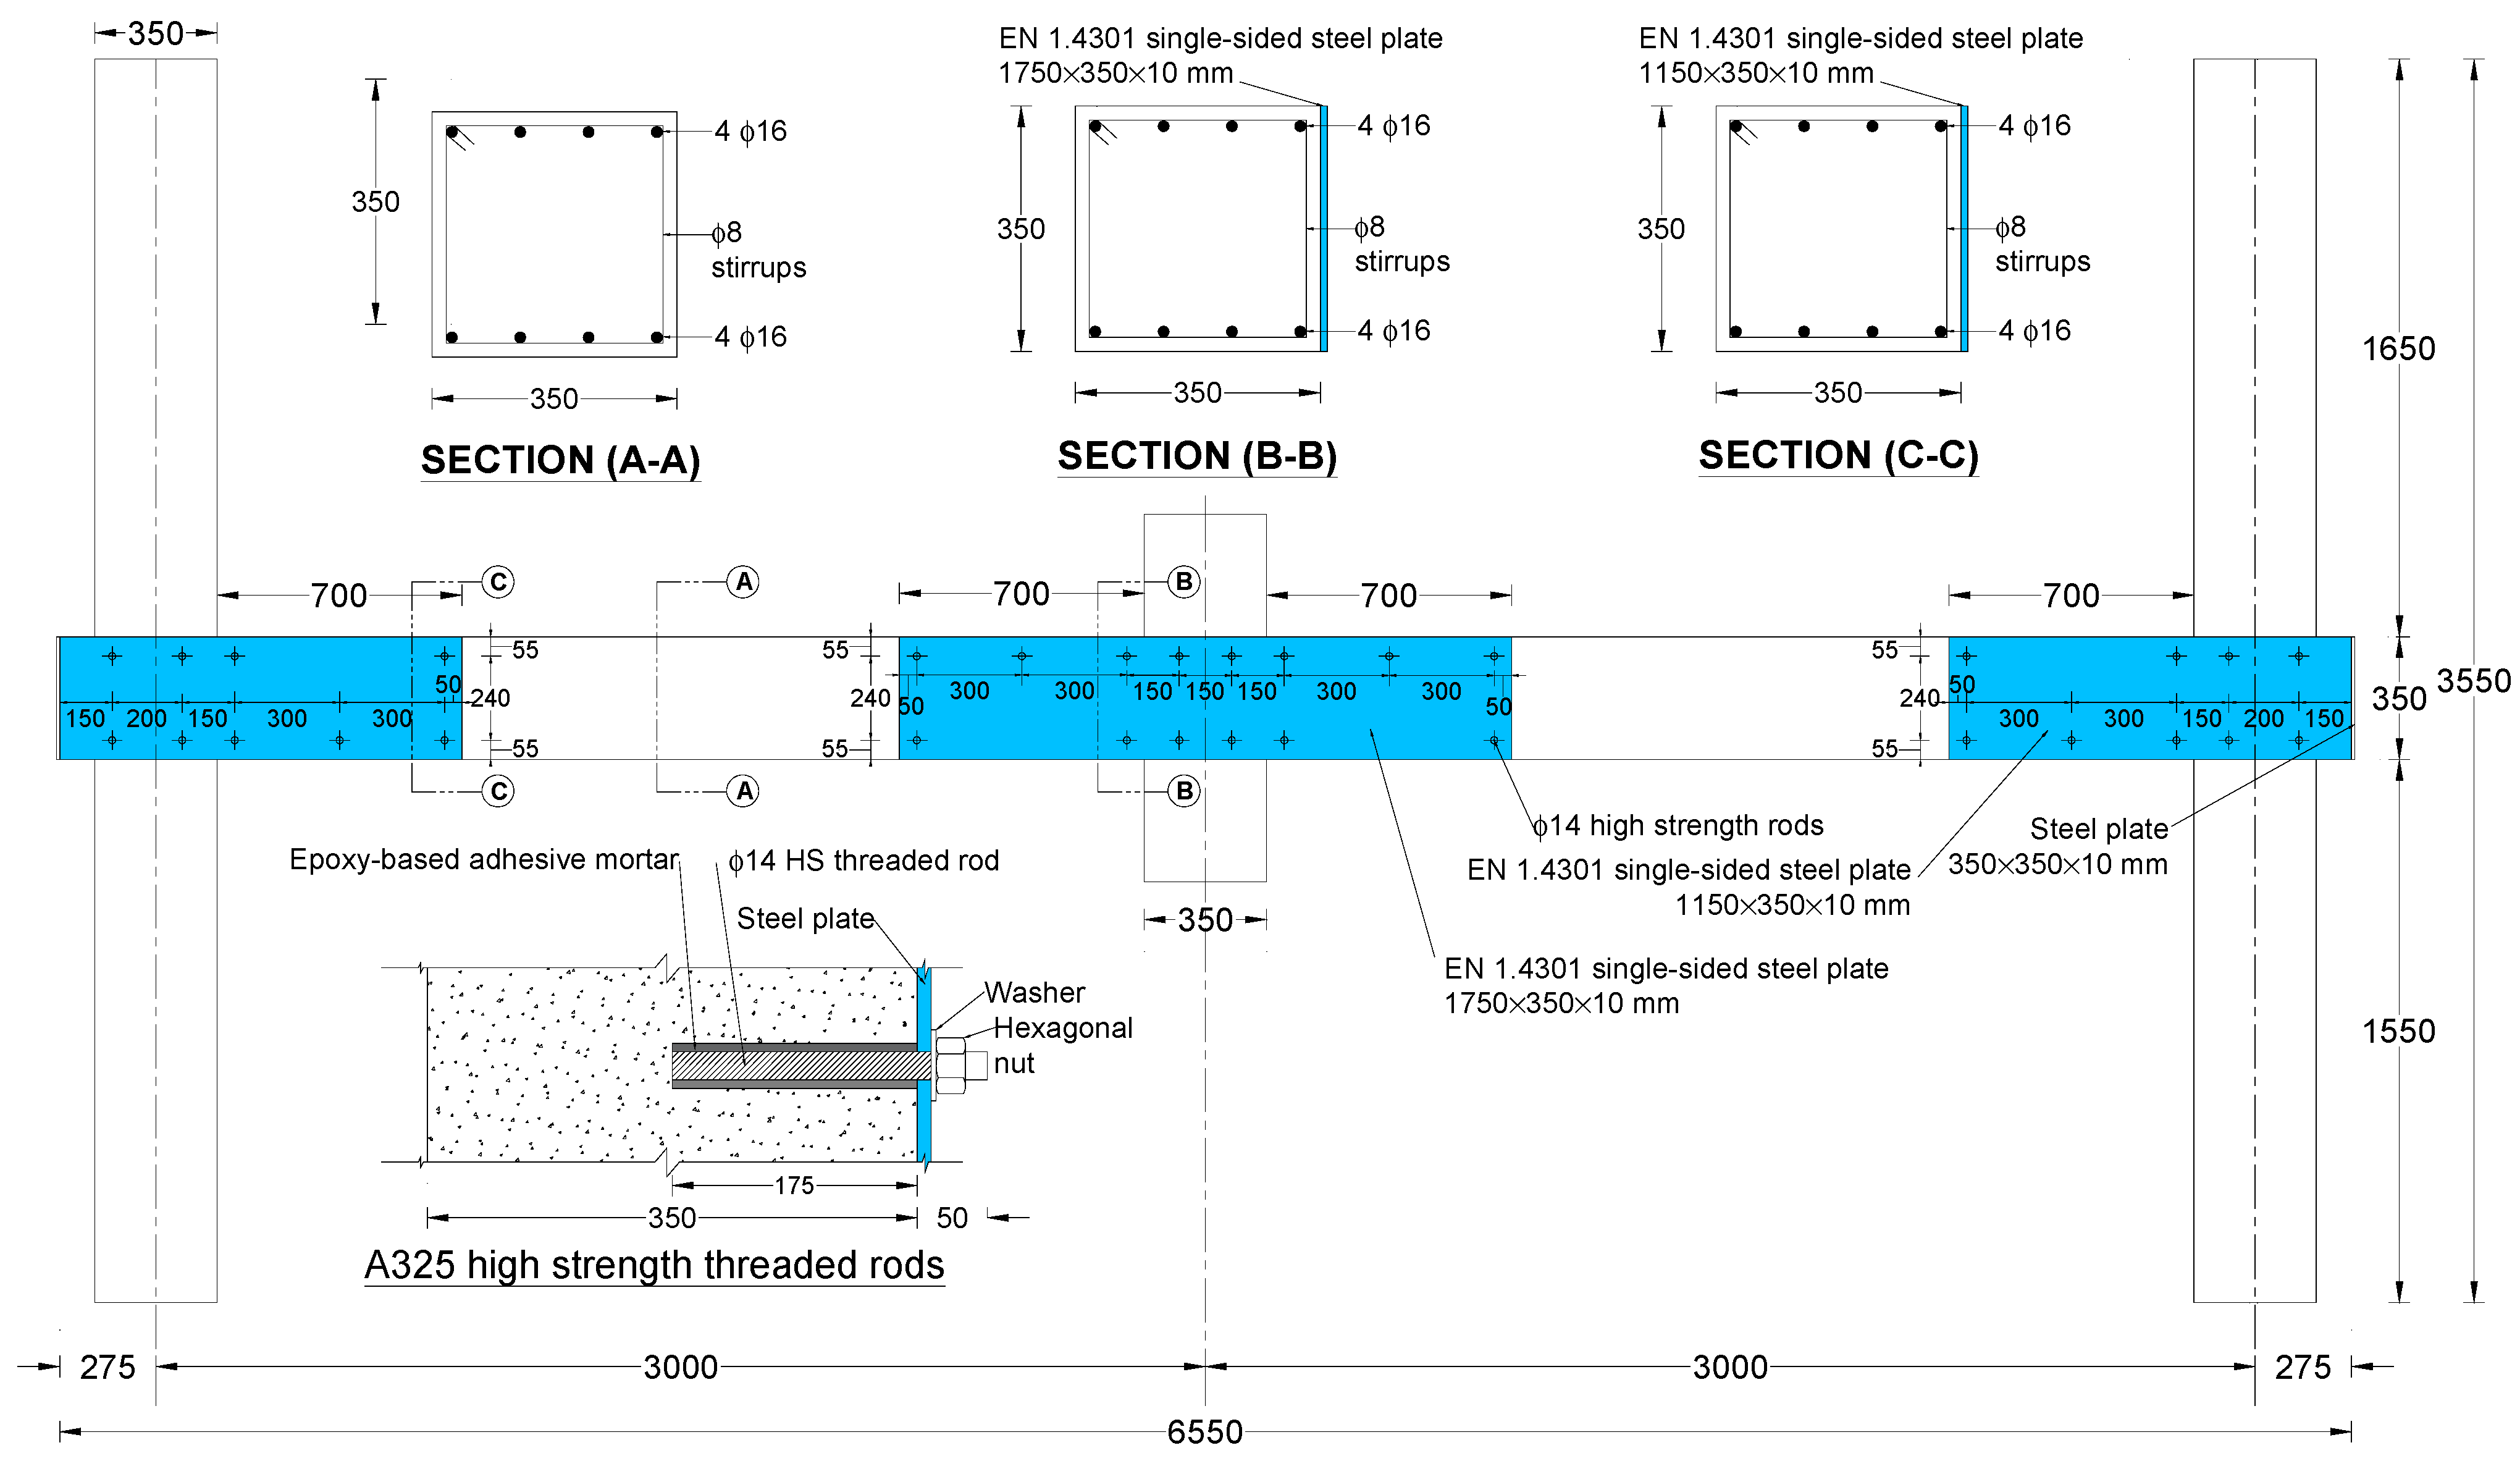
In the first scheme (S1-DS), a steel plate was added on both sides of the specimen at the middle joint only (see Figure 3). In the second strengthening scheme (S2-DS), a steel plate was added on both sides of the specimen at the middle and outer joints, as depicted in Figure 4. However, in the third upgrading scheme (S2-SS), a steel plate was added on one side of the specimen at the middle and end joints (see Figure 5).
The second studied parameter in the analysis matrix of upgraded specimens is the steel plate grade. Three different grades were utilized, and they included ASTM A302, Grade B; ASTM A36; and EN 1.4301, as illustrated in Table 2. ASTM A302, Grade B is a high-strength alloy steel widely used in pressure vessels and structural applications. Its relatively high yield strength and toughness make it suitable for enhancing the load-carrying capacity of reinforced concrete (RC) members subjected to high stress. ASTM A36, on the other hand, is a commonly available mild structural steel with moderate strength but high ductility. Its selection reflects industry practice, where cost and ease of fabrication are often key factors. EN 1.4301, austenitic stainless steel, was included as an alternative strengthening material due to its excellent corrosion resistance, durability, and relatively stable mechanical performance under service conditions. While the initial cost of stainless steel is higher than that of carbon steel grades, its life-cycle advantages, such as reduced maintenance and extended service life, make it attractive from both economic and environmental perspectives. Previous research [37] has shown its effectiveness in structural strengthening applications, particularly in environments prone to corrosion. Additionally, these grades have different fracture strains (varying from 15% for ASTM A302 to 45% for EN 1.4301). The fracture strain of the steel plate was thought to impact the progressive collapse capacity of the assembly at the catenary stage. Similar to control specimens, the seven upgraded assemblies were analyzed with axial load exerted on the outer columns, and the axial load ratio was taken to reflect the in-service load exerted on the first-story columns of actual buildings. In the labeling of strengthened assemblies in Table 2, the acronym “S1” stands for specimens with steel plates added on the middle joint only; the acronym “S2” represents specimens with steel plates added on both middle and end joints; and the symbols “SS” and “DS” stand for single- and double-sided steel plates, respectively.
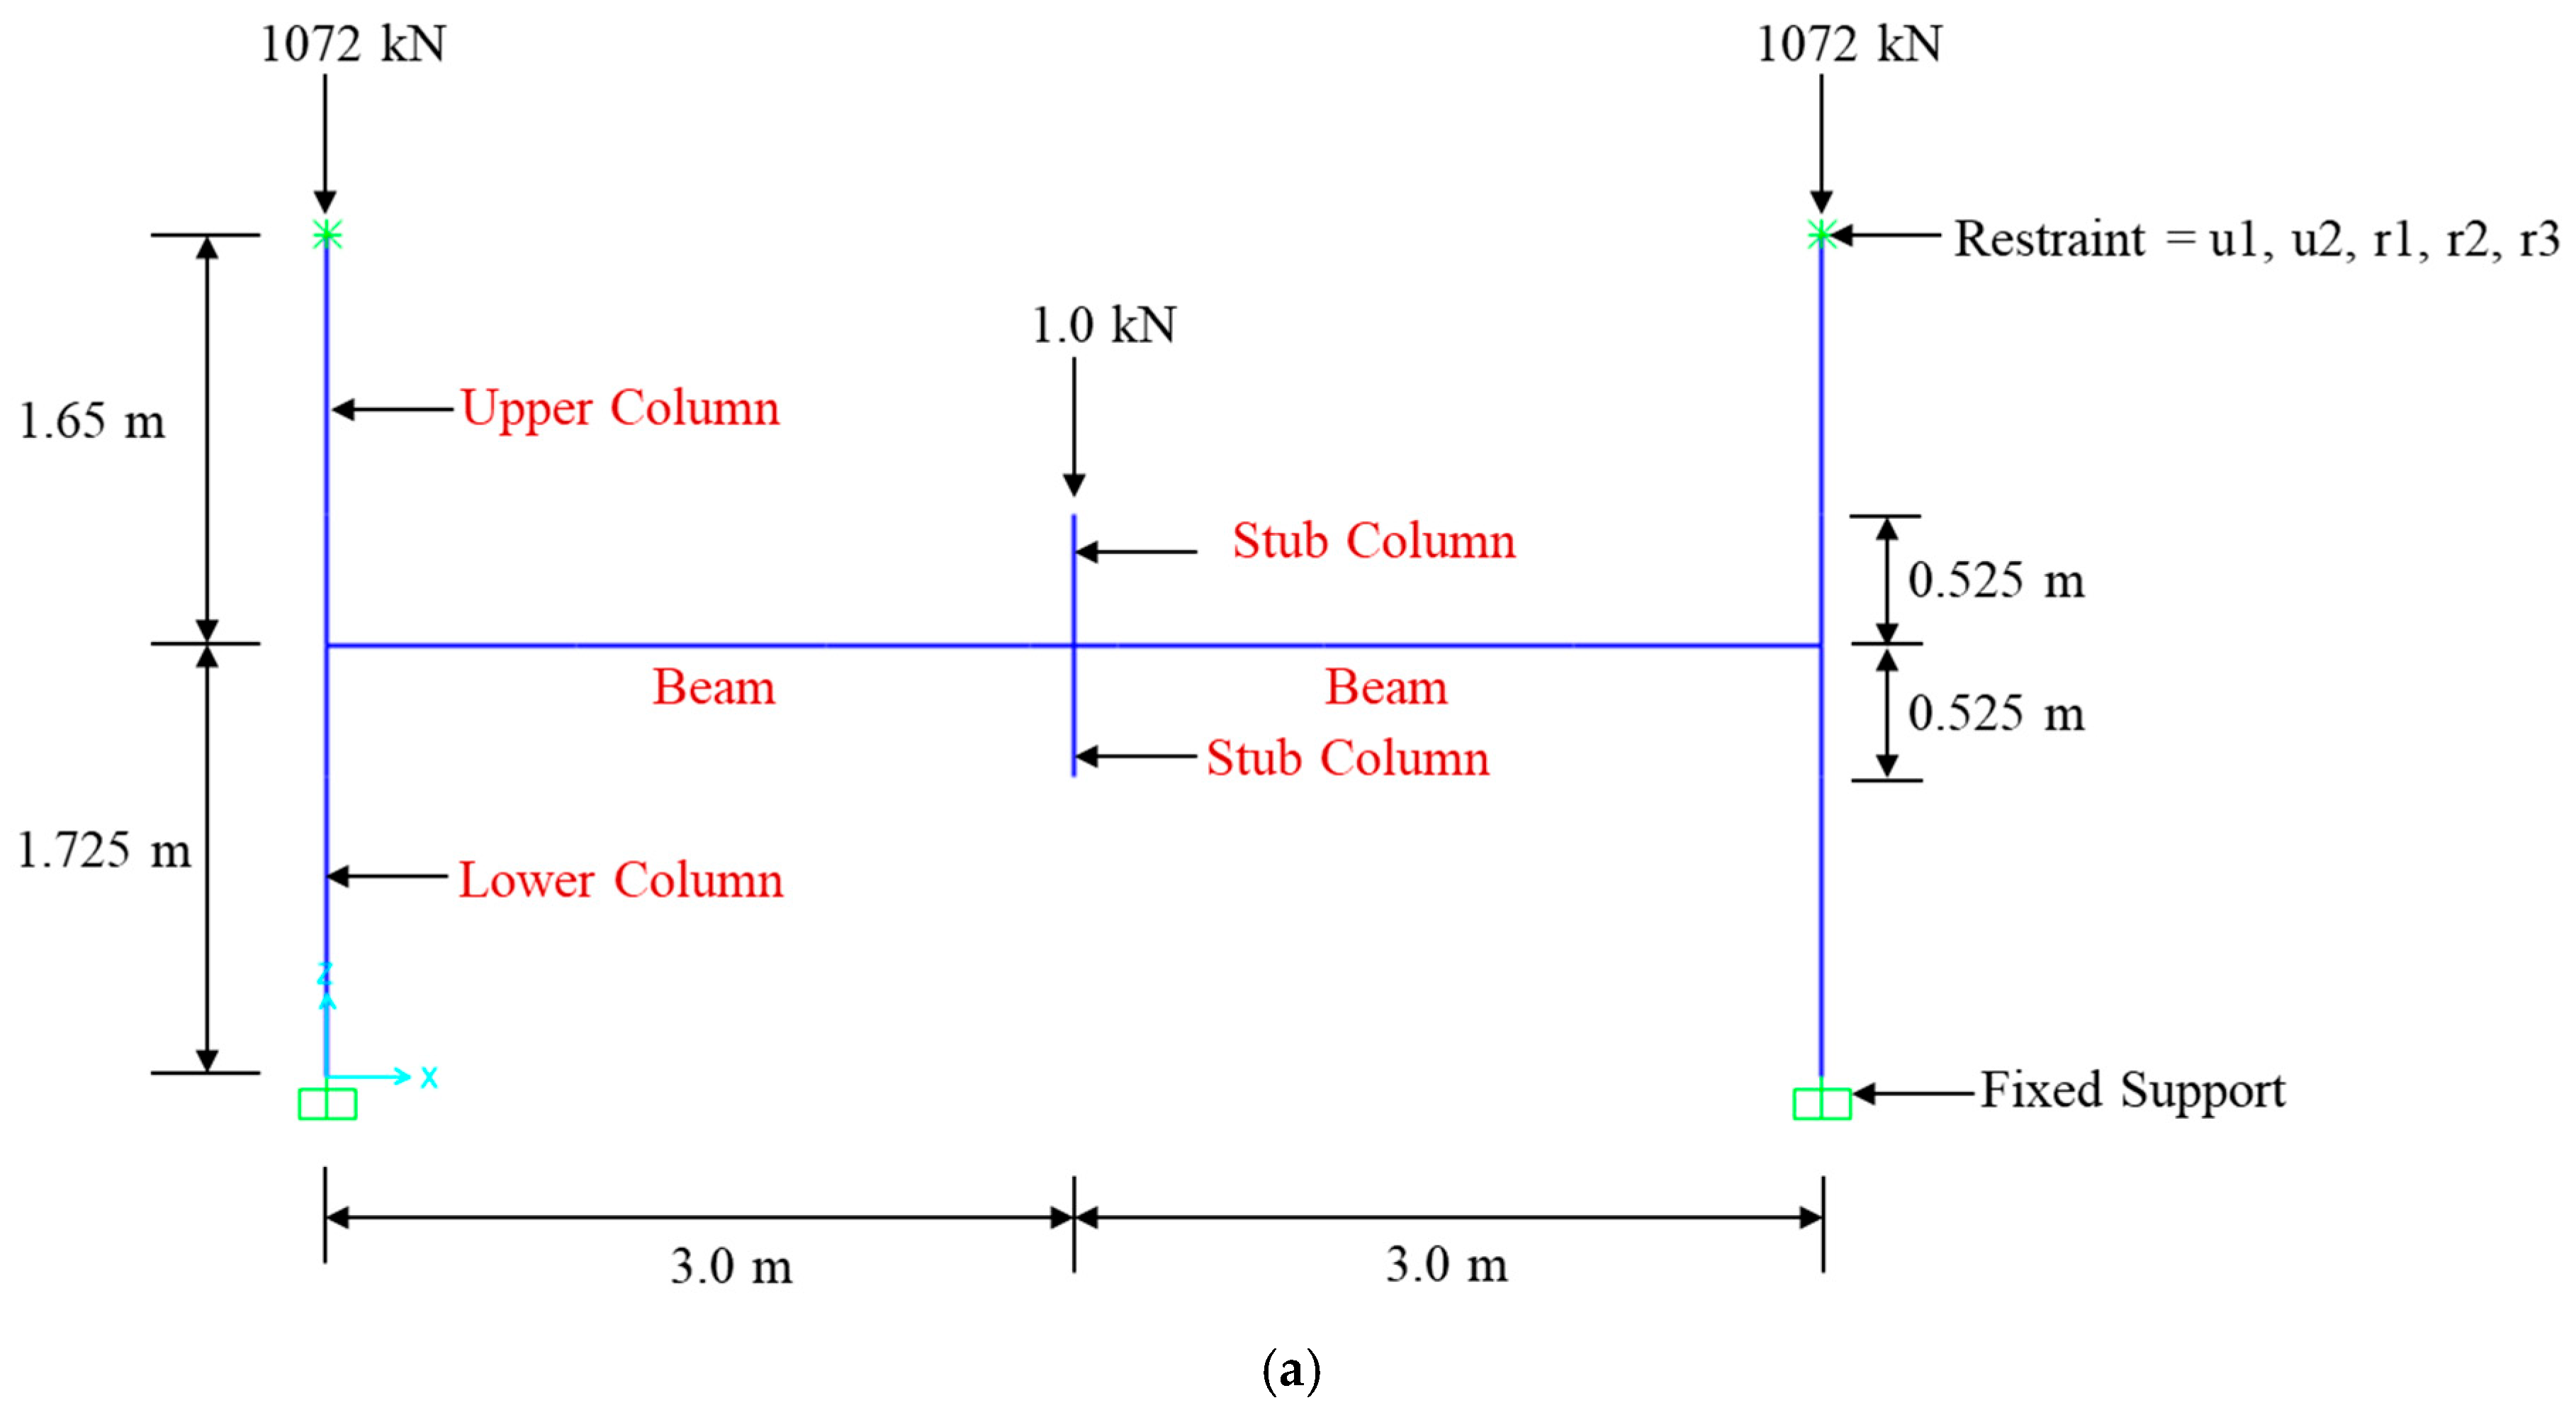
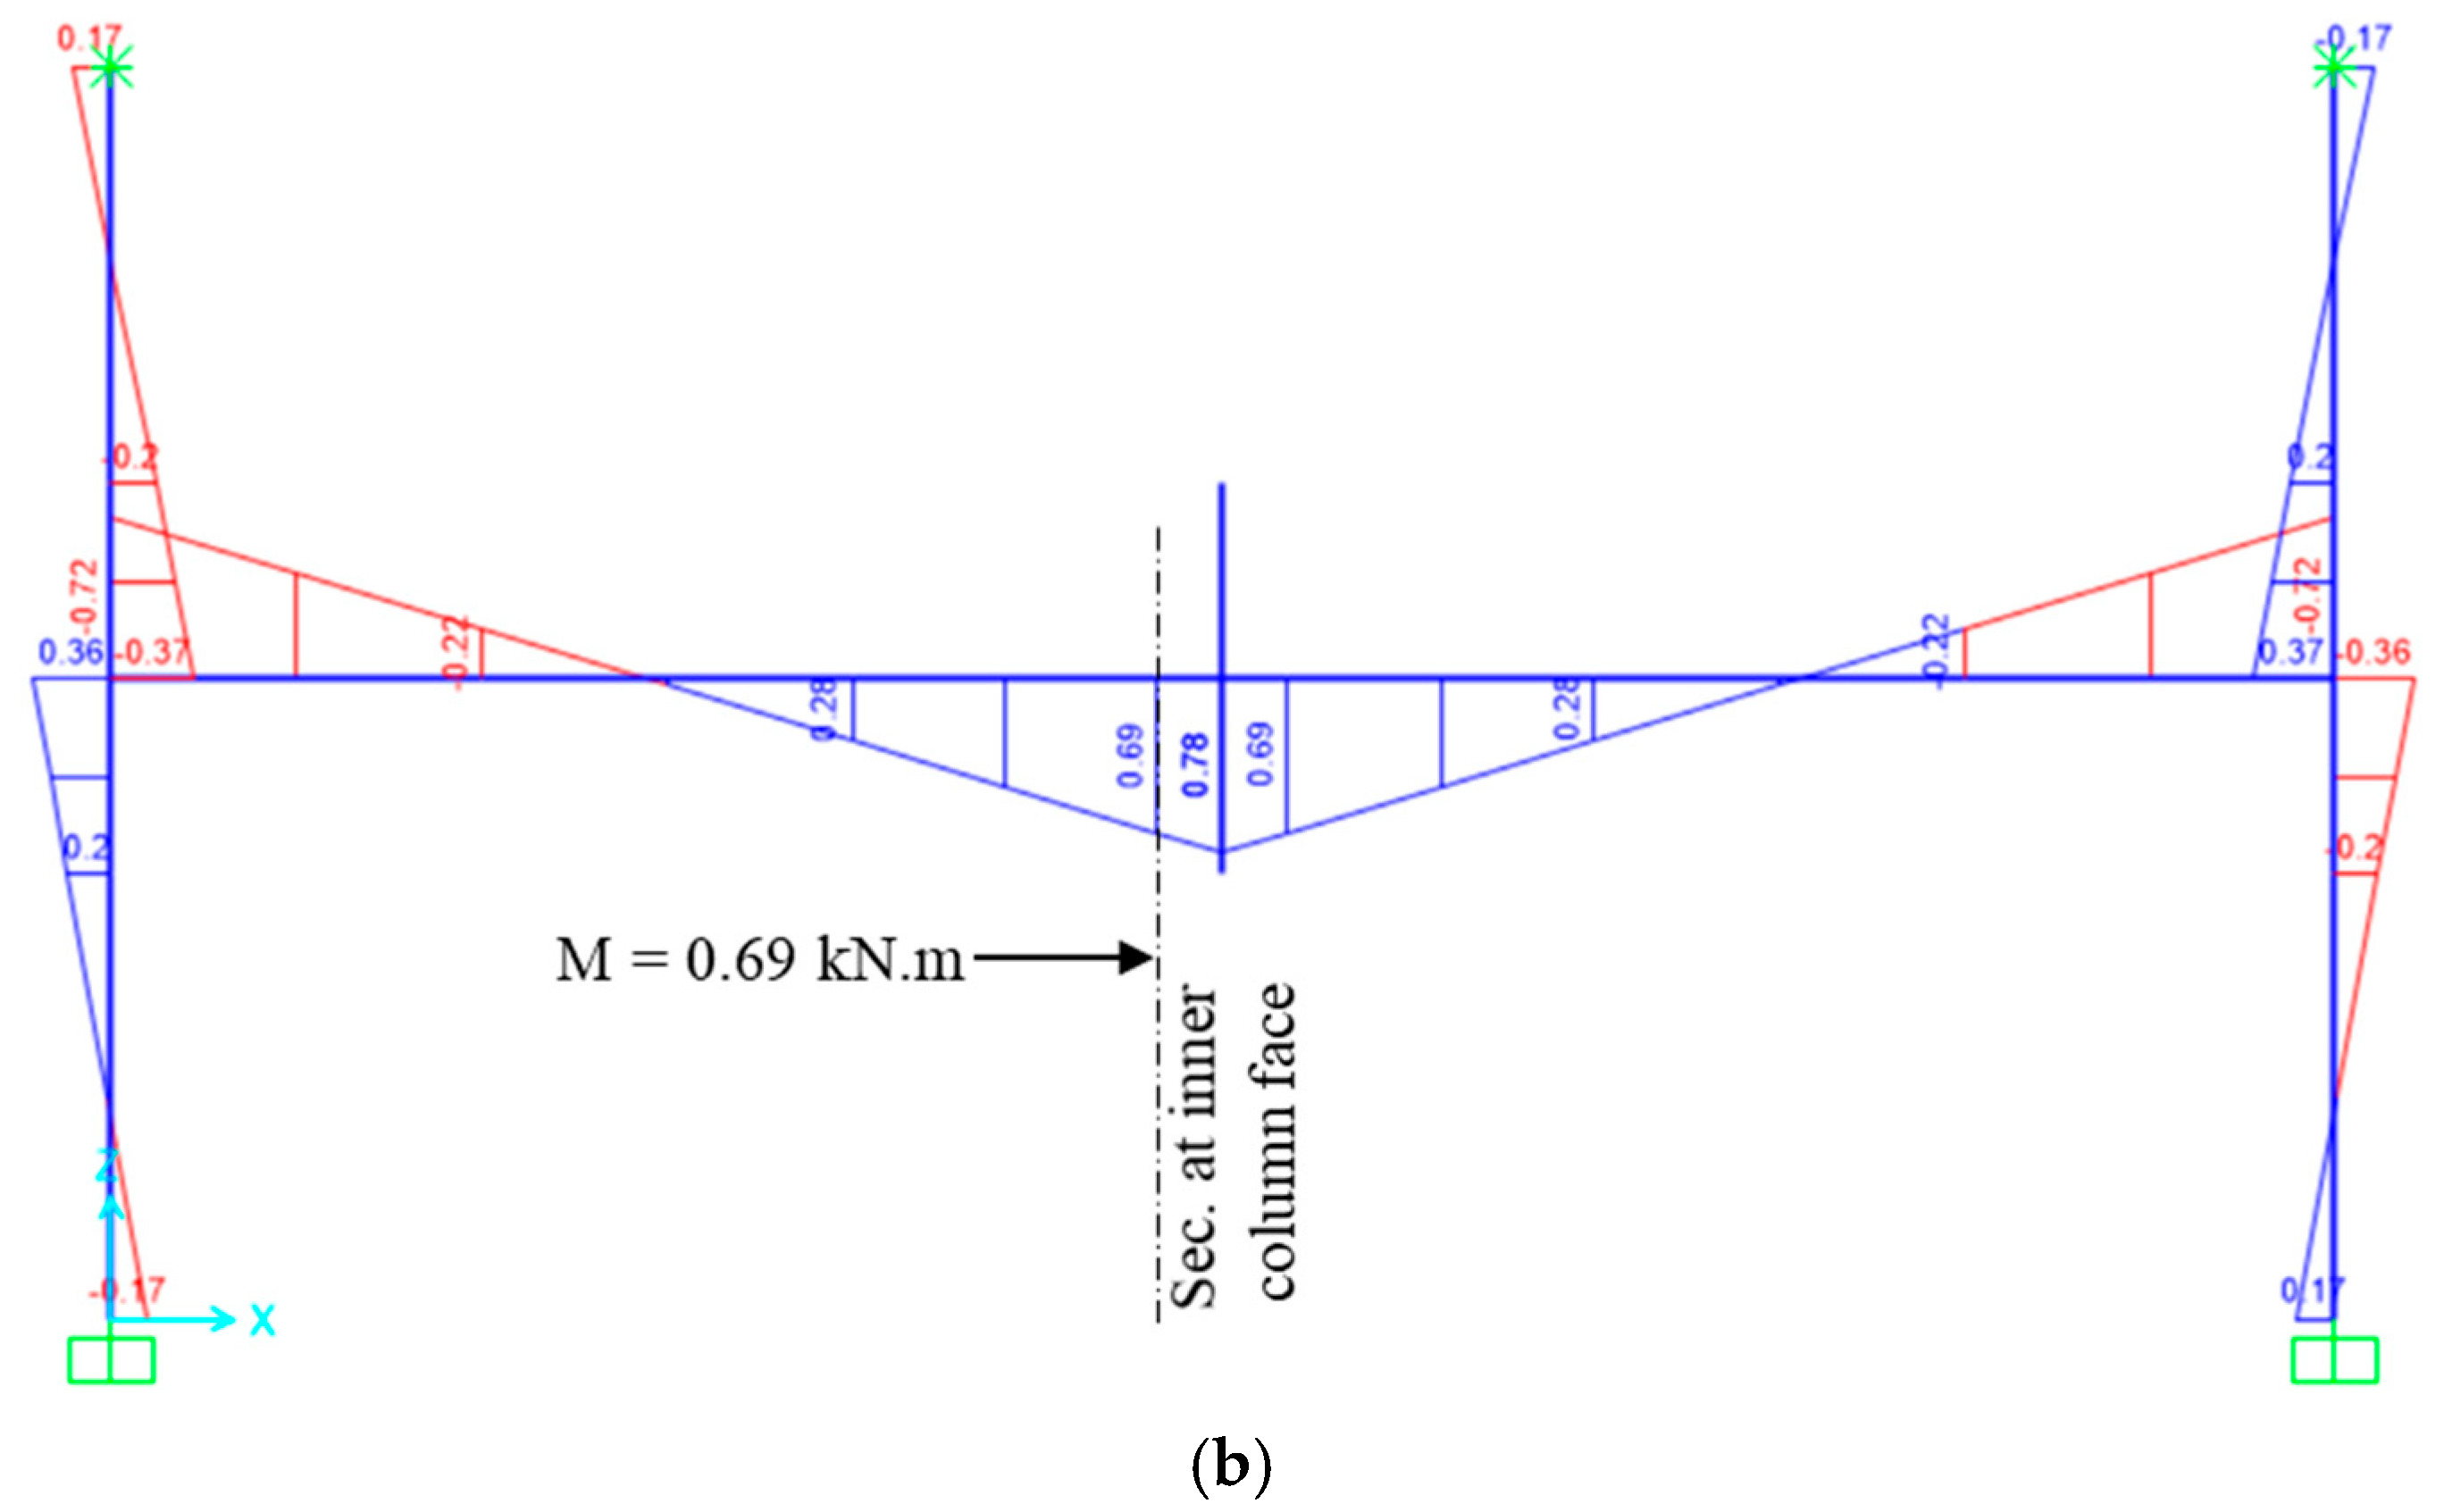
The strengthening design was conducted to upgrade the moment resistance of control specimen CON-0 at the flexural action stage to the level of assembly CON-100 (having continuous bottom beam reinforcement). The frame assembly was simulated using the SAP2000 package [38], as demonstrated in Figure 6a. Frame elements were used in the model with stiffness modifiers in accordance with the ACI 318-19 code [4]. As seen in Figure 6a, the extreme bottom nodes of the lower exterior columns of the simple model were fully fixed by restraining the rotation and displacement in the three global directions (X, Y, and Z). The extreme top nodes of the upper exterior columns of the model were restrained against rotation in the three global directions; however, displacements were only restrained in the global X and Y directions. A vertical load of 1.0 kN was applied on the middle column; however, a vertical load of 1072 kN was applied on the top of the upper exterior columns, thus simulating an axial load ratio of 25% of the axial column capacity. Hence, the bending moment diagram of the model was generated as seen in Figure 6b, and the moment was computed at the middle column face as 0.69 kN.m/kN.
The ultimate moment that needs to be resisted by side steel plates at the flexural action phase can then be computed from
M u F A ,   S P = 0.69 ( P u F A ,   C O N 100 P u F A ,   C O N 0 )   ( units :   kN   and   m )
where P u F A ,   C O N 100 and P u F A ,   C O N 0 are the peak loads of the flexural action stage of control specimens CON-100 and CON-0, respectively, and these values were obtained using 3D nonlinear FE analysis. The steel plate depth was set the same as the beam depth (350 mm), and the thickness of the plate was designed to satisfy Equation (1). Details of the equations used to compute the flexural capacity of the beam section upgraded by side steel plates can be found in Ref. [28]. For strengthening the inner and outer connections, steel plates with lengths of 1750 mm and 1150 mm, respectively, were used (refer to Figure 3, Figure 4 and Figure 5). These lengths were selected to ensure that plates were extended twice the depth of the beam past the column face, covering the plastic hinge region for RC special moment frames [4]. The steel plates were assumed to be connected with the RC assembly using an epoxy adhesive mortar.
In order to preclude premature plate buckling in the compression side close to the joint, high-strength steel rods (diameter = 14 mm) were employed to connect the plates to the frame (see Figure 3, Figure 4 and Figure 5). Rod spacing was designed using simple calculations, assuming elastic Euler buckling. It was assumed that the plates between the rods behaved like axially loaded, fixed columns under compression. The maximum on-center rod spacing, which was calculated to mitigate plate buckling, was approximately assessed via equating the yield strength with Euler buckling stress according to the subsequent equation.
s m a x = 2 π t p E s 12 f y p
where t p is the plate thickness, E s is the elastic modulus of steel, and f y p is the yield strength of the plate. As seen in Figure 3 and Figure 4, a rod spacing of 150 mm (on centers) was assumed for all assemblies strengthened with double-sided steel plates (schemes S1-DS and S2-DS) based on the worst case of 3 mm thick plates of ASTM A302, Grade B steel. However, for specimens upgraded with single-sided steel plates (scheme S2-SS), rod spacing of 300 mm (on centers) was used owing to the increased plate thickness of 10 mm (see Figure 5 and Table 2). The steel rods were assumed to be bonded with the concrete using epoxy-based adhesive mortar, as presented in Figure 3, Figure 4 and Figure 5.
Mechanical properties of the different constituent materials utilized in the investigated specimens are presented in Table 3. For both concrete and reinforcing bars, the material properties were assumed to be the same as those utilized in a previous study [33] for unstrengthened assemblies. However, for steel plates and rods, the material properties were taken from the manufacturer’s datasheet. As previously stated, the specimens’ response was assessed under the center column removal scenario. The loading protocol used in the study was identical to that used in prior research studies [29,32,33] for the analysis of RC beam–column assemblies in the event of column loss, and it will be described in the following section.
The potential failure modes for post-installed anchors in specimen S2-SS (with steel plates applied on one face of the beam) include pull-out or concrete breakout. Punching failure around the rod head is prevented by the 10 mm thick steel plate, while concrete breakout is unlikely due to the presence of longitudinal and transverse rebars in the beam. The pull-out capacity of the adhesive anchors is about 77 kN, which is significantly larger than the axial tension developed in the rods of specimen S2-SS-EN1.4103 (maximum axial force of 58 kN was predicted in the FE analysis).

3. FE Analysis

The LS-DYNA package Version R11 [17] was used to simulate the three control specimens (listed in Table 1) and the seven upgraded assemblies (listed in Table 2). The simulation only required modeling half of the frame assembly due to its symmetry. While the local buckling/tearing of steel plates could break symmetry, prior studies indicate that these effects are minor for the configurations considered, and the global response remains largely symmetrical. Thus, the half-model provides a reasonable approximation of the overall behavior.

3.1. Mesh Generation

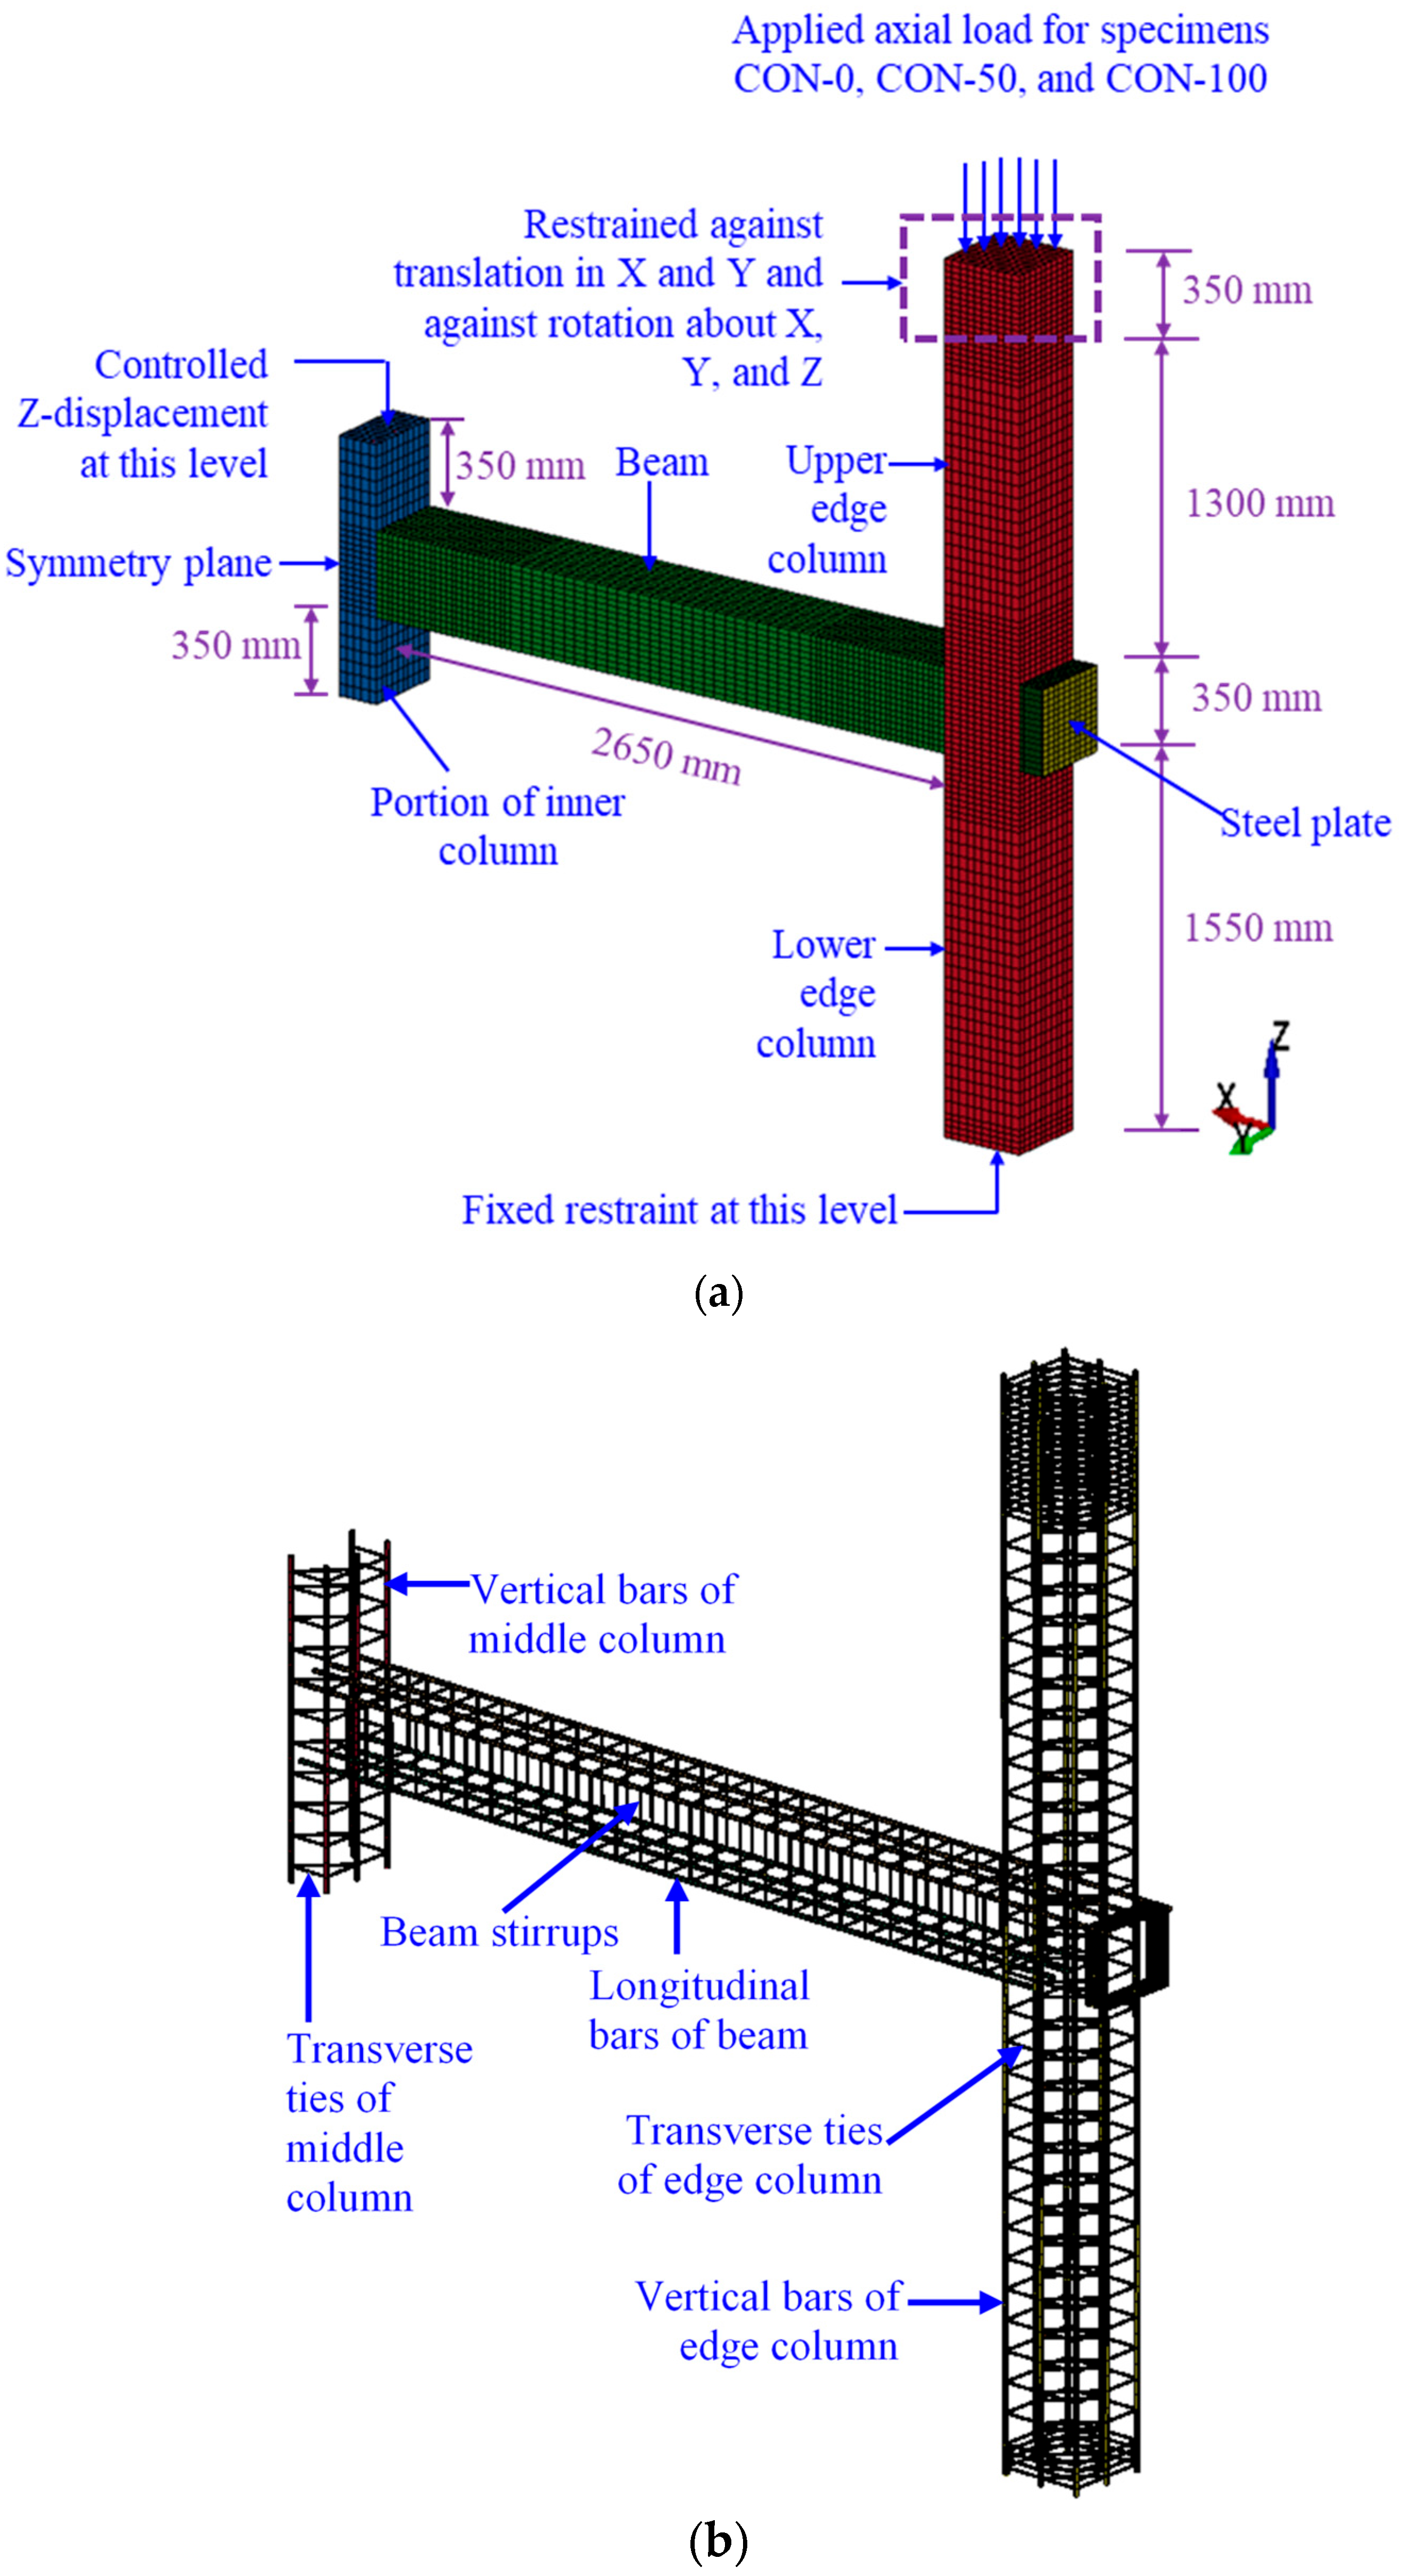
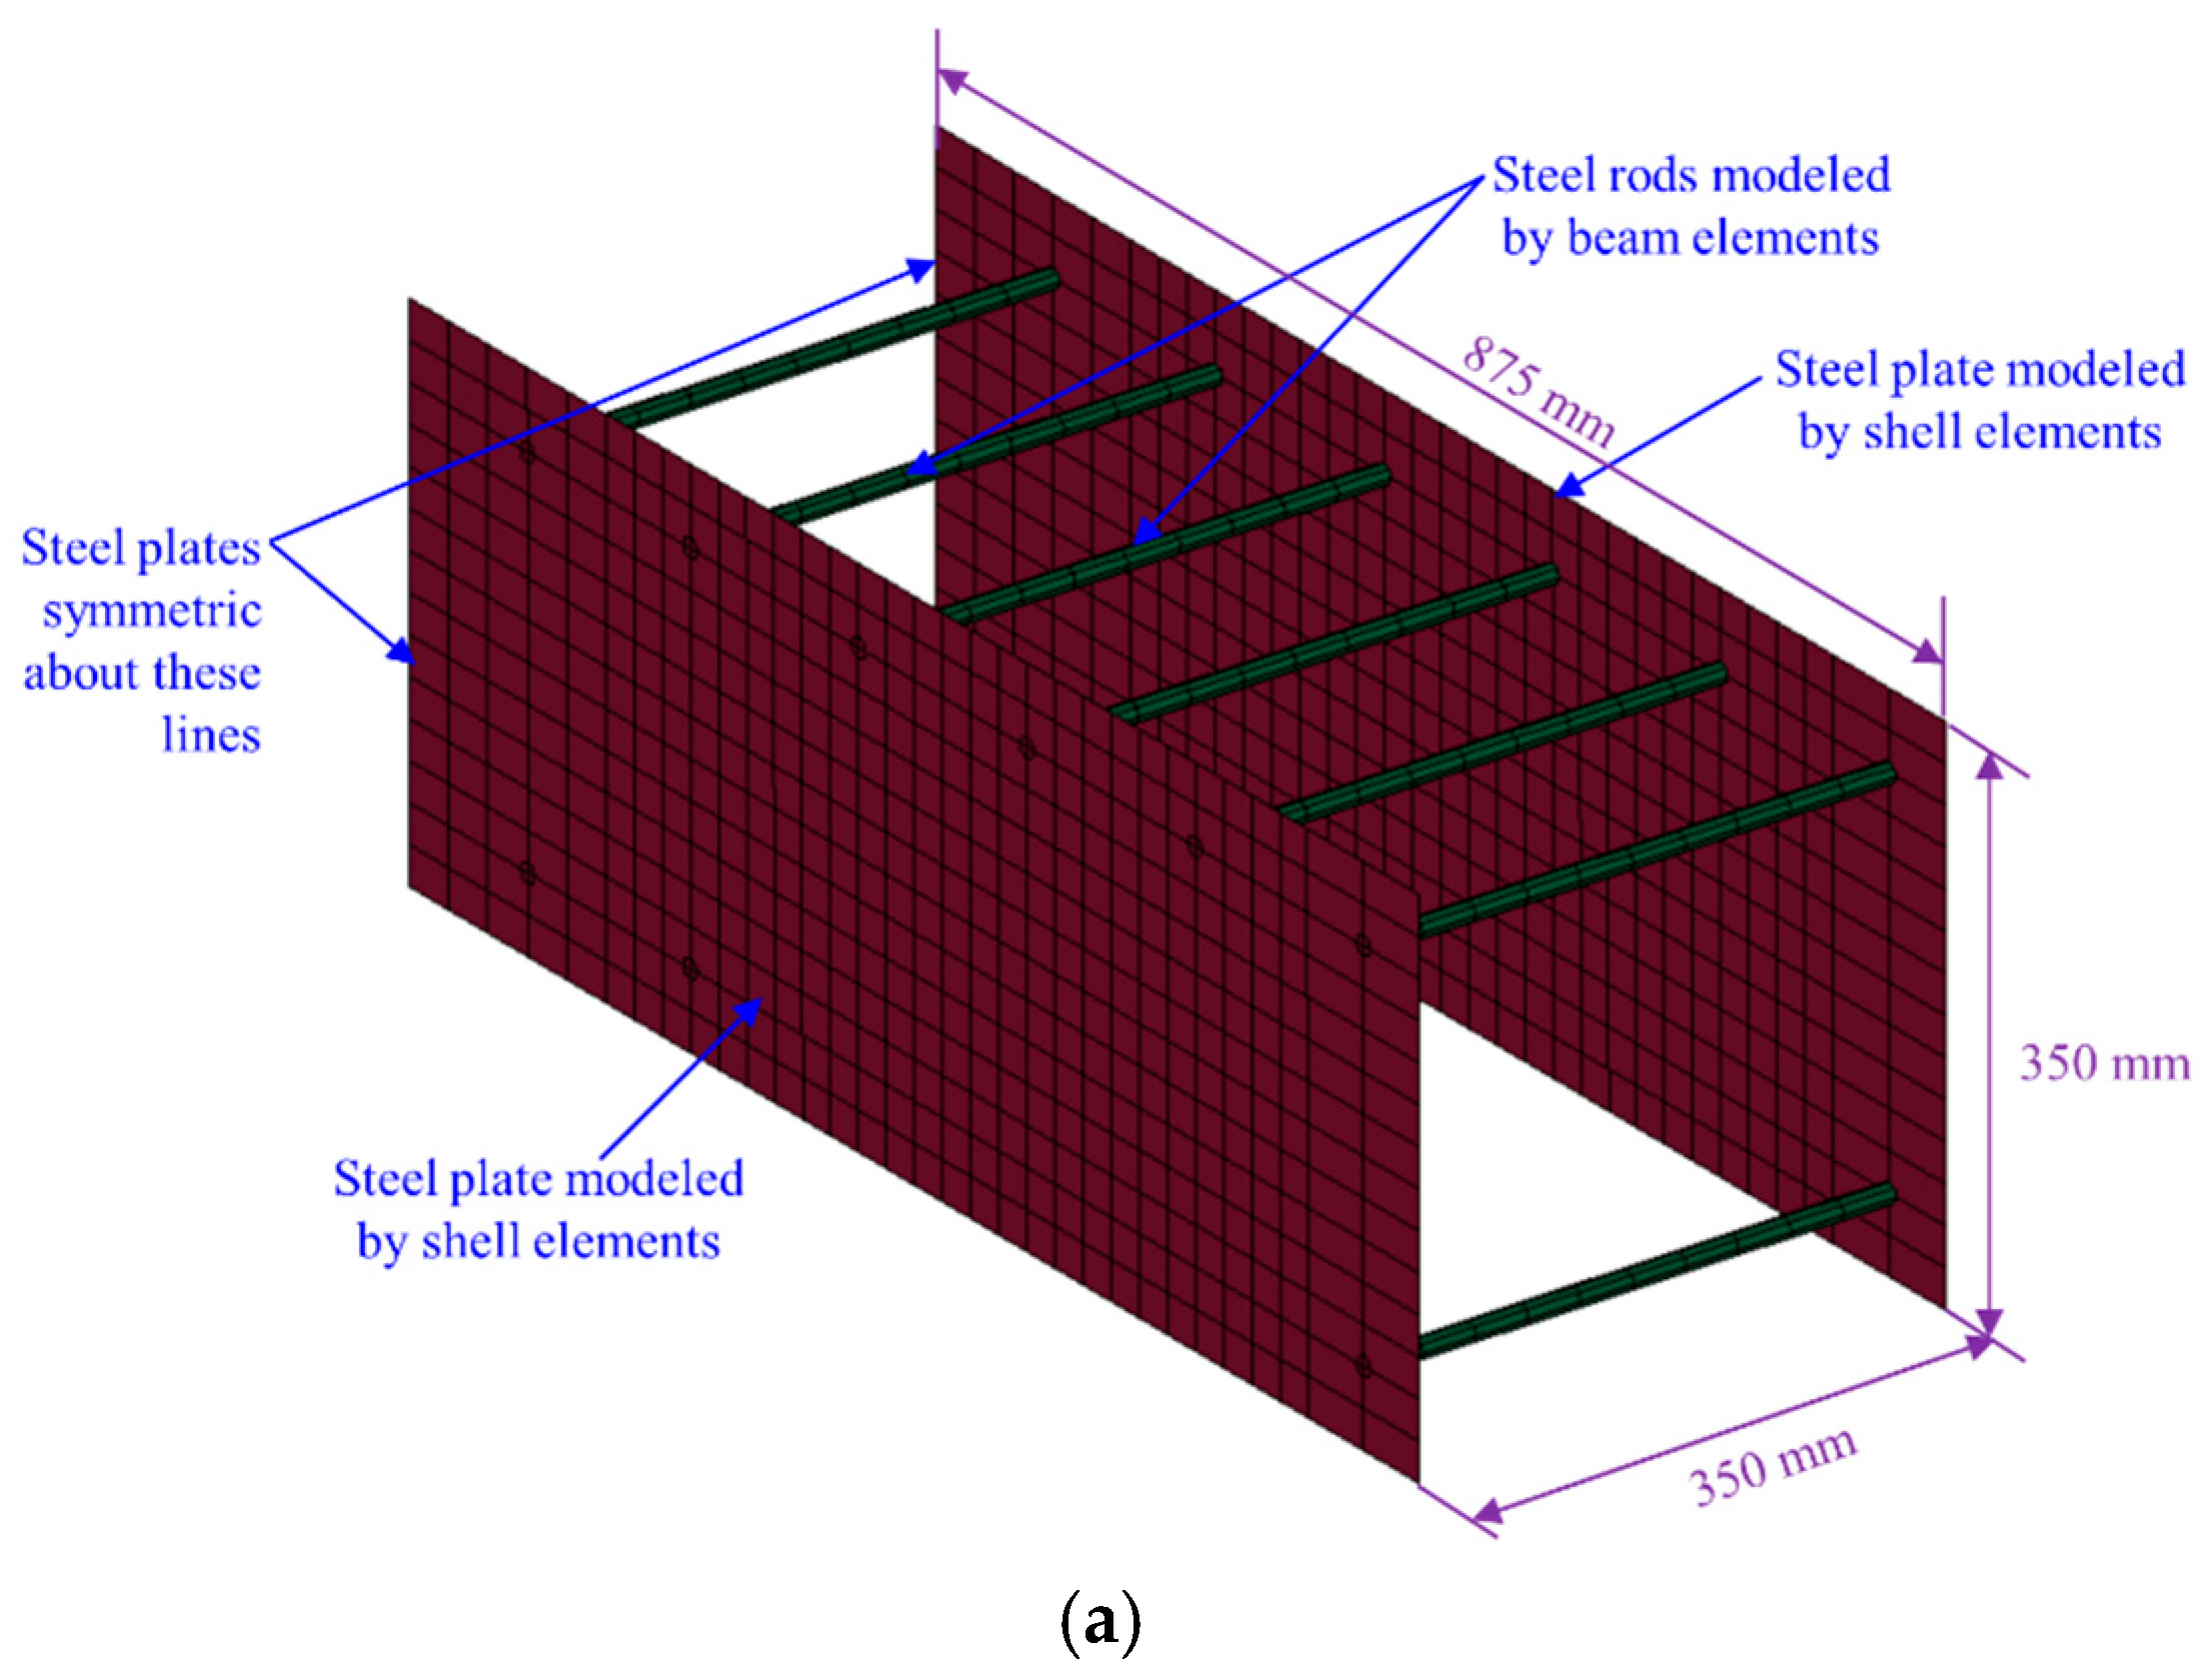
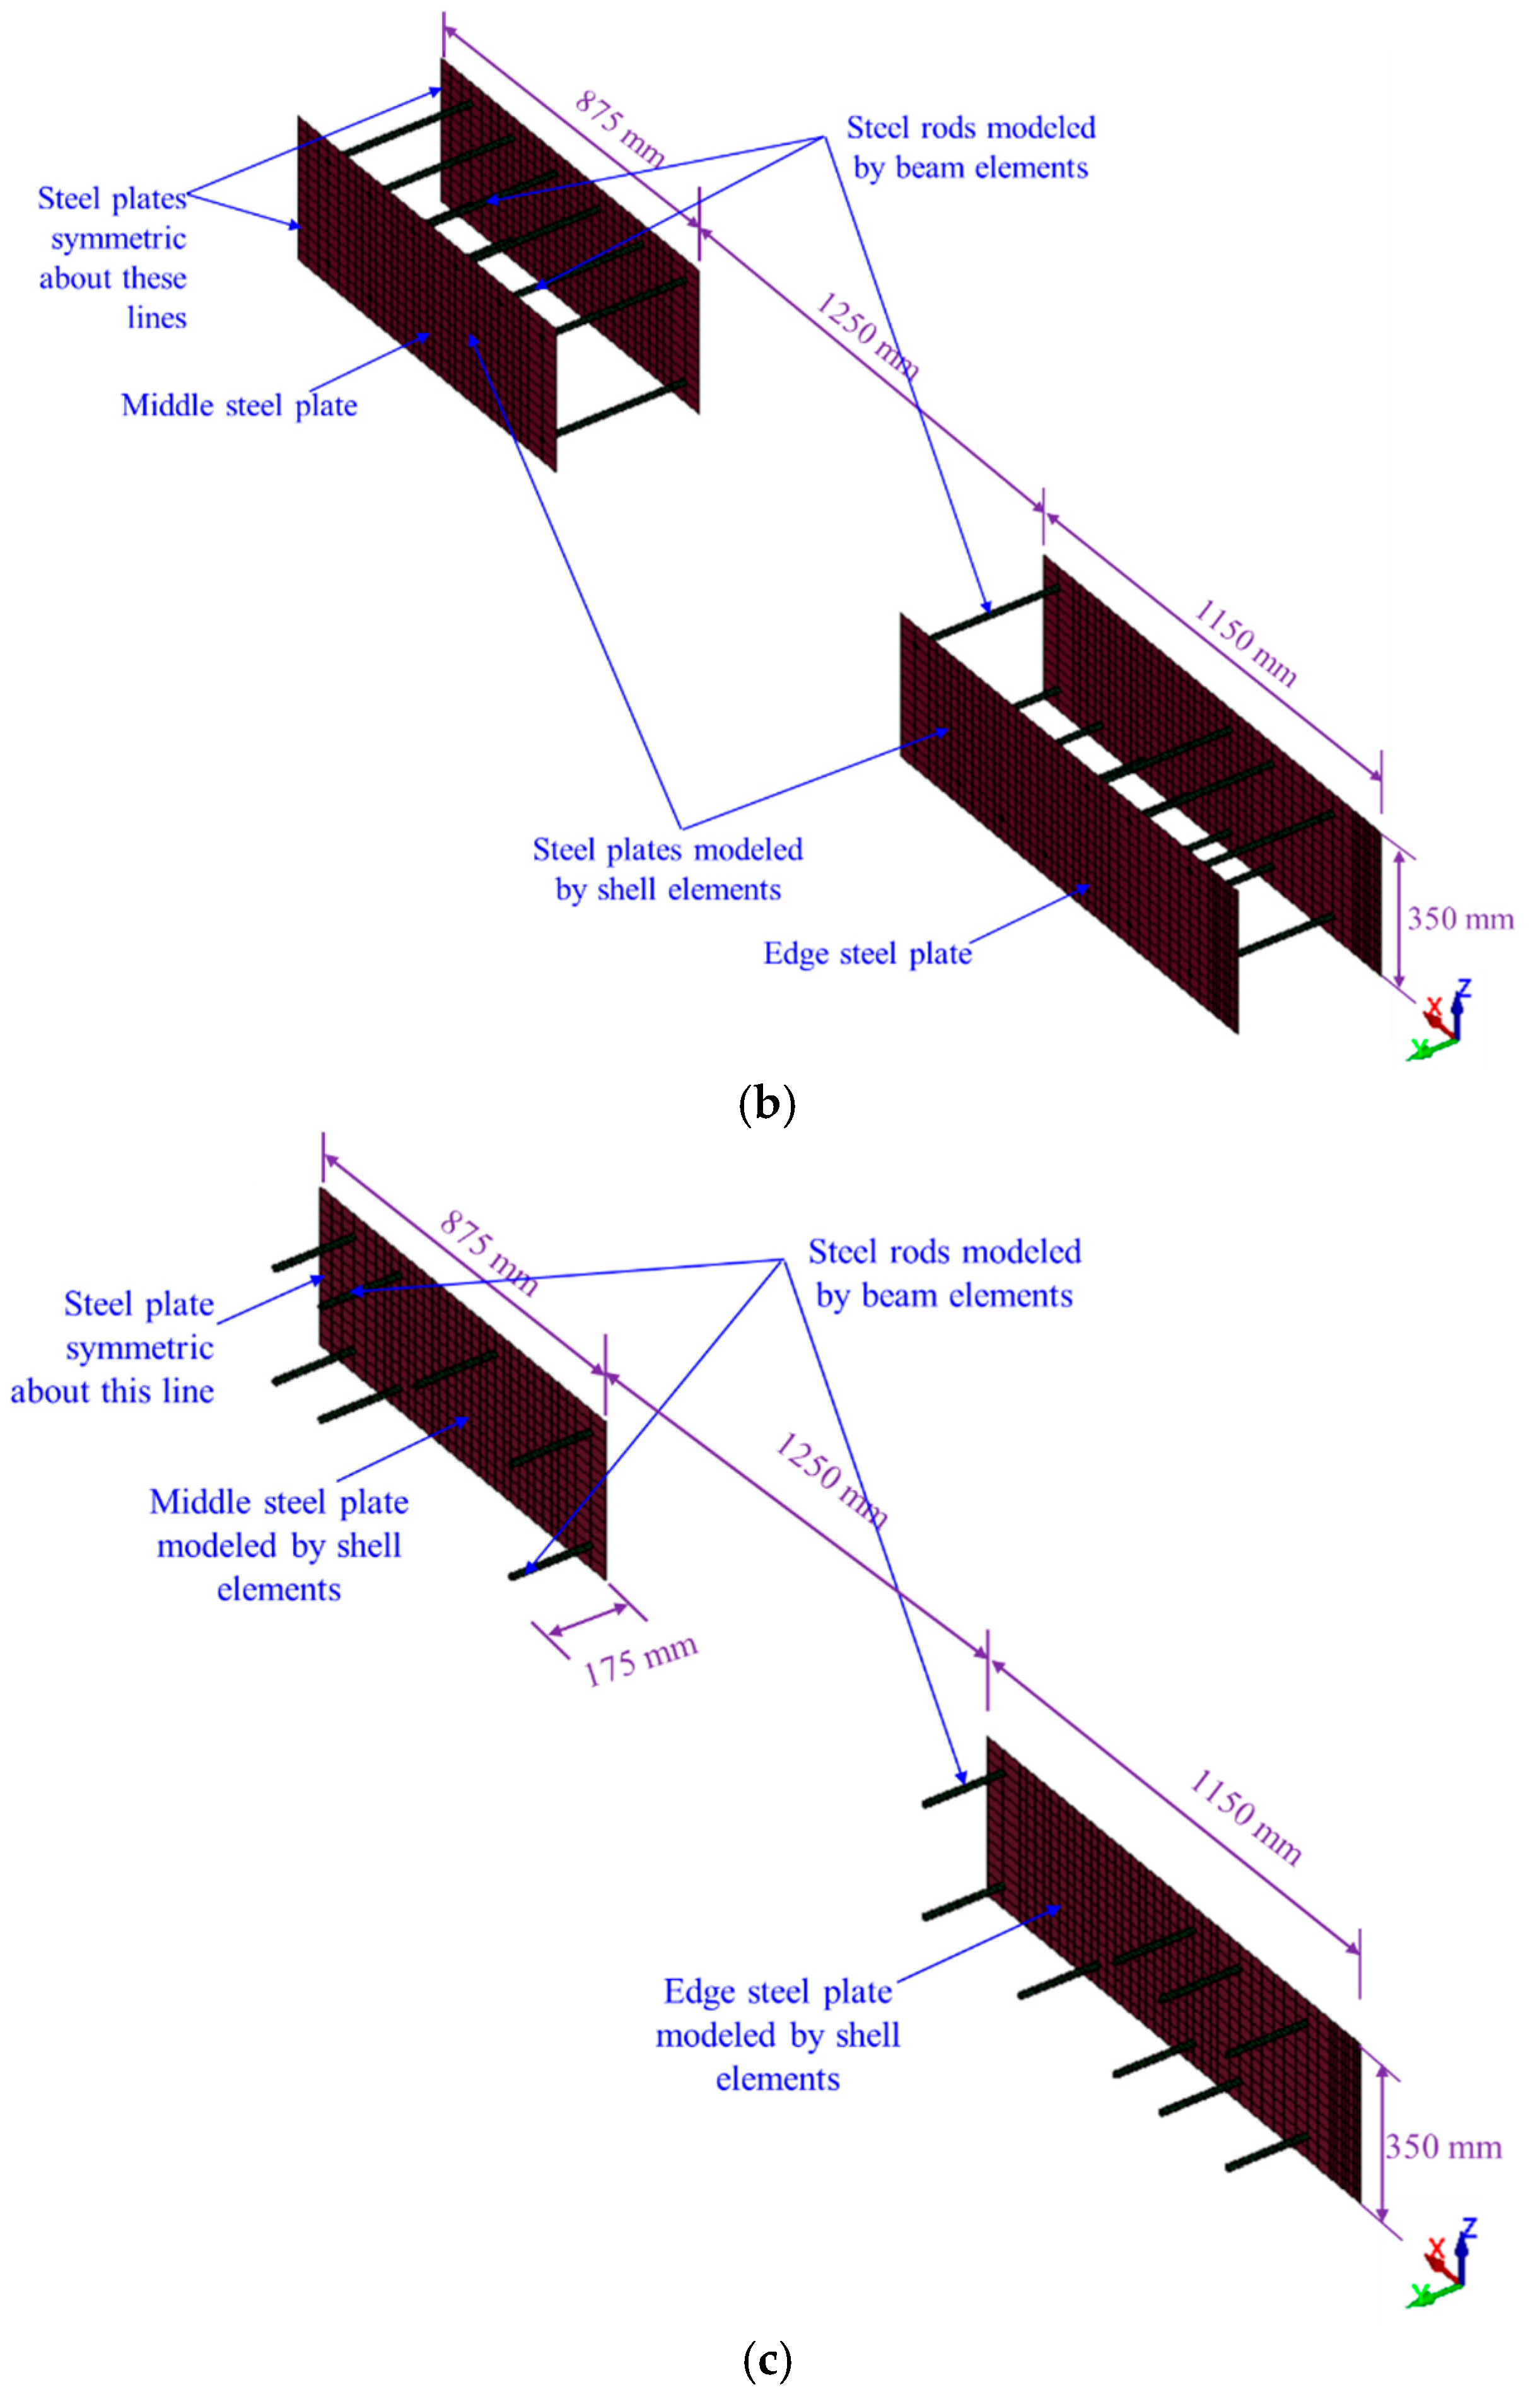
The FE model shown in Figure 7 represents one-half of the control specimens, while Figure 8 depicts one-half of the strengthening schemes. Reduced integration brick elements of eight nodes were employed for concrete. These elements improve computational efficiency and avoid overly stiff behavior associated with full integration elements. Reduced integration helps mitigate volumetric locking and allows for accurate capture of bending-dominated responses in the RC frame while reducing the total number of integration points, thereby decreasing computational cost without compromising the accuracy of global load–displacement predictions. For steel bars and rods, beam elements of two nodes were used. As demonstrated in Figure 8, the strengthening steel plates were simulated using shell elements of four nodes [39]. In all models, the mesh size ranged from 10 to 50 mm, chosen based on the mesh sensitivity analysis reported in past studies [16,29].

3.2. Constitutive Models

Table 3 provides an overview of the main input parameters utilized in the FE analysis for the constitutive rate-dependent models. The FE analysis employed the continuous surface cap rate-dependent model type 159 for concrete. More information about this model can be found in Refs. [17,39]. On the other hand, for steel bars, plates, and rods, the piecewise linear plasticity rate-dependent model type 24 was selected. For the strain-rate effect, the steel yield strength was scaled as per the subsequent formula.
D I F y = 1 + ε α 1 β
where D I F y   is the dynamic increase factor, ε denotes the strain rate (in s−1), and α and β are strain-rate parameters. The values assigned to α and β are 250 and 1.6, respectively [29,32,33]. Concrete erosion was indicated by the maximum principal strain exceeding 5%, which helped alleviate excessive distortion of concrete components [39,40]. On the other hand, the ultimate plastic strain (as given in Table 3) was selected to identify the failure of steel elements.

3.3. One-Dimensional Contact Model

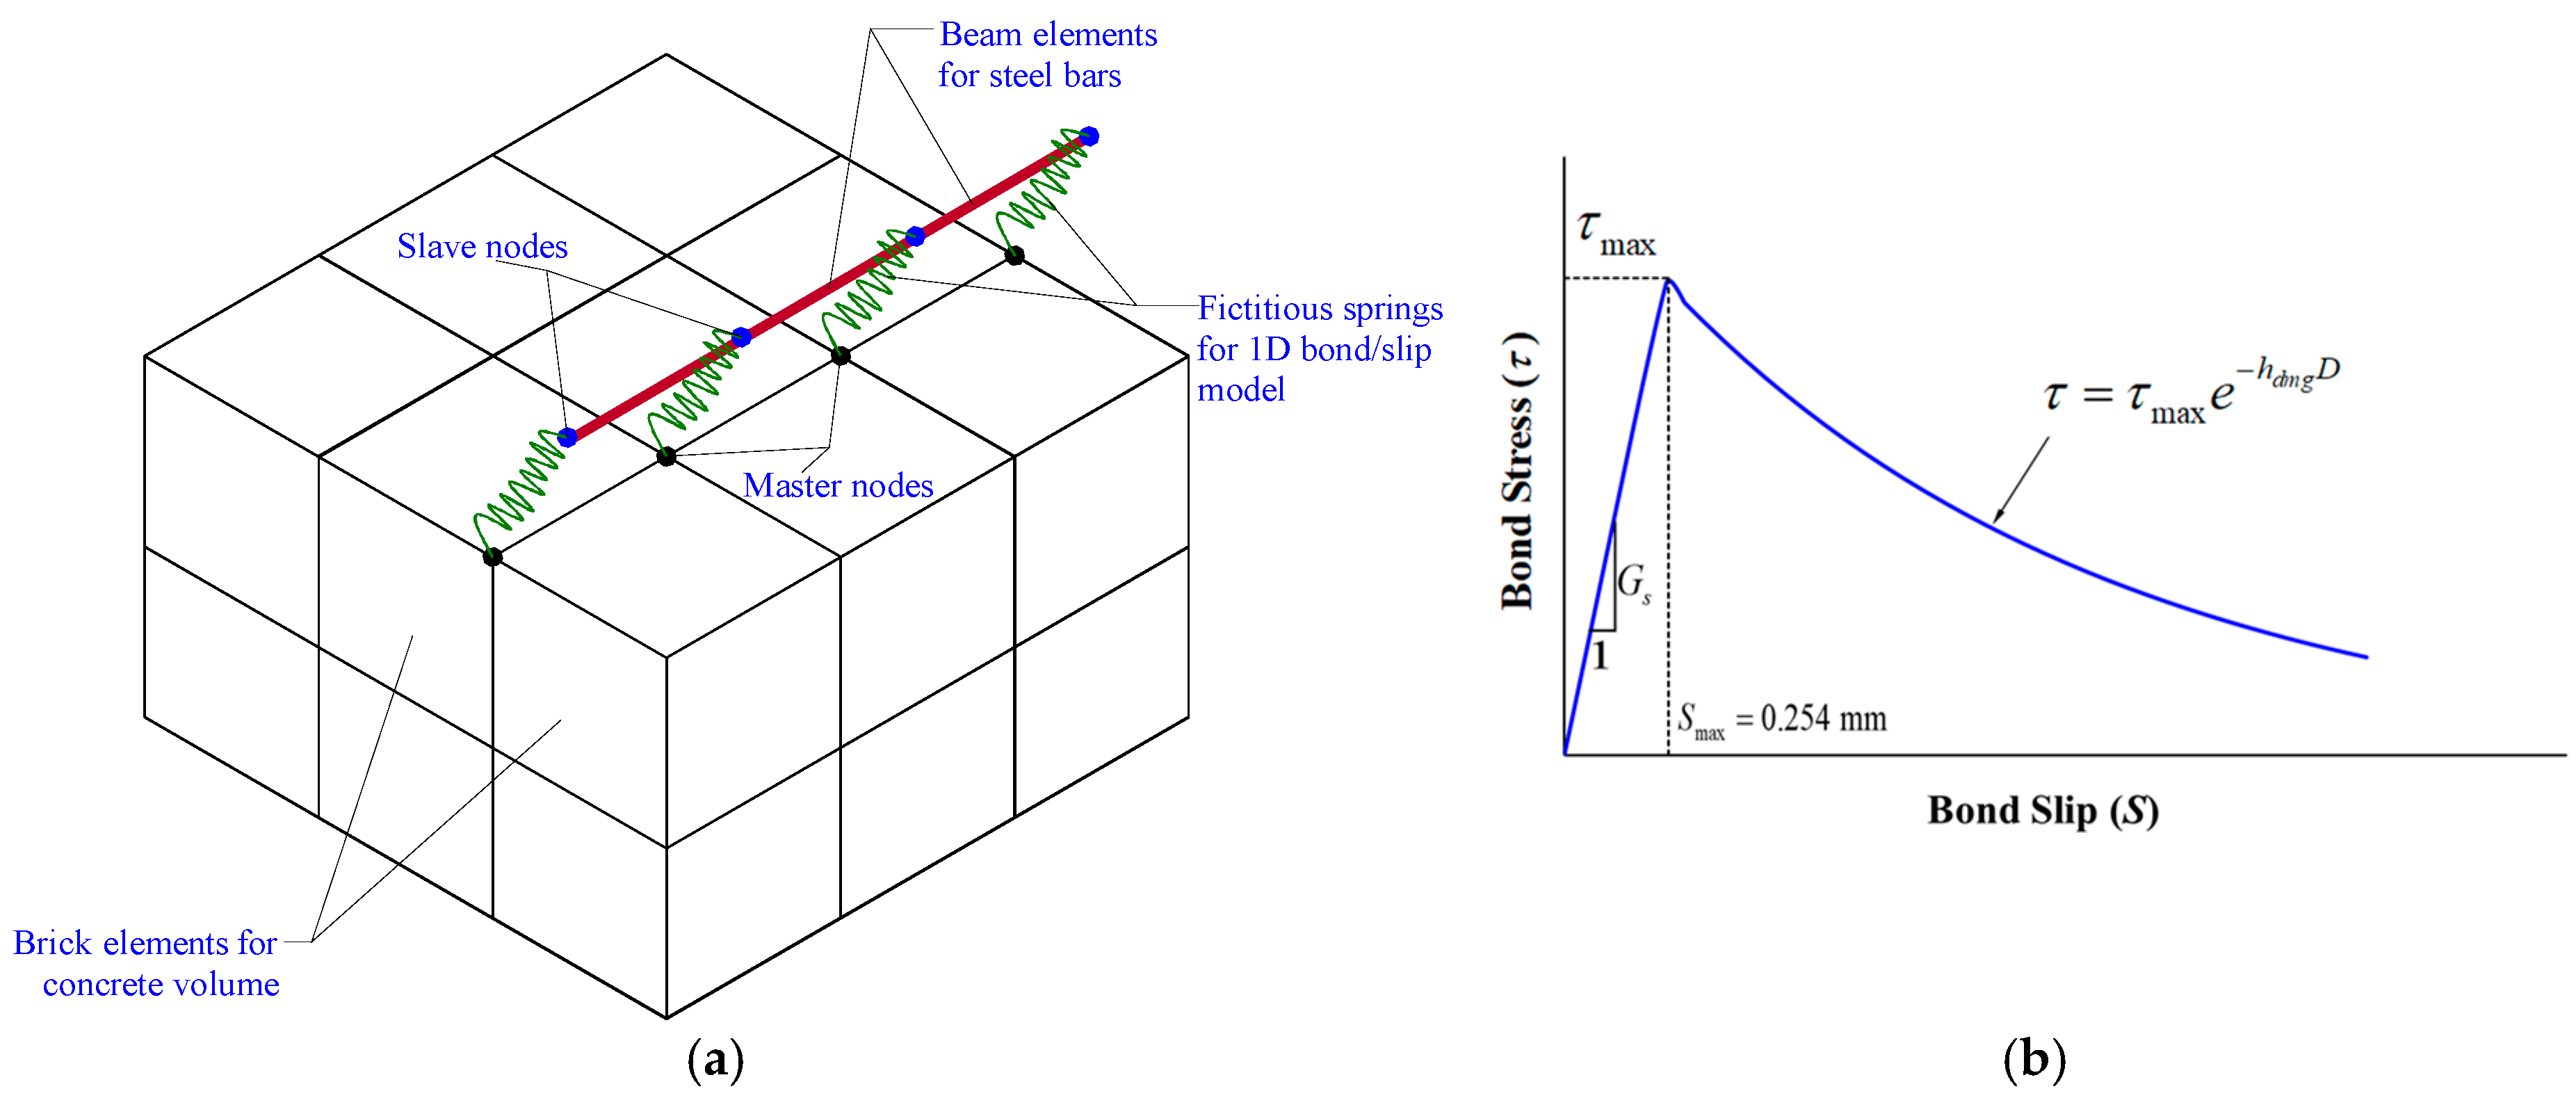
For the top and bottom longitudinal steel bars in beams of all specimens (4 ϕ 16 mm), bond-slip behavior was represented at their interaction with concrete. However, for all other steel bars in the specimens (beam stirrups, longitudinal column bars, and column ties), a perfect bond was simulated at their interface with concrete. For the bond-slip simulation, the one-dimensional (1D) contact model was used. In this model, as shown in Figure 9a, imaginary springs were positioned between slave nodes of steel elements and master nodes of concrete elements. Up to the maximal bond stress ( τ m a x ), the bond-slip curve, as depicted in Figure 9b, was input to be linear. After reaching this peak, the bond stress reduced with increasing plastic slip according to Equation (4).
τ = G s s                         s s m a x τ m a x . e h dmg D         s > s m a x
where τ and s are the bond stress and associated slip, G s is the bond modulus, s m a x is the peak elastic slip, h dmg is a decay coefficient, and D is a parameter accounting for interface damage. The peak elastic slip s m a x was determined to be 0.254 mm. The ACI 408R-03 [41] formula was used to compute the peak bond stress from
τ m a x = 20 f c d b 5.52   MPa   ( units :   N   and   mm )
where f c and d b are, respectively, the concrete strength and bar diameter. Subsequently, the bond modulus was calculated from
G s = 78.74 f c d b 21.73   MPa   ( units :   N   and   mm )
The exponential coefficient h dmg was assigned a value of 0.90.

3.4. Modeling of Contact Between Plates and Concrete

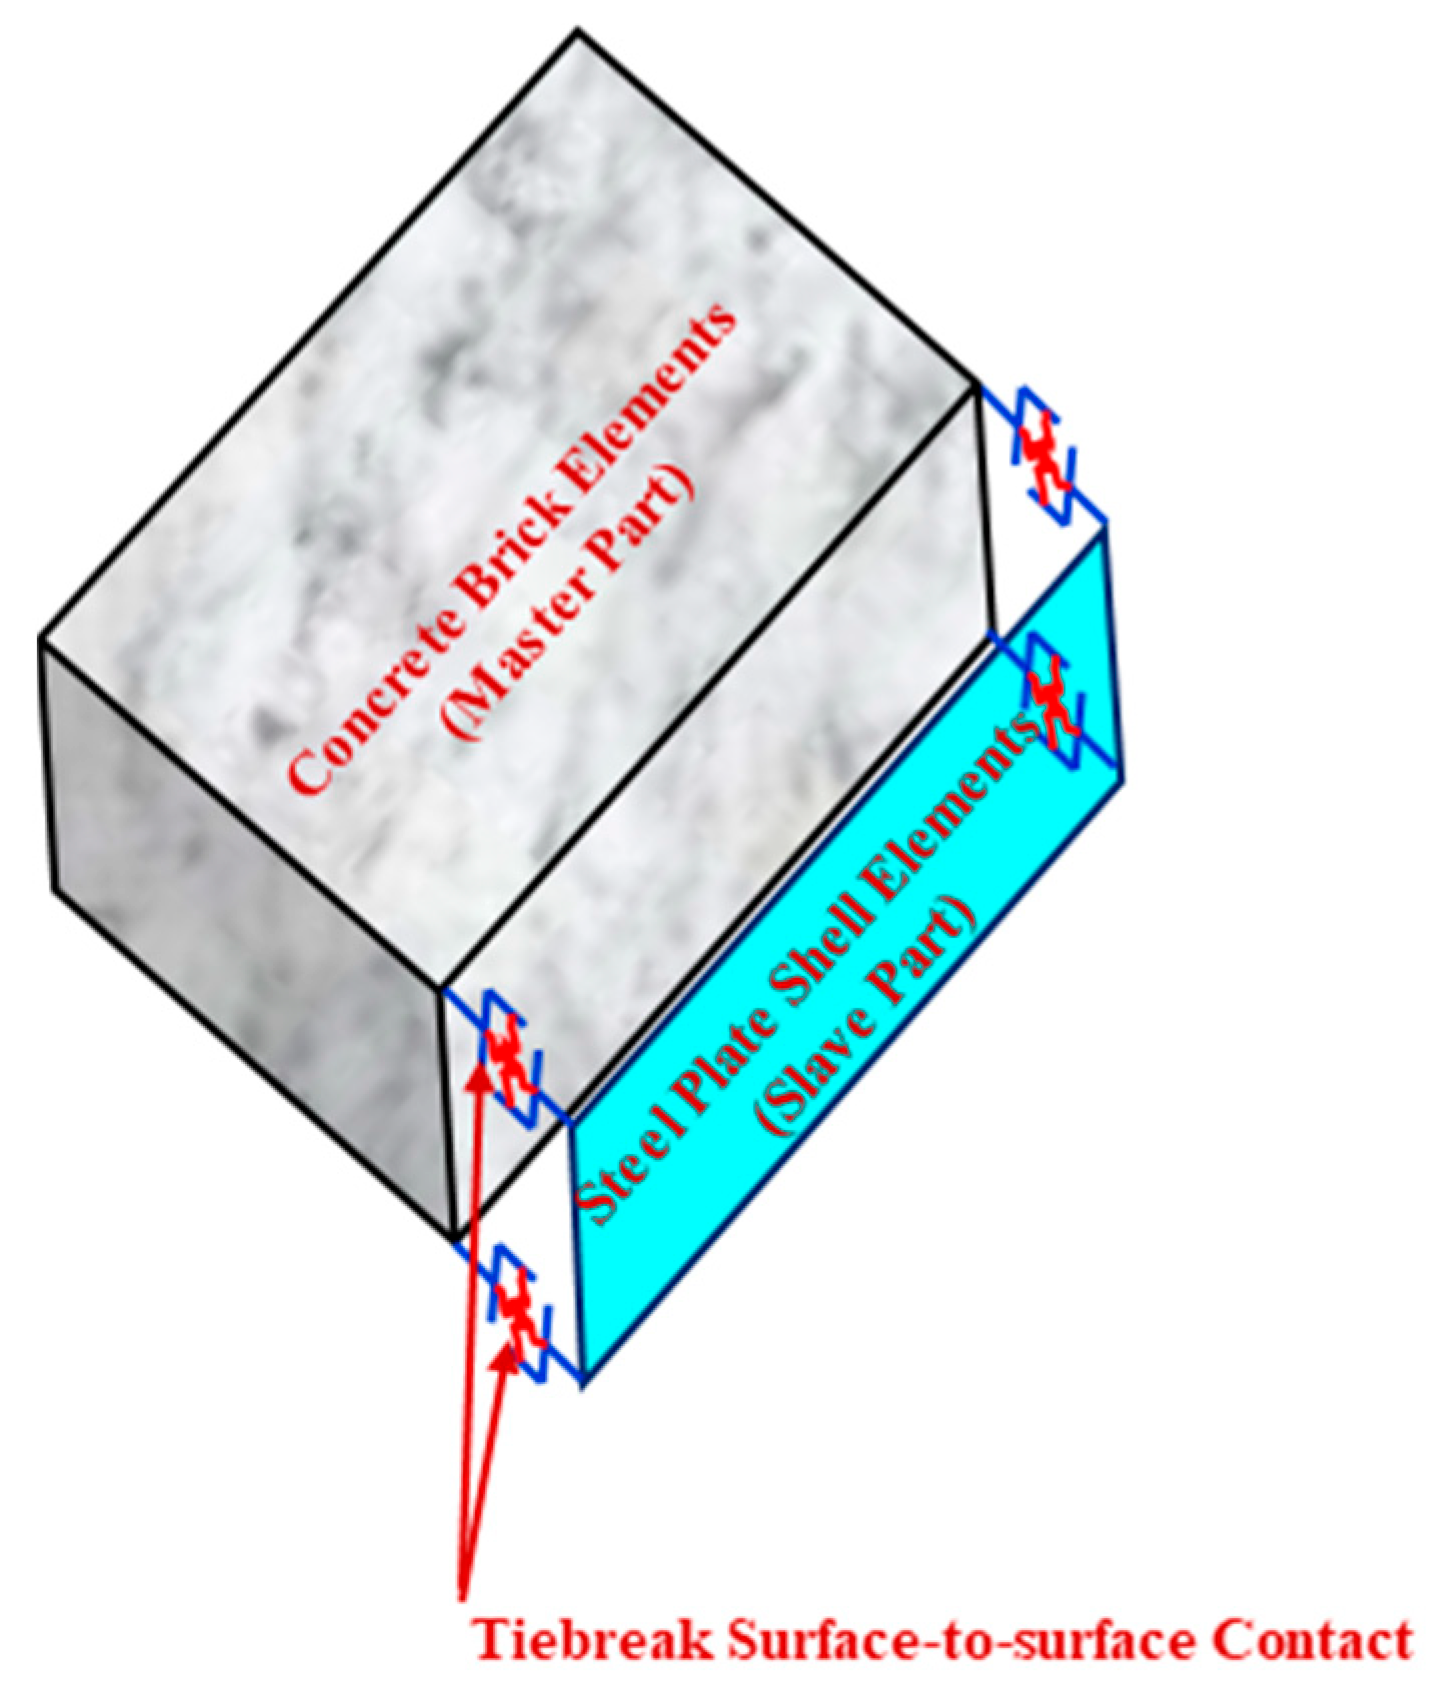
For strengthened frames, the bond at the interaction of concrete with steel plates was modeled employing the tiebreak surface-to-surface contact available in the software (LS-DYNA Version R11) according to the subsequent formula.
f s f s , F 2 + f n f n , F 2 1
where f s and f n are, respectively, the shear and normal stresses at the interface between steel plate and concrete; and f s , F and f n , F are the shear and normal stress thresholds, respectively, computed from the following equations [29]:
f s , F = 0.62 f c                   ( units :   Mpa )
f n , F = 0.2 f c                   ( units :   Mpa )
where f c is concrete strength. It is worth noting that in the contact definition, concrete and steel plates were taken as master and slave parts, respectively, as depicted in Figure 10.

3.5. Boundary Conditions

For the sake of symmetry, half of the frame was simulated. This involved setting symmetry boundary conditions for the respective nodes on the central column, as depicted in Figure 7 and Figure 8. In Figure 7a, the base nodes of the columns were fixed, restricting both rotation and displacement in three global directions. For the top 350 mm of the outer columns (representing the beams intersecting the column), the respective nodes were constrained against displacement in X and Y directions and rotation about all three axes, as shown in Figure 7a.

3.6. Loading Strategy

The axial load applied to the columns was modeled as nodal loads that increased from zero to the full value over a period of 1.0 s and after that remained unchanged, as depicted in Figure 11a. This approach was taken to diminish the oscillatory behavior typically observed in dynamic analyses. The upper nodes of the center column were subjected to a displacement–time history curve, as shown in Figure 11b, with a rate of rise of 100 mm/s. The reasons for selecting this rate have been discussed in Refs. [29,32,33]. It was assumed that this curve began at a time of 1.0 s when the outer columns were axially loaded with the full value. It should be noted that the displacement rate of 100 mm/s corresponds to a strain rate of 0.01 s−1 as derived from the experimental results of Ref. [28]. As per the models discussed in Ref. [28], the strain rate of 0.01 s−1 led to significant enhancements in concrete compressive strength (DIF = 1.18) and yield strength of steel bars and plates (DIF varied from 1.11 to 1.26). Accordingly, the strain-rate effect should be included in the FE analysis, as outlined previously in Section 3.2.

3.7. Validation of FE Models

It is important to mention that the models used in the current study have been validated in prior research. Size and type of elements, material models with rate-dependent effects, boundary conditions, and loading strategy have been validated by [10,16]. The parameters of the 1D contact model at steel bars/concrete interaction were validated experimentally in a previous study [16]. The tiebreak surface-to-surface contact model at the interaction of a steel plate with concrete was calibrated experimentally by Elsanadedy et al. [29].
A single-story, two-bay by one-bay RC SMRF (special moment-resisting frame) quarter-scale specimen, tested under a column loss scenario, was used in Ref. [16] to validate the FE model. The predicted peak load was 4% higher than the experimental value, while the displacement of the middle column (through which the load was applied) was 8% higher. Displacements at various frame locations at the ultimate state and the energy dissipation were within 10% of the experimental results. In Ref. [10], two precast single-story, two-bay frame assemblies and one SMRF specimen were tested and used for FE validation, with peak load and corresponding displacement predictions within 10% of the experimental values.

4. Discussion of FE Findings

As documented in past studies [16,33], the response of beam–column specimens under the center column removal scenario can be categorized into flexural and catenary action stages. In the flexural action stage, specimens have center column deflection up to the beam depth. During this phase, the beams experience axial compressive force. Nevertheless, when the center column deflection exceeds the beam depth, the catenary action stage is established. Throughout this stage, the beams experience axial tensile force.
The main results of the analysis matrix in the flexural action phase are presented in Table 4. However, the key findings in the catenary action stage and at the ultimate state are summarized in Table 5.
The ultimate state for this research is when there was a 20% decrease in the peak load of assemblies at the catenary action stage [42]. The energy dissipated, listed in Table 5, was measured as the area of the load–deflection plot till the ultimate state. In the subsequent sections, the FE findings are discussed with respect to the pattern of failure and the load–deflection relationship.

4.1. Failure Pattern

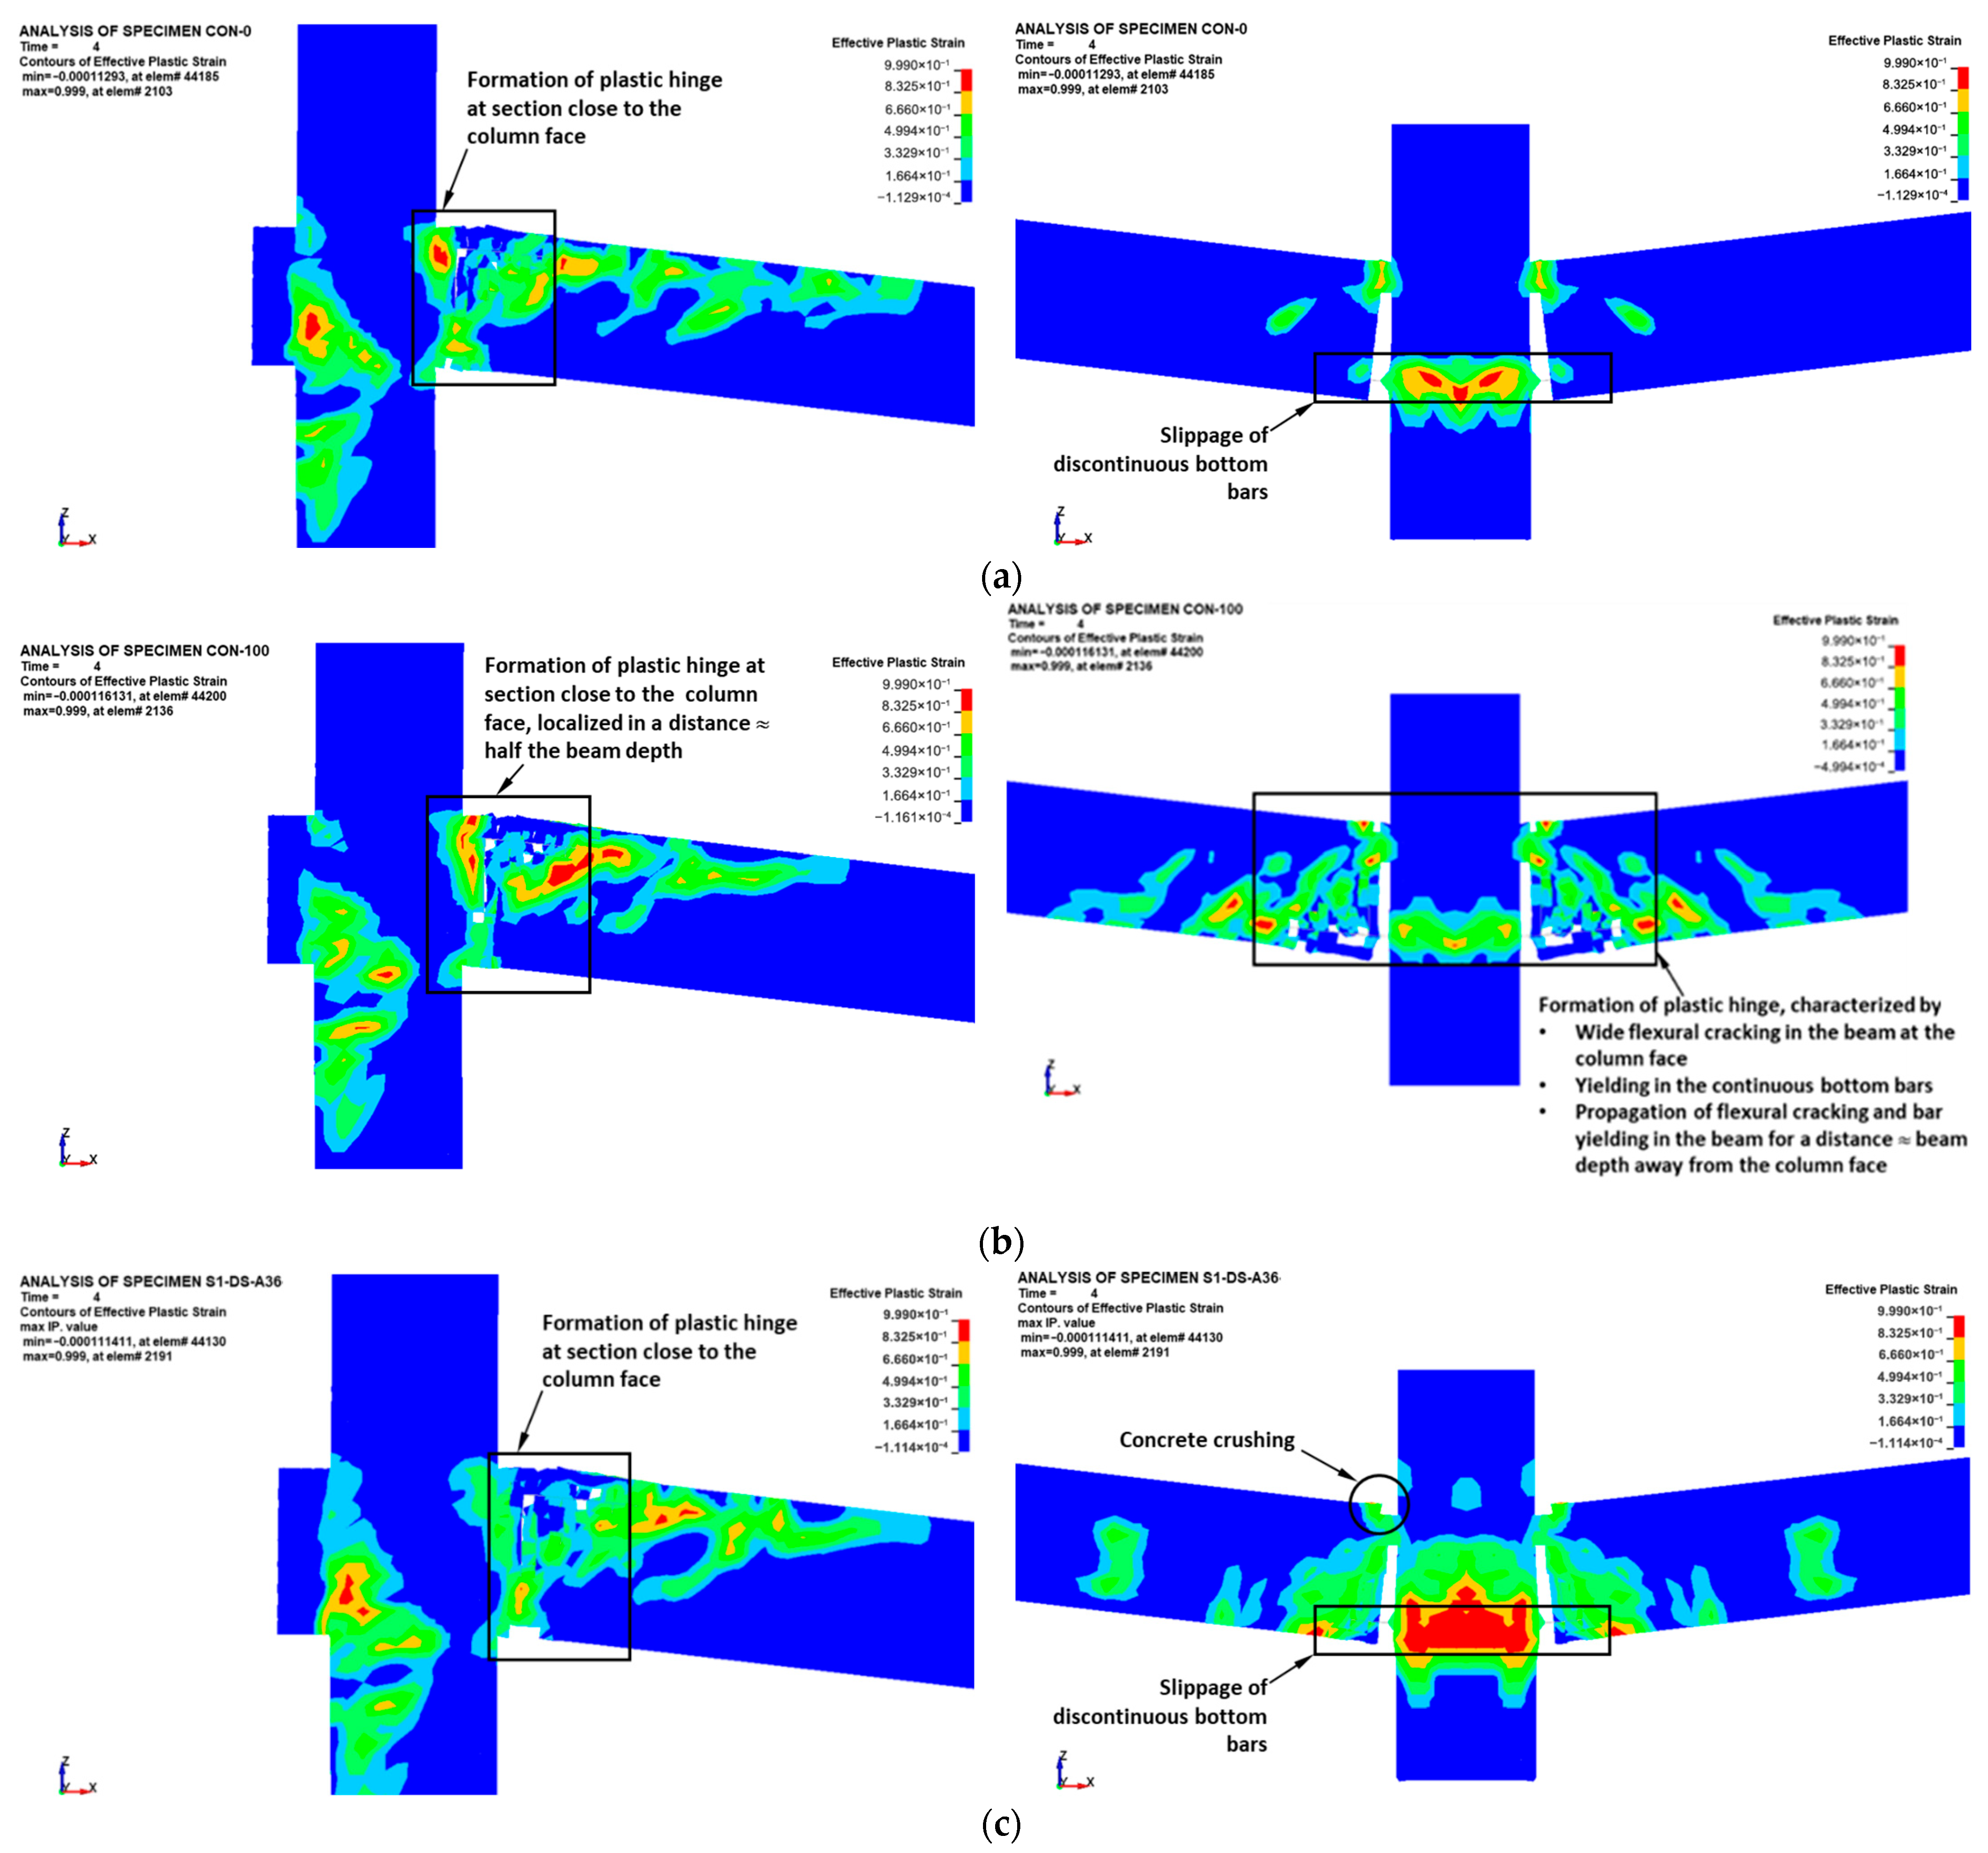
Concrete damage contours in the flexural and catenary stages of representative specimens are shown in Figure 12 and Figure 13, respectively. The effective plastic strain shown in these figures, representing the accumulated irreversible deformation in the material, is calculated as follows:
ε e f f p l = 2 3 d ε i j p l d ε i j p l
where, d ε i j p l is the incremental plastic strain tensor.

4.1.1. Control Specimens

At low displacement levels, slippage started in the discontinuous beam bars of control specimens CON-0 and CON-50 at the center column face (e.g., see Figure 12a). However, for the control specimen CON-100, a plastic hinge was produced in the beam near the center column region (Figure 12b). At the outer connection of control assemblies, because of continuity of the top bars, plastic hinges were produced in the beam near the exterior column region, and they extended for a distance of nearly 50% of the beam depth (see Figure 12a,b).
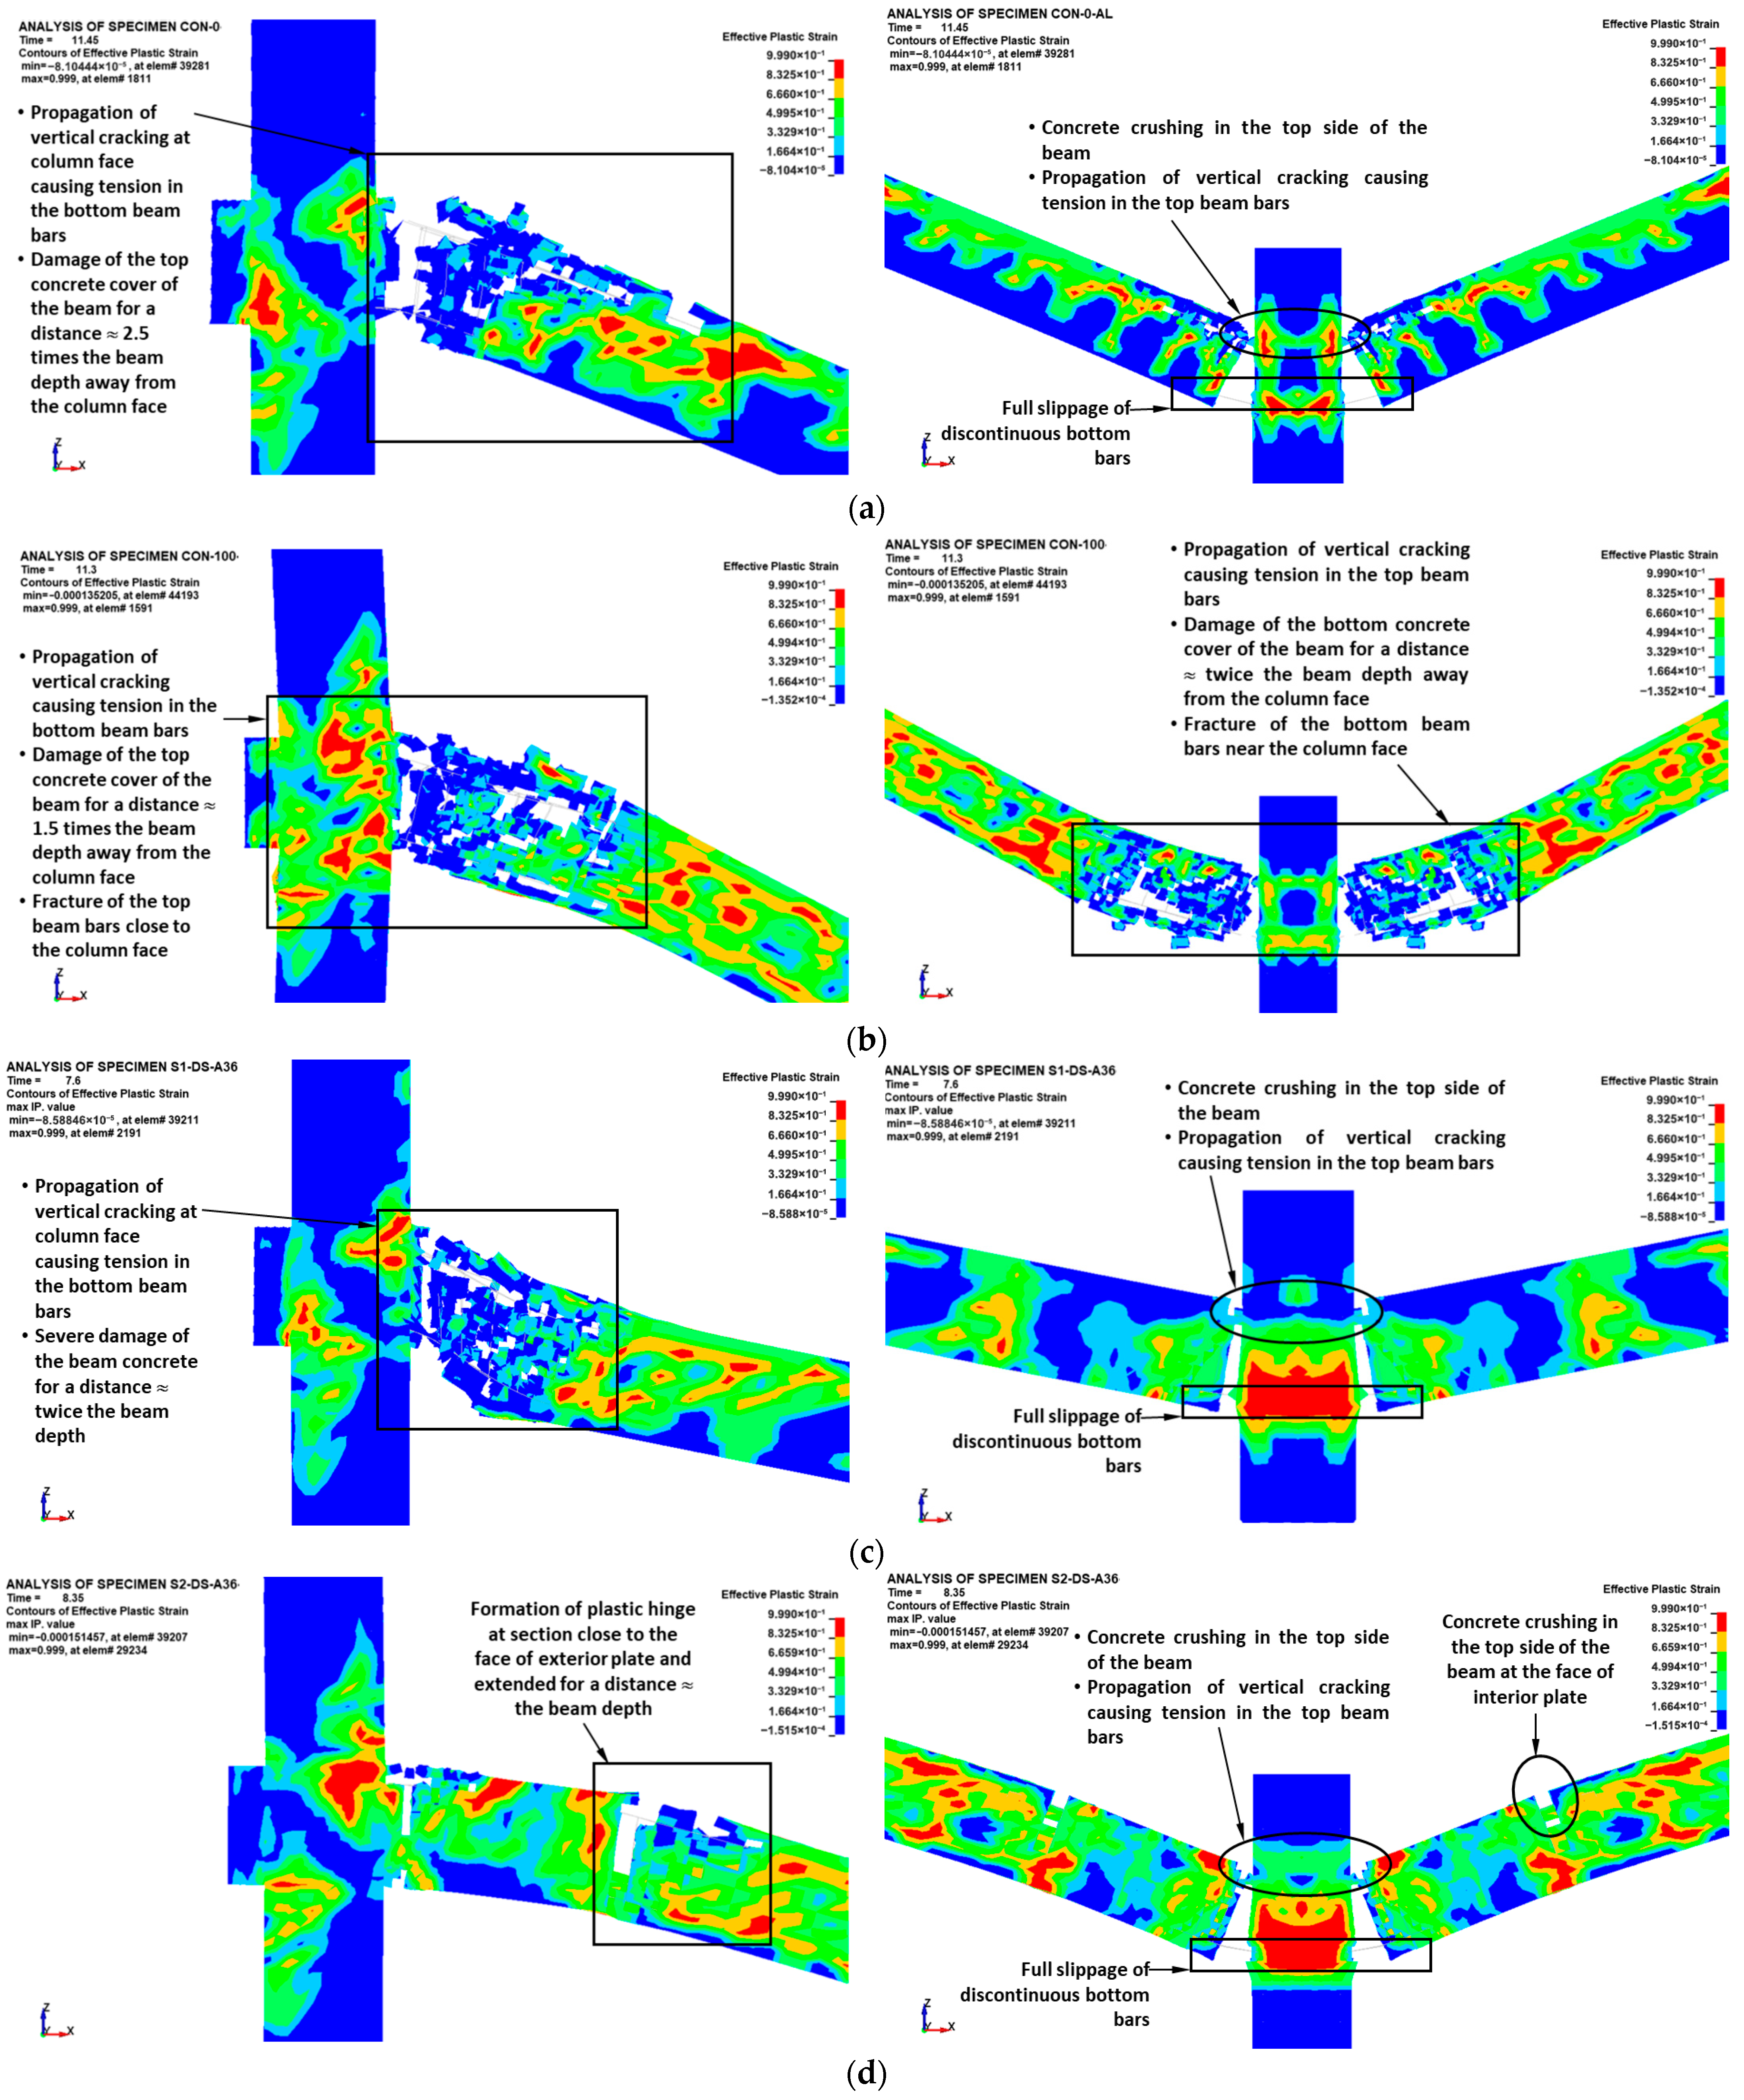
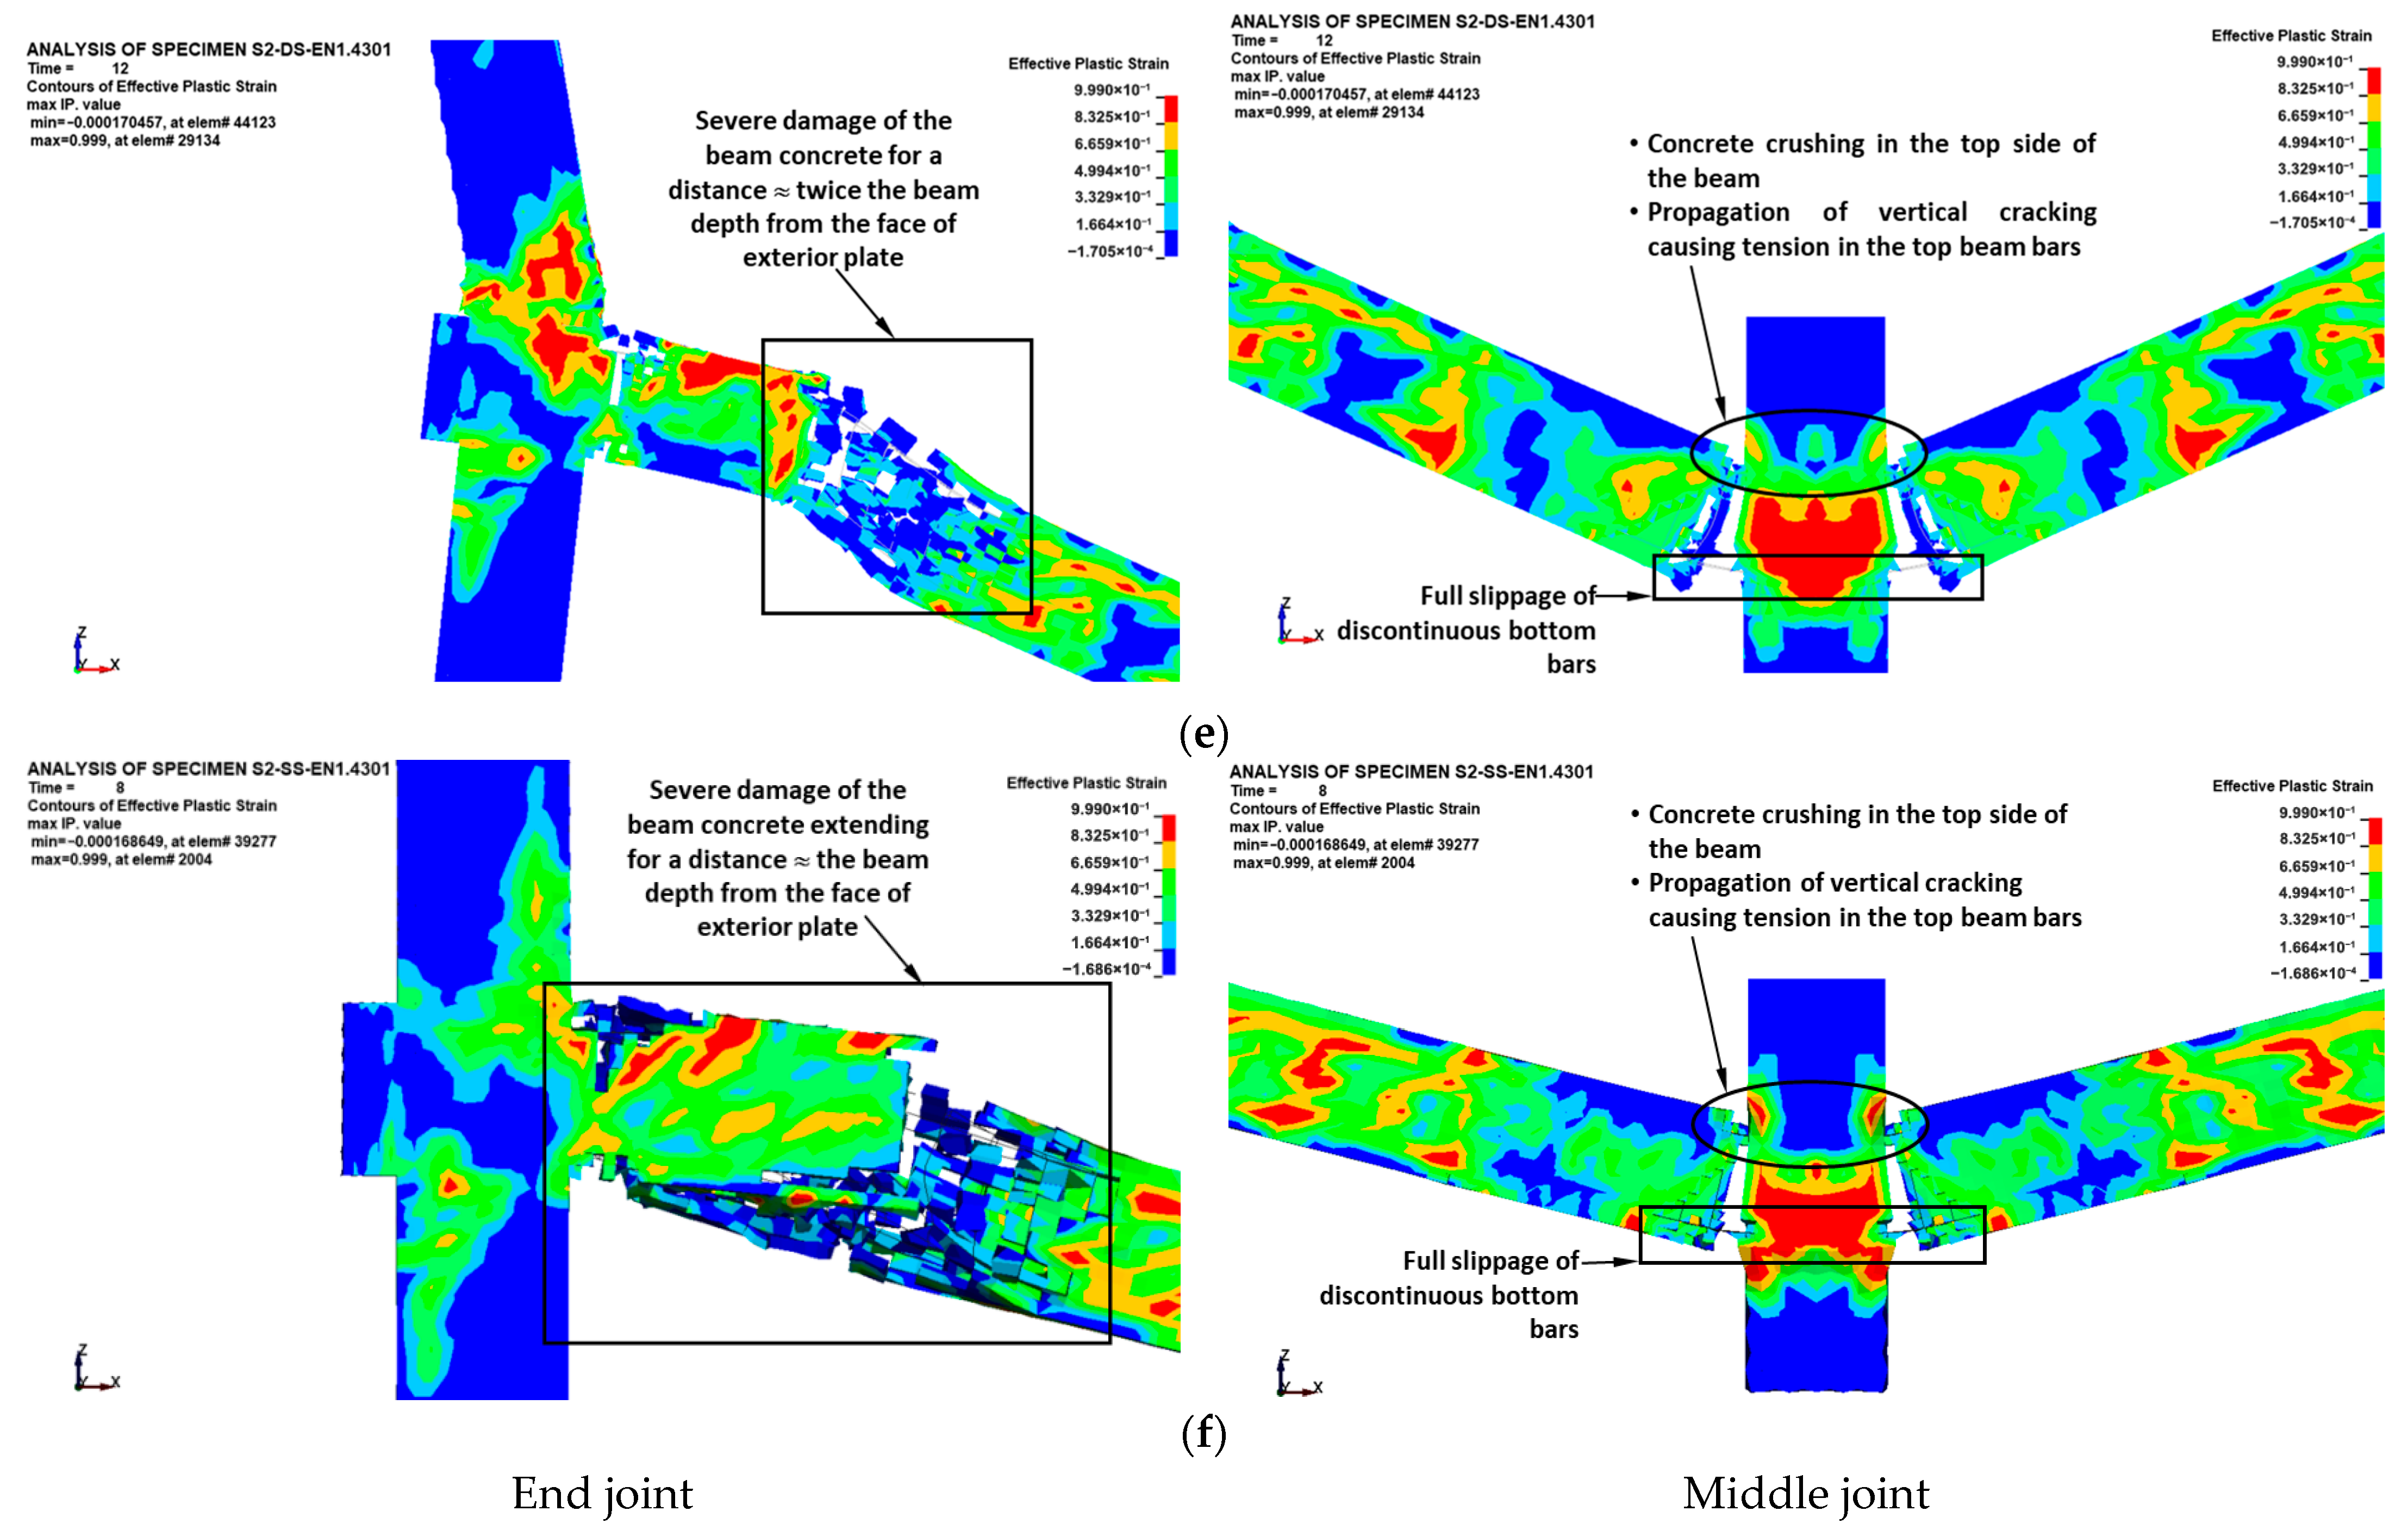
At large displacements in the catenary stage, the discontinuous bottom bars of control specimens CON-0 and CON-50 experienced full slippage near the middle joint (see Figure 13a). However, the continuous bottom bars of specimens CON-50 and CON-100 fractured near the inner column face, and the flexural cracks progressed nearly vertically, inducing tensile stresses in the top bars and, ultimately, leading to the partial establishment of the catenary phase (refer to Figure 13b). At the edge connection, the beam damage spread away from the edge column region, and flexural cracks progressed nearly vertically, inducing tensile stresses in the bottom bars (refer to Figure 13a,b). Since they were axially loaded in compression, the upper columns near the outer joint zone did not experience any flexural cracking or concrete damage (see Figure 13a,b).

4.1.2. Strengthened Specimens

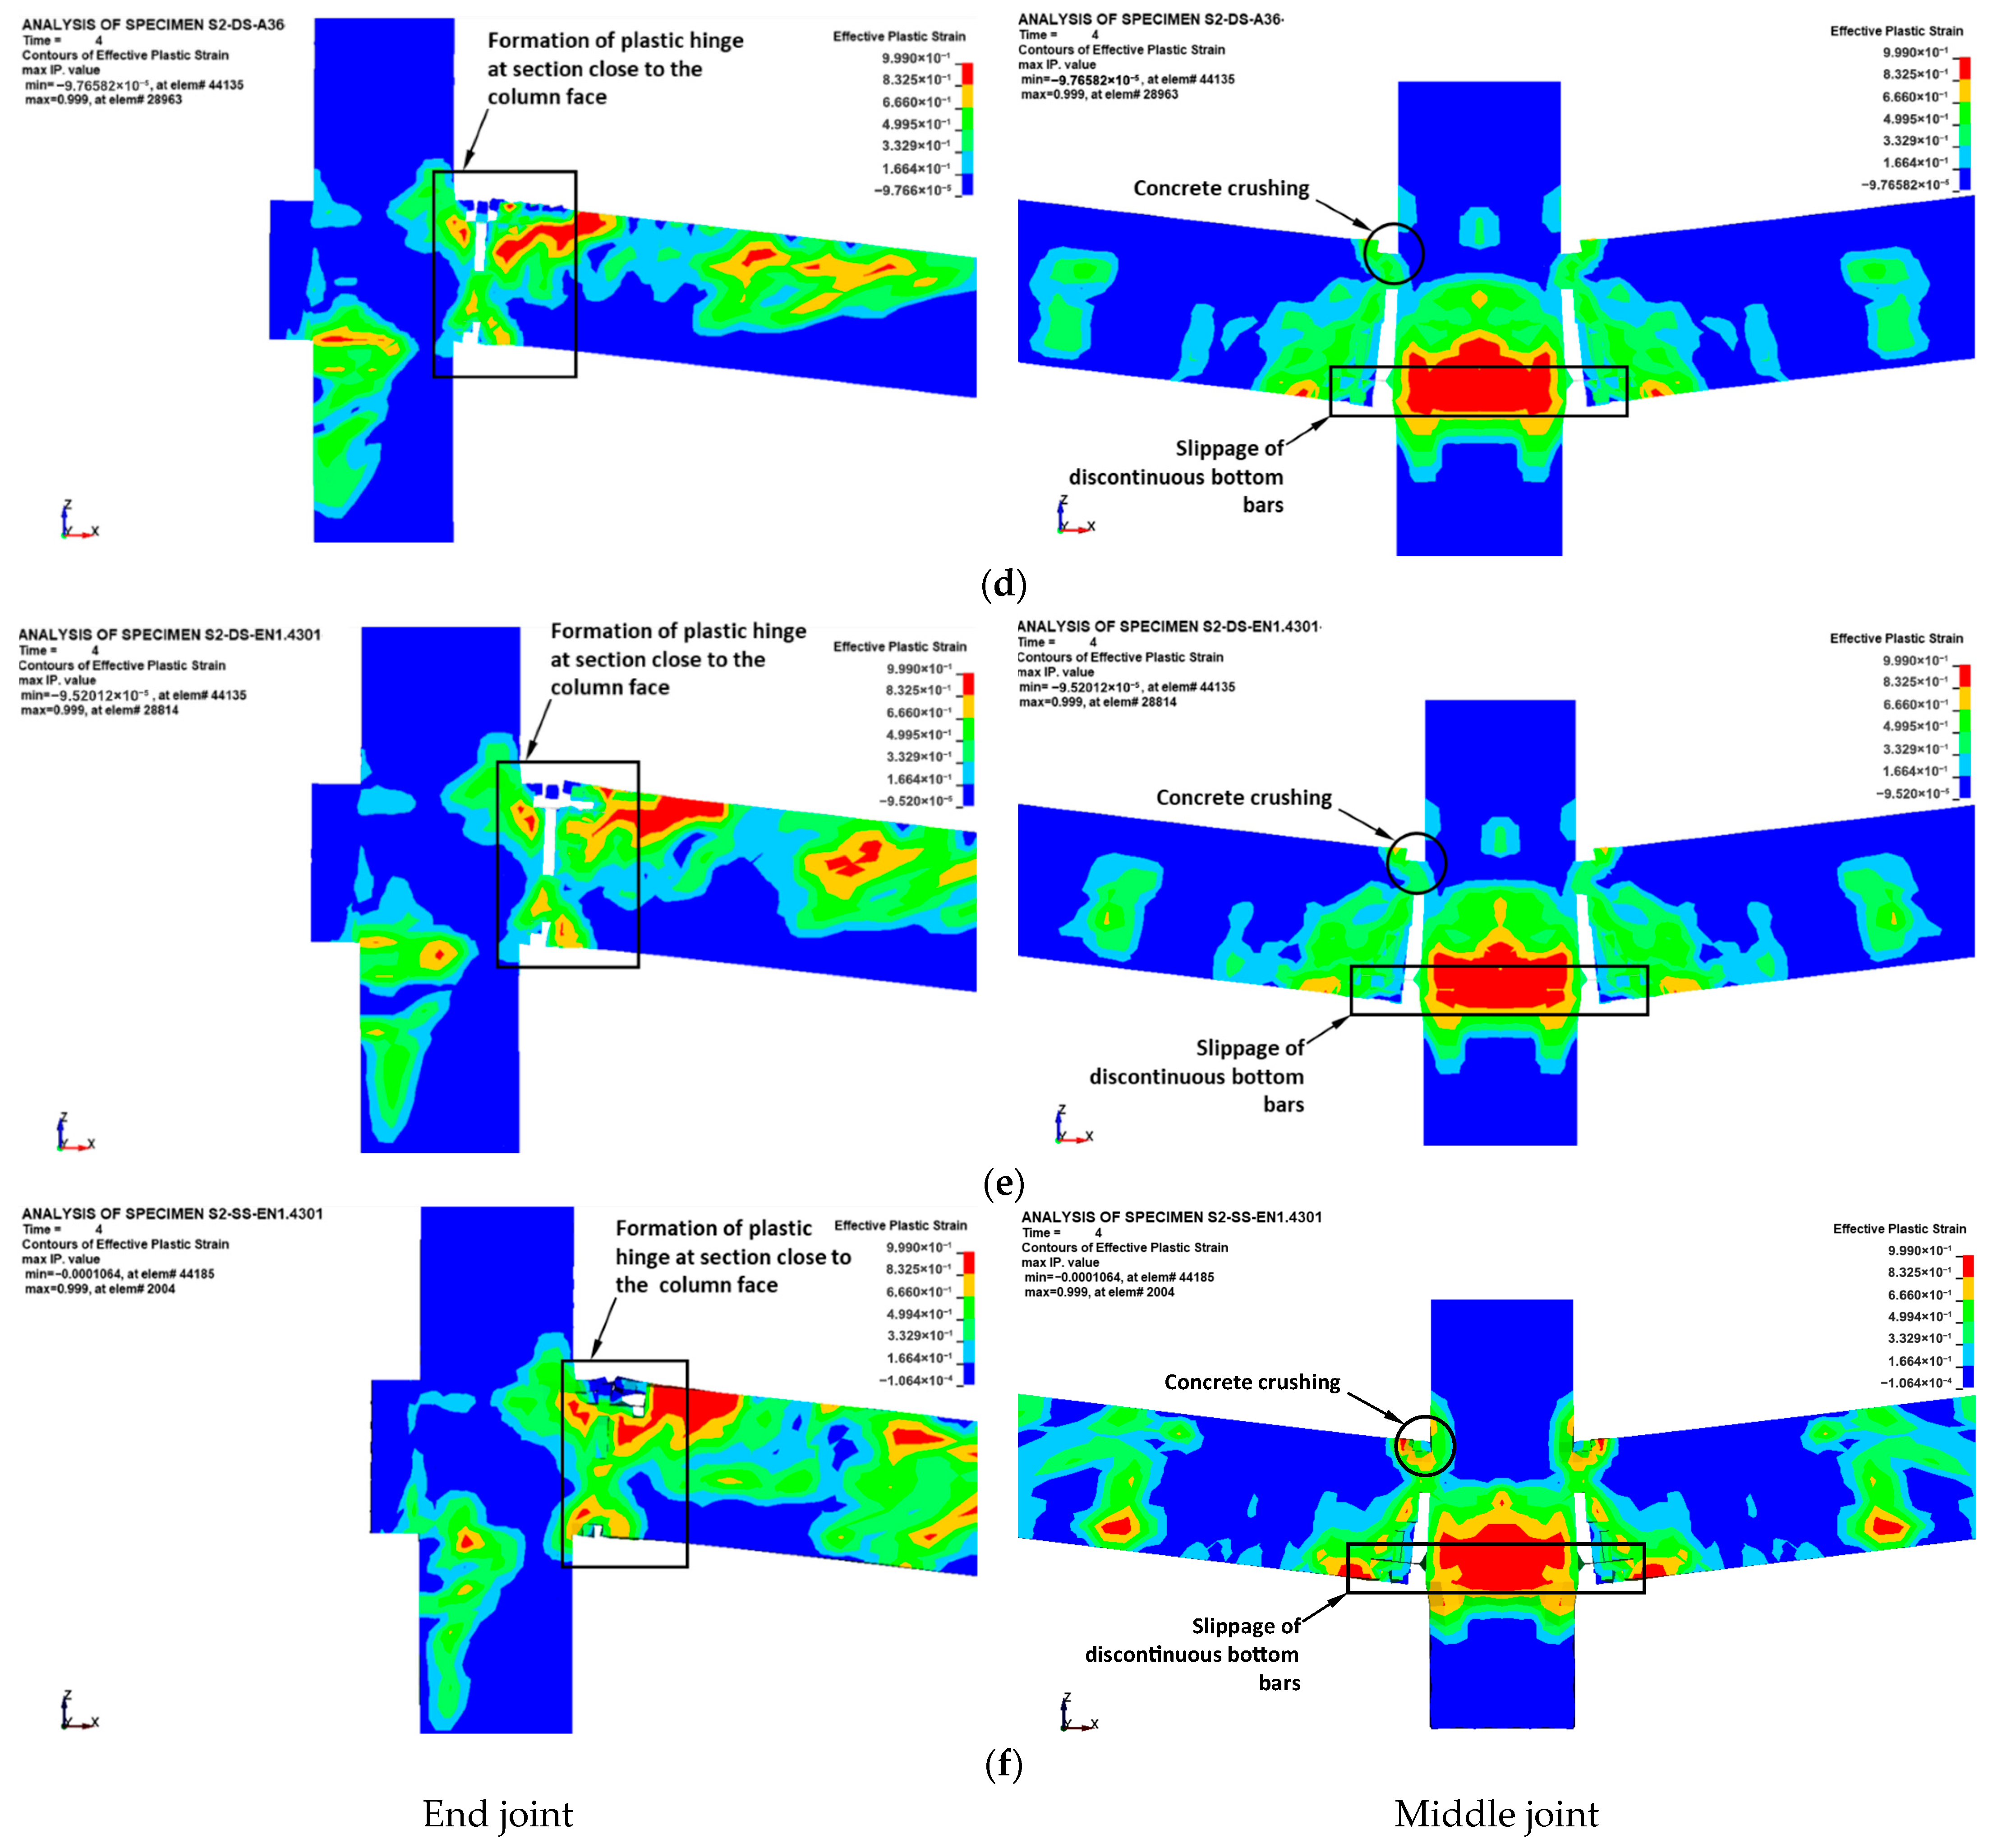
In the flexural phase, the concrete damage contours near the middle joint of upgraded assemblies were similar to those of the control specimen CON-0. Failure of the middle connection at this phase was characterized by slippage of discontinuous bottom beam bars accompanied by concrete crushing at the top side, as clarified in Figure 12c–f. At the exterior joints of upgraded specimens, plastic hinges were fully developed in the beam near the edge column zone, and they were localized within a distance that was less than half the beam depth, as seen in Figure 12c–f.
In the catenary stage, the concrete damage contours of the upgraded specimens near the middle column were almost similar to the control assembly CON-0, and full slippage was predicted for the discontinuous bars, as depicted in Figure 13c–f. This was accompanied by concrete crushing in the compression region and propagation of vertical cracking, producing tension in the top bars and the partial development of catenary action behavior. At the outer joints of specimens upgraded with the first scheme (S1-DS), failure of the outer connection was identified by propagation of flexural cracks, inducing tensile stresses in the bottom bars near the edge column face and severe damage of the beam concrete for a distance of nearly twice the beam depth (see Figure 13c). However, at the outer joints of specimens upgraded with the second scheme (S2-DS), in which steel plates were added on both sides of the inner and outer joints, failure of the outer joint was characterized by the formation of a second plastic hinge and severe damage of the beam concrete outside the exterior plate region, as seen in Figure 13d,e. For frame assembly strengthened with the third scheme (S2-SS), in which steel plates were only added at one side of the inner and outer joints, failure of the outer connection was owing to severe damage of the beam concrete extending from the column face to a distance nearly the beam depth beyond the face of the exterior plate, as presented in Figure 13f.
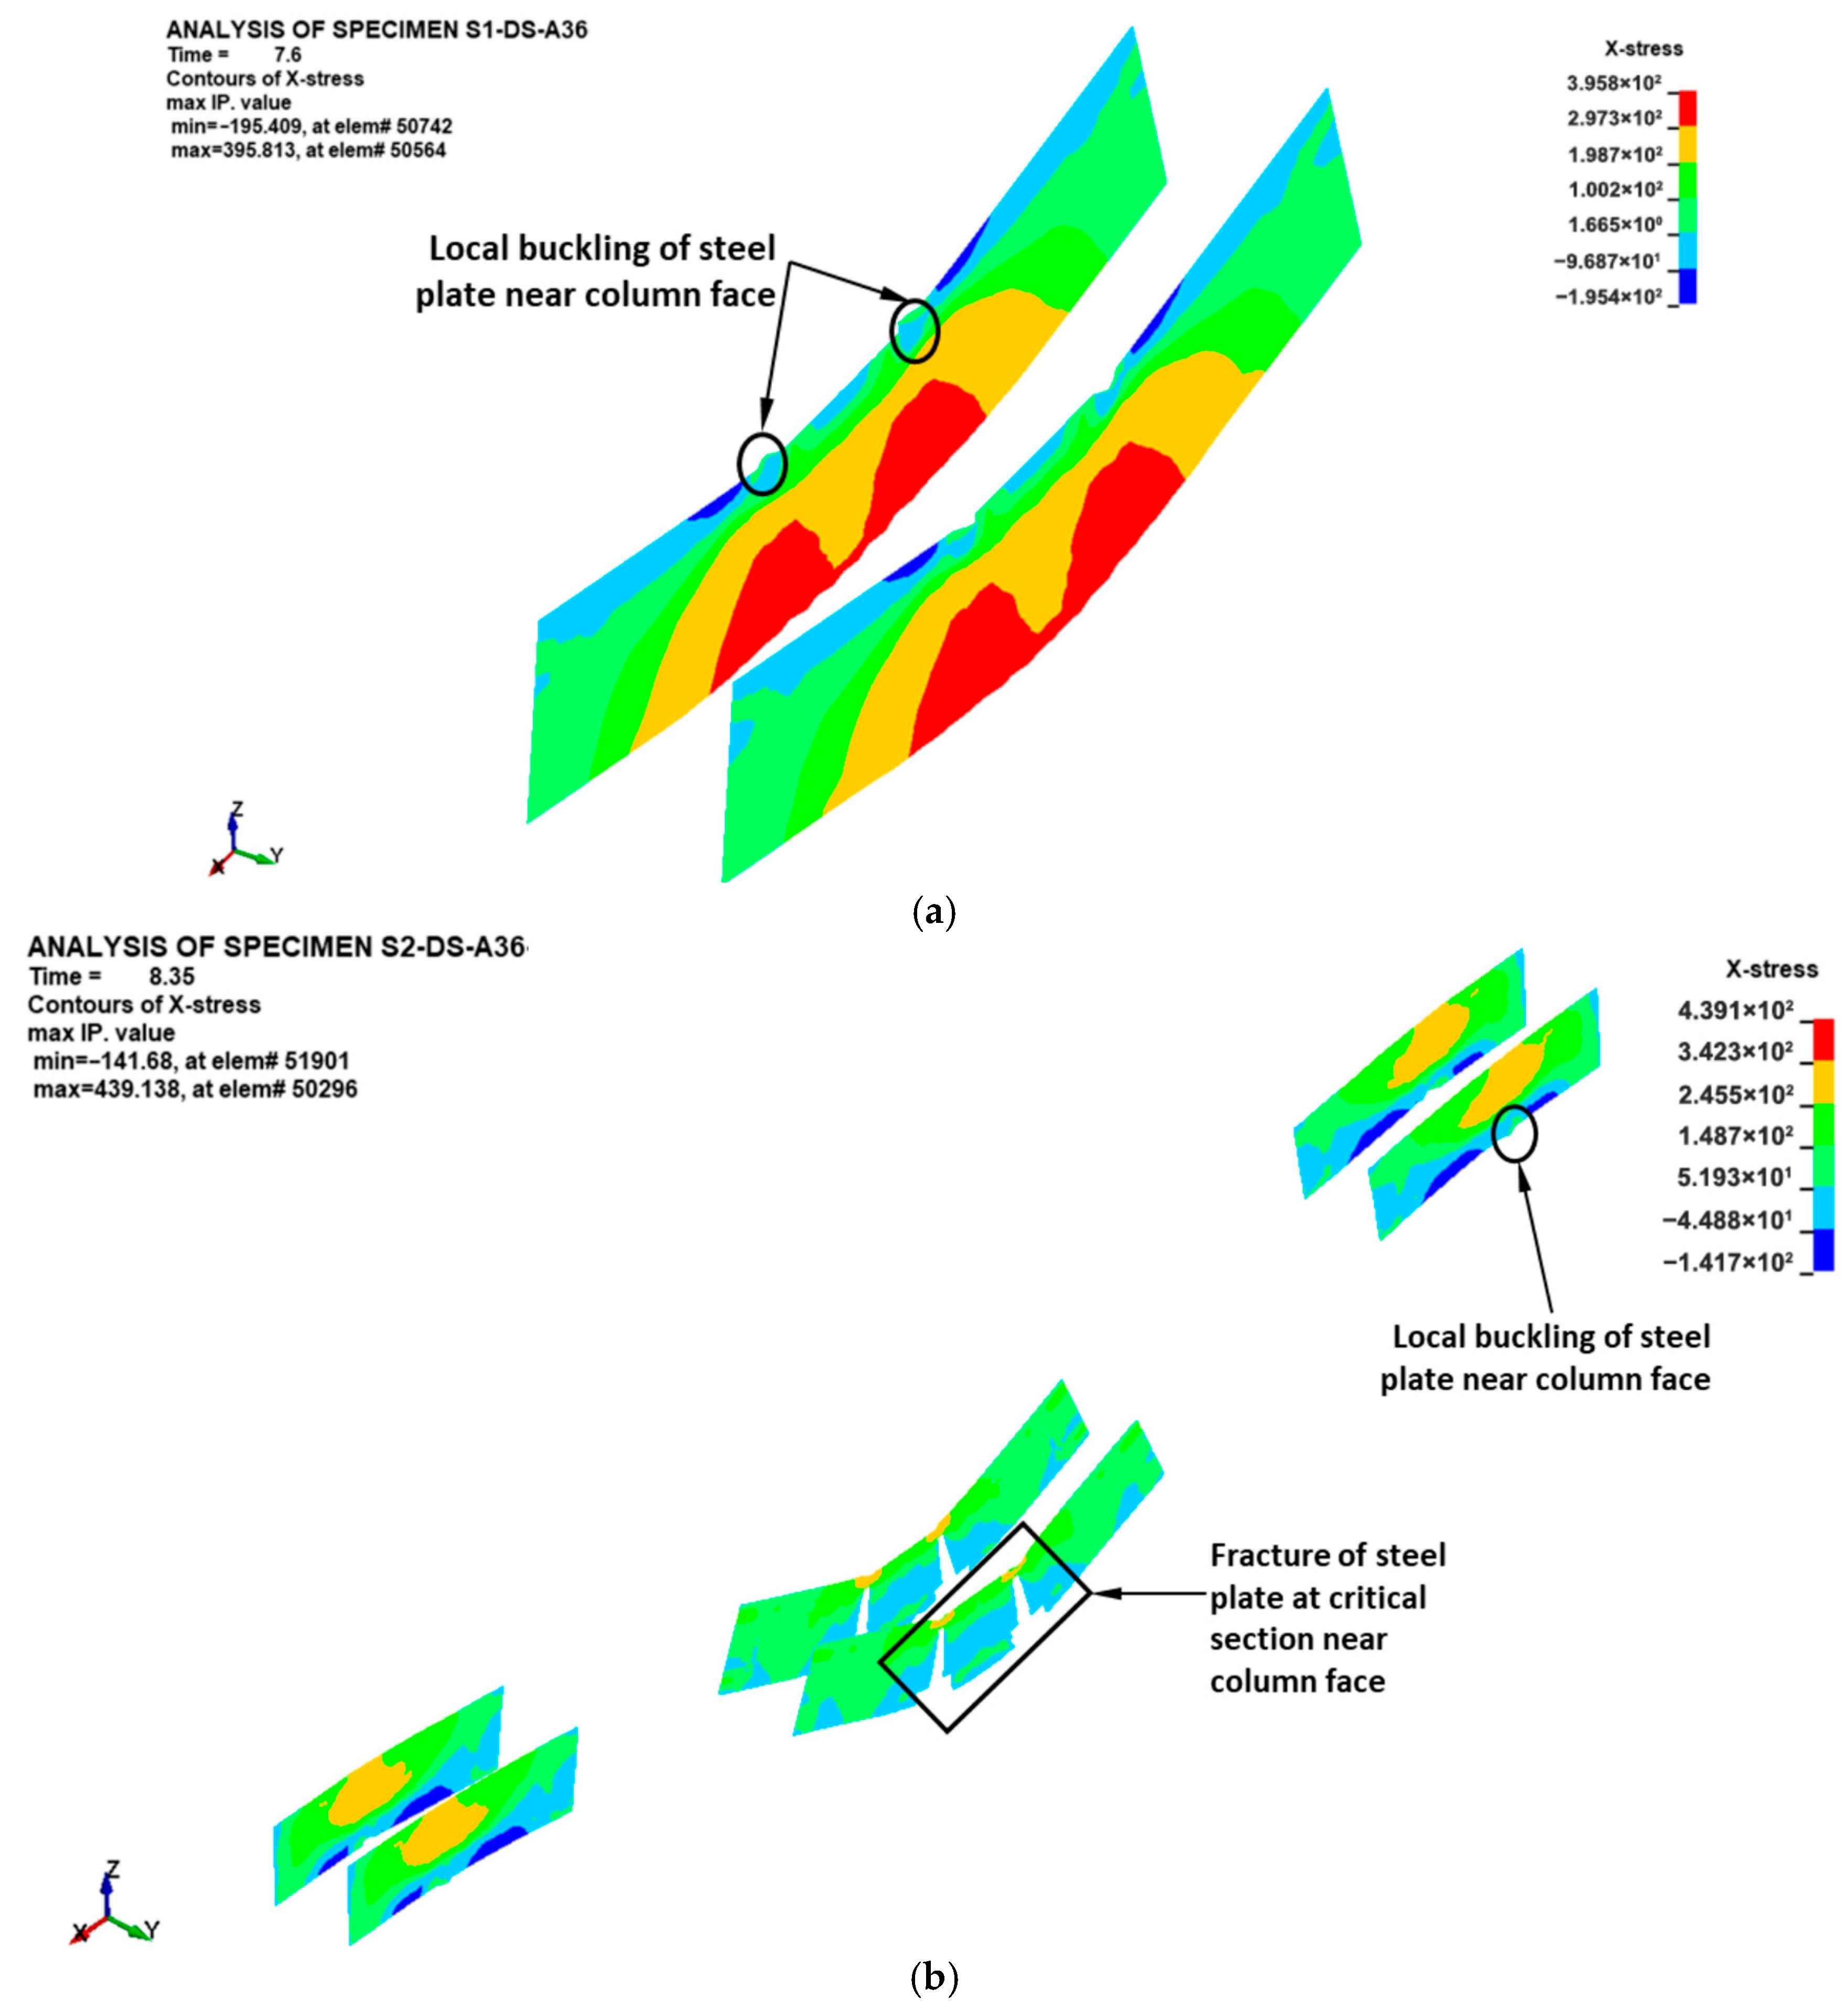
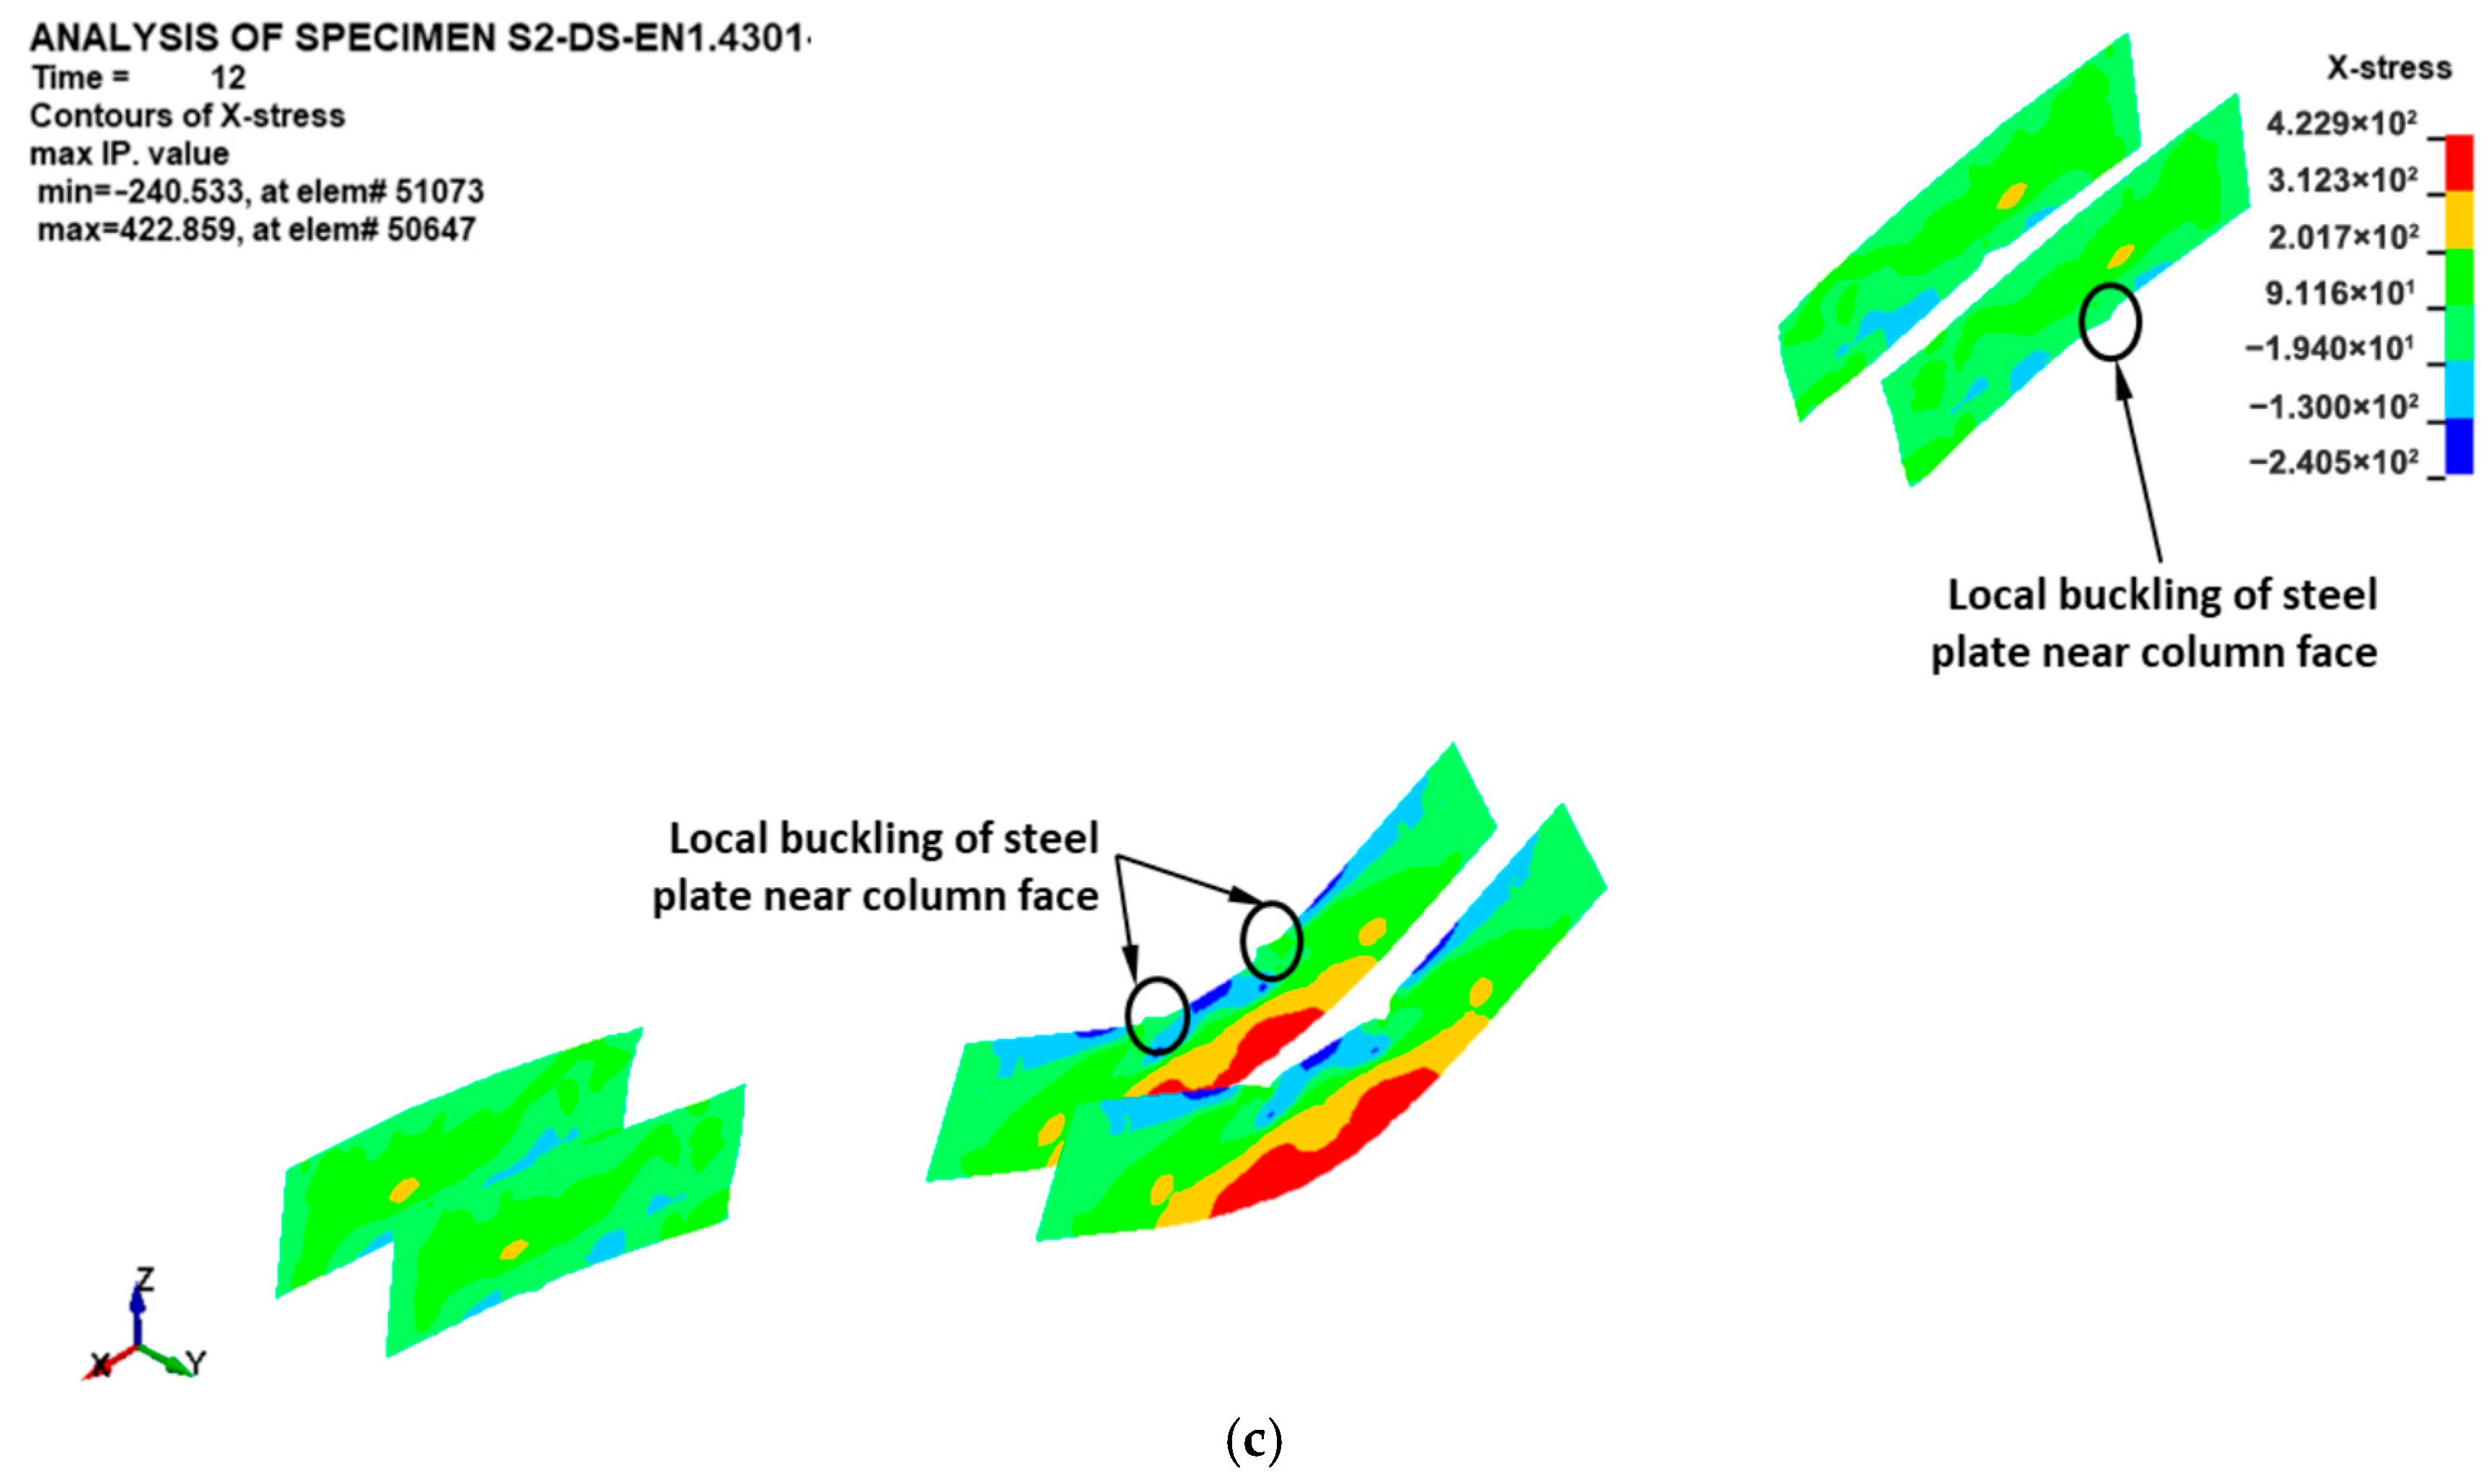
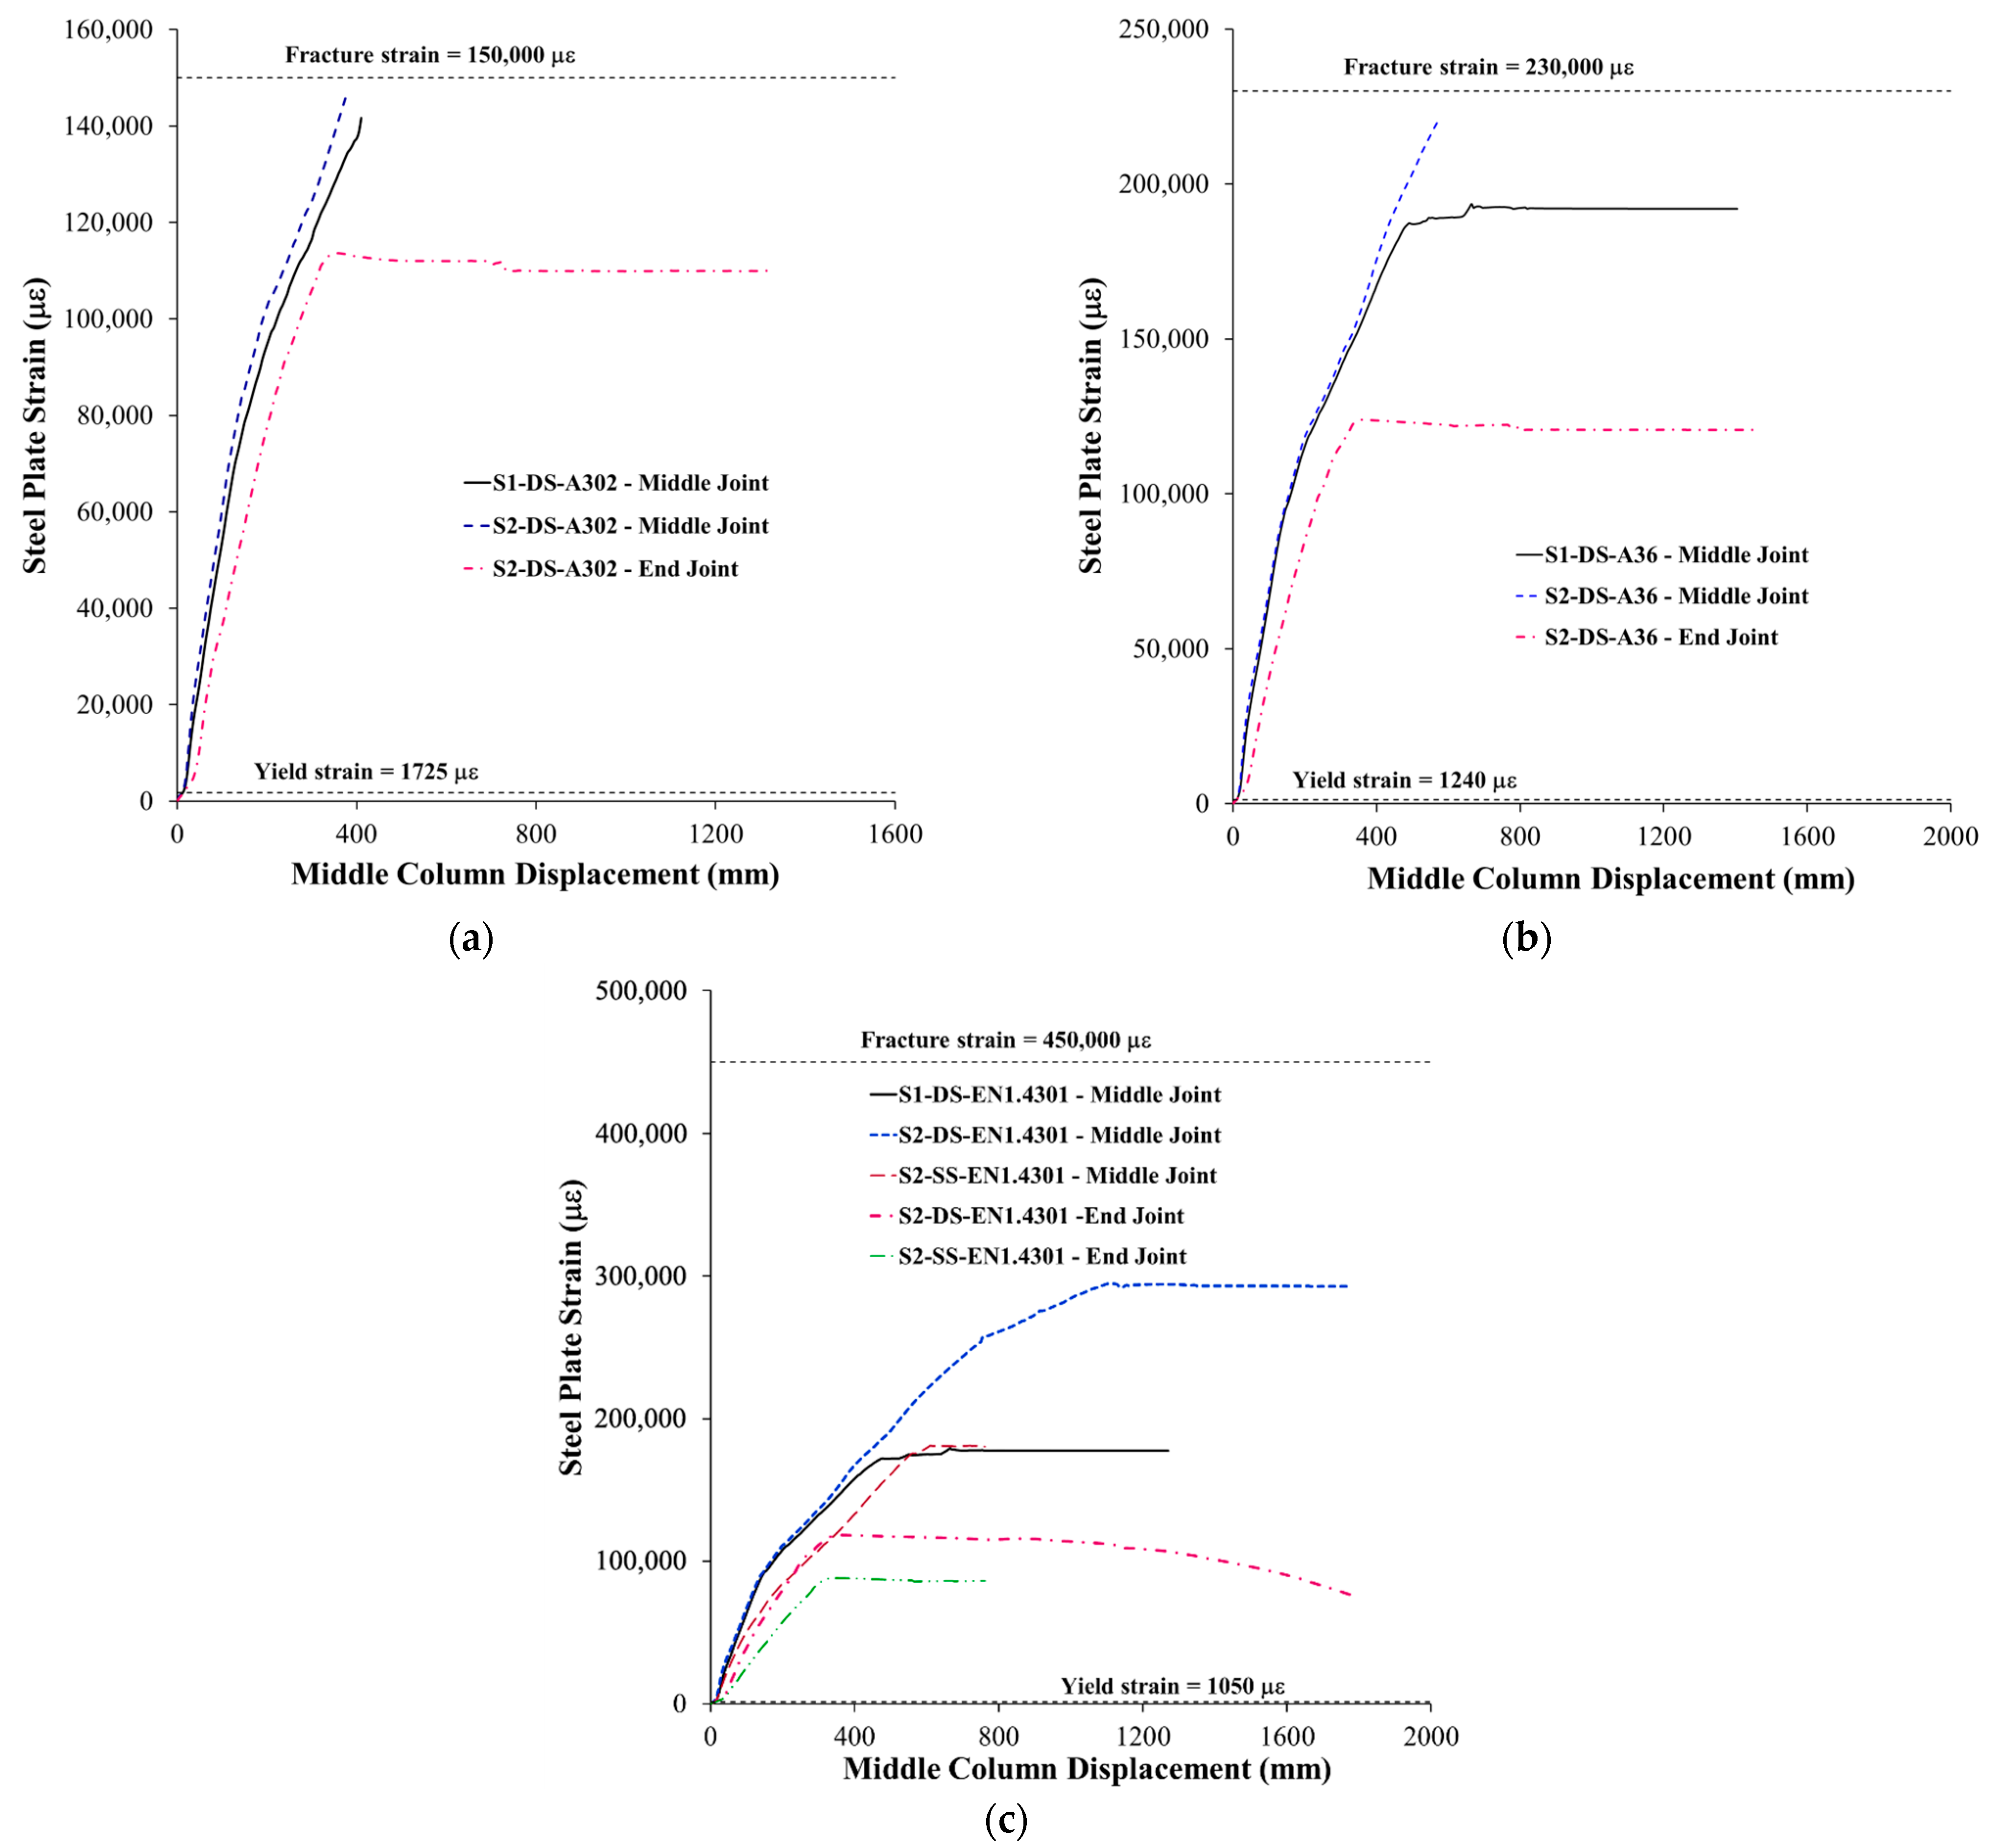
Figure 14 shows the X-stress contours (i.e., normal stress along the X-direction, which corresponds to the length of the beams) for the steel plates of representative upgraded specimens at the ultimate state. Figure 15 presents the predicted steel plate strain on the extreme tension side at the critical section near the column face versus displacement curves for strengthened specimens.
It was observed that, for steel plates added at the middle connection, fracture was predicted in all specimens upgraded with A302 steel due to its low plastic failure strain of 14.7% (see Figure 15a). However, for specimens with A36 steel, fracture was predicted only for those upgraded with scheme S2-DS, as shown in Figure 14b and Figure 15b. As indicated in Figure 15a,b, plate fracture initiated on the extreme tension side at middle column displacements of 410, 310, and 575 mm for specimens S1-DS-A302, S2-DS-A302, and S2-DS-A36, respectively. With further increases in column displacement, the fracture propagated toward the top side of the beam until more than 90% of the plate height had fractured, as shown in Figure 14b.
For A36 specimens upgraded with scheme S1-DS, as well as for all specimens strengthened with EN 1.4301 plates, fracture did not occur in the middle joint plates. Instead, the ultimate failure mode was governed by local plate buckling near the column face, as identified in Figure 14a,c and Figure 15b,c. For specimen S1-DS-A36, the strain on the extreme tension side of the middle plate (at the critical section near the column face) increased to about 190,000 μɛ when the displacement reached approximately 500 mm, after which the strain remained almost constant (Figure 15b). For specimens strengthened with EN 1.4301 steel, the maximum tensile strain in the middle plate increased to values between 172,000 and 290,000 μɛ as the displacement increased to 500–1100 mm, after which the strain remained nearly unchanged (Figure 15c).
For all steel grades in plates added at the exterior joints, fracture was not observed. Their ultimate strains remained well below the fracture limit, and the ultimate failure mode was governed by local plate buckling near the outer column face, as shown in Figure 14b,c and Figure 15a–c. The maximum tensile strain in the end plates increased to about 90,000–120,000 μɛ when the middle column displacement reached approximately 350 mm, after which the strain remained almost unchanged (see Figure 15).
It is worth noting that, in the middle plates, plasticity extended horizontally to a distance of approximately one beam depth (≈350 mm) beyond the critical section at the inner column face and vertically to nearly 0.8 times the beam depth beyond the extreme tension side. In contrast, for the end plates, plasticity extended horizontally to a distance of 1.0–1.5 times the beam depth beyond the critical section at the exterior column face and vertically to 0.6–0.7 times the beam depth beyond the extreme tension side. These observations confirm the adequacy of the strengthening design, in which the plates were extended to twice the beam depth beyond the column face.

4.2. Load–Displacement Pattern

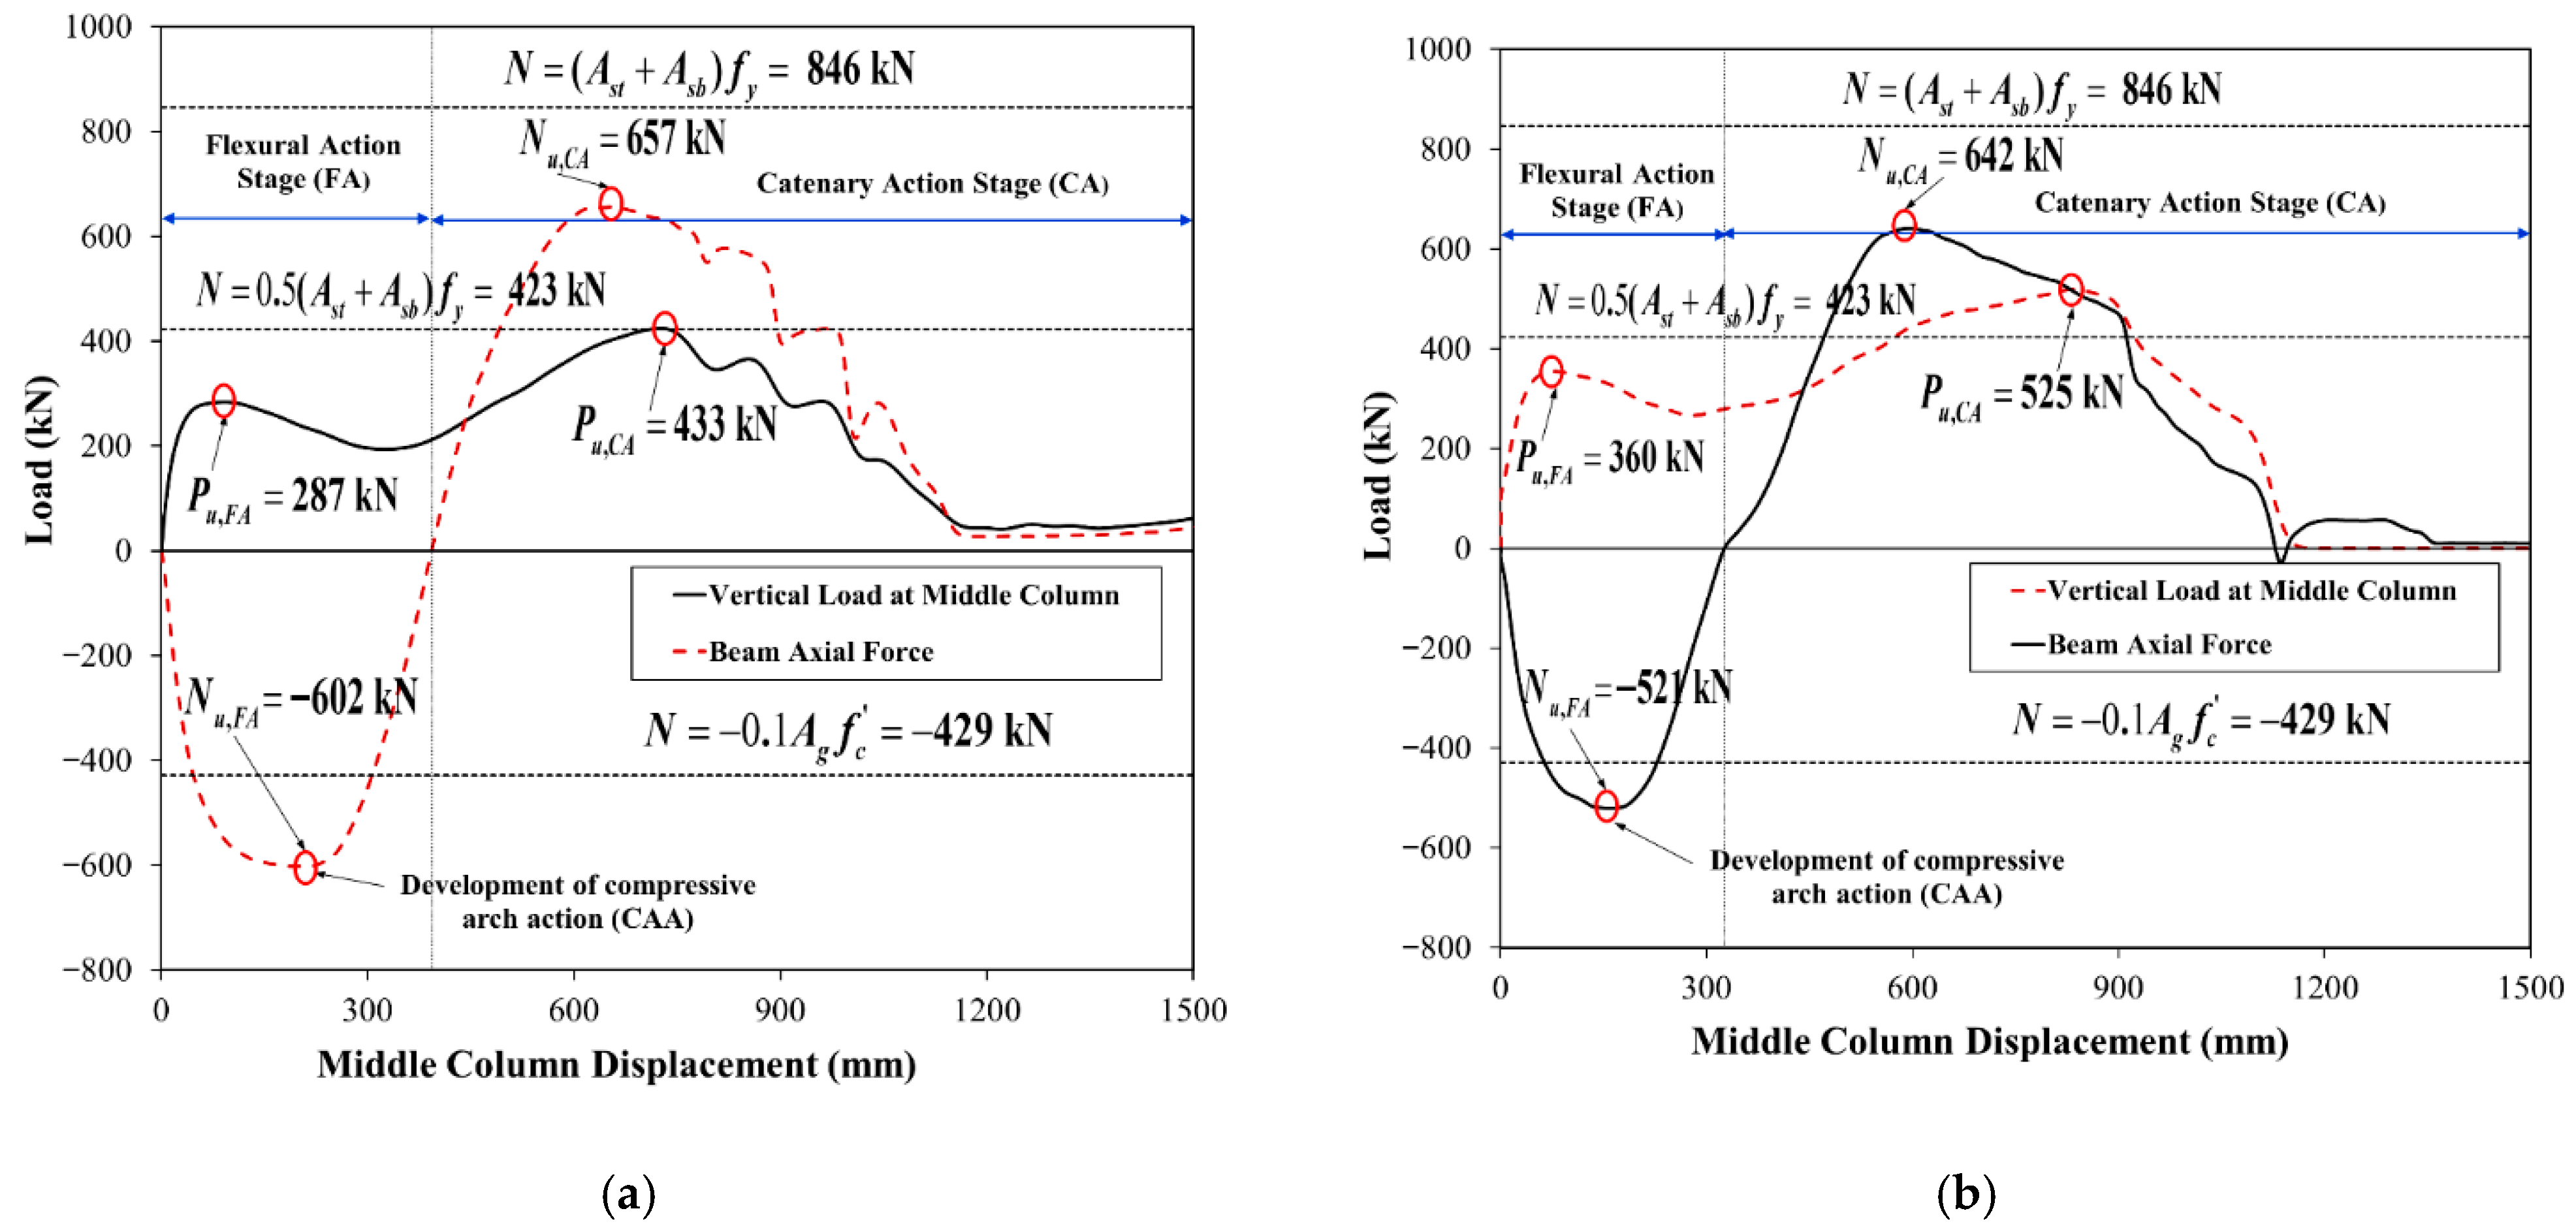
The envelopes for load against center column deflection for the investigated assemblies are shown in Figure 16. Figure 17 displays the development of the beam axial force. For specimens CON-100 and S2-DS-EN1.4301, for instance, Figure 18 shows the vertical load, as well as the beam axial force against the center column deflection. The two stages are discernible in the load–deflection curve of the control and upgraded specimens, as shown in Figure 16 and Figure 17. The beams’ axial compressive forces during the flexural action phase were significantly more than 10% of their axial capacity. As per the ACI 318 code [4], this would raise the moment resistance of the beam section and, therefore, specimens were able to develop the compression arch action. Additionally, it is made clear by Figure 17 that the tension force induced in the beams for both control and strengthened specimens was between 50% and 100% of the longitudinal beam bars’ yield strength (top plus bottom). As a result, as shown in Table 3 and Table 4, the catenary stage was partially produced, with maximum load increases (above the flexural stage) varying from 44% to 51% and 2% to 46% for the control and strengthened specimens, respectively.
It is identified from Table 3 and Table 4 and Figure 16 that the continuity of 50% of bottom beam bars in specimen CON-50 increased the progressive collapse capacity during the flexural and catenary phases by 23% and 21%, respectively, compared to specimen CON-0. Nevertheless, providing 100% continuity of bottom beam bars in assembly CON-100 increased the progressive collapse capacity by 41% and 46% in the flexural and catenary phases, respectively, compared to specimen CON-0. It is identified that strengthening of beam–column connections of specimen CON-0 using bolted steel plates of different schemes considerably enhanced its load–displacement response. Strengthening schemes significantly enhanced the load resistance of assembly CON-0 in the flexural stage by 43% to 77%; however, the enhancement of maximum load in the catenary phase ranged from 1% to 77%. It should be noted that the performance of strengthened specimens in the flexural action phase was better than that of the control specimen CON-100. The maximum load of upgraded specimens in the flexural action stage was higher than that of the control specimen CON-100 by 1% to 25%. However, in the catenary stage, the maximum load of all upgraded specimens, except S2-DS-EN1.4301, was less than that of the control specimen CON-100. For specimen S2-DS-EN1.4301, the peak capacity of the catenary stage was higher than that of the control assembly CON-100 by about 21%, as seen in Table 4.

4.3. Limitations and Practical Applications of Bolted Steel Plate Retrofitting

While the bolted steel plate technique indicates potential for increasing the progressive collapse resistance of RC frames, some limitations are acknowledged. First, proper anchorage and torque control of bolts are critical to ensure uniform load transfer; improper installation can lead to local stress concentrations around bolt holes, potentially reducing effectiveness. Second, the installation of bolts in heavily reinforced zones can increase construction difficulty and time. Third, although the method is effective in the tested configurations, its performance under extreme loading scenarios, such as combined blast and seismic actions, requires further investigation. It should also be noted that the strengthening schemes proposed in this study are applicable only when the column and beam have the same width. In cases where the column width exceeds that of the beam, prefabricated concrete blocks may be used to compensate for the difference, provided that these blocks are securely anchored to the RC beams.
Despite these limitations, the technique offers several practical advantages. Bolted plates are reversible and can be applied post-construction without extensive modification to the existing structure, making them suitable for retrofitting deficient members. Using EN 1.4301 stainless steel plates enhances durability, particularly in aggressive environmental conditions, thereby reducing long-term maintenance and improving life-cycle cost-effectiveness. These features make bolted steel plates a viable and sustainable strengthening solution for real-world applications, particularly in structures where durability, ease of installation, and long-term performance are critical considerations.

5. Comparison of Strengthening Schemes

Figure 19 shows the impact of steel grade and strengthening scheme on the percent enhancement in the response parameters of upgraded specimens (with regard to the control specimen CON-0). These response parameters included the peak capacity of the upgraded specimen in the two action phases, in addition to the dissipated energy. The percent enhancements in the response parameters of reference assembly CON-100 are also presented in Figure 19 for the purpose of comparison with upgraded assemblies.
As seen in Figure 19a, the maximum load increase in the flexural stage owing to strengthening varied from 43% to 50% and 72% to 77% for schemes S1-DS and S2-DS, respectively. It is, therefore, identified that for upgrading schemes S1-DS and S2-DS, the steel grade has a slight effect on the percent increase in the maximum load at the flexural action stage. This is because at such a stage, the load resistance relied on the yield strength of the plate, and the plate thickness was different for each grade to have almost the same flexural capacity as the control specimen with continuous beam bars (CON-100). It is also clarified from Figure 19a that scheme S2-DS is significantly better than S1-DS with regard to peak load enhancement at the flexural action phase. However, scheme S2-SS is slightly less efficient than S2-DS. For EN1.4301 steel, the peak load enhancement marginally decreased from 77% to 70% when the upgrading scheme changed from S2-DS to S2-SS.
Figure 19b presents the percent increase in catenary action capacity of upgraded specimens. It is identified that for all steel grades, upgrading the assemblies using steel plates of scheme S1-DS has a minor contribution to enhancing the progressive collapse capacity at the catenary action phase. For all specimens strengthened with scheme S1-DS, the increase in catenary action capacity ranged from 1% to 7%, and these values were significantly lower than those of the control specimens CON-100. It is clarified from Figure 19b that A302 steel of scheme S2-DS has minimal contribution to enhancing the catenary action capacity (only 5% enhancement). However, both A36 and EN1.4301steel plates of scheme S2-DS have significantly enhanced the catenary action resistance by 43% and 77%, respectively. The reason is that A302 steel has the lowest fracture strain of 15% among all investigated grades. For EN1.4301 steel, the increase in the catenary action resistance significantly dropped from 77% to 24% when the upgrading scheme changed from S2-DS to S2-SS. In conclusion, among all studied schemes and grades, the highest increase in catenary action capacity was provided by EN1.4301 steel plates of scheme S2-DS. This is attributed to the high fracture strain of 45% for EN1.4301 steel, which helped the upgraded assembly to have large deformation in the catenary action phase without premature failure owing to plate fracture.
The effect of steel plate grade and upgrading scheme on the percent increase in dissipated energy of upgraded specimens (with regard to control assembly CON-0) is presented in Figure 19c. It is clarified that for all steel grades, upgrading the non-seismic assemblies using scheme S1-DS has a slight impact on increasing the dissipated energy. For all specimens strengthened with scheme S1-DS, the increase in dissipated energy ranged from 4% to 27%, and these values were significantly lower than those of the control specimen CON-100, as depicted in Figure 19c. For specimens upgraded with EN1.4301 steel plates of scheme S2-DS, the dissipated energy was significantly enhanced to a level considerably higher than that of the control specimen CON-100. For A302 and A36 steel plates of scheme S2-DS, the increase in dissipated energy of upgraded specimens was considerably less than that of the control specimen CON-100. For EN1.4301 steel, the enhancement in dissipated energy considerably decreased from 122% to 17% when the upgrading scheme changed from S2-DS to S2-SS. In conclusion, among all studied schemes and grades, the highest increase in dissipated energy was provided by scheme S2-DS of EN1.4301 steel plates owing to their high fracture strain of 45%, as mentioned before.
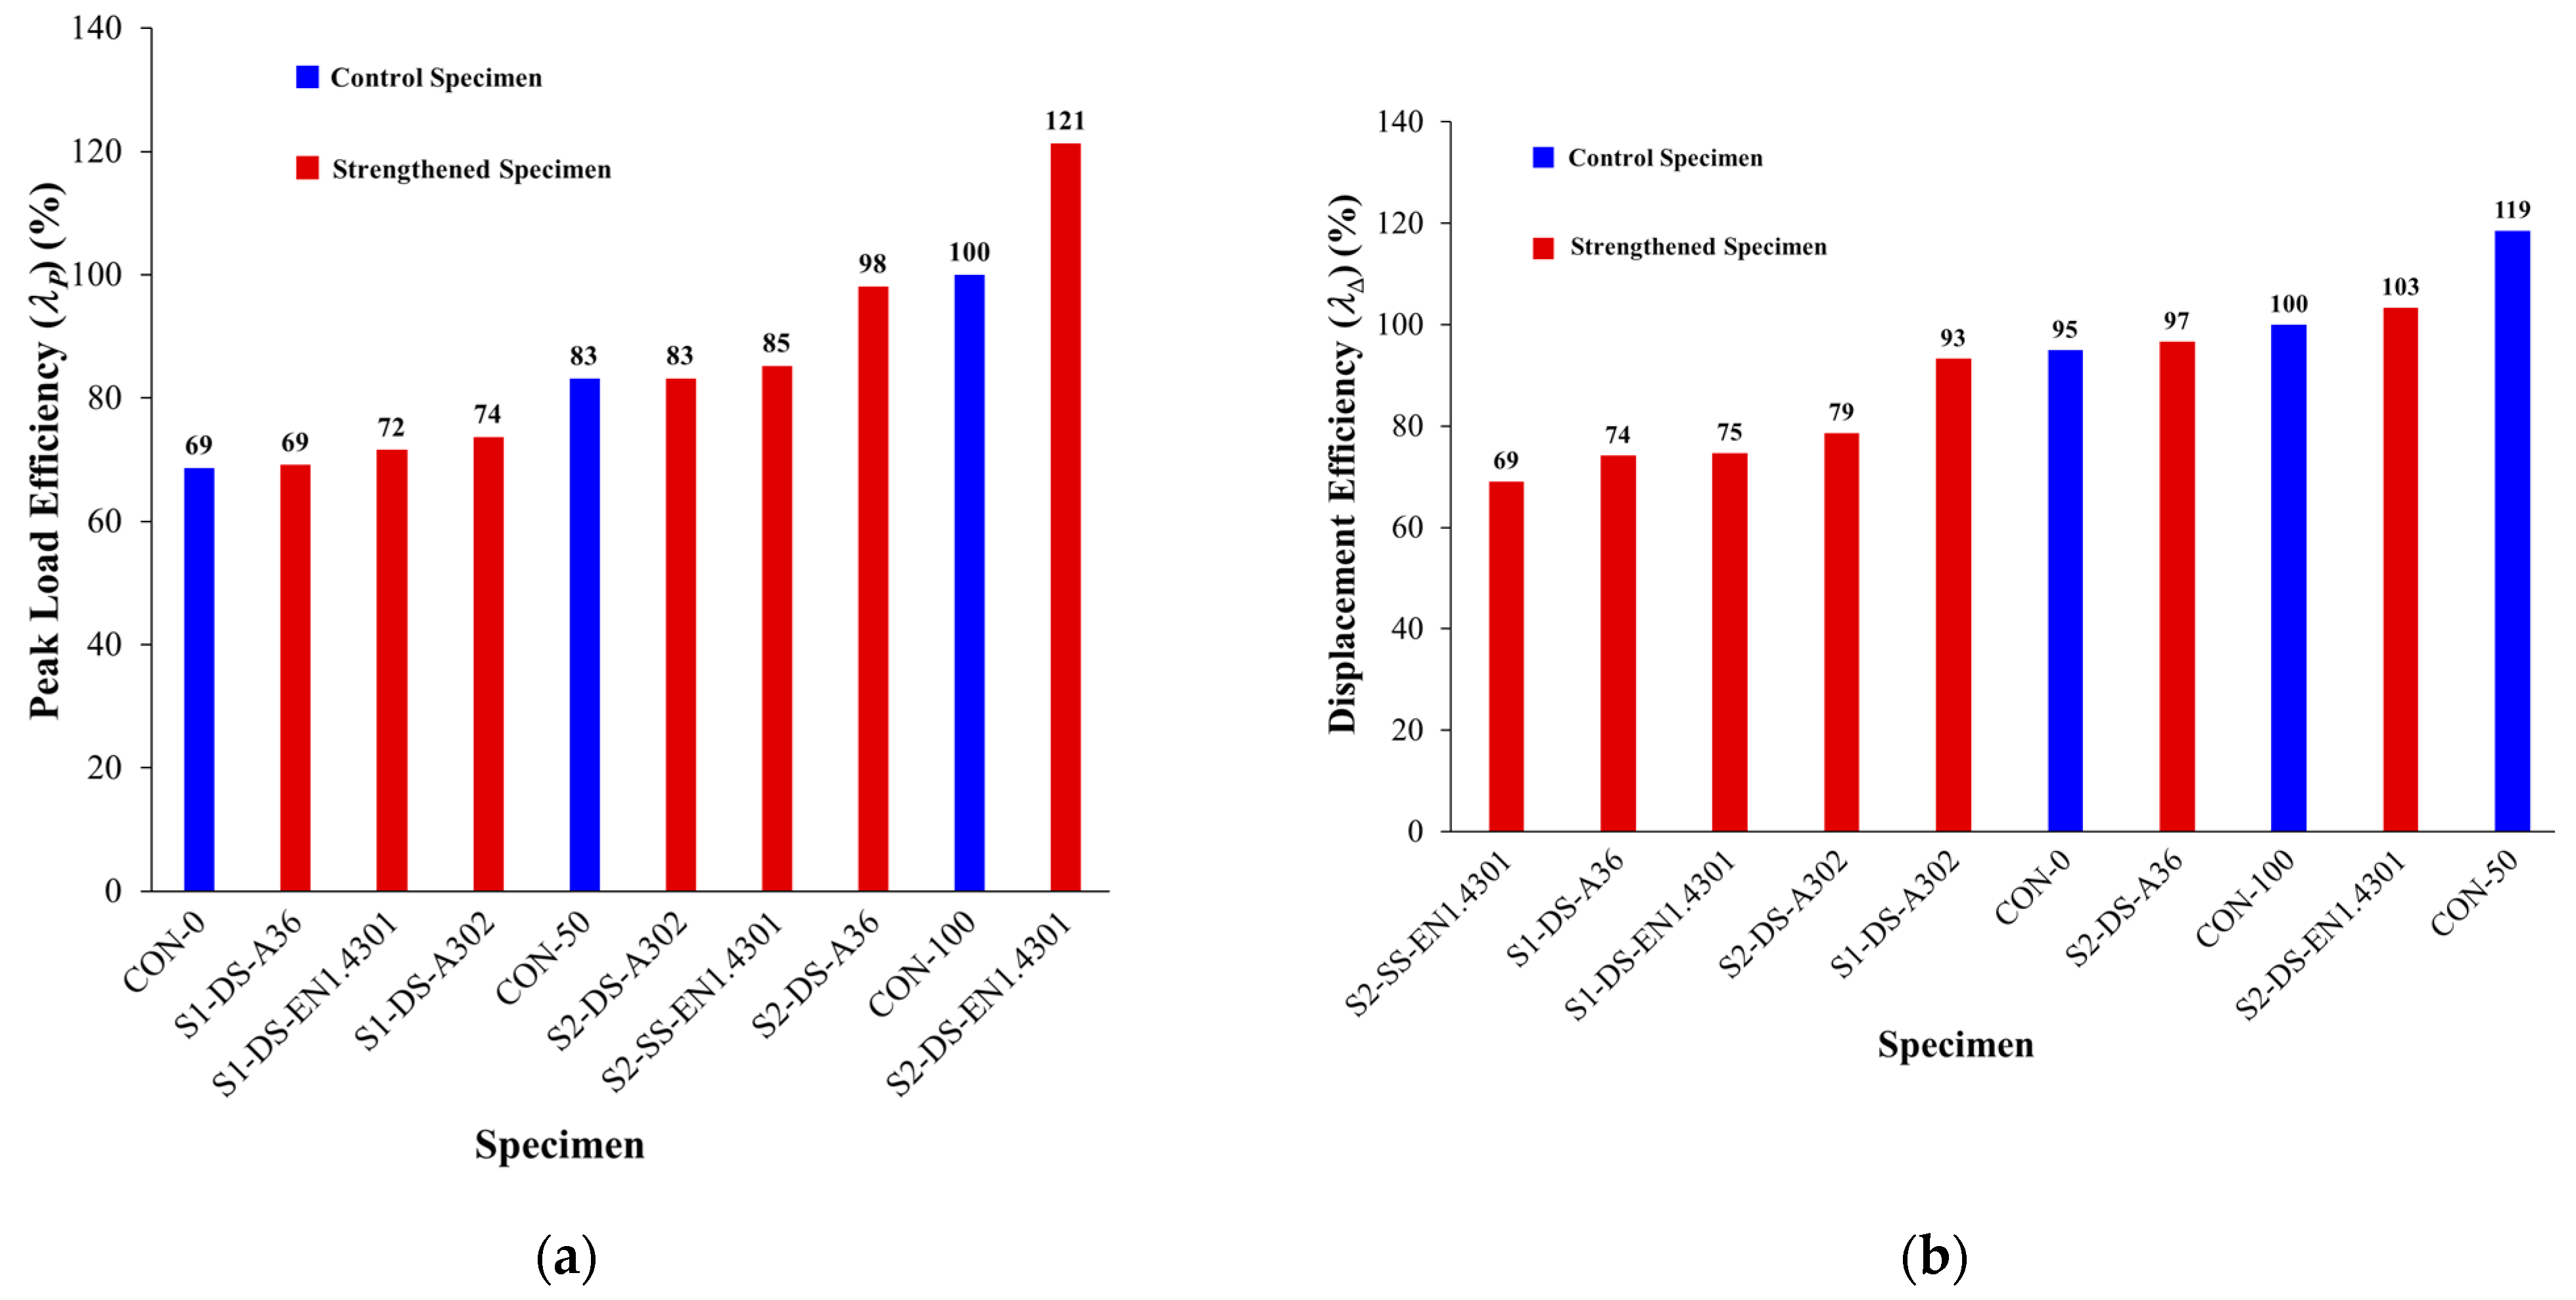
For upgraded specimens, the progressive collapse performance under the center column missing scenario was compared by the assessment of four response parameters. These are peak load efficiency ( λ P ), displacement efficiency ( λ Δ ), energy efficiency ( λ E ), and rotational ductility ( μ θ ), and they are calculated as follows:
λ P = P u , s P u , C O N × 100 %
λ Δ = Δ u , s Δ u , C O N × 100 %
λ E = E u , s E u , C O N × 100 %
μ θ = θ u θ y
In the above equations, P u , s   is the maximum load of strengthened assembly, P u , C O N   is the maximum load of control assembly having continuity in beam reinforcement (assembly CON-100), Δ u , s is the center column displacement of upgraded assembly at the ultimate state, Δ u , C O N is the middle column displacement of control specimen CON-100 at the ultimate state, E u , s   is the dissipated energy at the ultimate state in the strengthened specimen, E u , C O N   is the dissipated energy at the ultimate state in control assembly CON-100, θ u is the beam chord rotation at the ultimate state, and θ y is the beam chord rotation at first yield of either continuous bottom beam bars at center column face (for control specimens CON-50 and CON-100) or bottom surface of steel plates at center column face (for upgraded specimens).
All four parameters ( λ P , λ Δ , λ E , and μ θ ) were assessed and plotted in Figure 20a–d, respectively. It should be stated that control specimens CON-0, CON-50, and CON-100 were also added in Figure 20 for comparison with the strengthened assemblies. Also, it is crucial to note that the specimens in Figure 20 are arranged according to increasing efficiency.
It is widely acknowledged that with regard to peak load efficiency, the progressive collapse resistance of specimens upgraded with scheme S2-DS is better than that of scheme S1-DS. When compared with scheme S1-DS, adding steel plates at the outer joints in scheme S2-DS increased the strength and stiffness of the outer beam–column joints and, hence, enhanced the maximum load of the assembly at the two action phases, as previously seen in Table 3 and Table 4. It is also identified from Figure 20a,c that among all upgraded assemblies, specimen S1-DS-A36 had the worst response with regard to peak load and energy efficiencies ( λ P = 69% and λ E = 56%). Nevertheless, among all investigated strengthened assemblies, specimen S2-DS-EN1.4301 had the best response with respect to the four comparative parameters. It is the only specimen that had efficiency parameters exceeding 100% ( λ P , λ Δ , and λ E are 121%, 103%, and 120%, respectively), revealing a better performance than the reference assembly with continuous beam bars (CON-100). As seen in Figure 20d, specimen S2-DS-EN1.4301 also had the highest rotational ductility ( μ θ ) of 102 compared to all other studied assemblies.
Although the paper focuses on 2D frame assemblies, the findings are applicable to high-rise RC framed buildings. In the case of 3D RC frames, progressive collapse due to blast loads is typically governed by external blasts, which primarily affect the outer frames. For such scenarios, steel plates applied to one side of the beams can be used directly, as they can be installed on the building’s exterior without interference from transverse beams. If strengthening of interior frames is required, the schemes involving steel plates on both faces of the beams can be readily adapted in the case of RC frames without transverse beams at the beam–column joint location. Practical examples of situations where transverse beams do not exist at the connection region may involve cases in which the transverse beams are not directly linked to the beam–column joint. Instead, they connect to the main beam at a distance from the column face, such as in scenarios where there are openings in slabs. Furthermore, the 2D analysis presented in this study provides conservative, lower-bound estimates of progressive collapse resistance. For more accurate assessment and detailed design of strengthening schemes, future studies should consider modeling full 3D assemblies with slabs and transverse beams to analyze progressive collapse resulting from column loss.
It should be noted that aspects related to the assembly of steel plates, workmanship quality, and long-term durability issues, such as corrosion, fatigue, and joint loosening, are not addressed in this study and are recommended for future investigation.

6. Conclusions

The core goal of the current investigation was to reduce the progressive collapse risk in the event of column loss by numerically examining the use of bolted steel plates to strengthen the beam–column joints of RC non-seismic frames. The LS-DYNA package was used to model ten half-scale two-span, two-story beam–column assemblies under the scenario of center column removal. The analysis matrix included three control, unstrengthened assemblies and seven strengthened specimens. Studied variables included steel plate grade and upgrading scheme. The response of the specimens was compared regarding failure pattern and characteristics of load versus middle column displacement. The core outcomes of the study are summarized in the following points.
  • In the behavior of control and strengthened specimens under middle column loss, two discrete phases were identified. These are the flexural and catenary stages. Considerable axial compressive forces in the beams were created during the flexural action stage. These forces exceeded 10% of the beam section’s axial capacity, promoting the formation of compressive arch action in the beams.
  • Concrete damage contours of upgraded specimens were almost identical to those of control specimens with discontinuous bottom beam bars. The discontinuous beam bars at the middle column interface experienced slippage at low displacement levels of the middle column during the flexural stage. Full slippage of the discontinuous bottom bars occurred at large displacements during the catenary action phase. The flexural cracks near the center column face extended nearly vertically, inducing tension in the continuous top bars and partially triggering the establishment of the catenary stage. The ultimate failure pattern of steel plates added at the middle connection was due to either plate fracture or local plate buckling near the middle column face.
  • Strengthening of RC non-seismic assemblies using bolted steel plates considerably enhanced their load–displacement response, especially in the flexural phase. The maximum load of strengthened specimens in the flexural action phase was higher than that of the control specimen with continuous beam bars (CON-100) by 1% to 25%.
  • For upgrading schemes S1-DS and S2-DS, the steel grade has a slight influence on the percent enhancement in the maximum load at the flexural action stage. This is because at such a stage, the load resistance relied on the yield strength of the plate, and the plate thickness was different for each grade to have almost the same flexural capacity as the control specimen with continuous beam bars (CON-100).
  • The progressive collapse capacity of specimens upgraded with scheme S2-DS is generally better than that of scheme S1-DS. When compared with scheme S1-DS, adding steel plates at the outer joints in scheme S2-DS increased the strength and stiffness of the outer beam–column joints and, hence, enhanced the maximum load of the assembly at the two action phases.
  • Among all studied schemes and grades, the best progressive collapse performance was provided by specimens upgraded with EN1.4301 steel plates of scheme S2-DS. This is attributed to the high fracture strain of 45% for EN1.4301 steel, which helped the upgraded assembly to have large deformation in the catenary action phase without premature failure owing to plate fracture.
  • Even though the results of this study are based on modeling of 2D assemblies, in which the effects of RC slabs and transverse RC beams were not included, the 2D assemblies provided lower-bound values for the progressive collapse resistance. For more accurate analysis, it is highly recommended in the future to model 3D assemblies with slabs and transverse beams in the event of middle column loss.
  • This study confirmed that bolted steel plates are an effective strengthening method for mitigating progressive collapse in RC frames, with scheme S2-DS using EN 1.4301 stainless steel showing superior performance. Bolted plates offer practical advantages, such as ease of installation, adaptability, and reversibility. While EN 1.4301 has higher upfront costs, its corrosion resistance and durability improve long-term cost-effectiveness, making it a sustainable retrofitting option.
  • The upgraded schemes suggested in this study may be considered innovative owing to that (i) the use of bolted steel plates has not been used in the previous literature for mitigating progressive collapse in non-seismic RC frames; (ii) the schemes were added on the sides of the beam without increasing its depth, which could be practical in real-world applications; and (3) the EN 1.4301 stainless steel employed in this study was not commonly used in strengthening applications.
  • Future studies should focus on experimental validation of strengthening schemes, assessment of long-term performance under service loads, investigation of combined extreme loading scenarios, and evaluation of cost–benefit and construction feasibility aspects for the proposed bolted steel plate retrofitting techniques.

Author Contributions

Conceptualization, methodology, validation, writing—original draft, H.M.E.; methodology, validation, writing—review and editing, T.H.A.; visualization, writing—review and editing, H.A.; visualization, writing—review and editing, funding acquisition, Y.A.A.-S. All authors have read and agreed to the published version of the manuscript.

Funding

This research was funded through the Ongoing Research Funding program—Research Chairs (ORF-RC-2025-0400), King Saud University, Riyadh, Saudi Arabia.

Data Availability Statement

All data and models generated or used during the study appear in the article.

Acknowledgments

The authors gratefully acknowledge the funding received through the Ongoing Research Funding program—Research Chairs (ORF-RC-2025-0400), King Saud University, Riyadh, Saudi Arabia.

Conflicts of Interest

The authors declare no conflicts of interest.

References

  1. Pearson, C.; Delatte, N. Lessons from the progressive collapse of the Ronan Point apartment tower. Forensic Eng. 2003, 190–200. [Google Scholar] [CrossRef]
  2. Kazemi-Moghaddam, A.; Sasani, M. Progressive collapse evaluation of Murrah Federal Building following sudden loss of column G20. Eng. Struct. 2015, 89, 162–171. [Google Scholar] [CrossRef]
  3. Işık, E.; Avcil, F.; Hadzima-Nyarko, M.; İzol, R.; Büyüksaraç, A.; Arkan, E.; Radu, D.; Özcan, Z. Seismic performance and failure mechanisms of reinforced concrete structures subject to the earthquakes in Türkiye. Sustainability 2024, 16, 6473. [Google Scholar] [CrossRef]
  4. ACI Committee 318. Building Code Requirements for Structural Concrete and Commentary; ACI 318–19; American Concrete Institute: Detroit, MI, USA, 2019. [Google Scholar]
  5. ASCE (American Society of Civil Engineers). Minimum Design Loads and Associated Criteria for Buildings and Other Structures (ASCE/SEI 7–16); American Society of Civil Engineers: Reston, VA, USA, 2016. [Google Scholar]
  6. DOD (Department of Defense). Unified Facilities Criteria, Design of Building to Resist Progressive Collapse; Department of Defense: Arlington, VA, USA, 2005. [Google Scholar]
  7. GSA (General Service Administration). Alternate Path Analysis & Design Guidelines for Progressive Collapse Resistance; The U.S. General Services Administration: Washington, DC, USA, 2016. [Google Scholar]
  8. Pearson, C.; Delatte, N. Ronan point apartment tower collapse and its effect on building codes. J. Perform. Constr. Facil. 2005, 19, 172–177. [Google Scholar] [CrossRef]
  9. Alshaikh, I.M.; Bakar, B.A.; Alwesabi, E.A.; Zeyad, A.M.; Magbool, H.M. Finite element analysis and experimental validation of progressive collapse of reinforced rubberized concrete frame. Structures 2021, 33, 2361–2373. [Google Scholar] [CrossRef]
  10. Elsanadedy, H.M.; Almusallam, T.H.; Al-Salloum, Y.A.; Abbas, H. Investigation of precast RC beam-column assemblies under column-loss scenario. Constr. Build. Mater. 2017, 142, 552–571. [Google Scholar] [CrossRef]
  11. Feng, D.C.; Shi, H.R.; Parisi, F.; Brunesi, E.; Wang, C.L. Efficient numerical model for progressive collapse analysis of prestressed concrete frame structures. Eng. Fail. Anal. 2021, 129, 105683. [Google Scholar] [CrossRef]
  12. Kim, J.; An, D. Evaluation of progressive collapse potential of steel moment frames considering catenary action. Struct. Des. Tall Spec. Build. 2009, 18, 455–465. [Google Scholar] [CrossRef]
  13. Sasani, M.; Bazan, M.; Sagiroglu, S. Experimental and analytical progressive collapse evaluation of actual reinforced concrete structure. ACI Struct. J. 2007, 104, 731–739. Available online: https://www.proquest.com/scholarly-journals/experimental-analytical-progressive-collapse/docview/198350832/se-2 (accessed on 10 September 2025). [CrossRef] [PubMed]
  14. Kim, J.; Yu, J. Analysis of reinforced concrete frames subjected to column loss. Mag. Concr. Res. 2012, 64, 21–33. [Google Scholar] [CrossRef]
  15. Azar, A.B.; Sari, A. Reinforcement of arch structures under blast loads: A sustainable approach to structural enhancement. J. Struct. Integr. Maint. 2025, 10, 2457913. [Google Scholar] [CrossRef]
  16. Elsanadedy, H.M.; Al-Salloum, Y.A.; Almusallam, T.H.; Ngo, T.; Abbas, H. Assessment of progressive collapse potential of special moment resisting RC frames–Experimental and FE study. Eng. Fail. Anal. 2019, 105, 896–918. [Google Scholar] [CrossRef]
  17. Livermore Software Technology Corporation (LSTC). LS-DYNA Keyword User’s Manual; Version R11; LSTC: Livermore, CA, USA, 2018; Volume 1–3. [Google Scholar]
  18. Bao, Y.; Lew, H.S.; Kunnath, S.K. Modeling of reinforced concrete assemblies under column-removal scenario. J. Struct. Eng. 2014, 140, 04013026. [Google Scholar] [CrossRef]
  19. ASCE/SEI 41-06; Seismic Rehabilitation of Existing Buildings. American Society of Civil Engineers: Reston, VA, USA, 2006.
  20. Lim, N.S.; Tan, K.H.; Lee, C.K. Experimental studies of 3D RC substructures under exterior and corner column removal scenarios. Eng. Struct. 2017, 150, 409–427. [Google Scholar] [CrossRef]
  21. Lu, X.; Lin, K.; Li, Y.; Guan, H.; Ren, P.; Zhou, Y. Experimental investigation of RC beam-slab substructures against progressive collapse subject to an edge-column-removal scenario. Eng. Struct. 2017, 149, 91–103. [Google Scholar] [CrossRef]
  22. Yu, J.; Luo, L.; Li, Y. Numerical study of progressive collapse resistance of RC beam-slab substructures under perimeter column removal scenarios. Eng. Struct. 2018, 159, 14–27. [Google Scholar] [CrossRef]
  23. Kazemi, F.; Asgarkhani, N.; Jankowski, R. Machine learning-based seismic fragility and seismic vulnerability assessment of reinforced concrete structures. Soil Dyn. Earthq. Eng. 2023, 166, 107761. [Google Scholar] [CrossRef]
  24. Valente, M. Seismic upgrading strategies for non-ductile plan-wise irregular R/C structures. Procedia Eng. 2013, 54, 539–553. [Google Scholar] [CrossRef]
  25. Valente, M.; Milani, G. Alternative retrofitting strategies to prevent the failure of an under-designed reinforced concrete frame. Eng. Fail. Anal. 2018, 89, 271–285. [Google Scholar] [CrossRef]
  26. Teng, J.G.; Chen, J.F.; Smith, S.T.; Lam, L. Behaviour and strength of FRP-strengthened RC structures: A state-of-the-art review. Proc. Inst. Civ. Eng. Struct. Build. 2003, 156, 51–62. [Google Scholar] [CrossRef]
  27. Liu, X.; Lu, Z.D.; Li, L.Z. The use of bolted side plates for shear strengthening of RC beams: A review. Sustainability 2018, 10, 4658. [Google Scholar] [CrossRef]
  28. Al-Salloum, Y.A.; Alrubaidi, M.A.; Elsanadedy, H.M.; Almusallam, T.H.; Iqbal, R.A. Strengthening of precast RC beam-column connections for progressive collapse mitigation using bolted steel plates. Eng. Struct. 2018, 161, 146–160. [Google Scholar] [CrossRef]
  29. Elsanadedy, H.M.; Al-Salloum, Y.A.; Alrubaidi, M.A.; Almusallam, T.H.; Abbas, H. Finite element analysis for progressive collapse potential of precast concrete beam-to-column connections strengthened with steel plates. J. Build. Eng. 2021, 34, 101875. [Google Scholar] [CrossRef]
  30. De Lorenzis, L.; Teng, J.G. Near-surface mounted FRP reinforcement: An emerging technique for strengthening structures. Compos. Part B Eng. 2007, 38, 119–143. [Google Scholar] [CrossRef]
  31. Shang, X.Y.; Yu, J.T.; Li, L.Z.; Lu, Z.D. Strengthening of RC structures by using engineered cementitious composites: A review. Sustainability 2019, 11, 3384. [Google Scholar] [CrossRef]
  32. Elsanadedy, H.M.; Al-Salloum, Y.A.; Alrubaidi, M.A.; Almusallam, T.H.; Siddiqui, N.A.; Abbas, H. Upgrading of precast RC beam-column joints using innovative FRP/steel hybrid technique for progressive collapse prevention. Constr. Build. Mater. 2021, 268, 121130. [Google Scholar] [CrossRef]
  33. Elsanadedy, H.M.; Abadel, A.A. High-fidelity FE models for assessing progressive collapse robustness of RC ordinary moment frame (OMF) buildings. Eng. Fail. Anal. 2022, 136, 106228. [Google Scholar] [CrossRef]
  34. ASTM A302/A302M-17; Standard Specification for Pressure Vessel Plates, Alloy Steel, Manganese-Molybdenum and Manganese-Molybdenum-Nickel. ASTM International: West Conshohocken, PA, USA, 2022.
  35. ASTM A36/A36M-19; Standard Specification for Carbon Structural Steel. ASTM International: West Conshohocken, PA, USA, 2019.
  36. EN 10088-1:2023; Stainless Steels—Part 1: List of Stainless Steels. CEN: Brussels, Belgium, 2023.
  37. Karjalainen, L.P.; Taulavuori, T.; Sellman, M.; Kyröläinen, A.J. Some strengthening methods for austenitic stainless steels. Steel Res. Int. 2008, 79, 404–412. [Google Scholar] [CrossRef]
  38. Computers and Structures Inc. SAP2000 Ultimate 64-bit—Version 21.2.0; CSI: Berkeley, CA, USA, 2019. [Google Scholar]
  39. Belytschko, T.B.; Tsay, C.S. Explicit algorithms for nonlinear dynamics of shells. Nonlinear finite element analysis of plates and shells. J. Appl. Mech. 1981, 48, 209–231. [Google Scholar]
  40. Murray, Y.D.; Abu-Odeh, A.; Bligh, R. Evaluation of Concrete material Model 159; Report No. FHWA-HRT-05-063; US Department of Transportation, Federal Highway Administration National Transportation Systems Center: Washington, DC, USA, 2007. Available online: https://www.fhwa.dot.gov/publications/research/infrastructure/structures/05063/05063.pdf (accessed on 13 September 2025).
  41. ACI Committee 408. Bond and Development of Straight Reinforcing Bars in Tension; ACI 408R-03; American Concrete Institute: Detroit, MI, USA, 2003. [Google Scholar]
  42. NZS 4203; Code of Practice for General Structural Design and Design Loadings for Buildings 1. New Zealand Standard (NZS): Wellington, New Zealand, 1992.
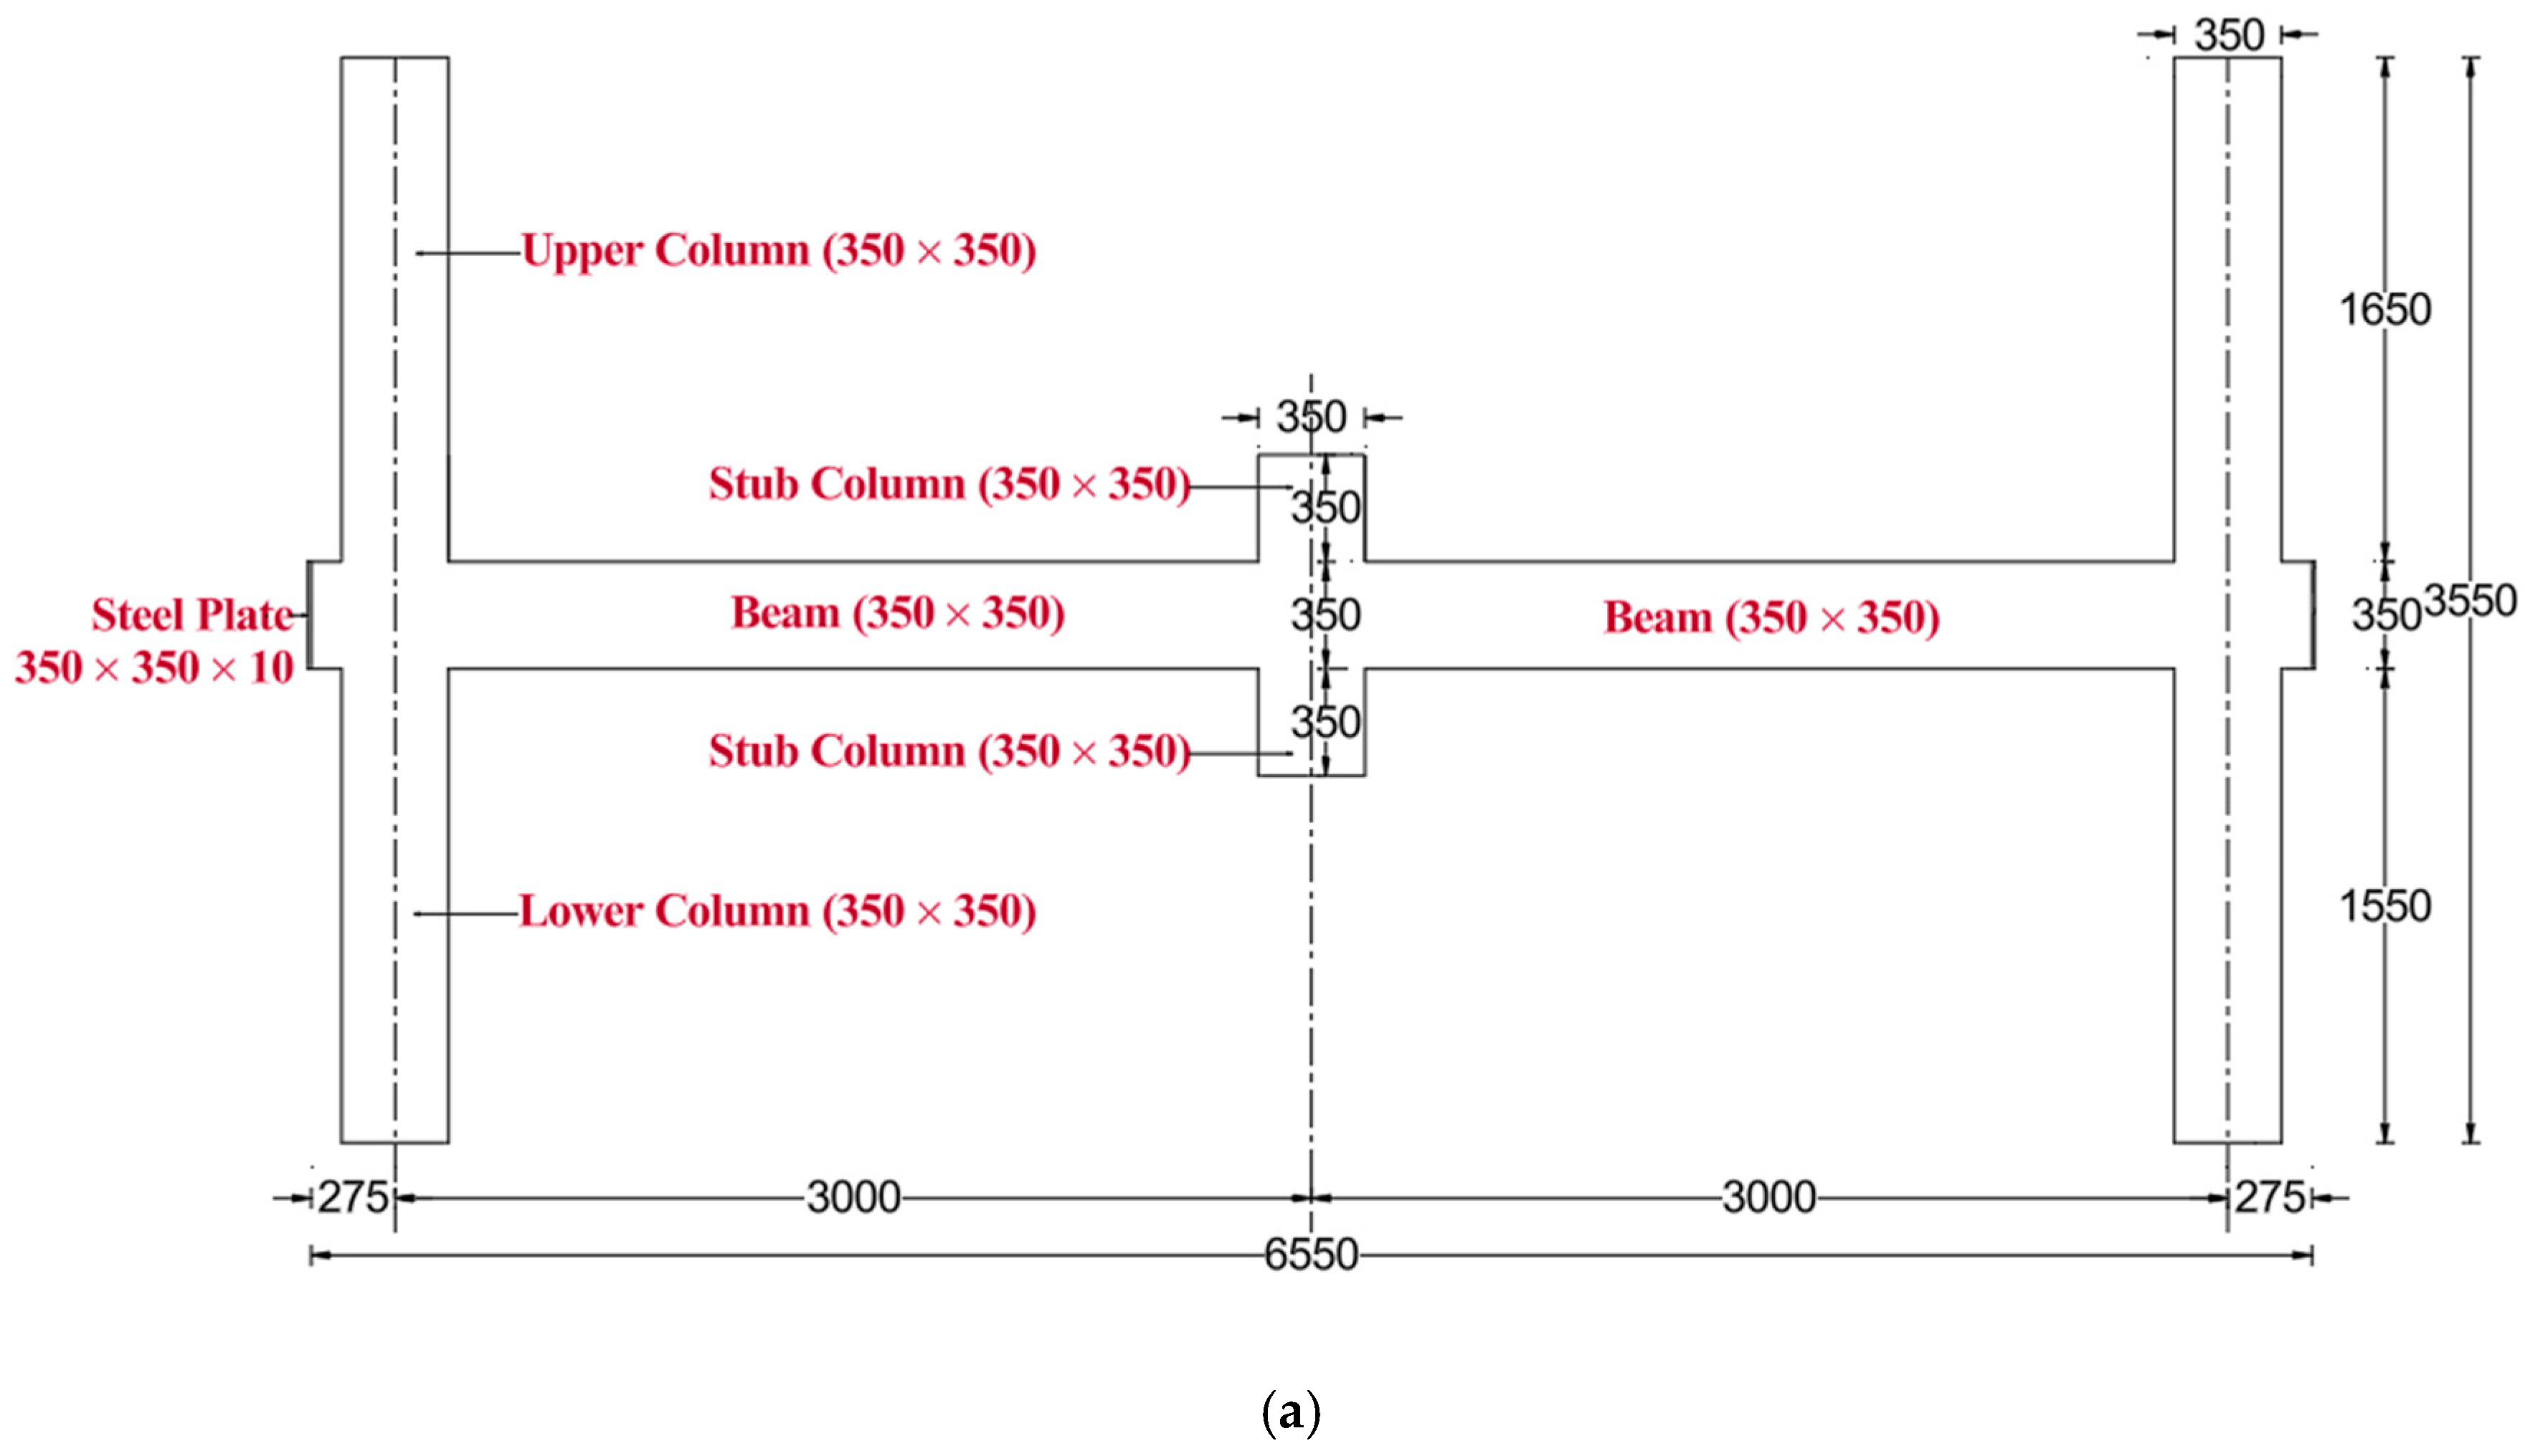
Figure 1. Details of control assemblies (units: mm): (a) outside dimensions of all assemblies; (b) steel reinforcement of one-half of specimen CON-0; (c) steel reinforcement of one-half of specimen CON-100.
Buildings 15 03325 g001aBuildings 15 03325 g001b
Figure 2. Plan view of bottom bars for beams of control assemblies: (a) CON-0; (b) CON-50; (c) CON-100.
Buildings 15 03325 g002
Figure 3. Details of assemblies strengthened with scheme S1-DS (units: mm).
Buildings 15 03325 g003
Figure 4. Details of assemblies strengthened with scheme S2-DS (units: mm).
Buildings 15 03325 g004
Figure 5. Details of assemblies strengthened with scheme S2-SS (units: mm).
Buildings 15 03325 g005
Figure 6. Modeling of frame assembly using SAP2000 [38]: (a) geometry and loading; (b) bending moment diagram (kN.m).
Buildings 15 03325 g006aBuildings 15 03325 g006b
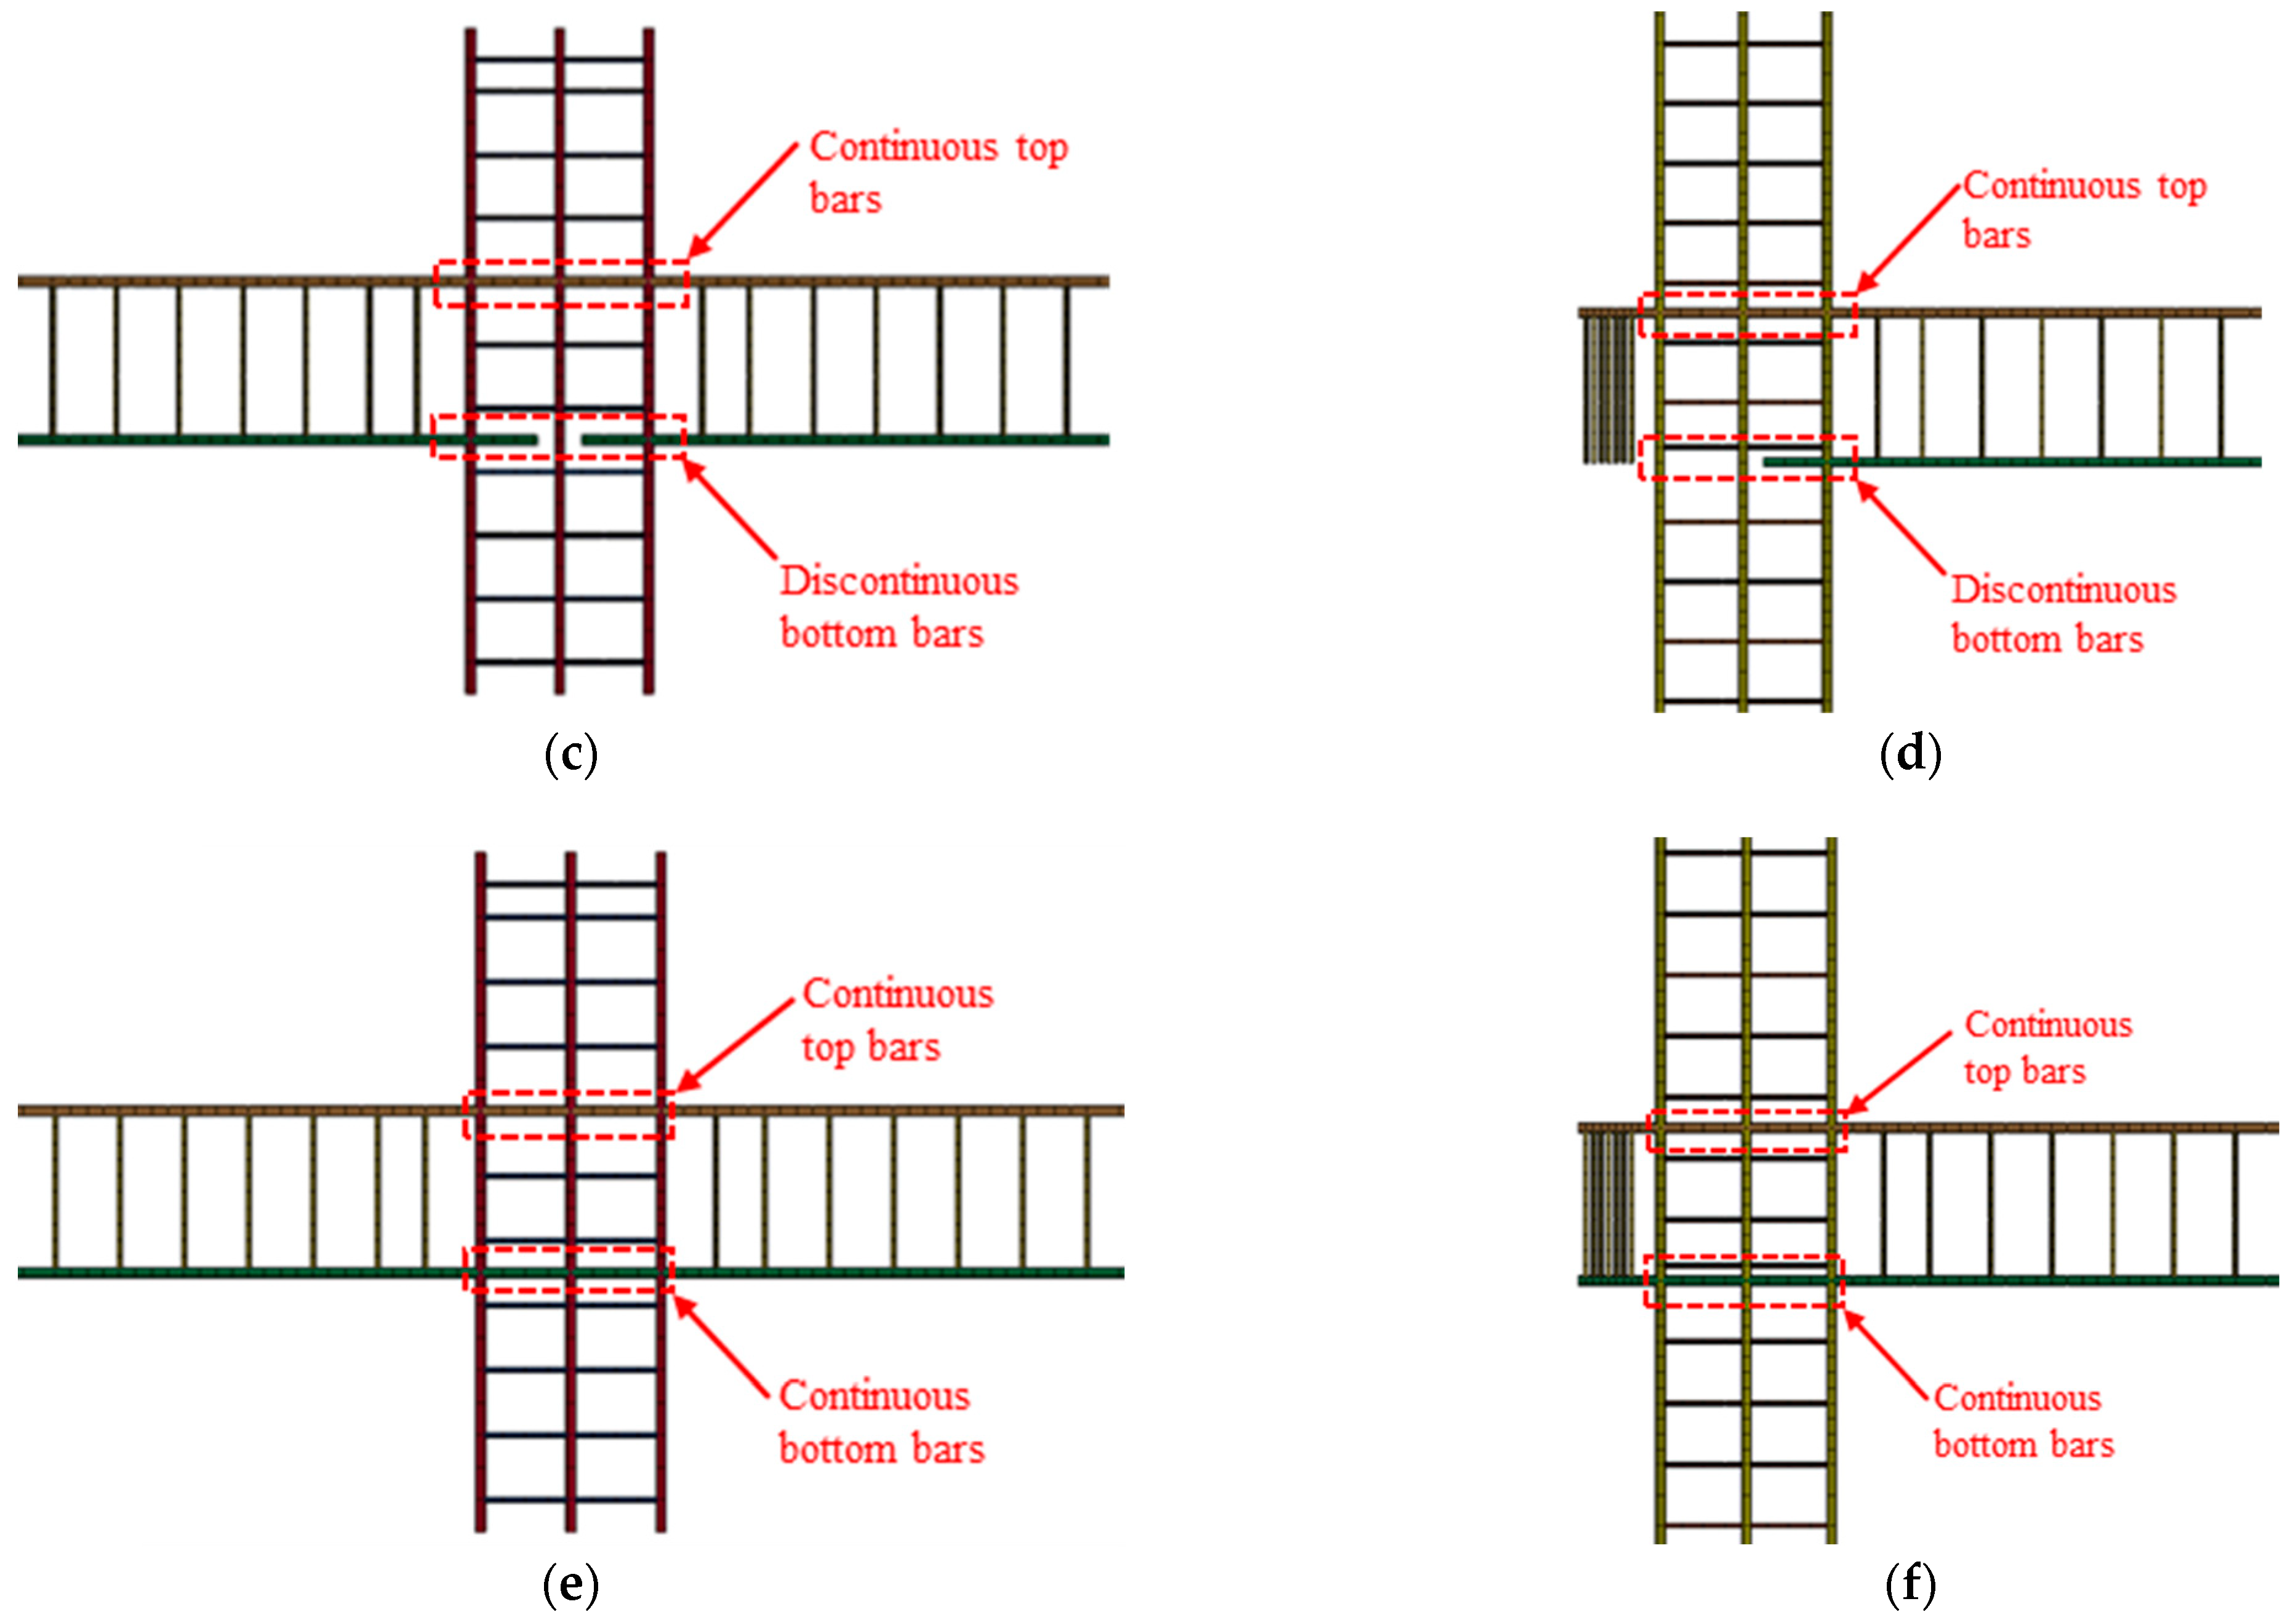
Figure 7. FE model of one-half of control assemblies: (a) outside dimensions for all assemblies; (b) reinforcement for assembly CON-0; (c) steel bars of middle connection of assembly CON-0; (d) steel bars of outer connection of assembly CON-0; (e) steel bars of middle connection of assembly CON-100; (f) steel bars of outer connection of assembly CON-100.
Buildings 15 03325 g007aBuildings 15 03325 g007b
Figure 8. FE model of strengthening schemes: (a) S1-DS; (b) S2-DS; (c) S2-SS.
Buildings 15 03325 g008aBuildings 15 03325 g008b
Figure 9. The 1D contact model: (a) fictitious springs at master-to-slave nodes interface; (b) relationship of bond versus slip.
Buildings 15 03325 g009
Figure 10. Modeling of steel plate/concrete interface using tiebreak surface-to-surface contact.
Buildings 15 03325 g010
Figure 11. Loading strategy used in the FE analysis: (a) application of axial load on edge column; (b) application of displacement on center column.
Buildings 15 03325 g011
Figure 12. Concrete damage contours in the flexural phase of representative assemblies: (a) CON-0; (b) CON-100; (c) S1-DS-A36; (d) S2-DS-A36; (e) S2-DS-EN1.4301; (f) S2-SS- EN1.4301.
Buildings 15 03325 g012aBuildings 15 03325 g012b
Figure 13. Concrete damage contours in the catenary phase of representative assemblies: (a) CON-0; (b) CON-100; (c) S1-DS-A36; (d) S2-DS-A36; (e) S2-DS-EN1.4301; (f) S2-SS-EN1.4301.
Buildings 15 03325 g013aBuildings 15 03325 g013b
Figure 14. X-stress contours for steel plates of representative upgraded specimens: (a) S1-DS-A36; (b) S2-DS-A36; (c) S2-DS-EN1.4301.
Buildings 15 03325 g014aBuildings 15 03325 g014b
Figure 15. Steel plate strain versus displacement curves for strengthened specimens: (a) A302 steel; (b) A36 steel; (c) EN1.4301 steel.
Buildings 15 03325 g015
Figure 16. Load versus displacement relationship for (a) specimens upgraded with scheme S1-DS; (b) specimens upgraded with schemes S2-DS and S2-SS.
Buildings 15 03325 g016
Figure 17. Beam axial force versus displacement curves for (a) specimens upgraded with scheme S1-DS; (b) specimens upgraded with schemes S2-DS and S2-SS.
Buildings 15 03325 g017
Figure 18. Evolution of different load–displacement phases for representative assemblies: (a) CON-100; (b) S2-DS-EN1.4301.
Buildings 15 03325 g018
Figure 19. Effect of steel plate grade on percent enhancement in response parameters owing to strengthening: (a) capacity at flexural action phase; (b) capacity at catenary action phase; (c) dissipated energy.
Buildings 15 03325 g019
Figure 20. Comparison between assemblies with regard to (a) peak load efficiency; (b) displacement efficiency; (c) energy efficiency; (d) rotational ductility.
Buildings 15 03325 g020aBuildings 15 03325 g020b
Table 1. List of numerically modeled control specimens.
Specimen ID% of Continuous Bottom Beam Bars at Beam–Column ConnectionDetails
CON-00%See Figure 1 and Figure 2
CON-5050%See Figure 1 and Figure 2
CON-100100%See Figure 1 and Figure 2
Table 2. List of numerically modeled strengthened specimens.
Specimen IDUpgrading SchemeSteel Plate ConfigurationDetails
Thickness (mm)GradeLocation
S1-DS-A302S1-DS3ASTM A302, Grade B [34]Both sides of the specimen at the middle joint See Figure 3
S2-DS-A302S2-DS3ASTM A302, Grade BBoth sides of the specimen at the middle and end jointsSee Figure 4
S1-DS-A36S1-DS4ASTM A36 [35]Both sides of the specimen at the middle joint See Figure 3
S2-DS-A36S2-DS4ASTM A36Both sides of the specimen at the middle and end jointsSee Figure 4
S1-DS-EN1.4301S1-DS5EN 1.4301 [36]Both sides of the specimen at the middle joint See Figure 3
S2-DS-EN1.4301S2-DS5EN 1.4301Both sides of the specimen at the middle and end jointsSee Figure 4
S2-SS-EN1.4301S2-SS10EN 1.4301One side of the specimen at the middle and end jointsSee Figure 5
Table 3. Details of material models employed in the numerical analysis.
Concrete
Material model Type 159—continuous surface cap
Compressive strength (MPa)35
Rate effect includedYes
Erosion type and thresholdMaximum principal strain—erosion limit = 5%
Maximum size of coarse aggregate (mm)10
Steel bars, plates, and rodsф8 barsф16 barsA302 platesA36 platesEN 1.4301 platesHS rods
Material modelType 24—piecewise linear plasticity
Elastic modulus (MPa)2 × 1052 × 1052 × 1052 × 1052 × 1052 × 105
Poisson’s ratio0.30.30.290.30.290.3
Strain rate parameter, α250250250250250250
Strain rate parameter, β1.61.61.61.61.61.6
Yield stress (MPa)525526345248210711
Tangent modulus (MPa)127106513966646910
Ultimate plastic strain (%)19.7011.7014.7022.8044.706.60
Table 4. Numerical results for studied specimens in the flexural action stage *.
Specimen IDPy (kN)Δy (mm)Pu-FA (kN)Δc-FA (mm)Nu-FA (kN)Formation of Compressive Arch Action in Beams
CON-0NYNY20455−611Yes
CON-501641525075−606Yes
CON-1002182028785−602Yes
S1-DS-A3021971530160−601Yes
S2-DS-A3022121436085−525Yes
S1-DS-A36148929185−604Yes
S2-DS-A361741035165−525Yes
S1-DS-EN1.43011981330560−599Yes
S2-DS-EN1.4301167936065−521Yes
S2-SS-EN1.4301133734675−514Yes
* Py and Δy = load and associated displacement at first yield of bottom beam bars at the face of the inner column; Pu-FA and Δc-FA = maximum load and associated displacement of specimen at the flexural action phase; Nu-FA = maximum axial force developed in the beam at the flexural action phase (+ve sign indicates tension); NY = no yielding of bottom beam bars at the face of the inner column.
Table 5. Numerical results for studied specimens in the catenary action phase and at the ultimate state *.
Specimen IDCatenary Action PhaseUltimate Stateεb,u-DIS-MCF (µε)εb,u-CONT-MCF (µε)εsp,u-MCF (µε)εt,u-ECF (µε) εsp,u-ECF (µε)Pu (kN)
DevelopmentPu-CA (kN)Pu-CA/Pu-FAΔc-CA (mm)Nu-FA (kN)Δu (mm)Eu (kN.m)
CON-0Partial2971.468004658451582023--121,308-297
CON-50Partial3601.4497547210552422087115,945-119,584-360
CON-100Partial4331.51740657890292-107,709-120,917-433
S1-DS-A302Partial3191.068054888302011759-141,669141,960-319
S2-DS-A302Partial3120.876855357001951965-145,71690,347113,644360
S1-DS-A36Partial2991.034854676601651889-193,607124,557-299
S2-DS-A36Partial4251.215706468602431834-221,22491,325123,916425
S1-DS-EN1.4301Partial3101.025404616651671806-178,951125,431-310
S2-DS-EN1.4301Partial5251.468356429203501793-294,85588,987118,359525
S2-SS-EN1.4301Partial3691.075555256151862296-181,095128,76387,998369
* Pu-CA and Δc-CA = maximum load and associated displacement of specimen at the catenary action phase; Nu-CA = maximum axial force developed in the beam at the catenary action phase (+ve sign indicates tension); Δu = displacement at the ultimate state; Eu = energy dissipated at the ultimate state; εb,u-DIS-MCF = maximum strain of discontinuous bottom beam bars at the face of the inner column; εb,u-CONT-MCF = maximum strain of continuous bottom beam bars at the face of the inner column; εsp,u-MCF = maximum strain of bottom edge of steel plates at the face of the inner column; εt,u-ECF = maximum strain of top beam bars at the face of the edge column; εsp,u-ECF = maximum strain of top edge of steel plates at the face of the edge column; Pu = progressive collapse resistance = maximum of Pu-FA and Pu-CA; strain values in italic bold font exceed their respective yield values.
Disclaimer/Publisher’s Note: The statements, opinions and data contained in all publications are solely those of the individual author(s) and contributor(s) and not of MDPI and/or the editor(s). MDPI and/or the editor(s) disclaim responsibility for any injury to people or property resulting from any ideas, methods, instructions or products referred to in the content.