Article

A GPR Imagery-Based Real-Time Algorithm for Tunnel Lining Void Identification Using Improved YOLOv8

1
Key Laboratory of Large Structural Health Monitoring and Control, Shijiazhuang Tiedao University, Shijiazhuang 050043, China
2
Yanzhao Modern Transportation Laboratory, Shijiazhuang 050043, China
3
China Railway Design Group Co., Ltd., Tianjin 300308, China
4
Hebei Transportation Investment Group Co., Ltd., Shijiazhuang 050090, China
*
Authors to whom correspondence should be addressed.
Buildings 2025, 15(18), 3323; https://doi.org/10.3390/buildings15183323
Submission received: 30 July 2025 / Revised: 4 September 2025 / Accepted: 12 September 2025 / Published: 14 September 2025
(This article belongs to the Section Construction Management, and Computers & Digitization)

Abstract

Tunnel lining voids, a common latent defect induced by the coupling effects of complex geological, environmental, and load factors, pose severe threats to operational and personnel safety. Traditional detection methods relying on Ground-Penetrating Radar (GPR) combined with manual interpretation suffer from high subjectivity, low efficiency, frequent missed or false detections, and an inability to achieve real-time monitoring. Thus, this paper proposes an intelligent identification methodology for tunnel lining voids based on an improved version of YOLOv8. Key enhancements include integrating the RepVGGBlock module, dynamic upsampling, and a spatial context-aware module to address challenges from diverse void geometries—resulting from interactions between the environment, geology, and load—and complex GPR signals caused by heterogeneous underground media and the varying electromagnetic properties of materials, which obscure void–background boundaries, as well as interference signals from detection processes. Additionally, the C2f-Faster module reduces the computational complexity (GFLOPs), parameter count, and model size, facilitating edge deployment at detection sites to achieve real-time GPR signal interpretation for tunnel linings. Experimental results on a heavy-haul railway tunnel’s lining defect dataset show 11.57% lower GFLOPs, 14.55% fewer parameters, and 13.85% smaller weight files, with average accuracies of 94.1% and 94.4% in defect recognition and segmentation, respectively, meeting requirements for the real-time online detection of tunnel linings. Notably, the proposed model is specifically tailored for void identification and cannot handle other prevalent tunnel lining defects, which restricts its application in comprehensive tunnel health monitoring scenarios where multiple defects often coexist to threaten structural safety.

1. Introduction

With the ongoing development of underground construction in China, the number and total length of tunnels in operation are steadily increasing, marking significant advancements in both highway tunnels and railway tunnels. According to statistics, by the end of 2023, the operating mileage of China’s railways has reached 159,000 km, including 18,573 railway tunnels with a total length of 23,508 km. The total length of high-speed railways in operation in China has surpassed 45,000 km, with 4561 high-speed railway tunnels totaling 7735 km. Among these, 115 extra-long tunnels exceed 10 km in length, collectively reaching approximately 1471 km. Additionally, China operates 286 extra-long railway tunnels, totaling approximately 3869 km, with 13 tunnels exceeding 20 km in length, covering around 312 km. Nationwide, there are 27,297 highway tunnels with a total length of 30,231.8 km [1], reflecting an increase of 2447 tunnels and 3447.5 km. This includes 2050 extra-long tunnels totaling 9240.7 km and 7552 long tunnels with a combined length of 13,213.8 km. The achievements in national transportation construction are truly remarkable [2], as shown in Table 1.
Due to the influence of complex geological conditions, environmental factors, and dynamic vehicle loads, hidden defects such as lining structure cracks, water leakage, and voids have become increasingly prominent and are continuing to rise with service time. The detection, diagnosis, and early warning of such issues have become critical challenges in the proactive management and safety control of tunnel operations. Among the hidden diseases of the tunnel lining structure, voids are the most prevalent. The presence of voids undermines the load-bearing capacity of the tunnel lining, leading to cracks in the secondary lining and further resulting in hazards such as falling debris and water leakage, as illustrated in Figure 1. These issues pose significant threats to both tunnel operations and public safety. Therefore, the real-time detection of tunnel lining voids and the prompt assessment of the tunnel’s safety and health status are critical to ensuring its safe and prolonged operation [3].
This challenge of tunnel defects, particularly lining voids, is not unique to China but is a global concern shared by many countries with tunnel infrastructure. In Europe and the United States, for instance, many early-built tunnels, some dating back to the 19th century, now face severe disease issues due to their prolonged service life. Constrained by the outdated construction techniques and materials available at the time of their construction, these historical tunnels suffer from various defects, including lining voids, water leakage, and structural deformations, which mirror the core defect types affecting China’s tunnels. Such issues not only deteriorate the service performance of tunnels but also trigger safety accidents, posing threats to transportation operations and public safety. Notably, tunnels built in these European countries during this period are even more prone to defects due to the long-term lack of advanced detection and maintenance. This global context further underscores the urgency of developing advanced detection and maintenance technologies for tunnel infrastructure worldwide. Our proposed improved YOLOv8-based algorithm is intended to contribute to addressing such global tunnel defect detection challenges, and it aligns closely with the research focus on tunnel lining void detection in this paper.
At present, the GPR is the primary non-destructive testing method used for tunnel lining quality inspection. However, the interpretation of GPR images primarily relies on manual labor, which is inefficient, inaccurate, and subjective. Despite consuming significant time and labor, accuracy cannot be reliably ensured. In GPR image interpretation, image processing technology is gradually replacing manual methods for extracting defects from radar images.
In recent years, among various tunnel lining quality inspection methods, deep learning-based detection has proven to offer unique advantages. It enables the extraction of deeper features from images, demonstrates enhanced adaptability to complex environments, and offers significant improvements in both efficiency and accuracy. Specifically, in the context of using GPR defect images to detect tunnel lining defects, deep learning-based detection methods have become a prominent research focus. Liu et al. [4] proposed a novel network, the CRNN, for processing GPR defect data. This network combines convolutional neural networks (CNNs) and recurrent neural networks (RNNs), achieving improved accuracy in processing GPR defect data. Liu et al. [5] proposed to use deep learning and transfer learning techniques. First, an experimental physical model was established to collect data, which was then used in combination with the SSD and YOLOv4 algorithms to train an intelligent recognition model. As a result, the automatic recognition of internal quality defects in tunnel linings was successfully realized, leading to improvements in both detection efficiency and accuracy. Li et al. [6] proposed the GPR-RCNN method, integrating the 2D planar features and 3D voxel features from GPR data. Experimental results demonstrated that this algorithm outperformed existing techniques in detecting defects such as runway voids, cracks, settlements, and pipelines. Zhao et al. [7] proposed a multi-disease detection method for dynamic wave tunnel lining GPR images using deep learning. The TLGAN model was employed to generate multi-dimensional GPR images, thus expanding the dataset, while the Wave-backbone model, integrated with the Wave-DetNets detection network, was designed to extract and fuse multi-scale global waveform features. This approach significantly enhanced the accuracy of tunnel lining detection. Luo et al. [8] proposed the MTGPR method. The method improves feature extraction by introducing modules such as CNXB and ACmix, optimizes the loss function using WIoUv3, and constructs the CAPW-YOLO model. Additionally, DEM-FDTD and DCGAN are employed for data augmentation. Ultimately, this model achieves significant improvements in both accuracy and efficiency when identifying voids and cavity defects in tunnel linings. Li et al. [9] proposed a method, PDSE-YOLOv8, based on GPR. Experimental validation demonstrated that this method enhanced real-time performance while maintaining detection accuracy, effectively identifying internal defects in asphalt roads. Additionally, the model proved to be more suitable for practical engineering applications.
While these deep learning-based approaches have made progress in tunnel lining defect detection, they still cannot fully address the specific difficulties of tunnel lining void identification. The limitations of existing methods first highlight the need for further algorithmic refinement, and this is precisely the motivation for our work to develop an improved detection algorithm tailored to tunnel lining voids. Additionally, these limitations also correspond to the unresolved practical challenges in current void detection.
These challenges directly constrain the performance of existing deep learning methods in tunnel lining void identification and are outlined as follows. (1) The coupled effects of multiple factors, including the environment, geology, and load, result in the complex and varied types and geometries of void defects in the lining structure, thereby increasing the difficulty in recognizing and segmenting void defects with varying target sizes. (2) Due to the heterogeneous characteristics of the tunnel’s surrounding rock and its varying electromagnetic properties, the reflected signals in GPR images often exhibit complex features such as multiple reflections and diffraction. This leads to blurred boundaries between void defects and the background, thereby reducing recognition accuracy. (3) The complex internal environment of the tunnel, including factors such as objects and structures within the tunnel and external electromagnetic noise, affects the GPR during tunnel lining quality inspection. These factors generate significant interference signals in the radar images, increasing background complexity and consequently making the identification of void defects more challenging. (4) The tunnel lining is located in a complex and unpredictable environment, with extremely high detection accuracy requirements. However, these high accuracy demands often result in numerous algorithm parameters and a large model size, making deployment near the data source at the detection site challenging and complicating the real-time processing of GPR image data.
To address the aforementioned issues, an intelligent identification algorithm for tunnel lining void defects based on an improved YOLOv8 is proposed, grounded in deep learning theory and tailored to the practical detection needs of tunnel lining diseases.

2. Methods

2.1. Basic Description of YOLOv8

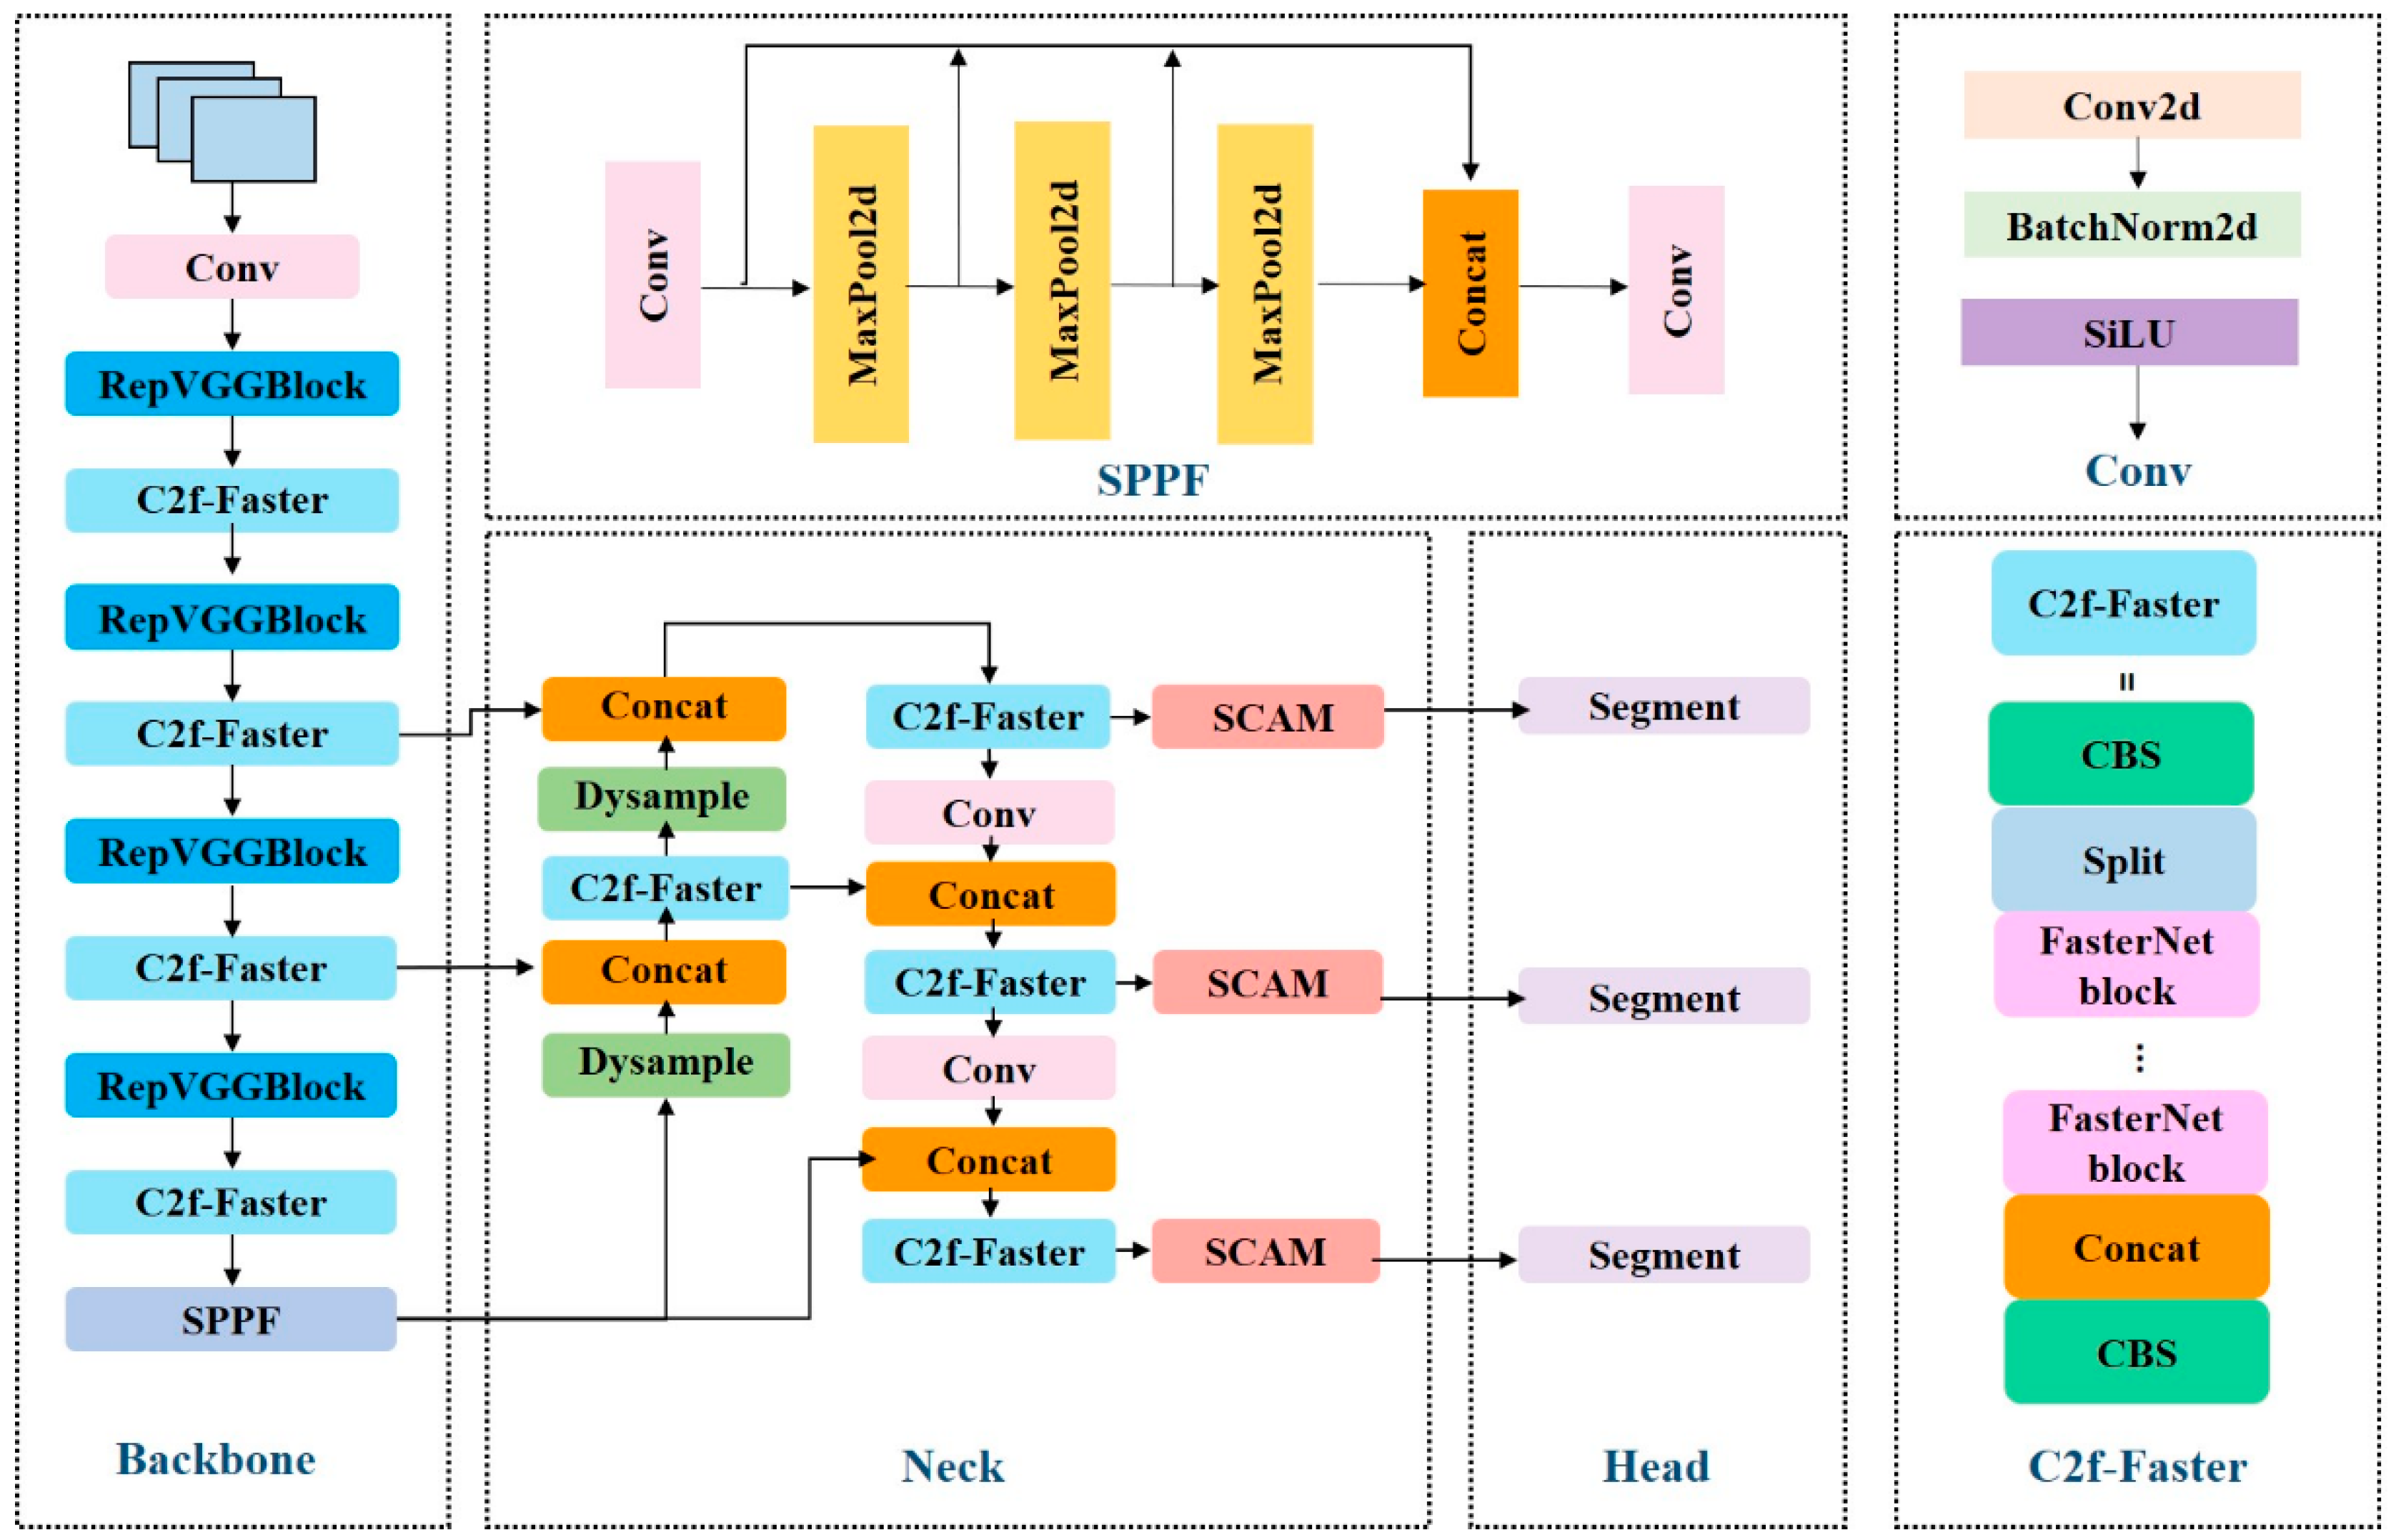
YOLOv8 demonstrates superior performance among contemporary object detection. The YOLOv8 model employed consists of four primary modules: the input layer, the backbone network, the neck network, and the segmentation layer. The input layer serves to input the image data necessary for recognition and segmentation tasks, establishing the foundation for subsequent processing. The backbone network extracts multi-scale features from input images. Through successive convolutional and pooling layers, the depth of feature extraction is progressively enhanced, resulting in richer, more detailed feature information. The neck network integrates the features extracted by the backbone, refining the model’s understanding and providing a solid foundation for subsequent precise processing. Finally, the segmentation layer is responsible for fine-grained tasks, such as prediction and pixel-level instance segmentation, by analyzing the relationships between features at various layers. Compared with simple object recognition, this segmentation layer, driven by feature association analysis, yields more accurate recognition results [10].

2.2. The Improved YOLOv8-RCDS

In practical tunnel engineering, various complex factors present significant challenges for the identification of void defects in tunnel linings based on GPR images. Therefore, this paper proposes an intelligent identification algorithm for tunnel lining voids based on an enhanced YOLOv8 model. This algorithm is built upon an innovative architecture called RCDS, and its overall structure is shown in Figure 2. In this architecture, the traditional convolution module in the backbone network is replaced with the RepVGGBlock. In the neck network, upsampling is enhanced through Dynamic Sampling (DySample). Additionally, a spatial context-aware module (SCAM) is introduced. The algorithm also replaces all C2f modules with C2f-faster modules, thus forming the RCDS architecture. This approach addresses the challenges of low identification efficiency, poor accuracy, and the inability to achieve the real-time detection of tunnel lining void defects caused by various complex factors.

2.2.1. Image Feature Extraction

In tunnel engineering, the detection of void defects in the lining is crucial to ensuring the safe operation of tunnels. However, during the actual construction process, several key factors contribute to the complex diversity in the types and forms of voids. The variety of void types is illustrated in Figure 3.
(1)
Characteristics of concrete materials
Owing to the intrinsic characteristics of concrete, it experiences shrinkage and creep subsequent to pouring, which gives rise to the creation of gaps between the lining and the surrounding rock or the waterproof membrane. The voids generated for this reason are typically of a small size.
(2)
Differences in construction techniques
During the tunnel excavation stage, poor blasting performance may result in an uneven initial support surface, leading to voids between the waterproof membrane behind the secondary lining and the initial support. During the installation of the waterproof membrane, excessive relaxation may cause folds to form, occupying the space of the secondary lining, and resulting in voids between the secondary lining and the initial support. During the concrete pouring process, inadequate vibration may lead to insufficient compaction, causing the concrete to sink under its own weight after the pouring is complete, thus forming voids in the arch section. During lining pouring, if no vent holes are provided at the arch position, or if the reserved vent holes are blocked and ineffective, gas accumulation within the arch can lead to the formation of an airbag, generating pressure that prevents the concrete from being fully compacted, thus creating voids in the arch section of the lining [11].
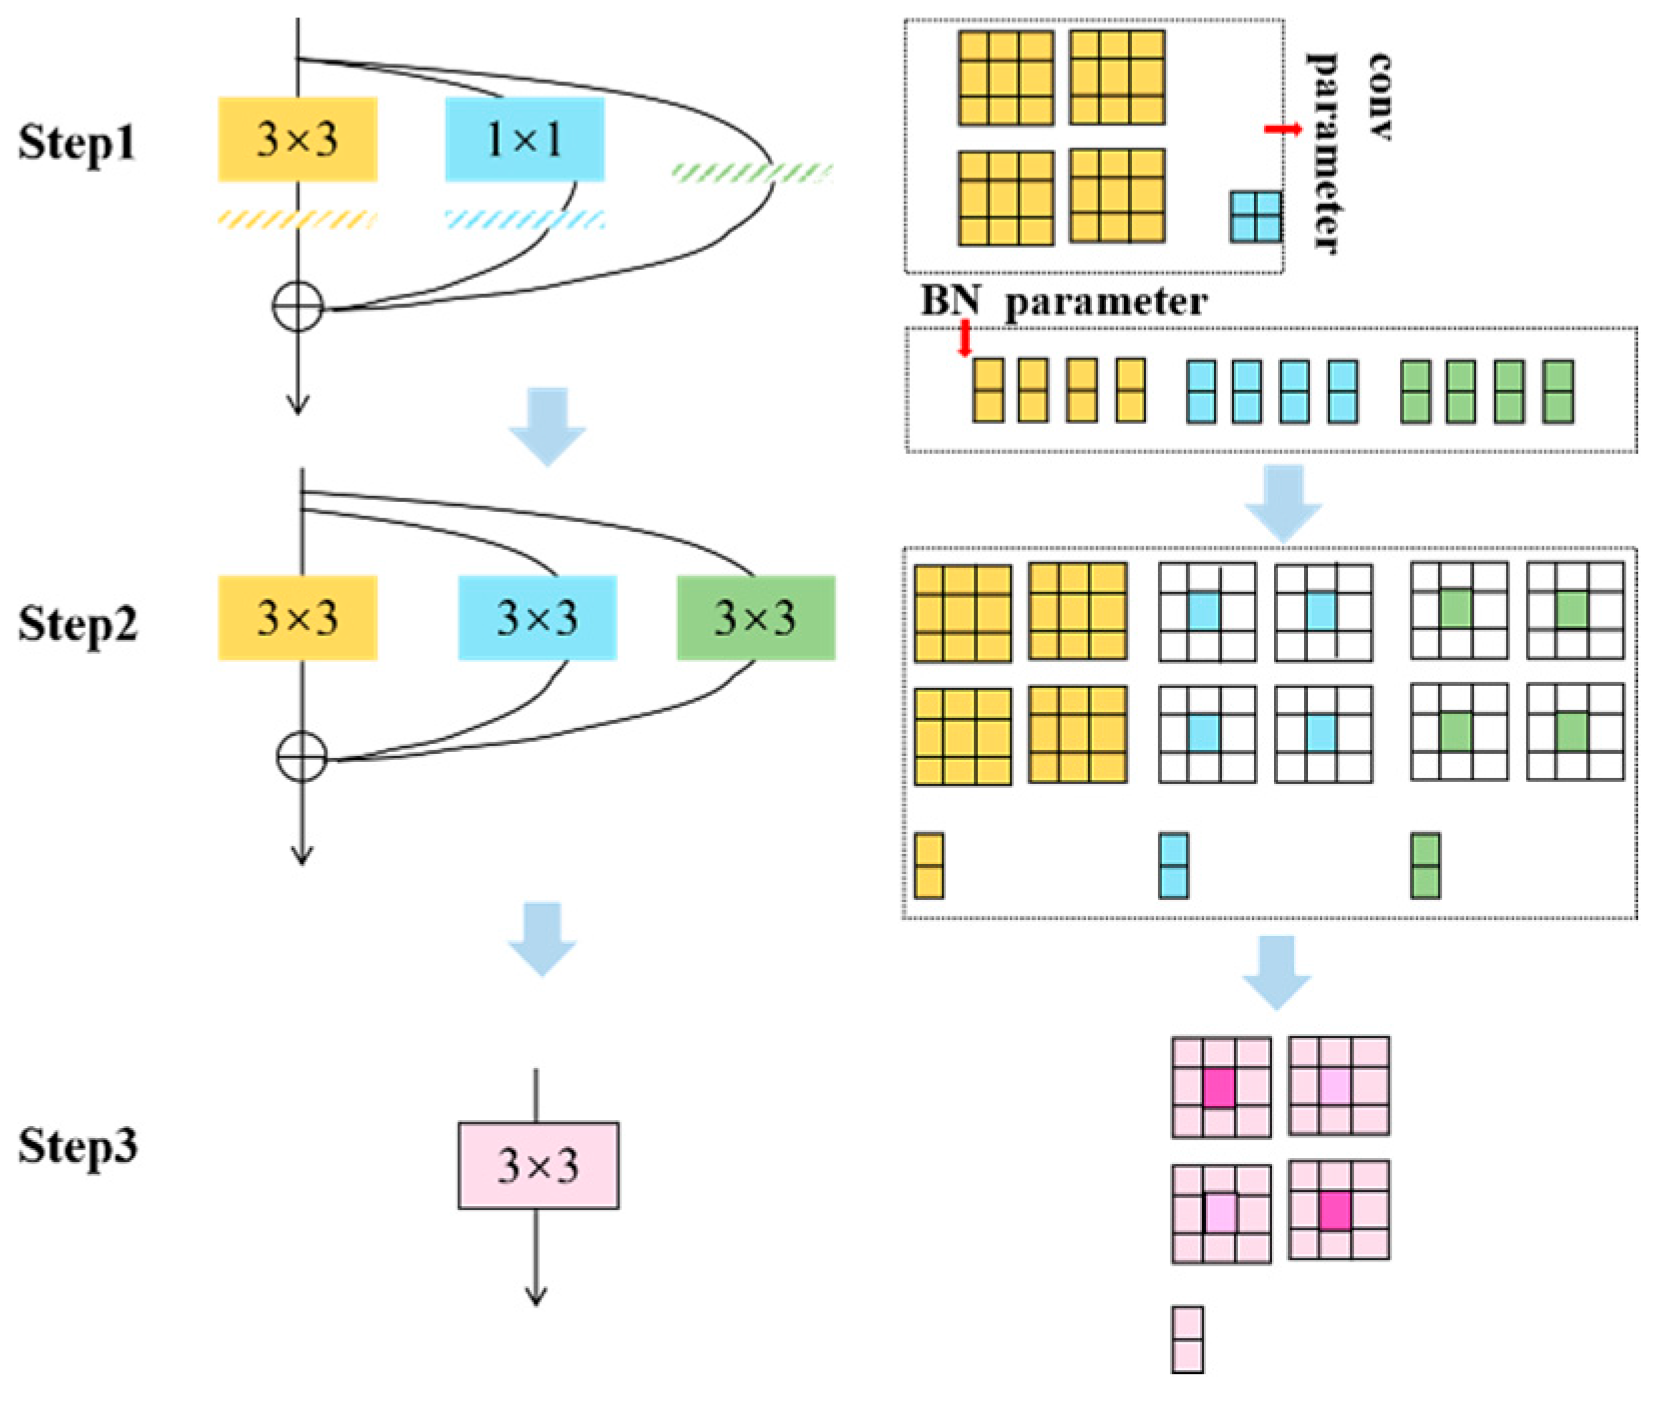
This complex diversity caused by the coupling effect of multiple factors, including the environment, geology, and load, poses significant challenges for recognition and segmentation. To effectively address this challenge, the reparameterization concept from RepVGG is utilized, replacing the original convolution in the backbone network with the RepVGGBlock, thereby refining the convolutional layer of the backbone network. Compared with the original YOLOv8, the model incorporating the RepVGGBlock module can be considered a large-scale, multi-branch model that integrates information from different branches, enhancing feature extraction [12], in order to improve the model performance and enhance the model’s ability to model complex problems [13] and better handle the recognition and segmentation tasks of voids with different target sizes.
The core idea of RepVGGBlock is as follows [14]:
(1)
The convolution layer and the Batch Normalization (BN) layer are integrated by means of the following Formula [15].
W i = γ i σ i W i
b i = μ i γ i σ i + β
Within the mathematical framework, Wi stands for the weights of the convolutional layer prior to the integration process. The statistical properties of the BN layer are characterized by μi, the expected value of the feature maps, and σi, their variance. During the fusion step, γi acts as the scaling factor and β as the offset factor for normalization. Post-fusion, the convolutional operation is represented by a new weight matrix W i and bias term b i , which absorb the BN layer’s parameters.
(2)
Transform the fused convolutional layer into a 3 × 3 convolution. For the 1 × 1 convolutional branch, the values contained within its convolution kernel can be repositioned to the center of the 3 × 3 convolution kernel. As for the identity mapping branch, given that it does not alter the values of the input feature map, it can be treated as a 3 × 3 convolution kernel with a weight of 1. Following this, it is multiplied by the input feature map to preserve the original value.
(3)
Merge the 3 × 3 convolutions in the residual branch. By aggregating the weights W and biases B across all branches, a combined 3 × 3 convolutional network layer is generated. The fusion process detailed above is illustrated in Figure 4 [16].

2.2.2. Image Detail Enhancement

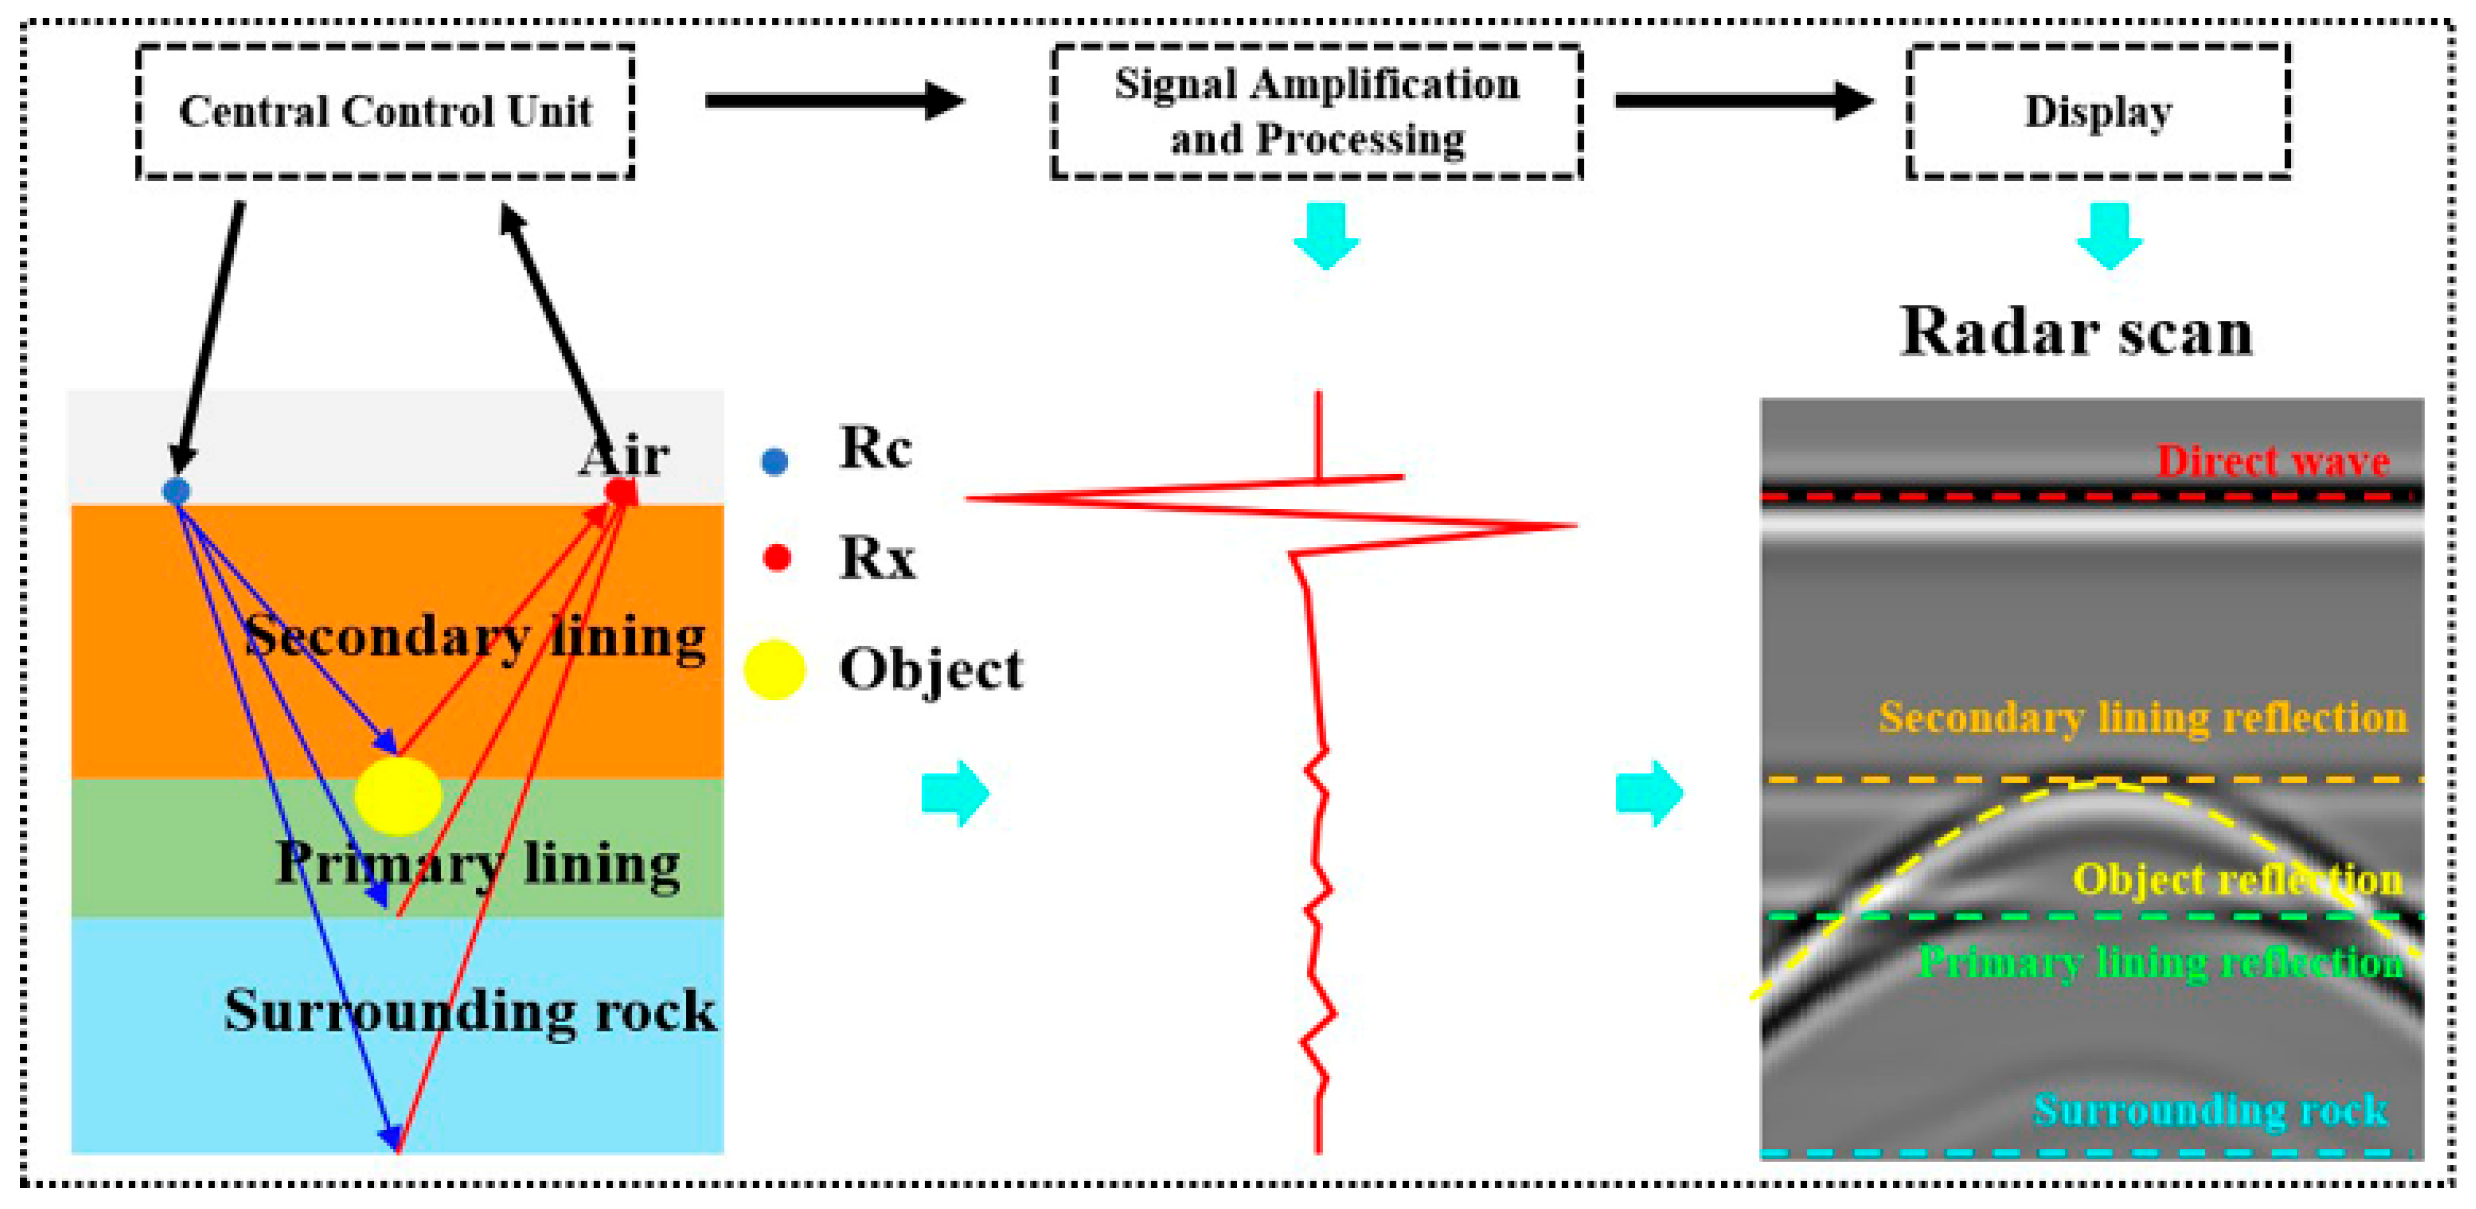
The working principle of GPR involves emitting high-frequency electromagnetic waves towards the lining structure via the transmitting antenna, receiving reflected electromagnetic waves from different layers within the lining through the receiving antenna, and subsequently analyzing and inferring the spatial position and shape of the underground medium based on the distinct electromagnetic characteristics of the media. The principle is illustrated in Figure 5. This can be understood by combining actual engineering practices with the working principle of GPR.
(1)
Due to the different electromagnetic characteristics between void diseases and surrounding soil, void diseases manifest in radar images as an increase in reflected signal energy, accompanied by sudden changes in frequency, amplitude, and phase. Additionally, multiple reflected waves appear beneath the void area, and diffraction occurs at the boundary [17], resulting in complex boundary reflection signals that make it challenging to clearly delineate the boundary with detailed information.
(2)
The heterogeneous characteristics of underground media lead to the attenuation of void signals. This occurs because high-frequency, narrow-band electromagnetic waves are randomly scattered by the rough surfaces of aggregates and within small-scale media. This scattering phenomenon causes energy loss in radar wave signals, which subsequently superimpose with the void echo signals. As a result, the amplitude of the void echo signals decreases, and the difference between the echo signals and the background diminishes, leading to blurred boundaries [18].
(3)
The data acquisition and processing of GPR significantly affect the resolution and boundary clarity of the resulting images. Inadequate parameter settings can hinder the complete capture of detailed information about the target objects, leading to incomplete or inaccurate data representation [19].
In summary, there exists significant fuzziness and uncertainty between the target void diseases and the background. Additionally, the conventional up-sampling in YOLOv8 primarily focuses on spatial information, neglecting the semantic information embedded in the feature map. To mitigate the risk of further blurring and the loss of edge and detail information when restoring the low-resolution feature map to high-resolution [20], and to enhance the model’s ability to perceive fine details for the more accurate localization and identification of void diseases in GPR images [21], the DySample module is introduced as an advanced up-sampling technique. This method improves the detail information in GPR images without imposing an additional computational burden [22].
The upsampling process using the DySample module is primarily illustrated in Figure 6. First, a given feature map χ with a size of C × H1 × W1 is provided. Additionally, a point-sampling set δ is introduced with a size of 2g × W2 × H2, where 2g represents the coordinates of x and y in the first dimension. Then, through the Grid sample function, using the position information in the point-sampling set δ, the feature map χ is resampled to χ with a size of C × H2 × W2, and its expression is as shown in Formula (3) [23].
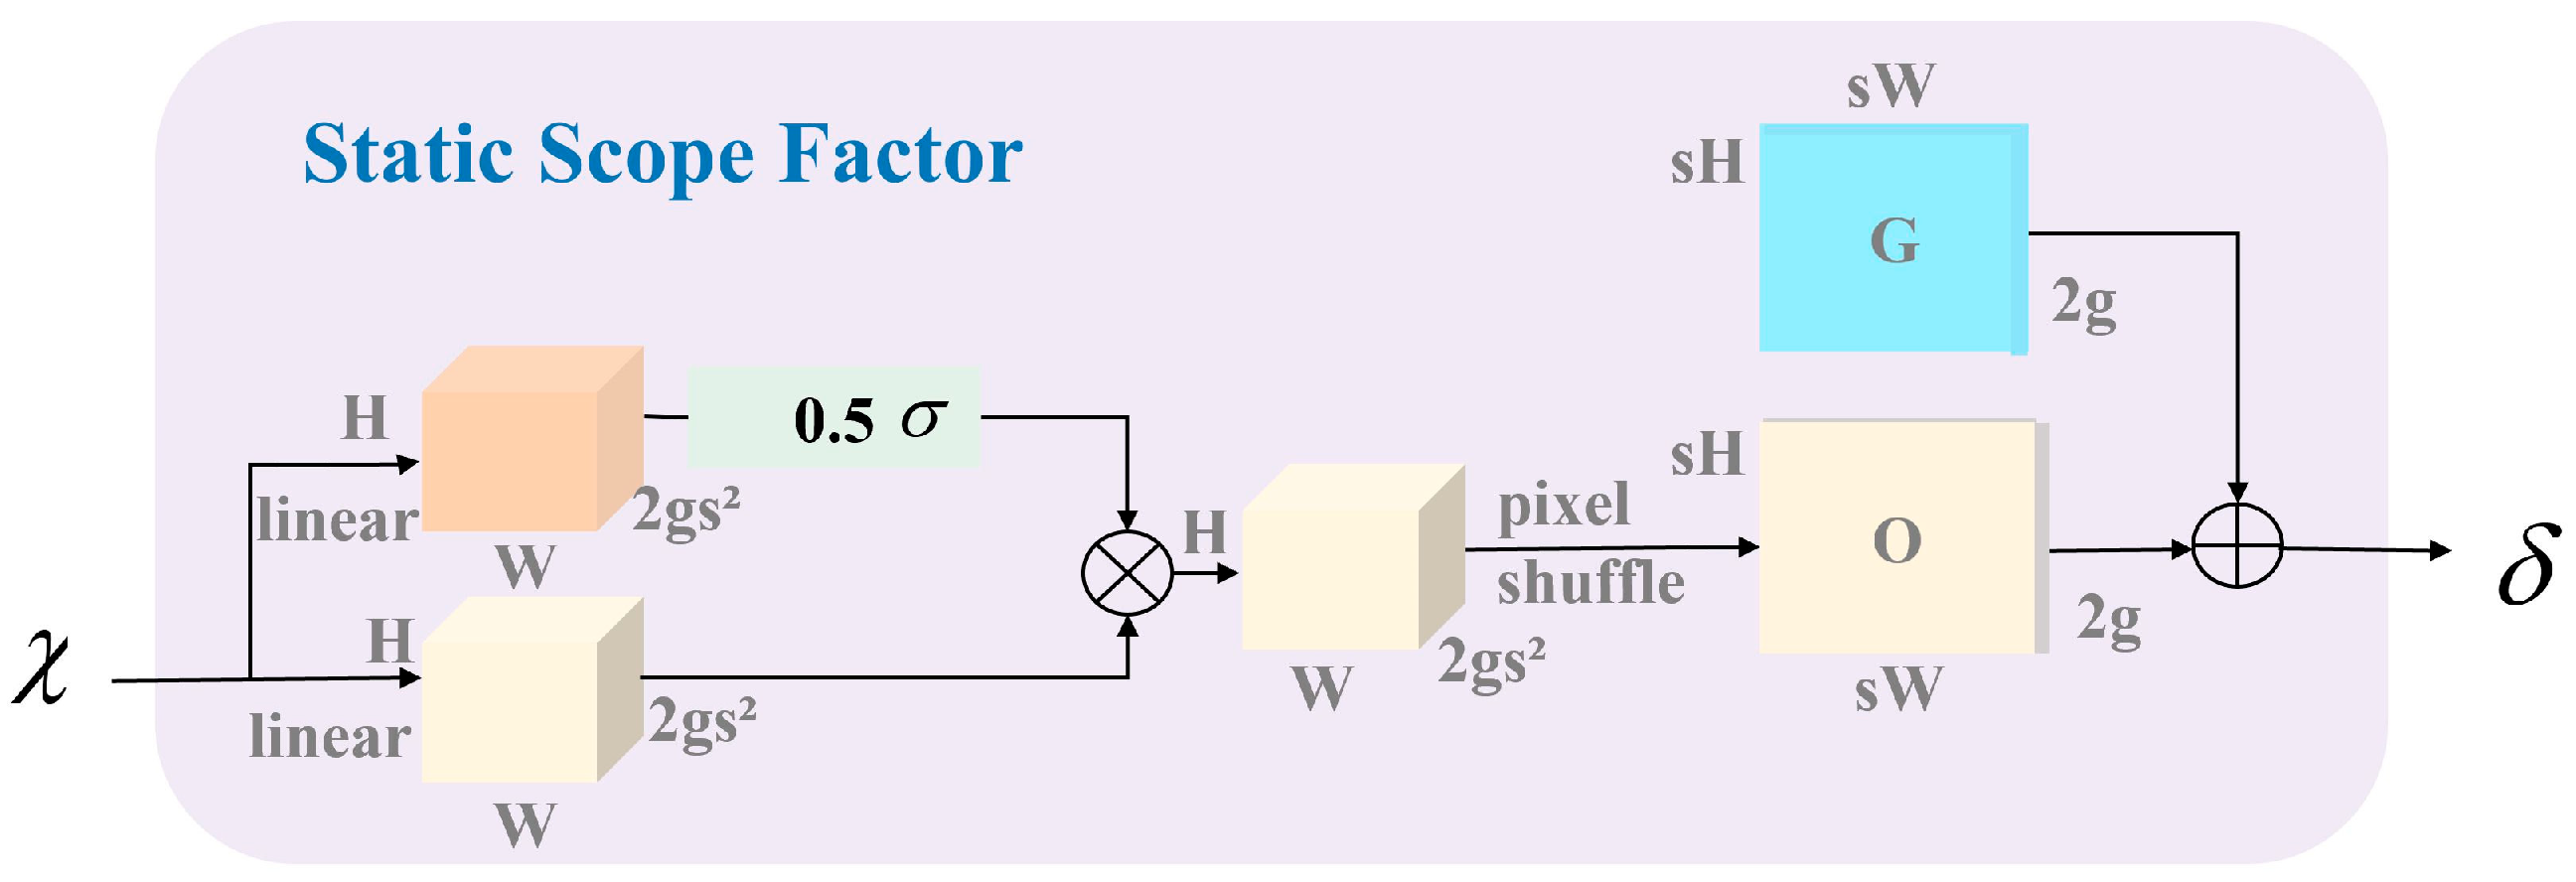
As illustrated in Figure 7, the generation process of the point-sampling set δ, which is based on the dynamic range factor, is demonstrated [24]. First, the up-sampling scale factor s and a feature map χ with a size of C × H × W are provided. Then, a linear layer with input and output channel numbers of C and 2gs2, correspondingly, is applied to generate an offset O with a size of 2gs2 × H × W, as shown in Formula (4) [25]. Then, through pixel shuffle, it is reshaped into a high-resolution original sampling grid G with a size of 2g × sH × sW. Finally, the point-sampling set δ is obtained by adding the offset O to the original sampling grid G, as shown in Formula (5) [26].
χ = grid _ sample χ , δ
O = linear χ
δ = O + G

2.2.3. Signal Suppression and Enhancement

During the process of using GPR to detect the quality of tunnel linings, it is affected by various interference factors. These factors include underground structures, embedded pipelines, engineering equipment, and other objects or structures within the tunnel, which can lead to the reflection, scattering, or absorption of radar waves, generating interference signals. Additionally, electromagnetic noise from external sources, such as mobile phones and signal receivers, can also interfere with radar signals. Specifically, when using a low-frequency radar, although it provides a greater detection depth, due to the lack of a shielding layer and poor anti-interference ability, the interference will be further increased [27]. These interference factors are intertwined and superimposed, making the background of the radar image more complex and reducing the signal-to-noise ratio, which severely affects the accuracy of the detection results of the tunnel lining quality and further increases the difficulty of lining quality assessment. An example of the interference signals is shown in Figure 8. Therefore, to facilitate automated data interpretation and enhance the accuracy of the results, it is necessary to suppress the interference signals in the GPR data.
To address this issue, this paper introduces the SCAM module, which mainly consists of three branches, as depicted in Figure 9. The first branch integrates global information using global average pooling (GAP) and global maximum pooling (GMP). The second branch employs 1 × 1 convolution to perform a linear transformation of the feature map, producing a result referred to as “value” in the figure. The third branch also uses 1 × 1 convolution to simplify “query” and “key”, denoted as “QK” in the figure. Subsequently, the first branch and the third branch are matrix-multiplied with the second branch to produce two branches, representing the cross-channel and spatial context information. Finally, the Hadamard product is applied to these two branches to generate the SCAM output. In each layer, the pixel spatial context can be represented as follows.
Q i j = P i j + α i j j = 1 N i exp ω q k P i j n = 1 N i exp ω q k P i n ω υ P i j
a i j = exp a v g P i ; max P i P i j n = 1 N i exp a v g P i ; max P i P i n
In the above formula, P i j and Q i j respectively represent the input and output of the jth pixel in the ith layer feature map. Ni indicates the total number of pixels. ωqk is a linear transformation matrix for projecting features (shaped as C × C, where C denotes the number of feature channels), while ω υ acts as a linear transformation matrix for refining projected features (also C × C, simplified via 1 × 1 convolution, tasked with adjusting scaled features after ωqk P i j to match spatial context). α i j is a dynamic attention coefficient learned during training with a range of [0, 1], and its role is to control the contribution of context information to Q i j to balance original features and enhanced context. Avg(·) and max(·) execute global average pooling (GAP) and global maximum pooling (GMP), respectively: GAP aggregates overall channel statistics, and GMP highlights the most prominent channel responses. These pooling operations guide the feature map to focus on channels with key information, enabling the SCAM (Spatial Context Aware Module) to learn the channel-dimension context. This context learning enhances the characterization of the target features related to void diseases in GPR and suppresses the background interference signals, which are often easily confused. As a result, it resolves the issue of increased difficulty in identifying void diseases due to the complex background of GPR images and effectively enhances the detection accuracy and effectiveness [28].

2.2.4. Lightweight and Real-Time Detection

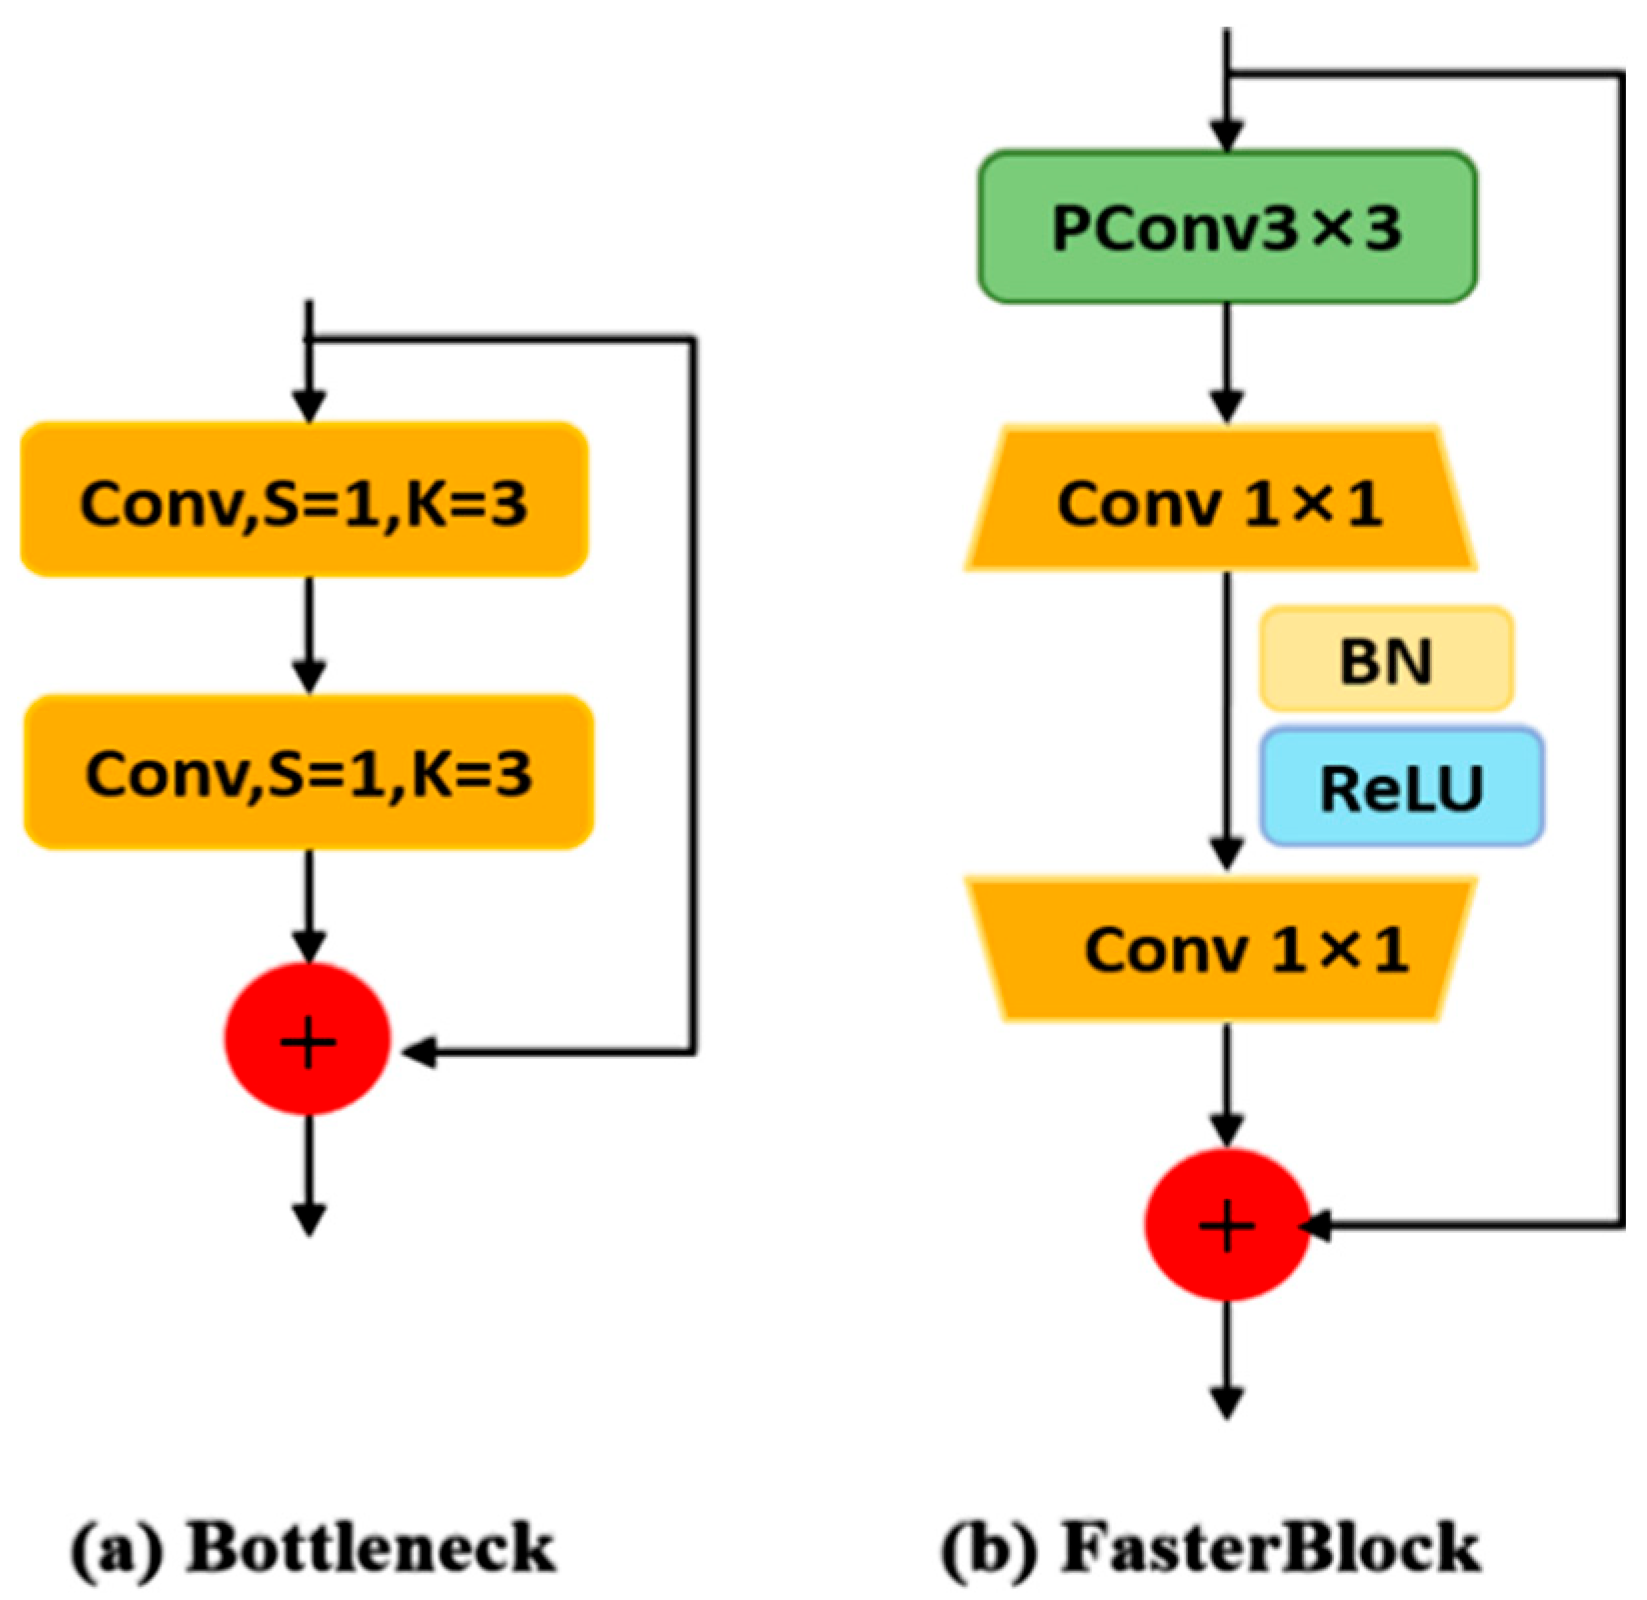
In tunnel engineering, the real-time detection of voids behind tunnel linings is of great significance for ensuring safe operation and extending the service life of tunnels. The tunnel environment is complex and variable, with extremely high requirements for detection accuracy. High accuracy requirements often result in complex models that consume significant computational resources, making it difficult to achieve lightweight deployment suitable for real-time detection at the data source. In response to this challenge, this paper improves upon the original YOLOv8 module. Based on the C2f module, the Bottleneck module is replaced with the FasterBlock to achieve model lightweighting [29]. A comparison of the structures of the two modules is shown in Figure 10. This results in the formation of a new module, denoted as the C2f-Faster, as illustrated in Figure 11. The C2f-Faster enables the model to fully integrate the information of void disease signals in different GPR images in the channel and maintain the diversity of information characteristics of void disease signals under the premise of reducing model complexity. Subsequent ablation experiments show that replacing the C2f module with the C2f-Faster module reduces the computational load, number of parameters, and size of the model weight file, all while preserving detection accuracy and improving detection efficiency.
This measure is of great significance for detecting voids behind tunnel linings. This facilitates the deployment of detection equipment near the data source, enhances the flexibility and versatility of detection, and enables real-time monitoring. It helps prevent the further deterioration of void-related issues, supports timely remediation actions, ensures the long-term stability of the tunnel structure, and ensures the safety of tunnel operation.
The architectural configuration of the FasterBlock module is presented in Figure 10b. It primarily consists of a PConv (Partial Convolution) and two Conv (Convolution) operations. The PConv differs from the conventional convolution in that it performs convolution operations on only a subset of input channels, leaving the others unchanged. This approach reduces the computational load of subsequent convolution layers and minimizes memory access requirements. This approach reduces the computational load and memory access requirements of subsequent convolution layers [30]. The two Conv convolutions serve different functions. The first Conv convolution reduces the number of feature channels, followed by normalization and activation function operations. By introducing nonlinear characteristics through the activation function, the model is endowed with the ability to learn nonlinear feature transformations, enabling it to better handle the complexity of features. The second Conv convolution is then used to adjust the number of feature channels to ensure that the input and output dimensions remain consistent so as to meet the requirements of the subsequent residual connection. This structural design significantly lightens the model while improving the accuracy of recognition and segmentation, as confirmed by ablation experiments, thus meeting the real-time detection requirements for practical engineering.

3. Experiments

3.1. Data Preprocessing and Augmentation

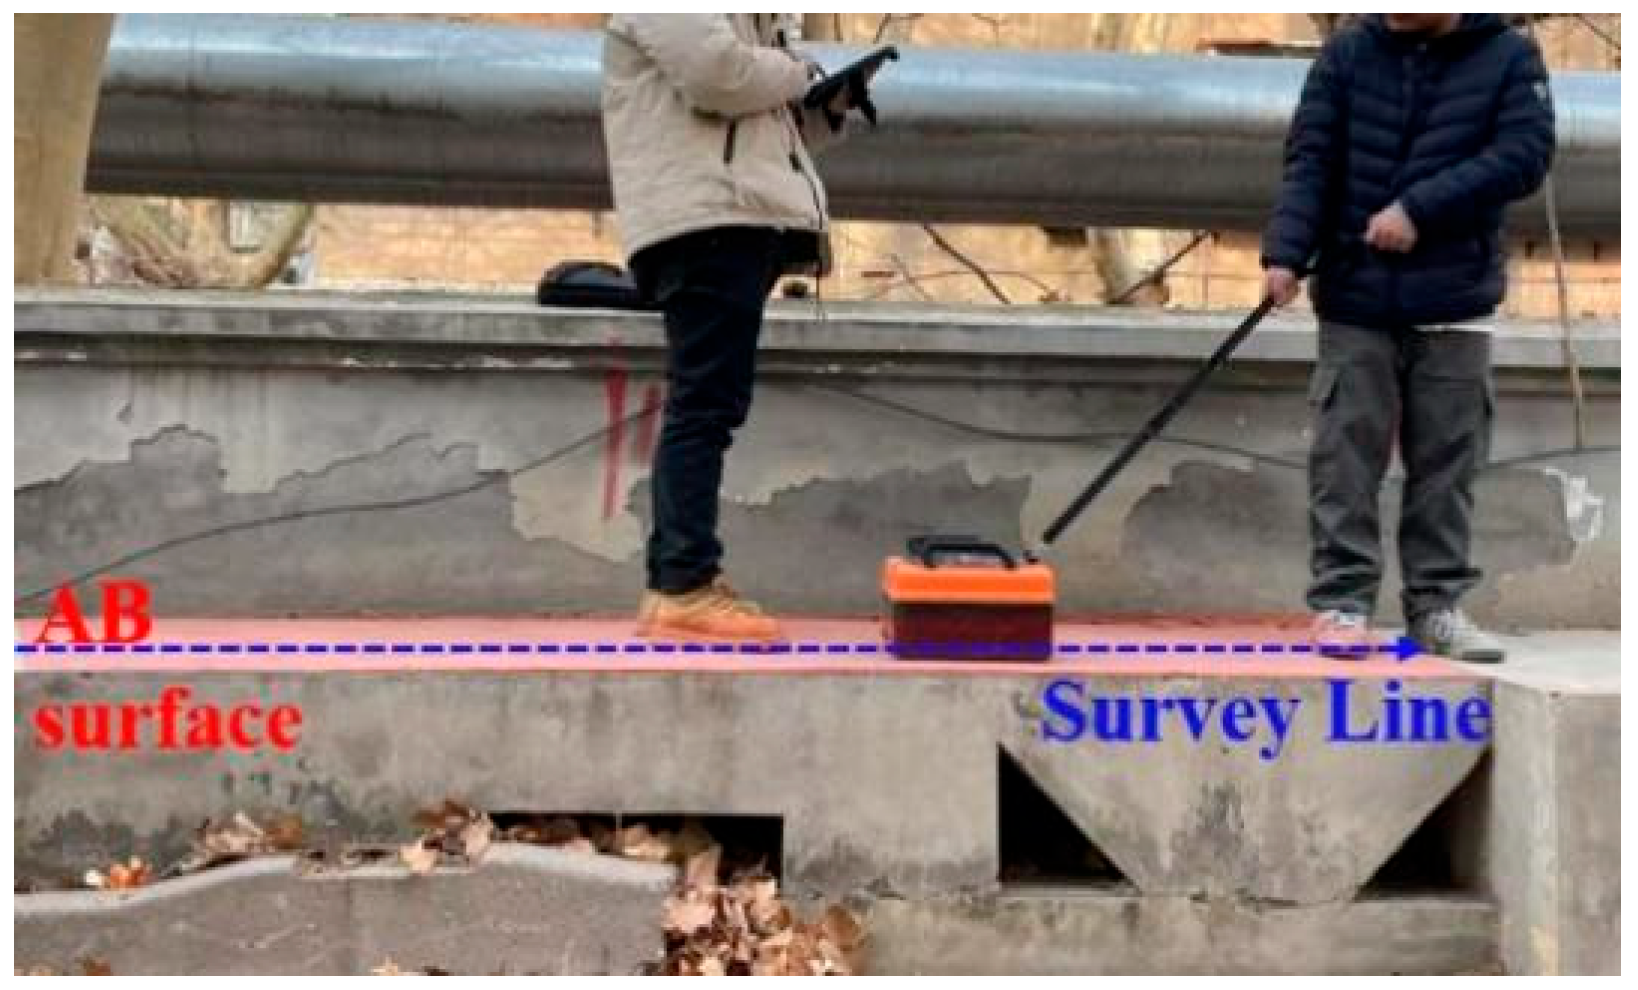
To enhance data diversity, cover a broader range of features, and provide richer data for model training—thereby improving the model’s ability to recognize voids in diverse scenarios and comprehensively verifying the algorithm’s performance under different data conditions—the GPR void disease image dataset is divided into two parts. The first part comprises GPR images of tunnel lining voids collected from the operating heavy-haul railway tunnel in the northwest of China. This heavy-haul railway adopts a composite lining structure cast with C30 concrete. Only the portal reinforcement sections are of reinforced concrete lining. The remaining tunnels are of composite concrete lining, and this lining has no steel bars. Voids predominantly occur in stress-critical areas such as the vault and shoulder of the tunnel lining, as shown in Figure 12. The second part comprises indoor model test data used to collect GPR images of void diseases. This data mixing method can better serve subsequent model training and experimental evaluation. In this model test, a model simulating the tunnel lining structure was designed, made of concrete, with a length of 12 m, a width of 1 m, and a height of 1.05 m. Inside the model, two rectangles and two triangles representing void diseases were set at intervals of 2 m. A total of 1 survey line was arranged on the upper part of the AB surface of the 1 m-wide model, and each survey line was surveyed three times back and forth to obtain data [31].
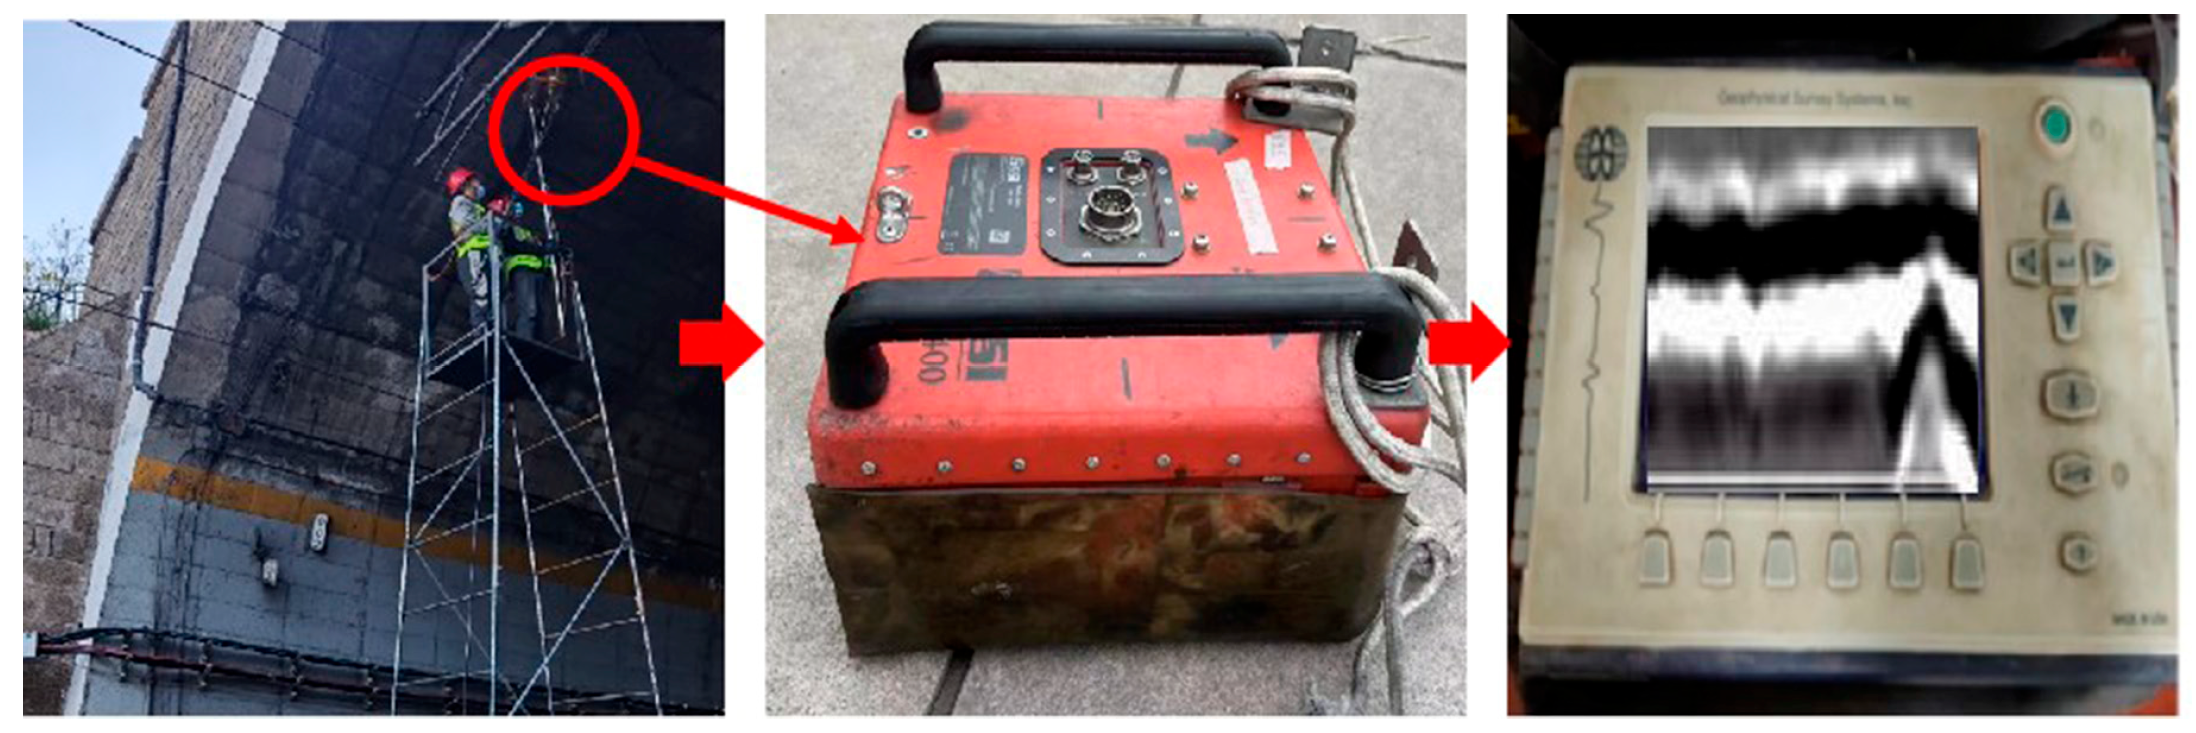
For this detection, radar images were collected using the SIR-3000 GPR device produced by GSSI. The collection process, shown in Figure 13, was used to obtain the actual GPR images. Prior to detection, the parameters of the GPR device needed to be set. The main parameters and their selections are presented in Table 2. In this study, to better highlight the internal characteristics of the tunnel lining, the selected original data were subjected to basic processing using the RADAN 7 processing software. The processing steps included time-zero correction, time gain, background filtering, and distance normalization [32,33,34,35].
The results of the void radar images collection are shown in Figure 14.
To ensure dataset quality, the labeling protocol adhered to industry standards (Code for Nondestructive Testing of Highway Tunnel Engineering, JTG/T 3512-2020 [36]) and engineering inspection reports (Inspection Report of Shijiazhuang Tiedao University Engineering Structure Testing Center, STDQJ202206002). Void defects were labeled based on the GPR signal characteristics documented in these reports.
The annotators included a master’s student in Safety Science and Engineering, whose research focuses on radar-based lining defect detection algorithms. This student contributed to developing the annotation guidelines by integrating defect features from the reports.
To enhance data diversity, enable the model to learn different morphological features, improve its generalization ability, and simultaneously simulate the changes in real scenes and enhance the model’s adaptability and robustness regarding data from different environments, this study performed data augmentation on the collected data. The augmentation methods included using flipping, brightness adjustment, and Gaussian noise adjustment [37]. The dataset was composed of 624 GPR void images of the tunnel lining on the operating heavy-haul railway tunnel and 55 GPR void disease images from the indoor model test. These 679 images were then used to construct a dataset with an 8:2 train–val split.

3.2. Experimental Environment and Training Parameters

The specific parameters for setting up the experimental environment in this study are provided in Table 3. All programming tasks in this study were carried out in the Python 3.8 environment, with PyTorch 1.10.0 and CUDA 11.3 used for deep learning model training. Model training was carried out strictly within the specified environment [38]. The training parameters of the YOLOv8 model are shown in Table 4.

3.3. Experimental Evaluation Metrics

In this study, Precision, Recall, mAP, and Frames Per Second (FPS) were chosen as the metrics for evaluating the experimental results in terms of both accuracy and real-time performance, while the GFLOPs, the number of parameters, and the size of the model weight file were used as the lightweight measurement indicators for the experimental results [39,40,41,42].
(1)
Precision (P): It represents the ratio of correctly detected voids to all detected voids and is calculated as follows.
(2)
Recall rate (R): It represents the ratio of correctly detected voids to all actual voids and is calculated as follows.
(3)
Mean average precision (mAP): mAP is a comprehensive evaluation indicator for P and R, representing the average of the mean precisions across all target categories. Since this study only involves one category (voids), mAP is simplified to a single average precision (AP) and is calculated as follows.
Precision = TP T P + F P
where TP (True Positives) denotes the number of actual voids correctly detected (true positive predictions), and FP (False Positives) denotes the number of non-voids incorrectly detected as voids (false positive predictions).
Recall = T P T P + F N
where FN (False Negatives) denotes the number of actual voids missed by detection (false negative predictions).
A P = r = 0 1 P r   dr
where P(r) represents the precision–recall curve (precision as a function of recall r); the integral calculates the area under this curve to measure the average precision of a single category.
m A P = 1 K i = 1 K A P i
where K is the number of target categories (in this study, K = 1 for voids only); APi is the Average Precision of the i-th category.
(4)
The GFLOPs and Parameters are used to measure the lightweight level of the model, and their calculation formulas are as follows.
G F L O P s = W × H × K × K × C i n × C o u t
P arameters = C in × C out × K × K
where W and H are the width and height of input feature maps; K is the size of the convolutional kernel; Cin is the number of input channels; and Cout is the number of output channels.

4. Results and Discussions

4.1. Ablation Experiment

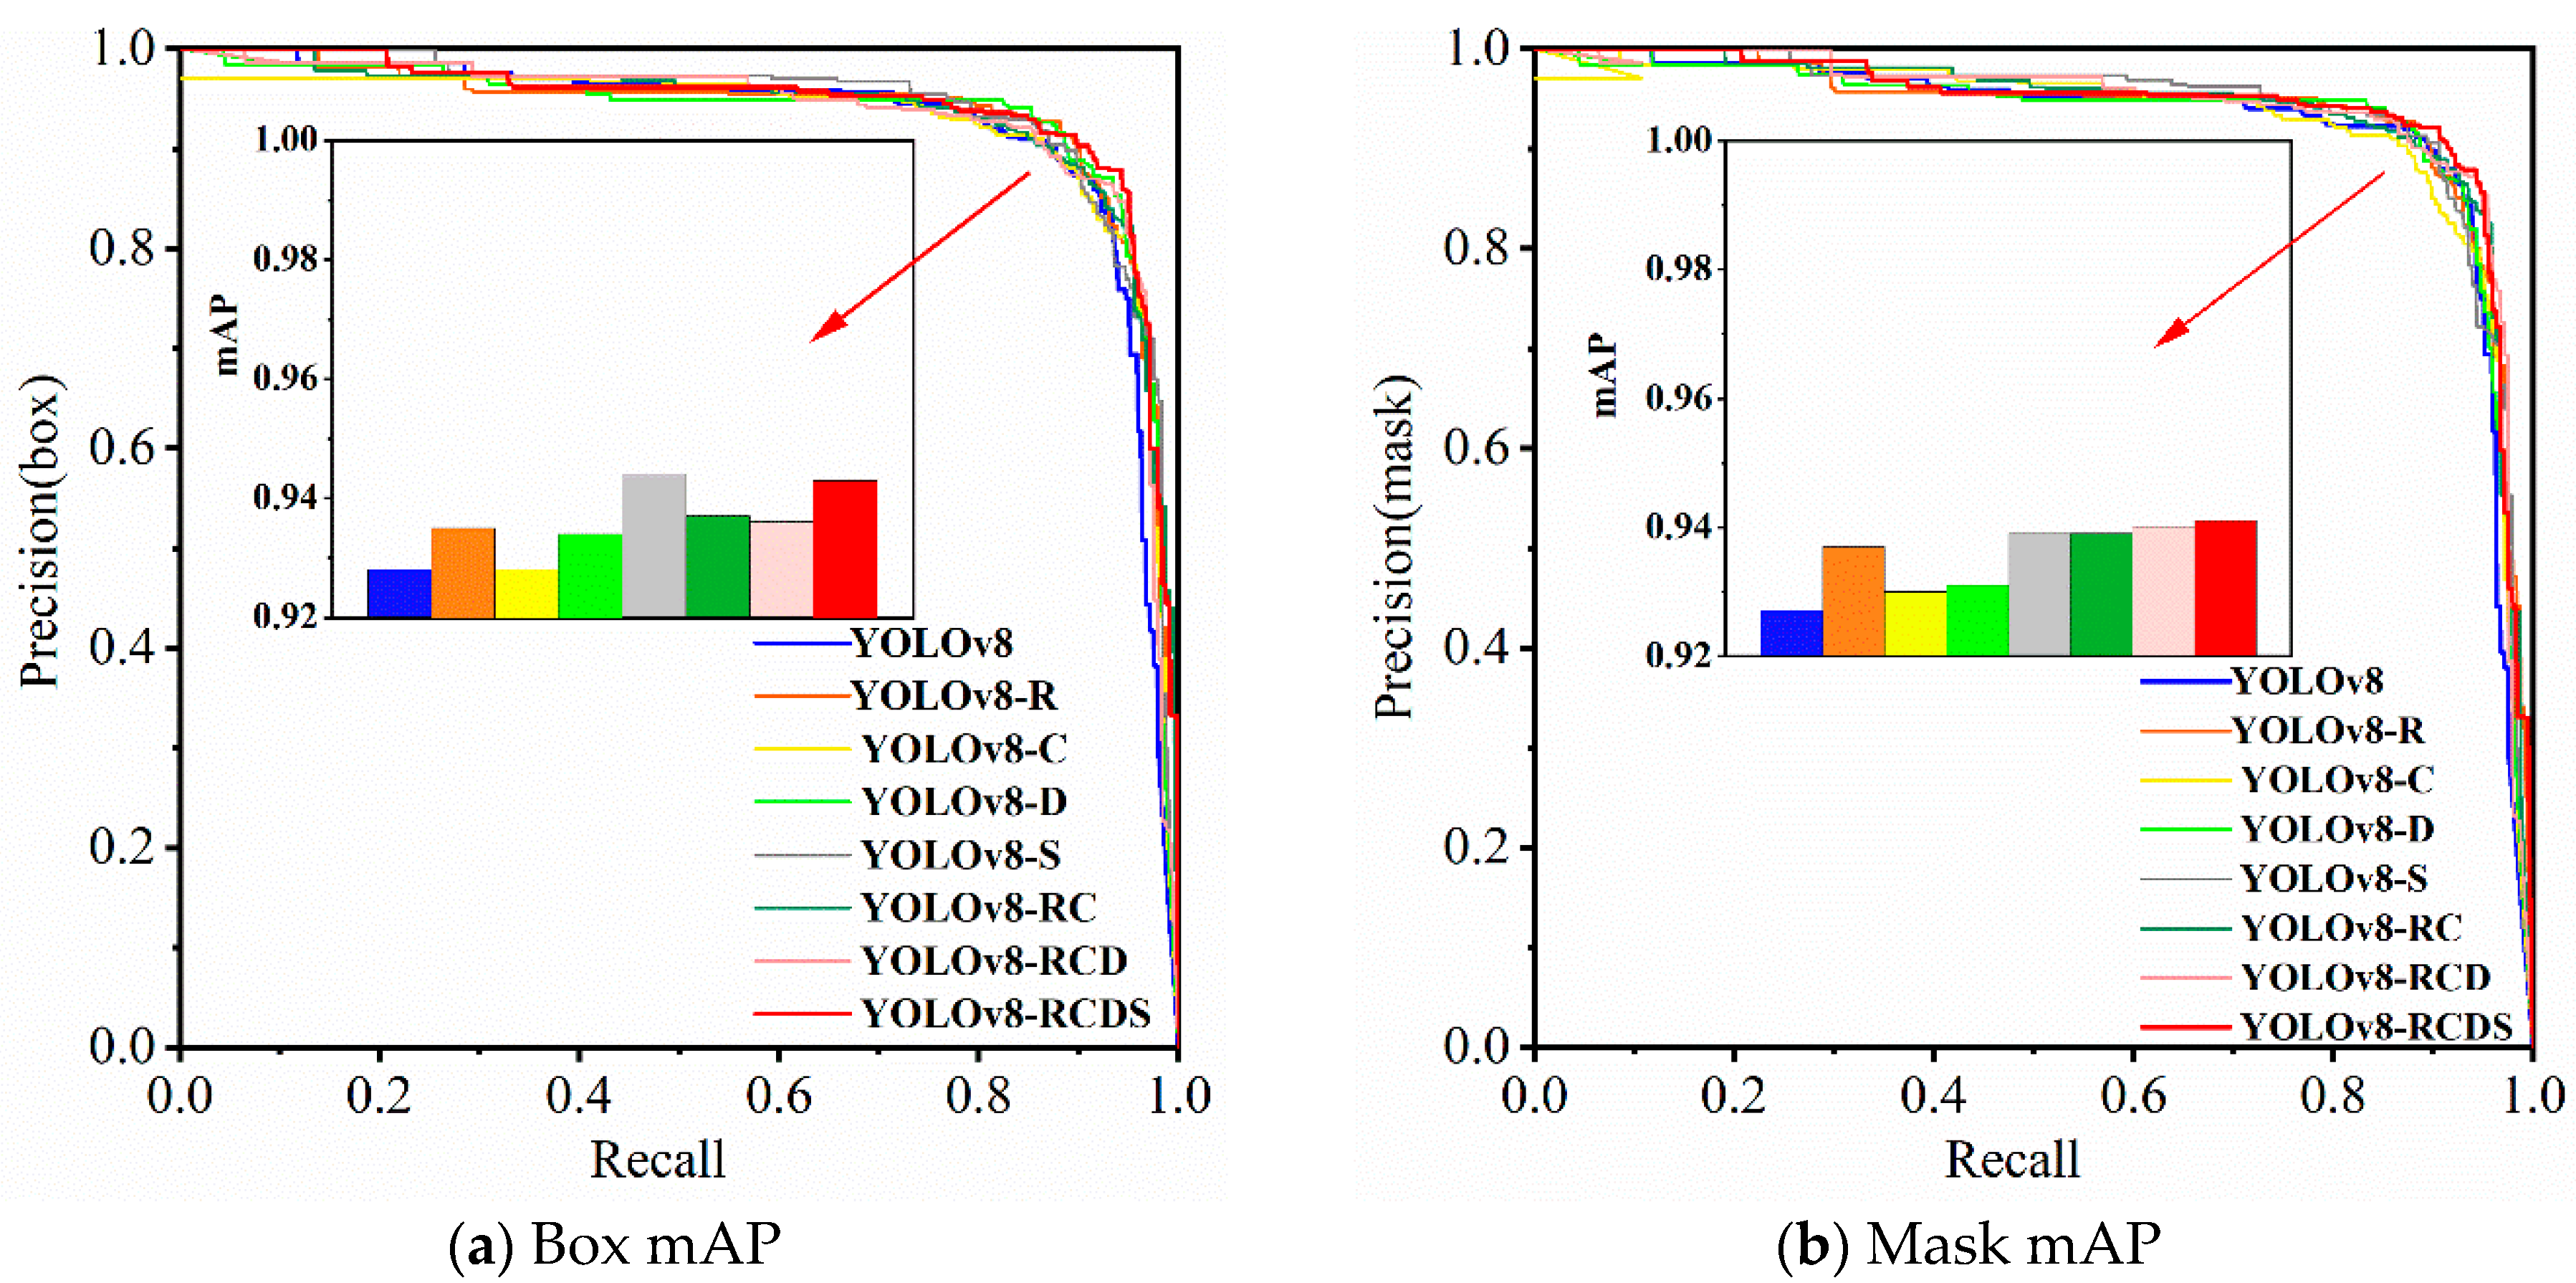
To evaluate the effectiveness of the proposed improvements in the algorithm, eight sets of ablation experiments were designed, as illustrated in Figure 15 and Table 5. Specifically, YOLOv8-R refers to replacing the Conv module in the backbone network of the YOLOv8 model with the RepVGGBlock module. YOLOv8-C denotes replacing all the C2f modules in the YOLOv8 structure with the C2f- Faster module. YOLOv8-D refers to replacing all the upsampling in the neck network part of the YOLOv8 with the more lightweight DySample module [43]. YOLOv8-S represents adding the SCAM module on the basis of the original network. YOLOv8-RC means using both the RepVGGBlock module and the C2f-Faster module simultaneously. YOLOv8-RCD represents using the DySample module on the basis of YOLOv8-RC. YOLOv8-RCDS means adding three layers of the SCAM module on the basis of YOLOv8-RCD. YOLOv8-RCDS represents the algorithm proposed in this paper [44].
The mAP comparison results from the ablation experiments for each module are presented in Figure 15. In the figure, the abscissa represents R, the ordinate represents P, and the area enclosed by the curve and the abscissa and ordinate is the detection accuracy (mAP), with the corresponding values recorded in Table 5. Usually, the further the curve nears the upper-right corner, the stronger the algorithm’s performance proves to be. As shown in Figure 15 and Table 5, compared to the baseline YOLOv8, the addition of the RepVGGBlock slightly increases the GFLOPs, the number of parameters, and the size of the model weight, resulting in a decrease in the model’s FPS, but the mAPs for recognition and segmentation are increased by 0.75% and 1.08% respectively, indicating that its unique multi-branch structure enhances the recognition and segmentation of multi-scale targets. With the addition of the DySample module alone, while the GFLOPs, the number of parameters, and the size of the weight file remain almost unchanged, the recognition and segmentation accuracies are both improved, with increases of 0.65% and 0.43%, respectively. This indicates that the DySample module effectively prevents the blurring and loss of edge and detail information of the target while also contributing to making the model lightweight. The addition of the SCAM module increases the mAP for recognition and segmentation by 1.72% and 1.29%, respectively, effectively enhancing the representation of the target features of GPR void diseases and suppressing the easily confused background filled with interference signals. The addition of the FasterBlock improves the accuracy and greatly reduces the GFLOPs, the number of parameters, and the size of the model weight file by 14.88%, 21.61%, and 21.54%, respectively, and additionally, it leads to an increase in FPS, indicating that this module has a structure that can make the model lightweight and improve the performance of the model to a certain extent. The YOLOv8-RCDS, composed of all the above modules, achieves a reduction of 11.57% in GFLOPs, a reduction of 14.55% in parameters, and a decrease of 13.85% in the size of the weight file. Simultaneously, the mAP for the dual tasks reaches 94.1% and 94.4%, with increases of 1.62% and 1.51%, respectively. Although the detection speed metric of this algorithm is slightly inferior to that of the original model, it improves detection accuracy while reducing algorithmic complexity and almost maintains a balance with the speed of the original model. From a comprehensive perspective, this algorithm is more suitable for industrial real-time detection.
It should be noted that this ablation experiment was conducted on a dataset of 679 images (with the training set and val set split at an 8:2 ratio). This data scale is relatively small for deep learning-based object detection tasks, and such a scale inherently carries potential overfitting risks.
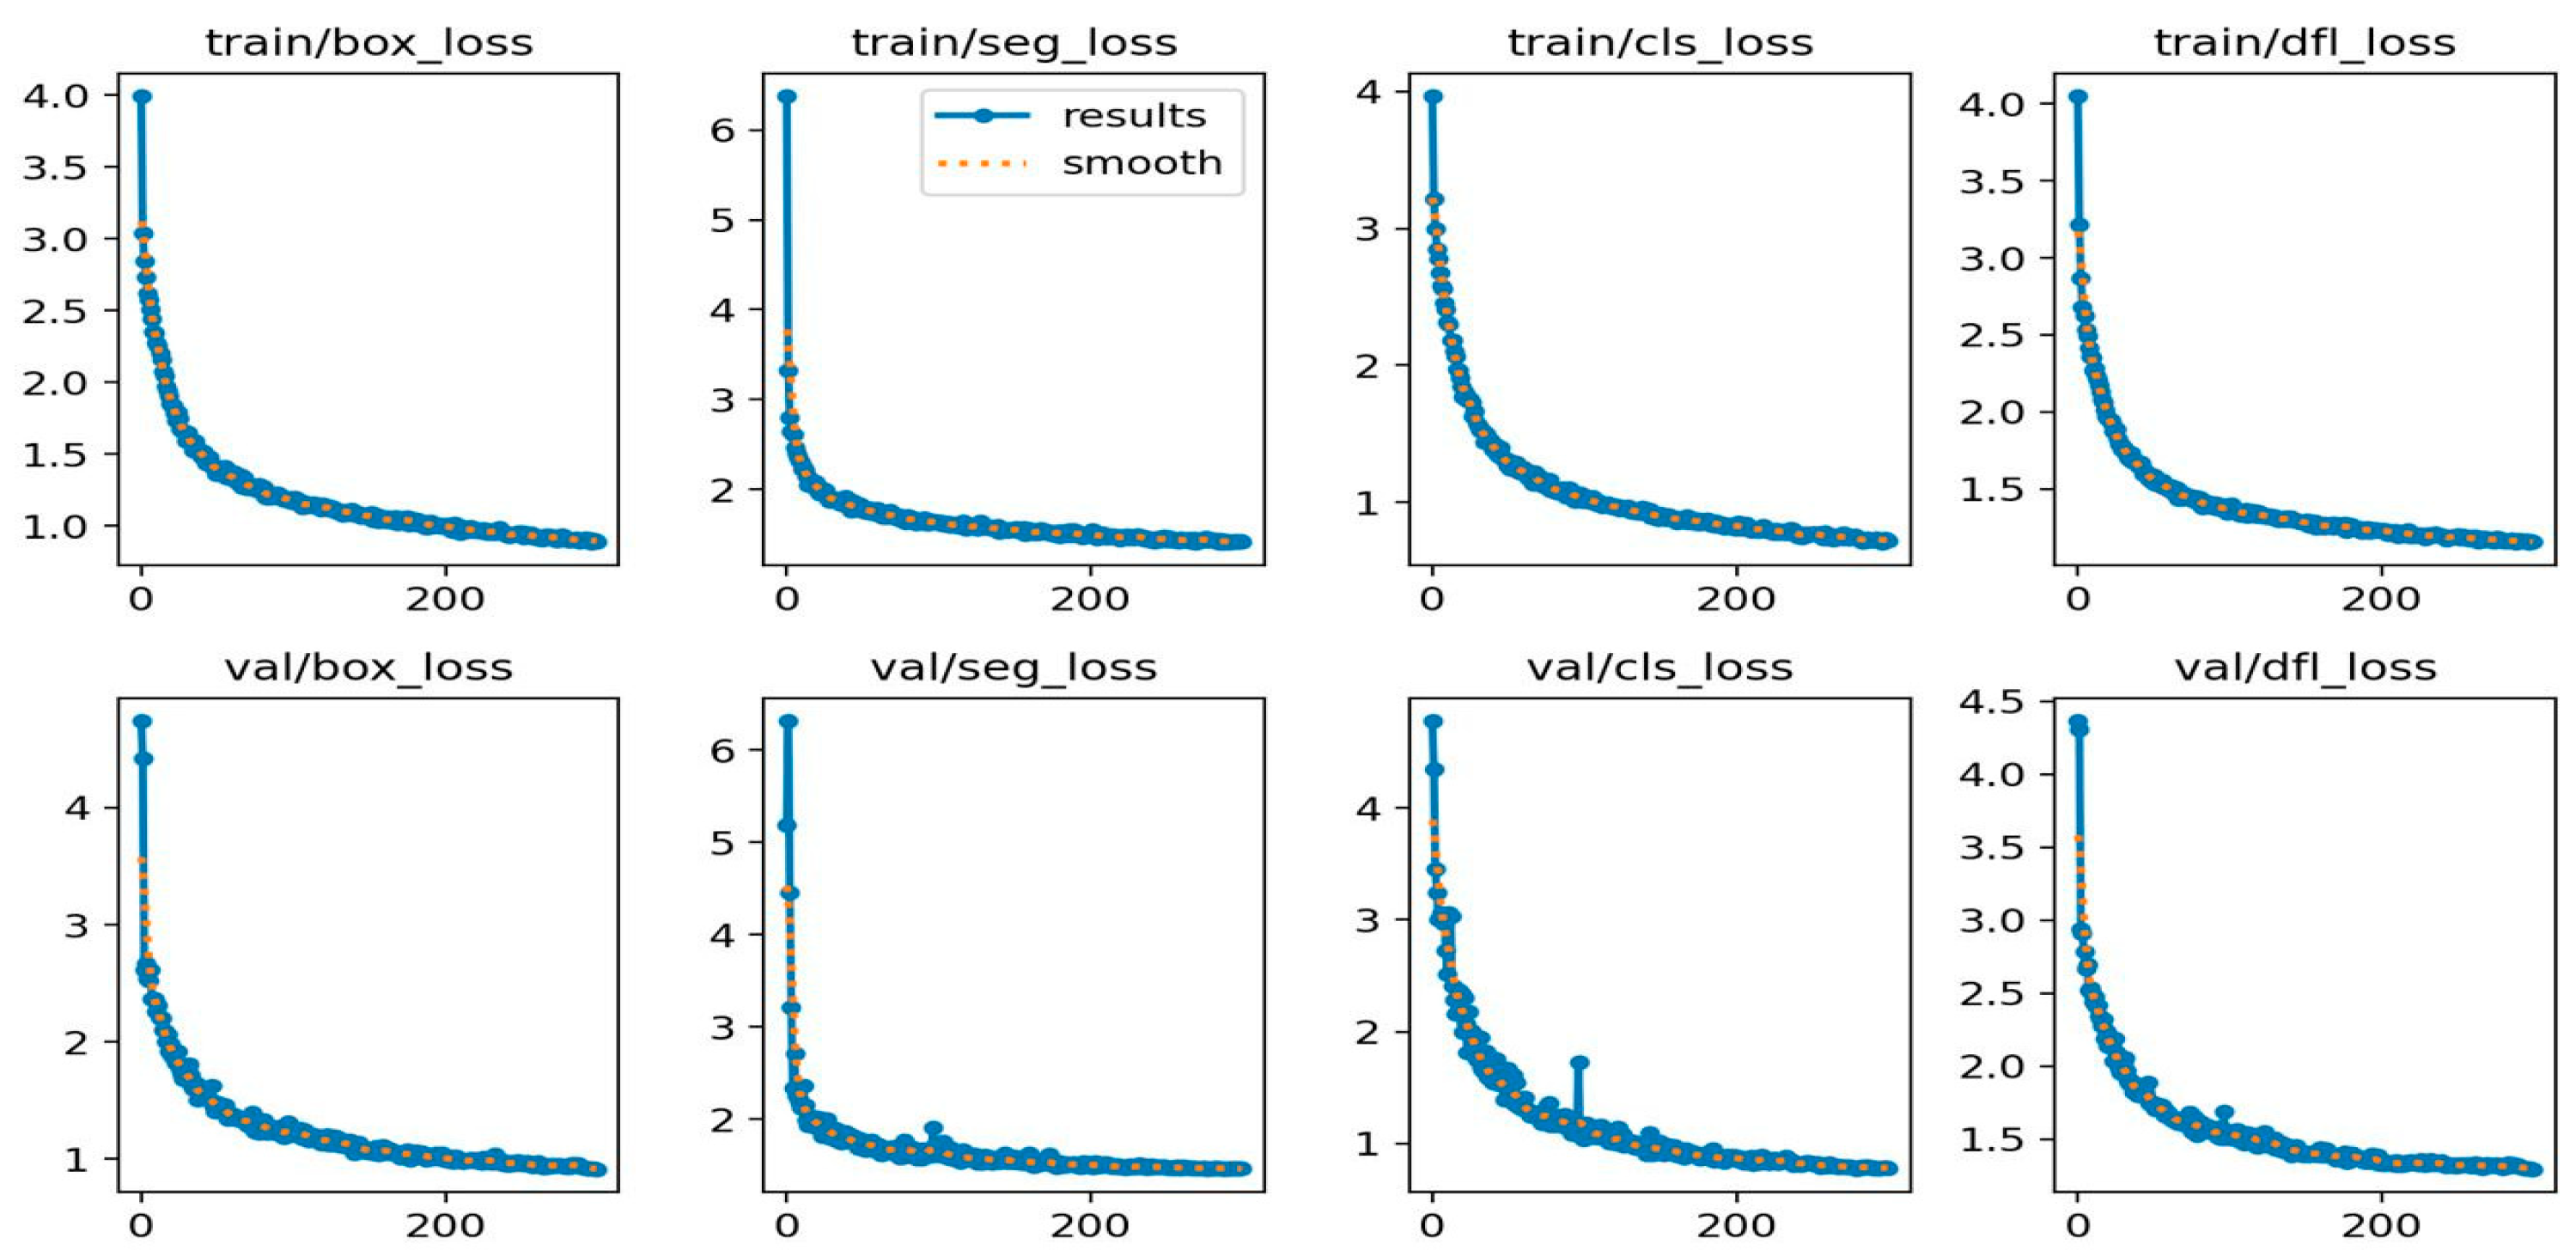
From the training and validation loss curves shown in Figure 16, both the training set losses (including train/box_loss and train/seg_loss) and the validation set losses (including val/box_loss and val/seg_loss) exhibit a steady downward trend and achieve consistent convergence. Notably, there is no sign of the typical overfitting characteristic, where training loss continues to decline while validation loss begins to rise. This outcome confirms that even with the limited dataset scale, the data augmentation techniques implemented in the preprocessing stage have effectively alleviated the risk of overfitting, ensuring the model can capture generalizable features of tunnel lining voids.
Nevertheless, the small dataset scale still limits the model’s adaptability to void scenarios, and this issue will be addressed by expanding dataset diversity in future research.

4.2. Comparative Experiment

To further verify the rationality and effectiveness of the proposed method, on the premise of keeping all parameter indicators unchanged [45], comparison experiments were conducted with the current mainstream object detection algorithms such as YOLOV5-P6, YOLOv6, and YOLOv8, as well as with the lightweight method that replace the backbone network of YOLOv8, namely, ShuffleNet-YOLOv8, Efficientnet-YOLOv8, and ConvNeXt-YOLOv8. The experimental comparison results are presented in Table 6. Compared to the current mainstream algorithms, although YOLOv6 and YOLOv8 are slightly superior in FPS detection speed, in the recognition task, YOLOv5-P6, YOLOv6, and YOLOv8 show reductions of 1.70%, 1.27%, and 1.59%, respectively, compared to YOLOv8-RCDS. In the segmentation task, these reductions are 0.96%, 1.59%, and 1.49%, respectively. Their GFLOPs are, respectively, 4.67%, 42.99%, and 13.08% lower than those of YOLOv8-RCDS, and their Parameters are, respectively, 59.65%, 58.06%, and 17.03% lower than those of YOLOv8-RCDS. The sizes of their weight files are, respectively, 57.14%, 53.57%, and 16.07% lower than those of YOLOv8-RCDS. Compared with the lightweight algorithms that replace the backbone network of YOLOv8, although ShuffleNet-YOLOv8, EfficientNet-YOLOv8, and ConvNeXt-YOLOv8 outperform the proposed algorithm in computational efficiency metrics—including lower GFLOPs, fewer parameters, smaller weight file sizes, and higher FPS detection speeds—their recognition and segmentation accuracies are both lower than those of our algorithm.
The superior performance of YOLOv8-RCDS stems from its four targeted module improvements, which address the core challenges of Ground-Penetrating Radar (GPR)-based tunnel lining void detection that mainstream algorithms and lightweight algorithms have failed to fully resolve:
(1)
Image feature extraction (Role of the RepVGGBlock Module):
Unlike the single-branch backbone networks of YOLOv5-P6, YOLOv6, and YOLOv8, YOLOv8-RCDS integrates the RepVGGBlock module, which fuses multi-branch convolutional information through reparameterization. This design enhances the model’s ability to capture subtle features of voids with diverse morphologies, effectively making up for the deficiency that mainstream algorithms’ single-branch structures cannot fully extract multi-scale, multi-semantic void features. This is the key reason why YOLOv8-RCDS outperforms YOLOv5-P6, YOLOv6, and YOLOv8 in recognition accuracy by 1.70%, 1.27%, and 1.59%, respectively.
(2)
Image detail enhancement (Role of the DySample Module):
Mainstream algorithms rely on traditional upsampling methods such as bilinear interpolation, which ignore semantic information and exacerbate the blurring of void boundaries caused by electromagnetic wave attenuation or diffraction. YOLOv8-RCDS introduces the DySample module, which generates dynamic sampling sets based on feature semantics to achieve the adaptive restoration of high-resolution details. This also explains why its Mask-mAP is 0.96% to 1.59% higher than that of YOLOv5-P6, YOLOv6, and YOLOv8, a factor that is crucial for delineating blurred void boundaries in GPR images with weak echo signals.
(3)
Signal suppression and enhancement (Role of the SCAM Module):
GPR images are often interfered with by pipeline reflections, electromagnetic noise, and other factors, which easily lead to confusion between void signals and background clutter. This is a problem that lightweight algorithms such as ShuffleNet-YOLOv8, EfficientNet-YOLOv8, and ConvNeXt-YOLOv8 fail to address, as they only focus on backbone lightweighting and lack interference suppression mechanisms. YOLOv8-RCDS adopts the SCAM module, which integrates global average pooling, global maximum pooling, and cross-channel attention to highlight void-related signals while suppressing interference. Thanks to this advantage, YOLOv8-RCDS can maintain stable accuracy even in complex backgrounds, while lightweight algorithms’ accuracy is significantly lower due to interference.
(4)
Lightweight and real-time detection (Role of the C2f-Faster Module):
Lightweight algorithms achieve improved efficiency by replacing the backbone network, but at the cost of accuracy. For example, ShuffleNet-YOLOv8 reduces GFLOPs and parameters but has recognition and segmentation accuracies much lower than those of YOLOv8-RCDS. In contrast, YOLOv8-RCDS improves the C2f module by introducing the FasterBlock; through Partial Convolution, which only convolves a subset of input channels and rational channel adjustment, it reduces computational complexity without losing feature diversity. As shown in Table 6, the GFLOPs of YOLOv8-RCDS (10.7) are lower than those of YOLOv6 (15.3), its FPS (114.70) is comparable to that of YOLOv8 (116.82), and its accuracy is superior to that of all lightweight methods, successfully achieving a balance between real-time detection and engineering reliability that lightweight algorithms cannot reach.
In conclusion, it can be seen that compared with the current mainstream object detection algorithms and the lightweight method after improving the backbone network, the YOLOv8-RCDS algorithm has more excellent recognition and segmentation performance for detecting the void disease images of GPR linings and can better meet the requirements of real-time detection.

5. Conclusions

Void detection of tunnel linings is a critical component of tunnel health monitoring, playing a key role in ensuring the safe operation of tunnels and extending their service life. This paper presents an intelligent recognition method for tunnel lining voids with a clear solution methodology: centered on an improved YOLOv8 architecture, we design a modular collaborative framework by sequentially integrating functional modules based on tunnel lining void detection pain points—first using RepVGGBlock to enhance multi-scale feature extraction and then combining C2f-Faster to optimize lightweight feature fusion, replacing native Upsample with DySample to preserve edge details, and finally incorporating SCAM to suppress background interference. The proposed model first fuses RepVGGBlock and C2f-Faster into the YOLOv8-RC structure and then upgrades the neck network with DySample and adds SCAM for feature refinement. This improved YOLOv8-based method is capable of effectively detecting voids behind tunnel linings. The main conclusions of this study are as follows.
(1)
The introduction of the RepVGGBlock, DySample, and SCAM modules precisely addresses core challenges in tunnel lining void detection. These challenges include the poor recognition accuracy caused by varying sizes of voids, complex underground media properties, and electromagnetic signal distortion. By leveraging RepVGGBlock, DySample, and SCAM to address these core challenges, the model’s recognition and segmentation accuracy for void diseases has been significantly improved.
(2)
By integrating the FasterNet-Block to construct the C2f-Faster module, the novelty of this study is highlighted: unlike existing methods that sacrifice either precision for lightweight or efficiency for accuracy, C2f-Faster achieves dual optimization. It breaks the traditional “precision–efficiency trade-off” dilemma, lays a foundation for the model’s edge deployment, and enables the model to be lightweight while improving detection efficiency.
(3)
The intelligent recognition algorithm for tunnel lining voids based on the improved YOLOv8 proposed in this paper achieves lightweighting while improving the accuracy, realizing a balance between the two. Specifically, compared with the baseline YOLOv8, it reduces GFLOPs by 11.57%, parameters by 14.55%, and weight sizes by 13.85% while increasing recognition and segmentation mAP by 1.62% and 1.51%, respectively. This balance enables the model to be deployed on near-data-source detection equipment, meeting the demand for the real-time detection of tunnel lining void diseases.
Although this paper has successfully proposed an intelligent recognition method for tunnel lining voids based on the improved YOLOv8, several limitations remain. The model was trained exclusively on a single dataset sourced from a specific heavy-haul railway and indoor environments, resulting in limited diversity in radar reflection and noise patterns. Additionally, the relatively small data volume may not adequately cover all void segmentation scenarios, affecting the model’s adaptability across different measurement environments. This limitation is further amplified by the inherent constraints of Ground-Penetrating Radar (GPR) technology, the core detection tool in this study, when identifying voids in complex tunnel environments. GPR works by emitting high-frequency electromagnetic waves and analyzing reflected signals to infer the spatial position and shape of underground media. However, key factors in tunnel scenarios directly disrupt this working mechanism, which not only restricts GPR’s detection performance but also limits the current model’s applicability.
Specifically, water accumulation in or around voids has a significantly higher relative permittivity compared to concrete and air. This large difference in permittivity leads to intense electromagnetic wave reflections at water–concrete or water–air interfaces. These intense reflections overlap with the weak reflection signals inherently generated by voids, and this signal superposition blurs the boundary between voids and the background in GPR images. This is a key issue that the current model, which was trained on relatively single-scenario data, cannot fully address.
Moreover, other tunnel-specific factors mentioned in our research plan, such as steel bars in portal reinforcement sections and the insufficient compaction of surrounding rock, exacerbate these GPR-related limitations. As highly conductive media, steel bars produce strong shielding effects on GPR electromagnetic waves, completely blocking signals from reaching voids beneath them. Meanwhile, insufficient compaction results in heterogeneous underground media, which scatters radar waves and reduces the signal-to-noise ratio of void-related signals. Together, these factors mean GPR alone struggles to reliably capture clear void features in real-world tunnel environments, and this creates inherent challenges for subsequent algorithm-based recognition.
For future work, we will collect data from various underground settings to enrich radar signal diversity and improve the model with real-world data. Considering tunnel structures often have steel bars and defects like water accumulation and poor compaction, it is vital to include these factors. We will also optimize the algorithm to unify feature representation and boost the model’s capability to handle uneven signals for multi-tunnel-disease recognition.

Author Contributions

Conceptualization, F.X. and Y.W.; Methodology, F.X.; Investigation, F.X. and Y.W.; Validation, F.X.; Formal analysis, F.X.; Resources, Y.W.; Data Curation, Y.W.; Writing—original draft, F.X. and Y.W.; Writing—review and editing, F.X., L.Z., H.Z., Y.H. and Y.L.; Funding acquisition, F.X.; Supervision, L.Z., H.Z., Y.H. and Y.L. All authors have read and agreed to the published version of the manuscript.

Funding

This work was supported by the National Natural Science Foundation of China (No. 52478407, No. 52427813), the Hebei Provincial Natural Science Foundation of China (No. E2023210113), the Science and Technology Research and Development Platform Special Project of Hebei Province (No. 25365407D), the S&T Program of Hebei (No. 254Z5402G, No. 232A7601Z), the Class A Key Project of China Railway Design Group (No. 2023A0103601), and the Key Research and Development Plan of Yunnan Provincial Science and Technology Department (No. 202303AA080005).

Data Availability Statement

The datasets generated and/or analyzed during this study cannot be publicly disclosed. This is because they are related to an ongoing project, and disclosure may have implications for the project’s integrity and associated interests. However, upon reasonable request, these datasets can be provided by the corresponding author.

Conflicts of Interest

Author Hemin Zheng is employed by the China Railway Design Group Co., Ltd. Author Yonghai He is employed by the Hebei Transportation Investment Group Co., Ltd. The remaining authors declare that the research was conducted in the absence of any commercial or financial relationships that could be construed as a potential conflict of interest.

References

  1. Yang, H.; Wang, Z.; Chen, X.; Lin, Z.; Li, Q. A test on fire-induced damage of concrete with multiple parameters analysis—Based on tunnel linings of China. Structures 2024, 70, 107664. [Google Scholar] [CrossRef]
  2. Gong, J.F.; Wang, W.; Wang, F.; Yang, C.X.; Yuan, Y. Statistics of China’s railway tunnels by the end of 2023 and introduction of tunnels of newly opened key projects in 2023. Tunnel Constr. 2024, 44, 377–392. [Google Scholar]
  3. Zhang, J.Q. Intelligent Identification and Accurate Positioning of Hidden Disease Morphology in Tunnels Based on Ground Penetrating Radar. Master’s Thesis, Shandong University, Jinan, China, 2023. [Google Scholar]
  4. Liu, H.; Wang, S.; Jing, G.; Yu, Z.; Yang, J.; Zhang, Y.; Guo, Y. Combined CNN and RNN neural networks for GPR detection of railway subgrade diseases. Sensors 2023, 23, 5383. [Google Scholar] [CrossRef] [PubMed]
  5. Liu, P.; Ding, Z.; Zhang, W.; Ren, Z.; Yang, X. Using ground-penetrating radar and deep learning to rapidly detect voids and rebar defects in linings. Sustainability 2023, 15, 11855. [Google Scholar] [CrossRef]
  6. Li, H.; Li, N.; Wu, R.; Wang, H.; Gui, Z.; Song, D. GPR-RCNN: An algorithm of subsurface defect detection for airport runway based on GPR. IEEE Robot. Autom. Lett. 2021, 6, 3001–3008. [Google Scholar] [CrossRef]
  7. Zhao, L.; Xu, Q.; Song, Z.; Meng, S.; Liu, S. Dynamic wave tunnel lining GPR images multi-disease detection method based on deep learning. NDT & E Int. 2024, 144, 103087. [Google Scholar] [CrossRef]
  8. Luo, T.X.; Zhou, Y.; Zheng, Q.; Hou, F.; Lin, C. Lightweight deep learning model for identifying tunnel lining defects based on GPR data. Autom. Constr. 2024, 165, 105506. [Google Scholar] [CrossRef]
  9. Li, N.; Zhang, W.; Liu, Z.; Liu, K.; Wang, J.; Zhang, F. PDSE-YOLOv8: A lightweight detection method for internal defects in asphalt roads. Signal Image Video Process. 2024, 18, 8925–8936. [Google Scholar] [CrossRef]
  10. Wang, F.S.; Wang, W.; Sun, X.H.; Wang, C.; Yuan, W.Z. Sheep Instance Segmentation Method Based on Improved YOLOv8n-seg. Trans. Chin. Soc. Agric. Mach. 2024, 55, 322–332. [Google Scholar]
  11. Xiang, Y.H. Study on the Influence of Tunnel Vault Lining Hollowing and Underthickness on Structural Safety. Master’s Thesis, Chongqing Jiaotong University, Chongqing, China, 2023. [Google Scholar]
  12. Tang, C.; Dong, H.; Huang, Y.; Han, T.; Fang, M.; Fu, J. Foreign object detection for transmission lines based on swin transformer V2 and YOLOX. Visual Comput. 2024, 40, 3003–3021. [Google Scholar] [CrossRef]
  13. Song, F.; Li, P. YOLOv5-MS: Real-time multi-surveillance pedestrian target detection model for smart cities. Biomimetics 2023, 8, 480. [Google Scholar] [CrossRef]
  14. Ding, X.; Zhang, X.; Ma, N.; Han, J.; Ding, G.; Sun, J. RepVGG: Making VGG-style ConvNets great again 2021. arXiv 2021, arXiv:2101.03697. [Google Scholar]
  15. Yang, Z.; Wang, D.; Li, R.; Wang, Y.; Ma, G.; Ma, B. Optimization of traffic participant detection algorithm in intelligent roadside scene. In Proceedings of the SAE 2022 Intelligent and Connected Vehicles Symposium, Aachen, Germany, 4–9 June 2022. [Google Scholar]
  16. Fang, Y.J. Design and Implementation of Intelligent Cockpit Interaction System for Intelligent Connected Vehicles. Master’s Thesis, Hangzhou Dianzi University, Hangzhou, China, 2024. [Google Scholar]
  17. Ma, Y.F. Typical disease identification, detection and application of 3D ground penetrating radar. China Highw. 2022, 625, 90–91. [Google Scholar]
  18. Zhang, Y.M.; Bao, F.; Tong, Z.; Ma, T.; Zhang, W.G.; Fan, J.W.; Huang, X.M. Radar wave response of slab bottom voids in heterogeneous airport concrete pavement. J. Southeast Univ. (Nat. Sci. Edit.) 2023, 53, 137–148. [Google Scholar]
  19. Xu, L. Research on Ground Penetrating Radar Road Detection Data Processing and Abnormal Target Extraction Technology. Master’s Thesis, Guilin University of Electronic Technology, Guilin, China, 2024. [Google Scholar]
  20. Tian, Q.; Wang, Y.; Zhang, Z.; Yang, Q. Improved YOLOv8n for Gated Imaging Object Detection Algorithm. Comp. Eng. Appl. 2024, 61, 124–134. [Google Scholar]
  21. Jin, L.L.; Wei, L.S. Defect detection method of solar panel based on improved YOLOv10n. J. Chongqing Technol. Busin. Univ. (Nat. Sci. Edit.) 2024, 1–9. [Google Scholar]
  22. Liu, W.; Lu, H.; Fu, H.; Cao, Z. Learning to upsample by learning to sample 2023. arXiv 2023, arXiv:2308.15085. [Google Scholar]
  23. Li, Y.; Guo, Z.; Sun, Y.; Chen, X.; Cao, Y. Weed detection algorithms in rice fields based on improved YOLOv10n. Agriculture 2024, 14, 2066. [Google Scholar] [CrossRef]
  24. Zhang, G.; Yang, X.; Lv, D.; Zhao, Y.; Liu, P. YOLOv8n-CSD: A lightweight detection method for nectarines in complex environments. Agronomy 2024, 14, 2427. [Google Scholar] [CrossRef]
  25. Wang, C.; Li, H.; Deng, X.; Liu, Y.; Wu, T.; Liu, W.; Xiao, R.; Wang, Z.; Wang, B. Improved you only look once v.8 model based on deep learning: Precision detection and recognition of fresh leaves from yunnan large-leaf tea tree. Agriculture 2024, 14, 2324. [Google Scholar] [CrossRef]
  26. Li, Q.; Shi, Y.; Fan, T. Research on O-Ring Surface Defect Detection Algorithm Based on Improved YOLOv8n. Comp. Eng. Appl. 2024, 60, 126–135. [Google Scholar]
  27. He, T.; Shang, H. Direct-wave denoising of low-frequency ground-penetrating radar in open pits based on empirical curvelet transform. Near Surf. Geophys. 2020, 18, 295–305. [Google Scholar] [CrossRef]
  28. Zhang, Y.; Ye, M.; Zhu, G.; Liu, Y.; Guo, P.; Yan, J. FFCA-YOLO for small object detection in remote sensing images. IEEE Trans. Geosci. Remote Sens. 2024, 62, 3363057. [Google Scholar] [CrossRef]
  29. Ren, H.; Jing, F.; Li, S. DCW-YOLO: Road object detection algorithms for autonomous driving. IEEE Access 2024, 13, 125676–125688. [Google Scholar] [CrossRef]
  30. Chen, J.; Kao, S.; He, H.; Zhuo, W.; Wen, S.; Lee, C.-H.; Chan, S.-H.G. Run, don’t walk: Chasing higher FLOPS for faster neural networks. In Proceedings of the 2023 IEEE/CVF Conference on Computer Vision and Pattern Recognition (CVPR), Vancouver, BC, Canada, 18–22 June 2023; pp. 12021–12031. [Google Scholar]
  31. Tangqing, Q.J.Y. Intelligent Radar Image Identification and Disease Rating of Tunnel Lining Voiding Disease Based on Deep Learning. Master’s Thesis, Shijiazhuang Tiedao University, Shijiazhuang, China, 2024. [Google Scholar]
  32. Huang, Z.; Xu, G.; Tang, J.; Yu, H.; Wang, D. Research on void signal recognition algorithm of 3D ground-penetrating radar based on the digital image. Front. Mater. 2022, 9, 850694. [Google Scholar] [CrossRef]
  33. Liu, H.; Yue, Y.; Liu, C.; Spencer, B.F.; Cui, J. Automatic recognition and localization of underground pipelines in GPR B-scans using a deep learning model. Tunn. Undergr. Space Technol. 2023, 134, 104861. [Google Scholar] [CrossRef]
  34. Zhang, J.; Lu, Y.; Yang, Z.; Zhu, X.; Zheng, T.; Liu, X.; Tian, Y.; Li, W. Recognition of void defects in airport runways using ground-penetrating radar and shallow CNN. Autom. Constr. 2022, 138, 104260. [Google Scholar] [CrossRef]
  35. Liu, B.; Zhang, J.; Lei, M.; Yang, S.; Wang, Z. Simultaneous tunnel defects and lining thickness identification based on multi-tasks deep neural network from ground penetrating radar images. Autom. Constr. 2023, 145, 104633. [Google Scholar] [CrossRef]
  36. JTG/T 3512-2020; Code for Design of Highway Tunnels. China Architecture & Building Press: Beijing, China, 2020.
  37. Zhang, T.; Zhang, J.; Pan, P.; Zhang, X. YOLO-RRL: A lightweight algorithm for PCB surface defect detection. Appl. Sci. 2024, 14, 7460. [Google Scholar] [CrossRef]
  38. Cheng, G.; Chao, P.; Yang, J.; Ding, H. SGST-YOLOv8: An improved lightweight YOLOv8 for real-time target detection for campus surveillance. Appl. Sci. 2024, 14, 5341. [Google Scholar] [CrossRef]
  39. Duan, S.; Zhang, M.; Qiu, S.; Xiong, J.; Zhang, H.; Li, C.; Jiang, Q.; Kou, Y. Tunnel lining crack detection model based on improved YOLOv5. Tunn. Undergr. Space Technol. 2024, 147, 105713. [Google Scholar] [CrossRef]
  40. Hu, H.; Fang, H.; Wang, N.; Ma, D.; Dong, J.; Li, B.; Di, D.; Zheng, H.; Wu, J. Defects identification and location of underground space for ground penetrating radar based on deep learning. Tunn. Undergr. Space Technol. 2023, 140, 105278. [Google Scholar] [CrossRef]
  41. Zhou, Z.; Zhang, J.; Gong, C. Automatic detection method of tunnel lining multi-defects via an enhanced you only look once network. Comput.-Aided Civ. Infrastruct. Eng. 2022, 37, 762–780. [Google Scholar] [CrossRef]
  42. Dais, D.; Bal, İ.E.; Smyrou, E.; Sarhosis, V. Automatic crack classification and segmentation on masonry surfaces using convolutional neural networks and transfer learning. Autom. Constr. 2021, 125, 103606. [Google Scholar] [CrossRef]
  43. Hao, Y.C.; Guo, C.X.; Yang, R.; Zhao, Y.H. EDR-YOLOv8: A lightweight target detection model for UAV aerial photography using advanced feature fusion methods. Meas. Sci. Technol. 2024, 36, 026303. [Google Scholar] [CrossRef]
  44. Lang, D.B.; Zhou, K.H. Lightweight bearing defect detection algorithm combined with improved YOLOv8. Mod. Electron. Tech. 2024, 47, 115–122. [Google Scholar]
  45. Zhou, Z.; Zhou, S.R.; Li, S.S.; Lu, S.P. Intelligent identification of internal defects in tunnel lining based on improved YOLOv7. J. China Railw. Soc. 2024, 1–14. [Google Scholar]
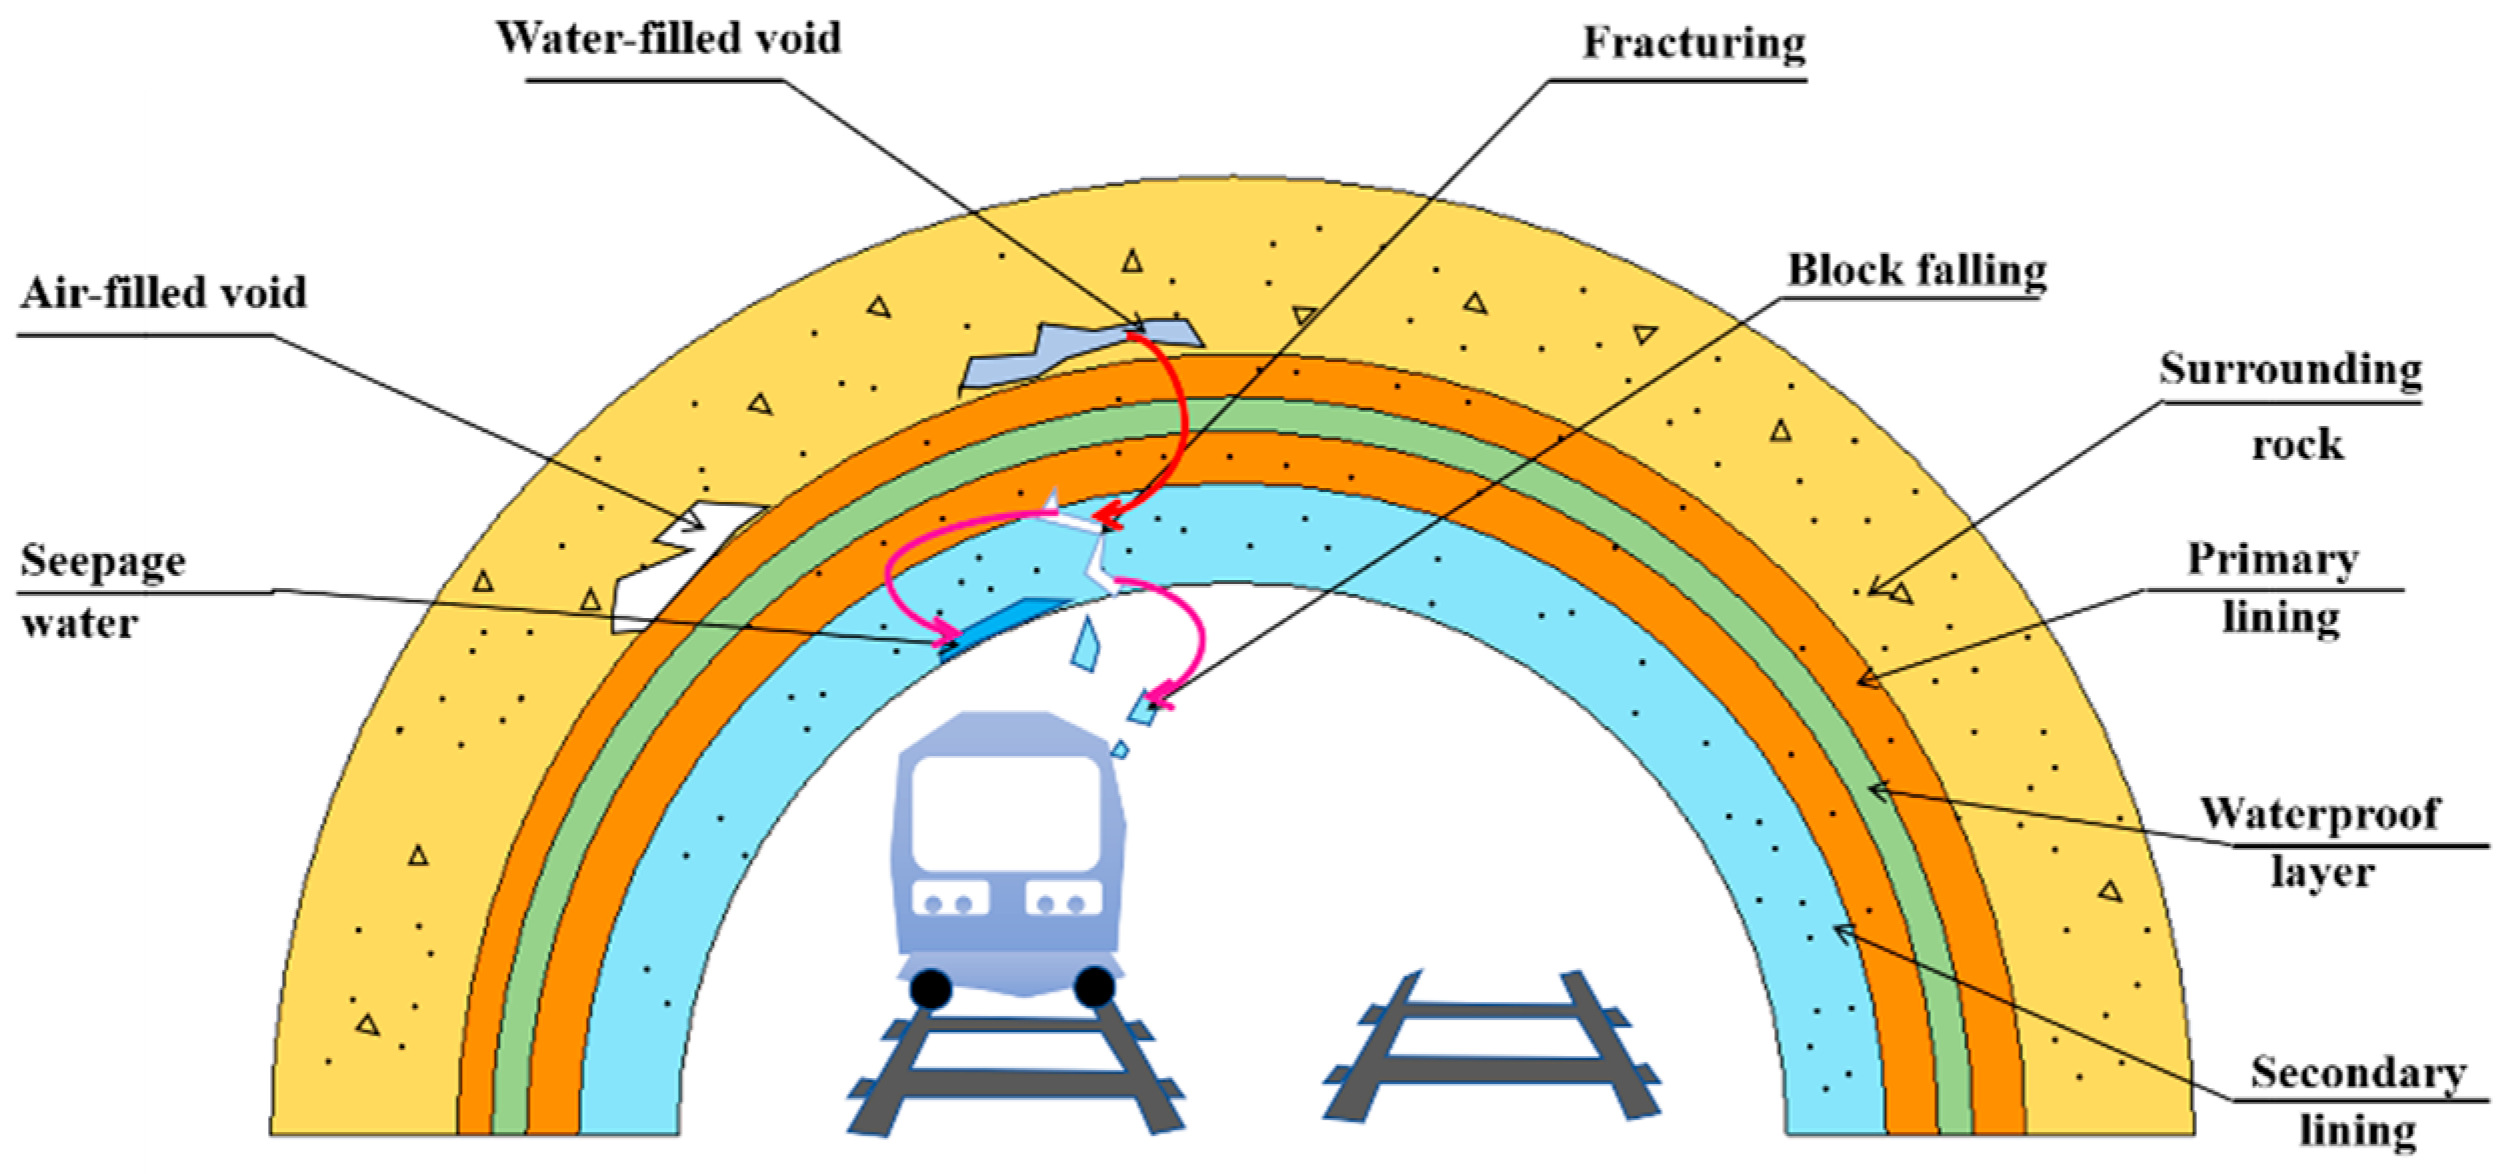
Figure 1. Sketch map of hazards caused by tunnel lining voids.
Buildings 15 03323 g001
Figure 2. Overall structure of the RCDS.
Buildings 15 03323 g002
Figure 3. Diverse and complex void shapes.
Buildings 15 03323 g003
Figure 4. Structure diagram of the RepVGG fusion process.
Buildings 15 03323 g004
Figure 5. Principle of GPR.
Buildings 15 03323 g005
Figure 6. Dynamic upsampling of the DySample module process.
Buildings 15 03323 g006
Figure 7. Generation process of the point sampling set.
Buildings 15 03323 g007
Figure 8. Diagram of interference signals.
Buildings 15 03323 g008
Figure 9. Structure of the SCAM.
Buildings 15 03323 g009
Figure 10. Comparison of the structures of the bottleneck and FasterBlock.
Buildings 15 03323 g010
Figure 11. Structure of the C2f-Faster.
Buildings 15 03323 g011
Figure 12. Picture data collected on site in the operating heavy-haul railway tunnel.
Buildings 15 03323 g012
Figure 13. Indoor test radar image acquisition process.
Buildings 15 03323 g013
Figure 14. Acquisition results of radar void images in indoor tests.
Buildings 15 03323 g014
Figure 15. mAP comparison.
Buildings 15 03323 g015
Figure 16. Training and Validation Loss Curves During Model Training.
Buildings 15 03323 g016
Table 1. Data on the number and total mileage of highway and railway tunnels over the past five years.
YearNumber of HighwaysNumber of RailwaysHighway MileageRailway Mileage
201919,06716,08418,966.618,041
202021,31616,79821,999.319,630
202123,26817,53224,698.921,055
202224,85017,87326,78421,978
202327,29718,57330,231.823,508
Table 2. Acquisition parameters and parameter selections.
Central Frequency/(MHz)Wave Velocity/(cm/ns)Sampling Time Window/(ns)Trace Interval/(m)Number of Sampling Points/(points)
800101002512
Table 3. Experimental environment parameters for the model.
Experimental EnvironmentConfiguration
GPURTX 4090D (24 GB)
CPU16 vCPU Intel(R) Xeon(R) Platinum 8481C
Memory80 GB
Integrated Computing EnvironmentPyTorch 1.10.0
Python 3.8
Cuda 11.3
Table 4. YOLOv8 model training parameters.
Parameter TypeNumber of IterationsBatch SizeLearning Rate
Value30080.001
Table 5. Ablation experiments.
ModelRepVGGBlockC2f-FasterDySampleSCAMBox-mAPMask-mAPGFLOPsParametersWeight File SizeFPS
YOLOv8 0.9280.92712.13,263,8116.5116.82
YOLOv8-R 0.9350.93712.23,308,2916.6103.36
YOLOv8-C 0.9280.93010.32,558,6115.1120.60
YOLOv8-D 0.9340.93112.13,276,1636.5107.61
YOLOv8-S 0.9440.93912.33,583,3626.8105.97
YOLOv8-RC 0.9370.93910.52,603,0915.2107.93
YOLOv8-RCD 0.9360.94010.52,615,4435.2108.61
YOLOv8-RCDS0.9430.94110.72,788,8375.6114.70
Table 6. Algorithm comparison.
ModelBox-mAPMask-mAPGFLOPsParametersWeight File SizeFPS
YOLOv5-P60.9270.93211.24,452,3408.8109.31
YOLOv60.9310.92615.34,408,0678.6124.16
YOLOv80.9280.92712.13,263,8116.5116.82
ShuffleNet-YOLOv80.9130.9118.91,965,8754.0129.06
Efficientnet-YOLOv80.9260.9259.62,162,1274.4151.22
ConvNeXt-YOLOv80.9210.9168.82,004,7634.0181.06
YOLOv8-RCDS0.9430.94110.72,788,8375.6114.70
Disclaimer/Publisher’s Note: The statements, opinions and data contained in all publications are solely those of the individual author(s) and contributor(s) and not of MDPI and/or the editor(s). MDPI and/or the editor(s) disclaim responsibility for any injury to people or property resulting from any ideas, methods, instructions or products referred to in the content.