Article

Experimental and Numerical Study on the Impact of Multi-Line TBM Tunneling in Fractured Zones on Building Deformation

College of Civil Engineering and Architecture, Shandong University of Science and Technology, Qingdao 266590, China
*
Author to whom correspondence should be addressed.
Buildings 2025, 15(18), 3322; https://doi.org/10.3390/buildings15183322
Submission received: 10 August 2025 / Revised: 2 September 2025 / Accepted: 9 September 2025 / Published: 14 September 2025
(This article belongs to the Section Building Structures)

Abstract

Tunneling in fractured zones significantly affects surface and building deformation. This paper investigates the deformation of overlying buildings and the surrounding ground induced by multi-line TBM tunneling in fractured zones of the Qingdao Metro, combining a 3D physical model test, numerical simulations, and field monitoring to analyze the evolution of settlement and structural responses. The results show that settlement induced by TBM excavation peaks at the center and diminishes laterally, with amplified differential settlement and building torsion near fractured zones. Comparative analyses of reinforcement strategies indicate that crown grouting is the most effective in reducing deformation. Sensitivity analysis further indicates that tunnel depth, grouting pressure, and building–tunnel relative position are the dominant factors influencing building settlement. The findings provide practical guidance for similar projects in complex geological conditions and contribute to deformation control in underground works.

1. Introduction

Tunnels are foundational to urban transport networks in dense cities [1], yet their construction inevitably disturbs the surrounding ground and nearby structures [2,3,4,5]. Especially when crossing fractured zones, external disturbances such as TBM excavation can trigger pronounced deformation or even failure, compromising stratum stability [6,7] and affecting adjacent structures. Despite extensive research on tunneling effects in sandy and clayey soils [8,9,10,11], the twin-tunnel undercrossing of buildings in fractured strata remains relatively underexplored.
Current research methods mainly include theoretical analysis, physical model tests and numerical simulations. Classical theoretical approaches predict greenfield settlements with Gaussian-type functions and cumulative-probability formulations, providing rapid estimates and transforming complex engineering problems into mathematical analyses [12,13,14,15]. However, these methods are confined to simplified conditions as they assume homogeneous free-field ground [16], neglect soil–structure interaction and building stiffness with foundation–superstructure continuity [17], simplify ground loss and staged advance and thus miss face-proximity effects and three-dimensional stress redistribution [18,19], and are unreliable for twin tunnels and fractured strata [20]. By contrast, numerical simulations accommodate complex geology and construction scenarios, characterize building–ground–tunnel interaction, and enable sensitivity analyses to guide design [21]. Complementarily, similarity-based physical model tests reproduce these interactions at scale, reveal construction-induced deformation and failure, and provide reliable data to validate simulations [22,23]. Accordingly, this study integrated model testing with numerical simulation.
For model testing, physical modeling simulates prototype conditions at a reduced scale while preserving essential similitude. It provides qualitative insights into a physical phenomenon, which may not be fully understood currently [24]. Early work by Kim et al. used 1 g model tests to examine how constructing a new circular tunnel in clay affects an existing circular tunnel. However, 1 g tests cannot satisfy stress and material similitude [25]. Consequently, centrifuge model tests have been predominantly employed in existing research [26,27,28,29,30]. These reproduce tunnel–ground–structure interaction under controlled conditions and record displacement, settlement, and stress responses. To emulate excavation, rubber-bag and inflatable bladder systems are used [31,32,33], and dual-bladder setups provide independent drainage control for imposed volume and weight loss [34,35]. Although existing studies provide partial insight into the effects of tunneling on overlying or adjacent buildings, the cost and complexity of laboratory tests often lead to simplified designs that omit buildings, replace them with surface loads, or model only piles, neglecting overall superstructure stiffness. In addition, ground loss is usually imposed by pipe extraction or liquid drainage, which fails to reproduce the dynamic construction process and thus limits realism. Therefore, these approaches have certain limitations.
Numerical methods efficiently model tunnel–soil–building interaction by representing the tunnel, soil, and building within a single unified model. Advances in computing have further expanded their application to these problems [36]. On the one hand, some studies’ analyses of adjacent piles quantify the axial force, bending moment, settlement, and pile–soil load transfer as the tunnel face advances and volume loss develops. Representative studies consistently report increases in the pile axial force and bending, redistribution of shaft resistance, and additional cap settlement during advancement [37,38,39]. On the other hand, studies on building responses to tunneling often simplify the superstructure as a surface elastic shell [40], an equivalent beam [41], or a frame with discrete infill [42] to reduce computational cost and enable parametric analyses. Such idealizations may attenuate or overlook superstructure torsion, non-uniform stiffness, and foundation–superstructure continuity, thereby biasing the assessment. For further simplification, it is commonly assumed that building foundations are uniformly of the pile type, with only the pile foundation modeled and the building load directly applied to the pile tops, without modeling the superstructure [43,44,45]. As a result, the influence of the overall stiffness and mass distribution of the building on the ground response is neglected. Moreover, existing studies have mostly focused on sandy or clayey soils, while research on complex geological conditions, such as soil–rock composite strata, remains relatively limited.
To address these limitations, this study selected the TBM tunneling in a section of the Qingdao Metro, which passes beneath a residential building and lies within a fractured zone, as its engineering background. Based on similarity theory, we designed and used a custom indoor apparatus, comprising excavation, propulsion, and support modules, to simulate the complete dynamic TBM process. By monitoring variations in soil pressure, as well as the displacements and strains of both the ground surface and the building during excavation, the deformation patterns of overlying structures induced by TBM construction were analyzed. On this basis, a three-dimensional numerical model representing the actual working conditions was developed using the ABAQUS finite element software to simulate and validate the TBM excavation process. Finally, three reinforcement measures, sub-foundation grouting, isolation piles, and tunnel crown grouting, were evaluated for their effectiveness in controlling deformations of existing buildings during TBM undercrossing, and a practical settlement control scheme was proposed.

2. Project Overview

The project is located at an under-construction station along the Qingdao Metro line in China. The starting point of the line is at the Ferry Station in the southern district of Qingdao, while the terminus extends into Taishan Road Station with a total length of 3.9 km. The tunnel has a crown depth of 21 m, with a horizontal distance of 15 m between the centers of the two tunnels. The overlying building is situated in the Taishan Road Station section, consisting of a six-story frame structure.
According to the geotechnical report, the stratigraphy from top to bottom consists of artificial fill, strongly weathered granite, moderately weathered granite, and slightly weathered granite, and a fractured zone approximately 20 m wide exists beneath the building.

3. Materials and Methods

3.1. Similarity Ratio Design and Stratum Materials

In this study, a similarity ratio of 1:50 was established for the model test, yielding a geometric scale factor of 50.
The choice of a 1:50 geometric similarity ratio was guided by previous studies. For example, David et al. [46] conducted model tests with a 1:50 scale to investigate ground deformation, confirming the suitability of this ratio. Similarly, Sun et al. [47] adopted a comparable scale in model tests on tunnel collapse evolution in composite strata, further demonstrating its applicability under complex geological conditions. This ratio ensures that the model dimensions remain suitable for the indoor apparatus and enables effective control of material composition, stress, and deformation. In addition, subsequent comparisons with field monitoring data in this study further validate this choice. By contrast, a smaller ratio would make the model too small and amplify particle effects, whereas a larger ratio would require oversized model boxes and loading devices, significantly increasing experimental costs.
The fundamental physical quantities chosen for similarity included geometric dimensions, density, and cohesion. Using these parameters, additional similarity conditions were derived, and the similarity coefficients for the key physical quantities are summarized in Table 1.
The development of stratum materials is a key component of this model test. To simulate different strata, barite powder, iron powder, and quartz sand were used, with a rosin–alcohol solution as the cementing agent and gypsum powder as the binder. After screening the orthogonal experiments, the final composition of the similarity stratum materials is presented in Table 2. In addition, based on existing research experience, the tunnel grouting layer is simulated using a 2:1 mass ratio of water to gypsum.

3.2. Model Test Apparatus

The experimental setup was used to investigate the effects of TBM tunnel construction on existing buildings. The setup consists of a model test box, building, TBM excavation equipment model, and date monitoring equipment.
The model test box is constructed with 15 mm thick tempered glass, reinforced with angle steel sections and square tubing at the corners and top/bottom, and fixed to a 2 × 2 m wooden base. The front and rear sides feature 13 cm circular holes, with distances of 30 cm above the bottom, 57 cm below the top, and 60 cm from the side edges, with a 30 cm center-to-center spacing. Fracture zones are marked at 10 cm intervals on the glass surfaces, and petroleum jelly is applied to reduce boundary effects. The model test box is shown in Figure 1a.
Following similarity principles, the TBM excavation device, simplified from the field device, consists of a control system, support frame, shield and cutter head, power unit, rails, and segments. The lining is modeled with PE pipes (120 mm diameter, 6 mm thickness). The cutterhead diameter is 12.6 cm, and the combined length of the shield and cutterhead is 25 cm. The power unit drives the cutterhead through a transfer rod and provides speed control, while rails guide the advance. The excavation rate is set by the advance distance and excavated volume. The TBM excavation device is shown in Figure 1b.
The residential building model used PMMA (acrylic) members bonded with a specialty adhesive; member sizes were 12 × 6 mm for beams, 12 × 12 mm for columns, and 40 × 40 × 20 mm for foundations. The PMMA has an elastic modulus of 2.86 GPa and a Poisson’s ratio of 0.35. The structural floor load is 8.2 kPa (live load 2.0 kPa; dead load 4.5 kPa). The load similarity ratio follows the elastic-modulus ratio; for PMMA relative to concrete it is 10.5 (i.e., CP = CE = 10.5) The load to be applied to the model residential building is as follows [48]:
P 2 = P 1 × α × b × n C P × g = 8.2 × 1000 × 0.78 × 0.17 n 10.5 × 9.8 = 10.57 n
where P2: load applied to the top of the acrylic (kg); a: longitudinal length of the model frame (m); b: transverse length of the model frame (m); n: number of floors; g: gravitational acceleration (m/s2).
The required load is 6 × 10.57 = 63.42 kg, applied by adding weights to the top of the frame. Note that, because the laboratory load is applied by placing dead weights on the acrylic frame, it is expressed as mass (kg) rather than force (N). The physical model of the residential building is shown in Figure 2.

3.3. Model Test Measurement

Ground displacements and building strains were monitored simultaneously to characterize deformation during TBM excavation.
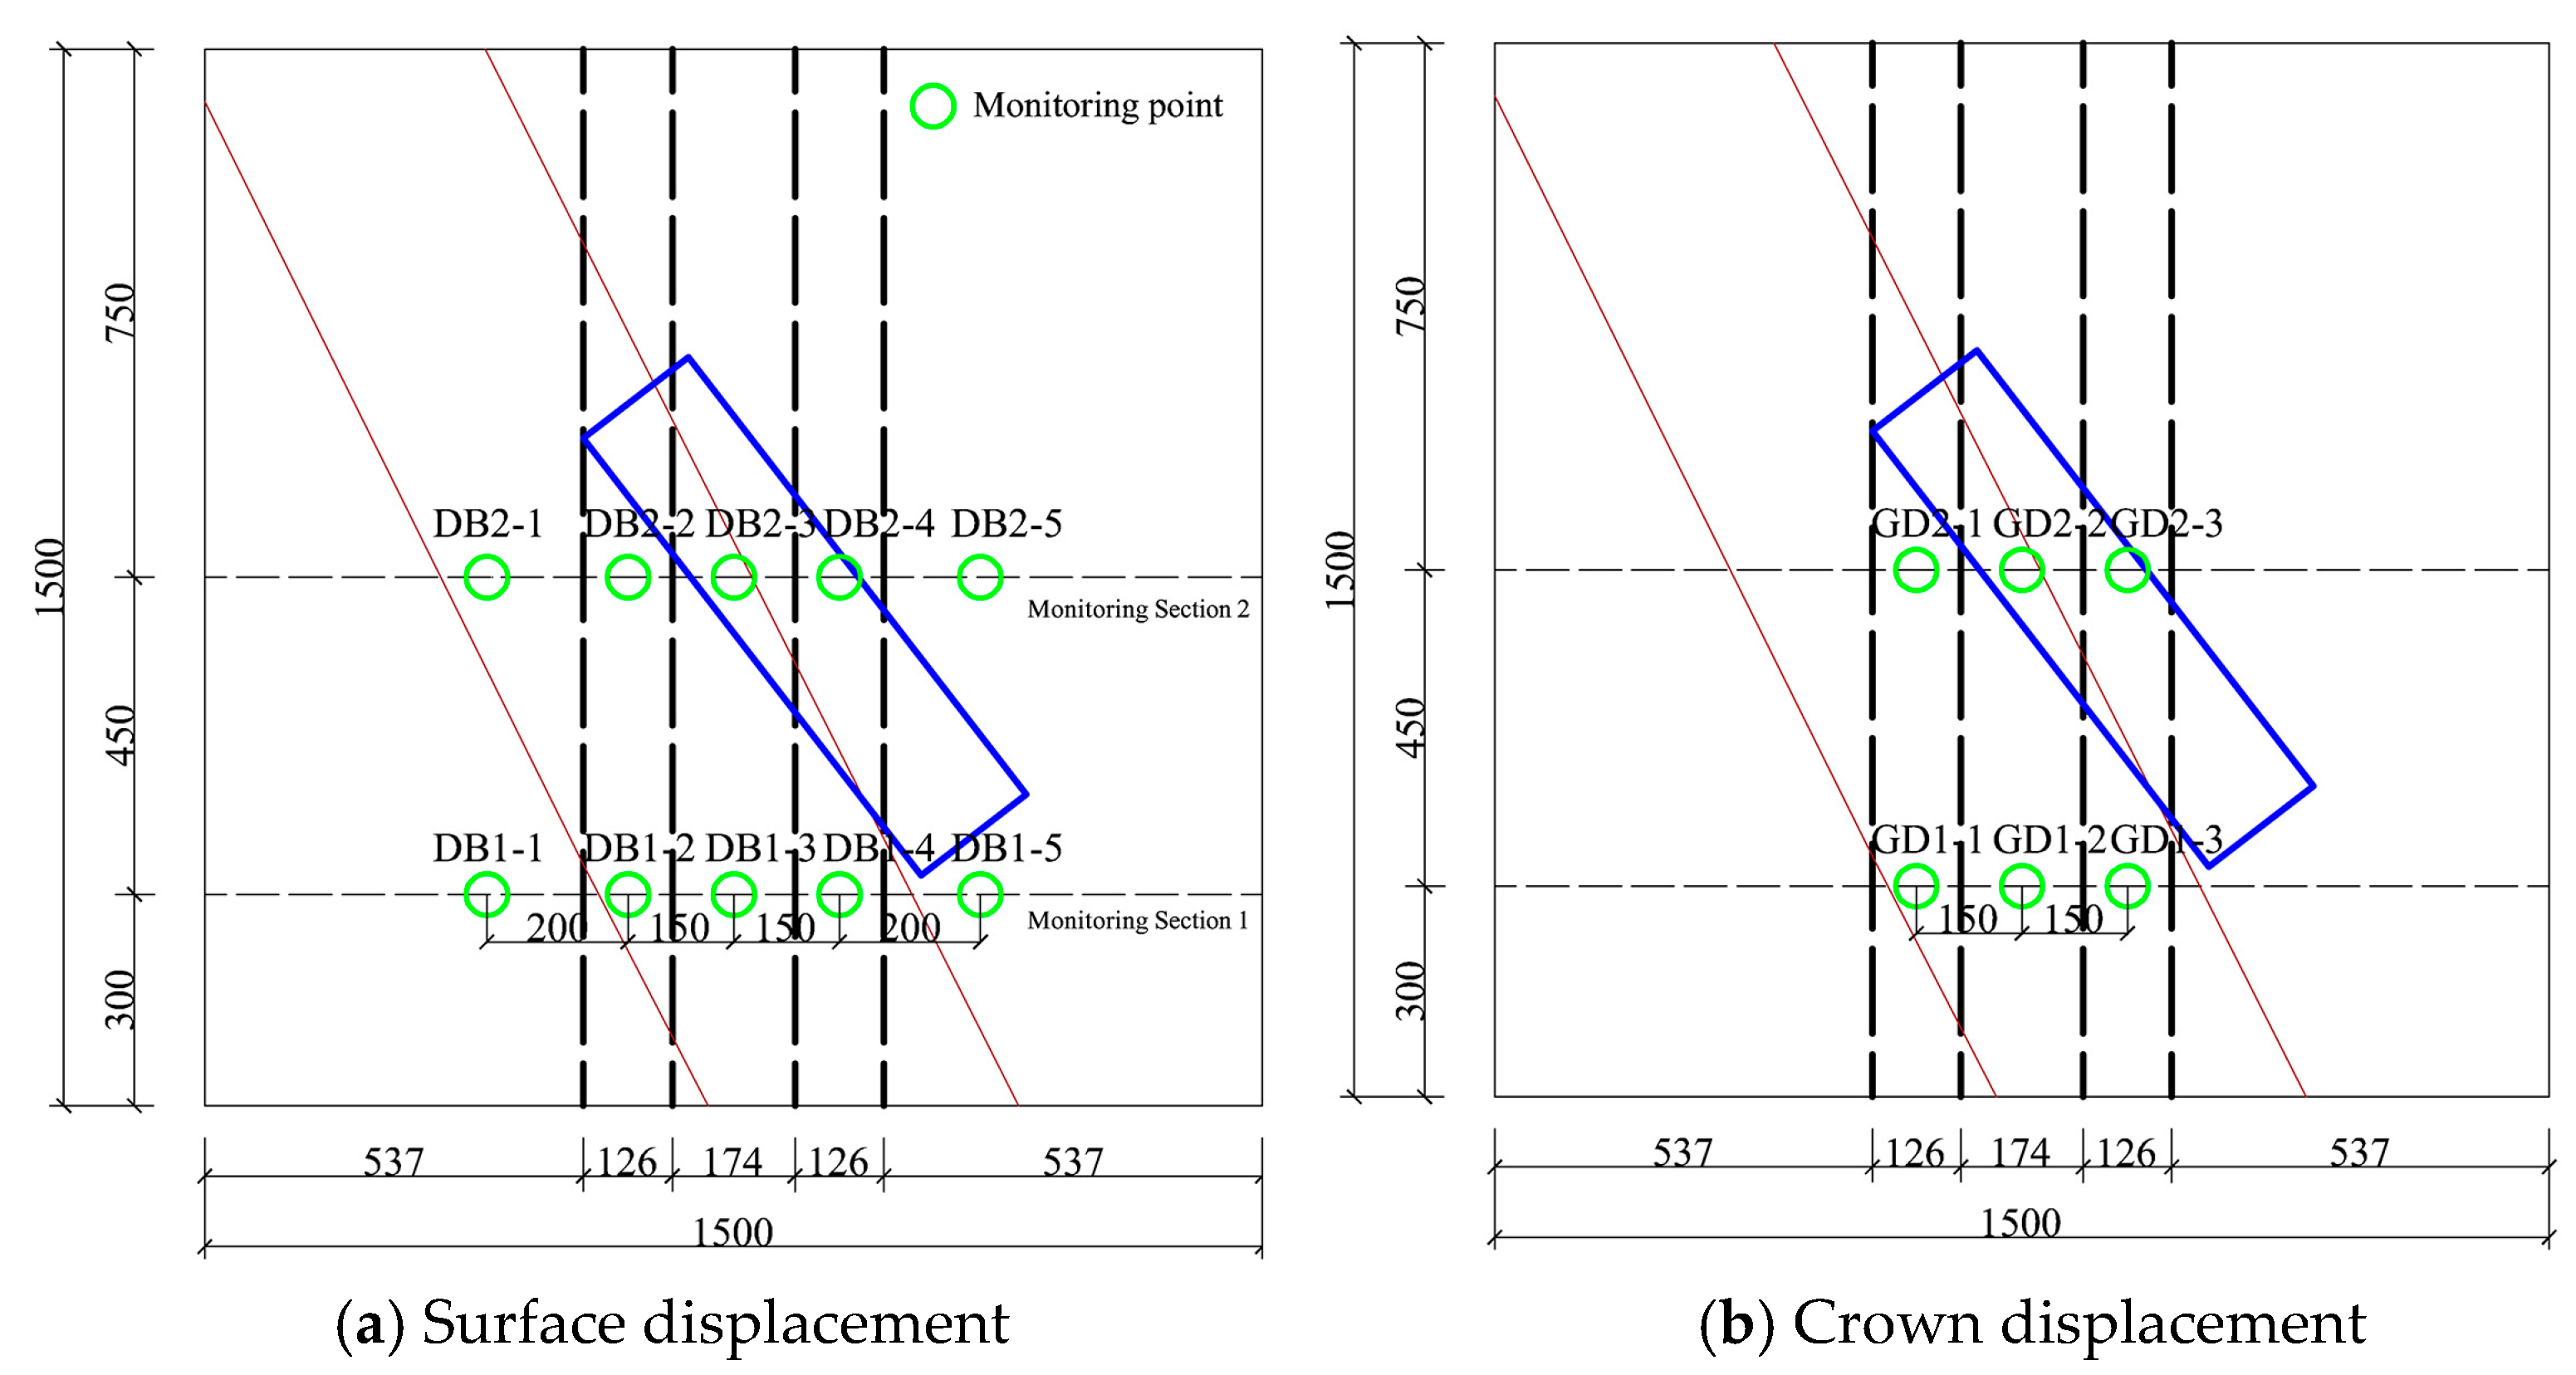
Stratum displacement was measured at the ground surface and at the tunnel crown. Surface displacement was measured in two rows of five points each (monitoring sections 1 and 2), located 50 mm in front of the building and directly beneath it, respectively, totaling 10 points, as shown in Figure 3a. Crown displacement was monitored in two rows of three points each, located in front of the building and directly beneath it, totaling 6 points, as shown in Figure 3b.
A total of 6 soil pressure measurement points were arranged in 3 layers, with 2 points per layer, located 5 cm, 21 cm, and 37 cm below the surface, all directly beneath the building. The monitoring point locations are shown in Figure 4. To prevent damage to the soil pressure gauge during backfilling and to ensure data accuracy, the soil pressure box was attached to a wooden board and the board buried in the material.
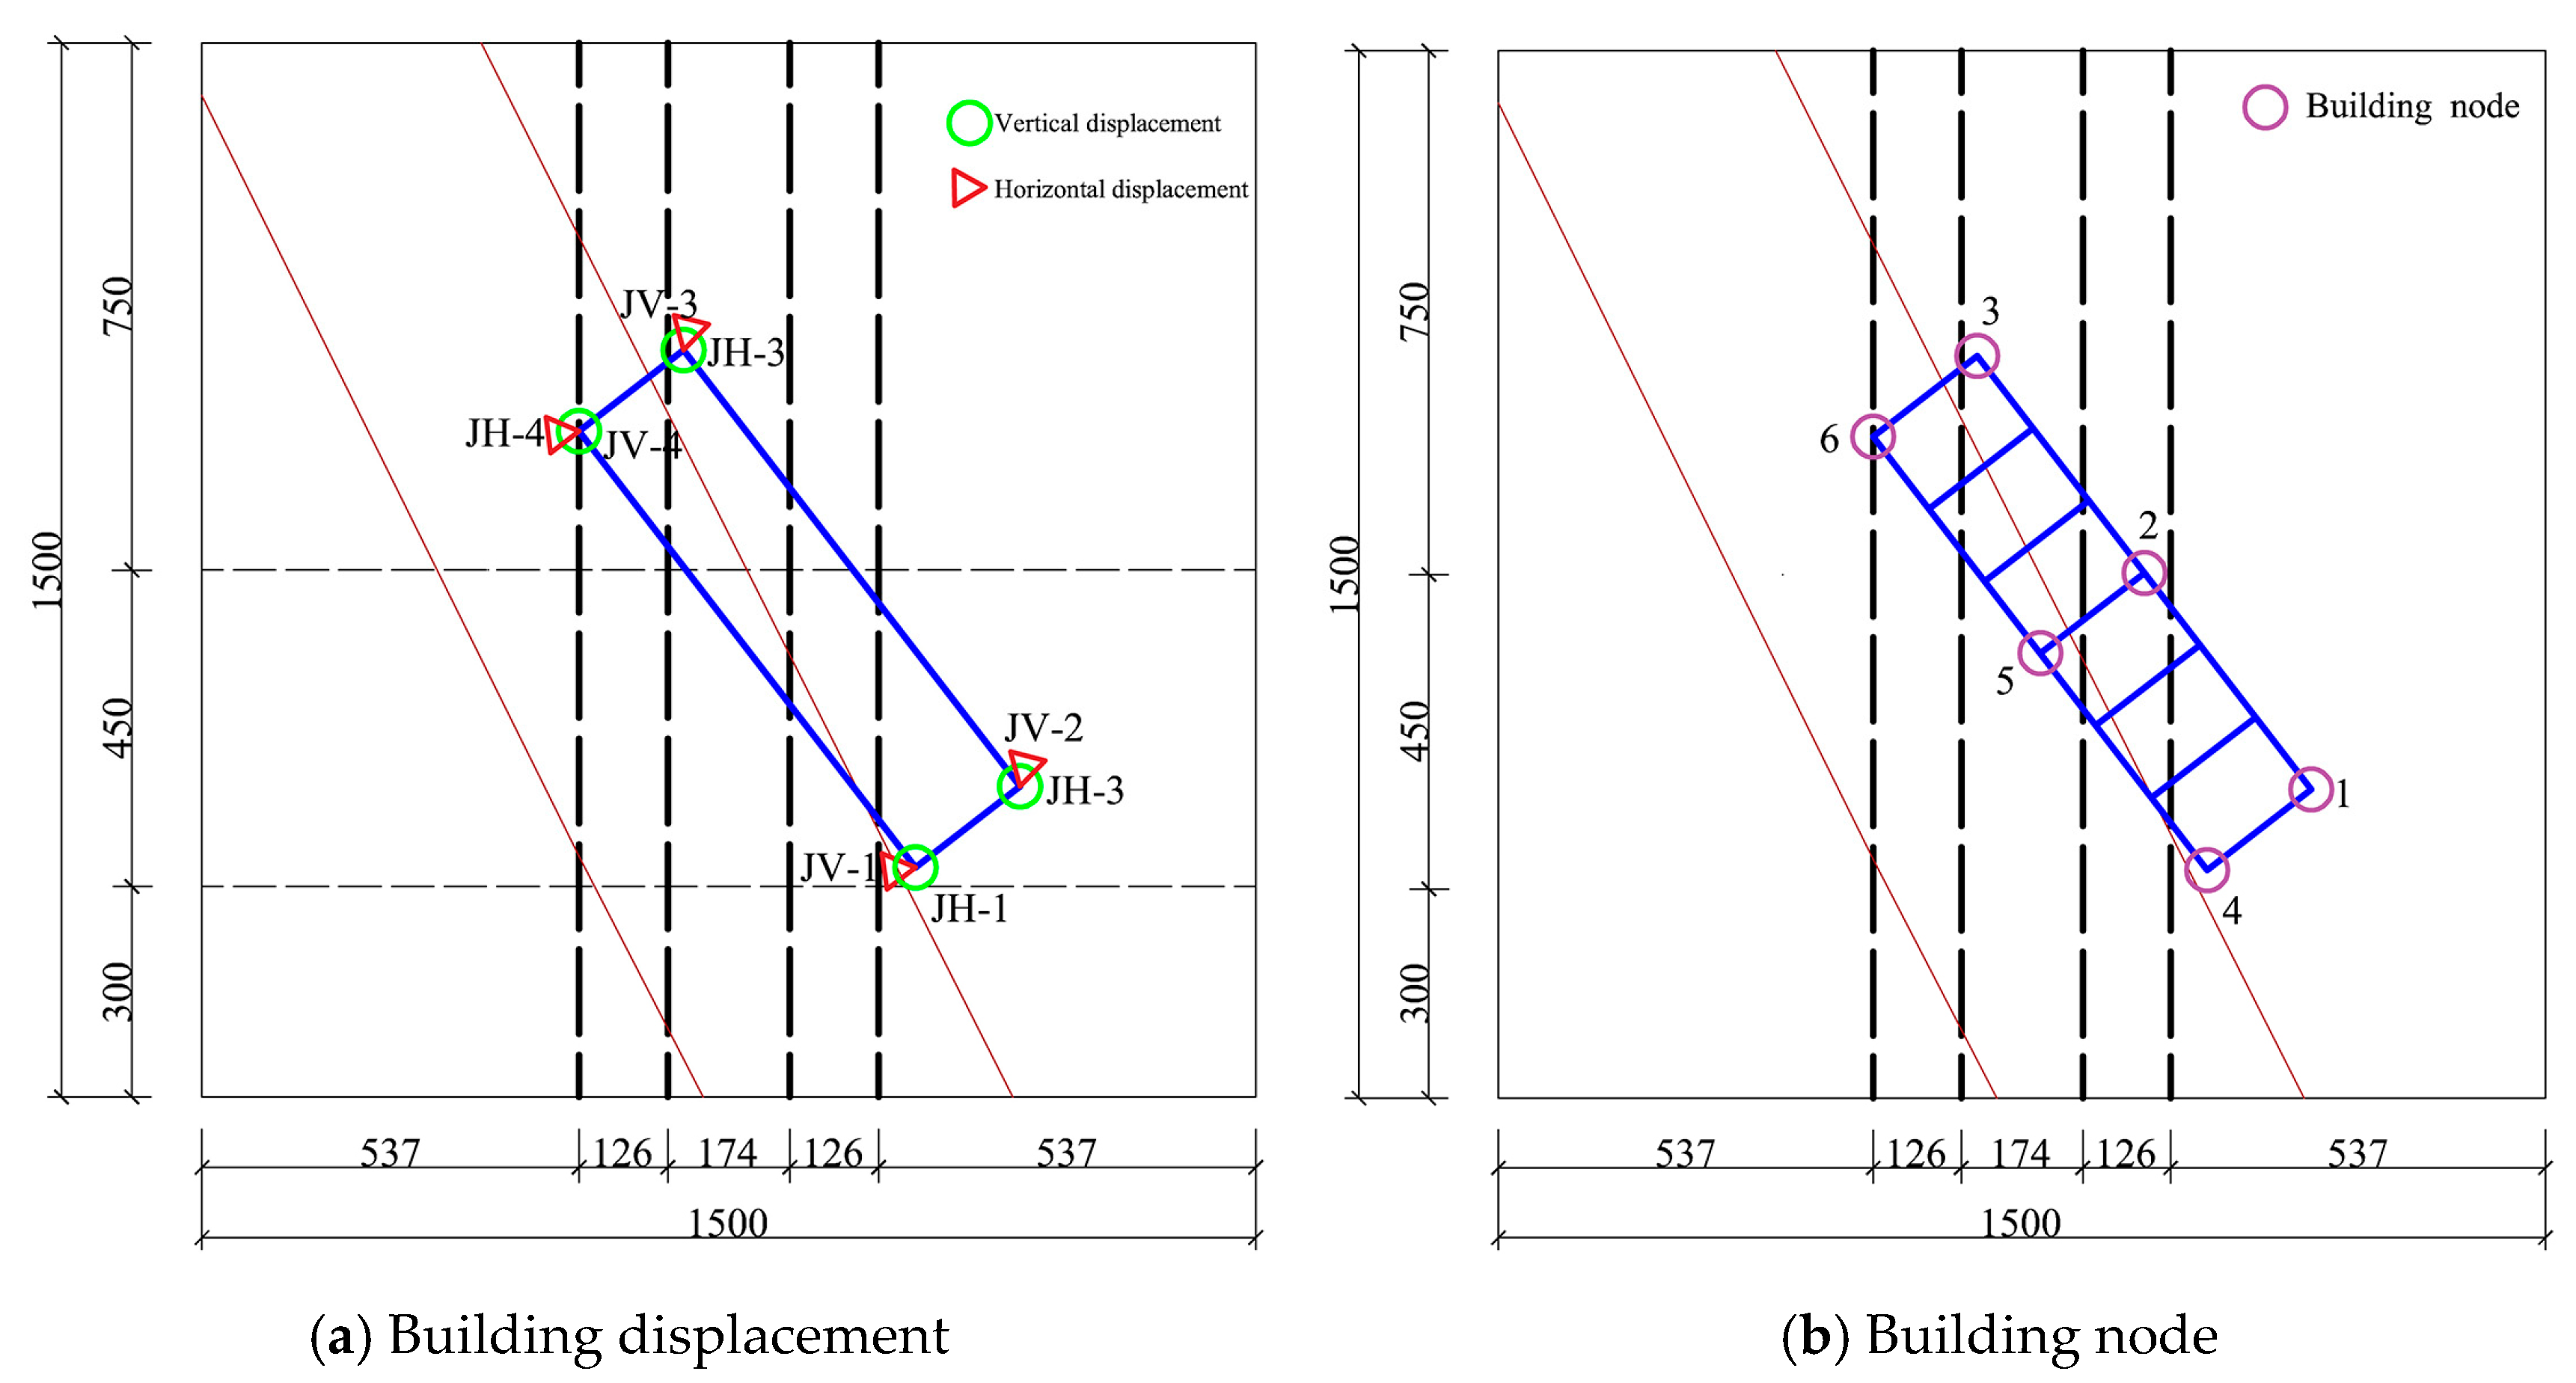
Vertical and horizontal displacement monitoring points were placed at the 4 corners of the building, with a total of 8 points, as shown in Figure 5a.
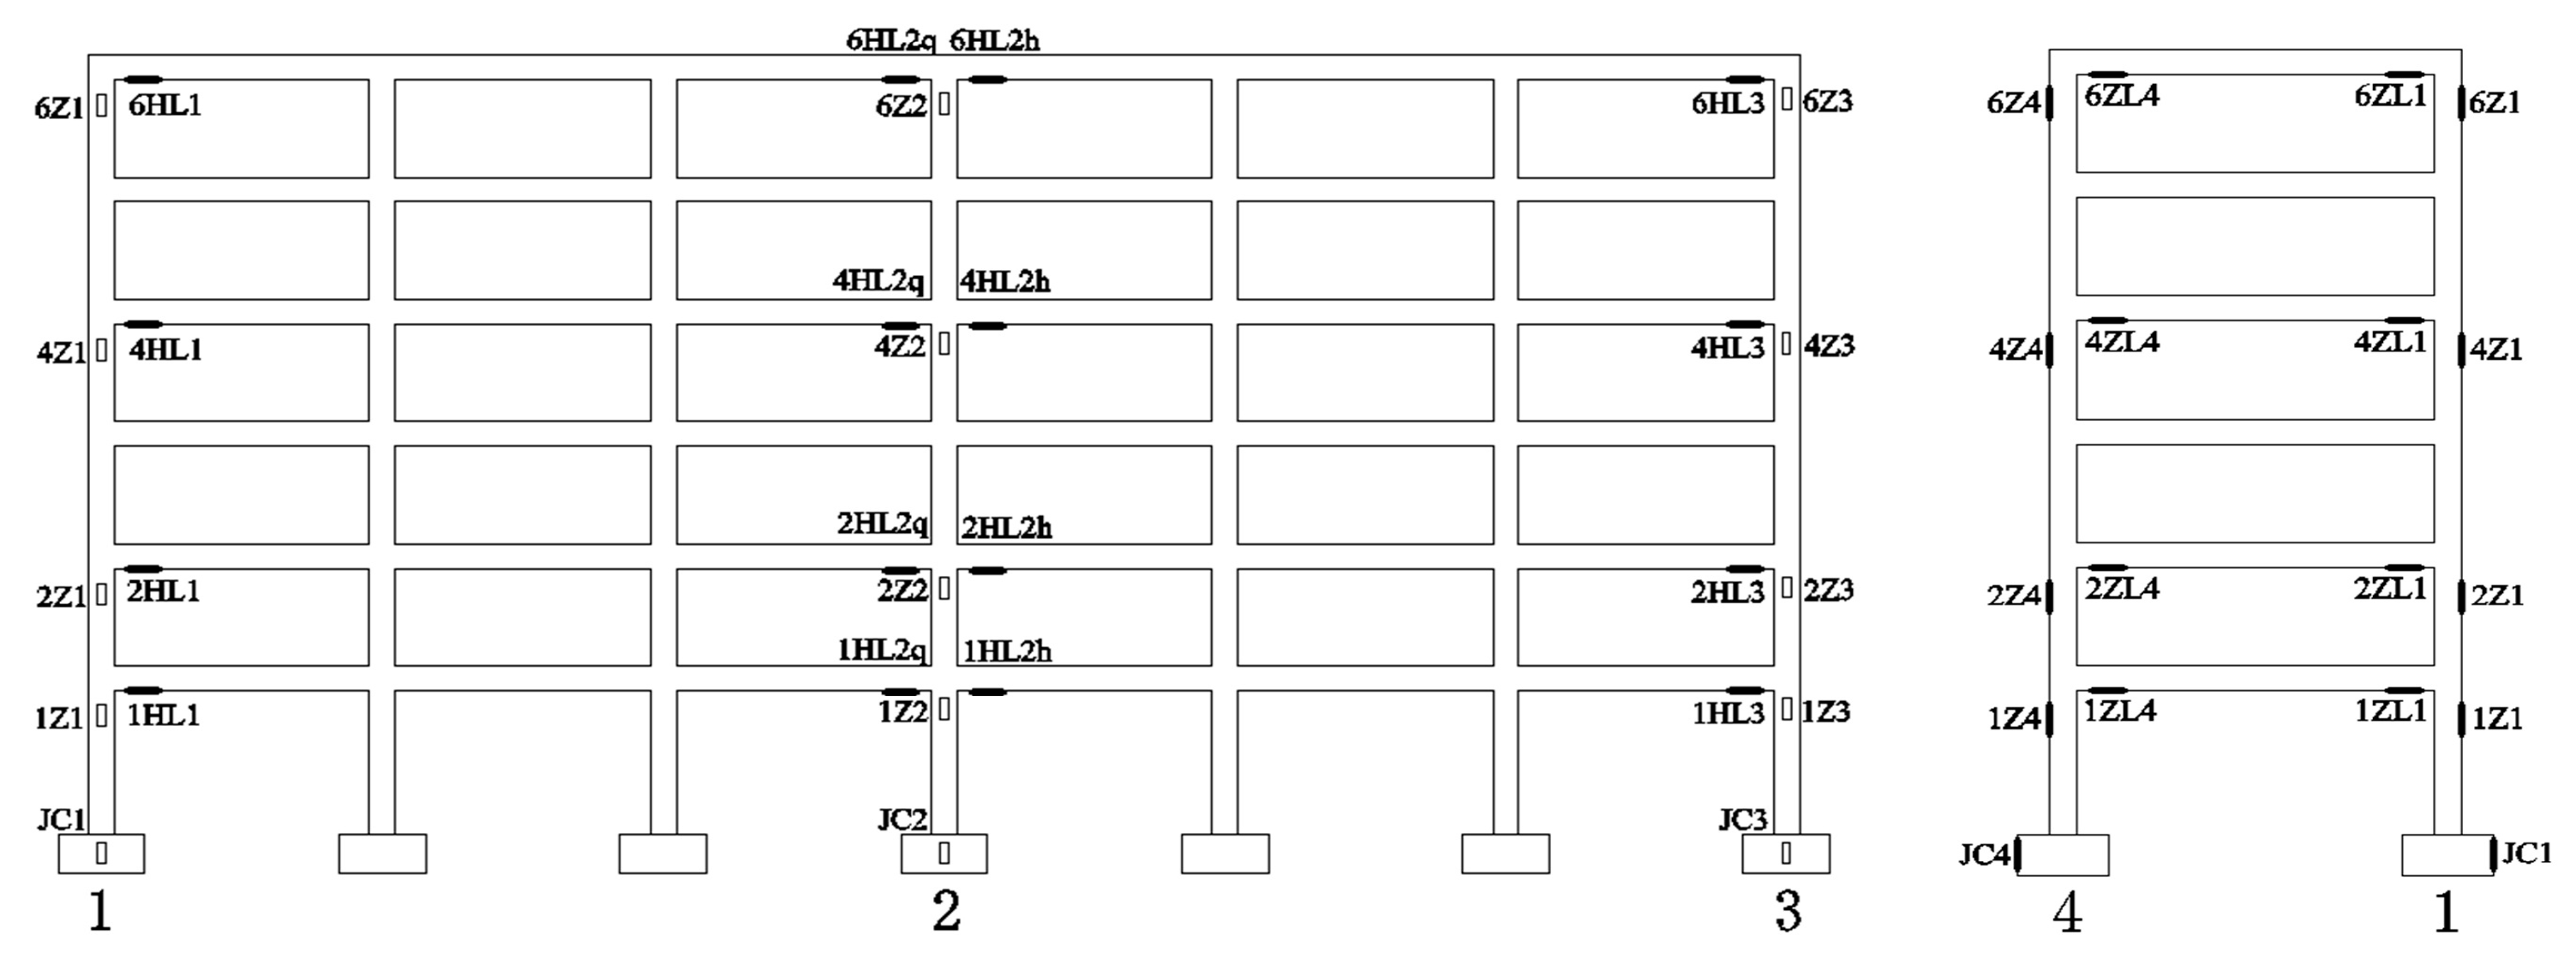
A total of 94 strain gauges were attached to the structural components, located at the foundations and beam–column joints. Strain gauges on the foundations and columns were bonded to the outer surfaces, and those on the beams were placed on the undersides.
Node labeling follows these rules: foundations are labeled “JC” followed by the node number, for example, the foundation at node 1 is labeled JC1; frame columns are labeled as the floor number + Z + node number, for example, the column at node 1 on the first floor is labeled 1Z1; and frame beams are labeled as the floor number + HL/ZL + node number + q/h, for example, the front transverse beam at node 2 on the first floor is labeled 1HL2q. The floor plan of the building nodes is shown in Figure 5b, and the layout of strain gauge locations is shown in Figure 6.
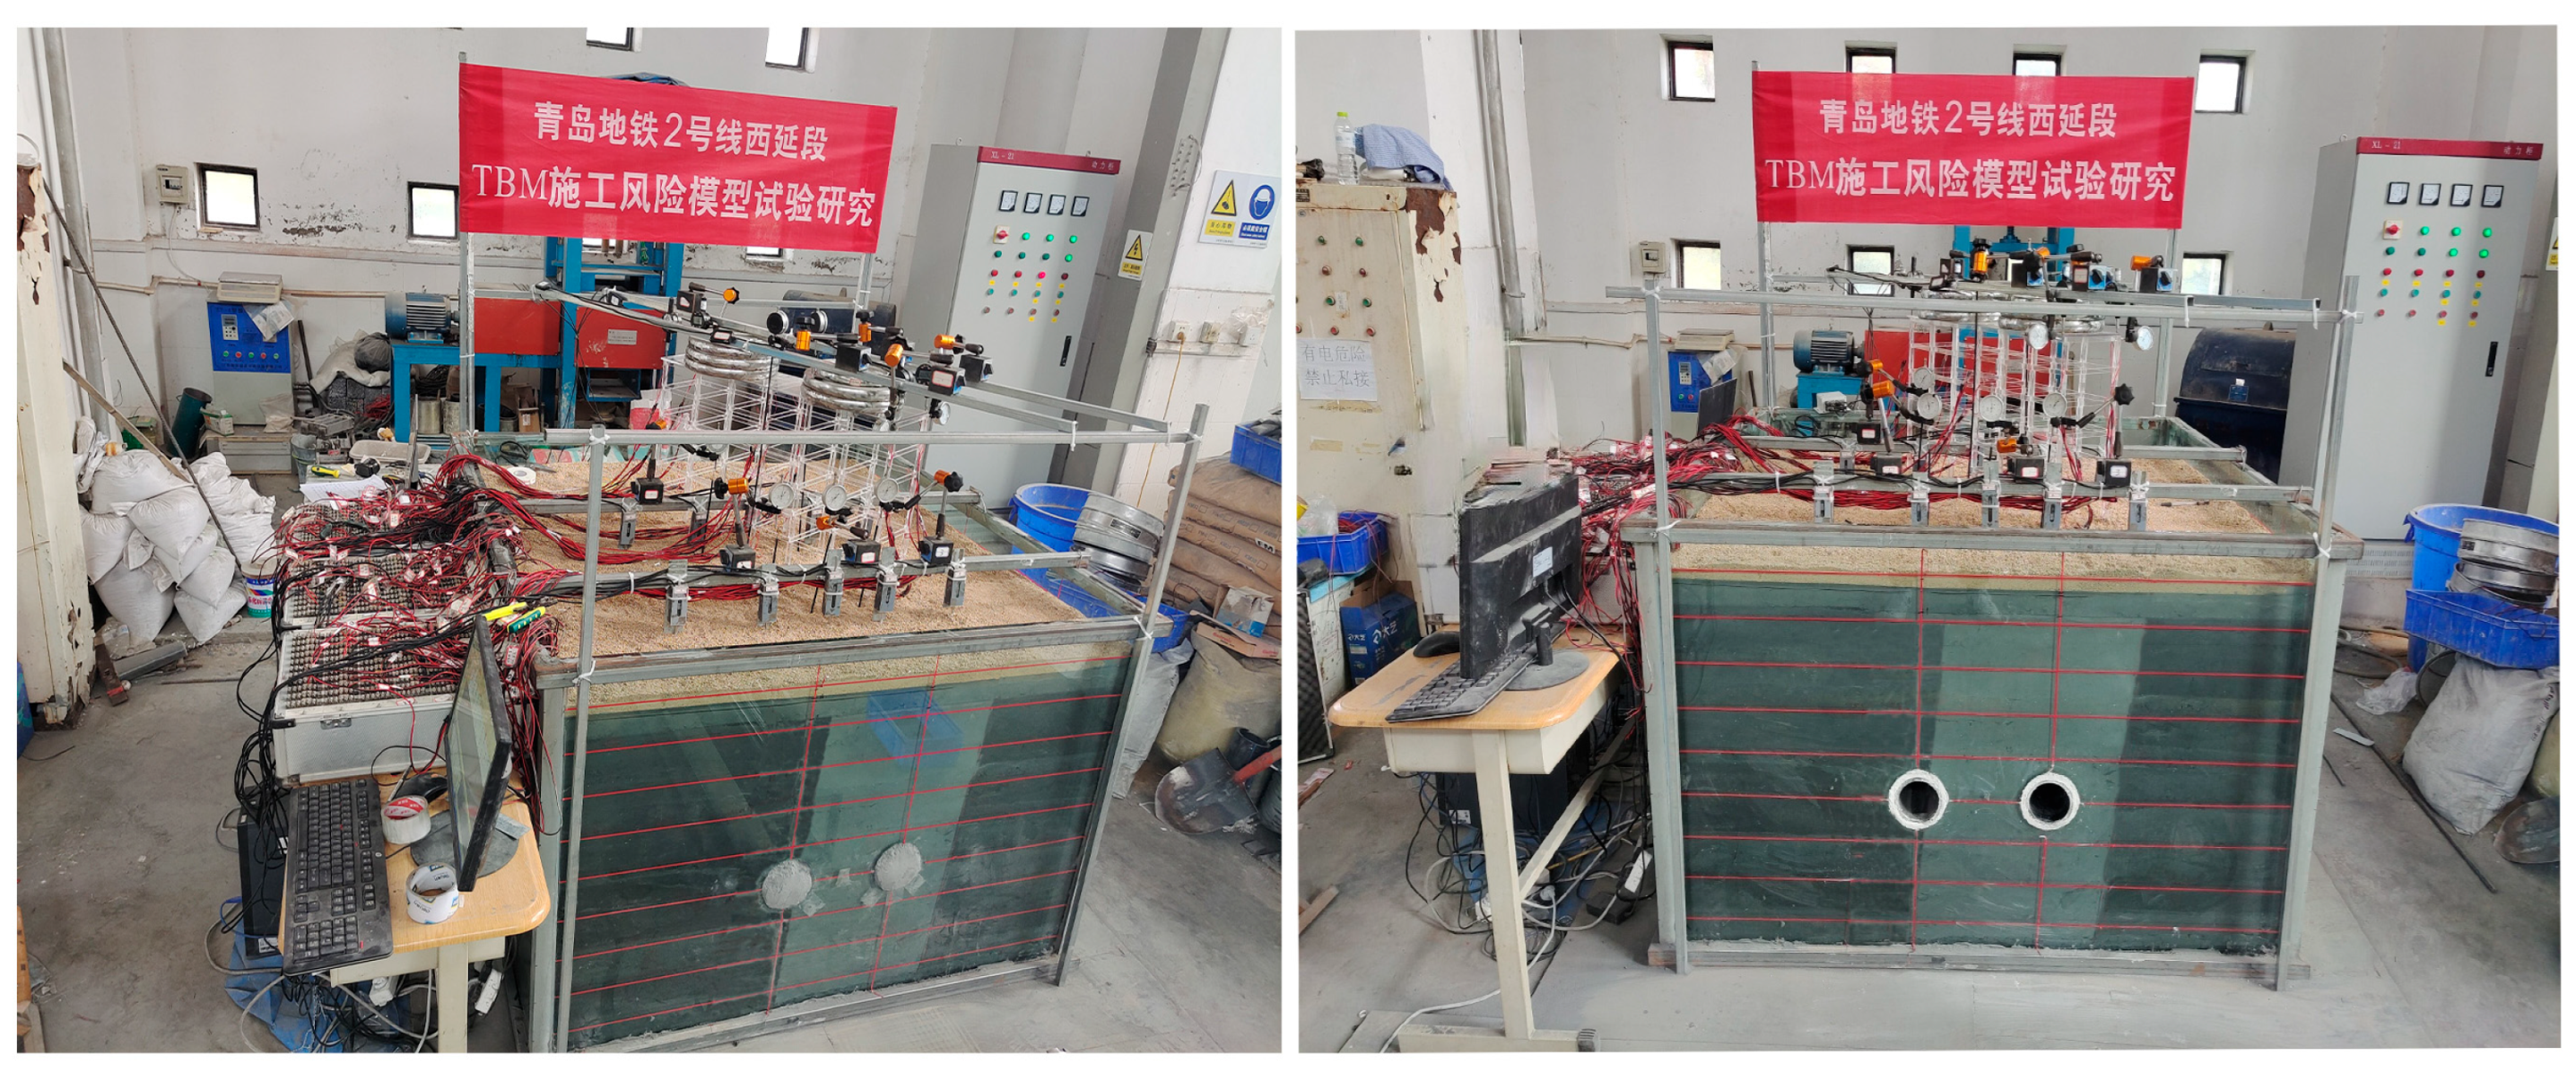
Prior to testing, the prepared specimen was cured for three days to stabilize the soil. Excavation began with the right-line tunnel, followed by the left-line tunnel. During excavation, lining segments were installed concurrently, and real-time monitoring was conducted throughout. Model filling and excavation are shown in Figure 7.

4. Model Test Results

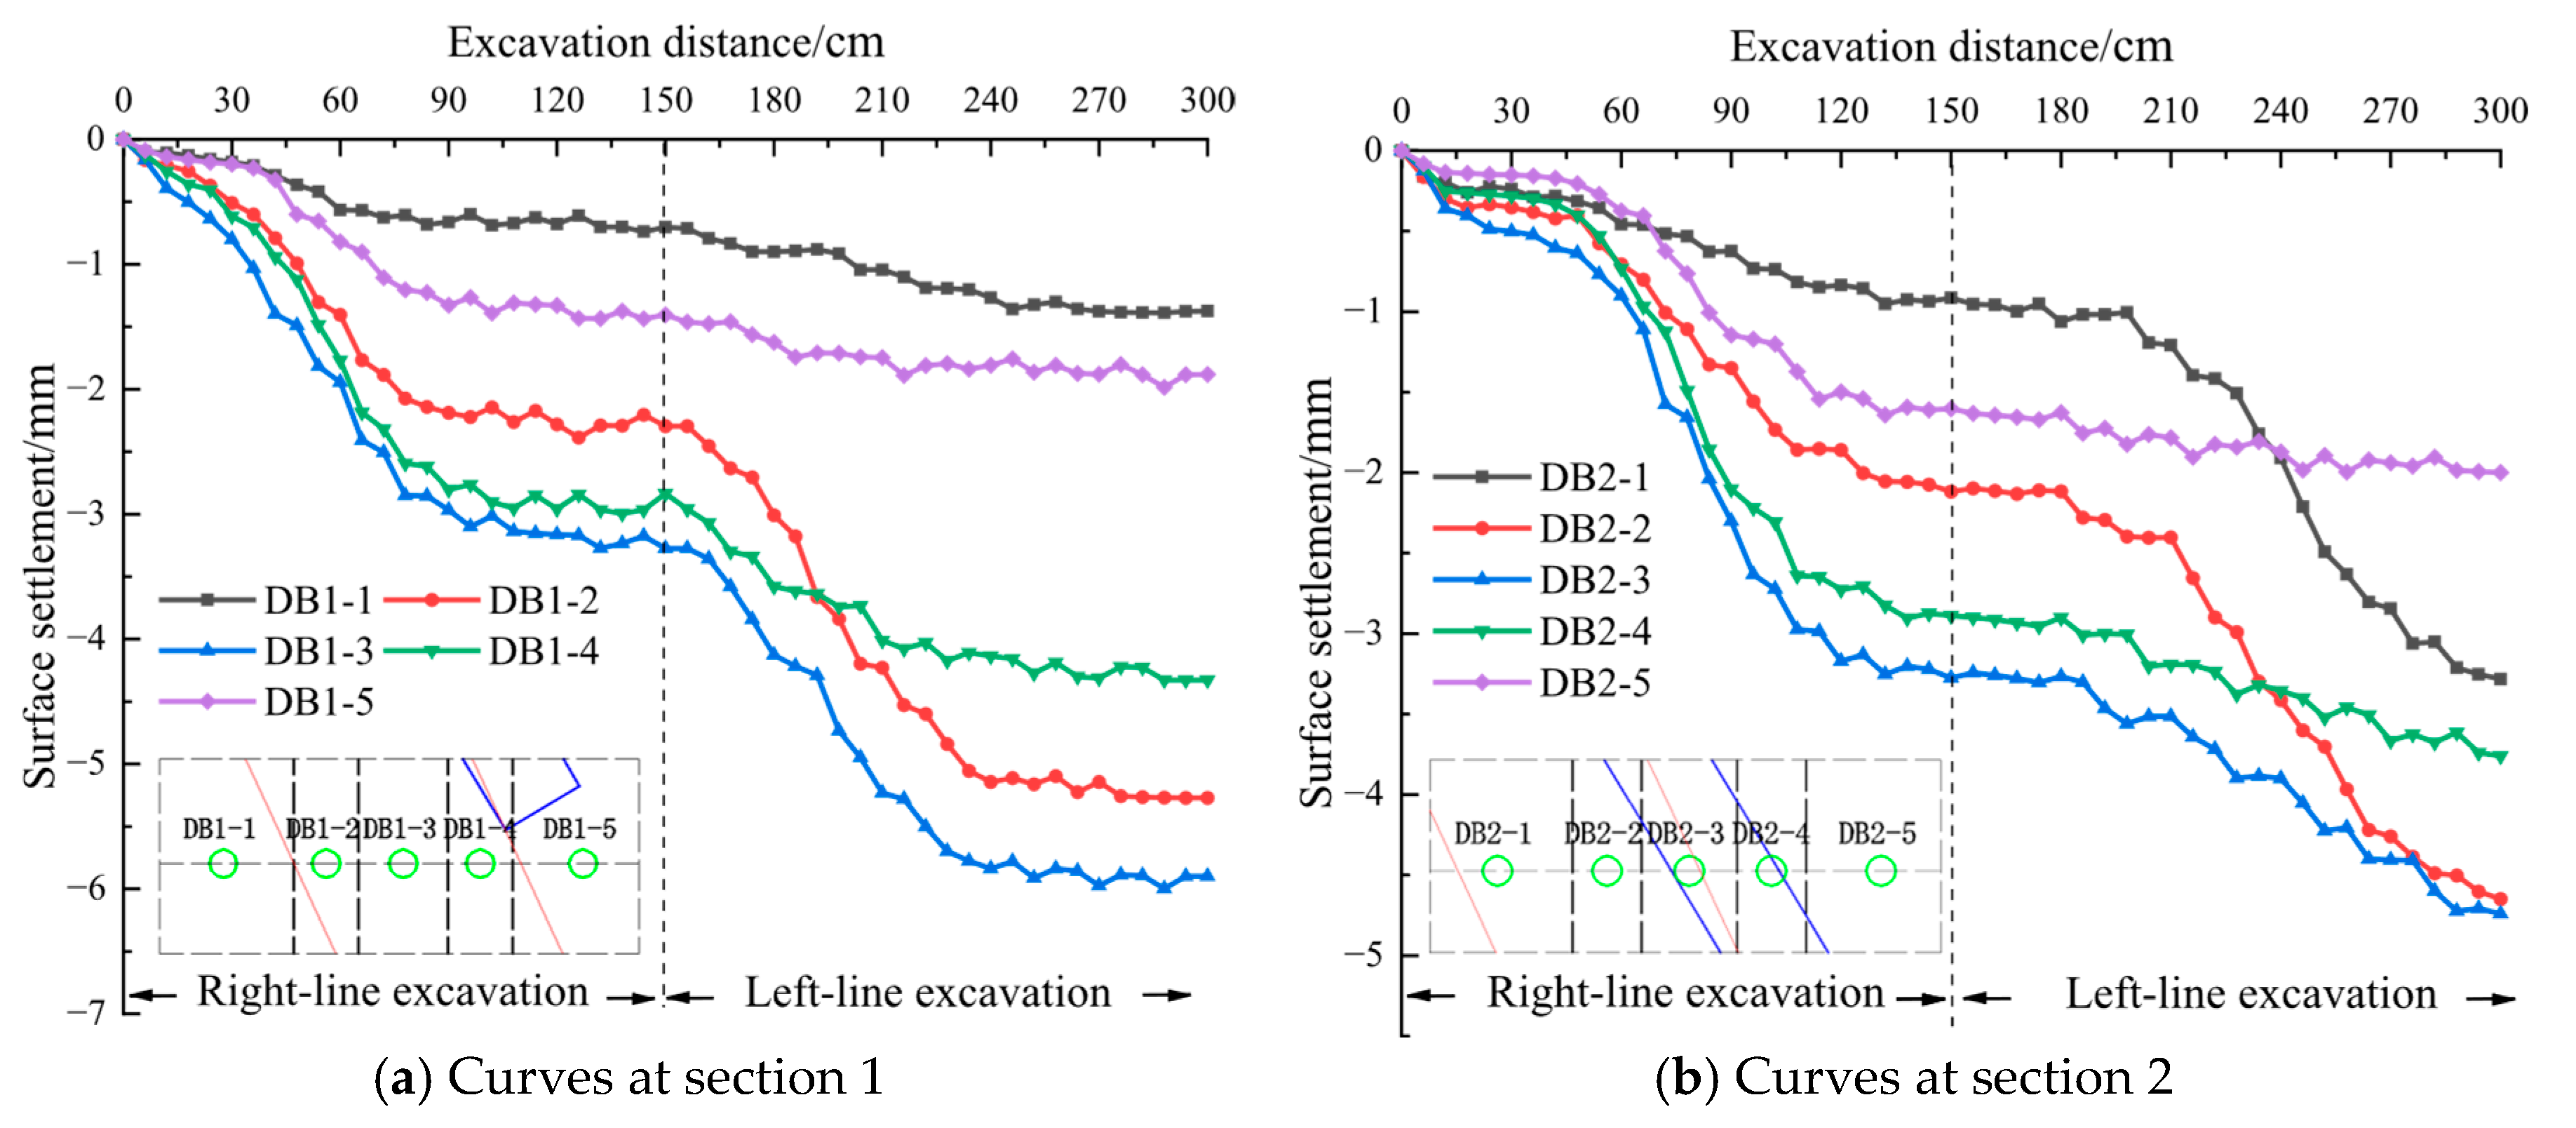
The surface settlement curves for the first and second monitoring sections during TBM excavation are shown in Figure 8. Advance distances of 0–150 cm and 151–300 cm correspond to the right-line excavation phases and the left-line excavation phases, respectively.
Figure 8 shows the surface settlement–time curves at monitoring sections 1 and 2 during TBM excavation. Settlement increased with advance and stabilized after the face passed each section. At 30 cm (section 1), the DB1 series recorded pronounced settlements at DB1-2 (0.51 mm), DB1-3 (0.81 mm), and DB1-4 (0.62 mm), with smaller values at DB1-1 (0.18 mm) and DB1-5 (0.20 mm). At 45 cm, the DB2 series points showed settlements ranging from 0.21 mm to 0.64 mm. At 75 cm (section 2), settlement rates rose, especially at DB1-4 and DB2-3.
After excavation reached about 3.5 times the tunnel diameter, settlement stabilized with segment support and grouting. By the end of right-line excavation, the maximum DB1 settlement was 3.27 mm. Left-line excavation showed a similar trend, reaching stabilization near 225 cm. Final settlements were 1.38 mm, 5.27 mm, 5.90 mm, 4.33 mm, and 1.88 mm for DB1, and 3.28 mm, 4.65 mm, 4.74 mm, 3.76 mm, and 2.00 mm for DB2. The largest settlements occurred above the left-line and fractured zone, highlighting the geological impact on settlement distribution. The statistical indicators of surface settlement are presented in Table 3.
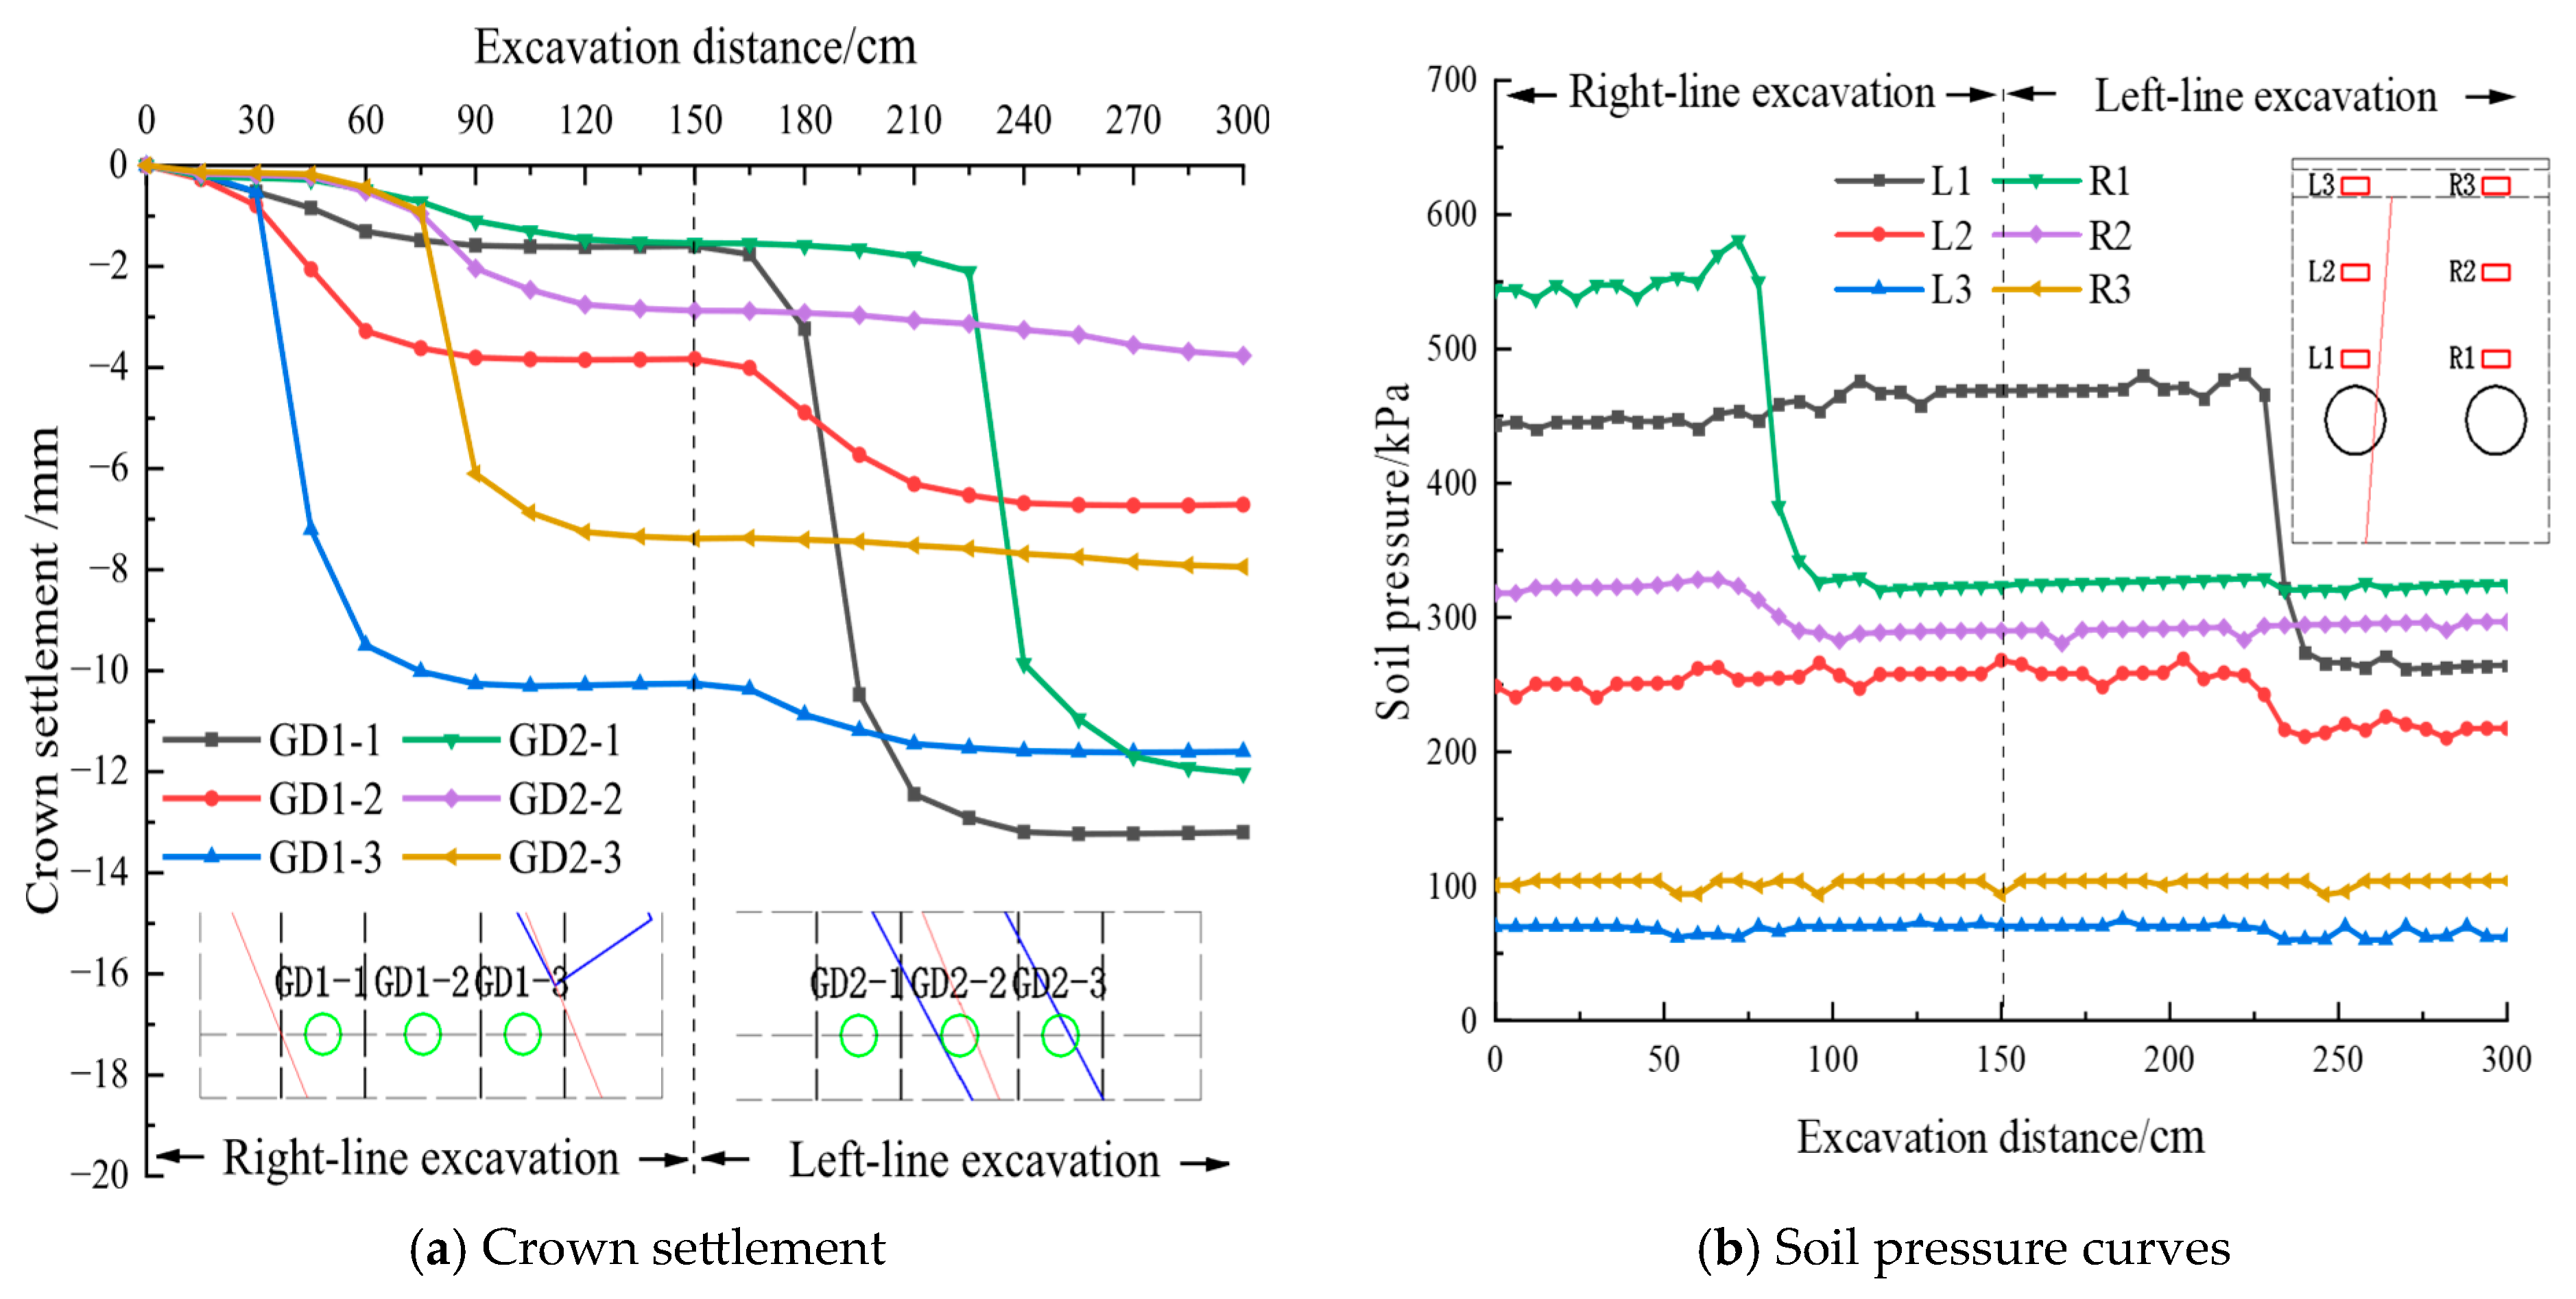
Figure 9a illustrates the crown settlement curve during excavation. Settlement increased gradually with tunneling. At 30 cm of advance, GD1-1 = 0.52 mm, GD1-2 = 0.79 mm, and GD1-3 = 0.53 mm. As the TBM passed section 1, crown settlement rose markedly, especially at GD1-3 above the right-line tunnel. At 75 cm of advance, settlements were GD1-1 = 1.48 mm, GD1-2 = 3.61 mm, GD1-3 = 10.01 mm, GD2-1 = 0.72 mm, GD2-2 = 0.96 mm, and GD2-3 = 0.91 mm. After the right-line excavation reached 105 cm, settlement stabilized. The left-line excavation showed a similar pattern: a rapid increase after the face passed the section, followed by stabilization once the advance exceeded about 3.5 tunnel diameters, indicating that crown deformation is concentrated within the excavation influence zone. The statistical indicators of crown settlement are shown in Table 4.
Figure 9b presents the soil-pressure evolution. Pressures were highest at depth (L1 and R1), with R1 beneath the building reaching 547 kPa. Middle-layer pressures (L2 and R2) were slightly lower, with R2 exceeding L2. Upper-layer pressures (L3 and R3) were the lowest due to the thinner cover. As TBM approached the monitoring section, pressure above the crown increased temporarily and then dropped sharply after the face passed, showing a characteristic increase-then-decrease response. The statistical indicators of soil-pressure values are shown in Table 5.
When a TBM excavation passes beneath a building, the primary causes of building damage are corner differential settlement and structural torsion. Han et al. defined the torsional deformation of buildings and provided the corresponding expression. For this study, the calculation formula is as follows [49]:
T W = S 4 S 1 S 3 S 2 B L
where TW: torsional deformation of the building; B, L: building width and length (mm); S1, S2, S3, S4: settlement values (mm) at building monitoring points JV1, JV2, JV3, and JV4, respectively.
The settlement values and torsional deformation at each monitoring point were extracted and converted according to the similarity ratio. Building settlements at each monitoring point, together with differential settlement and torsional deformation during excavation, are presented in Table 6 and Table 7.
The right-line tunnel produced larger settlements at the front monitoring points JV1 and JV2, whereas the left-line tunnel affected the rear points JV3 and JV4 more strongly.
At 75 cm of right-line advance, the differential settlement between S4 and S1 was relatively large, reaching –2.31 mm. Upon completion of the right tunnel excavation, the differential settlement between monitoring points decreased, primarily because the latter half of the right tunnel excavation had a greater influence on the rear monitoring points of the building; however, the settlement difference between S4 and S1 remained relatively large at –1.64 mm. When the left tunnel was excavated to 75 cm, the differential settlement between monitoring points increased again, with the difference between S4 and S1 still relatively large at –2.29 mm. Following completion of the left-hand excavation, differences decreased in a similar manner, but the difference between S3 and S2 was relatively large, reaching 1.97 mm.
The torsional deformation values were negative, indicating that from the start of the right-line tunneling to 75 cm of the left-line advance, the building’s torsional deformation increased progressively. As the latter half of the left tunnel excavation was completed, the torsional deformation gradually decreased.
Overall, the maximum settlement of the building was 5.09 mm, below the 10 mm control limit, and the maximum differential settlement was 2.31 mm, below the 0.002 L limit. These results indicate that the building remained within safety limits; nevertheless, continued monitoring during construction is advised to mitigate potential risks.
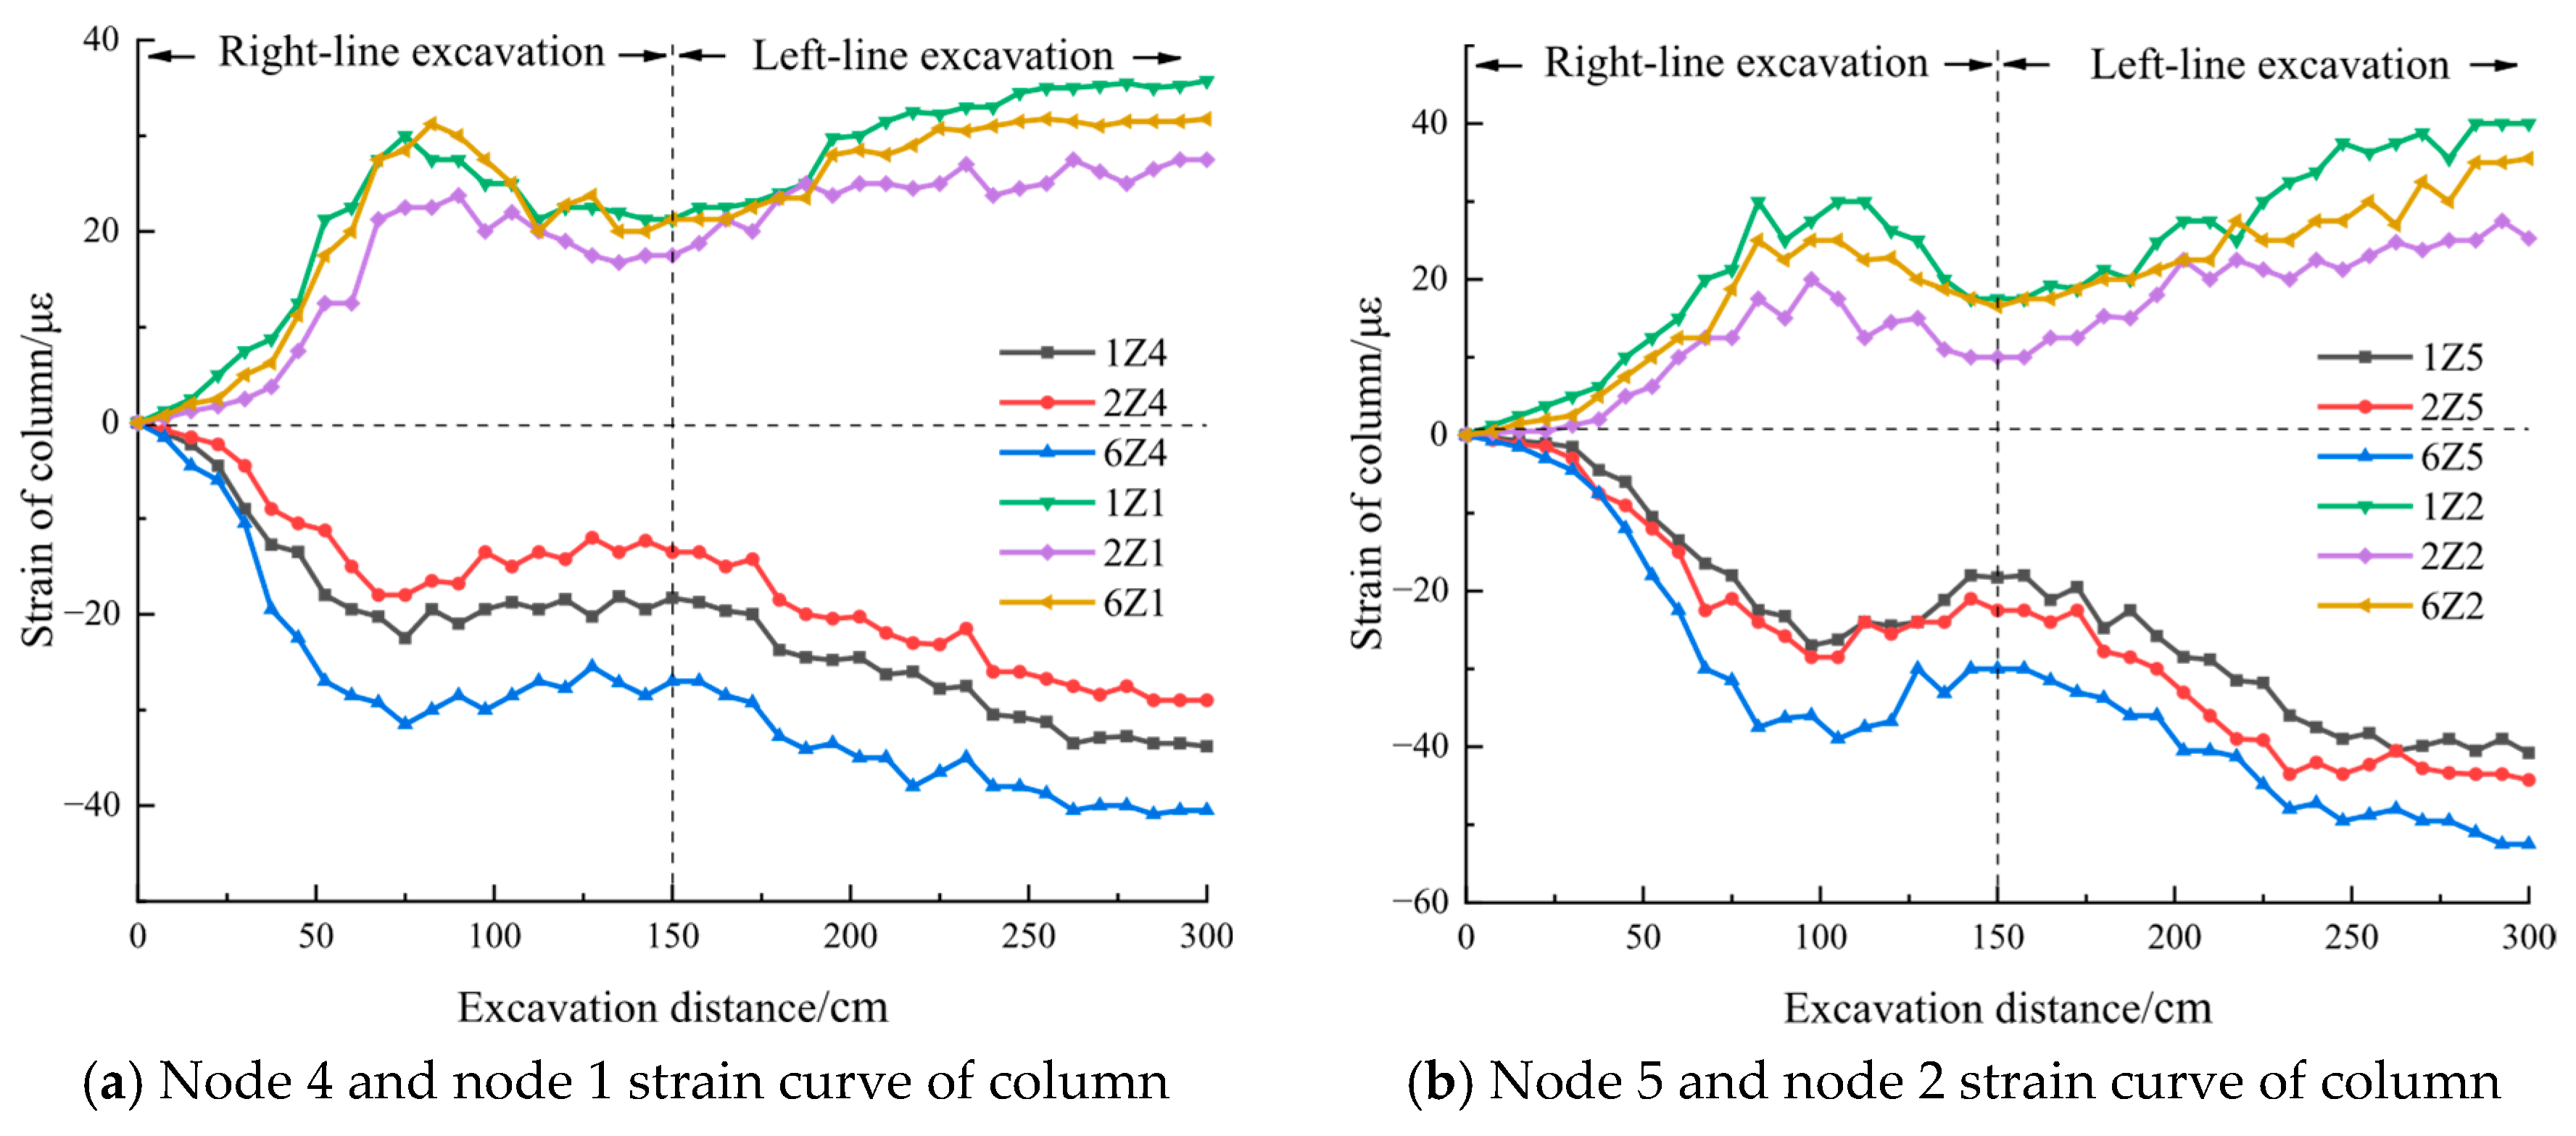
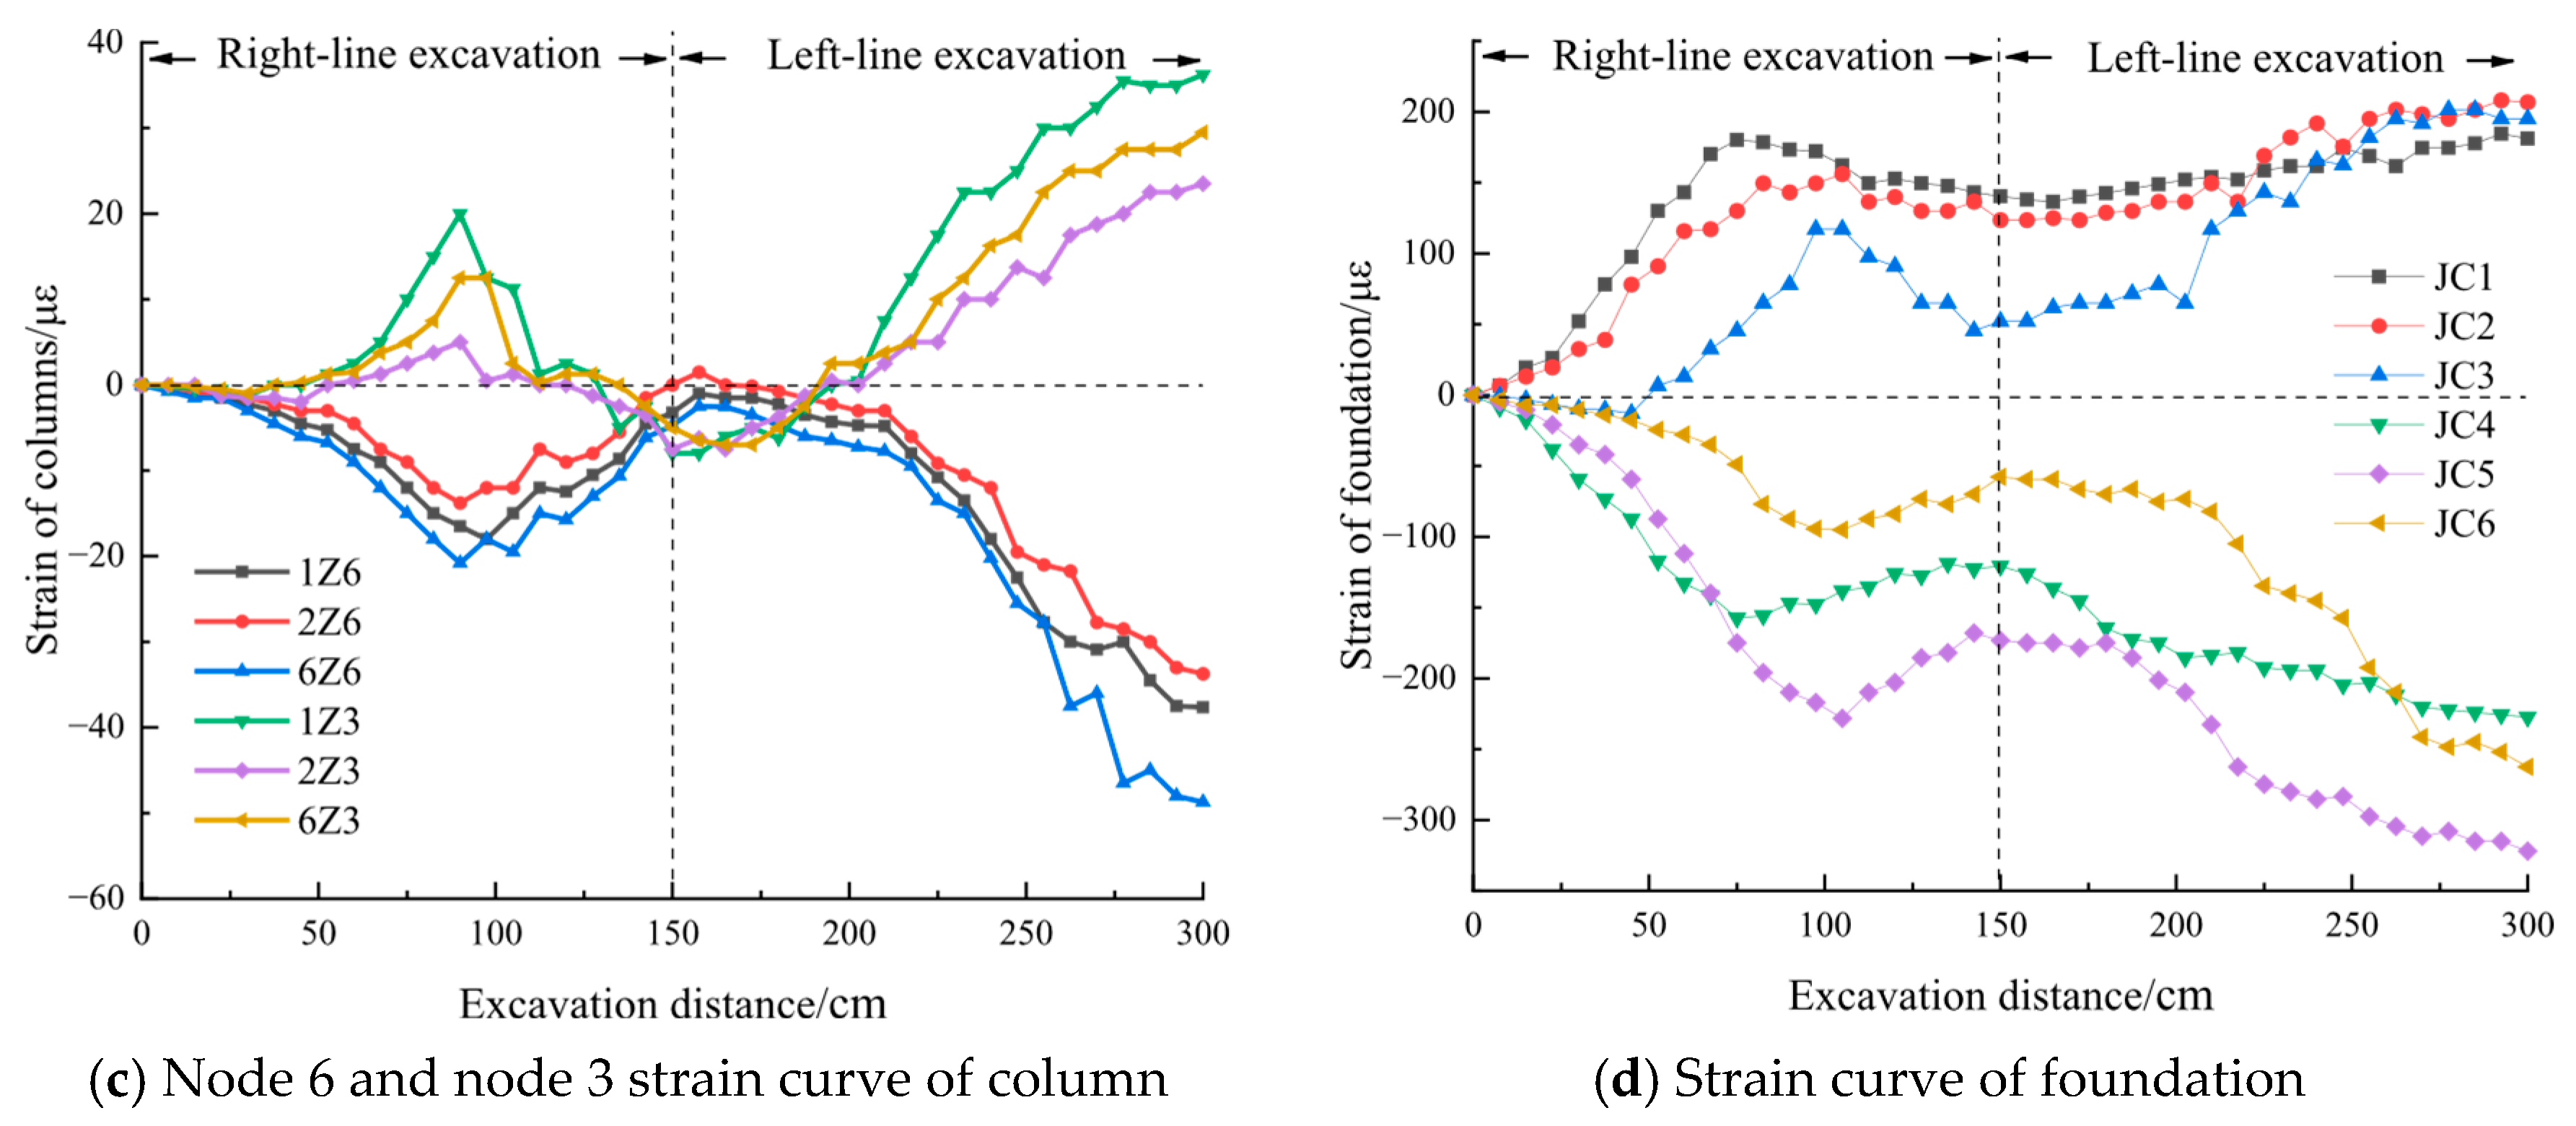
Figure 10 shows the strain response of the frame columns and foundations during TBM excavation.
The strain patterns closely follow the building’s surface settlement distribution. During the right-line tunneling phase, significant strain changes were observed at nodes 4, 1, 2, and 5, which are located near the right line. Since nodes 4 and 5 are above the fractured zone, where the stratum is weaker and settlement is larger, these areas primarily experience compressive strain, while nodes 1 and 2, located in relatively less affected areas, exhibit tensile strain. As TBM excavation continued and the face passed progressively beneath, settlement at nodes 4 and 1 stabilized, while settlement at nodes 3 and 6, farther from the right line, increased, causing a slight backward tilting of the building. During this phase, because of the frame’s overall stiffness, nodes 4 and 5, initially in compression, transitioned to tension, while nodes 1 and 2 shifted from tension to compression, indicating a reversal of the stress state. As shown in Table 8, the statistical indicators of foundation strain values are provided.
The strain development during the left-line excavation follows a trend similar to that of the right line. Nodes 4, 5, and 6 experience compressive strain, while nodes 1, 2, and 3 exhibit tensile strain, with strain values continuing to increase.
It is important to note that the strain distribution in the frame columns does not decrease monotonically from top to bottom. This pattern is influenced by the superstructure load distribution, the location of the fractured zone, the tunneling direction, and ground-settlement characteristics, reflecting the complexity of the column strain response. Therefore, during TBM construction, monitoring of key nodes and members should be strengthened to ensure the structural safety of the overlying building.
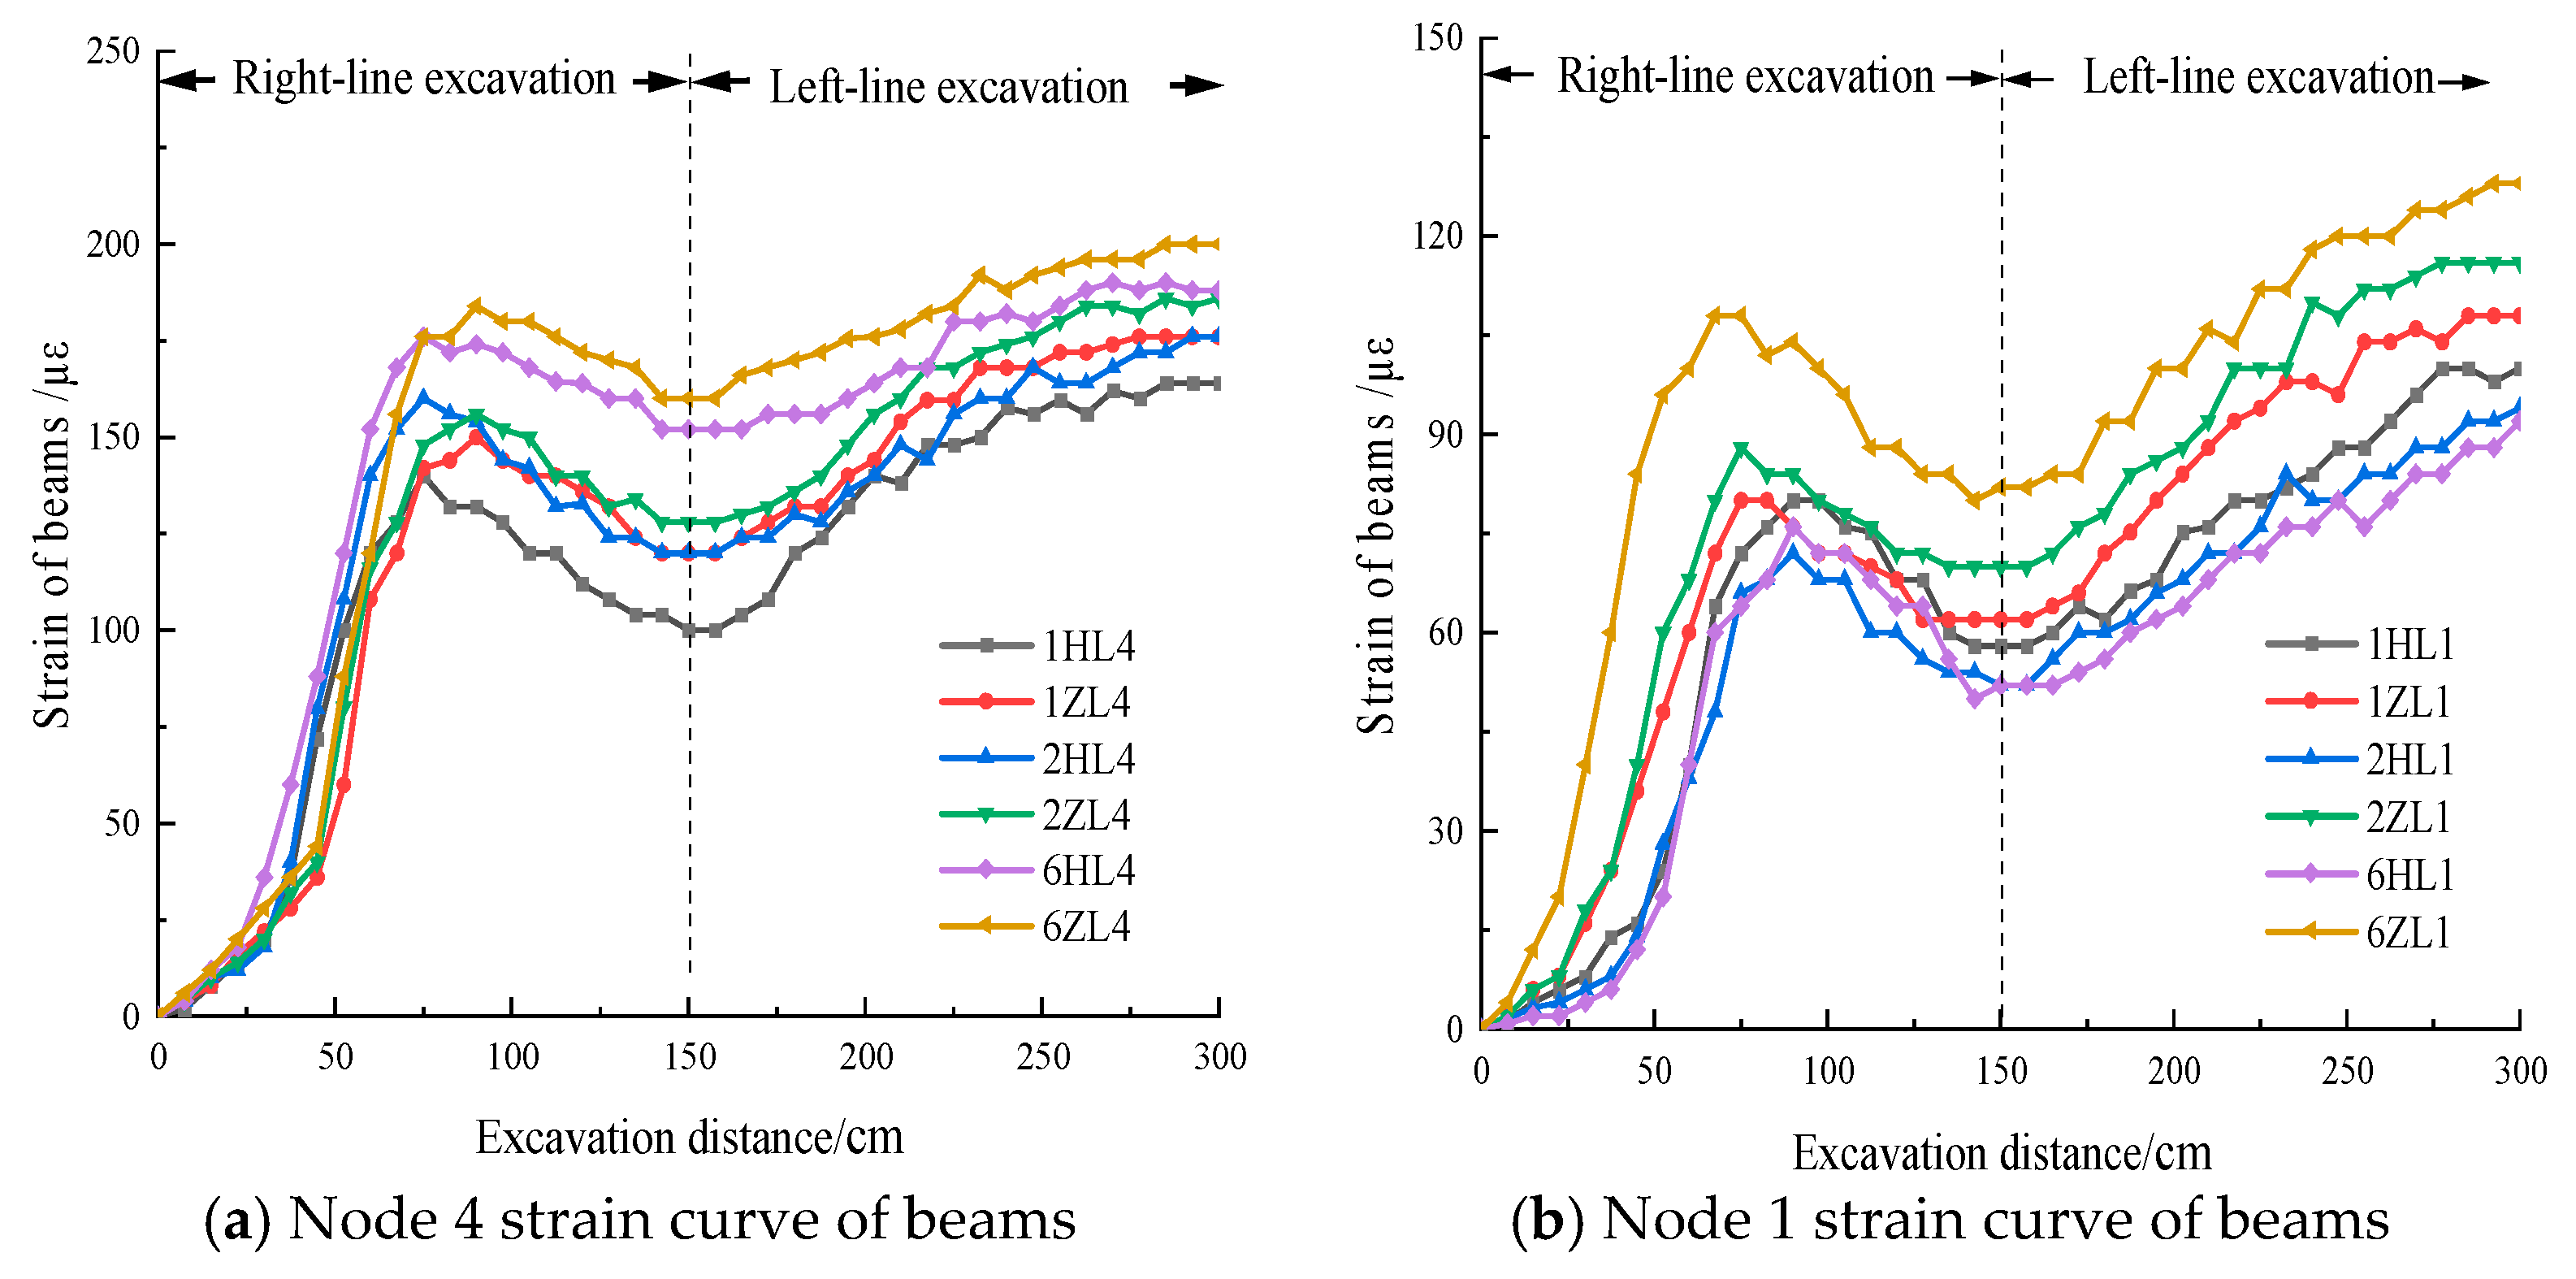
Figure 11 shows the beam strain evolution at building nodes 4 and 1. The strain trends at each node during TBM excavation are consistent with the building’s settlement distribution. During right-line excavation, nodes 4 and 1, above the right line, experienced greater disturbance, resulting in larger strain responses. Strains were larger on the upper floors than on the lower floors, reflecting the load concentration on the top floor. The strain at node 4, above the fractured zone, is higher than at node 1, confirming the building’s tilt towards the fractured zone. Beam strain evolution is influenced by both ground disturbance and the building’s load distribution and structural layout. In engineering practice, particular attention should be paid to strain evolution at beam–column nodes above the fractured zone. Table 9 displays the statistical indicators of the values related to beam strain.

5. Numerical Model

To further investigate the impact of TBM construction on the strata and the building, numerical simulations of the TBM excavation process were performed in ABAQUS. The results were then compared with and validated against model test data.

5.1. The Establishment of Numerical Models

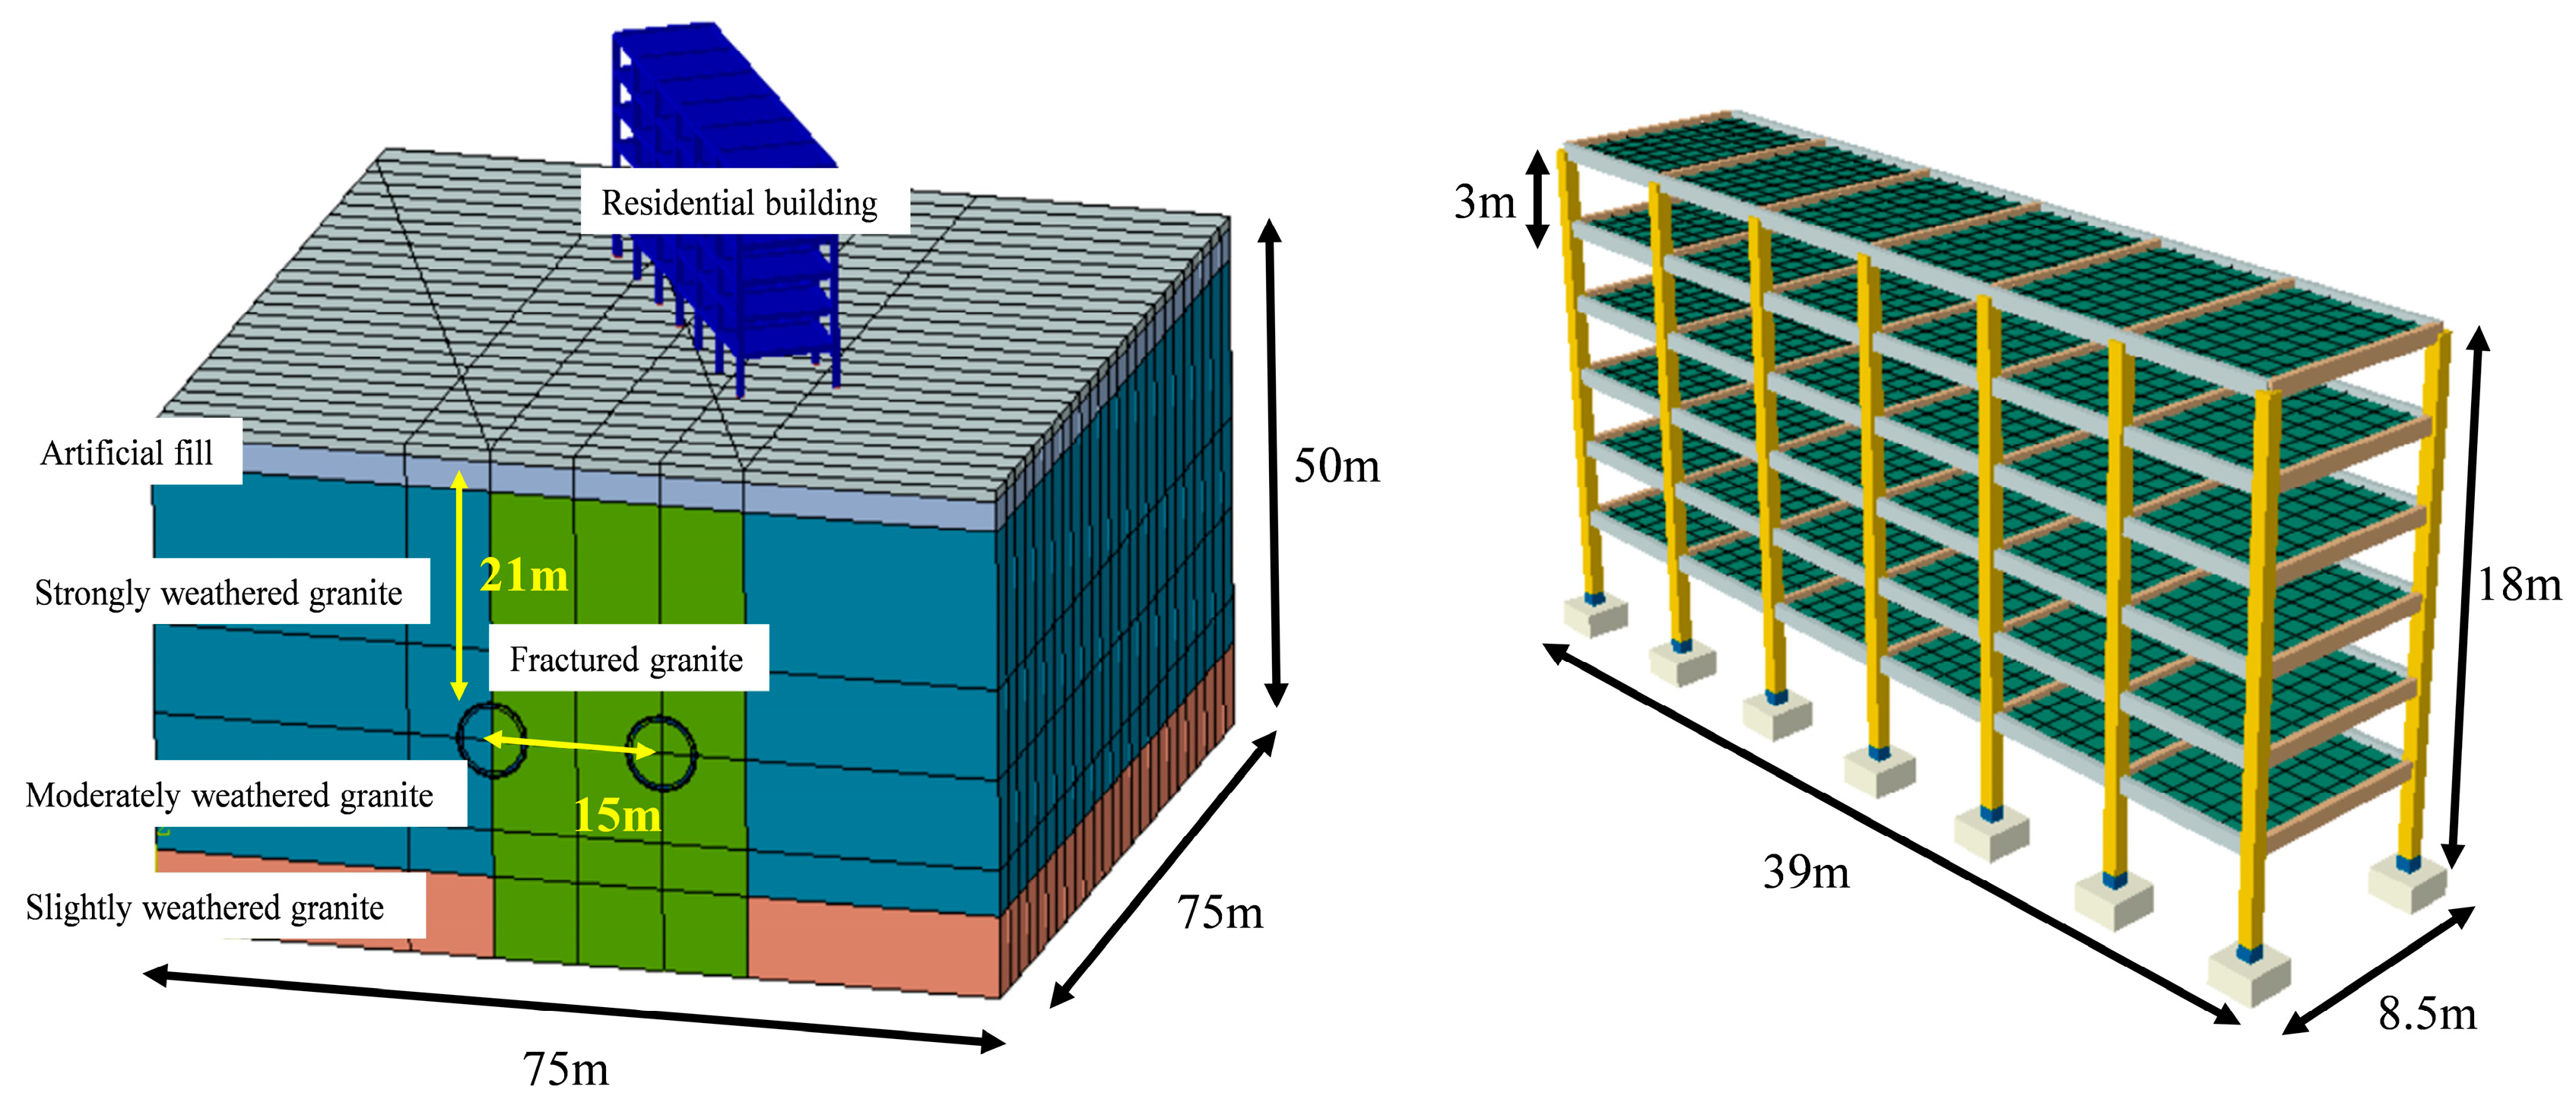
To account for size effects, the model has a length of 75 m in the x-direction, 75 m in the y-direction, and 50 m in the z-direction. The numerical model uses 3D solid, shell, and beam elements. Geomaterials follow the Mohr–Coulomb model, and structural components are modeled as linear elastic. Physical and mechanical parameters for the ground, tunnel, and building are listed in Table 10. The computational model is shown in Figure 12.

5.2. Mesh Generation, Boundary Conditions, and Simulation Steps

The model comprises 270,869 elements, including 267,439 solid elements, 1162 beam elements, and 2268 shell elements. The top surface is free of constraints, the side boundaries are restrained in the normal direction, and the bottom boundary is fixed to restrict displacement in all directions.
Each tunnel is 75 m long, with segment rings 1.5 m in length. To improve computational efficiency, excavation was divided into 1.5 m steps, with the right-hand tunnel excavated before the left-hand tunnel. The construction sequence was as follows:
  • The lining segments, shield, and grouting layer are deactivated. Gravity and boundary conditions are applied, the building is activated, its loads are imposed, and the initial stress equilibrium is established.
  • Stress release is simulated using the modulus-softening method. After reducing the elastic modulus by 40%, excavation is performed with the model change technique. During excavation, thrust and jacking pressure are applied at the face, while the cutterhead, front shield, and tail shield are progressively generated.
  • When excavation reaches the TBM length, lining segments are installed sequentially, and a grouting pressure of 0.3 MPa is applied between the segments and the tunnel wall.
  • After the lining extends 20 rings beyond the tail shield, backfilling is simulated by adjusting the grouting parameters.
  • The process is repeated until both tunnels are completed.

5.3. Comparative of Numerical Simulation, Model Test Results, and Monitoring

The simulated displacement values of the surface settlement, crown settlement, and building response at each monitoring point were extracted for both the completion of right-line and left-line excavation. These values were then compared with model test data and field monitoring results, as shown in Figure 13.
In Figure 13, N, M, and C represent the numerical simulation, model test, and construction monitoring, respectively, while R and L represent the right-line and left-line excavation phases. The three methods show generally consistent displacement trends, although some differences exist in specific values.
These discrepancies can be attributed to fluctuations in the curing conditions of the similarity materials in the model test, disturbances and interruptions during excavation, limitations in monitoring equipment accuracy, and idealized treatments of soil properties, boundary conditions, and construction conditions in the numerical simulation. Despite these deviations, errors are small with negligible influence on the overall response. More importantly, the consistent deformation trends confirm the reliability and applicability of the model, indicating that the simulations can reasonably capture strata and building responses during TBM construction. Therefore, the numerical results not only supplement the model tests but also provide practical guidance for engineering practice.
Errors for each monitoring series were compiled, and the results are reported in Table 11. Sim-Field Error % (R/L) denotes the relative error between the numerical simulations and field monitoring for the right-hand and left-hand tunnels, respectively. Test-Field Error % (R/L) denotes the relative error between the model tests and field monitoring for the right-hand and left-hand tunnels. All errors are within 30%, supporting the reliability of both the numerical simulations and the model-test results.
It should be noted that we adopted the Mohr–Coulomb model to balance fidelity and parsimony. It requires a limited, well-constrained parameter set that was available from site investigation and the materials used in the model tests, and it is robust for serviceability-level responses dominated by stiffness contrasts and volume loss. The modified Mohr–Coulomb model can better represent Lode-angle dependence and strength-envelope rounding, but it demands additional calibration data (e.g., multi-axis triaxial tests and reliable dilation characterization) that were not available for the composite strata and fractured zone. Using Mohr–Coulomb may over- or underestimate the plastic-zone extent and dilation, affecting peak settlement magnitude. Nevertheless, the close agreement in deformation trends among simulations, model tests, and field monitoring supports the adequacy of the chosen model for the study’s objectives.

5.4. Sensitivity Analysis

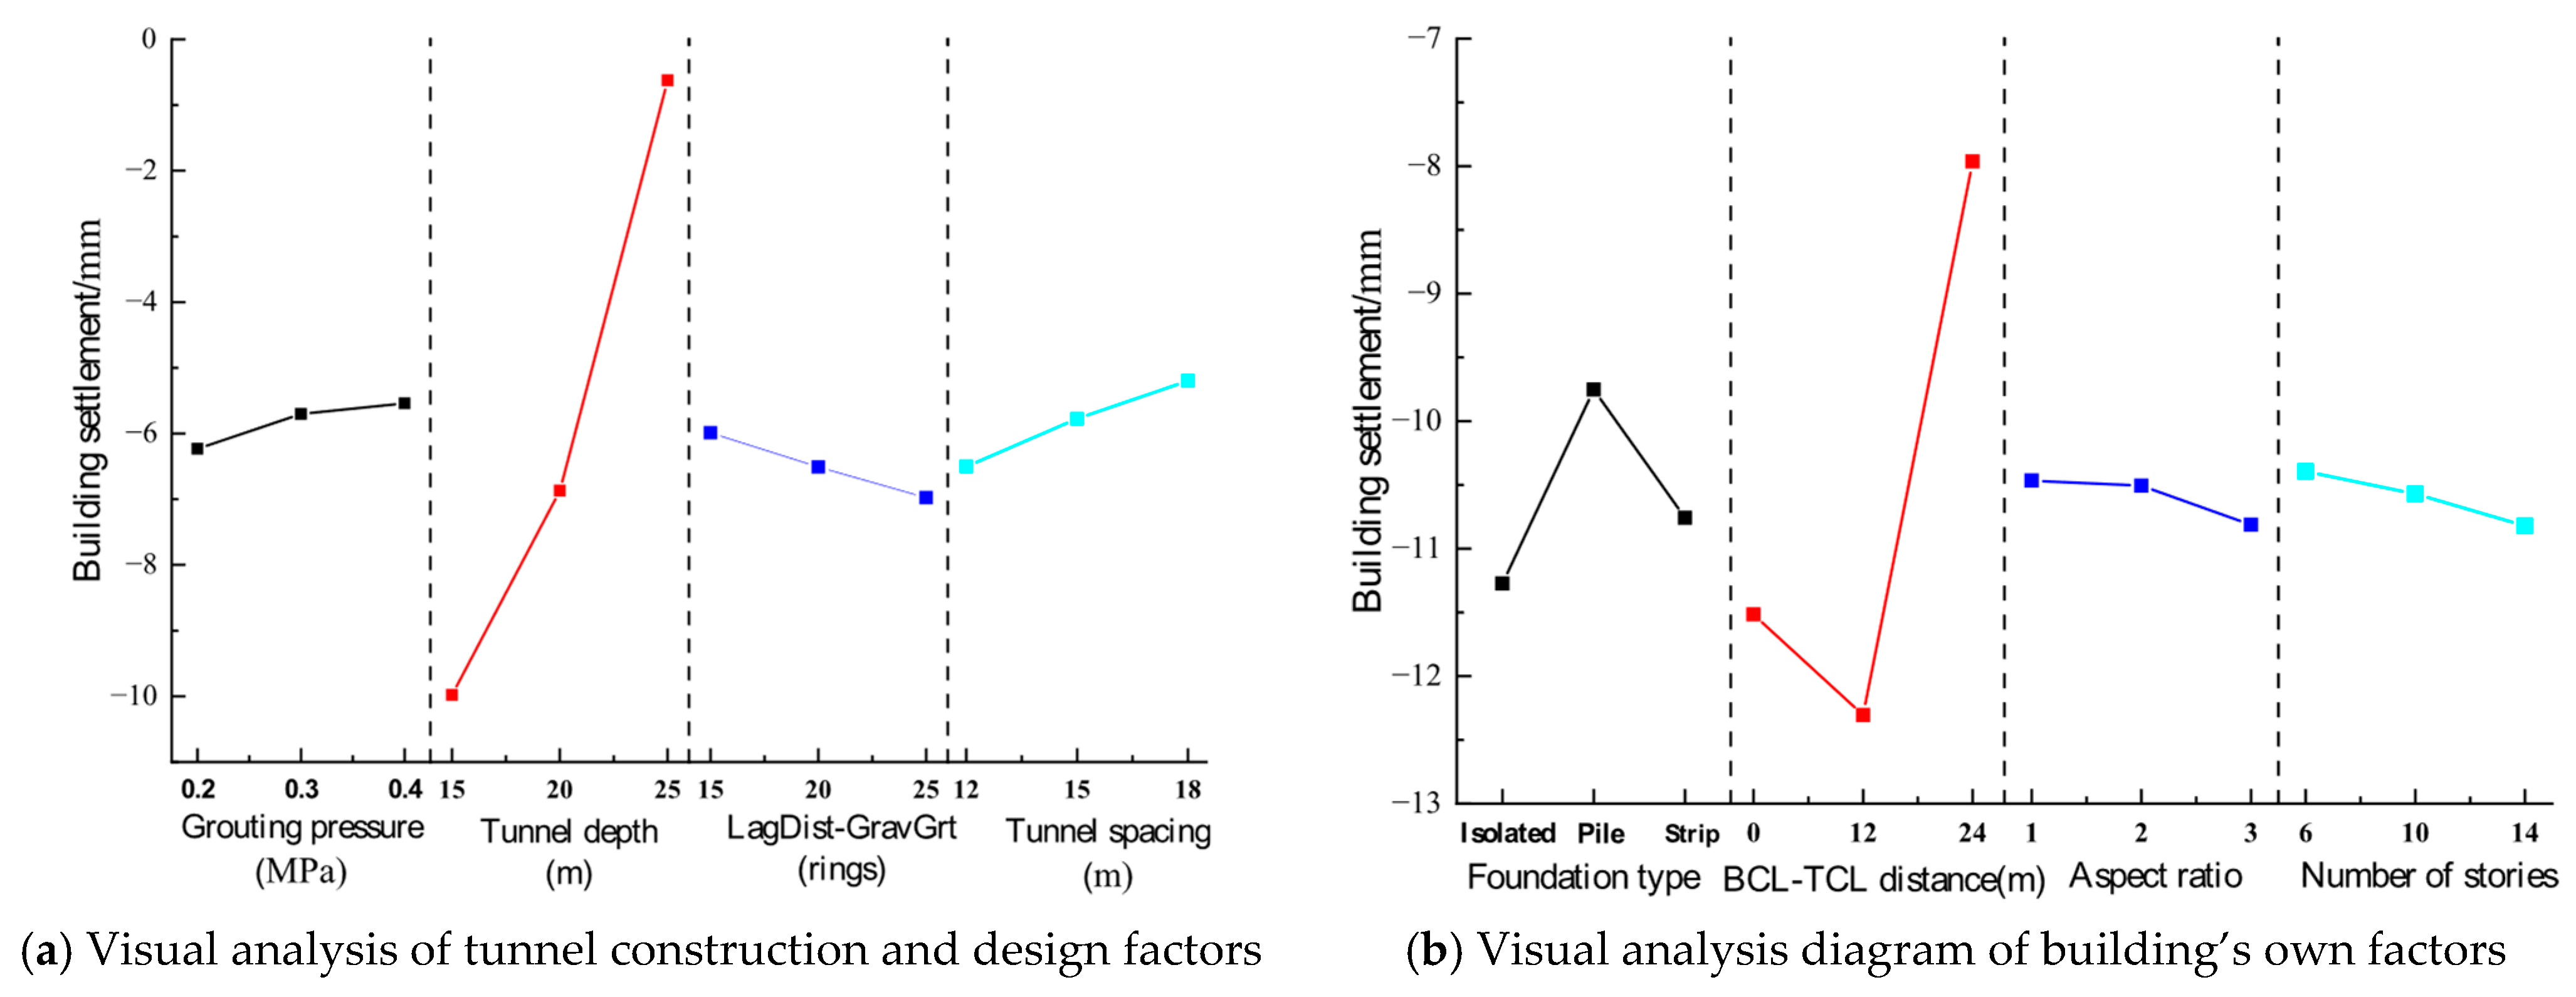
The study considered the following factors: the grouting pressure (0.2, 0.3, and 0.4 MPa), tunnel depth (15, 20, and 25 m), lag distance of gravel grouting (LagDist-GravGrt) (15, 20, and 25 rings), tunnel spacing (12, 15, and 18 m), foundation type (isolated, pile, and strip), distance between the building centerline and tunnel centerline (BCL-TCL distance) (0, 15, and 30 m), building aspect ratio (one, two, and three), and number of stories (6, 10, and 14).
To evaluate the influence of these parameters, an orthogonal test design was adopted. Four factors at three levels were selected for both tunneling- and design-related parameters, as well as for building-related parameters. The orthogonal design schemes are summarized in Table 12 and Table 13.
The maximum building settlements for cases 1–9 were 11.23, 6.88, 0.59, 8.88, 7.61, 0.62, 9.83, 6.12, and 0.67 mm, respectively. For cases a–i, the maximum settlements were 12.64, 12.87, 8.31, 10.38, 11.56, 7.31, 11.53, 12.49, and 8.26 mm. Maximum settlement was used as the evaluation criterion, and the effects of tunneling-, design-, and building-related parameters were analyzed. Figure 14 presents the intuitive comparison of factor influences, and the detailed results are listed in Table 14 and Table 15.

5.5. Deformation Control Measures

Based on the factor-analysis results, the largest building displacement occurred at a tunnel depth of 15 m, a grouting pressure of 0.2 MPa, a grouting lag of 25 rings, and a tunnel spacing of 12 m, with the building having an isolated foundation, an aspect ratio of three, and 14 stories. This combination represents the most critical undercrossing scenario. TBM tunneling beneath buildings tends to induce surface and structural settlement, and excessive disturbance may compromise structural safety. In this study, three reinforcement schemes were evaluated:
  • Foundation reinforcement: Foundation-zone grouting with a plan width of 34 m and a thickness of 2 m beneath the foundation was evaluated;
  • Crown reinforcement: Tunnel crown grouting beneath the building across 180° of the crown, 3 m thick and 14 m in length was evaluated;
  • Sensitivity analysis shows that tunnel depth, grouting pressure, and the relative position between building and tunnel are the dominant factors affecting building settlement, highlighting their importance for risk control and design optimization.
  • Isolation reinforcement: An isolation barrier of drilled, grouted piles 1.0 m in diameter at 1.2 m spacing, 25 m long, located 2 m outside the building perimeter was evaluated.
The reinforced areas are shown in Figure 15. In the simulations, grouted zones were represented by doubling the soil parameters in the reinforced regions (Table 16), with other parameters as previously specified.
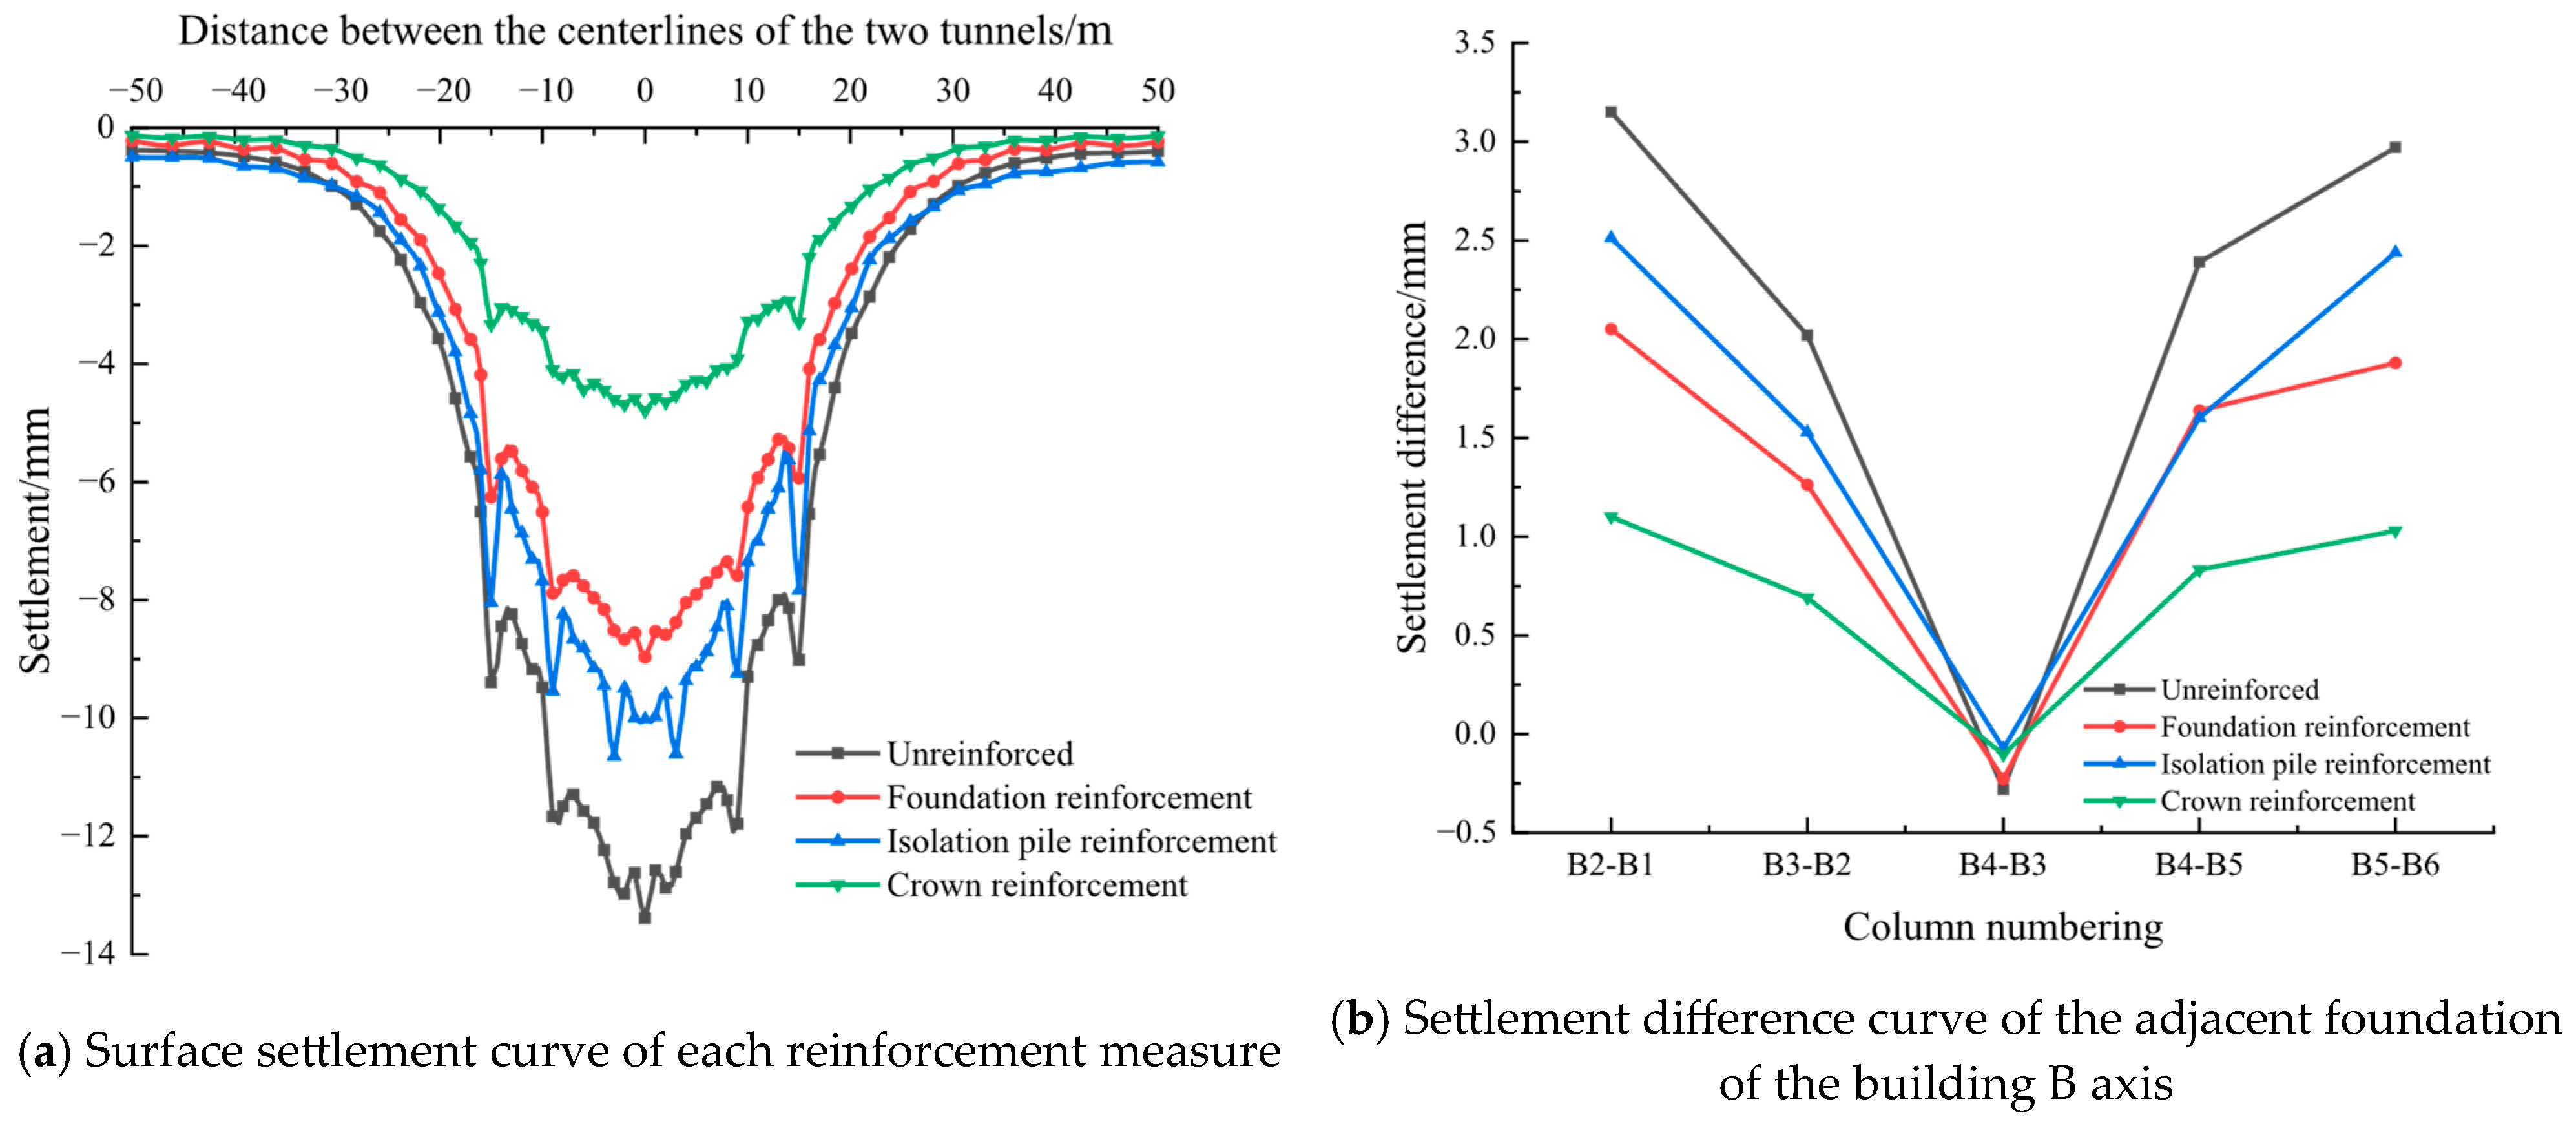
Figure 16 shows that different reinforcement measures have significant differences in controlling building settlement. Without reinforcement, the maximum settlement occurs at the centerline of both tunnels, reaching 13.39 mm. With foundation-zone grouting, the maximum settlement is reduced to 8.97 mm, a reduction of 4.42 mm, corresponding to a control rate of 33.01%. With isolation piles, the maximum settlement is 10.65 mm, with a control rate of 20.46%. Crown grouting is the most effective measure, reducing the maximum settlement to 4.80 mm, for a control rate of 64.15%.
Figure 16b shows that the building B axis settlement difference trends under each reinforcement scheme are generally consistent. At completion of the right-line excavation, the maximum settlement difference occurs between the foundations of B3 and B4, with the smallest settlement difference under crown grouting reinforcement, only 0.90 mm, achieving a control effect of 62.50%. After the left-line excavation, the overall settlement difference increases, with crown reinforcement still controlling the settlement most effectively (1.10 mm), followed by grouting beneath the foundation (2.05 mm), and isolation pile reinforcement being the least effective (2.51 mm).
In summary, crown grouting reinforcement is the most effective in controlling both settlement and settlement differences, followed by grouting beneath the foundation, while isolation pile reinforcement is relatively weak. When the tunnel passes directly beneath the building, crown grouting and foundation grouting reinforcement schemes are recommended as the priority.

6. Discussion

This study combines model tests and numerical simulations to systematically analyze the deformation characteristics of overlying strata and superimposed buildings during TBM multi-line tunnel construction under the condition of fractured zones, evaluate the influences of various factors on building settlement, and compare the control effects of different reinforcement measures.
Both the model tests and numerical simulations demonstrate that surface and crown settlements reach their maximum values in the area along the centerline between the two tunnels, gradually decreasing with increasing distance from the tunnel center, exhibiting a typical “larger in the middle and smaller on both sides” pattern. This trend is consistent with the Gaussian settlement trough distribution proposed by Peck [50] and the predictions based on elastoplastic theory by Loganathan and Poulos [51]. In addition, excavation of the left and right tunnel lines causes the settlement influence zones to overlap, resulting in crown settlements on both sides of the axis that exceed those along the centerline—an effect that is not pronounced in studies conducted in homogeneous strata or under conditions without building loads, as shown in Zhang et al. [52]. Furthermore, this study finds that the presence of a fractured zone significantly amplifies the magnitude of settlement, which is consistent with the findings of Zhang et al. [6] on shield tunneling through fault fracture zones, but with a quantitatively greater amplification, reflecting the combined effects of multi-line excavation and geological conditions.
Consistent with the findings of Han et al. [49] on building torsional deformation, this study likewise observed significant torsional deformation of buildings under uneven settlement, with the greatest settlement differential occurring on the fractured zone side. The strain distribution patterns of frame columns and beams agree with the tension–compression stress reversal phenomenon reported by Chiang and Lee [53] in their study on pile foundations affected by tunneling disturbances. However, unlike most numerical studies that only model the foundation or pile foundation, e.g., Marcel et al. [54], this study incorporated the complete superstructure frame in both the model tests and numerical simulations. It was found that the overall structural stiffness exerts a regulatory effect on the distribution of settlement differentials, and that the strain concentration in the upper beams is more pronounced than in studies considering only foundation models.
However, this study has certain limitations: Constrained by laboratory conditions, a relatively large similarity ratio was adopted in the tests, which inevitably introduced partial boundary effects. It failed to explicitly represent the interfaces between different soil and rock layers, the characteristics of intra-soil joint systems, and groundwater. Although different properties were assigned to soil layers to capture such differences, the local shear slip and strain concentration along discrete joints may have been smoothed, leading to deviations in the localization of peak stresses. The neglect of groundwater meant that pore pressure dissipation and effective stress changes were not characterized, and long-term settlement and grouting pressure diffusion may be underestimated. Future work will incorporate jointed rock mass or damaged plasticity models and account for groundwater coupling to enhance the ability to predict local mechanisms and long-term responses.

7. Conclusions

This study investigates the deformation effects of multi-line TBM tunnel construction on overlying buildings and the surrounding surface by model tests and numerical simulations, and also examines the effectiveness of various reinforcement measures in controlling building deformation. The key findings are as follows:
  • After TBM excavation, surface settlement is larger in the center and smaller on both sides, with increased settlement closer to the tunnel centers and above the fractured zone. Settlement near the building is also greater. Before reaching the monitoring section, slight settlement occurs, which increases after passing the section. Once excavation exceeds 3.5 times the tunnel diameter, settlement stabilizes. The results show minimal deviation from numerical simulations and field monitoring, with consistent trends across all methods.
  • The strain patterns of the building’s frame columns, beams, and foundation align with the settlement patterns. On the fractured zone side, compression occurs at the foundation and outer columns, while tension is observed on the opposite side. Strain values are influenced by factors such as load distribution, fractured zone position, and strata settlement, resulting in complex strain variations in the building’s components.
  • Sensitivity analysis shows that the tunnel depth, grouting pressure, and the relative position between the building and tunnel are the dominant factors affecting building settlement, highlighting their importance for risk control and design optimization.
  • Reinforcement measures such as grouting beneath the foundation, isolation piles, and crown grouting can all mitigate the structural response to excavation disturbances to varying degrees. Among these, crown grouting is the most effective in controlling settlement magnitude and deformation differences, and is recommended as the preferred method when tunneling directly beneath the building.

Author Contributions

Y.W.: Investigation, Methodology; Resources, Data curation, Methodology, Project administration, Writing—review and editing; R.H.: Conceptualization, Formal analysis, Methodology, Visualization, Writing—original draft; T.Z.: Methodology; D.H.: Data curation; Z.X.: Conceptualization, Methodology. All authors have read and agreed to the published version of the manuscript.

Funding

This research was funded by Natural Science Foundation of Shandong Province of China grant number [ZR2021QD061] and [ZR2024QD113].

Data Availability Statements

The data presented in this study are available on request from the corresponding author.

Acknowledgments

The authors would like to acknowledge the financial support from the Natural Science Foundation of Shandong Province of China (Grant Nos. ZR2021QD061 and ZR2024QD113).

Conflicts of Interest

The authors declare no competing interests.

References

  1. Akl, S.A.Y.; Kohail, A.; Shazly, M.; Abukiefa, M. Testing and modeling clay behavior subjected to high strain rate loading in a tunneling problem. Ain Shams Eng. J. 2022, 13, 101764. [Google Scholar] [CrossRef]
  2. Fang, Q.; Du, J.-M.; Li, J.-Y.; Zhang, D.-L.; Cao, L.-Q. Settlement characteristics of large-diameter shield excavation below existing subway in close vicinity. J. Cent. South Univ. 2021, 28, 882–897. [Google Scholar] [CrossRef]
  3. Fang, Q.; Zhang, D.; Li, Q.; Wong, L.N.Y. Effects of twin tunnels construction beneath existing shield-driven twin tunnels. Tunn. Undergr. Space Technol. 2015, 45, 128–137. [Google Scholar] [CrossRef]
  4. Jin, D.; Yuan, D.; Li, X.; Zheng, H. Analysis of the settlement of an existing tunnel induced by shield tunneling underneath. Tunn. Undergr. Space Technol. 2018, 81, 209–220. [Google Scholar] [CrossRef]
  5. Lin, X.-T.; Chen, R.-P.; Wu, H.-N.; Cheng, H.-Z. Deformation behaviors of existing tunnels caused by shield tunneling undercrossing with oblique angle. Tunn. Undergr. Space Technol. 2019, 89, 78–90. [Google Scholar] [CrossRef]
  6. Zhang, X.; Cheng, H.; Xu, Y.; Li, H. A case study on performances of overlying pipelines due to shallow tunnels excavation in water-rich gravel ground. Ain Shams Eng. J. 2022, 13, 101746. [Google Scholar] [CrossRef]
  7. Zhao, R.; Zheng, Y.; Guo, Y.; Luan, S.; Zhang, S. Experiments Studying the Instability Process of a Subway Tunnel in Soil–Rock Composite Strata Influenced by Defects. Buildings 2025, 15, 878. [Google Scholar] [CrossRef]
  8. Cao, L.; Zhang, D.; Fang, Q.; Yu, L. Movements of ground and existing structures induced by slurry pressure-balance tunnel boring machine (SPB TBM) tunnelling in clay. Tunn. Undergr. Space Technol. 2020, 97, 103278. [Google Scholar] [CrossRef]
  9. Wang, Z.; Feng, W.; Wu, S.; Wu, P.; Xu, S.; Yao, Z.; Sun, J. Research on Strata Deformation Induced by EPB Tunneling in Round Gravel Stratum and Its Control Technology. Appl. Sci. 2022, 12, 10553. [Google Scholar] [CrossRef]
  10. Lin, Q.; Lu, D.; Lei, C.; Tian, Y.; Gong, Q.; Du, X. Model test study on the stability of cobble strata during shield under-crossing. Tunn. Undergr. Space Technol. 2021, 110, 103807. [Google Scholar] [CrossRef]
  11. Gue, C.Y.; Wilcock, M.J.; Alhaddad, M.M.; Elshafie, M.Z.E.B.; Soga, K.; Mair, R.J. Tunnelling close beneath an existing tunnel in clay—Perpendicular undercrossing. Geotechnique 2017, 67, 795–807. [Google Scholar] [CrossRef]
  12. Islam, M.S.; Iskander, M. Twin tunnelling induced ground settlements: A review. Tunn. Undergr. Space Technol. 2021, 110, 103614. [Google Scholar] [CrossRef]
  13. Junjie, J.; Wenhao, S.; Yuan, W. A risk assessment approach for road collapse along tunnels based on an improved entropy weight method and K-means cluster algorithm. Ain Shams Eng. J. 2024, 15, 102805. [Google Scholar] [CrossRef]
  14. Junwei, Z.; Xutao, Z.; Yang, T. Analytical solution for deep pressure tunnels using composite stratum under a groundwater table. Ain Shams Eng. J. 2021, 12, 1419–1434. [Google Scholar] [CrossRef]
  15. Franzius, J.N.; Potts, D.M.; Addenbrooke, T.I.; Burland, J.B. The influence of building weight on tunnelling-induced ground and building deformation. Soils Found. 2004, 45, 166–167. [Google Scholar] [CrossRef][Green Version]
  16. Verruijt, A.; Booker, J.R. Surface settlements due to deformation of a tunnel in an elastic half plane. Géotechnique 1996, 46, 753–756. [Google Scholar] [CrossRef]
  17. Potts, D.M.; Addenbrooke, T.I. A Structure’s Influence on Tunnelling-Induced Ground Movements. Proc. Inst. Civ. Eng. Geotech. Eng. 1997, 125, 109–125. [Google Scholar] [CrossRef]
  18. Pinto, F.; Whittle, A.J. Ground Movements due to Shallow Tunnels in Soft Ground. I: Analytical Solutions. J. Geotech. Geoenviron. Eng. 2014, 140, 04013040. [Google Scholar] [CrossRef]
  19. Karakus, M. Appraising the methods accounting for 3D tunnelling effects in 2D plane strain FE analysis. Tunn. Undergr. Space Technol. 2007, 22, 47–56. [Google Scholar] [CrossRef]
  20. Bayati, M.; Khademi Hamidi, J. A case study on TBM tunnelling in fault zones and lessons learned from ground improvement. Tunn. Undergr. Space Technol. 2017, 63, 162–170. [Google Scholar] [CrossRef]
  21. Anato, N.J.; Chen, J.; Tang, A.; Assogba, O.C. Numerical Investigation of Ground Settlements Induced by the Construction of Nanjing WeiSanLu Tunnel and Parametric Analysis. Arab. J. Sci. Eng. 2021, 46, 11223–11239. [Google Scholar] [CrossRef]
  22. Hou, M.; Yang, C.; Yang, J.; Zeng, Y.; Zhu, Z. Analysis the Mechanical Response of Tunnels Under the Action of Vertical Jacking in Shield Construction and Research on Reinforcement. Buildings 2025, 15, 2321. [Google Scholar] [CrossRef]
  23. Zhang, C.; Gao, J.; Wang, Z.; Liu, C. Model Test on the Collapse Evolution Law of Tunnel Excavation in Composite Strata with a Cavity. Buildings 2024, 14, 932. [Google Scholar] [CrossRef]
  24. Fang, Q.; Liu, X.; Zeng, K.; Zhang, X.; Zhou, M.; Du, J. Centrifuge modelling of tunnelling below existing twin tunnels with different types of support. Undergr. Space 2022, 7, 1125–1138. [Google Scholar] [CrossRef]
  25. Kim, S.; Burd, H.; Milligan, G. Model testing of closely spaced tunnels in clay. Geotechnique 1998, 48, 375–388. [Google Scholar] [CrossRef]
  26. Chenjie, L.I.; Bo, L.I.; Congan, L.I.; Zhipeng, W. Centrifuge Model Test of the Influence of Tunnel Excavation with Different Spacings on Existing Tunnels. In IOP Conference Series: Earth and Environmental Science; IOP Publishing: Bristol, UK, 2024. [Google Scholar]
  27. Boonyarak, T.; Ng, C.W.W. Three-dimensional influence zone of new tunnel excavation crossing underneath existing tunnel. Jpn. Geotech. Soc. Spec. Publ. 2016, 2, 1513–1518. [Google Scholar] [CrossRef]
  28. Lu, H.; Shi, J.; Wang, Y.; Wang, R. Centrifuge modeling of tunneling-induced ground surface settlement in sand. Undergr. Space 2019, 4, 302–309. [Google Scholar] [CrossRef]
  29. Jin, D.; Yuan, D.; Wei, J.; Li, X.; Lu, P. Centrifugal model test of group tunneling with small spacing beneath existing tunnels. Chin. J. Geotech. Eng. 2018, 40, 1507–1514. [Google Scholar] [CrossRef]
  30. Jiang, B.; Chen, L.; Yang, J.S.; Wang, S.; Ng, C.W.W. Effects of twin-tunnel excavation on an existing horseshoe-shaped tunnel considering the influence of a settlement joint. Can. Geotech. J. 2017, 54, 1346–1355. [Google Scholar] [CrossRef]
  31. Mair, R.J. Centrifuge Modelling of Tunnel Construction in Soft Clay. Ph.D. Thesis, Cambridge University, Cambridge, UK, 1979. [Google Scholar]
  32. Lee, C.J.; Wu, B.R.; Chen, H.T.; Chiang, K.H. Tunnel stability and arching effects during tunneling in soft clayey soil. Tunn. Undergr. Space Technol. 2006, 21, 119–132. [Google Scholar] [CrossRef]
  33. Jacobsz, S.W.; Standing, J.R.; Mair, R.J.; Hagiwara, T.; Sugiyama, T. Centrifuge modelling of tunnelling near driven piles. J. Jpn. Geotech. Soc. 2004, 44, 49–56. [Google Scholar] [CrossRef]
  34. Idinger, G.; Aklik, P.; Wu, W.; Borja, R.I. Centrifuge model test on the face stability of shallow tunnel. Acta Geotech. 2011, 6, 105–117. [Google Scholar] [CrossRef]
  35. Li, P.; Du, S.-J.; Ma, X.-F.; Yin, Z.-Y.; Shen, S.-L. Centrifuge investigation into the effect of new shield tunnelling on an existing underlying large-diameter tunnel. Tunn. Undergr. Space Technol. 2014, 42, 59–66. [Google Scholar] [CrossRef]
  36. Fu, J.; Yu, Z.; Wang, S.; Yang, J. Numerical analysis of framed building response to tunnelling induced ground movements. Eng. Struct. 2018, 158, 43–66. [Google Scholar] [CrossRef]
  37. Ayasrah, M.; Qiu, H.; Zhang, X. Influence of Cairo Metro Tunnel Excavation on Pile Deep Foundation of the Adjacent Underground Structures: Numerical Study. Symmetry 2021, 13, 426. [Google Scholar] [CrossRef]
  38. Soomro, M.A.; Hong, Y.; Ng, C.W.W.; Lu, H.; Peng, S. Load transfer mechanism in pile group due to single tunnel advancement in stiff clay. Tunn. Undergr. Space Technol. Inc. Trenchless Technol. Res. 2015, 45, 63–72. [Google Scholar] [CrossRef]
  39. Simic-Silva, P.-T.; Martínez-Bacas, B.; Galindo-Aires, R.; Simic, D. 3D simulation for tunnelling effects on existing piles—ScienceDirect. Comput. Geotech. 2020, 124, 103625. [Google Scholar] [CrossRef]
  40. Burland, J.; Potts, D.; Franzius, J. The response of surface structures to tunnel construction. Proc. Inst. Civ. Eng. Geotech. Eng. 2006, 159, 3–17. [Google Scholar] [CrossRef]
  41. Mroueh, H.; Shahrour, I. A full 3-D finite element analysis of tunneling–adjacent structures interaction. Comput. Geotech. 2003, 30, 245–253. [Google Scholar] [CrossRef]
  42. Lee, G.T.K.; Ng, C.W.W. Effects of Advancing Open Face Tunneling on an Existing Loaded Pile. J. Geotech. Geoenviron. Eng. 2005, 131, 193–201. [Google Scholar] [CrossRef]
  43. Mroueh, H.; Shahrour, I. Three-dimensional finite element analysis of the interaction between tunneling and pile foundations. Int. J. Numer. Anal. Methods Geomech. 2002, 26, 217–230. [Google Scholar] [CrossRef]
  44. Basile, F. Effects of tunnelling on pile foundations. Soils Found. 2014, 54, 280–295. [Google Scholar] [CrossRef]
  45. Fan, Y.; Cai, J.; Wang, J. An Analytical Method Evaluating the Evolution of Group Effect for Vertically Loaded Pile Groups Subjected to Tunnel Excavation. Appl. Sci. 2023, 13, 517. [Google Scholar] [CrossRef]
  46. Chapman, D.; Ahn, S.; Hunt, D.; Chan, A. The use of model tests to investigate the ground displacement associated with multiple tunnel construction in soil. Tunn. Undergr. Space Technol. 2006, 21, 413. [Google Scholar] [CrossRef]
  47. Sun, Q.; Liu, X.; De Corte, W.; Taerwe, L. Numerical Simulation on the Leakage-Induced Collapse of Segmental Tunnels. Appl. Sci. 2024, 14, 3796. [Google Scholar] [CrossRef]
  48. Taylor, R.N. Geotechnical Centrifuge Technology; CRC Press: London, UK, 1994; Volume 1, p. 296. [Google Scholar]
  49. Han, X.; Standing, J.R.; Li, N. Analysis of tunnelling induced twist defomm ation of buildings. China Civ. Eng. J. 2010, 43, 82–88. [Google Scholar] [CrossRef]
  50. Peck, R.B. Deep excavations and tunnelling in soft ground. In Proceedings of the 7th International Conference on Soil Mechanics and Foundation Engineering, Mexico City, Mexico, 1969; Sociedad Mexicana de Mecanica de Suelos: Mexico City, Mexico, 1969. [Google Scholar]
  51. Loganathan, N.; Poulos, H.G. Analytical Prediction for Tunneling-Induced Ground Movements in Clays. J. Geotech. Geoenviron. Eng. 1998, 124, 846–856. [Google Scholar] [CrossRef]
  52. Zhang, K.; Chavez Torres, J.L.; Zang, Z. Numerical Analysis of Pipelines Settlement Induced by Tunneling. Adv. Civ. Eng. 2019, 2019, 13. [Google Scholar] [CrossRef]
  53. Chiang, K.-H.; Lee, C.-J. Responses of single piles to tunneling-induced soil movements in sandy ground. Can. Geotech. J. 2007, 44, 1224–1241. [Google Scholar] [CrossRef]
  54. Schlicke, M.; Wannenmacher, H.; Nübel, K. Advancing TBM Performance: Integrating Shield Friction Analysis and Machine Learning in Geotechnical Engineering. Geotechnics 2024, 4, 194–208. [Google Scholar] [CrossRef]
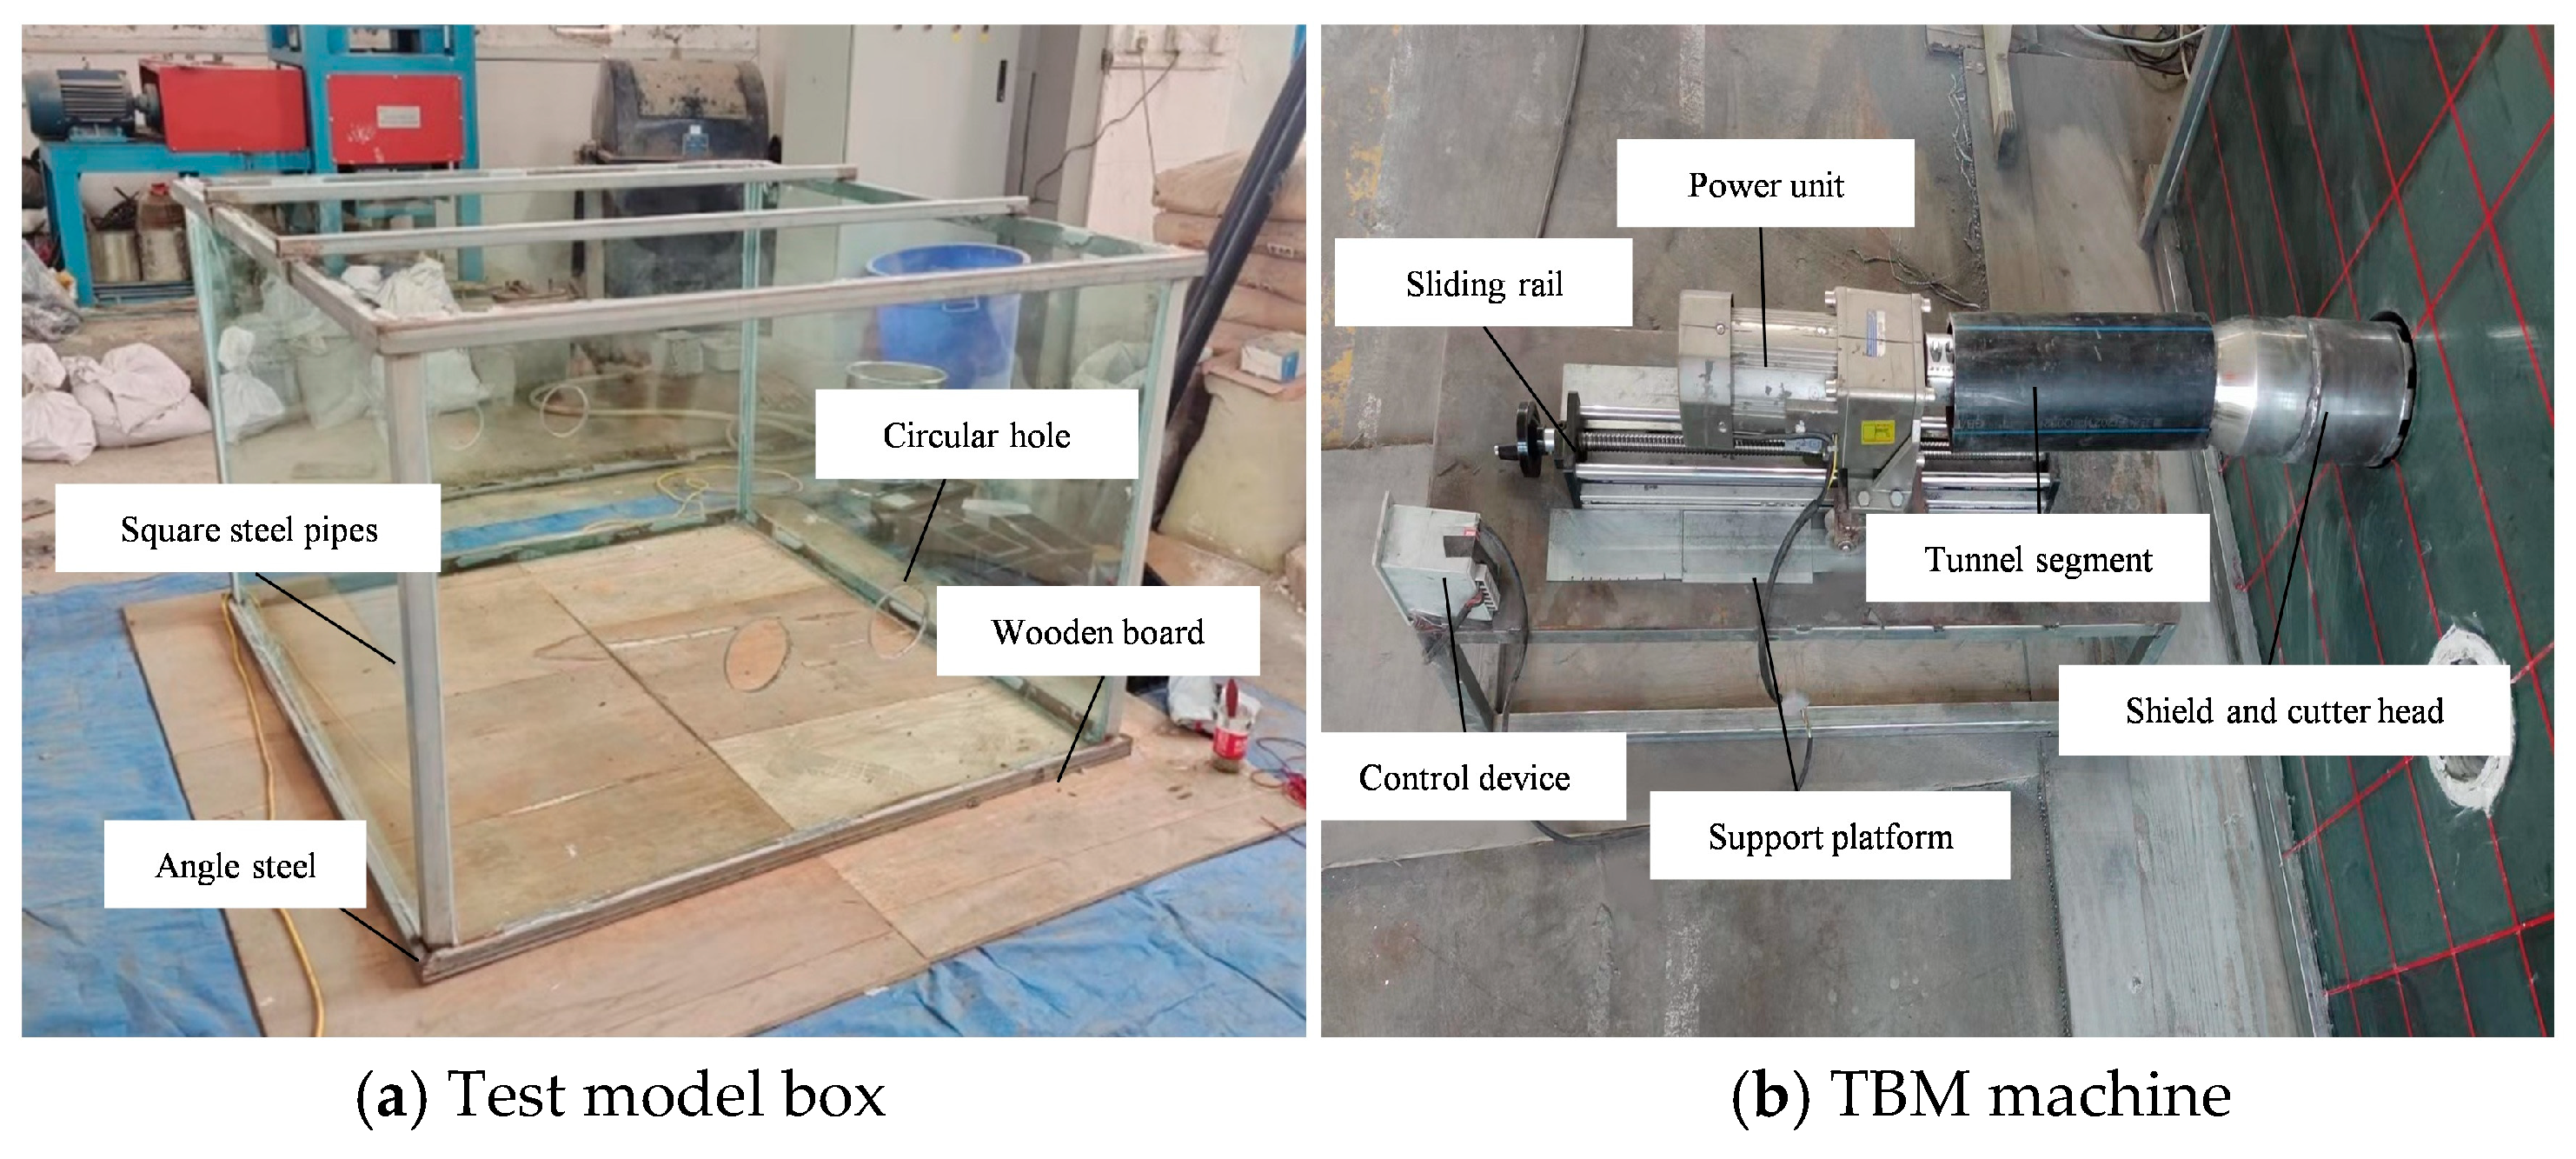
Figure 1. The TBM excavation device: (a) test model box and (b) TBM machine.
Buildings 15 03322 g001
Figure 2. Residential building model diagram.
Buildings 15 03322 g002
Figure 3. Monitoring point locations of displacement monitoring.
Buildings 15 03322 g003
Figure 4. Location of soil pressure embedment.
Buildings 15 03322 g004
Figure 5. Layout of building nodes and displacement monitoring points.
Buildings 15 03322 g005
Figure 6. Building strain gauge paste position diagram.
Buildings 15 03322 g006
Figure 7. Model filling and excavation (Experimental Study on Risk Model for TBM Construction of the West Extension Section of Qingdao Metro Line 2).
Buildings 15 03322 g007
Figure 8. Surface settlement–time curves at monitoring sections 1 and 2.
Buildings 15 03322 g008
Figure 9. Crown settlement (a) and soil pressure (b) during TBM excavation.
Buildings 15 03322 g009
Figure 10. Strain curves of the frame columns and foundation.
Buildings 15 03322 g010aBuildings 15 03322 g010b
Figure 11. Strain curve of frame beams.
Buildings 15 03322 g011
Figure 12. Overall picture of the model.
Buildings 15 03322 g012
Figure 13. Comparison analysis of monitoring points.
Buildings 15 03322 g013
Figure 14. The intuitive comparison of factor influences.
Buildings 15 03322 g014
Figure 15. Reinforcement area diagram.
Buildings 15 03322 g015
Figure 16. Settlement values under different reinforcement methods.
Buildings 15 03322 g016
Table 1. Similarity ratio of model parameters.
Physical QuantitySimilarity CoefficientSimilarity Constant
Geometry lCl50
Cohesion cCc50
Elastic modulus ECE50
Unit weight γCγ1
Poisson’s ratio μCμ1
Internal friction angle φCφ = 11
Strain εCε = 11
Displacement uCu = Cl50
Stress σCσ = Cc50
Table 2. Parameter values of similar materials.
MaterialsStrongly Weathered GraniteModerately Weathered GraniteSlightly Weathered GraniteFractured
Granite
Quartz sand–iron powder–barite powder1:0.63:0.941:1.04:1.561:1:11:1.05:2.45
Rosin/(rosin + alcohol)0.020.10.140.06
Table 3. Statistical measures of settlement values.
Monitoring Point|Mean| (mm)|Standard Deviation| (mm)|95% Confidence Interval| (mm)
DB1-12.9951.7270.195
DB1-22.2501.3230.150
DB1-32.6821.5410.174
DB1-41.7801.0530.119
DB1-51.4840.8590.097
DB2-12.2381.3030.147
DB2-22.6991.5670.177
DB2-32.5481.4870.168
DB2-42.0881.2260.139
DB2-51.9501.1390.129
Table 4. Statistical measures of crown settlement.
Monitoring Point|Mean| (mm)|Standard Deviation| (mm)|95% Confidence Interval| (mm)
GD1-14.9173.61113.042
GD1-22.7831.9343.742
GD1-31.8671.2991.687
GD2-14.6672.8237.967
GD2-23.0171.843.386
GD2-32.0331.1781.387
Table 5. Statistical measures of soil pressure.
Monitoring Point|Mean| (kPa)|Standard Deviation| (kPa)|95% Confidence Interval| (kPa)
L142092.6468583.333
L2247.312.798163.789
L364.84.36719.067
R1476126.61816,032.22
R2291.528.438808.722
R397.53.0289.167
Table 6. Settlement values of building monitoring points.
Monitoring PointSettlement Values (mm)
Excavation of the Right Tunnel: 75 cmCompletion of the Right Tunnel ExcavationExcavation of
the Left Tunnel:
75 cm
Completion of the Left Tunnel Excavation
JV12.793.304.244.41
JV21.772.302.802.92
JV30.381.952.204.89
JV40.481.661.955.09
Maximum2.793.304.245.09
Minimum0.381.661.952.92
Mean1.362.302.804.33
Standard
deviation
1.050.660.971.04
Table 7. Settlement difference and distortion value of building monitoring points.
Excavation DistanceSettlement Difference (mm)Distortion Value (mm−1)
S2—S1S3—S4S4—S1S3—S2
Excavation of the right tunnel: 75 cm−1.02−0.10−2.31−1.39−6.938 × 10⁻⁶
Completion of
the right tunnel excavation
−1.000.29−1.64−0.35−9.729 × 10⁻⁶
Excavation of the left tunnel: 75 cm−1.440.25−2.29−0.60−12.745 × 10⁻⁶
Completion of
the left tunnel excavation
−1.49−0.200.681.97−9.729 × 10⁻⁶
|Maximum|1.490.292.311.9712.745 × 10−6
|Minimum|1.000.100.680.356.938 × 10−6
|Mean|1.240.211.731.089.785 × 10−6
|Standard deviation|0.230.160.720.932.500 × 10−6
Table 8. Statistical measures of foundation strain.
Monitoring Point|Mean| (μs)|Standard Deviation| (μs)|95% Confidence Interval| (μs)
JC112961.1833743.333
JC213572.4575250.000
JC39246.8572195.556
JC49060.5533666.667
JC512073.7865444.444
JC676.553.7512889.167
Table 9. Statistical measures of beam strain.
Node NumberMonitoring Point|Mean| (μs)|Standard Deviation| (μs)|95% Confidence Interval| (μs)
Node 41HL-4116.66761.0333725
1ZL-4124.44462.3223884.028
2HL-4132.22263.7924069.444
2ZL-4139.44465.0694234.028
6HL-4148.33367.7774593.75
6ZL-4156.11169.6324848.611
Node 11HL-16.2223.49212.194
1ZL-17.1113.72313.861
2HL-18.1413.96915.75
2ZL-18.8894.22617.861
6HL-19.7784.49420.194
6ZL-110.6674.7722.75
Table 10. Model parameters, computational elements and constitutive relations.
Categoryγ
(kN/m3)
E
(MPa)
c
kPa
φ
(°)
μElement Type
Artificial fill18.58.510120.43D solid
Strongly weathered granite25150200320.35
Moderately weathered granite25.75000800400.28
Fractured zone24.5500300350.33
Slightly weathered granite25.810,000150047.50.25
Shield78.5210,000--0.3
Segment2534,500--0.2
Backfill layer
(ungrouted)
18200--0.4
Backfill layer (grouted)241000--0.3
Beam, column2530,000--0.2Beam
Plate2530,000--0.2Shell
Foundation2531,500--0.2Beam
Table 11. Error statistics table.
SeriesSim-Field Error % (R)Sim-Field Error % (L)Test-Field Error % (R)Test-Field Error % (L)
DB18.55917.25919.43824.777
GD21.00525.32920.24719.007
JV16.35623.94524.58128.133
JH20.11420.94722.44125.425
Table 12. Tunnel construction and design factor design scheme.
NumberGrouting Pressure
(MPa)
Tunnel Depth
(m)
Lag Distance of Gravel Grouting
(Rings)
Tunnel Spacing
(m)
10.2151512
20.2202515
30.2252018
40.3152518
50.3202012
60.3251515
70.4152015
80.4201518
90.4252512
Table 13. The building factor design scheme.
NumberFoundation TypeDistance Between the Building Centerline and Tunnel Centerline (m)Building Aspect RatioNumber of Stories
aIsolated016
bIsolated12310
cIsolated24214
dPile0314
ePile1226
fPile24110
gStrip0210
hStrip12114
iStrip2436
Table 14. Tunnel construction and design factor range analysis table.
Number of Level GroupsGrouting Pressure
(MPa)
Tunnel Depth
(m)
Lag Distance of Gravel Grouting
(Rings)
Tunnel Spacing
(m)
16.239.985.996.50
25.706.876.515.78
35.540.636.985.20
Range R0.699.350.991.31
Table 15. Building factor range analysis table.
Number of Level GroupsFoundation TypeDistance Between the Building Centerline and Tunnel Centerline (m)Building Aspect RatioNumber of
Stories
111.2711.5210.4710.39
29.7512.3110.5110.57
310.767.9610.8110.82
Range R1.524.340.350.43
Table 16. Physical and mechanical parameters of reinforced areas.
Typeγ (kN/m3)E (MPa)μc (kPa)φ (°)
Foundation reinforcement251700.3220037
Crown reinforcement263000.2740042
Isolation reinforcement2531,5000.2--
Disclaimer/Publisher’s Note: The statements, opinions and data contained in all publications are solely those of the individual author(s) and contributor(s) and not of MDPI and/or the editor(s). MDPI and/or the editor(s) disclaim responsibility for any injury to people or property resulting from any ideas, methods, instructions or products referred to in the content.