Article

Enhancing Energy Efficiency and Thermal Comfort Through Integration of PCMs in Passive Design: An Energetic, Environmental, and Economic (3E) Analysis

1
Laboratory of Thermal and Thermodynamics of Industrial Processes (LRTTPI), National Engineering School of Monastir, University of Monastir, Monastir 5019, Tunisia
2
Faculty of Sciences, University of Gafsa, Gafsa 2112, Tunisia
3
Electricity and Energy Department, Yalova Vocational School, Yalova University, Yalova 77200, Türkiye
4
Mechanical Engineering Department, Engineering Faculty, Kocaeli University, Kocaeli 41001, Türkiye
*
Author to whom correspondence should be addressed.
Buildings 2025, 15(18), 3319; https://doi.org/10.3390/buildings15183319
Submission received: 17 August 2025 / Revised: 7 September 2025 / Accepted: 8 September 2025 / Published: 13 September 2025
(This article belongs to the Section Building Energy, Physics, Environment, and Systems)

Abstract

Integrating phase change materials (PCMs) into building envelopes offers a powerful method for enhancing thermal mass and reducing heating, ventilation, and air conditioning energy demand. This study provides a comprehensive analysis of combining PCMs with various roof designs (flat, gable, and domed) and shading strategies in a Mediterranean climate to optimize residential building performance. Through a 3E (energetic, environmental, and economic) assessment and computational fluid dynamics (CFD) modeling, we determined that the use of PCM23 significantly enhances occupant comfort, improving the predicted mean vote by 17% and enhancing overall thermal comfort by 14%. The most effective configuration, a gable roof with integrated PCMs, outperformed a flat roof by reducing annual energy consumption by 20% (1103 kWh). This optimal design also yielded substantial economic and environmental benefits, including a 16.2 TD/m2 reduction in annual energy costs, a short investment payback period, and a 4% decrease in operational CO2 emissions. These results highlight the significant potential of pairing PCMs with passive architectural features to create more energy-efficient, cost-effective, and comfortable living environments.

1. Introduction

The building sector is one of the largest energy-consuming industries worldwide. Energy use for space heating and cooling alone accounts for up to 61% of the total energy demand in residential buildings. Notably, electricity consumption represents more than 40% of the energy used by the building sector [1]. Therefore, reducing the demand for indoor heating and cooling is a critical objective in efforts to lower global energy consumption and CO2 emissions.
In Tunisia, the building sector was the largest consumer of final energy in 2023, accounting for 43.5%, followed by the transport sector at 32.1%, industry at 24.4%, and agriculture at 6.4% [2]. In response to this, Tunisia has set a target to reduce carbon intensity by 45% by 2030, compared to 2010 levels. Notably, the national target for reducing primary energy demand relies heavily on the building sector, which is expected to contribute 56% of this reduction by 2030 [3].
The challenges faced by the construction sector, such as high energy consumption and increasing CO2 emissions, motivate researchers to explore various mitigation technologies. One promising approach is the integration of phase change materials (PCMs) into building envelopes, which has the potential to enhance energy efficiency and environmental sustainability [4]. PCMs provide enhanced thermal mass without the need to increase wall thickness, due to their substantial latent heat capacity. These materials can store substantial amounts of thermal energy, which helps minimize heat gains, regulate temperature variations during extreme outdoor conditions, and lead to overall energy savings [5].
Numerous studies have explored optimizing parameters of PCM-integrated envelopes to enhance energy savings [6]. Key parameters examined include the quantity or thickness of PCM, its thermophysical properties such as latent heat, thermal conductivity, and phase transition temperature, its placement within the structure, and its combination with insulation [7,8,9]. Kumar et al. [10] highlighted the importance of incorporating PCMs into sustainable building strategies, offering detailed insights into the optimization of materials and configurations for efficient thermal regulation. The application of aerogel render and PCMs on external walls, combined with PCMs and insulation in ceilings, resulted in an 82% reduction in hours of severe discomfort in a free-running building, alongside a decrease in overall energy consumption and peak cooling demand, CO2 emissions, and operational energy cost by up to 65%, 64%, and 35%, respectively, in an air-conditioned building. Bimaganbetova et al. [11] analyzed different PCM options to enhance the thermal performance of buildings across eight different tropical locations. In the study, integrating PCMs with a melting temperature range of 25–29 °C into buildings in tropical savanna climates reduced energy consumption by 15 to 69%, with thinner PCM layers and greater surface areas achieving the best energy-saving performance. Jia et al. [12] explored the relationship between PCM layer thickness and energy savings through simulations across five different climates. The study indicated that the optimal PCM thickness for energy savings in prefabricated buildings is 10 mm in severe cold and cold regions, 20 mm in mild regions, and 30 mm in hot summer/warm winter and hot summer/cold winter climates, demonstrating significant improvements in thermal performance and energy efficiency. Köse and Manioğlu [13] revealed that increasing the thickness of PCMs on building envelopes gradually reduces heating and cooling energy loads, with performance varying based on facade orientation. In the study, the best PCM performance was achieved on the western and eastern facades. Dardouri et al. [14] numerically analyzed the annual energy saving in residential buildings utilizing PCMs across four different climatic regions in Tunisia. The energy savings achieved with the optimal PCM thickness of 40 mm were 42% in Tozeur, 37% in Sousse, 35% in Tabarka, and 27% in Bizerte. The findings revealed that PCMs with lower melting points (21 °C) contributed more significantly to reducing heating energy consumption, whereas those with higher melting points (29 °C) proved to be more advantageous for minimizing cooling energy demands. Moreover, the dual-layer PCM configuration achieved greater overall energy savings than the single-layer setup, especially under hot and dry climatic conditions.
One of the most effective strategies for achieving energy savings in buildings involves the adoption of passive techniques. These include integrating a solar chimney with a passive evaporative cooler on windows [15,16,17], installing shading devices, employing shading and lighting control systems [18,19], optimizing natural air distribution systems [20], and utilizing thermal mass or reflective materials to regulate indoor temperatures [21]. However, these techniques are not universally applicable; their effectiveness can be limited under humid conditions, they may obstruct occupants’ views, and they often entail high implementation costs. Researchers have extensively explored the integration of PCMs with other passive techniques as a holistic strategy to enhance building energy efficiency to address these challenges [22,23]. Piselli et al. [24] studied how natural ventilation control enhanced PCM performance and found that incorporating optimized PCMs with temperature-controlled natural ventilation led to significant improvements in various climate zones. Authors concluded that the ideal peak melting temperature of PCMs varied slightly depending on the climate, and the greatest cooling energy savings, exceeding 65%, were achieved in milder climates with high internal heat gains. Nematchoua et al. [25] performed a simulation of a building across four distinct climates, testing scenarios with insulation alone, insulation combined with shading, and insulation paired with PCMs. Energy savings ranged from 9 to 10% with insulation, from 3 to 5% with local shading, from 19 to 20% with both insulation and local shading, and from 12.9 to 12.4% with both insulation and PCMs. Additionally, the study revealed that using PCMs with insulation helped maintain an indoor temperature range of 23 to 26 °C, even when outdoor temperatures fluctuated below 19 °C and above 28 °C. Sarri et al. [26] evaluated the impact of incorporating shading devices and PCMs in various hot locations in Algeria. The findings of the study established that integrating shading devices with PCMs in buildings enhanced energy savings by up to 33.83%, surpassing the energy savings achieved by buildings enhanced thermally with PCMs alone. Salihi et al. [27] investigated the effectiveness of various PCMs under different climatic regions in Morocco, aiming to determine the most suitable combination of PCMs and natural ventilation for improving buildings’ cooling energy performance. In the study, different natural ventilation approaches (like nighttime ventilation and constant daytime airflow) were examined to evaluate their impact on the charging and discharging behavior of PCMs. The study demonstrated that incorporating natural ventilation into PCM-enhanced buildings efficiently facilitated the solidification of PCMs during each required cycle. Combining PCMs with night ventilation improved PCM performance by 22 to 26% in warm and temperate Mediterranean climates. Additionally, continuous natural ventilation throughout the day led to an additional 2–9% decrease in cooling energy use compared to nighttime ventilation across all examined climate zones, positioning it as the most efficient strategy.
Another focus of researchers is to design the roof with PCMs to reduce heat loss through the building envelope. The roof, which plays a crucial role in mediating between the indoor and outdoor environments, acts as a thermal buffer, making its thermal insulation essential. Additionally, the roof is considered the weakest component in terms of thermal performance since it is the part of the building most exposed to solar radiation during the day [28]. Xu et al. [29] intended to improve building efficiency by integrating a pipe-embedded PCM with a solar collector in a novel roof design. The pipe-embedded PCM roof reduced energy demand for heating by 54% compared to a conventional roof, effectively maintaining indoor temperatures above 17 °C with auxiliary heating, except under extreme weather conditions. Peerzada and Subramaniyan [30] evaluated the potential of macro-encapsulated PCMs integrated into building roof slabs to reduce thermal loads and enhance energy efficiency in a subtropical climate through experimental analysis. The PCM-integrated slab unit reduced indoor temperatures by up to 4 °C during sunny hours, achieved a maximum heat gain reduction of 40.3%, and decreased thermal loads by 49.8%. Furthermore, this configuration provided a 33.33% greater electricity savings for cooling than for heating, with a 5.7-year payback period and a 44.24% reduction in CO2 emissions. Arumugam and Shaik [31] focused on the thermo-economic behavior of structures incorporating PCMs within hollow concrete blocks and roofing systems. Their results showed that using organic PCM blends in composite wall and roof tile setups led to the greatest reductions in air-conditioning expenses, lower CO2 emissions, and the most favorable payback durations. In the study conducted by Nguyen et al. [32], galvanized steel metal fibers with 0.1% by weight were immersed into PCM units to enhance thermal performance in a compact composite roof arrangement. The thin metal fiber PCM improved the roof’s thermal performance by 17% in maximum inner surface temperature reduction, 78% in attenuation coefficient, and 170% in time delay, while thicker metal fiber PCM demonstrated lower improvements at 17%, 76%, and 150%, respectively. Zhang et al. [33] developed a novel reversible multi-glazed roofing system that incorporates two different PCMs, low-emissivity glass, and silica aerogel, and assessed its thermal behavior under cold climate conditions. The new roof achieved an energy saving rate of 14% in summer and 34% in winter and saved a total cost of 217 RMB/m2 over its lifetime compared to the traditional roof.
In residential buildings, a significant portion of energy consumption is dedicated to maintaining indoor thermal comfort [34]. On the other hand, numerous studies have demonstrated that PCMs effectively stabilize indoor temperatures by absorbing and releasing latent heat, contributing to improved thermal comfort and more consistent comfort indices [35,36]. Therefore, it is crucial to evaluate both energy consumption and thermal comfort in PCM-integrated buildings. In the literature, Fanger’s PMV (predicted mean vote) and PPD (predicted percentage of dissatisfied) indices are widely employed as standard metrics for quantitatively assessing occupants’ thermal comfort [37,38]. Guichard et al. [39] investigated the thermal comfort of buildings with and without PCMs using a prototype building simulation code named ISOLAB, validated by reliable experimental data. The primary finding was that incorporating PCMs in buildings can enhance thermal comfort. In the 120 h simulation period, approximately 59% of occupants were dissatisfied with the PCM-equipped building, compared to 72% for the non-PCM building. While the PMV and PPD evaluations showed that thermal comfort could not be achieved in either scenario, Givoni’s psychrometric chart indicated that acceptable comfort levels in the PCM-equipped building might be reached through natural cross-ventilation or by leaving the door open. Hagenau and Jradi [40] evaluated the impact of integrating PCMs into building envelopes on energy efficiency and thermal comfort by examining four different building types: a daycare center, a residential building, an office building, and a university building. It was determined that PCM usage reduced energy consumption by 2 to 33%, depending on the building type, and decreased peak indoor temperatures by up to 6.2 °C. Nematchoua et al. [25] assessed the thermal performance of a building using different approaches: insulation alone, insulation combined with shading, and insulation integrated with PCMs. Without employing any passive strategy, thermal comfort ranged from 65 to 80%. Adding insulation improved this range to 65–81%, while combining insulation with shading further enhanced it to 65–81%. The highest comfort levels, ranging from 66 to 82%, were achieved through the integration of insulation with PCMs. In the study of Rangel et al. [41], an experimental evaluation was carried out to improve the thermal performance of roofs in semi-arid climates through combining natural ventilation and PCMs. The numerical results indicated that PCM configurations led to a reduction in the maximum indoor air temperature by up to 2.5 °C, a 7% cooling load reduction, and a 50 min improvement in thermal comfort, while natural ventilation extended the solidification time of PCMs by 19% to 41%. Kulumkanov et al. [42] estimated the potential of PCM integration in buildings for building energy savings and environmental sustainability under future climate scenarios through 2095. In the study, it was determined that PCM use reduces PMV fluctuation, improves thermal comfort, and provides energy savings and environmental benefits.

Research Motivation

PCMs, when combined with passive design strategies such as natural ventilation, insulation, and shading devices, have been widely investigated in the literature for their ability to enhance building energy performance and mitigate heat transfer challenges [6,13]. Recent studies highlight the significant energy savings achieved through the integration of PCMs with shading and natural ventilation [24,26]. However, a notable research gap exists in the architectural improvement of roof designs, particularly regarding their thermal performance and overall contribution to building energy efficiency.
Roofs play a crucial role in regulating thermal exchange between buildings and their surroundings. This role becomes especially critical in extreme climatic conditions, where efficient roof designs can substantially reduce energy demand. Motivated by this, the present study aims to address this gap by evaluating the thermal performance and energy efficiency of three distinct roof configurations. Specifically, the research examines the combined effects of roof designs, shading strategies, and roof openings with PCMs on energy consumption and indoor thermal comfort under both summer and winter conditions.
This study’s originality lies in its focus on roof configurations, emphasizing their interaction with PCMs to improve energy consumption and thermal comfort metrics. Unlike previous studies that primarily explored PCM integration at a generalized level, this research provides a targeted analysis of roof designs. By quantifying thermal performance using indicators such as decrement factor and time lag, and by assessing energy consumption and environmental impacts, the study introduces roof-focused innovations into sustainable building design. To achieve these objectives, advanced simulation tools and techniques were utilized to develop detailed building energy performance models. Computational fluid dynamics (CFD) analyses were conducted to evaluate airflow patterns and thermal comfort for both heating and cooling seasons. Additionally, an economic feasibility analysis was performed to assess the cost-effectiveness of the proposed roof configurations, offering a comprehensive perspective on their practicality. The study addresses a critical need in energy-efficient design while providing actionable insights for future research and practical applications by reducing environmental impacts and enhancing energy efficiency.

2. Methodology

2.1. Climatic Conditions

Tabarka, Tunisia, has geographical coordinates of 36°57′ N latitude and 8°45′ E longitude, with an altitude of 2 m over sea level. This coastal town experiences a humid Mediterranean climate, characterized by distinct seasonal variations, and falls within the ‘Csa’ category according to the Koppen–Geiger climate classification scheme [43]. Winters in Tabarka are typically cold and rainy, with average temperatures around 7.4 °C. This season is marked by substantial heating demands, occasional snowfall, and high humidity levels, which can further influence thermal comfort and building energy requirements. On the other hand, summers are predominantly hot and dry, with average temperatures peaking at 28.2 °C. The dry season is associated with increased cooling loads, emphasizing the importance of effective passive design strategies and thermal insulation in buildings. The climatic profile of Tabarka, including its coastal proximity, contributes to a microclimate that can impact wind patterns and solar radiation intensity. These factors are critical for evaluating energy performance and thermal comfort in the built environment. An overview of the annual climate data of Tabarka for 2021, including temperature, wind speed, and solar radiation trends, is presented in Figure 1.
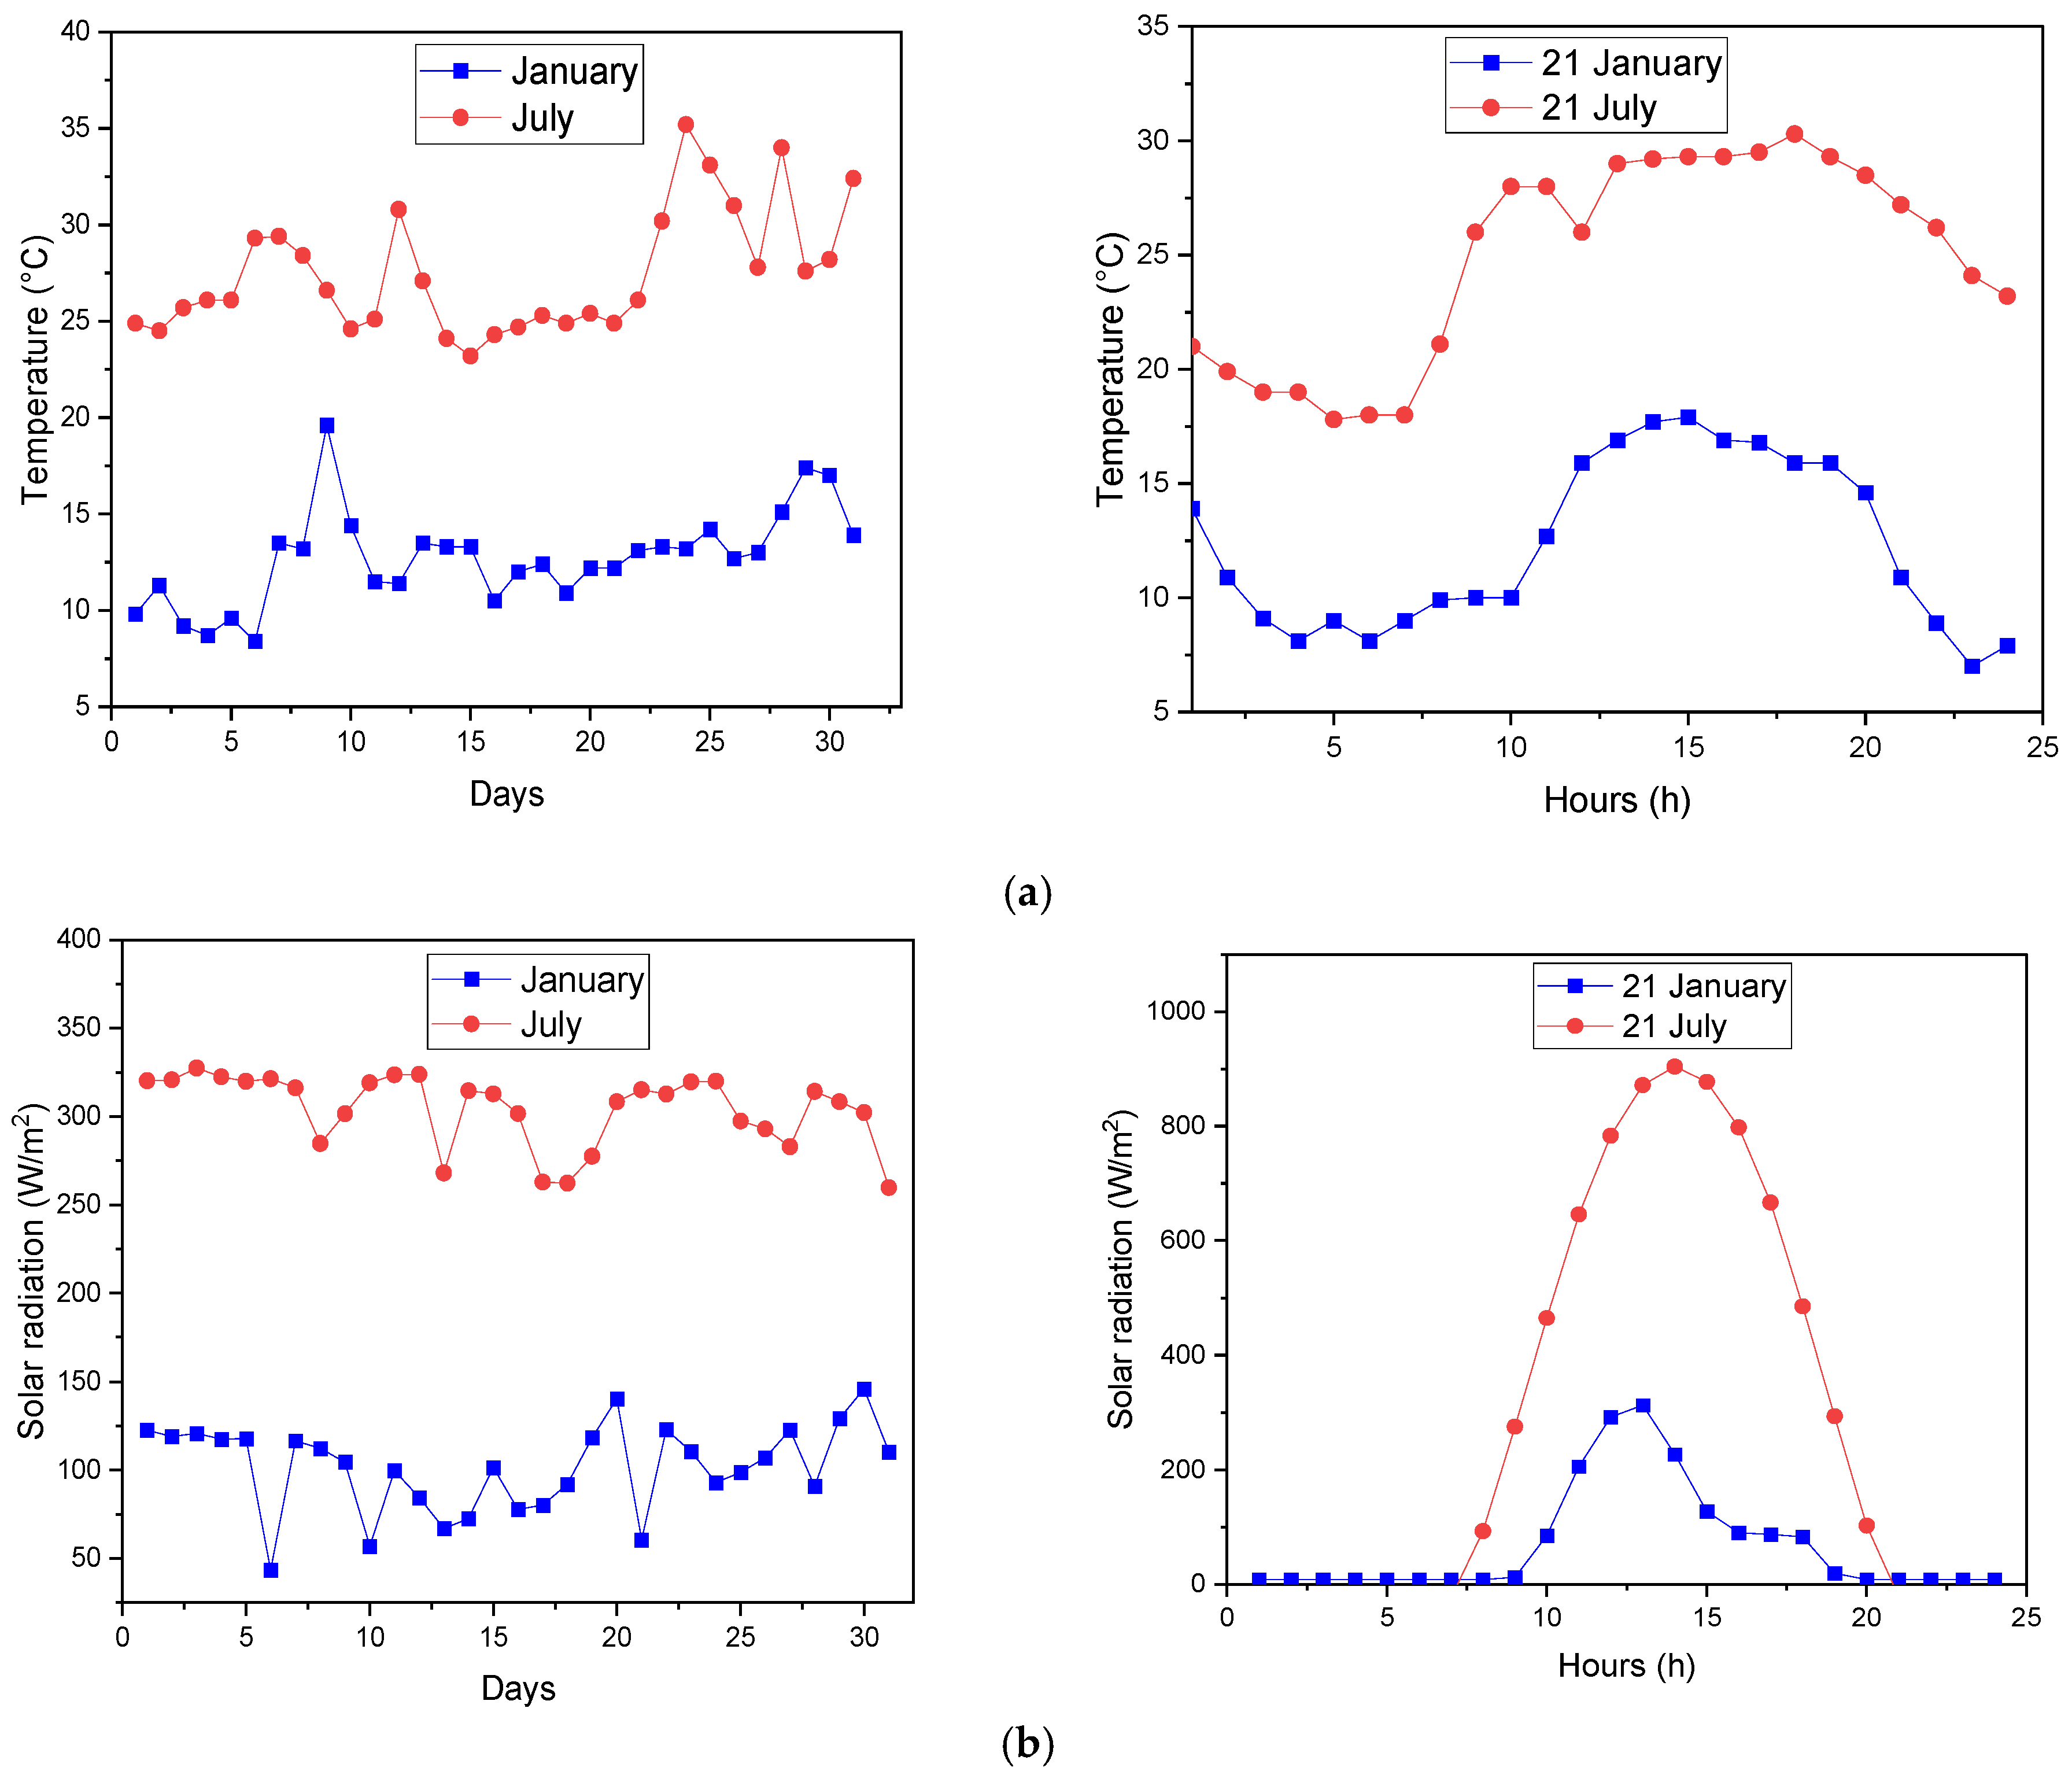
In this study, monthly simulations were conducted for January and July to provide a broader understanding of indoor thermal comfort. Additionally, daily analyses were performed for the representative dates of 21 January and 21 July, specifically chosen to capture extreme seasonal variations in climatic conditions and to offer insights into the building’s performance under different thermal loads. 21 January represents the middle of the winter season, typically characterized by lower ambient temperatures and reduced solar insolation, while 21 July corresponds to the peak of the summer season, marked by high temperatures and intense solar radiation. Figure 2 presents both monthly and daily data for these two periods, illustrating the outdoor air temperature and solar radiation trends over time, offering critical input for evaluating the building’s energy efficiency and thermal comfort across seasonal and daily variations.

2.2. Simulation Tool and Technique

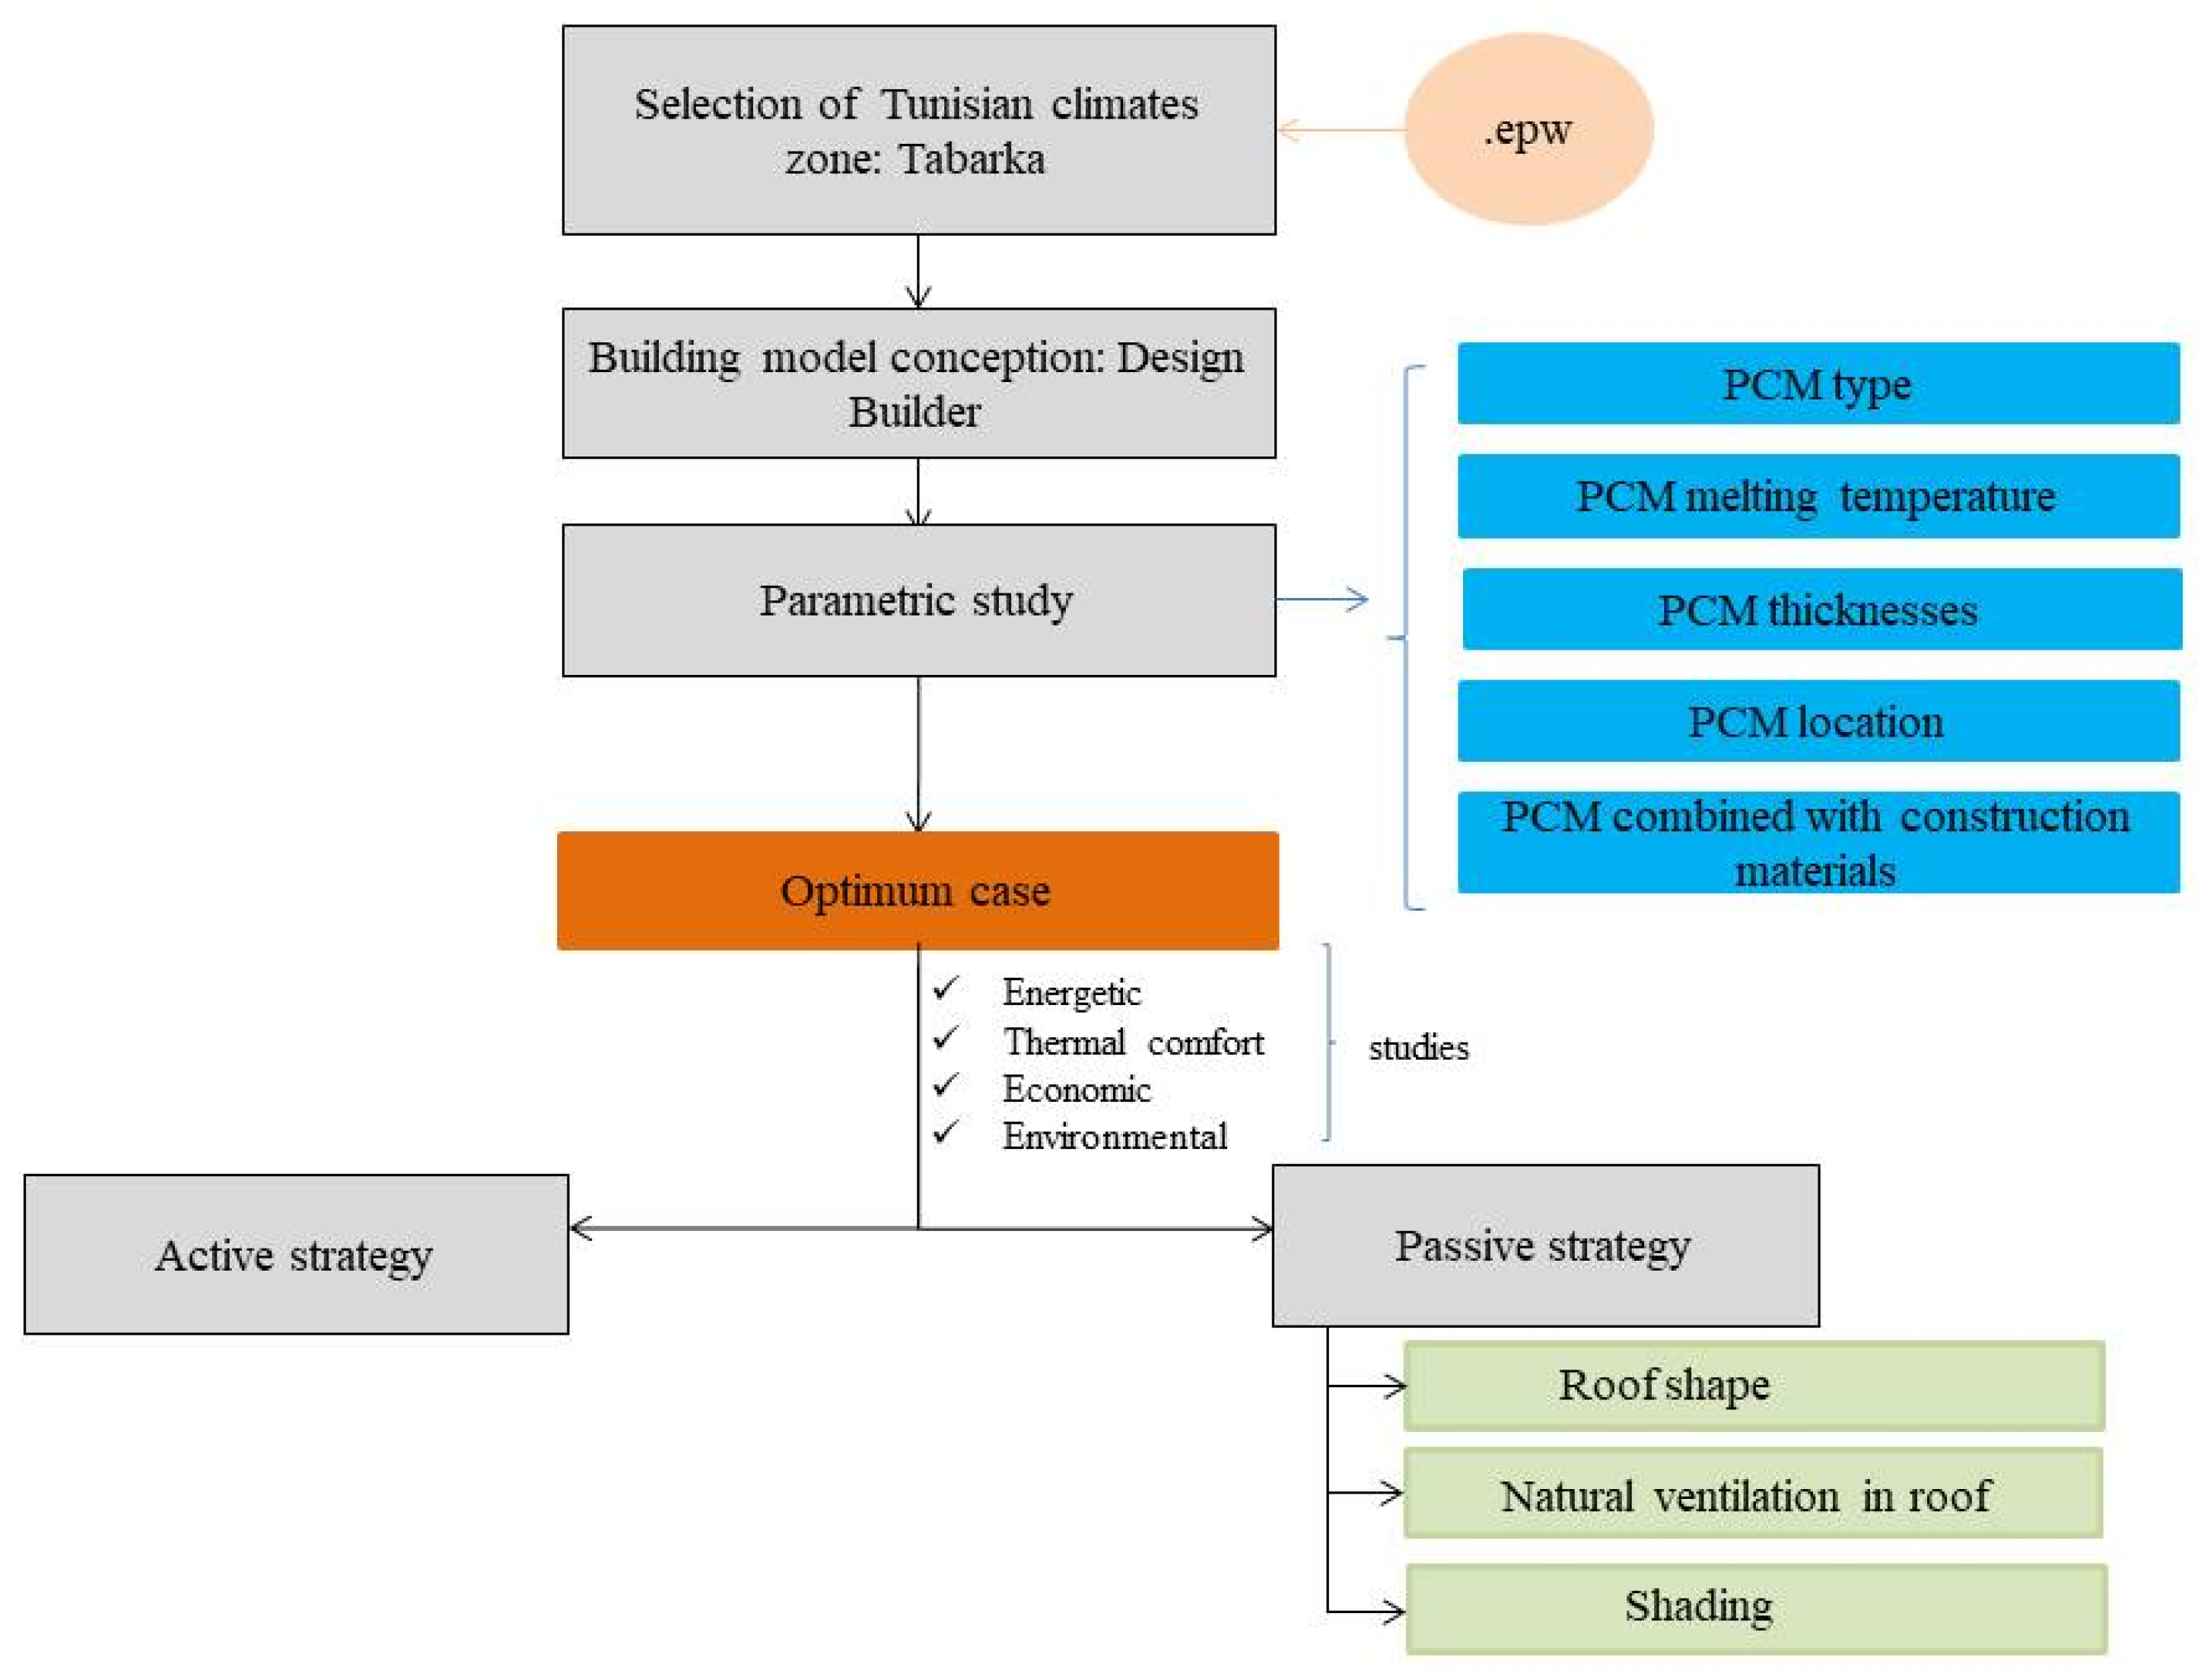
The analyses were conducted using DesignBuilder software (V6.1) [44], which employs EnergyPlus (V8.9) as its simulation engine. EnergyPlus is recognized as a prominent and frequently used tool for conducting dynamic energy simulations, renowned for its effectiveness in modeling the energy performance of buildings. One of the standout capabilities of EnergyPlus is its capacity to model the phase change behavior of PCMs, whose thermal characteristics are significantly influenced by temperature variations. The conduction transfer function (CTF) analytical method, frequently employed by EnergyPlus, offers simplicity and accuracy but is restricted to materials with constant thermal properties [45]. The CondFDM algorithm, built based on the conduction finite difference method, overcomes this limitation by modeling materials with varying thermal properties. The PCM model in EnergyPlus, which merges the CondFDM strategy with the enthalpy method, has undergone experimental validation by numerous researchers [46,47,48]. Figure 3 illustrates the simulation methodology employed in this study.
The CondFDM method delivers a numerical solution for one-dimensional conductive heat transfer, offering the choice between a semi-implicit scheme (Crank-Nicolson) or a fully implicit scheme. The CondFDM divides the surface into discrete nodes using an automatically generated mesh. The spacing between nodes, denoted as “∆x”, depends on the material’s thermal diffusivity (a), the selected time step “∆t”, and a spatial discretization constant “c”, which is the reciprocal of the Fourier number (Fo) [45,49]:
Δ x = a c Δ t = a . Δ t F o
Based on an implicit scheme, the Fourier equation is formulated by the PCM layer as follows:
ρ C p Δ x T i m + 1 T i m Δ t = k i + 1 m + 1 k i m + 1 2 T i + 1 m + 1 T i m + 1 Δ x + k i 1 m + 1 k i m + 1 2 T i 1 m + 1 T i m + 1 Δ x
Here, T i m represents the temperature of node “i” at time “m”, and k i m = k ( T i m ) denotes the corresponding thermal conductivity. An additional equation is associated with Equation (2), which takes into account the changes in the specific heat capacity “Cp” and adjusts its value at every iteration as indicated in [45]:
C p = h i m h i m 1 T i m T i m 1          
Here, h i m represents the specific enthalpy.

2.3. Building Description and Materials

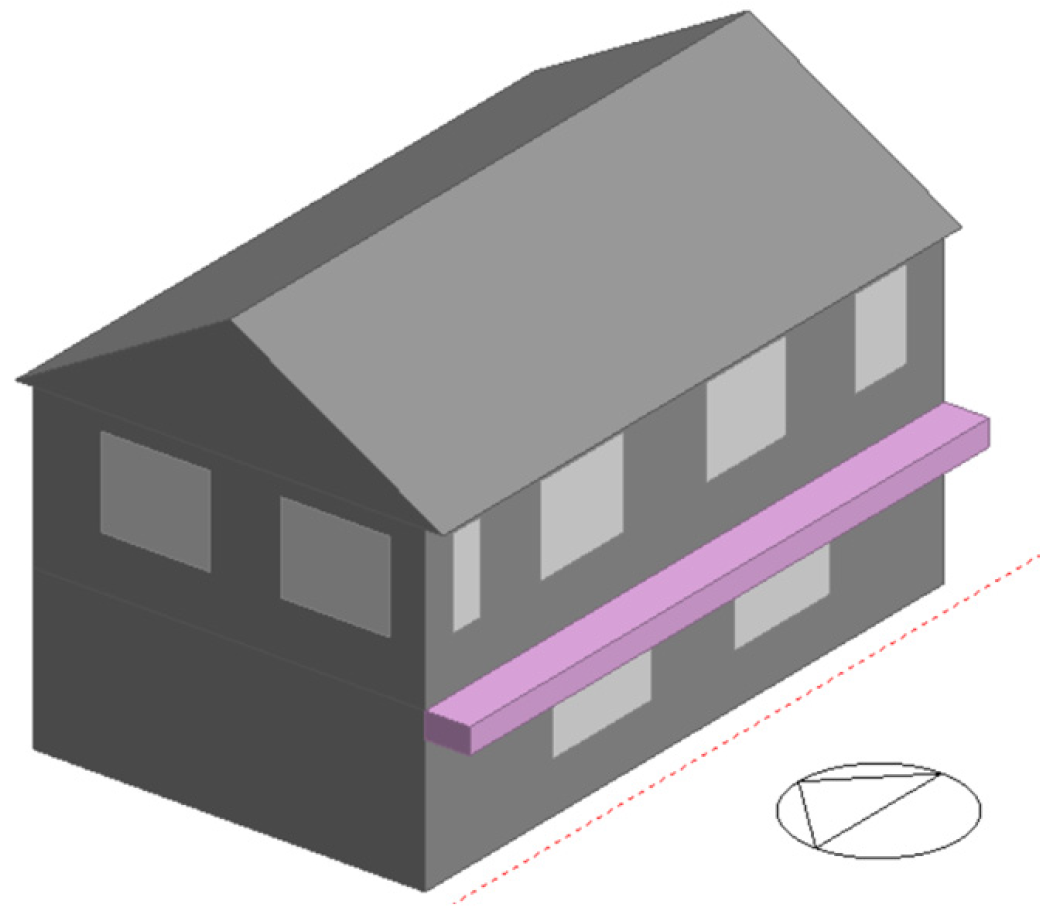
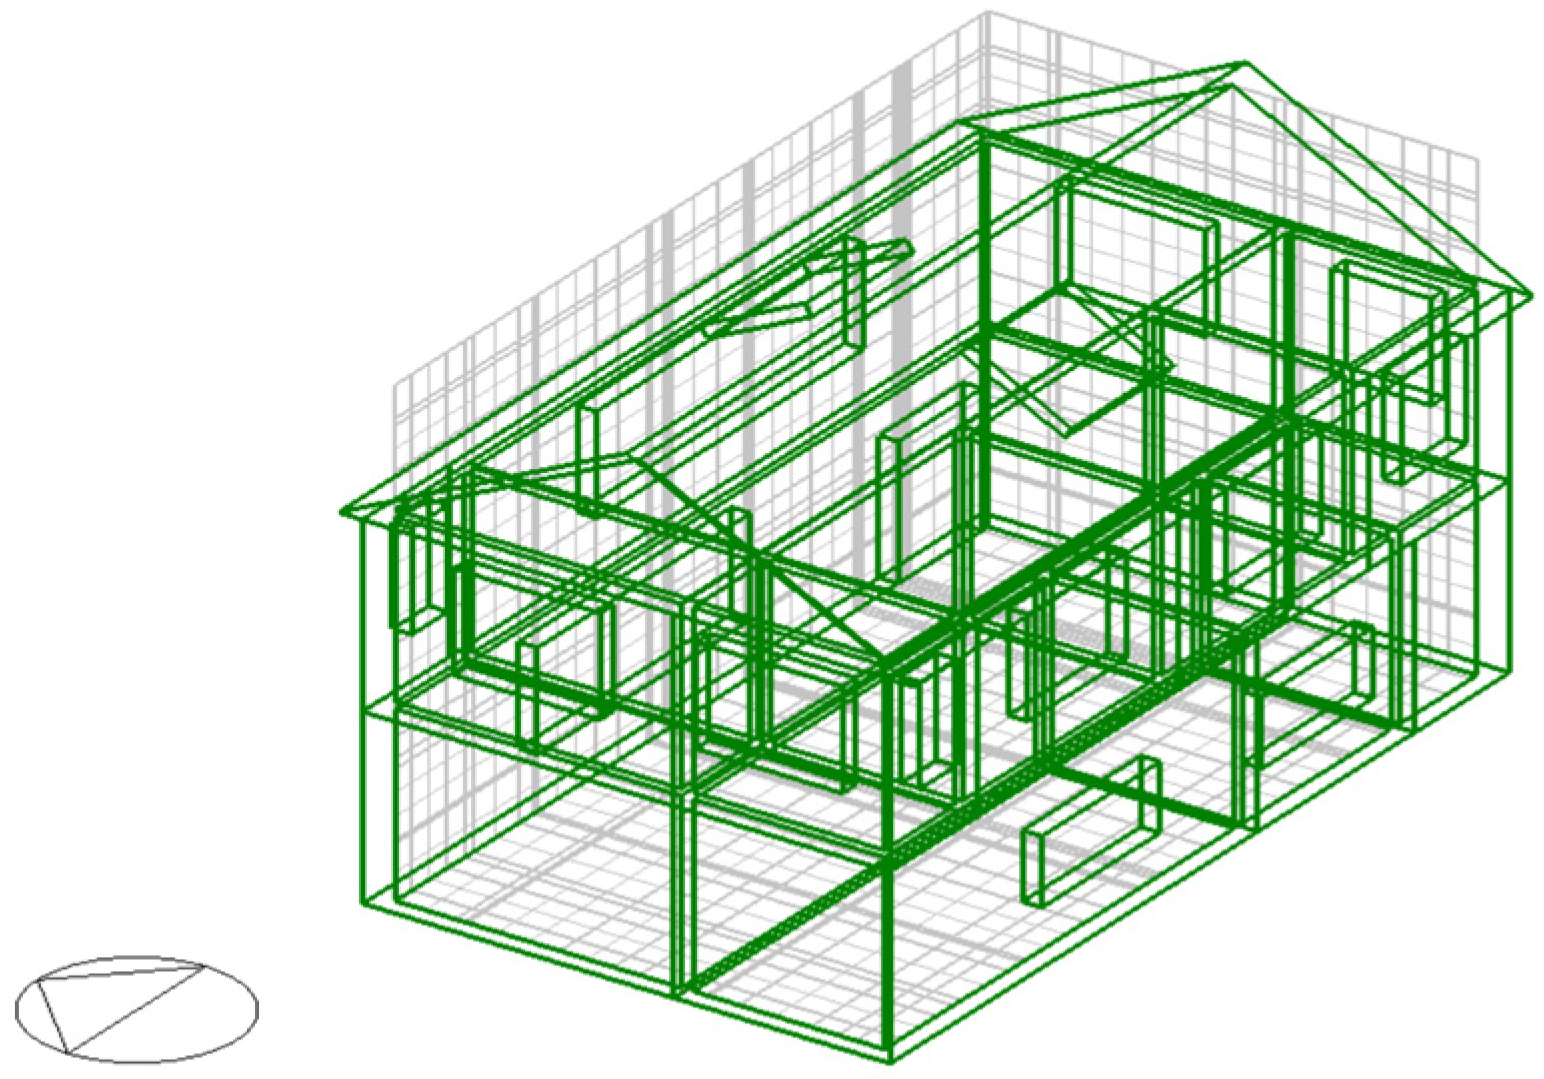
In the study, the residential building model shown in Figure 4 was formed to conduct performance evaluations. The building, with a total floor area of 119.71 m2, is a two-story structure consisting of a ground floor and a first floor, each with a ceiling height of 2.7 m. The window-to-wall ratio is 30% on all floors and facades.
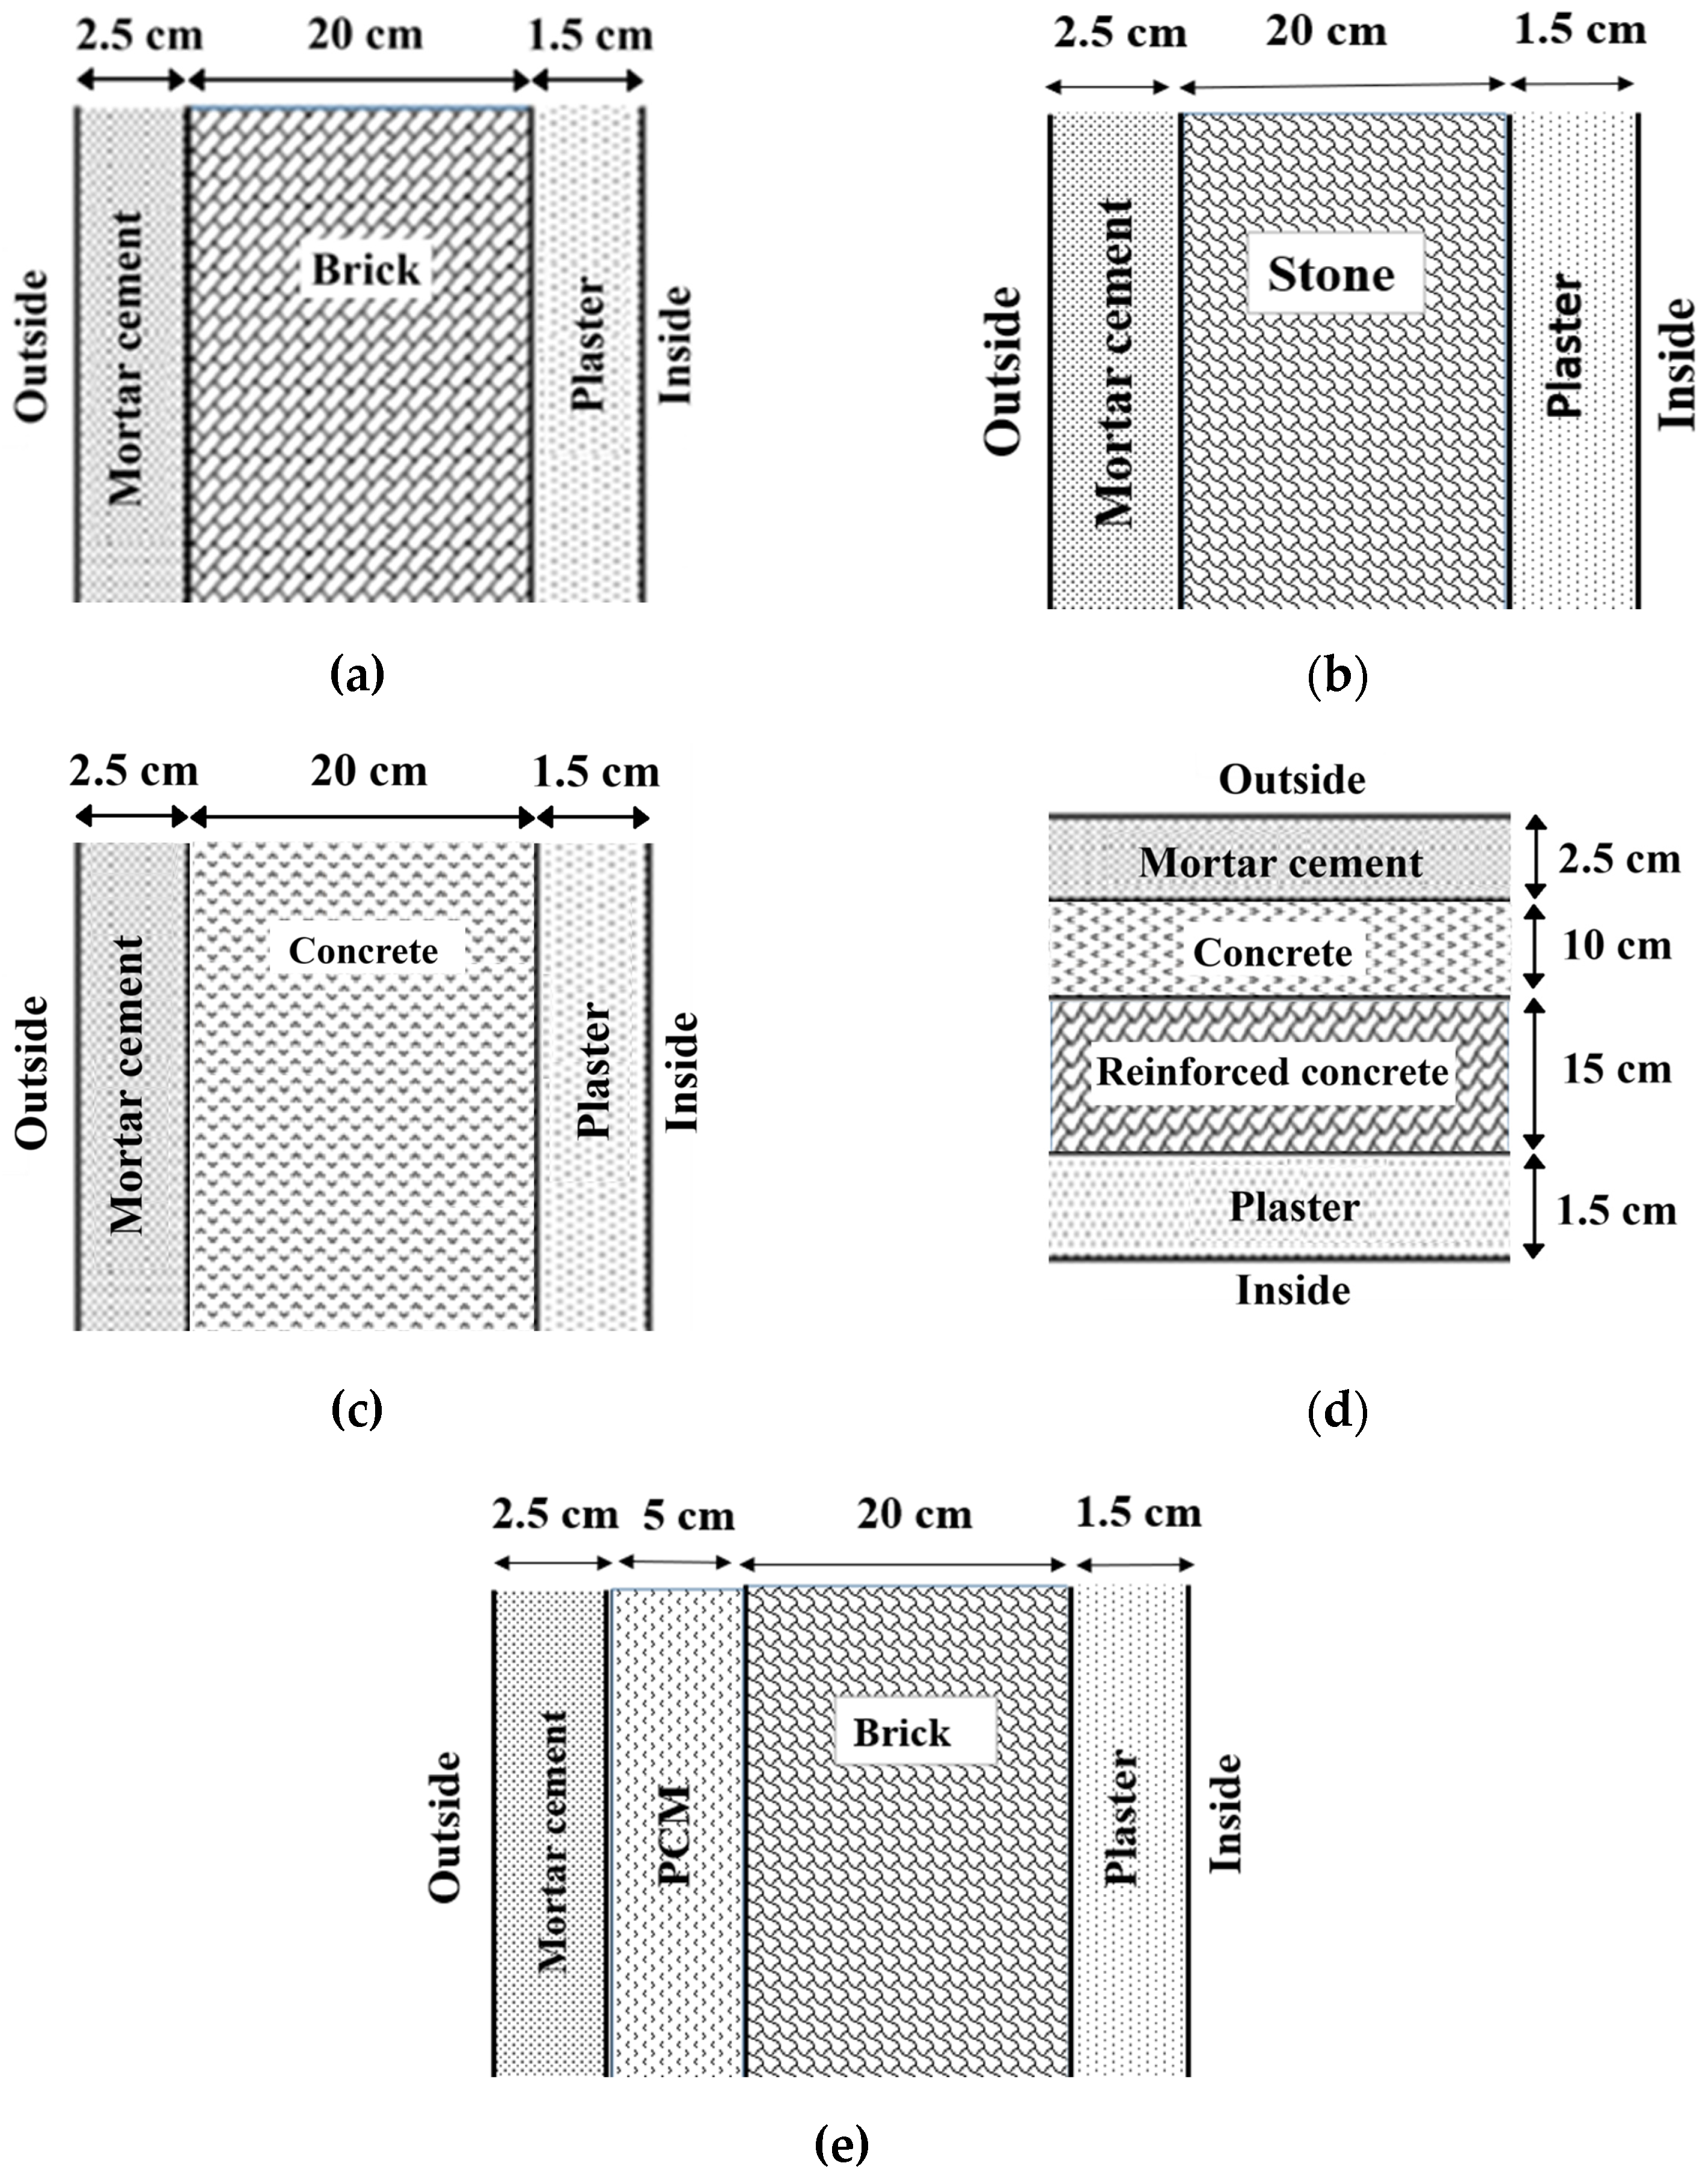
The wall and roof structures examined consisted of common materials used in the residential building sector in Tunisia (Figure 5). These external envelope structures were determined by referencing the National Energy Management Agency’s guide [50]. Three different primary wall materials were used to assess the synergy between the PCM and wall material, focusing on their impact on annual energy consumption. The three wall models represented uninsulated walls consisting of a layer of brick/stone/concrete sandwiched between layers of mortar cement and plaster. Additionally, there was no insulation material on the roof and floor. The thermal properties of the building materials were detailed in Table 1.
In this study, BioPCM M27 and Infinite RPCM were used to evaluate the effects of PCMs on energy consumption. RPCM was chosen as a representative conventional paraffin-based PCM, valued for its well-documented thermal performance in building applications, relative cost-effectiveness, and a phase change temperature suitable for general thermal mass enhancement. Concurrently, BioPCM M27 was selected to evaluate a sustainable, bio-derived alternative, aligning with objectives related to environmentally conscious building design. Critically, its nominal phase transition temperature of 27 °C offers a distinct thermal strategy compared to the RPCM. The thermophysical properties of PCMs placed on the outer surface of the building wall are given in Table 2. In the first stage of the study, PCMs with thicknesses ranging from 10 to 50 mm and melting temperatures between 21 °C and 29 °C were evaluated. The most suitable PCM in terms of melting temperature and thickness was identified, and a configuration with a single PCM was considered for subsequent stages of the study.

Roof, Shading, and Opening Configurations

Roofs can account for up to 50% of a building’s total solar energy gains, underscoring their critical role in influencing potential energy consumption and indoor thermal conditions [51,52]. Therefore, this study specifically focused on exploring various roof configurations integrated with a PCM to determine the most effective options for residential buildings in Tabarka, Tunisia (Figure 6). The evaluation centered on assessing the impact of integrating PCMs into three roof configurations—flat, gable, and domed—on energy usage as well as thermal comfort. The selected roof model is a commonly employed concrete-based structure in Tunisian construction (Figure 5 and Table 1). A comprehensive analysis is provided on how the integration of PCM, combined with various roof designs, contributes to energy efficiency and enhanced indoor thermal comfort. Such investigations were particularly important in regions like Tabarka, where climatic conditions pose significant challenges to achieving sustainable and comfortable living environments.
Shading is a highly effective passive cooling strategy that plays a significant role in reducing solar heat gain and improving indoor thermal comfort. Therefore, an external shading block was added to the southern facade of the reference building, which receives the highest solar radiation throughout the year (Figure 7). The objective was to determine the most effective approach to enhance the building’s energy performance. This shading element, made of concrete with a thickness of 0.52 m and a width of 0.93 m, was designed to reduce direct solar heat gain while maintaining adequate natural daylight, thereby enhancing both energy efficiency and indoor comfort. The annual energy consumption influence of shading was compared to the energy consumption achieved through the PCM integration into the roof and walls to identify the most effective passive strategy.
The building model was further refined by incorporating two openings on the gable roof face to evaluate their impact on the thermal comfort (Figure 8). The two openings, each measuring 15.1 m × 1.32 m, were designed to be in harmony with the overall layout of the building and mirror the arrangement used in similar configurations. Ventilation was facilitated through the inclusion of operable sections in both the roof openings and south-facing windows, with each roof window capable of opening 50% of its area from the bottom. This arrangement aimed to improve natural airflow by promoting effective cross-ventilation, contributing to improved indoor air movement. Furthermore, the addition of roof openings was intended to maximize daylight entry into the building, reducing potential reliance on artificial lighting. This configuration was developed to assess the combined effects of roof openings, ventilation, and lighting on overall building performance.

2.4. Air Conditioning System

The building’s thermal comfort was maintained using an air-cooled heat pump system, which provided both heating and cooling. The adaptive operation strategy employed in this study involves dynamically adjusting the HVAC system’s setpoints and operating schedules based on real-time occupancy patterns and weather conditions. The system operated with temperature set points of 21 °C for heating and 24 °C for cooling during occupied periods, ensuring a balance between energy efficiency and occupant comfort. The heat pump was programmed to operate at reduced temperature settings during unoccupied hours, preventing unnecessary energy use while avoiding extreme indoor conditions, to minimize energy consumption. In winter, the system maintained a slightly lower heating temperature to prevent overcooling, while in summer, a higher cooling set point was employed to prevent overheating. This adaptive operation strategy not only enhanced the overall energy efficiency of the system but also minimized the environmental impact of maintaining indoor thermal comfort.
The effectiveness of PCM integration into the building design was evaluated by defining the annual percentage reduction in energy consumption of the heat pump. This reduction compared to a baseline scenario (without the adaptive strategy) was quantified to assess the impact of PCMs on the overall energy performance of the building. The rate of reduction (η) was calculated using Equation (4):
η = E w i t h o u t   P C M E w i t h   P C M E w i t h o u t   P C M × 100
Here, “E” represents the annual energy consumption (kWh). This metric provides a clear and measurable way to analyze the energy-saving potential of heat pump systems of PCM-enhanced buildings under various operational and climatic conditions.

2.5. Time Lag and Decrement Factor

The thermal inertia of a building is primarily determined by the properties of its materials, including their density, thermal capacity, and layering arrangement. Materials such as stone and concrete typically exhibit higher thermal inertia due to their significant heat storage capabilities because of high density. Thermal inertia can be evaluated through experimental measurements of temperature and heat flow or by employing theoretical calculations. The decrement factor (f) and time lag (φ) are two essential transient dynamic parameters commonly employed to describe the thermal inertia of a wall. These parameters provide critical insights into the wall’s effectiveness in maintaining indoor thermal comfort.
The time lag (φ) represents the delay between the peak temperature occurring on the exterior surface of the wall and the corresponding peak temperature on its interior surface. This parameter indicates how well a material can buffer rapid temperature fluctuations. The decrement factor (f) quantifies the attenuation of temperature amplitude as heat transfers from the exterior to the interior surface, reflecting the material’s ability to dampen temperature variations. Accurate evaluation and adjustment of these parameters can significantly improve building thermal performance, particularly in climates with substantial diurnal temperature variations. Therefore, in the study, the effects of the integration of PCMs with different wall materials on decrement factor and time lag were evaluated using the following equations [53]:
f = Δ T i Δ T e = T i m a x T i m i n T e m a x T e m i n
φ = t T i , m a x t T e , m a x , | t T i , m a x > t T e , m a x t T i , m a x + p t T e , m a x , | t T i , m a x < t T e , m a x p , | t T i , m a x = t T e , m a x
Here, “Ti” and “Te” denote the temperatures at the inner and outer surfaces of the wall, respectively, while “ti” and “te” represent the corresponding times. The parameter “p” refers to the period, typically 24 h. The effectiveness of the wall improves with a longer time lag and a lower decrement factor, as these characteristics enhance the wall’s ability to regulate indoor thermal conditions.

2.6. Computational Fluid Dynamics Method

This study utilized the CFD module of DesignBuilder to simulate airflow and thermal comfort within the building under various design configurations (Figure 9). DesignBuilder’s CFD capabilities allow for precise integration with energy modeling, enabling a comprehensive assessment of indoor environmental performance. The air velocities at the inlets and outlets of the HVAC system play a crucial role in CFD analysis, as they directly influence the distribution of air and thermal comfort in the simulated environment. Low velocities can lead to air stratification, while too high velocities can cause uncomfortable drafts. Regarding mesh validation, we applied recognized practices in the field of CFD. We conducted convergence tests and compared our results with experimental data, ensuring that our meshes are fine enough to capture velocity and pressure gradients. This validation is essential to guarantee the reliability of the simulated results.
The module supports the evaluation of air movement, temperature distribution, and thermal comfort indices, such as PMV and PPD, making it an ideal tool for analyzing the effects of architectural and material changes on occupant thermal comfort. The foundation for the analysis is the accurate geometric representation of the building envelope and interior spaces. This geometric model served as the direct input for the mesh generation process, ensuring that the subsequent CFD simulation accurately considers the spatial characteristics of the building. The CFD simulations focused on key aspects of building performance, including the impact of flat, gable, and domed roof designs, roof openings, and the integration of PCMs. The analysis examined airflow patterns, temperature stratification, and thermal comfort within the indoor environment.
The wall temperature was set to a default value of 24 °C for the CFD simulations. The grid configuration included a spacing of 0.3 m and a grid line merge of 0.03 m. The wind was modeled with a velocity of 8 m/s coming from a direction of 270°. The mesh comprised 41 cells in the X-direction, 20 cells in the Y-direction, and 24 cells in the Z-direction.

2.7. Assessment Method for Thermal Comfort

In the study, thermal comfort analyses were conducted using Fanger’s PMV and PPD models. In this approach, the PMV model quantifies the average thermal sensation of occupants, while the PPD metric estimates the proportion of occupants likely to feel thermally uncomfortable. The model, recognized for its precision compared to adaptive thermal comfort models, provides a comprehensive assessment of the indoor environment by incorporating multiple physiological and environmental factors. The DesignBuilder, which provides thermal comfort conditions, uses the following PMV and PPD equations [54]:
P M V = 0.303 e 0.036 M + 0.028 × M W P e P s L r P r R C h
P P D = 100 95 × e ( 0.03353 P M V 4 + 0.2179 P M V 2 )
In the DesignBuilder interface, it was defined that 50% of the occupants were male and 50% were female, with an occupancy rate of 25%, a metabolic rate of 0.9 met, and a clothing insulation of 1 clo. Furthermore, it was assumed that the building was used with a 35% occupancy rate between 5:00 and 19:00 on weekdays and 75% on weekends (Figure 10).

2.8. Life-Cycle Cost Analysis for PCM Integration

Life-cycle cost analysis (LCCA) has become a commonly utilized method in recent studies to assess the economic efficiency of PCMs [55,56,57,58]. This method accounts for both the heating and cooling energy costs, as well as the cost of PCM, in a specified life-cycle period (n = 30 years). The energy consumption costs are calculated by incorporating the inflation rate of energy costs (i) and the market discount rate (d) for the time value of money. The present worth factor (PWF), employed in life-cycle cost calculations, is defined as [55]:
P 1 n , i , d = P W F = u = 1 m ( 1 + i ) u 1 ( 1 + d ) u = 1 d i   1 1 + i 1 + d m ,             | i d                                                               m 1 + i ,             | i = d
The total life-cycle cost per unit area of the wall (Ct), which includes the present value of energy costs along with the PCM expenses, is represented as:
C t = C e n + C P C M = P 1 C e n r + C P C M
C t = P 1 Q f C O P C e l 3.6 × 10 6 + Q c H g η h C g + C P C M l P C M
where Cenr, Cg, Cel, and CPCM denote the costs, respectively, associated with energy, natural gas, electricity, and the PCM. Furthermore, Hg is the natural gas heating value, lPCM is the most suitable PCM thickness that minimizes total cost, and ηh is the heating system’s efficiency.
The integration of a PCM into the building envelope is deemed cost-effective if positive net life cycle savings (NLCSs) are achieved. NLCS per unit area of the wall surface is determined by subtracting the additional costs associated with the PCM from the energy cost savings accrued over the building’s lifetime:
N L C S = P 1 Δ Q c C O P C e l 3.6 × 10 6 + Δ Q h H g η g C g C P C M l P C M
Here, ΔQc and ΔQh denote the energy savings associated with cooling and heating per unit wall area, respectively. The payback period (b) indicates the time required to recoup the extra cost of the PCM via energy savings. This is determined by setting the NLCS to zero using the following equation:
b = l n [ 1 d i C P C M e P C M A s ] l n ( 1 + i 1 + d ) , | i d 1 + i   C P C M e P C M A s , | i = d
A s = Δ Q f C O P C e l 3.6 × 10 6 + Δ Q c H u η s C g
Annual energy cost savings were calculated by multiplying the quantified energy savings for each relevant end-use component (in kWh, derived from the simulation results detailed in Section 3) by the applicable local energy tariffs for Tabarka, Tunisia. The total initial investment cost was estimated by summing the costs associated with the PCM (TD/m2). Key economic performance indicators were then calculated, including the payback period (b). Furthermore, the NLCS was calculated over a 30-year analysis period. Finally, to ensure transparency and reproducibility, all fundamental assumptions and parameters utilized in the economic calculations are explicitly documented in Table 3. This table includes values and sources for energy tariffs, PCM, the analysis period (lifespan), the discount rate, and any other relevant financial inputs. This comprehensive documentation allows for critical evaluation and potential replication of the economic findings.

3. Results and Discussion

The outcomes of integrating PCMs and their impact on energy use and thermal comfort in various scenarios were explored. The influence of various PCMs with different melting temperatures, thicknesses, and placements within the building envelope on thermal comfort was evaluated by analyzing factors such as interior wall surface temperatures, PMV, and PPD. Additionally, the role of roof designs and openings was examined to provide a comprehensive understanding of how PCMs can enhance both energy efficiency and occupant comfort.

3.1. Energy Consumption Analyses

3.1.1. Impact of PCM Integration on Energy Consumption

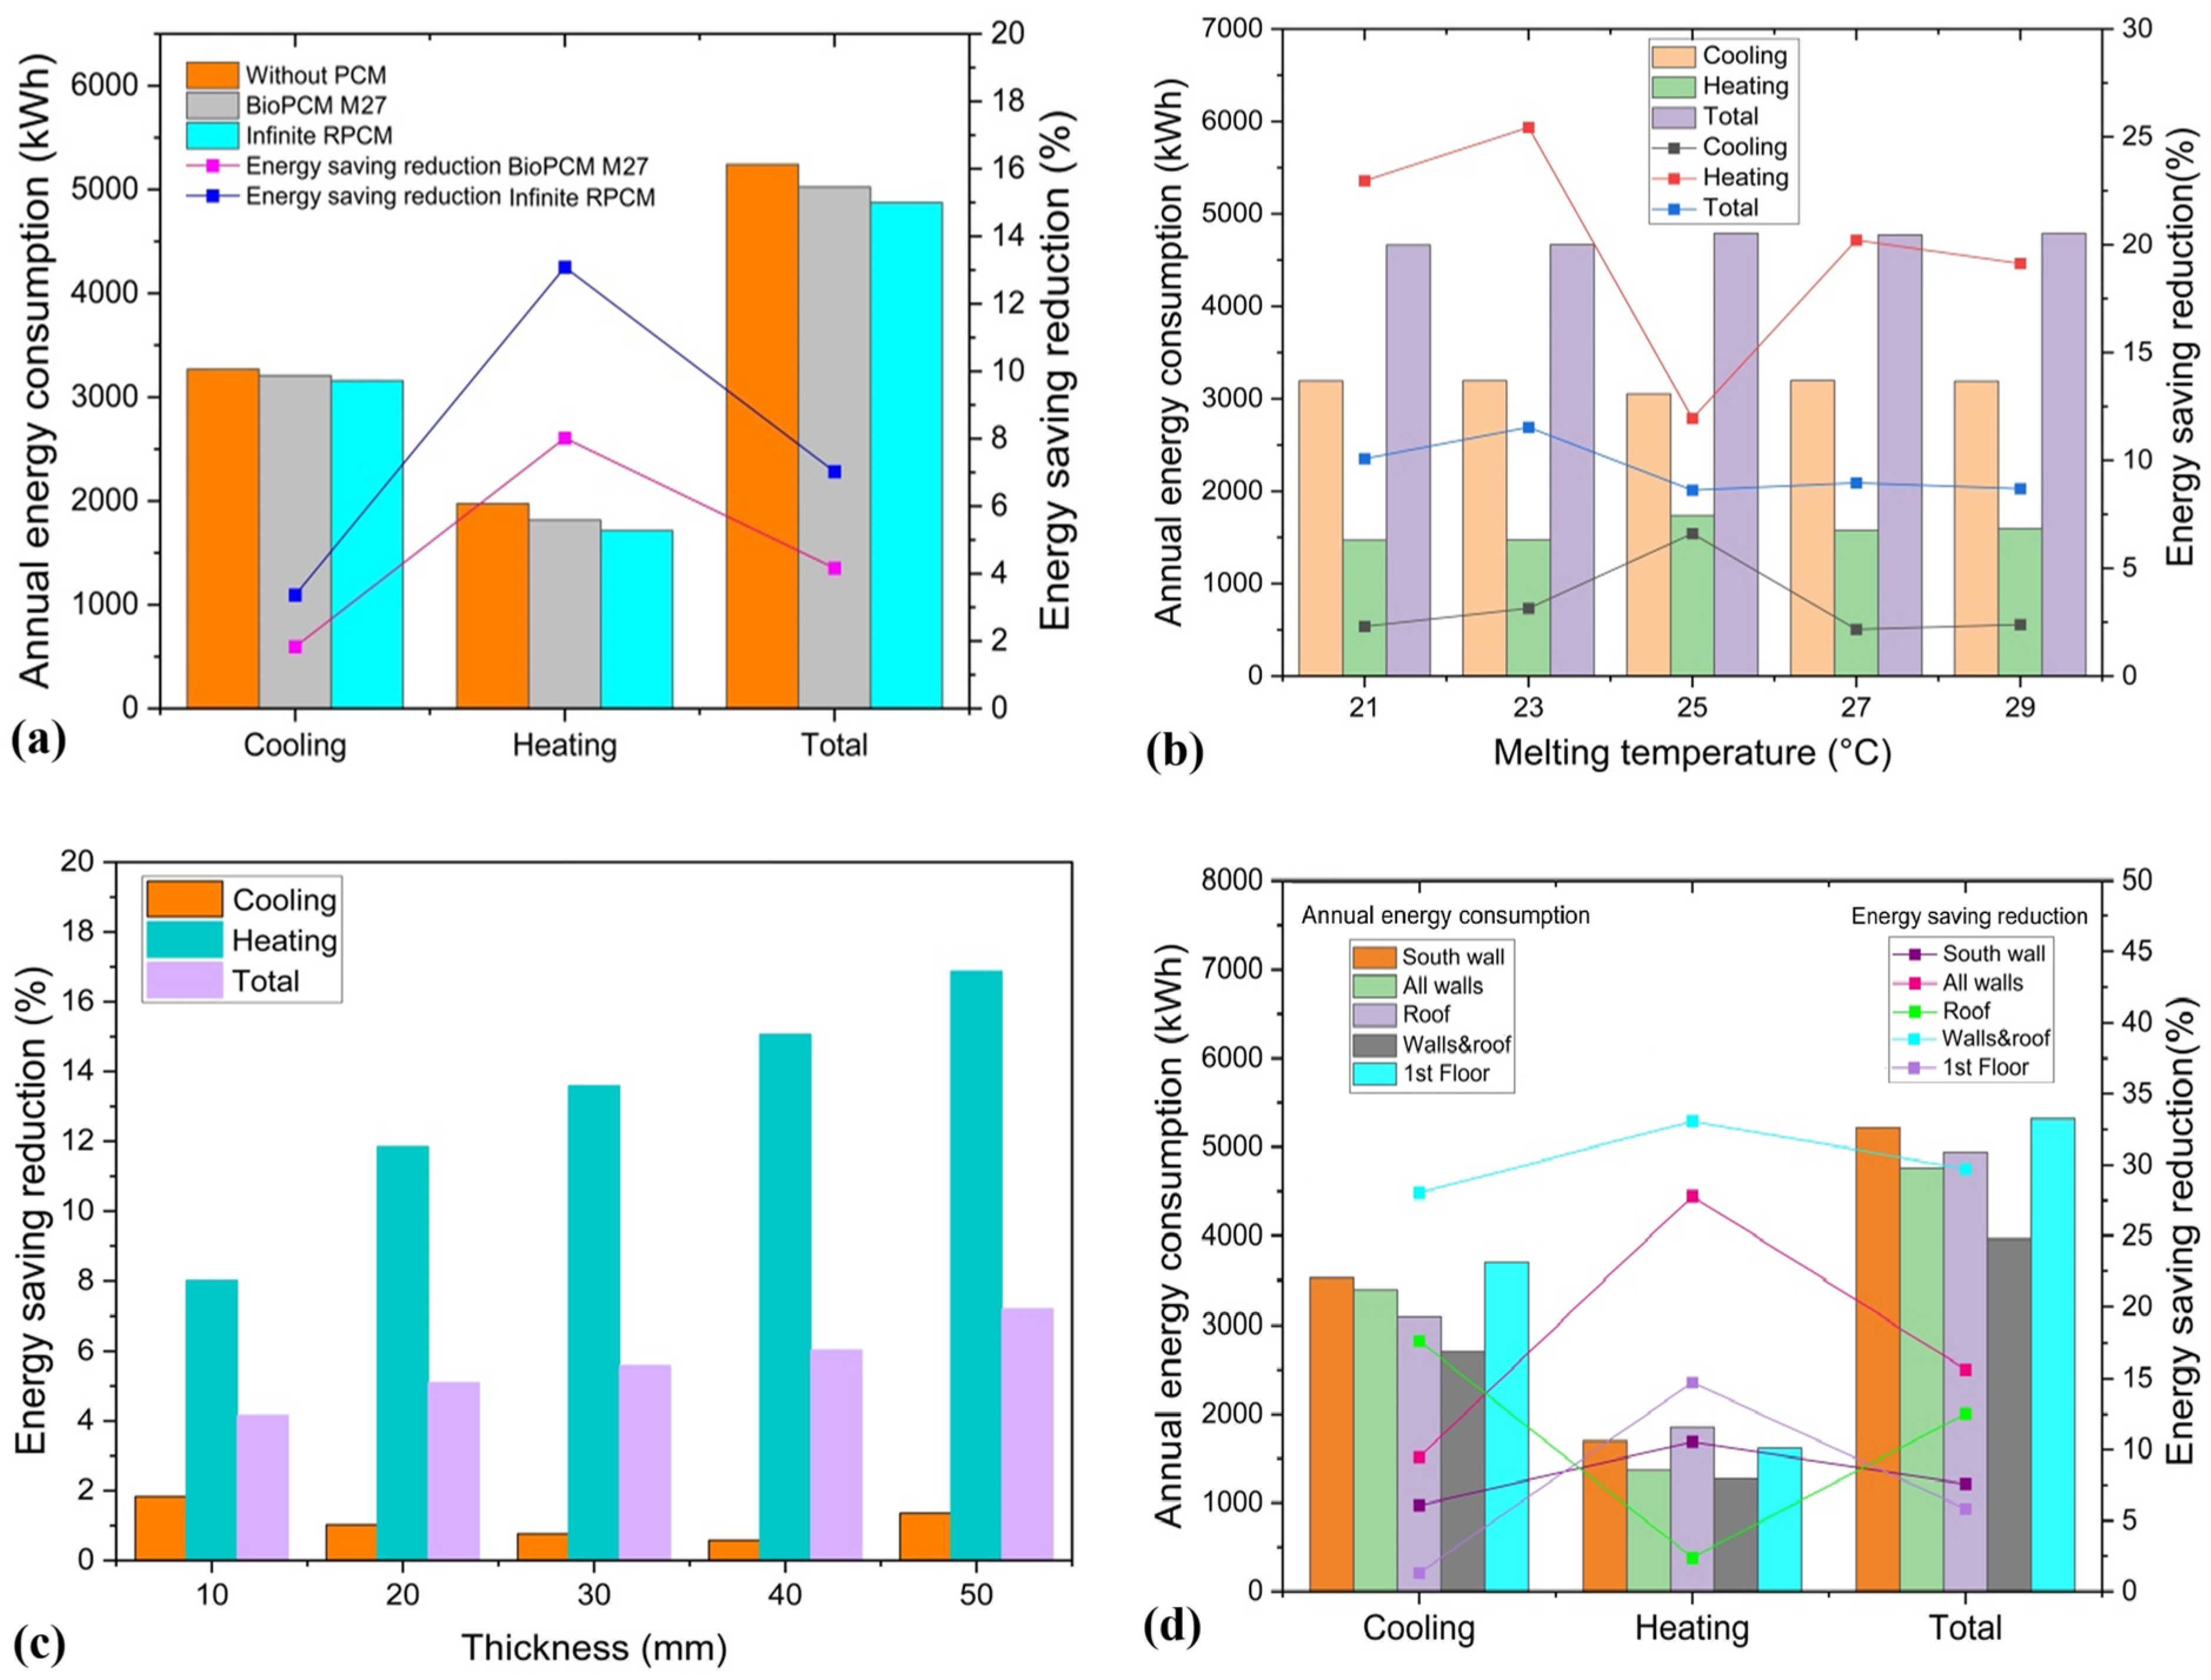
Two types of 10 mm thick PCM (BioPCM M27 and Infinite RPCM) with a Tm = 25 °C were placed on the outer surface of a typical brick wall, and their performance was analyzed (Figure 11a).
Infinite RPCM saved approximately 2% more energy in cooling and 5% more energy in heating compared to BioPCM. Additionally, the use of Infinite RPCM25 and BioPCM stood out with energy savings of approximately 7% and 4% in total energy consumption, respectively. This difference was attributed to the superior thermal conductivity of Infinite RPCM, enabling more efficient heat storage. Conversely, BioPCM’s lower thermal conductivity limited its performance. This result aligned with findings from Ref. [59], which reported energy savings of up to 29% for PCMs applied to external wall surfaces in Mediterranean climates.
A wider range of phase change temperatures (21–29 °C) was investigated for the use of Infinite RPCM, which demonstrated superior performance compared to BioPCM, considering the seasonal variations in heating and cooling demands (Figure 11b). The analysis revealed that the phase change temperature significantly influences energy-saving rates. Among the tested temperatures, the optimum Tm was identified as 23 °C, achieving the highest total energy reduction rate of 12%. At this temperature, the annual energy savings for heating reached approximately 25%, which was notably higher compared to the savings for cooling, which were around 4%. This highlighted that the benefits of PCM integration were more pronounced during the heating season due to the greater potential for thermal energy storage/release during colder periods. Furthermore, the results emphasized the importance of selecting an appropriate Tm tailored to the specific thermal demands of the building and the climatic conditions.
Increasing RPCM23 thickness resulted in substantial improvements in energy reduction rates, as demonstrated in Figure 11c. The analysis considered PCM thicknesses ranging from 10 to 50 mm, revealing a clear trend where thicker PCM layers enhanced energy savings. For a thickness of 10 mm, the total energy reduction was approximately 4%, and each 10 mm increment in RPCM thickness contributed to approximately 1% improvement in the total reduction rate. The most significant result observed of the thickness was determined to be 50 mm, achieving the highest total energy savings of 8%. At this thickness, the energy reduction during heating was particularly significant, contributing to approximately 81% of the total savings, while cooling accounted for the remaining 19%.
Various PCM locations, including the south walls, roof, first-floor ceiling, all walls, and a combination of roof and walls, were investigated to determine the most suitable placement within the building envelope (Figure 11d). The analysis assessed energy consumption across five different scenarios to compare the energy-saving potential of Infinite RPCM, which had Tm = 23 °C, l = 50 mm, and was placed on the external face in each scenario. The results shown in Figure 11d indicate that, among the five scenarios analyzed, the combination of PCM23 on both the roof and walls provided the highest reduction in annual energy consumption, achieving an energy-saving rate of 29%. This was followed by the scenario where PCM23 was integrated into all walls, resulting in a 15% reduction in energy consumption.
The third-best scenario was the integration of PCMs into the roof, yielding a 12% reduction. These findings suggested that the combination of PCMs on the roof and walls offered the most significant potential for energy savings, while PCM placement solely on the roof or walls provided lower, but still notable, reductions in energy consumption.

3.1.2. Synergy Between Different Wall Materials and PCM

The effects of using PCMs in the building with different wall materials, including brick, stone, and concrete, on energy consumption were evaluated in the study (Figure 12). In each case, a 50 mm layer of PCM with a Tm = 23 °C was applied to the outer surface on all walls. Outcomes showed that PCMs reduced energy consumption in all wall types. However, there were significant differences in the energy-saving rates achieved when combining different materials with the PCM. The use of PCMs in brick walls reduced annual energy consumption by 16%, while this rate was 11% in stone walls and 13% in concrete walls. Brick walls remained warm or cold for a longer time, reducing heating and cooling loads due to the high heat capacity of PCMs. These results indicate that PCMs are particularly effective in lighter wall materials such as brick.
In conclusion, the energy-saving rates achieved by integrating PCMs into different wall materials varied depending on the type of material. The use of PCMs in brick walls offered a higher potential for energy savings compared to other wall materials. These findings were consistent with those of Ref. [60], which emphasizes the increased effectiveness of PCMs in lightweight buildings compared to structures with higher thermal inertia.
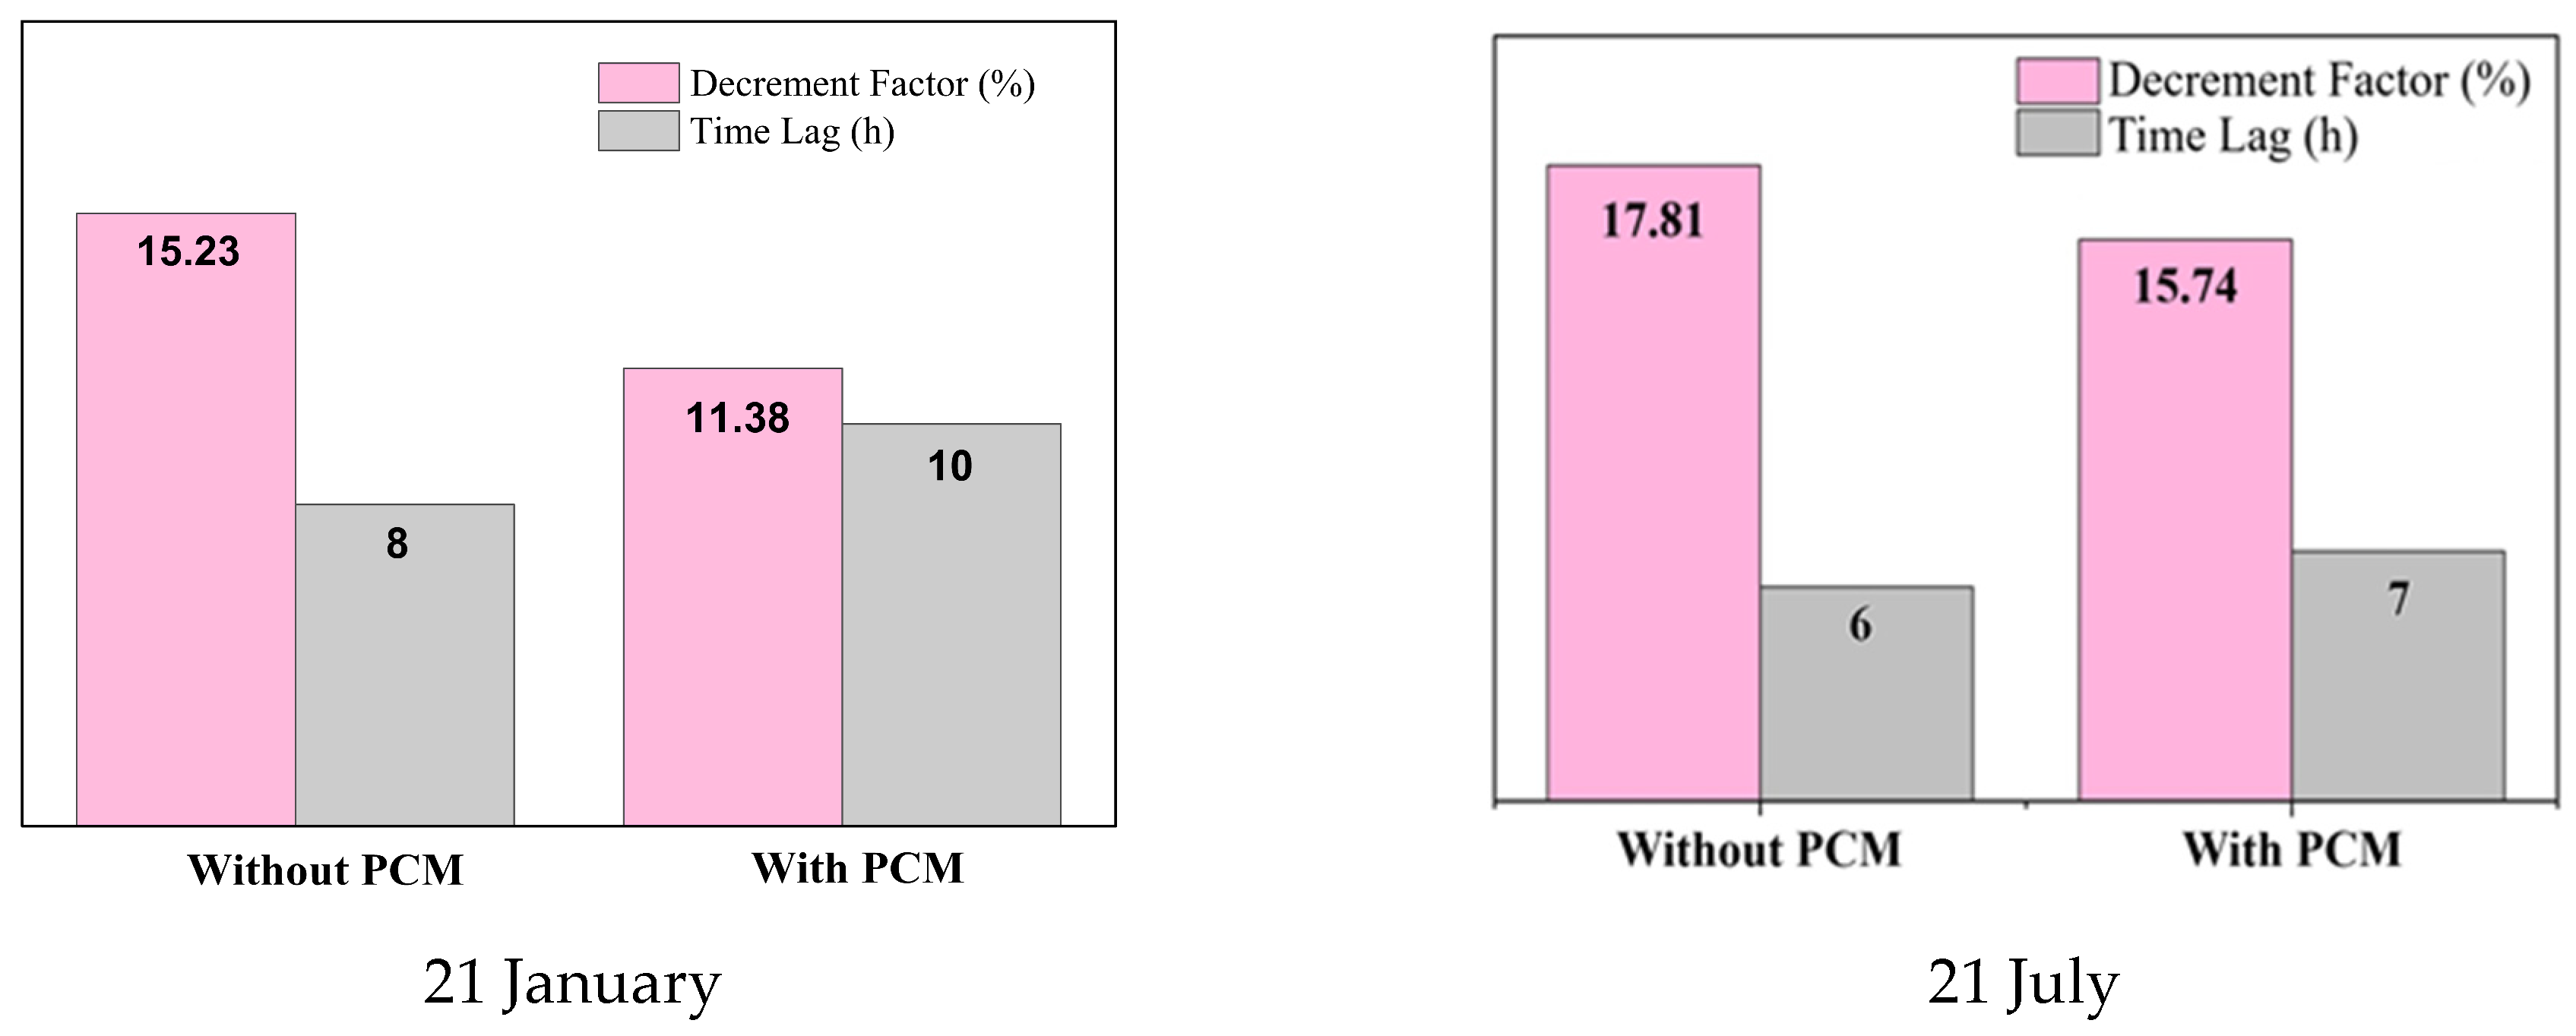
The decrement factor and time lag of a brick wall with 50 mm thick PCM23 were investigated during tests conducted on 21 January and 21 July (Figure 13). On 21 July, using PCMs reduced the decrement factor by 2% and increased the time lag by one hour compared to a system without a PCM. Similarly, on 21 January, PCM integration brought a more noticeable change, lowering the decrement factor from 15.23% to 11.38% and extending the time lag from 8 h to 10 h. This seasonal difference can be explained by the latent heat storage effect of PCMs. In winter, the continuous and relatively stable indoor–outdoor temperature difference allows the PCM to absorb and release heat gradually, thereby delaying heat transfer and extending the time lag. In contrast, during summer, strong solar radiation acts as a dynamic load. Although PCMs attenuate the amplitude of external temperature fluctuations by storing part of this energy, its storage capacity becomes saturated more rapidly, leading to a higher decrement factor but a shorter time lag.
These findings show how PCMs can significantly improve thermal performance, especially by reducing the decrement factor. Because of their high heat capacity and energy storage properties, PCMs boost the system’s thermal inertia, slowing the spread of temperature changes. This not only stabilizes indoor temperatures but also increases the time lag, highlighting their value in forming a more comfortable and energy-efficient indoor environment.

3.1.3. Influence of Roof Configuration and PCM Integration on Energy Consumption

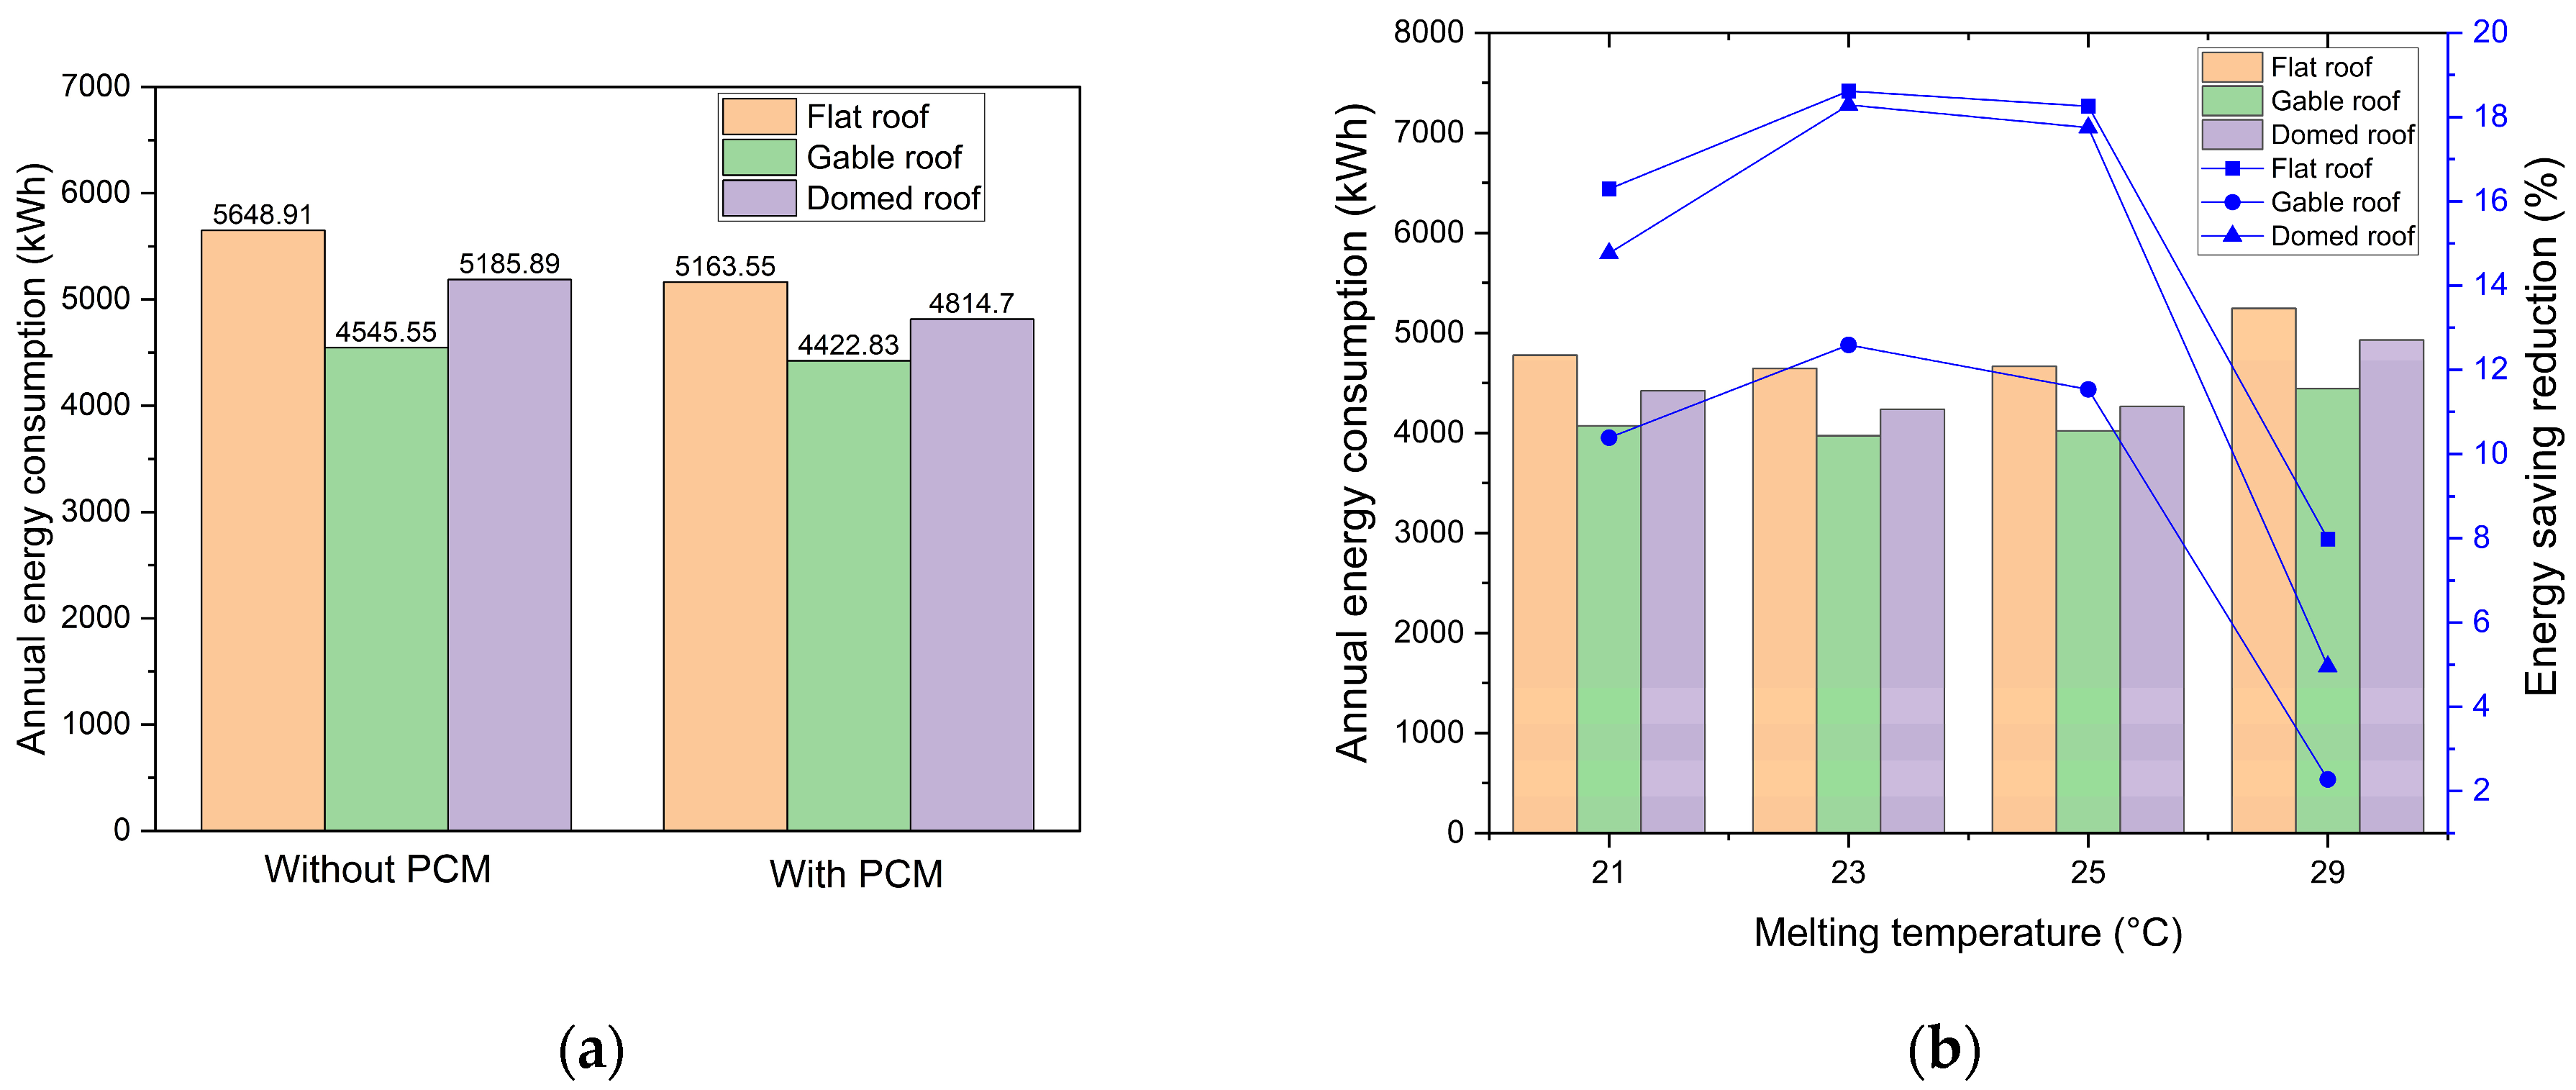
The impact of different roof configurations, as specified in Figure 5, on energy consumption with the utilization of brick wall and PCM23 is shown in Figure 14. In the absence of PCM integration, buildings with gable and domed roof configurations exhibited lower annual energy consumption compared to flat roofs. Specifically, gable roofs consumed 1103 kWh (20%) less energy, and domed roofs consumed 463 kWh (8%) less energy per year compared to flat roofs (Figure 14a). This reduction was attributed to the superior thermal performance of curved roofs, which effectively reflected solar radiation and dissipated heat through convection, as in Refs. [61,62]. While the integration of PCMs significantly reduced energy consumption for all roof types, the flat roof remained the most effective regarding absolute energy savings. However, in terms of relative energy savings, the flat roof utilizing a PCM with Tm = 23 °C achieved the highest reduction rate of 19%. As illustrated in Figure 14b, the energy-saving potential was closely linked to both the roof shape and the PCM melting temperature. A PCM layer with a thickness of 50 mm and a Tm range of 21 to 29 °C was applied to the exterior of the roof. The outcomes indicated that a PCM melting temperature of 23 °C improved energy savings across all roof shapes. The gable roof was found to have the lowest average energy consumption compared to flat and domed roofs. These findings were consistent with previous research, such as Ref. [63], which indicated a reduced sensitivity of gable roofs to directional solar radiation.

3.1.4. Role of Shading and PCM Integration in Energy Consumption

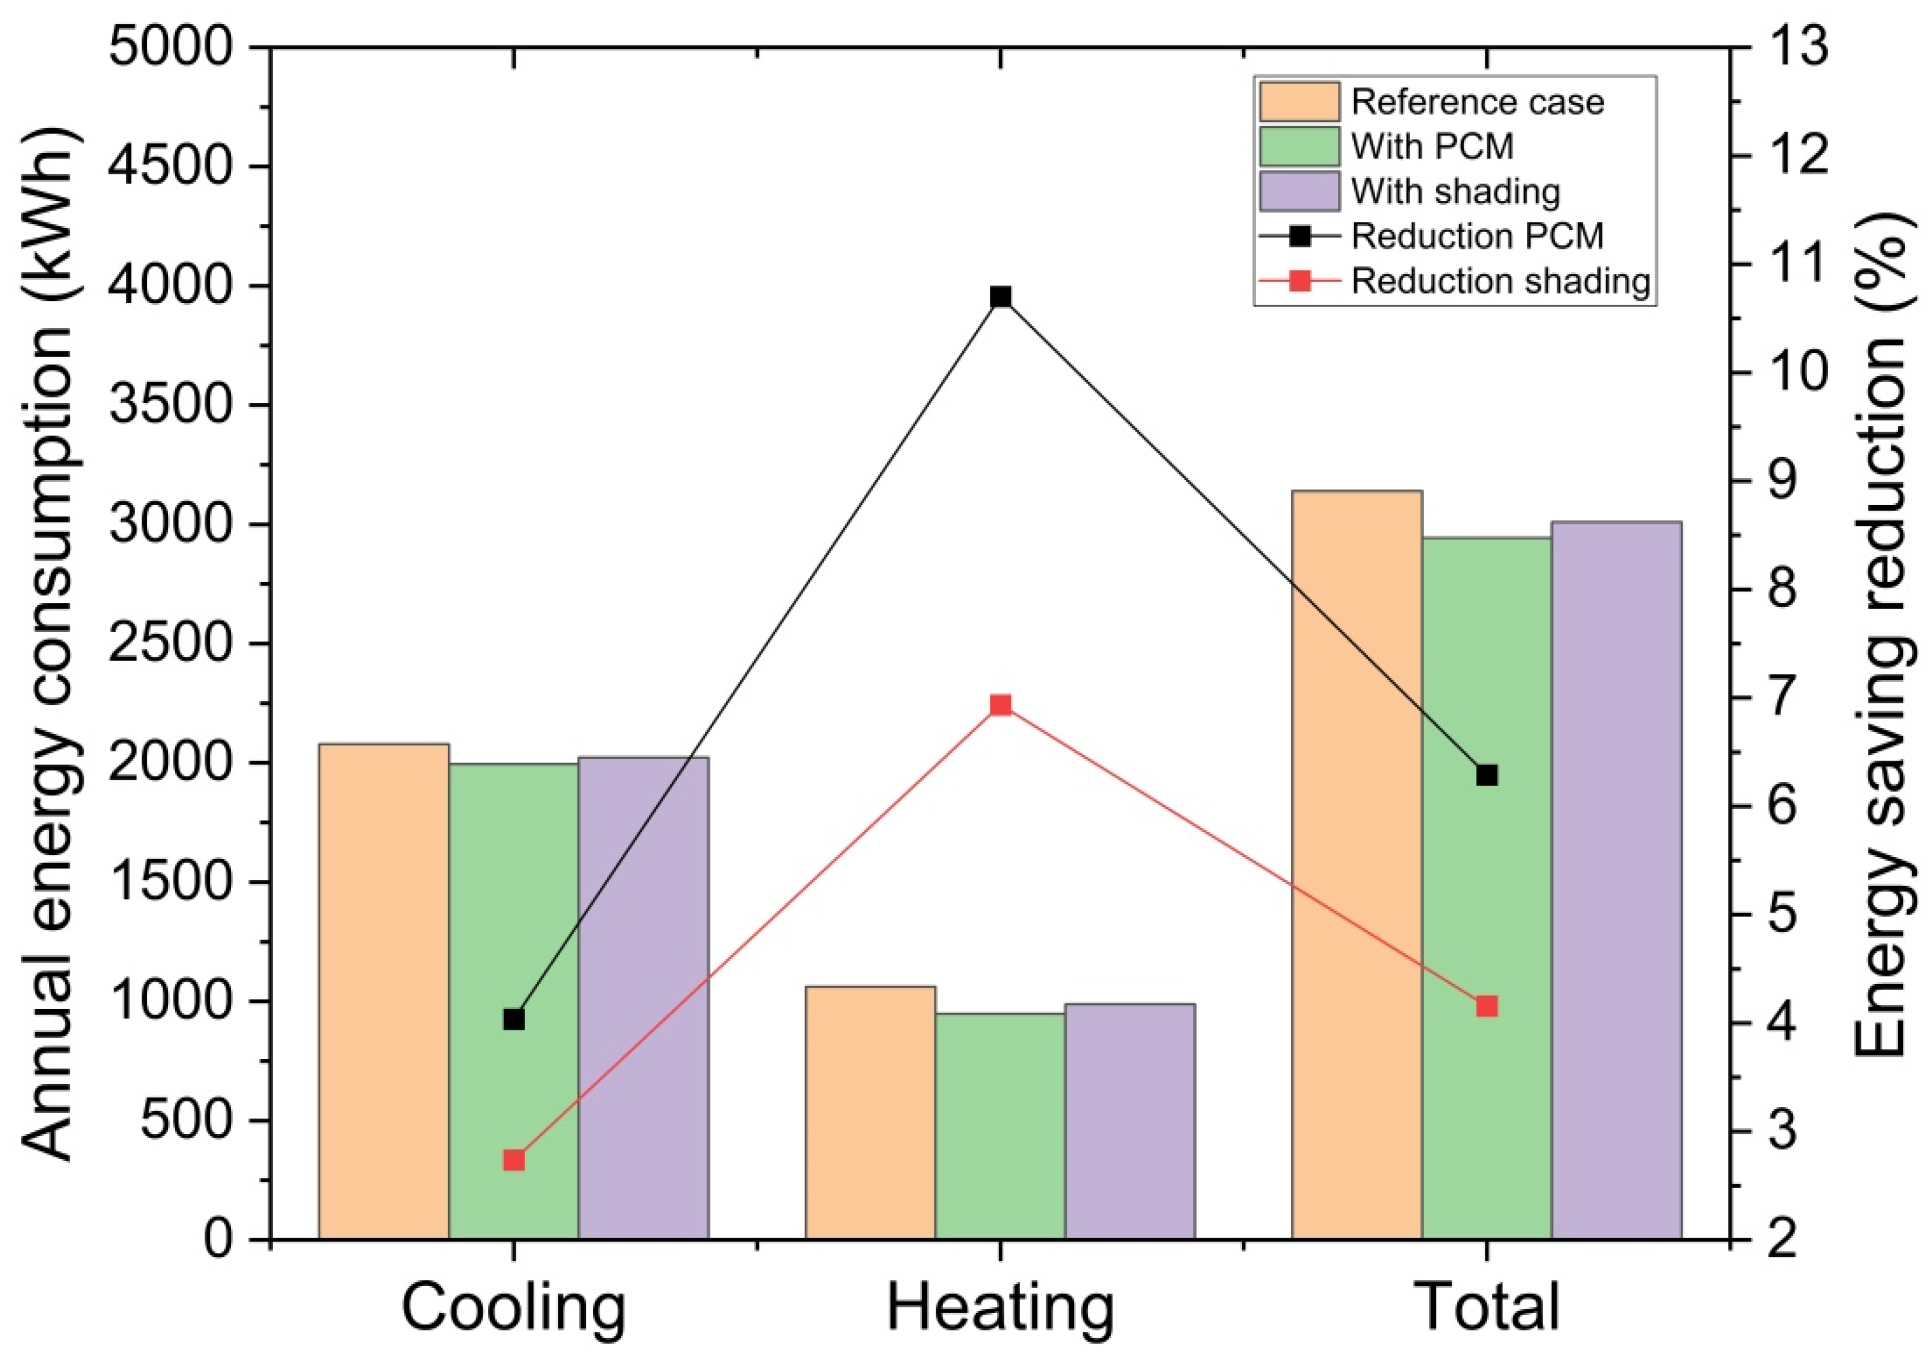
Figure 15 illustrates the impact of PCM23 and shading strategies on a building’s annual energy consumption, highlighting a comparative analysis of their effectiveness. PCM23 implementation achieved a higher overall reduction in annual total energy consumption at approximately 6%, compared to the 4% reduction observed with shading strategies. This demonstrated PCM23’s superior capability in enhancing thermal performance by storing heat during the day and releasing it gradually, thereby maintaining a more stable indoor temperature. PCM23 was particularly effective during the heating season, as it stored heat during daylight hours and released it at night, significantly reducing the operating time of the heating system.
In contrast, shading strategies primarily impacted energy consumption during the cooling season by minimizing direct solar radiation on the building envelope. This reduced indoor heat gain, lowering the cooling load and decreasing the reliance on mechanical cooling systems. While shading was slightly less effective than PCM23 in terms of overall annual energy savings, it played a critical role in enhancing thermal comfort and mitigating cooling demand during peak summer months.

3.2. Thermal Comfort Analyses

3.2.1. Effect of PCM Integration on Thermal Comfort

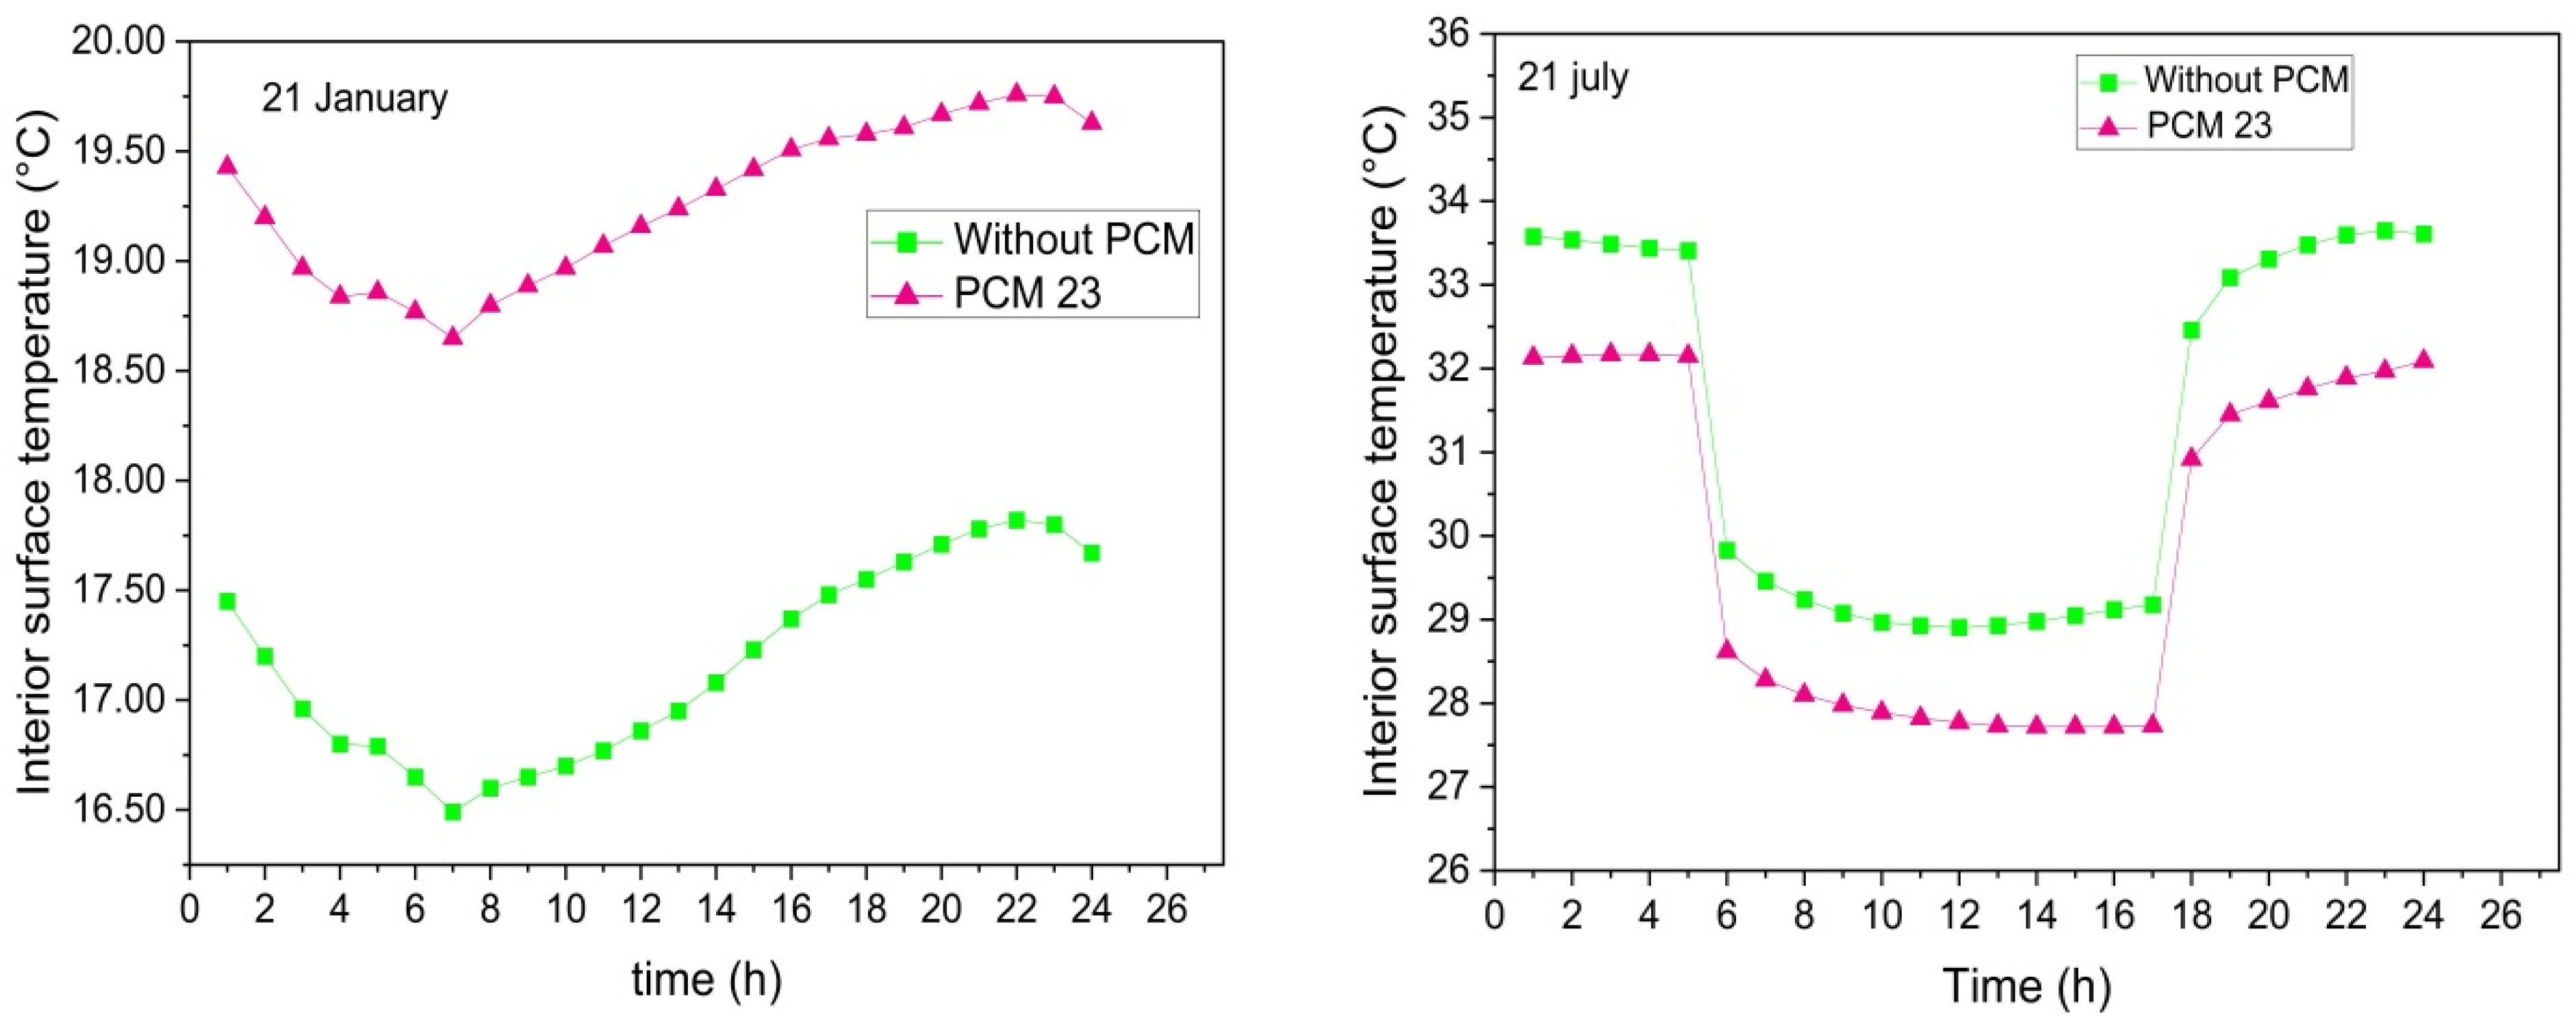
Interior wall surface temperatures were analyzed on 21 January and 21 July to evaluate the impact of PCM23 integration on thermal comfort (Figure 16). The integration of PCM23 significantly enhanced the regulation of interior wall surface temperatures, demonstrating its effectiveness on both cold and hot days. On 21 January, representing a cold day, the interior surface temperature with PCM23 consistently remained higher than the baseline case without PCM23. Specifically, PCM23 integration resulted in an average temperature increase of 2.1 °C, contributing to a more stable thermal environment. Conversely, on 21 July, representing a hot day, PCM23 integration had the opposite effect by mitigating excessive heat. The interior surface temperature with PCM23 decreased by an average of 1.6 °C compared to the scenario without PCM23. This performance highlighted PCM23’s ability to reduce temperature fluctuations and improve indoor thermal comfort on both days, attributed to its capacity to absorb heat during the day and gradually release it during colder night hours.
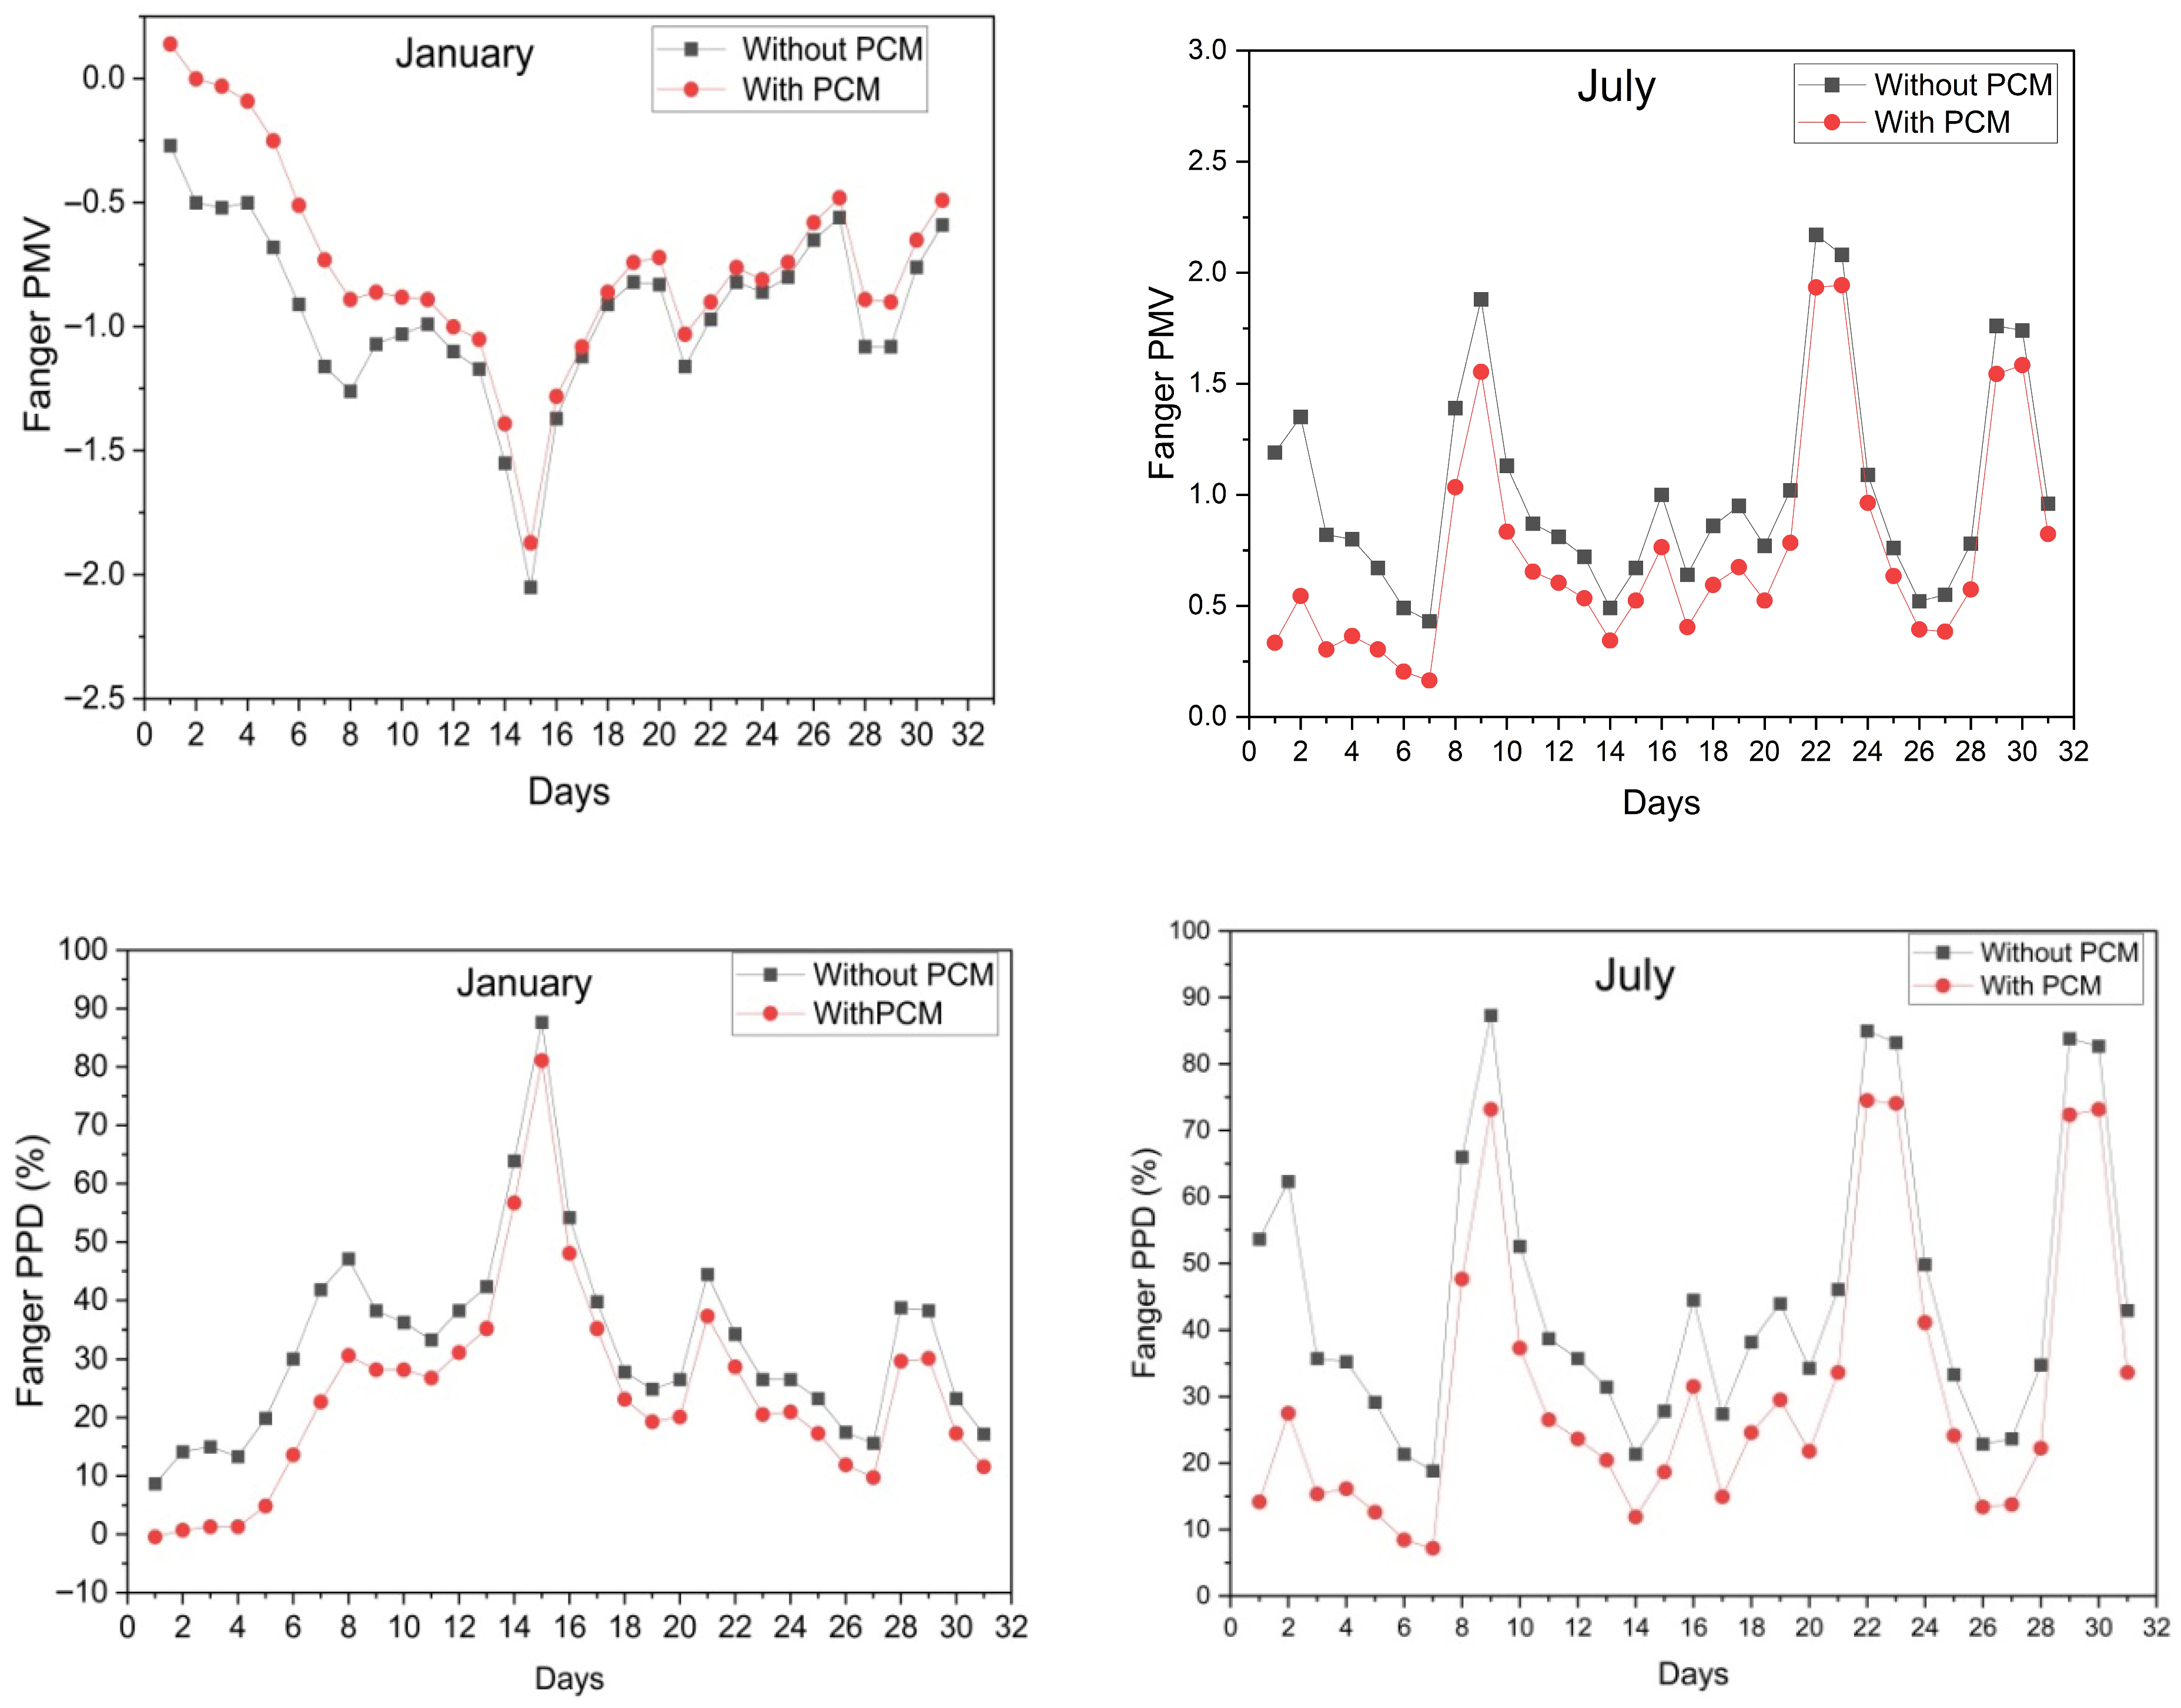
The integration of PCM23 in the building significantly improved thermal comfort, particularly during winter (Figure 17). Indoor thermal conditions often fall below the comfort range during the cold months due to low ambient temperatures and limited solar gains in Tabarka. For the building without PCM23, the PMV value reached the comfort range by 3% in January, whereas this value increased to 17% in the building equipped with PCM23. This improvement represented a 13% improvement in thermal comfort. PCM23 effectively absorbed and released heat, contributing to more stable indoor temperatures, especially during nighttime, and reduced fluctuations in thermal conditions.
Findings revealed that PCM23 provided improvement in PPD. During January, the PPD values in the PCM23-integrated building were consistently lower, with reductions ranging from 10 to 15%. This indicated a substantial improvement in occupant comfort and demonstrated PCM’s capacity to mitigate the effects of colder nights by gradually releasing stored heat, which reduced the operational demand on heating systems. The effect of PCM23 on thermal comfort was milder in July. Although the PCM23 provided some buffering against high daytime temperatures by absorbing excess heat, the PMV frequently exceeded the comfort range on hotter days, leading to less desirable indoor conditions. This was particularly evident during periods of intense solar radiation and high outdoor air temperatures. The limited benefit during summer highlighted the need for complementary passive strategies, such as shading or natural ventilation, to further enhance thermal comfort under extreme heat conditions.
Overall, PCM23 integration showed a seasonal variation in comfort improvements. Thermal comfort improved significantly during January, which was attributed to PCM23’s heat storage and release capabilities, while its effectiveness diminished during July. Despite the reduced summer performance, the PPD values for July indicated a 10 to 15% decrease, suggesting that PCM23 alleviated some discomfort during peak hours. These findings underscored the dual benefits of PCM23 integration in improving indoor thermal comfort and reducing energy demands, particularly in climates with significant seasonal thermal variations.

3.2.2. Impact of Roof Configurations on Thermal Comfort

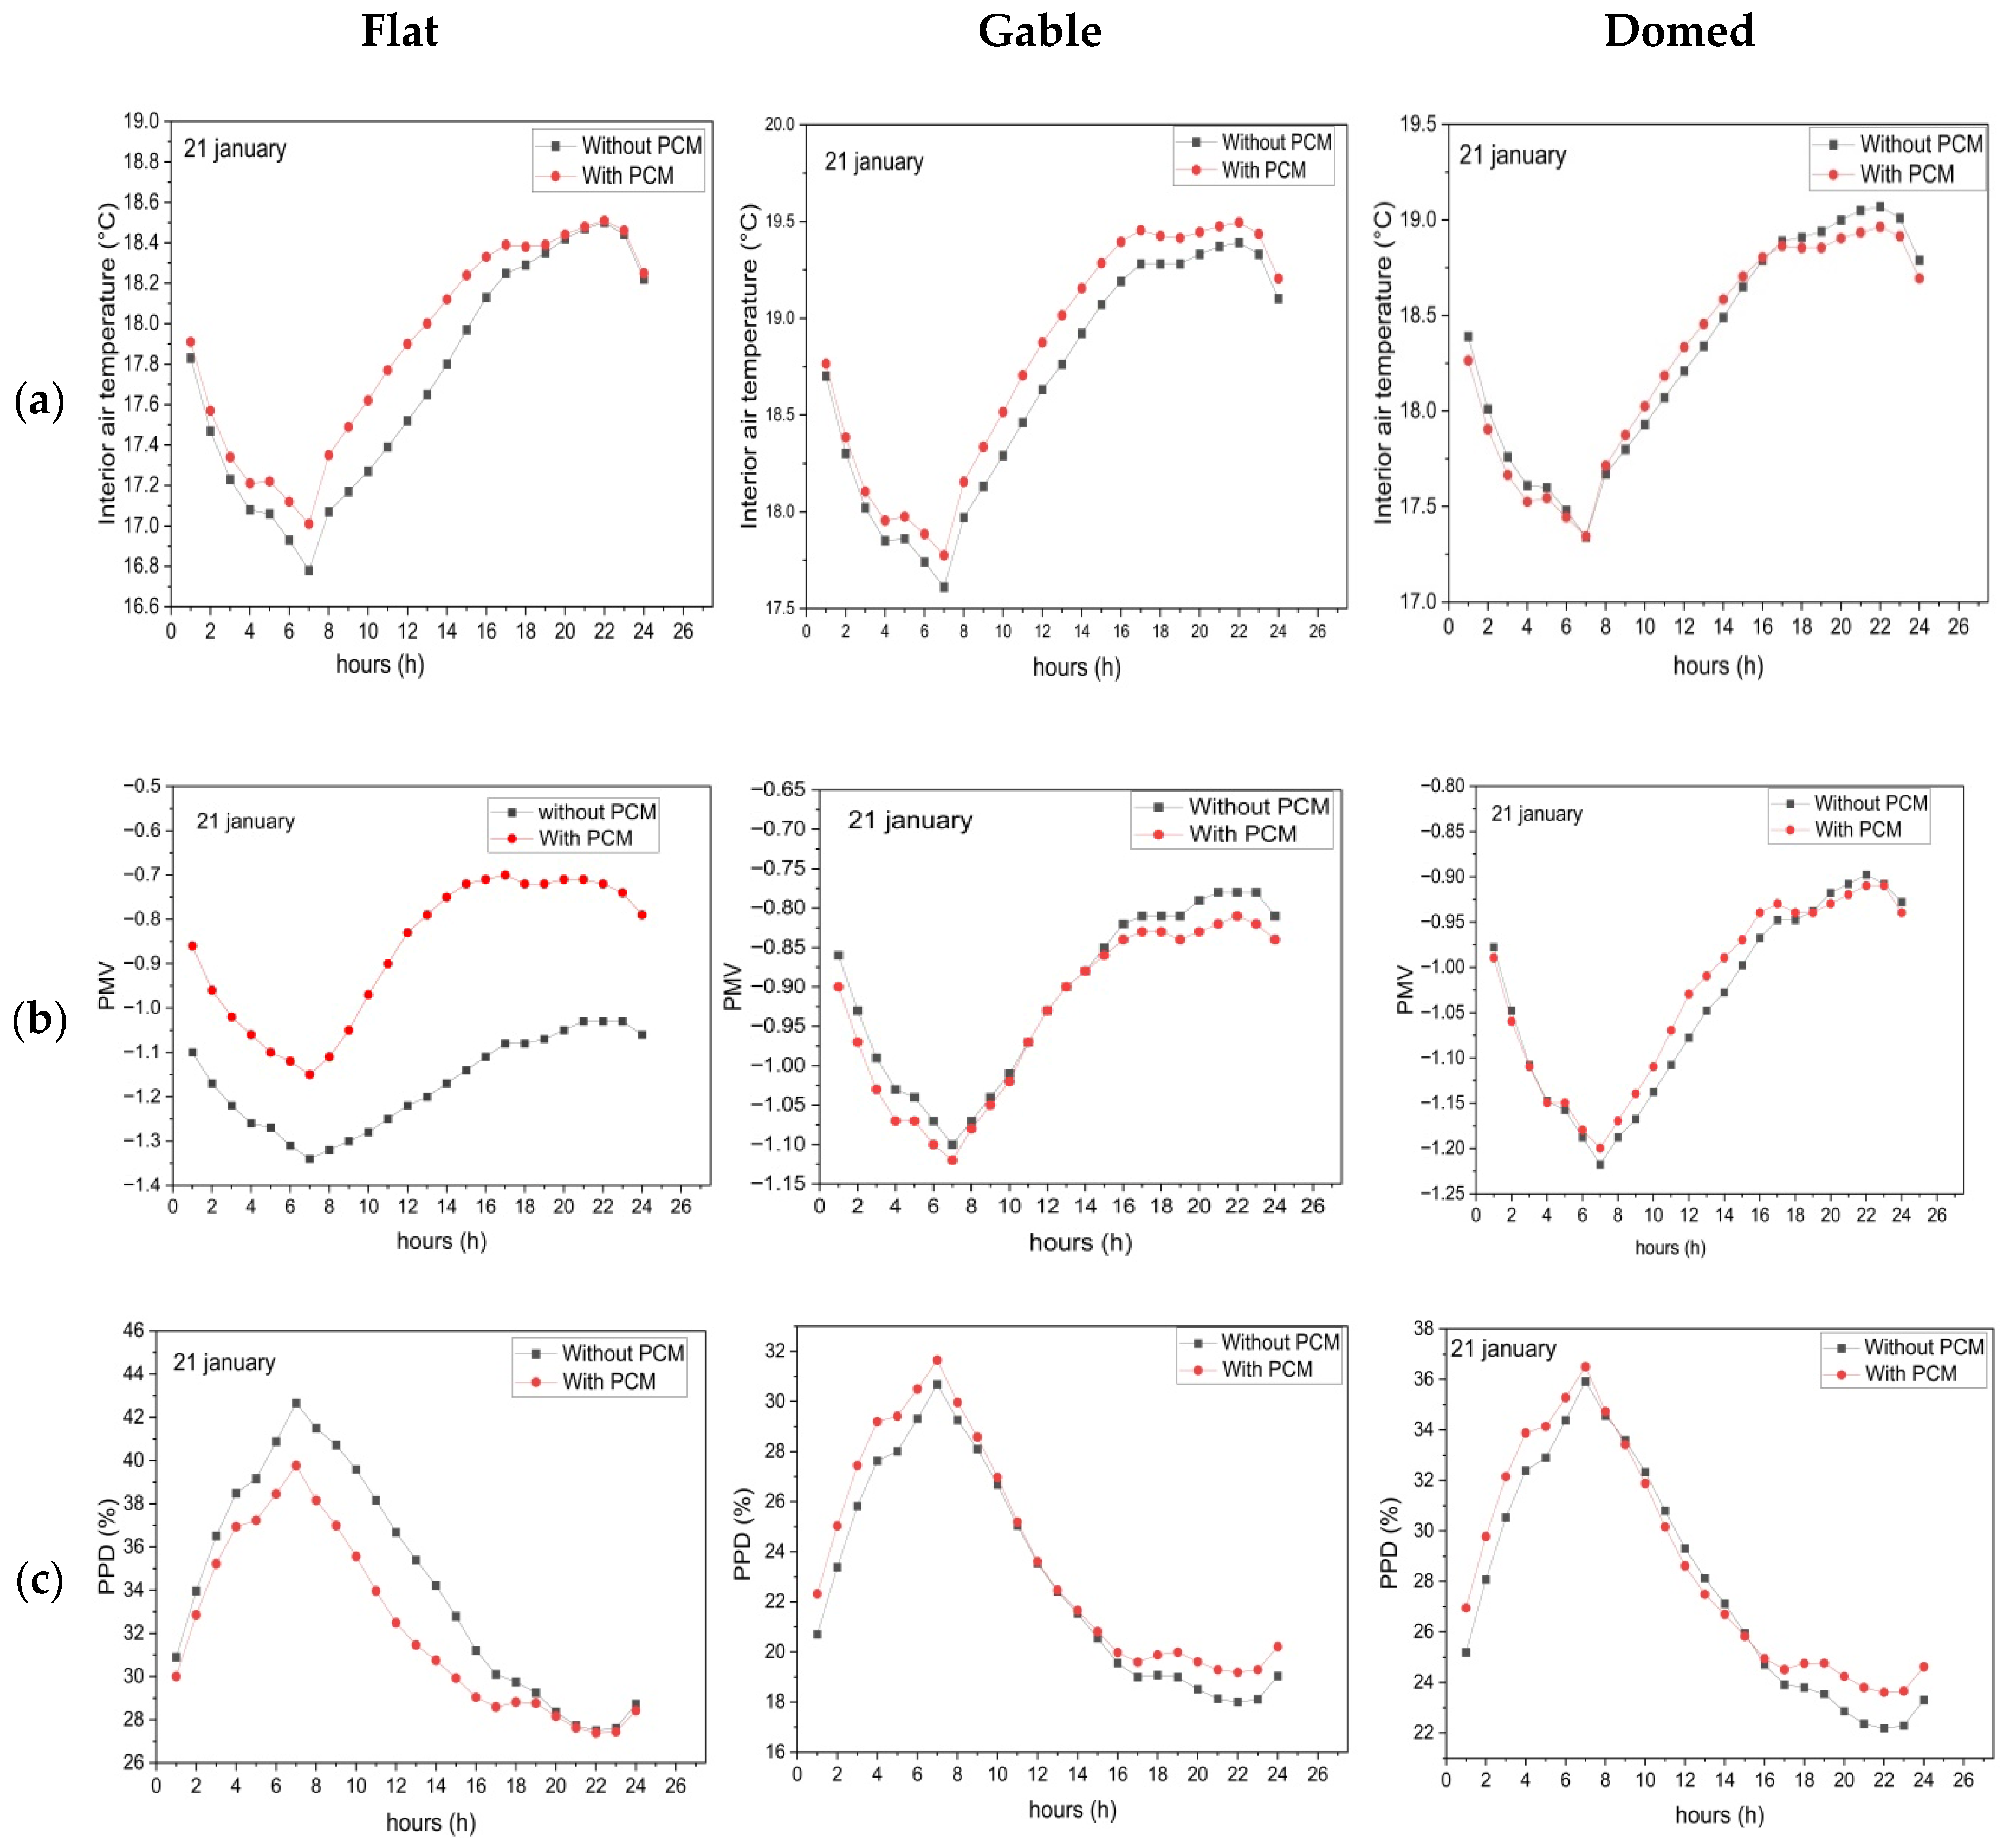
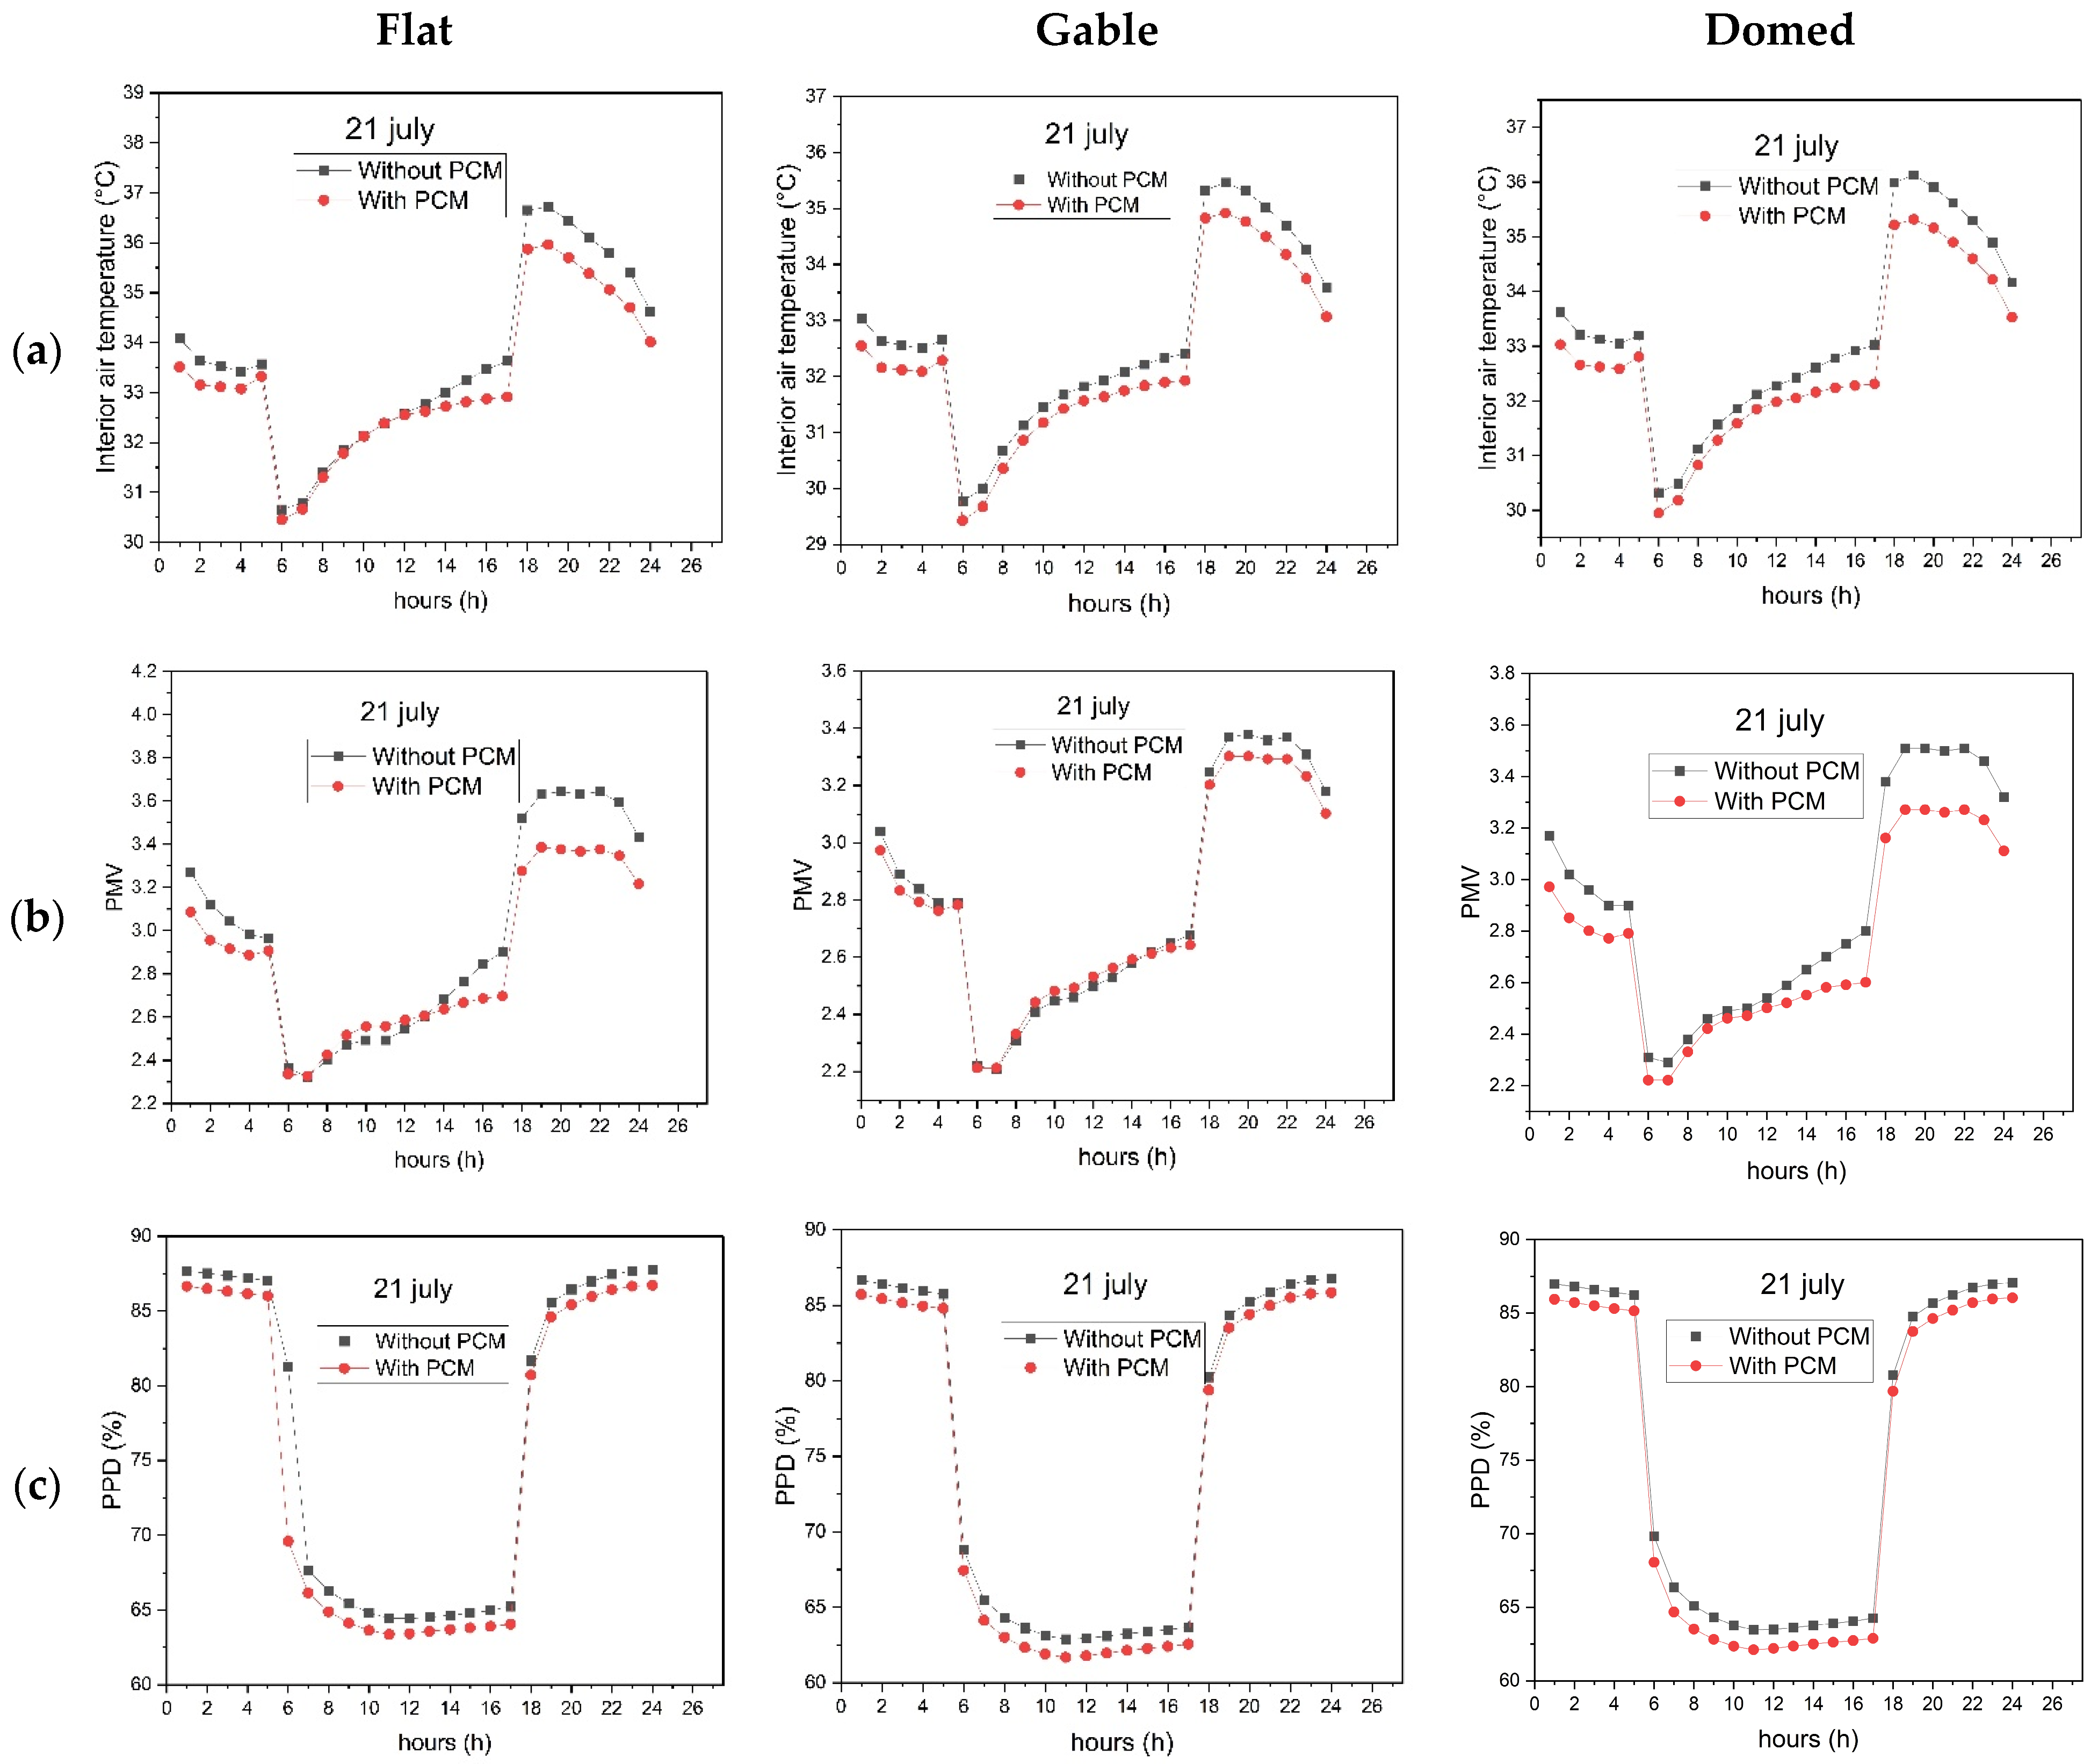
A comparison of the three roof shapes (flat, gable, and domed) was made in terms of thermal comfort parameters (indoor air temperature, PMV, and PPD) both with and without PCM23 integration (Figure 18 and Figure 19). On both days, the thermal conditions exceeded the comfort range. This occurred because the diagram reflected the average thermal comfort, and when external weather conditions were extreme and the building remained unoccupied, the indoor air temperature deviated from the comfort zone due to the suspension of heating and cooling systems. PCM23 integration led to an average decrease in internal temperature of 1.5 °C on 21 July and an average increase of 1.5 °C on 21 January. For the gable and domed roof shapes, PCM23 inclusion caused only minor fluctuations in PMV and PPD values. In contrast, for the flat roof, PCM23 significantly improved these thermal comfort parameters, particularly in winter. The PMV index ranged from −1.3 to −1.0 in scenarios without PCM23 and from −1.2 to −0.7 with PCM23. Similarly, the PPD values varied from 43 to 28% without PCM23 and from 40 to 27% with PCM23 on the same days (Figure 18). Generally, PCM23’s effectiveness relied on its ability to recharge overnight, which required a sufficient temperature drop to solidify the material [64]. However, in equatorial climates, the limited diurnal temperature variations were inadequate for complete PCM23 recharge. Among the three roof shapes, the gable roof was identified as the most effective choice in terms of thermal comfort parameters, outperforming the flat and domed roof shapes.

3.2.3. Influence of Roof Openings and PCMs on Thermal Comfort

In the study, the gable roof was considered for the roof opening due to its ability to provide better comfort conditions compared to other roof configurations. The variations in indoor air temperature and relative humidity in buildings with and without PCM23 with the gable roof opening are presented in Figure 20. The results for 21 January indicated that the outdoor temperature remained lower than the indoor temperature throughout the day. PCM23 integration resulted in an increase of 0.8 °C in the indoor temperature. Additionally, a reduction of approximately 1% in relative humidity was observed on average compared to the building without PCM23, which was attributed to the effect of PCM23 integration on indoor temperature.
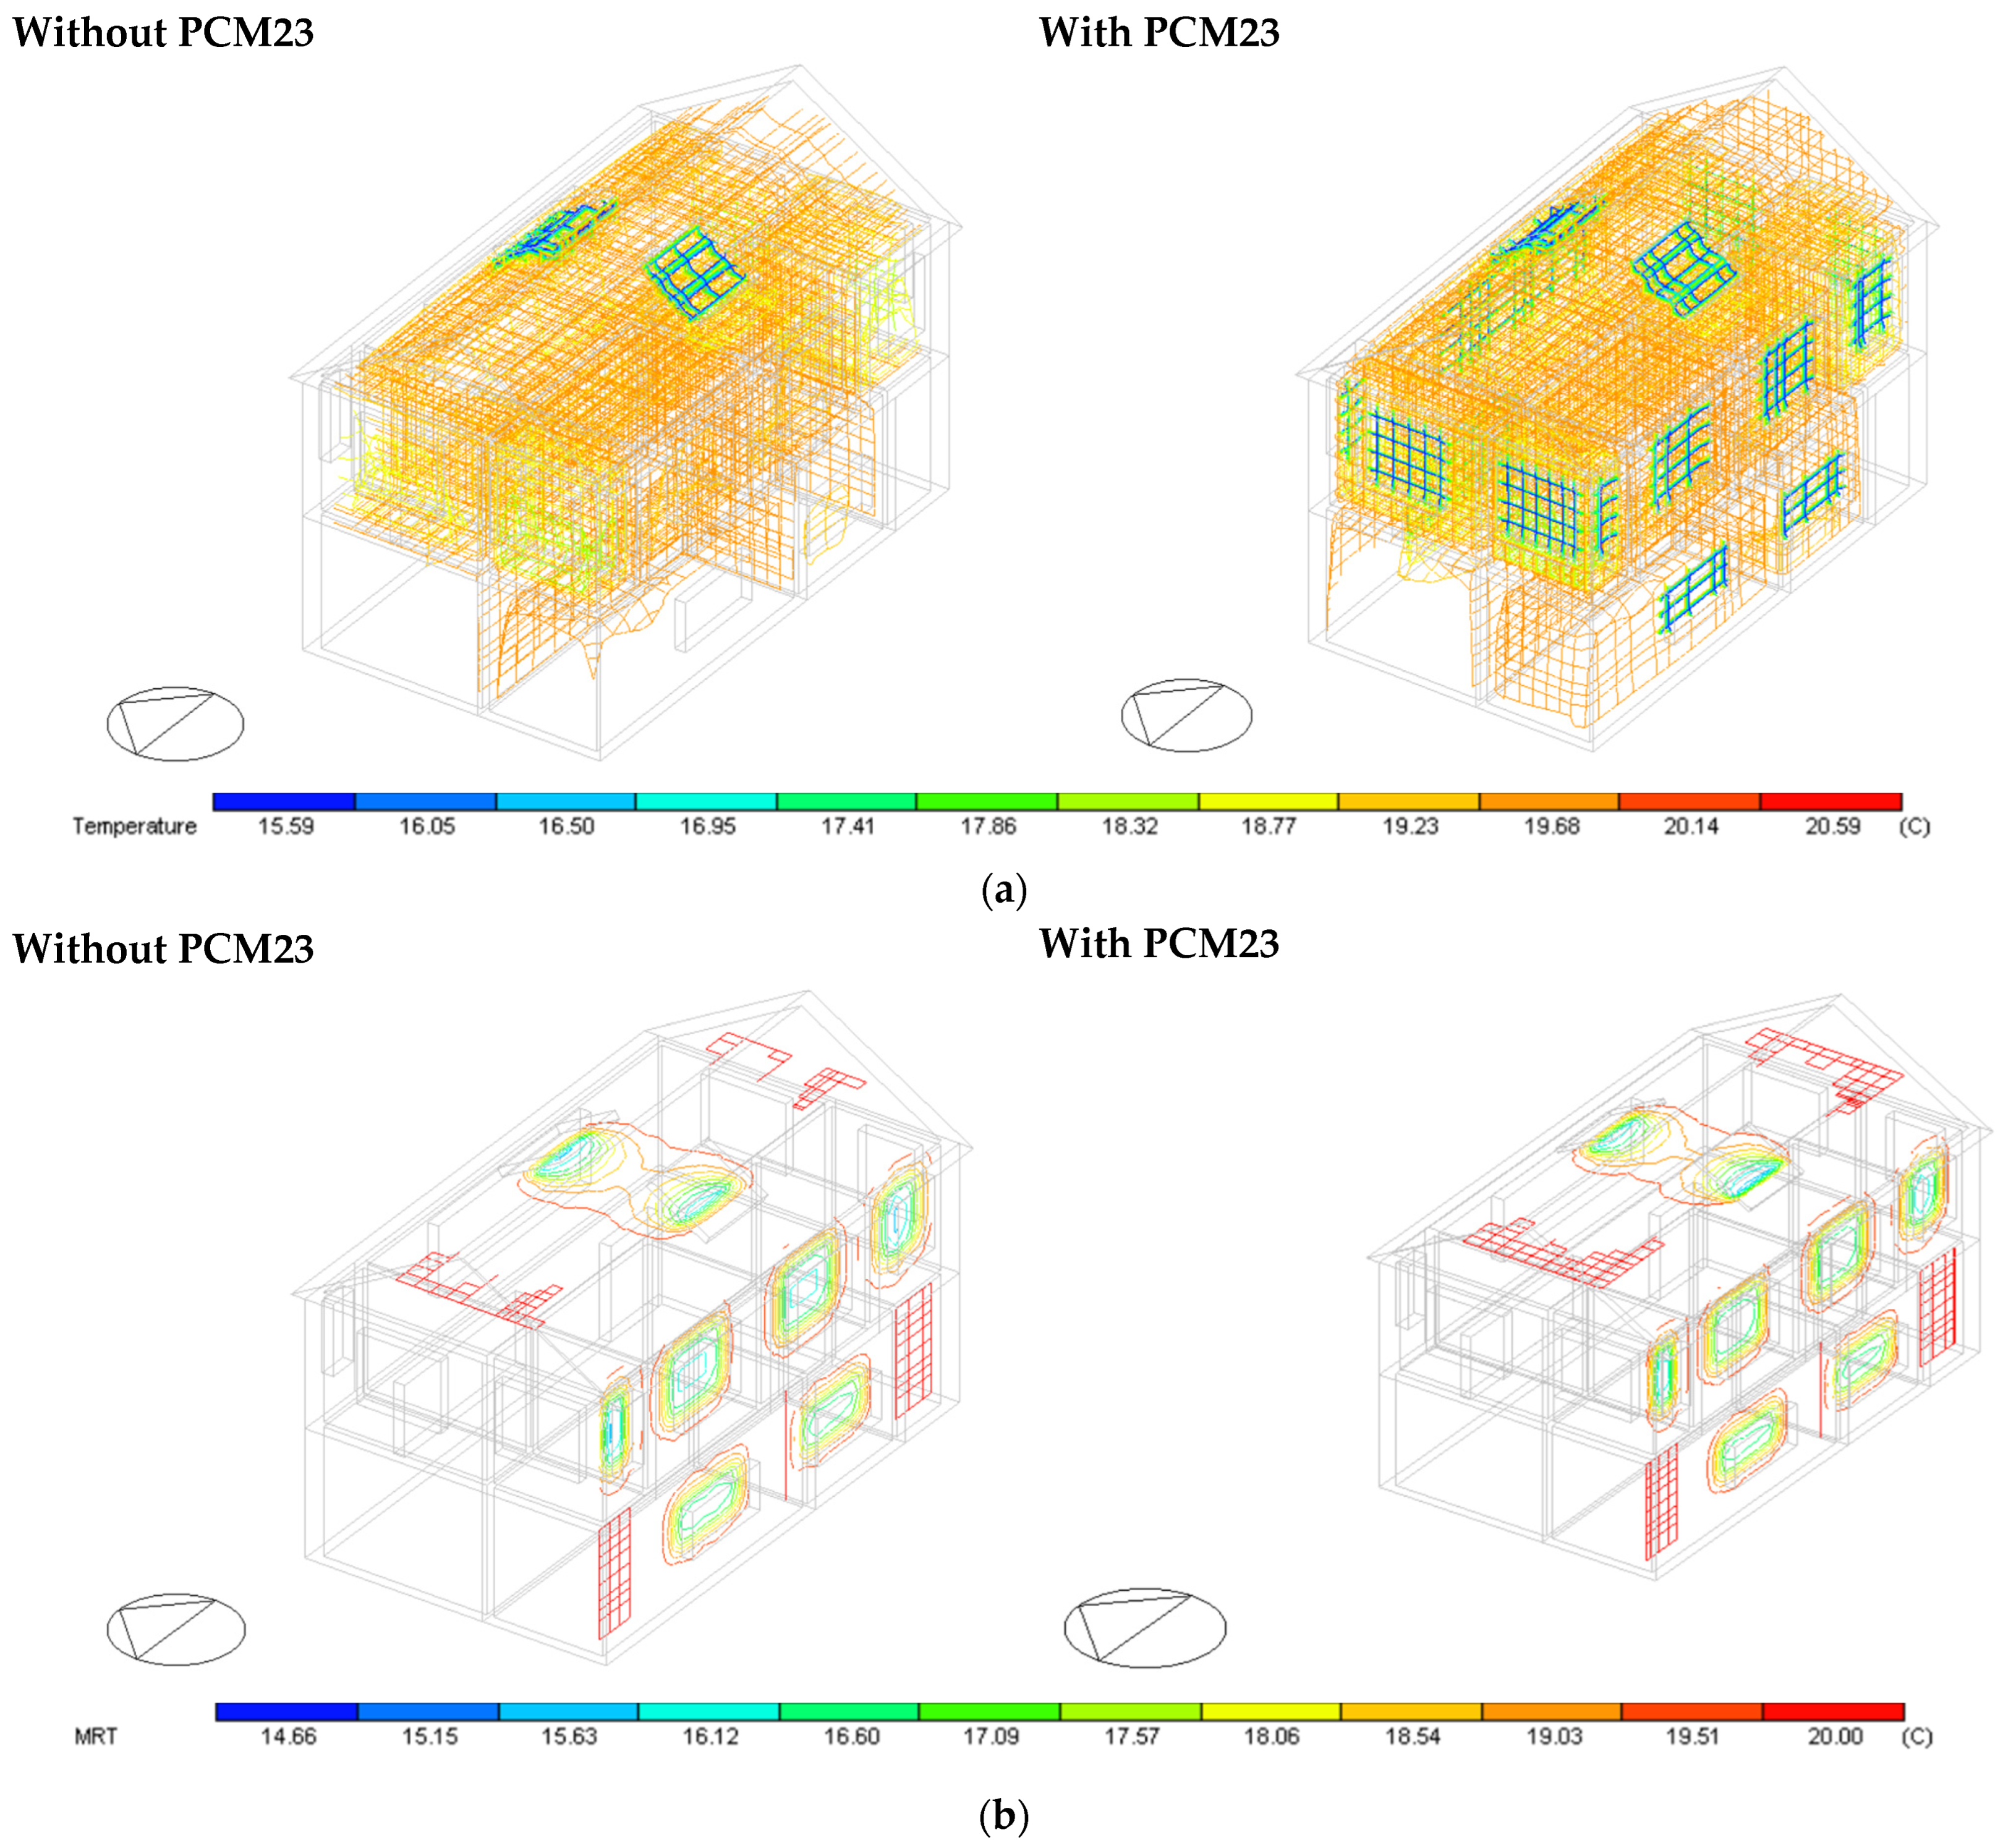
Figure 21 illustrates the distribution of indoor air temperature and radiant temperature for two scenarios: without and with PCM23. In the case without PCM23, the air temperature remained relatively stable at approximately 19.7 °C. The radiant temperature varied slightly across different surfaces, with windows exhibiting lower temperatures compared to the walls, floors, and ceilings. In the scenario with PCM23, the air temperature increased slightly to approximately 20.1 °C. Radiant temperature variations among surfaces were similar to those in the case without PCM23, with windows again showing lower temperatures than the walls, floors, and ceilings. The inclusion of PCM23 resulted in a modest rise in indoor air temperature and a slight decrease in radiant temperature compared to the case without PCM23.
Figure 22 displays the air velocity vectors and PPD contours in cases without and with PCM23. These parameters are distributed over the south wall windows and the two roof openings. The velocity vectors near the window elevation were slightly larger than in the rest of the room, ranging from 0.11 to 0.14 m/s. In the case without PCM23, the percentage of people dissatisfied with the thermal conditions ranged from 79 to 83%, indicating a significant level of discomfort. The average PMV ranged from −1.8 to −1.7, suggesting that most occupants perceived the zone as slightly cold (Figure 23). Wind entering through the window improved airflow within the room and facilitated more efficient air dispersion, promoting better circulation throughout the house. A noticeable decrease in both the PPD and PMV parameters was observed compared to the reference case without PCM23. These changes indicated a slight improvement in the internal conditions of the building.

3.3. Environmental Impacts

The environmental impact reduction was primarily assessed by quantifying the reduction in CO2 emissions associated with the decreased energy consumption. This was calculated by multiplying the energy savings (kWh) with the appropriate CO2 emission factor (kg CO2/kWh) for the electricity grid. The system boundaries for this environmental impact assessment were strictly defined to encompass the operational phase of the building located in Tabarka. The analysis includes CO2 emissions attributed to the energy consumed for heating and cooling loads within the building. Emissions associated with the embodied energy of building materials (including the PCM itself).
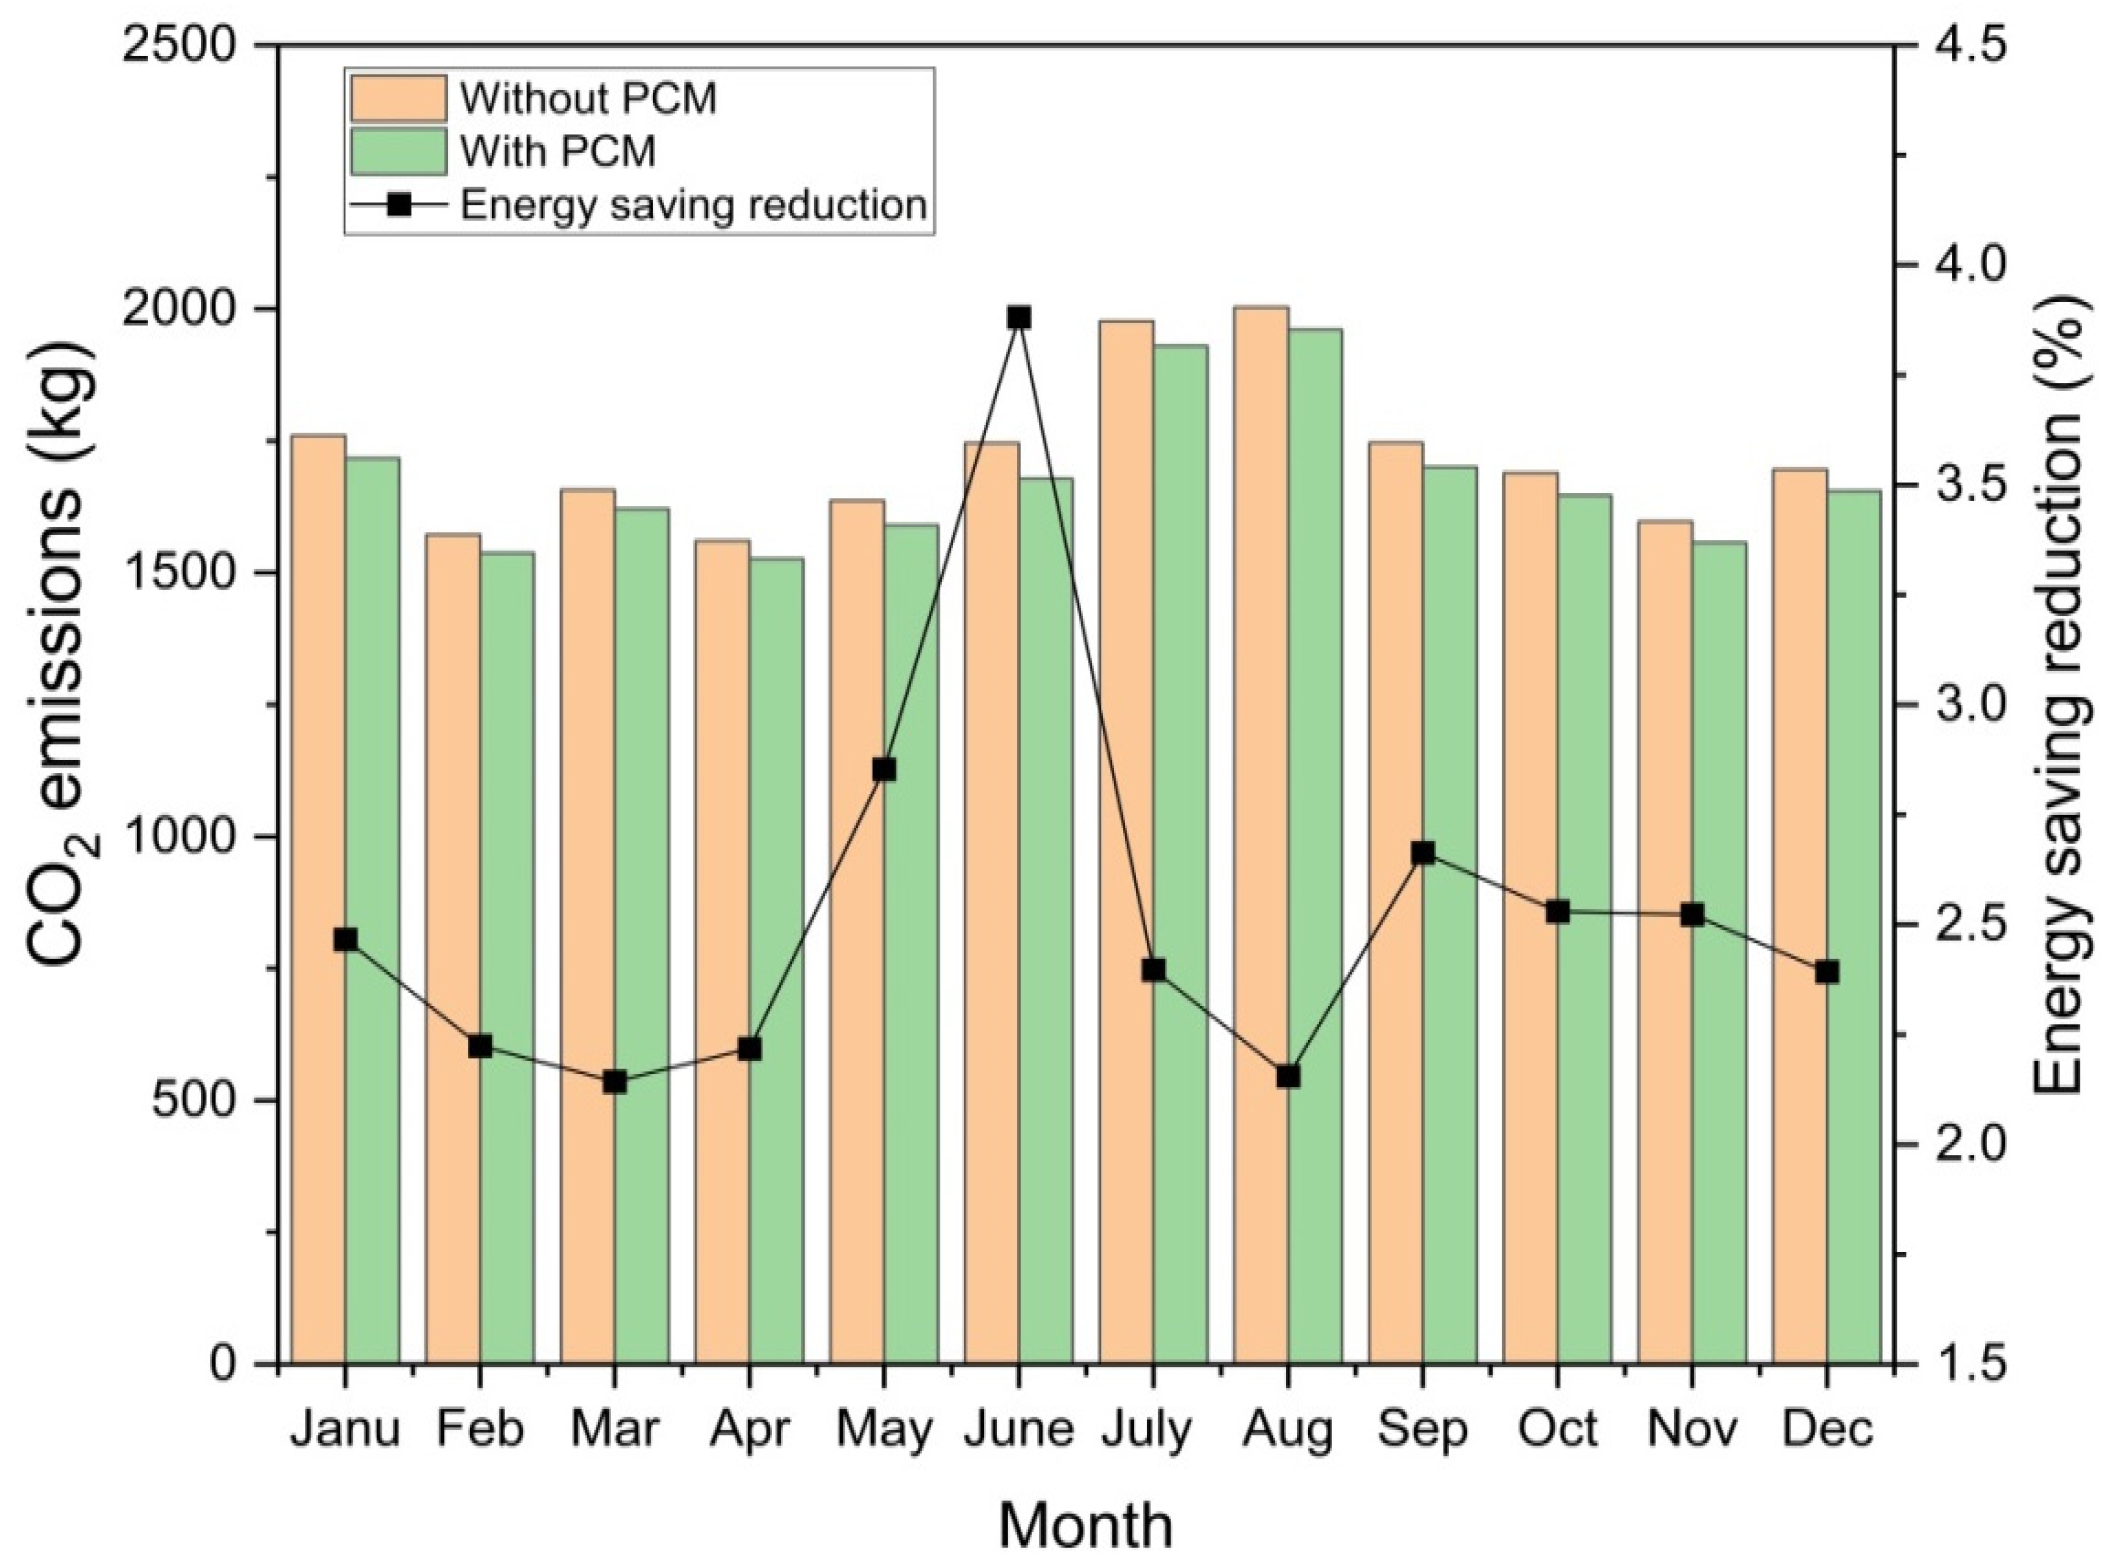
Figure 24 demonstrates the monthly CO2 emissions for both the reference building (without PCM23) and the building with PCM23 throughout the year. As a result of the reduced energy requirements for heating and cooling, significant CO2 emission reductions were achieved, amounting to 4%. The most substantial reductions occurred during the peak heating and cooling periods, particularly in the winter and summer months. By effectively storing and releasing thermal energy, the PCM23 significantly reduced the building’s reliance on energy-intensive heating and cooling systems, leading to a considerable decrease in CO2 emissions. During the peak winter months (December and January), the building with PCM23 experienced a reduction of approximately 55 kg of CO2 emissions compared to the reference building. Similarly, during the peak summer months (July and August), the building with PCM23 emitted around 48 kg less CO2. These reductions highlight the significant environmental benefits of incorporating PCM23 into building design.

3.4. Economic Analysis

In the study, to compare the cost implications of PCM integration, the annual energy expenses per unit area were determined by considering the yearly energy usage for heating and cooling in the model, both without and with PCMs (brick wall integrated with 50 mm thick PCM23).
Table 4 presents the annual energy consumption and equivalent energy costs for both reference and improved cases. The case involving PCM23 demonstrates a significant reduction in both cooling (QC) and heating (Qh) energy demands. The annual cooling load decreased by 22.6 MJ/m2, while the annual heating load decreased by 22.2 MJ/m2. This translated to a total annual energy reduction of 44.8 MJ/m2.
An NLCS assessment was performed to evaluate the economic viability of integrating PCM23. The results indicated a positive NLCS of 15.9 TD/m2, signifying a profitable investment. Furthermore, the calculated payback period of 4.8 years suggested a relatively short time frame for recovering the initial investment. Therefore, it is important to note that the economic viability of PCM23 integration is influenced by various factors, including the specific PCM23 material, its placement within the building envelope, and regional climatic conditions. Additionally, fluctuations in energy prices and material costs can impact the overall cost-effectiveness of PCM23 implementation.
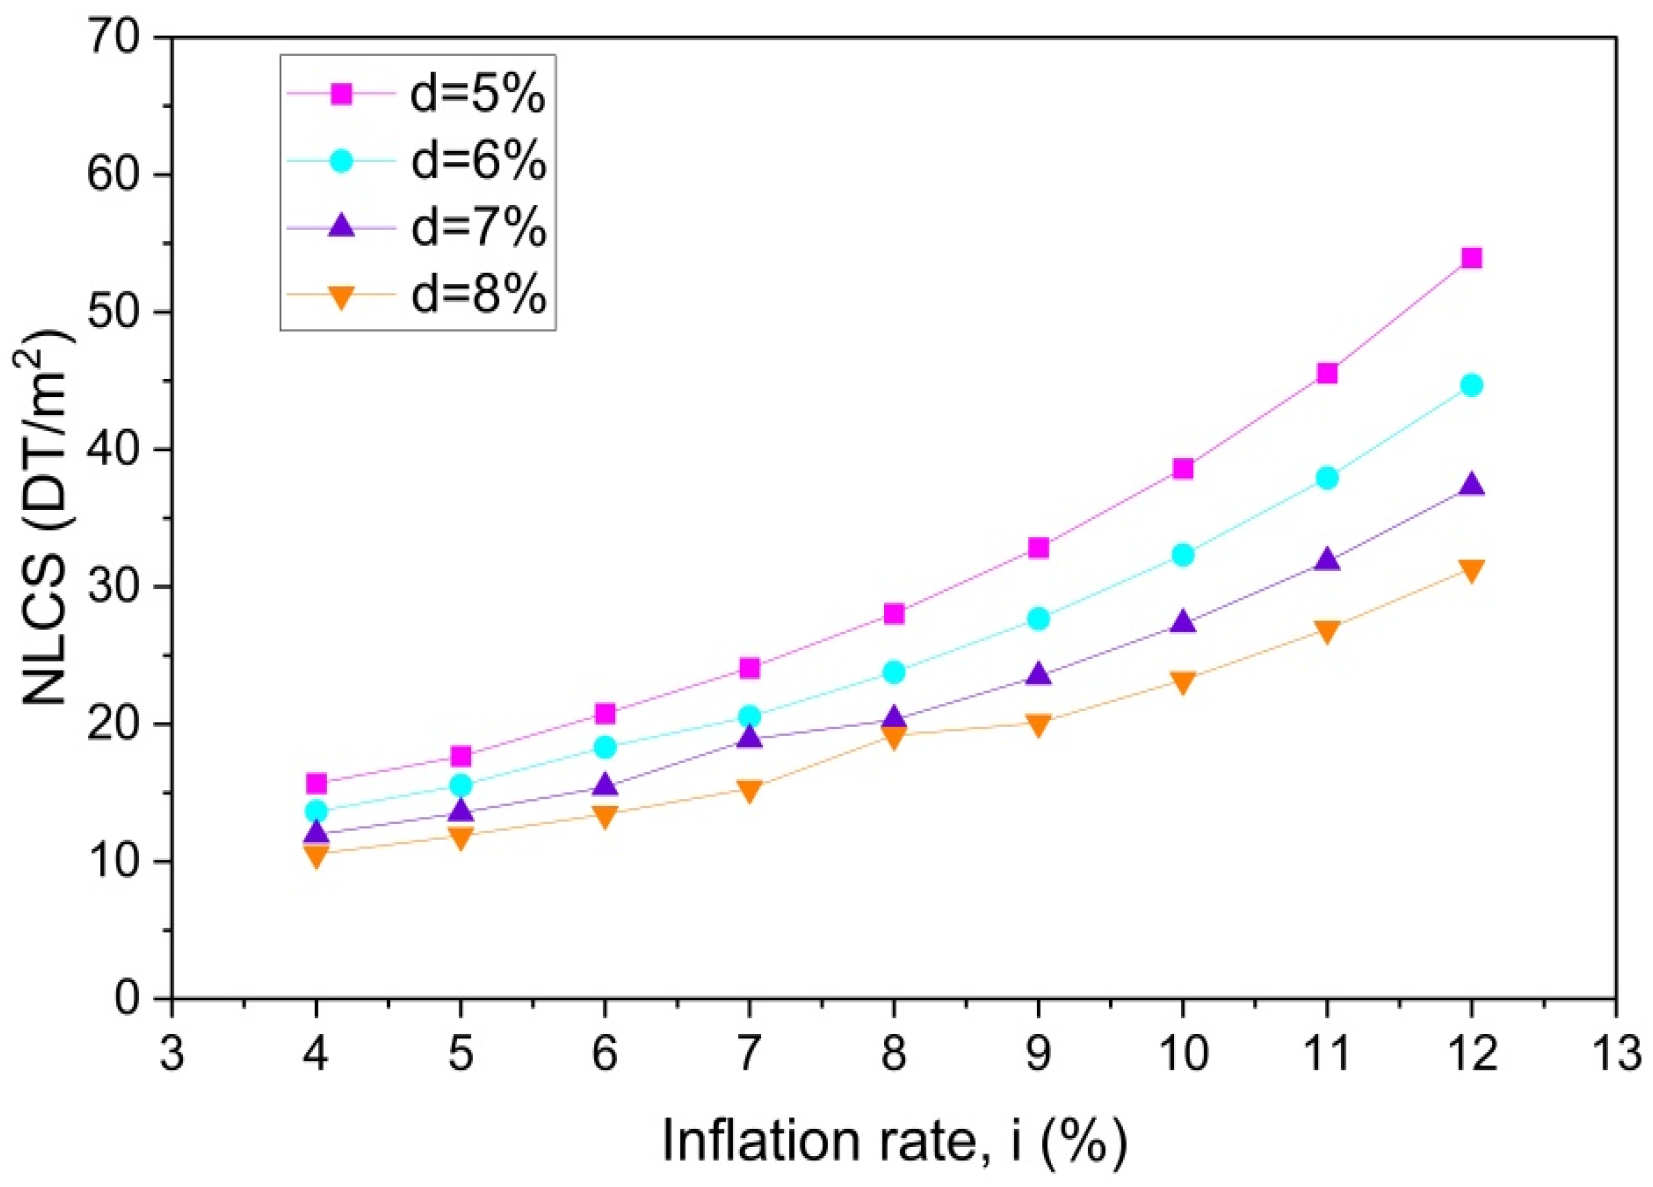
Figure 25 depicts the variation in NLCS with respect to inflation (i) and discount rates (d). As expected, an increase in the inflation rate corresponds to a higher NLCS, rendering PCM23 applications more economically attractive. Conversely, a higher discount rate diminishes the future value of savings, thereby reducing the profitability of PCM23. These findings underscore the dependence of PCM23’s economic viability on economic factors, especially inflation and discount rates. Regions with stable economies and predictable inflation rates are more likely to find PCM23 applications economically feasible. Government policies promoting energy efficiency and incentivizing sustainable building practices can enhance the economic attractiveness of PCM23. Furthermore, a thorough assessment of economic risks, such as fluctuations in energy prices and interest rates, is crucial for informed decision-making regarding PCM23 investments.
The performance of the proposed integrated system is contextualized against key findings from the literature in Table 5. Our finding of a 28.6% annual energy saving is significant and aligns well with the range of outcomes reported for similar Mediterranean and hot climates, such as those by Sarri et al. [26] (up to 33.83%) and Salihi et al. [27] (22–26%). The table highlights that the magnitude of energy savings is highly dependent on the specific synergy of strategies employed, with combinations like PCMs with natural ventilation showing very high performance in specific load conditions.

4. Conclusions

This study demonstrates that integrating PCMs with passive architectural strategies is a highly effective method for enhancing the performance of residential buildings in Tunisia. The optimal configuration identified was the use of PCM23, which was most effective during the heating season and achieved a total annual energy saving of 29% when applied to both the roof and brick walls.
The integration of PCMs yielded significant improvements in building physics and occupant comfort. Thermally, it reduced the decrement factor by 16% and increased the time lag by 7 h, leading to a more stable indoor environment. This translated directly to a 14% improvement in occupant comfort as measured by the Predicted Mean Vote (PMV) index, supported by a 2.1 °C temperature increase in winter and a 1.6 °C decrease in summer.
Beyond performance, the economic and environmental benefits are substantial. The optimized design resulted in an annual energy cost reduction of 16.2 TD/m2 (23.62%) with a short payback period, alongside a 4% decrease in operational CO2 emissions. While passive designs like gable roofs already offer significant energy savings (20%) over flat roofs, the addition of PCM technology presents a powerful, multi-faceted solution for creating energy-efficient, comfortable, and sustainable housing.
These findings suggest that PCM integration can substantially improve both the energy efficiency and thermal comfort of residential buildings in Tunisia, making it a promising approach for lowering energy use and improving indoor environmental quality.
The conclusion of this work should be considered within the context of two primary limitations. The study’s findings are geographically specific to the Mediterranean climate, and the reported performance metrics may not be directly applicable to other regions. Furthermore, the research is limited to a passive PCM system in a residential context, without investigating its scalability for larger buildings, and it does not account for the potential long-term thermal degradation of the PCM after thousands of phase change cycles.
To build upon this work, future investigations should focus on:
  • Conducting long-term studies on the durability and economic feasibility of PCMs under various climatic conditions.
  • Developing advanced control strategies to dynamically manage PCM behavior and assessing the scalability of these solutions for large-scale buildings.

Author Contributions

M.H.H.: conceptualization, methodology, software, investigation, writing—original draft, visualization, S.D.: methodology, software, formal analysis, investigation, writing—original draft, visualization, A.Y.: formal analysis, writing—original draft, M.A.: conceptualization, writing—review and editing, supervision, J.S.: formal analysis, writing—review and editing. All authors have read and agreed to the published version of the manuscript.

Funding

This research received no external funding.

Data Availability Statement

The datasets presented in this article are not readily available because of ongoing research. Requests to access the datasets should be directed to the corresponding author.

Conflicts of Interest

The authors declare no conflicts of interest.

Abbreviations

The following abbreviations are used in this manuscript:
ASEnergy cost saved (TD/m2)MMetabolic rate (W/m2)
BioPCM M27Bio-based PCM with a melting point of 27 °C NLCSNet life cycle savings (TD/m2)
CenPresent value of energy cost (TD/m2)pPeriod
CenrEnergy cost (TD/m2)PCMPhase change material
CFDComputational fluid dynamicsPeHeat loss via evaporation (W/m2)
ChConvective heat loss (W/m2)PMVPredicted mean vote
CO2Carbon dioxidePPDPredicted percentage of dissatisfied (%)
CondFDMConduction, finite difference methodPrHeat loss via respiration (W/m2)
CpSpecific heat (kJ/kg·K)PsHeat loss via sweating (W/m2)
CTFConduction transfer functionPWFPresent worth factor
EEnergy consumption (kWh)RRadiative heat loss (W/m2)
FoFourier numberTTemperature (°C)
hEnthalpy (kJ/kg)TmMelting temperature (°C)
HgHeating value of natural gas (MJ/m3)tTime (s)
iInflation rate (%)TDTunisian dinar
ISolar radiation (W/m2)WWork (W/m2)
Infinite RPCMA specific type of rigid PCMαThermal diffusivity (m2/s)
kThermal conductivity (W/m·K)ρDensity (kg/m3)
lThickness (m)fDecrement factor (%)
LCCALife-cycle cost analysisηEfficiency (%)
LrLatent heat loss via respiration (W/m2) φ Time lag (h)
QcEnergy consumption for cooling (MJ/m2)
QhEnergy consumption for heating (MJ/m2)

References

  1. Ürge-Vorsatz, D.; Cabeza, L.F.; Serrano, S.; Barreneche, C.; Petrichenko, K. Heating and cooling energy trends and drivers in buildings. Renew. Sustain. Energy Rev. 2015, 41, 85–98. [Google Scholar] [CrossRef]
  2. National Energy Balance. 2023. Available online: https://www.energiemines.gov.tn/fileadmin/docs-u1/Bilan_National_de_l_Energie_2023.pdf/ (accessed on 7 September 2025).
  3. Fragkos, P.; Zisarou, E. Energy System Transition in the Context of NDC and Mitigation Strategies in Tunisia. Climate 2022, 10, 166. [Google Scholar] [CrossRef]
  4. Bohórquez-Órdenes, J.; Tapia-Calderón, A.; Vasco, D.A.; Estuardo-Flores, O.; Haddad, A.N. Methodology to reduce cooling energy consumption by incorporating PCM envelopes: A case study of a dwelling in Chile. Build. Environ. 2021, 206, 108373. [Google Scholar] [CrossRef]
  5. Singh Rathore, P.K.; Shukla, S.K.; Gupta, N.K. Potential of microencapsulated PCM for energy savings in buildings: A critical review. Sustain. Cities Soc. 2020, 53, 101884. [Google Scholar] [CrossRef]
  6. Lamrani, B.; Johannes, K.; Kuznik, F. Phase change materials integrated into building walls: An updated review. Renew. Sustain. Energy Rev. 2021, 140, 110751. [Google Scholar] [CrossRef]
  7. Wang, G.; Li, X.; Wang, T. Investigation energy-saved and sustainable potential based on multi-objective optimization of PCM envelopes under different climatic zones in China. J. Energy Storage 2024, 97, 112902. [Google Scholar] [CrossRef]
  8. Dardouri, S.; Mankai, S.; Almoneef, M.M.; Mbarek, M.; Sghaier, J. Energy performance based optimization of building envelope containing PCM combined with insulation considering various configurations. Energy Rep. 2023, 10, 895–909. [Google Scholar] [CrossRef]
  9. Arıcı, M.; Bilgin, F.; Nižetić, S.; Karabay, H. PCM integrated to external building walls: An optimization study on maximum activation of latent heat. Appl. Therm. Eng. 2020, 165, 114560. [Google Scholar] [CrossRef]
  10. Kumar, D.; Alam, M.; Sanjayan, J.G. Retrofitting building envelope using phase change materials and aerogel render for adaptation to extreme heatwave: A multi-objective analysis considering heat stress, energy, environment, and cost. Sustainability 2021, 13, 10716. [Google Scholar] [CrossRef]
  11. Bimaganbetova, M.; Memon, S.A.; Sheriyev, A. Performance evaluation of phase change materials suitable for cities representing the whole tropical savanna climate region. Renew. Energy 2020, 148, 402–416. [Google Scholar] [CrossRef]
  12. Jia, J.; Liu, B.; Ma, L.; Wang, H.; Li, D.; Wang, Y. Energy saving performance optimization and regional adaptability of prefabricated buildings with PCM in different climates. Case Stud. Therm. Eng. 2021, 26, 101164. [Google Scholar] [CrossRef]
  13. Köse, E.; Manioglu, G. Evaluation of the Performance of a Building Envelope Constructed with Phase-Change Materials in Relation to Orientation in Different Climatic Regions. E3S Web Conf. 2019, 111, 04003. [Google Scholar] [CrossRef]
  14. Dardouri, S.; Tunçbilek, E.; Khaldi, O.; Arıcı, M.; Sghaier, J. Optimizing PCM Integrated Wall and Roof for Energy Saving in Building under Various Climatic Conditions of Mediterranean Region. Buildings 2023, 13, 806. [Google Scholar] [CrossRef]
  15. Shbailat, S.J.; Nima, M.A. Possible energy saving of evaporative passive cooling using a solar chimney of metal foam porous absorber. Energy Convers. Manag. X 2021, 12, 100118. [Google Scholar] [CrossRef]
  16. Soto, A.; Martínez, P.; Soto, V.M.; Martínez, P.J. Analysis of the Performance of a Passive Downdraught Evaporative Cooling System Driven by Solar Chimneys in a Residential Building by Using an Experimentally Validated TRNSYS Model. Energies 2021, 14, 3486. [Google Scholar] [CrossRef]
  17. Saifi, N.; Baadi, A.; Ghedamsi, R.; Guerrout, A.; Settou, N. An experimental study and numerical simulation of natural ventilation in a semi-arid climate building using a wind catcher with evaporative cooling system and solar chimney. J. Build. Eng. 2024, 85, 108475. [Google Scholar] [CrossRef]
  18. Mohammed, A.; Tariq, M.A.U.R.; Ng, A.W.M.; Zaheer, Z.; Sadeq, S.; Mohammed, M.; Mehdizadeh-Rad, H. Reducing the Cooling Loads of Buildings Using Shading Devices: A Case Study in Darwin. Sustainability 2022, 14, 3775. [Google Scholar] [CrossRef]
  19. Evangelisti, L.; Guattari, C.; Asdrubali, F.; de Lieto Vollaro, R. An experimental investigation of the thermal performance of a building solar shading device. J. Build. Eng. 2020, 28, 101089. [Google Scholar] [CrossRef]
  20. Chiesa, G.; Di Vita, D.; Ghadirzadeh, A.; Muñoz Herrera, A.H.; Leon Rodriguez, J.C. A fuzzy-logic IoT lighting and shading control system for smart buildings. Autom Constr. 2020, 120, 103397. [Google Scholar] [CrossRef]
  21. Wang, P.; Liu, Z.; Zhang, L.; Zhao, C.; Jiang, X.; Li, B. Adaptive building envelope combining variable transparency shape-stabilized PCM and reflective film: Parameter and energy performance optimization in different climate conditions. Energy Convers. Manag. 2024, 299, 117907. [Google Scholar] [CrossRef]
  22. Hadjadj, M.; Nehari, T.; Zehouani, Z.A.; Allam, B. Innovative passive techniques and PCM integration in building envelopes for enhanced energy efficiency in desert regions. J. Energy Storage 2024, 103, 114322. [Google Scholar] [CrossRef]
  23. Zhou, S.; Song, M.; Shan, K.; Ghani Razaqpur, A.; Huang, J.J.; Zhu, X.; Yu, S. Passive application of phase change materials (PCMs) for the Trombe wall: A review. Energy Storage Sav. 2025, 4, 195–227. [Google Scholar] [CrossRef]
  24. Piselli, C.; Prabhakar, M.; de Gracia, A.; Saffari, M.; Pisello, A.L.; Cabeza, L.F. Optimal control of natural ventilation as passive cooling strategy for improving the energy performance of building envelope with PCM integration. Renew. Energy 2020, 162, 171–181. [Google Scholar] [CrossRef]
  25. Nematchoua, M.K.; Noelson, J.C.V.; Saadi, I.; Kenfack, H.; Andrianaharinjaka, A.Z.F.R.; Ngoumdoum, D.F.; Sela, J.B.; Reiter, S. Application of phase change materials, thermal insulation, and external shading for thermal comfort improvement and cooling energy demand reduction in an office building under different coastal tropical climates. Sol. Energy 2020, 207, 458–470. [Google Scholar] [CrossRef]
  26. Sarri, A.; Bechki, D.; Bouguettaia, H.; Al-Saadi, S.N.; Boughali, S.; Farid, M.M. Effect of using PCMs and shading devices on the thermal performance of buildings in different Algerian climates. A simulation-based optimization. Sol. Energy 2021, 217, 375–389. [Google Scholar] [CrossRef]
  27. Salihi, M.; Chhiti, Y.; El Fiti, M.; Harmen, Y.; Chebak, A.; Jama, C. Enhancement of buildings energy efficiency using passive PCM coupled with natural ventilation in the Moroccan climate zones. Energy Build. 2024, 315, 114322. [Google Scholar] [CrossRef]
  28. Dhahri, M.; Yüksel, A.; Aouinet, H.; Wang, D.; Arıcı, M.; Sammouda, H. Efficiency Assessment on Roof Geometry and Trombe Wall Shape for Improving Buildings’ Heating Performance. Buildings 2024, 14, 1297. [Google Scholar] [CrossRef]
  29. Xu, K.; Xu, X.; Yan, T. Performance evaluation of a pipe-embedded phase change material (PE-PCM) roof integrated with solar collector. J. Build. Eng. 2023, 71, 106582. [Google Scholar] [CrossRef]
  30. Jaffar Abass, P.; Muthulingam, S. Comprehensive assessment of PCM integrated roof for passive building design: A study in energo-economics. Energy Build. 2024, 317, 114387. [Google Scholar] [CrossRef]
  31. Arumugam, C.; Shaik, S. Air-conditioning cost saving and CO2 emission reduction prospective of buildings designed with PCM integrated blocks and roofs. Sustain. Energy Technol. Assess. 2021, 48, 101657. [Google Scholar] [CrossRef]
  32. Nguyen, L.M.Q.; Alshuraiaan, B.; Hajjar, A.; Izadi, M.; El Idi, M.M. Controlling energy loss from roof structures equipped by round-corner double semi-hexagonal ferro- phase change material layer using magnetic field. J. Clean. Prod. 2023, 428, 139335. [Google Scholar] [CrossRef]
  33. Zhang, S.; Ma, Y.; Li, D.; Liu, C.; Yang, R. Thermal performance of a reversible multiple-glazing roof filled with two PCM. Renew. Energy 2022, 182, 1080–1093. [Google Scholar] [CrossRef]
  34. Sun, Y.; Zhang, C.; Zhao, Y.; Li, J.; Ma, Y.; Zhu, C. A systematic review on thermal environment and thermal comfort studies in Chinese residential buildings. Energy Build. 2023, 291, 113134. [Google Scholar] [CrossRef]
  35. Behzadi Hamooleh, M.; Torabi, A.; Baghoolizadeh, M. Multi-objective optimization of energy and thermal comfort using insulation and phase change materials in residential buildings. Build. Environ. 2024, 262, 111774. [Google Scholar] [CrossRef]
  36. Kumar, D.; Alam, M.; Doshi, A.J. Investigating the Influence of Thermal Conductivity and Thermal Storage of Lightweight Concrete Panels on the Energy and Thermal Comfort in Residential Buildings. Buildings 2023, 13, 720. [Google Scholar] [CrossRef]
  37. Alizadeh, M.; Sadrameli, S.M. Indoor thermal comfort assessment using PCM based storage system integrated with ceiling fan ventilation: Experimental design and response surface approach. Energy Build. 2019, 188–189, 297–313. [Google Scholar] [CrossRef]
  38. Sun, W.; Zhang, Z.; Wu, Z.; Xu, Y. Numerical modeling and optimization of annual thermal characteristics of an office room with PCM active–passive coupling system. Energy Build. 2022, 254, 111629. [Google Scholar] [CrossRef]
  39. Guichard, S.; Miranville, F.; Bigot, D.; Malet-Damour, B.; Beddiar, K.; Boyer, H. A complex roof incorporating phase change material for improving thermal comfort in a dedicated test cell. Renew. Energy 2017, 101, 450–461. [Google Scholar] [CrossRef]
  40. Hagenau, M.; Jradi, M. PCM-enhanced building envelope for improved thermal comfort and energy efficiency in danish buildings. In Proceedings of the Building Simulation 2021: 17th Conference of IBPSA, Bruges, Belgium, 1–3 September 2021. [Google Scholar] [CrossRef]
  41. Rangel, C.G.; Rivera-Solorio, C.I.; Gijón-Rivera, M.; Mousavi, S. The effect on thermal comfort and heat transfer in naturally ventilated roofs with PCM in a semi-arid climate: An experimental research. Energy Build. 2022, 274, 112453. [Google Scholar] [CrossRef]
  42. Kulumkanov, N.; Memon, S.A.; Khawaja, S.A. Evaluating future building energy efficiency and environmental sustainability with PCM integration in building envelope. J. Build. Eng. 2024, 93, 109413. [Google Scholar] [CrossRef]
  43. Climate Data. 2024. Available online: https://en.climate-data.org/africa/tunisia/jendouba/tabarka-768267/ (accessed on 7 September 2025).
  44. Garg, V.; Mathur, J.; Bhatia, A. Building Energy Simulation: A Workbook Using DesignBuilderTM, 2nd ed.; CRC Press: Boca Raton, FL, USA, 2020. [Google Scholar] [CrossRef]
  45. Pedersen, C.O. Advanced zone simulation in energyplus: Incorporation of variable properties and phase change material (PCM) Capability. In Proceedings of the 10th Conference of IBPSA, BS 2007, Beijing, China, 3–6 September 2007. [Google Scholar]
  46. Lee, K.O.; Medina, M.A.; Sun, X. Development and verification of an EnergyPlus-based algorithm to predict heat transfer through building walls integrated with phase change materials. J. Build. Phys. 2015, 40, 77–95. [Google Scholar] [CrossRef]
  47. Tabares-Velasco, P.C.; Christensen, C.; Bianchi, M. Verification and validation of EnergyPlus phase change material model for opaque wall assemblies. Build. Environ. 2012, 54, 186–196. [Google Scholar] [CrossRef]
  48. Kuznik, F.; Virgone, J. Experimental assessment of a phase change material for wall building use. Appl. Energy 2009, 86, 2038–2046. [Google Scholar] [CrossRef]
  49. Building Technologies Office (BTO), U.S. Department of Energy (DOE); National Renewable Energy Laboratory (NREL). EnergyPlusTM Version 22.1.0 Documentation Engineering Reference; Building Technologies Office (BTO), U.S. Department of Energy (DOE): Washington, DC, USA; National Renewable Energy Laboratory (NREL): Golden, CO, USA, 2022.
  50. Kratou, L. Le Rôle de la Coopération Internationale Publique dans la Protection de L’environnement en Tunisie: Efficacité et Limites. Ph.D. Thesis, University of Lorraine, Nancy, France, Université Tunis El Manar, Tunis, Tunisia, 2021; 467p. [Google Scholar]
  51. Pacheco, R.; Ordóñez, J.; Martínez, G. Energy efficient design of building: A review. Renew. Sustain. Energy Rev. 2012, 16, 3559–3573. [Google Scholar] [CrossRef]
  52. Nahar, N.M.; Sharma, P.; Purohit, M.M. Studies on solar passive cooling techniques for arid areas. Energy Convers. Manag. 1999, 40, 89–95. [Google Scholar] [CrossRef]
  53. Belhadj, B.; Bederina, M.; Makhloufi, Z.; Goullieux, A.; Quéneudec, M. Study of the thermal performances of an exterior wall of barley straw sand concrete in an arid environment. Energy Build. 2015, 87, 166–175. [Google Scholar] [CrossRef]
  54. ISO 7730:2025; Ergonomics of the Thermal Environment—Analytical Determination and Interpretation of Thermal Comfort Using Calculation of the PMV and PPD Indices and Local Thermal Comfort Criteria [4th Edition]. International Standardization Organization (ISO): Geneva, Switzerland, 2025.
  55. Jahangir, M.H.; Ziyaei, M.; Kargarzadeh, A. Evaluation of thermal behavior and life cycle cost analysis of greenhouses with bio-phase change materials in multiple locations. J. Energy Storage 2022, 54, 105176. [Google Scholar] [CrossRef]
  56. Struhala, K.; Ostrý, M. Life-Cycle Assessment of phase-change materials in buildings: A review. J. Clean. Prod. 2022, 336, 130359. [Google Scholar] [CrossRef]
  57. Di Bari, R.; Horn, R.; Nienborg, B.; Klinker, F.; Kieseritzky, E.; Pawelz, F. The Environmental Potential of Phase Change Materials in Building Applications. A Multiple Case Investigation Based on Life Cycle Assessment and Building Simulation. Energies 2020, 13, 3045. [Google Scholar] [CrossRef]
  58. Hayatina, I.; Auckaili, A.; Farid, M. Review on the Life Cycle Assessment of Thermal Energy Storage Used in Building Applications. Energies 2023, 16, 1170. [Google Scholar] [CrossRef]
  59. Panayiotou, G.P.; Kalogirou, S.A.; Tassou, S.A. Evaluation of the application of Phase Change Materials (PCM) on the envelope of a typical dwelling in the Mediterranean region. Renew. Energy 2016, 97, 24–32. [Google Scholar] [CrossRef]
  60. Marin, P.; Saffari, M.; de Gracia, A.; Zhu, X.; Farid, M.M.; Cabeza, L.F.; Ushak, S. Energy savings due to the use of PCM for relocatable lightweight buildings passive heating and cooling in different weather conditions. Energy Build. 2016, 129, 274–283. [Google Scholar] [CrossRef]
  61. Runsheng, T.; Meir, I.A.; Etzion, Y. An analysis of absorbed radiation by domed and vaulted roofs as compared with flat roofs. Energy Build. 2003, 35, 539–548. [Google Scholar] [CrossRef]
  62. Olgyay, V. Design with Climate, 2nd ed.; Princeton University Press: Princeton, NJ, USA, 1973. [Google Scholar]
  63. Morsali, S.; Akbarian, S.; Gari, Z. Simulation of the Roof Shapes and Building Orientation on the Energy Performance of the Buildings. J. Build. Pathol. Rehabil. 2021, 6, 36. [Google Scholar] [CrossRef]
  64. Souayfane, F.; Fardoun, F.; Biwole, P.H. Phase change materials (PCM) for cooling applications in buildings: A review. Energy Build. 2016, 129, 396–431. [Google Scholar] [CrossRef]
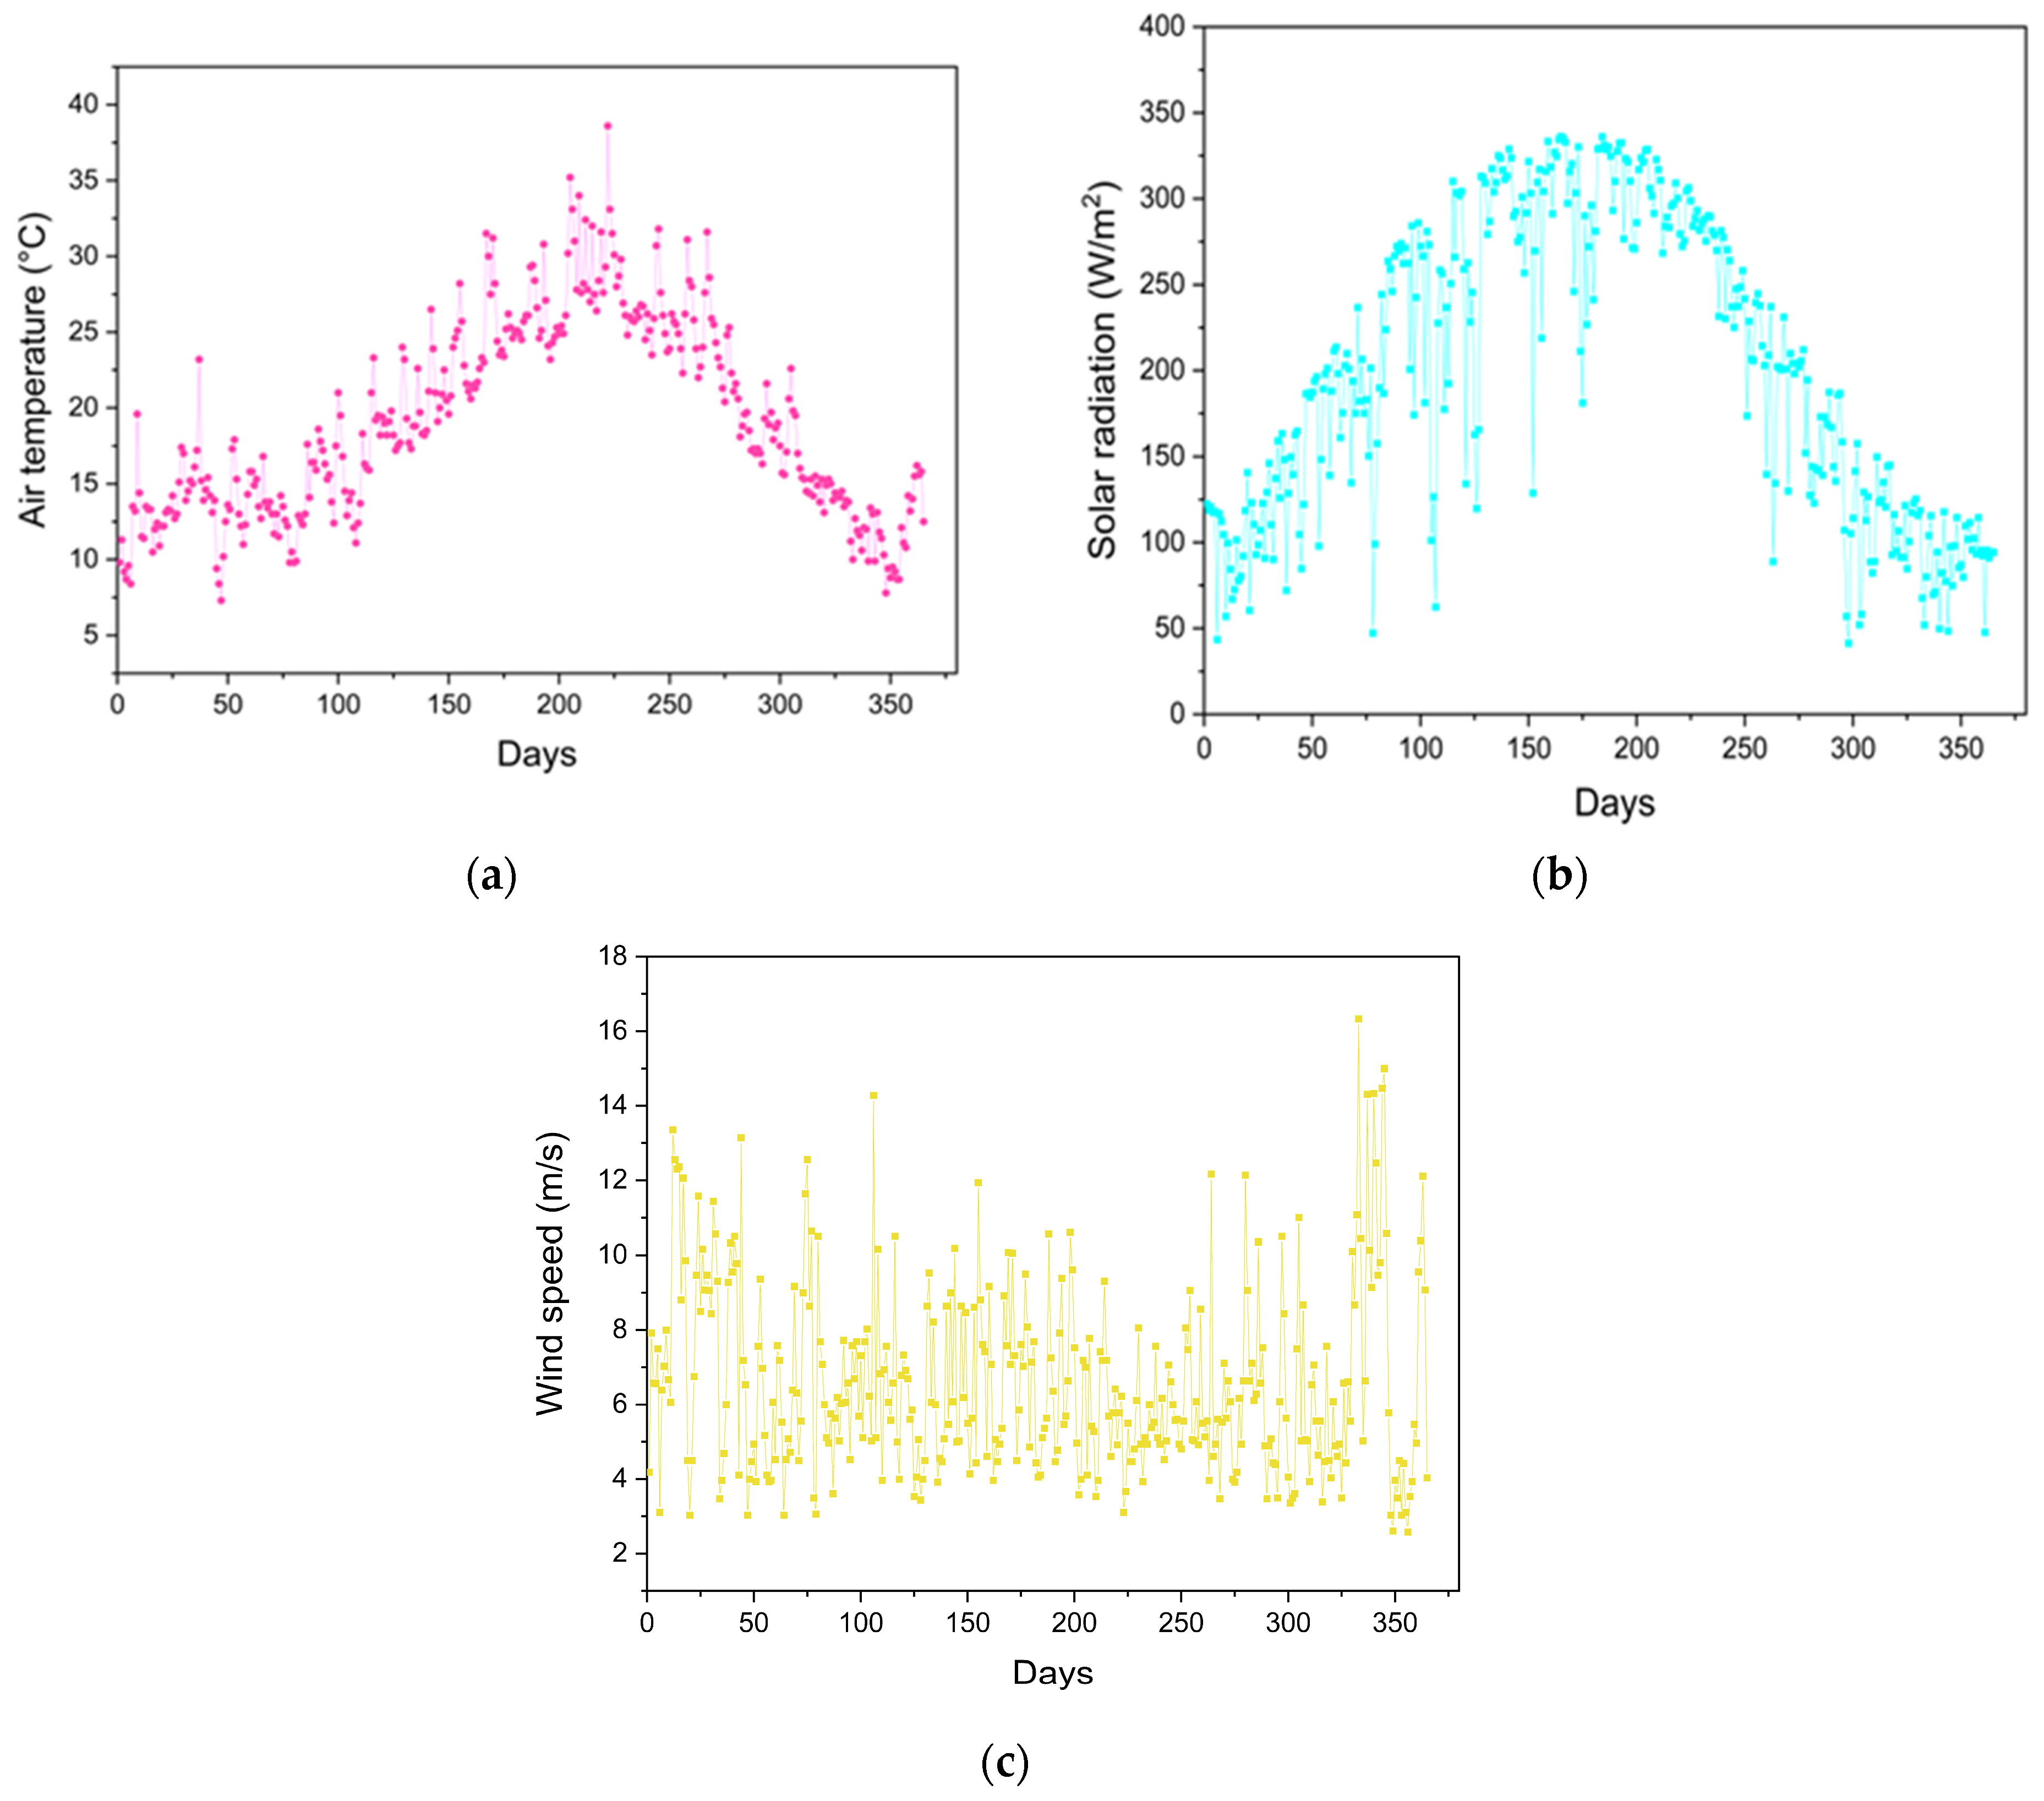
Figure 1. (a) Outdoor temperature, (b) solar radiation, and (c) wind speed of Tabarka, Tunisia.
Buildings 15 03319 g001
Figure 2. Monthly (January and July) and daily (21 January and 21 July) variations in Tabarka: (a) outdoor air temperature and (b) solar radiation.
Buildings 15 03319 g002
Figure 3. Methodological workflow diagram of this study.
Buildings 15 03319 g003
Figure 4. Building model: (a) ground and (b) first floor layout.
Buildings 15 03319 g004
Figure 5. Structure types: (a) brick wall, (b) stone wall, (c) concrete wall, (d) roof, and (e) brick wall with PCMs.
Buildings 15 03319 g005
Figure 6. Various roof configurations: (a) flat, (b) gable, and (c) domed.
Buildings 15 03319 g006
Figure 7. Residential building with a shading block on the south facade.
Buildings 15 03319 g007
Figure 8. View of openings in the gable roof.
Buildings 15 03319 g008
Figure 9. Geometric model of the building used as the basis for CFD mesh generation.
Buildings 15 03319 g009
Figure 10. Occupancy duration in the building.
Buildings 15 03319 g010
Figure 11. Annual energy consumption and savings for various scenarios: (a) integration of different PCMs, (b) PCM melting temperatures, (c) PCM thicknesses, and (d) PCM placements within the building envelope.
Buildings 15 03319 g011
Figure 12. Energy consumption and saving for building materials combined with PCMs.
Buildings 15 03319 g012
Figure 13. Influence of PCMs on decrement factor and time lag.
Buildings 15 03319 g013
Figure 14. Annual total energy consumption for three roof shapes: (a) PCM23 integration and (b) different PCM melting temperatures.
Buildings 15 03319 g014
Figure 15. Effect of shading and PCM23 integration on annual energy consumption and saving.
Buildings 15 03319 g015
Figure 16. Interior wall surface temperatures for 21 January and 21 July.
Buildings 15 03319 g016
Figure 17. Monthly PMV and PPD values for January and July.
Buildings 15 03319 g017
Figure 18. (a) Indoor air temperature, (b) PMV, and (c) PPD parameters for three roof configurations of the building with and without PCM23 on 21 January.
Buildings 15 03319 g018
Figure 19. (a) Indoor air temperature, (b) PMV, and (c) PPD parameters for three roof configurations of the building with and without PCM23 on 21 July.
Buildings 15 03319 g019
Figure 20. Outdoor and indoor temperatures and relative humidity on 21 January (a) without and (b) with PCM23.
Buildings 15 03319 g020
Figure 21. (a) Indoor air temperature and (b) radiant air temperature contours on 21 January for the buildings without and with PCM23.
Buildings 15 03319 g021
Figure 22. Air velocity vectors and PPD contours on 21 January for the buildings without and with PCM23.
Buildings 15 03319 g022
Figure 23. PMV contours on 21 January for the buildings without and with PCM23.
Buildings 15 03319 g023
Figure 24. CO2 emissions.
Buildings 15 03319 g024
Figure 25. Sensitivity to the economic parameter of NLCS.
Buildings 15 03319 g025
Table 1. Thermophysical properties of the construction materials used.
Material TypeMaterial Thickness
l (cm)
Thermal Conductivity
k (W/m·K)
Density
ρ (kg/m3)
Thermal Diffusivity
α × 107 (m2/s)
Brick200.7219204.46
Stone401.725006.8
Concrete202.5240010.41
Mortar cement2.51.422006.36
Plaster1.51.218007.93
Reinforced concrete152.3230010
Table 2. Thermophysical properties of used PCMs.
Infinite RPCMBioPCM M27
PCM18PCM21PCM23PCM25PCM29
Latent heat of fusion, kJ/kg200200200200200250
Peak melting temperature for freezing/melting curve, °C17/1920/2222/2424/2628/3020/23
Thermal conductivity, solid/liquid, W/(m·K)1.09/0.541.09/0.541.09/0.541.09/0.541.09/0.541.8/1.5
Density, solid/liquid, kg/m31540/9291540/9291540/9291540/9291540/9291400/850
Specific heat, J/(kg·K)314031403140314031401970
Table 3. Parameters used in economic calculations.
Parameters Values
Infinite RPCM cost ,   C P C M 5.64   TD / m 2
Electricity (cooling) cost ,   C e l 0.21 TD/kWh
Coefficient of performance (COP)3
Natural gas (heating) cost ,   C g 0.251 TD/m3
Hg34.526 × 106 J/m3
Efficiency η g 0.8
Inflation ratei7.3%
Market discount rated8%
Lifespan n30 years
Table 4. Annual energy consumption and equivalent energy costs.
Qc (MJ/m2)Qf (MJ/m2)Cenr (TD/m2)PWFCen (TD/m2)
Reference case without PCM57.1112.82.725.368.6
Optimum case with PCM2334.590.52.125.352.4
ΔQc (MJ/m2)ΔQf (MJ/m2)As (TD/m2)NLCS (TD/m2)Payback Period (Years)
22.622.20.615.94.8
Table 5. Comparative analysis of PCM performance with key findings from the literature.
StudyClimate ZonePCM/Passive Strategy InvestigatedKey Performance Metric (Energy/Thermal)Economic/Environmental Metric
Present StudyMediterranean (Tunisia)PCM23 in walls and gable roof29% annual energy saving; 14% thermal comfort improvement16.2 TD/m2 (23,62%) cost savings; 4% operational CO2 reduction
Dardouri et al. [14]Hot and Dry (Tunisia)Optimal PCM thickness (40 mm); dual-layer PCMUp to 42% annual energy savingsN/A
Sarri et al. [26]Hot Locations (Algeria)PCM + shading devicesUp to 33.83% energy savingsN/A
Salihi et al. [27]Warm/Temperate Mediterranean (Morocco)PCM + night ventilation22–26% PCM performance improvementN/A
Jia et al. [12]Various (Cold to Hot)Optimal PCM thickness (10–30 mm)Significant thermal performance improvementsN/A
Peerzada & Subramaniyan [30]SubtropicalMacro-encapsulated PCM in roof slab49.8% thermal load reduction; 4 °C indoor temp reduction5.7 year payback; 44.24% CO2 reduction
Arumugam & Shaik [31]N/APCM in hollow blocks and roofingGreatest reductions in A/C expensesMost favorable payback; lower CO2
Disclaimer/Publisher’s Note: The statements, opinions and data contained in all publications are solely those of the individual author(s) and contributor(s) and not of MDPI and/or the editor(s). MDPI and/or the editor(s) disclaim responsibility for any injury to people or property resulting from any ideas, methods, instructions or products referred to in the content.