Article

Selection of the Best 3D Printing High-Performance Mortars Using Multi-Criteria Analysis

by
Sara Alonso-Cañon
,
Elena Blanco-Fernandez
*,
Eva Cuesta-Astorga
,
Irune Indacoechea-Vega
and
Joaquin Salas-Alvarez
GITECO Research Group, Universidad de Cantabria, Av. de los Castros 44, 39005 Santander, Spain
*
Author to whom correspondence should be addressed.
Buildings 2025, 15(18), 3307; https://doi.org/10.3390/buildings15183307
Submission received: 29 July 2025 / Revised: 26 August 2025 / Accepted: 8 September 2025 / Published: 12 September 2025

Abstract

High-performance concrete for 3D printing has recently attracted significant attention due to its potential to create structural elements without the need for traditional reinforcement. While various formulations have been proposed by researchers, evaluations are often limited to mechanical performance and printability, while cost and environmental impact are generally overlooked. This study expands the analysis by also considering cost and environmental impact, aiming to identify the optimal mix using a multi-criteria decision-making analysis (MCDMA). In the first phase, several high-strength mortar formulations were developed and assessed based on mechanical strength, printability, environmental impact, and cost. In the second phase, the most promising mix from the initial evaluation was further modified by incorporating different types of fibers, including aramid, carbon, glass, cellulose, and polypropylene. Comprehensive testing—covering mechanical properties and printability—together with cost and a life cycle assessment were conducted to determine the most effective mortar formulations. One of the main findings is that adding 0.05% of 20 mm length cellulose fibers in weight to a mortar containing Cem I 42.5R can increase the compressive strength by more than 9% without affecting the cost or environmental impact, also allowing the obtainment of a mortar apt for 3D printing. This increase in the compression strength is presumably related to a lateral restriction in movements of the mortar, which makes it increase the maximal principal stresses, and thus, its strength.

1. Introduction

In recent years, concrete 3D printing (3DCP) has observed significant growth and development across various industries. This innovative approach to building offers several advantages over traditional construction methods, such as the ability to automate processes and produce complex, intricate designs. Its application has enabled the fabrication of prototypes of infrastructures such as bridges [1,2], housing units [3,4], and unique structural components, offering significant advantages over conventional methods, such as the ability to automate processes and produce complex, intricate designs [5].
Nevertheless, there are still some technological challenges, like reinforcing the 3DCP or the construction of beams and slabs. To solve the particular problem of reinforcing 3DCP, different strategies have been investigated. Some authors have tried to combine different robots to automate the process of 3D printing the concrete and placing the rebars [6]. Other researchers have focused on developing high-strength 3DPC by using large amounts of OPC, low w/c rations, and different admixtures [7]. Some other authors also decided to add fibers to 3DCP, either in standard strength [8] or in high-strength concretes [9]. Another interesting strategy is to combine, in the same beam, different layers of concrete with different characteristic strengths, leaving the weakest one in the neutral fiber position, and the strongest one in the tensile side [10].
As with the use of high-strength cement in traditional construction, the incorporation of fibers has been used extensively in traditional construction. This has also begun to be transferred to the field of 3D printing, incorporating different types of fibers such as steel [11,12], aramid [13], carbon [14,15], glass [16,17], polyvinyl alcohol [18,19], basalt [20], polypropylene [21], polyethylene [22], rock wool [23], cellulose [24], and cellulose microfibers [23,24], among others. The incorporation of these fibers is carried out with the main aim of improving the mechanical properties of the printed elements.
Nevertheless, in most of these studies, mechanical properties and/or rheological behavior are the main characteristics studied; however, the cost or environmental impact is, in most of the cases, overlooked.
Alonso-Cañon et al. [13] published a systematic comparison including printability, cost, mechanical performance, and life cycle assessment over standard 3D-printed mortars reinforced with fibers but not with high-strength mortars. Mohan et al. [25] performed a comparison of different 3DCP that incorporated CemI 52.5, considering some mechanical parameters, fresh state properties, cost, and environmental impact; however, mixtures did not include fibers of any kind. Yu et al. [26] undertook a comparison of different 3DCP that included steel slags, considering not only mechanical and rheological parameters but also cost and environmental impact, but fibers were not considered either. Rajendran et al. [27] conducted an interesting comparison of different 3DCP that incorporated cellulose nanocrystals, analyzing mechanical performance, cost, and environmental impact. They concluded that the cost was 423 USD/m3 and 1704.81 kg eq CO2/m3 for a mortar with an approximate compressive strength of 61 MPa and a flexural strength of 7.2 MPa, assuming they added 1% of cellulose nanocrystals (by volume of OPC). The values obtained here are neither economical nor environmentally friendly, and therefore, there is clear space for improvement.
Thus, from an engineering point of view, where not only mechanical performance or printability but also feasibility should be considered, analyzing at the same time mechanical performance, printability, cost, and environmental impact, there is a clear gap when comparing different potential solutions of high-strength mortars reinforced with fibers. Thus, the main aim of this paper is to present this comparison in order to allow engineers to select the best dosages when combining high-strength mortars with fibers. In addition, the materials used in this study can be found in the market, so it could be feasible for any company of 3DCP to use the dosages described here.
To do so, the research presented in this paper is divided into two phases. Firstly, the best high-performance cement dosages in 3D-printed mortars without using fibers were determined (Phase 1), and secondly, the optimum mortar was analyzed by incorporating different types of fibers (Phase 2) to the optimal dosage chosen in the previous phase.
In Phase 1, a printability analysis was carried out in the laboratory to obtain the optimal dosages of the mixtures. With these high-performance mortars, the workability of the mixtures is reduced, in some cases clogging the extrusion nozzle, making the printability difficult. Subsequently, both rheological and mechanical characteristics will be obtained for these optimum mixtures. Finally, a multi-criteria decision-making analysis will be carried out, for which five criteria were selected: printability, flexural strength, compressive strength, cost of material, and life cycle assessment (LCA). Equal weights were considered for all criteria. WASPAS and TOPSIS methods were used to evaluate the MCMD scores and, therefore, the rankings, which allowed us to obtain the best dosage, which was used for the second phase.
Phase 2 aims to analyze the contributions that will be achieved by incorporating different types of fibers, aramid, carbon, glass, cellulose, textile, and polypropylene, in the best mixture of Phase 1. For these mixtures, laboratory tests of flexural strength, compression, and rheology were also carried out, and finally, an MCDM analysis will be performed, in which the LCA and cost were also considered.

2. Materials and Methods

2.1. Materials and Dosage

2.1.1. Phase 1: Mortars Without Fibers

This phase aims to compare and obtain the best dosages for 3D printing with high-performance mortars. For this purpose, a total of 30 samples were prepared until the optimum dosages were obtained.
Two different types of high-performance cements were used, CEM I 42.5 R and CEM I 52.5 R. CEM I 42.5 R contained 95% clinker and 5% limestone, while CEM I 52.5 R contained 97% clinker and 3% gypsum. Limestone sand was used as fine aggregate. As a mineral admixture, fly ash was used, with a degree of crystallinity of 35% and a loss on ignition of 3.4%. Three types of admixtures were also used to improve the workability and strength of the mixes: a superplasticizer (Mastersure 950), a water reducer (MasterEase 5025), and microsilica (MasterRoc MS 610).
For the laboratory tests, different types and percentages of the materials were used in the dosages, resulting in 4 dosages with good printability. These dosages are shown in Table 1 and are proportions of the weight of the cement:
In all the mixes carried out, the manufacturer’s recommendations regarding plasticizers were maintained, keeping the values for MasterEase 5025 between 0.5 and 1.5% of cement and for Mastersure 950 between 0.7 and 2% of cement. In addition, it was also maintained that plasticizers could not represent more than 1.5% of the total materials in the mix, keeping all dosages below 0.5%.

2.1.2. Phase 2: Mortars with Fibers

Once the multi-criteria analysis of Phase one was carried out and the mix containing CEM I 42.5 R without fly ash was selected as the best performing mix in this second phase of tests, different types of fibers (Figure 1) were incorporated. The selected fibers were those that had obtained the best results in a previous laboratory test, carried out with Cement type III/B 32.5 N-SR [13]. These fibers have different lengths, between 6 and 25 mm, and are incorporated in different percentages between 0.05 and 0.1%, with 0.05% being the most commonly used. These fiber percentages should be kept to a maximum of 0.1%, since high fiber percentages reduce the workability of the mixes, an aspect that is especially important in this type of mix with HPC [28,29].
Five fibers were finally used: aramid, carbon, cellulose, polypropylene, and glass, and their properties are listed in Table 2 [13].
With the aforementioned fiber types, 8 alternatives were proposed for analysis, and in this second phase, a new multi-criteria analysis was carried out with these new blends. The fibers used in this study are shown in Figure 1. In addition, Table 3 shows the dosages of these mixtures. All dosages are ratios of the cement weight, except the fiber content, which is reported in a fraction of the mixture.

2.2. Mixing Process

To carry out the process of preparing the different mixtures, a 30 L capacity planetary mixer was used. It has three rotation speeds: 142 (slow), 234 (medium), and 429 rpm (fast), but in our production, we only use the first two. Table 4 shows the process of preparing the mixtures of Phase 1.
The preparation of the second phase mixtures was carried out in a similar way to that of the first phase, incorporating some modifications, as can be seen in Table 5 below.

2.3. Rheology

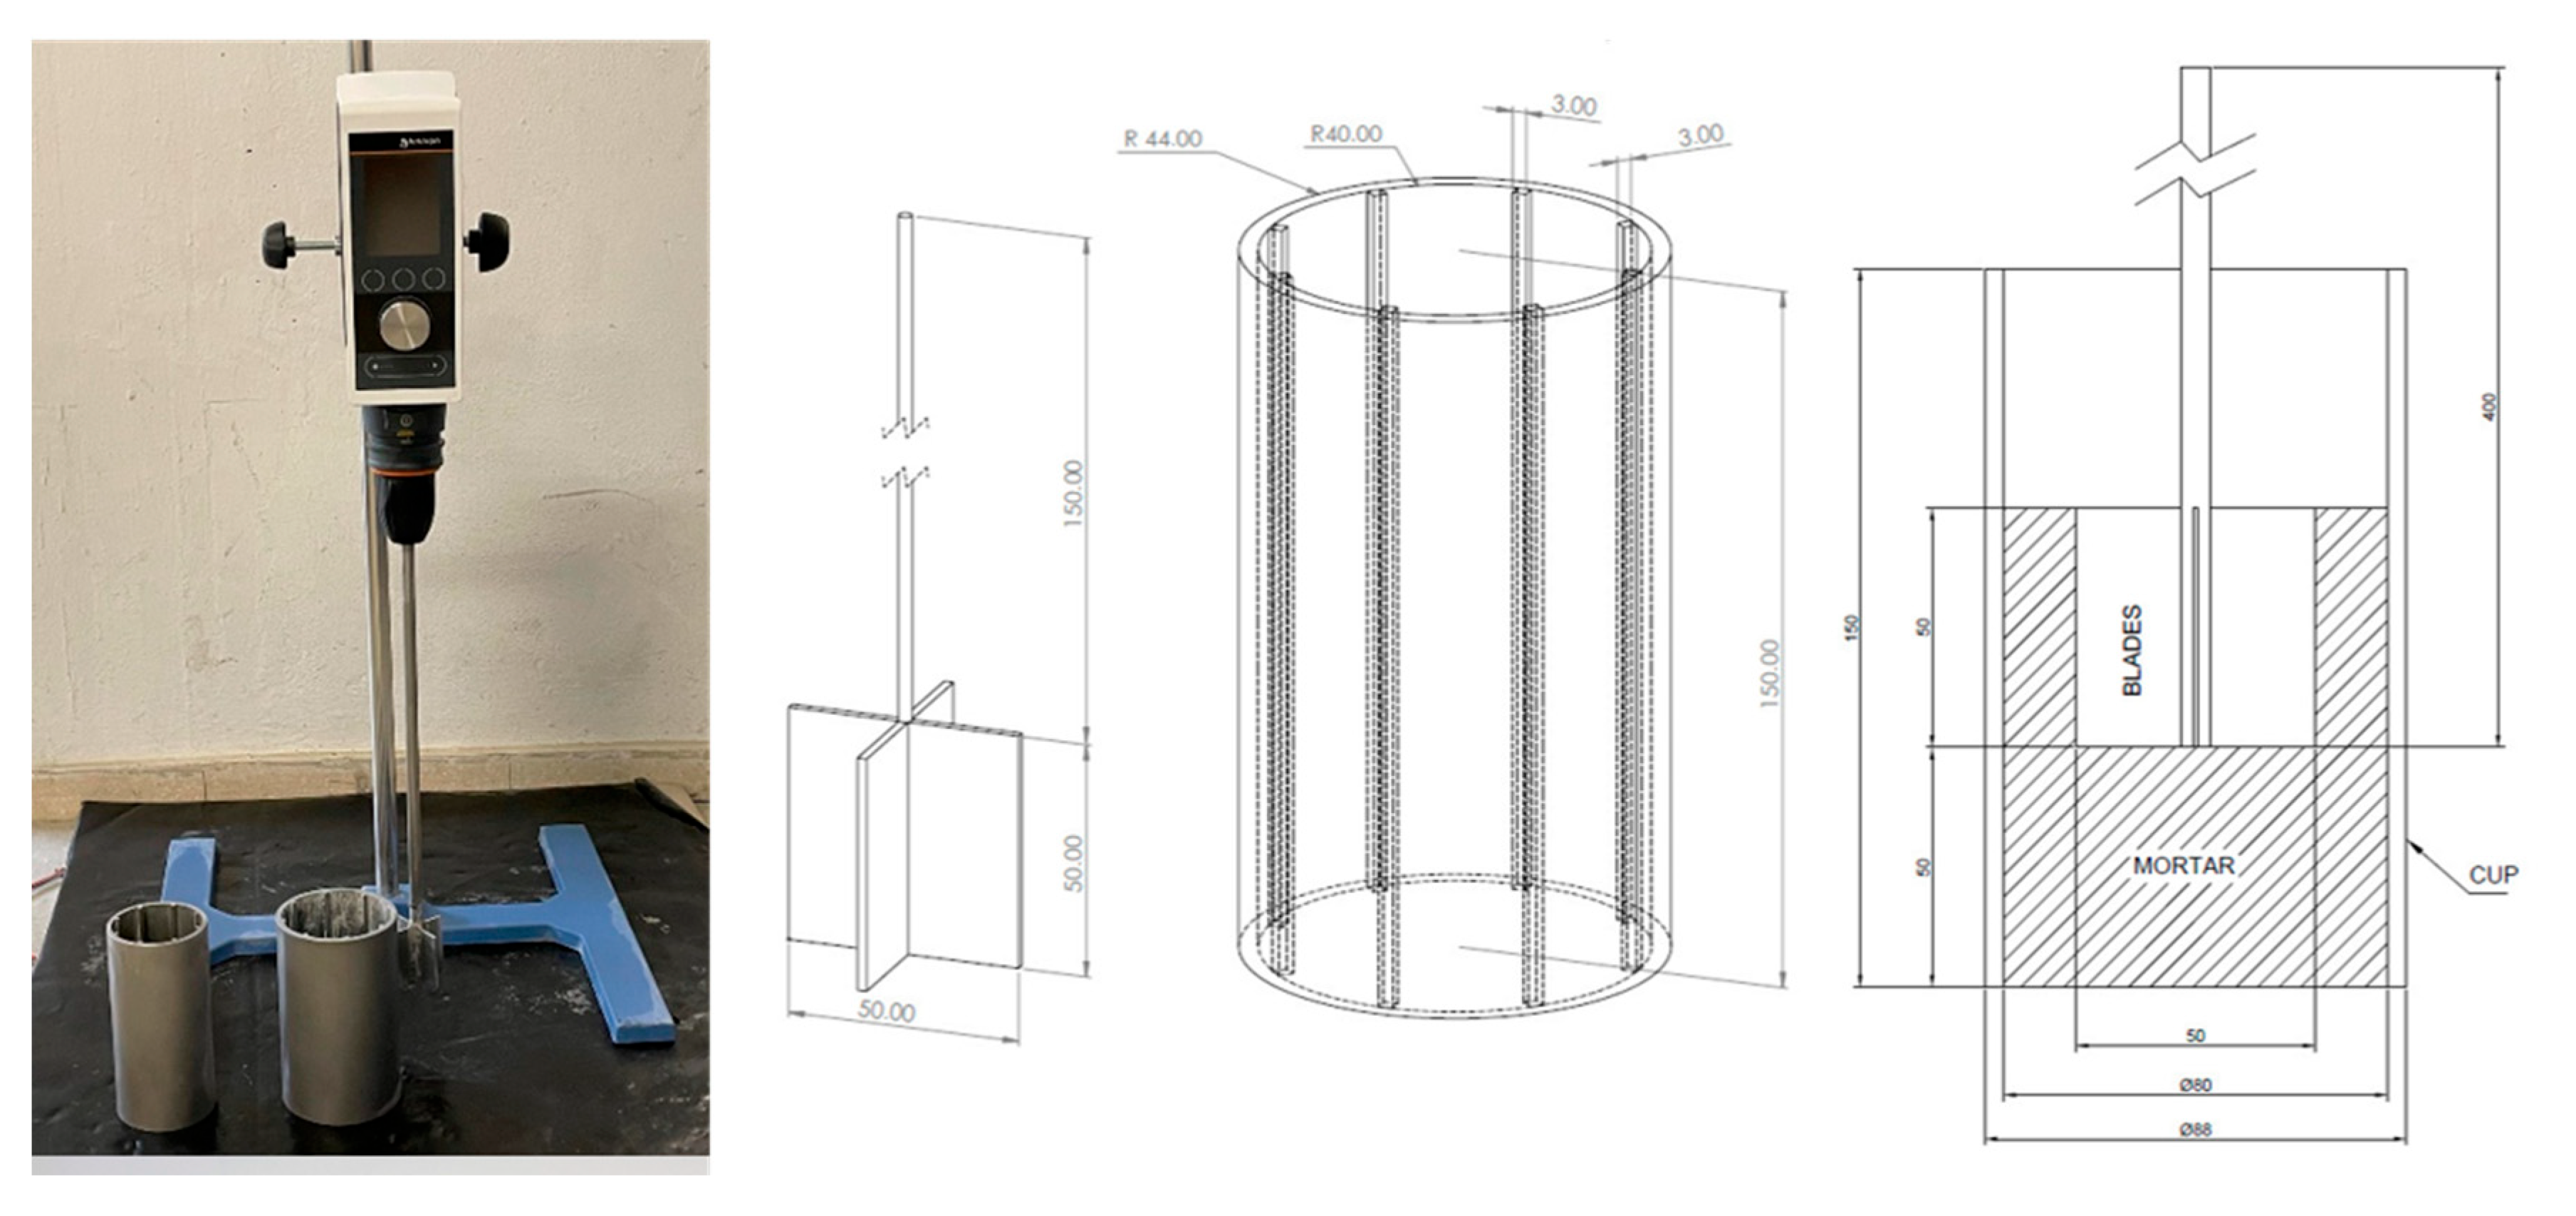
To calculate the rheological parameters of fresh mortar mixes, a low-cost torque rheometer has been developed in Universidad de Cantabria (UC) as described in detail in Ref. [30]. The equipment (Figure 2) consists of three main components. First, an agitator with adjustable rotation speeds ranging from 10 to 2000 rpm is connected to a computer, which records the torque corresponding to preset rotational speeds defined in the software. The agitator is assembled on a tripod using a clamp. Second, a four-blade vane (cross-shaped), measuring 50 mm in height and 25 mm in radius, is attached to the agitator. Finally, a steel cup of an 80 mm inner radius and 100 mm height is used to contain the mortar. The cup has eight ribs with 3 mm width and 3 mm depth, equally distributed, which prevents the mortar from moving in the mortar–cap interface.
The rheometer test consists of pouring a sample of the fresh mortar into the cylindrical container, placing the blade in the center, and making it rotate at previously established decreasing speeds (Figure 3), recording the torque (M) for each rotational speed (Ω). For each mixture, two samples (each sample is a new batch of the same mixture design) were tested.
The values obtained from the rheometer (M and Ω) are then converted into shear stress ( τ ) and shear rate ( γ ˙ ) using the formulas proposed by Estellé et al. [31,32,33]. Then shear stress (τ) vs. shear rate ( γ ˙ ) are graphed in order to obtain yield stress and viscosity, assuming a Bingham model.
A correlation between printability (based on visual observations during the printing trials) and the parameter yield stress × viscosity is proposed, the so-called “printability index”, as discussed in [13,34]. Therefore, good printability (which means a combination of continuity of the extruded filament and self-bearing capacity of the filaments) is correlated, somehow, with a low value of the printability index. In order to include the rheological properties within the multi-criteria decision-making analysis, the parameter “printability index” was included as one of the criteria.

2.4. Mechanical Tests

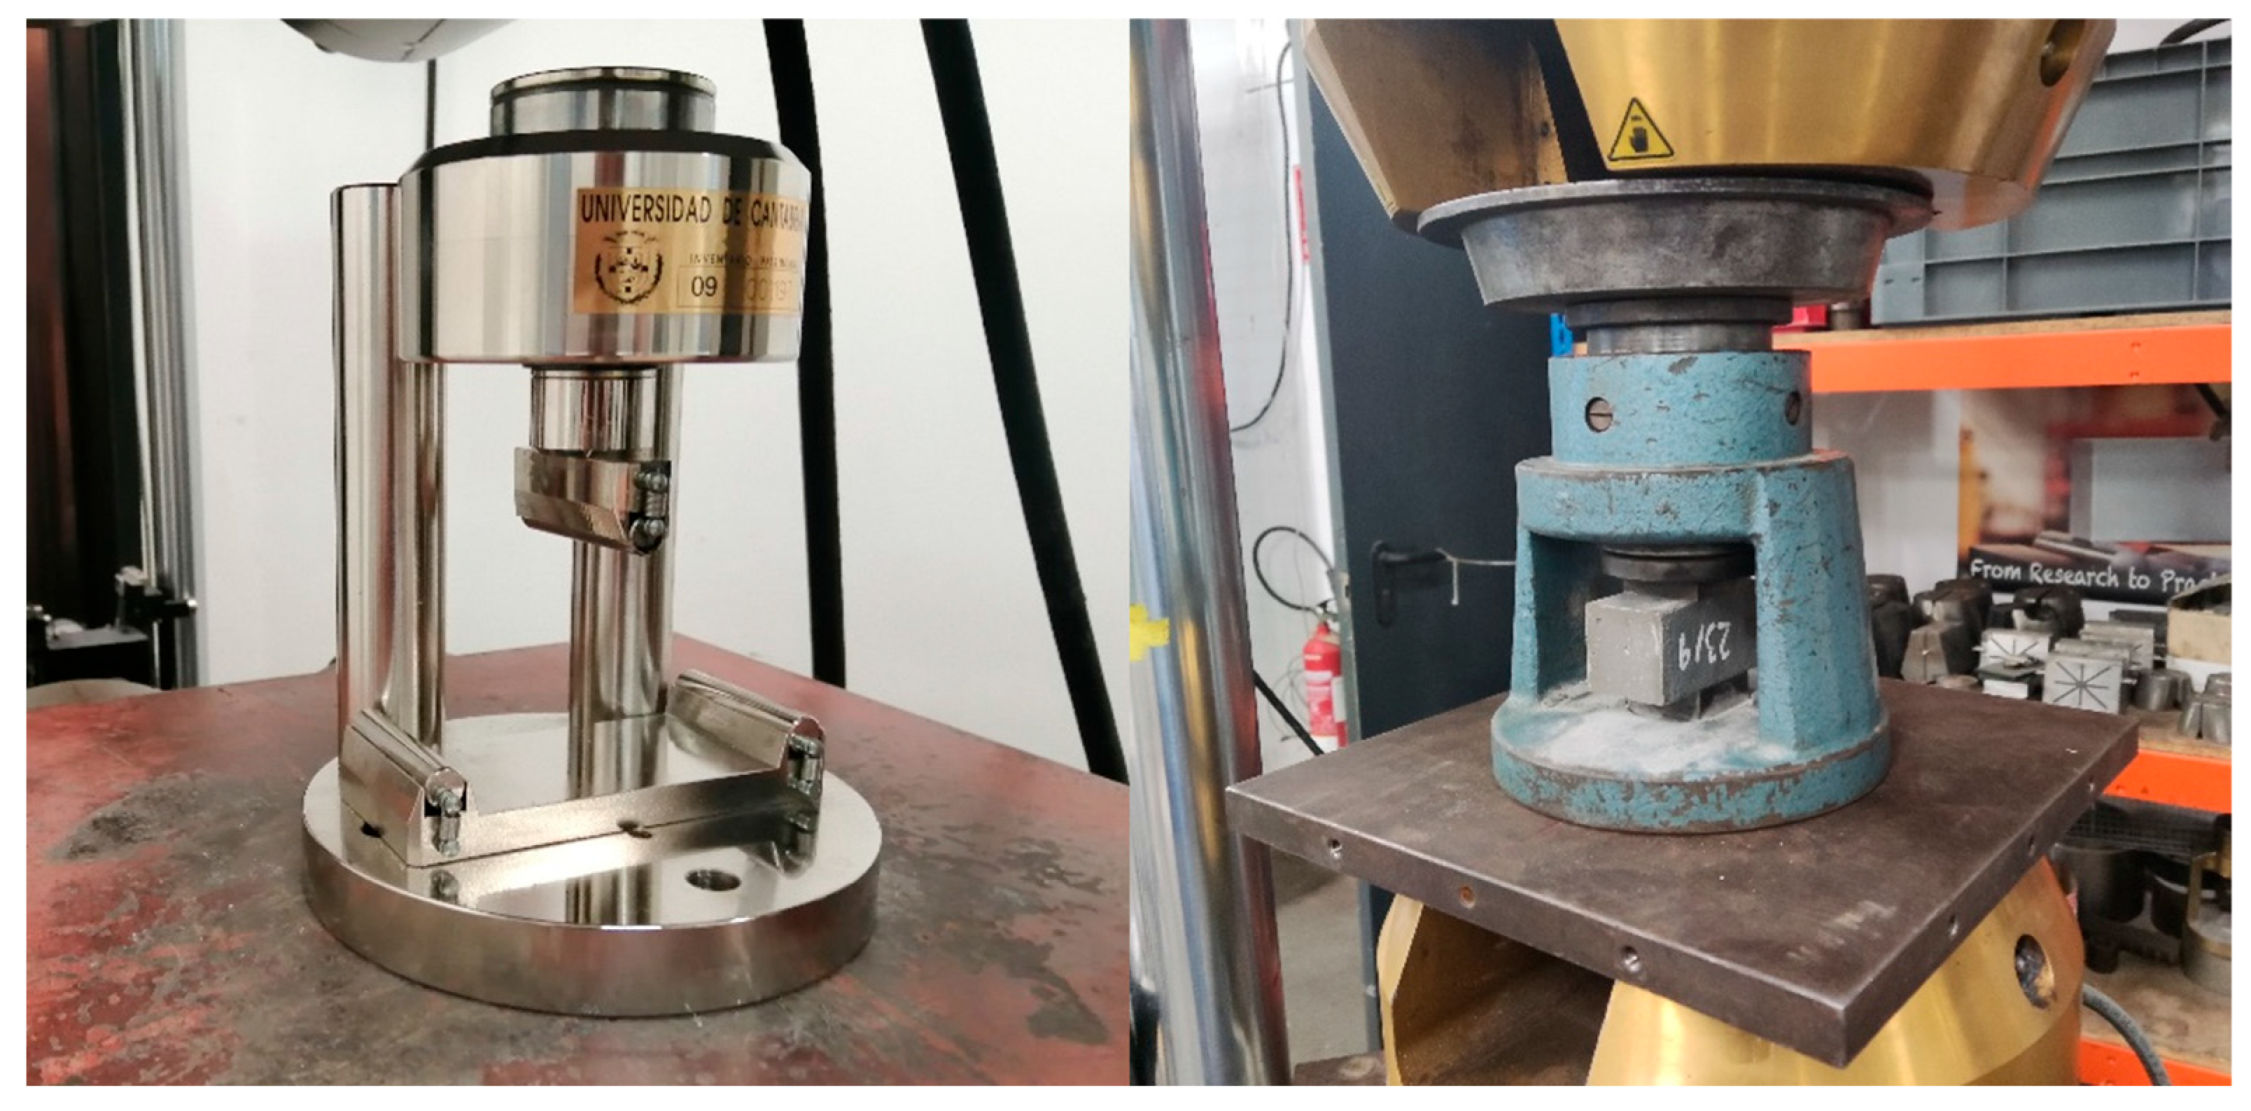
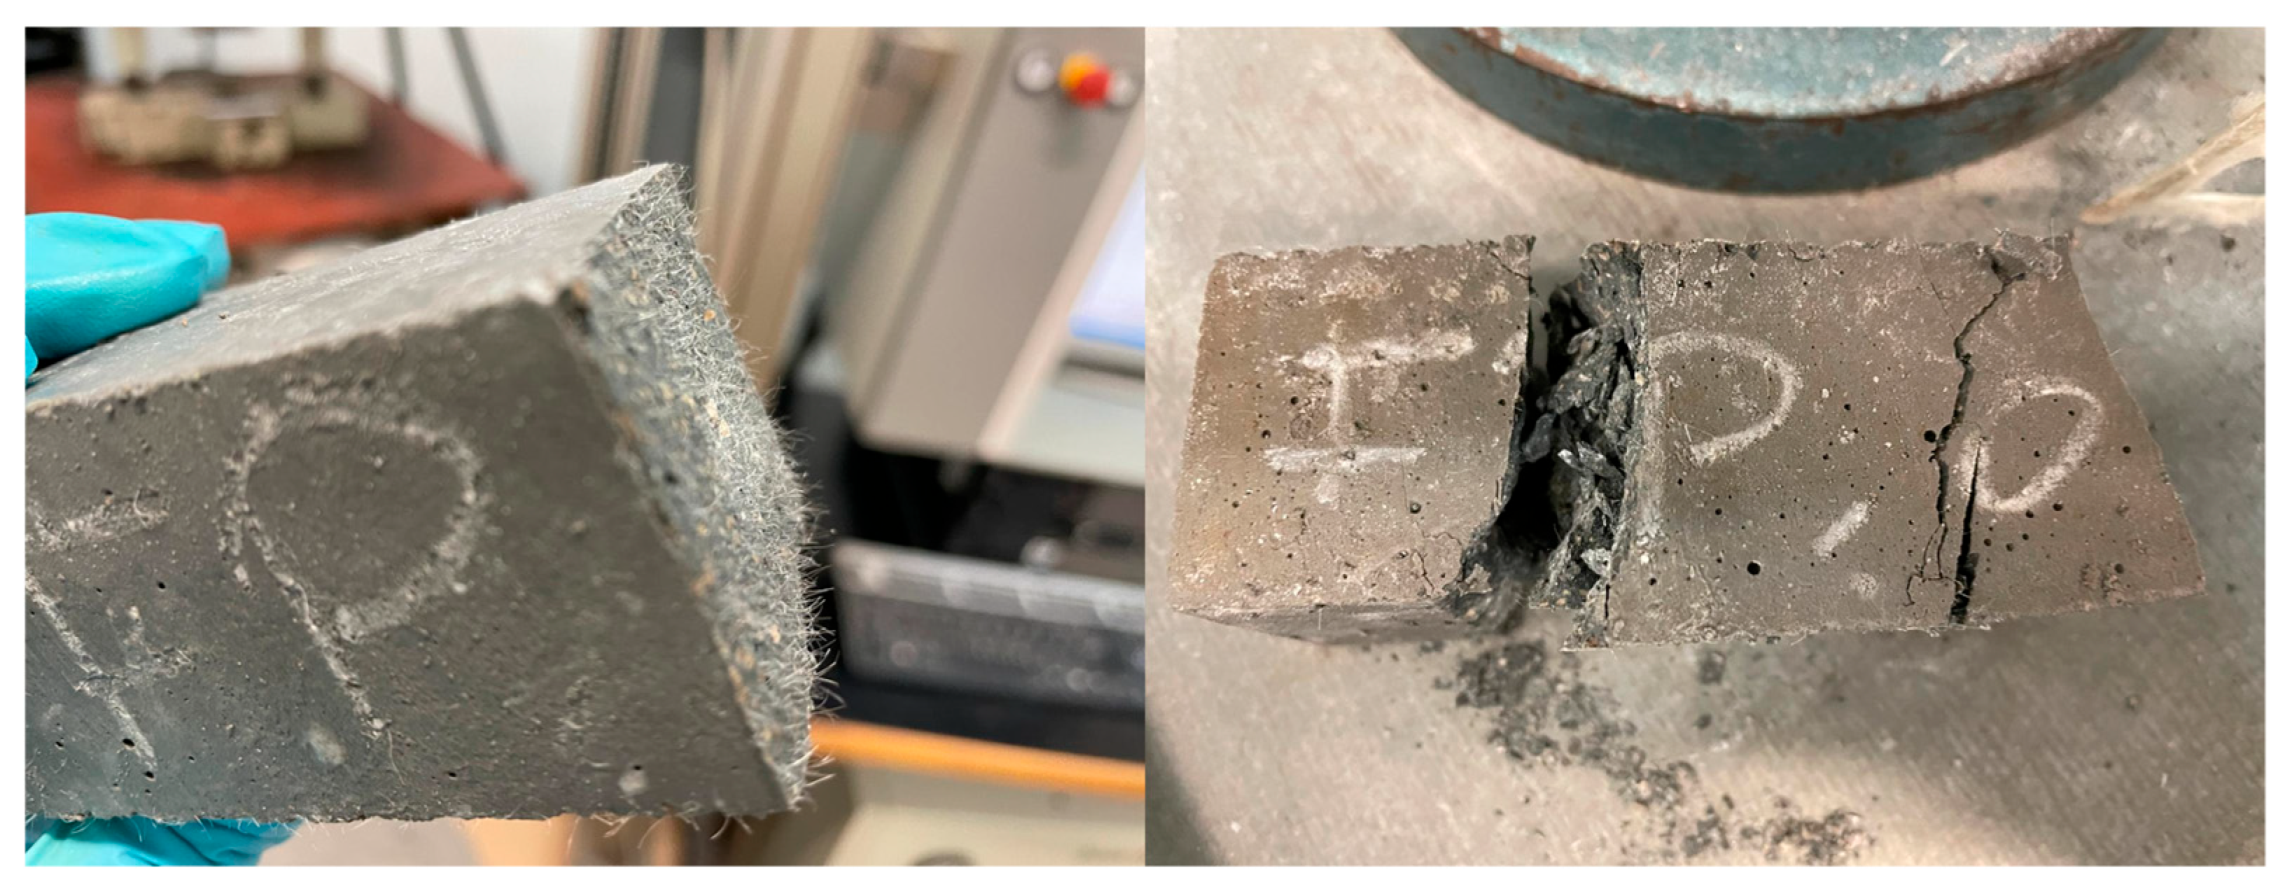
For the mechanical characterization, flexural and compression tests were carried out, using prismatic specimens of 40 mm × 40 mm × 160 mm following the EN 196–1 standard [35]. For the flexural test, a universal testing machine Zwick/Roell Z100 of 100 kN capacity was used, while for the compression test, an Instrom 8033 (Instron, Norwood, MA, USA) with 250 kN capacity was employed (Figure 4). Three specimens were tested at 28 days; thus, three values of flexural strength and six values (3 specimens × 2 halves) of compression strength were obtained (Figure 5). In order to minimize the laboratory work, mortar was cast in molds.
Although some research has suggested that the printing process could influence anisotropy, there is no consensus among authors regarding the extent of this effect. The final strength [36] depends on factors such as the printing path, the ratio of nozzle size to fiber length, the rheological behavior of the fresh mortar, and its setting time, among others. In practical 3D printing, it is common for the path pattern to alternate directions from one layer to the next, which can reduce the impact of anisotropy. This reduction is particularly noticeable when using more fluid mixes, as the extruded filaments can merge together without leaving significant gaps—the main cause of anisotropy. Moreover, if the mortar’s setting time is long enough, layers can bond effectively, minimizing or even eliminating anisotropy between the printing plane and its perpendicular direction, as well as between 3D-printed and cast samples [37].
Thus, for the purpose of this study, it was assumed that there should not be large differences in mechanical properties between cast mortar and 3D-printed mortar as discussed also in [13].

2.5. Life Cycle Analysis

A cradle-to-gate life cycle assessment (LCA) was carried out for the different mortar compositions under study, with the objective of ranking them according to their environmental performance. The declared unit is 1 ton of each mortar. The impact assessment method used was ReCiPe (midpoint level). In order to obtain a single indicator for ranking purposes, EF3.1 normalization and weighting values, published in July 2022, have been used. Regarding the life cycle inventory (LCI) of the raw materials used in the different mortar formulations, the data sources are detailed in Table 6. The impacts of additives Mastersure 950 and Materease 5025 were not included due to the lack of available information about their production processes and their very low concentration in the overall formulation. Estimated transportation distances are shown in Table 7.

2.6. Cost

The cost of the materials used to make the different types of mixes is shown in Table 8 and Table 9.

2.7. Multi-Criteria Decision-Making Analysis

2.7.1. Methodology

To undertake a multi-criteria decision-making analysis (MCDMA), it is necessary to define the alternatives, the criteria (and the weights for each criterion), and the methods to assess the different alternatives. In this work, the alternatives considered are the different mortars developed in Phase 1 (mortars without fibers) and Phase 2 (mortars with fibers). Thus, two independent MCDMAs were conducted, one for Phase 1 and another for Phase 2. In relation to the assessment methods, WASPAS and TOPSIS were used in order to double-check that the ranking of alternatives was comparable, independently of the method used.

2.7.2. Alternatives and Criteria

In Phase 1, four different mixtures without fibers were analyzed: 42.5-FA, 42.5, 52.5-FA, and 52.5. Five criteria were adopted: (i) printability, (ii) flexural strength, (iii) compressive strength, (iv) cost, and (v) LCA. The printability index was defined as the yield strength × viscosity. The weights assigned to each criterion were equal; that is, 0.2.
For Phase 2, since the mortar mixture was fixed, only the fibers added may have an influence on the results. Since the amount of fiber is very low, it was assumed that in terms of LCA, there would not be substantial differences among mixtures; thus, in this case, only four criteria were adopted: (i) cost, (ii) compressive strength, (iii) flexural strength, and (iv) printability index. Equal weights of 0.25 were assigned to all criteria.

2.7.3. Assessment Methods

  • WASPAS
The initial decision-making method to be applied is the Weighted Aggregated Sum Product Assessment (WASPAS). Developed by Zavadskas et al. [38], WASPAS integrates two well-known multi-criteria decision-making (MCDM) techniques: the Weighted Product Model (WPM) and the Weighted Sum Model (WSM). This hybrid approach enhances the method’s robustness [39], making it widely applicable across various engineering disciplines.
2.
TOPSIS
The Technique for Order Preference by Similarity to Ideal Solution (TOPSIS), introduced by Hwang et al. [40], is one of the most popular and frequently applied methods in multi-criteria decision-making. It operates by evaluating the distance of each alternative from two reference points: the ideal positive and ideal negative solutions [41]. The ideal positive solution represents the scenario with maximum benefits and minimum costs, whereas the ideal negative solution reflects the opposite. Consequently, the most favorable option is the one that is nearest to the ideal positive and farthest from the ideal negative solution.

3. Results and Discussion

3.1. Phase 1: Mortars Without Fibers

3.1.1. Rheology

Three-dimensional printing by extrusion through an endless screw and nozzle requires a combination of rheological properties of the mixtures. On the one hand, they must have good workability and flowability during the time necessary to extrude through the endless screw and be continuously expelled through the nozzle, without causing clogging or blockages. This first characteristic is especially important in mixtures made with high-performance mortars or concrete, which have lower flowability and shorter printing times. On the other hand, once the layers have been extruded, they must have sufficient capacity to maintain their shape and support the weight of the upper layers.
Table 10 shows the rheological results of the best mixtures obtained after the different laboratory tests.
It was observed that the modification of the cement type significantly affects the rheological results, both yield stress and viscosity.
The results showed very significant increases in yield stress of between 50 and 60%, comparing CEM I 42.5 R and CEM I 52.5 R mixtures. This increase in yield stress reflects what was observed in the laboratory tests, where the force to be applied by the worm screw was much higher in CEM I 52.5 R mixtures than in CEM I 42.5 R. Also, some CEM I 52.5 R mixtures clog the nozzle, while in others, the filament begins to become thinner or even lose continuity, requiring a slight increase in the amount of superplasticizers to allow mixtures to be printed and, at the same time, avoid collapse.
The results revealed a substantial increase in yield stress—between 50% and 60%—when comparing CEM I 52.5 R mixtures with CEM I 42.5 R mixtures. This higher yield stress aligns with laboratory observations, where the worm screw required considerably more force to process the CEM I 52.5 R mixtures than the CEM I 42.5 R ones. In some cases, CEM I 52.5 R mixtures caused nozzle blockages, while in others, the extruded filament became thinner or even lost continuity. To address these issues and ensure both printability and a self-support capacity, a slight increase in superplasticizer content was necessary to add.
Viscosity, on the other hand, showed less variable values between the mixes with different types of cement, but its value was slightly reduced with the CEM I 52.5 R mixes.
Finally, it was also observed that the use of fly ash, which had provided better results in the mixes with conventional cements, in this case, did not improve the performance of the HPC mixes.

3.1.2. Mechanical Tests

  • Flexural strength
In this study, the flexural strength values obtained at 28 days of the mixtures that were suitable for printing were analyzed.
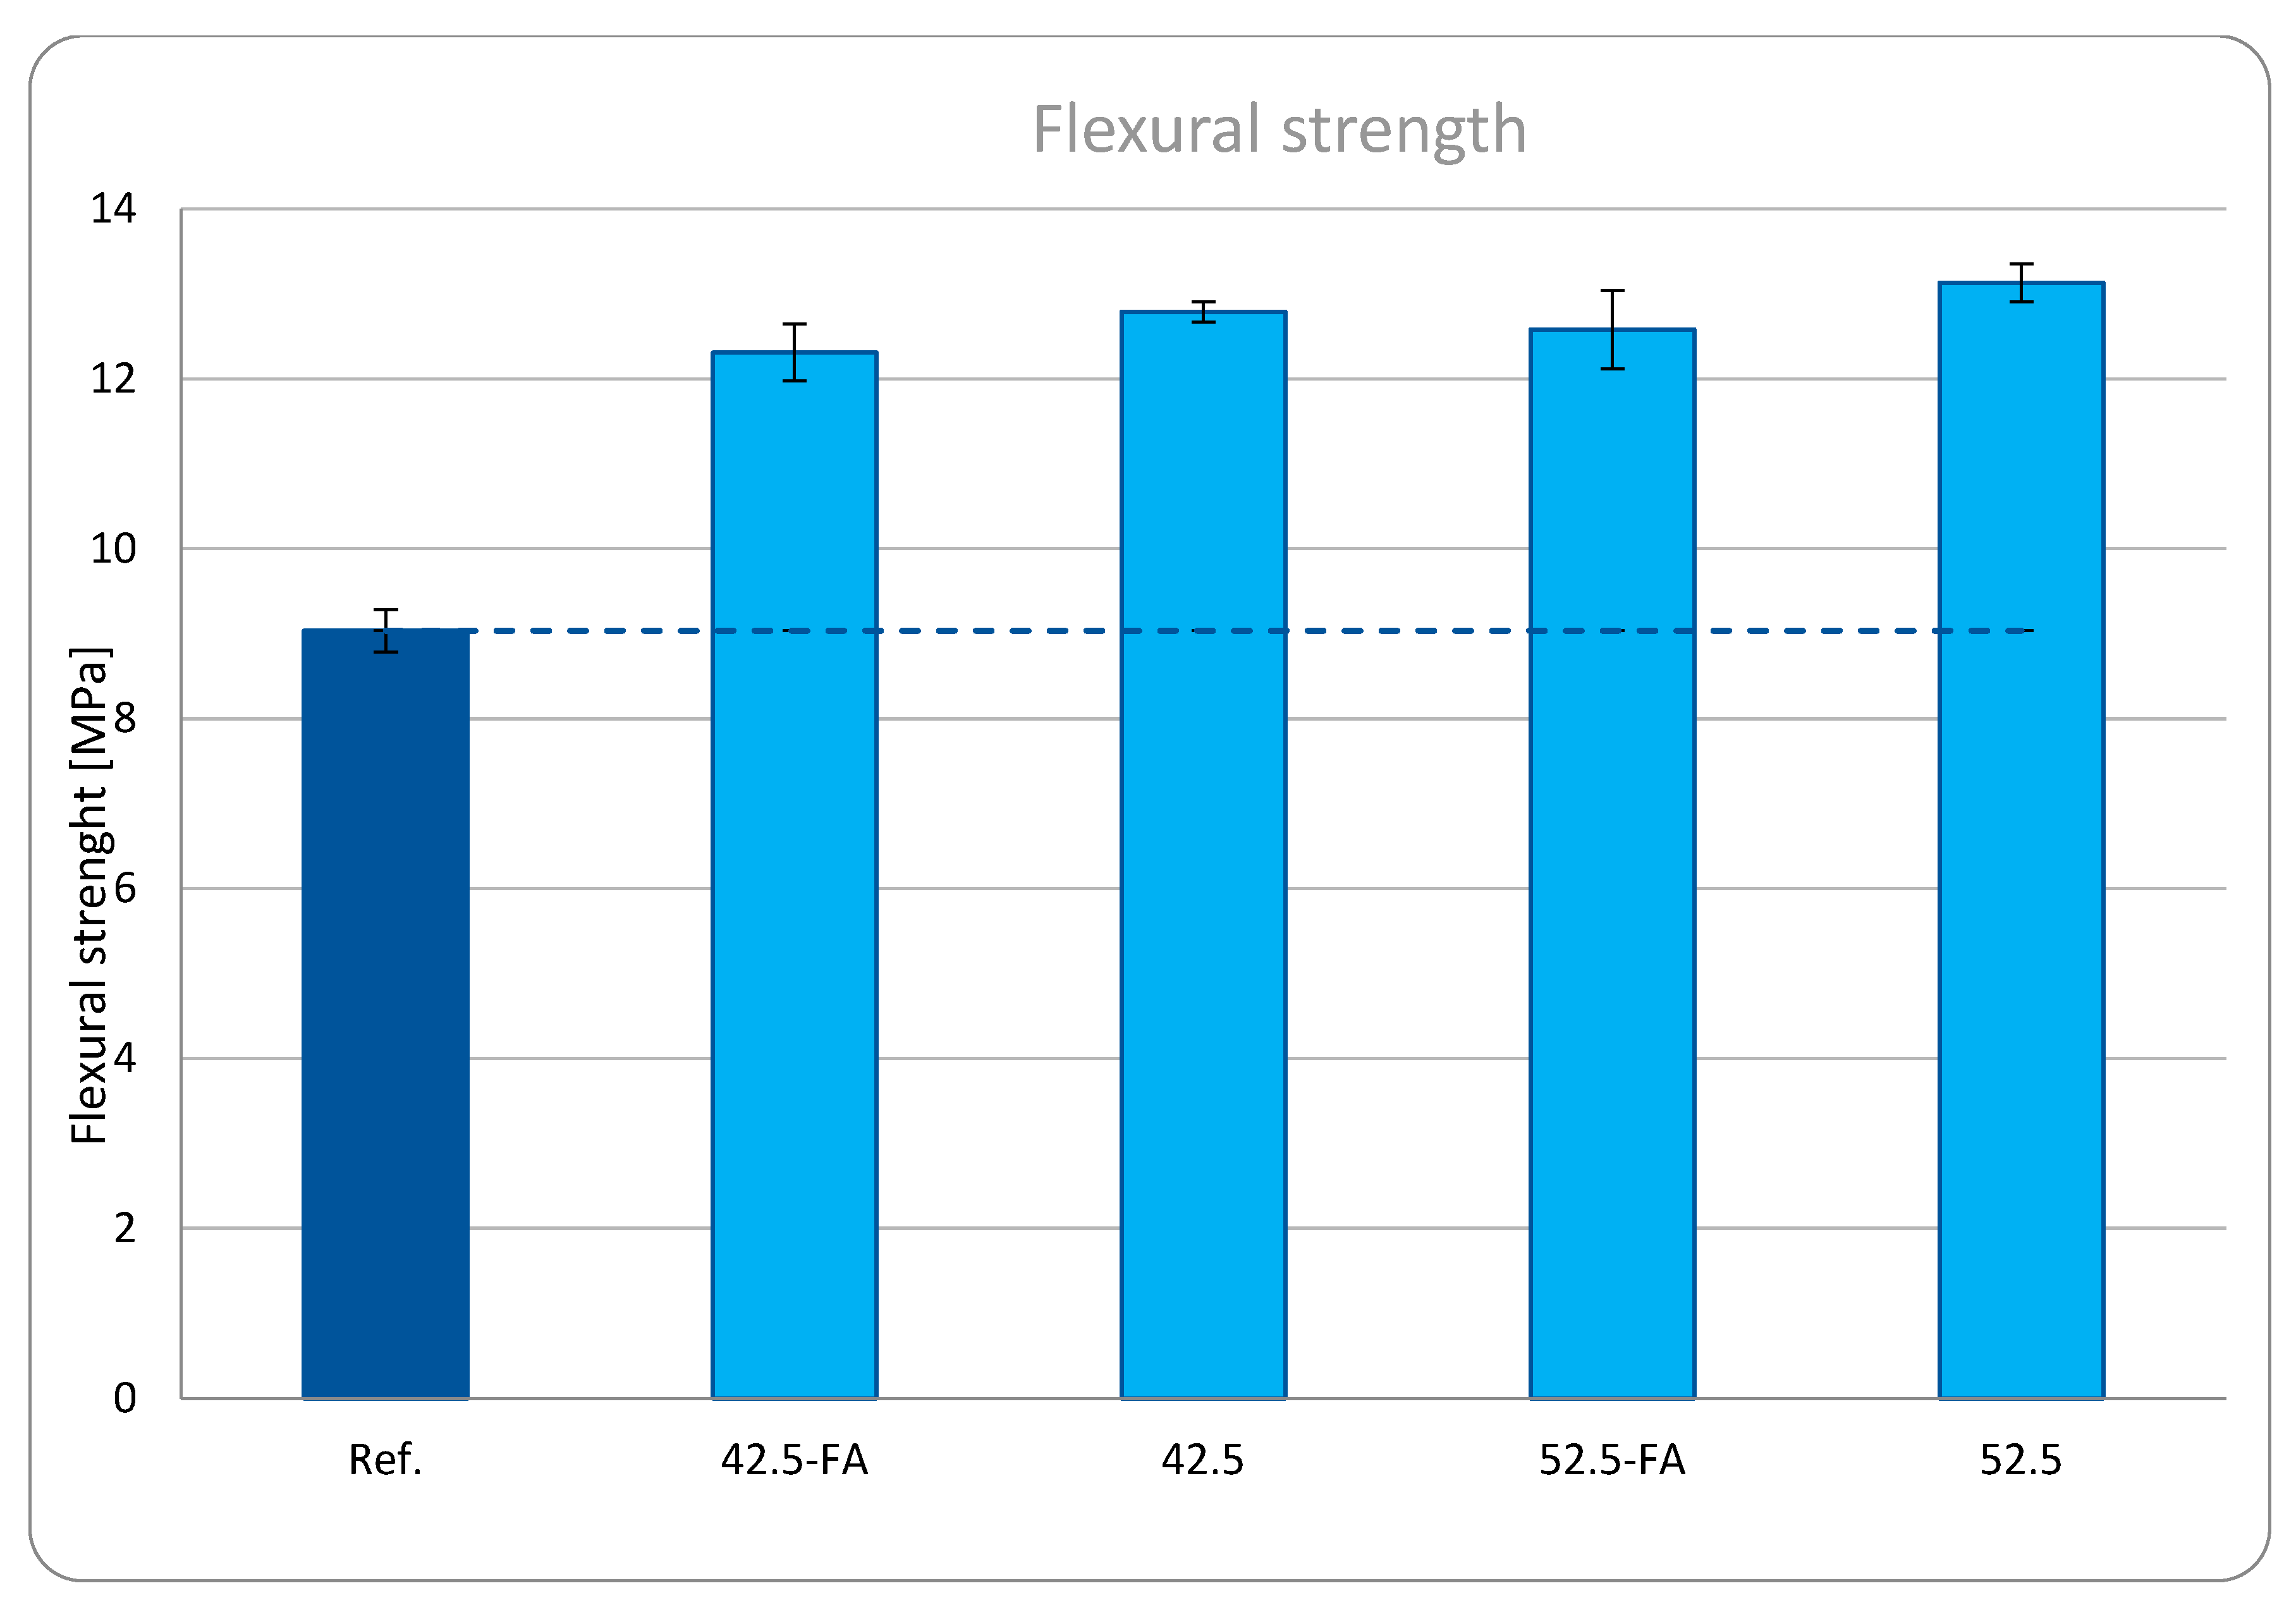
The results (Table 11 and Figure 6) show flexural strength values between 12.3 and 13.1 MPa. This represents an increase in between 35 and 45% when incorporating high-performance cements, compared to the conventional cement samples analyzed in previous laboratory tests [13]. Regarding the elimination of fly ash from the mixtures, it was observed that the flexural strengths improved slightly in this type of mixture, although the increases were not very significant, oscillating around 4%.
The values showed that the mixtures with the best flexural strength values were the mixture of CEM I 52.5 R, followed by the mixture of CEM I 42.5 R, in both cases eliminating fly ash.
2.
Compressive strength
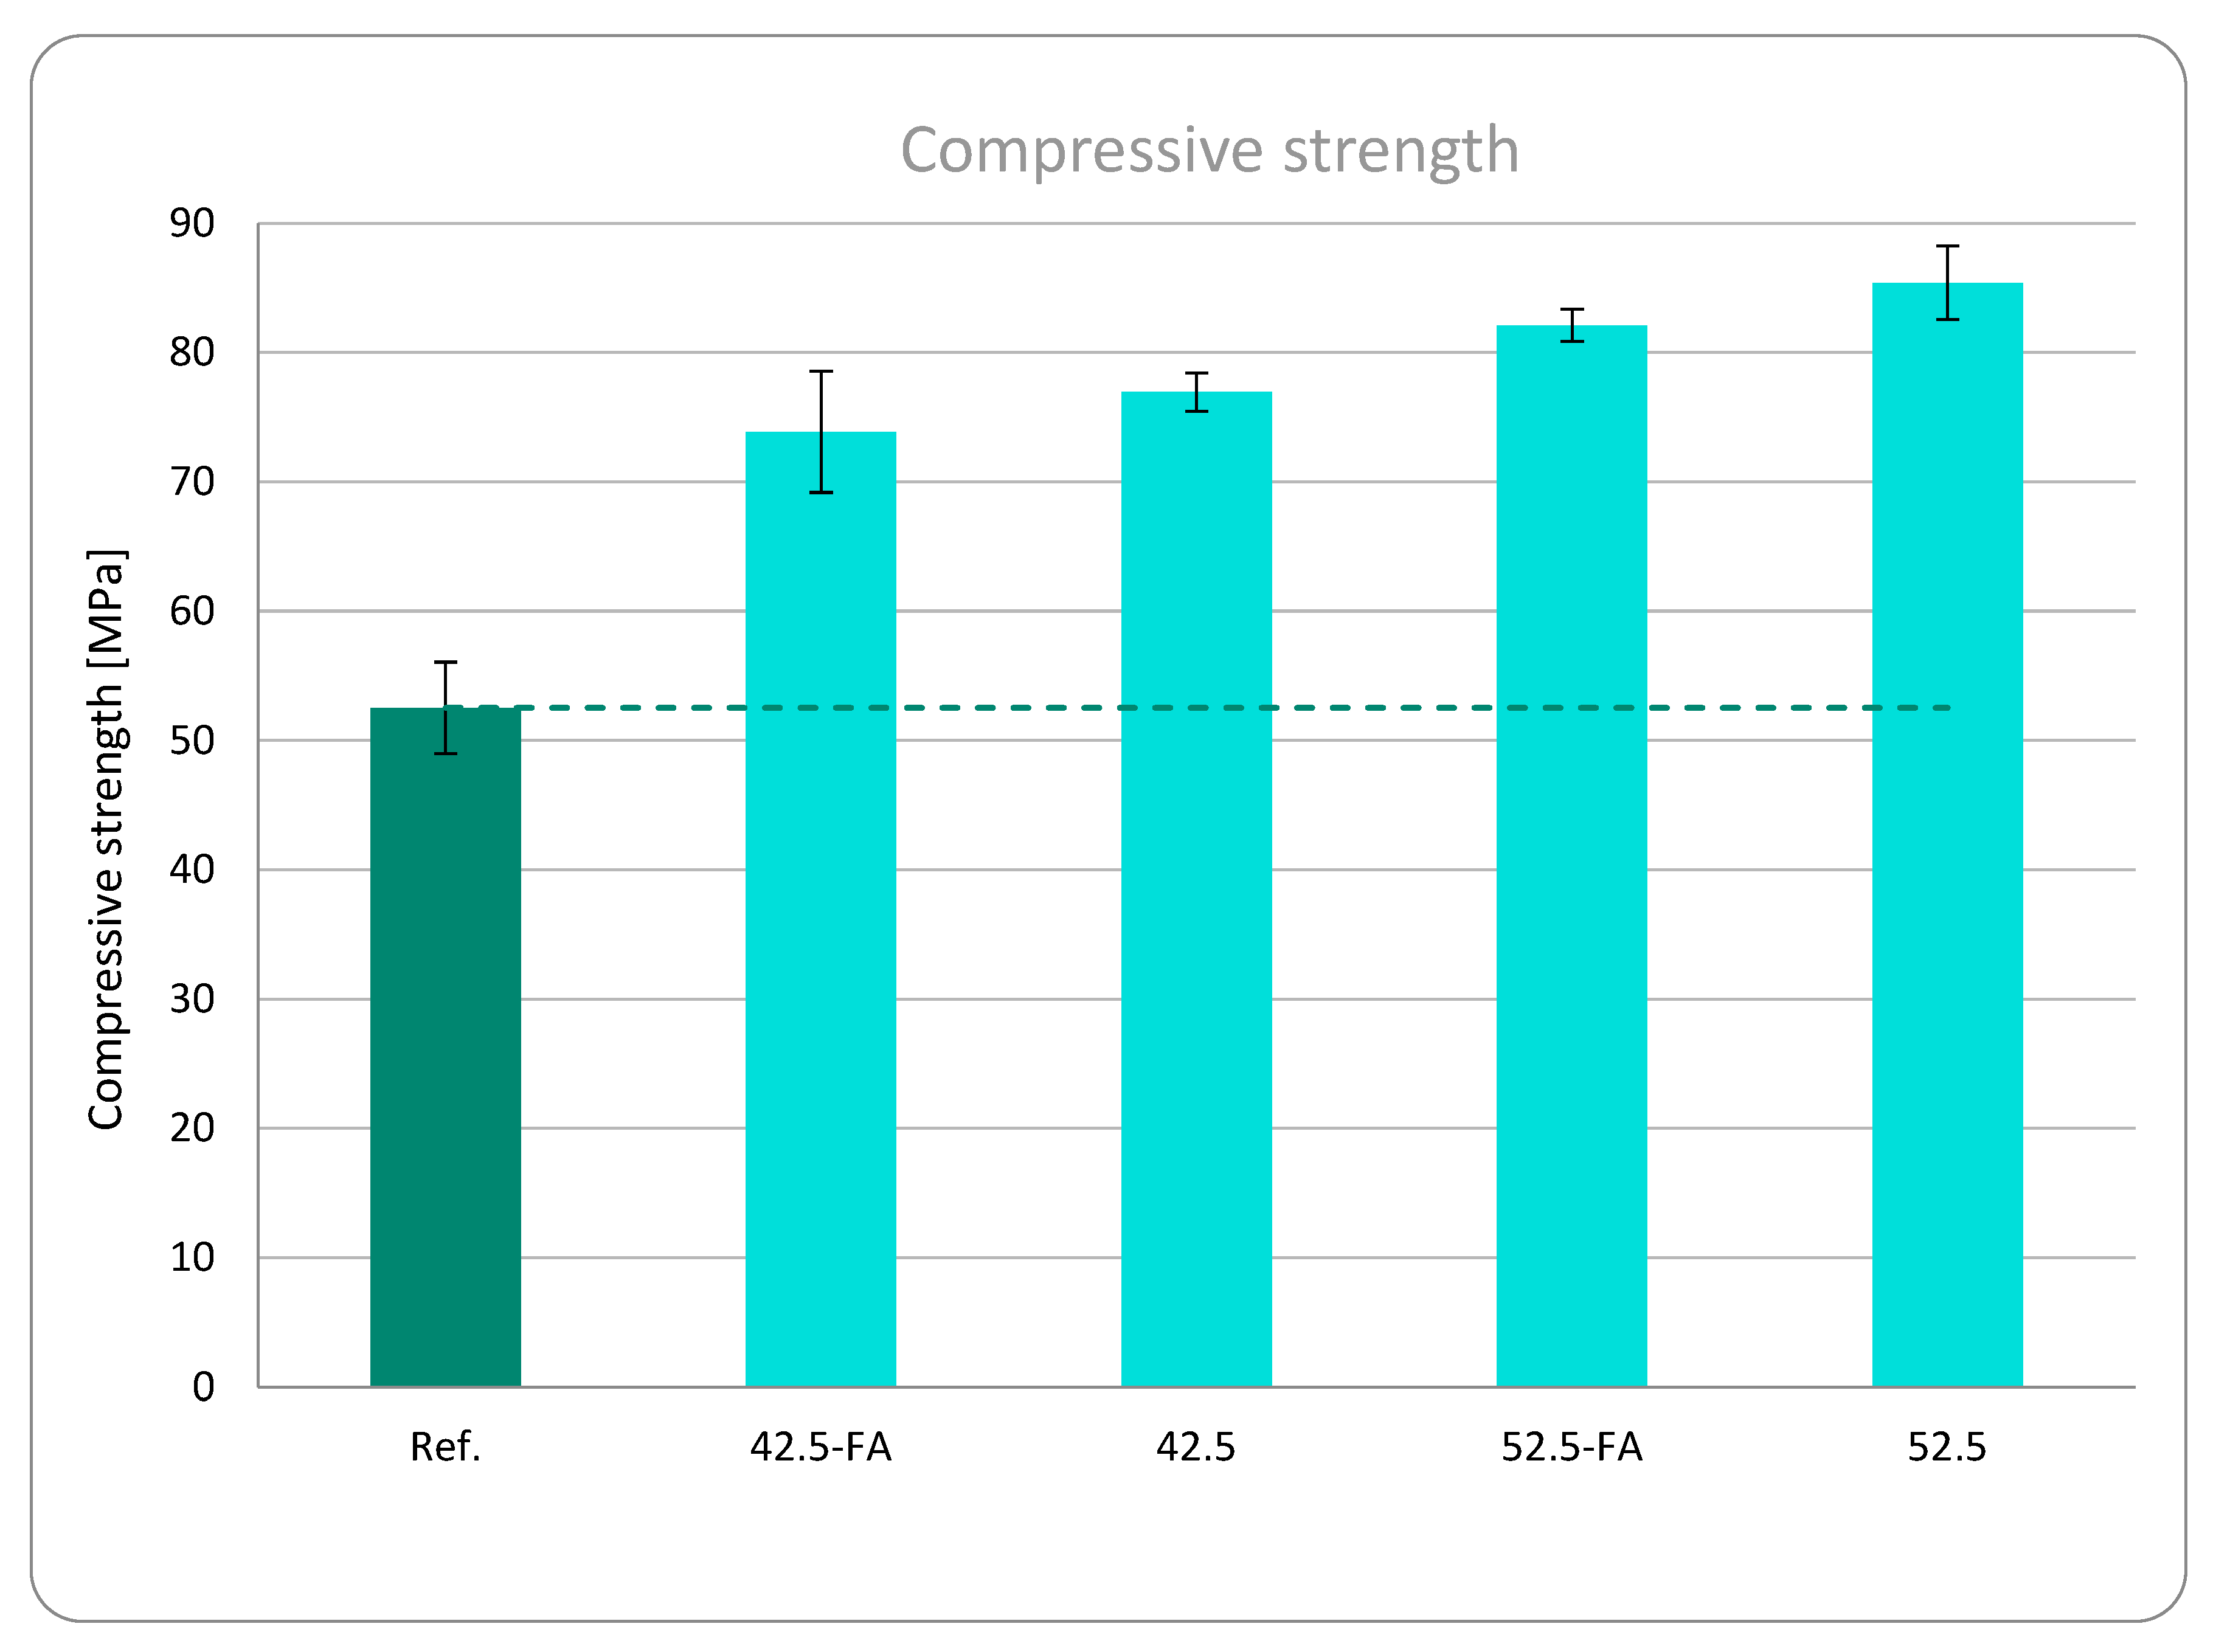
The results obtained in the compression tests at 28 days are shown in Figure 7 below, with results ranging between 73 and 85 MPa. This represents an increase compared to mixtures made with conventional concretes, which range between 40 and 60%, and therefore, the improvement provided by these high-performance cements is very substantial. The mixtures that showed the highest values were in both cases those that incorporated CEM I 52.5 R. As for the elimination of fly ash in the mixtures, the effect was similar to what happened in the flexural strength tests, obtaining results with increases of around 4%.

3.1.3. Life Cycle Analysis

Table 12 shows the individual impacts of each mortar measured in each category impact unit, and also the normalized and weighted impacts using dimensional units (Points). As can be seen, the largest impacts are “Climate change” and “Resource use, fossils”. Those two impacts account for nearly 70% of the overall LCA points of each mortar. The four mortars show quite similar results in terms of overall LCA punctuation, ranging from 1.342 × 10⁻² points (42.5 FA) to 1.387 × 10⁻² points (52.5). This is due to the small difference in clinker content between all of them.

3.1.4. Cost

The cost of each mixture was calculated on the basis of the prices established for each of the components listed in Table 13, obtaining the total cost of each of the mixtures (in euros/ton). The prices of all mixes were very similar, ranging from EUR 90 to 95. This is due to the fact that the prices of 42.5 R and 52.5 R cements are very similar, and fly ash is the material that has the lowest weight of the mixture, having a low influence on the total calculation.

3.1.5. Multi-Criteria Decision-Making Analysis

Table 14 shows the decision-making matrix of the alternatives and criteria considered. As indicated in the methodology, equal weights were assigned to the five criteria.
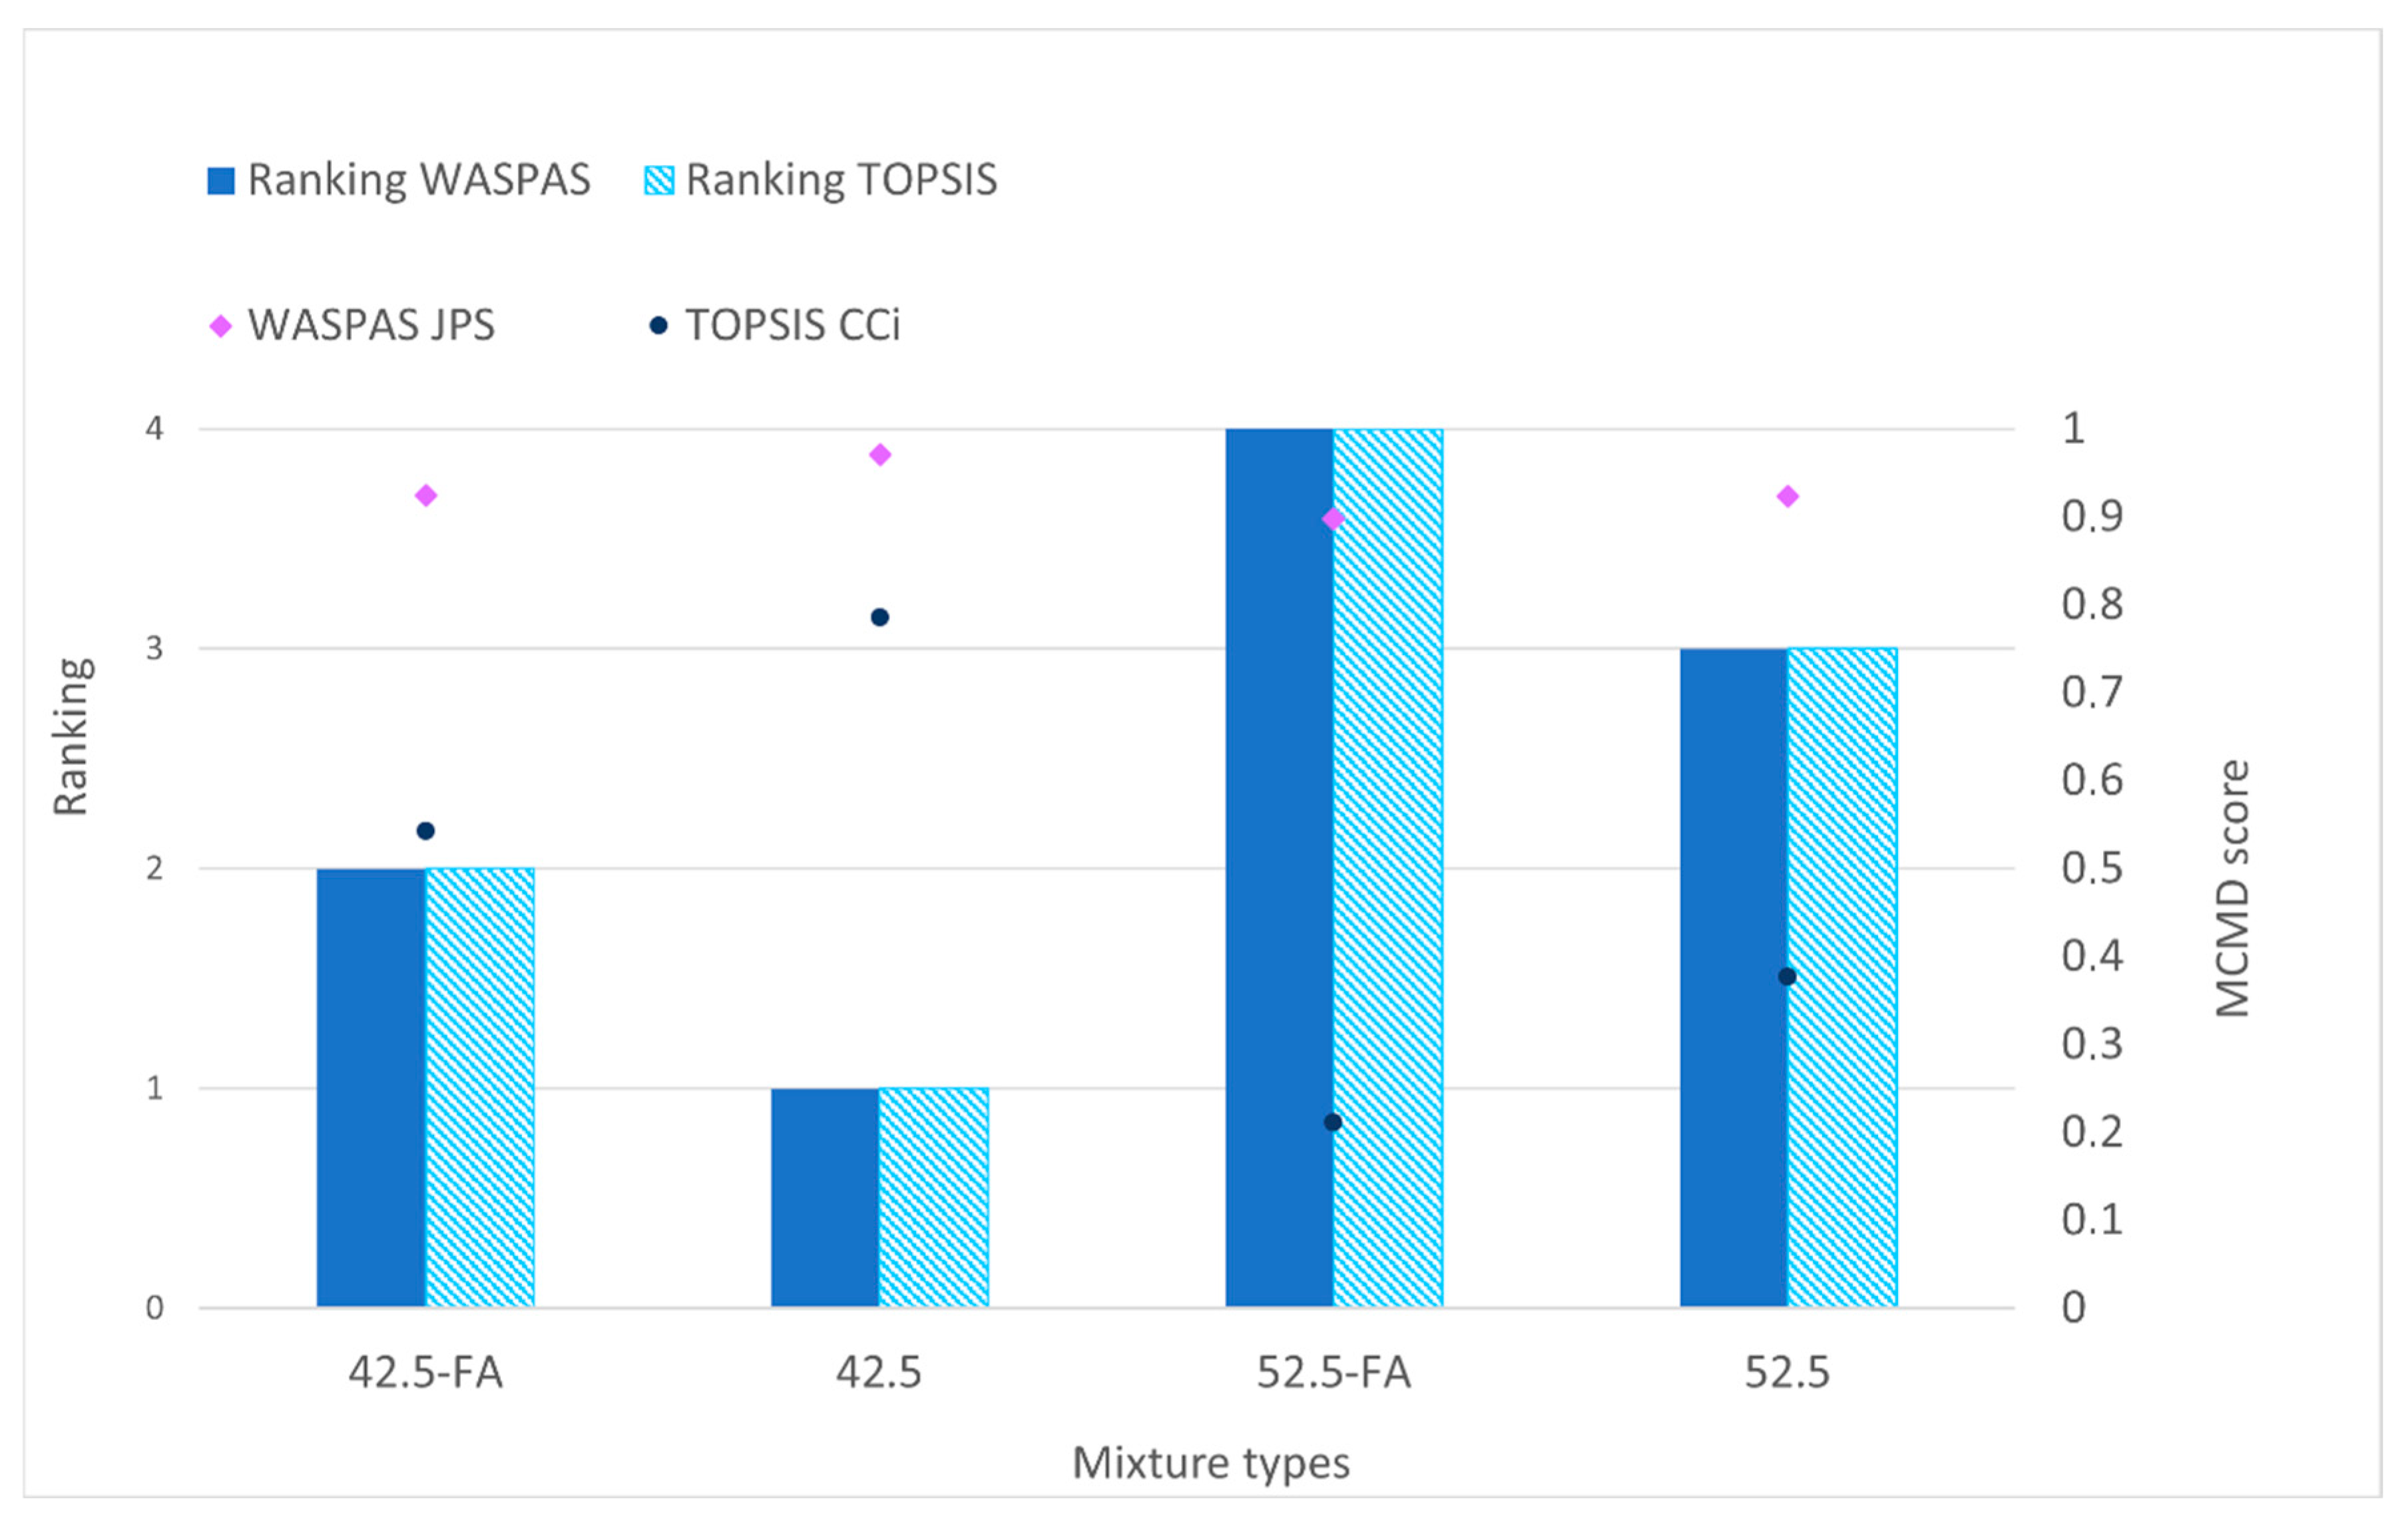
The MCDMA (Figure 8) shows that the best mortar formulation is “42.5”, which is the mortar that uses CemI 42.5 R without fly ash. Cement I 52.5 mortars show the highest strengths; however, these positive criteria do not compensate for the fact that they are worse in terms of printability and cost.

3.1.6. Discussions

The classification of the mixtures was carried out with the two MCDMA methods described above, WASPAS and TOPSIS, to check whether the results obtained with both methods were the same.
The CC and JPS score values range from 0 to 1 for both methods, and the best alternative is the one with the highest values. The classification obtained with the two methods of MCDM analysis is shown in Figure 8. There, it can be seen that the mixture that has presented the best results has been the one that uses CEM 42.5 R and no fly ash. This is due to the fact that this dosage has the best printability among all those tested, and good values of flexural and compressive strength, despite not being the mixture that obtained the best values. In addition, in terms of the economic criterion, mixtures with CEM 42.5 R presented a slightly lower value than those with CEM 52.5 R.
For Phase 2, mortars will include only CemI 42.5 R without fly ash, making variations in dosages using different types of fibers.

3.2. Phase 2: Mortars with Fibers

3.2.1. Rheology

As we have already mentioned before, mixtures for 3D printing must combine flowability and workability with good self-supporting capacity. The rheological results obtained are shown in Table 15, confirming that the incorporation of the fibers in the mixtures affects both the yield stress and viscosity values. Regarding the yield stress values, it can be seen that they increase with the incorporation of all types of mixtures. Therefore, the force to initiate the flow that the printer’s endless screw must perform increases significantly. This was also observed in the laboratory during 3D printing tests, since in this type of mixture, the printing increased and worsened slightly.
Regarding the viscosity value, this has a trend opposite that of the yield stress, since with the incorporation of these fibers, the mixtures reduce the viscosity value. These viscosity variations are not as noticeable as in the case of yield stress. This corresponds to what happens in the laboratory, since the mixtures that incorporate the fibers are drier and reduce their workability.
Mortar with PP fibers (PP6; 0.05) shows the worst printability performance (higher value of yield stress × viscosity), while mortar with 6 mm length cellulose fibers (CELL6; 0.05) exhibits the best behavior.

3.2.2. Mechanical Tests

  • Flexural strength
The results of the flexural strength tests obtained at 28 days, for the different mixtures in which the different types of fibers were incorporated into the mixture that had obtained the best results in Phase 1, are shown in Table 16 and Figure 9. Average values and dispersion are depicted on the graph. Also, in Table 16, increments with respect to the reference sample are included. Furthermore, the average increment for both flexural strength and compressive strength and a confidence interval of 95% are provided, assuming a t-Student. In this test, the incorporation of the fibers did not significantly affect the flexural strength, as proven by a p-value in an ANOVA test of p = 0.793 (>0.05). The maximum increase in flexural strength was observed for the mixtures containing carbon fibers (3.64% increment). In the particular case of the mixture containing 6 mm cellulose fibers, it showed a decrease in flexural strength of 7.74%. In previous laboratory tests with conventional cements, increases of up to 30% were achieved with the incorporation of fibers, as reported in previous studies.
One of the additional advantages of adding fibers to mortars or concretes is the increase in toughness (ability of a material to absorb energy and deform plastically before fracturing), with existing examples in the case of steel and carbon fibers [42,43]. In terms of cellulose fibers, there are no previous studies that analyzed their toughness; however, Varela et al. [24] studied the addition of sisal fibers (agave plant), which could be considered also somewhat similar to cellulose, concluding that they also increased the toughness with respect to control samples without fibers. Nevertheless, this might need further research in the particular case of mortars with cellulose fibers.
2.
Compressive strength
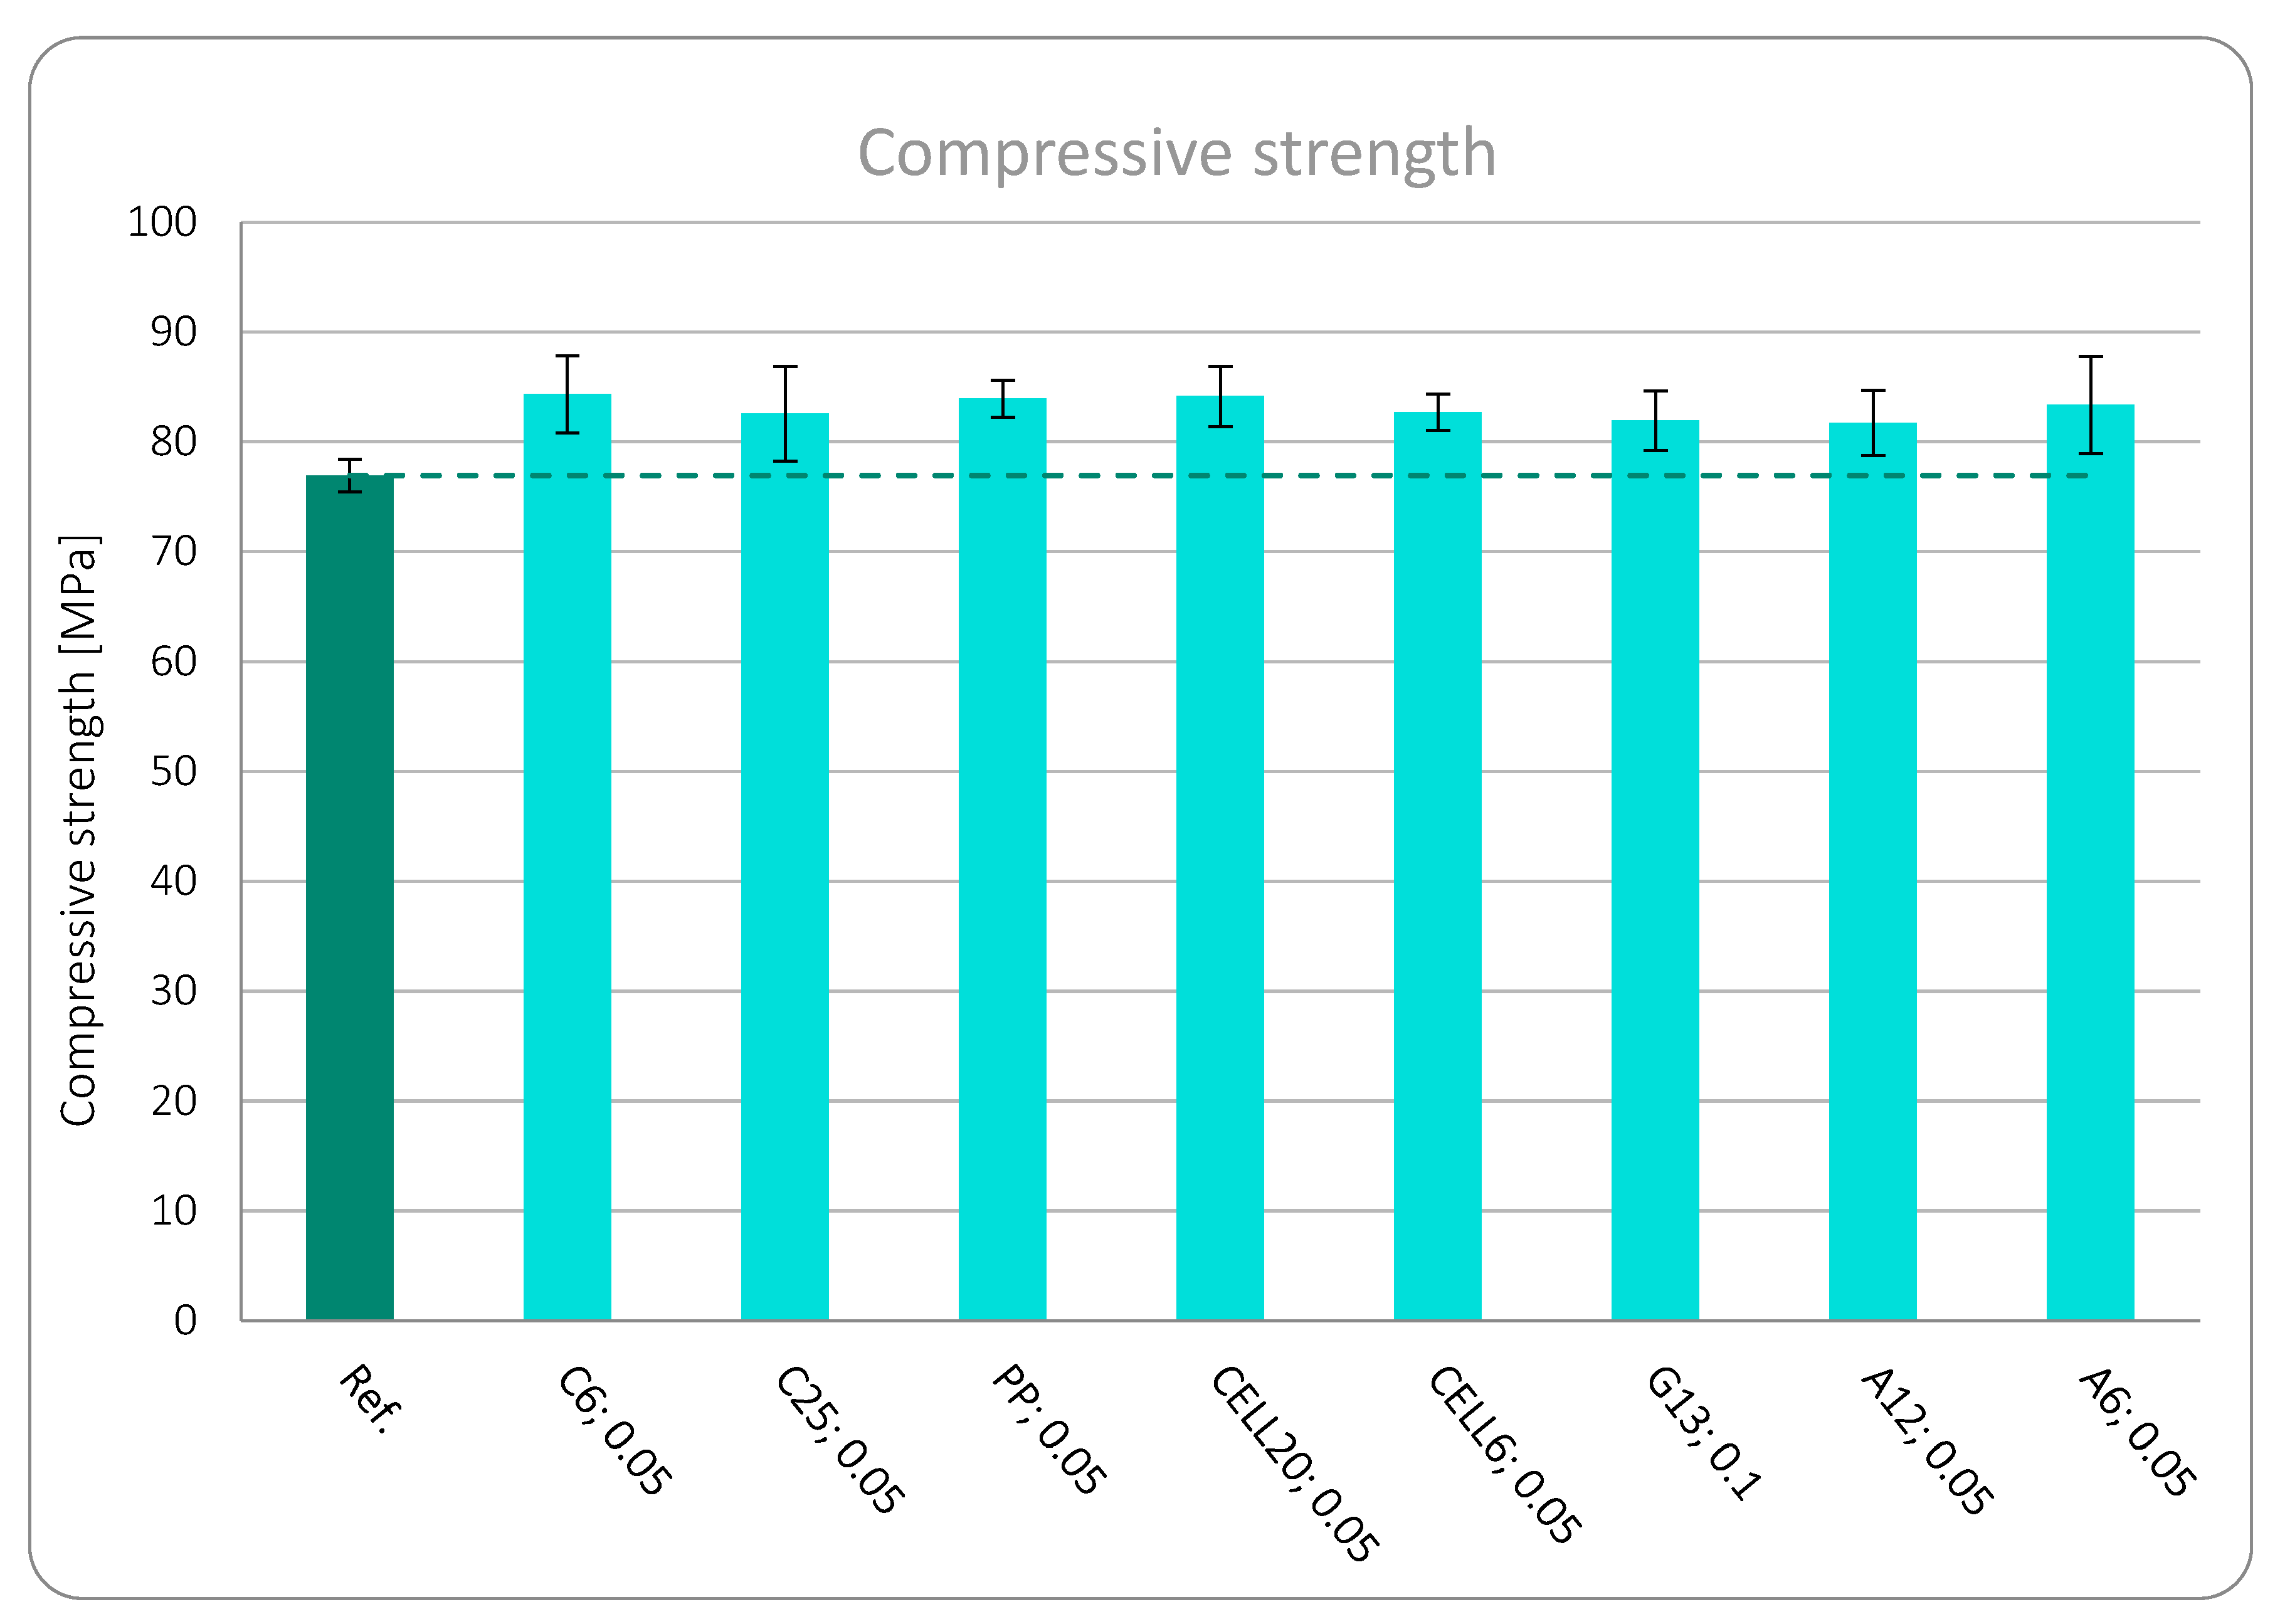
The results of the compressive strength at 28 days of the different mixtures in which the different types of fibers were incorporated are shown in Figure 10 below. The results show a significant difference (p = 0.000) with respect to reference samples, showing an average increase of 7.98%. Carbon fiber mortar of 6 mm length (C6; 0.05) shows the highest increment, 9.59%, while A12;0.05 (aramid fiber mortar of 12 mm length) shows the lowest increment in compressive strength. It is worth mentioning that cellulose fibers of 20 mm length reached an increment of 9.37%, showing a better performance than cellulose fibers of 6 mm. This increment somehow contradicts previous experiences by the authors [13], adding fibers to standard mortars, where no significant difference in compressive strength was found.
In these fiber-reinforced high-strength mortars, it seems that the fibers are somehow contributing to laterally confine the movements of samples under compression, which leads to an increase in the maximum principal stress.

3.2.3. Life Cycle Analysis

Table 17 shows the LCA of mortars with fibers. Individual impacts of each mortar with fibers measured in each category impact unit are shown, and also the normalized and weighted impacts using dimensional units (Points) are shown. The lowest values correspond to mortars containing cellulose fibers (1.365 ∙ 102 points), while the highest LCA is linked to mortars containing aramid fibers (1.556 ∙ 102 points), which represent an increment of 13%. Thus, even though the amount of aramid fiber added is very low (less than 0.05% of weight), it has a relatively significant impact on an LCA.

3.2.4. Cost

Table 18 shows the cost of mortars including fibers. Reference mortar represents a mortar without fibers, containing CemI 42.5 R with the same dosage as what so called “42.5” of Table 18. The more expensive mortars were the ones containing aramid fibers, while the cheapest ones were those containing cellulose fibers.

3.2.5. Multi-Criteria Decision-Making Analysis

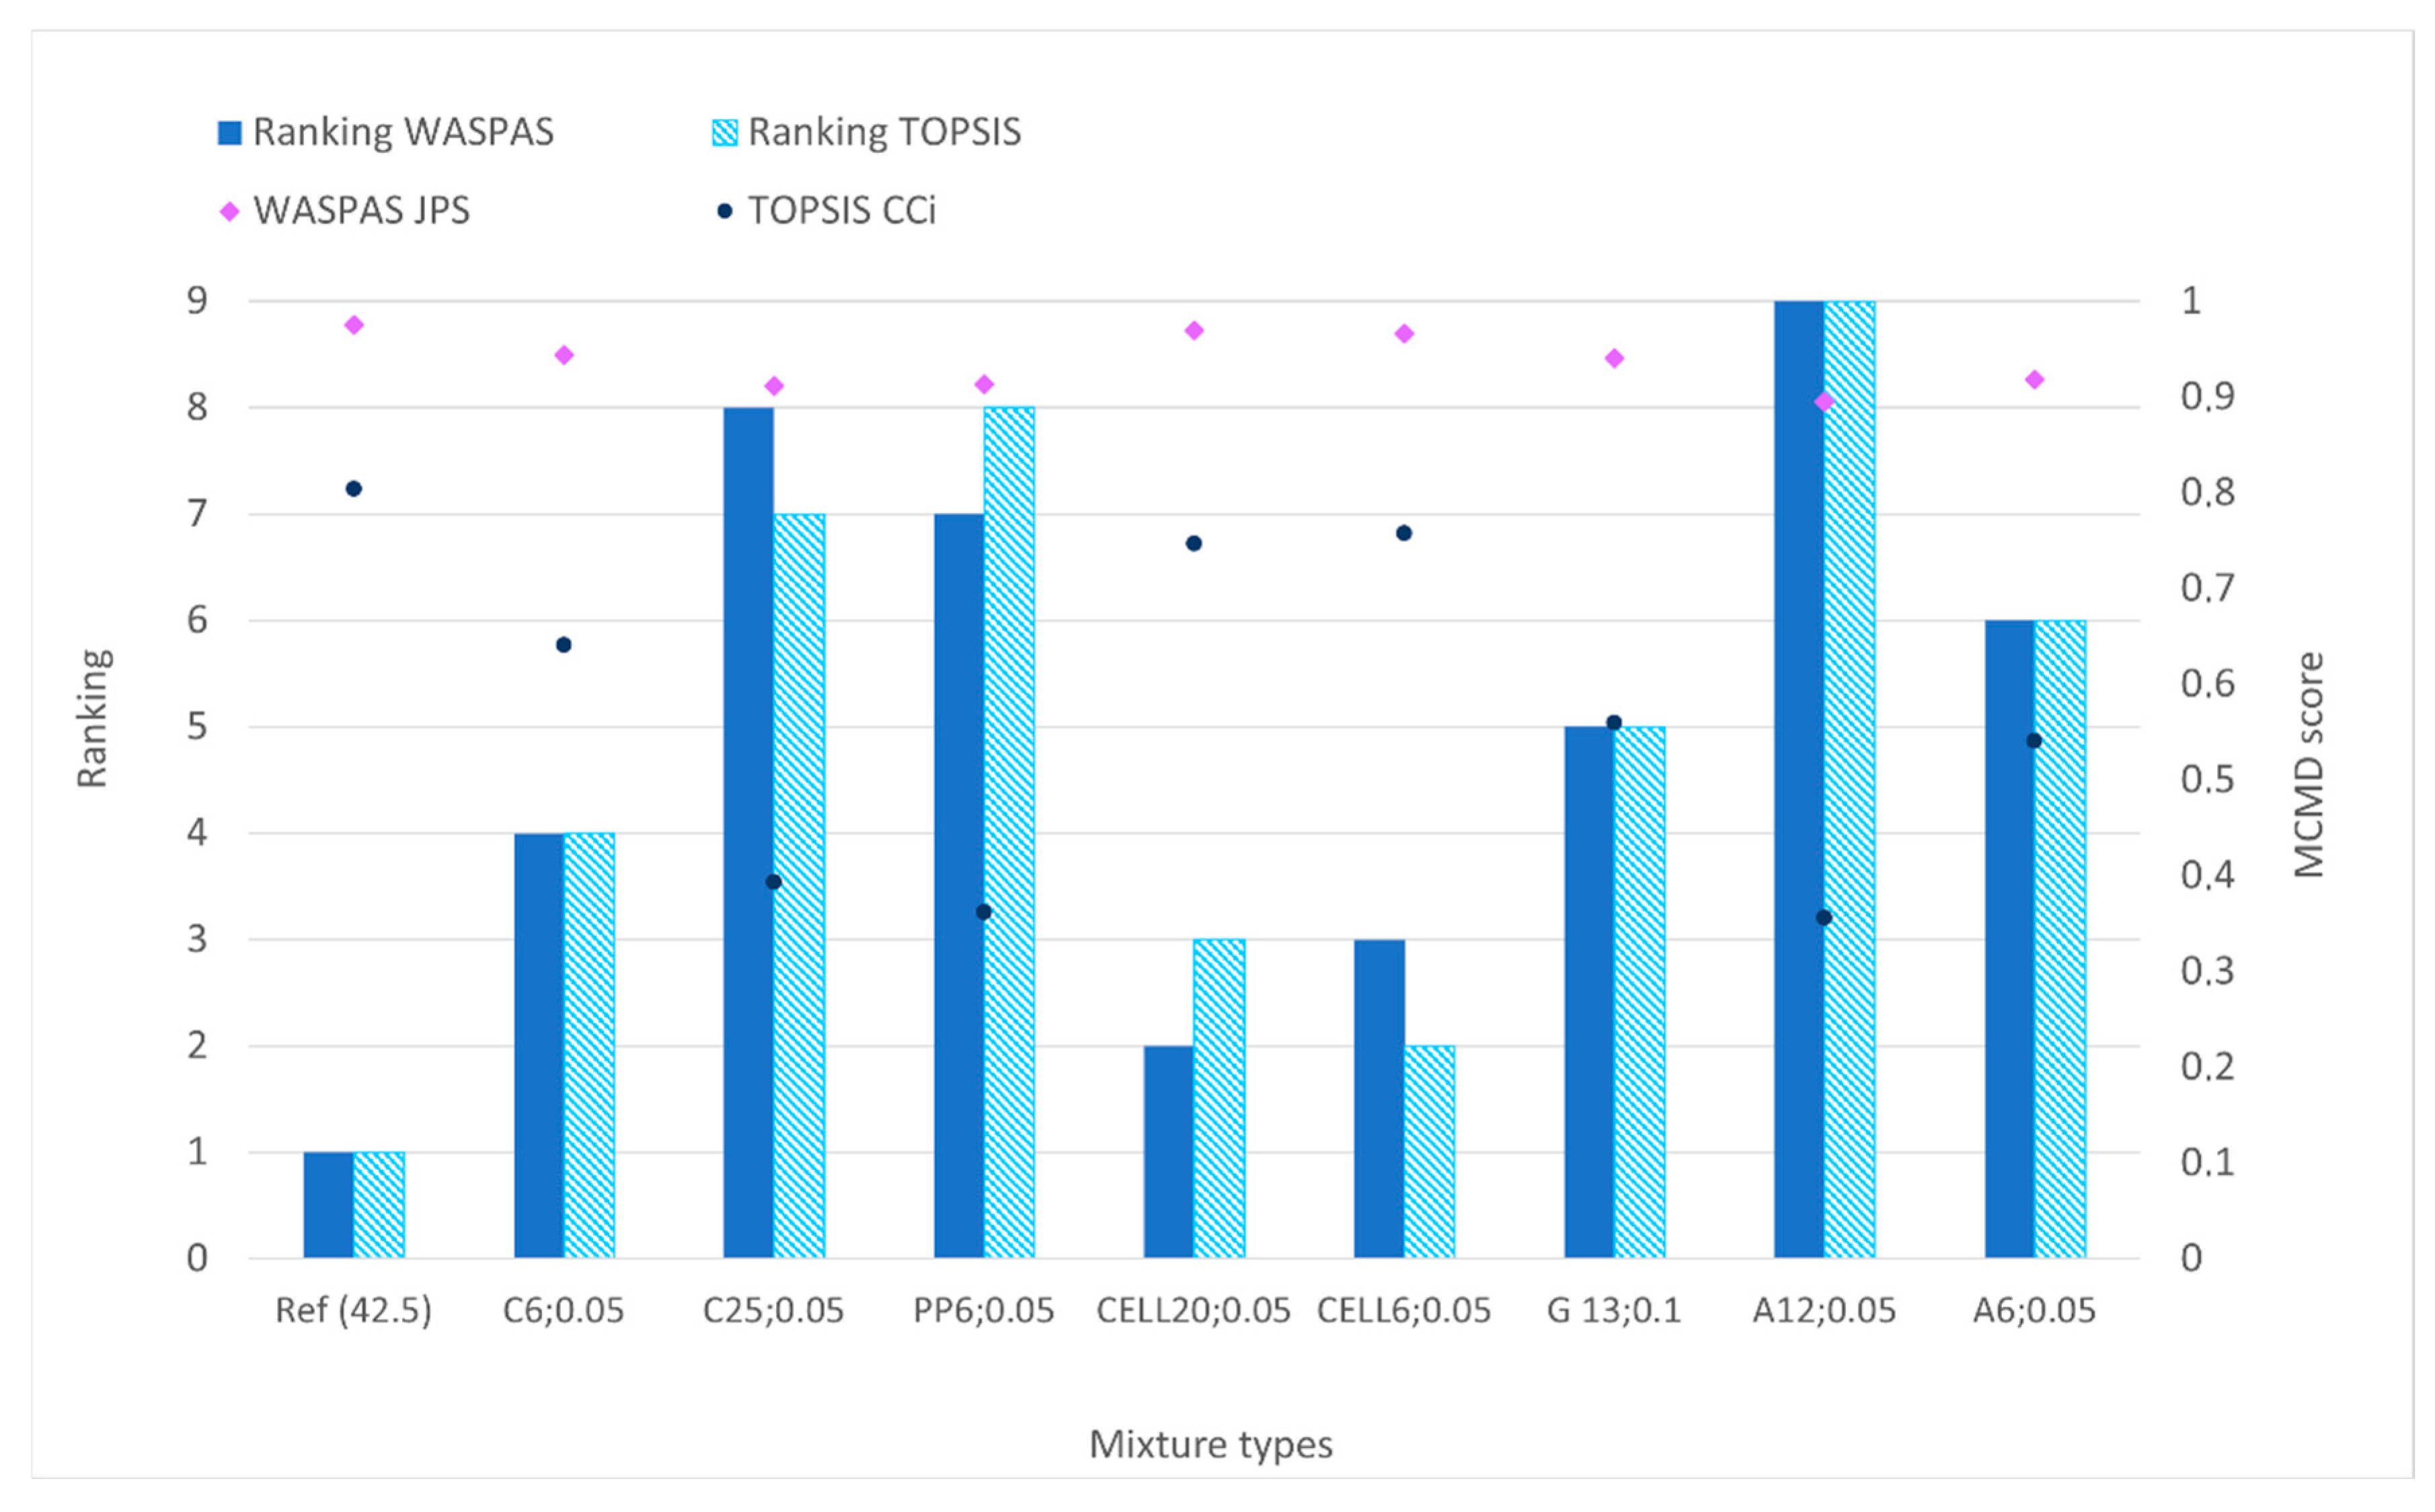
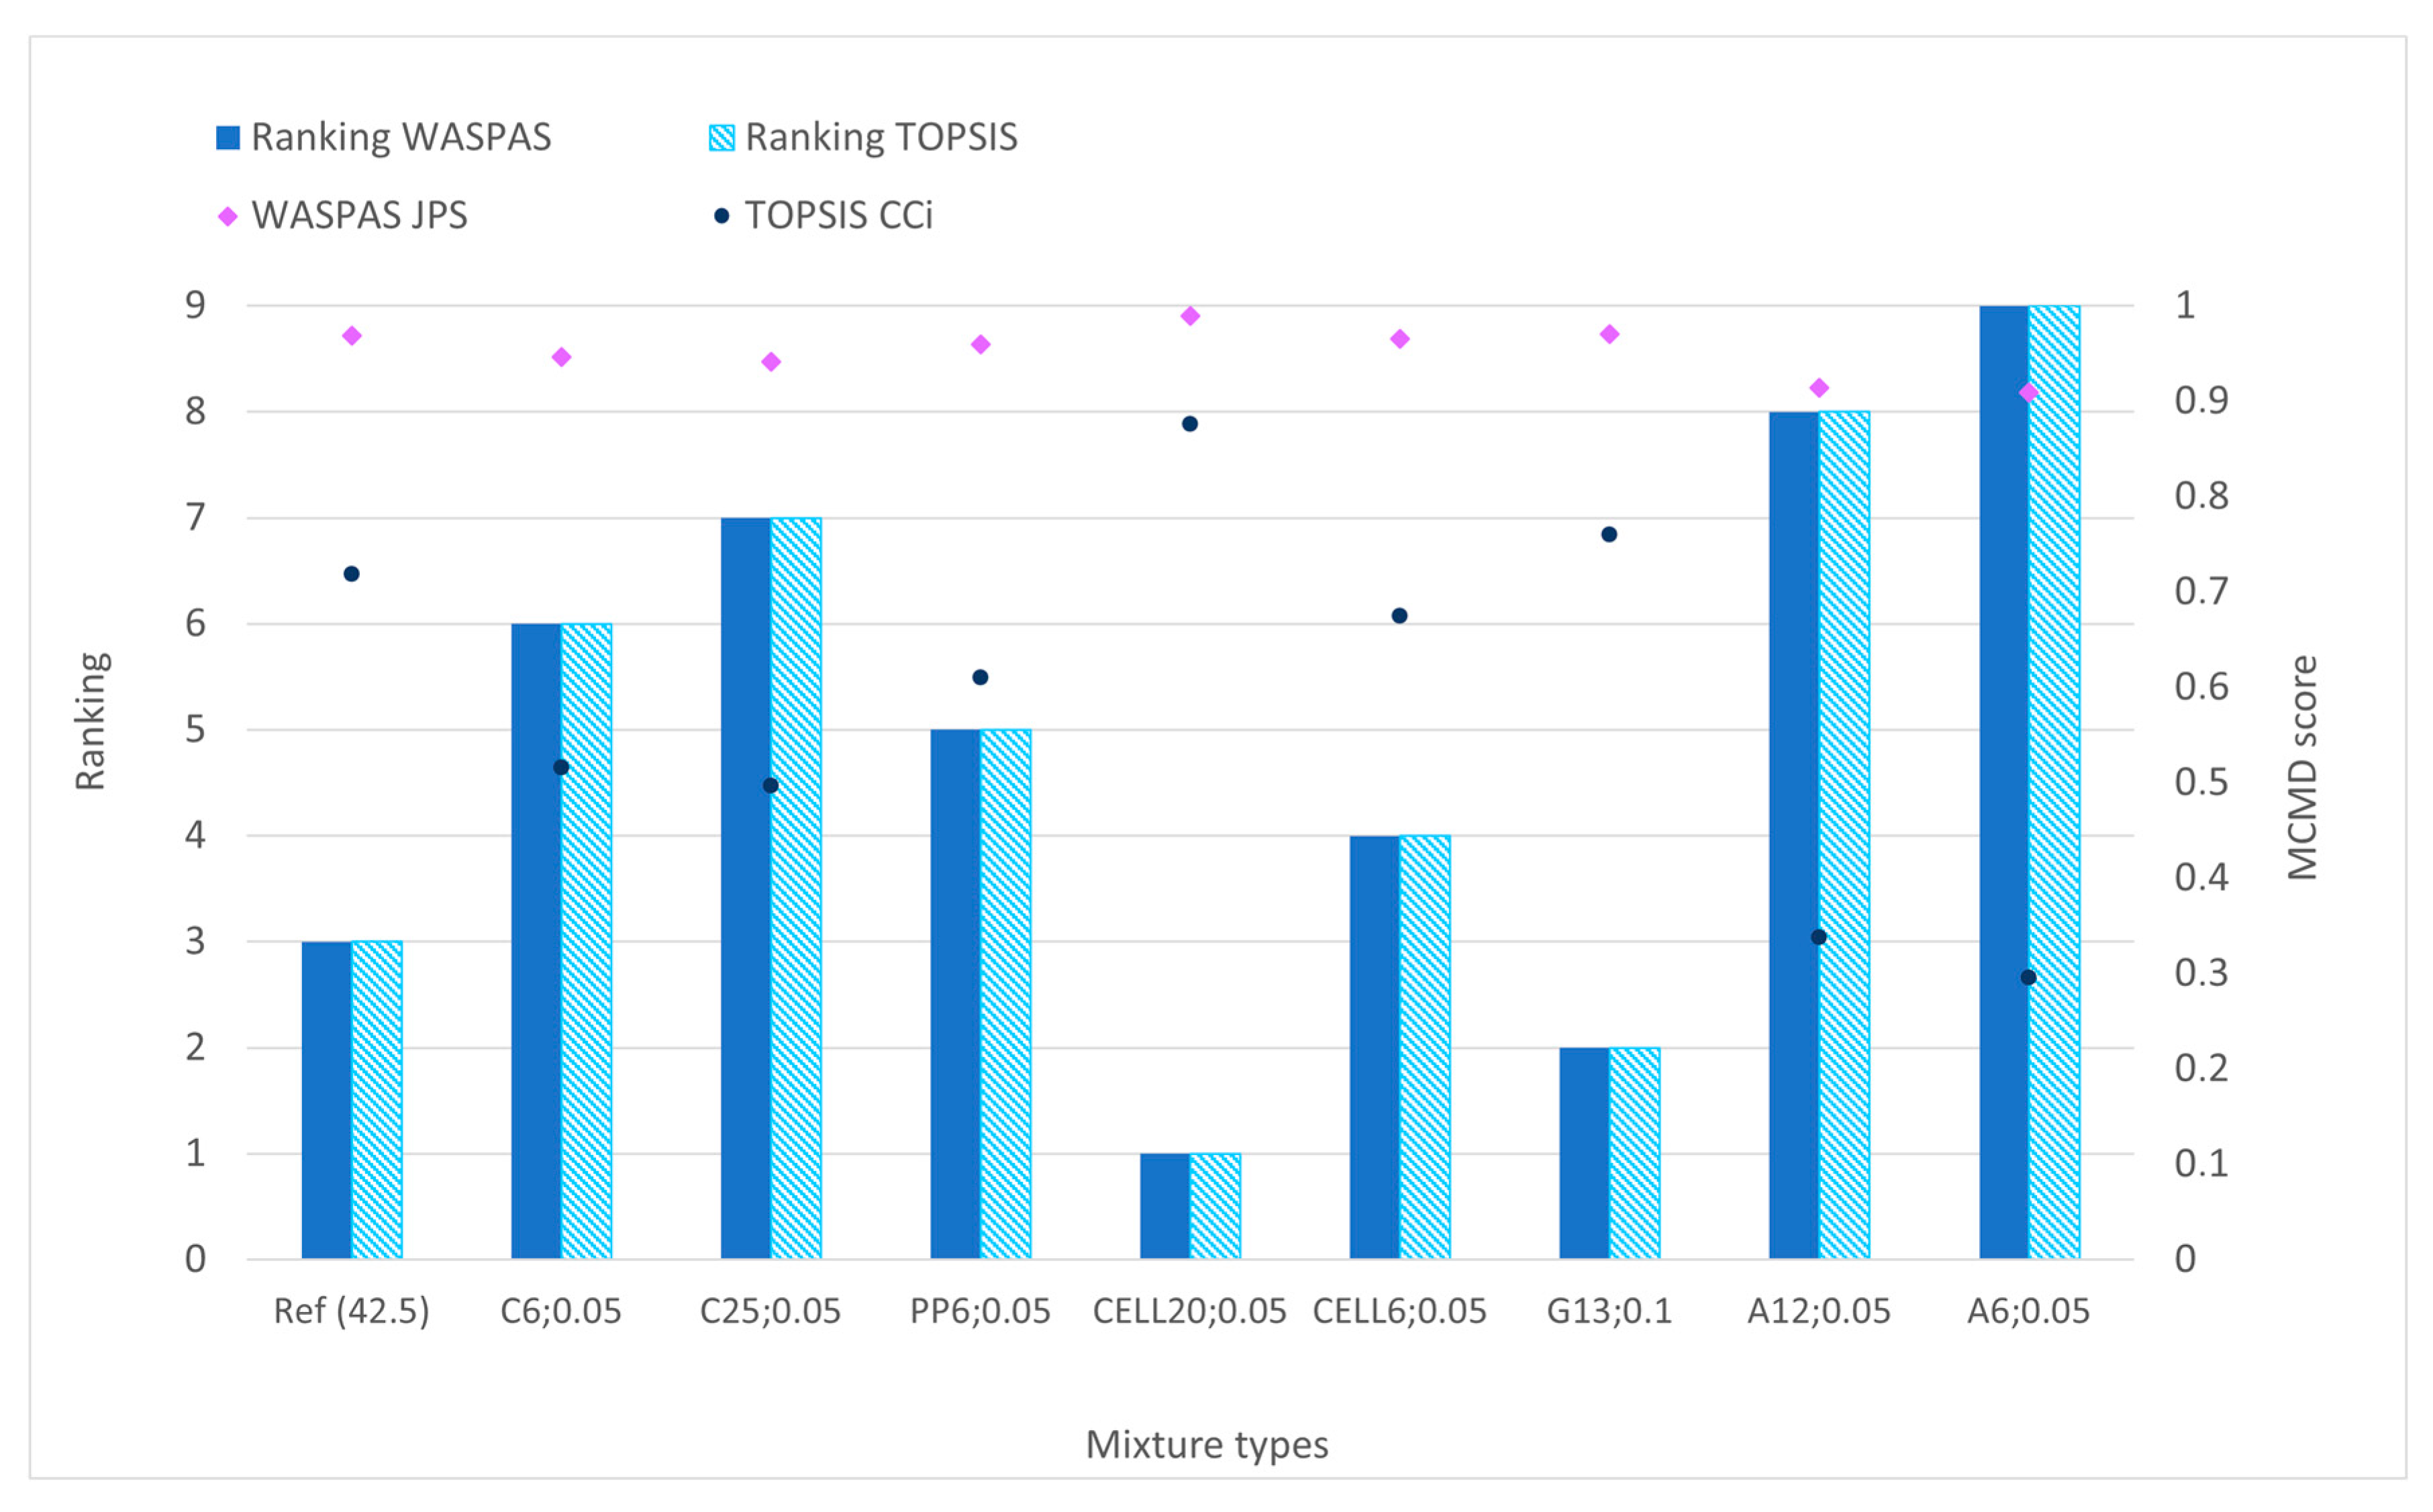
Table 19 presents the decision-making matrix, which evaluates the alternatives based on the defined criteria. As outlined in the methodology, equal weights have been assigned to each of the five criteria. Figure 11 shows the results of the MDMA analysis for mortars with fibers.

3.2.6. Discussion

Figure 11 represents the ranking of the different alternatives of mortars with fibers, including the reference mortar without fibers. Regarding the input data considered and the equal weights, it is worth mentioning that the best alternative is the reference mortar (mortar without fibers). This is mainly due to the negative influence of adding fibers in terms of printability.
Nevertheless, if we analyzed the mortars with fibers, the best mortars are those containing cellulose fibers of 20 mm, CELL20; 0.05, which ranked in the second or third position, depending on whether WASPAS or TOPSIS was used. This is due to the fact that cost and LCA hardly increase with respect to the reference mortar (no fibers); nevertheless, it is able to increase the compressive strength by up to 9% with respect to the sample without fibers (Ref(“42.5”)).
From a practical point of view, adding cellulose fibers could be recommendable since it hardly increases the cost or environmental impact of a 3DP mortar, although it contributes to a slight increment in the compressive strength (up to 9%). Although it was not measured in this research paper, they could also contribute to increasing toughness in an eventual failure. Even though adding fibers makes the printability a bit more difficult, this can still be undertaken. Indeed, if an MCDMA is undertaken without considering the “printability index” as a criterion (Figure 12), but only the other four criteria (flexural strength, compressive strength, cost, LCA), then CELL20; 0.05 is ranked the first, G13; 0.1 the second, and Ref. (“42.5”) is the third best option.
The cost of producing a mortar containing Cem I 42.5 and 0.05% of 20 mm cellulose fibers is 91.85 EUR/T, and its carbon footprint would be 284 kg CO2 eq/T. Assuming an average density of 2.1 T/m3, the cost would be 192.89 EUR/m3 and its carbon footprint would be 596.4 kg CO2 eq/m3. The flexural strength of this dosage at 28 days was 12.80 MPa, and 84.16 MPa for the compression strength. These results demonstrated a much better performance in strength, cost, and environmental impact of this mortar with respect to the one developed by Rajendran et al. [27], where a 7.2 MPa flexural strength, 61 MPa compression strength, a material cost of 423 USD/m3, and 1704.81 kg eq CO2/m3 of carbon footprint were reported.

4. Conclusions

In relation to the study undertaken, the main conclusions are summarized below:
  • Regarding the rheological behavior, using Cem I 52.5 makes the printability difficult since it tends to set too fast, so it is not considered adequate for 3D printing purposes. Mortar with Cem I 42.5 and no fly ash shows a good mechanical performance (up to 77 MPa of compression strength at 28 days) and a sufficient workability window to be used in high-performance 3DP applications. Adding fly ash did not show an increase in the mechanical properties in any of the mortars, although it slightly reduced their cost. Nevertheless, the MCDMA demonstrated that the optimal mortar with fibers was the one with Cem I 42.5 without fly ash.
  • Adding fibers to mortars always makes the printability process difficult. Nevertheless, they can increase the compressive strength of the mortar to almost around 9% in the case of cellulose fibers of 20 mm length without compromising either the cost or the environmental impact of the mortar.
  • The flexural strength of the mortar, in the particular case of high-strength mortars, is not significantly affected by adding fibers; however, these could have a potential impact on its toughness, which should be further explored.
  • The rest of the fibers (glass, carbon, aramid, polypropylene) are not considered adequate for high-performance 3D-printed mortars, at least for the 3D printer used, since they do not increase its strength considerably while increasing cost and environmental impact.
As an overall conclusion, it could be stated that cellulose fibers of 20 mm length should be considered as potential mechanical enhancers in 3D printing high-performance mortars since (1) their cost and environmental impact is mostly negligible, (2) they increase the compressive strength to up to 9% for 0.05% fiber content (expressed in weight), (3) the mortar can still be 3D-printed, and (4) they could increase its toughness.
From a practical point of view, the formulations presented here, especially that containing Cem I 42.5 and 0.05% of cellulose fibers of 20 mm, could be easily produced by companies that are providers of concrete/mortar 3D printing services. Furthermore, this mortar could also be considered for casting applications, either for in situ construction or for the pre-cast industry. In the particular case of casting, the amount of fiber could be increased, which might also involve a higher increase in its strength (or a reduction in the amount of cement used to maintain the same strength, which implies reducing the cost and environmental impact). In this case, the limitations in workability are not as strict as in 3D-printed mortars or concretes, so a higher percentage of cellulose fibbers is acceptable for casting applications. However, in either 3D printing or cast applications, it will also be necessary to evaluate the durability of mortars containing cellulose fibers under different environments.

Author Contributions

Conceptualization, S.A.-C. and E.B.-F.; methodology, S.A.-C., E.B.-F., E.C.-A., I.I.-V. and J.S.-A.; formal analysis, S.A.-C., E.B.-F. and I.I.-V.; investigation, S.A.-C. and E.B.-F.; writing—original draft preparation, S.A.-C. and E.B.-F.; writing—review and editing, S.A.-C. and E.B.-F.; supervision, S.A.-C. and E.B.-F. All authors have read and agreed to the published version of the manuscript.

Funding

This research has received funding by the Spanish Ministry of Science and Innovation through four grants: (1) “Promotion of activity in R+D of GITECO and GCS groups of the Universidad de Cantabria” (Ref: SSPJO1900I001723XV0); (2) “Fostering the circular economy and low CO2 technologies through the additive manufacturing-3DCircle” (Ref: PID2020-112851RA-I00); (3) “Enhancing biodiversity in the Atlantic area through sustainable artificial reefs -EBASAR-“ (Ref: TED2021-129532B-I00); (4) “Holistic approach to foster circular and resilient transport infrastructures and support the deployment of green and innovation public procurement and innovative engineering practices -CIRCUIT- “ (Ref: HORIZON-CL5-2022-D6-02 No.101104283).

Data Availability Statement

The original contributions presented in this study are included in the article. Further inquiries can be directed to the corresponding author.

Acknowledgments

The authors would like to thank the following companies for their contributions: Cementos Portland Valderribas S.A. for providing the cement, Solvay for providing the fly ash, Basf Chemicals Ltd. and BECSA for providing additives, Teijin Ltd. for providing various types of fibers (aramid and carbon), Fibratec Técnicas de la Fibra S.L for providing the glass fibers and Textil Santanderina S.A. for providing the cellulose fibers.

Conflicts of Interest

The authors declare no conflicts of interest.

Correction Statement

This article has been republished with a minor correction to the Data Availability Statement. This change does not affect the scientific content of the article.

References

  1. Feucht, T.; Waldschmitt, B.; Lange, J.; Erven, M. 3D-Printing with Steel: Additive Manufacturing of a Bridge in situ. Ce/papers 2021, 4, 1695–1701. [Google Scholar] [CrossRef]
  2. Salet, T.A.M.; Ahmed, Z.Y.; Bos, F.P.; Laagland, H.L.M. Design of a 3D printed concrete bridge by testing. Virtual Phys. Prototyp. 2018, 13, 222–236. [Google Scholar] [CrossRef]
  3. Afolabi, A.O.; Ojelabi, R.A.; Omuh, I.O.; Tunji-Olayeni, P.F. 3D House Printing: A sustainable housing solution for Nigeria’s housing needs. J. Phys. Conf. Ser. 2019, 1299, 12012. [Google Scholar] [CrossRef]
  4. Bazli, M.; Ashrafi, H.; Rajabipour, A.; Kutay, C. 3D printing for remote housing: Benefits and challenges. Autom. Constr. 2023, 148, 104772. [Google Scholar] [CrossRef]
  5. Buswell, R.A.; de Silva, W.R.L.; Jones, S.Z.; Dirrenberger, J. 3D printing using concrete extrusion: A roadmap for research. Cem. Concr. Res. 2018, 112, 37–49. [Google Scholar] [CrossRef]
  6. Marchment, T.; Sanjayan, J. Bond properties of reinforcing bar penetrations in 3D concrete printing. Autom. Constr. 2020, 120, 103394. [Google Scholar] [CrossRef]
  7. Gomaa, S.; Irizarry, E.M.; Ahmed, A.; Rosa, R.M.; Ahmed, H.; Burroughs, J.; Kreiger, E.; Liu, J.; Troemner, M.; Cusatis, G. 3D printing of ultra-high-performance concrete: Shape stability for various printing systems. Constr. Build. Mater. 2024, 456, 139039. [Google Scholar] [CrossRef]
  8. Zhou, Y.; Jiang, D.; Sharma, R.; Xie, Y.M.; Singh, A. Enhancement of 3D printed cementitious composite by short fibers: A review. Constr. Build. Mater. 2023, 362, 129763. [Google Scholar] [CrossRef]
  9. Arunothayan, A.R.; Nematollahi, B.; Khayat, K.H.; Ramesh, A.; Sanjayan, J.G. Rheological characterization of ultra-high performance concrete for 3D printing. Cem. Concr. Compos. 2023, 136, 104854. [Google Scholar] [CrossRef]
  10. Sun, H.-Q.; Zeng, J.-J.; Hong, G.-Y.; Zhuge, Y.; Liu, Y.; Zhang, Y. 3D-printed functionally graded concrete plates: Concept and bending behavior. Eng. Struct. 2025, 327, 119551. [Google Scholar] [CrossRef]
  11. Singh, A.; Liu, Q.; Xiao, J.; Lyu, Q. Mechanical and macrostructural properties of 3D printed concrete dosed with steel fibers under different loading direction. Constr. Build. Mater. 2022, 323, 126616. [Google Scholar] [CrossRef]
  12. Pham, L.; Tran, P.; Sanjayan, J. Steel fibres reinforced 3D printed concrete: Influence of fibre sizes on mechanical performance. Constr. Build. Mater. 2020, 250, 118785. [Google Scholar] [CrossRef]
  13. Alonso-Cañon, S.; Blanco-Fernandez, E.; Castro-Fresno, D.; Yoris-Nobile, A.I.; Castanon-Jano, L. Comparison of reinforcement fibers in 3D printing mortars using multi-criteria analysis. Int. J. Adv. Manuf. Technol. 2024, 134, 1463–1485. [Google Scholar] [CrossRef]
  14. Hambach, M.; Möller, H.; Volkmer, T.N.D. Portland cement paste with aligned carbon fibers exhibiting exceptionally high flexural strength. Cem. Concr. Res. 2016, 89, 80–86. [Google Scholar] [CrossRef]
  15. Korniejenko, K.; Łach, M.; Chou, S.-Y.; Lin, W.-T.; Cheng, A.; Hebdowska-Krupa, M.; Gądek, S.; Mikuła, J. Mechanical Properties of Short Fiber-Reinforced Geopolymers Made by Casted and 3D Printing Methods: A Comparative Study. Materials 2020, 13, 579. [Google Scholar] [CrossRef]
  16. Panda, B.; Paul, S.C.; Tan, M.J. Anisotropic mechanical performance of 3D printed fiber reinforced sustainable construction material. Mater. Lett. 2017, 209, 146–149. [Google Scholar] [CrossRef]
  17. Chu, S.H.; Li, L.G.; Kwan, A.K.H. Development of extrudable high strength fiber reinforced concrete incorporating nano calcium carbonate. Addit. Manuf. 2021, 37, 101617. [Google Scholar] [CrossRef]
  18. Yu, K.; McGee, W.; Ng, T.Y.; Zhu, H.; Li, V.C. 3D-printable engineered cementitious composites (3DP-ECC): Fresh and hardened properties. Cem. Concr. Res. 2021, 143, 106388. [Google Scholar] [CrossRef]
  19. Sun, X.; Zhou, J.; Wang, Q.; Shi, J.; Wang, H. PVA fibre reinforced high-strength cementitious composite for 3D printing: Mechanical properties and durability. Addit. Manuf. 2022, 49, 102500. [Google Scholar] [CrossRef]
  20. Hambach, M.; Volkmer, D. Properties of 3D-printed fiber-reinforced Portland cement paste. Cem. Concr. Compos. 2017, 79, 62–70. [Google Scholar] [CrossRef]
  21. Nematollahi, B.; Vijay, P.; Sanjayan, J.; Nazari, A.; Xia, M.; Naidu Nerella, V.; Mechtcherine, V. Effect of polypropylene fibre addition on properties of geopolymers made by 3D printing for digital construction. Materials 2018, 11, 2352. [Google Scholar] [CrossRef]
  22. Zeng, J.-J.; Hu, X.; Sun, H.-Q.; Liu, Y.; Chen, W.-J.; Zhuge, Y. Triaxial compressive behavior of 3D printed PE fiber-reinforced ultra-high performance concrete. Cem. Concr. Compos. 2025, 155, 105816. [Google Scholar] [CrossRef]
  23. Zat, T.; Schuster, S.L.; Duarte, E.S.; De Freitas Daudt, N.; Cruz, R.C.D.; Rodríguez, E.D. Rheological properties of high-performance concrete reinforced with microfibers and their effects on 3D printing process. J. Build. Eng. 2025, 105, 112406. [Google Scholar] [CrossRef]
  24. Cho, E.; Gwon, S.; Cha, S.; Shin, M. Impact of accelerator on rheological properties of cement composites with cellulose microfibers: 3D printing perspective. J. Build. Eng. 2025, 106, 112538. [Google Scholar] [CrossRef]
  25. Mohan, M.K.; Rahul, A.V.; van Dam, B.; Zeidan, T.; De Schutter, G.; Van Tittelboom, K. Performance criteria, environmental impact and cost assessment for 3D printable concrete mixtures. Resour. Conserv. Recycl. 2022, 181, 106255. [Google Scholar] [CrossRef]
  26. Yu, Q.; Zhu, B.; Li, X.; Meng, L.; Cai, J.; Zhang, Y.; Pan, J. Investigation of the rheological and mechanical properties of 3D printed eco-friendly concrete with steel slag. J. Build. Eng. 2023, 72, 106621. [Google Scholar] [CrossRef]
  27. Rajendran, N.; Runge, T.; Bergman, R.; Nepal, P.; Ali, S.D.; Al Fahim, A.; Moradllo, M.K. Economic and environmental impact analysis of cellulose nanocrystal-reinforced cementitious mixture in 3D printing. Resour. Conserv. Recycl. 2025, 218, 108252. [Google Scholar] [CrossRef]
  28. Zhang, D.; Yu, J.; Wu, H.; Jaworska, B.; Ellis, B.R.; Li, V.C. Discontinuous micro-fibers as intrinsic reinforcement for ductile Engineered Cementitious Composites (ECC). Compos. Part B Eng. 2020, 184, 107741. [Google Scholar] [CrossRef]
  29. Ramezanianpour, A.A.; Esmaeili, M.; Ghahari, S.A.; Najafi, M.H. Laboratory study on the effect of polypropylene fiber on durability, and physical and mechanical characteristic of concrete for application in sleepers. Constr. Build. Mater. 2013, 44, 411–418. [Google Scholar] [CrossRef]
  30. Alonso-Cañon, S.; Alonso-Estébanez, A.; Brunčič, A.; Blanco-Fernandez, E.; Castanon-Jano, L. Rheological parameter ranges for 3D printing sustainable mortars using a new low-cost rotational rheometer. Int. J. Adv. Manuf. Technol. 2025, 1–17. [Google Scholar] [CrossRef]
  31. Lanos, C.; Estellé, P. Vers une réelle rhéométrie adaptée aux bétons frais. Rev. Eur. Génie Civ. 2009, 13, 457–471. [Google Scholar] [CrossRef]
  32. Estellé, P.; Lanos, C.; Perrot, A. Processing the Couette viscometry data using a Bingham approximation in shear rate calculation. J. Nonnewton Fluid. Mech. 2008, 154, 31–38. [Google Scholar] [CrossRef]
  33. Estellé, P.; Lanos, C.; Perrot, A.; Amziane, S. Processing the vane shear flow data from Couette analogy. Appl. Rheol. 2008, 18, 34037-1–34037-6. [Google Scholar] [CrossRef]
  34. Yoris-Nobile, A.I.; Lizasoain-Arteaga, E.; Slebi-Acevedo, C.J.; Blanco-Fernandez, E.; Alonso-Cañon, S.; Indacoechea-Vega, I.; Castro-Fresno, D. Life cycle assessment (LCA) and multi-criteria decision-making (MCDM) analysis to determine the performance of 3D printed cement mortars and geopolymers. J. Sustain. Cem. Based Mater. 2022, 12, 609–626. [Google Scholar] [CrossRef]
  35. EN 196-1:2016; Methods of Testing Cement. Part 1: Determination of Strength. CEN-European Committee for Standardiztion: Brussels, Belgium, 2016.
  36. Wang, C.; Chen, B.; Vo, T.L.; Rezania, M. Mechanical anisotropy, rheology and carbon footprint of 3D printable concrete: A review. J. Build. Eng. 2023, 76, 107309. [Google Scholar] [CrossRef]
  37. Yoris-Nobile, A.I. Manufacture of Artificial Reefs by 3D Printing Using Sustainable Mortars. Ph.D. Thesis, Universidad de Cantabria, Santander, Spain, 2023. Available online: https://hdl.handle.net/10902/28426 (accessed on 1 September 2023).
  38. Zavadskas, E.K.; Turskis, Z.; Antucheviciene, J.; Zakarevicius, A. Optimization of weighted aggregated sum product assessment. Elektron. Ir Elektrotechnika 2012, 122, 3–6. [Google Scholar] [CrossRef]
  39. Mardani, A.; Nilashi, M.; Zakuan, N.; Loganathan, N.; Soheilirad, S.; Saman, M.Z.M.; Ibrahim, O. A systematic review and meta-Analysis of SWARA and WASPAS methods: Theory and applications with recent fuzzy developments. Appl. Soft. Comput. 2017, 57, 265–292. [Google Scholar] [CrossRef]
  40. Hwang, C.-L.; Yoon, K. Multiple Attribute Decision Making. In Methods and Applications A State-of-the-Art Survey; Springer: Berlin/Heidelberg, Germany, 1981. [Google Scholar]
  41. Salih, M.M.; Zaidan, B.B.; Zaidan, A.A.; Ahmed, M.A. Survey on fuzzy TOPSIS state-of-the-art between 2007 and 2017. Comput. Oper. Res. 2019, 104, 207–227. [Google Scholar] [CrossRef]
  42. Safiuddin, M.; Abdel-Sayed, G.; Hearn, N. Flexural and Impact Behaviors of Mortar Composite Including Carbon Fibers. Materials 2022, 15, 1657. [Google Scholar] [CrossRef]
  43. Park, J.-G.; Seo, D.-J.; Heo, G.-H. Impact Resistance and Flexural Performance Properties of Hybrid Fiber-Reinforced Cement Mortar Containing Steel and Carbon Fibers. Appl. Sci. 2022, 12, 9439. [Google Scholar] [CrossRef]
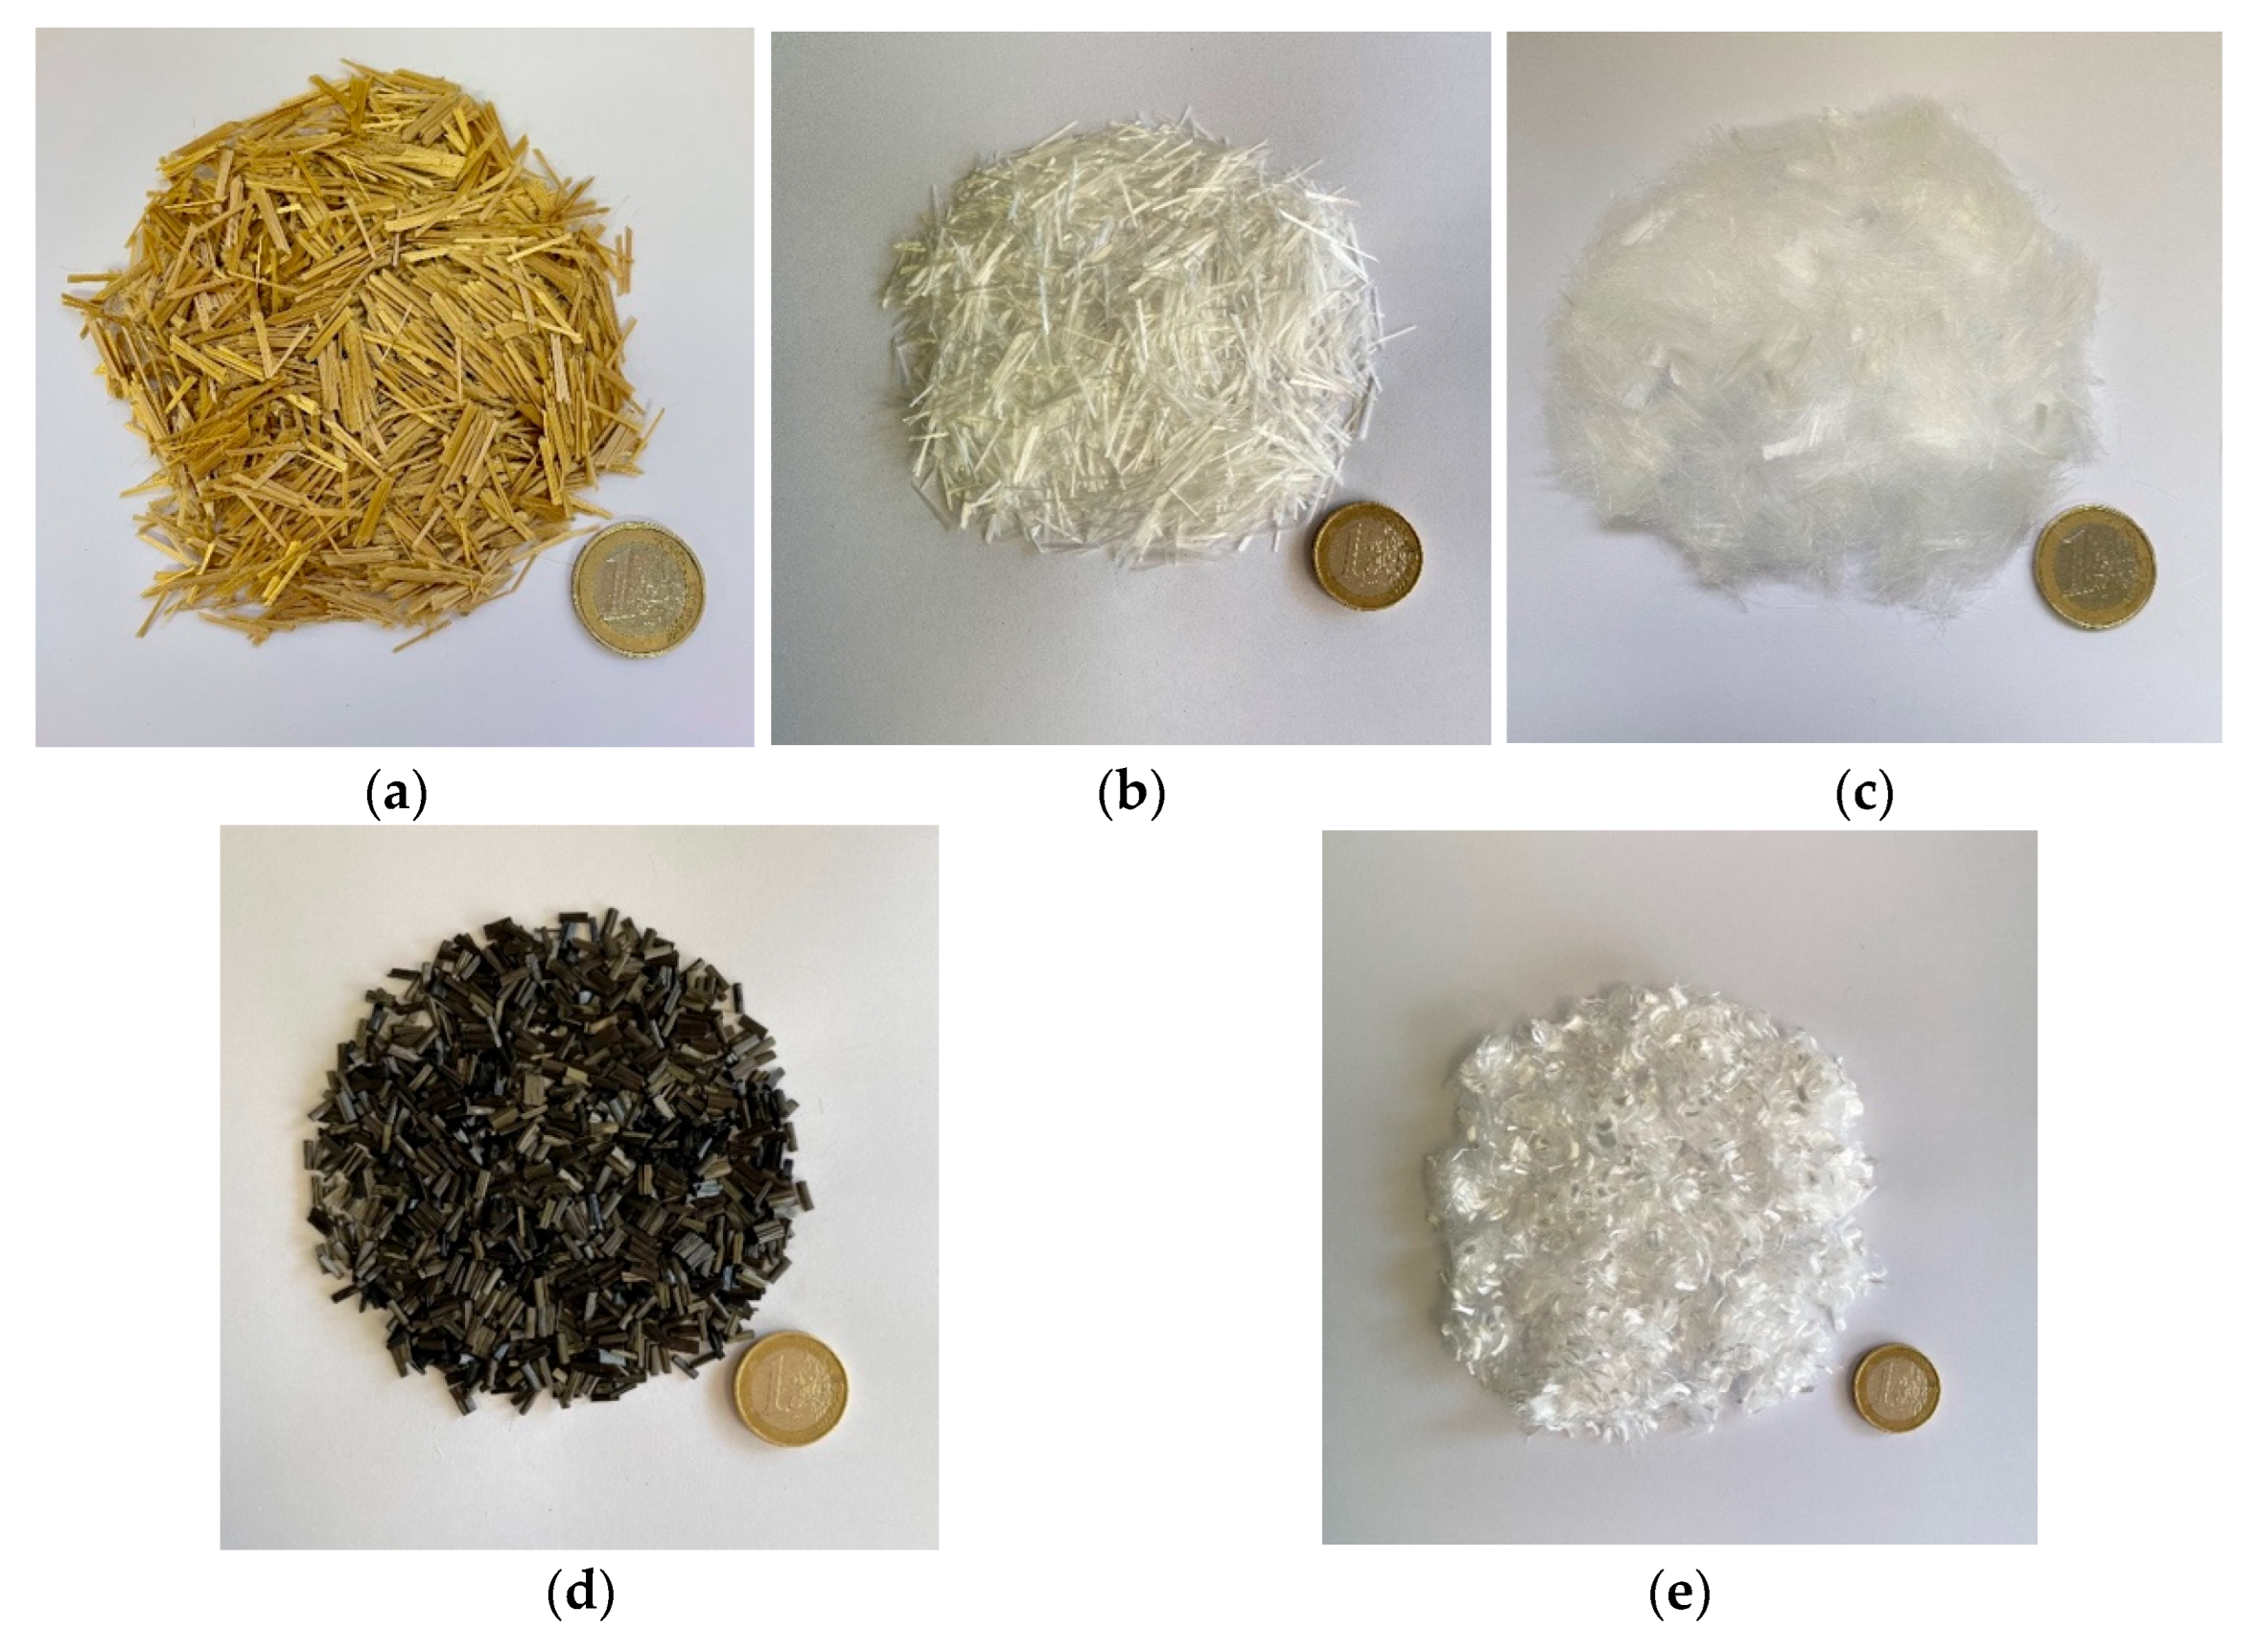
Figure 1. Fibers used. (a) Aramid fibers; (b) glass fibers; (c) cellulose fibers; (d) carbon fibers; (e) polypropylene fibers.
Buildings 15 03307 g001
Figure 2. Rheometer developed at UC.
Buildings 15 03307 g002
Figure 3. Rotational speed profile.
Buildings 15 03307 g003
Figure 4. Flexural test (left); compression test (right).
Buildings 15 03307 g004
Figure 5. Prismatic samples after flexural test (left) and compression test (right). Mortars with PP fibers.
Buildings 15 03307 g005
Figure 6. Flexural strength of mortars without fibers.
Buildings 15 03307 g006
Figure 7. Compressive strength of mortars without fibers.
Buildings 15 03307 g007
Figure 8. MCDMA results: mortars without fibers.
Buildings 15 03307 g008
Figure 9. Flexural strength of mortars with fibers.
Buildings 15 03307 g009
Figure 10. Compressive strength of mortars with fibers.
Buildings 15 03307 g010
Figure 11. MCDMA results: mortars with fibers.
Buildings 15 03307 g011
Figure 12. MCDMA results: mortars with fibers (excluding the “printability index” criteria).
Buildings 15 03307 g012
Table 1. Mixture proportions (ratios expressed in weight of cement).
MixturesCement
Type
Limestone AggregateWaterMastersure 950Masterease 5025Fly AshMS 610
42.5-FACEM I 42.5 R20.40.00830.00760.20.1
42.5CEM I 42.5 R20.40.00830.0076-0.1
52.5-FACEM I 52.5 R20.40.00860.00780.20.1
52.5CEM I 52.5 R20.40.00850.0079-0.1
Table 2. Physical properties and composition of the fibers [13].
TypeColorLength [mm]Diameter [μm]Density [g/cm3]Tensile Strength [MPa]Modulus [GPa]Elongation [%]
AramidNon-bundled short cutGold6211.393200734.3
Non-bundled short cutGold12211.393200734.3
CarbonChopped Black671.842802321.8
Chopped Black2571.7843002341.8
CelluloseRound monofilamentWhite618–480.914603.8515
Round monofilamentWhite2018–480.914603.8515
GlassMultifilamentWhite13.113.52.68162074
PolypropyleneMonofilamentWhite6310.91 1.5
Table 3. Mixture proportions of the mixtures with fibers.
MixturesCement CEM I 42.5 R Limestone AggregateWaterMastersure 950Masterease 5025MS 610Fibers (%)
C6; 0.05120.40.00850.00760.10.05%
C25; 0.05120.40.00850.00760.10.05%
PP 6; 0.05120.40.00850.00760.10.05%
CELL20; 0.05120.40.00850.00760.10.05%
CELL6; 0.05120.40.00850.00760.10.05%
G 13; 0.1120.40.00850.00760.10.1%
A12; 0.05120.40.00850.00760.10.05%
A6; 0.05120.40.00850.00760.10.05%
Table 4. Mixture preparation for Phase 1.
0:00:00Dry materials: cement, aggregates, MasterRoc MS 610, and fly ash;
0:00:15Water gradually added;
0:02:00Superplasticizers Mastersure 950 and MasterEase 5025;
0:06:00Change mixer speed to medium;
0:07:00End of process.
Table 5. Mixture preparation for Phase 2.
0:00:00Dry materials: cement, aggregates, and MasterRoc MS 610;
0:00:15Water gradually added;
0:02:00Superplasticizers Mastersure 950 and MasterEase 5025;
0:03:30Fibers added gradually;
0:05:00Change mixer speed to medium;
0:07:00End of process.
Table 6. Life cycle inventory databases.
MaterialSource
CementCement, Portland [EU without Switzerland] production, cut-off, Ecoinvent
Limestone aggregateLimestone, crushed, washed [CH] production, cut-off, Ecoinvent
WaterTap water [EU without Switzerland] production, conventional treatment, cut-off, Ecoinvent
Fly ashAverage of EPD-IES-0020837 and EPD-S-P-10674
MS610EPD-S-P-05963
Carbon fibersEF Database 3.1: Carbon fiber production [GLO] technology mix, production mix at plant (100% active substance)
Cellulose fiberscellulose fiber {RoW}| market for cellulose fiber | cut-off, U, Ecoinvent v3.10
Glass fibersGlass fiber {GLO}|market for|cut-off, U, Ecoinvent v3.10
Polypropylene fibersPolypropylene, granulate {GLO}|market for|cut-off, U, Ecoinvent v3.10
Aramid fibersEF Database 3.1: Aramid fiber [EU + EFTA + UK] low-temperature solution polymerization of m-phenylene diamine with isophthaloyl chloride
Table 7. Distances from raw material to mortar production.
MaterialDistance (Km)
Cement100
Limestone aggregate50
Water-
Fly ash25
MS610400
Table 8. Cost of materials (except fibers).
MaterialCement CEM I 52.5 RCement CEM I 42.5 RLimestone AggregateFly AshMastersure 950 MasterEase 5025MS 610
Cost (EUR/kg)0.130.120.010.082.632.631.40
Table 9. Cost of fibers.
FibersCarbon CelluloseGlassPolypropyleneAramid
Cost (EUR/kg)26.01.355.8023.2039.00
Table 10. Rheology results of Phase 1.
MixturesYield Stress [Pa]Viscosity [Pa·s]Printability Index =
Yield Stress × Viscosity
[Pa2·s]
42.5-FA480.2715.547463.40
42.5422.0214.656182.59
52.5-FA723.1513.239567.27
52.5686.3512.688702.92
Table 11. Mechanical test results of Phase 1.
MixturesFlexural Strength (MPa)Compression Strength (MPa)
MeanSDMeanSD
42.5-FA12.310.3473.864.68
42.512.790.1276.951.49
52.5-FA12.580.4682.091.25
52.513.130.2285.392.84
SD: Standard deviation.
Table 12. LCA results of Phase 1.
Individual LCA Values With Their Own UnitsNormalization FactorsWeighing FactorsNormalized and Weighed LCA Values
(Points/T)
42.5, FA42.552.5, FA52.542.5, FA42.552.5, FA52.5
Acidificationmol H+ eq.7.94 × 10−17.95 × 10−18.05 × 10−18.07 × 10−11.80 × 10−20.0628.86 × 10−48.87 × 10−48.98 × 10−49.00 × 10⁻⁴
Climate changekg CO2 eq.2.73 × 1022.84 × 1022.78 × 1022.89 × 1021.32 × 10−40.21067.60 × 10−37.92 × 10−37.74 × 10−38.07 × 10⁻³
Ecotoxicity, freshwaterCTUe2.62 × 1022.43 × 1022.66 × 1022.47 × 1021.76 × 10−50.01928.88 × 10−58.23 × 10−59.00 × 10−58.35 × 10⁻⁵
Particulate matterDisease incidences5.57 × 10−64.58 × 10−65.63 × 10−64.64 × 10−61.68 × 1030.08968.38 × 10−46.89 × 10−48.47 × 10−46.98 × 10⁻⁴
Eutrophication, marinekg N eq.2.13 × 10−12.12 × 10−12.16 × 10−12.15 × 10−15.12 × 10−20.02963.23 × 10−43.21 × 10−43.27 × 10−43.26 × 10⁻⁴
Eutrophication, freshwaterkg P eq.2.07 × 10−22.15 × 10−22.11 × 10−22.19 × 10−26.22 × 10−10.0283.61 × 10−43.75 × 10−43.68 × 10−43.82 × 10⁻⁴
Eutrophication, terrestrialmol N eq.2.43 × 102.42 × 102.46 × 102.46 × 105.66 × 10−30.03715.09 × 10−45.08 × 10−45.17 × 10−45.16 × 10⁻⁴
Human toxicity, cancerCTUh1.76 × 10−81.79 × 10−81.79 × 10−81.82 × 10−85.80 × 1040.02132.18 × 10−52.21 × 10−52.21 × 10−52.25 × 10⁻⁵
Human toxicity, non-cancerCTUh8.04 × 10−85.30 × 10−88.08 × 10−85.33 × 10−87.77 × 1030.01841.15 × 10−57.57 × 10−61.15 × 10−57.62 × 10⁻⁶
Ionizing radiationkBq U235 eq.8.09 × 108.52 × 108.20 × 108.62 × 102.37 × 10−40.05019.61 × 10−51.01 × 10−49.73 × 10−51.02 × 10⁻⁴
Land usePt3.14 × 1023.28 × 1023.18 × 1023.32 × 1021.22 × 10−60.07943.04 × 10−53.17 × 10−53.08 × 10−53.22 × 10⁻⁵
Ozone depletionkg CFC 11 eq.1.16 × 10−51.22 × 10−51.17 × 10−51.24 × 10−51.91 × 1010.06311.40 × 10−51.47 × 10−51.42 × 10−51.49 × 10⁻⁵
Photochemical ozone formationkg NMVOC eq.5.71 × 10−15.67 × 10−15.79 × 10−15.76 × 10−12.45 × 10−20.04786.68 × 10−46.63 × 10−46.78 × 10−46.73 × 10⁻⁴
Resource use, fossilsMJ1.24 × 1031.27 × 1031.26 × 1031.28 × 1031.54 × 10−50.08321.59 × 10−31.62 × 10−31.61 × 10−31.64 × 10⁻³
Resource use, minerals, and metalskg Sb eq.1.94 × 10−42.03 × 10−41.97 × 10−42.06 × 10−41.57 × 1010.07552.31 × 10−42.41 × 10−42.33 × 10−42.44 × 10⁻⁴
Water usem32.02 × 1012.11 × 1012.05 × 1012.14 × 1018.72 × 10−50.08511.50 × 10−41.56 × 10−41.52 × 10−41.59 × 10⁻⁴
Total (Points)1.342 × 10−21.364 × 10−21.364 × 10−21.387 × 10−2
Table 13. Cost of mortars without fibers.
MixtureCost (EUR/T)
42.5-FA90.91
42.591.22
52.5-FA93.94
52.594.73
Table 14. Decision matrix of Phase 1: mortars without fibers.
MixturesNon-Beneficial
Criteria
Beneficial
Criteria
Beneficial
Criteria
Non-Beneficial
Criteria
Non-Beneficial Criteria
Printability IndexFlexural StrengthCompression StrengthCostLCA
(Pa2·s)(MPa)(MPa)(EUR/T)(Points/T)
42.5-FA7463.4012.3173.8690.910.01342
42.56182.5912.7976.9591.220.01364
52.5-FA9567.2712.5882.0993.940.01364
52.58702.9213.1385.3994.730.01387
Table 15. Rheology results of Phase 2.
MixtureYield Stress [Pa]Viscosity [Pa·s]Printability Index =
Yield Stress × Viscosity
[Pa2·s]
Ref (“42.5”)422.0214.656182.59
C6; 0.05498.4113.286618.88
C25; 0.05546.2414.237773.00
PP6; 0.05652.5612.858385.40
CELL20; 0.05598.1411.596932.44
CELL6; 0.05594.2510.726370.36
G13; 0.1689.2510.877492.15
A12; 0.05468.2716.127548.51
A6; 0.05489.3613.236474.23
Table 16. Mechanical test results of Phase 2.
MixturesFlexural Strength (MPa)Compression Strength (MPa)
MeanSDIncrementMeanSDIncrement
Ref. (“42.5”)12.790.34 76.951.49
C6; 0.0513.260.563.64%84.333.509.59%
C25; 0.0513.260.503.64%82.574.317.30%
PP; 0.0512.820.170.23%83.941.709.08%
CELL20; 0.0512.800.630.08%84.162.749.37%
CELL6; 0.0511.800.47−7.74%82.701.677.47%
G13; 0.112.970.431.37%81.932.726.47%
A12; 0.0513.160.742.89%81.742.956.22%
A6; 0.0512.620.17−1.33%83.364.428.33%
AVERAGE=0.35%AVERAGE=7.98%
CI=[−2.77%; 3.47%]CI=[6.89%; 9.07%]
SD: Standard deviation; CI: confidence interval at 95% of the average.
Table 17. LCA of Phase 2.
Individual LCA Values with Their Own UnitsNormalization FactorsWeighing FactorsNormalized and Weighed LCA Values
(Points/T)
C6; 0.05C25; 0.05PP6; 0.05CELL20; 0.05CELL6; 0.05G13; 0.1A12; 0.05A6; 0.05 C6; 0.05C25; 0.05PP6; 0.05CELL20; 0.05CELL6; 0.05G13; 0.1A12; 0.05A6; 0.05
Acidificationmol H+ eq.8.68 × 10−18.68 × 10−18.00 × 10−17.96 × 10−17.96 × 10−18.04 × 10−18.41 × 10−18.41 × 10−11.80 × 10−20.0629.68 × 10−49.68 × 10−48.92 × 10−48.88 × 10−48.88 × 10−48.97 × 10−49.38 × 10−49.38 × 10⁻⁴
Climate changekg CO2 eq.3.00 × 1023.00 × 1022.85 × 1022.84 × 1022.84 × 1022.85 × 1023.02 × 1023.02 × 1021.32 × 10−40.21068.37 × 10−38.37 × 10−37.95 × 10−37.92 × 10−37.92 × 10−37.95 × 10−38.43 × 10−38.43 × 10⁻³
Ecotoxicity, freshwaterCTUe3.57 × 1023.57 × 1022.46 × 1022.44 × 1022.44 × 1022.47 × 1029.83 × 1029.83 × 1021.76 × 10−50.01921.21 × 10−41.21 × 10−48.32 × 10−58.25 × 10−58.25 × 10−58.35 × 10−53.33 × 10−43.33 × 10⁻⁴
Particulate matterDisease incidences5.85 × 10−65.85 × 10−64.62 × 10−64.59 × 10−64.59 × 10−64.67 × 10−66.41 × 10−66.41 × 10−61.68 × 1030.08968.81 × 10−48.81 × 10−46.96 × 10−46.91 × 10−46.91 × 10−47.02 × 10−49.65 × 10−49.65 × 10⁻⁴
Eutrophication, marinekg N eq.2.33 × 10−12.33 × 10−12.13 × 10−12.12 × 10−12.12 × 10−12.14 × 10−14.34 × 10−14.34 × 10−15.12 × 10−20.02963.53 × 10−43.53 × 10−43.22 × 10−43.21 × 10−43.21 × 10−43.24 × 10−46.57 × 10−46.57 × 10⁻⁴
Eutrophication, freshwaterkg P eq.2.18 × 10−22.18 × 10−22.17 × 10−22.15 × 10−22.15 × 10−22.19 × 10−22.36 × 10−22.36 × 10−26.22 × 10−10.0283.79 × 10−43.79 × 10−43.78 × 10−43.75 × 10−43.75 × 10−43.81 × 10−44.12 × 10−44.12 × 10⁻⁴
Eutrophication, terrestrialmol N eq.2.58 × 102.58 × 102.43 × 102.42 × 102.42 × 102.44 × 102.52 × 102.52 × 105.66 × 10−30.03715.41 × 10−45.41 × 10−45.10 × 10−45.08 × 10−45.08 × 10−45.12 × 10−45.29 × 10−45.29 × 10⁻⁴
Human toxicity, cancerCTUh2.84 × 10−82.84 × 10−81.80 × 10−81.80 × 10−81.80 × 10−81.80 × 10−82.90 × 10−82.90 × 10−85.80 × 1040.02133.51 × 10−53.51 × 10−52.22 × 10−52.22 × 10−52.22 × 10−52.23 × 10−53.59 × 10−53.59 × 10⁻⁵
Human toxicity, non-cancerCTUh1.14 × 10−71.14 × 10−75.35 × 10−85.30 × 10−85.30 × 10−85.34 × 10−82.66 × 10−72.66 × 10−77.77 × 1030.01841.62 × 10−51.62 × 10−57.65 × 10−67.58 × 10−67.58 × 10−67.63 × 10−63.80 × 10−53.80 × 10⁻⁵
Ionizing radiationkBq U235 eq.9.58 × 109.58 × 108.54 × 108.53 × 108.53 × 108.63 × 101.06 × 1011.06 × 1012.37 × 10−40.05011.14 × 10−41.14 × 10−41.01 × 10−41.01 × 10−41.01 × 10−41.02 × 10−41.26 × 10−41.26 × 10⁻⁴
Land usePt3.30 × 1023.30 × 1023.29 × 1023.28 × 1023.28 × 1023.32 × 1023.04 × 1023.04 × 1021.22 × 10−60.07943.20 × 10−53.20 × 10−53.19 × 10−53.18 × 10−53.18 × 10−53.21 × 10−52.94 × 10−52.94 × 10⁻⁵
Ozone depletionkg CFC 11 eq.1.23 × 10−51.23 × 10−51.22 × 10−51.22 × 10−51.22 × 10−51.23 × 10−51.22 × 10−51.22 × 10−51.91 × 1010.06311.48 × 10−51.48 × 10−51.47 × 10−51.47 × 10−51.47 × 10−51.48 × 10−51.47 × 10−51.47 × 10⁻⁵
Photochemical ozone formationkg NMVOC eq.6.01 × 10−16.01 × 10−15.69 × 10−15.67 × 10−15.67 × 10−15.72 × 10−15.99 × 10−15.99 × 10−12.45 × 10−20.04787.03 × 10−47.03 × 10−46.66 × 10−46.64 × 10−46.64 × 10−46.69 × 10−47.00 × 10−47.00 × 10⁻⁴
Resource use, fossilsMJ1.53 × 1031.53 × 1031.30 × 1031.27 × 1031.27 × 1031.28 × 1031.46 × 1031.46 × 1031.54 × 10−50.08321.96 × 10−31.96 × 10−31.67 × 10−31.62 × 10−31.62 × 10−31.64 × 10−31.87 × 10−31.87 × 10⁻³
Resource use, minerals, and metalskg Sb eq.2.21 × 10−42.21 × 10−42.10 × 10−42.05 × 10−42.05 × 10−42.14 × 10−42.39 × 10−42.39 × 10−41.57 × 1010.07552.62 × 10−42.62 × 10−42.50 × 10−42.43 × 10−42.43 × 10−42.54 × 10−42.83 × 10−42.83 × 10⁻⁴
Water usem33.29 × 1013.29 × 1012.15 × 1012.11 × 1012.11 × 1012.13 × 1012.68 × 1012.68 × 1018.72 × 10−50.08512.44 × 10−42.44 × 10−41.60 × 10−41.57 × 10−41.57 × 10−41.58 × 10−41.99 × 10−41.99 × 10⁻⁴
Total (Points)1.499 × 10−21.499 × 10−21.375 × 10−21.365 × 10−21.365 × 10−21.375 × 10−21.556 × 10−21.556 × 10−2
Table 18. Cost of mortars with fibers.
MixtureCost (EUR/T)
Ref (“42.5”)91.22
C6; 0.05103.67
C25; 0.05103.67
PP6; 0.05102.77
CELL20; 0.0591.85
CELL6; 0.0591.85
G13; 0.196.93
A12; 0.05110.67
A6; 0.05110.67
Table 19. Decision matrix of Phase 2: mortars without fibers.
MixturesNon-Beneficial
Criteria
Beneficial
Criteria
Beneficial
Criteria
Non-Beneficial
Criteria
Non-Beneficial
Criteria
Printability IndexFlexural StrengthCompression StrengthCostLCA
(Pa2·s)(MPa)(MPa)(EUR/T)(Points/T)
Ref (“42.5”)6182.5912.7976.9591.220.01364
C6; 0.056618.8813.2684.33103.670.01499
C25; 0.057773.0013.2682.57103.670.01499
PP6; 0.058385.4012.8283.94102.770.01375
CELL20; 0.056932.4412.8084.1691.850.01365
CELL6; 0.056370.3611.8082.7091.850.01365
G13; 0.17492.1512.9781.9396.930.01375
A12; 0.057548.5113.1681.74110.670.01556
A6; 0.056474.2312.6283.36110.670.01556
Disclaimer/Publisher’s Note: The statements, opinions and data contained in all publications are solely those of the individual author(s) and contributor(s) and not of MDPI and/or the editor(s). MDPI and/or the editor(s) disclaim responsibility for any injury to people or property resulting from any ideas, methods, instructions or products referred to in the content.