Article

A Study on the Supply–Demand Matching and Spatial Value Effects of Community Public Service Facilities: A Case Study of Wuchang District, Wuhan

1
School of Architecture and Urban Planning, Huazhong University of Science and Technology, Wuhan 430074, China
2
Hubei Engineering and Technology Research Center of Urbanization, Wuhan 430074, China
3
The Key Laboratory of Urban Simulation for Ministry of Natural Resources, Wuhan 430074, China
*
Author to whom correspondence should be addressed.
Buildings 2025, 15(18), 3293; https://doi.org/10.3390/buildings15183293
Submission received: 25 July 2025 / Revised: 26 August 2025 / Accepted: 9 September 2025 / Published: 12 September 2025
(This article belongs to the Special Issue Sustainable Urban Development and Real Estate Analysis)

Abstract

In the context of low-growth urban development, the interaction between the supply–demand structure of community public service facilities and the housing market has increasingly become a key research concern. Yet, systematic investigations into how supply–demand dynamics influence market value remain limited. To fill this gap, this study takes Wuchang District of Wuhan as the empirical case and establishes an integrated framework of “supply–demand evaluation—value effects” to assess both the equity of facility allocation and its capitalization effects. The results indicate that: (1) all categories of public service facilities in Wuchang District have Gini coefficients above 0.6, indicating substantial imbalance. Among them, elderly care, infant care, and child recreation facilities exceed 0.7, reflecting particularly severe inequality. (2) The “accessibility–housing price” quadrant model further reveals typical mismatch patterns, with “low accessibility–high price” and “high accessibility–low price” zones together accounting for 45.08%, suggesting that mismatches are widespread in the study area. (3) MGWR results show that different facility types exert differentiated effects across locations, with some even displaying opposite positive and negative effects, underscoring significant spatial heterogeneity. Overall, this study uncovers the intrinsic links between facility supply–demand structures and market value, clarifies the differentiated roles of facility types in shaping spatial value, and provides empirical evidence to support improvements in urban public service systems.

1. Introduction

Against the backdrop of rapid global urbanization, achieving the efficient allocation of spatial resources has become a central issue in sustainable urban development [1]. According to data from the United Nations, by 2050, approximately 70% of the global population will reside in cities, accelerating the transition toward high-density built environments [2]. In response to this trend, regions such as Europe, North America, and East Asia have taken the lead in exploring community-based public service systems characterized by “neighborhood scale,” “mixed functions,” and “flexible provision.” Diverse community service facilities—such as block-based, modular, and shared models—are increasingly regarded as key strategies for enhancing urban livability. These approaches emphasize that public services should be embedded within residents’ everyday living environments to establish an efficient, accessible, and life-oriented micro-scale service network [3,4].
China has also actively explored approaches to urban community governance, continuously advancing the development of community public service infrastructure in key areas such as elderly care, child care, health care, and cultural and sports services [5]. In recent years, policy initiatives such as the “15-min living circle” and “complete communities” have been repeatedly introduced to enhance service accessibility and shift the focus of public services from quantitative expansion to qualitative balance [6]. This trend signifies a transition in China’s public service delivery system toward greater refinement, offering strategic guidance for optimizing facility distribution in high-density urban settings.
In recent years, research has shifted from isolated analyses of supply or demand to integrated evaluations of supply–demand spatial matching [7,8,9]. Scholars now examine not only supply-side factors such as facility quantity and density, but also residents’ travel behavior and service preferences [10]. Methods including spatial overlay [11] and the two-step floating catchment area (2SFCA) method [12] have been applied to assess the coordination between facilities and population demand, while fairness is evaluated using measures such as the Gini coefficient [13], Theil index [14], and location entropy [15]. Meanwhile, increasing attention has been paid to the effects of public service facilities on housing prices. Traditional hedonic pricing models often fail to capture spatial heterogeneity [16,17,18], whereas geographically weighted regression (GWR) [19] and its multiscale extension (MGWR) [20] offer more suitable analytical tools. For example, Liu et al. used MGWR to compare the explanatory power of different accessibility measures on housing prices, underscoring the importance of model selection [21].
Although substantial progress has been made in studies on facility provision and housing price capitalization, existing findings remain largely confined to a single perspective—either emphasizing supply–demand balance or focusing on the correlation between facilities and housing prices. A systematic framework that integrates supply–demand matching with market effects is still absent, making it difficult to account for the mismatches frequently observed between facility resources and market value in practice. To address this gap, this study proposes a dual-dimensional framework of “supply–demand evaluation—value effects,” with the aim of investigating the following scientific questions:
  • Supply–demand evaluation dimension: Under the context of high-density urban development, what are the spatial equity patterns of different types of community public service facilities?
  • Value effects dimension: Do significant spatial mismatches exist between facility accessibility and housing prices, and do the capitalization effects of different facility types exhibit spatial heterogeneity?
To this end, the study first applies an improved 2SFCA method to measure facility accessibility and assess the level of supply–demand balance. Second, the “accessibility–housing price” quadrant model is employed to identify mismatch patterns. Finally, a MGWR model is used to analyze the spatial heterogeneity of the effects of service accessibility on housing prices. The ultimate goal is to provide a robust scientific basis for optimizing facility allocation and guiding value-oriented urban development.
The core innovation of this study lies in the development of a unified framework, situated in the empirical context of high-density Chinese cities, that integrates supply–demand matching of community public service facilities with the analysis of market value effects. This framework links the measurement of facility equity with research on value capitalization, thereby establishing a systematic research pathway that encompasses supply–demand diagnostics, mismatch identification, and spatial heterogeneity analysis. It introduces a quantifiable and generalizable analytical paradigm, providing a novel theoretical perspective for optimizing community public service systems and informing housing market regulation.

2. Literature Review

2.1. Progress in Research on Supply–Demand Matching of Public Service Facilities

Since the end of World War II, the equity of public service facilities has gradually emerged as a central concern in international academic discourse. Research has progressively advanced toward the dynamic balance between supply and demand and the pursuit of spatial optimization, with “supply–demand matching” evolving into a key theme. The existing body of literature can broadly be classified into three perspectives: supply-oriented, demand-oriented, and integrated supply–demand matching.
Supply-oriented studies typically take facility quantity, service radius, and spatial distribution as core indicators, forming the foundation for evaluating the accessibility of public service facilities. The accessibility model proposed by Hansen laid the theoretical groundwork for this line of research [22]. Building on this framework, subsequent studies have broadened the scope. For instance, Wei et al. [23] employed an improved three-step floating catchment area method to quantify the supply of medical services, highlighting the shortage and spatial imbalance of high-quality medical resources, while Zhao [24] refined the measurement of supply capacity through scale-based classification, offering useful guidance for facility optimization. In addition, several studies have incorporated service capacity and quality indicators, such as hospital bed numbers [25], student–teacher ratios [26], and park area [27]. Nevertheless, in multi-type or large-scale analyses, facility quantity and spatial distribution remain the most widely used and intuitively comparable indicators.
Demand-oriented studies typically begin with population size and socio-demographic attributes, emphasizing the decisive role of population distribution in shaping the demand for public service facilities. Population size and density are the most widely used indicators, as they directly capture the overall level of regional demand [28]. Methodologically, Liu et al. [29] incorporated a choice probability function from the demand side, emphasizing variations in residents’ behavioral preferences and thereby improving the accuracy of elderly care accessibility assessment. Other studies underscore the importance of socio-demographic characteristics; for instance, Wachs and Kumagai [30] demonstrated that income, age, and travel behavior exert substantial influences on service accessibility.
Supply–demand matching studies integrate facility provision with population demand, with a central focus on evaluating the equity of allocation. Common approaches include macro-level indicators such as the Gini coefficient [13] and Theil index [14], which reflect overall levels of equity, as well as methods such as the spatial imbalance index [31], spatial autocorrelation analysis [32], and the entropy method [33], which uncover clustering patterns and local disparities in spatial distribution. To enable multi-scale analysis, this study employs the Gini coefficient at the macro level to assess overall accessibility equity and applies the entropy method at the micro (street) level to measure supply–demand balance.

2.2. Progress in Research on the Effect Mechanisms of Public Service Facilities on Housing Prices

The capitalization effect of public service facilities on the real estate market was first proposed in the mid-20th century and has since been repeatedly validated through empirical studies. It is generally recognized that housing value is jointly determined by three categories of factors: structural attributes, neighborhood attributes, and locational attributes [34]. Among these, structural and neighborhood characteristics are usually treated as control variables, while locational features are typically regarded as the core explanatory factors. (1) Structural attributes. The intrinsic attributes of a dwelling directly determine its fundamental use value [35]. Studies have shown that spatial features such as floor area ratio, green coverage ratio, building quality, and building age exert stable influences on housing prices. A higher green coverage ratio generally produces a positive effect, as it not only enhances residential comfort but also increases market attractiveness through air purification and noise mitigation [36]. By contrast, building age is negatively associated with price, reflecting the impacts of functional depreciation and rising maintenance costs [37]. (2) Neighborhood attributes. The neighborhood environment, as a major externality, has a significant impact on housing prices. The capitalization effect of educational resources is especially prominent, with high-quality schools often creating price gradients centered on school districts [38]. Medical facilities exhibit nonlinear effects: while moderate accessibility enhances housing attractiveness, excessive proximity may diminish it due to noise and traffic congestion [39]. Public green spaces and waterfront areas typically generate a “green premium,” a phenomenon particularly pronounced in ecologically oriented cities [40]. (3) Locational attributes. The accessibility of public service facilities is the core factor at the locational level. It not only reflects the convenience of daily life but also manifests spatial heterogeneity through differences in facility types and distributions. The accessibility of diverse facilities, such as cultural and sports amenities, has been shown to significantly influence housing values [41]. Moreover, the distance decay effect indicates that facilities exert the strongest capitalization effects within a reasonable service radius, whereas both excessive distance and excessive proximity may diminish their influence [42].
Empirical studies on the mechanisms influencing housing prices have primarily relied on the hedonic pricing model and its extensions. This model posits that housing prices are jointly determined by multiple implicit attributes, with the marginal contributions of each factor estimated through the decomposition of housing characteristics [43]. However, as a global regression approach, it has limited capacity to capture spatial heterogeneity.
To address this limitation, scholars have introduced spatial econometric methods. Brunsdon et al. [19] proposed GWR, which applies spatial weighting functions to capture local variations. Building on this, Fotheringham et al. [20] developed MGWR, which employs adaptive bandwidths to characterize multi-scale effects across different variables. More recently, machine learning approaches such as XGBoost [44] have been adopted in housing price research, offering advantages in predictive accuracy and model robustness through their capacity to process large-scale and high-dimensional data.

2.3. Summary of Research Progress

In summary, existing studies have established a relatively systematic foundation on the supply–demand matching of public service facilities and their mechanisms of influence on housing prices. However, these two strands of research have largely advanced in parallel, and the effects of supply–demand matching on housing market value remain insufficiently examined in a systematic way. Furthermore, most studies have relied on facility quantity as the core metric, paying limited attention to the role of service accessibility in revealing supply–demand balance and explaining capitalization effects.
Building on this, the present study takes Wuchang District of Wuhan as the empirical case and analyzes the supply–demand matching of public service facilities from the perspective of service accessibility. This perspective is further incorporated into a MGWR model to examine its effects on housing prices. Unlike traditional approaches that focus mainly on facility quantity, this study adopts accessibility measures derived from the 2SFCA method, which more accurately reflect the effective utility of facilities within their service radius.

3. Data and Methodology

3.1. Study Area and Objects

This study selects Wuchang District of Wuhan as the research area (Figure 1), based on two main considerations. First, Wuchang is located on the south bank of the Yangtze River, with convenient transportation, a dense road network, and a well-developed metro and bus system, ensuring high accessibility and extensive service spillover capacity [45]. As one of the city’s core districts, it is characterized by high population density, pronounced aging, and diverse community types. These conditions generate strong demand for public service facilities [46], yet the existing distribution and coverage remain insufficient, resulting in significant supply–demand imbalances and making it a representative case for study. Second, Wuchang District has been an early mover in urban regeneration and community governance, with proactive policy responses. In recent years, it has consistently promoted facility construction, establishing a sound foundation of practice and data [47], which provides robust support for quantitative analysis of supply–demand matching and value effects.
The definition of “community public service facilities” in this study draws on previous research and refers to current Chinese standards and policy documents, including the Guidelines for the Construction of Embedded Community Service Facilities in Urban Communities (Trial) [48], the Technical Guidelines for Community Life Circle Planning [49], and various local planning guidelines for life-circle development. In this study, “community public service facilities” are defined as a system of services reasonably allocated within a community to meet residents’ daily needs and enhance their quality of life, with the core objective of ensuring services that are high-quality, inclusive, and conveniently accessible [50]. According to these guidelines and local implementation rules, such facilities should be located within a walkable life circle and encompass nine categories of services: elderly care, infant care, child care, child recreation, community meal, domestic convenience, health care, sports fitness, and cultural recreation facilities. On this basis, Wuchang District of Wuhan is selected as the study area, with the “15-min walking life circle” adopted as the spatial analysis radius.

3.2. Data Sources

The data used in this study fall into three main categories: (1) geographic spatial data relevant to the study, including road network data, river system data, study area boundaries, and administrative subdistrict boundaries; (2) internet-based big data, including residential community data, points of interest (POI) data for nine categories of public service facilities, and other related data; and (3) statistical data, such as demographic information and subdistrict-level statistical indicators. Based on the extraction of natural geographic and socio-environmental information for the study area, an analytical model was constructed to assess the current supply–demand matching of community public service facilities and to explore their effect mechanisms on housing prices. All data were converted into ArcGIS vector format and processed using the WGS84 coordinate reference system. The types and sources of data are summarized in Table 1.

3.3. Research Methods

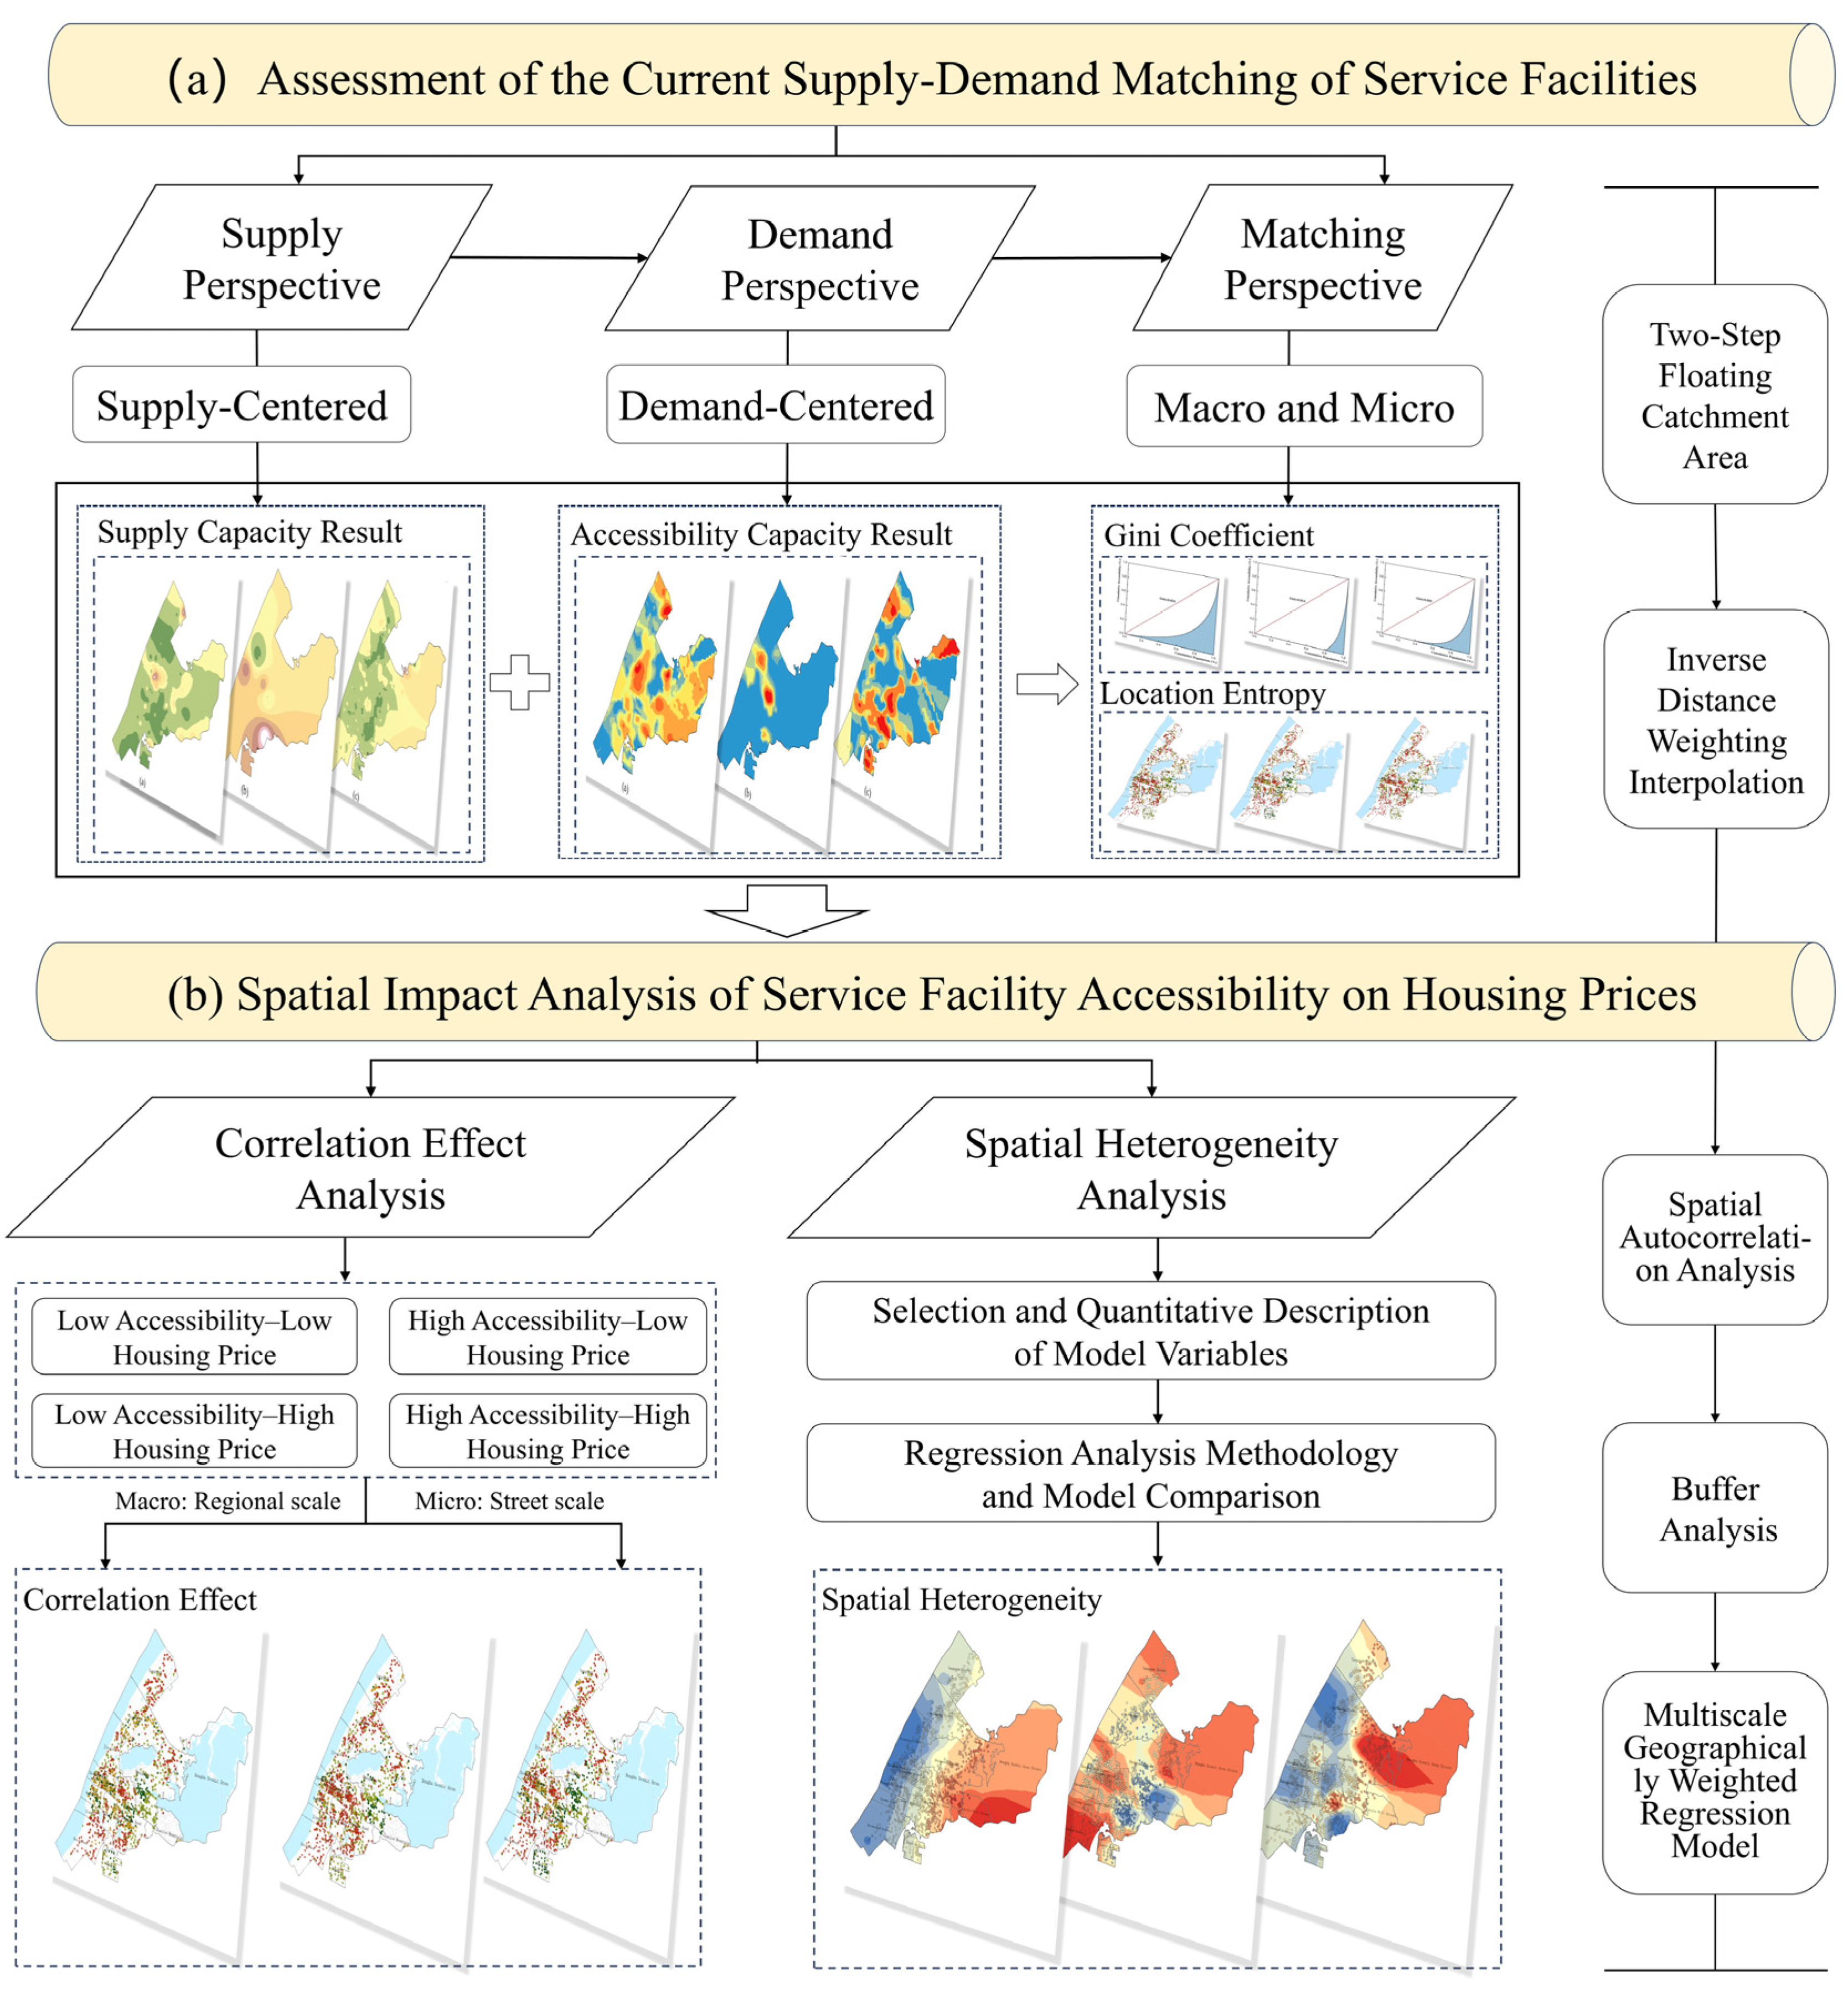
This study constructs an integrated research framework that encompasses “supply–demand evaluation—value effects” (Figure 2). Within the supply–demand evaluation dimension, the framework develops an assessment system from three perspectives: supply, demand, and matching. The Gini coefficient and location entropy are employed to evaluate, respectively, the macro-level distributional equity and the micro-level spatial matching of facility allocation. Within the value effects dimension, the “accessibility–housing price” quadrant model is first constructed to identify typical types of facility–market mismatches. MGWR is then employed to quantitatively analyze the spatial heterogeneity of the effects of different facility accessibilities on housing prices. This framework integrates spatial equity with value effect, providing a unified methodological foundation and analytical pathway for systematically revealing the supply–demand structure of community public service facilities and their economic value. The methodology of this study consists of the following five components (Table 2).

3.3.1. Improved Two-Step Floating Catchment Area (2SFCA) Method

The 2SFCA method was first proposed by Luo et al. [51]. Based on supply and demand points, the 2SFCA method performs two rounds of searches within a defined distance threshold and aggregates the supply-to-demand ratios to calculate the accessibility at each demand point. This method is considered highly applicable and practical and has been widely recognized by geographers as one of the most effective approaches for measuring service accessibility [52]. However, a key limitation of the 2SFCA method is its reliance on straight-line distance, which ignores the real-world road network impedance. As a result, all demand points within the catchment radius are assigned equal weight, failing to reflect the realistic distance decay of service effectiveness. To address this limitation, scholars introduced the Gaussian distance decay function, which continuously adjusts service weights based on distance, allowing the model to more accurately represent the spatial influence of public service facilities. The improved 2SFCA method fully incorporates the influence of supply and demand scales on accessibility and has become a principal tool for measuring spatial accessibility in studies of various types of service facilities. Its core logic consists of two steps [53,54]:
Step 1: Calculate the supply-to-demand ratio   R j for each facility. For each supply point j , a catchment area is delineated using a predefined threshold travel distance d 0 , which represents the maximum distance residents are considered willing to travel to reach a given facility. All demand points k falling within this radius are identified. The supply-to-demand ratio   R j is then computed by dividing the service capacity of facility j by the total demand of the identified population within its catchment.
  R j = S j k d i j d 0 P k
In the equation, S j denotes the total supply capacity of facility point j ; d i j refers to the network distance between residential community i and facility j ; P k represents the demand at point k within the catchment area, typically measured by population size; and   R j is the supply-to-demand ratio, reflecting the service capacity of the facility relative to the surrounding demand.
Step 2: Calculate the accessibility A i for each residential community. For each residential location i , a catchment area is defined using the same threshold distance d 0 , and all facilities located within this area are identified. A Gaussian decay function is then applied to weight the supply-to-demand ratios   R j of these facilities based on their respective distances from i . The weighted sum of these values yields the accessibility index A i , reflecting the overall service accessibility available to the community.
A i = k d i j d 0 G d i j R j
In the equation, A i represents the accessibility of demand point i ; d i j denotes the distance between demand point i and supply point j ;   R j is the supply-to-demand ratio at facility j ; and G d i j is the Gaussian decay function, defined as:
G d i j , d 0 = e 1 2 × d i j d 0 2 e 1 2 1 e 1 2 d i j < d 0 0 d i j d 0

3.3.2. Inverse Distance Weighting Interpolation (IDW)

Inverse Distance Weighted interpolation is an important tool in spatial analysis and is based on the spatial proximity principle [55]. The method estimates unknown values by calculating the spatial distances between the target point and known sample points, assigning distance-based weights accordingly. Points that are closer to the target location have greater influence on the interpolated value. This distance-decay-based interpolation technique is widely used in GIS for surface modeling and spatial prediction.
N S 0 = i = 1 n W i N S i
W i = 1 d i t i = 1 n 1 d i t
In the equation, N S 0 represents the predicted value at the target interpolation point S 0 ; N S i denotes the observed value at the i t h sampling point; n is the total number of sampling points; W i   is the weight assigned to each sampling point during the interpolation process; and d i represents the spatial distance between the sampling point and the interpolation location. The weight is typically defined as 1 d i t , where   t is the distance decay coefficient. As the value of ttt increases, closer sampling points exert a stronger influence on the estimated value, enhancing the spatial sensitivity of the interpolation.

3.3.3. Spatial Autocorrelation Analysis

Spatial autocorrelation is a core component of exploratory spatial data analysis and is used to reveal spatial distribution patterns of data via GIS techniques [56]. Rooted in Tobler’s First Law of Geography, this method consists of two main modules: trend analysis and spatial correlation analysis. In practical applications, spatial autocorrelation identifies spatial dependence by quantifying the similarity of attribute values among neighboring spatial units. It is a critical step in understanding spatial distribution patterns and in constructing spatial econometric models.
This study conducts a systematic analysis of the spatial distribution of housing prices in Wuchang District using Moran’s I index, with a focus on examining whether regional housing prices exhibit spatial clustering. The index effectively identifies spatial patterns in price distribution and determines whether the observed pattern is randomly dispersed or exhibits significant spatial autocorrelation.
I = i = 1 n j = 1 n w i j x i x - x j x - s 2 i = 1 n j = 1 n w i j
In the equation, I   is the core indicator for spatial autocorrelation analysis; n represents the total number of residential communities in the study area; x i and x j denote the second-hand listing prices of the i t h and j t h residential communities, respectively; w i j is the spatial weight between locations i   and j ; and s 2 and x - refer to the variance and mean of housing prices.
The value of Moran’s I ranges from −1 to 1 and can effectively distinguish among three typical spatial distribution patterns. A significantly positive I indicates strong spatial autocorrelation, where high or low values are clustered together. A significantly negative I suggests spatial dispersion or a checkerboard pattern of alternating high and low values. When I approaches zero, it reflects a random spatial distribution of housing prices across the study area. However, under the null hypothesis of spatial randomness, the expected value of I is not exactly zero due to the limited sample size, but is slightly less than zero, that is, E I = 1 n 1 .

3.3.4. Buffer Analysis Method

The buffer analysis method constructs an evaluation framework based on the principle of distance transformation. It generates polygonal zones by extending outward from geographic features—such as points, lines, or areas—using a predefined distance threshold [57]. In the context of public community service facility studies, this method offers dual analytical utility. On one hand, buffers around individual features can define service coverage areas or pollution dispersion boundaries [58]. On the other hand, when combined with overlay analysis, it allows for the evaluation of facility density and spatial relationships within designated areas—for instance, by measuring the coverage of service facilities around residential points or assessing the response capabilities of emergency infrastructure [59]. The corresponding formulation is as follows:
M i = x d x , N i R
In the equation, d denotes the spatial distance between any given point and the spatial feature N i , which can be calculated using one of three common methods, depending on the research context: Euclidean distance (straight-line), suitable for idealized planar spaces; Manhattan distance (grid-based), simulating paths along urban block structures; and network distance (path-based), which incorporates the constraints of real-world transportation networks. The neighborhood radius R serves as a critical threshold parameter for delineating the spatial influence range of feature N i . The set M i   represents the spatial distribution of all points located within the neighborhood centered on N i and bounded by radius R .
For a set of n spatial features denoted as N = N i i = 1,2 , . n , the overall buffer zone M can be expressed as the union of the individual buffer zones M i , as defined below:
M = U i = 1 n M i

3.3.5. Multiscale Geographically Weighted Regression Model (MGWR)

Ordinary Least Squares (OLS) regression is widely used in hedonic price modeling due to its simplicity and strong explanatory power [60]. However, the OLS model assumes spatial stationarity of parameters, making it insufficient for capturing spatial non-stationarity—which refers to the possibility that relationships between variables may vary across geographic locations. To address this limitation, Fotheringham et al. proposed GWR, which introduces spatial coordinates into the regression framework, allowing coefficients to vary with location and enabling local parameter estimation. This approach effectively reveals spatial variation and complex relationships across different regions. Aligned with Tobler’s First Law of Geography, GWR has demonstrated strong performance in domains characterized by significant spatial heterogeneity, such as real estate, environmental studies, and public health.
Although GWR effectively captures spatial non-stationarity, it employs a uniform bandwidth for all explanatory variables, which limits its ability to characterize variable-specific spatial scales and reduces both interpretability and model adaptability [61]. MGWR extends the GWR framework by introducing a methodological improvement: it assigns an independent, optimal bandwidth to each explanatory variable, thereby more precisely capturing the spatial scale at which each factor operates. MGWR retains the kernel function structure and bandwidth selection mechanisms of GWR (e.g., the AICc criterion), while offering greater flexibility in parameter estimation, and can be considered a specific form of the generalized additive model (GAM). This study conducts a systematic comparative analysis of the GWR and MGWR models using the MGWR 2.2 platform, aiming to more accurately identify the spatial scale effects of public service facilities on housing prices, and to enhance the model’s spatial explanatory power and policy applicability.
y i = β 0 μ i , ϑ i + j = 1 k β b ω j μ i , ϑ i x i j + ϵ i
In the equation, y i is the dependent variable; μ i , ϑ i represents the spatial coordinates of location i; β 0 μ i , ϑ i is the intercept term at that location; β b ω j   denotes the bandwidth associated with the regression coefficient for the j t h   explanatory variable; and ϵ i   is the random error term.

4. Results and Analysis

4.1. Assessment of the Current Supply–Demand Matching of Community Public Service Facilities

On the supply side, facility quantity is used as the indicator, while on the demand side, population size reflects demand intensity. Specifically, the spatial supply–demand ratio of each facility type is first calculated to identify areas of surplus and shortage [62]. Second, service accessibility is assessed at the neighborhood scale to capture accessibility levels from the demand perspective. Finally, the Gini coefficient and entropy method are employed to comprehensively analyze supply–demand matching, considering both macro-level equity and micro-level suitability.

4.1.1. Supply-Side Perspective: Evaluation of Service Facility Provision

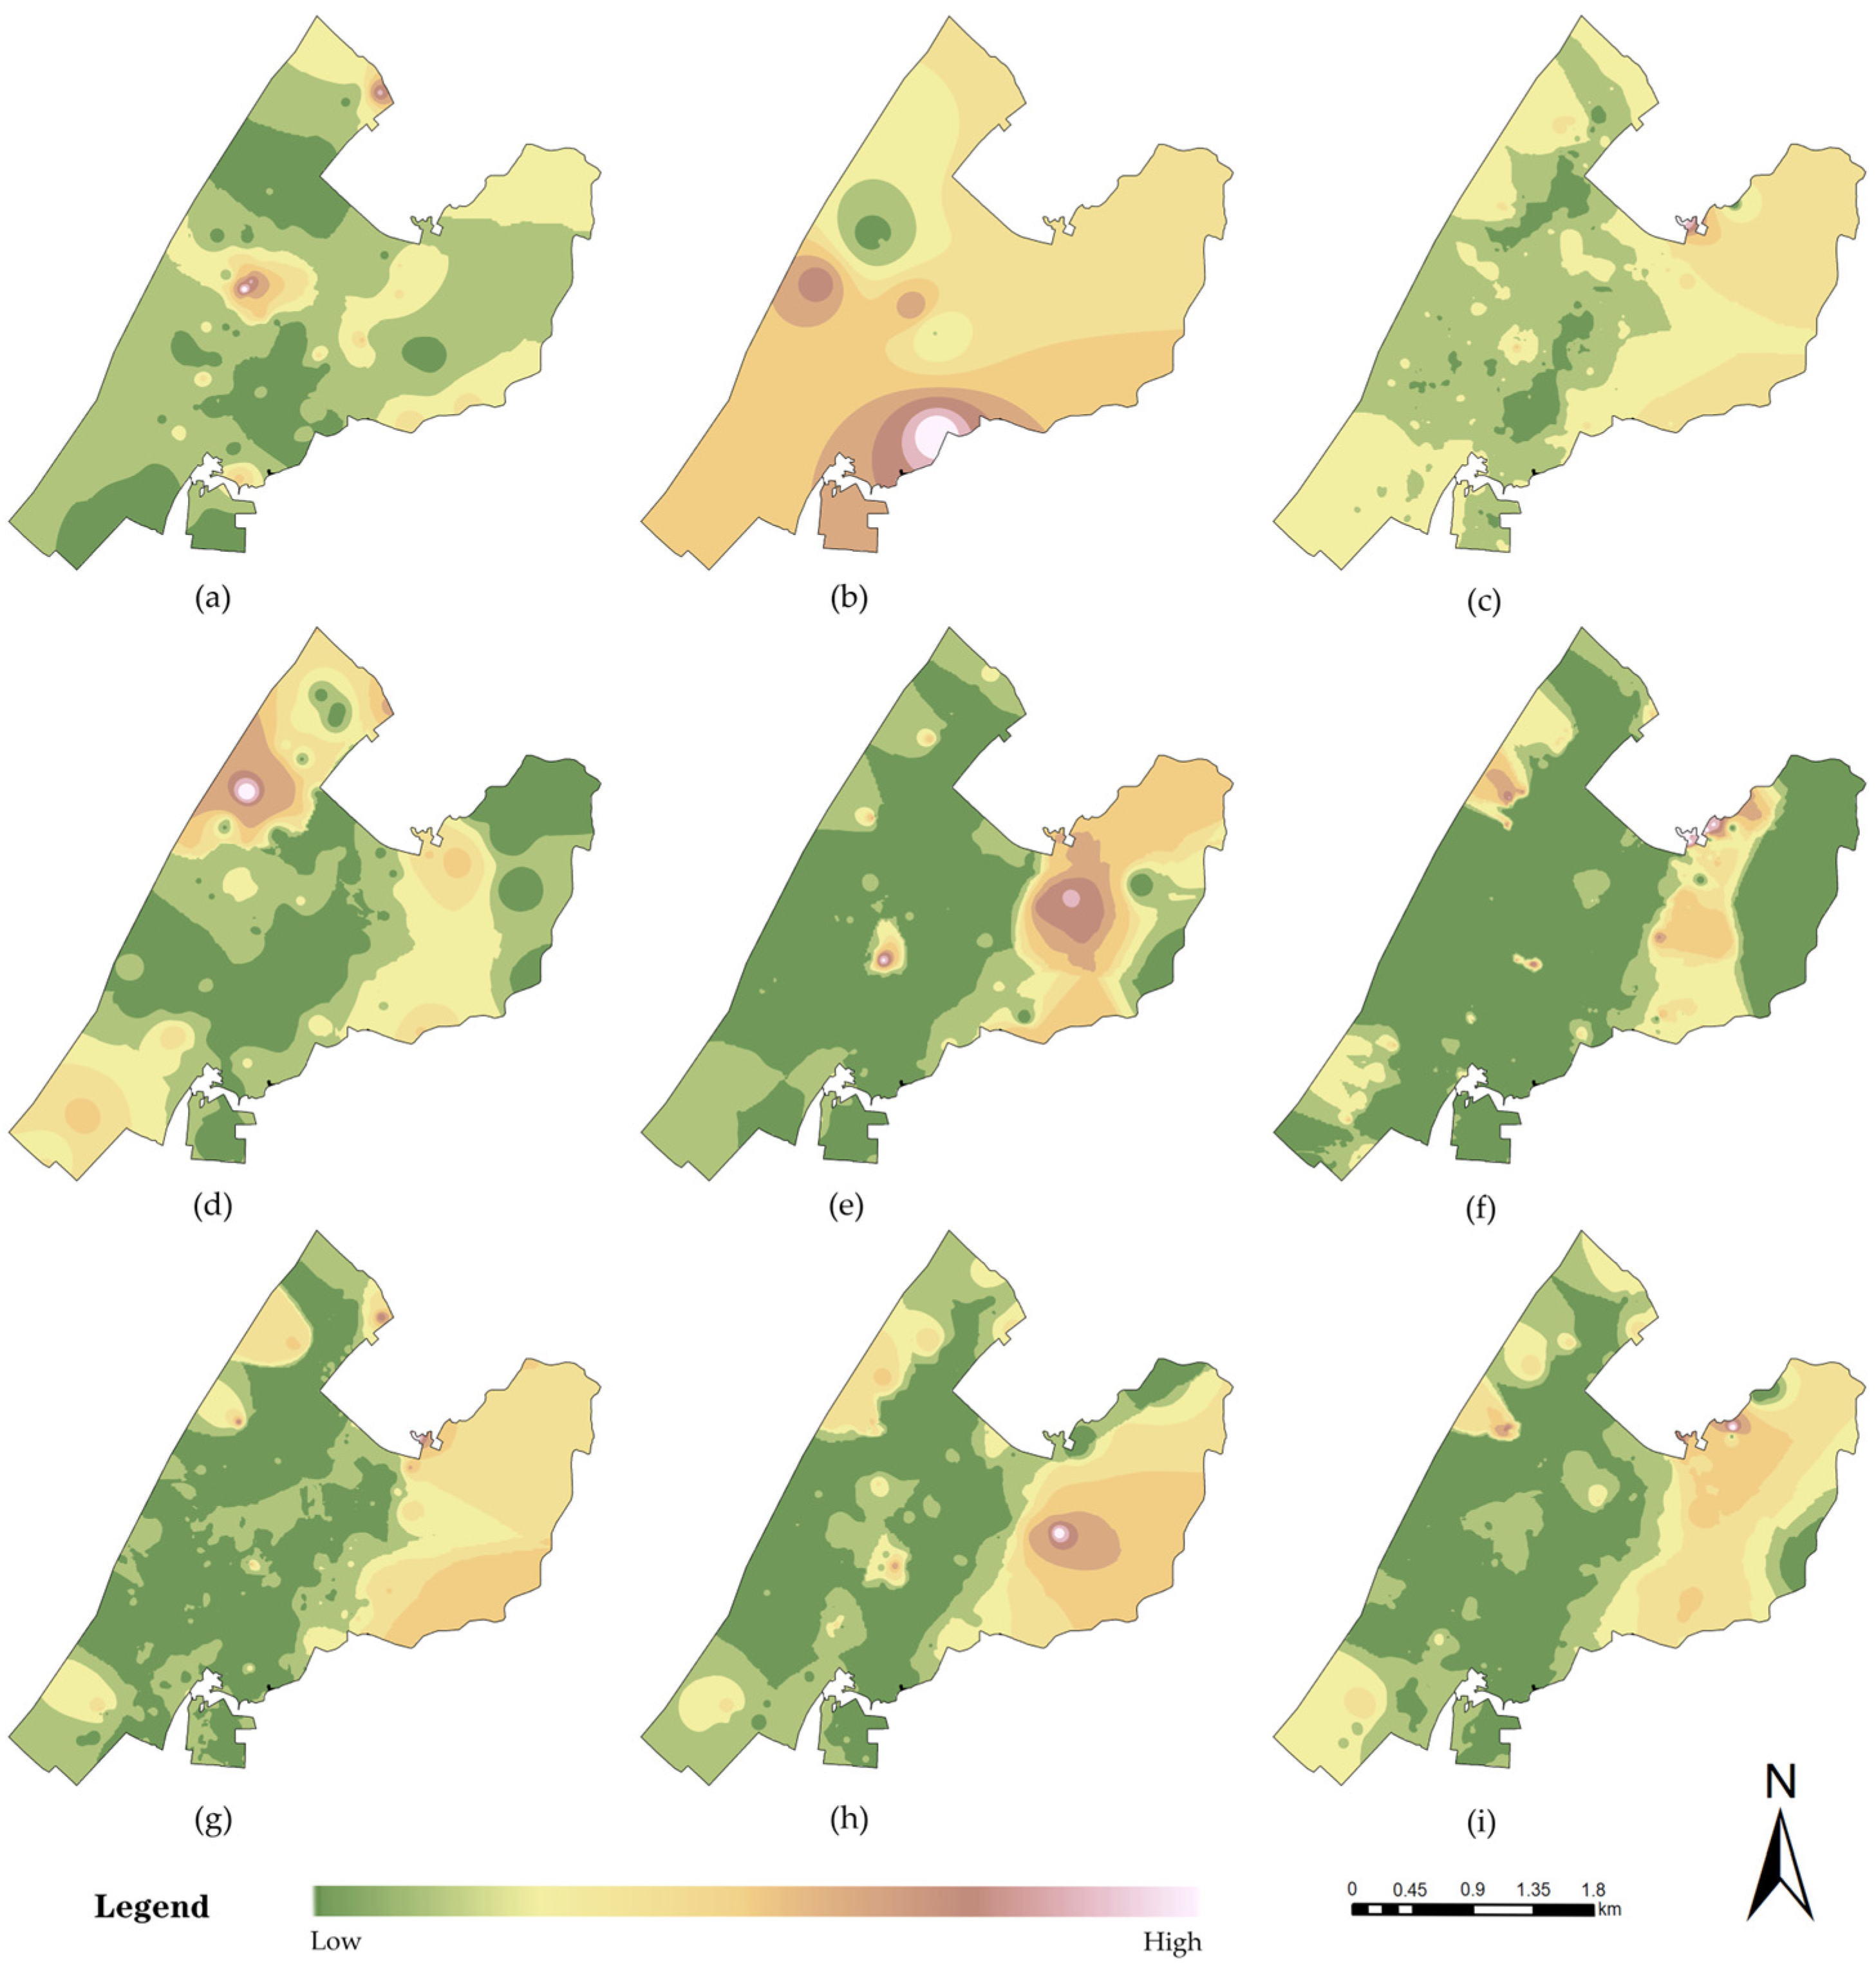
This section is based on the first stage of the improved 2SFCA method and constructs a 15 min walking travel cost matrix from community public service facilities to residential communities. Using real road network data, the spatial supply–demand ratios of nine types of facilities are calculated to identify their distribution patterns at the subdistrict level.
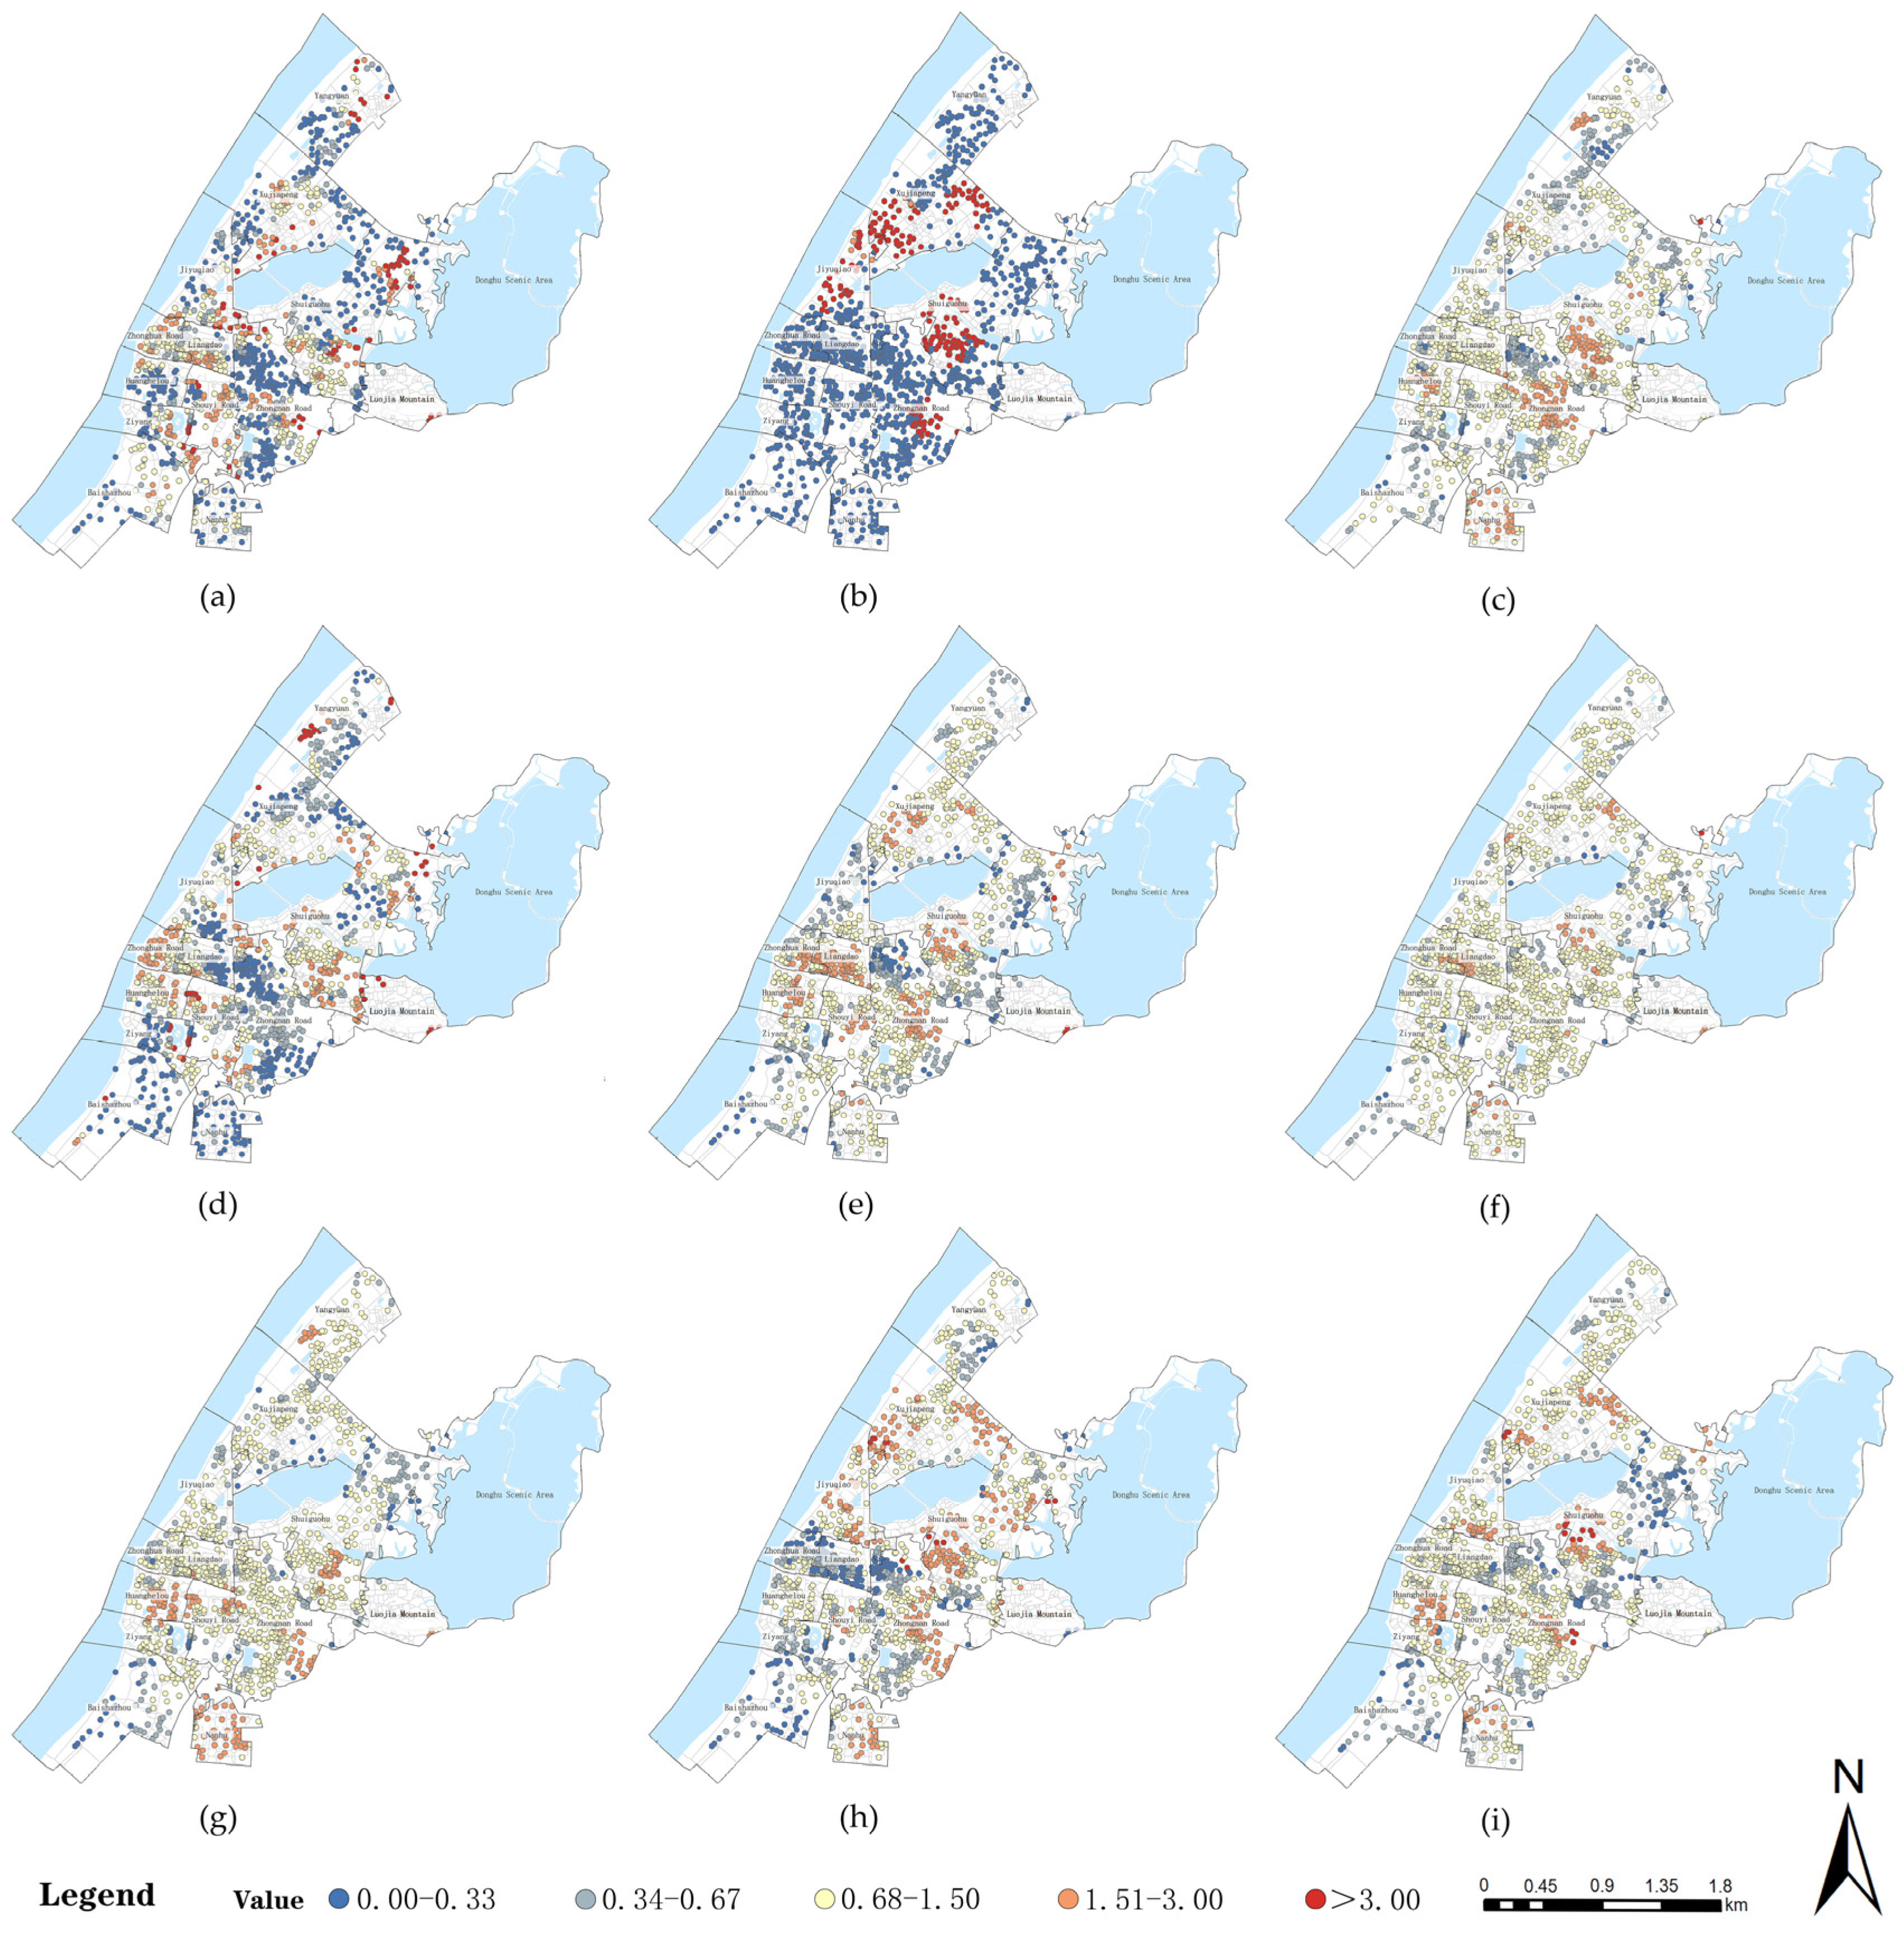
The analysis results (Figure 3) reveal significant spatial disparities in the distribution of various types of community public service facilities across the study area. Facilities for domestic convenience service, health care, sports fitness, and cultural recreation form high-intensity supply clusters in the Donghu Scenic Area subdistrict, largely benefiting from its relatively low population density. Elderly care, children recreation, and child care facilities demonstrate strong coverage in subdistricts such as Xujiapeng and Yangyuan, indicating that some older neighborhoods provide relatively good support for specific types of services. Infant care and community meal facilities in Zhongnan Road subdistrict exhibit a clustered, point-based distribution pattern, reflecting a certain degree of concentration in the siting of such services. In contrast, central subdistricts such as Shuiguohu and Jiyuqiao have a relatively high number of service facilities, but due to their large population base, the supply–demand ratios are significantly lower, resulting in considerable service pressure. In such areas, per capita access to services is limited, reflecting the strained service responsiveness typical of high-density urban districts.
Overall, the supply–demand ratios of community public service facilities exhibit a pattern of “peripheral concentration and core strain,” revealing that there remains room for improvement in the quantitative alignment between facility distribution and population patterns.

4.1.2. Demand-Side Perspective: Accessibility Assessment of Residential Communities

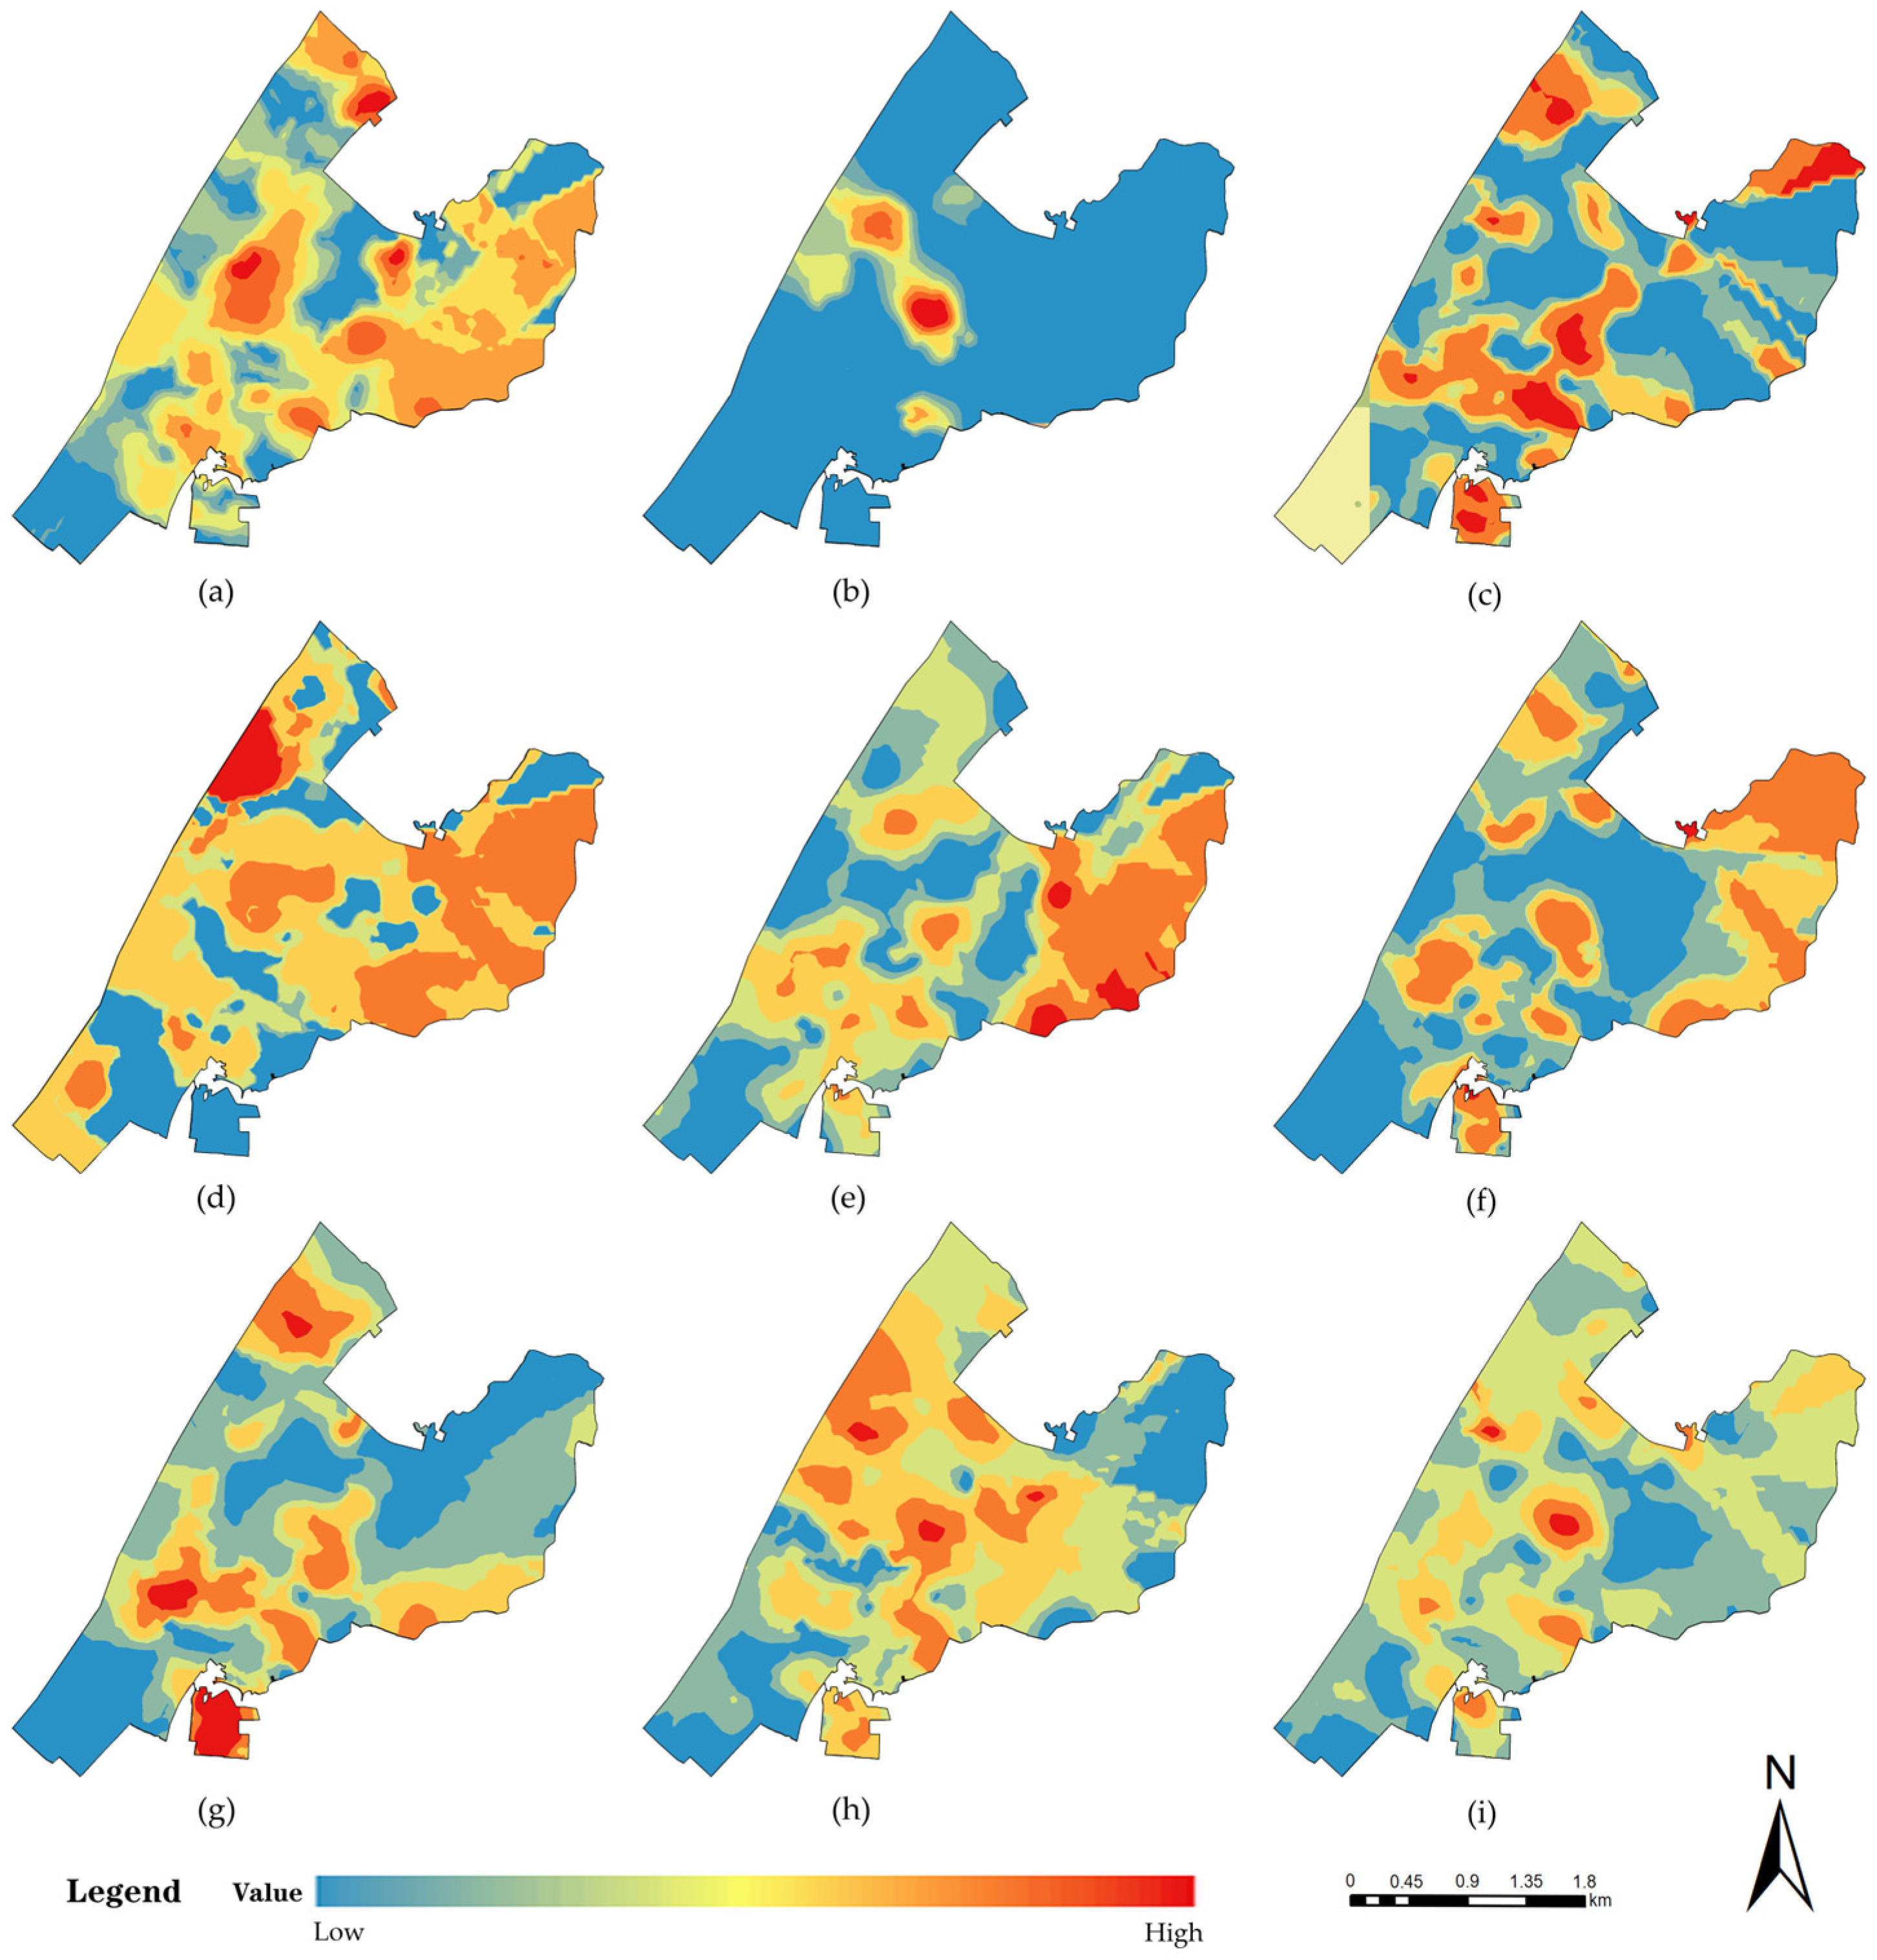
This section is based on the second stage of the 2SFCA method, taking residential communities as origin points and community public service facilities as destinations. A 15 min walking origin–destination (OD) time-cost matrix is constructed using actual road network data. A distance decay optimization function is also introduced to quantify the level of service accessibility under realistic travel conditions.
The results (Figure 4) indicate significant spatial variation in facility types at the subdistrict level, which can be categorized into two distribution patterns. The first type includes elderly care facilities, child care facilities, health care facilities, community meal service facilities, and cultural recreational facilities, which generally exhibit a “multi-point distribution with nodal connectivity” pattern. These facilities are primarily concentrated in central subdistricts such as Shuiguohu, Zhongnan Road, Xujiapeng, and Nanhu, where some areas have already developed relatively continuous service coverage networks. These areas benefit from higher facility density and more balanced spatial distribution, resulting in strong accessibility and connectivity advantages.
The second type of facilities—including infant care facilities, child recreation facilities, domestic convenience facilities, and sports fitness facilities—exhibit a concentrated layout with distinct regional differentiation. Infant care and child recreation facilities are highly concentrated in the Xujiapeng and Shuiguohu subdistricts, while most other areas display generally low levels of accessibility. Domestic convenience facilities form localized high-value clusters in the Donghu Scenic Area; however, in densely populated central areas, they show a contradictory “high supply–low accessibility” pattern, indicating substantial service pressure. Sports fitness facilities exhibit a “higher in the north, lower in the south” spatial pattern, with subdistricts in the southern part, such as Baishazhou, facing insufficient accessibility.
Overall, the accessibility pattern of community public service facilities exhibits a spatial gradient structure of “high in the center, low at the periphery,” which contrasts with the previously identified supply–demand ratio results. Central subdistricts such as Shuiguohu and Zhongnan Road, with dense and diverse facilities, show high cumulative service values in the accessibility model, indicating a clear advantage in accessibility. In contrast, peripheral areas such as Baishazhou and Ziyang suffer from sparse facility distribution and limited service coverage, resulting in low service acquisition levels and the formation of typical low-accessibility zones.

4.1.3. Matching Perspective: Spatial Equity Analysis of Service Facilities

(1)
Macro-Level Evaluation of Supply–Demand Spatial Distribution Based on the Gini Coefficient
At the macro level, this study uses the entire study area as the evaluation unit. Based on accessibility levels measured by the 2SFCA method, and combined with the Gini coefficient and Lorenz curve, it systematically evaluates the accessibility disparities of different types of community public service facilities (Table 3). As a classical indicator of resource distribution inequality, the Gini coefficient has been widely applied across multiple disciplines, including urban planning, due to its broad applicability in equity analysis. Given that the supply–demand matching of community public service facilities essentially reflects the spatial equity of social resource allocation, this methodological framework is particularly well-suited and explanatory for the present study.
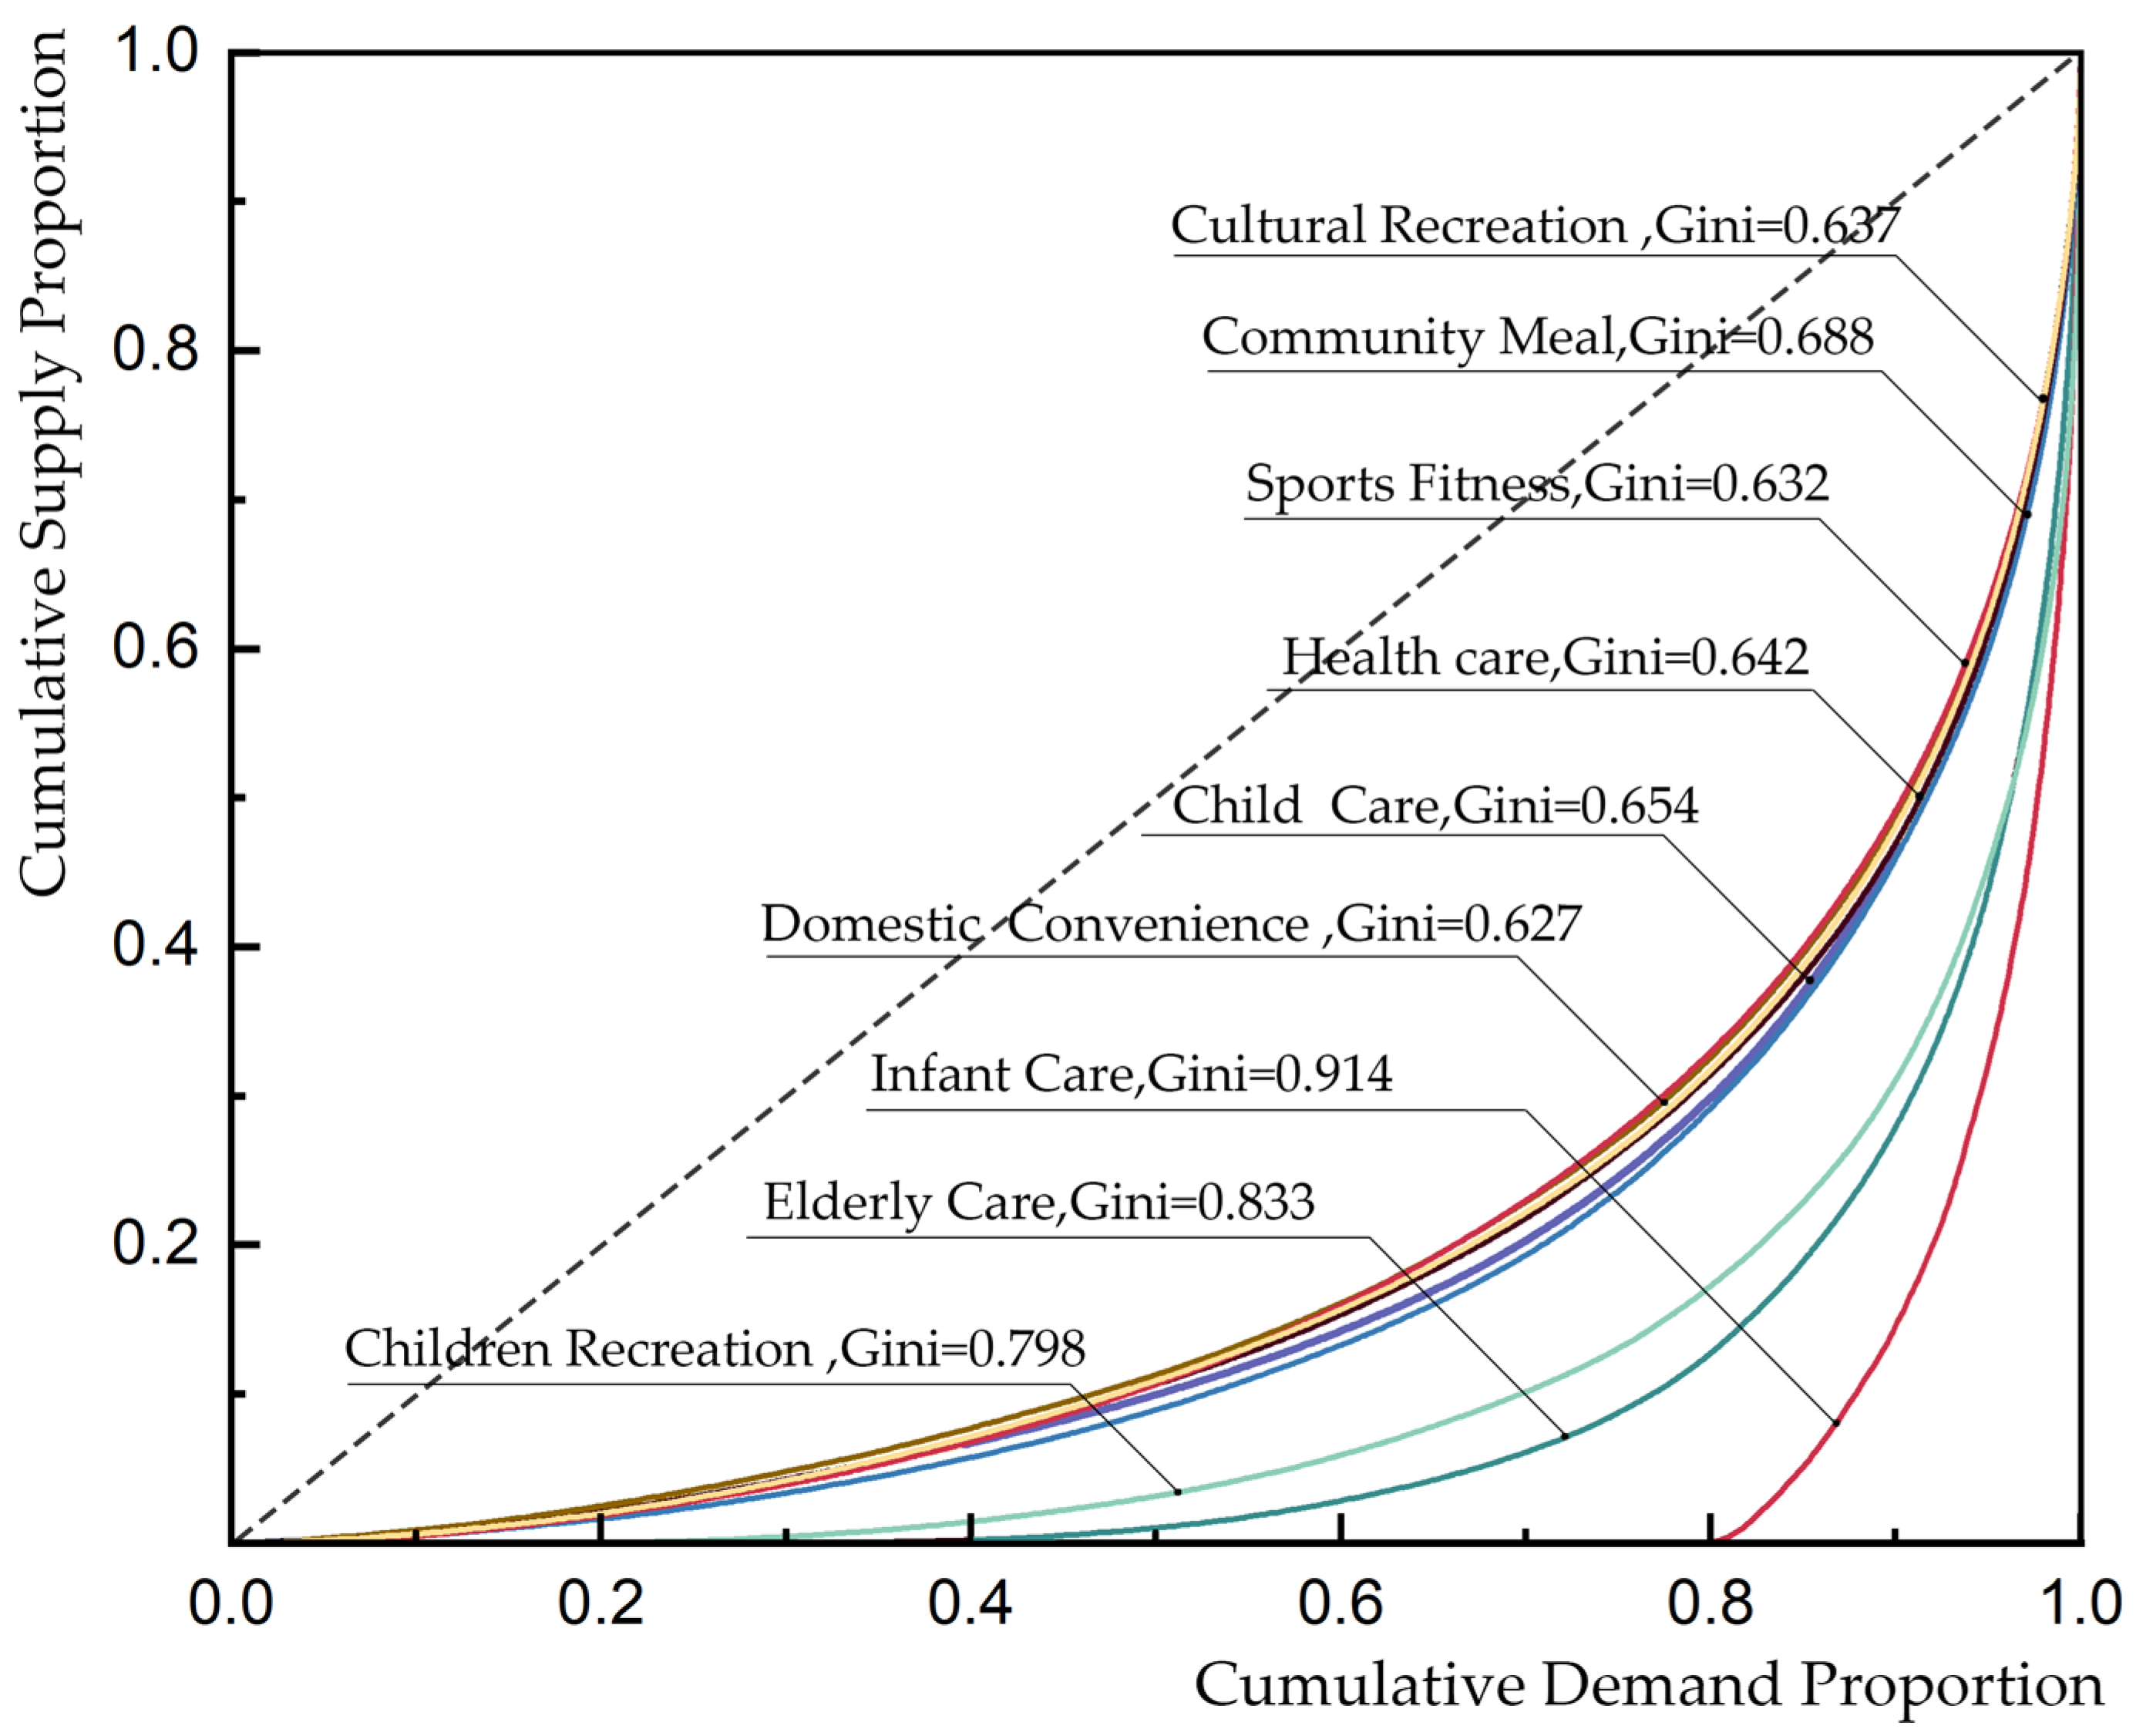
To enhance the robustness of the results, we applied bootstrap resampling (R = 2000) to the point estimates of the Gini coefficient and constructed BCa 95% confidence intervals. The findings show pronounced inequality in accessibility across facility types, with estimates that are statistically reliable. Elderly care facilities had a Gini coefficient of 0.833 (95% CI = [0.824, 0.869]), infant care 0.914 (CI = [0.899, 0.935]), and child care 0.798 (CI = [0.778, 0.801]); child recreation 0.654 (CI = [0.632, 0.667]), community meal 0.668 (CI = [0.647, 0.674]), and domestic convenience 0.627 (CI = [0.610, 0.659]); health care 0.642 (CI = [0.594, 0.648]), sports fitness 0.632 (CI = [0.603, 0.661]), and cultural recreation 0.637 (CI = [0.612, 0.646]). Overall, the confidence intervals for all facility types remained relatively narrow (approximately 0.03–0.06) and consistently fell within the same inequality category, indicating that statistical variation does not alter the interpretation and that the results are robust.
The results (Figure 5) show that the Gini coefficients for all facilities in Wuchang District all exceed 0.6, significantly surpassing the internationally recognized equity warning threshold of 0.4, indicating severe spatial inequality in facility accessibility. This result highlights a spatial imbalance in resource allocation and reflects a structural mismatch between urban planning and the social service delivery system. The Lorenz curve deviates significantly from the line of absolute equity (y = x), with a large enclosed area, further demonstrating insufficient distributional equity and the urgent need to improve spatial allocation efficiency.
In terms of facility type, the Gini coefficients for elderly care facilities (0.833), infant care facilities (0.914), child recreation facilities (0.654), and child care facilities (0.798) all fall within the range of severe inequality, indicating significant spatial mismatches in service accessibility for elderly and child populations. The high Gini coefficient for elderly care facilities suggests that their provision fails to effectively cover areas with high concentrations of older adults, revealing an inadequate early planning response to population aging. The extreme imbalance observed for infant care facilities (0.914) highlights the limited capacity of the current public service system following the implementation of the “universal two-child” policy, reflecting a dual constraint of outdated planning standards and underdeveloped market-based supply mechanisms. The spatial imbalance in the distribution of child recreation and child care facilities further underscores systemic weaknesses in developing child-friendly urban environments—likely constrained by factors such as insufficient land allocation for public services and the low prioritization of children’s spatial needs in resource planning.
In addition, the Gini coefficients for community meal services (0.668), domestic convenience facilities (0.627), health care facilities (0.642), sports fitness facilities (0.632), and cultural recreation facilities (0.637) all significantly exceed the equity warning threshold, indicating widespread spatial inequality in the distribution of multiple types of daily-life service facilities. The imbalance in the distribution of community meal service facilities may be attributed to limited participation of social capital and a lack of diversified service models, which hinders effective coverage of the elderly, especially those living alone. The spatial mismatch of domestic convenience facilities reflects a structural disconnect between market supply and residents’ actual needs, particularly in aging neighborhoods. Health care facilities exhibit a pattern of “core-area concentration with multiple secondary clusters,” suggesting a layout that favors localized high-density coverage over broad, equitable distribution—possibly linked to disparities in resource prioritization and regional public health governance capacity. The spatial imbalance of sports fitness and cultural recreation facilities reflects a persistent shortage of public activity spaces in cities, which not only undermines residents’ well-being but also potentially exacerbates socio-spatial segregation. In the context of rapid urbanization, such spatial inequalities may deepen disparities in resource access through the “Matthew effect,” reinforcing systemic exclusion of vulnerable groups and undermining pathways toward social equity and spatial justice.
(2)
Micro-Level Evaluation of Supply–Demand Spatial Distribution Based on Location Entropy
At the micro level, residential communities are used as the evaluation units. The location entropy method is applied to measure the differences in accessibility relative to the overall level of Wuchang District, thereby revealing the spatial differentiation patterns of public service facility accessibility within the study area (Figure 6). Specifically, the location entropy of each residential community is defined as the ratio of its facility accessibility to the overall accessibility level of the district. Based on the computed location entropy values, residential communities are classified into five levels (Table 4) to examine the micro-scale spatial supply–demand matching pattern derived from location entropy classification.
(1)
Low-value dominated type: Elderly care facilities, infant care facilities, and child recreation facilities
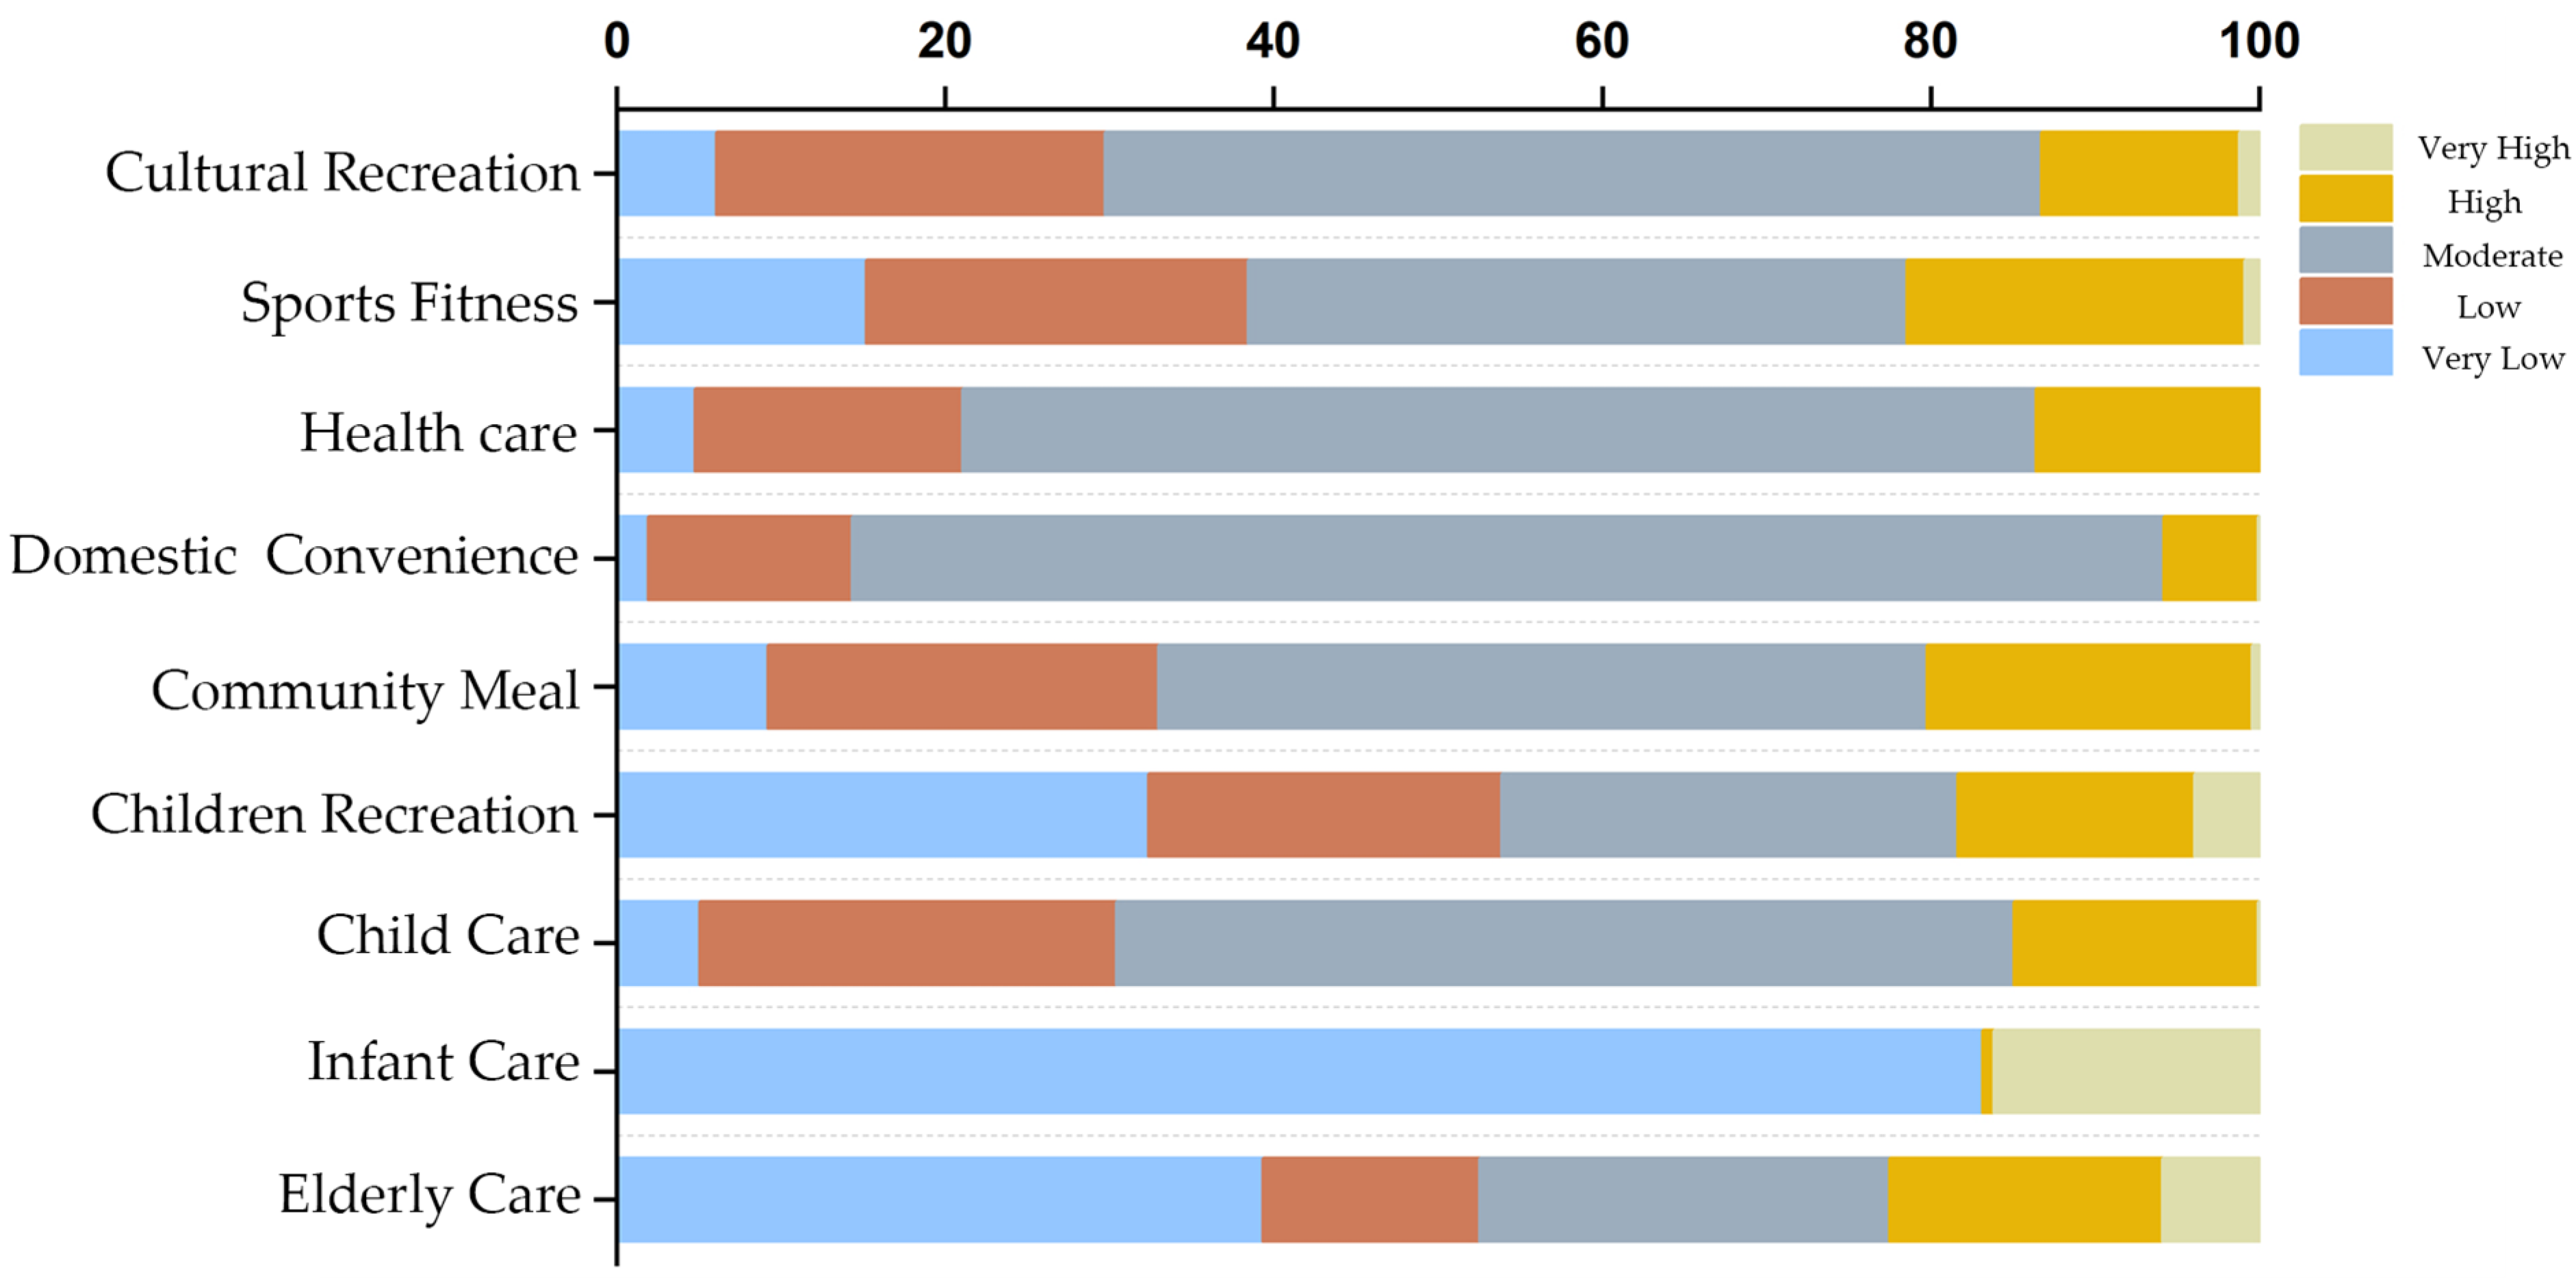
As shown in Figure 6 and Figure 7, over 50% of elderly care facilities (0.933), infant care facilities (0.914), and child recreation facilities (0.654) are located in areas with low location entropy values (classified as very low and low), indicating a clear dominance of low accessibility. Overall, more than half of the residential communities in Wuchang District fall below the district-wide average in terms of facility accessibility, with pronounced spatial disparities. Subdistricts such as Baishazhou and Ziyang in the south, and Yanyang in the north, are particularly notable for severe service provision deficiencies. In response to this situation, it is essential to prioritize resource allocation in low-accessibility areas, optimize facility distribution and configuration, and progressively narrow accessibility disparities to enhance spatial equity and improve overall resident well-being.
(2)
Median-stable type: Children care facilities, domestic convenience facilities, health care facilities, and cultural recreation facilities
Within the moderate location quotient range (Figure 6 and Figure 7), the proportions of children care facilities, domestic convenience, health care, and cultural and recreation facilities are 54.64%, 79.85%, 65.36%, and 56.98%, respectively, exhibiting a “central bulge and tapering ends” distribution pattern. This pattern indicates that most communities exhibit a moderate level of facility accessibility, suggesting a certain degree of robustness. However, the Gini coefficients for these four facility types all exceed 0.6—specifically 0.798, 0.627, 0.642, and 0.637—indicating considerable overall inequality in accessibility distribution. Although communities with moderate accessibility account for the majority, a substantial number of neighborhoods fall into either extremely low or extremely high accessibility categories, preventing a balanced supply–demand relationship. Therefore, enhancing accessibility in low-access areas and curbing excessive clustering in high-access zones are critical strategies for optimizing the spatial layout and promoting service equity for these facility types.
(3)
High-value driven type: community meal facilities and sports fitness facilities
Within the high-value range of location quotient (higher and extremely high levels) (Figure 6 and Figure 7), community meal and sports fitness facilities account for 20.23% and 21.43%, respectively, indicating a relatively high proportion and a pronounced pattern of high accessibility. The Gini coefficients for these two types of facilities are 0.668 and 0.632, respectively, both exceeding 0.6, suggesting a certain degree of spatial imbalance. Overall, although these facilities exhibit relatively high accessibility in certain neighborhoods and effectively support residents’ daily living and health needs in local areas, their high accessibility is concentrated in a few areas, such as Zhongnan Road Subdistrict and Shuiguohu Subdistrict, leading to a concentration of resource allocation and insufficient overall spillover effects. Therefore, it is necessary to maintain service levels in well-performing areas while further optimizing the spatial layout of facilities, expanding the coverage of high-accessibility service zones, and enhancing overall spatial equity and inclusiveness.

4.2. Analysis of the Spatial Value Effect of Community Public Service Facility Accessibility on Housing Prices

After identifying the supply–demand patterns of facilities, it is necessary to further examine their transformation effects on housing prices. Accessibility, as an integrated representation of supply–demand relationships, not only affects everyday convenience but also shapes the spatial pattern of housing prices. This section employs the “accessibility–housing price” four-quadrant model to identify mismatch types and applies the MGWR model to reveal the spatial heterogeneity of facility effects on housing prices and the underlying mismatch mechanisms.

4.2.1. Spatial Correlation Analysis Between Community Public Service Facility Accessibility and Housing Prices

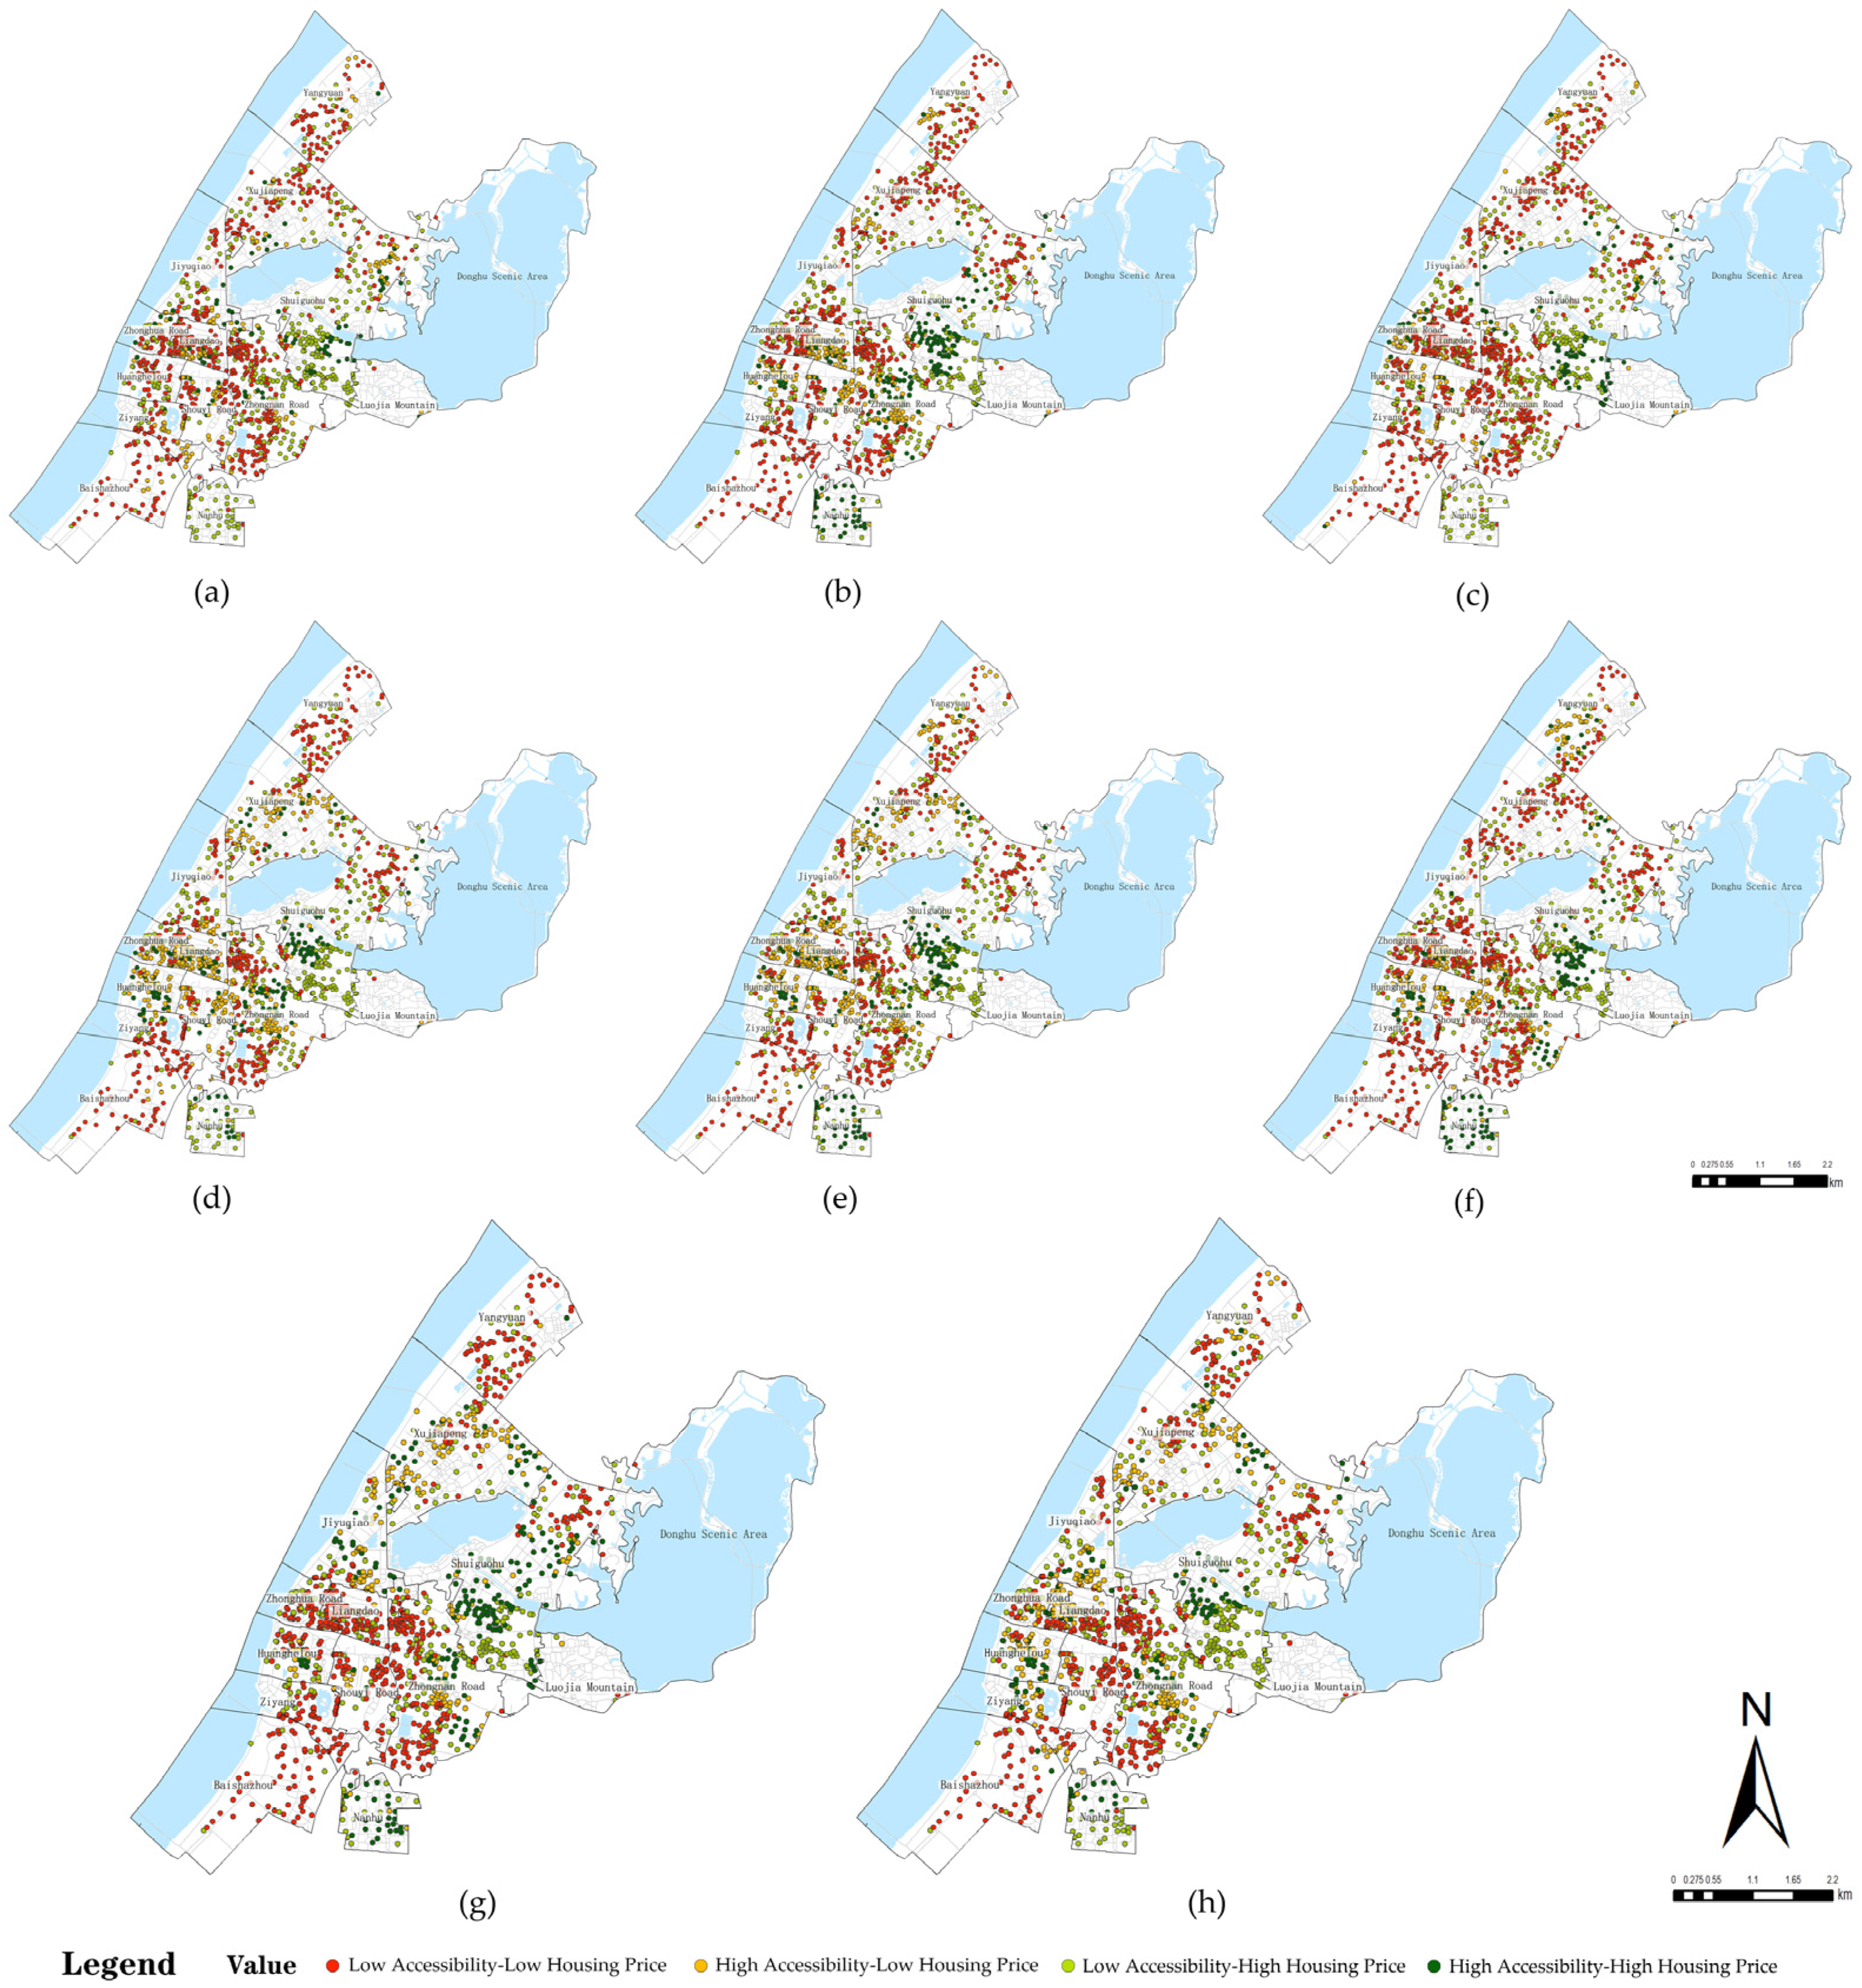
This study applies the natural breaks method to classify both service facility accessibility and housing prices, categorizing each into “high” and “low” levels. On this basis, spatial overlay analysis is employed to construct four typical combination types—low accessibility–low housing price, high accessibility–low housing price, low accessibility–high housing price, and high accessibility–high housing price—thereby revealing the spatial coupling patterns between service provision and housing value (Figure 8). It should be noted that infant care facilities are excluded from the subsequent analysis due to an insufficient number of samples within the study area.
Overall, the study area exhibits a pronounced pattern of mismatch. The “low accessibility–low housing price” type is the most widespread, concentrated in peripheral subdistricts and aging residential communities, reflecting the combined effects of resource scarcity and market stagnation. The “low accessibility–high housing price” areas rank second in proportion, indicating that service facility provision has lagged significantly in certain high-priced locations, embodying the feature of “development first, services delayed.” The “high accessibility–low housing price” areas account for a moderate share, suggesting that some mid- and low-priced neighborhoods, despite having relatively sound service foundations, have not yet seen their value effectively capitalized, possibly due to factors such as affordability, facility quality, or utilization efficiency. The “high accessibility–high housing price” areas are the least common, highlighting the scarcity of zones where services and markets are highly aligned, yet underscoring their crucial demonstration value.
At the facility-type level, a relatively high proportion of child recreation, community meal, domestic convenience, health care, and cultural recreation facilities fall into the “high accessibility–low housing price” category. This suggests that although these facilities are sufficiently supplied, their capacity for market value conversion remains limited, reflecting weak capitalization potential. In contrast, elderly care, child care, and sports fitness facilities are more concentrated in the “high accessibility–high housing price” areas, indicating that their services better align with residential demand and possess stronger market adaptability and premium potential.
At the subdistrict scale, the distributional differences among the four combination types become more pronounced (Table 5). The “low accessibility–low housing price” type is mainly concentrated in Baishazhou and Ziyang Subdistricts. The “high accessibility–low housing price” type is mostly found in western subdistricts such as Huanghelou, Shouyi Road, and Liangdao, reflecting insufficient capitalization. The “low accessibility–high housing price” and “high accessibility–high housing price” types are mainly located in central and eastern areas such as Donghu Scenic Area, Nanhu, Luojia Mountain, and Shuiguohu Subdistricts. The former indicates that service provision lags behind urban development, while the latter combines service advantages with market premiums, forming priority zones for future optimization.

4.2.2. Spatial Heterogeneity Analysis of the Effect of Community Public Service Facility Accessibility on Housing Prices

By incorporating the assumption of spatial non-stationarity, the MGWR model effectively captures the spatial heterogeneity of explanatory variables on housing prices, making it a powerful tool for analyzing the mechanisms of urban housing price differentiation. This study uses residential communities in Wuchang District, Wuhan, as the empirical sample, with 2024 s-hand housing listing prices set as the dependent variable. Although there is a temporal lag between listing prices and actual transaction prices, in large samples they still provide a reasonably accurate reflection of housing price levels and market expectations. The independent variable system covers three categories—structural attributes, neighborhood attributes, and locational attributes—comprising 17 indicators in total (Table 6), thereby ensuring a multidimensional representation of influencing factors. Specifically, these include four structural attributes (e.g., floor area ratio, building age), five neighborhood attributes (e.g., distance to parks, hospitals, and commercial district), and eight locational attributes (e.g., accessibility to various types of community public service facilities). All independent variables correspond to 2024 data to ensure temporal consistency with the dependent variable.
First, spatial autocorrelation analysis was conducted on the model’s dependent variable—the 2024 housing prices of residential communities in Wuchang District, Wuhan—to test whether significant spatial autocorrelation and clustering patterns exist, thereby providing a basis for applying subsequent spatial regression models. The global Moran’s I index is 0.143326 (p < 0.01), significant at the α = 0.01 level, indicating a pronounced spatial positive correlation of housing prices in the study area, that is, a clear spatial clustering effect: high-priced communities tend to cluster into high-value zones, while low-priced communities also exhibit low-value clustering, reflecting the spatial differentiation characteristics of the housing market in Wuchang District.
Subsequently, the 17 independent variables were subjected to multicollinearity and significance tests to ensure that the variables included in the model were both independent and statistically significant. Based on the multicollinearity test (variance inflation factor, VIF < 7.5) and significance test (p < 0.1), five variables that were either insignificant or exhibited multicollinearity were excluded. Specifically, the excluded variables included: X1 (floor area ratio), X5 (distance to the nearest park), X13 (accessibility of community meal facilities within a 15 min walking range), X14 (accessibility of domestic convenience facilities within a 15 min walking range), and X15 (accessibility of health care facilities within a 15 min walking range). This filtering process ensured the independence and explanatory power of the model variables, thereby laying a solid foundation for the subsequent spatial heterogeneity analysis.
The results (Table 7) show that the green coverage ratio [36] and metro accessibility [63] all exert positive effects on housing prices, whereas building age [37] exhibits a significant negative effect. This conclusion is largely consistent with existing research. In terms of distance-related factors, the negative externalities of hospitals make residences located farther from them more attractive, while the traffic congestion and environmental pressures surrounding commercial centers lead to relatively higher market preference in some more distant areas. These results are also consistent with findings reported in previous studies, which suggest that although hospitals [39,64] and commercial district [65] generally generate positive premiums due to their convenience, negative externalities such as noise and traffic congestion may diminish this advantage and even depress housing prices at very close distances. However, the negative effect of educational resources on housing prices appears counterintuitive [38,66]. This may be attributed to increased population density, traffic congestion, and school-related noise, which together reduce the residential attractiveness of these areas [67].
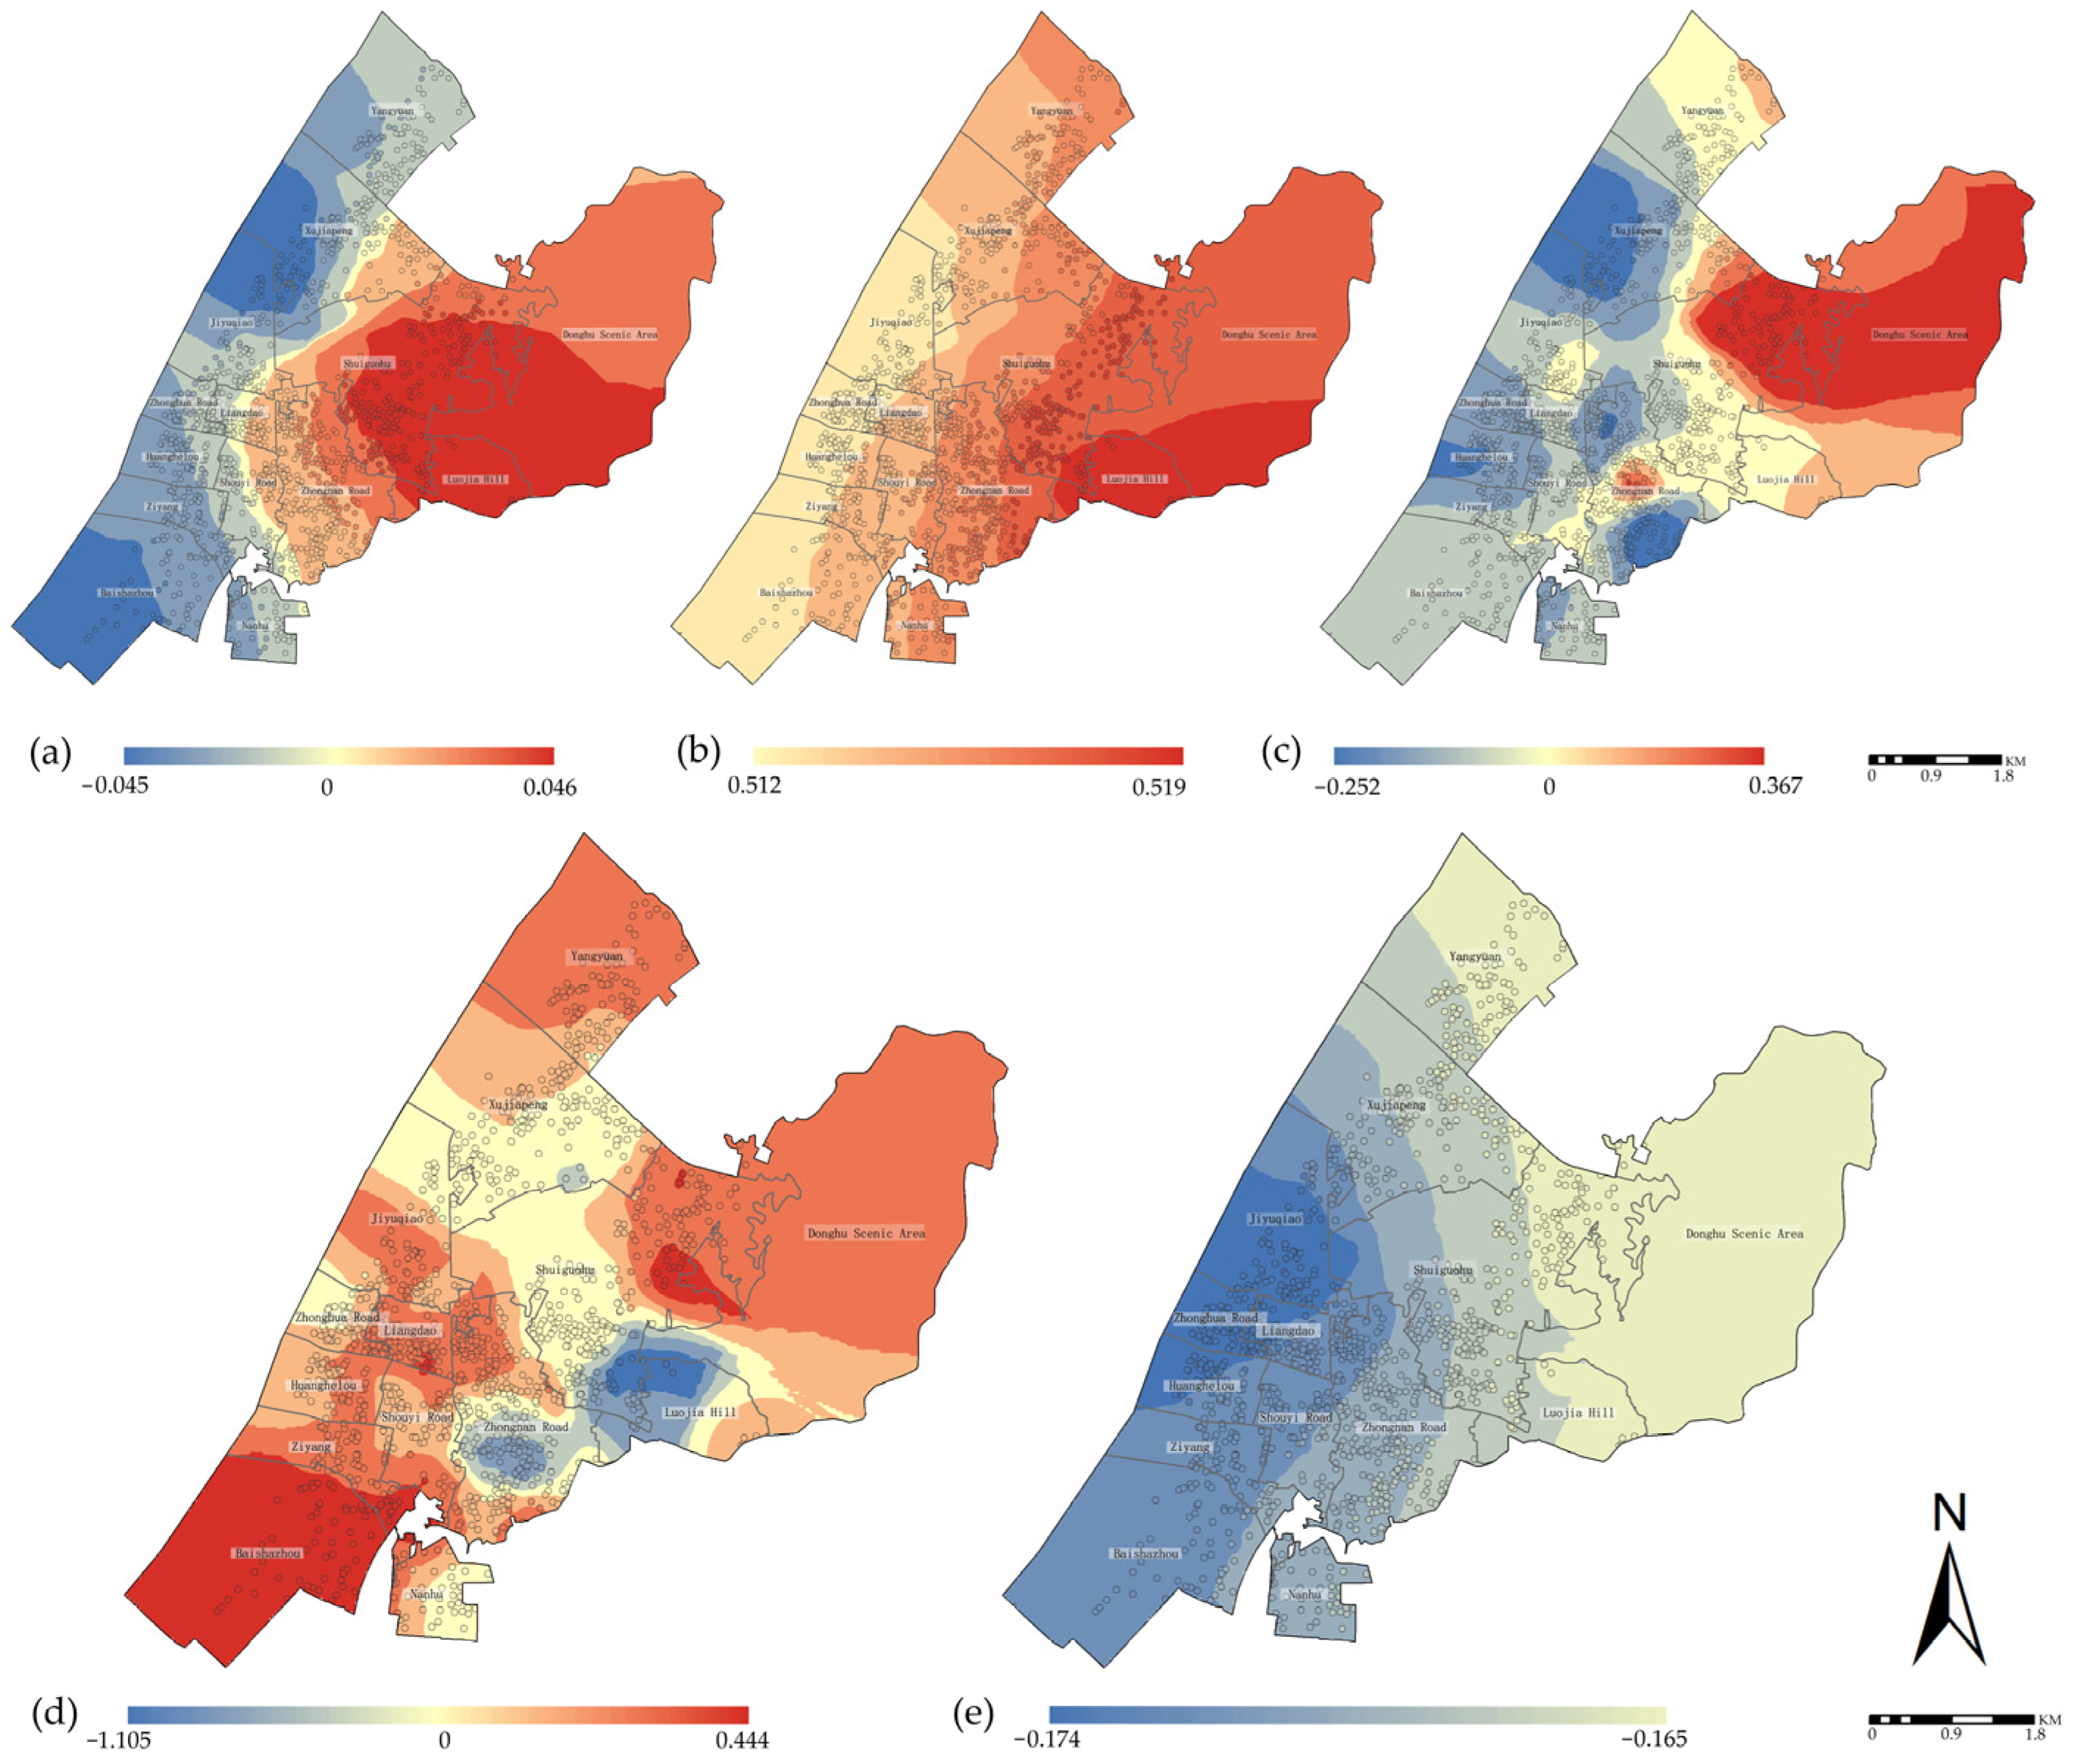
The empirical results of the MGWR model (Figure 9) show that the impact of accessibility to different types of community public service facilities on housing prices varies significantly, exhibiting pronounced type-specific heterogeneity and spatial differentiation. The accessibility of elderly care facilities has a slightly positive overall impact on housing prices, with regression coefficients ranging from −0.0450 to 0.0463 and a mean value of 0.0024, showing a spatial pattern of “higher in the east, lower in the west.” Eastern subdistricts such as Shuiguohu, Donghu Scenic Area, and Luojiashan exhibit relatively high coefficients, indicating a certain degree of capitalization. In contrast, western areas such as Huanghelou, Yangyuan, and Ziyang show mostly negative effects, suggesting regional disparities in residents’ willingness to pay for service convenience. Child care facilities show the most significant impact on housing prices, with regression coefficients ranging from 0.5128 to 0.5190 and an average of 0.5152, indicating a stable and strong positive effect. This effect is mainly concentrated in areas such as Zhongnan Road, Shuiguohu, and Luojiashan, suggesting that this type of “household-essential” service has been highly capitalized. In contrast, the accessibility of children recreation facilities shows a slightly negative correlation with housing prices, with regression coefficients ranging from −0.253 to 0.367 and an average of −0.024. This may be attributed to negative externalities caused by noise, environmental burden, or a mismatch between service users and homebuyers. Positive effects are observed only in a few areas such as Shuiguohu and Luojiashan, while most other regions exhibit negative impacts, reflecting significant spatial imbalance. The capitalization potential of sports fitness facilities is even weaker, with regression coefficients ranging from −1.105 to 0.444 and a mean of −0.111. Core areas such as Zhongnan Road and Luojiashan generally exhibit negative spillover effects, while peripheral areas such as Baishazhou and Donghu Scenic Area occasionally show positive responses, indicating spatial heterogeneity in residents’ acceptance. Cultural recreation facilities exert a relatively weak impact on housing prices, with coefficients ranging from −0.175 to −0.165 and an average of −0.170, showing a slight overall negative correlation. Although accessibility is relatively high in some areas, limitations related to service quality, functional composition, and surrounding environment prevent the realization of positive price premiums.

5. Discussion

5.1. Key Findings and Summary

The Gini coefficients of all community public service facilities in the study area are above 0.6, exceeding the international warning threshold of 0.4. Elderly care (0.933), infant care (0.914), and children recreation (0.798) show the highest inequality, reflecting acute supply–demand imbalances. Location quotient analysis further supports this finding: in low-value areas, the proportions of neighborhoods covered by these facilities are 52.53%, 83.17%, and 53.89%, respectively, underscoring substantial disparities in accessibility and indicating that many neighborhoods fall well below the regional average. This finding is consistent with empirical evidence from Shanghai. In the central districts of the city, scholars have identified a paradox in elderly care facilities, where both undersupply and oversupply coexist. This dual condition constrains service quality while simultaneously leading to resource waste [68]. International research has also revealed similar problems. For instance, in Florida, USA, low-income households face substantially longer commuting distances to access infant care services, reflecting systemic inequities in provision [69]. Taken together, these cases demonstrate that in both Chinese and international contexts, elderly and children facilities commonly experience supply–demand mismatches and spatial inequities, highlighting the urgent need for targeted policy intervention and refined planning strategies.
Theoretically, facility accessibility is expected to align with housing price levels. However, empirical results show that “low accessibility–high housing price” (27.88%) and “high accessibility–low housing price” (17.20%) account for relatively large proportions, while “high accessibility–high housing price” represents only 14.04%. This reveals two typical forms of mismatch: (1) a demand-oriented mismatch, where housing prices are high but facility supply is inadequate; and (2) a supply-redundant mismatch, where facility accessibility is high but housing prices do not exhibit significant premiums. The MGWR results further demonstrate that capitalization effects are weak in the western part of the study area, whereas the central and eastern zones show strong premiums associated with higher accessibility. This disparity does not stem from the spatial distribution of facilities but from the varying effect strengths of the same facility types across different areas. Elderly care and children recreation facilities tend to have negative or insignificant effects in the west but positive effects in the east. Child care facilities exhibit positive effects in both areas, with stronger impacts in the east. Overall, the eastern part shows more pronounced positive effects, driving up housing prices. These findings suggest that the regional heterogeneity of facility capitalization effects is a key driver of spatial mismatches. Similar disparities have been documented in Europe and the United States: education, green space, and transport facilities often generate housing price premiums in central urban areas but have limited influence in peripheral zones [70,71], indicating that capitalization effects are not linear but are jointly shaped by demographic structure, land use, and market demand.

5.2. Contributions to Theory and Method

This study expands the analytical framework of public service facility research at the theoretical level. Previous studies have largely concentrated on a single dimension—either emphasizing the spatial equity of facility distribution or exploring their capitalization effects on housing prices—often treating the two as disconnected domains. This study develops an integrated analytical framework that links “supply–demand assessment” with “value effects,” positioning facility accessibility as the key nexus between spatial equity and market response. It demonstrates how imbalances in service resource allocation can translate into price mismatches in the housing market. This approach challenges the traditional linear assumption that “facility improvements inevitably drive up housing prices” [72]. By emphasizing two heterogeneous scenarios—redundant supply and unmet demand—it advances a deeper understanding of the complex relationship between service facilities and spatial value.
The methodological innovation of this study lies in employing accessibility, calculated through an improved 2SFCA method, as the core explanatory variable in the MGWR model. Unlike traditional approaches that approximate accessibility using coarse-grained variables such as facility counts, nearest distances, or POI density [73], the 2SFCA method incorporates facility supply, population demand, and distance decay to generate accessibility values, offering a more realistic representation of residents’ actual opportunities to obtain services. Incorporating this refined metric into the MGWR model not only reduces estimation bias but also enhances the capacity to identify and interpret the spatial heterogeneity of accessibility–housing price capitalization effects. The resulting “2SFCA → MGWR” coupling pathway provides a replicable approach for jointly evaluating spatial equity and value effects within a unified framework, while also establishing a more robust parameter foundation for policy simulation.

5.3. Practical Implications

This study identifies two typical mismatch patterns—“low accessibility–high housing price” and “high accessibility–low housing price.” These findings suggest that public service facility planning should move beyond mere quantitative expansion and instead implement differentiated interventions tailored to neighborhood characteristics. In “low accessibility–high housing price” areas, policies should prioritize addressing service deficits to align facility provision with residential value. Conversely, in “high accessibility–low housing price” areas, interventions should focus on functional optimization and environmental improvements to enhance the practical value of facilities and avoid resource waste. Such a classification-based strategy provides a solid basis for the precise allocation of limited fiscal resources.
At the same time, the study demonstrates that improvements in public services do not automatically yield housing price premiums; their effects are often contingent on governance models and policy coordination. When service provision is decoupled from housing regulation, the intended value may remain unrealized. Governments should therefore integrate facility planning with housing policy within a unified governance framework, supported by dynamic evaluation and feedback mechanisms that promote a virtuous cycle between supply–demand alignment and market response. This approach not only helps to avoid inefficiencies such as “facilities without value” or “high prices with low provision,” but also enables a more stable balance between equity and efficiency.

5.4. Limitations and Future Directions

This study still has certain limitations in terms of data and methodology. First, as the analysis covers multiple types of facilities, the supply–demand matching is conducted with the overall population as the reference. This approach does not fully reflect differences among population groups in service needs, usage frequency, and sensitivity to accessibility, which may underestimate the complexity of equity issues. Second, in the MGWR model, listing prices are employed as a proxy for housing prices. While this measure is broadly representative, it deviates from actual transaction prices, leaving the precision and explanatory power of the results to be further improved.
Future research can be extended in two directions: (1) integrating time-series data to conduct dynamic analyses that uncover the evolution of facility supply and housing price effects, as well as potential lag effects, thereby allowing a more accurate assessment of the long-term impacts of policy interventions; and (2) applying artificial intelligence methods to integrate multi-source data such as large-scale POIs, mobility trajectories, and activity frequencies, which can enhance predictive and simulation capacities and enable a more comprehensive examination of the complex coupling between public service facilities and the housing market.

6. Conclusions

As cities enter a stage of low incremental growth, the interaction between the supply–demand patterns of public service facilities and the real estate market has drawn increasing attention, with economic capitalization effects becoming particularly critical. Existing studies, however, often examine these issues from a single perspective, making it difficult to capture their underlying connections. This study focuses on Wuchang District in Wuhan and develops an integrated spatial framework that links “supply–demand assessment” with “value effects.” This study applies an improved 2SFCA method to measure accessibility for multiple facility types. In addition, it employs the “accessibility–housing price” four-quadrant model and MGWR to identify spatial mismatches between facility provision and market value. These methods move beyond the traditional separation of facility configuration and market value by introducing an integrated evaluation approach. As a result, the findings offer deeper insight into the relationship between service equity and value responsiveness in high-density urban settings. The findings provide quantitative support for promoting spatial equity in cities and optimizing the supply of community facilities. They also offer empirical evidence to help governments shape housing market expectations and implement differentiated interventions. The study therefore carries both theoretical significance and practical value.

Author Contributions

Conceptualization, Y.L. and X.Y.; methodology, Y.L. and X.Z.; software, X.Z.; validation, Y.L., X.Z. and X.Y.; formal analysis, Y.L. and X.Z.; investigation, Y.L. and X.Z.; resources, X.Y.; data curation, X.Z. and X.Y.; writing—original draft preparation, Y.L. and X.Z.; writing—review and editing, X.Z. and X.Y.; visualization, X.Z.; supervision, X.Y.; project administration, X.Y.; funding acquisition, Y.L. All authors have read and agreed to the published version of the manuscript.

Funding

This research was funded by National Natural Science Foundation of China Project (No.52578074), Humanities and Social Science Project of Ministry of Education (No.24YJAZH083).

Data Availability Statement

Road network and river system data were obtained from the OpenStreetMap platform (https://www.openstreetmap.org); study area boundaries, subdistrict administrative divisions, and point-of-interest (POI) data were collected from the Amap Open Platform (https://lbs.amap.com); residential community data were retrieved from the Anjuke real estate platform (https://www.anjuke.com); and demographic statistics were derived from the Seventh National Population Census published by the Wuchang District People’s Government.

Acknowledgments

We would like to thank the editors and reviewers for providing constructive comments on this manuscript.

Conflicts of Interest

The authors declare that they have no known competing financial interest or personal relationships that could have appeared to influence the work reported in this paper.

References

  1. He, X.; Zhou, Y.; Yuan, X.; Zhu, M. The coordination relationship between urban development and urban life satisfaction in Chinese cities-An empirical analysis based on multi-source data. Cities 2024, 150, 105016. [Google Scholar] [CrossRef]
  2. Wen, C.; Albert, C.; Von Haaren, C. The elderly in green spaces: Exploring requirements and preferences concerning nature-based recreation. Sustain. Cities Soc. 2018, 38, 582–593. [Google Scholar] [CrossRef]
  3. Zang, Y.; Wang, H.; Huang, J.; Liu, G.; Li, J. Community disaster resilience assessment and external association characteristics analysis based on accessibility of service facilities: From the perspective of 15-minute life circle. Sustain. Cities Soc. 2025, 118, 106051. [Google Scholar] [CrossRef]
  4. Dong, S.; Esmalian, A.; Farahmand, H.; Mostafavi, A. An integrated physical-social analysis of disrupted access to critical facilities and community service-loss tolerance in urban flooding. Comput. Environ. Urban. Syst. 2020, 80, 101443. [Google Scholar] [CrossRef]
  5. Luo, Y.; Zou, G.; Liu, Q. Relationships between community public service facilities and social capital: An exploratory study of Harbin, China. PLoS ONE 2025, 20, e0318144. [Google Scholar] [CrossRef] [PubMed]
  6. Ma, W.; Wang, N.; Li, Y.; Sun, D. 15-min pedestrian distance life circle and sustainable community governance in Chinese metropolitan cities: A diagnosis. Humanit. Soc. Sci. Commun. 2023, 10, 1–14. [Google Scholar] [CrossRef]
  7. Wei, W.; Ren, X.; Guo, S. Evaluation of public service facilities in 19 large cities in China from the perspective of supply and demand. Land 2022, 11, 149. [Google Scholar] [CrossRef]
  8. Yu, Y.; Zhou, R.; Qian, L.; Yang, X.; Dong, L.; Zhang, G. Supply-demand balance and spatial distribution optimization of primary care facilities in highland cities from a resilience perspective: A study of Lhasa, China. Front. Public Health 2023, 11, 1131895. [Google Scholar] [CrossRef]
  9. Wang, M.; Yuan, H.; Zhang, D.; Qi, J.; Rao, Q.; Li, J.; Tan, S. Supply-demand measurement and spatial allocation of Sponge facilities for Sponge city construction. Ecol. Indic. 2023, 148, 110141. [Google Scholar] [CrossRef]
  10. Song, L.; Kong, X.; Cheng, P. Supply-demand matching assessment of the public service facilities in 15-minute community life circle based on residents’ behaviors. Cities 2024, 144, 104637. [Google Scholar] [CrossRef]
  11. Fei, H.; Renchao, L. Matching of supply and demand for community service-oriented home care facilities based on accessibility measurement: A case study of Nanjing. Econ. Geogr. 2020, 40, 91–101. [Google Scholar]
  12. Wang, F. Inverted two-step floating catchment area method for measuring facility crowdedness. Prof. Geogr. 2018, 70, 251–260. [Google Scholar] [CrossRef]
  13. Fedotenkov, I.; Idrisov, G. A supply-demand model of public sector size. Econ. Syst. 2021, 45, 100869. [Google Scholar] [CrossRef]
  14. Qi, Z.; Li, Q.; Huang, Q.; Wu, T. Evaluation of supply and demand balance and spatial spillover effect of age-friendly environment. Sustainability 2023, 15, 11810. [Google Scholar] [CrossRef]
  15. Dong, Y.; Chen, X.; Lv, D.; Wang, Q. Evaluation of urban green space supply and demand based on mobile signal data: Taking the central area of Shenyang city as an example. Land 2023, 12, 1742. [Google Scholar] [CrossRef]
  16. Soler, I.; Gemar, G.; Correia, M.; Serra, F. Algarve hotel price determinants: A hedonic pricing model. Tourism Manag. 2019, 70, 311–321. [Google Scholar] [CrossRef]
  17. Wei, C.; Fu, M.; Wang, L.; Yang, H.; Tang, F.; Xiong, Y. The research development of hedonic price model-based real estate appraisal in the era of big data. Land 2022, 11, 334. [Google Scholar] [CrossRef]
  18. Morano, P.; Tajani, F.; Guarini, M.R.; Di Liddo, F.; Anelli, D. A multivariate econometric analysis for the forecasting of the interdependences between the housing prices and the socio-economic factors in the city of Barcelona (Spain). In Computational Science and Its Applications—ICCSA 2019; Misra, S., Gervasi, O., Murgante, B., Stankova, E., Korkhov, V., Torre, C., Rocha, A.M.A.C., Taniar, D., Apduhan, B.O., Tarantino, E., Eds.; Springer: Cham, Switzerland, 2019; pp. 13–22. [Google Scholar]
  19. Charlton, M.; Brunsdon, C.; Fotheringham, A. Geographically weighted regression-modelling spatial non-stationarity. J. R. Stat. Soc. Ser. D Stat. 1998, 47, 431–443. [Google Scholar]
  20. Fotheringham, A.; Yang, W.; Kang, W. Multiscale geographically weighted regression (MGWR). Ann. Am. Assoc. Geogr. 2017, 107, 1247–1265. [Google Scholar] [CrossRef]
  21. Liu, L.; Yu, H.; Zhao, J.; Wu, H.; Peng, Z.; Wang, R. Multiscale effects of multimodal public facilities accessibility on housing prices based on MGWR: A case study of Wuhan, China. ISPRS Int. J. Geo-Inf. 2022, 11, 57. [Google Scholar] [CrossRef]
  22. Hansen, W.G. How accessibility shapes land use. J. Am. Inst. Plann. 1959, 25, 73–76. [Google Scholar] [CrossRef]
  23. Wei, Z.; Bai, J.; Feng, R. Evaluating the spatial accessibility of medical resources taking into account the residents’ choice behavior of outpatient and inpatient medical treatment. Socio-Econ. Plan. Sci. 2022, 83, 101336. [Google Scholar] [CrossRef]
  24. Li, Z.H.A.O.; Diaoxia, H.E.; Jian, Z.H.A.O. Spatial Distribution and Factors Influencing Elderly Care Service Facilities based on Accessibility Evaluation—Taking Wuxi City as an Example. J. Resour. Ecol. 2024, 15, 130–139. [Google Scholar] [CrossRef]
  25. Doi, S.; Ide, H.; Takeuchi, K.; Fujita, S.; Takabayashi, K. Estimation and evaluation of future demand and supply of healthcare services based on a patient access area model. Int. J. Environ. Res. Public Health 2017, 14, 1367. [Google Scholar] [CrossRef] [PubMed]
  26. Geletu, G.M. The qualitative and quantitative measurements of quality education for-and-against standards and indicators of high, medium and low performing primary schools in Oromia Regional State, Ethiopia. Education 2024, 3–13, 1–18. [Google Scholar] [CrossRef]
  27. Zhou, Y.; Xie, H.; Liu, X.; Wang, X.; Wang, Z. From service capacity to spatial equity: Accurately and comprehensively evaluating urban park green space distribution under multi-trips mode. PLoS ONE 2024, 19, e0296629. [Google Scholar] [CrossRef]
  28. Li, X.; Zhu, J.; Wan, J.; Wang, Z. Equilibrium in adversity: Balancing public service supply and demand during population decline. Humanit. Soc. Sci. Commun. 2024, 11, 1–15. [Google Scholar] [CrossRef]
  29. Liu, L.; Lyu, H.; Zhao, Y.; Zhou, D. An improved two-step floating catchment area (2SFCA) method for measuring spatial accessibility to elderly care facilities in Xi’an, China. Int. J. Environ. Res. Public Health 2022, 19, 11465. [Google Scholar] [CrossRef] [PubMed]
  30. Wachs, M.; Kumagai, T.G. Physical accessibility as a social indicator. Socio-Econ. Plan. Sci. 1973, 7, 437–456. [Google Scholar] [CrossRef]
  31. Peng, R.; Huang, J.; Deng, X. Spatiotemporal evolution and influencing factors of the allocation of social care resources for the older adults in China. Int. J. Equity Health 2023, 22, 222. [Google Scholar] [CrossRef]
  32. Li, H.; Li, L.; Li, Y.; Ji, Q.; Zhao, J.; Ge, Z.; Zhou, Q.; Sun, Q. A research on spatial configuration characteristics and social performance evaluation of public sports facilities in shanghai based on geographic information system (GIS). PLoS ONE 2025, 20, e0310585. [Google Scholar] [CrossRef] [PubMed]
  33. Wu, R.; Gesang, D.; Zhou, G.; Li, Y. Spatial disparities and dynamic evolution of professional public health resource supply level in Beijing, China. BMC Public Health 2024, 24, 2524. [Google Scholar] [CrossRef]
  34. Rosen, S. Hedonic prices and implicit markets: Product differentiation in pure competition. J. Political Econ. 1974, 82, 34–55. [Google Scholar] [CrossRef]
  35. Liu, T.; Wang, J.; Liu, L.; Peng, Z.; Wu, H. What Are the Pivotal Factors Influencing Housing Prices? A Spatiotemporal Dynamic Analysis Across Market Cycles from Upturn to Downturn in Wuhan. Land 2025, 14, 356. [Google Scholar] [CrossRef]
  36. Jim, C.Y.; Chen, W.Y. External effects of neighbourhood parks and landscape elements on high-rise residential value. Land Use Policy 2010, 27, 662–670. [Google Scholar] [CrossRef]
  37. Dambon, J.A.; Fahrländer, S.S.; Karlen, S.; Lehner, M.; Schlesinger, J.; Sigrist, F.; Zimmermann, A. Examining the vintage effect in hedonic pricing using spatially varying coefficients models: A case study of single-family houses in the Canton of Zurich. Swiss J. Econ. Stat. 2022, 158, 2. [Google Scholar] [CrossRef]
  38. Wen, H.; Zhang, Y.; Zhang, L. Do educational facilities affect housing price? An empirical study in Hangzhou, China. Habitat Int. 2014, 42, 155–163. [Google Scholar] [CrossRef]
  39. Peng, T.C.; Chiang, Y.H. The non-linearity of hospitals’ proximity on property prices: Experiences from Taipei, Taiwan. J. Prop. Res. 2015, 32, 341–361. [Google Scholar] [CrossRef]
  40. An, S.; Jang, H.; Kim, H.; Song, Y.; Ahn, K. Assessment of street-level greenness and its association with housing prices in a metropolitan area. Sci. Rep. 2023, 13, 22577. [Google Scholar] [CrossRef]
  41. Yu, P.; Yung, E.H.; Chan, E.H.; Zhang, S.; Wang, S.; Chen, Y. The spatial effect of accessibility to public service facilities on housing prices: Highlighting the housing equity. ISPRS Int. J. Geo-Inf. 2023, 12, 228. [Google Scholar] [CrossRef]
  42. Lee, H.; Han, H.; Pettit, C. Capturing the distance decay effect of amenities on housing price using explainable artificial intelligence. Appl. Geogr. 2025, 174, 103486. [Google Scholar] [CrossRef]
  43. Soltani, A.; Heydari, M.; Aghaei, F.; Pettit, C.J. Housing price prediction incorporating spatio-temporal dependency into machine learning algorithms. Cities 2022, 131, 103941. [Google Scholar] [CrossRef]
  44. Sharma, H.; Harsora, H.; Ogunleye, B. An optimal house price prediction algorithm: XGBoost. Analytics 2024, 3, 30–45. [Google Scholar] [CrossRef]
  45. Li, T.; Xu, H.; Sun, H. Spatial Patterns and Multi-Dimensional Impact Analysis of Urban Street Quality Perception under Multi-Source Data: A Case Study of Wuchang District in Wuhan, China. Appl. Sci. 2023, 13, 11740. [Google Scholar] [CrossRef]
  46. Zhang, Y.; Qin, K.; Bi, Q.; Cui, W.; Li, G. Landscape patterns and building functions for urban land-use classification from remote sensing images at the block level: A case study of Wuchang District, Wuhan, China. Remote Sens. 2020, 12, 1831. [Google Scholar] [CrossRef]
  47. Yang, X.; Cao, Y.; Wu, A.; Guo, M.; Dong, Z.; Tang, L. Accessibility assessment of buildings based on multi-source spatial data: Taking Wuhan as a case study. ISPRS Int. J. Geo-Inf. 2021, 10, 701. [Google Scholar] [CrossRef]
  48. National Development and Reform Commission (NDRC); Ministry of Housing and Urban-Rural Development (MOHURD); Ministry of Natural Resources (MNR). Guidelines for the Construction of Embedded Community Service Facilities in Urban Communities (Trial); Government of China: Beijing, China, 2021. [Google Scholar]
  49. Ministry of Natural Resources of the People’s Republic of China. Technical Guidelines for Community Life Circle Planning; China Standards Press: Beijing, China, 2024. [Google Scholar]
  50. Wang, J.; Zhou, J. Spatial evaluation of the accessibility of public service facilities in Shanghai: A community differentiation perspective. PLoS ONE 2022, 17, e0268862. [Google Scholar] [CrossRef] [PubMed]
  51. Luo, W.; Wang, F. Measures of spatial accessibility to health care in a GIS environment: Synthesis and a case study in the Chicago region. Environ. Plan. B Plan. Des. 2003, 30, 865–884. [Google Scholar] [CrossRef]
  52. Lei, Z.; Lei, P. An Improved Algorithm for Accessibility of Public Transport Stations Based on Two Step Moving Search Method. World Sci. Res. 2024, 10, 25–34. [Google Scholar]
  53. Tao, Z.; Cheng, Y.; Liu, J. Hierarchical two-step floating catchment area (2SFCA) method: Measuring the spatial accessibility to hierarchical healthcare facilities in Shenzhen, China. Int. J. Equity Health 2020, 19, 164. [Google Scholar] [CrossRef]
  54. Tao, Z.; Yao, Z.; Kong, H.; Duan, F.; Li, G. Spatial accessibility to healthcare services in Shenzhen, China: Improving the multi-modal two-step floating catchment area method by estimating travel time via online map APIs. BMC Health Serv. Res. 2018, 18, 345. [Google Scholar] [CrossRef]
  55. Tercan, E.; Eymen, A.; Urfalı, T.; Saracoglu, B. A sustainable framework for spatial planning of photovoltaic solar farms using GIS and multi-criteria assessment approach in Central Anatolia, Turkey. Land Use Policy 2021, 102, 105272. [Google Scholar] [CrossRef]
  56. Ogryzek, M.; Jaskulski, M. Applying methods of exploratory data analysis and methods of modeling the unemployment rate in spatial terms in Poland. Appl. Sci. 2025, 15, 4136. [Google Scholar] [CrossRef]
  57. Zhu, J.; Zhu, M.; Na, J.; Lang, Z.; Lu, Y.; Yang, J. Incorporation of spatially heterogeneous area partitioning into vector-based cellular automata for simulating urban land-use changes. Land 2023, 12, 1893. [Google Scholar] [CrossRef]
  58. Nie, X.; Li, M.; Lu, J.; Wang, B. Research on Buffer Calculation Model of Critical Chain Based on Adjacency Information Entropy. Buildings 2023, 13, 942. [Google Scholar] [CrossRef]
  59. Song, X.; Du, L.; Wang, Z. Correlation Analysis of Urban Road Network Structure and Spatial Distribution of Tourism Service Facilities at Multi-Scales Based on Tourists’ Travel Preferences. Buildings 2024, 14, 914. [Google Scholar] [CrossRef]
  60. Rey-Blanco, D.; Zofio, J.; Gonzalez-Arias, J. Improving hedonic housing price models by integrating optimal accessibility indices into regression and random forest analyses. Expert Syst. Appl. 2024, 235, 121059. [Google Scholar] [CrossRef]
  61. Cellmer, R.; Cichulska, A.; Bełej, M. Spatial analysis of housing prices and market activity with the geographically weighted regression. ISPRS Int. J. Geo-Inf. 2020, 9, 380. [Google Scholar] [CrossRef]
  62. Lu, C.; Zhang, Z.; Lan, X. Impact of China’s referral reform on the equity and spatial accessibility of healthcare resources: A case study of Beijing. Soc. Sci. Med. 2019, 235, 112386. [Google Scholar] [CrossRef] [PubMed]
  63. Sun, W.; Zheng, S.; Wang, R. The capitalization of subway access in home value: A repeat-rentals model with supply constraints in Beijing. Transp. Res. Part A Policy Pract. 2015, 80, 104–115. [Google Scholar] [CrossRef]
  64. Gu, Z.; Tang, M.; Luo, X.; Feng, J. Examination of the impacts of hospital accessibility on housing prices: Heterogeneity across attributes, space and price quantiles. J. Hous. Built Environ. 2024, 39, 179–200. [Google Scholar] [CrossRef]
  65. Yang, H.J.; Song, J.; Choi, M.J. Measuring the externality effects of commercial land use on residential land value: A case study of Seoul. Sustainability 2016, 8, 432. [Google Scholar] [CrossRef]
  66. Liu, Z.; Ye, J.; Ren, G.; Feng, S. The effect of school quality on house prices: Evidence from Shanghai, China. Land 2022, 11, 1894. [Google Scholar] [CrossRef]
  67. Huang, Y.; Dall’Erba, S. Does proximity to school still matter once access to your preferred school zone has already been secured? J. Real Estate Financ. Econ. 2021, 62, 548–577. [Google Scholar] [CrossRef]
  68. Rong, D.; Biscaya, S. Exploration of supply–demand gaps of urban community-based elderly care facilities in Shanghai. City Built Environ. 2025, 3, 10. [Google Scholar] [CrossRef]
  69. Hu, Y.; Sherlock, P.; Huang, J.; Knopf, H.T.; Hall, J.M. Unveiling spatial mismatch in childcare supply and demand: An excess commuting analysis of home-to-childcare distance in subsidized families. J. Transp. Geogr. 2024, 116, 103829. [Google Scholar] [CrossRef]
  70. Laziou, G.; Lemoy, R.; Texier, M.L. Radial analysis and scaling of housing prices in French urban areas. Environ. Plan. B Urban Anal. City Sci. 2025, 52, 1147–1162. [Google Scholar] [CrossRef]
  71. Daams, M.N.; Sijtsma, F.J.; Veneri, P. Mixed monetary and non-monetary valuation of attractive urban green space: A case study using Amsterdam house prices. Ecol. Econ. 2019, 166, 106430. [Google Scholar] [CrossRef]
  72. Mohammad, S.I.; Graham, D.J.; Melo, P.C.; Anderson, R.J. A Meta-Analysis of the Impact of Rail Projects on Land and Property Values. Transp. Res. Part A Policy Pract. 2013, 50, 158–170. [Google Scholar] [CrossRef]
  73. Liu, Y.; Gu, H.; Shi, Y. Spatial accessibility analysis of medical facilities based on public transportation networks. Int. J. Environ. Res. Public Health 2022, 19, 16224. [Google Scholar] [CrossRef]
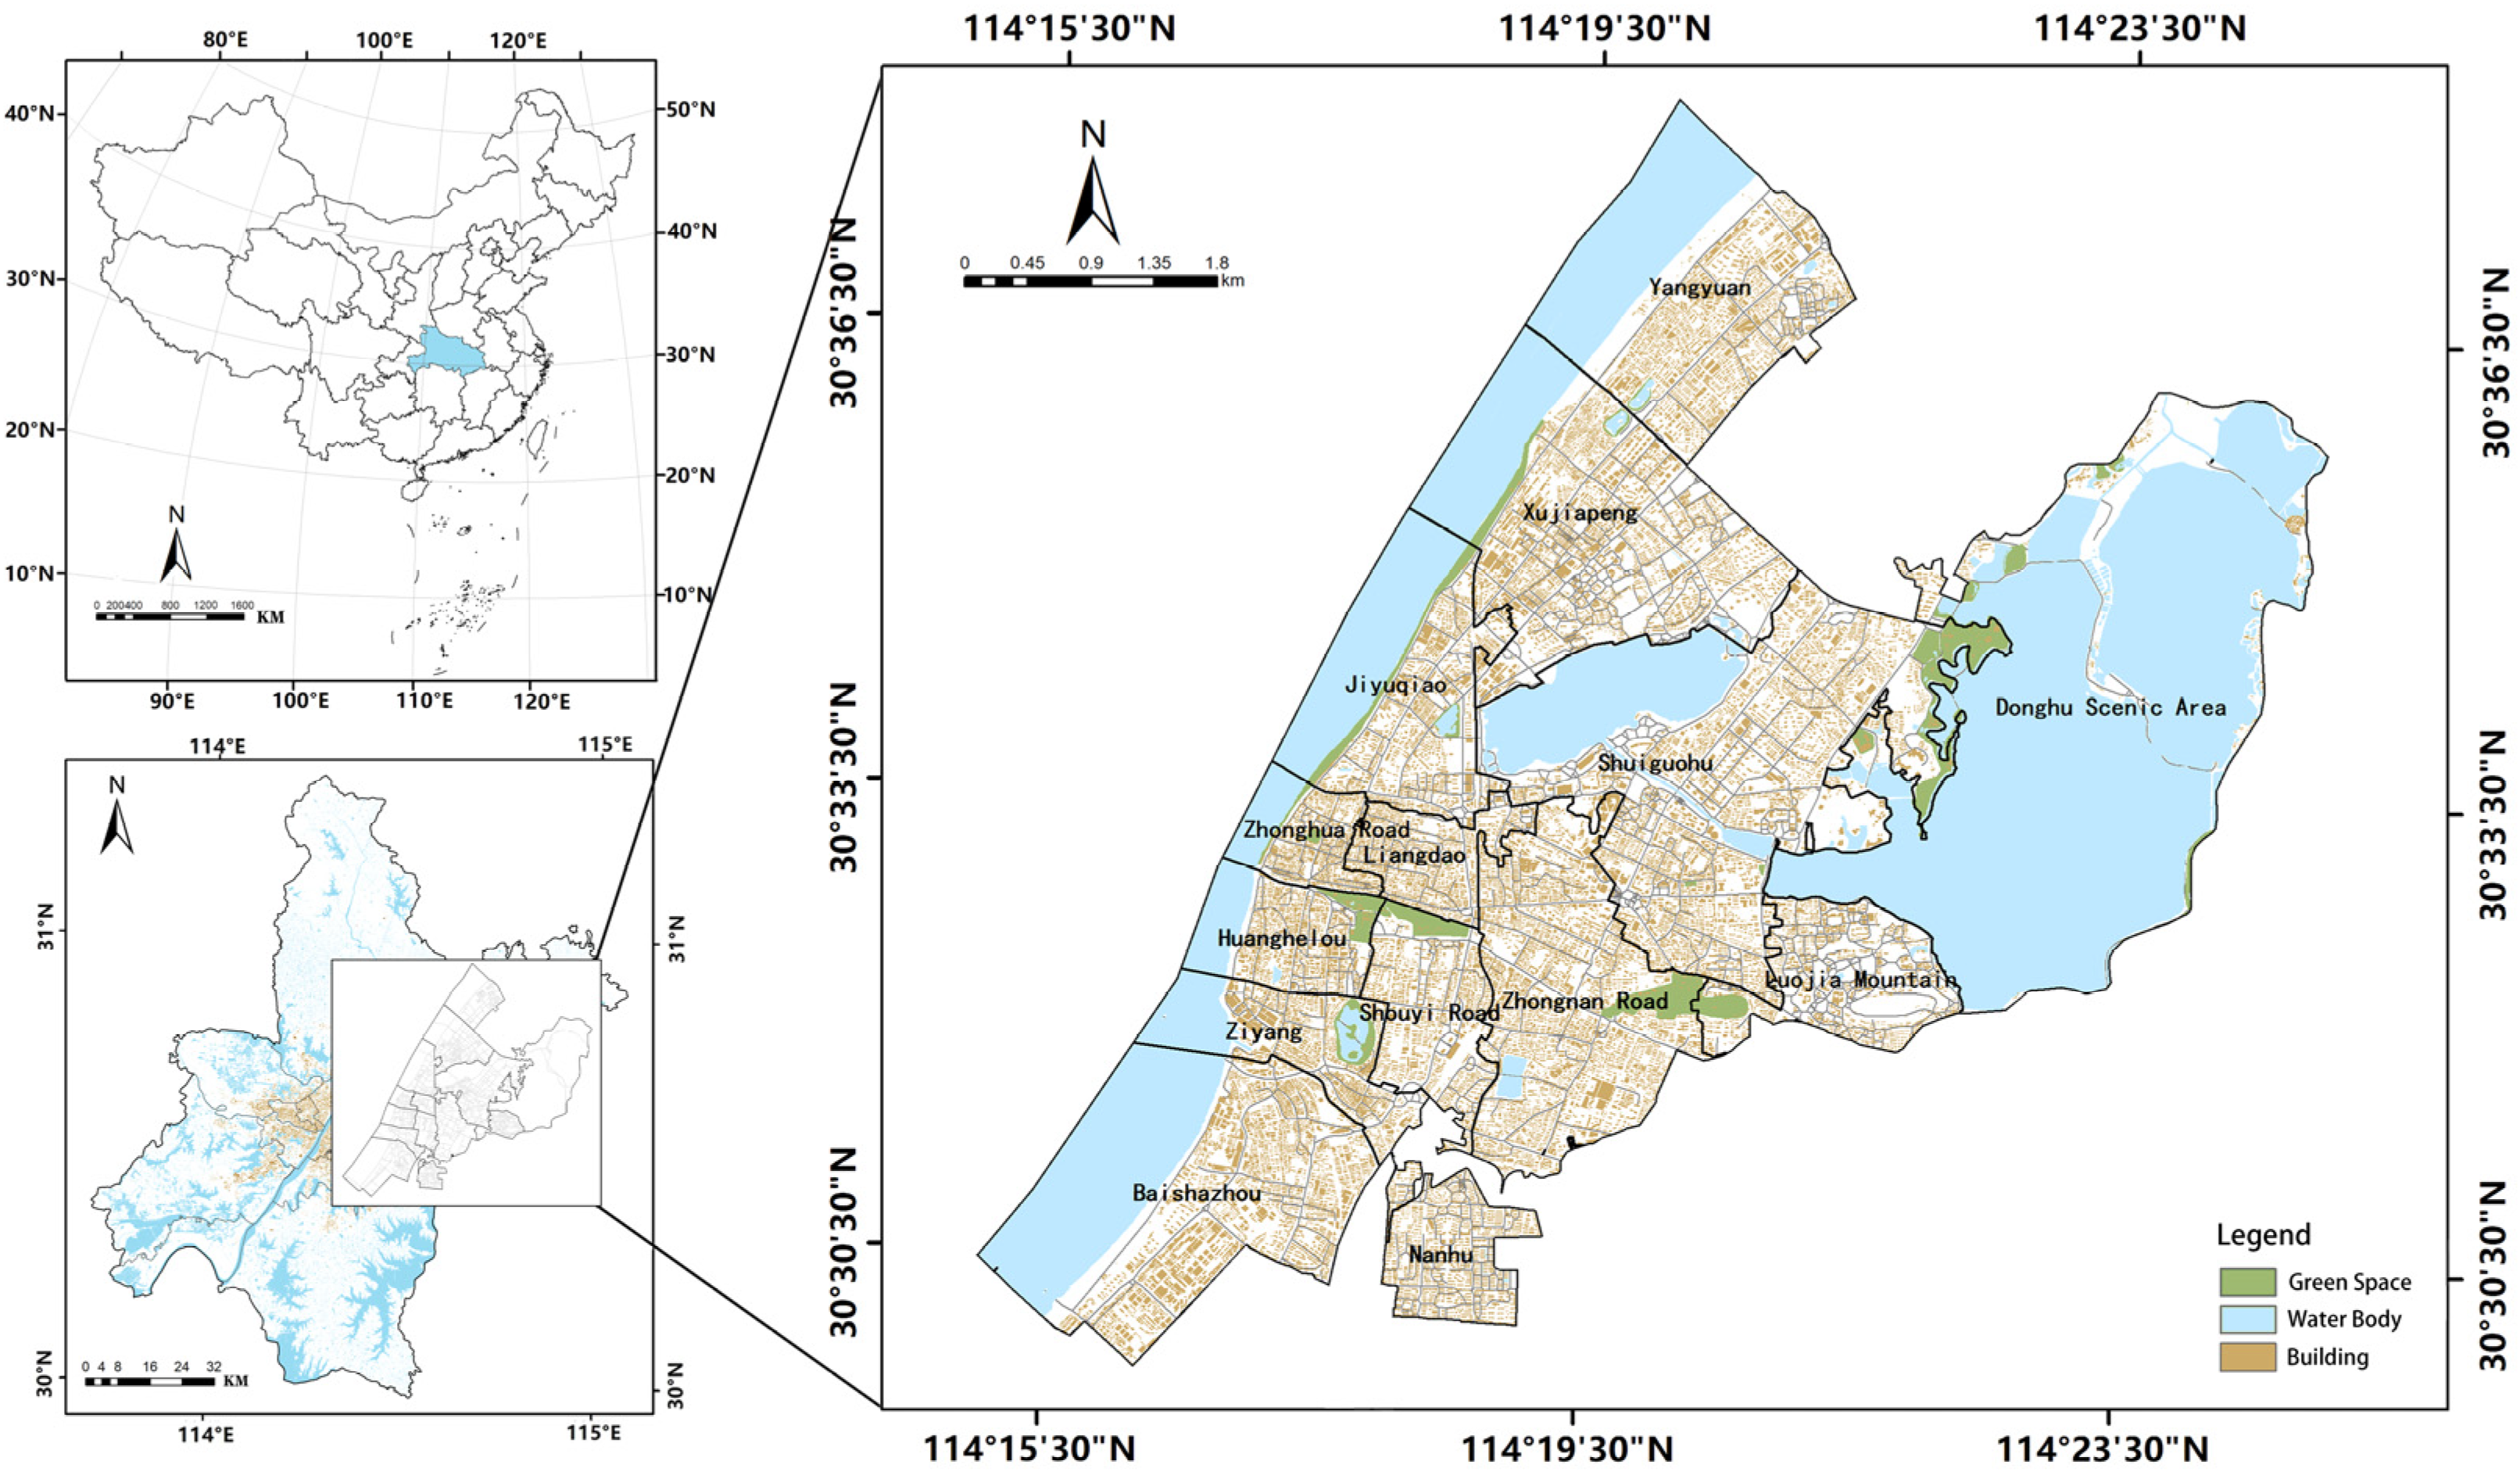
Figure 1. Overview of the Study Area.
Buildings 15 03293 g001
Figure 2. Research Framework of the Study.
Buildings 15 03293 g002
Figure 3. Supply–Demand Ratios for Nine Types of Community Public Service. Note: (a) Elderly care; (b) Infant care; (c) Child care; (d) Child recreation; (e) Community meal; (f) Domestic convenience; (g) Health care; (h) Sports fitness; (i) Cultural recreation.
Buildings 15 03293 g003
Figure 4. Accessibility Map of Nine Types of Community Public Service Facilities. Note: (a) Elderly care; (b) Infant care; (c) Child care; (d) Child recreation; (e) Community meal; (f) Domestic convenience; (g) Health care; (h) Sports fitness; (i) Cultural recreation.
Buildings 15 03293 g004
Figure 5. Gini Coefficients for Nine Categories of Community Public Service Facilities.
Buildings 15 03293 g005
Figure 6. Proportions of Location Entropy Levels for Accessibility of Nine Types of Community Public Service Facilities.
Buildings 15 03293 g006
Figure 7. Location Entropy Levels of Accessibility for Nine Types of Community Public Service Facilities. Note: (a) Elderly care; (b) Infant care; (c) Child care; (d) Child recreation; (e) Community meal; (f) Domestic convenience; (g) Health care; (h) Sports fitness; (i) Cultural recreation.
Buildings 15 03293 g007
Figure 8. Spatial Distribution of the Correlation Between Community Public Service Facility Accessibility and Housing Prices. Note: (a) Elderly care; (b) Child care; (c) Child recreation; (d) Community meal; (e) Domestic convenience; (f) Health care; (g) Sports fitness; (h) Cultural recreation.
Buildings 15 03293 g008
Figure 9. Spatial Distribution of Regression Coefficients for Community Public Service Facilities Based on Inverse Distance Weighted Interpolation. Note: (a) Elderly care; (b) Child care; (c) Child recreation; (d) Sports fitness; (e) Cultural recreation.
Buildings 15 03293 g009
Table 1. Data Sources and Descriptions.
Data TypeSourceDescriptionYear
Road Network DataOSM MapIncludes expressways, main urban roads, secondary roads, local streets, rural roads, and pedestrian paths2024
River and Water System DataOSM MapIncludes the Yangtze River, Han River, and urban lakes2024
Study Area Boundaries and SubdistrictsAmap Open PlatformIncludes Wuchang District boundary and administrative boundaries of subdistricts2024
Residential Community DataAnjuke (Real Estate Platform)Includes coordinates, number of households, greening ratio, and housing prices collected from listings2024
POI Data for Public Service FacilitiesAmap API InterfacePOI data on community public service facilities2024
Demographic StatisticsWuchang District People’s GovernmentSubdistrict-level population size and average household size from the 7th National Census2020
Table 2. Functions and Applications of Research Methods.
CategoryMethodFunctionApplication
Supply–demand EvaluationImproved 2SFCAIntegrates facility supply, population demand, and distance decayMeasures accessibility of multiple facility types
IDWEstimates spatial values with distance weightingSimulates the distribution of supply–demand ratios and accessibility values
Value EffectsSpatial AutocorrelationIdentifies spatial clustering and dependenceTests spatial clustering of housing price data
Buffer AnalysisDefines service areas based on threshold distanceDetermines facility coverage areas
MGWRIdentifies spatial heterogeneity at multiple scalesExamines variations in the effects of accessibility on housing prices
Table 3. Gini Coefficient Equity Classification.
Value RangeEquity Level
0 < G < 0.2Absolute equity
0.2 ≤ G < 0.3Relatively equitable
0.3 ≤ G < 0.4Moderately equitable
0.4 ≤ G < 0.5Large disparity (Warning level)
0.5 ≤ G < 1Severe disparity (Critical level)
Table 4. Classification Criteria for Location Entropy Values.
LevelEntropy Value RangeRemarks
Very Low<0.33Significantly below the district average
Low0.33–0.67Below the district average
Medium0.67–1.50Close to the district average
High0.67–1.50Above the district average
Very High>3.00Significantly above the district average
Table 5. Summary of Cumulative Distribution Values for the Four Quadrant Types of “Facility Accessibility–Housing Price” by Subdistrict.
SubdistrictLow
Accessibility—Low Price
High
Accessibility—Low Price
Low
Accessibility—High Price
High
Accessibility—High Price
Nanhu0.840.284.322.56
Shuiguohu1.600.483.722.19
Donghu Scenic Area1.600.004.402.00
Luojiashan1.201.203.901.70
Huanghelou2.033.051.251.67
Liangdaojie3.272.531.280.93
Zhonghualu3.941.801.370.89
Zhongnanlu4.061.191.930.83
Xujiapeng3.181.922.160.74
Shouyilu3.872.600.880.65
Ziyang4.891.141.360.62
Jiyuqiao3.541.452.410.60
Yangyuan4.991.231.490.28
Baishazhou6.780.400.760.07
Total45.7919.2731.2315.73
Note: The values represent the cumulative proportions of the nine types of public service facilities in each subdistrict under the four-quadrant classification of “housing price–accessibility”. Due to the aggregation across multiple facilities, the total value of a single row may exceed 1.
Table 6. Selection and Quantification of Characteristic Variables.
Variable TypeVariable CodeVariableQuantification MethodExpected Sign
Spatial AttributesX1Floor Area RatioActual value (unitless)
X2Green Coverage RatioActual value (%)+
X3Building Height CategoryDummy variable: low-rise = 1, multi-storey = 2, mid-rise = 3, high-rise = 4, super high-rise = 5Uncertain
X4Building AgeActual value (years)
Neighborhood AttributesX5Distance to the nearest park or green spaceActual value (km)
X6Distance to the nearest hospitalActual value (km)Uncertain
X7Number of primary and secondary schools within 1.5 kmActual value (count)+
X8Distance to the nearest metro stationActual value (km)
X9Distance to the nearest commercial districtActual value (km)+
Locational AttributesX10Accessibility to elderly care facilities within a 15 min walking rangeActual value (unitless)+
X11Accessibility to child care facilities within a 15 min walking rangeActual value (unitless)+
X12Accessibility to children recreation facilities within a 15 min walking rangeActual value (unitless)+
X13Accessibility to community meal facilities within a 15 min walking rangeActual value (unitless)+
X14Accessibility to domestic convenience facilities within a 15 min walking rangeActual value (unitless)+
X15Accessibility to health care facilities within a 15 min walking rangeActual value (unitless)+
X16Accessibility to sports fitness facilities within a 15 min walking rangeActual value (unitless)+
X17Accessibility to cultural recreation facilities within a 15 min walking rangeActual value (unitless)+
Table 7. Descriptive Statistics of Regression Coefficients in the MGWR Model.
VariableMeanMinimumMaximum
X20.0430.0340.055
X30.128−0.6071.043
X4−0.112−0.203−0.055
X60.0990.0890.109
X7−0.150−0.160−0.136
X8−0.088−0.115−0.054
X90.181−0.6291.079
X100.002−0.0450.046
X110.5150.5130.519
X12−0.024−0.2530.367
X16−0.111−1.1050.444
X17−0.170−0.175−0.165
Disclaimer/Publisher’s Note: The statements, opinions and data contained in all publications are solely those of the individual author(s) and contributor(s) and not of MDPI and/or the editor(s). MDPI and/or the editor(s) disclaim responsibility for any injury to people or property resulting from any ideas, methods, instructions or products referred to in the content.