Article

A Framework for Rapid Vulnerability Assessment of Building Stock Utilizing Critical Seismic Wall Index Calculated via BIM Integrated into GIS for Prioritization of Seismic Risk to Avoid Demolition for Sustainable Cities

by
Ahmet Çıtıpıtıoğlu
and
Can Balkaya
*
Department of Civil Engineering, Istanbul Nişantaşı University, 34398 Istanbul, Turkey
*
Author to whom correspondence should be addressed.
Buildings 2025, 15(18), 3292; https://doi.org/10.3390/buildings15183292
Submission received: 21 July 2025 / Revised: 4 September 2025 / Accepted: 6 September 2025 / Published: 11 September 2025
(This article belongs to the Section Building Structures)

Abstract

A framework for rapid seismic vulnerability assessment and disaster management of urban buildings was developed, incorporating structural information from Building Information Models (BIM) integrated into a Geographic Information System (GIS). The Critical Seismic Wall Index (CSWI) was evaluated for 252 undamaged and damaged buildings and compared with their seismic performance analyses. The seismic vulnerability of these buildings was determined based on site-specific seismic hazard analysis and compared with each building’s CSWI. This study demonstrates the use of BIM within a GIS workflow to enable rapid wall index calculation. Building on previous research that identifies a Critical Seismic Wall Index (CSWI) of 0.0025 as an indicator of a building’s seismic vulnerability, it further proposes a CSWI threshold of 0.004 for buildings with structural irregularities, based on the analysis of the studied building. The implementation of the integrated BIM–GIS methodology could enable rapid risk and damage assessment, as demonstrated in the investigated case studies. This study is significant because it provides a model for quickly assessing the seismic vulnerability of buildings, supporting resilience planning and sustainability, particularly in earthquake-prone regions, by prioritizing seismic risk by identification of high-risk buildings for demolition and prioritization of retrofit.

1. Introduction

On 6 February 2023, the Pazarcık Mw = 7.7 and Elbistan Mw = 7.6 earthquakes struck Kahramanmaraş, Turkey, occurring just nine hours apart. More than 300,000 buildings collapsed or were severely damaged, and more than 50,000 people lost their lives [1]. These events highlight the critical importance of rapidly and reliably assessing damage in the aftermath of an earthquake, as well as evaluating the seismic vulnerability of buildings beforehand, particularly in densely populated cities with older building stock, such as Istanbul as shown in Figure 1, to support sustainable urban development as intended by the framework proposed in this paper.
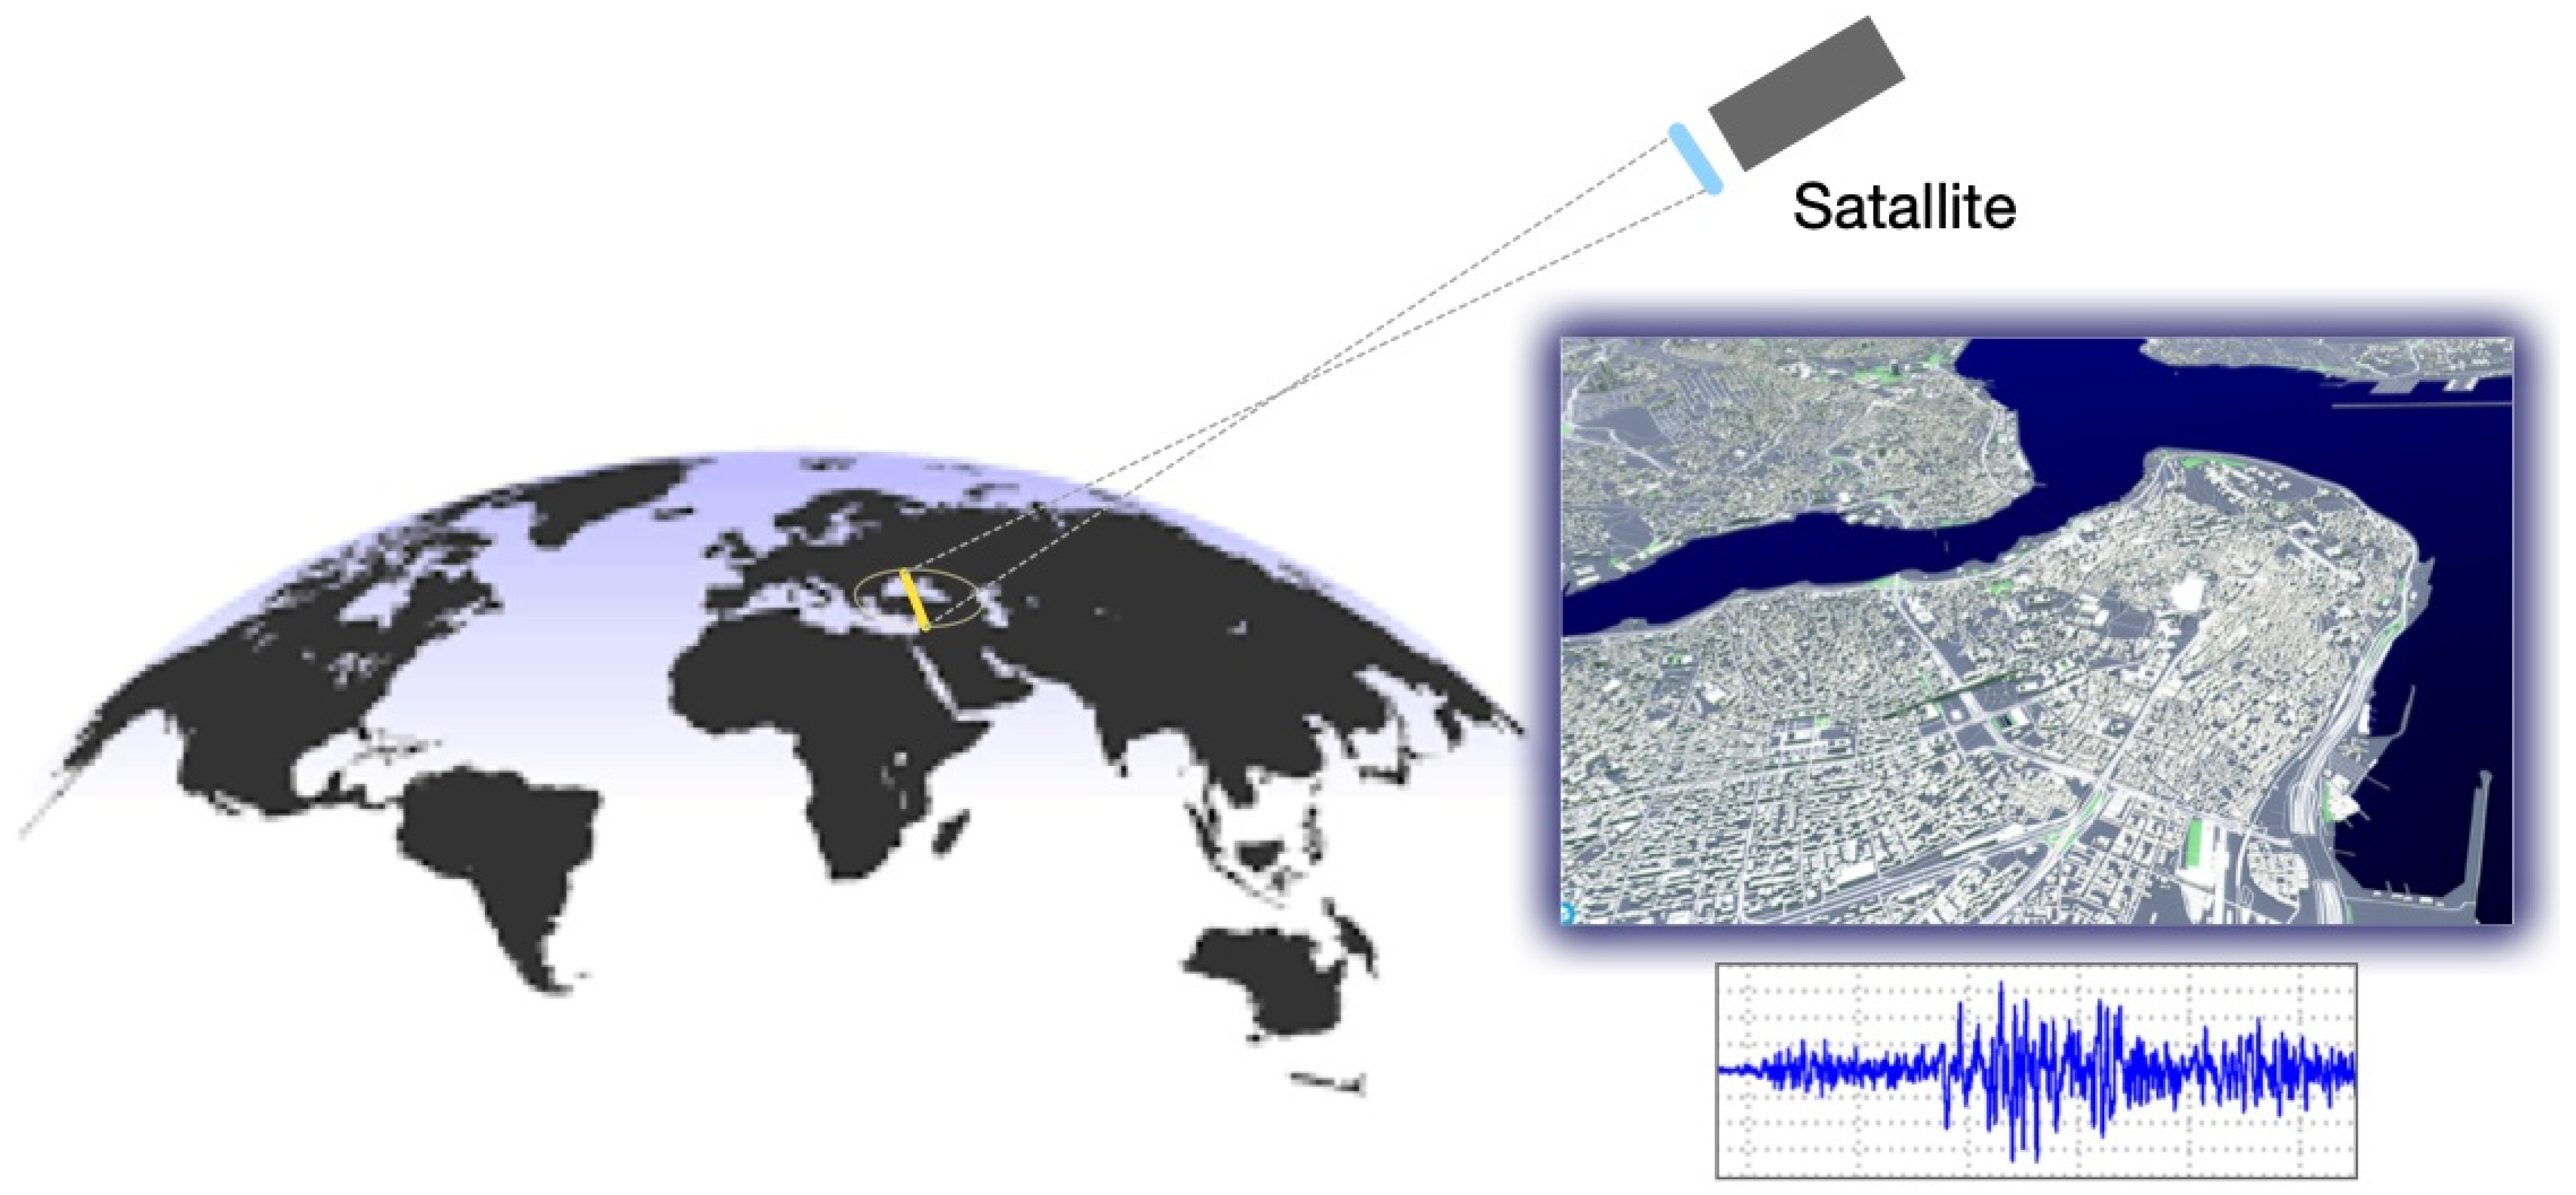
The wide area covering several large urban areas is shown in Figure 2 with satellite images of a neighborhood in Hatay before and after the Kahramanmaraş earthquake of 6 February 2023, where the impact and devastation can be clearly seen. A quick assessment of the seismic vulnerability of reinforced concrete (RC) and masonry buildings before an earthquake is an effective tool for risk management after an earthquake disaster. The effects of such an earthquake, which extends over large regions and affects a large population, especially in densely populated areas such as Istanbul, are investigated in case studies. Rapid assessment in a short time frame for such large population centers requires a suitable set of tools that integrates information from BIMs into GIS and is supplemented by satellite image acquisition and processing. This process, illustrated schematically in Figure 3, can incorporate multiple layers of critical data to evaluate the initial seismic hazard and can be further enhanced by including BIM-derived structural information.
There are different approaches to seismic vulnerability assessment, namely analytical, empirical and rapid visual screening (RVS) methods. Analytical methods use appropriate mechanical models and advanced analysis techniques to assess the vulnerability of buildings [2,3], while empirical methods are based on damage statistics of past earthquakes and expert judgment [4,5]. A common problem with using an empirical approach is the unavailability of sufficient and reliable statistical data for different intensities of ground motion [6]. ATC-13 fragility curves based on expert judgment have been shown to greatly overestimate damage to structures, at least for some classes of structures for which damage statistics have been compiled [4]. Many methods have been proposed for the rapid visual inspection (RVI) or (RVS) of structures before and after an earthquake [7,8,9]. These approaches do not consider the existing material strength of the structure or the design values of the project and seismic performance analysis.
It is challenging to develop a methodology for building structures, especially for old building areas with high seismic vulnerability. The integration of structural information in GIS in conjunction with satellite imagery processing (Figure 3) is relatively simple and requires a low computational effort compared to implicitly performing detailed finite element and seismic performance analysis for each building. To this end, this paper proposes a sustainable method that utilizes BIM to integrate meaningful structural information into GIS to provide the basic structural data for calculating citywide CSWI for the general building stock rapidly across wide urban areas.
The framework proposed in this study, illustrated in Figure 4, is designed to provide a tool for rapidly assessing the seismic vulnerability of RC and masonry buildings in large urban areas, either before or after an earthquake. The use of the Critical Seismic Wall Index (CSWI) offers a valuable means for rapid assessment and prioritization of urban buildings.
Several methods have been developed to rapidly evaluate building seismic vulnerability using wall indices, which are based on the dimensions of elements resisting lateral earthquake loads and calibrated by correlating these indices with observed on-site earthquake performance. Hassan and Sozen [10] proposed methods that rely solely on the dimensions of laterally loaded elements, while Gulkan and Sozen [11] developed simple vulnerability indices for low- to medium-rise reinforced concrete buildings, considering only the orientation and cross-sectional size of vertical walls and columns. In this study the CSWI for typical buildings in Turkey is assessed based on building data and seismic structural analysis of 252 existing undamaged and damaged buildings.
Structural information extracted from BIMs within GIS, including individual RC wall information, can furthermore be effectively used in artificial neural networks (ANN) [12,13,14,15,16,17] for the estimation of earthquake damage to structures [18,19].
Like Istanbul, southeastern Europe, California, and other earthquake-prone regions face significant risks from earthquakes, threatening lives, property, and infrastructure, and thereby jeopardizing sustainable development. Rapid assessment of earthquake vulnerability to improve response efficiency and community resilience has recently been studied, leading to the development of a Rapid Earthquake Damage Assessment System (REDAS) [20].
Wide regions are assessed with the help of satellite images taken before and after the event using image processing techniques. GIS-based systems play a critical role by integrating multiple thematic layers to represent actual on-the-ground conditions through a common set of reference coordinates. These include fundamental datasets such as altimetry, roads, buildings, and hydrography. As illustrated in Figure 5, thematic GIS layers provide the spatial foundation for integrating BIM-derived CSWI data to support rapid seismic vulnerability assessments, while also incorporating relevant contextual information such as earthquake zones, soil characteristics, fault locations, and population distribution.
The HAZUS [21] software is distributed as a GIS-based desktop application with a growing collection of simplified, standardized open-source tools and data for assessing the risk of earthquakes and other disasters. The HAZUS program is managed by FEMA’s Natural Hazard Risk Assessment Program (NHRAP).
Figure 5. Thematic GIS layers representing on-the-ground conditions for a common set of reference coordinates [22], including altimetry, hydrography, roads, buildings, and 3D urban context. These layers provide the spatial basis for integrating BIM-derived CSWI data to support rapid seismic vulnerability assessment.
Buildings 15 03292 g005
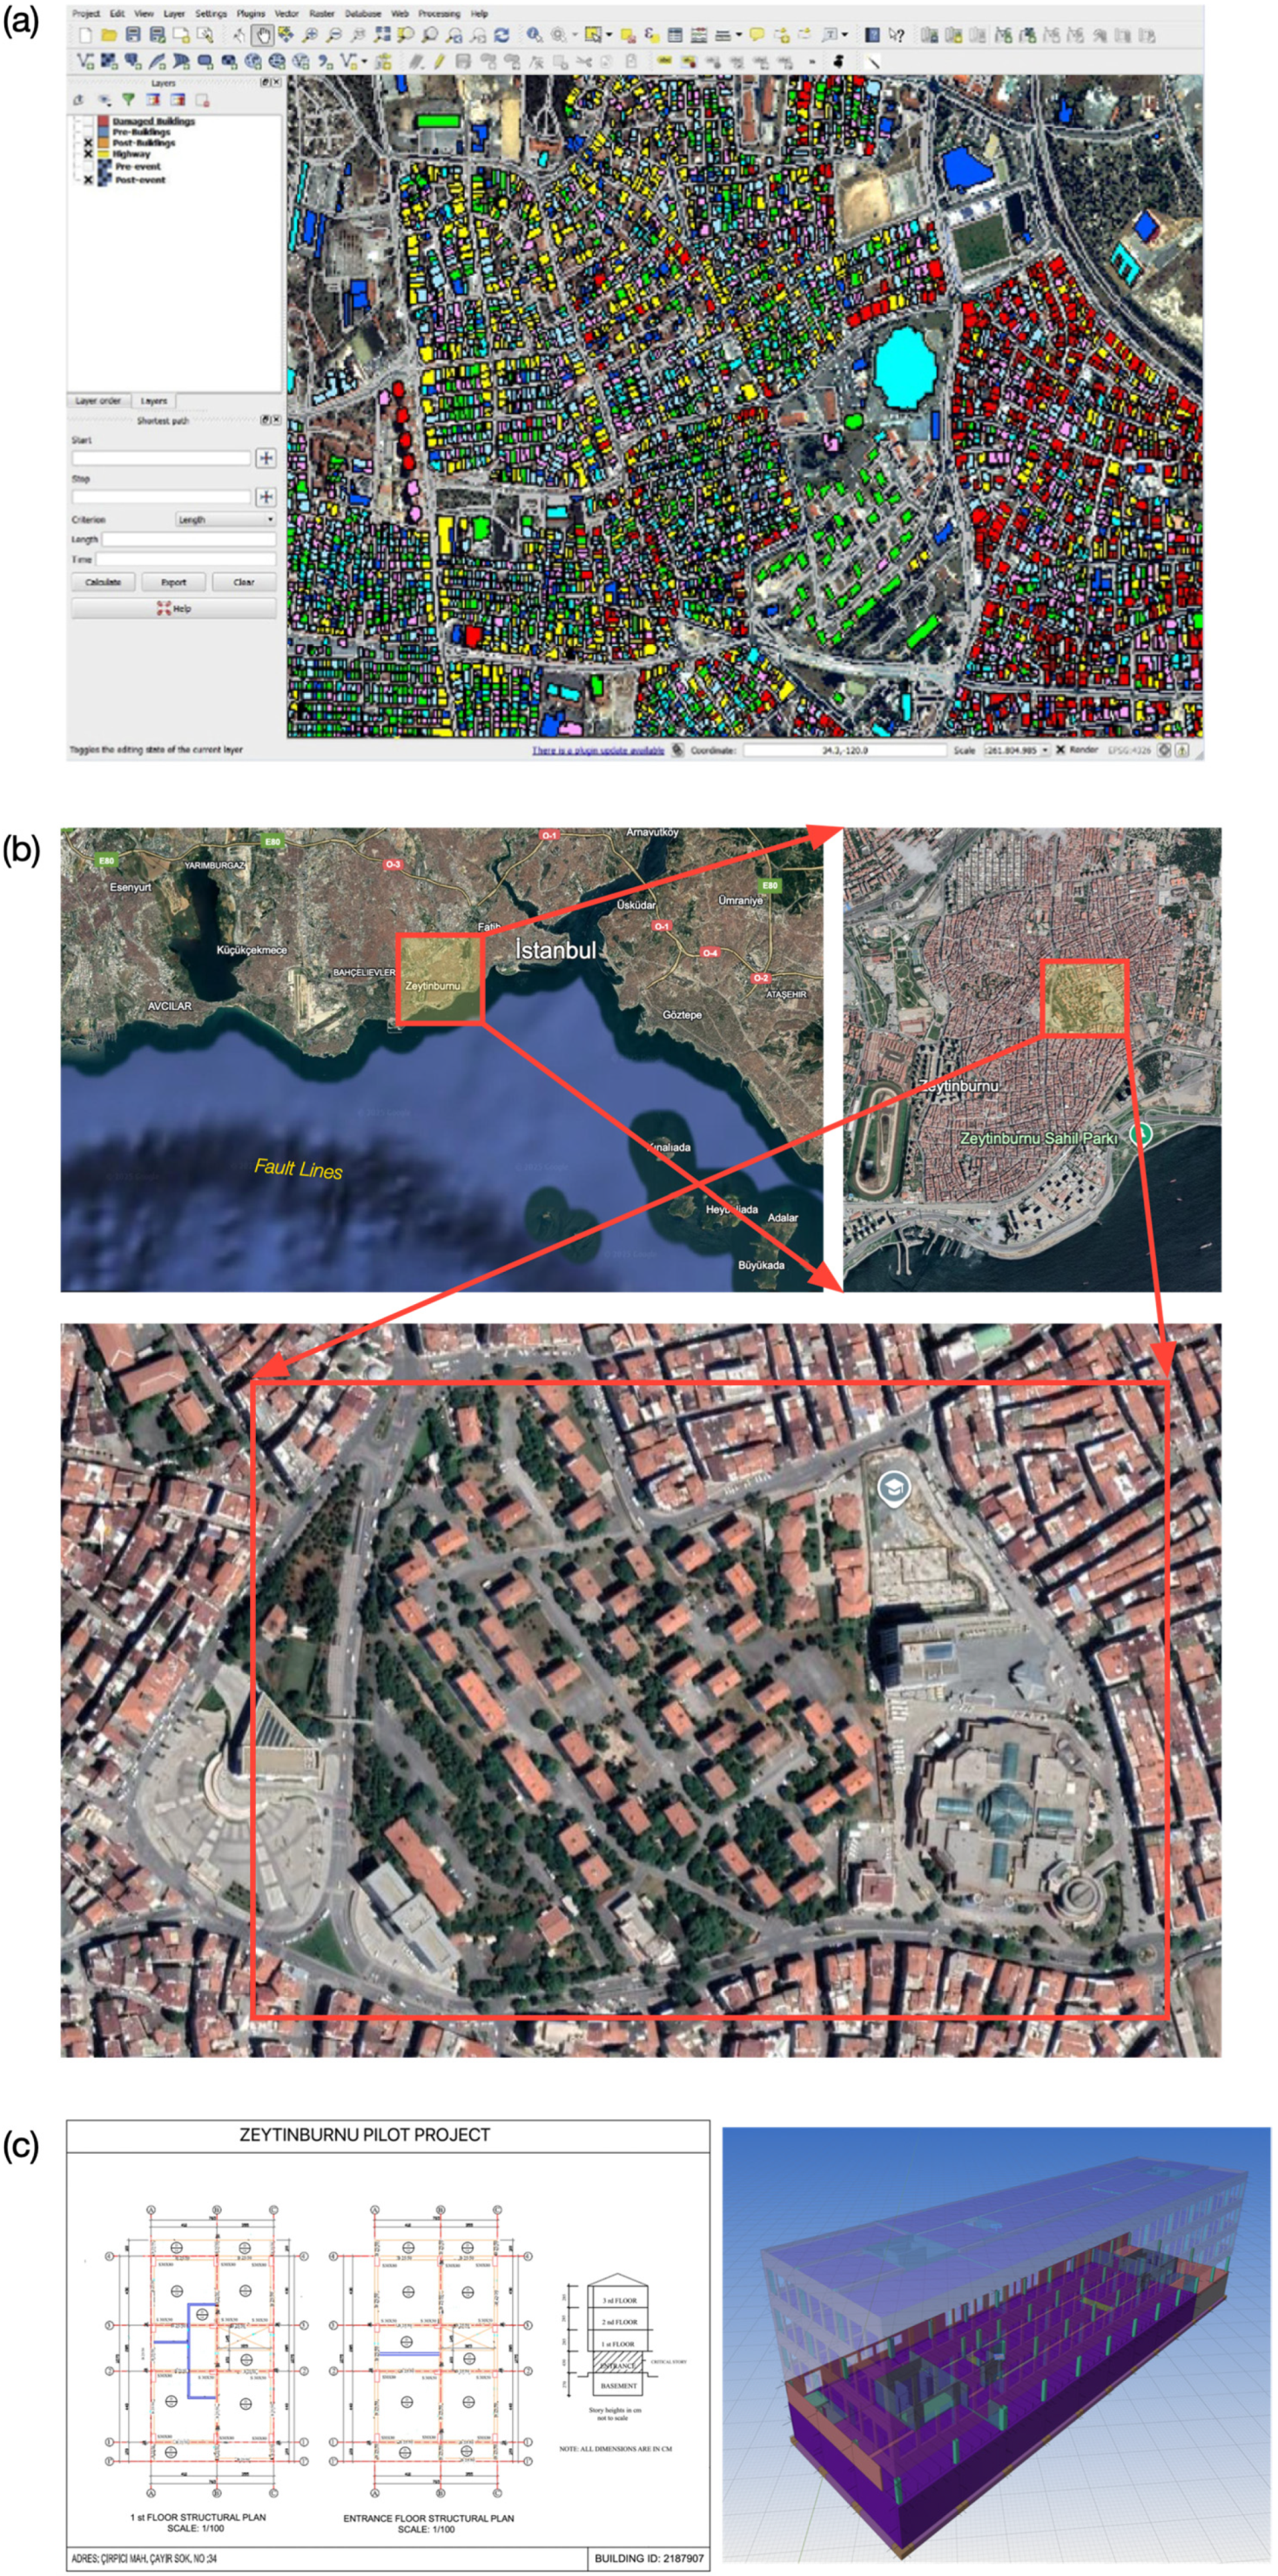
However, a quick assessment or detailed analysis is difficult because it is hard to find a compilation of as-built structural and architectural drawings or sketches of the existing buildings for the large urban areas in question. Analyzing these structures may take more time than predicted and require even more effort to retrofit to at least a life-safety level. Thus, prioritizing this effort is also essential. With proper planning and legislation, the information required for the assessments can be compiled using a geographic information system GIS infrastructure (Figure 6).
Damage assessment after an earthquake can be carried out with the help of satellite images before and after a seismic event, which can provide important information about the situation through image processing. Different layers of important information can be compiled for this assessment, namely the following: administrative, general, structural, earthquake zone, soil map information, fault maps and population. GIS can also be used to add references to BIM data for individual buildings.
Sahin et al. [23] created digital maps to estimate the time-averaged shear wave velocity (VS30) in a GIS environment for the region affected by the Kahramanmaraş earthquakes on 6 February 2023. Though structural building information is needed in conjunction with GIS to rapidly determine the seismic vulnerability of existing building structures. To this end a pilot project was conducted in Zeytinburnu, Istanbul, to assess the seismic vulnerability of approximately 16,000 existing reinforced concrete and masonry buildings. To obtain a more reliable estimate of the risk assessment distribution, image processing was used to integrate structural building data, including information collected via site surveys from satellite imagery.
An application for seismic hazard assessment at the regional level is presented using a multi-level seismic hazard assessment of several thousand buildings in Zeytinburnu, a district of Istanbul [24]. The seismic risk, damage and resilience of RC buildings in Zeytinburnu were evaluated by a three-dimensional nonlinear time history analysis considering soil-structure interaction [25]. The influence of sensor density on the rapid regional assessment of seismic damage is investigated for Istanbul [26].
Such data stored for urban cities in the cases studied can be further used in artificial intelligence. Cinar et al. [27] developed an artificial neural network to estimate the base periods of RC buildings with damaged structural and non-structural elements. Konukcu et al. [28] presented a building damage analysis for Istanbul based on building data up to 2013 using HAZTURK software [29] to compare the results of building damage assessment for Istanbul based on a magnitude (Mw) 7.5 earthquake scenario. Elnashai et al. [30] described the overall multi-layered architecture of MAEviz, which is based on the widely used Eclipse Rich Client Platform (RCP) and the use of open-source middleware and components for geographic information systems.
With the advent of emerging technologies for risk and damage assessment, risk management and mitigation, and retrofit strategies, the earthquake engineering community has developed increasingly effective and cost-efficient approaches to reducing seismic risk. These advances have been facilitated by the exchange of knowledge on seismic hazard assessment and the strengthening of existing building stock [31]. Recent research has placed particular emphasis on data-driven and geospatial approaches to support rapid seismic vulnerability evaluation. For example, Domaneschi et al. [32] combined finite element modeling with wireless sensor networks to assess the seismic safety of school buildings, while Ferretti et al. [33] introduced a simplified large-scale assessment methodology for masonry and reinforced concrete structures, validated through case studies in Ravenna. In parallel, GIS-based methodologies have gained traction for urban-scale applications. Leggieri et al. [34] integrated multisource data into a GIS framework to evaluate the vulnerability of 3726 buildings in Bisceglie, Italy, whereas Mota da Sá et al. [35] developed a cost-effective risk indicator for Lisbon that incorporates structural vertical irregularities—such as soft stories—in masonry and reinforced concrete buildings, providing decision-support capabilities at both micro and macro scales.
Alongside GIS-based approaches, Building Information Modeling (BIM) has emerged as a powerful tool that integrates multidisciplinary data across all stages of a building’s life cycle. BIM enables the systematic organization of building properties within their 3D geometric representation, offering new opportunities for seismic vulnerability assessment. A range of methods for embedding seismic damage assessment into BIM environments have been proposed and tested [36,37,38,39,40,41]. Wang et al. [42] conducted a systematic meta-analysis of BIM applications in disaster risk management, identifying both opportunities and persistent challenges in harnessing BIM for resilience-oriented workflows.
Together, these studies demonstrate a growing convergence of structural analysis, sensor technologies, GIS, and BIM toward scalable and practical solutions for earthquake vulnerability assessment. Building on this trajectory, the present study advances this line of research by proposing a BIM- and GIS-integrated framework that explicitly accounts for structural irregularities within geospatial assessments, while embedding practical seismic vulnerability indicators extracted directly from digital building models.
In this work, a framework to extract structural information of buildings from BIM integrated into GIS is proposed to conveniently and rapidly assess the seismic vulnerability of buildings across large urban areas. BIM provides a convenient way to compile structural input data for buildings, allowing for the rapid calculation of individual buildings’ seismic wall indices to assess their vulnerability against the CSWI. In this study, the CSWI was evaluated using structural data and analyses based on structural analysis assessments for 252 undamaged and retrofitted buildings collected from field studies. Based on this evaluation, a modified CSWI is also proposed for many of the buildings that have structural irregularities.

2. Methodology for the Integration of Structural Information

2.1. Description of the Methodology

The first stage of the risk assessment involves a preliminary evaluation of the building stock using information collected prior to an earthquake. All relevant administrative, general, and structural building data should be stored within a GIS infrastructure. The main goal of this phase is to assess the seismic vulnerability of the building stock using a limited set of rationally compiled information in a short time. This approach is particularly effective when the building stock includes thousands of highly vulnerable structures. The resulting compilation serves as a tool to identify the most at-risk areas in regions of high seismic hazard and provides a basis for prioritizing buildings. This prioritization enables more detailed analyses, which are more complex in terms of input data and methodology, to be conducted more efficiently.
General structural and damage information for existing buildings is essential for investigating seismic behavior and evaluating the safety level of a building prior to an earthquake. To obtain complete and accurate information, the following items must be defined: the layout of the structural system, the type of building system, irregularities in the floor plan and sections, the number of floors, the type of floor and foundation systems, the distances to neighboring buildings, the type and quality of building materials, and structural wall index WI, which is a measure of the total load-bearing column and wall area at the first floor above the subgrade basement in relation to the total floor area.
After an earthquake, buildings must be inspected, considering all structural and non-structural damage, to determine and assess the actual damage. Structural damage can be classified in a range from “cracks” to “collapse” of structural elements, depending on the load-bearing or load-transferring function, location, crack size and type of cracks in these structural elements. Finally, the building damage is classified as no damage, minor damage, moderate damage or severe damage after a comparison with the previously developed database. This initial data, compiled prior to an earthquake, is essential for disaster management and rapid assessment of seismic damage on an urban scale. The information from on-site inspection after an event can then be used to develop risk assessment parameters for future events and planning.

2.2. Site Survey and Data Collection

The following defines various data that must be considered in the context of a rapid assessment of seismic vulnerability and damage to urban buildings and for disaster management:
  • Administrative information: Detailed information about the location of the building and information about the owner and occupants. Information on the use of the building is also important for statistical aspects when creating a database on the building stock. In addition, any technical drawings of the building are used to compare differences between the actual building and its design, and such information is useful for assessing the extent to which building regulations are complied with.
  • General information: Information to identify all types of defects that can lead to damage. The damage rating for each defect is determined to determine the total damage. The geometry of the building and the total number of floors (including the number of basement floors) are determined. In addition, the position of the building in relation to neighboring buildings is very important in determining the seismic response of the building in question. This position information, whether a building is in the corner of a block or in the middle and whether the number of floors is the same or different from the neighboring buildings, is needed to assign a score to this feature when determining the damage, the building can cause to the surrounding area.
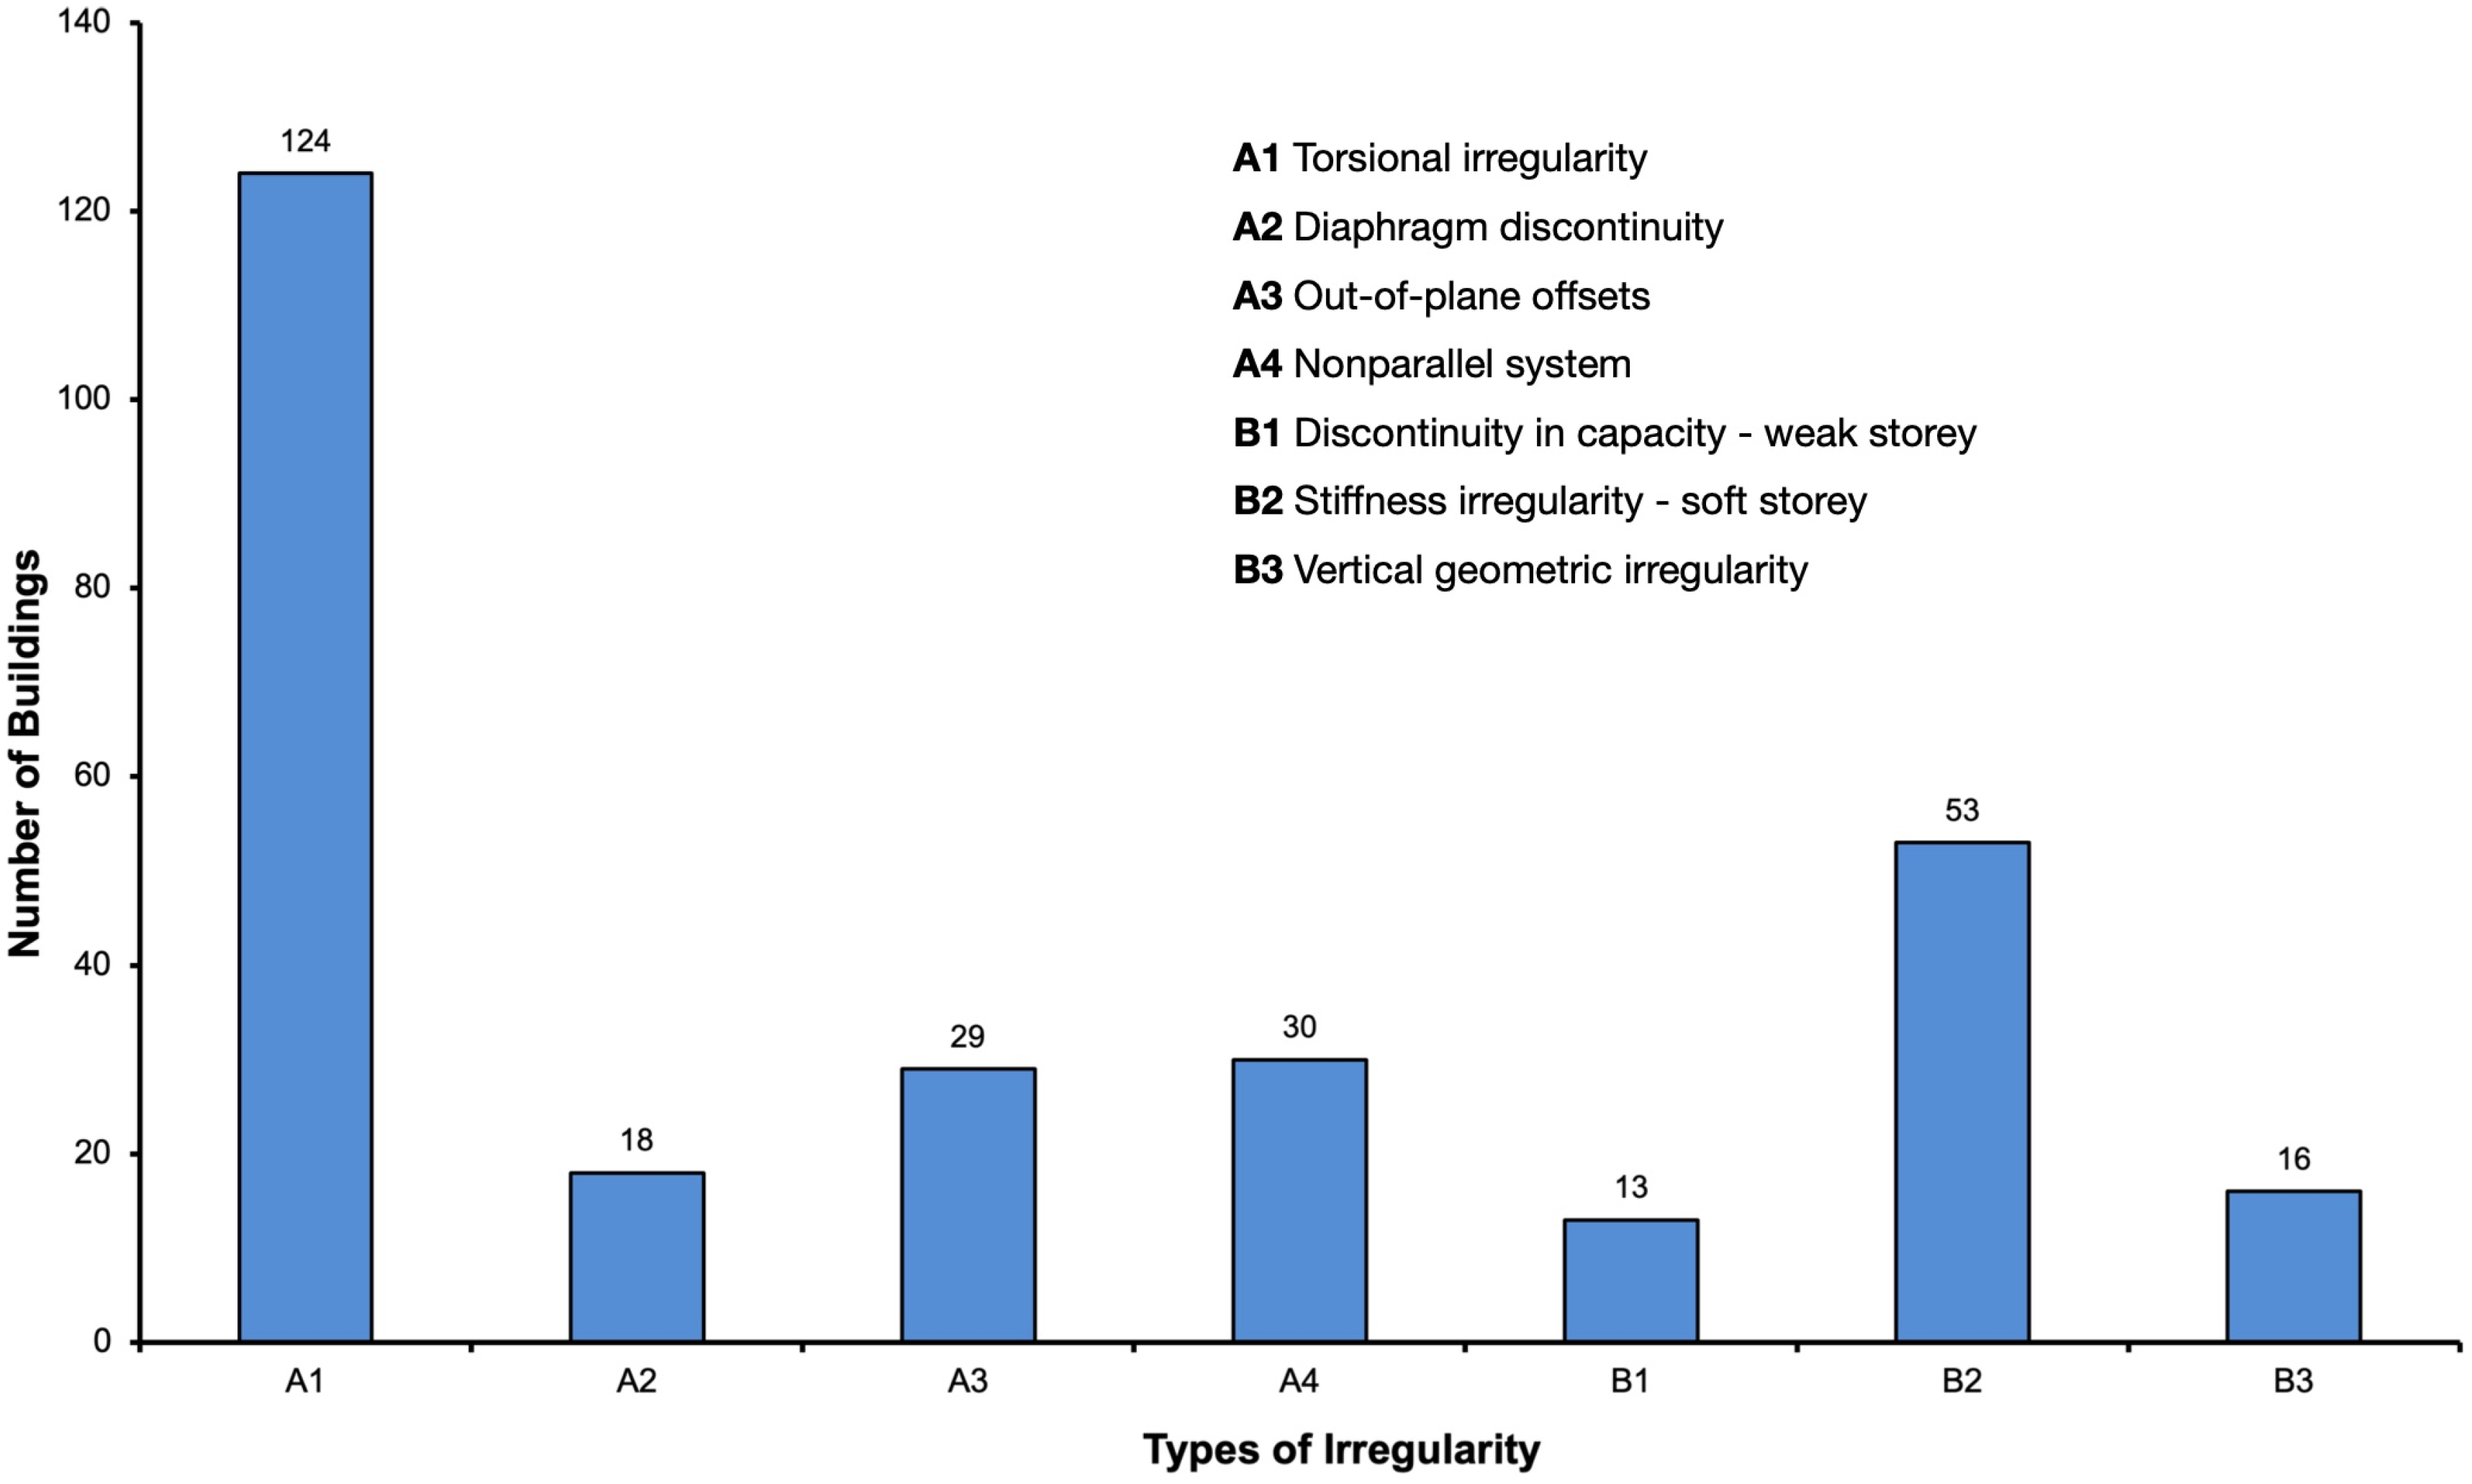
  • Structural information: Structural system, seismic region and location of fault systems, soil information, type of foundation, and type of material used for concrete and steel reinforcement. Irregularities in the plan and elevation of the building, as these can make the building more susceptible to collapse in the event of an earthquake. The vertical continuity of masonry infill walls is also specified for RC structures, as they are the main cause of the “soft floor” phenomenon. Each type of irregularity is considered to obtain a score for determining the overall damage. The different types of irregularities are defined in [43] as follows: A1: Torsional irregularity, A2: Diaphragm discontinuity, A3: Out-of-plane offsets, A4: Non-parallel systems, B1: Discontinuity in capacity—weak story, B2: Stiffness irregularity—soft story, B3: Vertical geometric irregularity. For the calculations of WI, the cross-sectional areas of the load-bearing columns, shear walls and brick walls for both in the x and y directions supporting the first floor in along with the total area of the floor.
The proposed framework envisages the use of digital tools for the built environment to proactively compile relevant information described above that is important for pre- and post-earthquake planning and management in an integrated and sustainable manner. Building an infrastructure to progressively feed information and update after each event in large urban areas is critical to the effective deployment of resources and efforts to prevent loss of life and property. Starting in 2027, Turkey will, will move toward the use of e-permits requiring BIMs during the building permit application [44]. Other European countries and regions with high seismicity are also working towards establishing e-permit schemes. This legislative requirement will provide a comprehensive mechanism for compiling the necessary information in digital format which will support the implementation of the framework proposed in this study.

3. Case Study: Istanbul Earthquake Masterplan Zeytinburnu Pilot Project

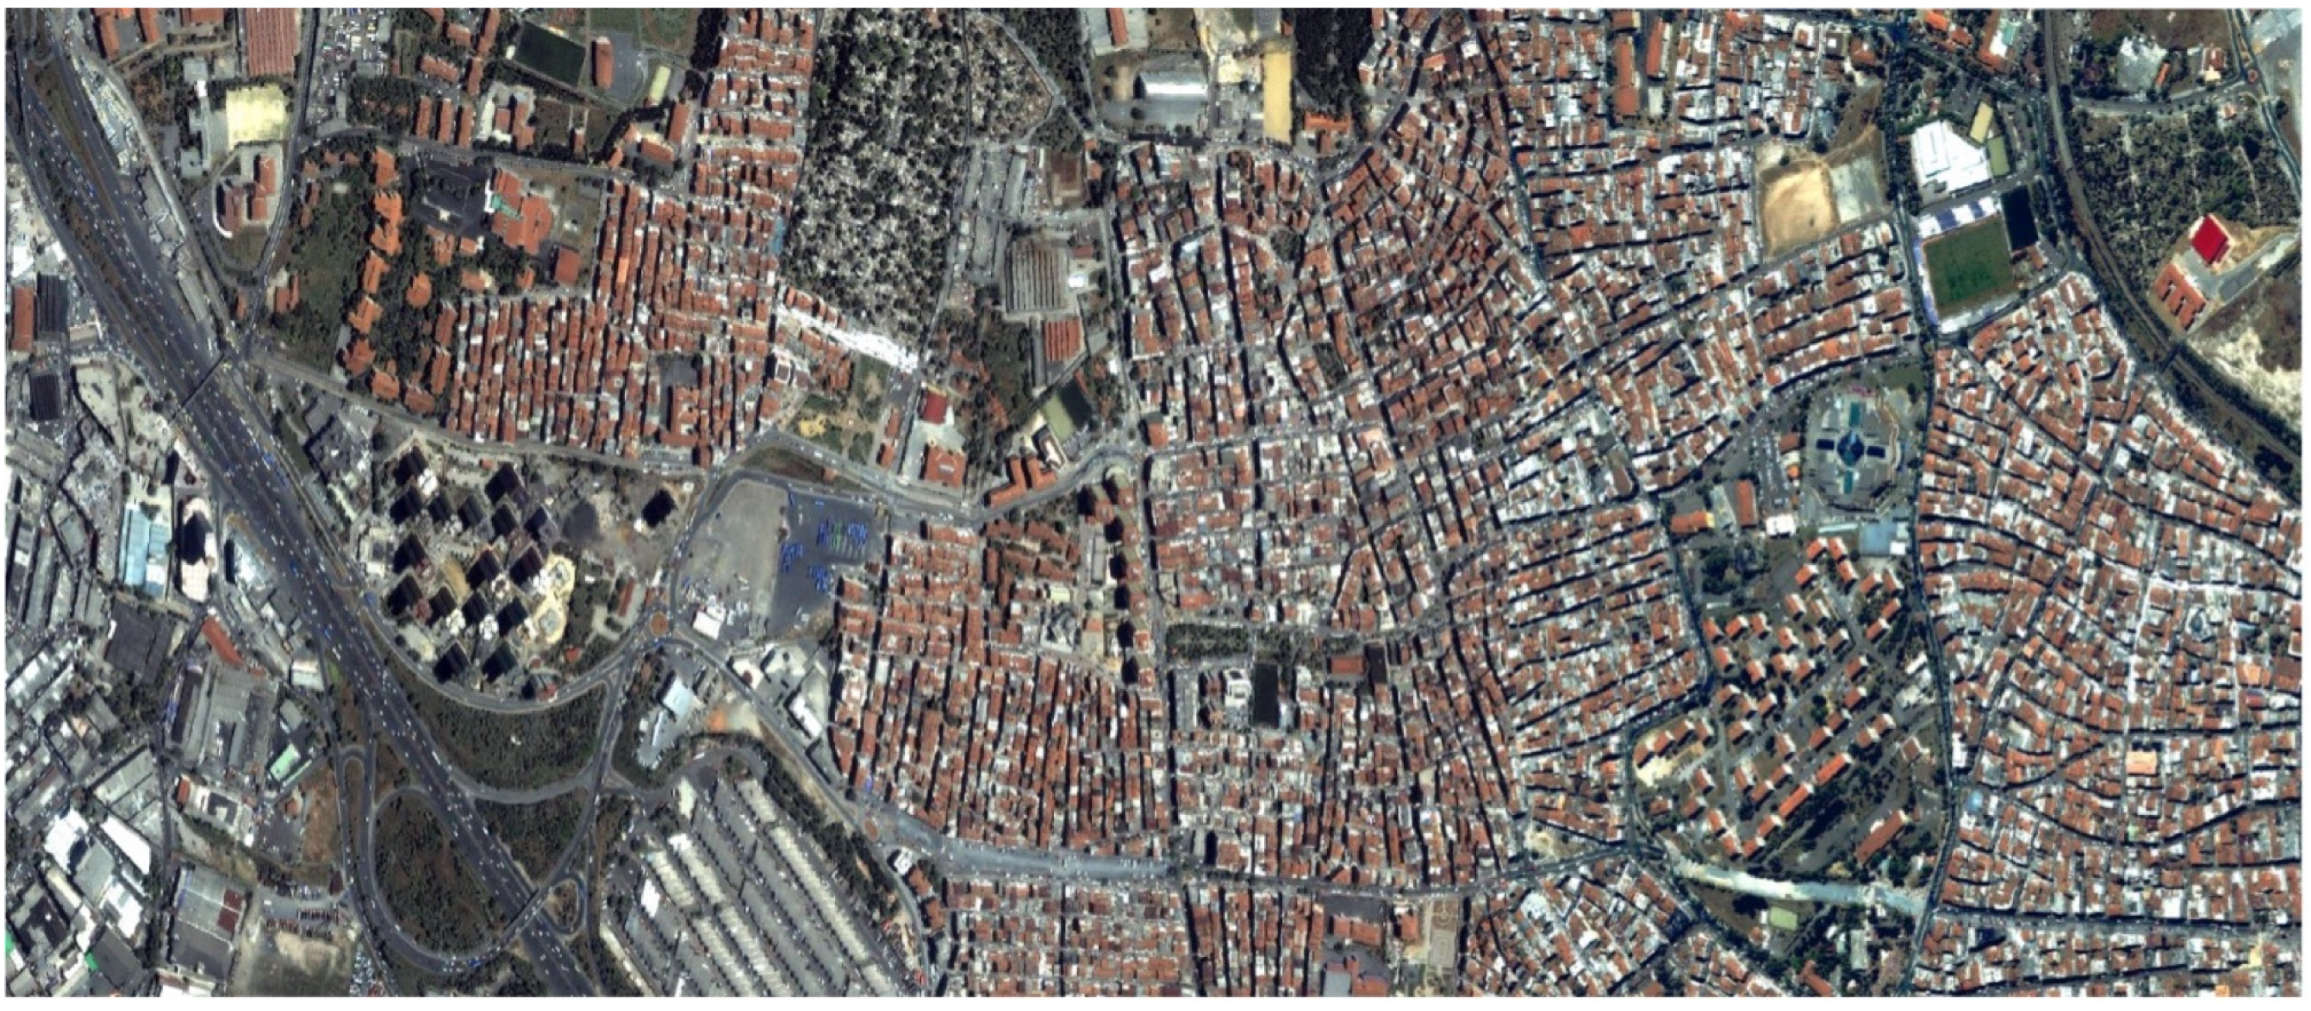
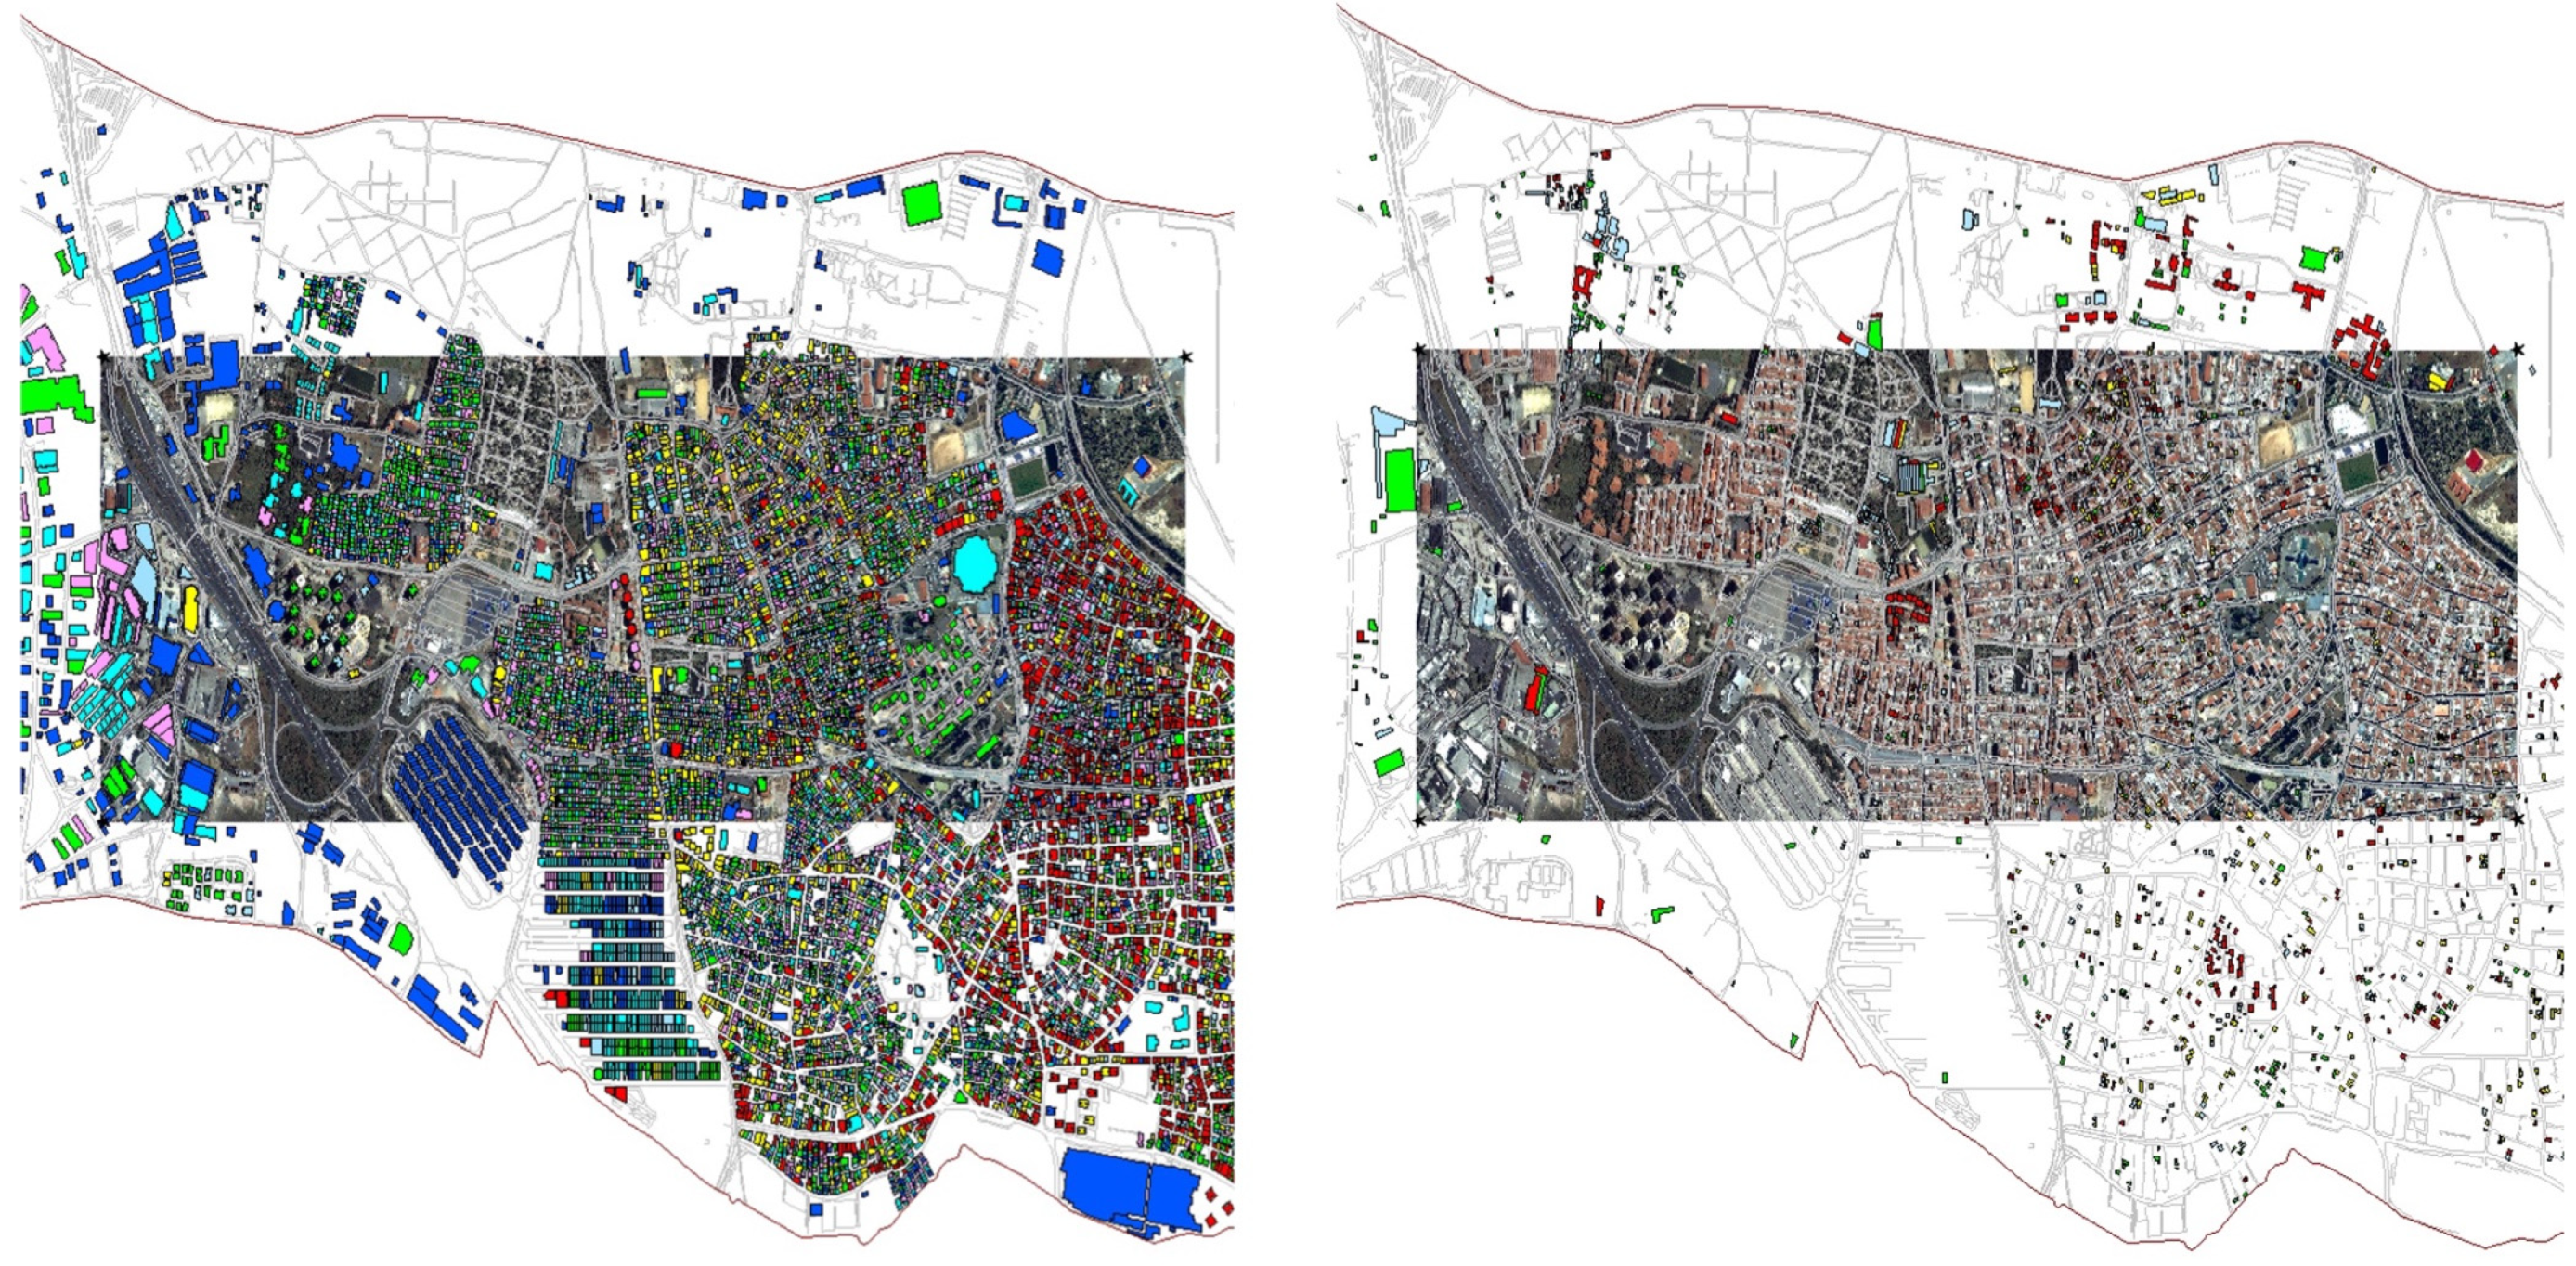
The 1999 Kocaeli earthquake, which occurred in the Marmara region with a magnitude of Mw = 7.4, caused major damage in the coastal region on the European side of Istanbul. A master plan project was prepared to assess the impact of a future earthquake. In this context, a pilot project was carried out in the Zeytinburnu region of Istanbul to evaluate the seismic vulnerability of existing RC and masonry buildings and to test the application of the proposed method [22]. The satellite images of the Zeytinburnu region are shown in Figure 7. In Figure 8, there are about 16,000 buildings in this area; 11,000 of them are reinforced concrete and 5000 are masonry. During the field studies, several parameters that could affect the seismic response of reinforced concrete and masonry buildings were recorded, including the following: Type of structure, number of stories, structural irregularities, and construction quality. Each parameter was calculated considering the relevant parameters for RC and masonry buildings. In addition, a capacity parameter was defined for each damage level of both building types. The seismic vulnerability of buildings was then determined based on a site-specific seismic hazard analysis. Based on the parameters determined during the field investigation, various methodologies for assessing the vulnerability of buildings to seismic impacts were then proposed [22,24].

3.1. Prioritization of Seismic Risk of Buildings

Various levels of assessments were conducted throughout this study: Basic walk down evaluations where general structural parameters of the building inventory stock were gathered yielding preliminary seismic performance grading of the existing RC buildings in Zeytinburnu relative to each other. More detailed preliminary assessments where field teams gathered specific information about the structural system of each building including all dimensions of structural and nonstructural elements to calculate a seismic performance score were conducted. The main objective of the procedure is to identify the buildings that are highly vulnerable to damage [7,24].
The purpose of these analyses is to provide information on the relative seismic vulnerability levels of buildings among each other, rather than determination of seismic safety and deficiency of each building. As such regions with high level of vulnerability in studied urban areas could be determined.

3.2. Estimation of Seismic Performance/Damage Levels of Buildings

More detailed linear and nonlinear performance-based analyses were conducted on the most vulnerable buildings to evaluate their seismic performance and expected damage levels under code-prescribed ground motions. These analyses required the as-built dimensions and reinforcement details of all structural elements.
The performance criteria for these studies were defined as “life safety” for the seismic input determined for the deterministic scenario and as “collapse prevention” for the probabilistic seismic hazard analysis for an exceedance probability of 10% in 50 years. For each building the displacement demand of the seismic input for was compared to the displacement capacity for life safety and collapse prevention using the procedure defined in FEMA 356 [8]. The seismic input is defined by a damped, site-specific acceleration spectrum of 5%, which is specified by spectral acceleration values for T = 0.2 s and T = 1.0 s, which are calculated for the specified site considering the local site conditions.
The performance of RC and masonry buildings is assessed by comparing the seismic displacement demand with the displacement capacity. The demand-to-capacity relationship is evaluated against seismic performance criteria defined as Life Safety (LS) and Collapse Prevention (CP). The results for LS and CP can then be linked to damage states for building damage assessment. Buildings performing below the LS threshold are classified as having slight damage. Those between LS and CP are considered to have moderate to extensive damage, while buildings exceeding the CP threshold are regarded as collapsed.
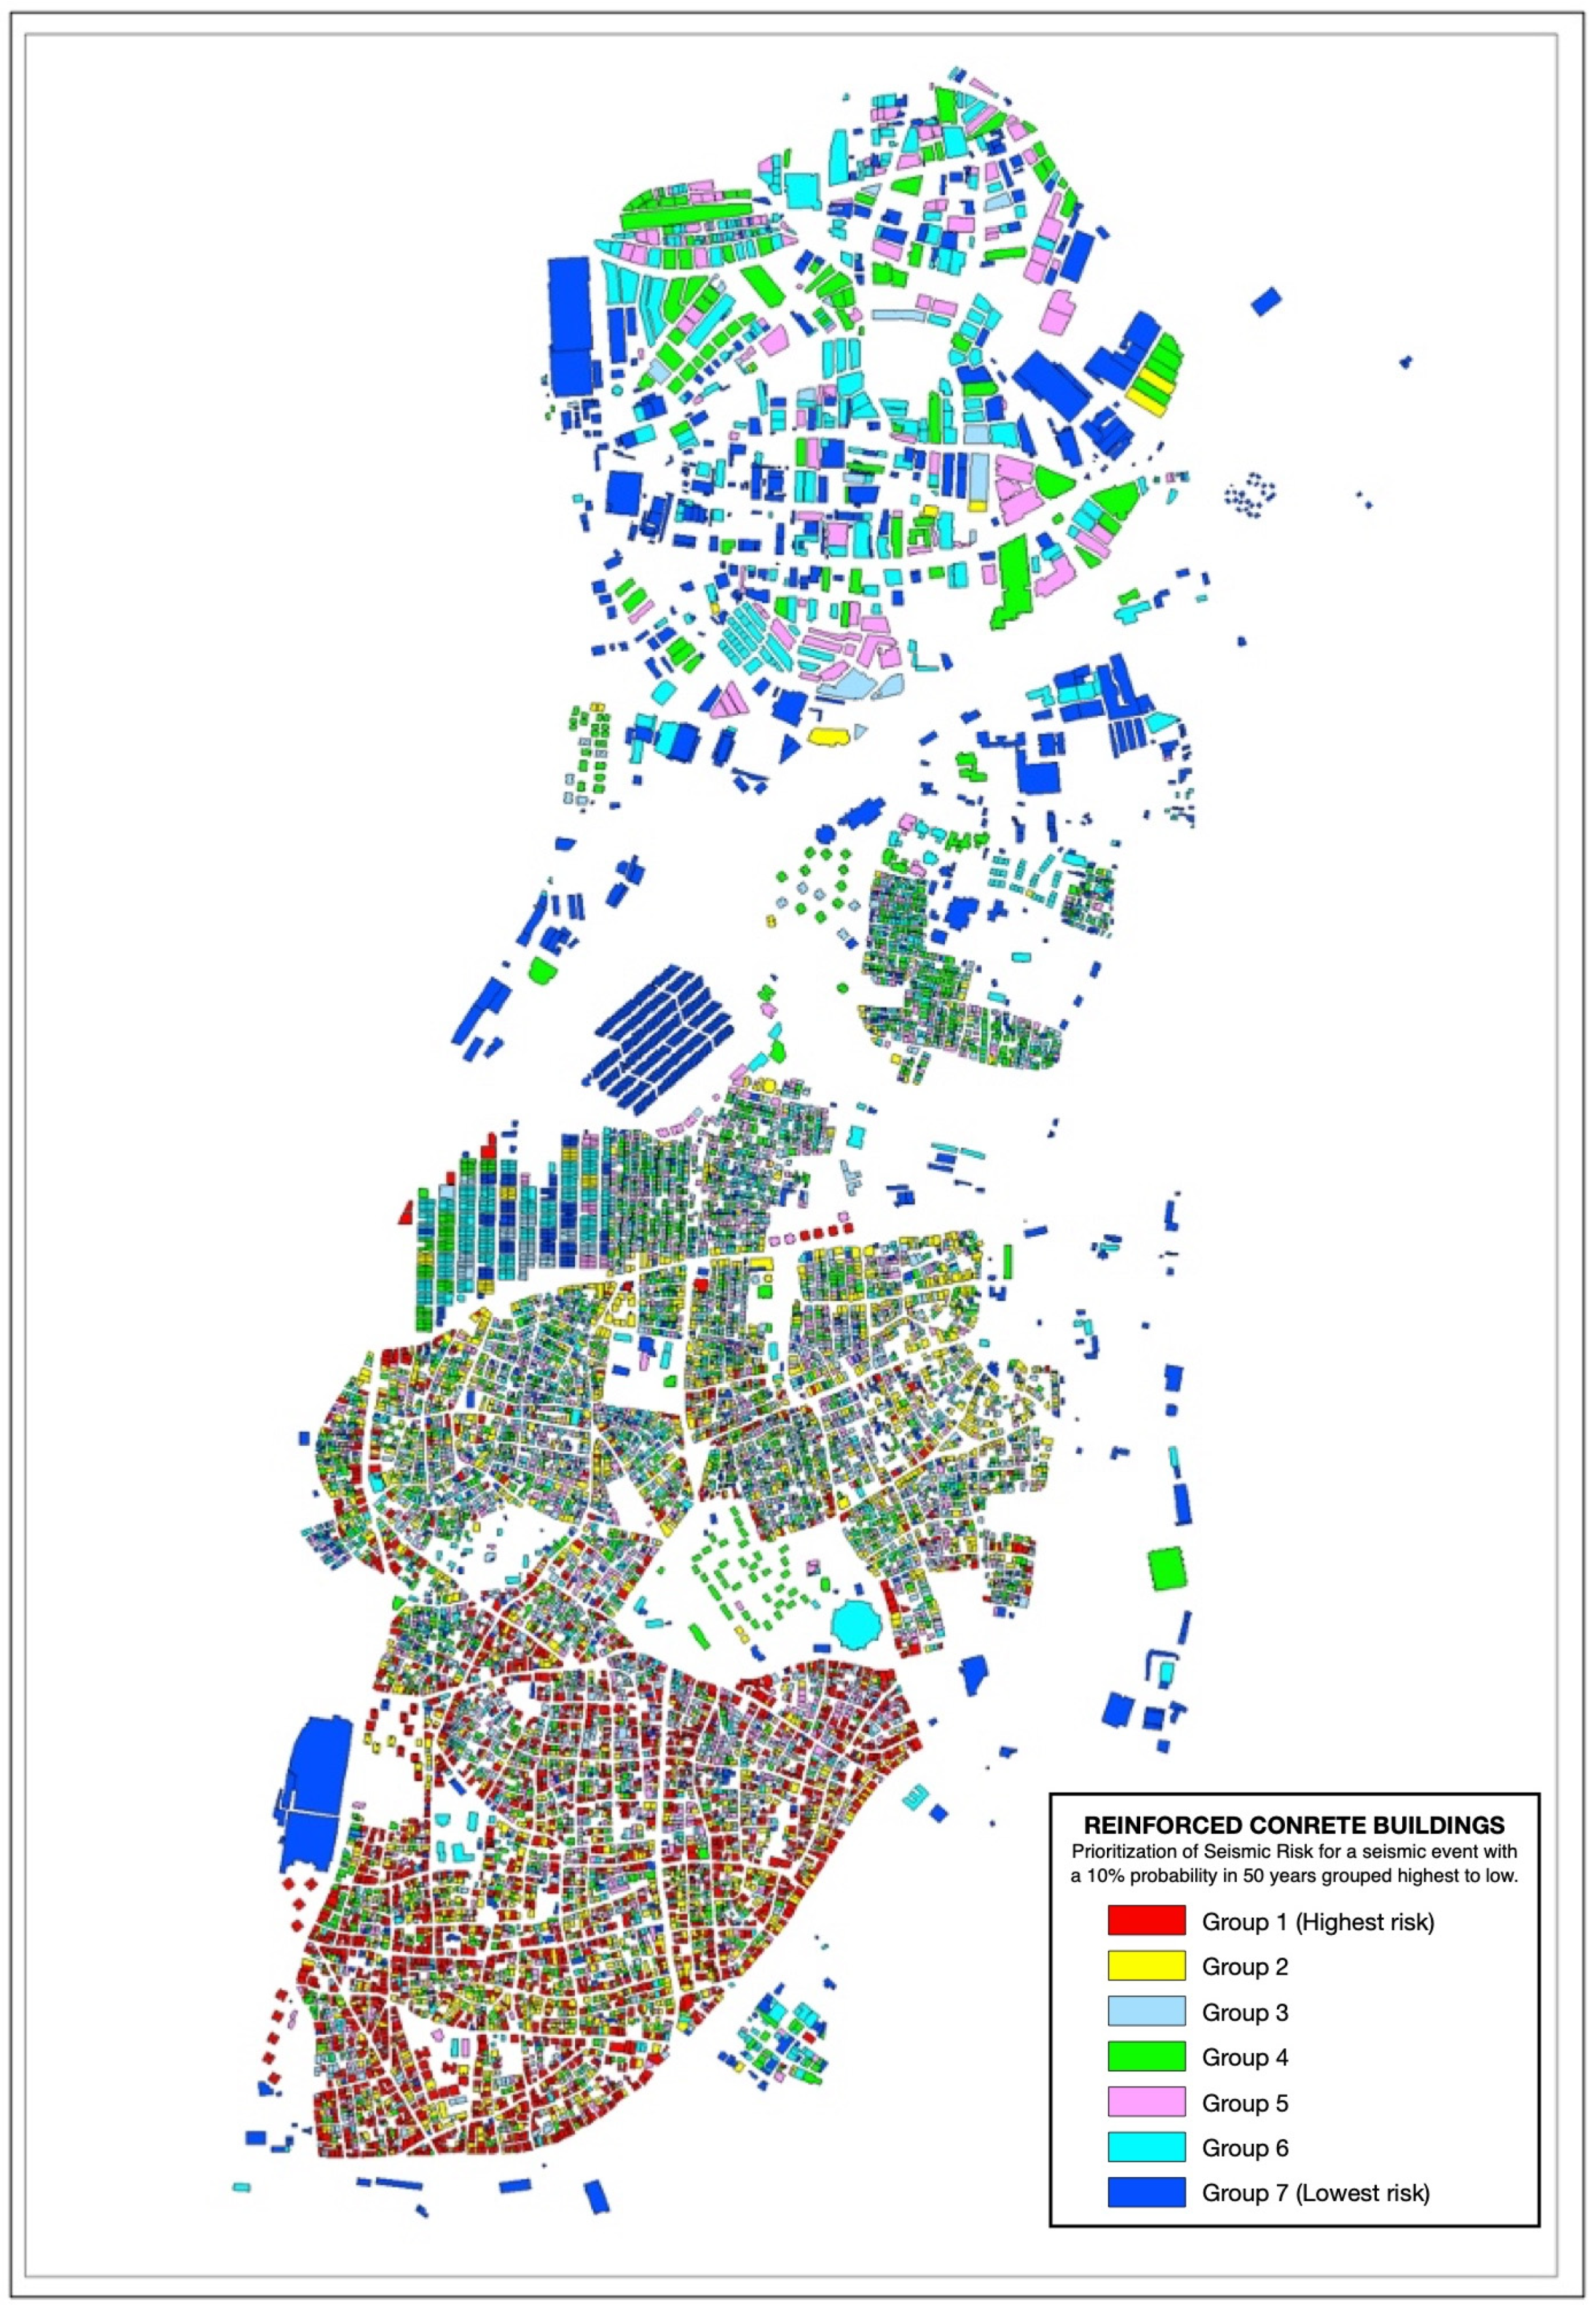
The methodology above was used in the pilot project within the Zeytinburnu district, Istanbul, to assess the vulnerability of existing building stock, and can also be used for a damage assessment of buildings after an earthquake. The results of applying this methodology are shown in terms of “life safety” and “collapse prevention” for each building type where the prioritization of seismic risks are shown in Figure 9 and Figure 10 for RC and masonry structures, respectively. The highest levels of damage are shown by red, with progressively less levels at different colors.
Basic walk down assessments rely on visual inspection and are relatively subjective while detailed structural analysis produce in-depth information of seismic performance for existing building stock it is typically costly and time-consuming. An assessment framework which balances effort and level of information with value in outcomes that is sustainable is necessary to large scale rapid assessments. This framework presented in this paper aims to address this need.

3.3. Earthquake Risk Assessment: Istanbul Zeytinburnu District

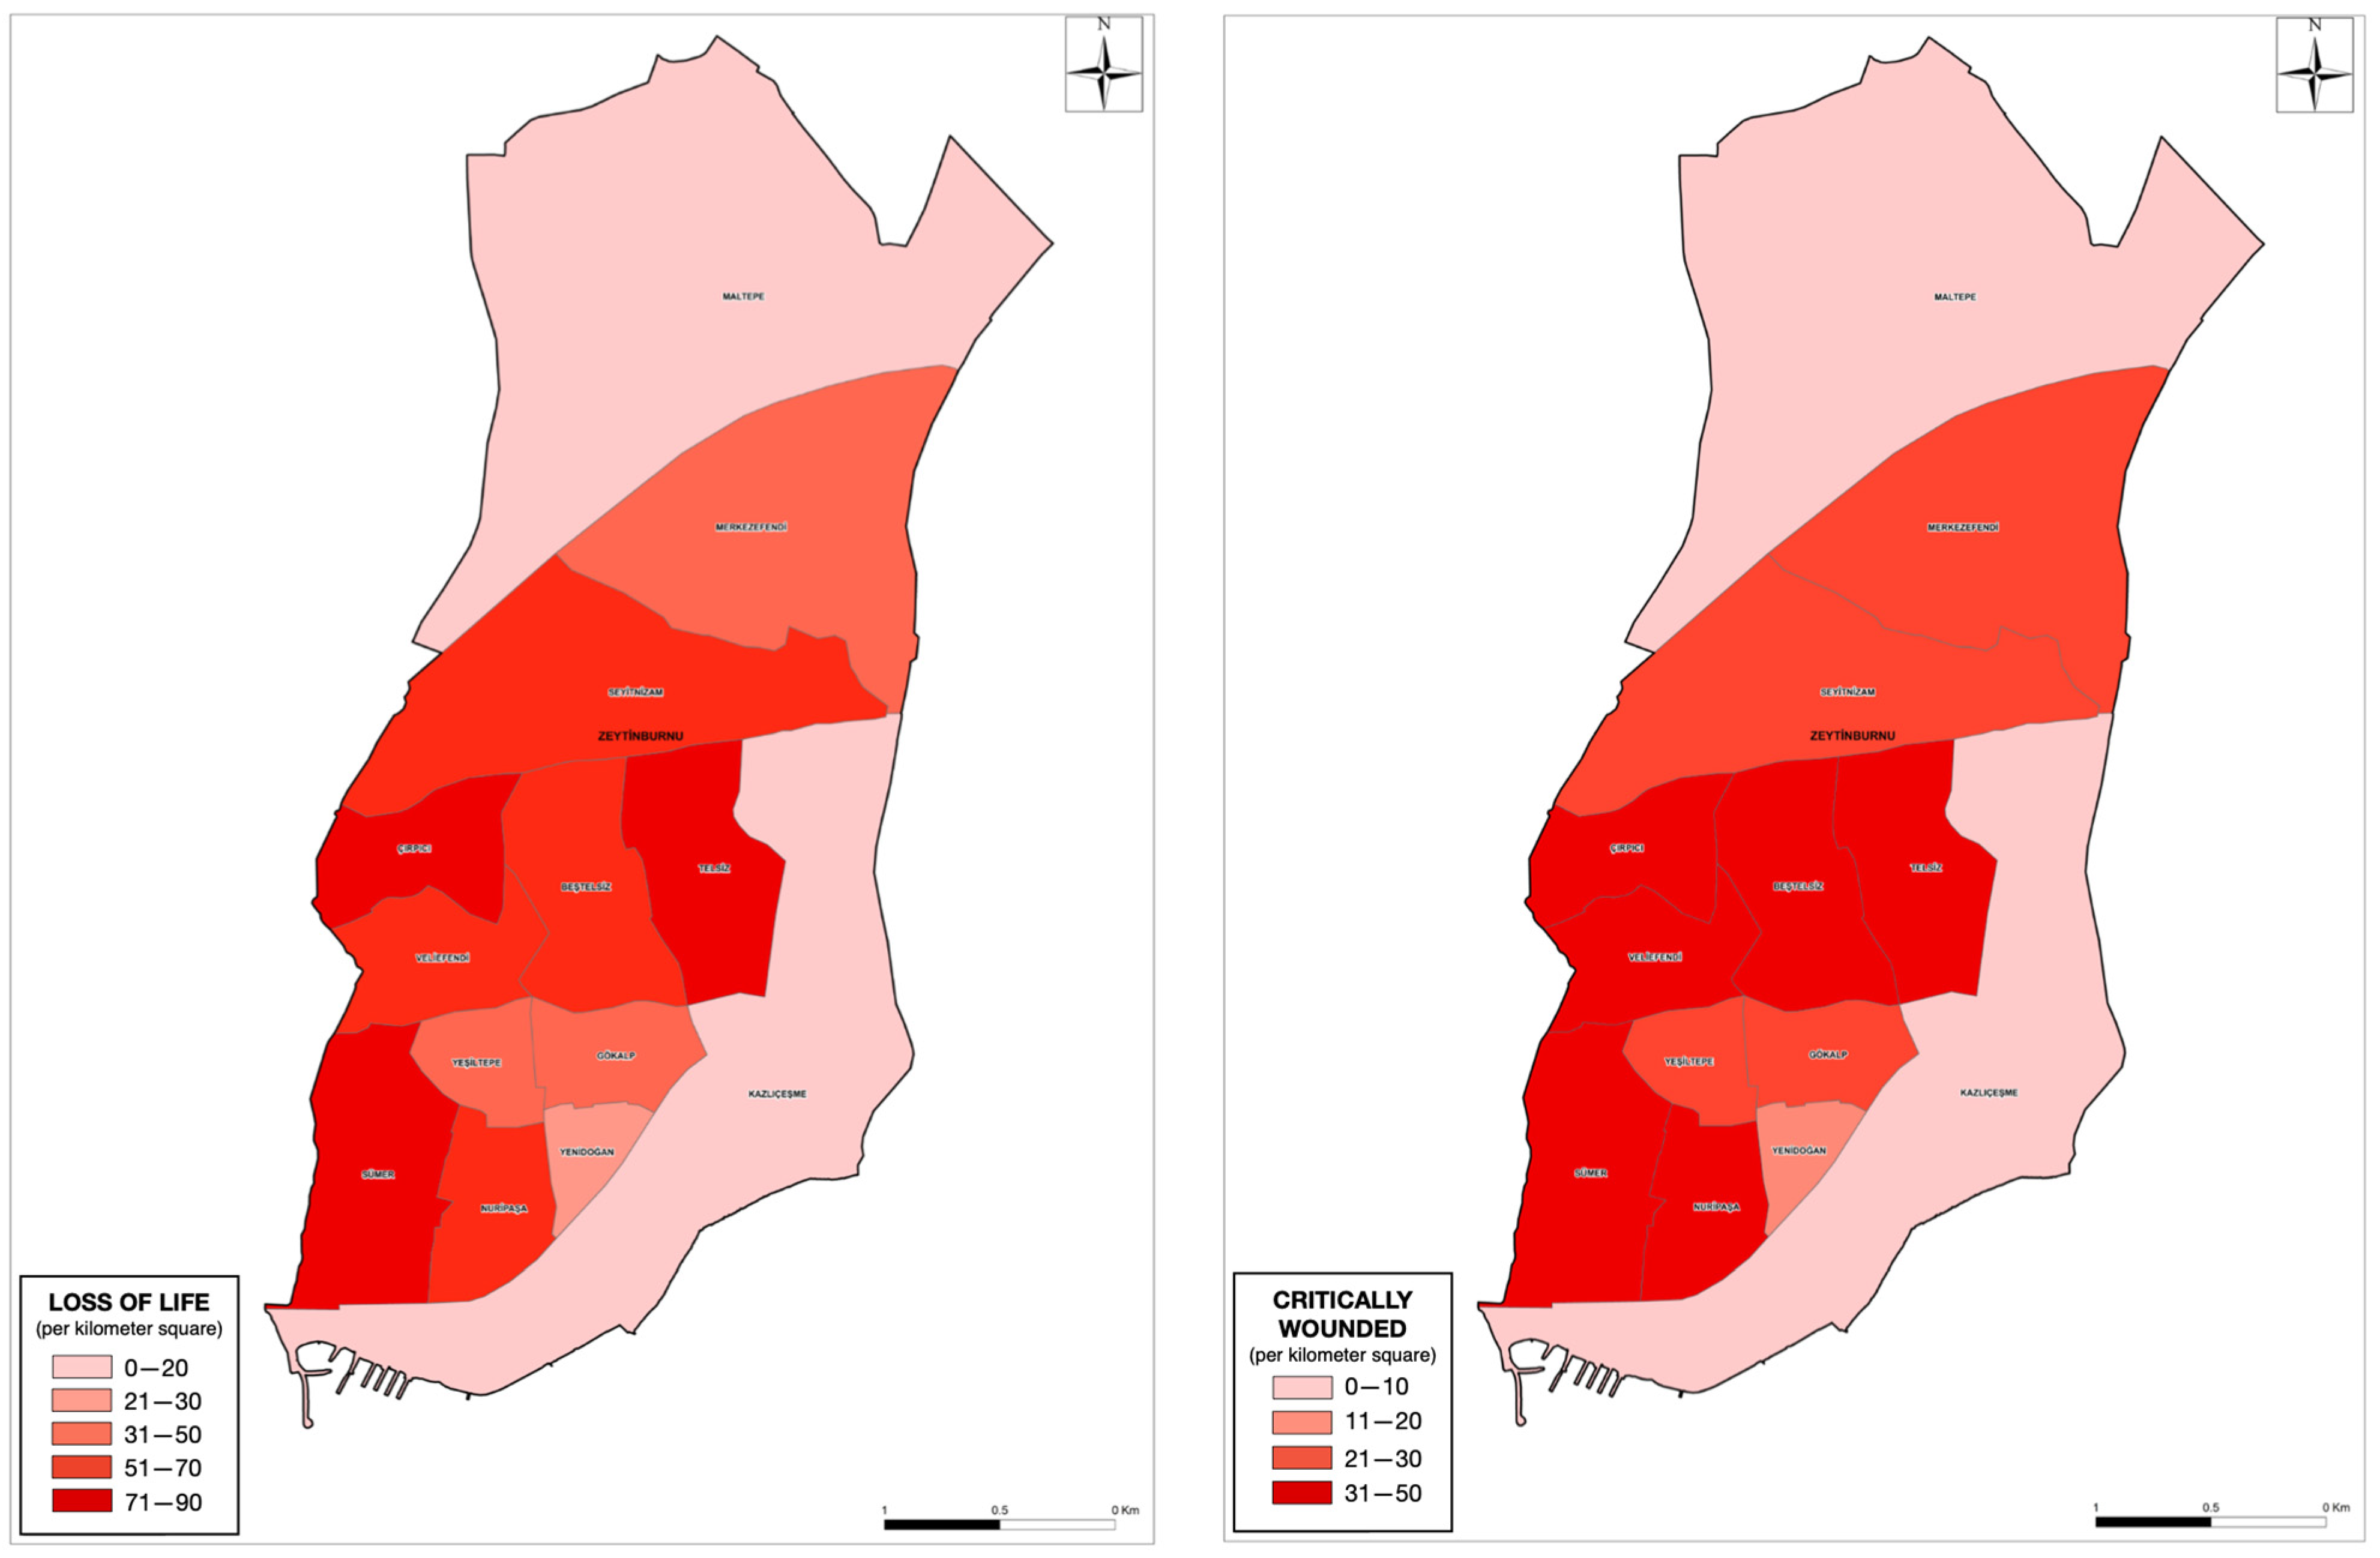
The project to update the estimates of potential losses in the province of Istanbul was prepared in 2020 based on 2019 data [45]. The results of the Mw = 7.5 earthquake scenario were used in the study. The area of the Zeytinburnu district is 11.31 km2 with a population of 293,574 (as of 2019). In an earthquake scenario of Mw = 7.5, an estimated 668 fatalities and 374 serious injuries are expected, as shown in Figure 11.
The basic principles of earthquake preparedness in Istanbul are summarized by [46] as follows:
  • Do not increase the existing risk by building considering earthquake zones, new regulations and safe structures,
  • Reduce the existing risk by retrofitting,
  • Transfer the risk through insurance.
Seismic vulnerability assessment studies have shown that the Zeytinburnu district is the most vulnerable area in Istanbul. Various measures are being taken to reduce the risk of an earthquake disaster: demolition of vulnerable buildings, widening of roads, establishing evacuation corridors and assembly points, establishing community centers, strengthening of public infrastructure, rehabilitation of vulnerable residential areas, relocation of industry from the district.
The loss assessment analysis is compared with the results of previous studies by [47] to estimate the building damage, remediation costs, economic loss and cost–benefit analysis for Zeytinburnu neighborhood in Istanbul with MAEviz-Istanbul (HAZTURK).
Supplementary tools such as satellite imagery, when combined with data from multi-viewpoint image and video fusion applications, have the potential to provide more accurate information about post-earthquake damage, since vertical satellite imagery alone has limitations [48]. Beyond satellite imagery, other remote sensing technologies are also required for assessing infrastructure and critical structures such as high-rise buildings, bridges, and railroads. For Istanbul, the quality of sensors and the spatial density of data are crucial for the rapid regional assessment of seismic damage after an event.
The assessment efforts for the Istanbul Earthquake Masterplan Zeytinburnu Pilot Project required significant resources, involving multiple institutions over an extended period. While it produced valuable information and analyses, the outcome is a snapshot of the area at that time, producing reports that could not be updated as the city continues to evolve. This underscores the need for a sustainable and practical framework for rapid seismic vulnerability assessment. As proposed in this paper, the CSWI approach, utilizing BIM within a GIS context, offers such a framework by providing threshold values as proxy indicators of seismic vulnerability across large urban areas. CSWI threshold represents the lateral rigidity of the ground story, usually the most critical story, as a means to assess code level “life safety” building seismic performance. The threshold is it be calibrated per studied urban area to capture the inherit situation on a local basis. As previously noted, the information needed for the proposed framework is becoming more readily available at the municipality level with mandates of BIMs during building permit applications.

4. Critical Seismic Wall Index CSWI Calculation Via BIM to Rapid Seismic Performance Evaluations

Old building stock in Istanbul was generally built using concrete manually mixed on site, resulting with buildings with a concrete strength class of C8 to C12 (cylindrical compressive strengths of 8–12 MPa) instead of the usual concrete strength class of C14 to C25 (cylindrical compressive strengths of 14–25 MPa). Also, most of the old buildings lacked proper reinforcement details, required for ductile earthquake-resistant buildings. The observed reinforcement in old buildings generally corresponds to S220 steel (yield strength of 220 MPa). The CSWI approach was developed to provide a rapid, initial assessment of the seismic behavior of existing RC buildings in Turkey.
Detailed seismic structural analyses were performed by the Engineering Earthquake Research Center for a total of 252 buildings: 92 buildings retrofitted following the 1998 Adana-Ceyhan earthquake (Mw = 6.3) and 160 undamaged buildings in the western part and Marmara region of Turkey, which were analyzed as pre-earthquake buildings. Based on these analyses, the CSWI value was calculated for these buildings, and a knowledge-based information system was subsequently developed.
The CSWI of a building is defined as the ratio of the total cross-sectional area of load-bearing walls and columns on the first load-bearing floor above grade to the typical total floor area, calculated separately in the x and y directions [10,11]. By analyzing the CSWI of all the examined buildings in conjunction with seismic structural analyses, a threshold Critical Seismic Wall Index (CSWI) can be determined, for rapidly estimating the seismic vulnerability of existing buildings. These results can be effectively used to evaluate both damaged and undamaged existing RC buildings and to inform retrofitting studies [49].
The CSWI are calculated in the x and y directions as follows:
C S W I x = ( 0.5 A c + A w x + 0.10 A b w x ) / A t
C S W I y = ( 0.5 A c + A w y + 0.10 A b w y ) / A t
where
C S W I x : Critical seismic wall index in the x-direction
C S W I y : Critical seismic wall index in the y-direction
A c : Cross-sectional area of the columns in the x- or y-direction on the first floor
A w x : Cross-sectional area of shear walls in the x-direction on the first floor
A w y : Cross-sectional area of shear walls in the y-direction on the first floor
A b w x : Cross-sectional area of brick walls in the x-direction on the first floor
A b w y : Cross-sectional area of brick walls in the y-direction on the first floor
A t : Total floor area on the first floor
The following two case studies are presented to illustrate the key aspects of the proposed approach for rapid vulnerability assessment of buildings across a large urban area, providing a basis for interpreting their expected seismic performance.

4.1. Post-Earthquake Case Study: 92 Retrofitted Buildings After the Adana-Ceyhan Earthquake of 1998 (Mw = 6.3)

The CSWI approach was used to evaluate the seismic performance of buildings retrofitted after the 1998 Adana-Ceyhan earthquake in Ceyhan province [50]. Of the 92 buildings analyzed, 89 buildings were of RC framed construction, and three buildings were of mixed construction. Most of the buildings were low-rise RC buildings with a varying number of stories ranging from one to seven stories. All the surveyed buildings were in a region with high seismic risk. Of this building stock, 32 were undamaged (35%), 39 were slightly damaged (42%) and 21 were moderately damaged (22%).
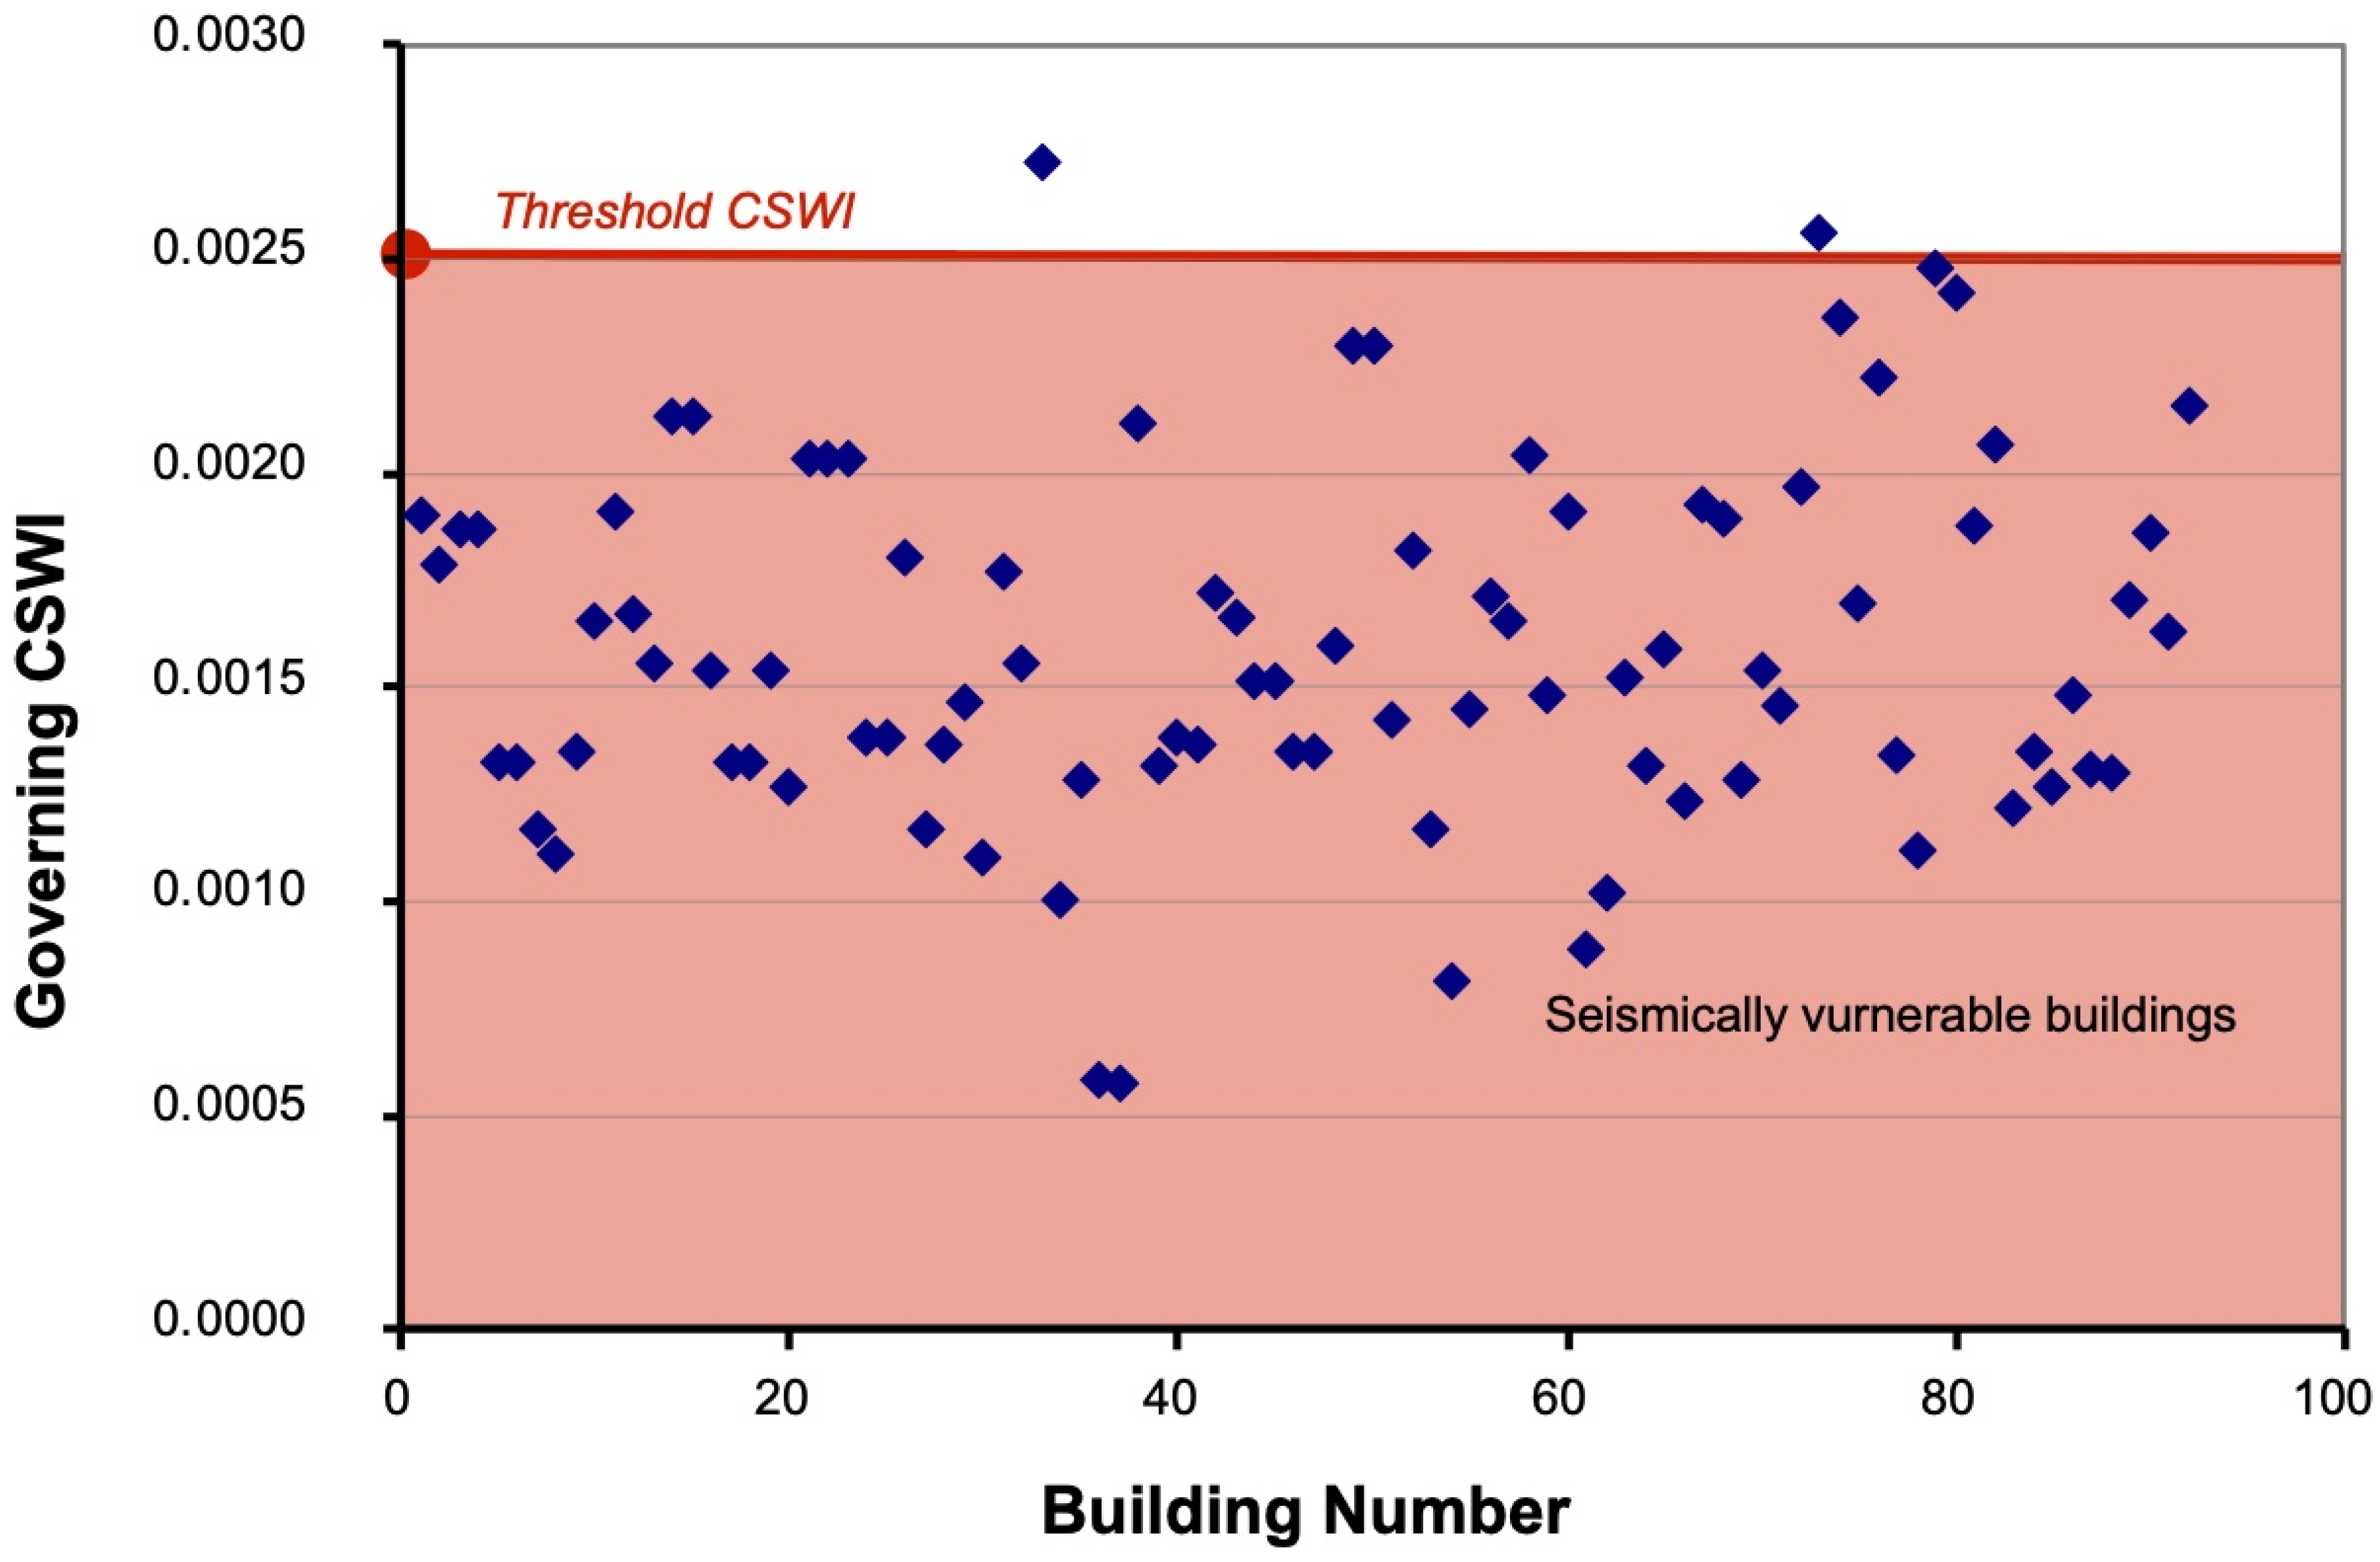
Although some buildings were not visibly damaged because the earthquake was not strong enough, a seismic structural analysis was performed for all of them according to [37]. The analysis showed that none of the buildings met the required structural strength levels and all needed retrofitting. The calculated CSWI values for 92 RC buildings requiring retrofitting are shown in Figure 12; only two buildings had a CSWI greater than 0.0025 which is chosen as an appropriate rounded threshold value representing a proxy indictor of seismic vulnerability.
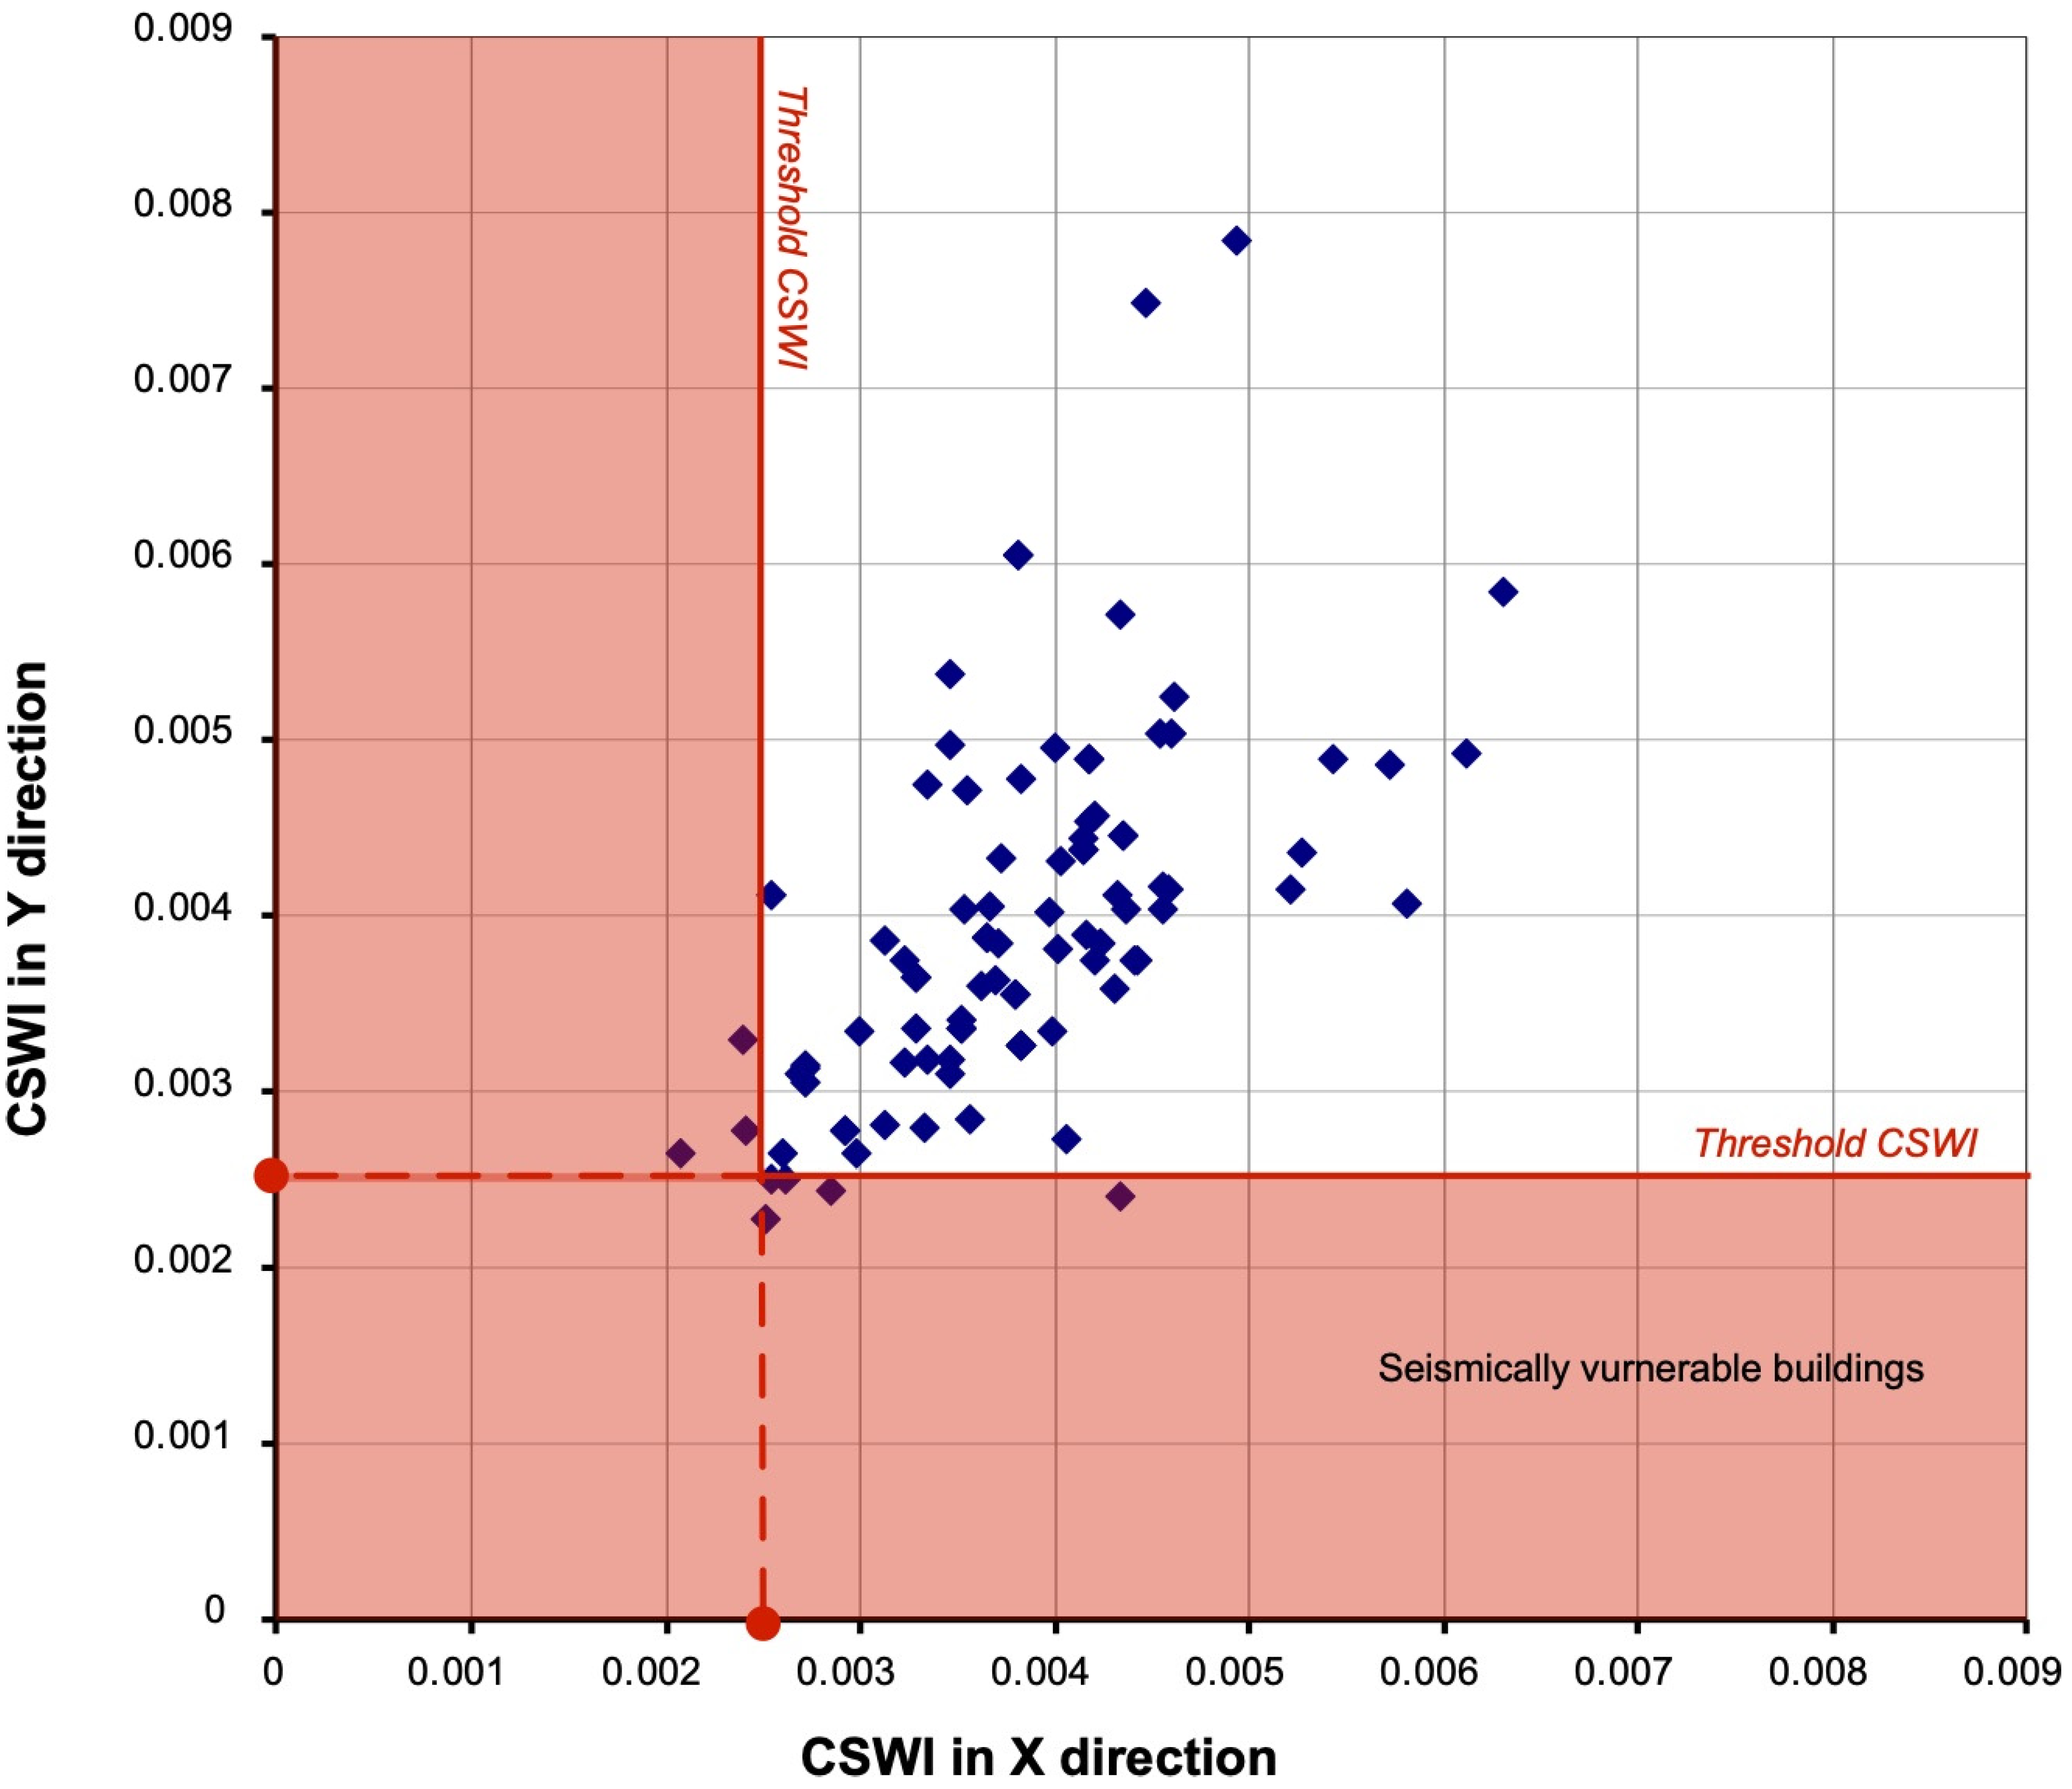
The buildings were retrofitted in accordance with the current seismic code, and the CSWI of the 92 buildings was then recalculated, as shown in Figure 13. After retrofitting, most CSWI values in both the x and y directions exceeded the 0.0025 threshold. Only three buildings in the x-direction and two in the y-direction remained below the threshold, though they were very close to it. These results demonstrate that the CSWI threshold can be used as an indicator, providing a reliable and rapid tool for assessing the seismic behavior of similar RC building types which delineates seismic vulnerability of buildings per expected code level performance.
The main objective of the CSWI approach is to rapidly screen a large number of buildings and identify those most vulnerable to seismic damage. Previous studies [24] comparing different multi-tier approaches—from basic walk downs relying on visual inspection to more detailed assessments based on structural and nonstructural measurements—have shown generally consistent results. However, in some cases, the assessment outcome may shift from classifying a building as vulnerable to non-vulnerable, or vice versa. Such variation is expected, as many factors influencing seismic performance can only be fully captured through detailed structural analysis, which requires extensive site surveys of material properties and confinement details to accurately model the behavior of individual structural elements. This process is typically costly and time-consuming. The CSWI approach is therefore proposed as a rapid assessment tool rather than a precise method for determining the exact seismic performance of a building. Its simplicity and speed come at the cost of reduced accuracy.

4.2. Pre-Earthquake Case Study: 160 Undamaged Buildings in Western and Marmara Region of Turkey

The goal of this case study was to illustrate the method for estimating the initial seismic performance of existing undamaged building structures. In this study, 160 undamaged buildings were investigated by the METU Earthquake Engineering Research Center after the 1999 Kocaeli and Duzce earthquakes as part of an unpublished privately funded project. Of the 160 buildings investigated, 86% were RC buildings with a varying number of stories, ranging from one to nine stories. The year of construction and the structural systems were also recorded. Of the buildings studied, 54% were built with RC frames and 32% with RC frames and shear walls. Most of the buildings were in a high seismic risk zone and were mainly in seismic region I (116 buildings) and seismic region II (40 buildings). The field studies showed that most of the RC buildings were built with C14 strength class concrete and S220 class reinforcement. An excerpt of the building data compiled is given in Table 1 below.
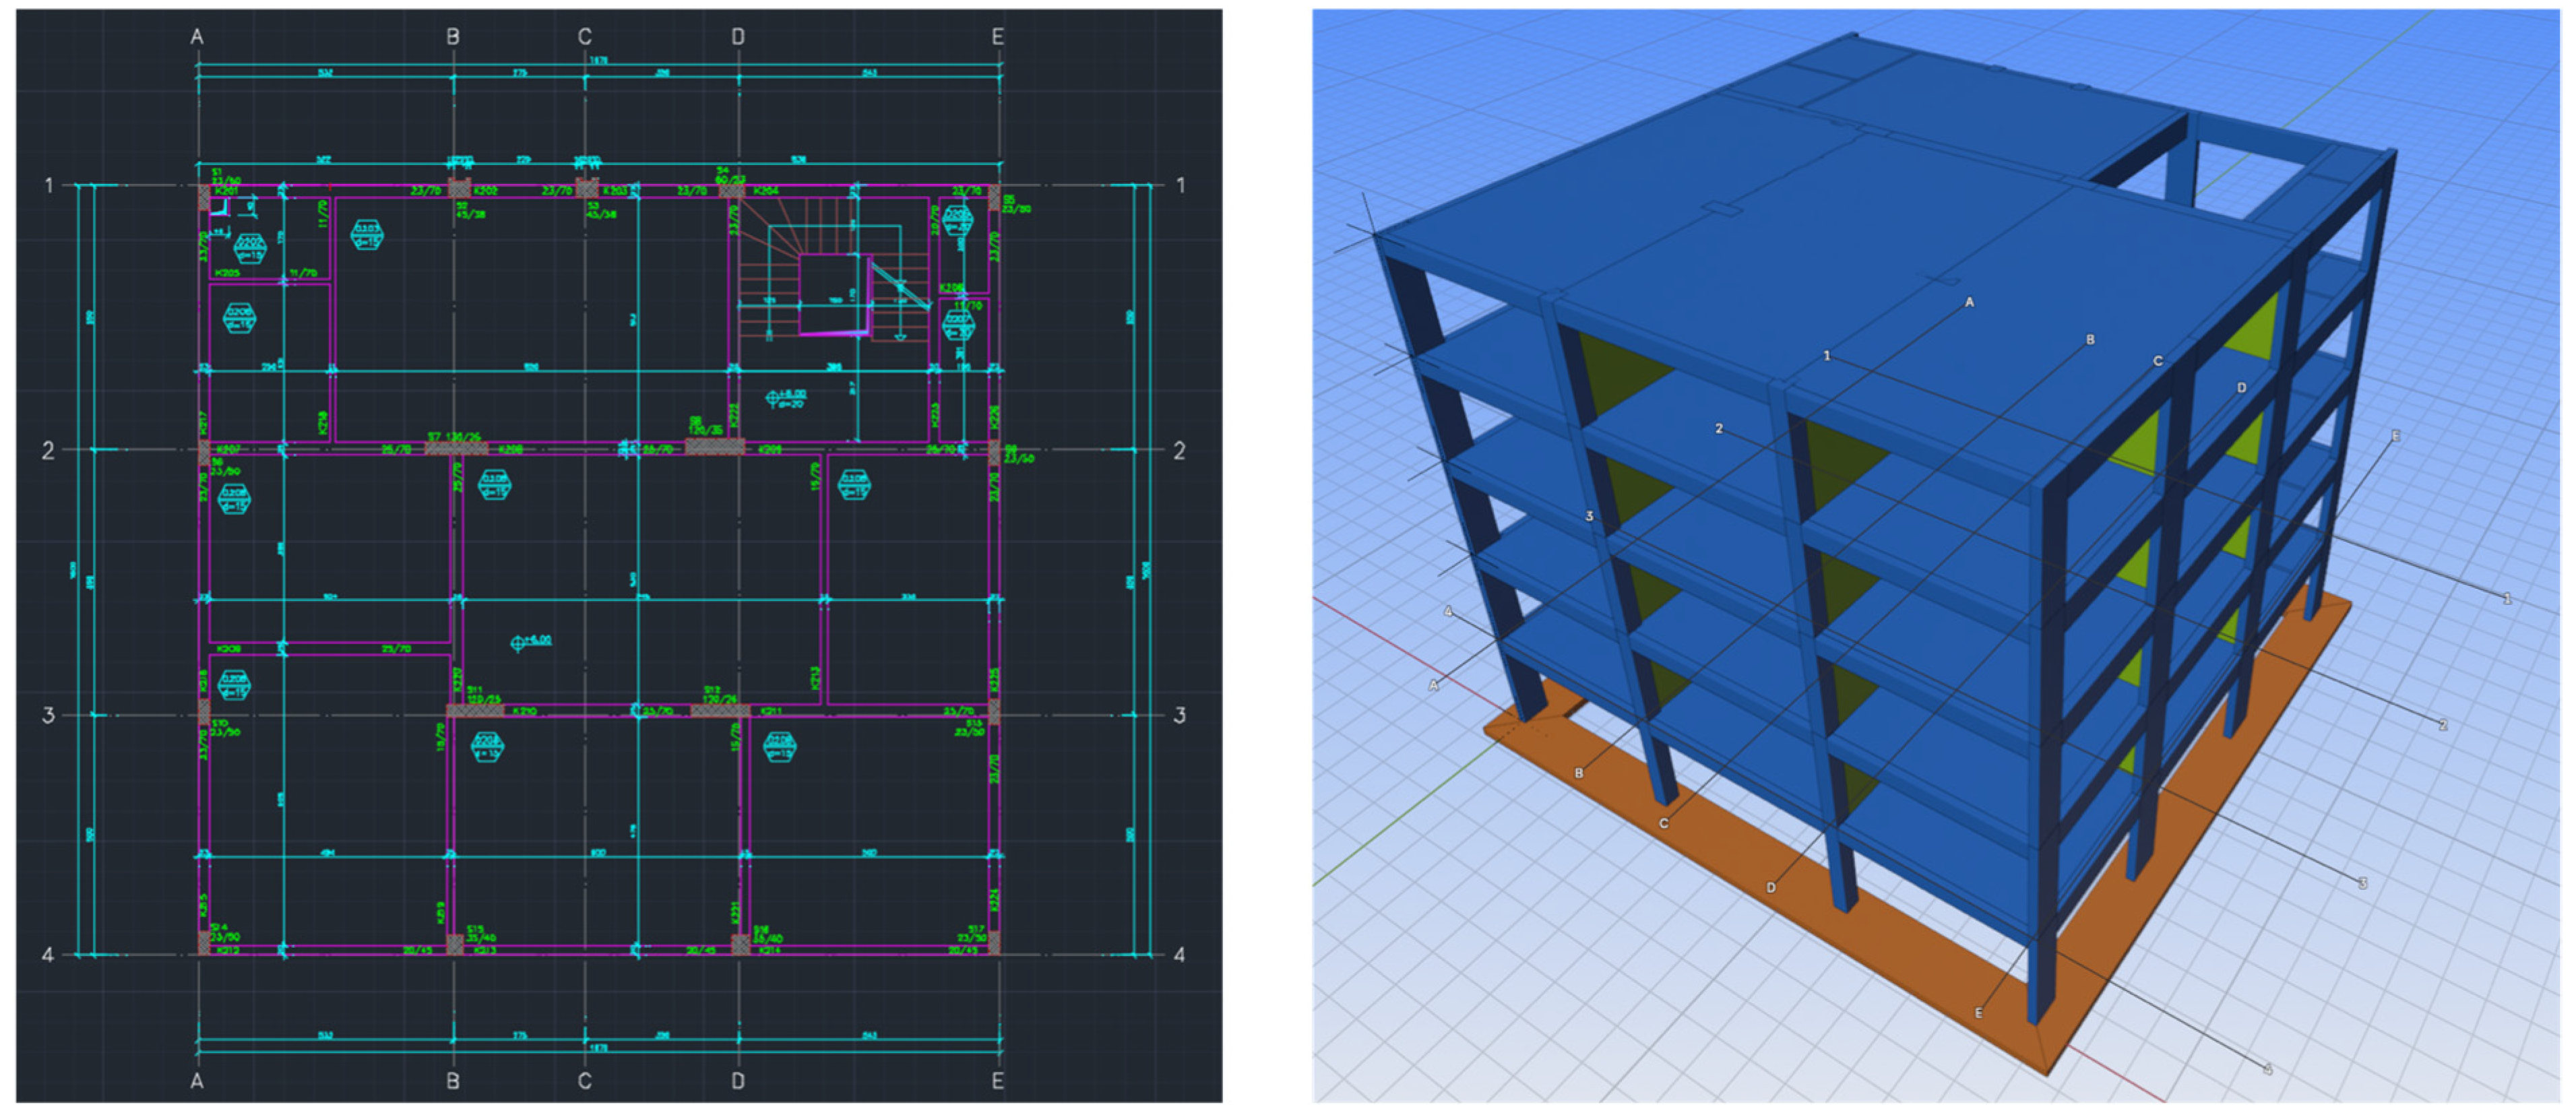
The seismic vulnerability of the buildings was assessed using the CSWI Equations (1) and (2) for both the x and y directions. Calculation is made using data extracted from structural BIMs created using drawings prepared from site surveys, as shown in Figure 14. To account for structural irregularities, data on 3D effects (torsion), top-view irregularities, and vertical irregularities were also compiled and included in the tabulated dataset. Seismic structural analyses were performed to evaluate structural capacities and verify code compliance [43]. Collapse mechanisms were then examined in relation to structural configuration, gravity and lateral loads, and material properties. The primary objective was to ensure that the buildings met the minimum life safety requirements specified in the code.
Most of the buildings reviewed where built with torsional regularities (A1) as shown in Figure 15. This type of irregularity was prominently identified in the buildings that were deemed seismically insufficient and required strengthening.
Based on these studies, a database was then compiled for these buildings which is useful and convenient for rapid assessment of seismic performance in conjunction with GIS and satellite images for future reference and assessments.

4.3. Critical Seismic Wall Index CSWI Approach Considering Structural Irregularies via BIM

In situ data on structural irregularities are incorporated into the BIMs, allowing their effects on building assessment to be accounted for by introducing an additional criterion to the CSWI threshold. Accordingly, the impact of irregularities as defined in the seismic code, on building seismic vulnerability is considered. The adjustment of the CSWI threshold for buildings with irregularities provides an added layer of information to rapid seismic vulnerability assessment.
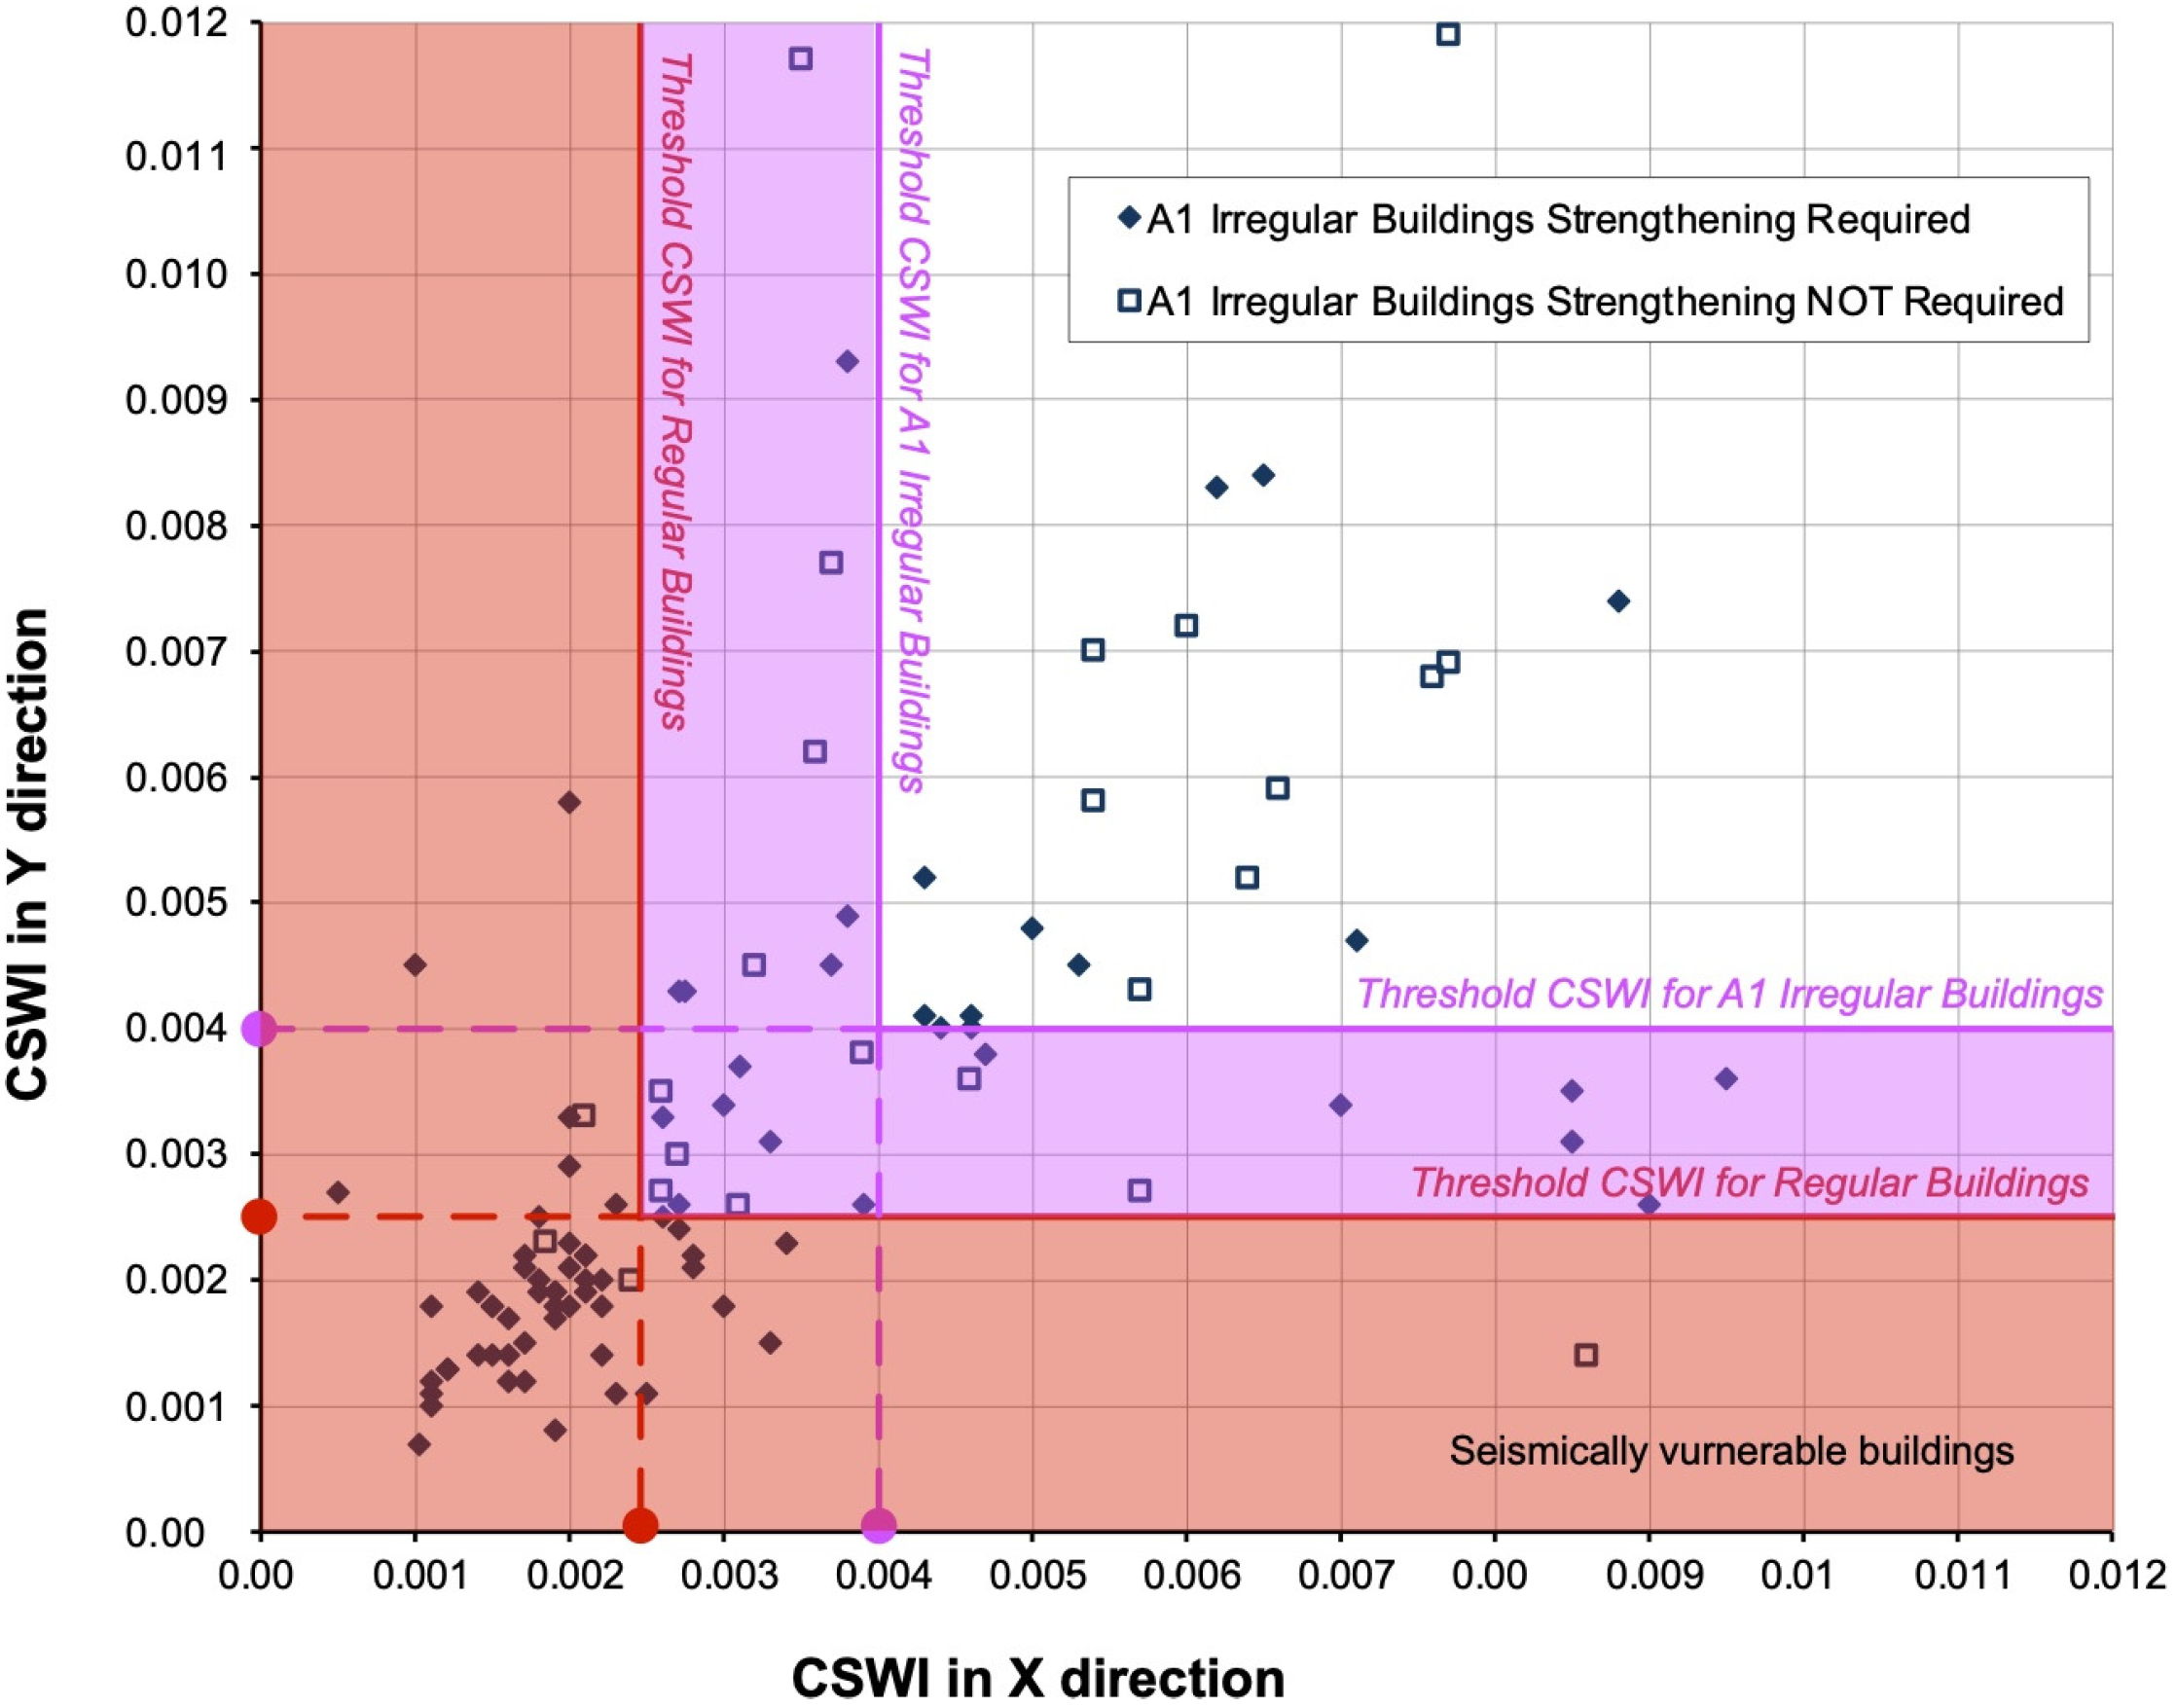
In the dataset of 160 buildings, 124 exhibited torsional irregularities. Of these, the CSWI values of 119 buildings in both the x and y directions were calculated and plotted in Figure 16, while the CSWI of five unreinforced masonry buildings were not included. Among the 124 buildings with torsional irregularities, seismic structural analysis showed that 89 required strengthening, while the remaining 30 did not.
A CSWI threshold of 0.0025, as presented in the previous section and illustrated in the figure, is proposed as a proxy indicator of seismic vulnerability for rapid assessment, requiring only limited structural data. Buildings with CSWI values below this threshold are considered seismically vulnerable.
Applying the 0.0025 threshold to the dataset, of the 89 buildings requiring strengthening, 56 fall below the threshold and are correctly identified as seismically vulnerable, while 33 are above the threshold and thus represent false positives—i.e., buildings assessed as not seismically vulnerable despite requiring strengthening. For the 30 buildings that did not require strengthening, 4 are below the threshold and thus represent false negatives, while 26 are above the threshold and correctly identified as not vulnerable.
For buildings with torsional irregularities, applying the 0.0025 CSWI threshold results in a 37% false-positive rate, with many buildings requiring strengthening assessed as not seismically vulnerable. To address this discrepancy and provide a more conservative approach, a higher CSWI threshold of 0.004 is proposed. This adjustment captures a greater number of vulnerable buildings requiring strengthening and reduces the likelihood of false-positive assessments.
Reinterpreting the results using the CSWI threshold of 0.004, of the 89 building that require strengthening: 78 are below the threshold and thus are deemed as seismically vulnerable while now 11 are above the threshold and are assessed as false positives. Thus, the false positives are significantly reduced by increasing the CSWI threshold making this approach more reliable. For the 30 buildings that did not require strengthening: 15 are below the threshold and 15 are above the threshold. While the number of false negative buildings increase, this method is meant to provide a sufficiently accurate means to rapidly canvas a large number of buildings to identify seismic vulnerability across large urban areas.
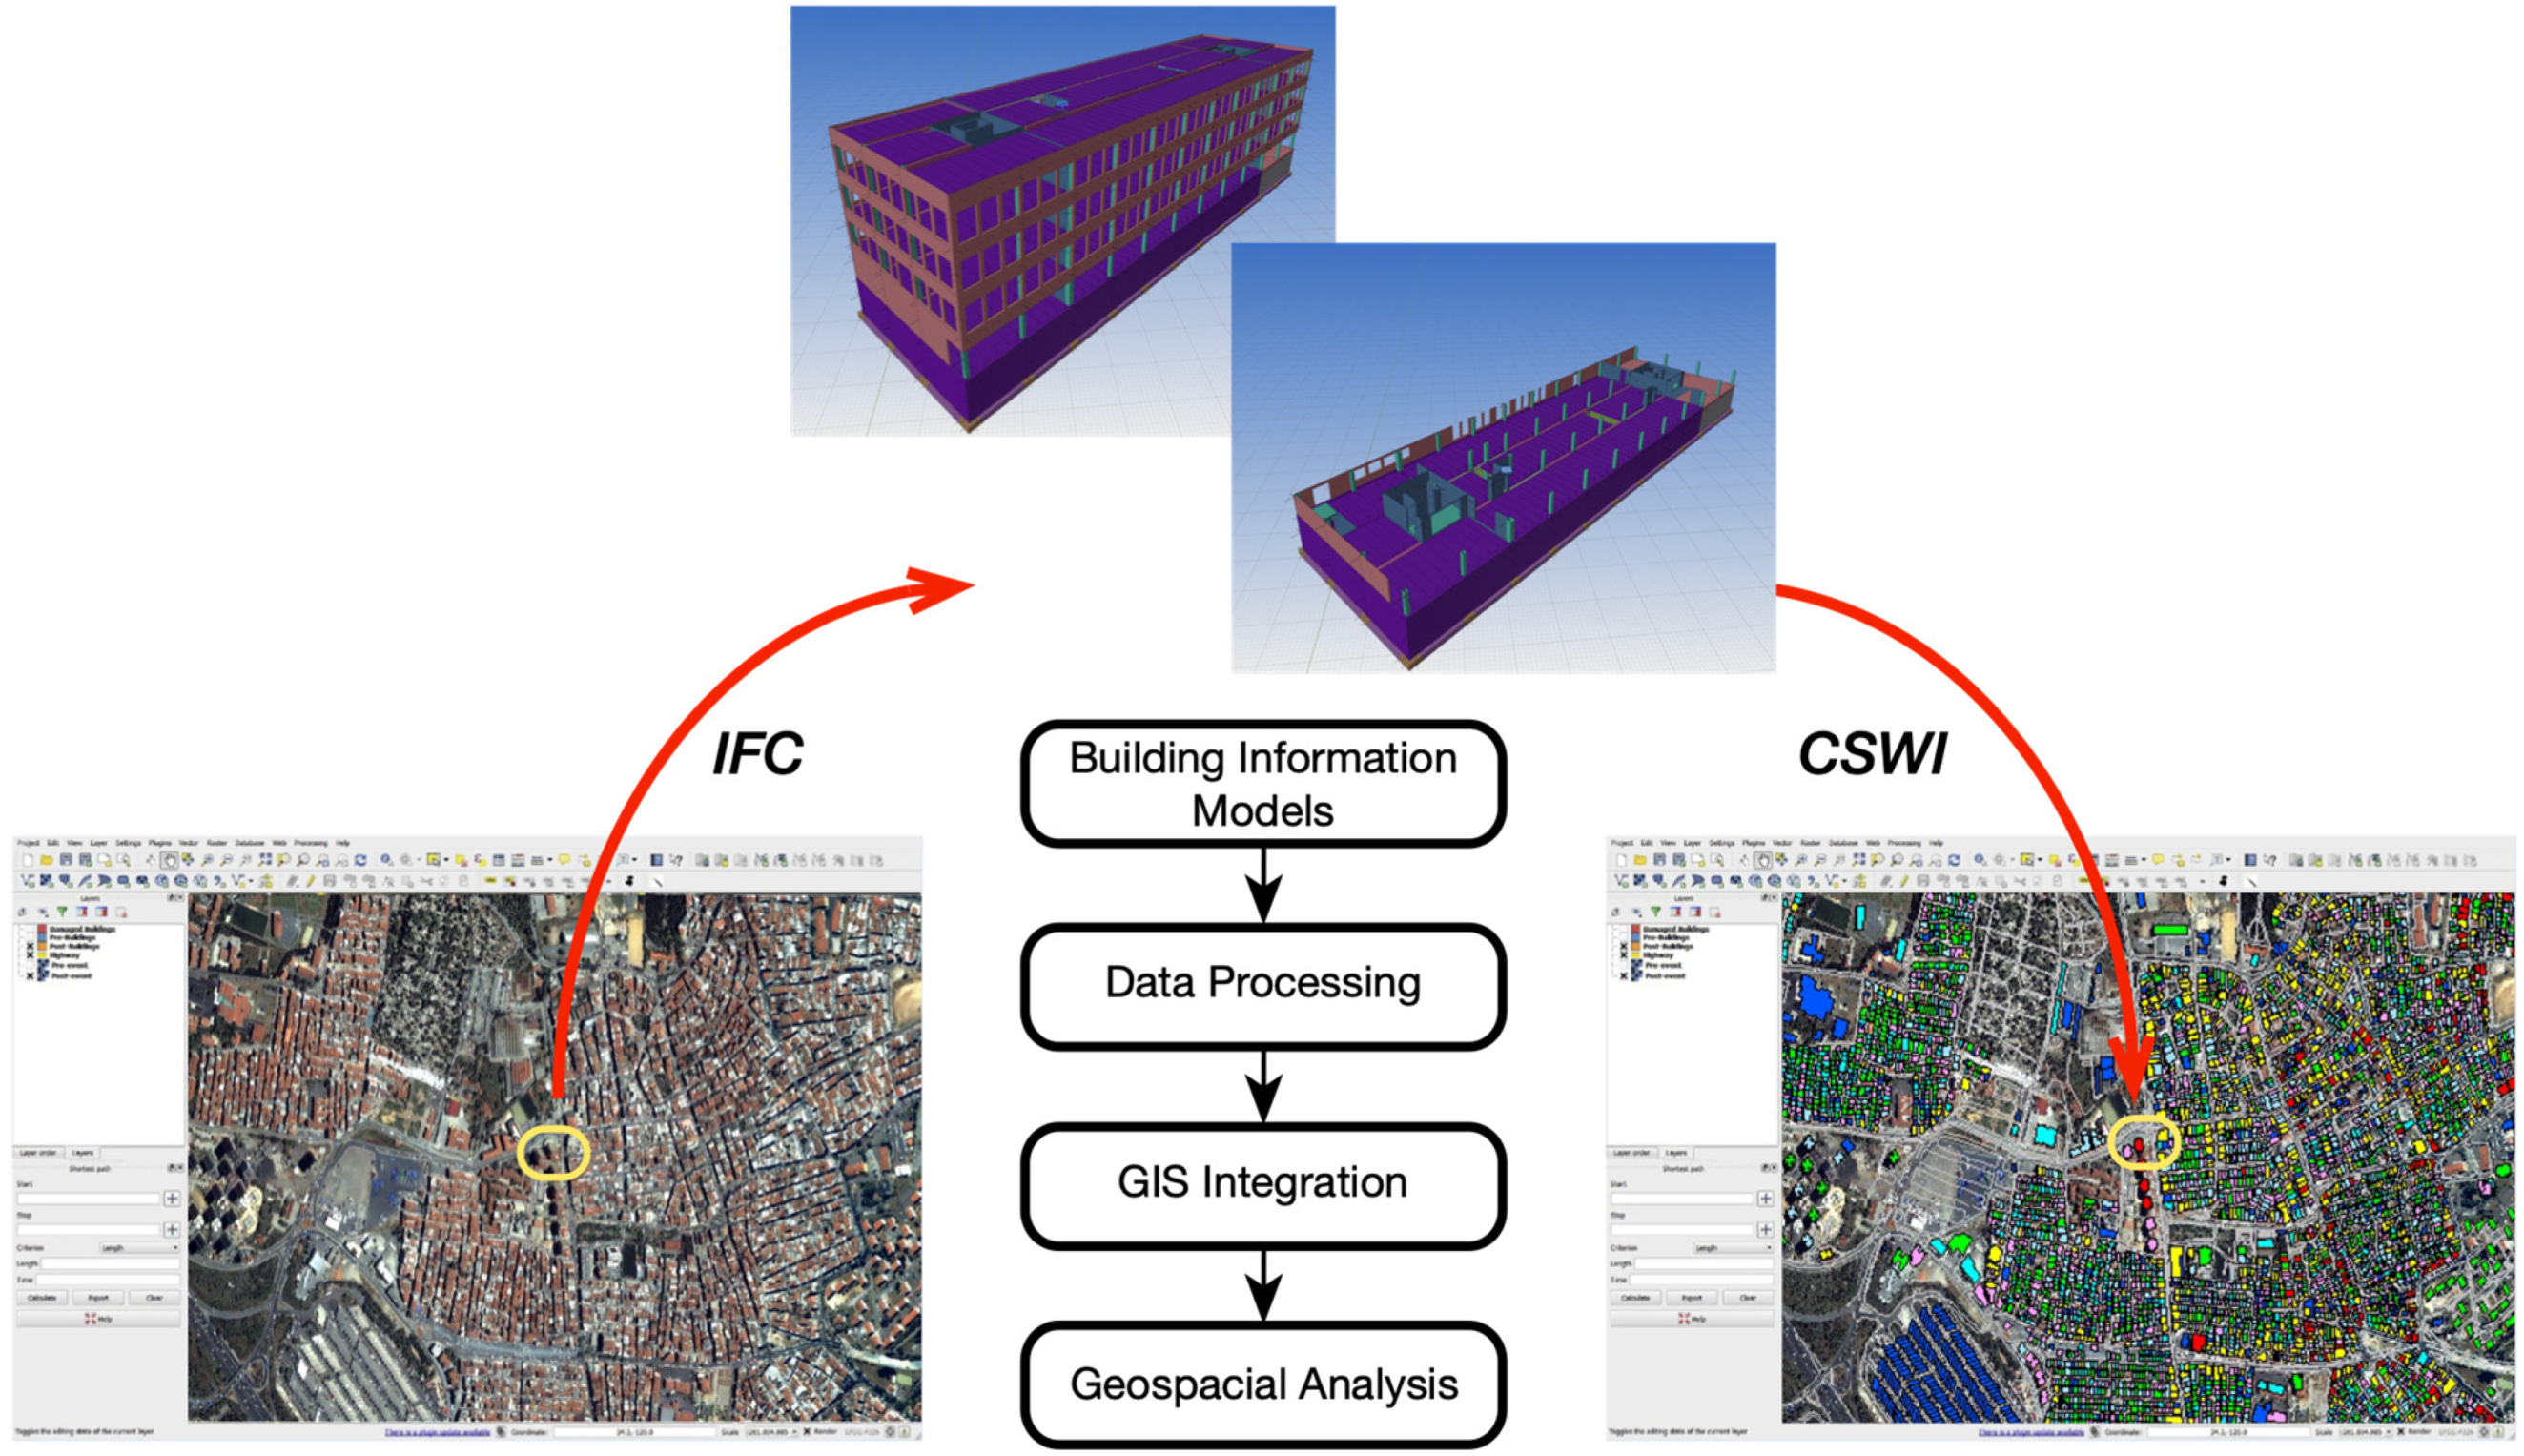
An overview of the system architecture for an interactive database framework is shown in Figure 17, where integrated building satellite images are combined with IFC-based BIM data to calculate and store Critical Seismic Wall Index (CSWI) values for the urban-wide building stock within a GIS application. The interactive interface enables the seamless integration of BIM-derived structural attributes with geospatial data, allowing CSWI values to be computed at the building level and aggregated for city-scale seismic risk assessment. As illustrated, arrows depict the workflow, transitioning from the extraction of individual building data within the BIM model to the large-scale visualization of CSWI distributions across the urban fabric. This integration supports a dynamic, city-wide prioritization process, where localized building information is transformed into actionable seismic risk indicators within the GIS environment.
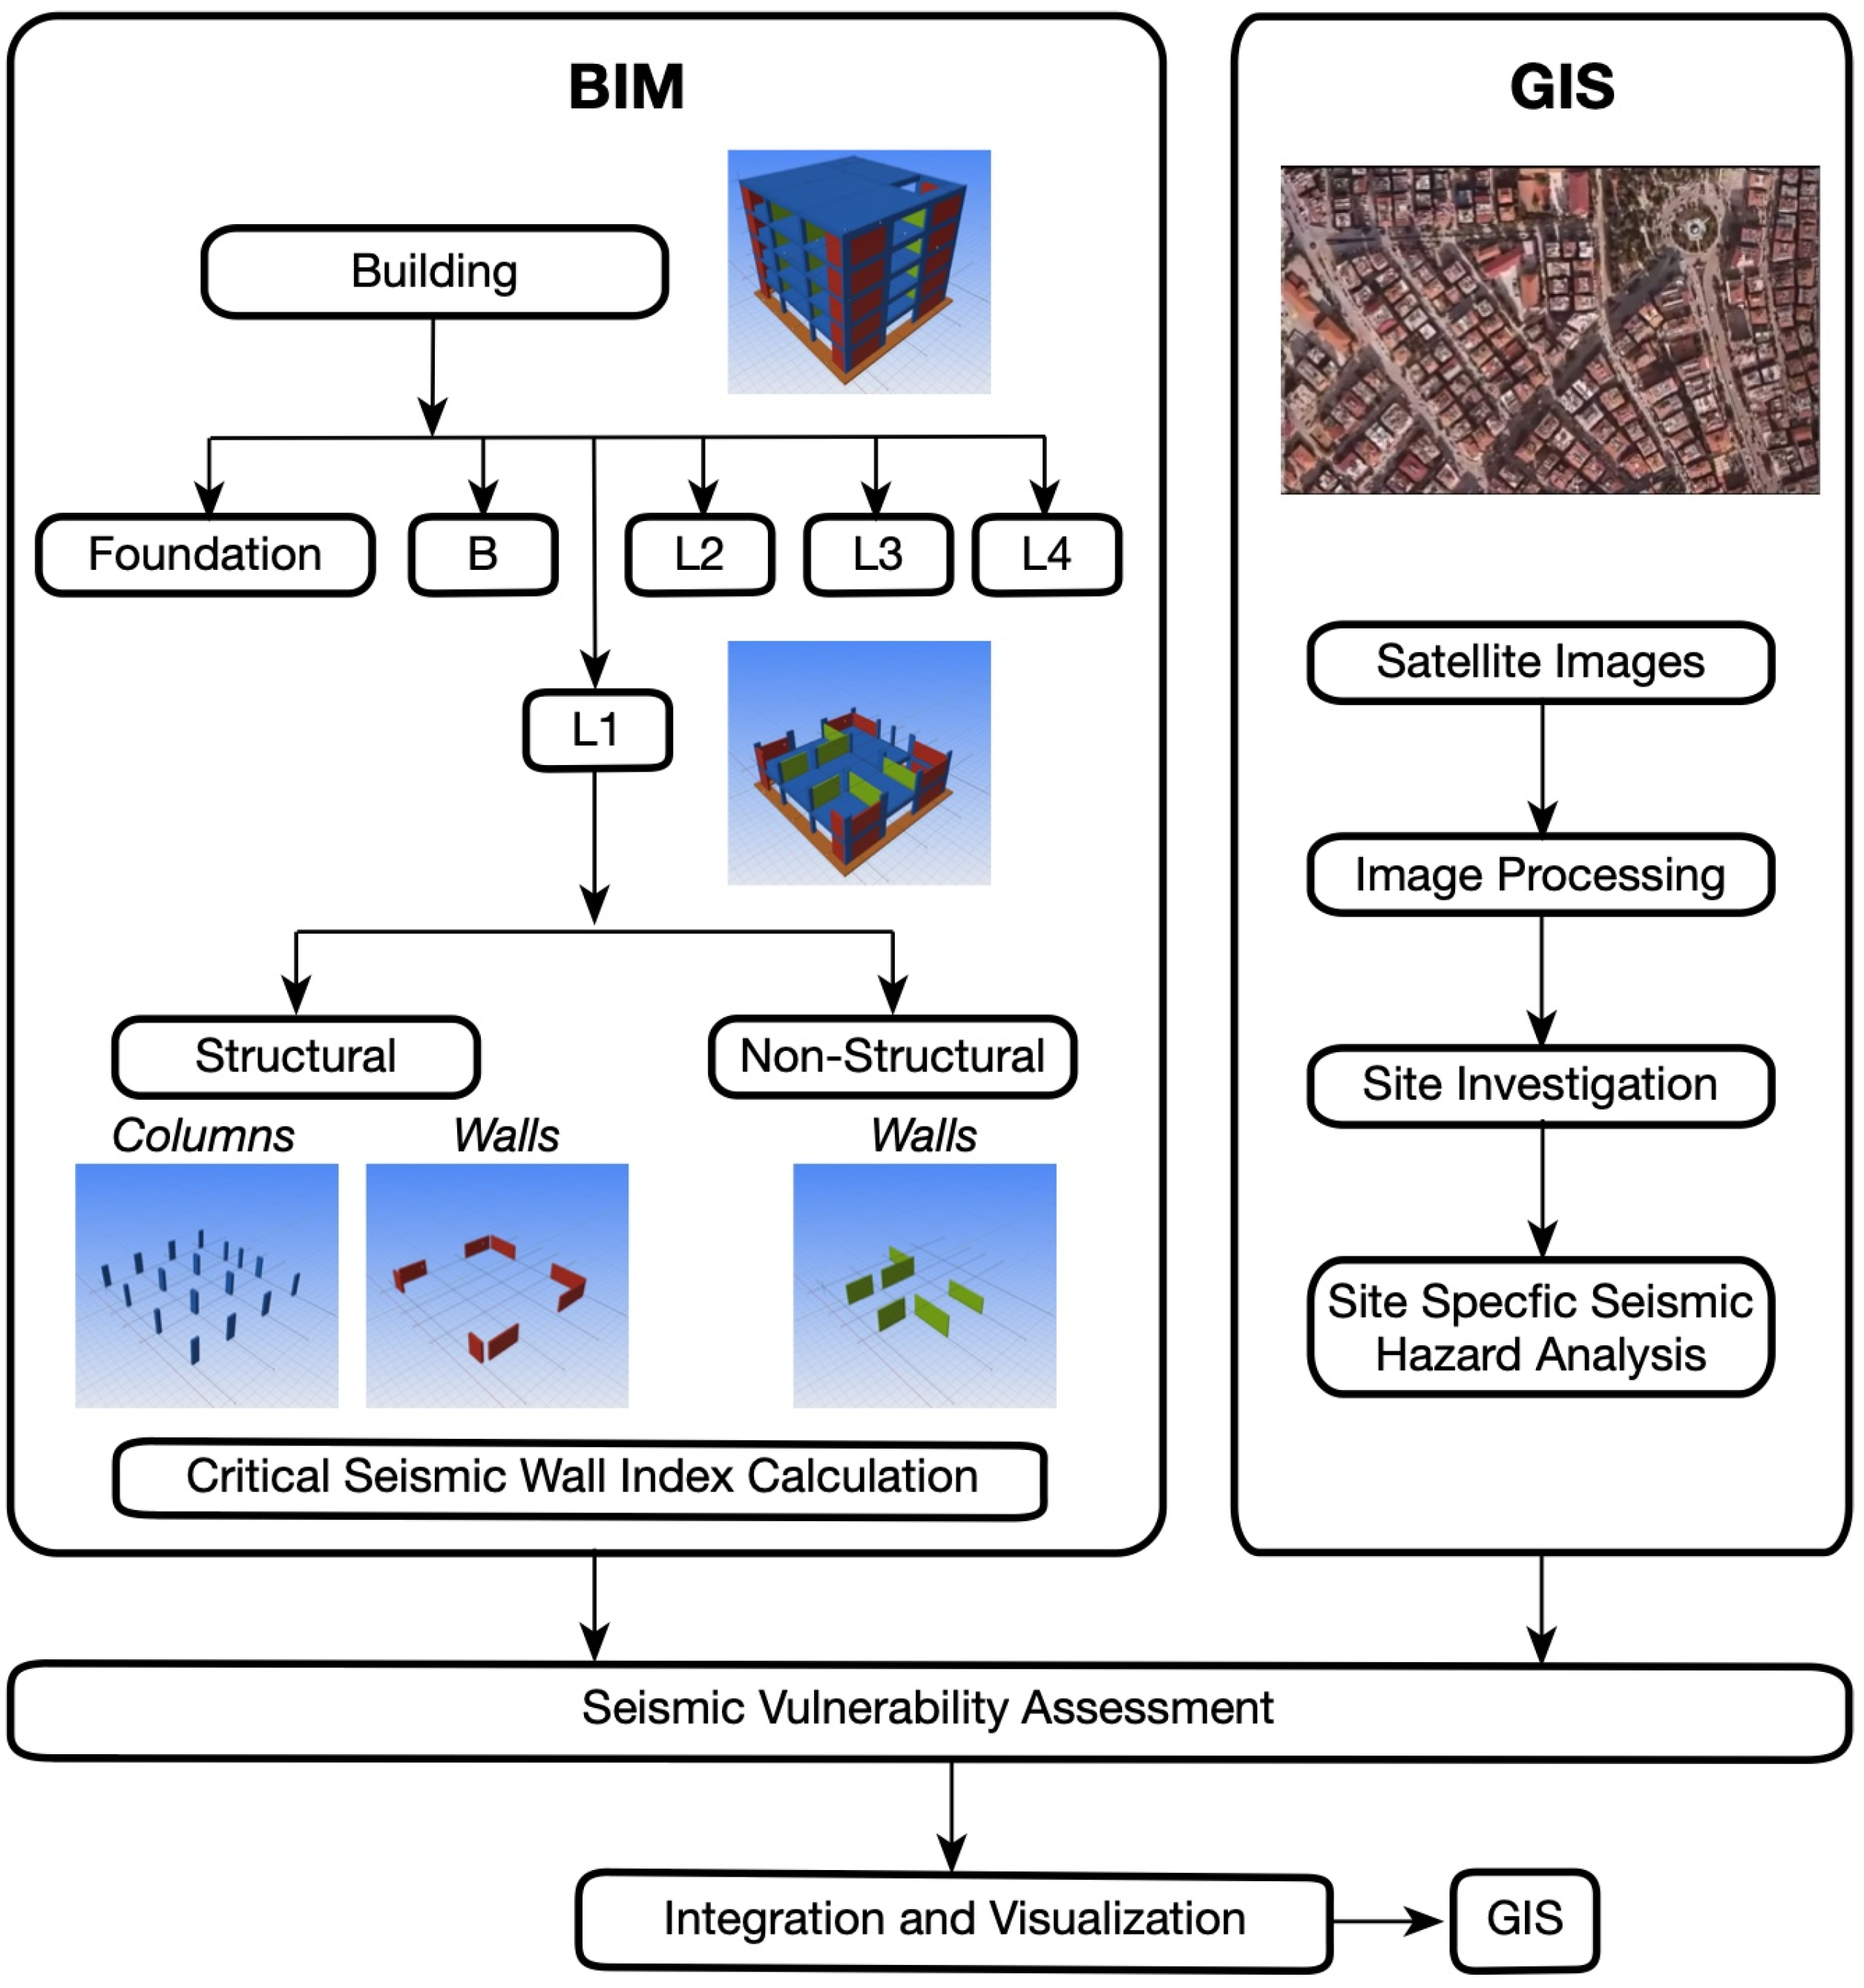
Figure 18 presents the schematic workflow of a vulnerability assessment using BIM–GIS data integration for urban-wide seismic vulnerability evaluation based on the CSWI of buildings derived from BIMs. The BIMs provide the necessary building element data to calculate the CSWI, including the cross-sectional areas of load-bearing structural columns and walls, as well as non-structural wall section areas at the critical first story above the subgrade basement. This information is combined within the GIS platform with satellite imagery from before and after seismic events to perform seismic vulnerability assessments across large urban areas. The database is stored and updated as needed to reflect new seismic events and related developments.
Furthermore, the use of artificial intelligence can be utilized as an important tool for rapid damage assessment, further enhanced with data integration from BIM and image data in GIS [51]. Enhancements can also be made with text and voice communication as well as seismometer data. In the proposed framework, the system can be integrated with other sensors/devices, drones, robots, social communication photos, and an artificial intelligence system with deep learning and expert systems for assessment to increase its usefulness for disaster management and rapid response.

5. Information System for Risk Assessment and Damage Detection

5.1. Building Information Models for Calculating and Compiling Seismic Risk Information

BIM provides a robust foundation for seismic risk assessment by delivering accurate, object-based representations of buildings. It enables engineers and designers to analyze structural components in detail, which is essential for quantifying risk indicators—such as the CSWI—derived from structural information obtained Via BIM. In this context, BIMs can be archived and used long-term to retrieve data on critical load-bearing elements. Specifically, calculating the CSWI of a building serves as a proxy indicator for seismic resistance, making it particularly valuable for the rapid, large-scale assessment of buildings across extensive urban areas.
The Industry Foundation Classes (IFC) data schema is an open, standardized data model developed by buildingSMART International to represent building and construction information in a digital, software-independent format. It enables interoperability between different BIM tools and platforms by providing a common schema for the exchange of geometry, materials, spatial relationships and semantic properties of building elements. IFC is officially recognized as an international standard under ISO 16739-1 [52], which defines the schema and methodology. This makes the IFC format an ideal data exchange and archive standard for BIM processes throughout the lifecycle of buildings—from planning and construction to operation and maintenance.
The extraction of relevant standard entities, IfcWall, IfcWallStandardCase, and IfcColumn, makes IFC an ideal and sustainable means of handling comprehensive building data in the BIM context. These entities encode essential structural information needed for the rapid calculation of building seismic risk indicators such as the CSWI, as previously described. Filtering can be performed using the IfcBuildingStorey and LoadBearing attributes to select elements from the appropriate floors and to distinguish structural from non-load-bearing components. Section areas for these filtered elements can then be obtained by extracting the CrossSectionArea or NetArea quantity take-off attributes. This process can be automated through preprocessing with IfcOpenShell scripts, ensuring that only elements contributing to a building’s seismic resistance are included, without the need for manual interpretation.
By leveraging the geometric and semantic richness of IFC data—including dimensions, positions, orientations, and material specifications—it is possible to perform consistent and repeatable calculations of seismic capacity indicators across diverse building typologies. The use of BIM eliminates much of the ambiguity and manual effort associated with traditional 2D plans or visual inspections.
Integrating seismic vulnerability data from BIM into a GIS platform enables building-level analysis at an urban scale, leveraging the advantages of big data. When IFC-based models are georeferenced and linked to spatial databases, key indicators such as story-level stiffness ratios and structural irregularities can be compiled across an entire city. This automation supports rapid risk mapping, emergency preparedness, and the prioritization of remediation efforts. Furthermore, BIM–GIS integration facilitates the fusion of heterogeneous datasets, for example, overlaying satellite imagery or socio-economic information, providing a comprehensive and scalable framework for seismic risk management in densely built environments.

5.2. Multisource Images and Image Processing

The integration of images from satellites, drones, webcams and monitoring systems or other TOGAF-type devices for architectural or structural information offers significant potential to improve structural information and damage assessment before and after an earthquake. Multi-angle and time-stamped imagery—from drone overflights, building-mounted cameras or public webcams—can provide a reliable assessment of structural damage in near real-time. It is estimated that there are over 100,000 publicly available webcams worldwide, which, in combination with satellite imagery, represent a largely untapped resource for environmental and structural monitoring.
To process this diverse visual data, an Advanced Data Fusion System has been proposed [48]. It enables the fusion of terrestrial and non-satellite image data (e.g., smartphone, CCTV, UAV images) in a GIS framework. This system uses algorithms that classify image pixels and match them with GIS-referenced building coordinates, enabling spatially accurate overlays with structural data. Image fusion techniques enable the effective combination of high-resolution satellite and aerial image data. This enables consistent, detailed views of affected areas for damage verification. Ultimately, this approach supports a more responsive, accurate and integrated damage analysis workflow— by bringing together real-time structural performance data, spatial coordinates and visual evidence in a unified GIS platform.

5.3. Post-Earthquake Comparison of Satellite Images for Damage Assessment

As soon as satellite images and possibly other aerial images are available after an earthquake, they can be compared with reference images taken before the disaster. This way, damaged buildings in a large urban area can be identified and documented. The concept behind this idea is quite simple. In a satellite image of a given area after a catastrophic event, the intensity of the image pixels must be relatively different if the building stock has changed. The pixel-by-pixel difference between the two images enables a quick assessment of the overall damage in the disaster area. Damage detection is further enhanced by image processing techniques that analyze distortions and darkness in the post-disaster images. The integration of multi-angle imagery and video fusion technologies significantly improves accuracy and compensates for the limitations of vertical satellite images.

6. Conclusions

This study presents a BIM–GIS framework, enhanced with satellite imagery, for rapid seismic vulnerability assessment and urban disaster management. The approach integrates detailed structural information from BIMs with geospatial analysis in a GIS platform, enabling large-scale assessment of building stock and identification of vulnerable structures across urban areas. The methodology supports informed planning for retrofitting, risk prioritization, and the reduction in unnecessary demolitions.
The framework was assessed based on data from various pilot studies which covered approximately 16,000 reinforced concrete and masonry buildings. Seismic vulnerability was assessed using the Critical Seismic Wall Index (CSWI), developed from performance analyses of 252 buildings and calibrated against site-specific seismic hazards. A CSWI threshold of 0.0025 was used for general buildings, while a higher threshold of 0.004 was proposed for buildings with torsional irregularities, improving the identification of structurally vulnerable buildings.
The methodology allows rapid calculation of seismic risk indicators from BIMs, combining story-level structural data with GIS and satellite imagery to perform urban-scale assessments. This enables early identification of buildings requiring strengthening, supports emergency preparedness, and provides a scalable tool for prioritizing retrofit or demolition programs. The approach was validated through analysis of a large number and variety of buildings, demonstrating its practical applicability and adoptability on a local basis.
The devastating Kahramanmaraş earthquakes on 6 February 2023, highlight the importance of such integrated systems which balances effort and level of information with value in outcomes that is sustainable for large scale rapid assessments. Implementation of the proposed framework could facilitate rapid pre-event resilience assessments, post-event damage evaluation, and city-scale risk management, ultimately enhancing urban seismic resilience. The study provides a model for other earthquake-prone cities, emphasizing the critical role of integrating structural and geospatial data for sustainable disaster risk reduction.

Author Contributions

Conceptualization, A.Ç. and C.B.; methodology, C.B.; software, A.Ç.; validation, A.Ç.; formal analysis, A.Ç.; investigation, A.Ç. and C.B.; resources, C.B.; data curation, A.Ç.; writing – original draft preparation, A.Ç.; writing – review & editing, C.B.; visualization, A.Ç.; supervision, C.B.; Project administration, C.B.; Funding acquisition, C.B. All authors have read and agreed to the published version of the manuscript.

Funding

The APC was partially funded by Istanbul Nişantaşı University and the authors.

Data Availability Statement

“252_Damaged_and_Non_Damaged_Buildings_Wall Indices” data available on request from the authors.

Acknowledgments

The authors acknowledge the Leonardo da Vinci grant LdV Transfer Innovation Project: VET in Rapid Earthquake Damage Assessment of Buildings to Avoid the Demolishing (2011-1-TR1-LEO05-27938).

Conflicts of Interest

The authors declares that there are no conflicts of interest between the authors regarding the publication of this paper.

References

  1. Cetin, K.O.; Ilgac, M.; Can, G.; Cakır, E. Preliminary Reconnaissance Report on 6 February 2023, Kahramanmaraş—Pazarcık (Mw=7.7) and Elbistan (Mw=7.6) Earthquakes; Report No. METU/EERC 2023-01; Earthquake Engineering Research Center, Middle East Technical University: Ankara, Turkey, 2023. [Google Scholar]
  2. Dymiotis, C.; Kappos, A.J.; Chryssanthopoulos, M.C. Seismic reliability of R/C frames with uncertain drift and member capacity. J. Str. Engng. ASCE 1999, 125, 1038–1047. [Google Scholar] [CrossRef]
  3. Crowley, H.; Colombi, M.; Silva, V.; Monteiro, R.; Ozcebe, S.; Fardis, M.; Tsionis, G.; Askouni, P. SYNER-G: Systemic Seismic Vulnerability and Risk Analysis for Buildings, Lifeline Networks and Infrastructures Safety Gain; Springer: Berlin/Heidelberg, Germany, 2011. [Google Scholar]
  4. Anagnos, T.; Rojahn, C.; Kiremidjian, A.S. NCEER-ATC Joint Study on Fragility of Buildings; Technical Report NCEER 95-0003; State University of NY at Buffalo: New York, NY, USA, 1995. [Google Scholar]
  5. ATC. Earthquake Damage Evaluation Data for California (ATC-13); Applied Technology Council: Redwood City, CA, USA, 1985. [Google Scholar]
  6. Kappos, A.J.; Panagopoulos, G.; Panagiotopoulos, C.; Penelis, G. A hybrid method for the vulnerability assessment of R/C and URM buildings. Bull. Earthq. Eng. 2006, 4, 391–413. [Google Scholar] [CrossRef]
  7. FEMA 154. Rapid Visual Screening of Buildings for Potential Seismic Hazards: A Handbook; FEMA: Washington, DC, USA, 2015. [Google Scholar]
  8. FEMA 356. Prestandard and Commentary for the Seismic Rehabilitation of Buildings; FEMA: Washington, DC, USA, 2000. [Google Scholar]
  9. New Zealand Society for Earthquake Engineering (NZSEE). Assessment and Improvement of the Structural Performance of Buildings in Earthquakes; Recommendations of a NZSEE Study Group on Earthquake Risk Buildings; NZSEE: Wellington, New Zealand, 2006. [Google Scholar]
  10. Hassan, A.F.; Sozen, M.A. Seismic vulnerability assessment of low-rise buildings in regions with infrequent earthquakes. ACI Struct. J. 1997, 94, 31–39. [Google Scholar] [CrossRef] [PubMed]
  11. Gulkan, P.; Sozen, M.A. Procedure for determining seismic vulnerability of building structures. ACI Struct. J. 1999, 96, 336–342. [Google Scholar] [CrossRef] [PubMed]
  12. Adeli, H. Neural networks in civil engineering: 1989–2001. Comput. Aid Civ. Infrastruct. Eng. 2001, 16, 126–142. [Google Scholar] [CrossRef]
  13. Shahin, M.A.; Jaksa, M.B.; Maier, H.R. State of the art of artificial neural networks in geotechnical engineering. Electr. J. Geotech. Eng. EJGE. 2008, 8, 1–26. [Google Scholar]
  14. Jegadesh, S.J.S.; Jayalekshmi, S. A review on artificial neural network concepts in structural engineering applications. Int. J. Appl. Civ. Env. Eng. 2015, 1, 6–11. [Google Scholar]
  15. Sun, H.; Burton, H.V.; Huang, H. Machine learning applications for building structural design and performance assessment: State—Of—The—Art review. J. Build. Eng. 2021, 33, 101816. [Google Scholar] [CrossRef]
  16. Harirchian, E.; Hosseini, S.E.A.; Jadhav, K.; Kumari, V.; Rasulzade, S.; Işık, E.; Wasif, M.; Lahmer, T. A review on application of soft computing techniques for the rapid visual safety evaluation and damage classification of existing buildings. J. Build. Eng. 2021, 43, 102536. [Google Scholar] [CrossRef]
  17. De-Miguel-Rodríguez, J.; Morales-Esteban, A.; Requena-García-Cruz, M.V.; Zapico-Blanco, B.; Segovia-Verjel, M.L.; Romero-Sánchez, E.; Carvalho-Estêvão, J.M. Fast seismic assessment of built urban areas with the accuracy of mechanical methods using a feedforward neural network. Sustainability 2022, 14, 5274. [Google Scholar] [CrossRef]
  18. Xu, Y.; Lu, X.; Cetiner, B.; Taciroglu, E. Real-time regional seismic damage assessment framework based on long short-term memory neural network. Comput. Aided Civ. Infrastruct. Eng. 2020, 36, 504–521. [Google Scholar] [CrossRef]
  19. Ruggieri, S.; Cardellicchio, A.; Leggieri, V.; Uva, G. Machine-learning based vulnerability analysis of existing buildings. Autom. Constr. 2021, 132, 103936. [Google Scholar] [CrossRef]
  20. Papatheodorou, K.; Theodoulidis, N.; Klimis, N.; Zulfikar, C.; Vintila, D.; Cardanet, V.; Kirtas, E.; Toma-Danila, D.; Margaris, B.N.; Fahjan, Y.; et al. Rapid Earthquake Damage Assessment and Education to Improve Earthquake Response Efficiency and Community Resilience. Sustainability 2023, 15, 16603. [Google Scholar] [CrossRef]
  21. HAZUS. FEMA, Federal Emergency Management Agency. Available online: https://www.fema.gov/flood-maps/products-tools/hazus (accessed on 4 September 2025).
  22. Balkaya, C. (Ed.) VET in Rapid Earthquake Damage Assessment of Buildings to Avoid the Demolishing, Leonardo da Vinci Grant LdV Transfer Innovation Project; Project No: 2011-1-TR1-LEO05-27938; 2013; pp. 1–410. Available online: https://www.academia.edu/143700215/VET_in_rapid_earthquake_damage_assessment_of_buildings_to_avoid_the_demolishing (accessed on 4 September 2025).
  23. Sahin, G.; Gokalp, K.; Kackar, M.K.; Yilmaz, M.T.; Jalehforouzan, A.; Temiz, F.A.; Gundogan, A.; Akgun, H.; Erberik, M.A. Development of a GIS-Based Predicted-VS30 Map of Türkiye using Geological and Topographical Parameters: Case Study for the Region Affected by the 6 February 2023 Kahramanmaraş Earthquakes. Seismol. Res. Lett. 2024, 95, 2044–2057. [Google Scholar] [CrossRef]
  24. Ozcebe, G.; Sucuoglu, H.; Yucemen, M.S.; Yakut, A.; Kubin, J. Seismic risk assessment of existing building stock in Istanbul a pilot application in Zeytinburnu district. In Proceedings of the 8th U.S. National Conference on Earthquake Engineering, San Francisco, CA, USA, 18–22 April 2006. [Google Scholar]
  25. Zhang, W.; Chen, P.Y.; Crempien, J.; Kurtulus, A.; Arduino, P.; Taciroglu, E. Regional-scale seismic fragility, loss, and resilience assessment using physics-based simulated ground motions: An application to Istanbul. Earthq. Eng. Struct. Dyn. 2023, 52, 1785–1804. [Google Scholar] [CrossRef]
  26. Cheng, Q.; Liao, W.; Fei, Y.; Tian, T.; Lu, X.; Zhang, W.; Ghahari, F.; Kurtulus, A.; Taciroglu, E. A cost-benefit analysis of sensor quality and spatial density for rapid regional post-event seismic damage assessment: Application to Istanbul. Soil Dyn. Earthq. Eng. 2022, 163, 107496. [Google Scholar] [CrossRef]
  27. Cinar, O.F.; Aldemir, A.; Zervent, A.; Yucel, O.B.; Erberik, M.A.; Anil, O.; Sahraman, M.; Kockar, M.K.; Gundogan, A. Fundamental period estimation of RC buildings by considering structural and non-structural damage distributions through neural network. Neural Comput. Appl. 2024, 36, 1329–1350. [Google Scholar] [CrossRef]
  28. Konukcu, B.E.; Karaman, H.; Sahin, M. Building damage analysis for the updated building dataset of Istanbul. Nat. Hazards. 2016, 84, 1981–2007. [Google Scholar] [CrossRef]
  29. Elnashai, A.S.; Hampton, S.; Lee, J.S.; McLaren, T.; Myers, J.D.; Navarro, C.; Spencer, B.; Tolbert, N. Overview and applications of Maeviz-Hazturk. J. Earthq. Eng. 2008, 12, 100–108. [Google Scholar] [CrossRef]
  30. Elnashai, A.S.; Hampton, S.; Lee, J.S.; McLaren, T.; Myers, J.D.; Navarro, C.; Spencer, B.; Tolbert, N. Architectural Overview of MAEviz-HAZTURK. J. Earthq. Eng. 2008, 12, 92. [Google Scholar] [CrossRef]
  31. Ferreira, T.M.; Mendes, N.; Silva, R. Reducing the Seismic Vulnerability of Existing Buildings: Assessment and Retrofit; MDPI: Basel, Switzerland, 2019; ISBN 978-3-03921-257-6. ISBN 978-3-03921-258-3. [Google Scholar] [CrossRef]
  32. Domaneschi, M.; Zamani Noori, A.; Pietropinto, M.V.; Cimellaro, G.P. Seismic vulnerability assessment of existing school buildings. Comput. Struct. 2021, 248, 106522. [Google Scholar] [CrossRef]
  33. Ferretti, F.; Mazzotti, C.; Savoia, M. Seismic vulnerability assessment of masonry and RC building stocks: A simplified methodology. Buildings 2024, 14, 2890. [Google Scholar] [CrossRef]
  34. Leggieri, V.; Mastrodonato, G.; Uva, G. GIS multisource data for the seismic vulnerability assessment of buildings at the urban scale. Buildings 2022, 12, 523. [Google Scholar] [CrossRef]
  35. Mota da Sá, F.; Lopes, M.S.; Oliveira, C.S.; Ferreira, M.A. A Rapid Assessment Method for Evaluating the Seismic Risk of Individual Buildings in Lisbon. Sustainability 2025, 17, 6027. [Google Scholar] [CrossRef]
  36. Wang, X.; Love, P.E.; Kim, M.J.; Park, C.-S.; Sing, C.-P.; Hou, L. A conceptual framework for integrating building information modeling with augmented reality. Autom. Constr. 2013, 34, 37–44. [Google Scholar] [CrossRef]
  37. Liu, X.; Wang, X.; Wright, G.; Cheng, J.C.P.; Li, X.; Liu, R. A state-of-the-art review on the integration of building information modeling (BIM) and geographic information system (GIS). ISPRS Int. J. Geo Inf. 2017, 6, 53. [Google Scholar] [CrossRef]
  38. Garber, R. BIM Design: Realising the Creative Potential of Building Information Modelling; Wiley: New York, NY, USA, 2012; ISBN 978-1-118-71979-4. [Google Scholar]
  39. Alirezaei, M.; Noori, M.; Tatari, O.; Mackie, K.R.; Elgamal, A. BIM-based damage estimation of buildings under earthquake loading condition. Procedia Eng. 2016, 145, 1051–1058. [Google Scholar] [CrossRef][Green Version]
  40. Christodoulou, S.; Vamvatsikos, D.; Georgiou, C. A BIM-based framework for forecasting and visualizing seismic damage, cost and time to repair. In Proceedings of the European Conference on Product and Process Modelling, Cork, Ireland, 14–16 September 2011. [Google Scholar]
  41. Georgiou, C.; Vamvatsikos, D. Damage Assessment, Cost Estimating, and Scheduling for Post-Earthquake Building Rehabilitation Using BIM. In Proceedings of the 31st International Conference of CIB W78, Orlando, FL, USA, 23–25 June 2014; pp. 398–405. [Google Scholar]
  42. Wang, J.; Ma, Y.; Rui, L.; Zhang, S. Applications of Building Information Modeling (BIM) and BIM-Related Technologies for Sustainable Risk and Disaster Management in Buildings: A Meta-Analysis (2014–2024). Buildings 2025, 15, 2298. [Google Scholar] [CrossRef]
  43. Ministry of Public Works and Settlement, Specification for Structures to Be Built in Disaster Areas (Afet Bölgelerinde Yapılacak Yapılar Hakkında Yönetmelik). Official Gazette of the Republic of Turkey, Issue No. 23098 (Amendment), 2 July 1998. Available online: https://www.tdmd.org.tr/Eklenti/21,52-tdy1998ingpdf.pdf?0 (accessed on 8 September 2025). (In Turkish).
  44. Republic of Turkey, Ministry of Environment, Urbanisation and Climate Change, Regulation Amending the Zoning Regulation for Planned Areas (Planlı Alanlar İmar Yönetmeliğinde Değişiklik Yapılmasına Dair Yönetmelik), Official Gazette of the Re-public of Turkey, Issue No. 32838, 11 March 2025. Available online: https://csb.gov.tr/planli-alanlar-imar-yonetmeliginde-degisiklik-bakanlik-faaliyetleri-41777 (accessed on 8 September 2025). (In Turkish)
  45. Sesetyan, K.; Hancilar, U.; Safak, E.; Cakti, E.; Kara, S.; Uzunkol, O.; Konukcu, B.E.; Gunay, S.; Mehmetoglu, H.; Mentese, E.Y.; et al. Booklet of Estimated Earthquake Losses for Zeytinburnu District, Istanbul Province (Istanbul İli Zeytinburnu İlcesi Olası Deprem Kayip Tahminleri Kitapcigi), June 2020, Istanbul, Turkey. Available online: https://depremzemin.ibb.istanbul/uploads/prefix-zeytinburnu-666ad70384c4c.pdf (accessed on 4 September 2025). (In Turkish).
  46. Erdik, M.; Durukal, E. Earthquake risk and its mitigation in Istanbul. Nat. Hazards 2008, 44, 181–197. [Google Scholar] [CrossRef]
  47. Karaman, H.; Sahin, M.; Elnashai, A.S.; Pineda, O. Loss Assessment Study for the Zeytinburnu District of Istanbul using Maeviz-Istanbul. J. Earthq. Eng. 2008, 12, 187–198. [Google Scholar] [CrossRef]
  48. Balkaya, C.; Casciati, F.; Casciati, S.; Faravelli, L.; Vece, M. Real-time identification of disaster areas by an open access vision-based tool. Adv. Eng. Softw. 2015, 88, 83–90. [Google Scholar] [CrossRef]
  49. Balkaya, C. Information Systems for Rapid Seismic Evaluation and Strengthening Alternatives of Existing Building Structures. In Proceedings of the Fifth International Congress on Advances in Civil Engineering, Istanbul, Turkey, 25–27 September 2002; pp. 175–184. [Google Scholar]
  50. Gur, T.; Sucuoglu, H. Seismic Rehabilitation of 108 R/C Buildings in Ceyhan After the 27 June 1998 Adana-Ceyhan Earthquake. In METU/EERC 2000-01 Report; Middle East Technical University, Earthquake Research Center: Ankara, Turkey, 2000. [Google Scholar]
  51. Hansapinyo, C.; Latcharote, P.; Limkatanyu, S. Seismic Building Damage Prediction From GIS-Based Building Data Using Artificial Intelligence System. Front. Built Environ. 2020, 6, 576919. [Google Scholar] [CrossRef]
  52. ISO Standard 16739-1; Industry Foundation Classes (IFC) for Data Sharing in the Construction and Facility Management Industries—Part 1: Data Schema. ISO: Geneva, Switzerland, 2018.
Figure 1. General view of the old building stock in a typical Istanbul neighborhood.
Buildings 15 03292 g001
Figure 2. (a) Large area affected by the Kahramanmaraş earthquakes of 6 February 2023, as plotted by the USGS, showing the both the Pazarcık and Elbistan earthquake epicenters with their respective moment magnitudes, together with ground shaking intensity represented on the MMI scale; and (b) satellite images taken before and after the earthquakes, illustrating their impact on a neighborhood in Hatay.
Buildings 15 03292 g002
Figure 3. Satellite image capturing for remote sensing large urban areas impacted by earthquake.
Buildings 15 03292 g003
Figure 4. System architecture for proposed framework by means of building information models integrated into GIS.
Buildings 15 03292 g004
Figure 6. Building information found (a) via GIS through the user interphase, (b) selected from within a large neighborhood in Istanbul, (c) accessing structural drawings and BIMs.
Buildings 15 03292 g006
Figure 7. Satellite image of Zeytinburnu, Istanbul.
Buildings 15 03292 g007
Figure 8. Distribution of RC (left) and masonry (right) buildings in Zeytinburnu, Istanbul [22].
Buildings 15 03292 g008
Figure 9. Prioritization of seismic risk of RC buildings in the district of Zeytinburnu for a seismic event with a 10% probability in 50 years [22].
Buildings 15 03292 g009
Figure 10. Prioritization of seismic risk of masonry buildings in the district of Zeytinburnu for a seismic event with a 10% probability in 50 years [22].
Buildings 15 03292 g010
Figure 11. Estimated loss of life (left) and critically wounded (right) per kilometer square area in Zeytinburnu district for a Mw = 7.5 earthquake scenario [45].
Buildings 15 03292 g011
Figure 12. Governing Critical Seismic Wall Index (CSWI) in either x or y direction of the investigated 92 retrofitted buildings relative to the determined threshold critical seismic wall index of 0.0025.
Buildings 15 03292 g012
Figure 13. Critical seismic wall index (CSWI) for both axes’ direction of the investigated buildings after structural retrofitting, relative to the determined threshold critical seismic wall index of 0.0025.
Buildings 15 03292 g013
Figure 14. Building T13, +6.00 formwork plan CAD drawing and structural BIM model.
Buildings 15 03292 g014
Figure 15. Types of irregularities found in the investigated buildings.
Buildings 15 03292 g015
Figure 16. Critical seismic wall Index (CSWI) used as a reference rapid seismic performance determination for undamaged buildings.
Buildings 15 03292 g016
Figure 17. Interactive database interface integrating IFC-based BIM data with GIS to calculate and visualize the Critical Seismic Wall Index (CSWI) for city-scale seismic risk assessment. Arrows depict the workflow, transitioning from individual building data in the BIM model to urban-scale CSWI extraction and visualization.
Buildings 15 03292 g017
Figure 18. Schematic of BIM-GIS integration for urban-wide seismic vulnerability assessment utilizing critical seismic wall index of buildings via BIMs.
Buildings 15 03292 g018
Table 1. Sample data of the 160 undamaged buildings in Marmara region and Western Turkey.
General InformationType of IrregularityFoundationMaterialStructural SystemRetrofitting
Building ReferenceCityEarthquake RegionConstruction YearNumber of FloorsA1A2A3A4B1B2B3Foundation SystemSoil TypeConcrete GradeConcrete Modulus (Gpa)Reinforcement GradeStructural SystemCritical Seismic Wall Index X DirectionCritical Seismic Wall Index Y DirectionRequired?
1: True
0: False
A1İstanbul1196931000010UnknownZ3BS1627St1RC-Frame0.001500.001401
A4İstanbul2197540000010Strip FootingZ3BS1627St1RC Frame+Shearwall0.015300.000301
A5İstanbul1197041000000IndividualZ3BS1627St1RC-Frame0.002100.001901
A14Kocaeli1197941001000IndividualZ2BS1627St1RC-Frame0.001900.001701
A15İstanbul1199530000000UnknownZ3BS22.527.5St3RC Frame+Shearwall0.003400.003300
A16İstanbul1199331000000Strip FootingZ2BS1827St3RC Frame+Shearwall0.002700.002401
ANT01Antalya1200031000110Strip FootingZ4BS2028.5St1RC-Frame0.002700.003000
B1Bursa1194531000010UnknownZ3BS1627St1Mixed0.000000.000001
B2Bursa1197441001010UnknownZ3BS1627St1RC-Frame0.003900.003800
B27Yalova1196941010010Mat FoundationZ3BS1627St1RC-Frame0.002100.002001
B28Bursa1198551100000Mat FoundationZ3BS1627St1RC Frame+Shearwall0.006600.021400
B29Balikesir1193820000000IndividualZ3BS1627St1RC-Frame0.002800.002701
E1Eskişehir2197251000000Mat FoundationZ4BS1627St1RC-Frame0.001700.001201
E5Bolu1199161000000UnknownZ3BS1627St1RC Frame+Shearwall0.003300.003101
E6Düzce1196531010000Mat FoundationZ3BS1627St1RC-Frame0.002100.002201
E8Bolu1197511100100UnknownZ3BS1627St1RC-Frame0.004700.007501
E9Kütahya2196031000010IndividualZ3BS1426.15St1RC-Frame0.002600.003500
E13Kütahya1198841000000Strip FootingZ4BS1627St1RC Frame+Shearwall0.000800.013101
E17Uşak2197441000101IndividualZ3BS1426.15St1RC-Frame0.002600.003301
E18Bilecik1198751001010UnknownZ1BS2028.5St1RC-Frame0.002600.002501
E22Bilecik1197831000010UnknownZ2BS2028.5St1RC-Frame0.002800.002101
E23Bolu1199551001000Strip FootingZ3BS1627St1RC-Frame0.008500.003101
E24Karabük1198251000010UnknownZ4BS1627St1RC-Frame0.001700.002201
I1İzmir1196471000010UnknownZ4BS1627St1RC-Frame0.001100.001101
I11İzmir1199641000000UnknownZ3BS1426.15St1RC-Frame0.004300.004101
I12İzmir1198331100000Strip FootingZ3BS1426.15St1RC-Frame0.003100.003701
I33Aydın1199051001000Strip FootingZ3BS1627St1RC-Frame0.008500.003101
I34Aydın1199371000000IndividualZ3BS1627St1RC-Frame0.001800.001901
I35Muğla1199151000000UnknownZ3BS1627St3RC Frame+Shearwall0.009000.002601
I36Muğla1197131000000UnknownZ3BS1627St1RC-Frame0.00340.00231
I41Muğla1199821000000UnknownZ3BS1627St1RC Frame+Shearwall0.013700.008800
T1İstanbul2197171001010UnknownZ3BS1627St1RC Frame+Shearwall0.001900.000801
T3İstanbul2195861100001Strip FootingZ2BS1426.15St1Mixed0.001600.001201
T4İstanbul2195651000000UnknownZ3BS1627St1RC-Frame0.001100.001001
T11İstanbul2197771000010Strip FootingZ3BS1426.15St1RC-Frame0.002200.001401
T13İstanbul2196751000010Strip FootingZ4BS1627St1RC-Frame0.001800.002001
T14İstanbul2195371000101Strip FootingZ2BS1627St1RC-Frame0.001840.002300
T15İstanbul2197291000000UnknownZ3BS1627St1RC-Frame0.000500.002701
T18İstanbul2196541110000UnknownZ3BS1627St1RC-Frame0.001400.001901
T19İstanbul2197231010010UnknownZ3BS1627St1RC-Frame0.00310.00260
T23İstanbul2191051000001Wall FootingZ3BS1627St1Masonry0.000000.000001
T24İstanbul2198821000000Mat FoundationZ3BS2028.5St1+St3RC-Frame0.003700.007700
T25İstanbul2199620000010IndividualZ3BS2028.5St3RC-Frame0.005400.004200
T26İstanbul1198661011000Mat FoundationZ3BS1627St1RC Frame+Shearwall0.002700.004301
T27İstanbul2198761000000Mat FoundationZ2BS1627St3RC Frame+Shearwall0.004700.003801
T28İstanbul2198641000000Mat FoundationZ3BS1626.5St3RC Frame+Shearwall0.002000.002901
T29İstanbul2195241010010UnknownZ3BS1627St1RC-Frame0.001900.001901
T32İstanbul2199091000000Mat FoundationZ3BS1627St1RC Frame+Shearwall0.001700.001501
T36İstanbul1199820000000UnknownZ3BS1627St1RC-Frame0.004200.008400
T38İstanbul2197371000010IndividualZ2BS1426.15St1RC-Frame0.001200.001301
T40İstanbul2198520101000Mat FoundationZ3BS1627St1RC Frame+Shearwall0.003100.069700
T41İstanbul2196510000000UnknownZ2BS1626.5St1RC-Frame0.005100.006500
T42İstanbul2197030000010UnknownZ3BS1627St1RC-Frame0.002200.001901
T43İstanbul2199361110100Strip FootingZ3BS1827.75St3RC-Frame0.001000.004501
Disclaimer/Publisher’s Note: The statements, opinions and data contained in all publications are solely those of the individual author(s) and contributor(s) and not of MDPI and/or the editor(s). MDPI and/or the editor(s) disclaim responsibility for any injury to people or property resulting from any ideas, methods, instructions or products referred to in the content.