Article

Experimental Study on Local Bearing Capacity of Concrete Reinforced with Spiral Stirrups

1
School of Civil Engineering, Jilin Jianzhu University, Xincheng Street, Nanguan District, Changchun 130118, China
2
Jilin Province Craftsmanship Architectural Design Consulting Co., Ltd., Room 103, No. 3, Mingde Road, Chaoyang District, Changchun 130000, China
*
Author to whom correspondence should be addressed.
Buildings 2025, 15(18), 3290; https://doi.org/10.3390/buildings15183290
Submission received: 5 August 2025 / Revised: 1 September 2025 / Accepted: 9 September 2025 / Published: 11 September 2025
(This article belongs to the Section Building Structures)

Abstract

To investigate the local compressive bearing capacity of concrete reinforced with spiral stirrups, a study was conducted on 40 specimens, focusing on the analysis of failure modes and strain variations. The study investigated the effects of concrete strength grade fcg, stirrup diameter d, volumetric ratio of the spiral stirrups ρv, and ratio of core area to load area Acor/Al on the local bearing capacity Fl. The experimental results indicated that the local bearing capacity Fl increased as the ratio of core area to load area Acor/Al decreased, with an observed increase of 23.0%. Furthermore, the local bearing capacity Fl increased with a reduction in stirrup spacing s, showing a 65.4% increase compared to the initial value. An increase in stirrup diameter d also would contribute to a higher Fl, with an improvement of 24.7%. Additionally, the local bearing capacity Fl exhibited a directly proportional relationship with the concrete strength grade fcg. Based on the theoretical analyses, the local bearing capacity of calculation equation Nu′ was established with the reinforcement term ρvfyAl and the concrete term fcAl. The experimental data on concrete reinforced with spiral stirrups were collected to verify the accuracy of calculation equation. The results show that there was a high calculation accuracy for the mechanical model and could provide a reference for local bearing capacity calculation.

1. Introduction

The local pressure is common in the field of engineering, particularly in bridge engineering. For example, the supports at both ends exert vertical pressure on the concrete piers, leading to stress concentrations in specific regions of the piers in simply supported beam bridges. Every year, many structural accidents caused by local pressure failure. To mitigate the risk of local pressure failure in construction projects, spiral stirrups are commonly employed for structural strengthening. The spiral stirrups are interconnected with the longitudinal reinforcement, thereby maintaining the core concrete under a significant restraining effect. The restraining effect is attributed to the circumferential stress generated by the spiral stirrups, which can effectively constrain the lateral deformation of the core concrete and thereby enhance its local bearing capacity. Spiral stirrups provide a superior restraining effect compared to commonly used rectangular stirrups. When compared to composite stirrups, spiral stirrups offer a similar restraining effect but are simpler and more efficient to manufacture [1,2].
Liao et al. conducted shear tests on circular concrete short columns reinforced with GFRP longitudinal bars and CFRP grid stirrups, considering variations in stirrup ratio and stirrup type [3]. The results indicated that all specimens experienced shear-compression failure, with cracks initiating from flexural cracks on the tensile side of the columns and propagating along diagonal paths across the entire cross-section. The GFRP longitudinal bars remained undamaged throughout the testing process. Furthermore, increasing the CFRP grid stirrup ratio was found to effectively delay the formation of critical diagonal cracks, thereby enhancing both the shear strength and ductility of the specimens.
Marchão et al. conducted experimental studies on prismatic specimens for posttensioning tendon anchorage zones in accordance with ETAG 013 guidelines [4], comparing the performance of ordinary reinforced concrete and high-performance fiber-reinforced concrete HPFRC [5]. They found that HPFRC could significantly reduce cross-sectional dimensions, reduce the amount of confinement reinforcement, and still meet the acceptance criteria specified in ETAG 013. This verified the feasibility of HPFRC in the lightweight design of anchorage zones.
Cai proposed that under vertical pressure, the core concrete is subjected to a triaxial compression state, which would enhance the compressive strength [6]. Cao and Liu et al. emphasized that shear-induced slip and splitting within the wedge-shaped cone formed inside the core concrete are primarily responsible for local pressure failures [7,8]. Yang et al. investigated the effect of spiral stirrups on the local bearing capacity with wedge theory and proposed corresponding calculation formulas [9,10,11]. Wei presented experimental evidence that challenges prevailing assumptions about the correlation between wedge-shaped cone formation and local bearing capacity, showing that such cone structures are more likely attributable to shearing forces induced by the loading plate [12]. Yang et al. [13,14] carried out experimental investigations on local compressed high-strength concrete and proposed the micro-column shear failure theory. The theory suggested that the formation of diagonal cracks promote the development of micro-columns, which eventually results in structural failure [13,14]. Furthermore, Cao et al. examined the influence of spiral stirrups arrangement and found that placing them in the upper half of the specimen or within a 10 cm radius near the tip of the wedge-shaped cone yielded optimal performance [15].
Zhao et al. conducted experiments on eleven spiral stirrups concrete specimens to investigate the effect of core area Acor variations on local bearing capacity [16,17]. The results indicated that when Acor is smaller than load area Al, the spiral stirrups provide limited lateral restraint to core concrete. It would substantially diminish the restraining effect of the spiral stirrups. Gai et al. investigated the influence of volumetric spiral stirrups ratio, spacing, and strength on concrete columns reinforced by spiral stirrups and found that no yielding occurred within the affected region of the stirrups during local pressure failure [18]. Xiao et al. conducted a study on the local bearing capacity of lightweight aggregate concrete and proposed a calculation formula for determining the bearing capacity of lightweight aggregate concrete reinforced by spiral stirrups [19,20,21]. Miao et al. explored the influence of bond stress on the local bearing capacity of concrete and found that an increase in both concrete strength and load area contributes to a higher bearing capacity. Furthermore, they proposed a corresponding calculation method [22,23,24]. Zhou et al. conducted bearing capacity tests on steel fiber-reinforced reactive powder concrete (SF-RPC) confined by spiral stirrups, with the objective of investigating the synergistic restraining effect between steel fibers and spiral stirrups [25]. The experimental results demonstrated that the combination of steel fibers and spiral stirrups could form a “dual confinement” mechanism, which not only further enhances the local bearing capacity but also effectively restrains crack propagation. This mechanism significantly reduced crack width at the point of local compression failure and improved the overall service performance of structural members. Based on the test data, a calculation model for local bearing capacity under the confinement of high-strength spiral stirrups was developed, which could serve as a reference for engineering design. Wang et al. proposed a method to enhance the local compression capacity of normal strength concrete (NSC) structures by incorporating ultra-high performance concrete (UHPC) cores [26]. A finite element model of local compression specimens was developed using ABAQUS, and the model’s accuracy was validated through experimental data. Subsequently, this model was employed to investigate the effects of various parameters, including NSC strength, UHPC strength, spiral reinforcement strength, and UHPC core diameter, on the local compressive behavior of the structures. The results confirmed both the effectiveness and economic viability of the proposed strengthening approach.
Li et al. proposed a methodology for evaluating the local compressive capacity of stirrup-confined concrete by employing artificial neural networks, ANNs [27]. Furthermore, they explored the feasibility of incorporating coarse aggregates into conventional ultra-high-performance concrete (UHPC), demonstrating that this modification could substantially reduce material costs without significantly compromising the mechanical properties [28,29,30,31,32]. The experimental results revealed that although the failure mechanism aligned with the principles of wedge splitting theory, there was a marked increase in brittleness and a corresponding reduction in transverse deformation capacity of the tested specimens. In addition, the study extended to reactive powder concrete, RPC, a type of high-performance concrete known for its superior mechanical characteristics. The research systematically conducted experimental investigations into the local bearing capacity of RPC confined by high-strength spiral stirrups, accompanied by rigorous validation of the test results and analytical conclusions. This study not only expands the existing database of local mechanical performance parameters of high-performance concrete under high-strength spiral stirrups, but also provides valuable experimental data for the design and evaluation optimization of RPC local bearing capacity.
Li et al. introduced generalized prediction models, particularly Factor Analysis (FA) models and artificial neural network (ANN) models [33]. By incorporating key influencing factors such as concrete strength, the load area ratio, and reserved ducts, this approach offers a more comprehensive and accurate method for predicting concrete bearing capacity. Wu et al. have contributed to the advancement of anchorage zone design in post-tensioned prestressed concrete structures by systematically evaluating existing prediction models specified in the GB 50010-2010 [34] and the PTI guide [35] and by developing a more precise calculation equation specifically tailored for special bearing plates (SBPs) [36]. Yan et al. [37] proposed the SRCFST (steel-reinforced concrete-filled steel tube) column with the aim of enhancing the local compressive performance of concrete-filled steel tubular columns. They also conducted an investigation into the local compressive behavior of the columns. Furthermore, he analyzed the stress mechanisms and stress responses of both locally compressed and axially compressed specimens at various characteristic stages. Ultimately, a simplified formula was developed to predict the local bearing capacity of SRCFST short columns [37].
Pohribnyi et al. developed an advanced computational method that utilizes variational techniques based on concrete plasticity theory to enhance the accuracy of predicting the bearing capacity of concrete under local pressure load [38]. Wei et al. conducted experimental studies on strain softening and local failure in FRP-confined concrete columns. The results showed that an increase in confinement level would lead to a corresponding increase in both the length of the local failure area and the compressive fracture energy [39,40]. Han et al. performed experiments on thirty-two short columns filled with concrete and steel, demonstrating that both the thickness of the bearing plate and the Acor/Al significantly influence column behavior [41]. An increasing in bearing plate thickness enhances both strength and ductility indices, whereas a higher Acor/Al results in a decrease in strength index. Prabhu et al. investigated the structural behavior of concrete-filled steel columns under conditions of axial and local pressure, asserting that both the Acor/Al and slenderness ratio are critical parameters affecting column bearing capacity [42]. And they proposed a simplified design model based on their experimental findings. Atefeh JahanMohammadi et al. explored cracks generation and propagation as well as the importance of reinforcement arrangement within an average constitutive model framework [43]. By developing a nonlinear finite element program, a local-average finite element modeling approach for reinforced concrete components were established. Chang et al. conducted an analysis of axial pressure test results from 198 specimens and 144 literature sources [44,45,46]. And the results showed that as the compressive strength of unconfined concrete increases, the tensile strain in unyielded stirrups decreases. Conversely, an increase in the volumetric ratio of the spiral stirrups leads to a rise in tensile strain. The formula for calculating the tensile stress of unyielded stirrups was proposed and established the minimum volumetric stirrups ratio to achieve tensile yielding.
In existing research, most experiments results focused on axial compression specimens reinforced with spiral stirrups. However, studies addressing local compression specimens with spiral stirrups remain relatively limited. The existing achievements have not established a clear calculation model for the local bearing capacity of concrete reinforced by spiral stirrups. Furthermore, the current literature lacks thorough and comprehensive exploration of the internal mechanical behavior. This study focused on the local bearing capacity of concrete specimens reinforced with spiral stirrups. Through quantitative analysis of experimental data from 40 specimens, it systematically investigated the influence for various parameters on local compression performance. The key factors analyzed include concrete strength grade fcg, stirrup diameter d, volumetric ratio of the spiral stirrups ρv, and the ratio of core area to load area Acor/Al.
During the experimental process, trends in crack development and peak loads observed during specimen failure were recorded and analyzed. Two typical failure modes were identified, elucidating the failure mechanisms of specimens under local compression at different volumetric stirrups ratio. The study re-examined the contributions of spiral stirrups and concrete to local bearing capacity and proposed an innovative calculation method for evaluating local bearing capacity. The values calculated by the equation Nu′ included the contributions of both reinforcement component and the concrete component. A set of experimental data was employed to validate the rationality and accuracy of the proposed equation. The results demonstrated that, compared with the currently prevailing estimation methods, the proposed equation achieved a higher level of accuracy. The study provides necessary theoretical insights and calculation references for the design optimization of spiral stirrup with local pressure concrete members.

2. Experimental Program

2.1. Specimen Design

A total of 40 concrete specimens were designed, and the geometric dimensions were 220 mm × 220 mm × 400 mm. The spiral stirrups used in the experiments were HRB400. Among the specimens, 30 were reinforced with 8 mm spiral stirrups, while the remaining 10 with 6 mm. The thickness of the concrete cover was uniformly maintained at 10 mm. Additionally, the longitudinal reinforcement consisted of four HRB400 reinforcement with diameters of 8 mm. And it combined with spiral stirrups to form the frame. The geometric dimensions and reinforcement arrangement of the specimens are illustrated in Figure 1.
The core concrete referred to the concrete located within the region enclosed by the inner surface of the stirrups, which was subjected to triaxial compression. The cross-sectional area of this portion of concrete was defined as the core area Acor. The influence of multiple factors, including the ratio of core area to load area Acor/Al, concrete strength grade fcg, stirrups spacing s, volumetric ratio of the spiral stirrups ρv, and stirrup diameter d were considered in experiments. Variations in the Acor/Al were achieved by employing bearing plates of different dimensions. Specifically, two types of plates were used with geometric dimensions of 80 mm × 80 mm × 30 mm and 60 mm × 60 mm × 30 mm. The bearing plate and the concrete surface have not undergone special treatment. The load area Al could be determined by the bearing plate dimensions, and the core area could be determined by the clear distance of the stirrups. Then, the value of Acor/Al of the specimen could be obtained and corresponding to Acor/Al values of 4.15, 4.34, 7.39, and 7.71, respectively. The fcg considered in the experimental program were C30, C40, and C50. Specimens with the same fcg and Acor/Al were grouped together, resulting in a total of four groups. Each group consisted of five specimens with varying s. Detailed specimen parameters are summarized in Table 1.

2.2. Arrangement of Strain Gauges

The stress in the reinforcement was measured indirectly by attaching strain gauges on the spiral stirrups. When the specimen was subjected to local pressure load, the stress distribution indicated that the affected region would comprise both a compression region and a tension region. Within the compression region, two reinforcement strain gauges were symmetrically installed on each turn of the spiral stirrup. In the tension region, four reinforcement strain gauges were symmetrically installed on each turn of the spiral stirrup. The arrangement of the strain gauges is illustrated in Figure 2.

2.3. Concrete Casting and Curing

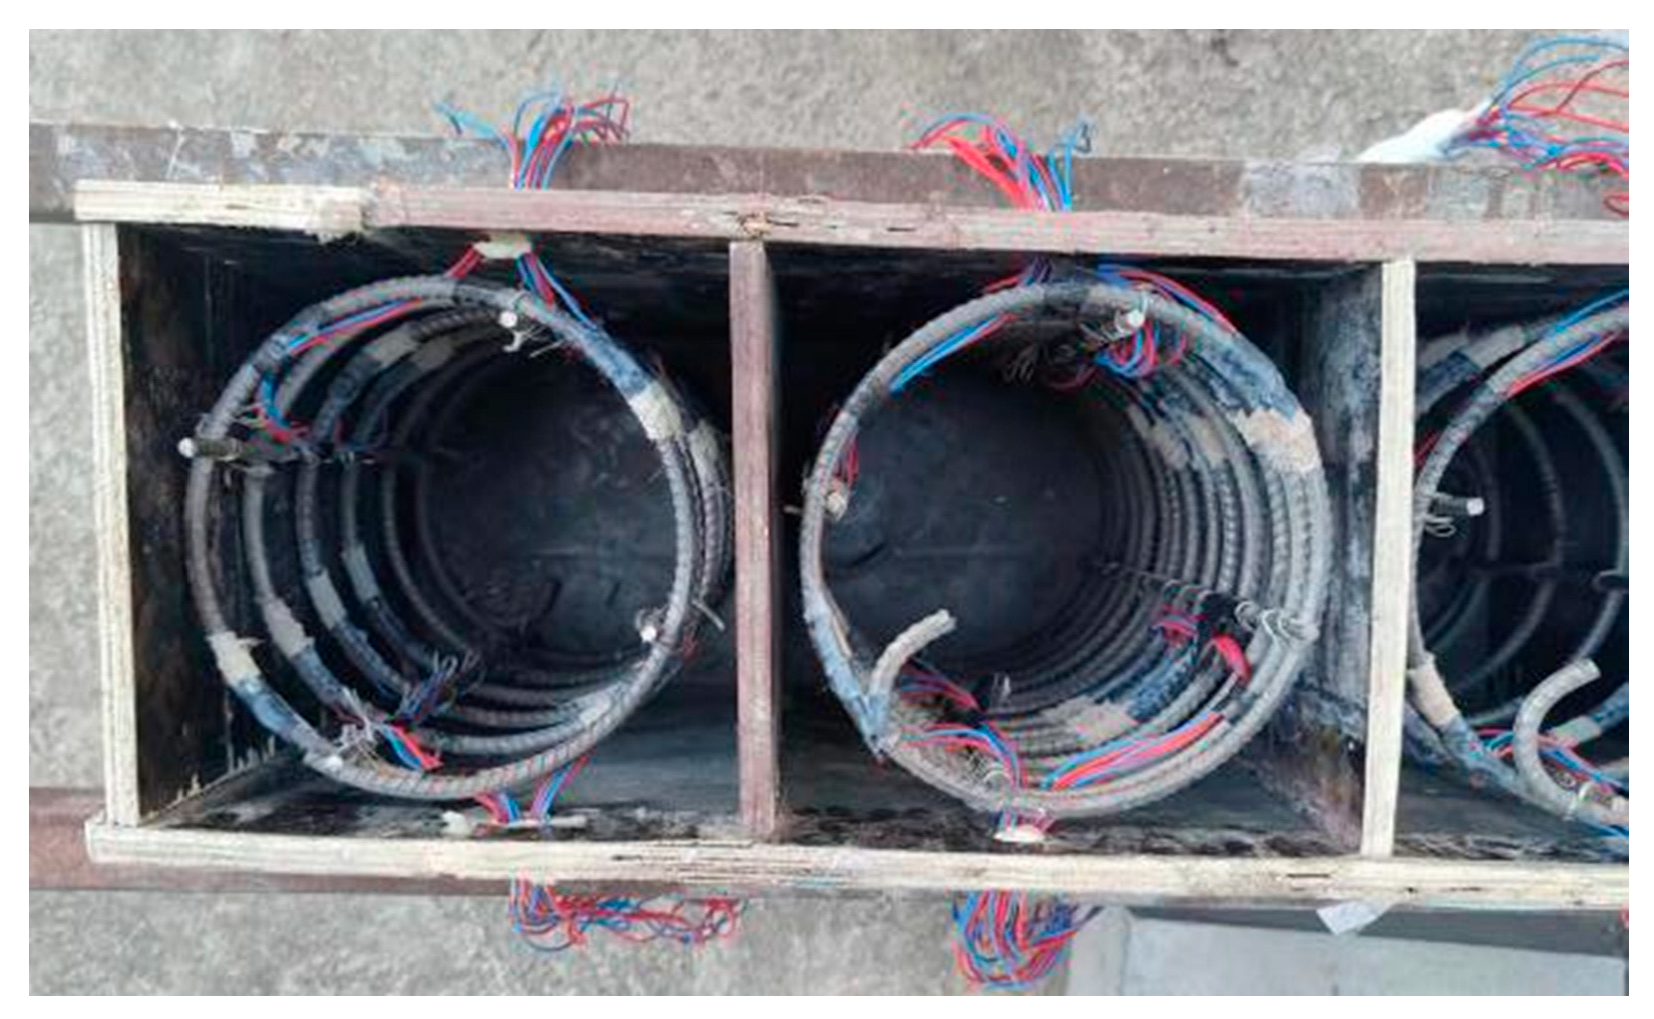
The molds for specimens were fabricated with 20 mm thick wooden formwork. A pre-prepared steel frame was inserted into the mold and firmly secured to maintain dimensional accuracy and structural stability throughout the casting process. Near the top of the mold, circular openings were reserved to accommodate the passage of wires connected to the enameled wire. After the wires were threaded through the openings, the holes were sealed with a foam filler material to prevent the leakage of concrete slurry during the casting process. The molds and the spiral stirrups are illustrated in Figure 3.
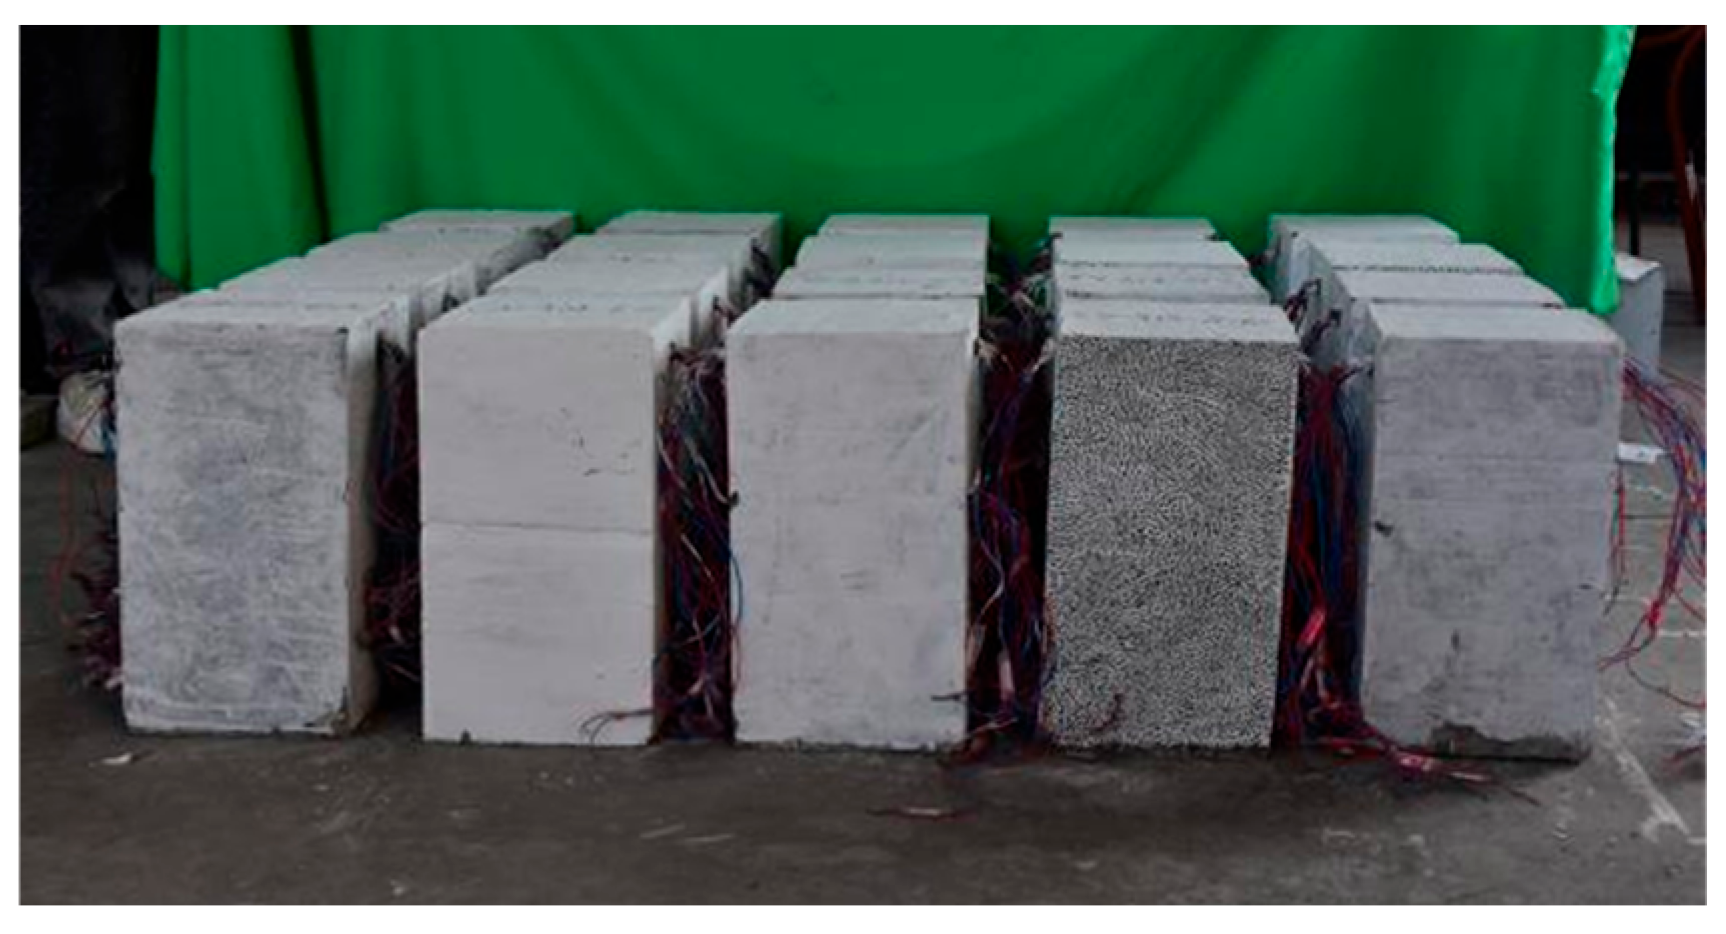
During the casting process, the horizontal forced mixer was utilized. The thoroughly mixed concrete was poured into the wooden molds and simultaneously compacted using an electric vibrator to ensure complete consolidation. The surface of the freshly poured concrete was then leveled and finished smoothly. During the pouring process, 40 standard 150 mm cubic specimens were prepared simultaneously, including 20 for C30, 10 for C40, and 10 for C50. These specimens were cured under natural environmental conditions with adequate watering to ensure that the required humidity level was maintained. The compressive strength of the concrete cubes was determined in accordance with the provisions specified in Standard for an evaluation of concrete compressive strength (GB/T 50107-2010) [47]. Three bars with diameters of 6 and 8 were selected for testing, and they met the requirements of steel for reinforcement of concrete—Part 2: Hot rolled ribbed bars (GB/T 1499.2-2024) [48]. The specimens were transferred outdoors for curing and were watered daily over a period of seven days after casting. A photograph of the specimens immediately after casting is presented in Figure 4. Figure 5 displays the specimens after demolding and prior to loading.

2.4. Material Properties

The concrete strength grades in test were C30, C40, and C50, with corresponding mix proportions detailed in Table 2. The coarse aggregate primarily consisted of crushed limestone or basalt, with a maximum particle size ranging from 10 mm to 20 mm and a water absorption rate between 0.5% and 1.5%. It was appropriate for standard concrete testing. The fine aggregate was natural river sand obtained from the Songhua River basin, characterized by particle sizes generally below 5 mm. A fineness modulus within the range of 2.6 to 3.0 and a water absorption rate between 1.0% and 2.0%.
Compression tests were performed on cubic test blocks reserved during the casting process to determine the cube compressive strength of concrete fcu,m. Based on the measured fcu,m values, other mechanical performance parameters of the concrete were derived. The mechanical properties of the concrete were summarized in Table 3.
For the spiral stirrups in the experiment, HRB400 with diameters of 6 mm and 8 mm were selected. Tensile strength tests of the reinforcement were conducted with the LA-2000 steel strand tensile testing machine. The mechanical properties of the reinforcement are presented in Table 4.

2.5. Flowchart of Specimen Fabrication

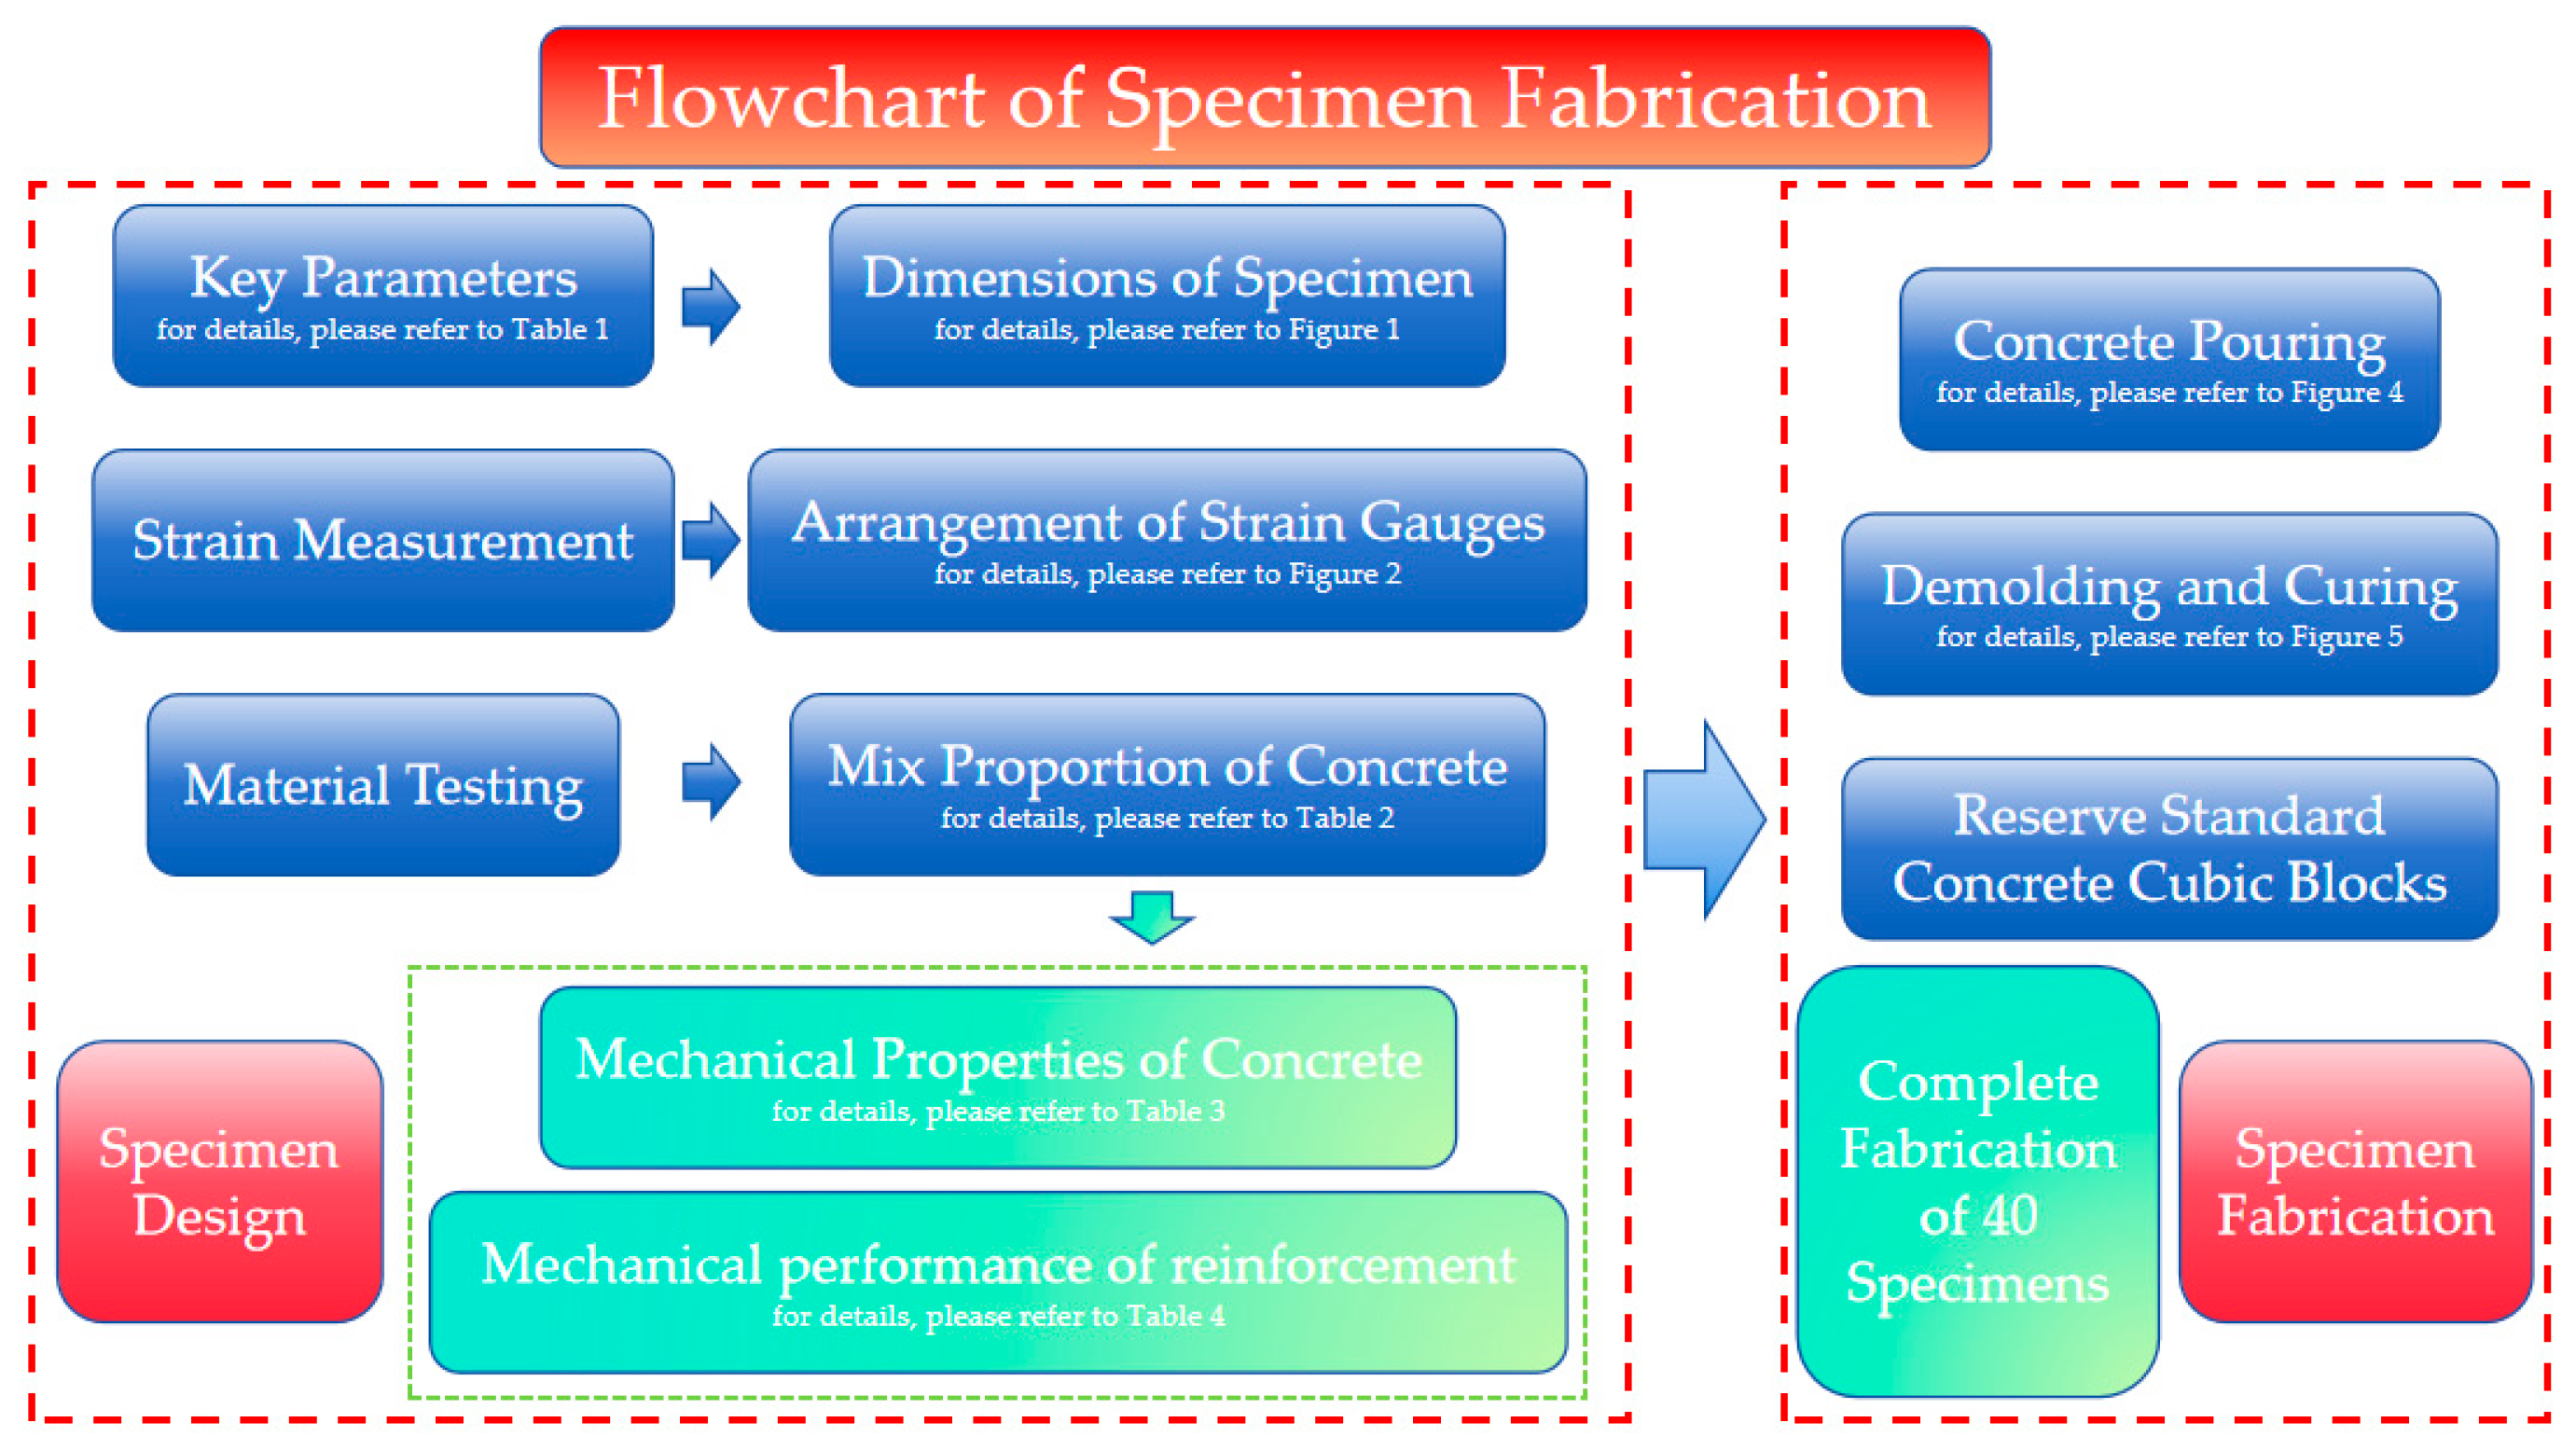
In summary, the flowchart illustrating the specimen fabrication process is presented in Figure 6.

3. Test Loading and Measurement Scheme

3.1. Test Loading Scheme

Prior to the formal loading procedure, a preloading process must be conducted to ensure the proper functioning of all instruments. The formal loading process was divided into two distinct stages. In the first stage, loading was controlled by force at a rate of 3 kN/s, and the load was applied incrementally in stages. Each loading step corresponds to 10% of the estimated peak load. After each stage, the load was held constant for one minute to record data and observe any phenomena. When the applied load reached 50% of the estimated peak load, the test proceeded to the second stage. In the second stage, loading was controlled by displacement and set at a rate of 0.003 mm/s. Once the specimen reaches its peak load, the displacement rate remains unchanged. The loading continues at this rate until the load decreased to 85% of the peak load, at which point the specimen was deemed to have failed, and the test was terminated.

3.2. Test Measurement Scheme

In 2024, Kabir et al. proposed an automated computer vision-based method for estimating the sorptivity of cementitious materials [49]. The methodology fundamentally relies on non-contact optical imaging to capture variations in surface characteristics of the materials. Through camera calibration, accurate mapping of pixel data to real-world dimensions is achieved, followed by the extraction and analysis of image features using visual algorithms and machine learning techniques to derive key physical performance parameters. This approach presented notable advantages, including low cost, automation capability, and high precision. Based on the principle of “non-contact optical measurement capturing surface changes via imaging, and extracting physical parameters through calibration and algorithmic analysis,” DIC-3D was adopted for monitoring purposes in our experimental study.
During the loading process, the surface of the specimen was closely monitored. The load at which the first crack appears was defined as the cracking load, while the peak load was defined as the maximum load sustained before a decline in the specimen’s local bearing capacity. Strain variations in the spiral stirrups were recorded using a DH3816 static strain measurement system (Donghua Testing Technology Co., Ltd., Taizhou, China). Additionally, a Digital Image Correlation (DIC) monitoring technology was utilized to capture three-dimensional coordinates, displacement data, and strain measurements on the specimen’s surface throughout the loading process. The camera brand of the DIC system was the CSI 29MP camera. The photosensitive resolution was 6576 × 4384, and the maximum full-frame rate was 3 FPS. The camera was equipped with a 28 mm prime lens and features an LED high-brightness light source. The DIC testing method measured the displacement and deformation of the sample surface with two industrial cameras. Therefore, the positional relationship between the cameras and the external and internal orientation information such as the internal focal plane of the cameras must be corrected. Correction mainly corrected the pixels of the collected image to correspond to the actual size. The speckle size was approximately 2 mm. The photo frequency was set to take one photo every 1 s during load holding stage.
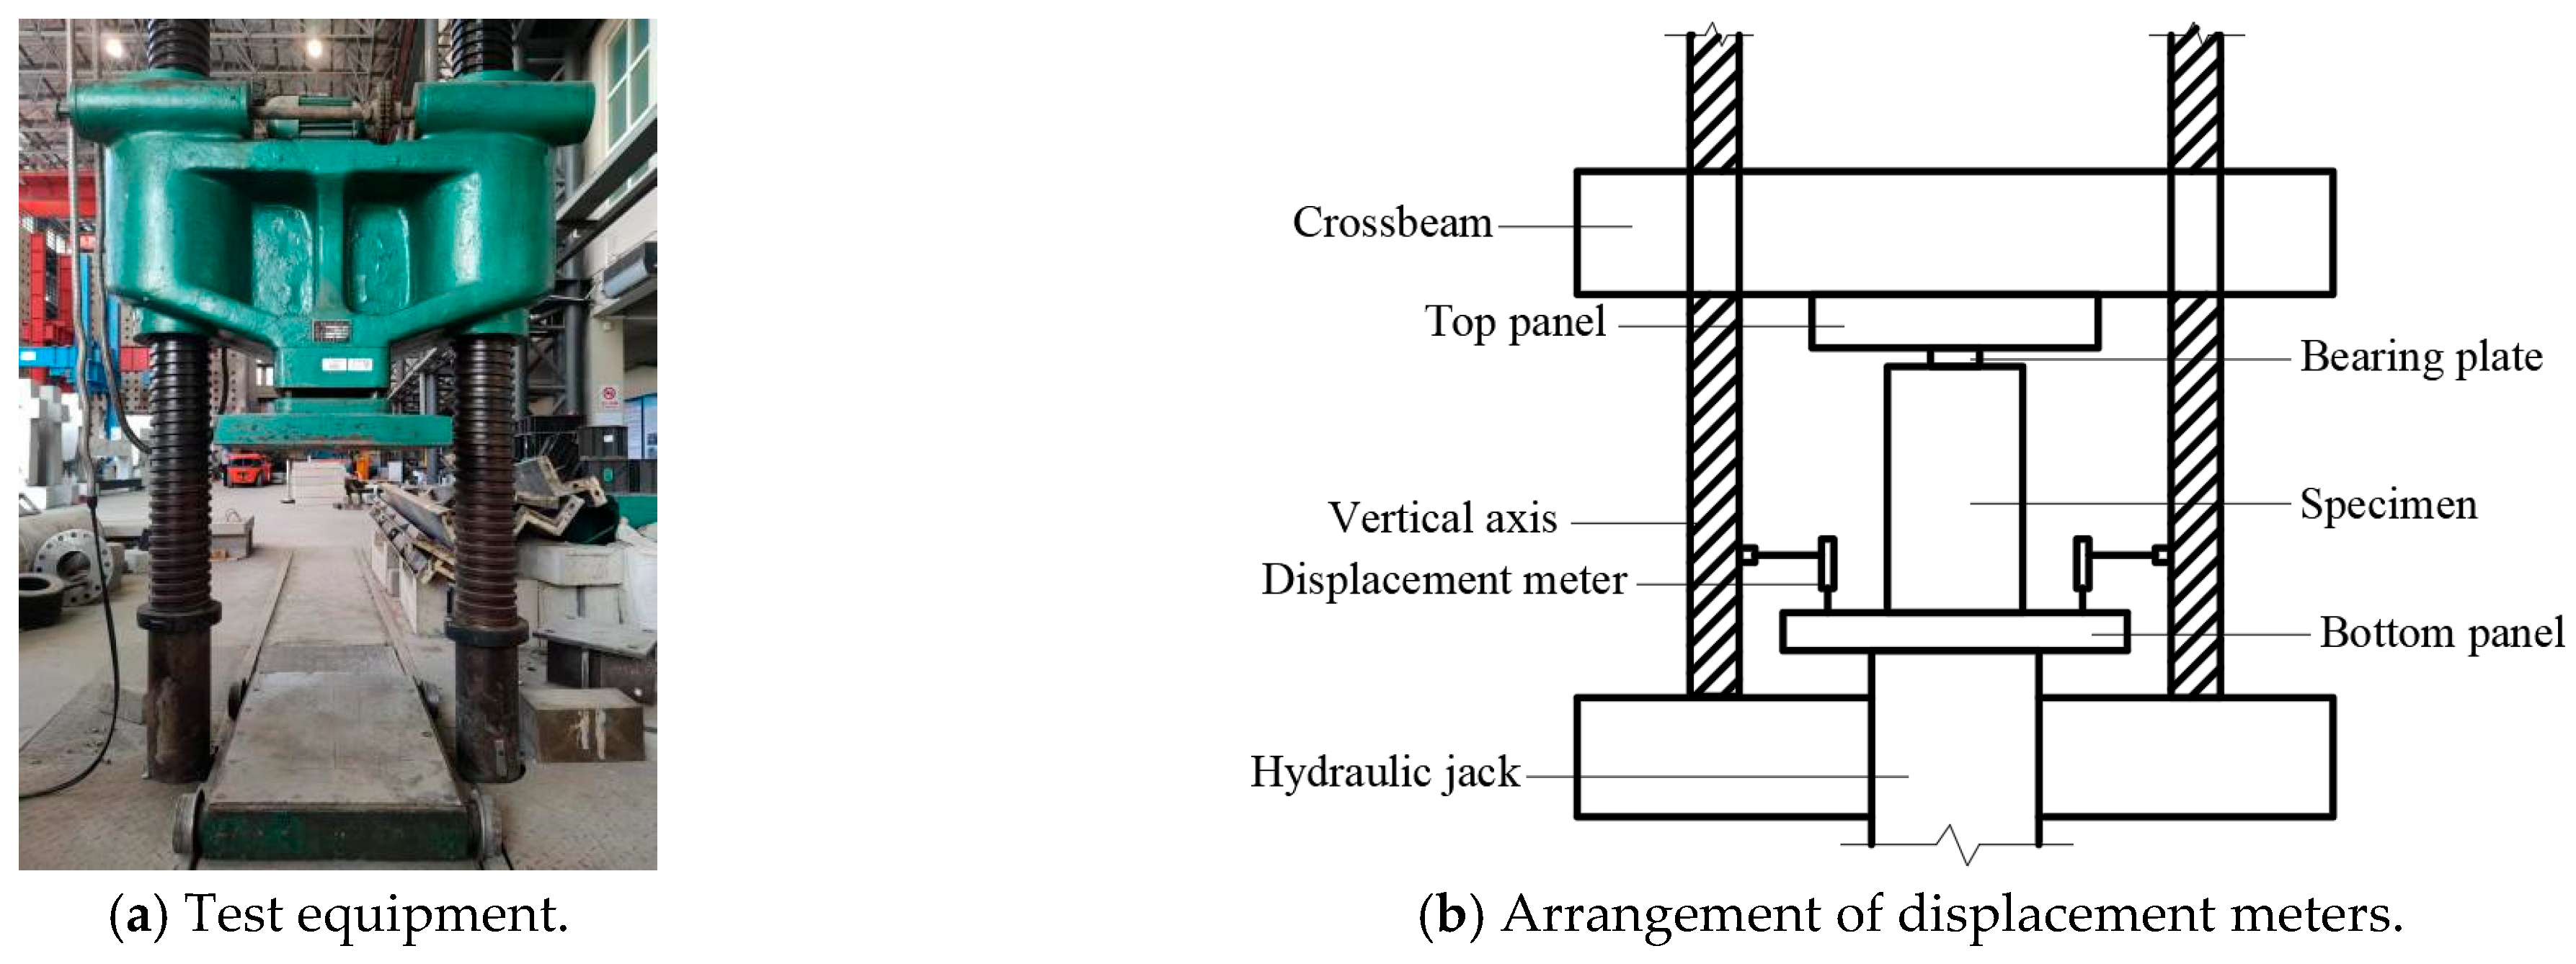
The selected loading equipment was a 500t hydraulic pressure testing machine (as shown in Figure 7a). Prior to the formal loading test, a preloading test must be conducted to verify the proper functioning of the instrumentation. Four displacement meters were strategically placed on the lower surface of the specimen to measure overall compressive deformation during the experiment, as illustrated in Figure 7b.

4. Experimental Phenomena and Results

The experimental results demonstrate that all specimens experienced a ductile failure, characterized by initial cracking followed by progressive failure. In certain cases, local pressure failure occurred due to concrete crushing under the bearing plate. The primary role of spiral stirrups was to enhance the strength of concrete in the tension region. Variations in the volumetric ratio of the spiral stirrups result in different levels of strength in both the tension and compression regions. The local pressure failure of concrete reinforced with spiral stirrups was classified into two failure modes: crushing failure and tensile failure. The restraining effect of spiral stirrups on concrete under two failure modes was analyzed with Digital Image Correlation (DIC) monitoring technology.
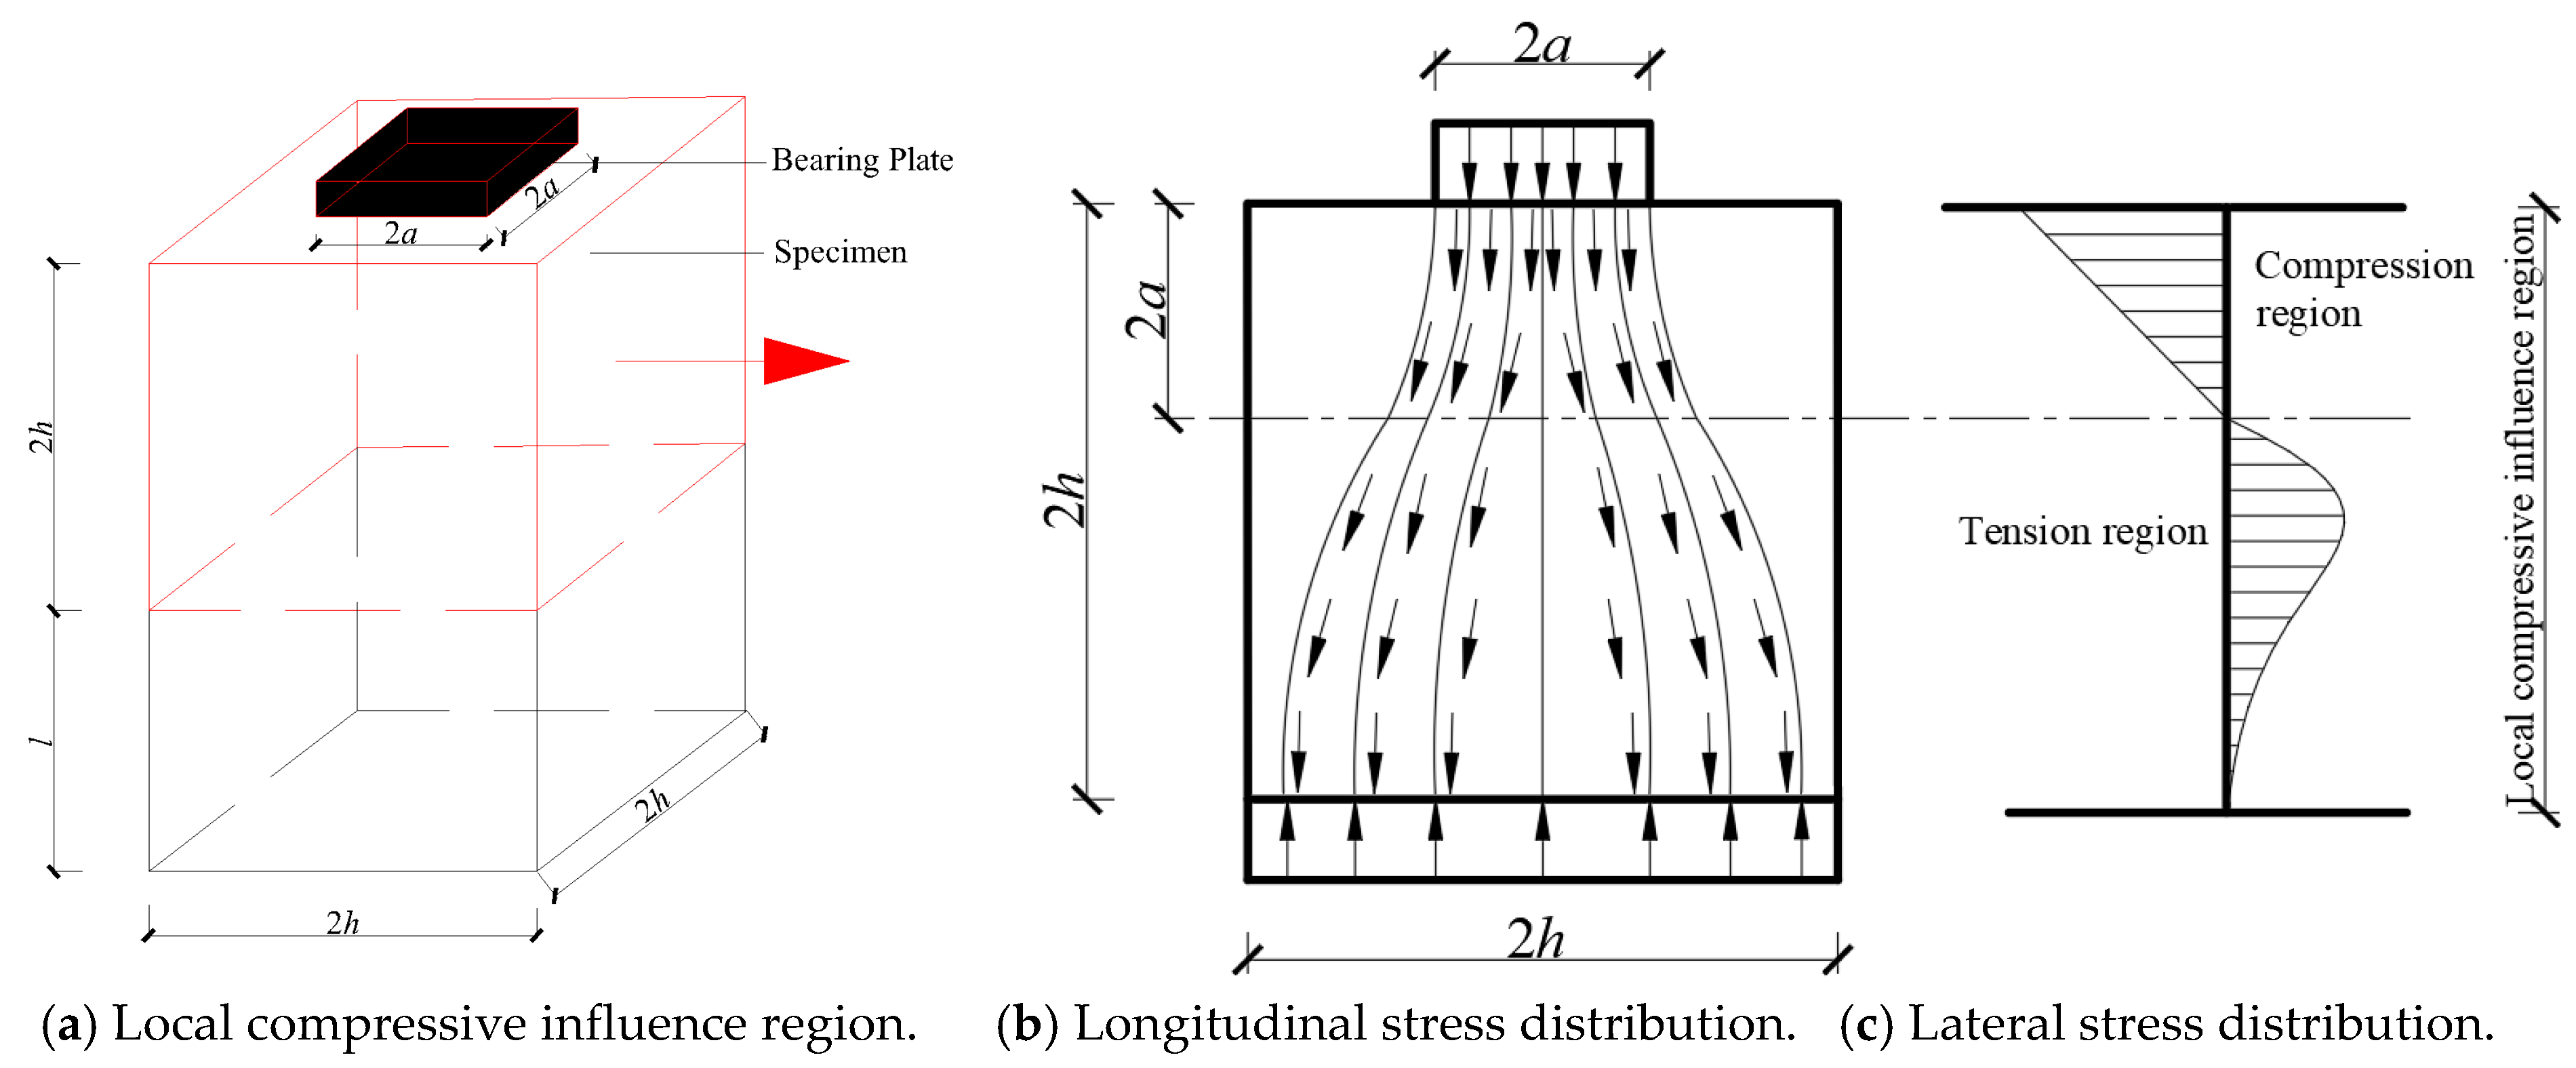
According to Saint-Venant’s principle, local compressive stress must propagate over a certain distance before it was uniformly distributed across the entire cross-section. This leaded to the formation of a local compressive influence region, which could be further divided into a compression region and a tension region, as illustrated in Figure 8. Due to the complex stress diffusion mechanism, the tension region was subjected to lateral tensile stress. The lateral tensile stress primarily originates from two key contributing factors: the radial dispersion of the applied load and constrained deformation. Both of the contribute to the initiation and propagation of cracks in the tension region. Consequently, lateral tensile stress in the tension region would become the primary cause of specimen failure. The spiral stirrups incorporated into the specimen provided vertical constraint in the tension region, effectively resisting the lateral tensile stresses present in that region. In contrast, failure in the compression region was primarily attributed to the vertical compressive stress imposed by the bearing plate. When local pressure failure occurs, it is typically characterized by concrete crushing under the bearing plate, accompanied by continuous displacement under a nearly constant load.

4.1. Crushing Failure

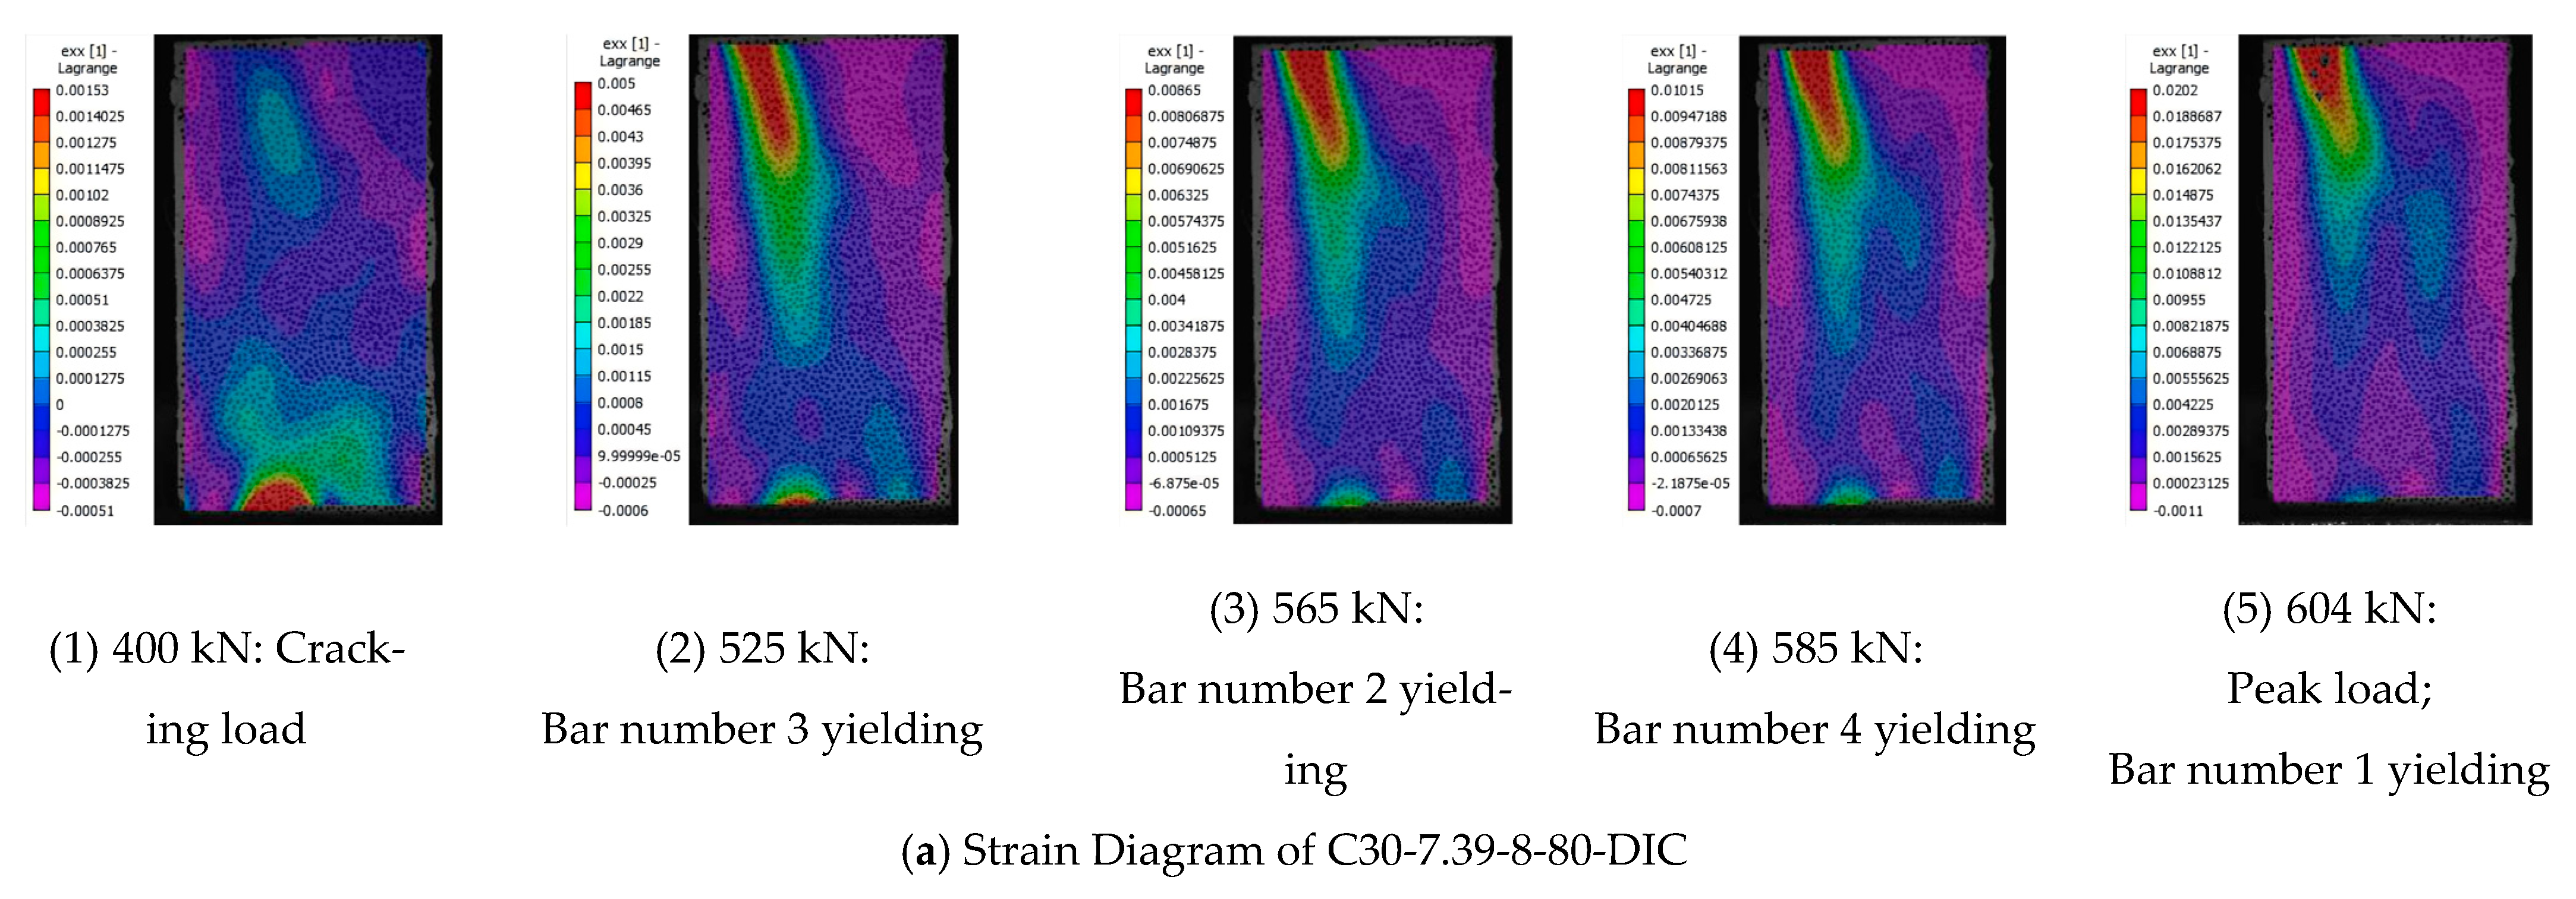
At the initial loading stage, concrete specimens with a higher volumetric stirrups ratio exhibit greater tensile strength than compressive strength due to the increased number of stirrups. The analysis of the Digital Image Correlation DIC data during the crushing failure process, as shown in Figure 9. This leads to obvious stress concentration in the compression region, and vertical cracks were observed in the central area of the compression region. As the loading continues, the DIC data indicated the appearance of tiny cracks in areas experiencing high strain. The appearance of these cracks indicated that the tensile strain of the concrete had reached 0.0003, exceeding the ultimate tensile strain capacity of the concrete. With further loading, the reinforcement within the compression region would gradually approach its yield point. It indicated that the bearing plate has been pressed into the specimen, causing lateral expansion of the surrounding material and subsequent yielding of the reinforcement. It was important to note that the local bearing mechanisms differ between the tension and compression regions. The outer surface of the compression region would exhibit tensile failure characteristics, while the concrete under the bearing plate had not reached its ultimate compressive strength. In contrast, cracking in the tension region indicated that the concrete has reached its ultimate tensile strength. It leads to a change in the interaction between the reinforcement and the concrete, wherein the concrete no longer effectively collaborates with the reinforcement to resist lateral tensile stresses. As the stirrups enter the yielding and strain hardening stages, the compression region under the bearing plate would gradually attain its maximum local bearing capacity.

4.2. Tensile Failure

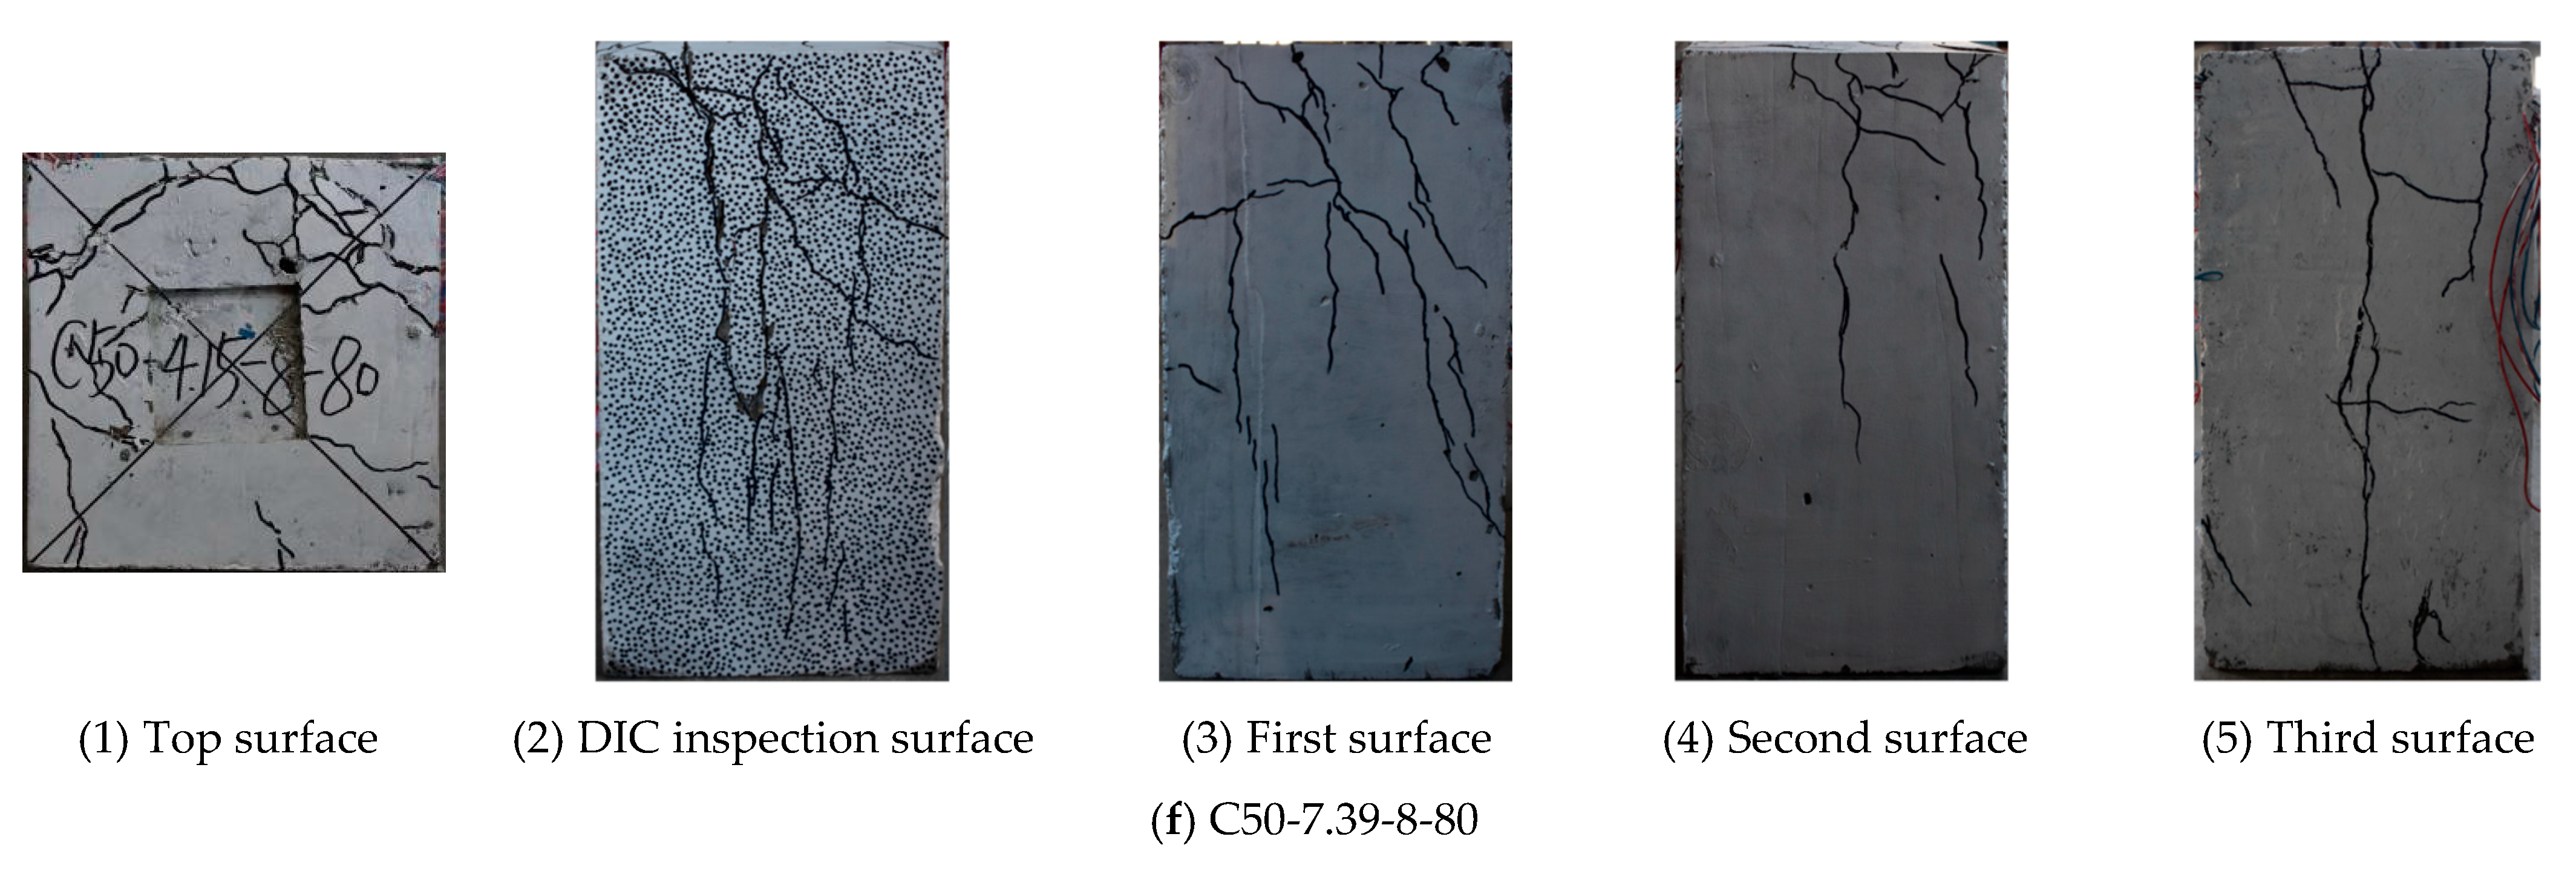
The experimental results indicated that specimens exhibited tensile failure generally with a lower volumetric stirrups ratio. The primary cause of failure was the presence of continuous vertical cracks. The fundamental mechanism of tensile failure can be attributed to the relatively lower tensile strength of this region, which results from a reduced volumetric stirrups ratio compared to the compression region. Consequently, the restraining effect provided by the spiral stirrups was insufficient to prevent splitting failure effectively. Moreover, the concrete in the compression region had not yet reached its ultimate capacity, allowing splitting-induced vertical cracks to propagate and ultimately lead to the structural failure of the specimen. Additionally, the experiment revealed that specimens with a smaller ratio of core area to load area were more susceptible to tensile failure. This was because specimens with a larger load area contain fewer reinforcing bars in the tension region, resulting in a thinner layer of concrete between the core concrete and spiral stirrups. The reduction in confinement lead to a more pronounced splitting effect, as illustrated in Figure 10.
In contrast to the crushing failure, specimens experiencing tensile failure exhibited no significant compressive deformation or lateral expansion-induced cracks in the compression region. Furthermore, the concrete under the bearing plate in the compression region had not reached its ultimate compressive strength at the conclusion of the experiment. During the loading process, DIC monitoring revealed that the first tiny vertical crack initiated in the upper region of the tension region. The appearance of this crack indicated that the concrete at that location had reached its ultimate tensile strength. In this scenario, the reinforcement continued to resist the lateral tensile stresses. As the load increased incrementally, the first crack propagated toward the reinforcement in the tension region, eventually causing yielding. This demonstrated that the spiral stirrups were capable of maintaining their constraining effect even after the concrete reached its tensile strength. As the load continued to increase, the stirrups within the tension region gradually yielded. Until reaching the peak load, all reinforcement in the tension region had yielded and entered the strain-hardening phase. At this stage, the spiral stirrups could no longer effectively resist the splitting effects induced by loading. And the concrete under the bearing plate had still not reached its ultimate compressive strength. Consequently, the specimen would reach its peak load capacity and fail due to tension region degradation.

4.3. Experimental Results

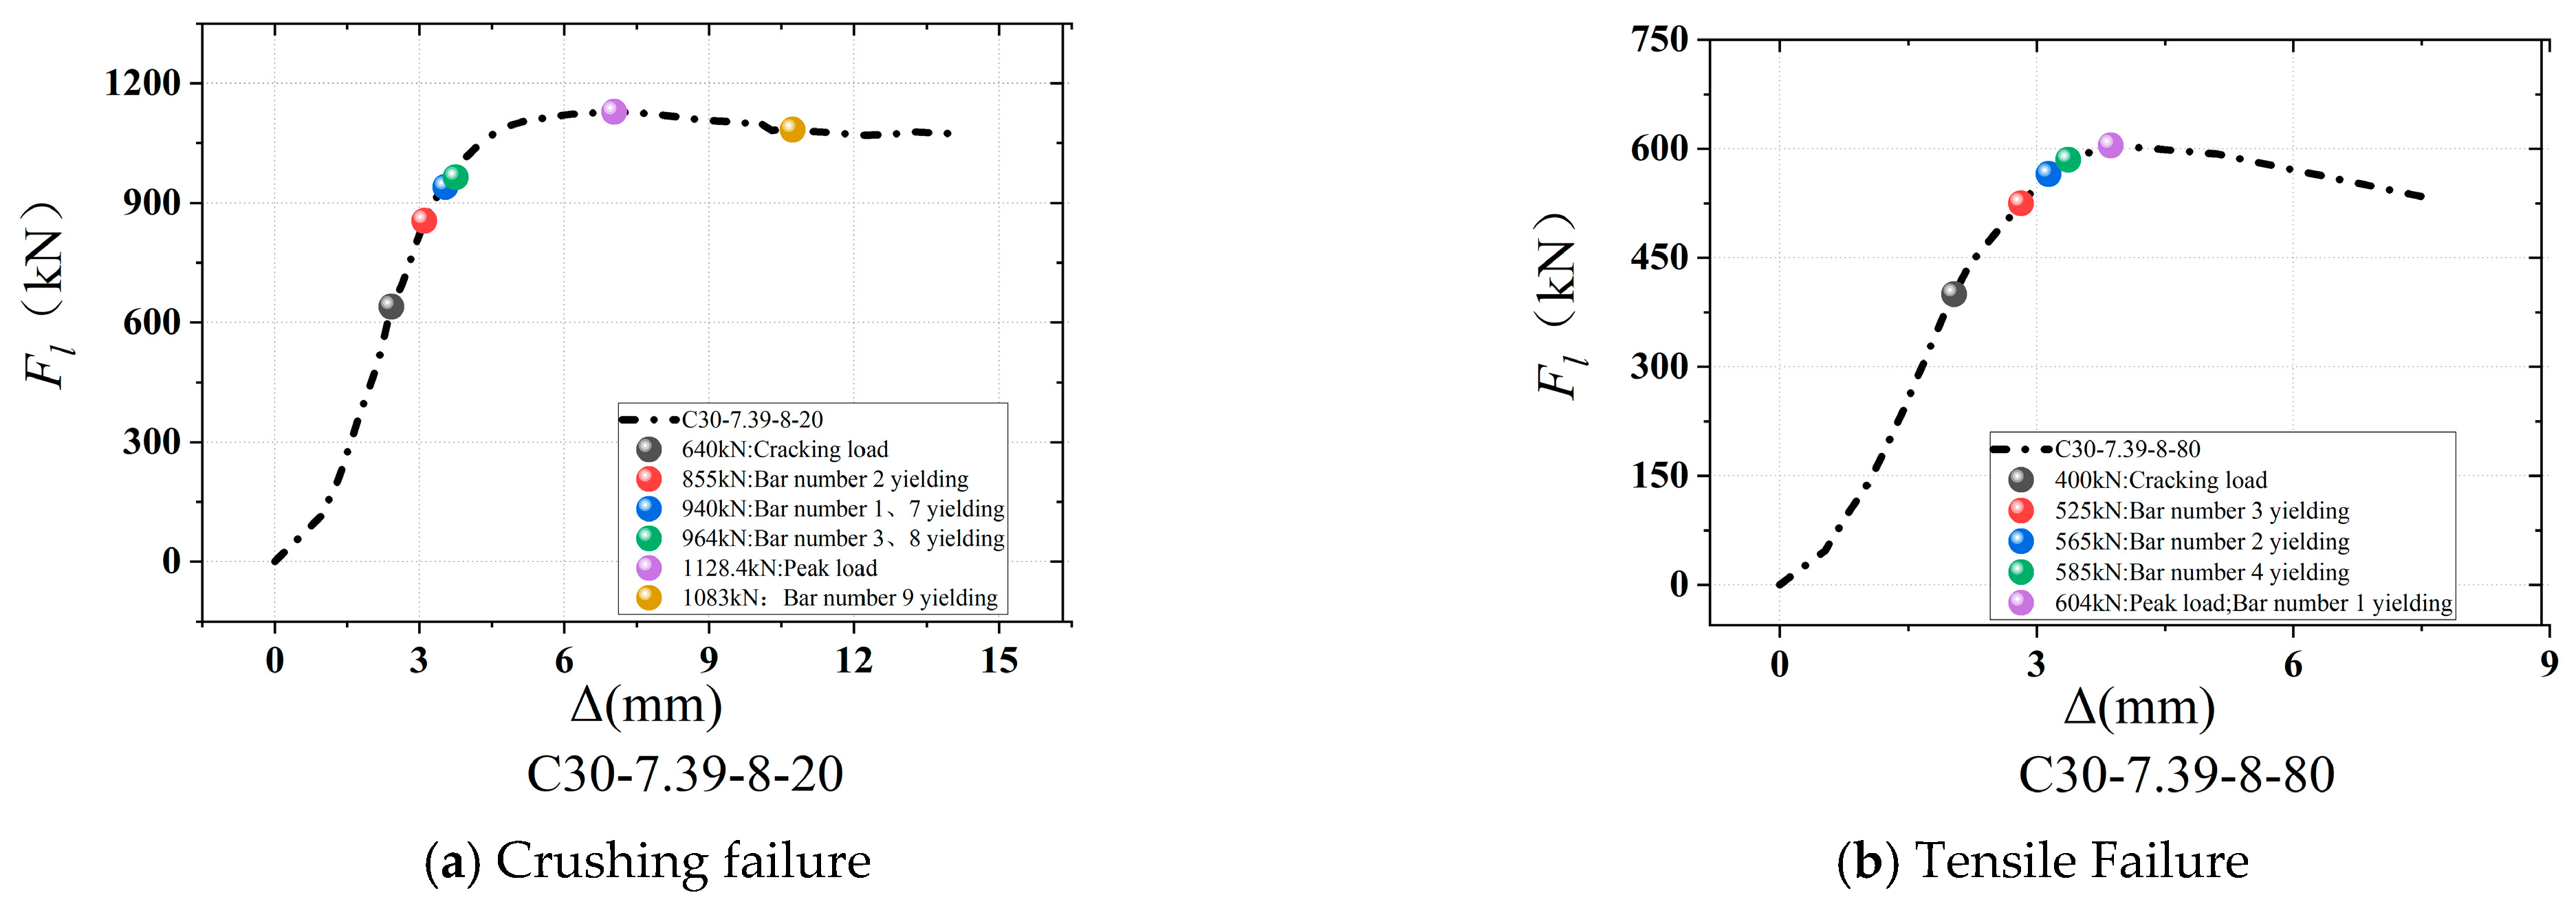
Taking the load–deformation curves of specimens C30-7.39-8-20 and C30-7.39-8-80 as examples, the characteristics of the two failure modes are analyzed and summarized in Table 5.
The typical load–deformation curve of crushing failure is shown in Figure 11a. It was clearly observed that the specimen retained significant deformation even after reaching the peak load. Additionally, the variation in load was minimal. This phenomenon could be primarily attributed to crushing failure of the specimen, during which the concrete under the loading plate underwent continuous compression. The lateral deformation within the compression region of the specimen continued to increase, while the tension region force remained relatively low. The failure of the specimen occurred when the compressive deformation of the concrete exceeded the allowable limit.
The typical tensile failure mode is illustrated in Figure 11b. In contrast to crushing failure, all the bars in the tension region yielded when the specimens reached the peak load. Subsequently, the load decreased rapidly as deformation increased. This indicated that the bars subjected to tensile stress undergo yielding, leading to overall compressive deformation of the specimen. The deformation was primarily concentrated in the tension region. Consequently, the failure due to tensile stress, while the compression region remained largely undamaged.
In tensile failure, a primary crack spanning the entire height of the C50 specimen formed before the bars fully yield. The crack rapidly propagated within the region affected by local pressure, accompanied by the emergence of secondary cracks at peak load. This suggested that high-strength concrete exhibited low ductility and limited deformation capacity. The failure mode was characterized by splitting with a single dominant crack, and the bars had typically reached full yielding at the peak load. In contrast, C40 specimens tend to develop multiple major cracks, with crack widths expanding significantly as the load increases. This indicated a failure pattern involving coordinated development of multiple cracks, demonstrating superior deformation capacity compared to C50 concrete.
In crushing failure, the crack distribution in C50 specimens was more concentrated. Strain variations at the crack locations were pronounced, while strains in other regions remain relatively low. After reaching peak load, crack propagation occurred at a slower rate. The concrete under the loading plate was crushed, and visible transverse cracks appear at the top of the specimen. Conversely, C40 specimens exhibited a broader crack influence region, with noticeable strain changed in the tension region relative to the volumetric strain. These observations indicated that C50 concrete was more susceptible to brittle failure under compressive stress, with significantly lower plastic deformation capacity compared to low-strength concrete. Due to the inherent brittleness of high-strength concrete, cracks predominantly occurred in compression region. Although the surrounding reinforcement could constrain lateral expansion, yielding may occurred near the cracks, weakening the bond effect. This not only compromised local confinement but also reduced the overall load-bearing capacity. Both failure modes consistently demonstrate that C40 concrete offered better ductility and deformation performance than C50 concrete.
Through the monitoring of DIC and the analysis of variations in reinforcement strain, the experimental results were obtained. The results show that specimens experiencing tensile failure account for approximately 55% of the total, and specimens exhibiting crushing failure constitute approximately 45%. A higher volumetric stirrups ratio significantly enhances the strength of the tension region, thereby increasing the probability of crushing failure. However, an insufficient volumetric ratio of the spiral stirrups may result in splitting and tensile failure, particularly in specimens with a relatively low volumetric ratio.

5. Local Bearing Capacity Calculation

5.1. Theoretical Equation Calculation

The calculation equation for the upper limit of the local bearing capacity with the configuration of indirect reinforcement was given by Equation (1) below:
N u = β c β l f c , k A l + 2 α ρ v β c o r f y A l
β l = A b A l
β c o r = A c o r A l
In Equation (1), βc and α denote the concrete strength influence coefficient and reduction coefficient that accounts for the restraining effect, respectively. Because the concrete strength grade does not exceed C50, both βc and α are assigned a value of 1.0 in this study. Based on an analysis of the code calculation equation, it was determined that the bearing capacity is the sum of the concrete component and the reinforcement component. The reinforcement component was related to the volumetric stirrups ratio and decreased as the concrete strength increase. To account for the reduction, the code introduces the coefficient α. As presented in Table 5, θc represents the ratio between the experimental values and the theoretically calculated values. It could be observed from the table that the experimental values would exceed the calculated values. This indicated that there was a significant difference between theoretical predictions and actual test results.
To address the difference between theoretical predictions and actual test results, the local bearing capacity was further decomposed into concrete component and the reinforcement component for analysis. This approach leads to the recalculated local bearing capacity Nu′, and facilitates the development of a new calculation equations. Through the analysis of various factors, a clear positive or negative correlation between these variables and the bearing capacity could be established. The contribution of concrete component represents the local bearing capacity of plain concrete, while the contribution of reinforcement component is enhanced through the presence of indirect reinforcement based on the characteristics of constrained concrete. The concrete component contribution can be simplified as fc,kAl, and the reinforcement component contribution as ρvfyAl. Taking these two components as independent variables and Nu′ as the dependent variable, a new calculation equation for local bearing capacity could be obtained.

5.2. Analysis of Influencing Factors

5.2.1. Influence of ρvfy

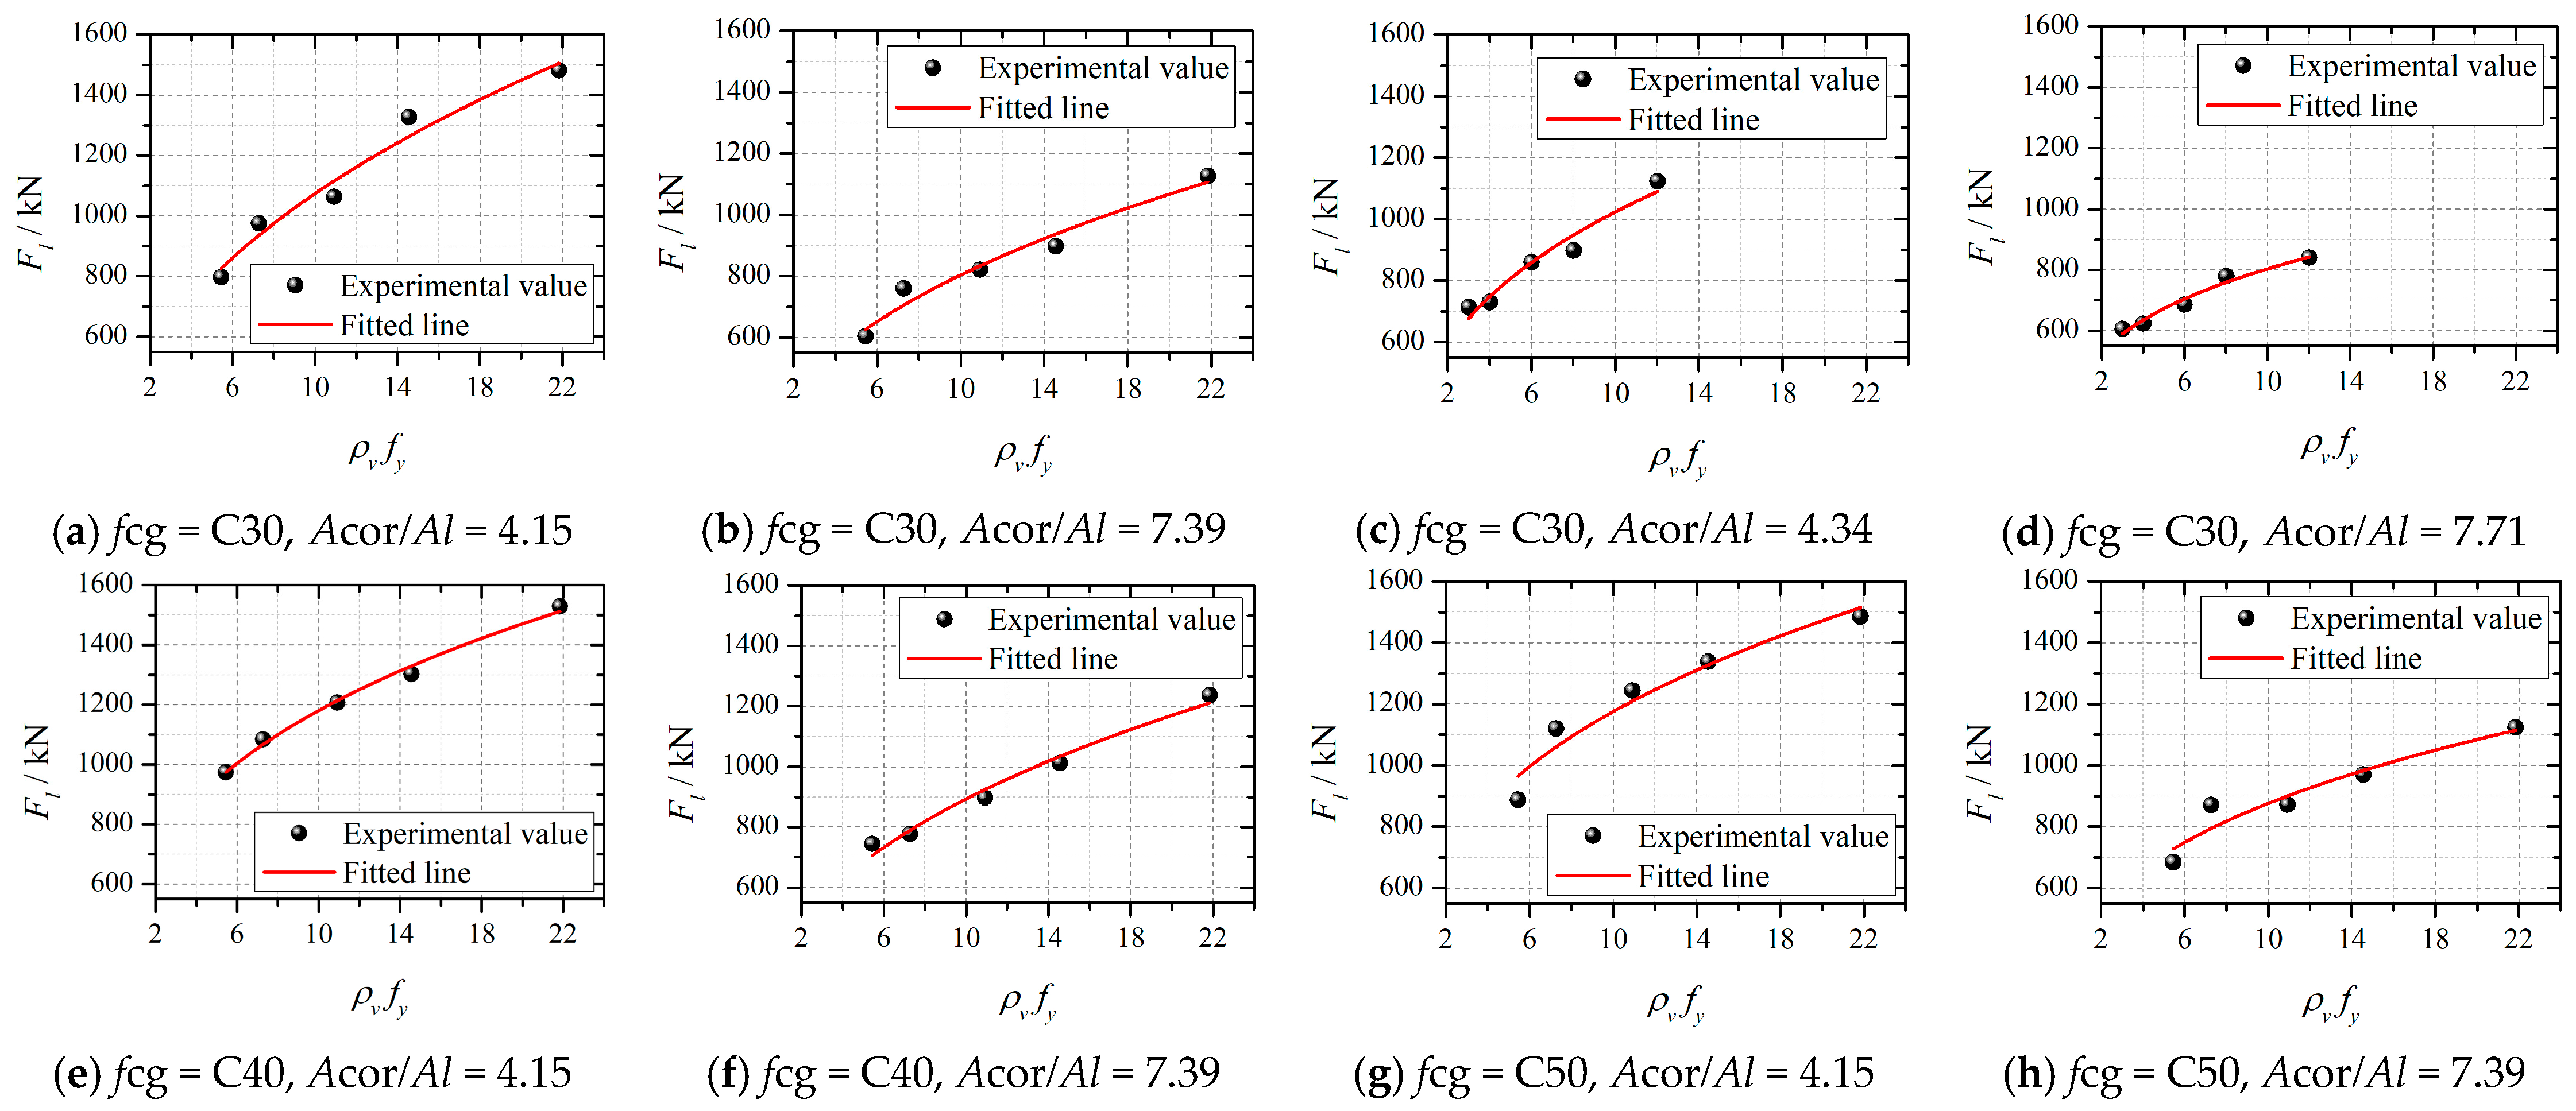
By adjusting the stirrup spacing s and stirrup diameter d, the volumetric stirrups ratio of the specimens was directly altered. With consistent concrete strength grade fcg and the ratio of core area to load area Acor/Al, the influence of stirrup stress ρvfy on the local bearing capacity Fl was examined. Figure 12 illustrates the relationship between the local bearing capacity Fl and stirrup stress ρvfy with the same ratio of core area to load area Acor/Al. Holding all other variables constant, the local bearing capacity Fl of concrete would increase with the increase in stirrup stress ρvfy.

5.2.2. Influence of Acor/Al

When the dimensions of specimen and core concrete were fixed, changing the width of the bearing plate 2a could test the influence of different Acor/Al on Fl. The experimental data were sorted out and analyzed, and the relevant results are shown in Table 6.
The data presented in Table 6 indicated that Fl decreases as the Acor/Al increase with a notable decline observed. The underlying reason for this phenomenon was that a reduction in the bearing plate size results in an increased Acor/Al. It leads to a decrease in lateral tensile stresses within the tension region, thereby enhancing the integrity of the tension region. However, the reduced bearing plate size also would decrease the height of the compression region, which in turn would reduce the bearing capacity of the concrete. Consequently, specimens with smaller Acor/Al were more prone to failure. Therefore, the Fl is relatively lower in specimens with smaller bearing plate areas, indicating a directly proportional relationship between the local bearing capacity Fl and load area Al.

5.2.3. Influence of fcg

With conditions of constant stirrup spacing s and ratio of core area to load area Acor/Al, the influence of concrete strength grade fcg on the local bearing capacity Fl was examined when the specimens reach their ultimate local bearing capacity. Figure 13 presents the relationship between the local bearing capacity Fl and the concrete strength grade fcg.
As illustrated in Figure 13, the local bearing capacity of the specimens would generally increase with the concrete strength increase. However, the local bearing capacity of the C50 was predominantly lower than that of the C40 specimens. This phenomenon could be attributed to the fact that as concrete strength increases, its ductility and deformation capacity tend to decrease. The concrete of C50 was more prone to brittle failure under load and lacks the significant plastic deformation capacity observed in lower-strength concrete. Due to the inherent brittleness of high-strength concrete, cracks tend to concentrate in cracks. At these critical points, stirrups restrict the transverse expansion of concrete. However, stirrups may experience local yielding at the crack locations, leading to a reduction in the constraining effect on the surrounding concrete. Consequently, this results in a partial loss of confinement and a decrease in the overall load bearing capacity, causing the specimen to reach its peak load prematurely.

5.3. Fitting of Local Bearing Capacity Calculation Equation Nu’

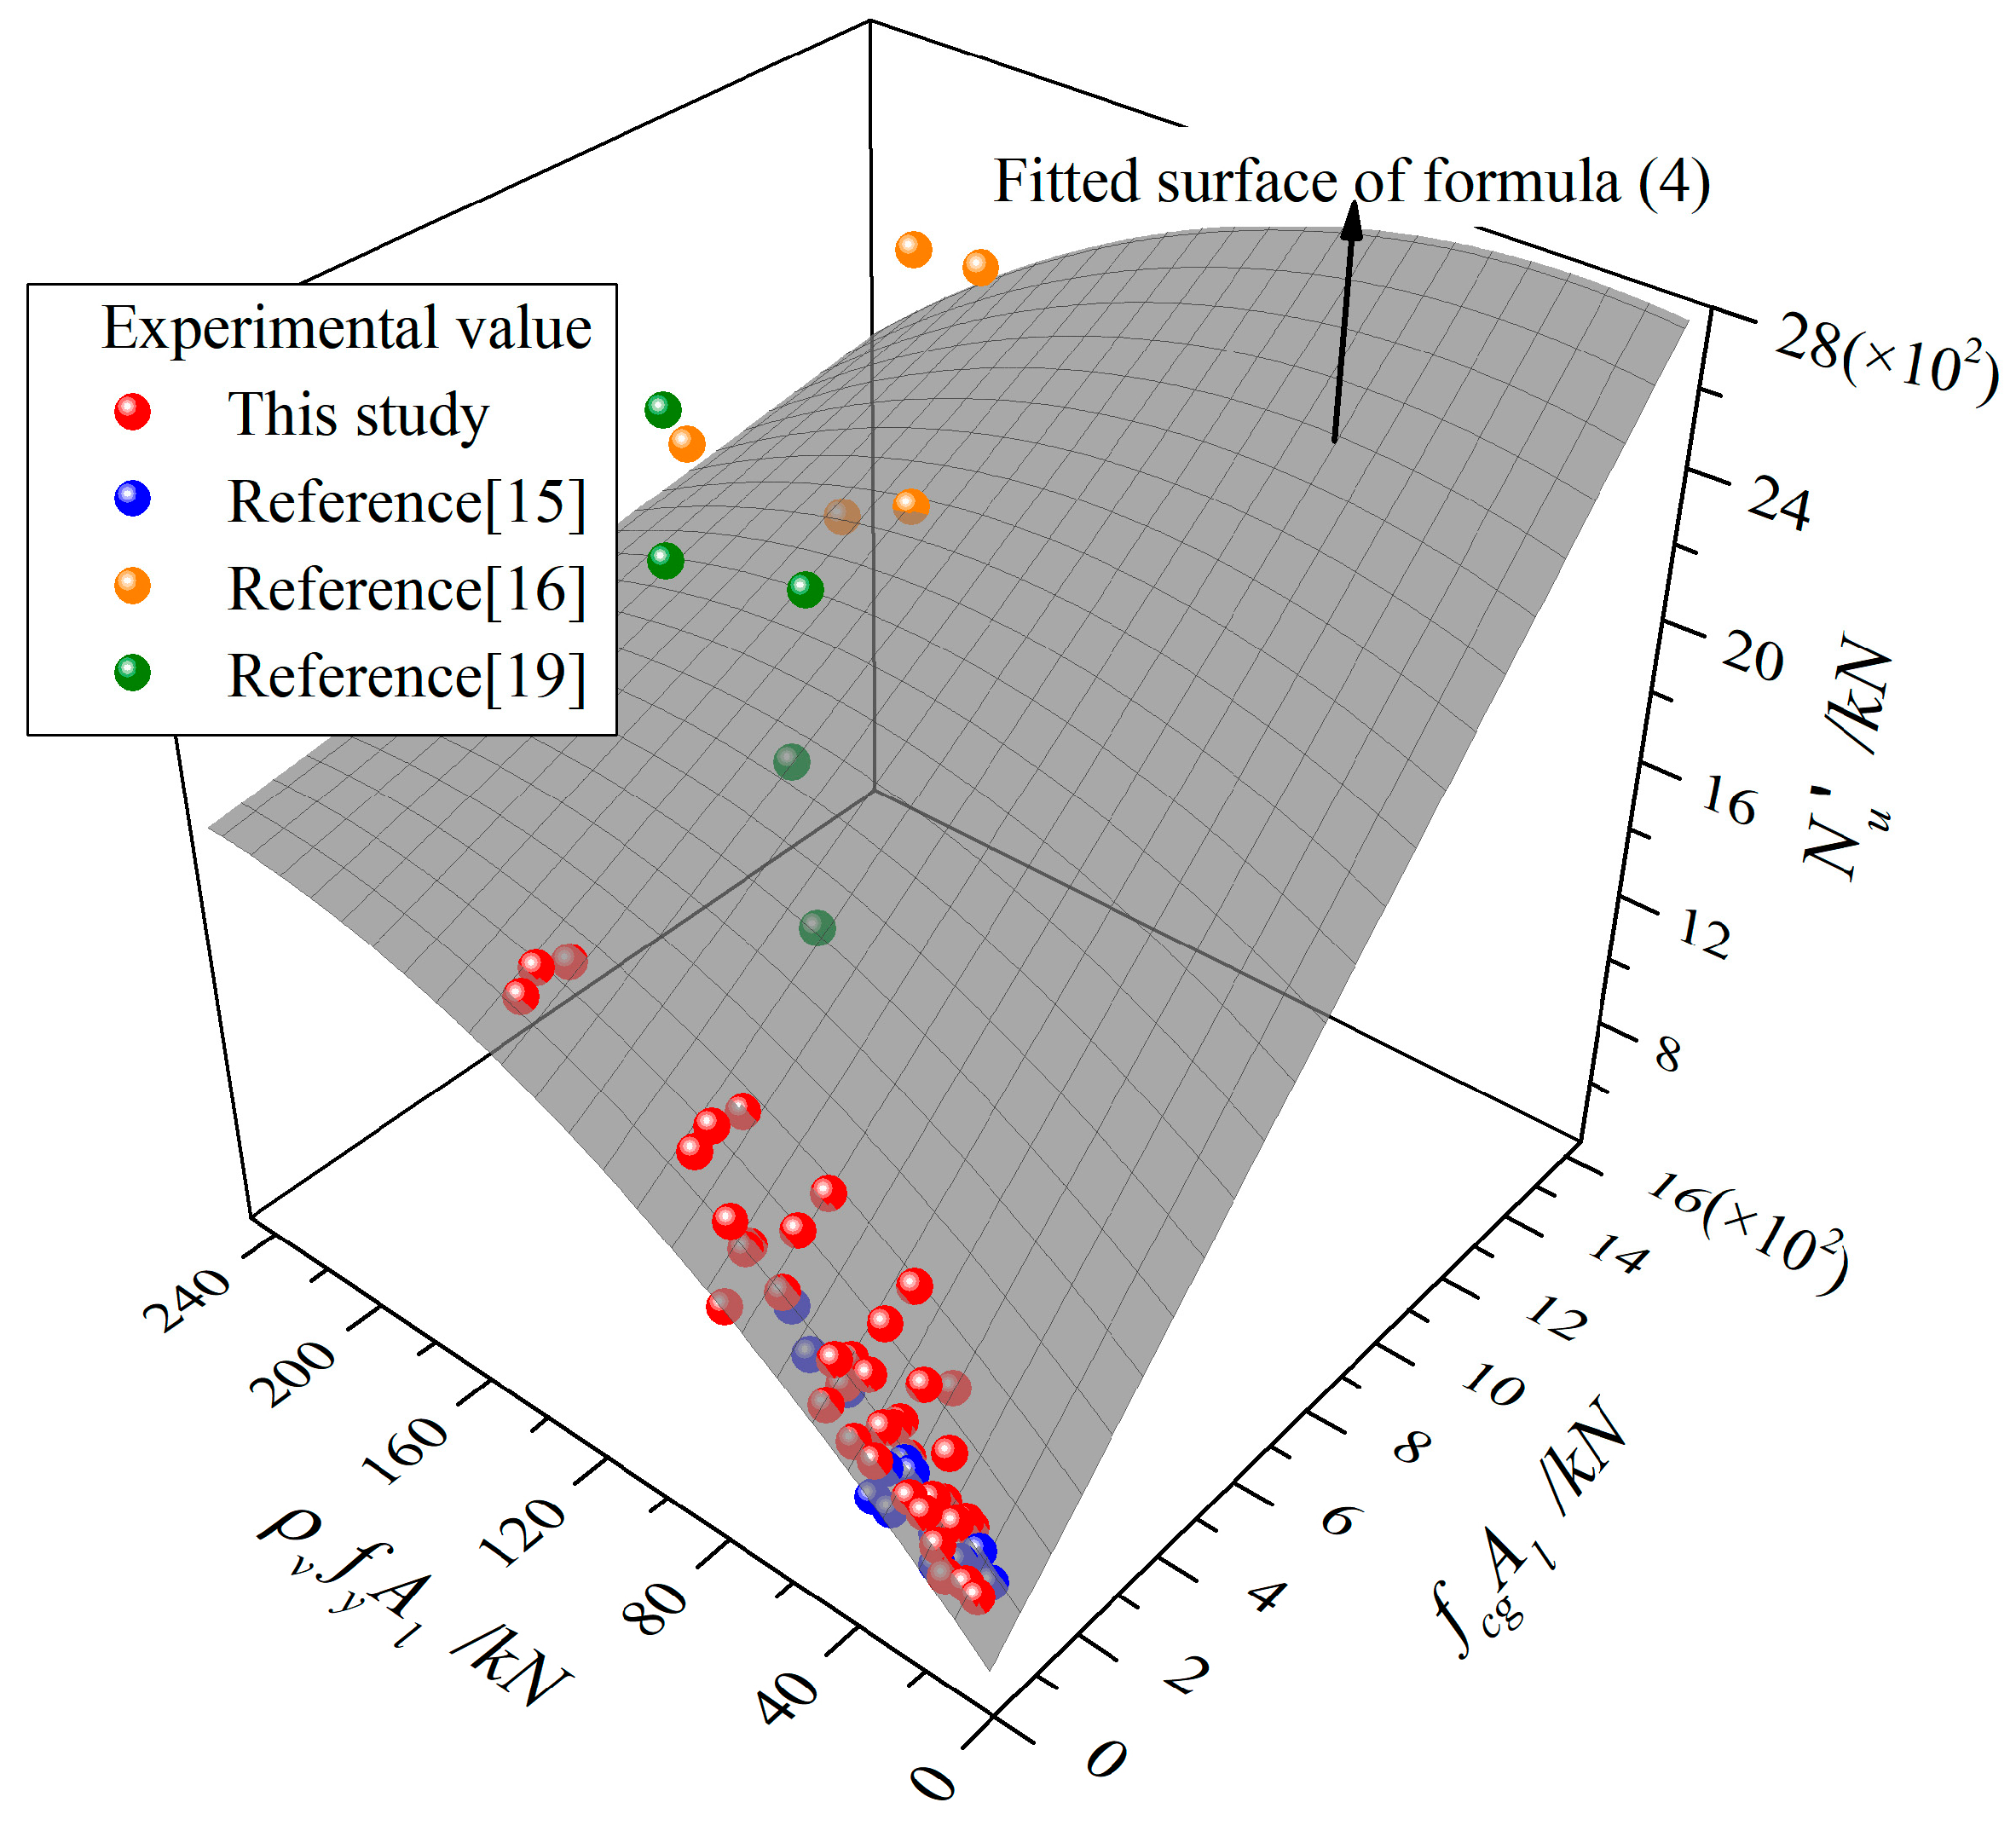
Based on the parameter analysis conducted in the preceding section, it was evident that the local bearing capacity Nu′ was influenced by variations in stirrup stress, load area, and concrete strength grade. Leveraging the aforementioned analytical results, the data points were fitted within a three-dimensional coordinate system. The concrete contribution to the fc,kAl is plotted along the X-axis, the ρvfyAl along the Y-axis, and the Fl along the Z-axis. This fitting process leaded to the formulation of a three-dimensional model. When the fcg is C30 to C50, with Acor/Al values ranging from 4.15 to 7.71 and ρv values between 1.4% and 5.5%, the calculation formula for the local compressive bearing capacity was derived as follows:
N u = 378.2 + 1.435 f c , k A l + 9.353 ρ v f y A l 4.949 × 10 - 3 f c , k A l 2 ρ v f y 1.815 × 10 - 2 ( ρ v f y A l ) 2
The Nu′ values calculated from Equation (4) were compared with the corresponding experimental results, as presented in Table 7. The parameter θ was the ratio of calculated to experimental values. Systematic organization and analysis of the calculated values derived from the segmented formula in conjunction with the experimental data are shown in Table 7.
The average θ value is determined to be 1.000, with a standard deviation of 0.059 and a coefficient of variation of 0.059. The value of R2 was 0.950. This suggested that Equation (4) achieved a reasonable level of accuracy.

5.4. Verification of the Equation

To verify the validity of the equation calculations, experimental data were collected from 24 concrete specimens reinforced with spiral stirrups from References [15,16,19]. The detailed experimental data are summarized in Table 8.
The Nu′ values recalculated from Equation (4) were compared with the corresponding experimental results for the collected specimens, as presented in Table 8. In this context, αc was the ratio of experimental values to calculated values.
Through comparative analysis of the data in Table 8, the validity and precision of the proposed equation could be further assessed. The results showed an average αc value of 0.950, with a standard deviation of 0.100 and a coefficient of variation of 0.105. These statistics indicated that the equation achieved a high level of accuracy and low error. Consequently, the equation exhibited both high accuracy and adaptability, making it a reliable tool for estimating local bearing capacity in practical engineering applications.
The test data obtained from the experiment, collected data, and the fitting surface with Equation (4) are shown in Figure 14. The local bearing capacity calculated using Equation (4) demonstrated a satisfactory level of accuracy and fits well with the observed data.

5.5. Discussion

The test data, the data collected from the references, the calculation lines of Equation (4), and the calculation lines of the GB50010-2010 and ACI318-19 [50] are shown in Figure 15.
From Figure 15, the derived Equation (4) tended to show a good agreement with the experimental values. It could generally reflect the variation trend of the experimental values well and could also demonstrate the dynamic changes in the specimens’ performance with relevant parameters. Regarding the GB50010-2010, its advantage lies in that the calculated bearing capacity values are usually able to dynamically adjust with the changes in multiple parameters of the specimens, thus matching the actual performance variation law of the specimens to a considerable extent. However, compared with the ACI318-19, the safety reserve of the GB50010-2010 is relatively lower in most cases. In contrast, the ACI318-19 determined the design bearing capacity through the conversion of the strength reduction factor, which tended to endow it with a relatively high safety reserve and usually made it more reliable in engineering practice. However, since the ACI318-19 took into account relatively few influencing factors in its calculation, the bearing capacity values were often relatively constant and could not fully reflect the performance changes in the specimens as stipulated in the GB50010-2010 or the derived fitting equations.

6. Conclusions

To investigate the local bearing capacity of concrete reinforced with spiral stirrups, a total of 40 specimens were subjected to local compression testing. The study examined several key factors that influence the local compressive performance of concrete, including the ratio of core area to load area Acor/Al, concrete strength grade fcg, stirrup diameter d, and stirrup spacing s. Based on the experimental results, the following conclusions were reached:
  • An analysis and classification of the failure types observed in the 40 specimens revealed two primary failure modes: tensile failure and crushing failure. The tensile failure occurred in the tension region, when the strength of the tensile region was lower than that of the compression region, and the crushing failure, which occurred in the compression region, when the strength of the tensile region was higher than that of the compression region.
  • Based on analysis of the experimental parameters, it was found that the local bearing capacity of concrete Fl increases as the Acor/Al decreases, with an enhancement of 23.0%. Furthermore, a reduction in s would result in a 65.4% improvement in Fl compared to the initial value. Moreover, increasing the d results in a 24.7% improvement in Fl.
  • Reducing the s increases the number of stirrups in the tension region, thereby enhancing the lateral restraint provided by the stirrups and further improving the strength of the tension region. It would contribute to an increase in the Fl. A smaller Acor/Al results in a larger proportion of the load area within the specimen, making its behavior more similar to axial compression and enhancing the Fl. Additionally, a larger d provided a stronger constraining effect on the concrete, which also improved the Fl.
  • The experimental data indicated that there is a proportional relationship between fcg and Fl. A comparison of the local bearing capacities of C40 and C50 specimens revealed that the influence of concrete strength on bearing capacity must consider whether the spiral stirrups could fully exert their restraining effect on the concrete. During the experiments, single-point yielding of the stirrups was observed at crack locations in the C50 concrete specimens upon failure. Under the action of peak load, there were main cracks on the surface of the specimen. This indicated that the strain of the spiral stirrups was mainly concentrated at the main cracks. Therefore, the local bearing capacity of the C50 specimen failed to reach its maximum potential.
  • Based on normative equation derived from theoretical research, the local bearing capacity Nu′ were recalculated. The calculation equation for Nu′ was developed in terms of fc,kAl and ρvfyAl. Subsequently, experimental data from studies on spiral stirrups reinforced concrete were collected to verify the accuracy and applicability of the proposed formula.

Author Contributions

Conceptualization, H.L., Y.Z., S.W., Y.D., D.J., T.M. and R.Q.; Methodology, H.L., Y.Z., S.W., Y.D., D.J., T.M. and R.Q.; Software, H.L., Y.Z., S.W., Y.D. and D.J.; Validation, Y.Z., S.W., Y.D., D.J. and X.B.; Formal analysis, H.L., Y.Z., S.W., Y.D. and X.B.; Investigation, H.L., Y.Z., S.W. and D.J.; Resources, Y.Z., S.W., X.B. and Y.Q.; Data curation, Y.Z., Y.D., D.J., R.Q., X.B. and Y.Q.; Writing—original draft, H.L.; Writing—review & editing, H.L., Y.Z., T.M., R.Q., Y.Q. and B.W.; Visualization, Y.Z. and T.M.; Supervision, Y.Z., T.M. and B.W.; Project administration, T.M.; Funding acquisition, T.M. All authors have read and agreed to the published version of the manuscript.

Funding

This research was funded by Natural Science Foundation of Jilin Province (YDZJ202401575ZYTS).

Data Availability Statement

The original contributions presented in this study are included in the article.

Conflicts of Interest

Author Shanshan Wang was employed by the company Jilin Province Craftsmanship Architectural Design Consulting Co., Ltd. The remaining authors declare that the research was conducted in the absence of any commercial or financial relationships that could be construed as a potential conflict of interest.

Nomenclature

fcgConcrete strength gradeEsElastic modulus of spiral stirrup
dStirrup diameterNuLocal bearing capacity of calculation Equation (4)
ρvVolumetric ratio of the spiral stirrupsAcorCore area
Acor/AlRatio of core area to load areaAlLoad area
FlLocal bearing capacity of experimental valuesβcConcrete strength influence coefficient
sStirrup spacingαReduction coefficient
fcu,mMeasured compressive strength of concrete cubesθcRatio between the experimental values and the theoretically calculated values
fc,mMeasured values for axial compressive strength of concreteβlConcrete strength grade adjustment coefficient
fc,kStandard value for axial compressive strength of concreteβcorCoefficient for improving the local bearing capacity of indirect reinforcing
ft,kStandard value of axial tensile strength of concreteNuLocal bearing capacity of calculation in Equation (1)
fyYield strength of spiral stirrupθRatio of calculated to experimental values.
fuUltimate strength of spiral stirrupαcRatio of experimental values to calculated values

References

  1. Musa, M.M.E.; Xiong, X.; Zhang, Y. Experiment and Validation of Local Bearing Capacity for Ultra-High-Performance Concrete Confined with Stirrups. Materials 2022, 15, 5869. [Google Scholar] [CrossRef] [PubMed]
  2. Niyogi, S.K. Bearing Strength of Reinforced Concrete Blocks. J. Struct. Div. 1975, 101, 1125–1137. [Google Scholar] [CrossRef]
  3. Liao, J.J.; Di, B.; Zheng, Y.; Xuan, Z.W.; Zeng, J.J. Shear behavior of circular concrete short columns reinforced with GFRP longitudinal bars and CFRP grid stirrups. Compos. Struct. 2024, 340, 118181. [Google Scholar] [CrossRef]
  4. ETAG 013-EOTA; ETAG 013 Guideline for European Technical Approval of Post-Tensioning Kits for Prestressing of Structures. European Organisation for Technical Approvals: Brussels, Belgium, 2002.
  5. Marchao, C.; Lúcio, V.; Ganz, H.R. Efficiency of the confinement reinforcement in anchoragezones of posttensioning tendons. Struct. Concr. 2019, 20, 1182–1198. [Google Scholar] [CrossRef]
  6. Cai, S.H. Local compressive strength of concrete and reinforced concrete. J. Civ. Eng. 1963, 9, 1–10. [Google Scholar]
  7. Liu, Y.; Guan, J.; Zhou, F.L.; Wang, C.Z. Methods for controlling tensioning cracks on the end faces of prestressed concrete members. Build. Str. 1980, 3, 9–15. [Google Scholar]
  8. Cao, S.Y.; Yang, X.K. Working mechanism and strength theory of concrete under local pressure. J. Harbin Univ. Civ. Eng. Archit. 1982, 3, 44–53. [Google Scholar]
  9. Yang, X.K.; Yang, B.; Meng, F.S. Several problems on local compression of concrete and reinforced concrete. Low Temp. Archit. Technol. 1999, 75, 8–10. [Google Scholar]
  10. Yang, X.K.; Yang, B.; Liu, L.N. Wedge theory of concrete and reinforced concrete under local pressure (I). Low Temp. Archit. Technol. 1999, 78, 10–12. [Google Scholar]
  11. Yang, X.K.; Yang, B.; Dong, L. Wedge theory of concrete and reinforced concrete under local pressure (II). Low Temp. Archit. Technol. 2000, 79, 18–19. [Google Scholar]
  12. Wei, S.M. The discussion of “local compressive strength and failure mechanism of concrete”. China Civ. Eng. J. 1985, 18, 82–87. [Google Scholar]
  13. Yang, Y.H.; Xue, A. Local compressive limit strength theory of high strength concrete. Sichuan Build. Sci. 1995, 4, 42–46. [Google Scholar]
  14. Yang, Y.H.; Xue, A. Analysis and calculation of local compressive cracking strength of high strength concrete. Sichuan Build. Sci. 1996, 1, 24–27. [Google Scholar]
  15. Cao, S.Y.; Yang, X.K.; Xu, K.Y. Experimental study on local bearing capacity of reinforced concrete. J. Harbin Univ. Civ. Eng. Archit. 1983, 2, 1–22. [Google Scholar]
  16. Zheng, W.Z.; Zhao, J.W.; Wang, Y.; Zhou, W. Local pressure test of concrete with Acor/Al < 1.35 and Ab extended to side beam. J. Harbin Inst. Technol. 2010, 42, 1536–1542. [Google Scholar]
  17. Zhao, J.W.; Zheng, W.Z. The calculation of the local compressive capacity of prestressed concrete and the configuration of indirect steel bars at the end. Ind. Constr. 2007, 11, 47–52. [Google Scholar]
  18. Gai, L.Q.; Zheng, W.Z.; Li, S. Indepth study on calculation method of local compression bearing capacity of concrete. J. Harbin Inst. Technol. 2021, 53, 1–11. [Google Scholar]
  19. Xiao, Z.M. Study on Local Compression Performance of HRB500 Reinforced Lightweight Aggregate Concrete Members. Master’s Thesis, Suzhou University of Science and Technology, Suzhou, China, 2017. [Google Scholar]
  20. Xiao, Z.M.; Sao, Y.J.; Lao, Y.H.; Zhang, C.Y. Calculation and analysis of local compression capacity of HRB500 reinforced lightweight aggregate concrete members. J. Guangxi Univ. 2018, 43, 103–110. [Google Scholar]
  21. Xiao, Z.M.; Sao, Y.J. Experimental study on local compression performance of HRB500 reinforced lightweight aggregate concrete beam ends. China Concr. Cem. Prod. 2018, 1, 68–72. [Google Scholar]
  22. Miao, T.M.; Yang, J.; Zhou, Y.; Zhan, M.Q.; Wang, B.; Zheng, W.Z. Model for calculating local bearing capacity of concrete with spiral stirrups. Constr. Build. Mater. 2023, 389, 131762. [Google Scholar] [CrossRef]
  23. Miao, T.M.; Zheng, W.Z. Local bearing capacity of concrete under the combined action of pressure force and bond stress. Constr. Build. Mater. 2019, 226, 152–161. [Google Scholar] [CrossRef]
  24. Miao, T.M.; Yang, J.; Zhou, Y.; Sha, L.R.; Zheng, W.Z. Method for calculating local bearing capacity of concrete under bond stress from reinforcement in straight anchor section. Structures 2022, 46, 1796–1807. [Google Scholar] [CrossRef]
  25. Zhou, W.; Hu, H.B. Bearing capacity of steel fiber reinforced reactive powder concrete confined by spirals. Mater. Struct. 2015, 48, 2613–2628. [Google Scholar] [CrossRef]
  26. Wang, L.F.; Wu, H.Q.; Liu, L.; Xiao, Z.W. Enhancement of local concrete compression performance by incorporating ultra-high performance concrete (uhpc) tube. Multidiscip. Model. Mater. Struct. 2022, 18, 856–878. [Google Scholar] [CrossRef]
  27. Li, S.; Zheng, W.Z.; Xu, T.; Wang, Y. Artificial neural network model for predicting the local compression capacity of stirrups-confined concrete. Structures 2022, 41, 943–956. [Google Scholar] [CrossRef]
  28. Li, S.; Zheng, W.Z.; Zhou, W.; Wang, Y. General Prediction Models for Local Bearing Capacity of Concrete. KSCE J. Civ. Eng. 2023, 27, 4865–4875. [Google Scholar] [CrossRef]
  29. Li, S.; Zheng, W.Z.; Zhou, W. Compressive failure mechanism of ultra-high performance concrete with coarse aggregates with orthogonal reinforcements for predicting the bearing capacity: Experimental and numerical investigation. Eng. Fract. Mech. 2024, 298, 109915. [Google Scholar] [CrossRef]
  30. Li, S.; Zheng, W.Z.; Zhou, W.; Wang, Y. Local compression capacity of ultra-high performance concrete containing coarse aggregate: Testing and calculation method. J. Build. Eng. 2023, 76, 107411. [Google Scholar] [CrossRef]
  31. Li, S.; Zheng, W.Z.; Zhou, W.; Jiang, Z.S.; Cui, Y.N. Local compression capacity of steel fiber reinforced ultra-high performance concrete containing coarse aggregate. Compos. Struct. 2023, 318, 117084. [Google Scholar] [CrossRef]
  32. Li, S.; Zheng, W.Z.; Zhou, W.; Jiang, Z.S.; Wang, Y. Experiment and validation of local bearing capacity for reactive powder concrete confned with high strength spirals. Arch. Civ. Mech. Eng. 2022, 22, 40. [Google Scholar] [CrossRef]
  33. Li, H.D.; Zeng, J.; Ahmad, A. A study on improving energy flexibility in building engineering through generalized prediction models: Enhancing local bearing capacity of concrete for engineering structures. Eng. Struct. 2024, 303, 117051. [Google Scholar] [CrossRef]
  34. GB50010-2010; Code for Design of Concrete Structures. China Architecture and Building Press: Beijing, China, 2015.
  35. Post-Tensioning Institute (PTI). Post-Tensioning Manual, 6th ed.; The USA: Post-Tensioning Institute: Phoenix, AZ, USA, 2006. [Google Scholar]
  36. Wu, C.; Su, Y.L.; Chen, T.; Sun, C.J.; Zhang, Z.H. Bearing capacity of post-tensioned concrete local anchorage zones under special bearing plates with multiple bearing surfaces. Eng. Struct. 2025, 335, 120338. [Google Scholar] [CrossRef]
  37. Yan, Y.; Jin, X.; Chang, W.; Wang, J.L.; Zheng, W.Z. Behavior of concrete-filled steel tube columns reinforced with steel-reinforced under local compression. J. Constr. Steel Res. 2025, 234, 109750. [Google Scholar] [CrossRef]
  38. Pohribnyi, V.; Dovzhenko, O.; Kuznietsova, I.; Usenko, D. The improved technique for calculating the concrete elements strength under local compression. MATEC Web Conf. 2018, 230, 02025. [Google Scholar] [CrossRef]
  39. Wei, Y.Y.; Wu, Y.F. Experimental Study of Concrete Columns with Localized Failure. J. Compos. Constr. 2016, 20, 04016032. [Google Scholar] [CrossRef]
  40. Wu, Y.F.; Wei, Y.Y. Stress–Strain Modeling of Concrete Columns with Localized Failure: An Analytical Study. J. Compos. Constr. 2016, 20, 04015071. [Google Scholar] [CrossRef]
  41. Han, L.H.; Liu, W.; Yang, Y.F. Behaviour of concrete-filled steel tubular stub columns subjected to axially local compression. J. Constr. Steel Res. 2008, 64, 377–387. [Google Scholar] [CrossRef]
  42. Ganesh Prabhu, G.; Sundarraja, M.C. Design model for concrete-filled steel tube columns under full and local compression loads. Proc. Inst. Civ. Eng. Struct. Build. 2022, 175, 682–696. [Google Scholar] [CrossRef]
  43. JahanMohammadi, A.; Soltani, M. Toward combined local-average stress field modeling of reinforced concrete. Eng. Struct. 2016, 111, 394–410. [Google Scholar] [CrossRef]
  44. Chang, W.; Zheng, W.Z. A method for calculating the tensile stress of constrained stirrup under peak compressive load in a stirrup constrained concrete column. In Proceedings of the 33rd National Conference on Structural Engineering, Fuxin, China, 18 October 2024; Volume 1, pp. 254–260. [Google Scholar]
  45. Chang, W.; Zheng, W.Z.; Hao, M.J. Analytical models for stress–strain behaviour of UHPC confined with spiral stirrups. Constr. Build. Mater. 2023, 409, 133784. [Google Scholar] [CrossRef]
  46. Chang, W.; Hao, M.J.; Zheng, W.Z. Compressive behavior of UHPC confined by both spiral stirrups and carbon fiber-reinforced polymer (CFRP). Constr. Build. Mater. 2020, 230, 117007. [Google Scholar] [CrossRef]
  47. GB 50107-2010; Standard for Inspection and Assessment of Concrete Strength. Ministry of Housing and Urban-Rural Development of the People's Republic of China. China Architecture and Building Press: Beijing, China, 2010.
  48. GB/T 1499.2-2024; Steel for the Reinforcement of Concrete—Part 2: Hot Rolled Ribbed Bars. Standardization Administration of China. Standards Press of China: Beijing, China, 2024.
  49. Kabir, H.; Wu, J.; Dahal, S.; Joo, T.; Garg, N. Automated estimation of cementitious sorptivity via computer vision. Nat. Commun. 2024, 15, 1–12. [Google Scholar] [CrossRef] [PubMed]
  50. ACI 318-19; Building Code Requirements for Structural Concrete. American Concrete Institute: Farmington Hills, MI, USA, 2019.
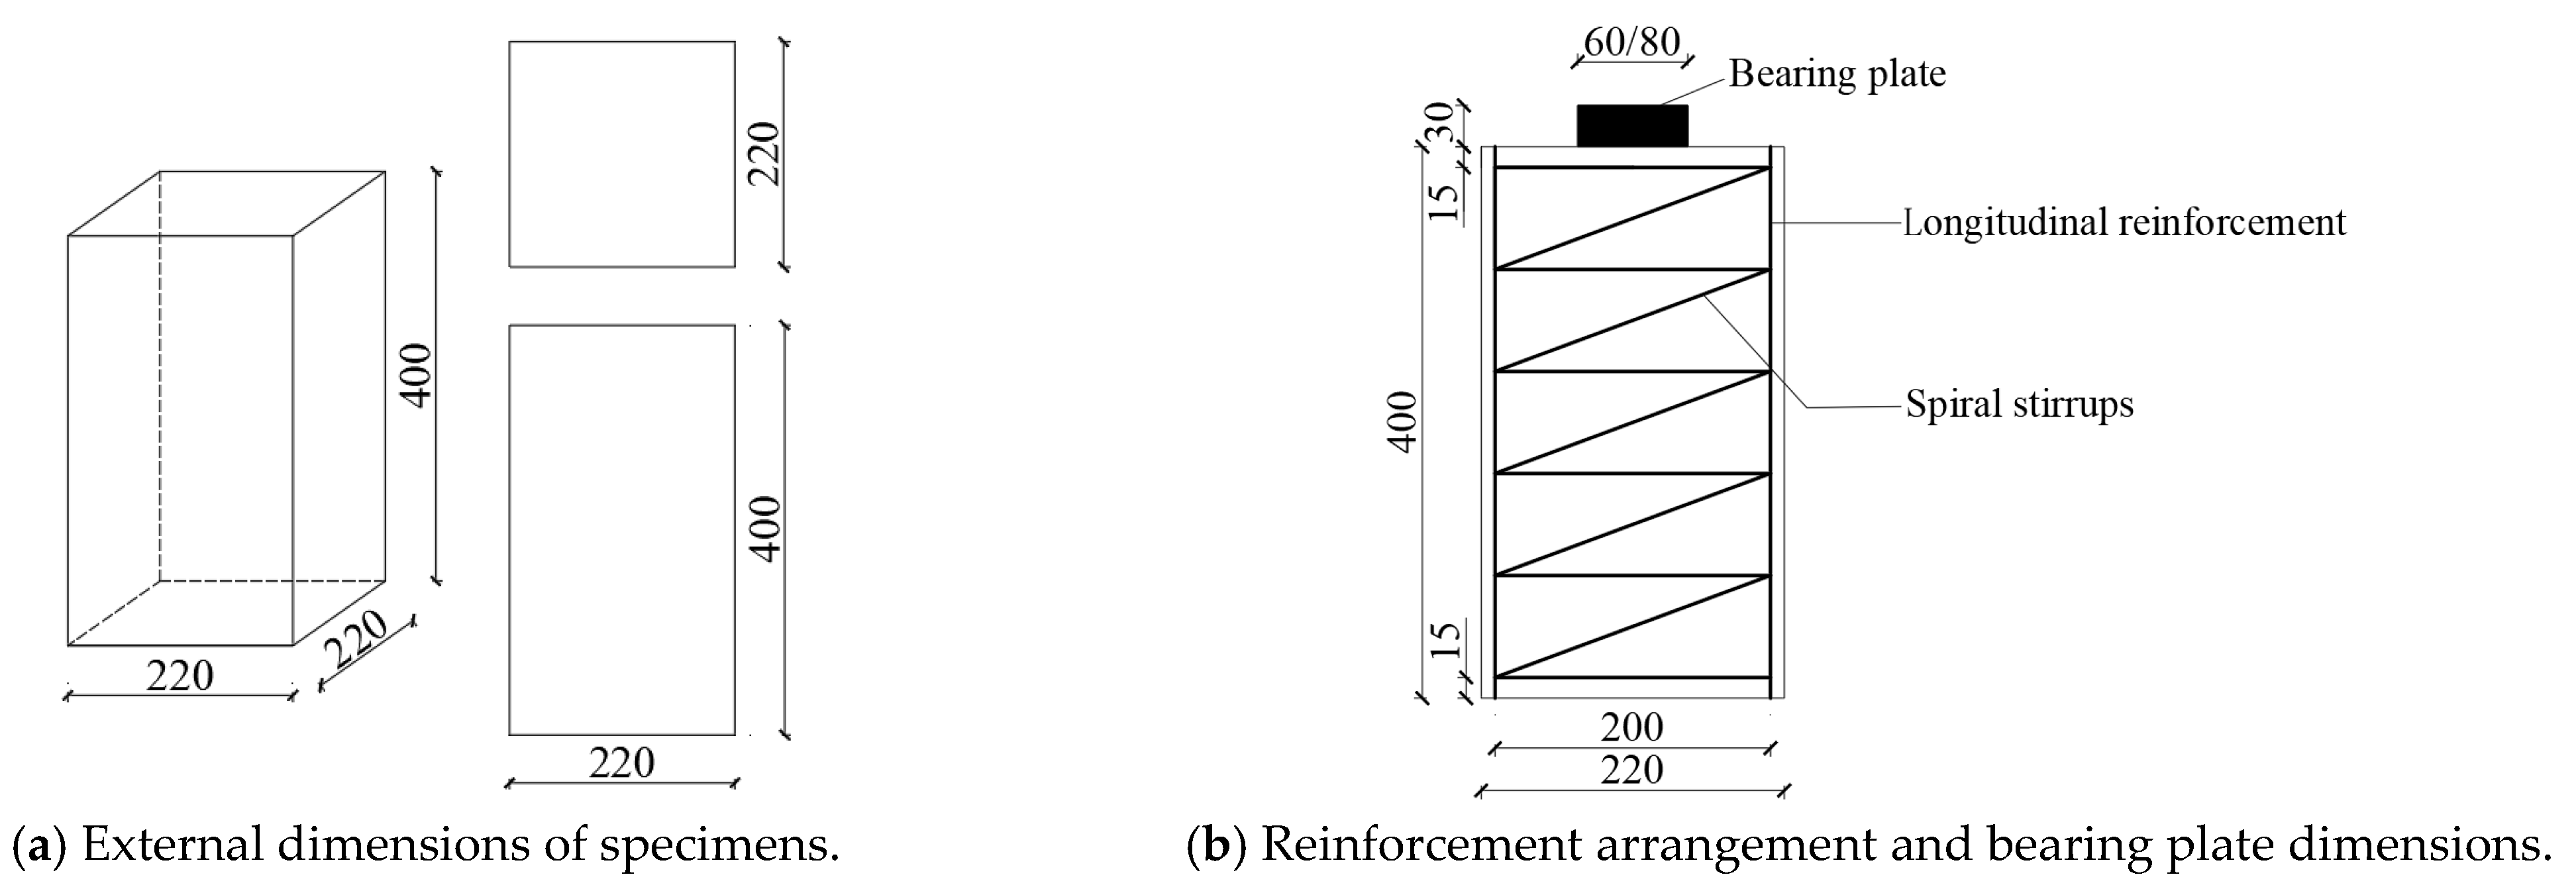
Figure 1. Geometric dimensions and reinforcement arrangement (mm).
Buildings 15 03290 g001
Figure 2. Arrangement of strain gauges (mm).
Buildings 15 03290 g002
Figure 3. Molds and the spiral stirrups for specimen.
Buildings 15 03290 g003
Figure 4. Scene of specimens after casting.
Buildings 15 03290 g004
Figure 5. Specimens after form removal.
Buildings 15 03290 g005
Figure 6. Flowchart of specimen fabrication.
Buildings 15 03290 g006
Figure 7. Arrangement of displacement meters.
Buildings 15 03290 g007
Figure 8. Stress distribution for specimen.
Buildings 15 03290 g008
Figure 9. Crushing failure.
Buildings 15 03290 g009aBuildings 15 03290 g009b
Figure 10. Tensile failure.
Buildings 15 03290 g010aBuildings 15 03290 g010bBuildings 15 03290 g010c
Figure 11. Typical specimen load–deformation curves.
Buildings 15 03290 g011
Figure 12. Effect of ρvfy on Fl.
Buildings 15 03290 g012
Figure 13. Effect of fcg on Fl.
Buildings 15 03290 g013
Figure 14. Data and fitting surface of Equation (4) [15,16,19].
Buildings 15 03290 g014
Figure 15. The relationship between the experimental data and Equation (4), the code values.
Buildings 15 03290 g015
Table 1. Detailed specimen parameters for specimens.
SpecimensAcor/AlSection Width
/mm
Plate Width 2a
/mm
Spiral StirrupsSpecimensAcor/AlSpecimen Width
/mm
Plate Width 2a
/mm
Spiral Stirrups
d @ s
/mm
ρvd @ s
/mm
ρv
C30-4.15-d8-14.15220808@800.014C40-4.15-d8-214.15220808@800.014
C30-4.15-d8-24.15220808@600.018C40-4.15-d8-224.15220808@600.018
C30-4.15-d8-34.15220808@400.027C40-4.15-d8-234.15220808@400.027
C30-4.15-d8-44.15220808@300.036C40-4.15-d8-244.15220808@300.036
C30-4.15-d8-54.15220808@200.055C40-4.15-d8-254.15220808@200.055
C30-7.39-d8-67.39220608@800.014C40-7.39-d8-267.39220608@800.014
C30-7.39-d8-77.39220608@600.018C40-7.39-d8-277.39220608@600.018
C30-7.39-d8-87.39220608@400.027C40-7.39-d8-287.39220608@400.027
C30-7.39-d8-97.39220608@300.036C40-7.39-d8-297.39220608@300.036
C30-7.39-d8-107.39220608@200.055C40-7.39-d8-307.39220608@200.055
C30-4.34-d8-114.34220806@800.008C50-4.15-d8-314.15220808@800.014
C30-4.34-d8-124.34220806@600.010C50-4.15-d8-324.15220808@600.018
C30-4.34-d8-134.34220806@400.015C50-4.15-d8-334.15220808@400.027
C30-4.34-d8-144.34220806@300.020C50-4.15-d8-344.15220808@300.036
C30-4.34-d8-154.34220806@200.031C50-4.15-d8-354.15220808@200.055
C30-7.71-d8-167.71220606@800.008C50-7.39-d8-367.39220608@800.014
C30-7.71-d8-177.71220606@600.020C50-7.39-d8-377.39220608@600.018
C30-7.71-d8-187.71220606@400.015C50-7.39-d8-387.39220608@400.027
C30-7.71-d8-197.71220606@300.020C50-7.39-d8-397.39220608@300.036
C30-7.71-d8-207.71220606@200.031C50-7.39-d8-407.39220608@200.055
Table 2. Mix proportions of concrete.
fcg (MPa)Type of CementMaterial Consumption (kg/m3)Water–Binder Ratio
mw/mc
Sand–Stone Ratio
ms/mg
Water
mw
Cement
mc
Sand
ms
Stone
mg
C30P·O 42.519040061511950.4834%
C40P·O 42.517043061011800.4034%
C50P·O 42.515543061711980.3634%
Table 3. Mechanical properties of concrete.
fcg (MPa)fcu,m/MPafc,m/MPafc,k/MPaft,k/MPa
C3039.9430.3517.841.93
C4048.5436.8923.632.25
C5059.0844.9034.222.76
Note: The standard value of concrete axial compressive strength fc,k and the standard value of the axial tensile strength of concrete ft,k were calculated according to Code for Design of Concrete Structures GB 50010-2010.
Table 4. Mechanical performance of reinforcement.
Typed/mmfy/MPafu/MPaEs/GPa
HRB4006459635210
8445620210
Table 5. Experimental values Fl; calculated values Nu, θc; and failure mode.
Specimenfc,k/
MPa
βlαfy/
MPa
βcorNu/kNFl/kNθcFailure Mode
C30-4.15-d8-117.842.75 1.00 4452.038 472.45 797.00 1.69 Tensile failure
C30-4.15-d8-217.842.75 1.00 4452.038 525.27 975.00 1.86 Tensile failure
C30-4.15-d8-317.842.75 1.00 4452.038 630.91 1063.00 1.68 Tensile failure
C30-4.15-d8-417.842.75 1.00 4452.038 736.56 1327.00 1.80 Crushing failure
C30-4.15-d8-517.842.75 1.00 4452.038 947.85 1481.00 1.56 Crushing failure
C30-7.39-d8-617.843.67 1.00 4452.717 354.34 604.00 1.70 Tensile failure
C30-7.39-d8-717.843.67 1.00 4452.717 393.95 760.00 1.93 Tensile failure
C30-7.39-d8-817.843.67 1.00 4452.717 473.19 822.00 1.74 Tensile failure
C30-7.39-d8-917.843.67 1.00 4452.717 552.42 898.00 1.63 Crushing failure
C30-7.39-d8-1017.843.67 1.00 4452.717 710.88 1007.00 1.42 Crushing failure
C30-4.34-d8-1117.842.75 1.00 4452.082 403.12 714.00 1.77 Tensile failure
C30-4.34-d8-1217.842.75 1.00 4592.082 436.57 730.00 1.67 Tensile failure
C30-4.34-d8-1317.842.75 1.00 4592.082 497.87 860.00 1.73 Tensile failure
C30-4.34-d8-1417.842.75 1.00 4592.082 559.16 898.00 1.61 Crushing failure
C30-4.34-d8-1517.842.75 1.00 4592.082 681.75 1124.00 1.65 Crushing failure
C30-7.71-d8-1617.843.67 1.00 4592.776 304.44 605.00 1.99 Tensile failure
C30-7.71-d8-1717.843.67 1.00 4592.776 327.43 623.00 1.90 Tensile failure
C30-7.71-d8-1817.843.67 1.00 4592.776 373.40 685.00 1.83 Crushing failure
C30-7.71-d8-1917.843.67 1.00 4592.776 419.37 779.00 1.86 Crushing failure
C30-7.71-d8-2017.843.67 1.00 4592.776 511.31 840.00 1.64 Crushing failure
C40-4.15-d8-2123.63 2.75 1.00 4452.038 574.27 974.30 1.70 Tensile failure
C40-4.15-d8-2223.63 2.75 1.00 4452.038 627.09 1084.00 1.73 Tensile failure
C40-4.15-d8-2323.63 2.751.00 4452.038732.74 1207.00 1.65 Tensile failure
C40-4.15-d8-2423.63 2.751.00 4452.038838.38 1363.00 1.63 Crushing failure
C40-4.15-d8-2523.63 2.751.00 4452.0381049.67 1528.50 1.46 Crushing failure
C40-7.39-d8-2623.63 3.671.00 4452.717430.70 743.90 1.73 Tensile failure
C40-7.39-d8-2723.63 3.671.00 4452.717470.32 776.50 1.65 Tensile failure
C40-7.39-d8-2823.63 3.671.00 4452.717549.55 897.20 1.63 Tensile failure
C40-7.39-d8-2923.63 3.671.00 4452.717628.78 1012.00 1.61 Crushing failure
C40-7.39-d8-3023.63 3.671.00 4452.717787.25 1236.00 1.57 Crushing failure
C50-4.15-d8-3134.222.750.98 4452.038760.74 888.00 1.17 Tensile failure
C50-4.15-d8-3234.222.750.98 4452.038813.56 1120.00 1.38 Tensile failure
C50-4.15-d8-3334.222.750.98 4452.038919.20 1244.00 1.35 Tensile failure
C50-4.15-d8-3434.222.750.98 4452.0381024.85 1338.00 1.31 Crushing failure
C50-4.15-d8-3534.222.750.98 4452.0381236.13 1485.00 1.20 Crushing failure
C50-7.39-d8-3634.223.670.98 4452.717570.55 684.00 1.20 Tensile failure
C50-7.39-d8-3734.223.670.98 4452.717610.17 871.00 1.43 Tensile failure
C50-7.39-d8-3834.223.670.98 4452.717689.40 872.00 1.26 Crushing failure
C50-7.39-d8-3934.223.670.98 4452.717768.63 969.50 1.26 Crushing failure
C50-7.39-d8-4034.223.670.98 4452.717927.10 1123.00 1.21 Crushing failure
Table 6. Effect of Acor/Al on Fl.
SpecimensReduction Rate of FlSpecimensReduction Rate
of Fl
SpecimensReduction Rate
of Fl
SpecimensReduction Rate
of Fl
C30-4.15-d8-124.2%C30-4.34-d6-1115.3%C40-4.15-d8-2123.6%C50-4.15-d8-3123.0%
C30-7.39-d8-6C30-7.71-d6-16C40-7.39-d8-26C50-7.39-d8-36
C30-4.15-d8-222.1%C30-4.34-d6-1214.7%C40-4.15-d8-2228.4%C50-4.15-d8-3222.2%
C30-7.39-d8-7C30-7.71-d6-17C40-7.39-d8-27C50-7.39-d8-37
C30-4.15-d8-322.7%C30-4.34-d6-1320.3%C40-4.15-d8-2325.7%C50-4.15-d8-3329.9%
C30-7.39-d8-8C30-7.71-d6-18C40-7.39-d8-28C50-7.39-d8-38
C30-4.15-d8-432.3%C30-4.34-d6-1413.3%C40-4.15-d8-2422.3%C50-4.15-d8-3427.5%
C30-7.39-d8-9C30-7.71-d6-19C40-7.39-d8-29C50-7.39-d8-39
C30-4.15-d8-523.8%C30-4.34-d6-1525.3%C40-4.15-d8-2519.1%C50-4.15-d8-3524.4%
C30-7.39-d8-10C30-7.71-d6-20C40-7.39-d8-30C50-7.39-d8-40
Table 7. Calculation values of Equation (4) Nu′ and θ values.
SpecimensNu′/kNθSpecimensNu′/kNθSpecimensNu′/kNθSpecimensNu′/kNθ
C30-4.15-d8-1863.58 0.92 C30-4.34-d8-11732.85 0.97 C40-4.15-d8-21909.44 1.07 C50-4.15-d8-31993.33 0.89
C30-4.15-d8-2944.85 1.03 C30-4.34-d8-12784.53 0.93 C40-4.15-d8-22988.62 1.10 C50-4.15-d8-321068.69 1.05
C30-4.15-d8-31110.48 0.96 C30-4.34-d8-13894.03 0.96 C40-4.15-d8-231149.55 1.05 C50-4.15-d8-331221.02 1.02
C30-4.15-d8-41252.26 1.06 C30-4.34-d8-14995.70 0.90 C40-4.15-d8-241286.63 1.06 C50-4.15-d8-341349.50 0.99
C30-4.15-d8-51473.26 1.01 C30-4.34-d8-151175.54 0.96 C40-4.15-d8-251497.71 1.02 C50-4.15-d8-351542.42 0.96
C30-7.39-d8-6663.87 0.91 C30-7.71-d8-16586.63 1.03 C40-7.39-d8-26691.47 1.08 C50-7.39-d8-36741.95 0.92
C30-7.39-d8-7715.81 1.06 C30-7.71-d8-17614.70 1.01 C40-7.39-d8-27742.74 1.05 C50-7.39-d8-37792.01 1.10
C30-7.39-d8-8827.21 0.99 C30-7.71-d8-18683.16 1.00 C40-7.39-d8-28852.66 1.05 C50-7.39-d8-38899.21 0.97
C30-7.39-d8-9931.07 0.96 C30-7.71-d8-19749.13 1.04 C40-7.39-d8-29955.03 1.06 C50-7.39-d8-39998.86 0.97
C30-7.39-d8-101125.54 0.89 C30-7.71-d8-20873.65 0.96 C40-7.39-d8-301146.37 1.08 C50-7.39-d8-401184.45 0.95
Table 8. Parameters of specimens reported in references.
No.Acor/AlAl/mm2fc,k/MPafy/MPaρvs/mmFl/kNNu′/kNαcReferences
16.2580 × 8022.46254.70.03818829.01050.12 0.79 [15]
26.2580 × 8019.2254.70.04316909.01078.32 0.84
36.2580 × 8024.23254.70.04914960.01170.70 0.82
411.1160 × 6029233.40.01740589.0650.53 0.91
511.1160 × 6028.5233.40.02133669.0675.85 0.99
611.1160 × 6025.6233.40.02627620.0696.15 0.89
711.1160 × 6018.83233.40.0323620.0691.25 0.90
811.1160 × 6025.7233.40.03420660.0750.27 0.88
911.1160 × 6026.7233.40.03818710.0781.07 0.91
1011.1160 × 6025.5233.40.04316800.0807.75 0.99
1111.1160 × 6026.9233.40.04615809.0833.03 0.97
1211.1160 × 6018.43233.40.04615700.0795.11 0.88
1311.1160 × 6019.99233.40.04914805.0821.12 1.02
1411.1160 × 6018.75233.40.05313700.0840.71 0.87
152.78210 × 21034.81263.00.017502336.02221.66 1.03[16]
162.78210 × 21034.81263.00.019502315.02086.60 1.02
174.24170 × 17036.48263.00.021502102.02088.751.05
184.24170 × 17036.48263.00.024501988.02041.490.98
194.24170 × 17036.48263.00.031502001.01857.830.95
2010.12110 × 11055.48394.00.031501720.01836.370.99[19]
2110.12110 × 11048.18394.00.027501400.01746.590.87
227.25130 × 13047.18394.00.024502050.01922.941.11
235.44150 × 15045.64394.00.027502100.01834.231.00
247.25130 × 13047.18394.00.031501950.01865.140.99
Disclaimer/Publisher’s Note: The statements, opinions and data contained in all publications are solely those of the individual author(s) and contributor(s) and not of MDPI and/or the editor(s). MDPI and/or the editor(s) disclaim responsibility for any injury to people or property resulting from any ideas, methods, instructions or products referred to in the content.