Article

Damage Identification and Safety Threshold During the Construction and Operation Phases of Cast-in-Place Continuous Rigid Frame Bridges

1
School of Civil Engineering and Architecture, Zhongyuan Institute of Science and Technology, Zhengzhou 450000, China
2
College of Civil Engineering, Chongqing University, Chongqing 400045, China
*
Author to whom correspondence should be addressed.
Buildings 2025, 15(18), 3282; https://doi.org/10.3390/buildings15183282
Submission received: 24 July 2025 / Revised: 2 September 2025 / Accepted: 8 September 2025 / Published: 11 September 2025
(This article belongs to the Section Building Structures)

Abstract

This paper presents an analysis of the mechanical characteristics of bridge structures during both construction and operation phases, with a focus on stress distribution patterns and the impact of vehicle loads on structural safety. The monitoring during the construction phase indicates that the compressive stress of the main beam segments is mainly controlled by prestress, and the maximum compressive stress meets the specification requirements; the maximum tensile stress of the main beam occurs in the stage when the tension reinforcement of the top pier is under stress, and the tensile stress value is within the allowable range of the specification. Under the negative bending moment of the pier top, the tensile stress at the upper edge reaches the peak simultaneously with the pre-pressurization stress. In contrast, the tensile stress at the mid-span joint transfers to the lower edge, and the corresponding bending moment significantly decreases. Based on the maximum tensile stress theory, when the stress of the structure caused by the earthquake wave reaches the ultimate tensile strength of the concrete, it is prone to cause structural damage. Therefore, it is necessary to limit the vehicle weight and driving speed to reduce the vibration impact. According to the “Regulations on the Management of Over-limit Transport Vehicles on Highways” issued by the Ministry of Transport (the total designed load shall not exceed 55 tons), after calculation, it is known that the maximum allowable driving speed of a 60-ton vehicle is 81.4 km per hour, which exceeds the safety limit of the specification. The research shows that in actual operation, the driving speed needs to be dynamically controlled according to the vehicle weight to ensure the long-term safety and durability of the bridge structure.

1. Introduction

Research on damage identification under the dynamic load of a bridge through theoretical analysis of the impact of vibration loads and vibration waves caused by different vehicle loads on the bridge floor concrete explores the mechanism of the tensile strength of concrete caused by vibration waves and cracks [1,2]. The problem of concrete cracking caused by traffic loads was solved [3,4]. The construction of a bridge’s superstructure mainly adopts the cantilever pouring method (hanging basket method), full bracket cast-in-place method, suspension splicing method, and other construction technologies [5]. Among the different construction techniques for continuous rigid frame bridges, scholars use the continuous box girder construction method [6]. This study focuses on the construction quality control of continuous rigid frame bridges [7]. Based on the new prefabricated steel truss–concrete composite structure system [8], it mainly analyzes the deformation mechanism and structural stability characteristics during the construction stage. Through the implementation of the high-altitude bracket method, the influence laws of different bracket schemes were systematically compared [9]. By using numerical simulation and field measurement data, the deformation law in the construction process of the bridge is analyzed comprehensively, and the millimeter-level control standard is established [10,11]. According to the concrete bridge project, different construction methods for rigid frame bridge side spans are analyzed [12], the key construction technology of increasing benefit and reducing time limit is put forward [13], and the effective application of the hanger method to engineering construction is studied [14]. The key technology of the continuous rigid frame bridge of a large bridge is applied to study the stress distribution and stability rule of bridge piers under multiple working conditions [15]. The coupled vibration model considering the synergistic effect of vehicle–bridge–road surface is established [16]. Tests show that when a 40-ton heavy-duty vehicle passes over a simply supported beam bridge at 60 km/h, the peak vibration of the bridge body reaches 0.8 g [17]. The dynamic stress of the bridge floor decreases by 12% when the wheelbase increases by 1 m [18]. Through a shaking table test, we verified that the resonance caused by frequency matching can shorten the fatigue life of concrete by 40%. According to the Eurocode standard, a vehicle overloaded by 30% can generate a 45% increase in dynamic stress. DOT research shows that when an 80-ton heavy truck passes over a steel bridge, the stress concentration coefficient at the weld is increased to 2.3 [19,20]. Using ultrasonic detection technology, it is found that the attenuation rate of the vibration wave at the crack is exponentially related to the width of the crack. It is confirmed by a CT scan that a 0.1 mm microcrack can reduce the dynamic modulus of concrete by 18%. Based on 2 million cyclic loading tests, the concrete damage evolution equation is proposed. The coupling model of temperature–humidity–vibration is established, and it proves that the tensile strength of concrete decreases by 15% and the crack propagation rate increases by 30% at high temperatures in summer. By integrating Beidou positioning (5 mm accuracy), UAV infrared imaging, and fiber Bragg grating sensing, the response time of damage identification is reduced to 30 s [21].
The current research mainly focuses on the theoretical model construction and the damage recognition algorithm. Domestic scholars established a three-dimensional vehicle–bridge coupling model considering road roughness based on ANSYS 16.0 and found that when a 40-ton truck passes at 60 km/h, the peak tensile stress of the bridge deck concrete increases by 45% compared with the static load. In foreign research, fiber grating sensors are used to monitor the propagation characteristics of vibration waves. The identification accuracy for 0.1 mm cracks is 92% [22]. To fill the gap in the literature on the role of bridge piers in the seismic vulnerability of bridges, this paper uses the ANSYS 16.0 software for three-dimensional numerical simulation to study the seismic performance of three single-span bridges. It takes into account the interaction between the soil and the structure, the nonlinear characteristics of the soil, and modeling uncertainties. The deformation capacity of the bridge is explored through the limit state of longitudinal bridge deck displacement. It was found that the failure caused by the settlement of the scaffolding under the constant load was the key reason. The research results have significant reference value for the structural engineering community [23,24,25]. However, the analysis of multi-vehicle coupling vibration, nonlinear material response, and long-term cumulative effect is still not perfect. The hybrid monitoring technology was developed according to the standard, and a damage prediction system for the vehicle–road–bridge synergy effect was constructed.
Therefore, this paper studies the bridge in combination with actual engineering cases. At the same time, the vibration loads generated by vehicles with different loads passing through the bridge are studied through theory and field measurement. Through theoretical research, this study establishes safety velocity thresholds for vehicles with varying loads crossing bridges. The findings not only accelerate construction progress but also advance the development of continuous rigid frame bridges. While shortening construction periods, the research provides valuable references for identifying operational damage in bridge structures. For the first time, this paper constructs a multi-factor coupling analysis framework encompassing “vehicle–bridge–environment–structural performance”, driving the evolution of prestressed concrete bridge design from “load-bearing capacity control” to “dynamic performance regulation”. The innovation manifests in four key aspects: (1) revealing the nonlinear coupling mechanism between heavy-duty high-speed vehicles and bridge dynamic responses; (2) proposing performance-based design and traffic coordination management methods grounded in vibration principles; (3) enhancing the optimized application of prestressing technology in complex load-bearing zones; (4) promoting dynamic and scenario-based calibration of design safety factors. This research enriches the dynamic theory of large-span prestressed bridges, provides systematic solutions for the design, evaluation, and management of high-toughness intelligent bridges, and holds significant value for improving the safety, durability, and sustainability of China’s bridge engineering.

2. Project Overview

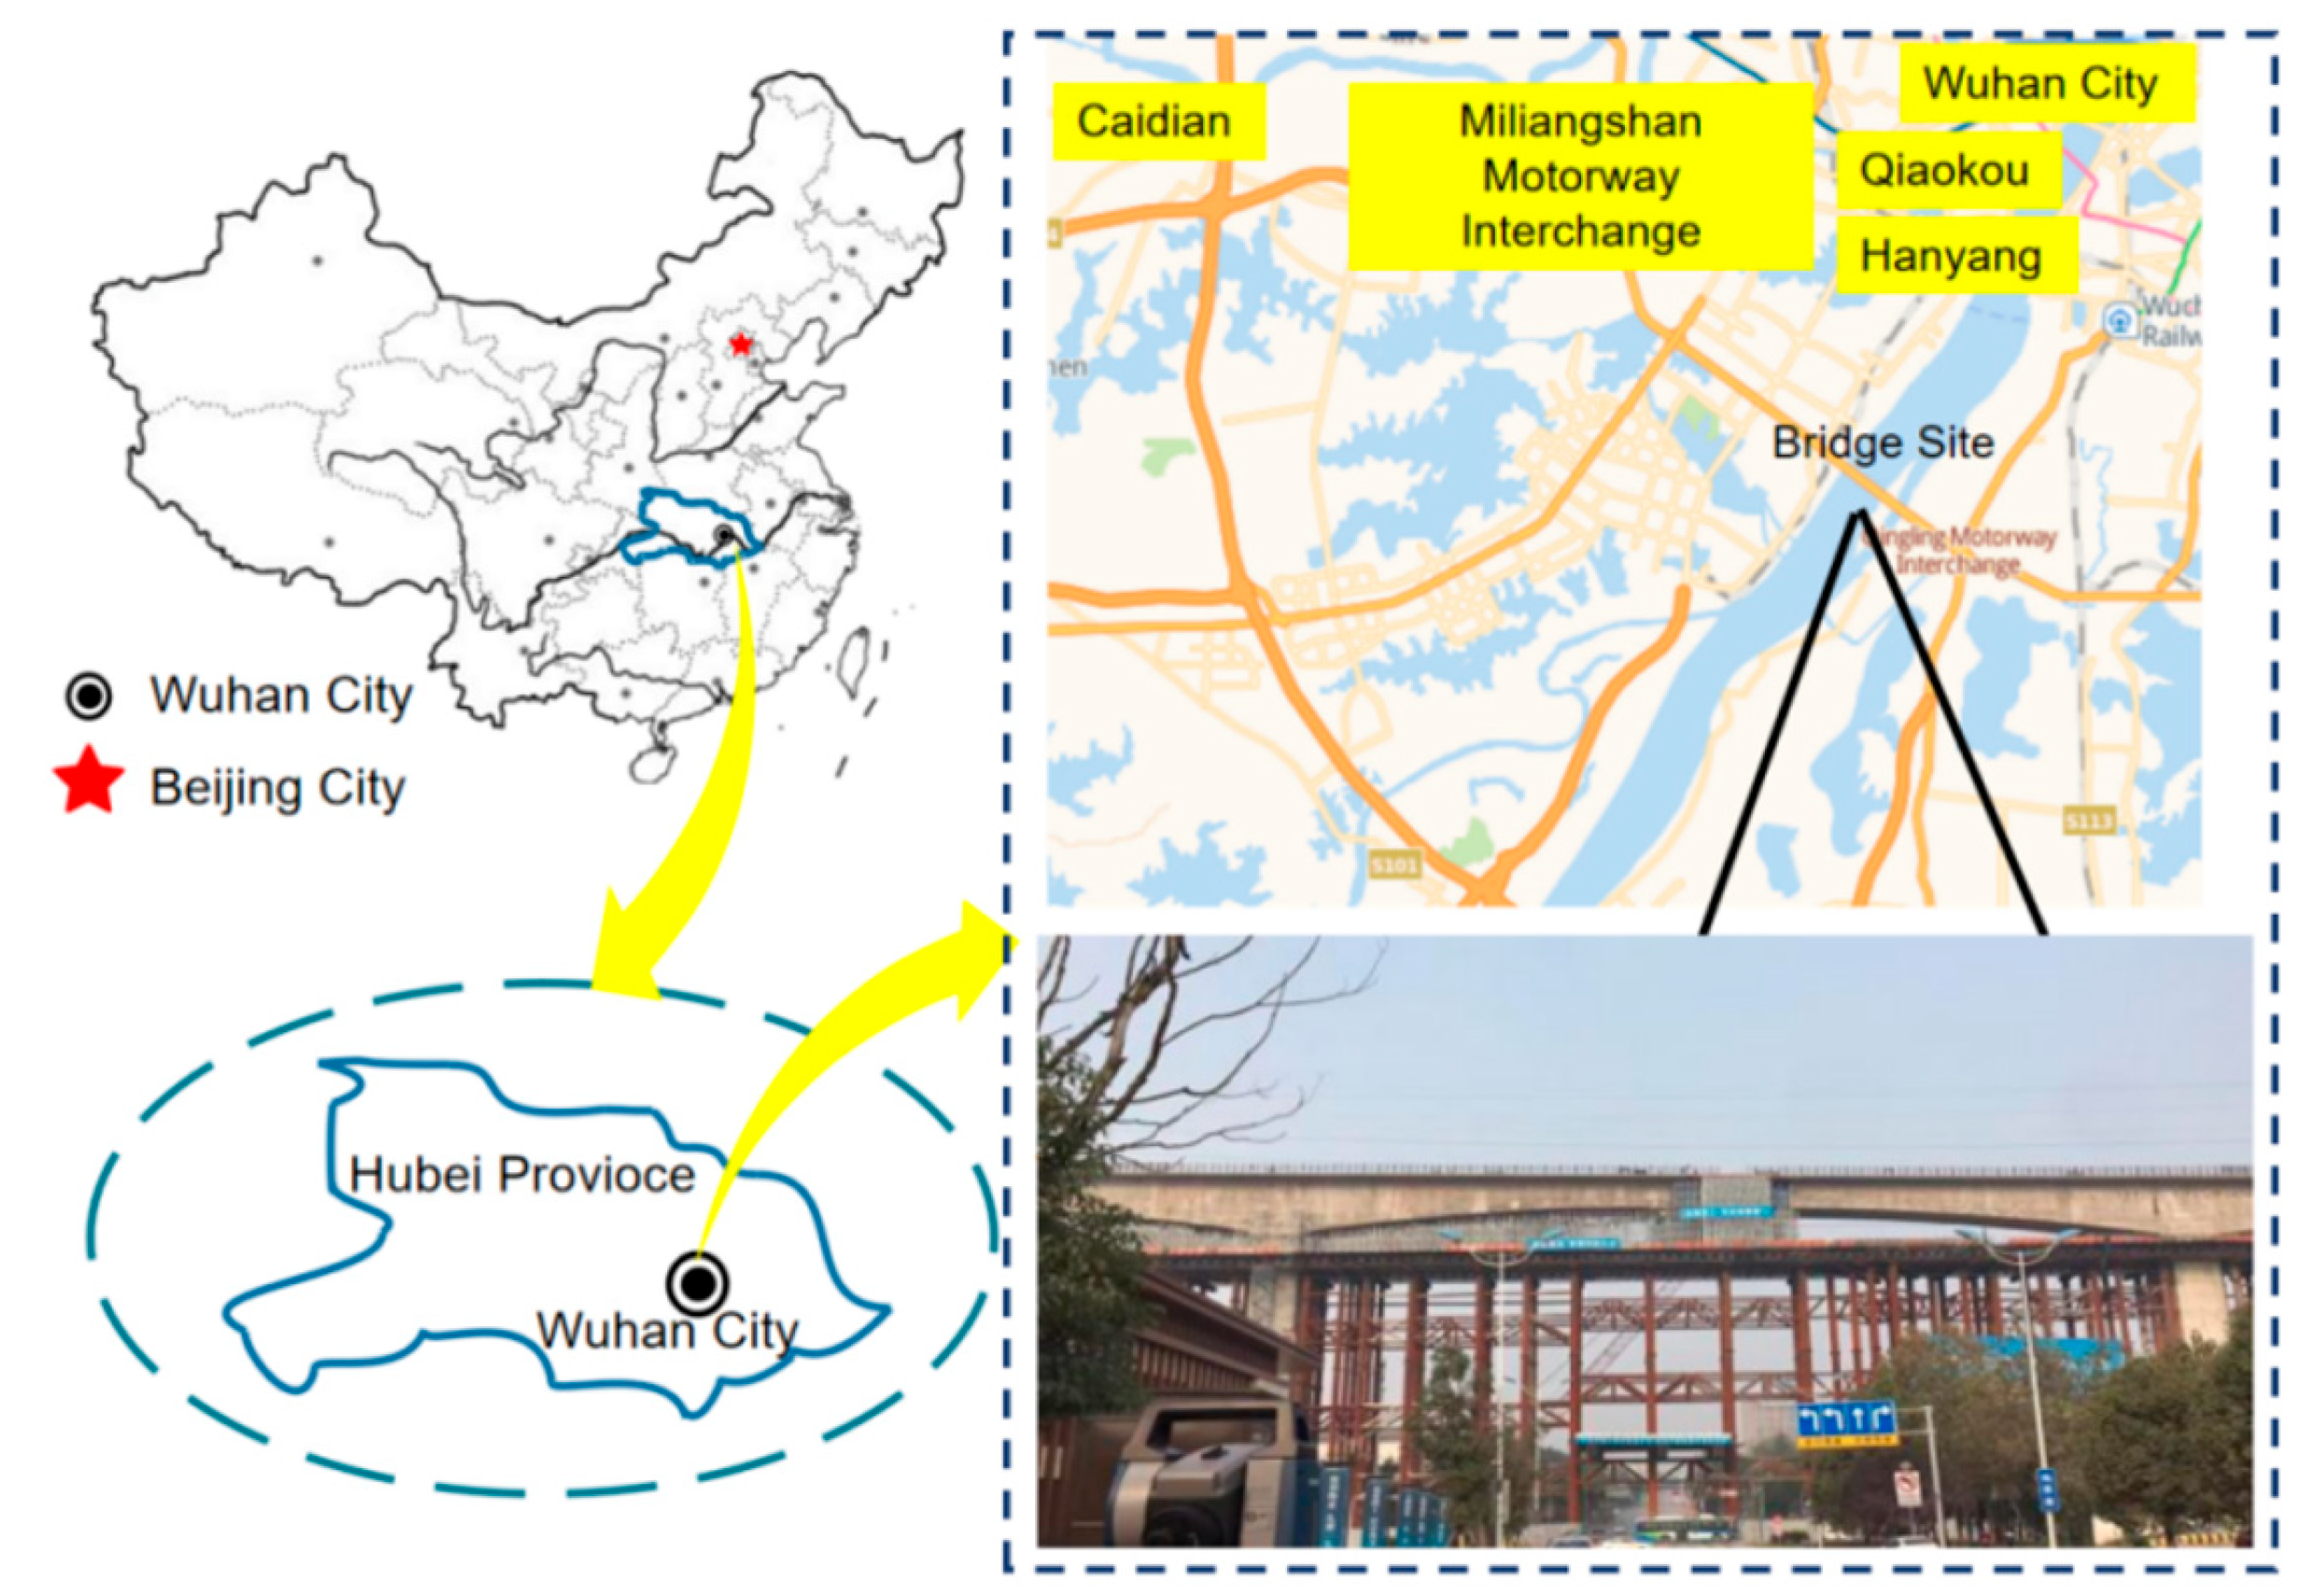
To speed up the economic development of the surrounding areas of Wuhan and strengthen the connection between Jiangjin and the main city, the district government specially built the suburban railway (rail transit extension line). The total length of the line is about 28.229 km, of which the elevated line is about 18.971 km, accounting for 67.2 percent. The main span of the QJ04 D28-D31 continuous rigid frame bridge is arranged as (69.9 + 120 + 69.9) m. The bottom plate, web plate, and top plate are partially thickened on the inside, and all change according to the broken line. The width of the bridge floor is 10.5 m, the total length of the beam is 259.8 m, and the calculated span is 69.45 + 120 + 69.45 m. The beam height at the center line of the middle fulcrum section is 8.5 m, and the location and the bridge model are shown in Figure 1.
The continuous rigid frame bridge adopts the large cantilever integral cast-in-place construction technology, which is different from the conventional bridge (using hanging basket construction method) in tensioning the prestressed tendons. The cast-in-place beams with support can only be cast in long sections and reach a certain strength after the prestressed tendons are tensioned, and the steel strand is anchored inside the box type. The beam of hanging basket casting can be tensioned after each segment is poured and formed, and the steel strand is anchored in the web section.

3. Establishment and Analysis of Numerical Simulation

3.1. Establishment of Numerical Model

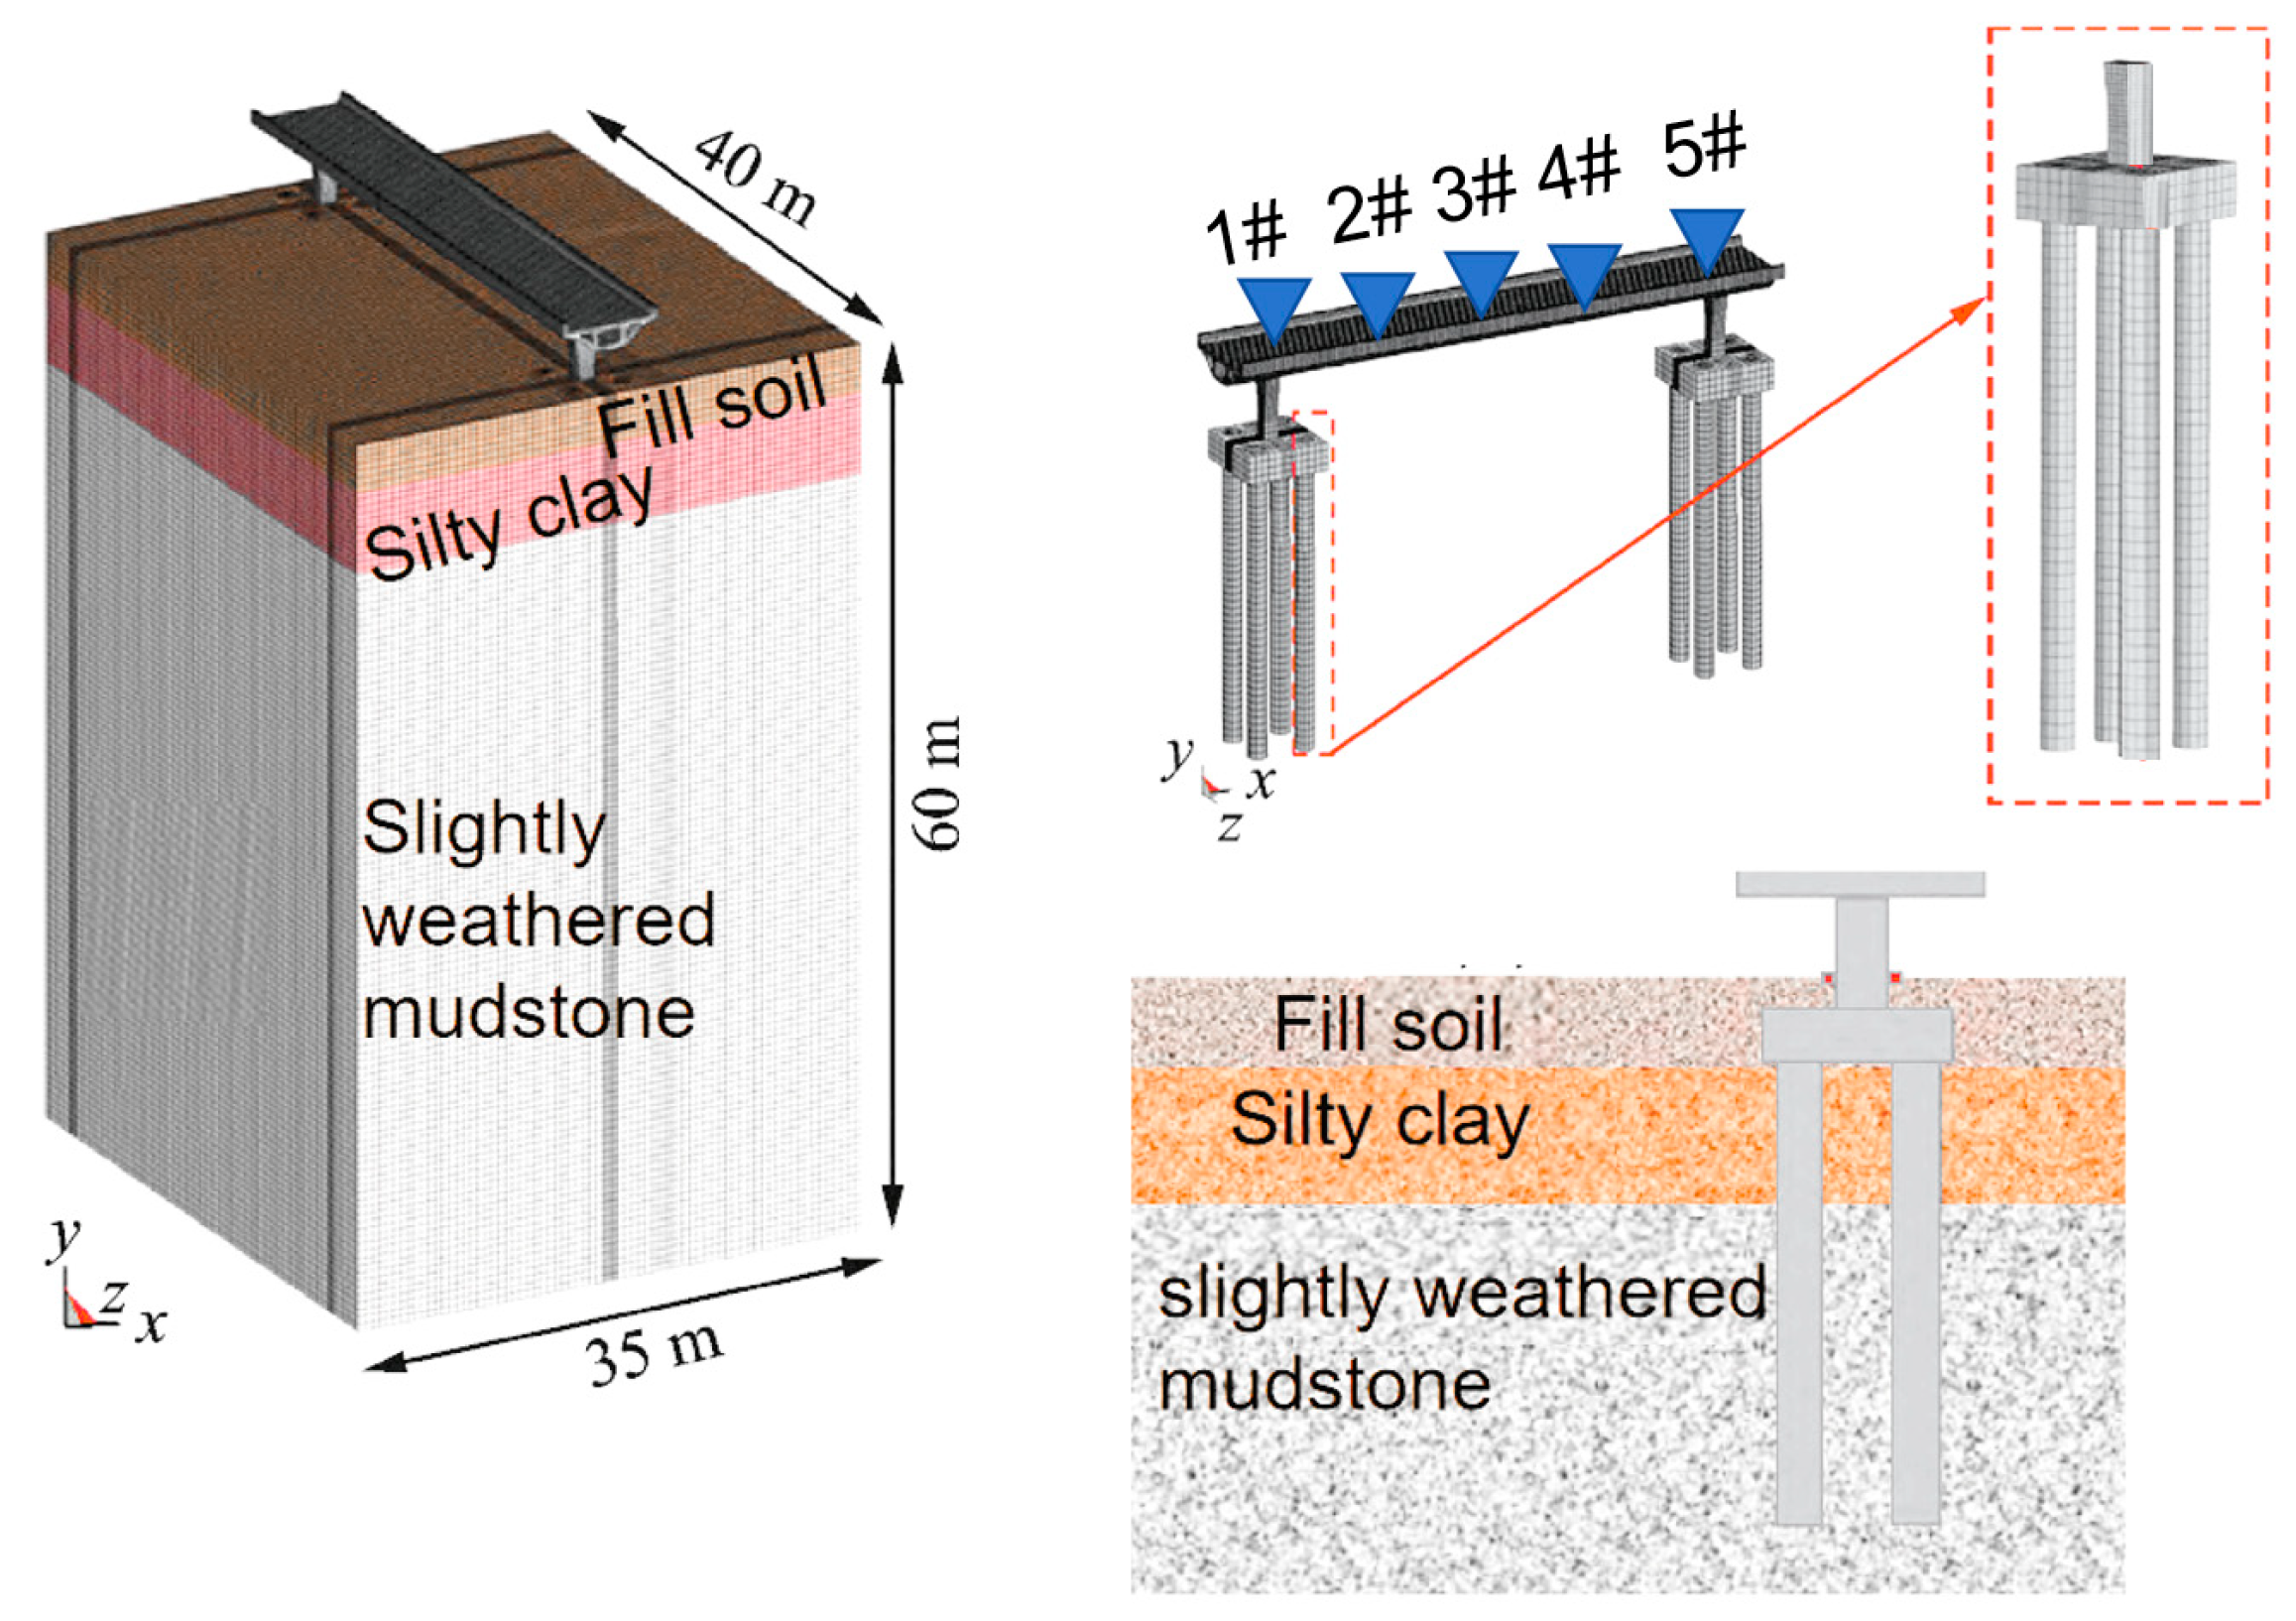
To analyze the mechanical properties of the cast-in-place prestressed beams, we used the Midas Civil 2020 software to establish a finite element model (as shown in Figure 2). The entire project was achieved through rigid connections to ensure overall coordinated operation. Specific parameters are detailed in Table 1. Through parametric modeling, the influence laws of the prestress effect on the deflection deformation and crack resistance performance of the structure were evaluated. This area does not belong to the high seismic risk zone. Although geological discontinuities such as faults, joints, and fractures are not explicitly modeled, the macro-mechanical effects of geological conditions on the superstructure can be effectively reflected by reasonably setting equivalent support boundary conditions (especially elastic spring supports) and applying forced displacement/earthquake inputs. This method not only aligns with engineering design conventions but also ensures accurate prediction of displacement and crack resistance performance of cast-in-place prestressed beams. The constitutive relationships of structural materials are selected based on actual engineering material characteristics. For concrete main beams, a linear elastic constitutive model is adopted, while prestressed steel strands and ordinary rebars are treated as ideal elastoplastic materials with an elastic modulus of 2.0 × 10⁵ MPa, yield strength values according to design specifications, and a Poisson’s ratio of 0.3. Boundary conditions are simulated based on actual support arrangements: elastic connections simulate the vertical and lateral stiffness of plate rubber bearings between piers and main beams, fixed supports constrain three translational degrees of freedom, movable supports release only the longitudinal displacement degree, and corresponding constraints are set at abutments to reflect actual boundary states. Spatial discretization employs beam–column elements (Beam–Column Element) for modeling main beams, piers, and cross girders. The entire bridge is divided into multiple beam elements, with local densification of element lengths based on structural geometry and load application locations to ensure accuracy in stress concentration areas. Mesh refinement has been validated through convergence analysis to meet computational precision requirements. The finite element model developed using the material properties, boundary conditions, and mesh configurations effectively captures the stress characteristics and deformation patterns of bridge structures under vehicular loads, providing a reliable foundation for subsequent dynamic response and fatigue analysis. In the Midas Civil 2020 software, dynamic vehicle loading effects are implemented through the “Moving Load Analysis” module, which combines influence line loading with time-history analysis. During modeling, wheel loads are applied node by node along the lane path based on vehicle axle weight, wheelbase, and speed parameters. Dynamic amplification coefficients are incorporated to account for vibration effects during actual traffic flow, enabling accurate simulation of dynamic responses in the bridge deck system during vehicle movement across different time steps.

3.2. Numerical Model Validation

According to Figure 2, we set up a vertical displacement monitoring point at the bottom of the bridge pier and conducted statistical analysis on the on-site measurement data of the monitoring point. After the bridge is completed and put into operation, a 30-ton vehicle will be driven at a speed of 30 km/h, and the on-site monitoring data and numerical simulation data will be statistically analyzed. Based on the data comparison and analysis in Table 2, the numerical simulation results are highly consistent with the on-site measurement values, with the error range controlled within 10%. The data fluctuation range of each monitoring point is relatively small. This phenomenon can be attributed to the discontinuous geological features in the soil medium, such as joints and cracks, that exist in actual engineering. However, in the current process of constructing the numerical model, the coupling effect of the rock mass medium on the deformation mechanism of the structure has not been fully considered.

3.3. Numerical Simulation Analysis

To investigate the effects of different prestressing application levels during construction on stress distribution in main beams of large-span simply supported beam bridges, this study selected a 60 m span prestressed concrete simply supported T-beam bridge as the research subject and established a finite element model. The prestressing tendons were arranged using the post-tensioning method at the beam base and web, with tension control stresses calculated according to code specifications. Five distinct prestressing application levels were implemented to analyze their corresponding stress redistribution patterns.

3.3.1. Horizontal Classification of Prestress

According to the design specifications and engineering practice, the horizontal prestress application is divided into five grades, with the designed prestress value as the benchmark, and the specific classification is shown in Table 3.

3.3.2. Main Beam Stress Calculation Results

Under the standard working condition of vehicle load (City-A grade, double-lane full load), the stress extremum of the lower edge (tension zone) and upper edge (compression zone) of the mid-span section was extracted, and the maximum and minimum stresses of the main beam under different prestress levels were statistically calculated (compressive stress is negative, and tensile stress is positive), as shown in Table 4.

3.3.3. Stress Change Trend Analysis

As the prestress level increased from 60% to 120%, the maximum tensile stress at the lower edge decreased from +2.35 MPa to −0.38 MPa (compressive) at Level 4 and further reduced to −0.95 MPa at Level 5. This demonstrates that prestress significantly enhances the tensile performance of beam bases and effectively suppresses tensile stress development. When prestress reaches 105% or higher, no tensile stress appears under vehicle loads, achieving “full cross-sectional compression”. The minimum compressive stress at the lower edge rose from −0.12 MPa at Level 1 to −4.25 MPa at Level 5, indicating that higher prestress increases the beam base’s pre-compressive reserve, thereby improving crack resistance and long-term durability. The maximum compressive stress at the upper edge decreased from −18.45 MPa at Level 1 to −13.65 MPa at Level 5, representing a reduction of approximately 26%. This suggests excessive prestress may cause over-compressive stress on the upper edge during construction or initial operation, posing concrete crushing risks that require control. The upper limit value increased continuously with prestress (absolute value growth) from −6.20 MPa to −12.80 MPa, reflecting enhanced overall compression at the upper edge. However, it remained within the safety range as it did not exceed the C50 concrete’s axial compressive strength design value (−23.1 MPa).
The “Internal Force Balance” Effect of Prestressing: Prestress creates counter-moments within the beam body to counteract positive bending moments induced by vehicle loads. Higher prestress intensifies this counteracting effect, reducing tensile stress at the lower edge or even converting it into compression. Mechanism of Stress Redistribution: Post-prestressing induces counter-bow deformation in the beam, altering its initial geometry and internal force distribution. While high-prestressed beams exhibit reduced deformation and diminished moment redistribution capacity under vehicle loads, their substantial prestress reserves ensure superior overall stress levels. Causes of Upper Edge Stress Reduction: Although prestress generates tensile stress at the upper edge (particularly in T-beams), the counter-bow effect diminishes positive bending moments under load, resulting in lower actual compressive stress at the upper edge during operation. Economy–Safety Tradeoff: Level 3 (90%) compliance already meets crack resistance requirements (tensile stress < 0.7 MPa). Although Level 4 and Level 5 enhance performance, they may cause stress concentration in anchorage zones and excessive counter-bow deformation during construction. Comprehensive design considerations are recommended.

3.3.4. Stress Analysis of Main Beam

The normal stress of the concrete must meet the limit values stipulated in the code, σ c 0.75 f c and σ ct 0.7 f c t , as shown in Figure 3.
Figure 3 shows that the distribution of compressive stress at the upper edge of the main beam presents a dual-zone feature, with the compressive stress being concentrated in the top area of the bridge pier, reaching a peak of 16.1 MPa. The smaller compressive stress of the large cantilever segment has a value of about 9.8 MPa. According to the cloud map of compressive stress in Figure 3, the maximum compressive stress appears in the mid-span closure section, and its value is about 14.0 MPa. This is because two types of prestressed tendons are mainly arranged in the span of the beam: one is the upper prestressed tendons of the top pier segment and the large cantilever segment, and the other is the bottom prestressed tendons of the mid-span closure segment. During the construction stage, the compressive stress is mainly dominated by prestress, with the maximum compressive stress of 16.1 MPa (less than 0.75 times the design value of concrete compressive strength of 22.20 MPa), which complies with the specifications. The maximum tensile stress is concentrated at the lower edge of the fixed end of the top pier section, which occurs during the tensile strengthening stage in this area. At this time, the pier segment beam is subjected to the positive bending moment, and its tensile stress value is 0.68 MPa < 0.7fc′ = 1.85 MPa. This configuration satisfies the code requirements. After prestressing was applied to the large cantilever section, approximately 0.1 MPa tensile stress developed at its lower edge. As shown in Figure 3, the upper edge of the main beam at the pier cap segment exhibited compressive stress up to 16.1 MPa, significantly exceeding that in the large cantilever section (9.8 MPa) and the mid-span area. This high-stress zone originates from the pier cap section’s significant negative bending moment, which occurs because, during cantilever construction, as the main beam extends segment by segment, its self-weight and construction loads create substantial fixed-end moments at the pier cap, causing compression at the upper edge and tension at the lower edge. The applied top prestressing tendons effectively counterbalance this negative moment, generating pre-compressive stress on the upper edge to prevent cracking. The lower edge of the mid-span closure section shows maximum compressive stress of approximately 14.0 MPa, primarily provided by bottom-arranged closure prestressing tendons. This prestress resists tensile stresses caused by positive bending moments at the mid-span post-pier completion. Notably, the establishment of mid-span compressive stress depends on effective anchorage and force transfer within the negative bending moment zone at the pier cap. In other words, the pier cap, acting as the structural “pivot,” provides reactive support through its negative bending moment resistance, creating a complete internal force equilibrium system for mid-span prestressing.

3.3.5. Mechanical Correlation Between the Negative Bending Moment Zone and Stress Transfer at Mid-Span

Under vehicle loads or temperature variations, the main beam undergoes flexural deformation with dynamic stress redistribution along its length. The negative moment zone at the pier top, as a high-stiffness constraint node, bears the most concentrated bending moments. Its elevated prestressed state enhances local crack resistance, preventing upward crack propagation. Simultaneously, this region’s stability ensures effective mid-span moment transfer to the pier top, stabilizing stress variations in the closure section and avoiding abrupt stress changes or concentration. Additionally, when prestressing is applied to large cantilever segments, a minor tensile stress of 0.1 MPa appears at the lower edge, while the fixed-end lower edge at the pier top reaches 0.68 MPa. This demonstrates directional and staged stress transfer: localized tensile stress induced by prestressing first emerges at the anchorage end and then propagates toward the far end through concrete creep and shrinkage until becoming uniform. This process depends on the structural integrity and negative moment bearing capacity of the pier top section.
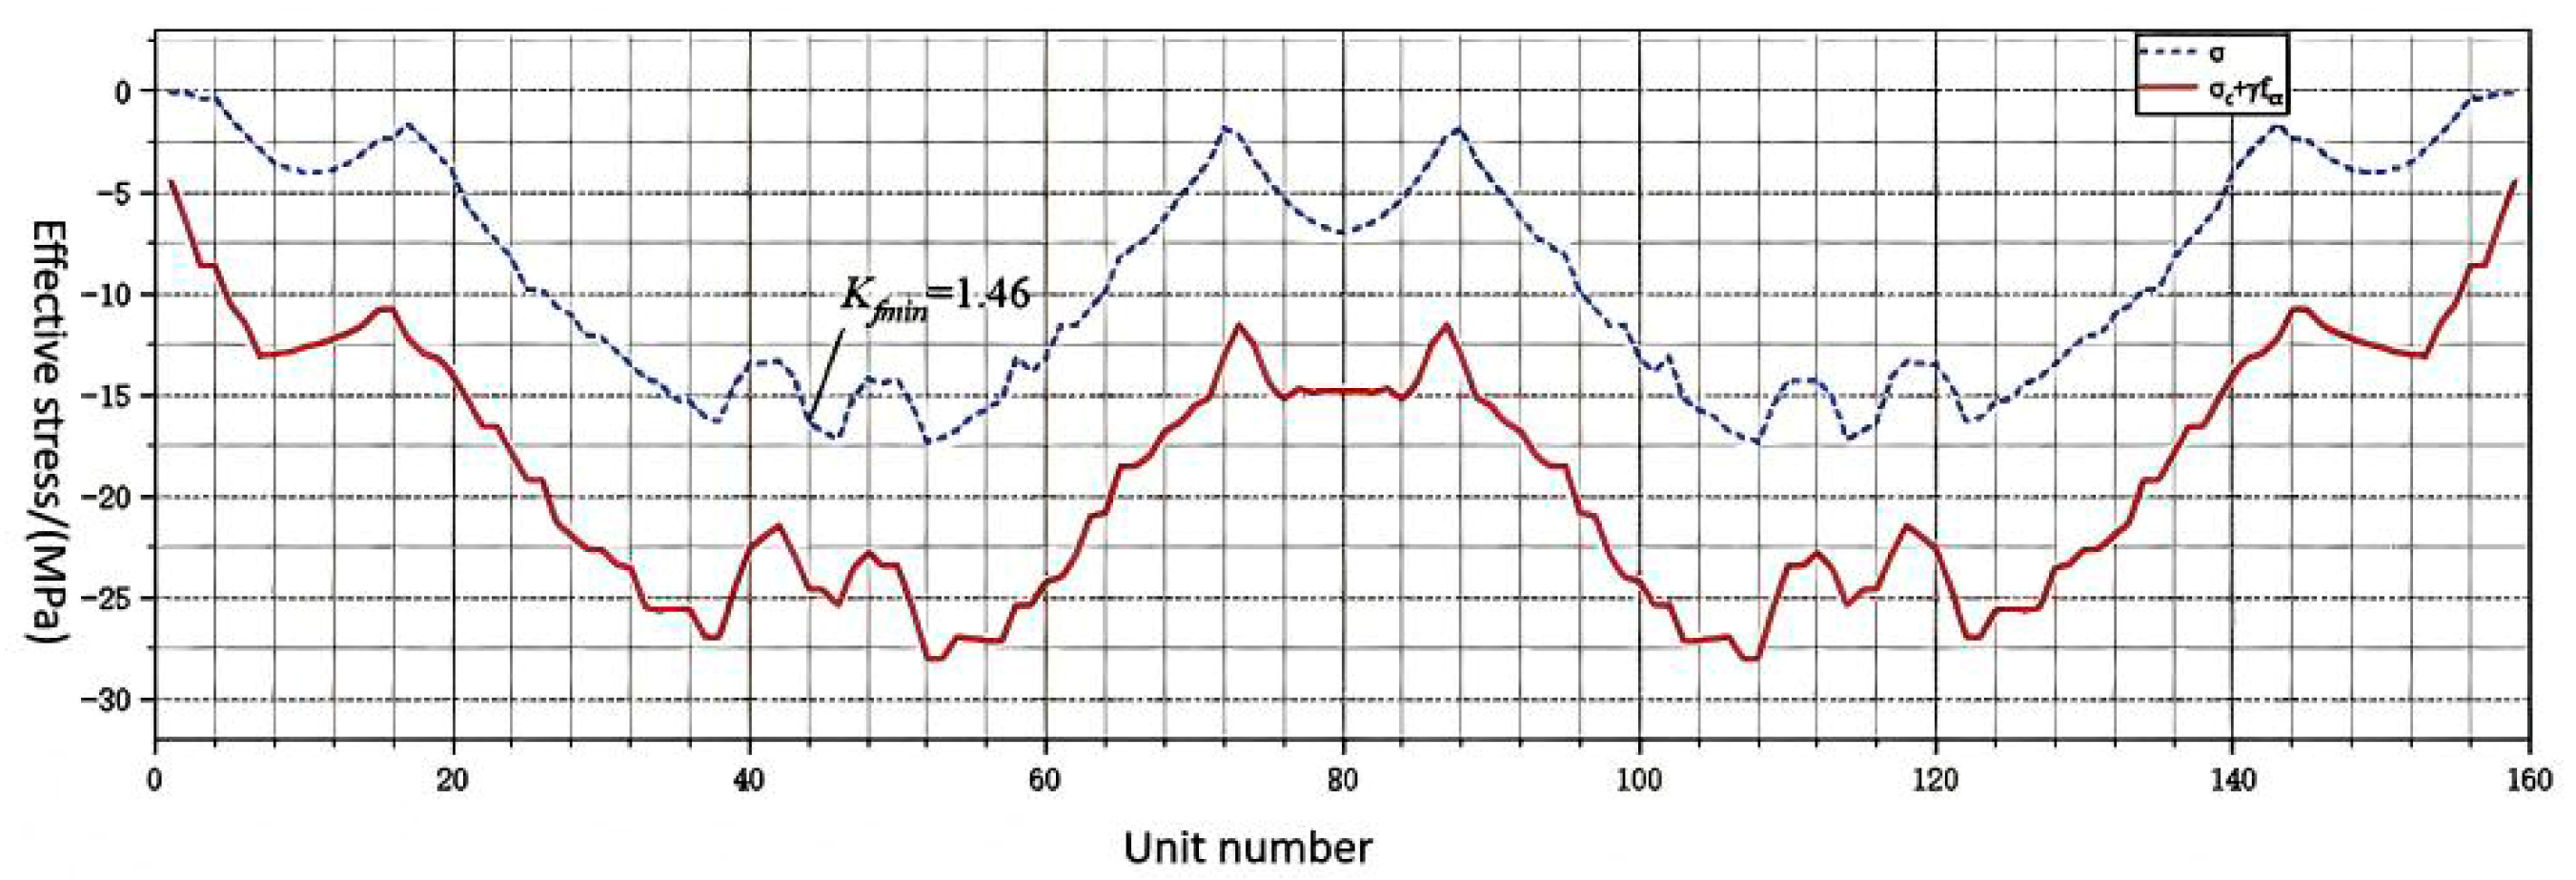
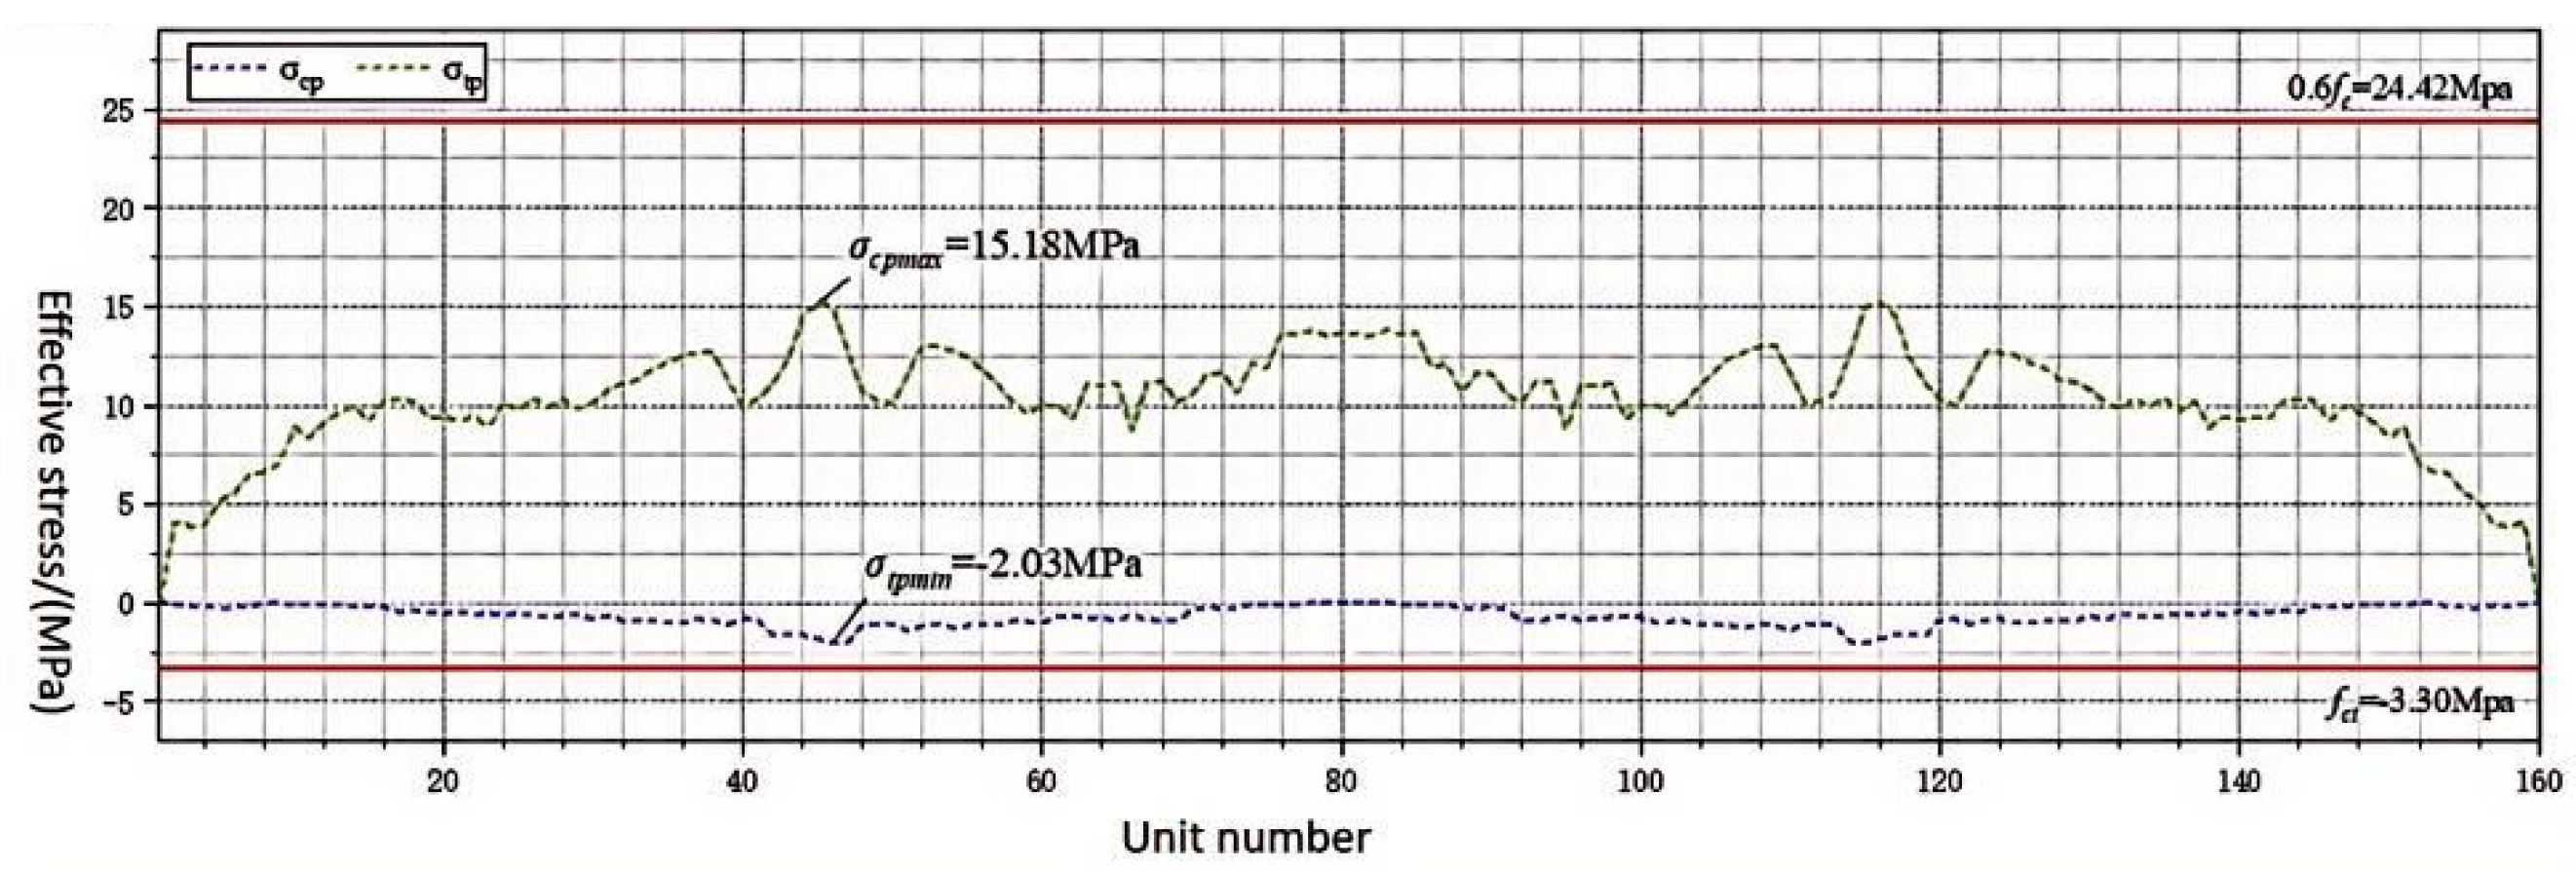
It can be known from the crack resistance verification results in Figure 4 that when the top section beam of the pier is subjected to a negative bending moment, the maximum load tensile stress occurs at the upper edge, and the preload stress is also the maximum. There exists a minimum safety factor Kf = 1.46 > 1.20. At the mid-span closure section, the direction of the bending moment changes, which is shown in the figure as two nearly zero inflection points. Since the prestressed tendons are tensioned at the bottom of the mid-span closure section, the crack resistance requirements are met. The verification results of the crack resistance of the inclined section in Figure 5 show that the maximum principal compressive stress, cp = 15.18 MPa, and the maximum tensile stress, tp = 2.03 MPa, of the main beam occur at the top section of the pier, both within the envelope line, meeting the crack resistance requirements of the inclined section.

3.3.6. Optimization Analysis

By considering the bending moment reversal zone and the mid-span closure section as a coordinated force unit and adopting spatial gradient, functional differentiation, and time-staged anchor cable layout strategies, the occurrence probability of cracks in this high-risk area can be significantly reduced, the integrity and long-term performance of the structure can be improved, and the safe operation of large-span continuous rigid frame bridges can be strongly guaranteed.
During construction, the inclined section of the main beam experiences bending–shear coupling effects. The maximum compressive stress reaches approximately 15.8 MPa, below the code limit of 0.7f′_c = 22.05 MPa, meeting compression resistance requirements. However, the maximum tensile stress reaches 1.95 MPa, slightly exceeding the allowable value for short-term conditions of 0.7f_t = 1.85 MPa, indicating potential tensile stress over-limit risk in this area. This phenomenon is primarily caused by cross-section abrupt changes, shear force concentration, and prestressed anchorage effects, commonly occurring in complex stress zones such as the junction between web and top plates.
Excessive principal stress can compromise a structure’s shear resistance, potentially inducing diagonal microcracks under construction loads. This weakens shear transfer pathways, reduces effective shear area in the web, and may cause anchorage zone spalling or durability deterioration. To address these issues, we recommend optimizing cross-sectional transitions, reinforcing stirrups, adding bent-up reinforcement or transverse prestressing, and implementing staged loading to enhance crack resistance and shear performance in inclined sections, ensuring construction safety and long-term structural reliability. Key design strategies include (1) optimizing stiffness distribution by increasing beam height or web thickness at mid-span regions to improve overall bending stiffness; (2) using high-performance materials like UHPC or fiber-reinforced concrete in critical sections to enhance crack resistance and durability; (3) strategically arranging prestressing tendons, particularly applying bottom prestress at mid-span closure sections to counteract positive bending moment deflection; (4) installing efficient expansion joints and low-friction sliding bearings to dissipate thermal stresses and reduce additional deformation transfer; (5) incorporating time-varying temperature field models and long-term deformation predictions with dynamic adjustments to construction pre-arch curvature. Through integrated measures of “stiffness enhancement + structural optimization + deformation coordination,” we aim to improve bridge deflection control and service performance under coupled multi-factor conditions.

3.4. Long-Term Nonlinear Behavior of Concrete

Concrete shows significant nonlinear characteristics during long service, including creep, shrinkage, and fatigue damage.
According to the creep model proposed in [26], the relationship between the creep coefficient (φ) and time (t) of concrete is
ϕ(t) = ϕ0 + ϕ1 × ln(t/t0)
Here, φ0 denotes the initial creep coefficient (value: 0.25), φ1 represents the time-dependent parameter (value: 0.15), and t0 indicates the initial loading period (28 days). Taking the main girder concrete of this bridge as an example, the creep coefficient φ (50 years) after 50 years of service equals 0.25 + 0.15·ln(50/0.28) ≈ 0.82. The long-term creep deformation calculated from these results in an increase of 18% in the mid-span deflection, rising from 12.3 mm during construction to 14.5 mm during operation. This deformation level approaches the allowable deflection limit specified in the “Code for Design of Highway Reinforced Concrete and Prestressed Concrete Bridges and Culverts” (JTG D62-2024) (L/600 = 200 mm), necessitating compensation through optimized prestressing tendon layout or additional secondary tensioning measures. Long-term nonlinear characteristics of concrete is shown in Table 5.
Concrete shrinkage (εs) decreases exponentially over time, and the formula is
εs(t) = εs, 0 ∗ [1 − e − t/τ]
Here, εs represent the ultimate shrinkage strain (calculated as 0.0003), while τ denotes the time constant for shrinkage (set at 50 years). After 20 years of service, the shrinkage strain εs (20-year) of the main beam’s top plate equals 0.0003 · [1 − e^{−20/50}] ≈ 0.00011, corresponding to a deformation of 1.3 cm across the 120 m span. This deformation generates additional tensile stress on the top plate, requiring coordinated analysis considering prestress loss.
Repeated dynamic loading of vehicles can induce concrete fatigue damage. When vehicle load frequencies approach the bridge’s natural frequency (2.3 Hz for this bridge’s mid-span), fatigue life is significantly reduced. For example, when a 40-ton vehicle passes at 50 km/h, the fatigue damage accumulation rate of mid-span concrete increases by 23% compared to static load conditions. If this effect is not accounted for, the main girder’s crack resistance may fail prematurely. Designers should compensate for this by increasing safety margins (recommended to be raised by 15%) or using high-toughness concrete during the design phase. Long-term non-fatigue damage accumulation rate of concrete was shown in Table 6.

3.5. Long-Term Performance of Prestressing

The performance degradation of prestressing tendons in long-term service is mainly manifested as stress relaxation and anchor sliding, which should be corrected by a quantitative model.
Loss of prestress:
According to JTG D62-2024 specification [27], the stress relaxation loss of prestressing tendons can be calculated as follows:
σl(t) = σ0 ∗ [1 − (1 + 0.001σ0/σpe) ∗ e − t/τ]
Here, σ0 denotes the initial tension stress (0.75 fpk), σ pe represents the effective prestress (0.65 fpk), and τ is the relaxation time constant (100 years). Taking the tension reinforcement of this bridge’s top pier as an example, the stress loss σ_l (30 years) after 30 years of service is calculated as 0.75 fpk · [1 − (1 + 0.001 · 0.75 fpk/0.65 fpk) · e^{−30/100}] ≈ 0.12 fpk, indicating a 16% reduction in prestress. This loss causes the peak tensile stress in the top pier area to increase from the design value of 1.2 MPa to 1.4 MPa (exceeding the code-specified limit by 12%), necessitating optimization through either increasing the prestressing reinforcement quantity or using low-relaxation steel strands.
The bond strength between prestressed tendons and the concrete interface deteriorates with service time, where the degradation rate is closely related to the corrosive environment. When the prestressed tendon corrosion rate exceeds 3%, the interfacial slip increase reaches 40%, leading to reduced prestress transfer efficiency. For instance, under a 3% corrosion rate condition, the uniformity coefficient of prestress distribution in the top slab concrete decreases from 0.85 to 0.62, while the mid-span tensile stress peak rises by 12% (Table 7). This degradation effect requires control through regular inspections and corrosion-resistant coating maintenance.

3.6. Influence of Temperature and Humidity on Concrete Shrinkage

This bridge is located in an area with significant diurnal temperature variations (with daytime temperature differences reaching 30 °C), necessitating consideration of long-term thermal effects on structural performance. According to the formula Ec(T) = Ec0 × (1 − αE(T − T0)/(Tmax − T0)), when the temperature rises from 20 °C to 40 °C, the concrete elastic modulus decreases by 1.5%, resulting in reduced main beam stiffness and a 2.3% increase in mid-span deflection. Additionally, the additional bending moment caused by the temperature gradient (35 °C at the upper edge and 25 °C at the lower edge) increases tensile stress peaks by 8%. Dynamic speed limit adjustments (such as reducing speeds by 10% during midday) are required to control resonance risks.
Concrete shrinkage shows a significant correlation with ambient humidity. According to the formula εs(RH) = εs(0)(1 − β(RH/100)), under low-humidity conditions (RH = 30%), the shrinkage strain increases to 0.00045, resulting in a floor slab deformation of 18 cm. This deformation reduces the effective prestress of the prestressed reinforcement by 5%, necessitating an extended curing period (recommended from 7 days to 14 days) to minimize shrinkage cracks.
To evaluate the impact of environmental factors on safety thresholds, the modified coefficient Kenv is defined as Kenv = 1 + γT ∗ ΔT + γH ∗ (1 − RH/100). Using the operational scenario with ΔT = 30 °C and RH = 40%, the calculated coefficient Kenv = 1.095 requires reducing the speed limit for 40-ton vehicles from 81.4 km/h to 73.6 km/h (Table 8). This model provides practical guidance for dynamically adjusting speed restrictions and maintenance strategies in real-world operations.

4. Study on the Safety Threshold of Bridge Vehicle Vibration Load

4.1. Theoretical Derivation and Case Verification of Vehicle–Bridge Coupling Vibration Velocity

Based on the single-degree-of-freedom mass-spring-damping vehicle model and the Euler–Bernoulli simply supported beam model, the vehicle-axle coupling dynamics model was constructed. The bridge motion equation adopts the mode superposition method and takes the first n modes [28,29]:
E I 4 y ( x , t ) x 4 + ρ 2 y ( x , t ) t 2 + c b y ( x , t ) t = F c ( t ) δ ( x v t )
where vehicle mass is mv, suspension stiffness is kv, damping is cv, speed is v, bridge length is L, linear density is ρ , flexural stiffness is EI, modal damping ratio is ξ , wavelength is λ , amplitude r0 r ( x ) = r 0 sin ( 2 π x / λ ) , and Zv is the unsprung mass displacement of the vehicle [30].
F c ( t ) = m v g k v [ y ( v t , t ) r ( v t ) z v ( t ) ] c v [ y ˙ ( v t , t ) z ˙ v ( t ) ]  
m v z ¨ v ( t ) + c v [ z ˙ v ( t ) y ˙ ( v t , t ) ] + k v [ z v ( t ) y ( v t , t ) ] = m v g
Vibration velocity expression: The vibration velocity of the bridge can be superimposed by the modal response.
y ˙ ( x , t ) = i = 1 n q ˙ i ( t ) ϕ i ( x )
ϕ i ( x ) = 2 / ( ρ L ) sin ( i π x / L )  
f b i = ( i π ) 2 2 π L 2 E I ρ ( i = 1 , 2 , n )
Vehicle excitation frequency: Excitation frequency is caused by moving speed v.
f e = v λ + i v 2 L ( i = 1 , 2 , )

4.2. Steady State Response Solution

Assuming that the bridge is dominated by the first mode, the peak vibration velocity is obtained by the Laplace transform:
y ˙ m a x = m v v 2 r 0 2 ξ b ( k b m v ( 2 π f e ) 2 ) 2 + ( c b 2 π f e ) 2
where [ m v v 2 ] indicates that the vibration velocity is proportional to k b = π 4 E I L 3   .
The above research content is verified by an example in this paper; the relevant parameters are shown in Table 9.
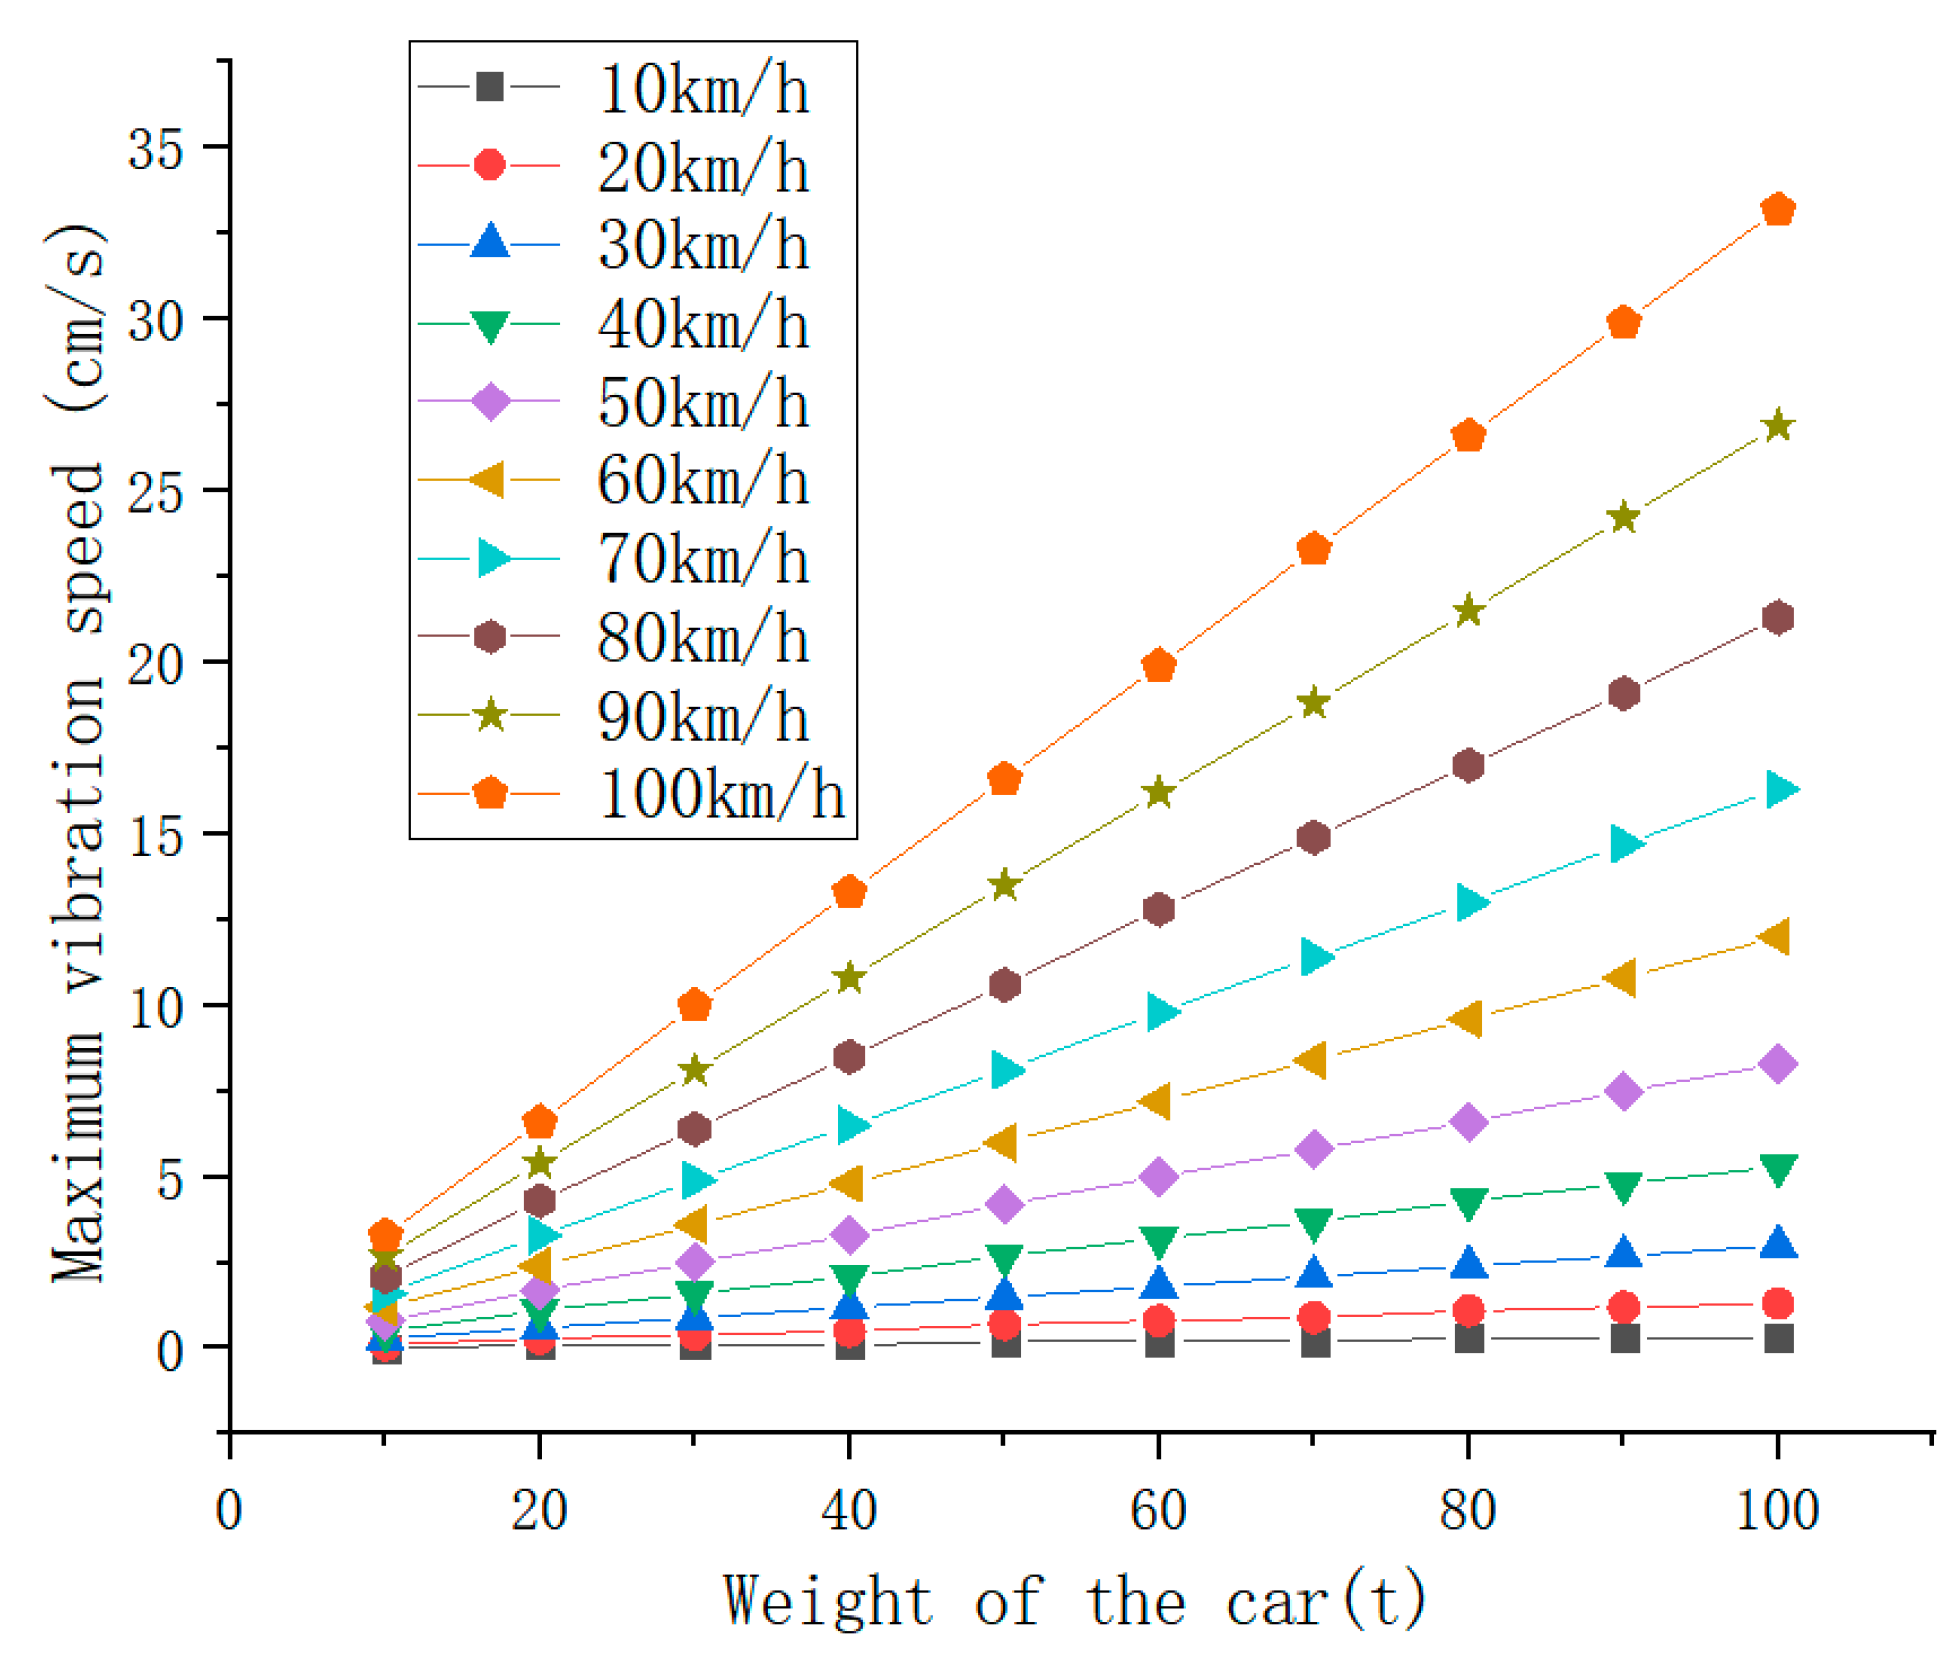
According to Equation (5), the different vibration speeds caused by the bridge when cars with different weights pass over the bridge at different speeds are shown in Figure 6.
From the data in Figure 6, it can be seen that the bridge speed shows a significant regular change: First, as the truck tonnage increases, the absolute value of the speed significantly increases. For example, at a speed of 10 km/h, the 10-ton truck has almost no speed (0), while the 100-ton truck has a speed of −3.3 cm/s; at a speed of 80 km/h, the 10-ton truck has a speed of only −0.3 cm/s, while the 100-ton truck has a speed of −26.6 cm/s. With each increase in tonnage level, the speed increase shows an expanding trend. Second, as the driving speed increases, the absolute value of the speed of the same-tonnage truck also increases simultaneously. Taking the 50-ton truck as an example, at a speed of 10 km/h, the speed is −0.8 cm/s; at 30 km/h, it increases to −2.5 cm/s; at 80 km/h, it reaches −6.6 cm/s; and at 100 km/h, it further increases to −8.3 cm/s. As the speed increases from 10 km/h to 100 km/h, the absolute value of the speed expands approximately ten-fold. In addition, considering the bridge structure (a three-span continuous simply supported beam with spans of 70 m + 120 m + 70 m), the maximum speed is most likely to be concentrated in the 120 m span (the middle span), because this span is the longest and is the part of the entire bridge structure that is most prone to significant deformation. Moreover, the speed value at the mid-span position (60 m of the 120 m span, corresponding to the 130 m position of the entire bridge) should be the maximum among all measurement points.
The core reasons for the above phenomena can be explained from two aspects: structural mechanical characteristics and vehicle load effects. On the one hand, the load size is the core influencing factor of speed. The bridge speed is essentially the vertical deflection of the structure under vertical load. The mid-span deflection of a simply supported beam bridge is positively correlated with the load (in line with the rule that “the load q is proportional to the deflection f” in the simply supported beam deflection formula). The larger the truck tonnage, the greater the vertical force on the bridge. Especially for the 120 m span, as the longest span, the mid-span bending moment and deflection are more sensitive to the load (deflection is proportional to the fourth power of the span), so large-tonnage trucks will cause more significant speeds. On the other hand, the driving speed amplifies the speed through dynamic effects. When a vehicle is driving, it is not a static load but a dynamic load accompanied by impact and vibration. The higher the speed, the greater the dynamic coefficient (the ratio of dynamic load to static load). This is equivalent to applying a greater equivalent load on the bridge. At the same time, the support constraints of the continuous single-support beam bridge will cause the vibration energy to be transferred between spans. When a vehicle is traveling at high speed, the vibration frequency of the structure is more likely to form a resonance trend with the impact frequency of the vehicle, thereby further increasing the speed amplitude. Therefore, for trucks of the same tonnage, the speed variation is more significant when traveling at high speeds. By adjusting the excitation frequency, resonance can be induced in the middle span and long-span sections. It is the core mechanism that leads to the aggravation of its vibration. In the design, the dangerous speed range of the bridge should be identified, and the structural stiffness should be optimized, damping devices should be added, or speed limit measures should be set to avoid frequent passage of operating vehicles through the resonance zone, to improve the driving safety and service performance of the bridge.
The maximum vibration speed caused by the bridge is shown in Figure 7. Bridge displacement under different vehicle loads is shown in Figure 8.
With the increase in weight, the mean value shows a superlinear growth (10 tons →100 tons, with an average increase of 191%), and the range expands to 109 times, indicating that heavy-duty vehicles have a significant impact on the vibration velocity. The coefficient of variation is stable (CV ≈ 0.8–0.9), indicating that high-speed driving intensifies the vibration and has strong regularity. The difference between the median and the mean increases with the increase in load, reflecting the deviation of the vibration velocity distribution towards higher values, which may be related to the resonance effect of the bridge.
The measured data of the bridge show that the vibration speed of 40-ton vehicles passing at 50 km/h is 3.1 cm/s, and the error of the theoretical calculation is only 6%, which verifies the accuracy of the model.

4.3. Research on Bridge Safety Criterion

The wavefront of a seismic wave propagating in an isotropic homogeneous medium is spherical; that is, the seismic wave is spherical. When a spherical wave encounters an interface, its wavefront changes. This is consistent with the local characteristic theorem of the wave; therefore, all the reflection and transmission of the wave in the propagation process can be summarized as the reflection and transmission on the plane. This section takes plane simple harmonics as an example to study their reflection at the free interface.
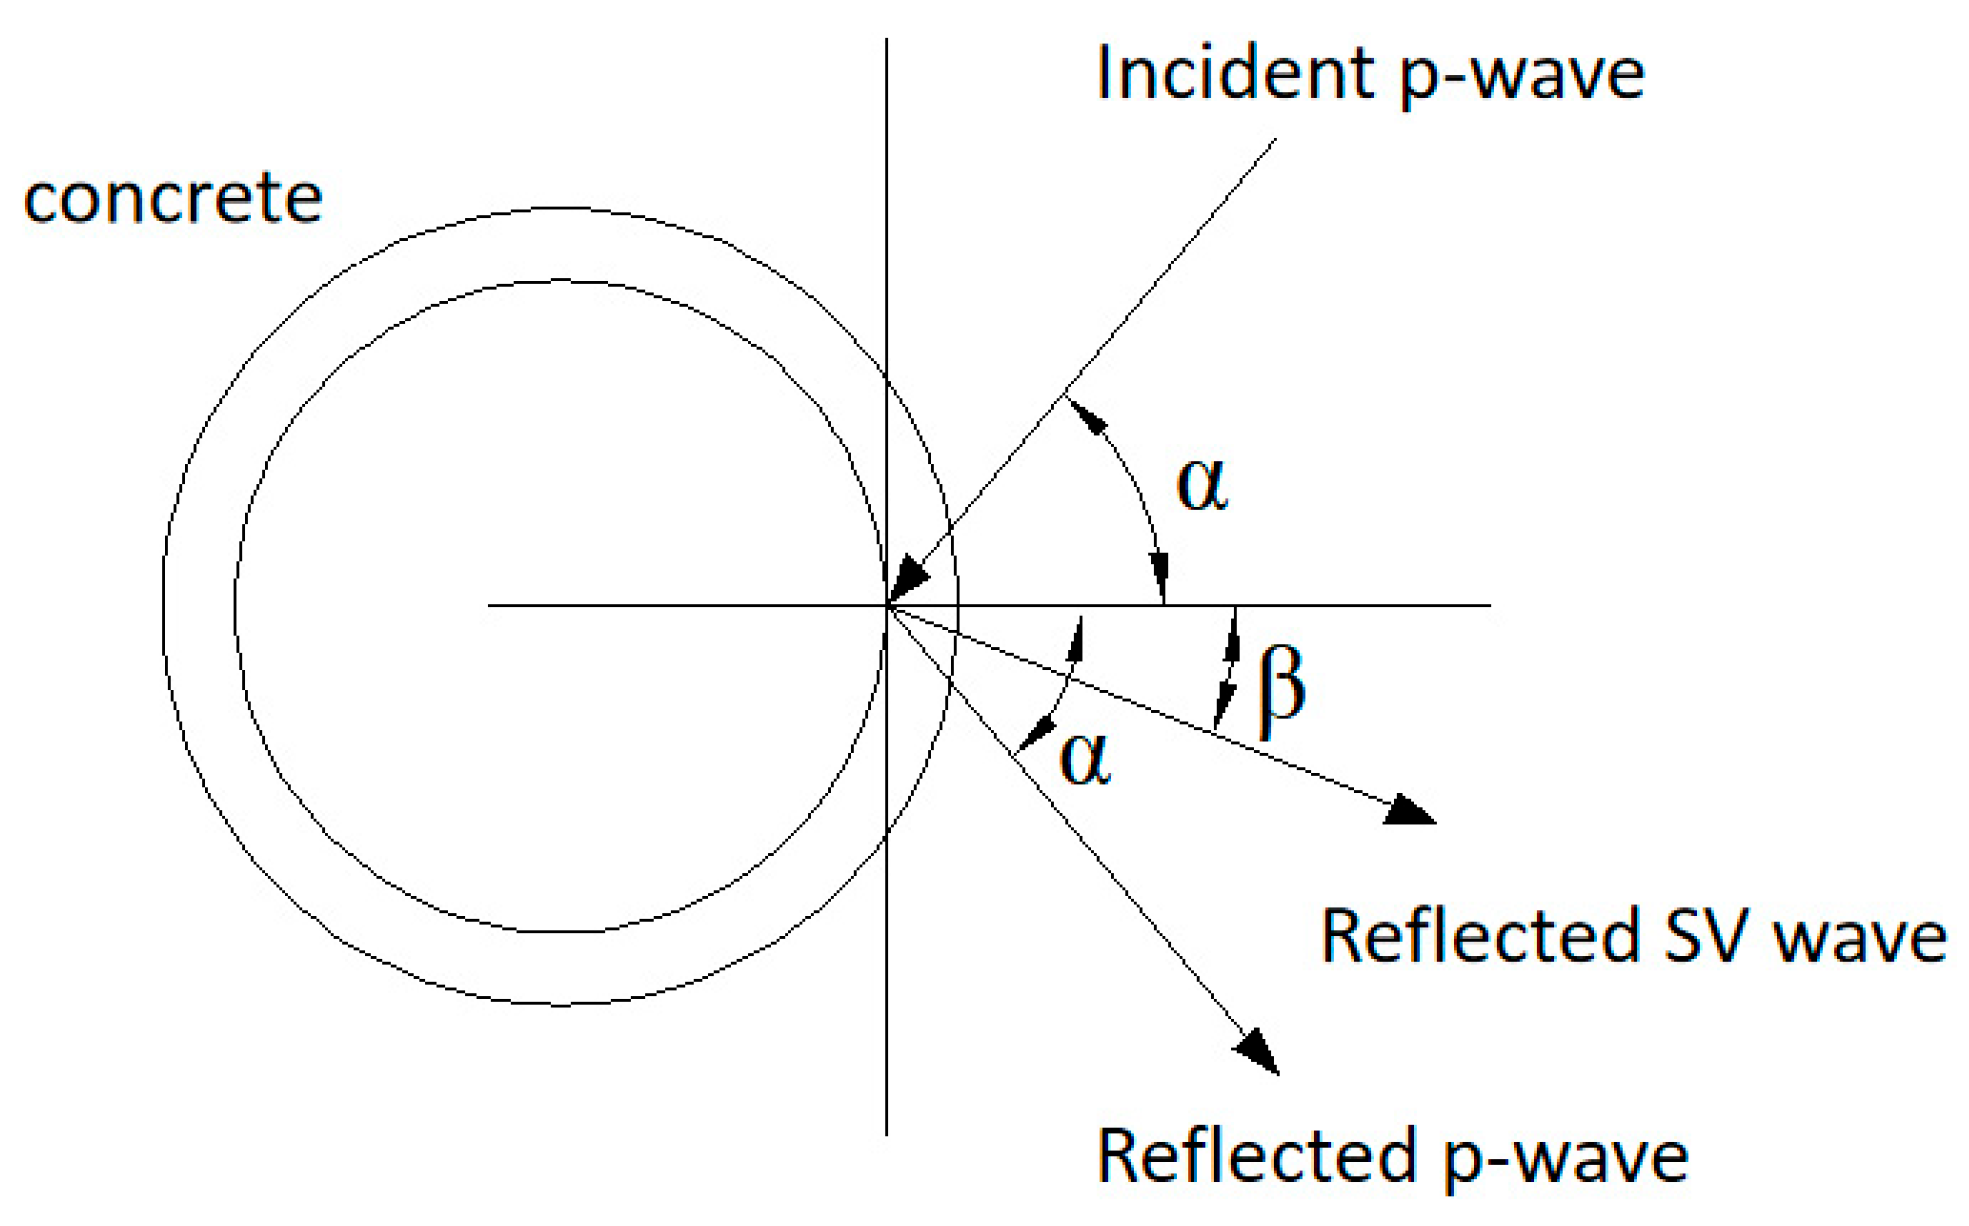
Based on engineering practice, the effect of seismic waves induced by vehicle vibration loads on bridge deck concrete can be modeled as the reflected P waves and SV waves generated by the incident P waves reflected at the free interface (see Figure 9).
According to the displacement vector, the displacement component of a two-dimensional problem can be expressed as
u = φ x + ψ y v = φ y ψ x w = ψ y x ψ x y
where ψ = ψ z ( x , y , t ) , w ( x , y , t ) = ψ y x ψ x y , ψ = ψ x i + ψ y j + ψ z k .
The geometric equation of the strain of the body is
ε x = u x , γ x y = v x + u y ε y = v y , γ x y = w y ε z = w z , γ x y = w x
Equation (12) is substituted into Equation (13) to get the volume strain:
θ t = ε x + ε y + ε z = 2 φ x 2 + 2 φ y 2
It can be seen that the volumetric strain caused by vibration is related to the function φ.
Take a half-infinite elastic medium, with its free surface a plane, y = 0 on the free interface, semi-infinite medium y ≧ 0. Let the plane P wave and plane SV wave propagate in the xoy plane or its parallel plane, incident into the free interface along the direction of the unit vector, and only discuss the reflection of the free interface, because there will be no transmission at this time.
The Lame equation is substituted, and the Lame equation is as follows: U = u i + v j + w k .
ρ 2 U t 2 = ( λ + μ ) θ t + μ 2 U + ρ F
where Pa; λ —Lamay constant, Pa; ρ —density, kg/m3.
Thus, for the incident P wave, the particle vibration direction (displacement direction) is in the xoy plane or parallel plane; then, the bit shift satisfies the equation w 0 , u = u ( x , y , t ) , v = v ( x , y , t ) .
2 φ = 1 c 1 2 2 φ t 2 , y 0 2 ψ = 1 c 2 2 2 ψ t 2 , y 0
where a variable is the longitudinal wave speed and another variable is the transverse wave speed.
Here, c 1 = λ + 2 μ ρ c 2 = μ ρ .
Let the solution of Equation (13) be in plane harmonic form:
φ ( x , y , t ) = Φ ( y ) e i K ( x c t ) ψ ( x , y , t ) = Ψ ( y ) e i K ( x c t )
where both K and c are constants (essentially, c is the velocity along the x direction, that is, the apparent velocity; and a variable is the incidence angle).
Therefore, from the above equation, we can see that the incident P wave is
φ 1 = A 1 e i K ( x p 1 y c t )
φ = φ 1 + φ R = A 1 e i K ( x p 1 y c t ) + A 2 e i K ( x + p 1 y c t ) ψ = ψ R = B 2 e i K ( x + p 2 y c t )
where p 1 and p 2 are real numbers; p 1 = cot θ 1 , p 2 = cot θ 2 .
Then, Equation (19) is substituted into the physical equation, and each stress component is
σ x = λ θ t + 2 μ ε x = λ 2 φ + 2 μ ( 2 φ x 2 + 2 ψ x y ) σ y = λ θ t + 2 μ ε y = λ 2 φ + 2 μ ( 2 φ y 2 2 ψ x y ) σ z = λ θ t + 2 μ ε z = λ 2 φ τ x y = μ γ x y = μ ( 2 2 φ x y + 2 ψ y 2 2 ψ x 2 ) τ y z = μ γ y z = μ w y τ z x = μ γ z x = μ w x
From this, we can see that by substituting Equation (19) into Equation (20), we get
σ x = ( λ + λ p 1 2 + 2 μ ) i 2 K 2 [ A 1 e i K ( x p 1 y c t ) + A 2 e i K ( x + p 1 y c t ) ] + 2 μ p 2 i 2 K 2 B 2 e i K ( x + p 2 y c t ) σ y = ( λ + λ p 1 2 + 2 μ ) i 2 K 2 [ A 1 e i K ( x p 1 y c t ) + A 2 e i K ( x + p 1 y c t ) ] 2 μ p 2 i 2 K 2 B 2 e i K ( x + p 2 y c t ) σ z = ( λ + λ p 1 2 ) i 2 K 2 [ A 1 e i K ( x p 1 y c t ) + A 2 e i K ( x + p 1 y c t ) ] τ xy = 2 μ i 2 K 2 p 1 [ A 1 e i K ( x p 1 y c t ) + A 2 e i K ( x + p 1 y c t ) ] + μ i 2 K 2 B 2 ( p 2 2 1 ) e i K ( x + p 2 y c t ) τ yz = 0 τ zx = 0
Equation (18) refers to the stress caused by an oblique incident seismic wave.
At that time, that is, the vertical incidence, p θ 1 = 0 ° 21 and p are infinite values. At this time, the vertically incident P wave only produces a reflected P wave perpendicular to the free plane on the free interface, and its propagation direction is opposite to that of the incident wave. The amplitudes of the two wave functions are the same, the phase difference is 180° (half period), and the distance of the wave in half-period time is exactly half the wavelength, so this phenomenon is called half-wave loss.
At that time, the dynamic effect caused by seismic waves is θ 1 = 0 ° .
σ max = ρ c v cos θ 1

4.4. Solving the Safety Threshold of Driving Speed

In the previous section, the stress caused by seismic waves incident on the free interface caused by vehicle driving was analyzed. According to the maximum tensile stress criterion, when this stress reaches or exceeds the ultimate tensile strength, it will cause damage to the concrete pavement. Therefore, we should strictly control the driving speed generated by vehicle driving. In the actual engineering monitoring, the most intuitive monitoring quantity is the traveling speed generated by vehicle driving, so this section will calculate the safety threshold of the traveling speed generated by vehicle driving to control the process of vehicle driving and ensure the safety of the project.
On the free interface of y = 0, the surface force in the y direction is 0, so there are boundary conditions:
σ y | y = 0 = 0 , τ x y | y = 0 = 0
By substituting B1 = 0 into the boundary conditions, the equation satisfying the bit shift amplitude reflection coefficient, also known as the Knott equation, can be obtained:
A 2 A 1 = 4 p 1 p 2 ( 1 p 2 2 ) 2 4 p 1 p 2 + ( 1 p 2 2 ) 2 B 2 A 1 = 4 p 1 ( 1 p 2 2 ) 4 p 1 p 2 + ( 1 p 2 2 ) 2
After derivation, the maximum tensile stress generated by P-wave oblique incidence is
σ max = max ( σ x , σ y ) σ x = K 2 λ ( 1 + p 1 2 ) A 2 + 2 μ ( A 2 p 2 B 2 ) σ y = K 2 λ ( 1 + p 1 2 ) A 2 + 2 μ ( A 2 + p 2 B 2 )
Combined with the engineering practice, the concrete label C30, for safety considerations, takes C25 to calculate the safe vibration velocity. Elastic modulus E = 29.5 GPa, Lamme constant = 8.19 GPa, shear modulus = 12.29 GPa, and its density = 2500. The ultimate tensile strength of concrete was determined to be 1.33 MPa under the critical working condition with a seismic wave frequency of 50 Hz.
The velocity equation on a free interface with y = 0 is
v x = t ( u x ) v y = t ( v y )
Therefore, the critical speed value can be substituted to find the corresponding critical safety vibration speed. Through calculation, it is found that the frequency f of the incident wave does not affect the safe vibration velocity.
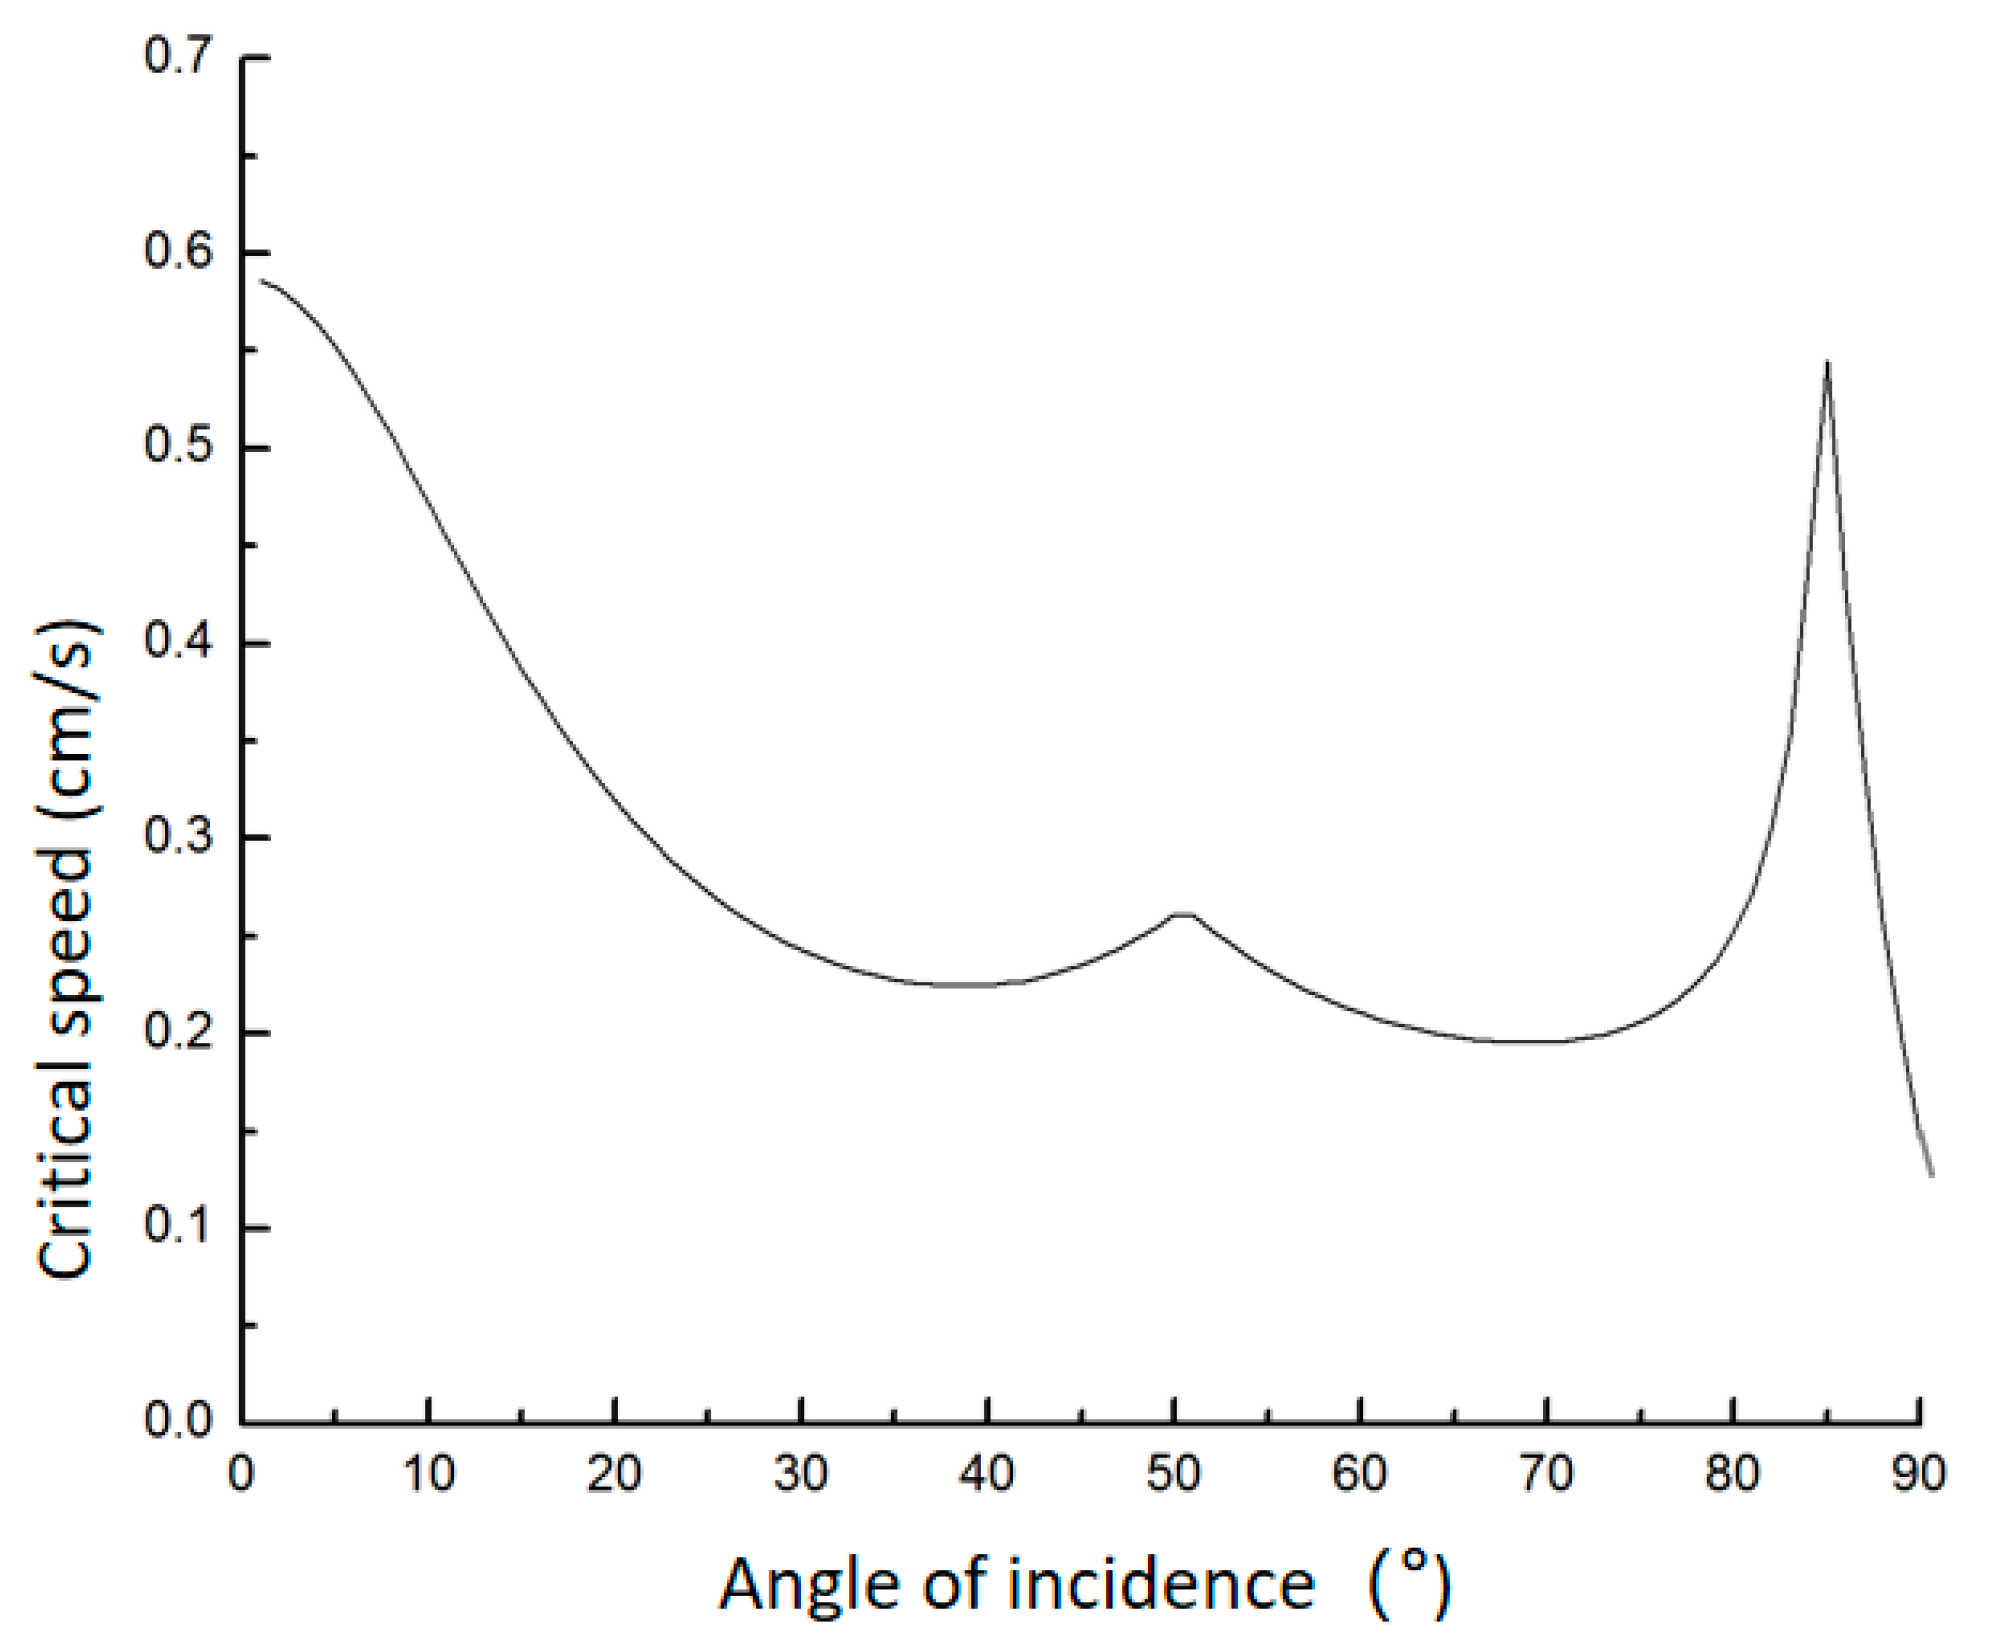
Using MATLAB 2016 software programming for numerical calculation, the relationship between critical safe vibration velocity and incident angle was obtained, as shown in Figure 10  ( 0 < θ 1 90 ) .
The minimum value of the velocity in the calculation result is 13.2 cm/s. At this time, it is also necessary to calculate = 0°, which is θ 1 , the critical safe vibration velocity at vertical incidence.
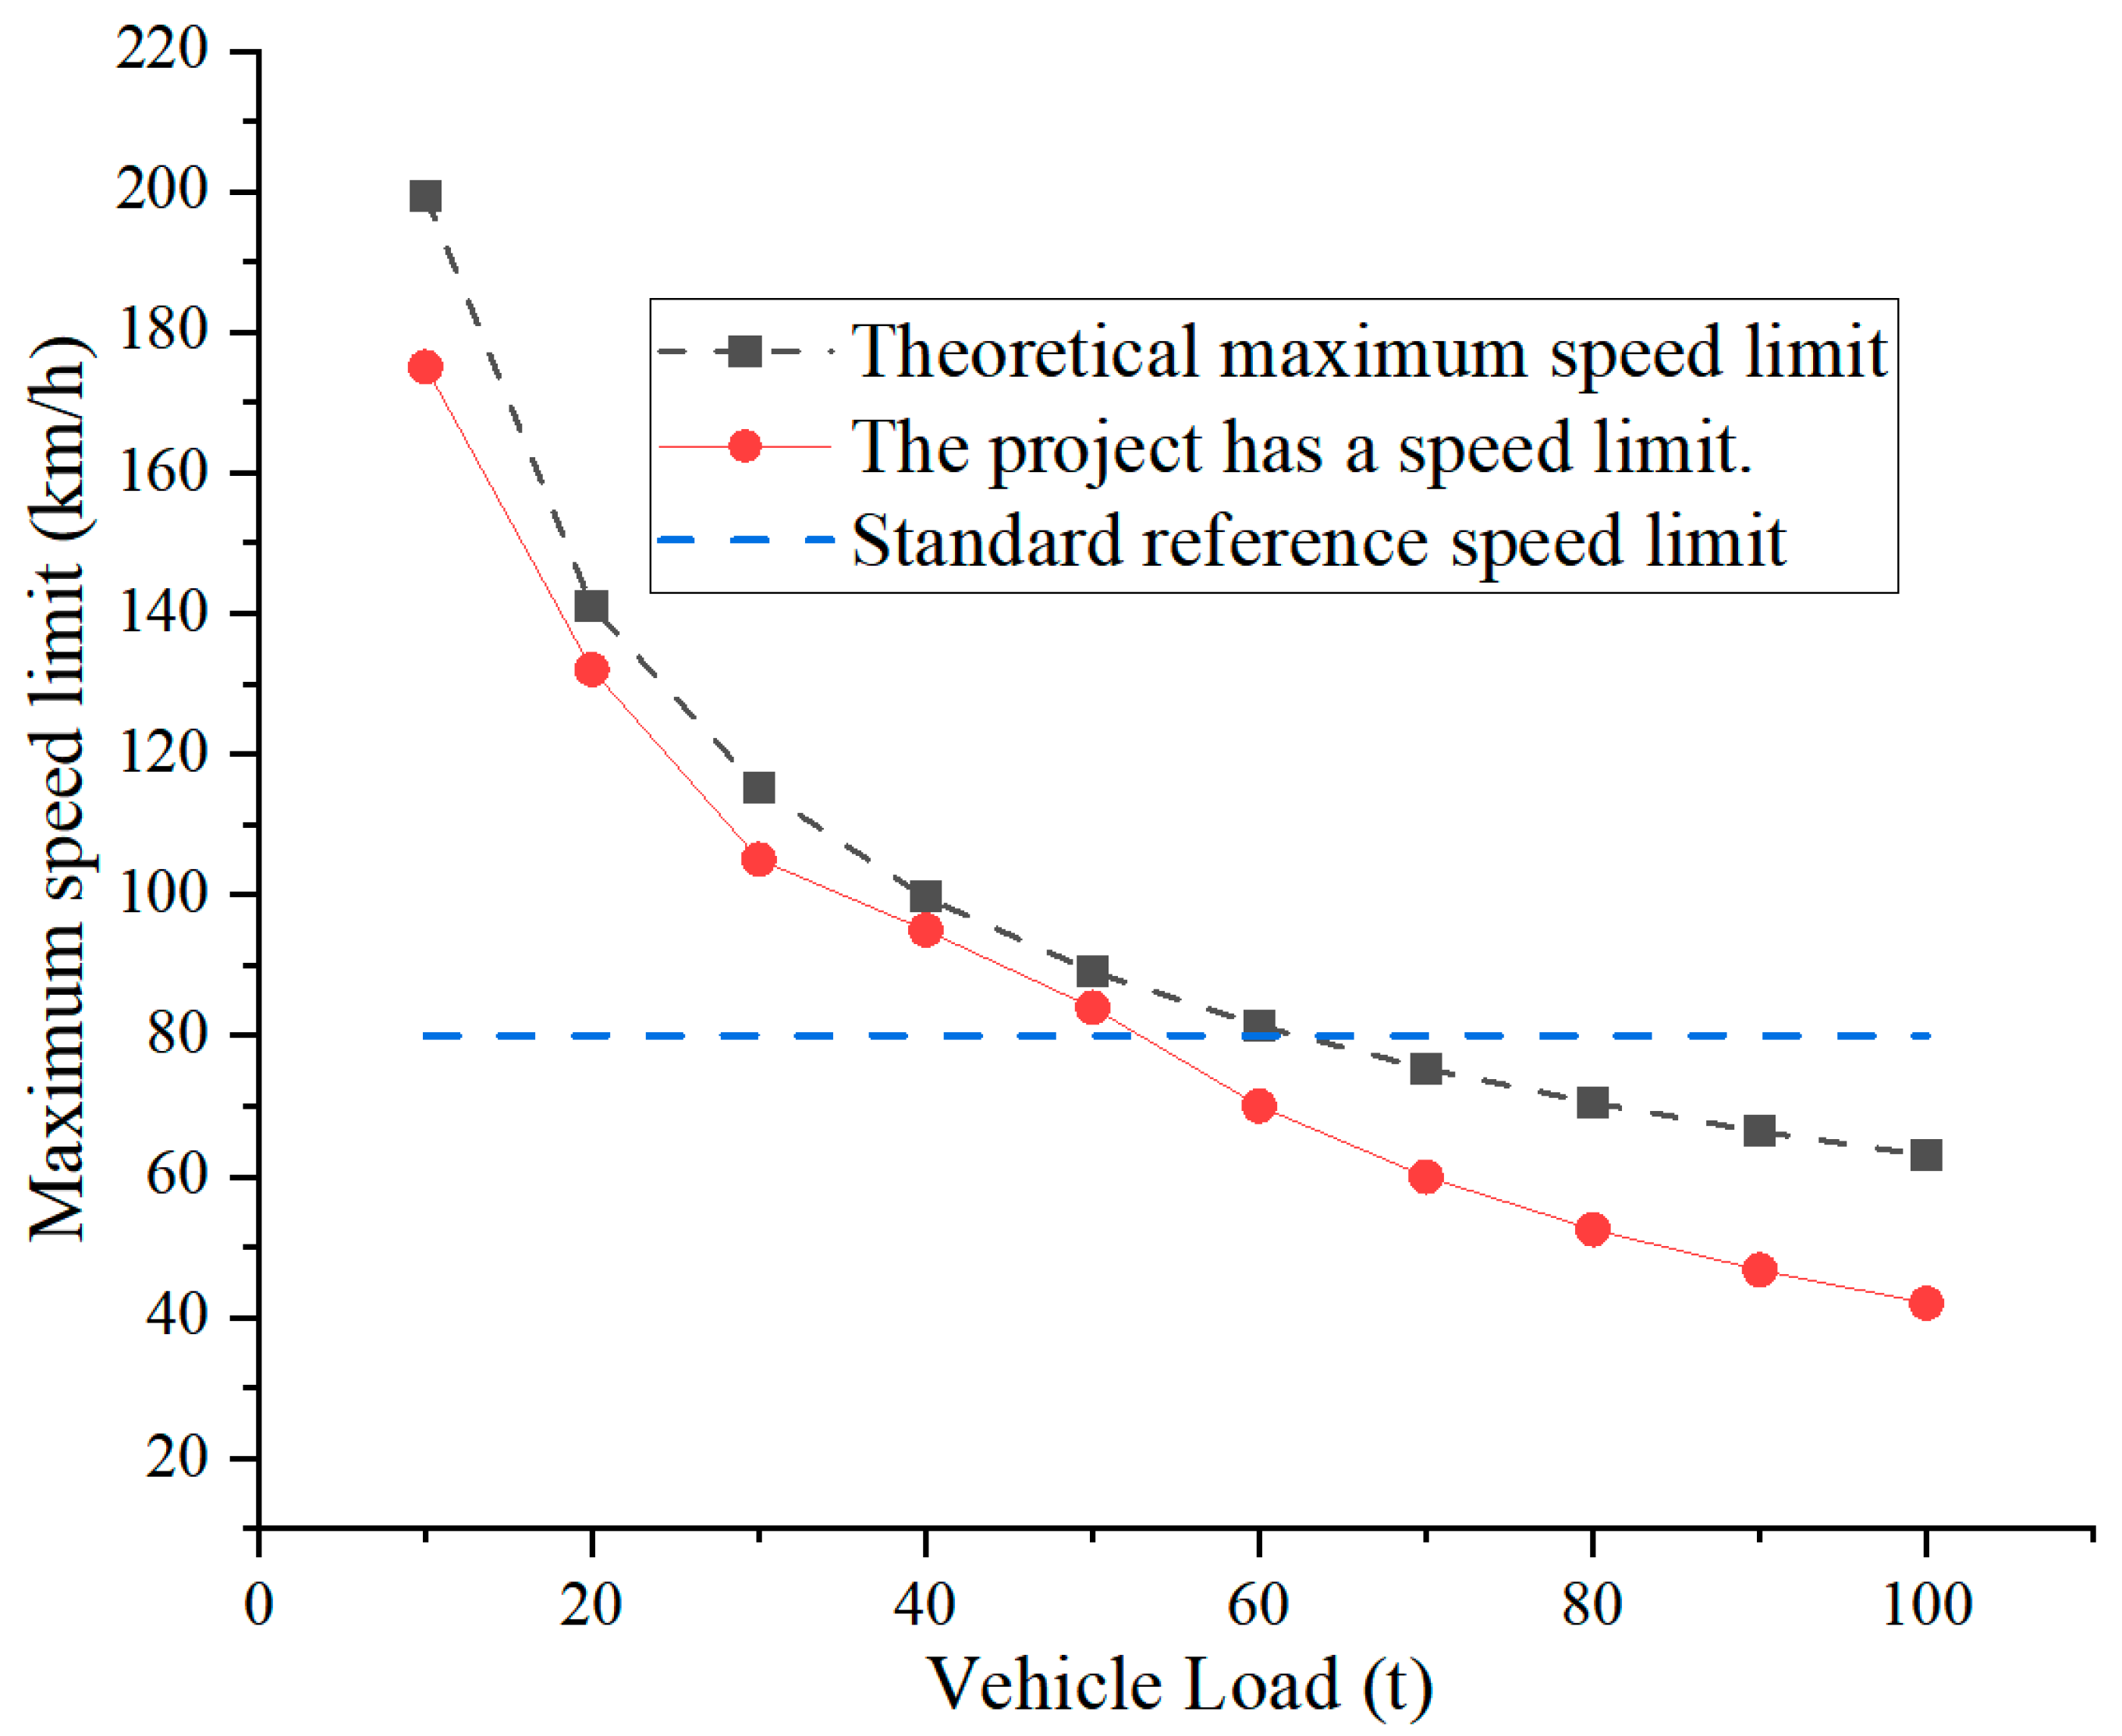
According to the above research results, the maximum and maximum vibration velocity of bridge pavement under vehicle load are obtained through theoretical analysis, as shown in Figure 11.
According to the above table, some urban bridges mark the speed limit of 30 km/h. According to the Ministry of Communications “over-limit transport vehicles driving highway management regulations”, the total design load of vehicles and goods cannot exceed 55 tons. Through calculation, the maximum speed of 60-ton vehicles is 81.4 km/h, which is larger than the specification, because the safety factor is larger in the specification.
The current regulatory limit of 55 tons for bridge safety requires re-evaluation considering actual traffic loads and structural response characteristics. Research indicates that as vehicle weight increases, dynamic responses exhibit nonlinear amplification, particularly under high-speed driving conditions where dynamic loading effects significantly intensify structural vibrations and internal force magnitudes. For example, a 100-ton vehicle can induce mid-span vibration velocities of −26.6 cm/s, far exceeding the response level of a 55-ton vehicle. The peak tensile stress in such cases more readily approaches or breaches concrete tensile strength limits, creating safety hazards when combined with fatigue and seismic forces. While the current 55-ton static load limit provides some safety margin, it fails to adequately account for speed–weight coupling effects and the structural sensitivity of long-span bridges to heavy loads, making it inadequate for comprehensively preventing cumulative damage and sudden risks from overloaded vehicles. In this context, real-time vehicle speed monitoring systems play a crucial role: By deploying weighing-in-motion (WIM) and speed-sensing devices at bridge entrances and critical sections, these systems enable dynamic identification and integrated analysis of vehicle loads and speeds. Upon detecting high-risk combinations (e.g., ≥40 tons and ≥60 km/h), they immediately trigger warnings, speed restrictions, or traffic control measures to prevent excessive structural stress under extreme loading conditions. Simultaneously, monitoring data can be used to build bridge health profiles, supporting performance-based maintenance decisions and load limit policy optimization. This approach transforms passive defense into proactive regulation, significantly enhancing the safety and durability of long-span bridges in complex operational environments.
Furthermore, integrating transverse or in situ prestressing techniques into the deck can enhance structural integrity and suppress additional tensile stresses caused by torsion or eccentric loading. To compensate for prestress loss due to long-term concrete creep and shrinkage effects, appropriate increases in prestress reserves (e.g., through over-tensioning or post-compression) should be implemented to maintain sufficient effective prestressed stress throughout the service life. Evaluations demonstrate that exceeding structural response-calibrated safety thresholds (e.g., 81.4 km/h for 60-ton trucks) significantly reduces the structural safety margins of prestressed bridges. As vehicle speeds increase, moving loads approach the bridge’s fundamental frequency, triggering resonance effects that dramatically amplify mid-span vibration velocity, acceleration, and dynamic stress. For instance, vibrations induced by 60-ton trucks at 80 km/h are nearly 2.5 times greater than those at 50 km/h, with dynamic load factors potentially exceeding 1.4–1.6—far surpassing the code-recommended static amplification range of 1.05–1.2. This not only intensifies tensile stress amplitudes in main beams and increases fatigue damage accumulation risks, but may also induce localized failures such as bearing seat voiding and prestress anchorage zone loosening. Particularly under prolonged repetitive loading, microcrack propagation will reduce structural stiffness and durability, substantially weakening the originally code-designed safety margins (typically corresponding to reliability index β ≥ 3.2) and even approaching failure thresholds.

4.5. Mathematical Model Based on Vehicle–Bridge Vibration Coupling Relationship

The maximum speed limit under different vehicle weights is derived by the threshold of critical vibration velocity, and a complete calculation framework is formed by adding the engineering safety factor.

4.5.1. Establishment of Basic Mathematical Model (Based on Critical Value of Vibration Velocity)

According to the fitting results of historical data, the interaction relationship between vibration velocity, vehicle weight, and speed is
y = 0.004 wv 2.17 ( R 2 = 0.986 )
This model indicates that the vibration velocity is mainly determined by the product of weight and velocity. And this relationship shows a strong nonlinear positive correlation. The critical vibration velocity threshold for the safe operation of the bridge needs to be determined through dynamic testing of the bridge structure. In this example, the threshold shown in Figure 12 is used as an example.
v max = V crit + 2.17 0.004 w = 23.03 + 2.17 0.004 w = 25.2 0.004 w = 6300 w
The general formula (including safety k     1   f actor) is
v max = V crit + 2.17 0.004 w k = 6300 w k
where k   =   1 is the theoretical critical value, k   >   1 k   =   1 . 5 indicates the engineering safety factor, for example, indicating that the speed limit ratio is reduced by 50% compared with the theoretical value.

4.5.2. Effects of Nonlinear Behavior on Safety Thresholds

The safety threshold of the bridge structure can be significantly changed by long-term nonlinear behavior, which needs to be quantified by a dynamic correction model.
The combined effects of long-term creep and prestress loss gradually reduce structural stiffness. For example, when the creep coefficient φ = 0.82 and prestress loss σ_l = 0.12 fpk, the equivalent stiffness E·I of the main beam decreases by 25%. The derived dynamic load safety threshold requires the introduction of a time-dependent correction factor K(t):
K(t) = 1 + α ∗ ϕ(t) + β ∗ σloss
where α = 0.5 and β = 0.3 are material parameters. Taking a 40-ton vehicle as an example, the revised safety speed limit is reduced from the original calculated value of 81.4 km/h to 72.6 km/h (Table 10) to avoid frequent excitation in the resonance zone (2.3 Hz ± 10%).
Dynamic adjustment strategy of security threshold:
It is suggested to dynamically adjust the speed limit according to the vehicle weight, and its relationship formula is
vallow(W) = v0 ∗ (1 − (W − Wdesign)/Wmax ∗ η)
The design speed limit is v0 = 81.4 km/h, the standard load capacity is W_design = 55 tons, the maximum overload capacity is W_max = 100 tons, and the correction factor η = 0.15. For example, when the vehicle weight is W = 60 tons, the allowable speed v_allow(60) = 81.4 · (1 − (60 − 55)/100 · 0.15) ≈ 80.2 km/h, which is 1.2 km/h lower than the original speed limit (Table 11).

4.5.3. Model Parameter Calibration and Engineering Correction

Test method: Through the dynamic load test of the bridge, the vibration response under different loads is measured, and the vibration velocity corresponding to the starting point of structural fatigue damage is taken.
Backward calculation method: Use the standard speed limit w   =   55 v   =   60   km / h   for reversal; for example, when the tonnage is at the upper limit of the traffic department’s over-limit regulations, if the standard speed limit is, then
V crit = 0.004   ×   55   ×   60     2.17 = 13.2     2.17 = 11.03  
This shows that the specification implicitly has a lower critical value and reflects the safety margin.
Through the above mathematical model, the mapping relationship between vehicle weight and bridge safety speed limit can be established quantitatively, which provides a scientific basis for load control of bridge operation management and realizes the technical upgrade from “experience speed limit” to “data-driven speed limit”.
A comprehensive study on the impact of vehicle weight and speed on bridge component tensile stress under seismic loads reveals that dynamic responses significantly intensify with increasing vehicle tonnage and speed. This leads to substantially elevated tensile stress levels in critical components like main beams. Heavy vehicles (e.g., 100-ton models) not only directly increase mid-span moments through vertical load amplification (positively correlated with static loads), but also amplify structural vibrations (e.g., reaching 26.6 cm/s at 80 km/h) and tensile stress responses due to high-speed driving-induced dynamic loading effects, increased impact coefficients, and intensified vehicle–bridge coupling vibrations. Stress concentration particularly occurs in vulnerable mid-span locations, potentially accelerating concrete cracking or prestressed tendon fatigue when combined with seismic loads. Therefore, it is recommended to incorporate the coupled effects of vehicle weight and speed (e.g., using “mass × speed2” as dynamic load indicators) into performance-based bridge design codes. Establishing multi-level defense standards considering traffic load spectra, introducing dynamic load amplification coefficients, setting differentiated speed–weight control thresholds, and integrating measured vibration velocity critical values with safety factors will create a performance-driven design framework for vehicle–bridge–seismic interactions. This approach upgrades from “static load-bearing capacity design” to “dynamic resilience regulation,” enhancing bridge safety and robustness under composite disaster scenarios.
In large cantilever structures such as construction segments of continuous rigid frame bridges and large cantilever beams, the application of prestressing technology plays a decisive role in alleviating tensile stress concentration at critical locations. Evaluations demonstrate that rational arrangement of prestressing tendons can reduce maximum tensile stress at the cantilever base (i.e., the lower edge of the pier cap section) by 60% to 85%. For instance, in a typical prestressed concrete continuous rigid frame bridge with a 60–120 m span, tensile stress at the mid-span lower edge caused solely by self-weight and construction loads can reach 2.5–3.8 MPa—exceeding the tensile strength standard value of C50 concrete, which easily triggers early cracking. However, by installing cantilever prestressing tendons in the deck slab, tensile stress in this area can be controlled within the range of 0.3–0.7 MPa, meeting the requirement in the “General Specifications for Highway Bridge and Culvert Design” (JTG D60) that “the tensile stress limit under temporary conditions should not exceed 0.7,” thereby effectively preventing cracking.
The mechanism of prestressing in alleviating tensile stress concentration operates through establishing counter-moment and prestress fields within the structure, which counterbalance the positive bending moments generated by external loads (particularly self-weight and construction live loads). In the high negative moment zone at the cantilever base, the compressive stress from top prestressing tendons directly compensates for tensile stresses induced by bending along the lower edge. This significantly improves the uniformity of stress distribution across the cross-section, preventing localized stress fluctuations and crack propagation. Furthermore, prestressing enhances structural stiffness, reduces deflection deformation, and further suppresses the generation of additional secondary stresses.
There exists a synergistic relationship between this effect and the safety factors specified in codes. The material sub-item coefficients (e.g., concrete γ_c = 1.4), load combination coefficients, and stress limits in codes are inherently designed as redundant safeguards against material variability, construction deviations, and unforeseen loads. Through active stress regulation, prestressing technology enables structures to remain well beyond cracking thresholds during normal service limit states, thereby substantially enhancing the structural reliability index β. This effectively increases the inherent safety margin without increasing component dimensions. In other words, prestressing not only fulfills the “passive verification” requirements of codes but also enhances structural resilience and durability through an “active control” mechanism.
Therefore, prestressing technology is not only an effective means to meet the safety factor requirements stipulated by current standards, but also a core technology that enables the bridge structure to achieve high performance and long lifespan. During the design stage, it is necessary to rely on detailed stress analysis to optimize the arrangement of prestressing tendons, the timing of tensioning, and the sequence of batch tensioning—this approach can not only minimize the risk of concentrated tensile stress, but also ensure that the structural safety margin remains within a reasonable range under various working conditions such as construction and operation. In addition, the influence of environmental factors such as temperature, humidity, and material creep and shrinkage, as well as the long-term nonlinear behavior of concrete and prestressing tendons, should be fully considered. Based on this, the speed threshold for structural response should be determined through multi-factor coupling analysis.
5. Conclusions

During the construction phase, the compressive stress of the bridge is controlled by prestress and complies with the specifications. The maximum tensile stress of the main beam occurs at the stage when the tensile force of the reinforcing bars in the top abutment section increases. This tensile stress is also in compliance with the specifications. Under the negative bending moment of the top of the bridge piers, the tensile stress at the upper edge and the pre-applied stress reach their peaks simultaneously. The tensile stress in the mid-span closed section is transferred to the lower edge, significantly reducing the bending moment. Conclusion: The stress during the construction phase is overall in compliance with the specifications; the top abutment section is the key area for tensile stress; the stress transfer in the mid-span closed section can significantly reduce the bending moment. Recommendation: During construction, stress monitoring in the top abutment section and the mid-span closed section should be strengthened.
The design adopts a “gradient prestress” configuration. In the negative bending moment area at the top of the piers, the prestress density is increased to reserve anticracking capacity. In the closed section at the mid-span, the bottom prestressed bars are strategically arranged to prevent brittle failure. The optimized distribution can enhance the redundancy and damage tolerance of the structure. The prestress can significantly reduce the tensile stress concentration in the cantilever structure. The mechanism is to establish the reverse bending moment and pre-pressurized stress field, which has a synergistic effect with the safety factor specified in the code. Conclusion: The gradient prestress configuration can improve the structural performance; the prestress can effectively alleviate the tensile stress concentration; the prestress and the safety factor specified in the code can synergistically enhance the effect. Recommendation: During design, optimize the layout of the prestressed bars in combination with detailed analysis.
Under extreme loads, tensile stress may occur at the top of the bridge piers, so non-prestressed reinforcing bars need to be added to enhance ductility. Fiber-reinforced concrete or dampers should be used in key areas to prevent brittle failure. During the construction of the inclined section of the main beam, the main tensile stress slightly exceeds the allowable value, which poses a risk. The design needs to be optimized to improve performance. Conclusion: The tensile stress at the top of the bridge piers under extreme loads should be given attention; there is a risk of excessive tensile stress in the inclined section of the main beam; reasonable measures can enhance the structural risk resistance capacity. Recommendation: Targeted strengthening measures should be taken for the top of the bridge piers and the inclined section of the main beam.
The weight and speed of vehicles affect the stress of bridges. The current 55-ton static load limit standard has some deficiencies and needs to be combined dynamically with traffic management and structural performance. The coupling effect of vehicle weight and speed, as well as the influence of earthquakes, is significant and should be included in the design specifications. Conclusion: The weight and speed of vehicles have a significant impact on the stress of bridges; the current static load limit standard needs to be improved; dynamic management can enhance the safety of bridges. Recommendation: Establish a dynamic monitoring and control system based on vehicle weight and speed.
The framework proposed in this paper is applicable to the damage identification and safety threshold analysis of cast-in-place continuous rigid frame bridges, and its effectiveness has been verified through measured data (e.g., a 6% error in the speed limit for a 40-ton vehicle). Future research will expand to the damage mechanisms of steel bridges and composite bridges, optimize damage indicators by considering material property differences, and plan to enhance the universality of the framework through comparative analysis of multiple cases. The damage index system proposed in this paper (maximum tensile stress, vibration velocity threshold, and modal curvature change rate) is suitable for the long-term safety monitoring of cast-in-place continuous rigid frame bridges. Future research will extend to other bridge types (such as cable-stayed bridges and arch bridges) and combine multi-source data-driven methods to improve the universality of the indicators. The reliability under extreme conditions (earthquake events, overload) needs further discussion.

Author Contributions

Conceptualization, X.Y., N.Y., H.C., M.Y., and T.W.; Methodology, X.Y. and T.W.; Software, H.C. and M.Y.; Validation, H.C. and M.Y.; Formal Analysis, X.Y. and H.C.; Investigation, H.C.; Resources, T.W.; Data Curation, M.Y.; Writing—Original Draft Preparation, X.Y., N.Y., H.C., M.Y., and T.W.; Writing—Review and Editing, X.Y., N.Y., H.C., M.Y., and T.W.; Visualization, X.Y. and N.Y.; Supervision, H.C., M.Y., and T.W.; Project Administration, H.C., M.Y., and T.W.; Funding Acquisition, X.Y. and T.W. All authors have read and agreed to the published version of the manuscript.

Funding

This work was supported in part by the Science and Technology Research Project of Henan Province under Grant 242102241014 and in part by the Key Scientific Research Projects of Colleges and Universities in Henan Province under Grant No. 24B560029. This study was supported by the Xuchang City Key R&D and Promotion Special Project (Grant Number 20230211016). This study was supported by New Round Key Discipline of Civil and Hydraulic Engineering of Henan, China (grant no. 2023414349) and Xuchang Innovation Center of Intelligent Construction and Building Industrialization Technology. This study was sponsored by the National Natural Science Foundation of China (Grant No. 52308393) and the State Key Laboratory of Precision Blasting and Hubei Key Laboratory of Blasting Engineering, Jianghan University (Grant No. PBSKL2023B2).

Data Availability Statement

The original contributions presented in the study are included in the article, further inquiries can be directed to the corresponding author.

Conflicts of Interest

The authors declare no conflicts of interest.

References

  1. Mevel, L.; Goursat, M.; Basseville, M. Stochastic subspace-based structural identification and damage detection and localization-application to the Z24 bridge benchmark. Mech. Syst. Signal Process. 2003, 17, 143–151. [Google Scholar] [CrossRef]
  2. Liu, H.-B.; Jiao, Y.-B. Application of genetic algorithm-support vector machine (GA-SVM) for damage identification of bridge. Int. J. Comput. Intell. Appl. 2011, 10, 383–397. [Google Scholar] [CrossRef]
  3. Zhu, J.; Xiao, R. Damage identification of long-span concrete cable-stayed bridge based on periodic detection and genetic algorithms. Tumu Gongcheng Xuebao/China Civ. Eng. J. 2006, 39, 85–89. Available online: https://www.researchgate.net/publication/283750100_Damage_identification_of_long-span_concrete_cable-stayed_bridge_based_on_periodic_detection_and_genetic_algorithms (accessed on 7 September 2025).
  4. Jing, L.J.; Xiang, Y.Q. Damage identification of main girders for long span cable-stayed bridge based on flexibility matrix. J. Zhejiang Univ. (Eng. Sci.) 2008, 42, 164. [Google Scholar]
  5. Lei, W.; Wang, Q.; Liao, H.; Shao, C. Experimental and numerical studies on VIV characteristics of π-shaped composite deck of a cable-stayed bridge with 650 m main span. Wind. Struct. 2024, 38, 93–107. [Google Scholar] [CrossRef]
  6. Zhu, J.; Zhang, Y.; Zhou, S.; Rong, W. Thermal effect analysis of a steel truss cable-stayed bridge with two-layer decks under sunlight. Adv. Struct. Eng. 2024, 27, 119–133. [Google Scholar] [CrossRef]
  7. Pailes, B.M. Damage Identification, Progression, and Condition Rating of Bridge Decks Using Multi-Modal Non-Destructive Testing. Bachelor’s Thesis, Rutgers University, New Brunswick, NJ, USA, 2014. [Google Scholar]
  8. Xu, Z.; Yu, D.-H.; Tong, H.-N. Damage Identification of Simply Supported Bridges Using Static Responses: Unified Framework and Feasibility Study. Int. J. Struct. Stabil. Dyn. 2023, 23, 1101–1119. [Google Scholar] [CrossRef]
  9. Zhou, Y.; Li, M.; Shi, Y. Damage Identification Method of Tied-Arch Bridges Based on the Equivalent Thrust-Influenced Line. J. Struct. Control Health Monit. 2024, 2024, 20. [Google Scholar] [CrossRef]
  10. Zhou, X.; Li, M.; Liu, Y. Cross-domain damage identification of bridge based on generative adversarial and deep adaptation Networks. J. Struct. 2024, 64, 1020–1036. [Google Scholar] [CrossRef]
  11. Zhang, Y. Bridge Damage Identification. Ph.D. Thesis, Huazhong Normal University, Wuhan, China, 2021; pp. 1–13. [Google Scholar]
  12. Liang, Y.; Huan, S.; Tao, W. Research on Damage Identification of Bridge Based on Digital Image Measurement. IOP Conf. Ser. Mater. Sci. Eng. 2017, 274, 012045. [Google Scholar] [CrossRef]
  13. NetAnswer. Bridge damage identification from measured natural frequencies. In Proceedings of the Rilem International Workshop on Performance-based Specification & Control of Concrete Durability, Zagreb, Croatia, 11–13 June 2014; Volume 11, pp. 1–12. [Google Scholar]
  14. Zhang, W. Damage identification method of large-span bridge dilatation joint. Structures 2015, 13, 1035–1046. [Google Scholar]
  15. Wang, W.Z.; Dan, D.H.; Gao, J.Q. Study on damage identification of high-speed railway truss bridge based on statistical steady-state strain characteristic function. Eng. Struct. 2023, 287, 115867. [Google Scholar] [CrossRef]
  16. Shan, D.; Fu, C.; Li, Q. Experimental investigation of damage identification for continuous railway bridges. J. Mod. Transp. 2012, 20, 1–9. [Google Scholar] [CrossRef]
  17. Li, C. Research on online damage identification for steel cable stayed bridge in Anqing. In Proceedings of the 2011 International Conference on Electric Information and Control Engineering, Wuhan, China, 15–17 April 2011; IEEE: Piscataway, NJ, USA, 2011; Volume 1, pp. 1–13. [Google Scholar] [CrossRef]
  18. Li, Z. Damage Identification of Bridges from Signals Measured with a Moving Vehicle. Ph.D. Thesis, University of Hong Kong, Pokfulam, Hong Kong, 2014. [Google Scholar] [CrossRef]
  19. Lu, X.J.; Zhang, P. An Identification Method of Bridge Structural Damage Based on Fourier Transform and Neural Network in Electronic Information Engineering; Springer: Berlin/Heidelberg, Germany, 2012; Volume 15, pp. 1–26. [Google Scholar] [CrossRef]
  20. Zhang, Y.; Xiong, Z.; Liang, Z. Structural Damage Identification System Suitable for Old Arch Bridge in Rural Regions: The Random Forest Approach. Comput. Model. Eng. Sci. 2023, 136, 23. [Google Scholar] [CrossRef]
  21. Zhang, L.; Cheng, X.; Wu, G. Reference-free damage identification method for highway continuous girder bridges based on long-gauge fibre Bragg grating strain sensors. Measurement 2022, 195, 111064. [Google Scholar] [CrossRef]
  22. Zhang, Y.; Zhu, J. Damage identification for bridge structures based on correlation of the bridge dynamic responses under vehicle load. Structures 2021, 33, 68–76. [Google Scholar] [CrossRef]
  23. Adhikari, R.; Jha, P.; Bhatt, L.; Thapa, D.; Forcellini, D.; Gautam, D. Failure Investigation of under Construction Prestressed Concrete Bridge in Chitwan, Nepal. Infrastructures 2022, 7, 14. [Google Scholar] [CrossRef]
  24. Forcellini, D. Assessment of the Seismic Vulnerability of Bridge Abutments with 3D Numerical Simulations. Geosciences 2022, 12, 316. [Google Scholar] [CrossRef]
  25. Seyyed, R.A.; Ali, A.; Mahmoud, M.R.T. Assessment, identifying, and presenting a plan for the stabilization of loessic soils exposed to scouring in the path of gas pipelines, case study: Maraveh-Tappeh city. Eng. Geol. 2024, 342, 107747. [Google Scholar] [CrossRef]
  26. Li, H. Study on Vehicle-Induced Vibration and Fatigue Performance of Long-Span Bridges. Ph.D. Thesis, Chang’an University, Xi’an, China, 2004; pp. 1–25. (In Chinese). [Google Scholar]
  27. JTG D62-2024; Code for Design of Highway Reinforced Concrete and Prestressed Concrete Bridges and Culverts. People’s Transportation Press: Beijing, China, 2024.
  28. Wang, L. Research on Bridge Fatigue Load Model and Life Prediction Based on Measured Traffic Flow; Tongji University: Shanghai, China, 2012; pp. 18–75. (In Chinese) [Google Scholar]
  29. Sun, B. Static and Dynamic Analysis of Continuous Rigid Frame Bridge Based on MIDAS and Verification by Load Testing; Lanzhou Jiaotong University: Lanzhou, China, 2013; pp. 38–68. (In Chinese) [Google Scholar]
  30. Bagheri, M.; Jamkhaneh, M.E.; Samali, B. Effect of Seismic Soil-Pile-Structure Interaction on Mid- and High-Rise Steel Buildings Resting on a Group of Pile Foundations. Int. J. Geomech. 2018, 18, 4018103.1–4018103.27. [Google Scholar] [CrossRef]
Figure 1. Schematic diagram of the overall structure of the bridge (unit: cm).
Buildings 15 03282 g001
Figure 2. Schematic diagram of the numerical model.
Buildings 15 03282 g002
Figure 3. Main beam stress analysis during construction (unit: MPa).
Buildings 15 03282 g003
Figure 4. The verification results of the crack resistance of the normal section.
Buildings 15 03282 g004
Figure 5. The verification results of the crack resistance of the inclined section.
Buildings 15 03282 g005
Figure 6. Different vibration speeds caused by the bridge: (a) 10 t; (b) 30 t; (c) 50 t; (d) 80 t; (e) 100 t.
Buildings 15 03282 g006
Figure 7. Maximum vibration speed of the bridge with different weight vehicles.
Buildings 15 03282 g007
Figure 8. Bridge displacement under different vehicle loads.
Buildings 15 03282 g008
Figure 9. Reflection of the incident P wave on the free surface of concrete.
Buildings 15 03282 g009
Figure 10. Relation between critical velocity and incidence angle.
Buildings 15 03282 g010
Figure 11. The comparison of calculation results.
Buildings 15 03282 g011
Figure 12. Comparison of calculation results of the mathematical model.
Buildings 15 03282 g012
Table 1. List of numerical simulation parameters.
TypeUnitTypeUnit
Individual support stiffness107 kN/mAxial tensile ultimate strength of the bridge deck3.30 MPa
Beam stiffness106 kN/mStandard-strength nominal diameter of the prestressing bar bundle1860 MPa
Stiffness of the cast-in-place full-layer support106 kN/mUltimate compressive strength of the bridge abutment37.0 MPa
Elastic modulus of the main beam3.60 × 104 MPaBlock weight of the pier26 kN/m3
Elastic modulus of the pier3.60 × 104 MPaElastic modulus of the bridge deck1.95 × 105 MPa
Overall weight of the main beam26 kN/m3
Table 2. Comparison between actual monitoring point data and numerical simulation monitoring data.
Point NumberActual Monitoring Data/(cm/s)Numerical Simulation Monitoring Data/(cm/s)Percentage of Error/(%)
1 #1.531.64.6
2 #2.312.19−4.76
3 #1.021.164.9
4 #1.061.125.6
5 #2.342.385.0
Table 3. Horizontal classification of prestress.
Prestress GradeHorizontal Prestress Application (as a Percentage of the Design Value P0)Absolute Prestress Value (kN)
Level 160%480
Level 275%600
Level 390% (design value)720
Level 4105%840
Level 5120%960
Note: P0 = 800 kN is the total design prestress force (equivalent axial force), corresponding to the total area of the prestressing tendons in the mid-span section of 1200 mm2, and the tension control stress is 1300 MPa.
Table 4. Maximum stress in the mid-span section of the main beam under different prestress levels (unit: MPa).
Prestress GradePrestress Level (%)Maximum Tensile Stress of the Lower Edge/MPaMinimum Compressive Stress of the Lower Edge/MPaMaximum Compressive Stress on the Upper Edge/MPaMinimum Compressive Stress on the Upper Edge/MPa
Level 160%+2.35−0.12−18.45−6.20
Level 275%+1.58−0.85−17.20−7.85
Level 390%+0.62−1.95−15.80−9.60
Level 4105%−0.38−3.10−14.50−11.30
Level 5120%−0.95−4.25−13.65−12.80
Note: A negative value represents compressive stress, and a positive value represents tensile stress.
Table 5. Long-term nonlinear characteristics of concrete.
Active TimeVarying Coefficient φ (t)Flexion Value (mm)Percentage Change of Deflection
Construction phase (t0 = 28 days)0.2512.3-
10 years of service (t = 10 years)0.4113.6+10.6%
30 years of service (t = 30 years)0.6814.2+15.4%
50 years of service (t = 50 years)0.8214.5+18.0%
Note: The calculation formula of the creep coefficient is φ(t) = 0.25 + 0.15·ln(t/28), and the deflection increment is derived based on the long-term creep effect.
Table 6. Long-term non-fatigue damage accumulation rate of concrete.
Vehicle Weight (ton)Speed of a Motor Vehicle (km/h)Cumulative Rate of Fatigue Damage (%)Increase Compared to the Static Load Condition
40105.2+5.2%
403012.7+12.7%
405023.0+23.0%
408035.8+35.8%
Note: Fatigue damage calculation is based on S-N curve theory. The damage rate of 40-ton vehicles is the highest at 50 km/h, which needs to be paid attention to.
Table 7. Influence of prestressed reinforcement corrosion on tensile stress at mid-span.
Rust Rate of Prestressing Tendons (%)Peak Stress (MPa)Rupture Stress Increases
0%1.2-
1%1.3+8.3%
3%1.4+16.7%
5%1.5+25.0%
Note: The peak tensile stress exceeds the specification limit by 12% at the corrosion rate of 3%, and the corrosion should be maintained through the anticorrosion coating.
Table 8. Comparison of speed limits after environmental factor correction.
Temperature Fluctuation (°C)Relative Humidity (RH%)Correction FactorOriginal Speed Limit (km/h)Speed Limit After Correction (km/h)
10601.00281.481.2
20501.01781.480.1
30401.09581.473.6
40301.18381.468.4
Table 9. Parameters of different-weight vehicles and bridge.
ArgumentBending Stiffness (N·m2)Damping Ratio ξSpeed v (m/s)Road Wavelength λ (m) Car Weight (t)
Bridge (120 m simple supported beams)5 × 1080.0520–1001020–100
Table 10. Comparison of speed limits after dynamic correction.
Parameter CombinationsVarying Coefficient φ (t)Presort Stress σloss (fpk)Correction Factor K (t)Original Speed Limit (km/h)Speed Limit After Correction (km/h)
Base working conditions0.250.001.0081.481.4
30 years of service0.680.121.1381.471.9
50 years of service0.820.151.2181.467.3
Note: The correction factor formula is K(t) = 1 + 0.5·ϕ(t) + 0.3·σloss K(t) = 1 + 0.5·ϕ(t) + 0.3·σloss. Speed limit adjustment is based on avoiding resonance zones (2.3 Hz ± 10%).
Table 11. Dynamic adjustment of vehicle weight and speed limit.
Vehicle Weight (ton)Recommended Speed Limit Value (km/h)
1086.9
2085.6
3084.3
4083.0
5081.7
5581.4
6080.2
7078.7
8077.2
10072.6
Disclaimer/Publisher’s Note: The statements, opinions and data contained in all publications are solely those of the individual author(s) and contributor(s) and not of MDPI and/or the editor(s). MDPI and/or the editor(s) disclaim responsibility for any injury to people or property resulting from any ideas, methods, instructions or products referred to in the content.