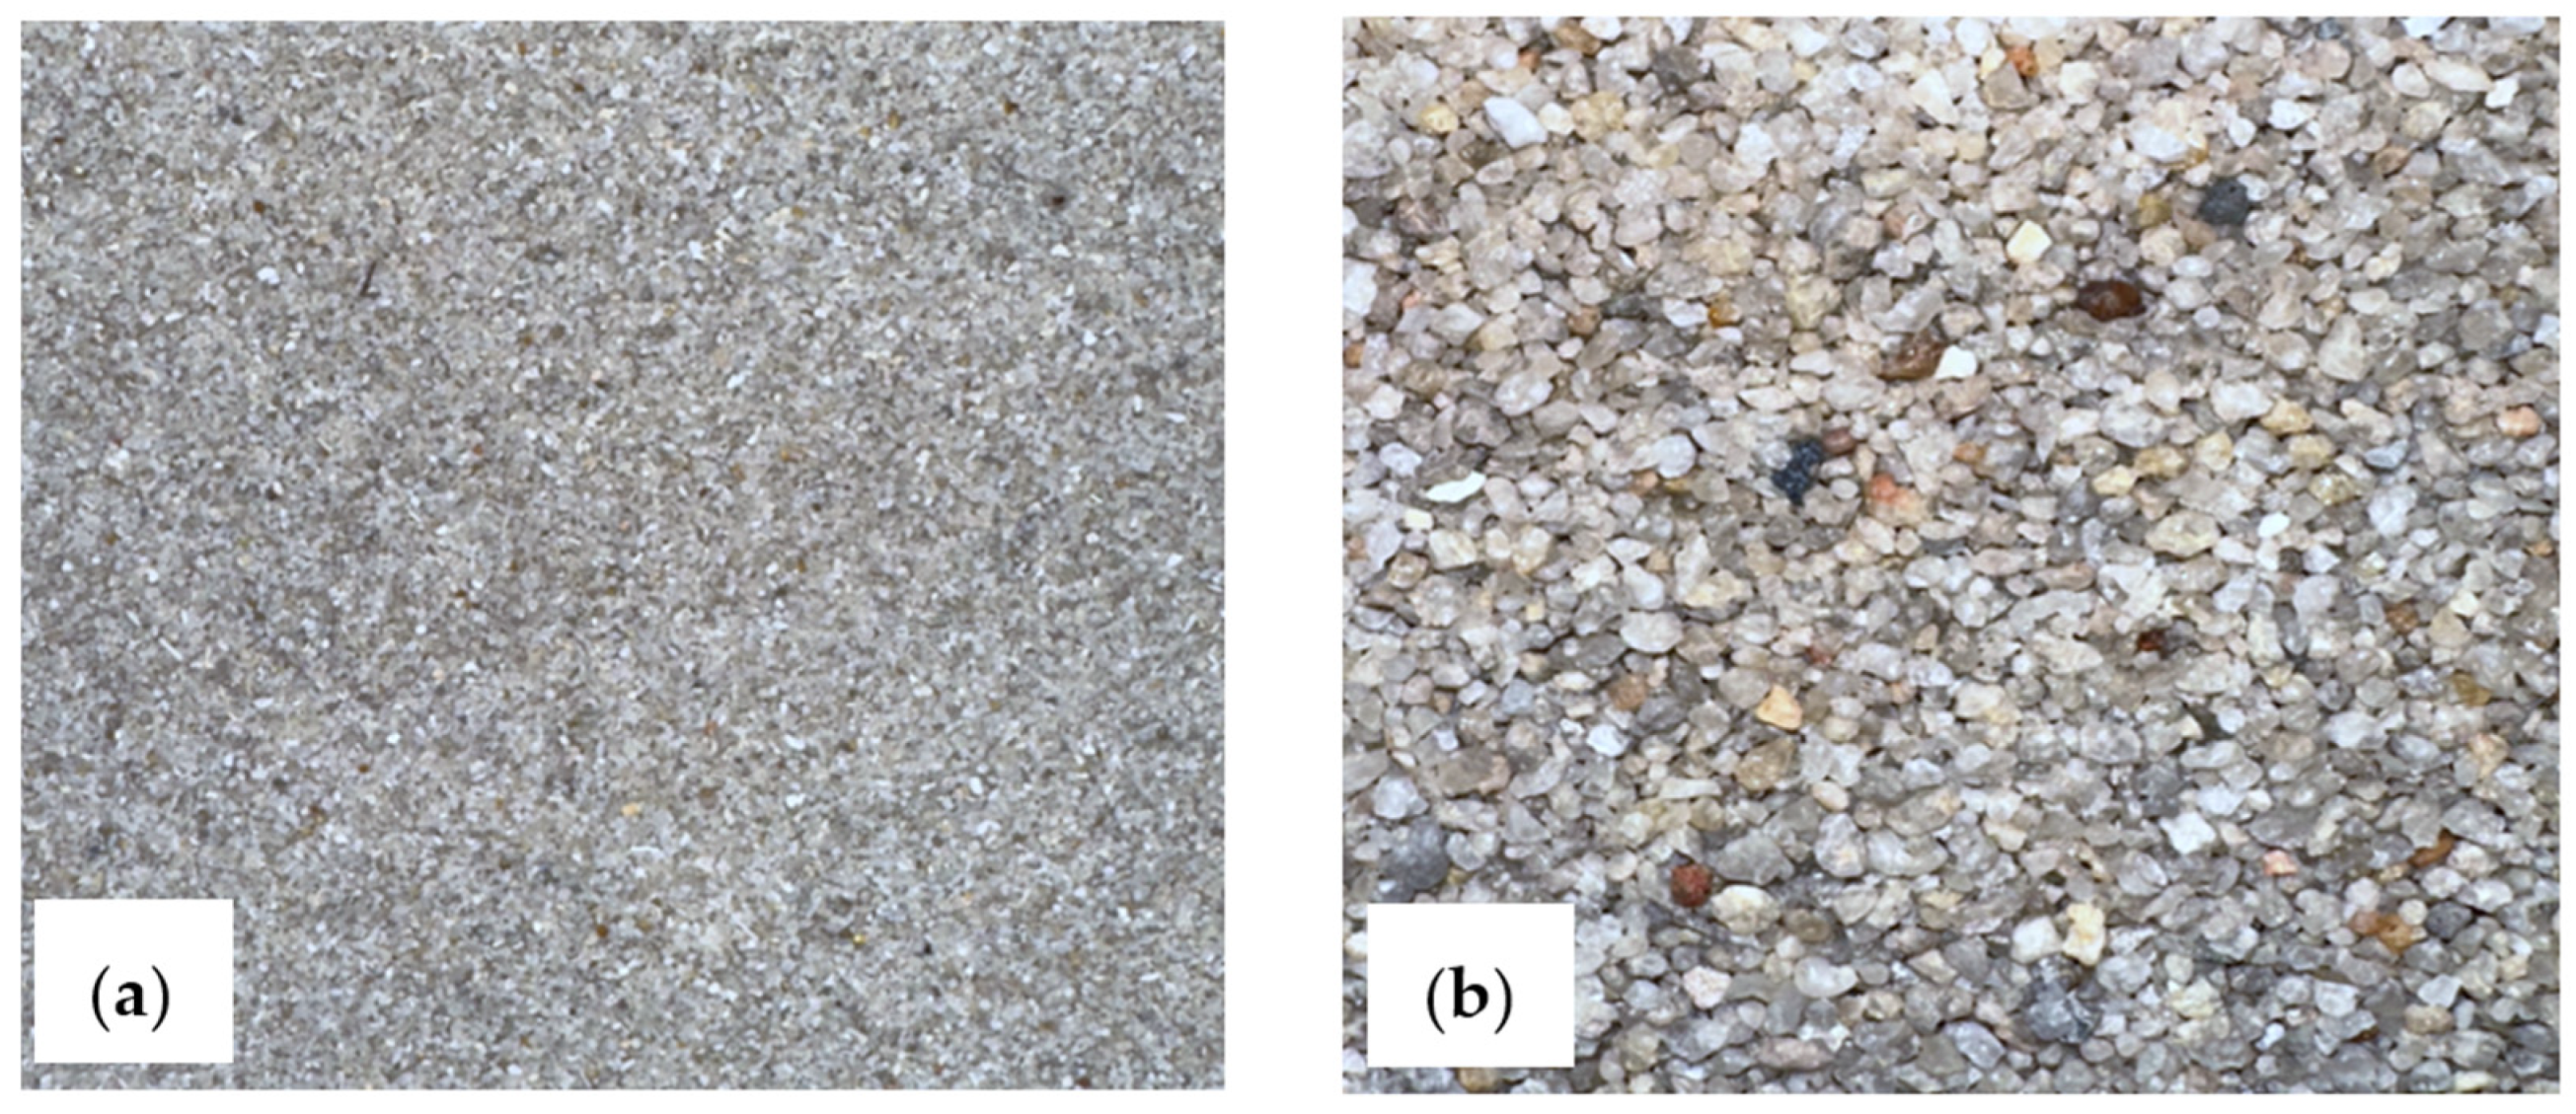
Figure 1.
Types of sand used in soil mixtures: (a) Sand-A, (b) Sand-B.
Figure 1.
Types of sand used in soil mixtures: (a) Sand-A, (b) Sand-B.
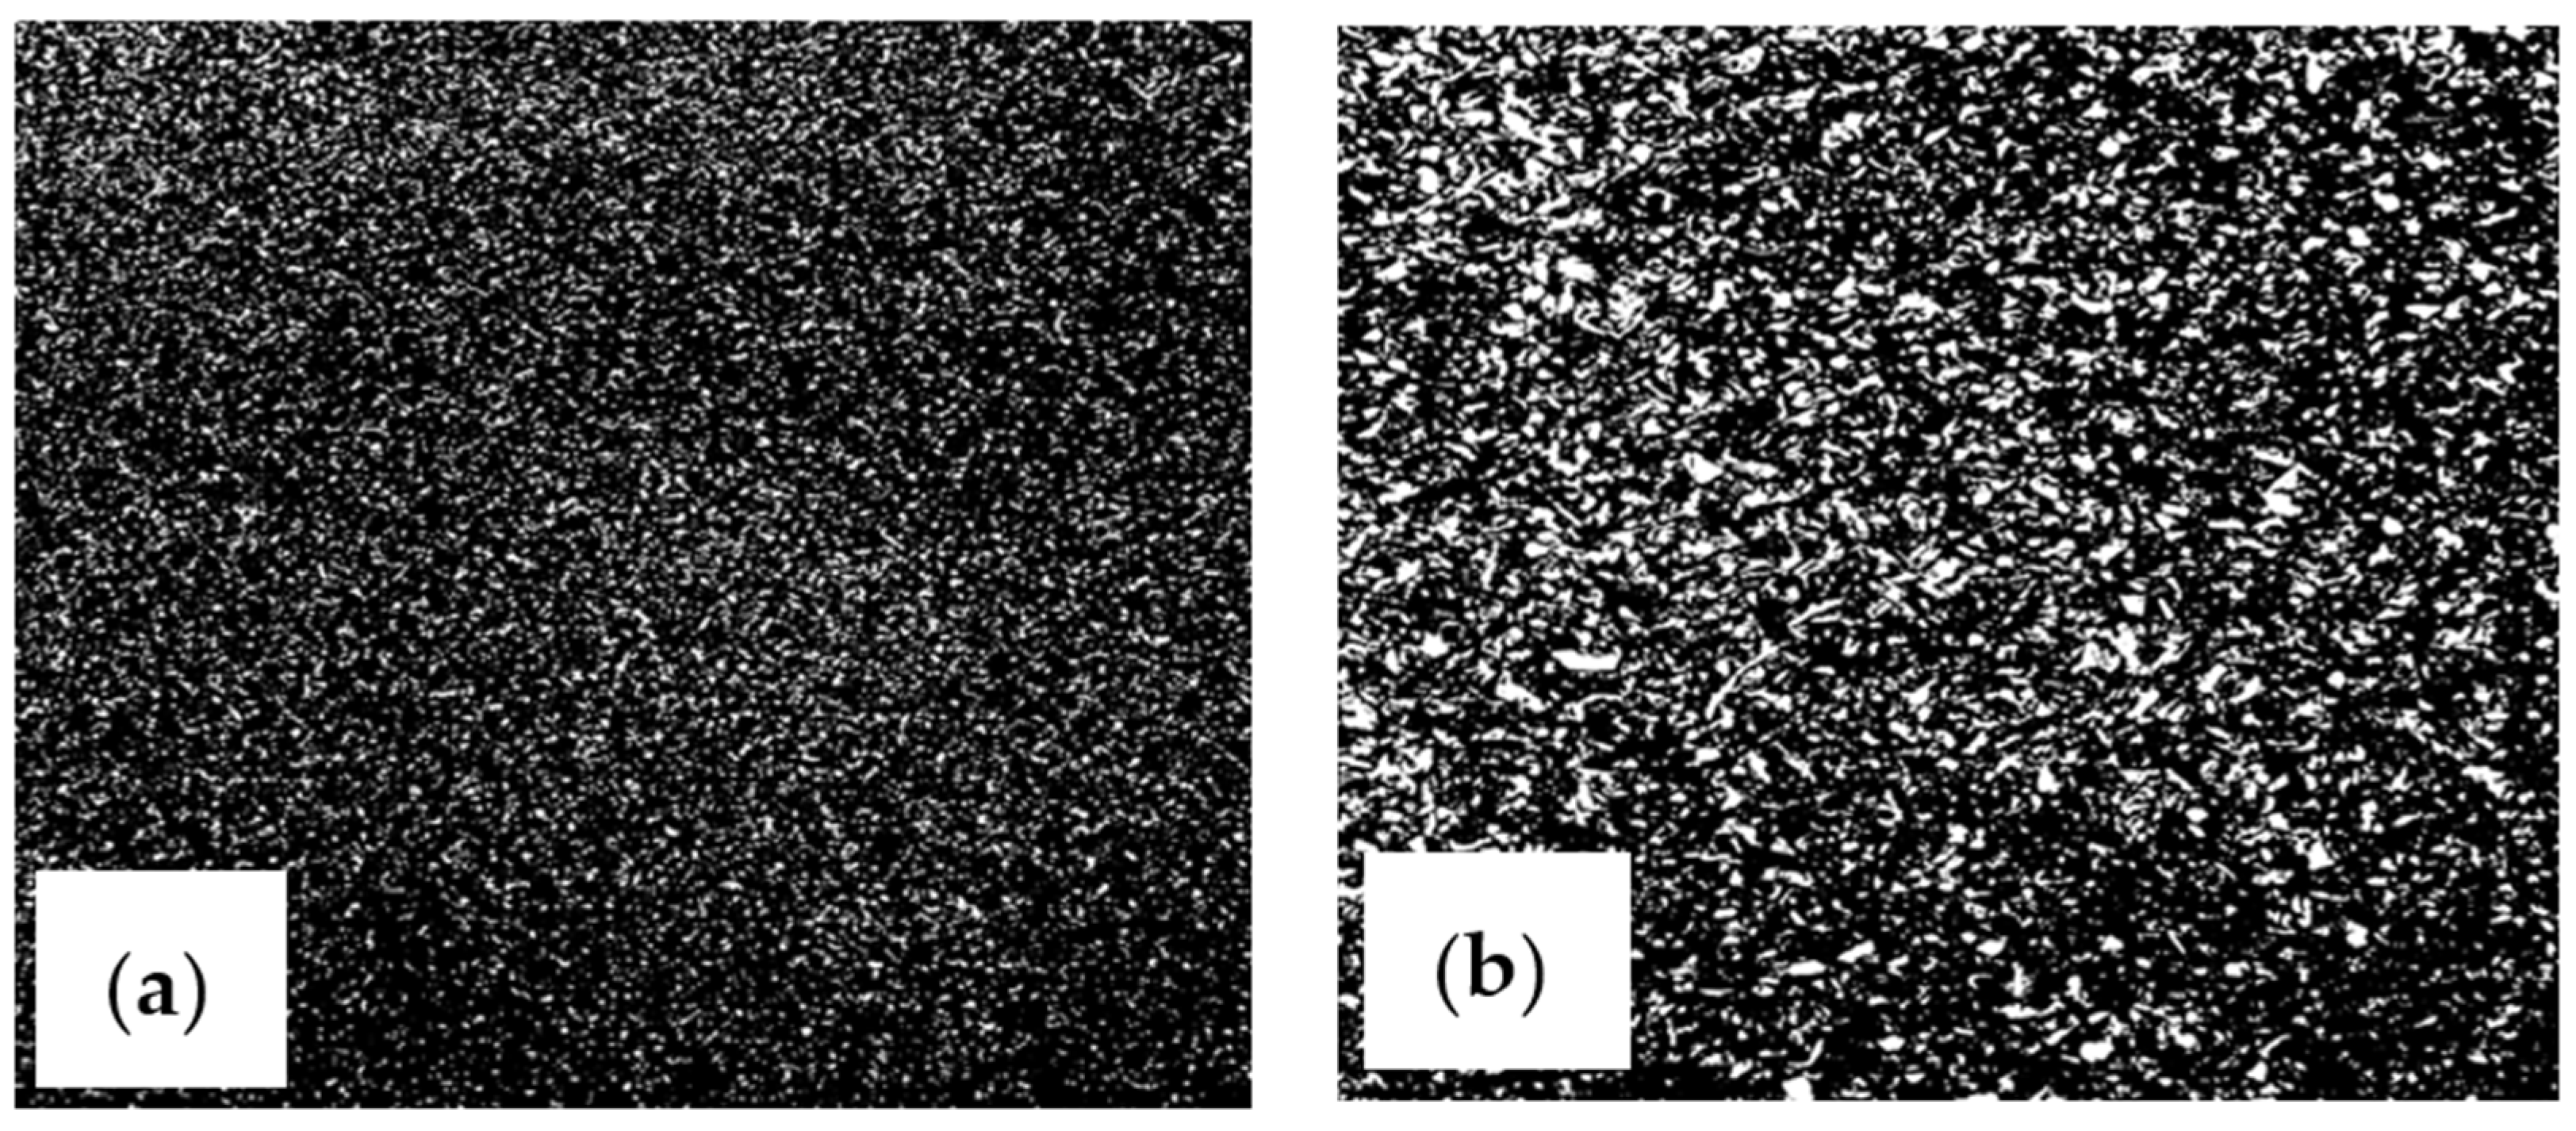
Figure 2.
Types of rubber used in the soil mixtures: (a) Rubber-A, (b) Rubber-B.
Figure 2.
Types of rubber used in the soil mixtures: (a) Rubber-A, (b) Rubber-B.
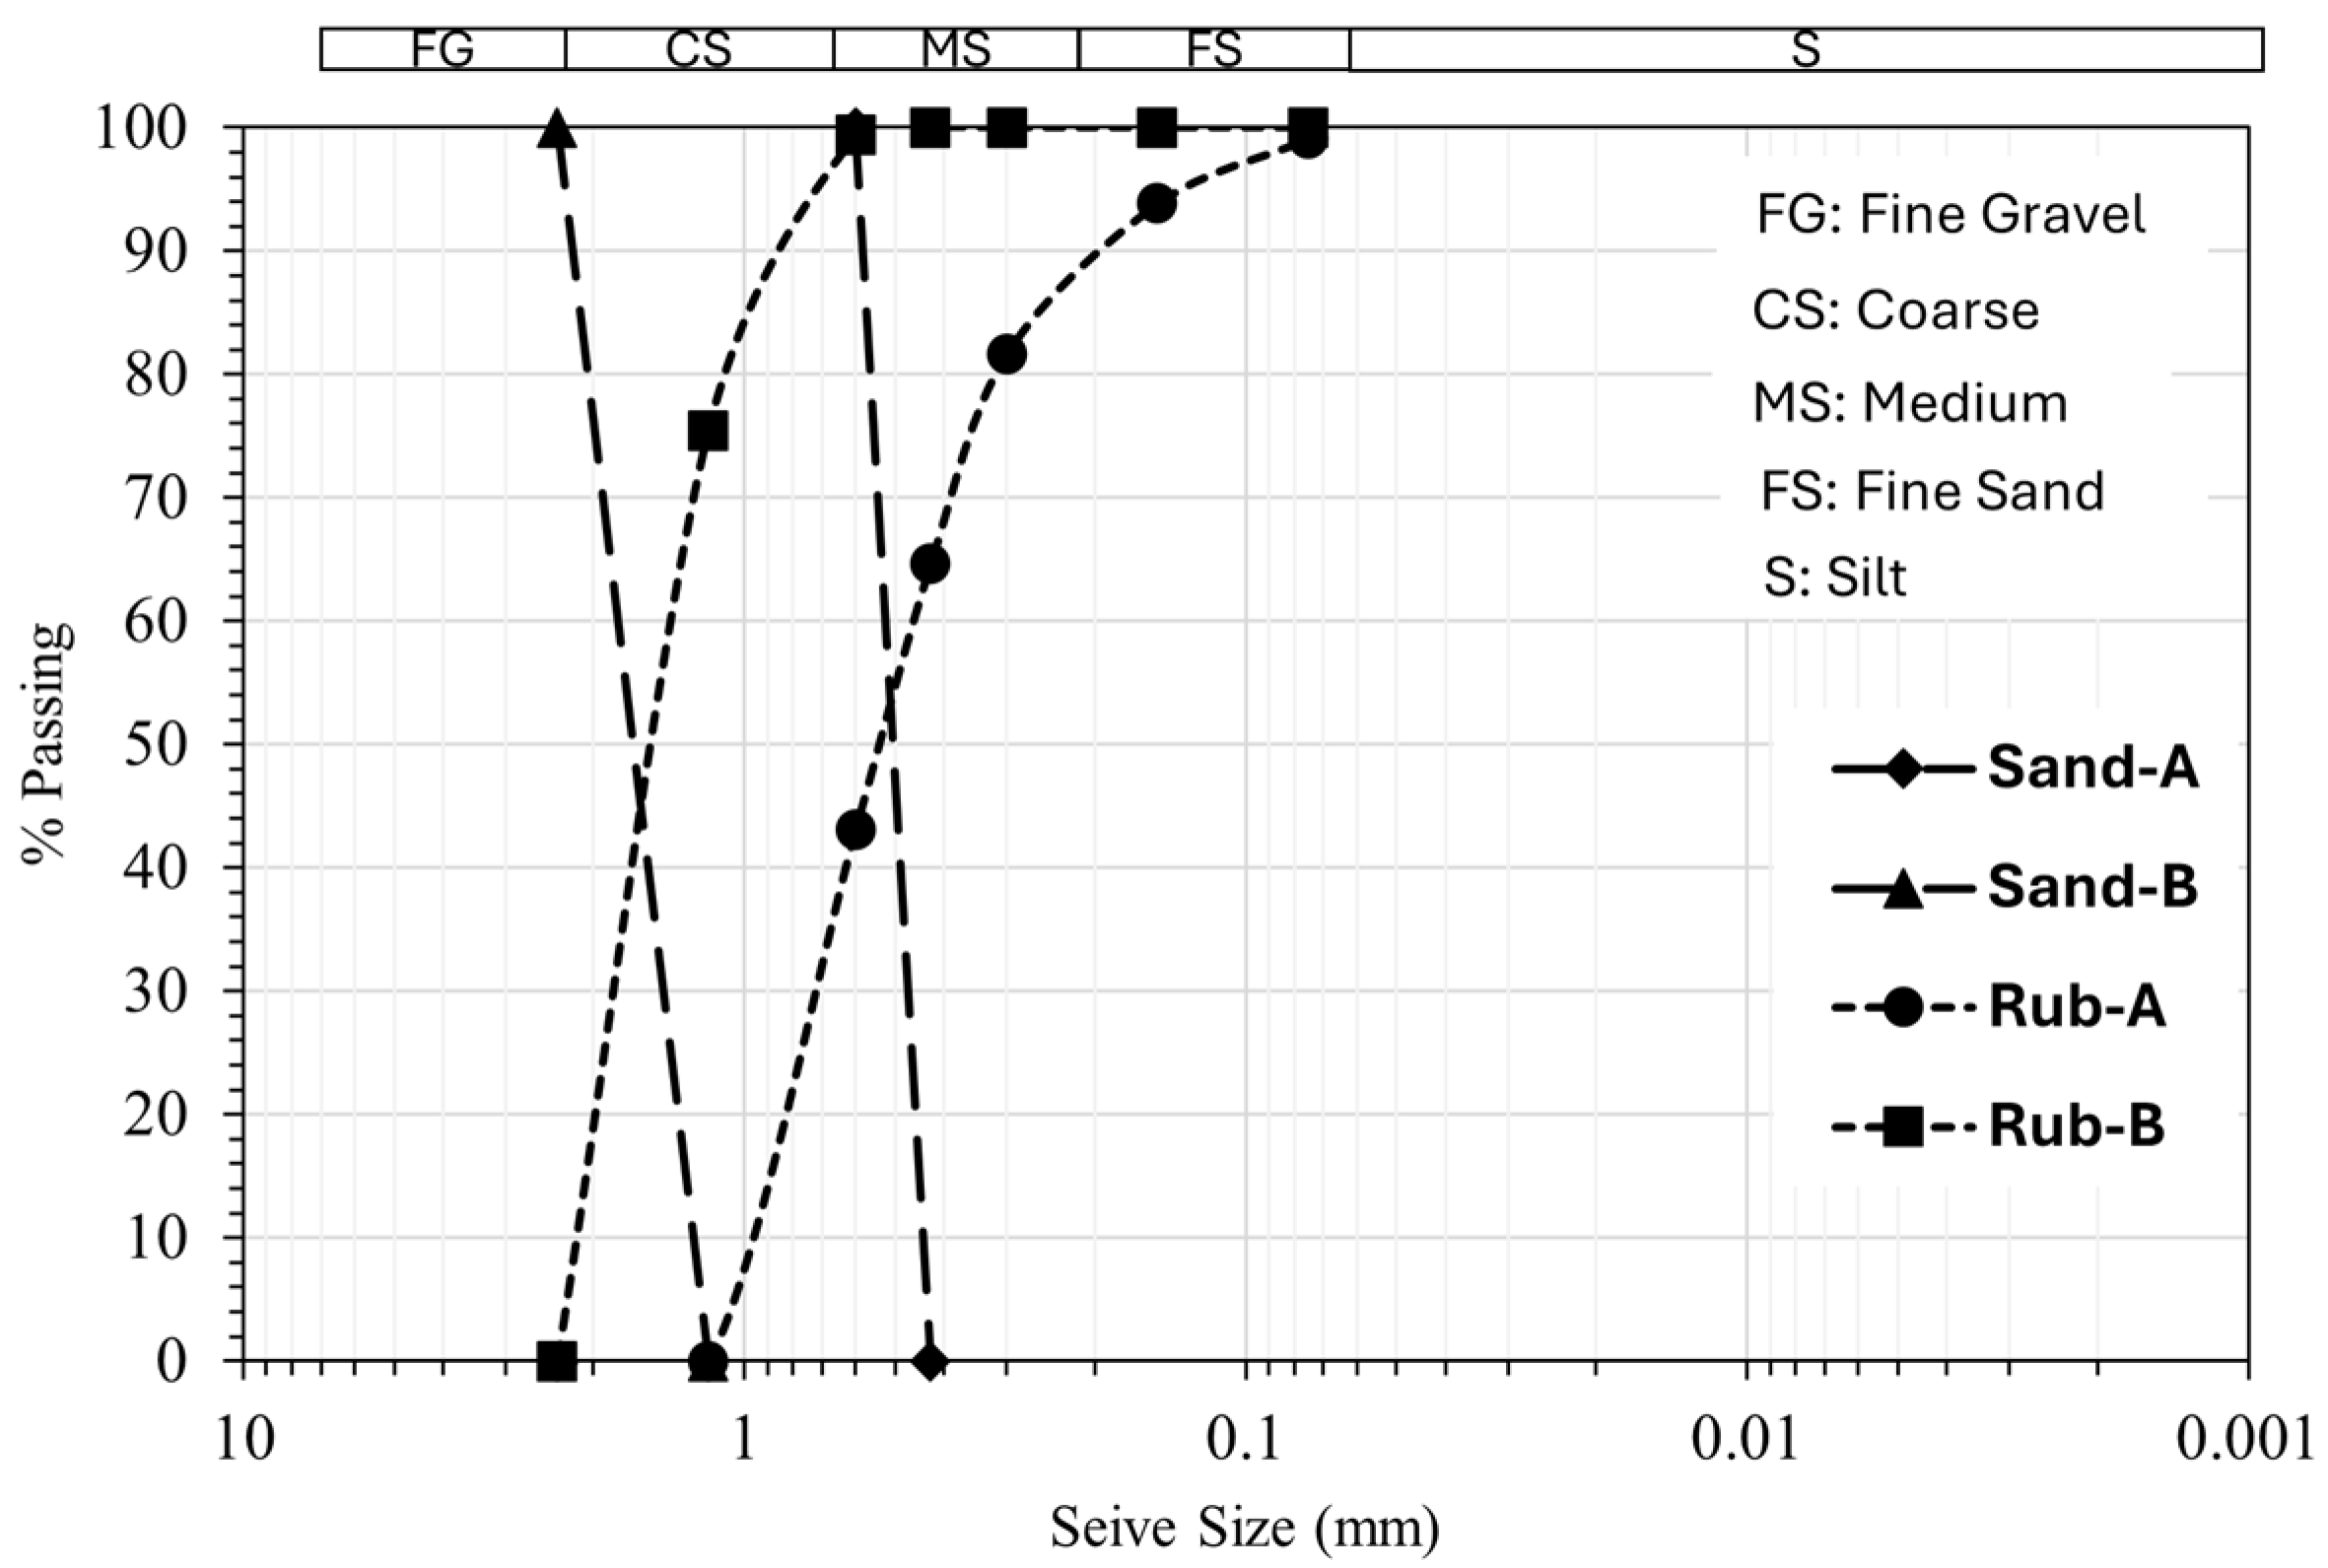
Figure 3.
Particle size distribution of sand and rubber used for the soil mixture.
Figure 3.
Particle size distribution of sand and rubber used for the soil mixture.
Figure 4.
Types of continuous surfaces used in the experiments: (a) smooth steel, and (b) rough steel.
Figure 4.
Types of continuous surfaces used in the experiments: (a) smooth steel, and (b) rough steel.
Figure 5.
Stylus profilometer (Mitutoyo Corporation, Kawasaki, Japan) for roughness measurement.
Figure 5.
Stylus profilometer (Mitutoyo Corporation, Kawasaki, Japan) for roughness measurement.
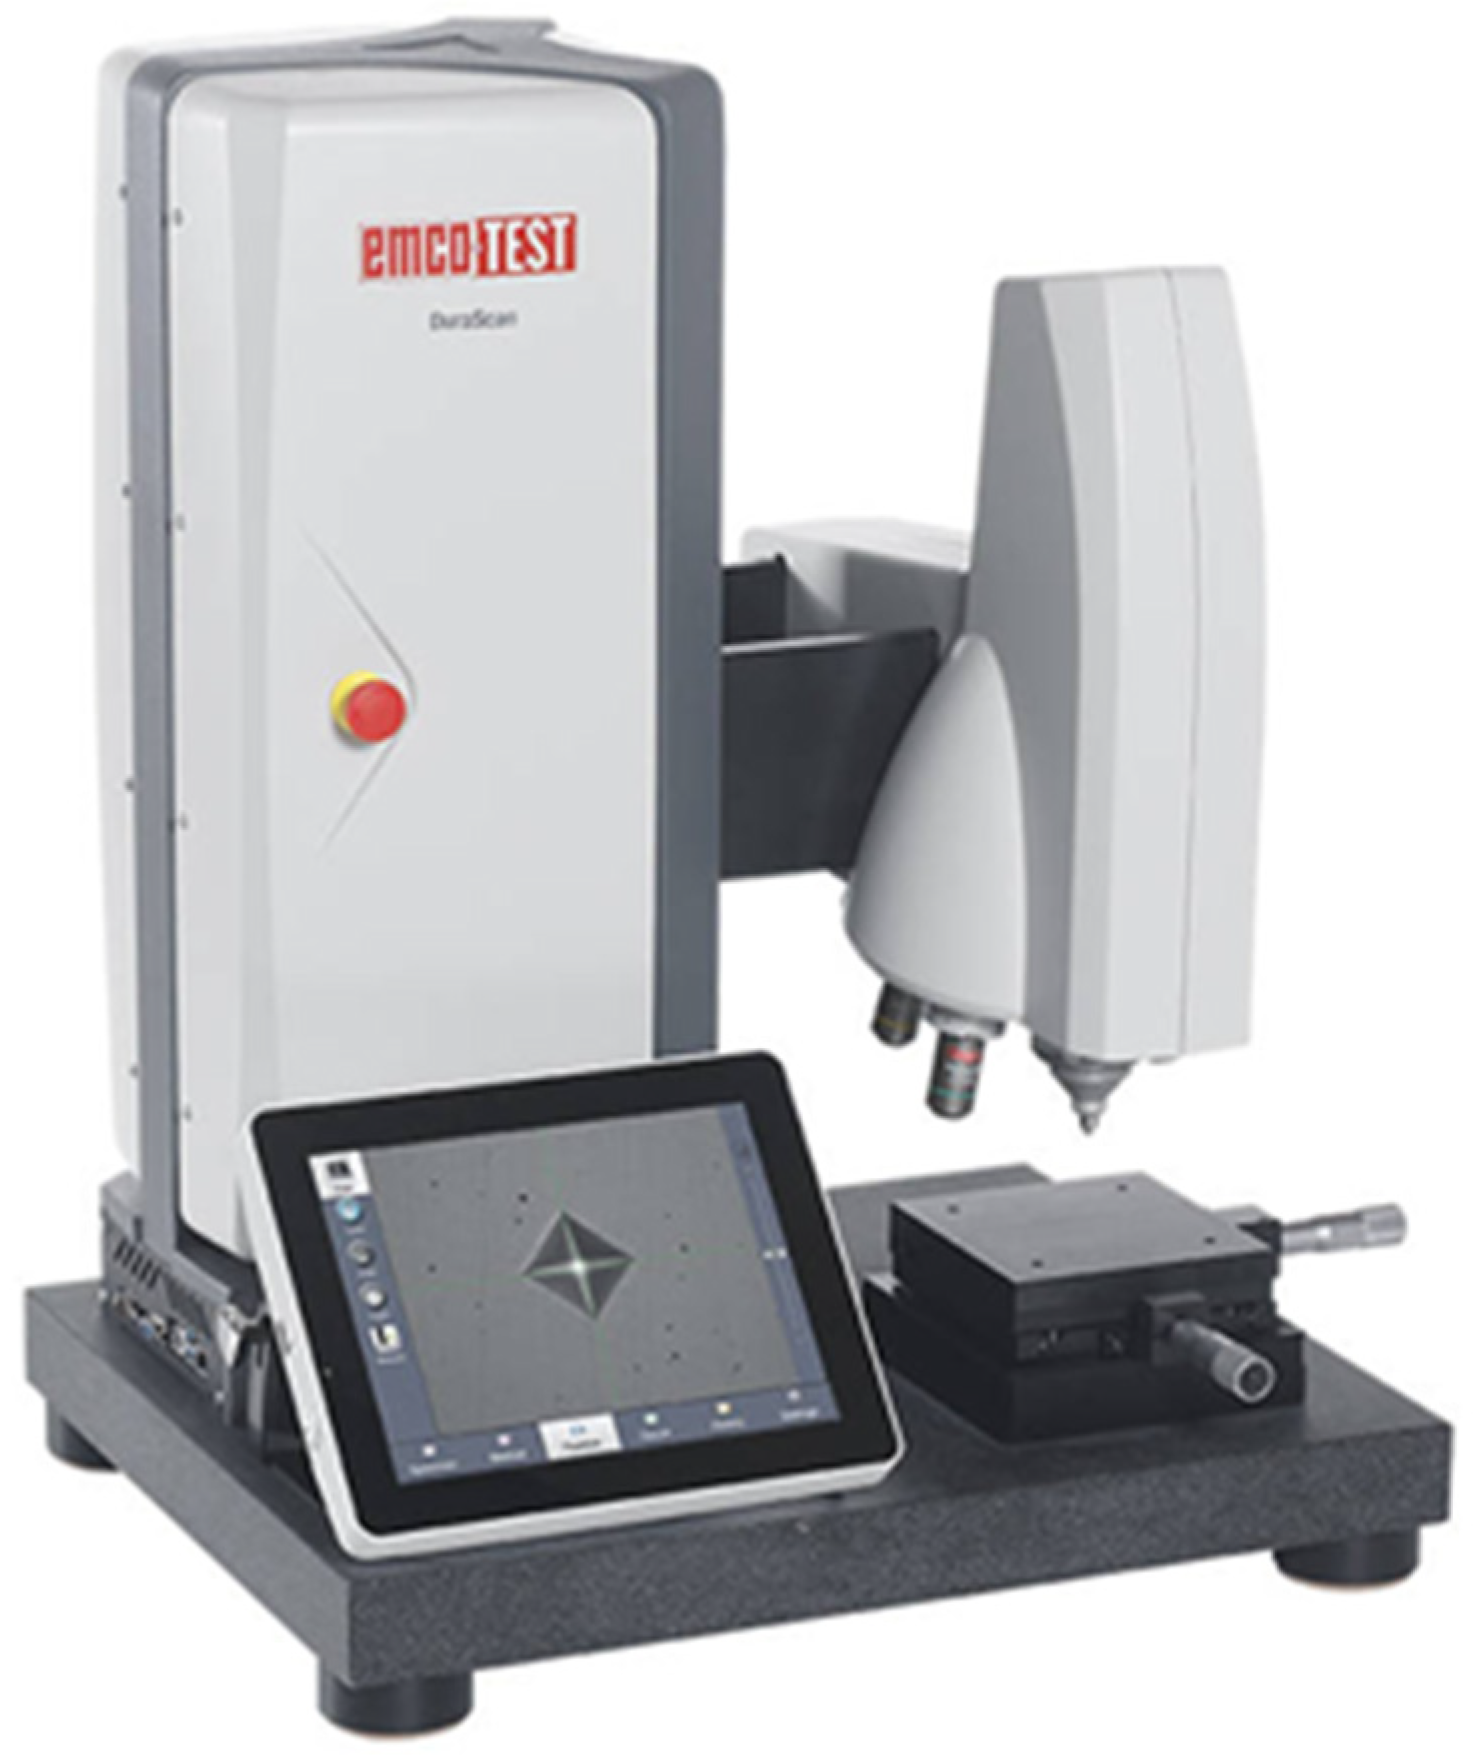
Figure 6.
DuraScan Device for hardness testing.
Figure 6.
DuraScan Device for hardness testing.
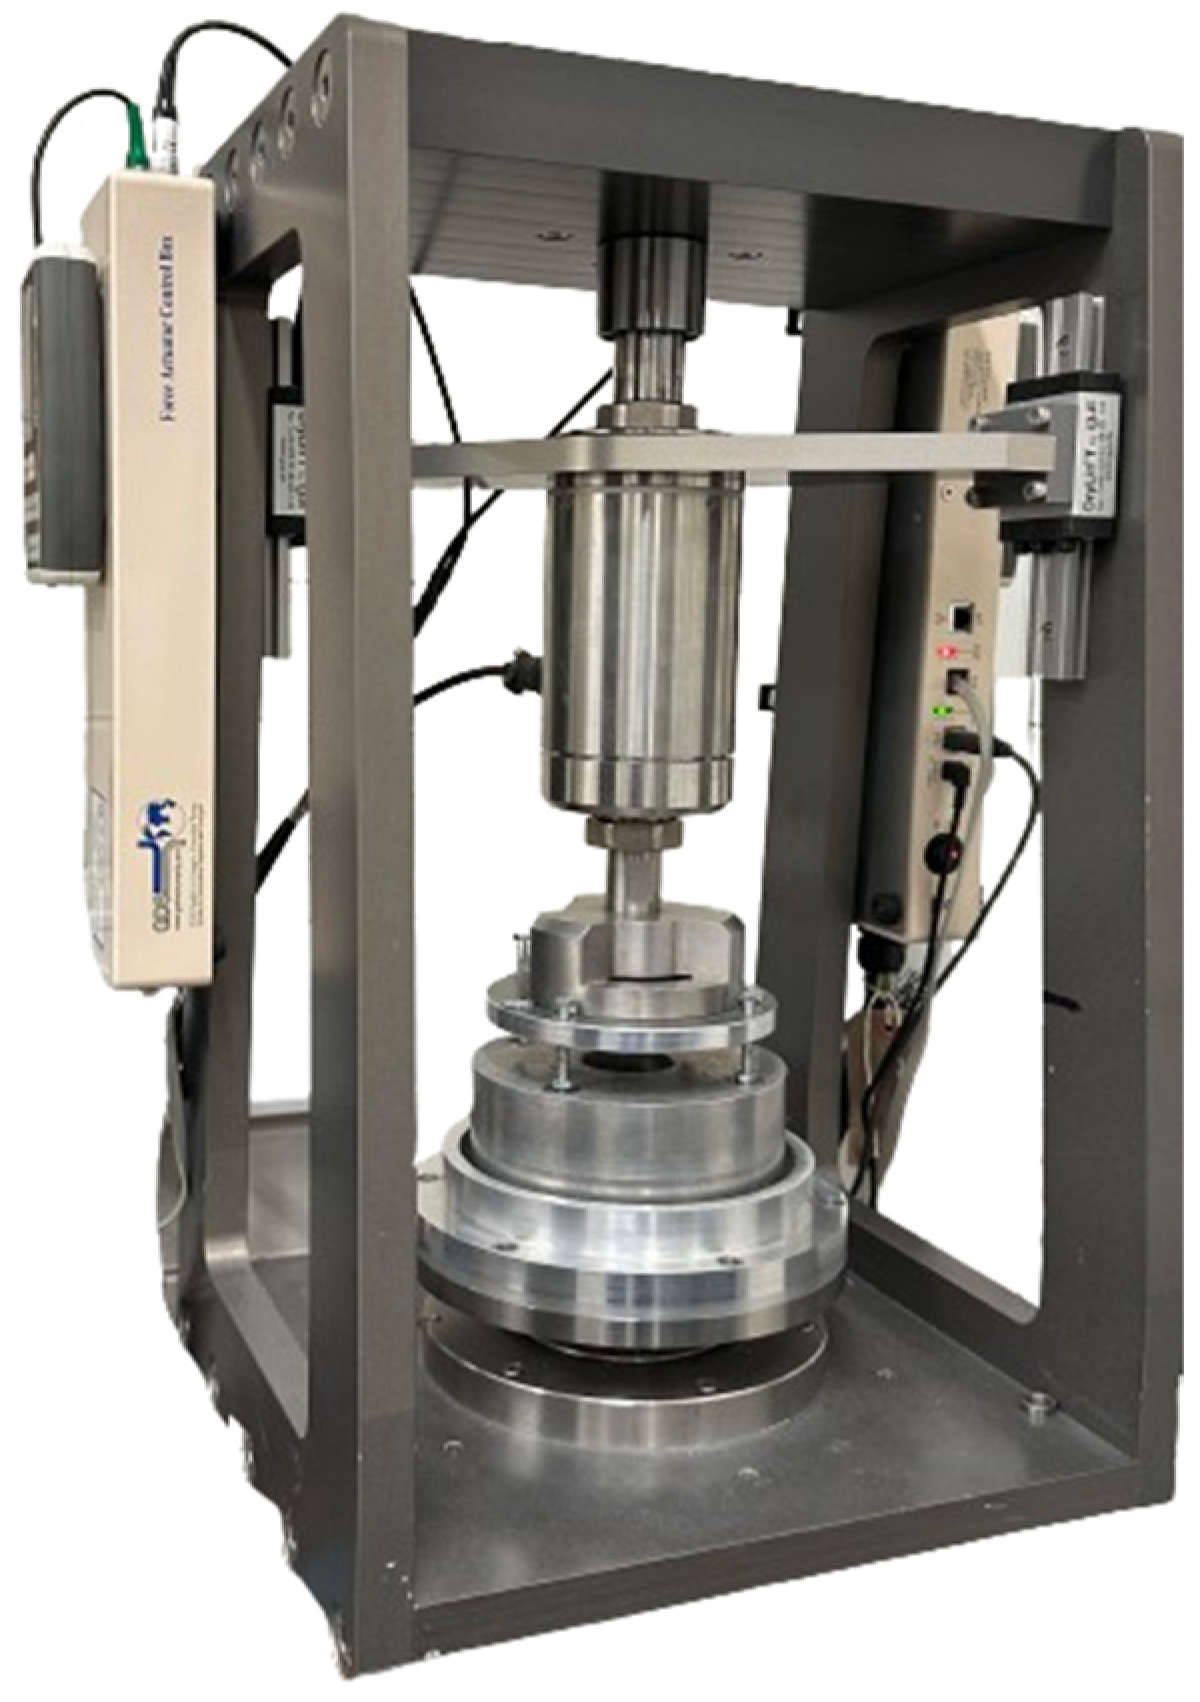
Figure 7.
The modified ring-shear apparatus.
Figure 7.
The modified ring-shear apparatus.
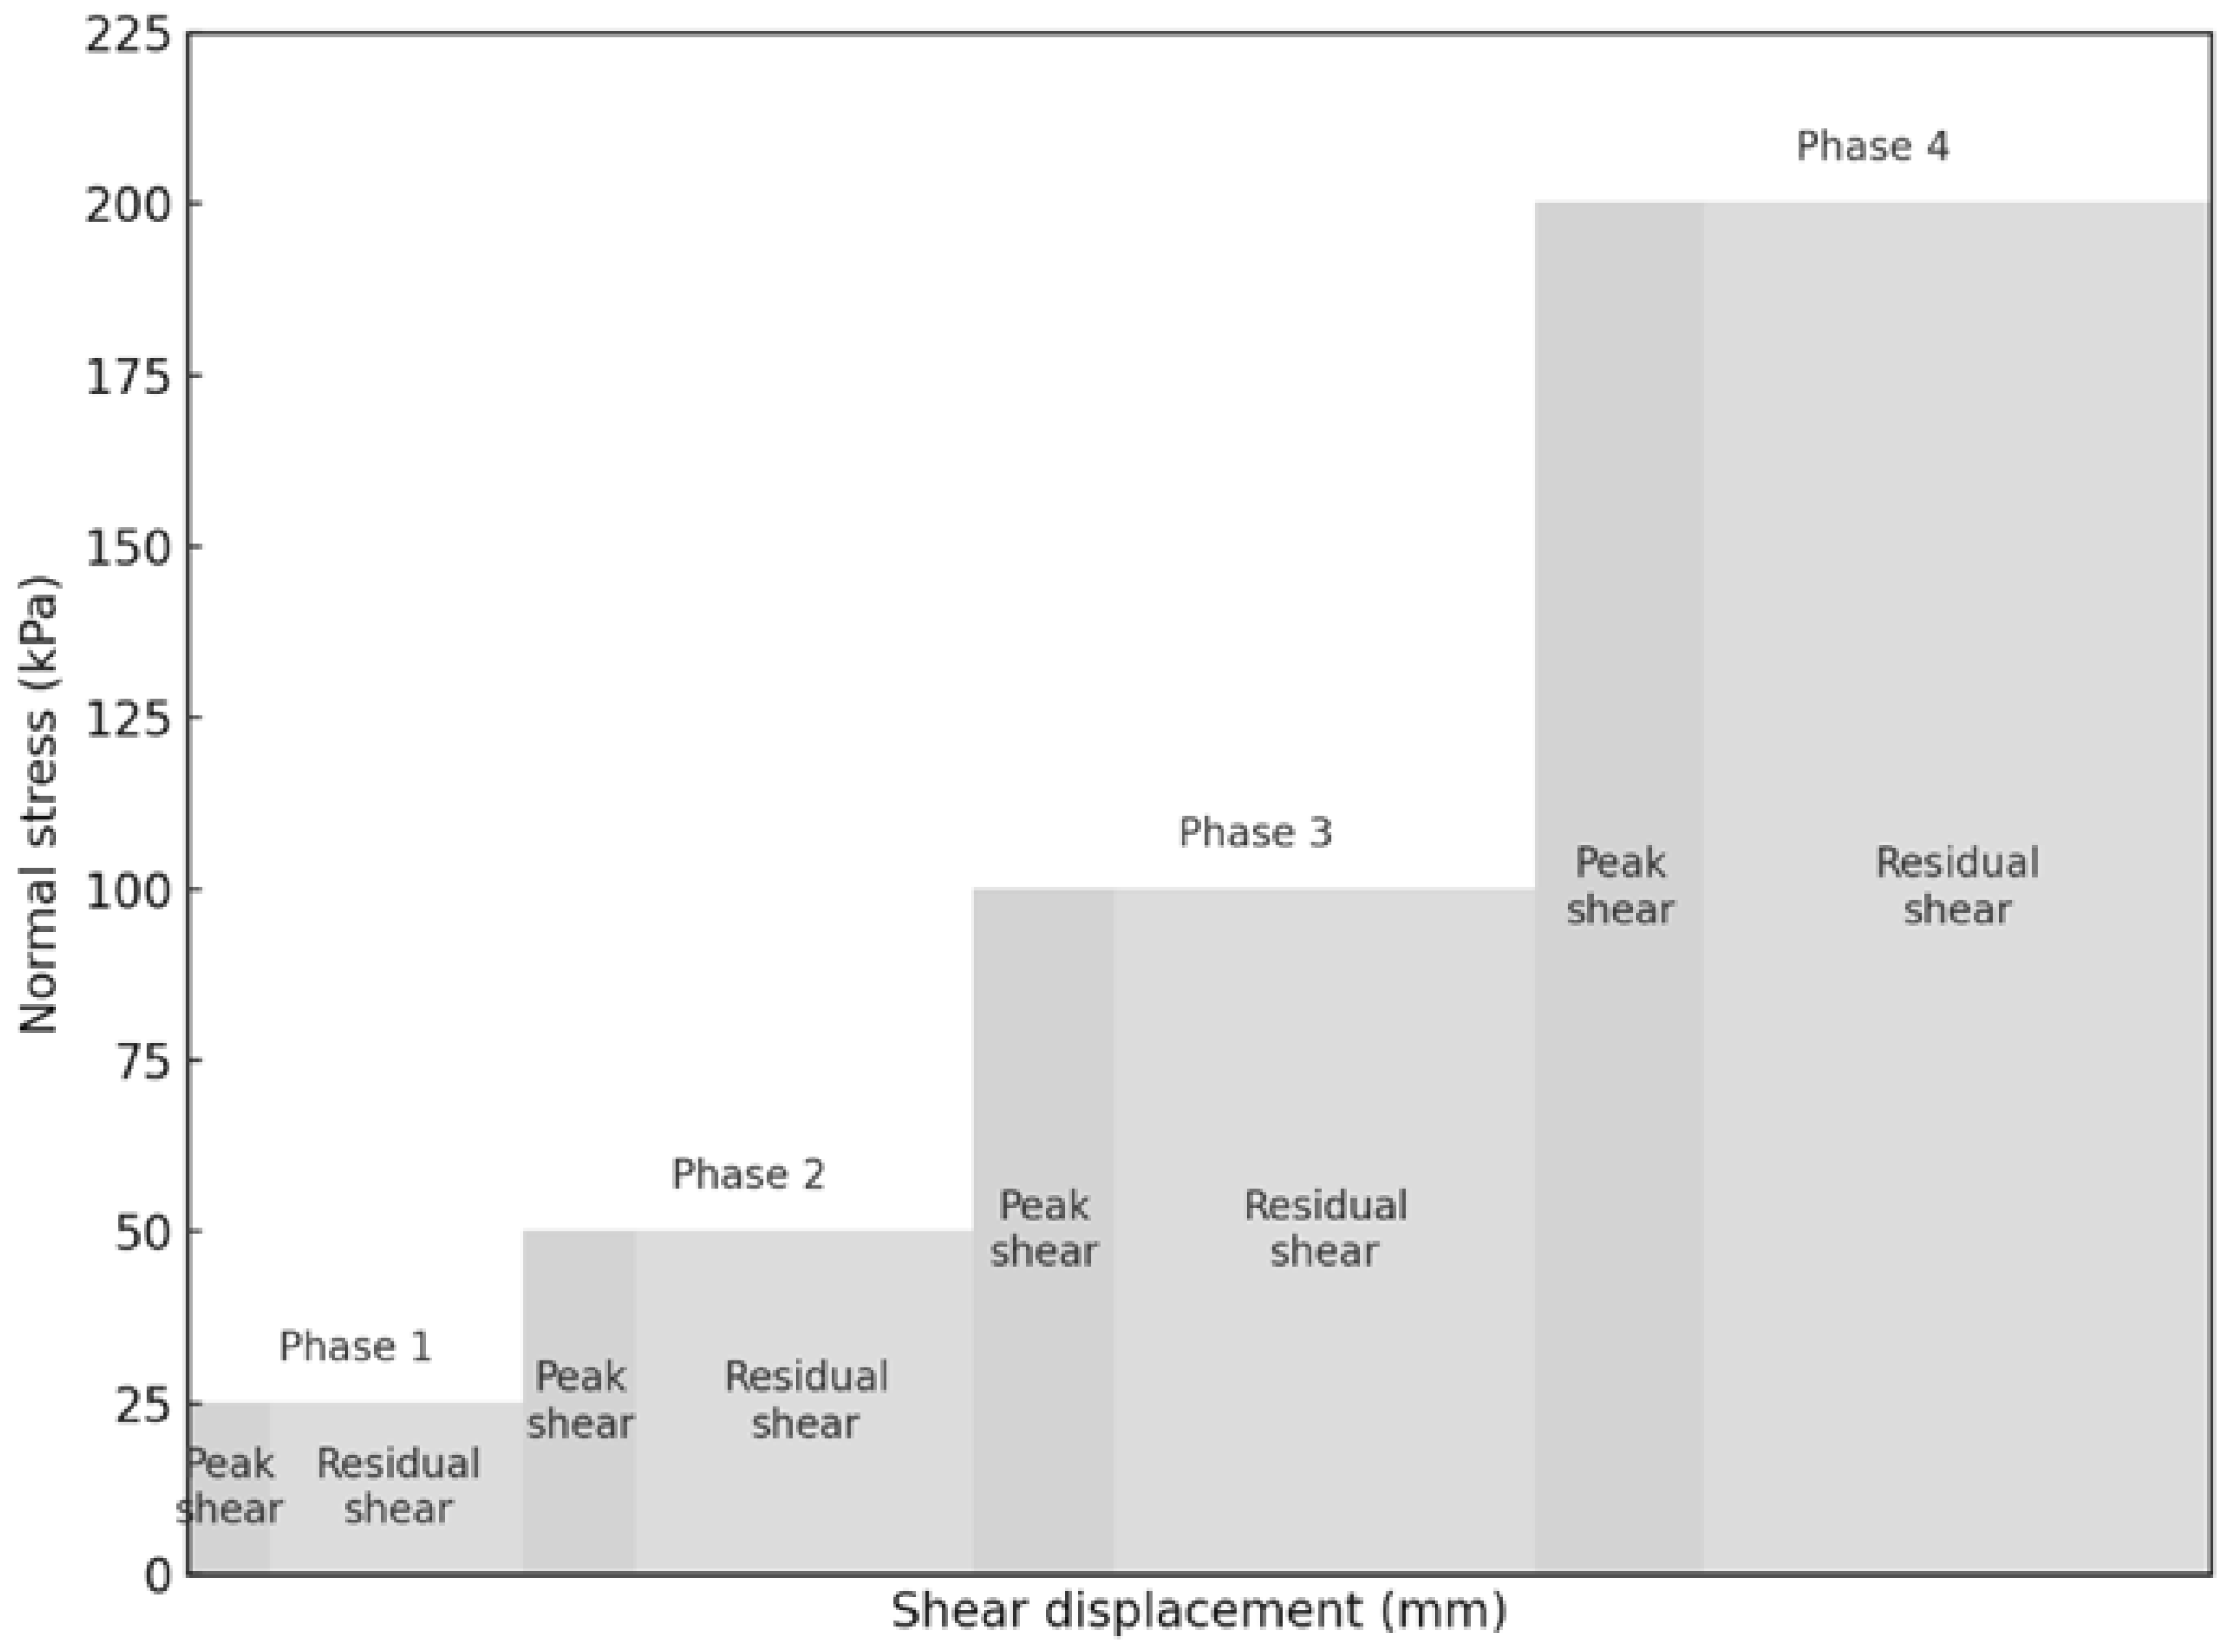
Figure 8.
Shear testing phases at 25, 50, 100, and 200 kPa showing peak and residual stages.
Figure 8.
Shear testing phases at 25, 50, 100, and 200 kPa showing peak and residual stages.
Figure 9.
Shear strength for different sand–rubber mixtures at 100 kPa, smooth steel, 20% rubber.
Figure 9.
Shear strength for different sand–rubber mixtures at 100 kPa, smooth steel, 20% rubber.
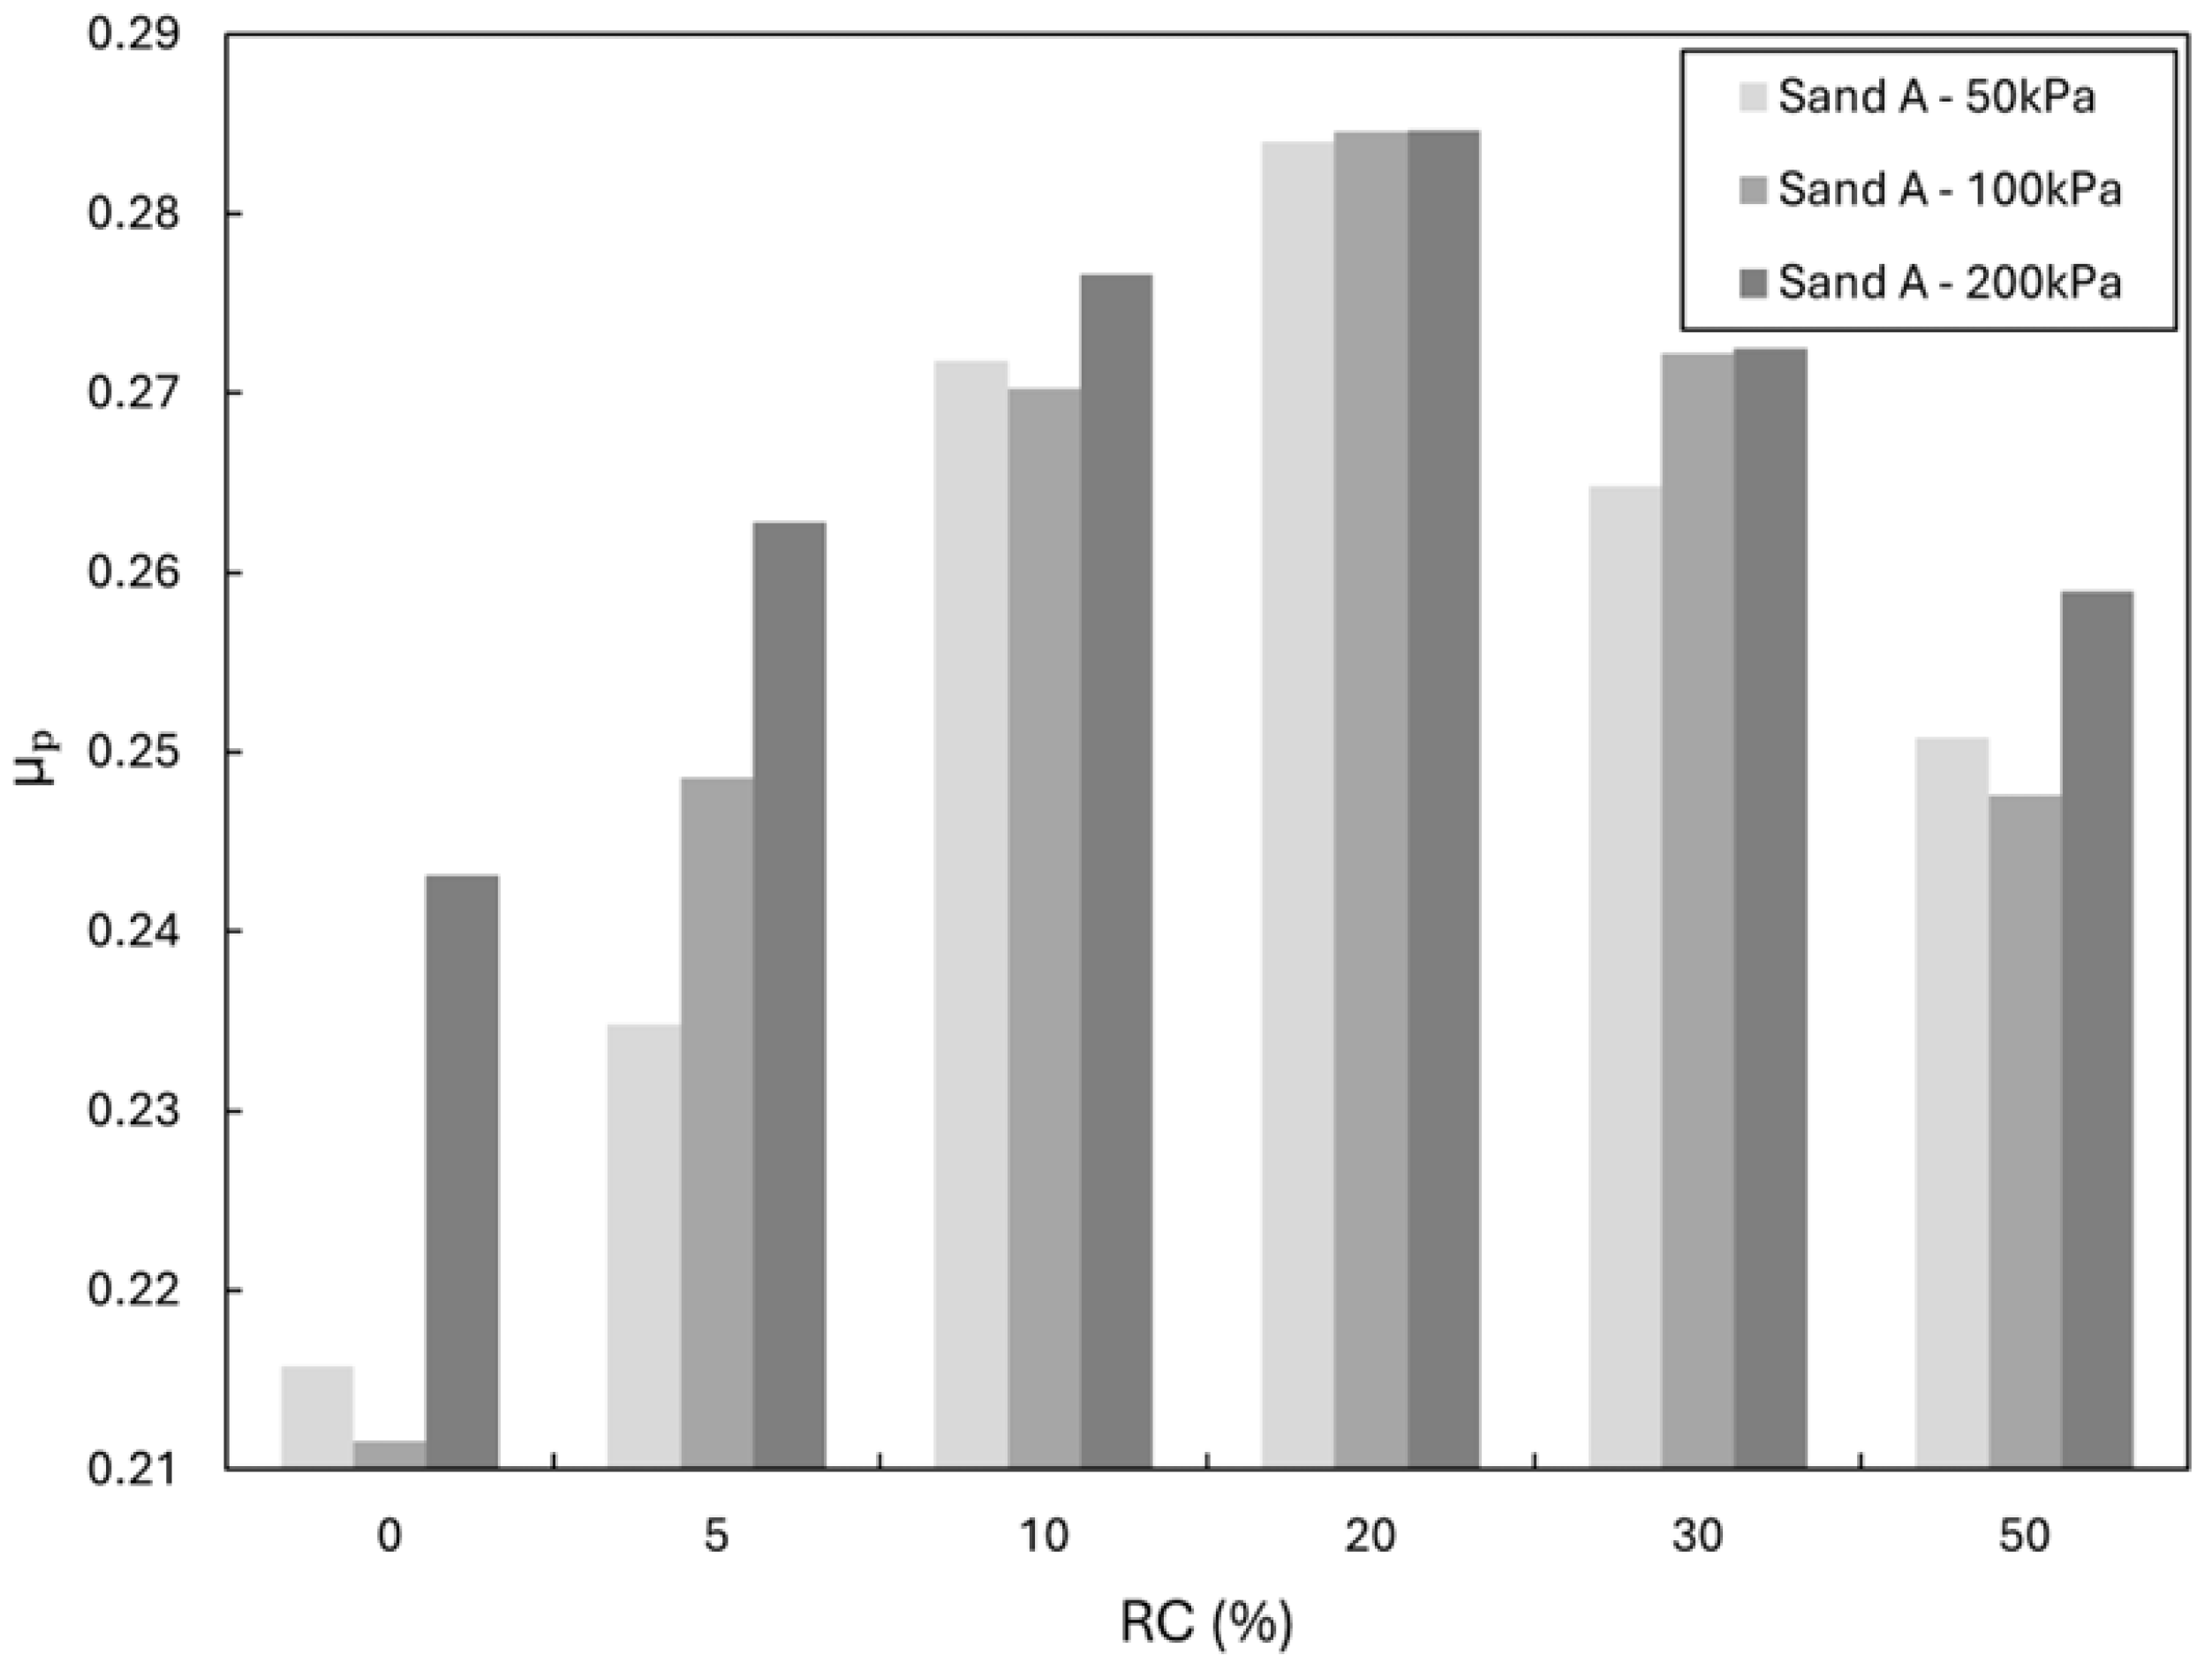
Figure 10.
Variation in interface shear coefficient (μp) with rubber content for Sand A at 50, 100, and 200 kPa against smooth steel.
Figure 10.
Variation in interface shear coefficient (μp) with rubber content for Sand A at 50, 100, and 200 kPa against smooth steel.
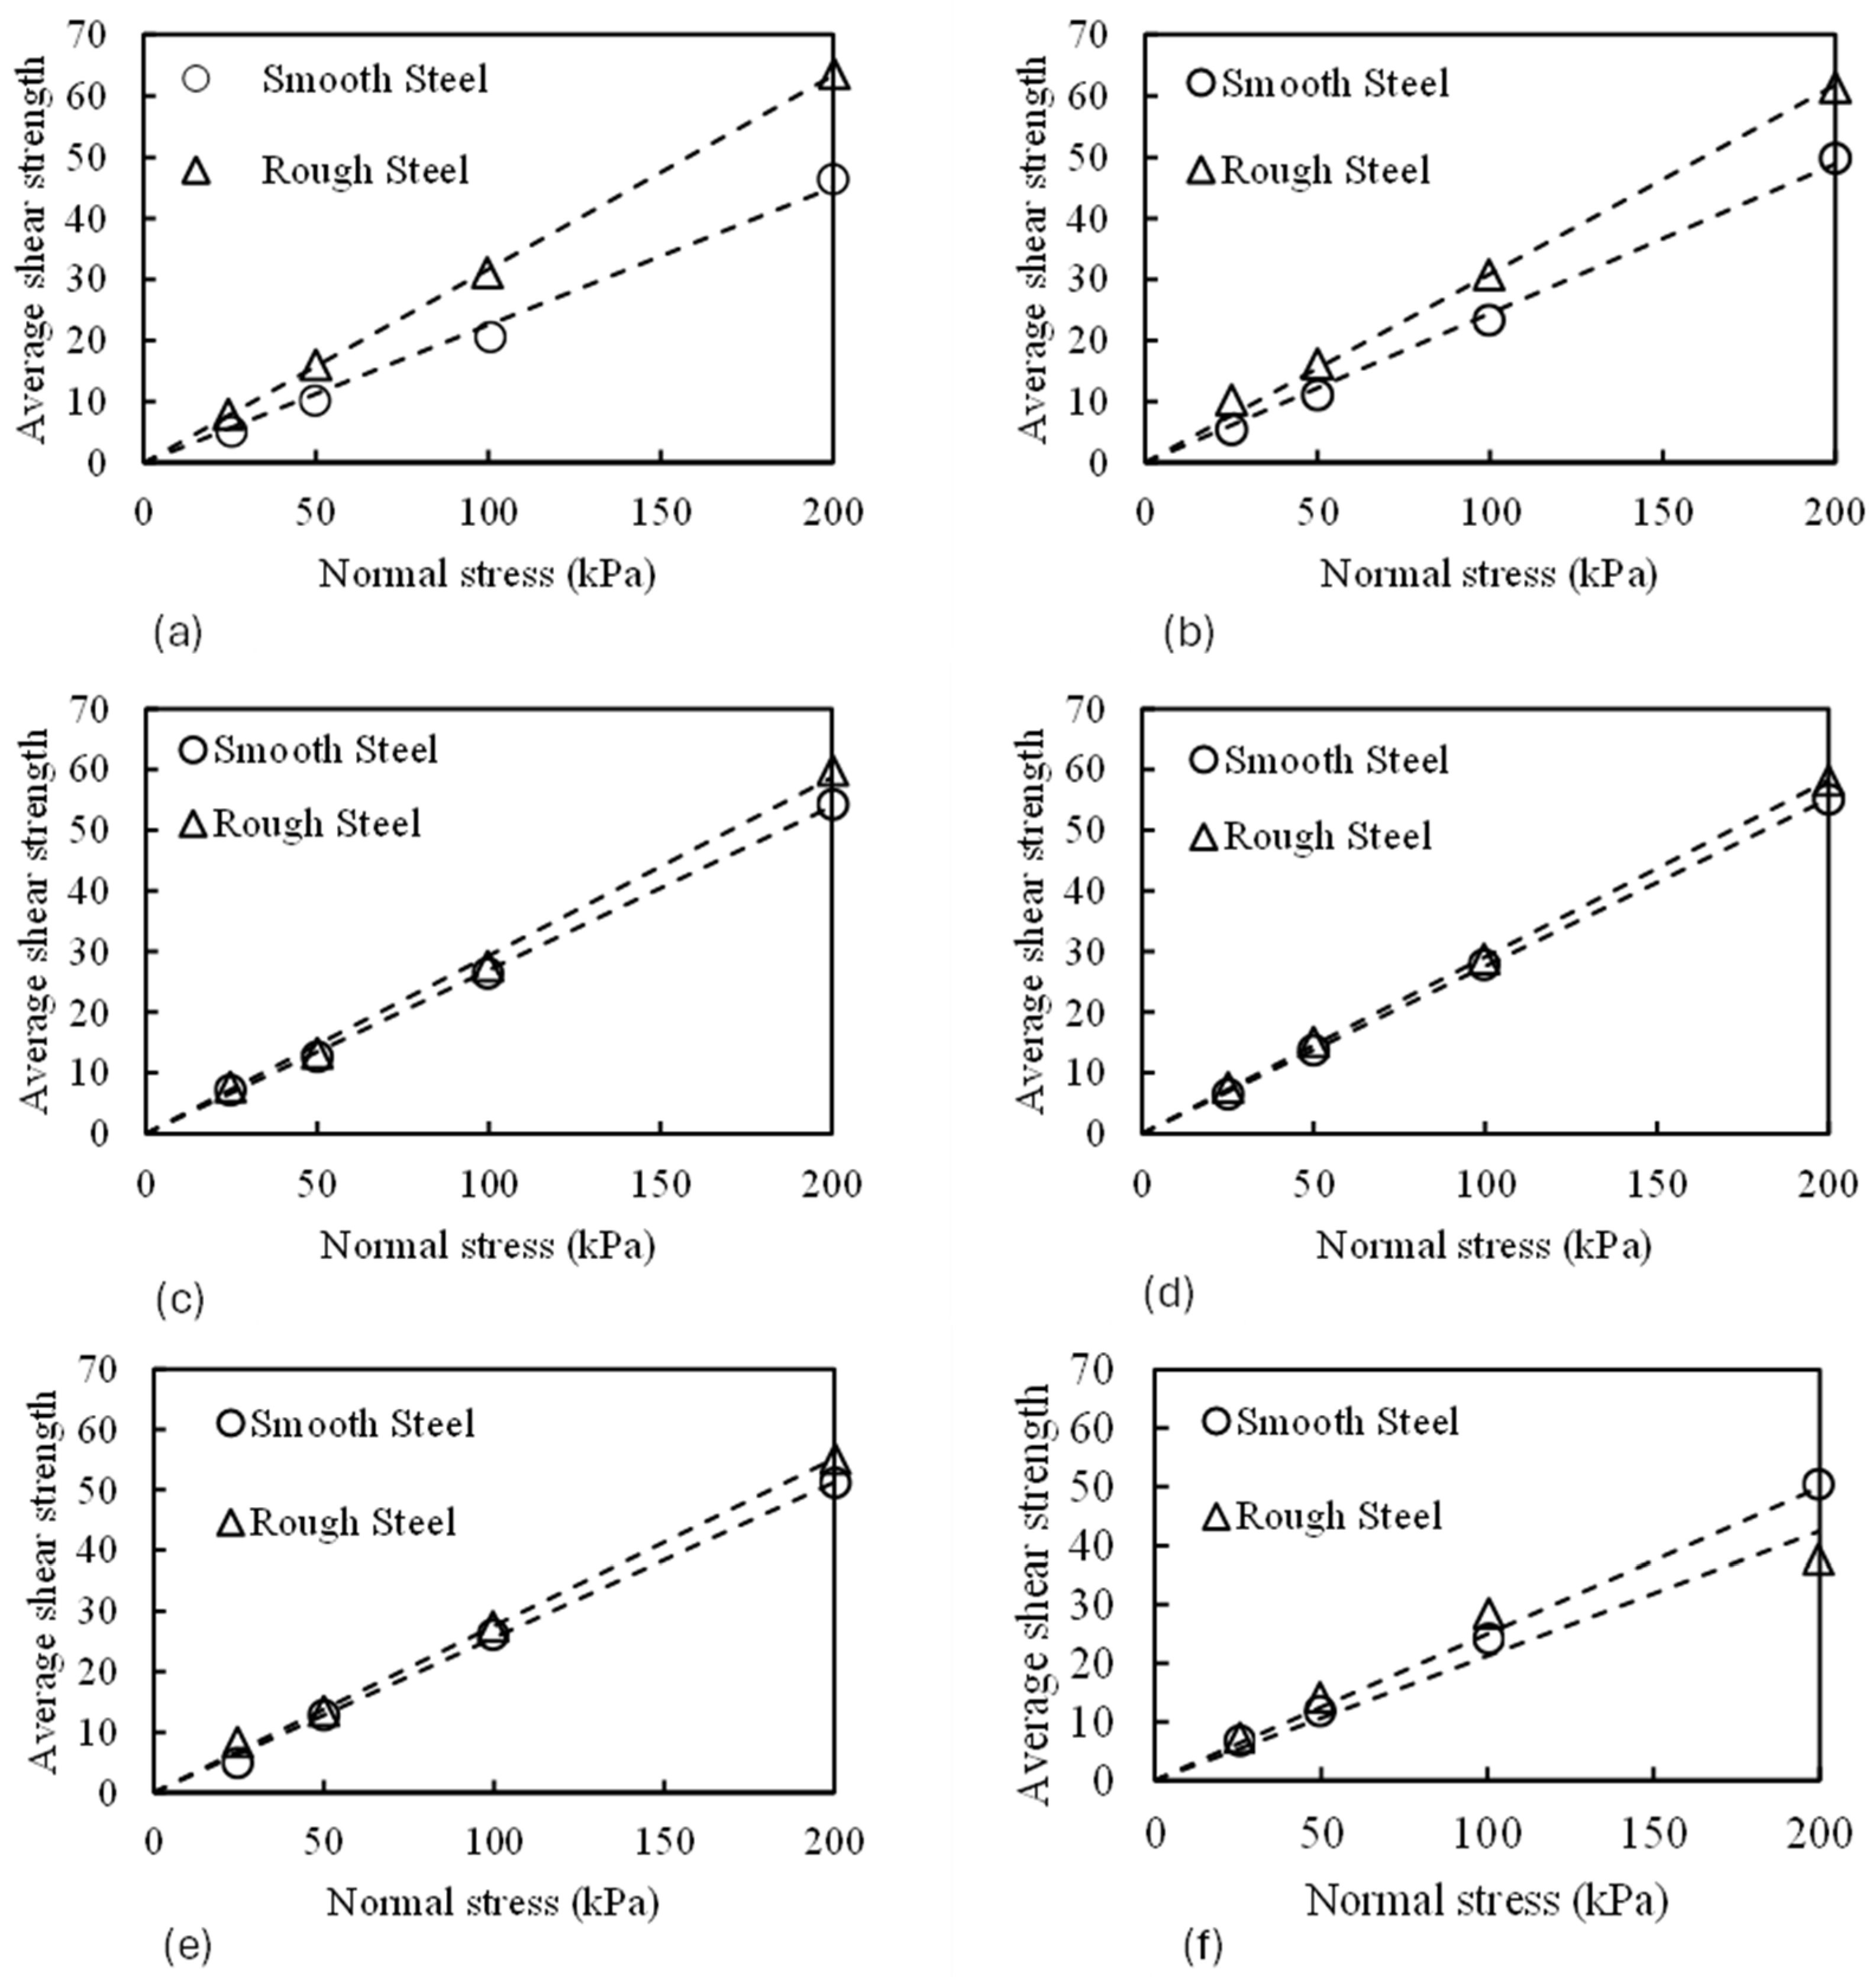
Figure 11.
Average shear strength versus normal stress for sand A with different rubber content, where (a) Zero rubber, (b) 5% Rb, (c) 10% Rb, (d) 20% Rb, (e) 30% Rb, (f) 50% Rb.
Figure 11.
Average shear strength versus normal stress for sand A with different rubber content, where (a) Zero rubber, (b) 5% Rb, (c) 10% Rb, (d) 20% Rb, (e) 30% Rb, (f) 50% Rb.
Figure 12.
Average shear strength versus normal stress for sand B with different rubber content, where (a) Zero rubber, (b) 5% Rb, (c) 10% Rb, (d) 20% Rb, (e) 30% Rb, (f) 50% Rb.
Figure 12.
Average shear strength versus normal stress for sand B with different rubber content, where (a) Zero rubber, (b) 5% Rb, (c) 10% Rb, (d) 20% Rb, (e) 30% Rb, (f) 50% Rb.
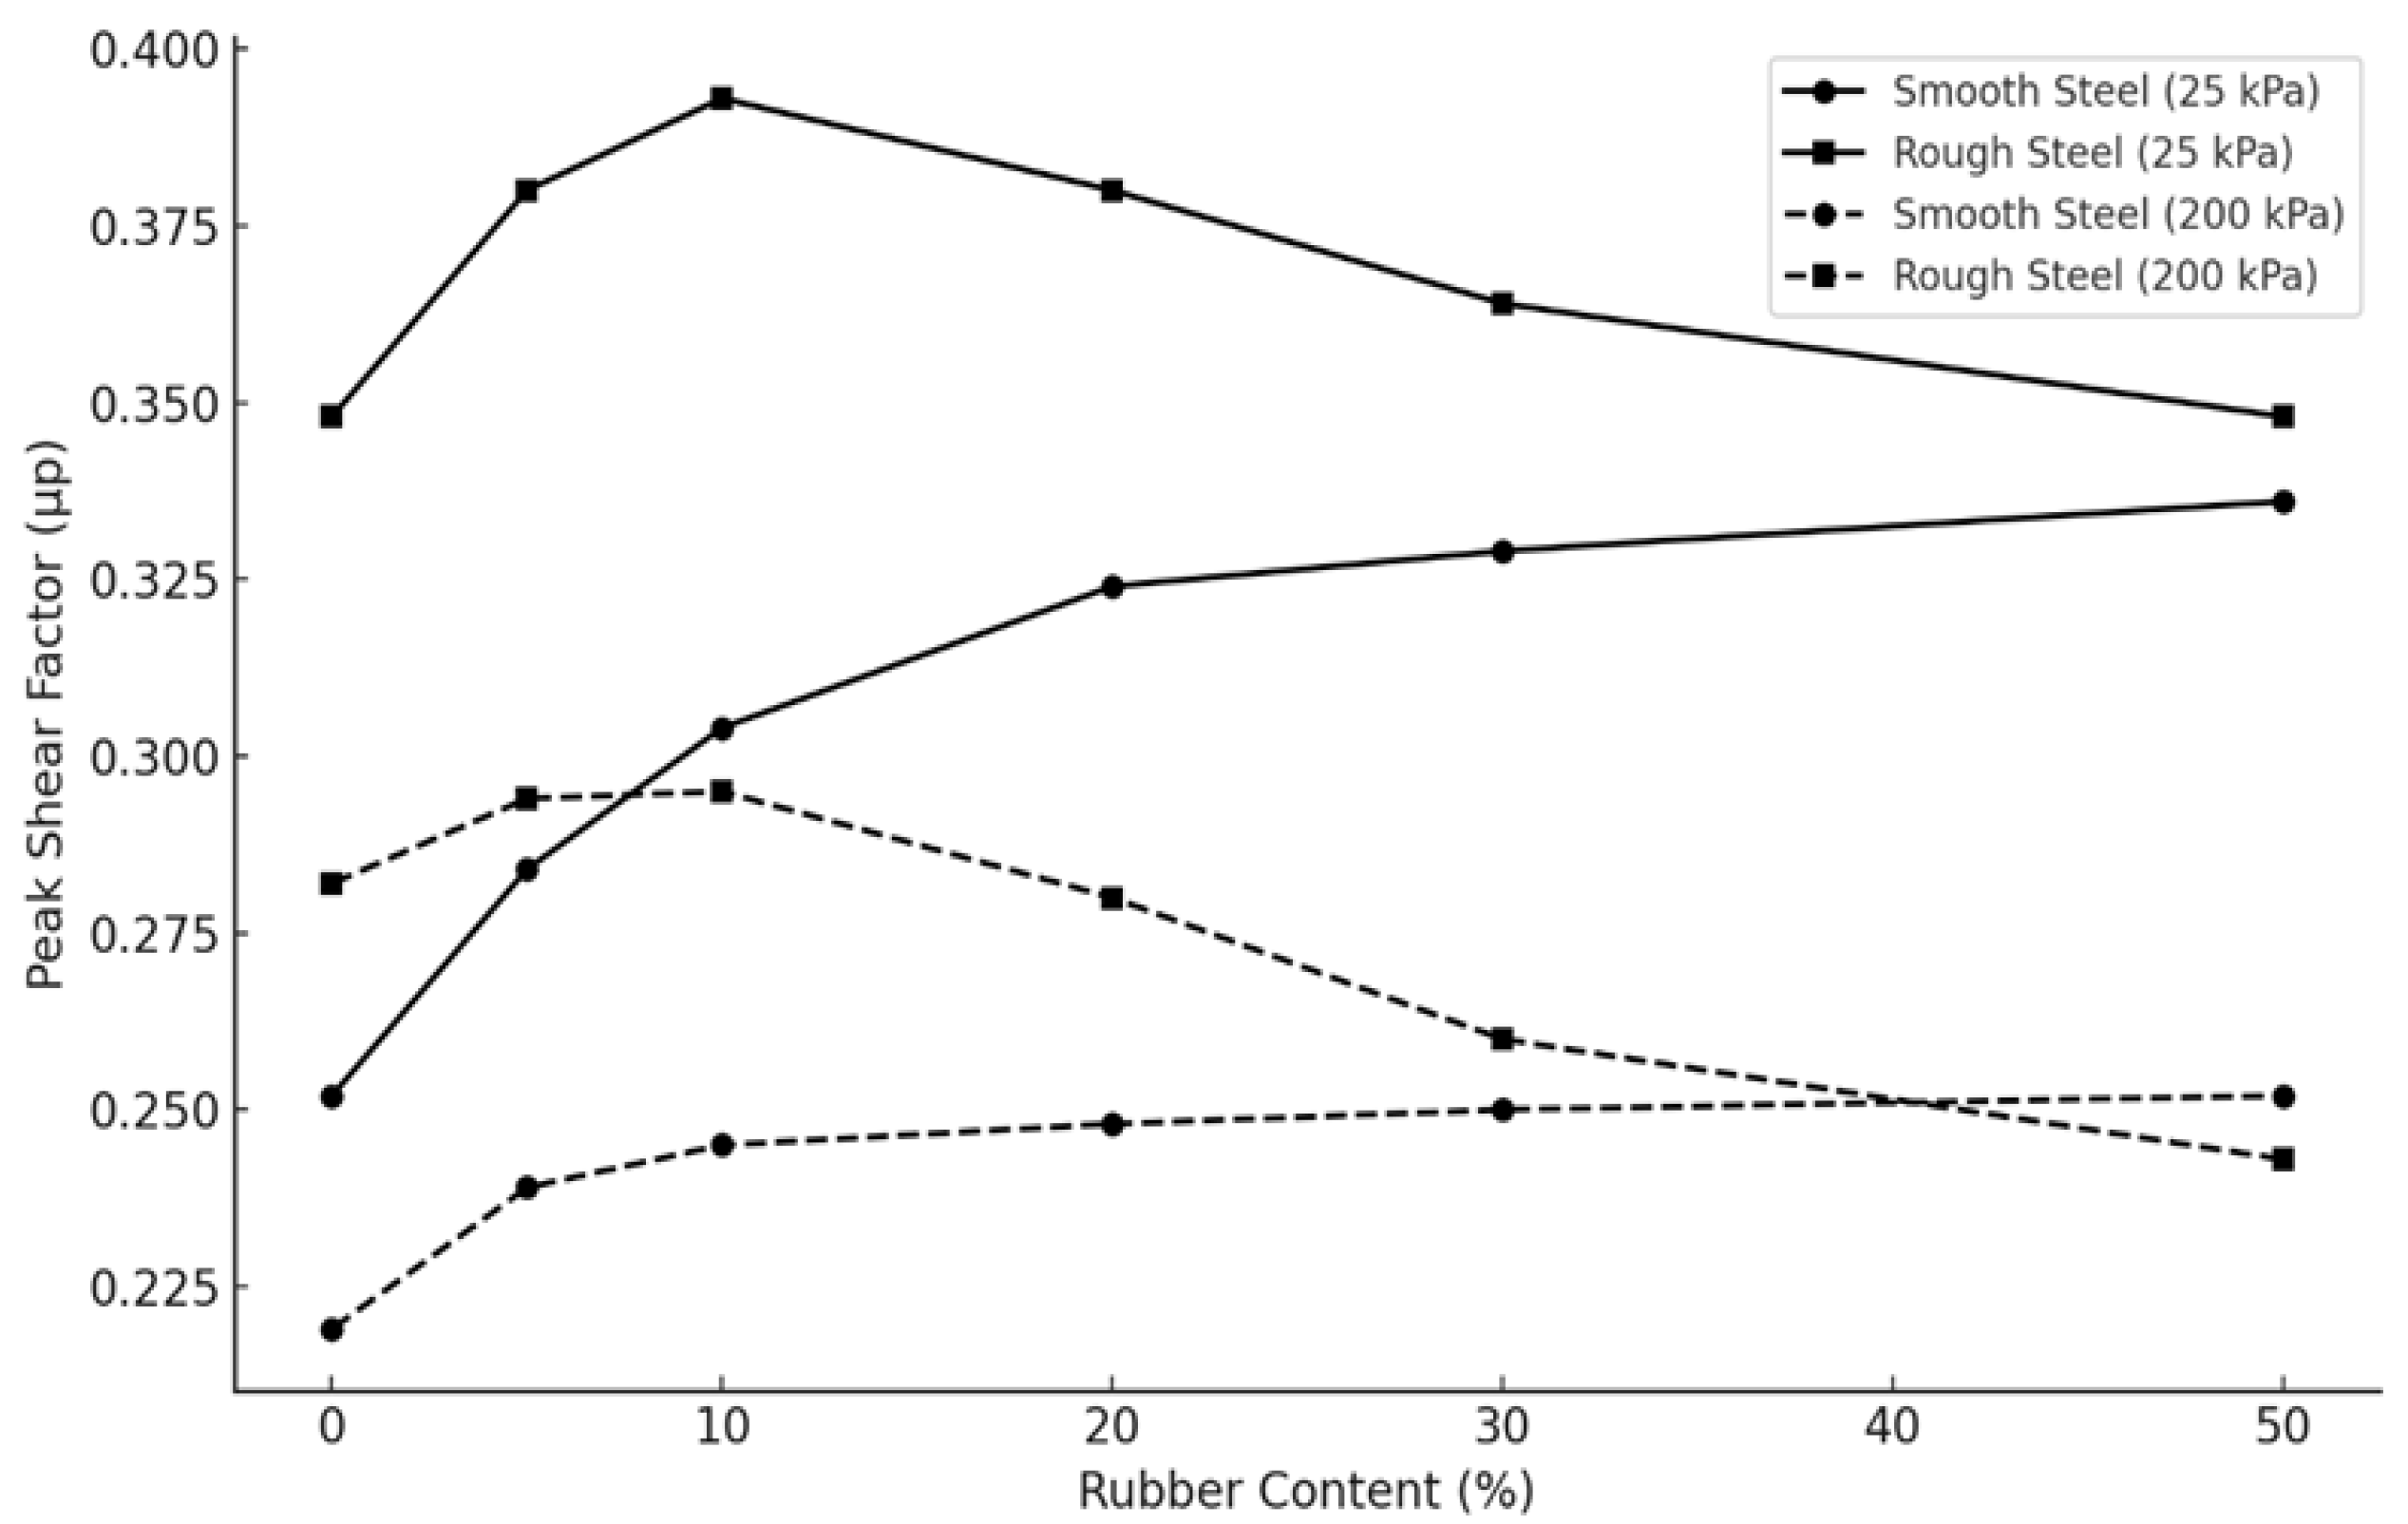
Figure 13.
Peak shear factor of sand A vs. Rubber content for smooth and rough steel at 25 and 200 kPa normal stresses.
Figure 13.
Peak shear factor of sand A vs. Rubber content for smooth and rough steel at 25 and 200 kPa normal stresses.
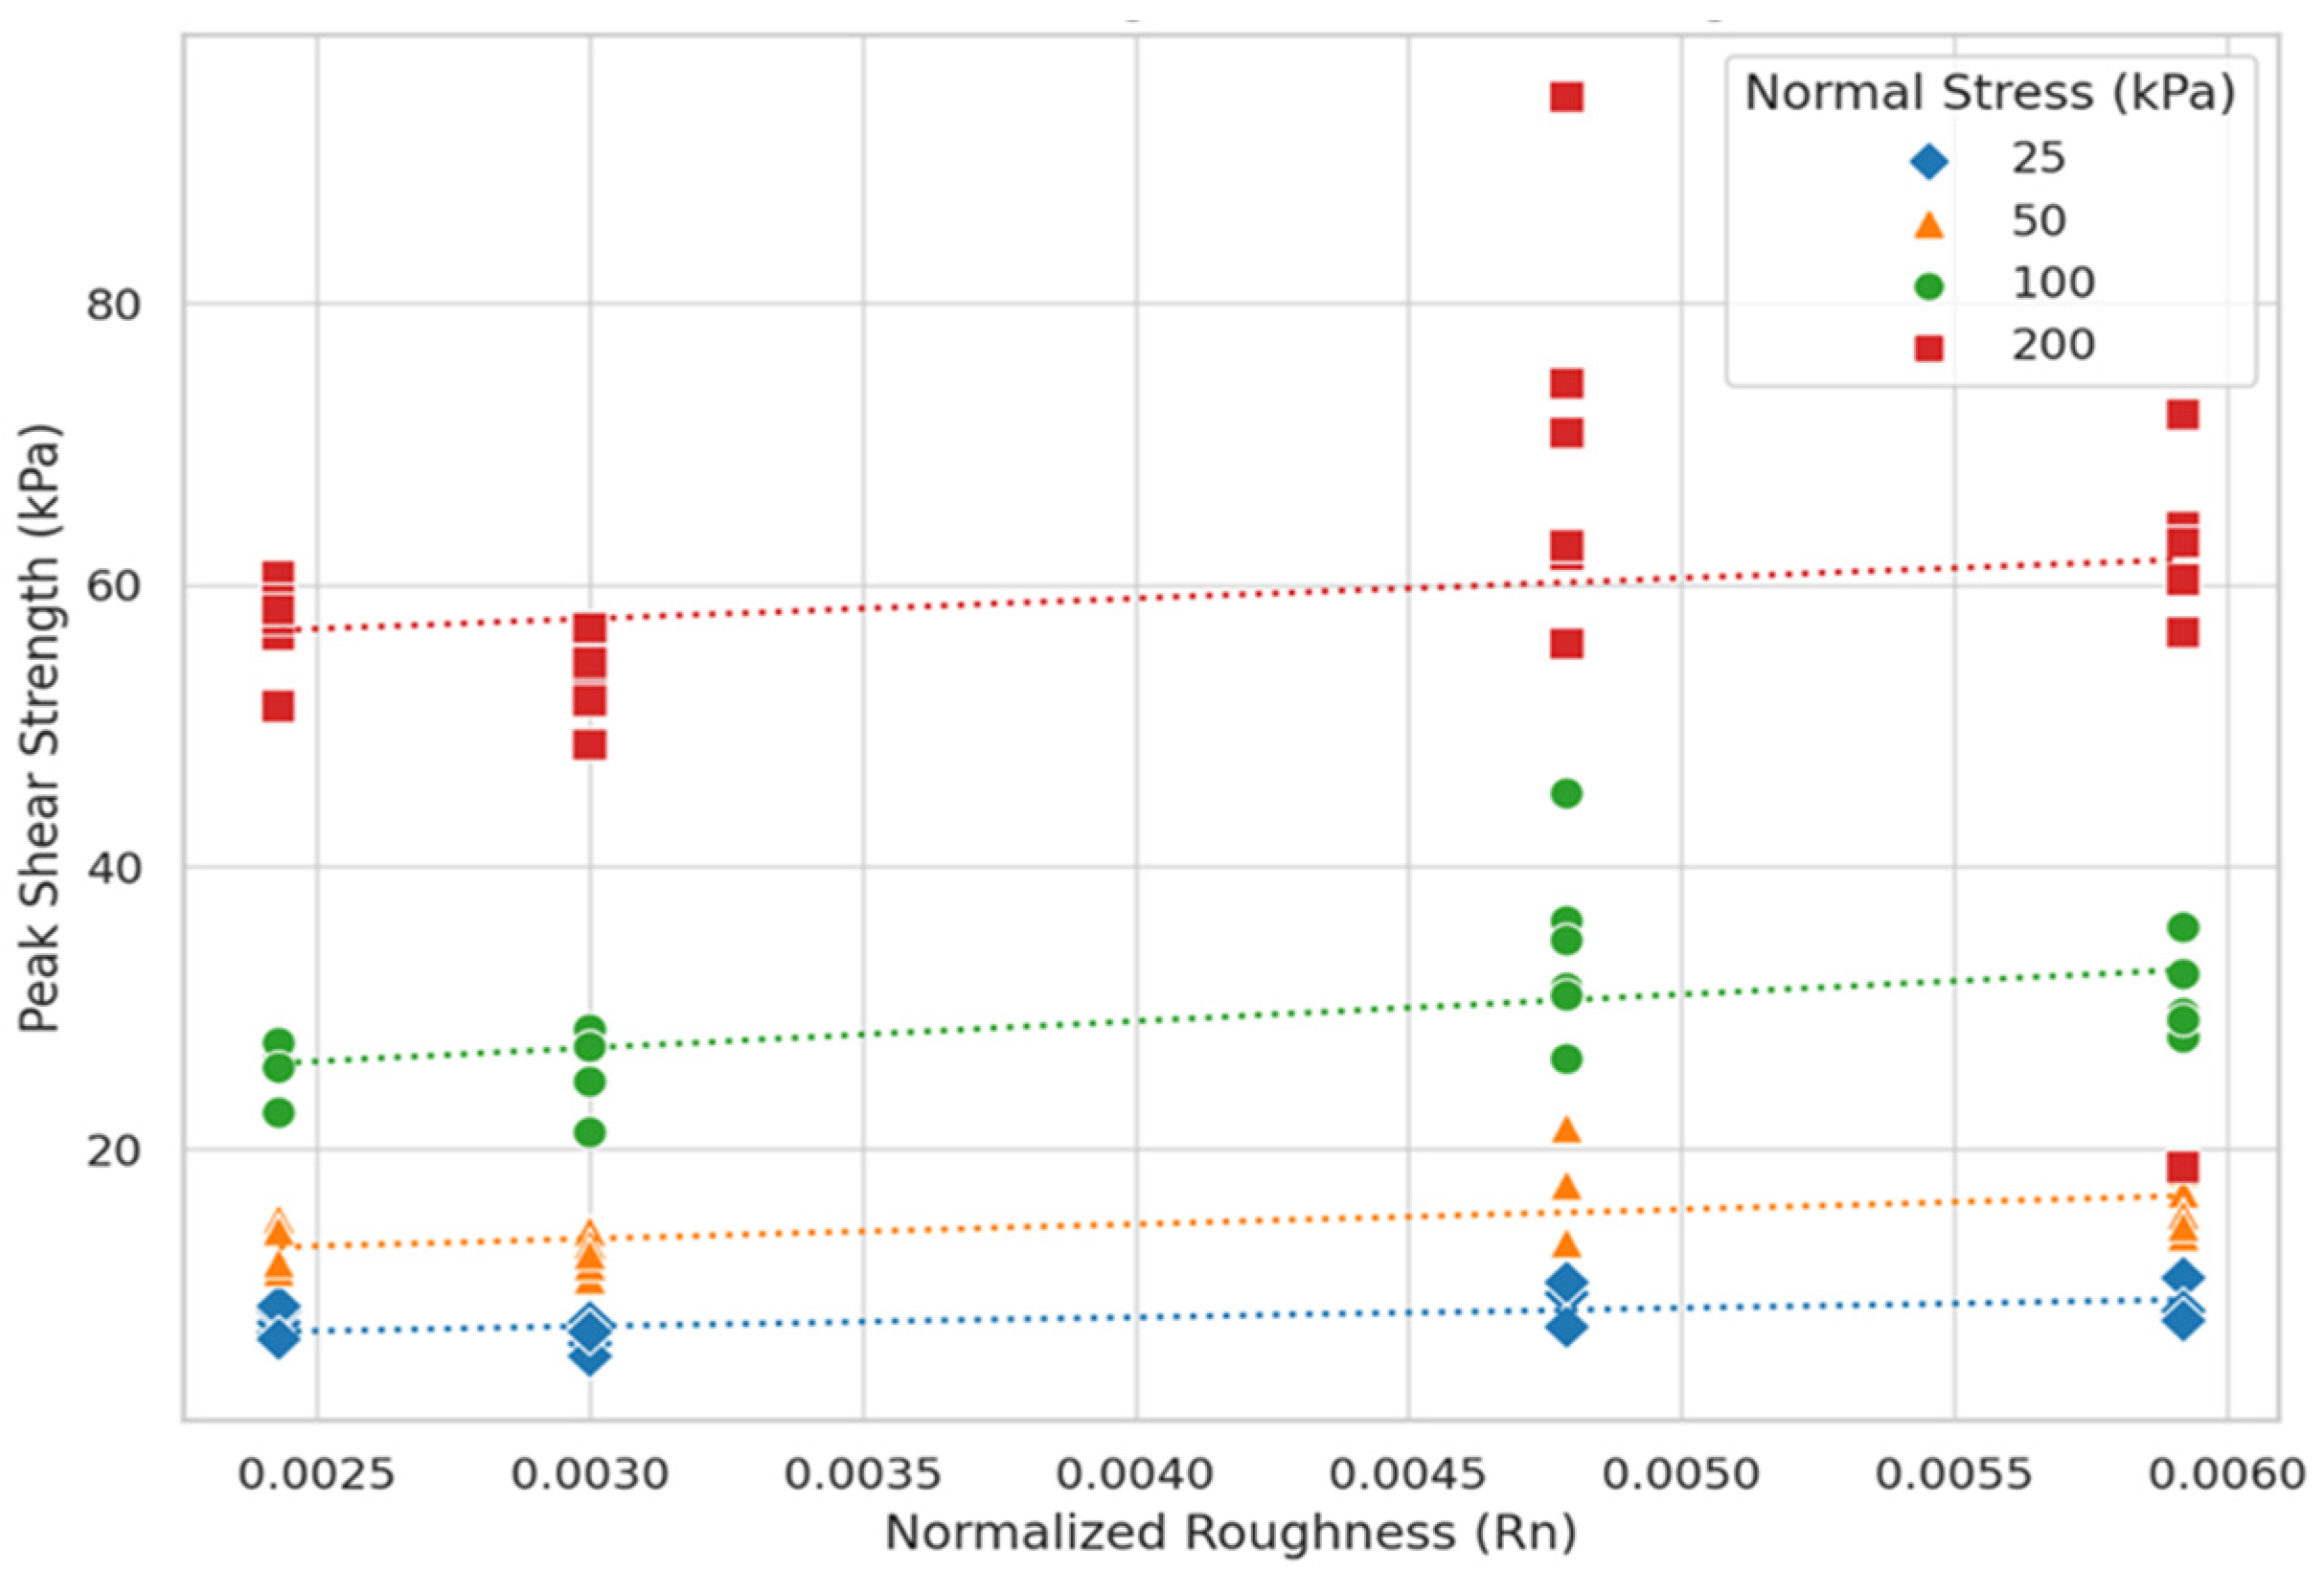
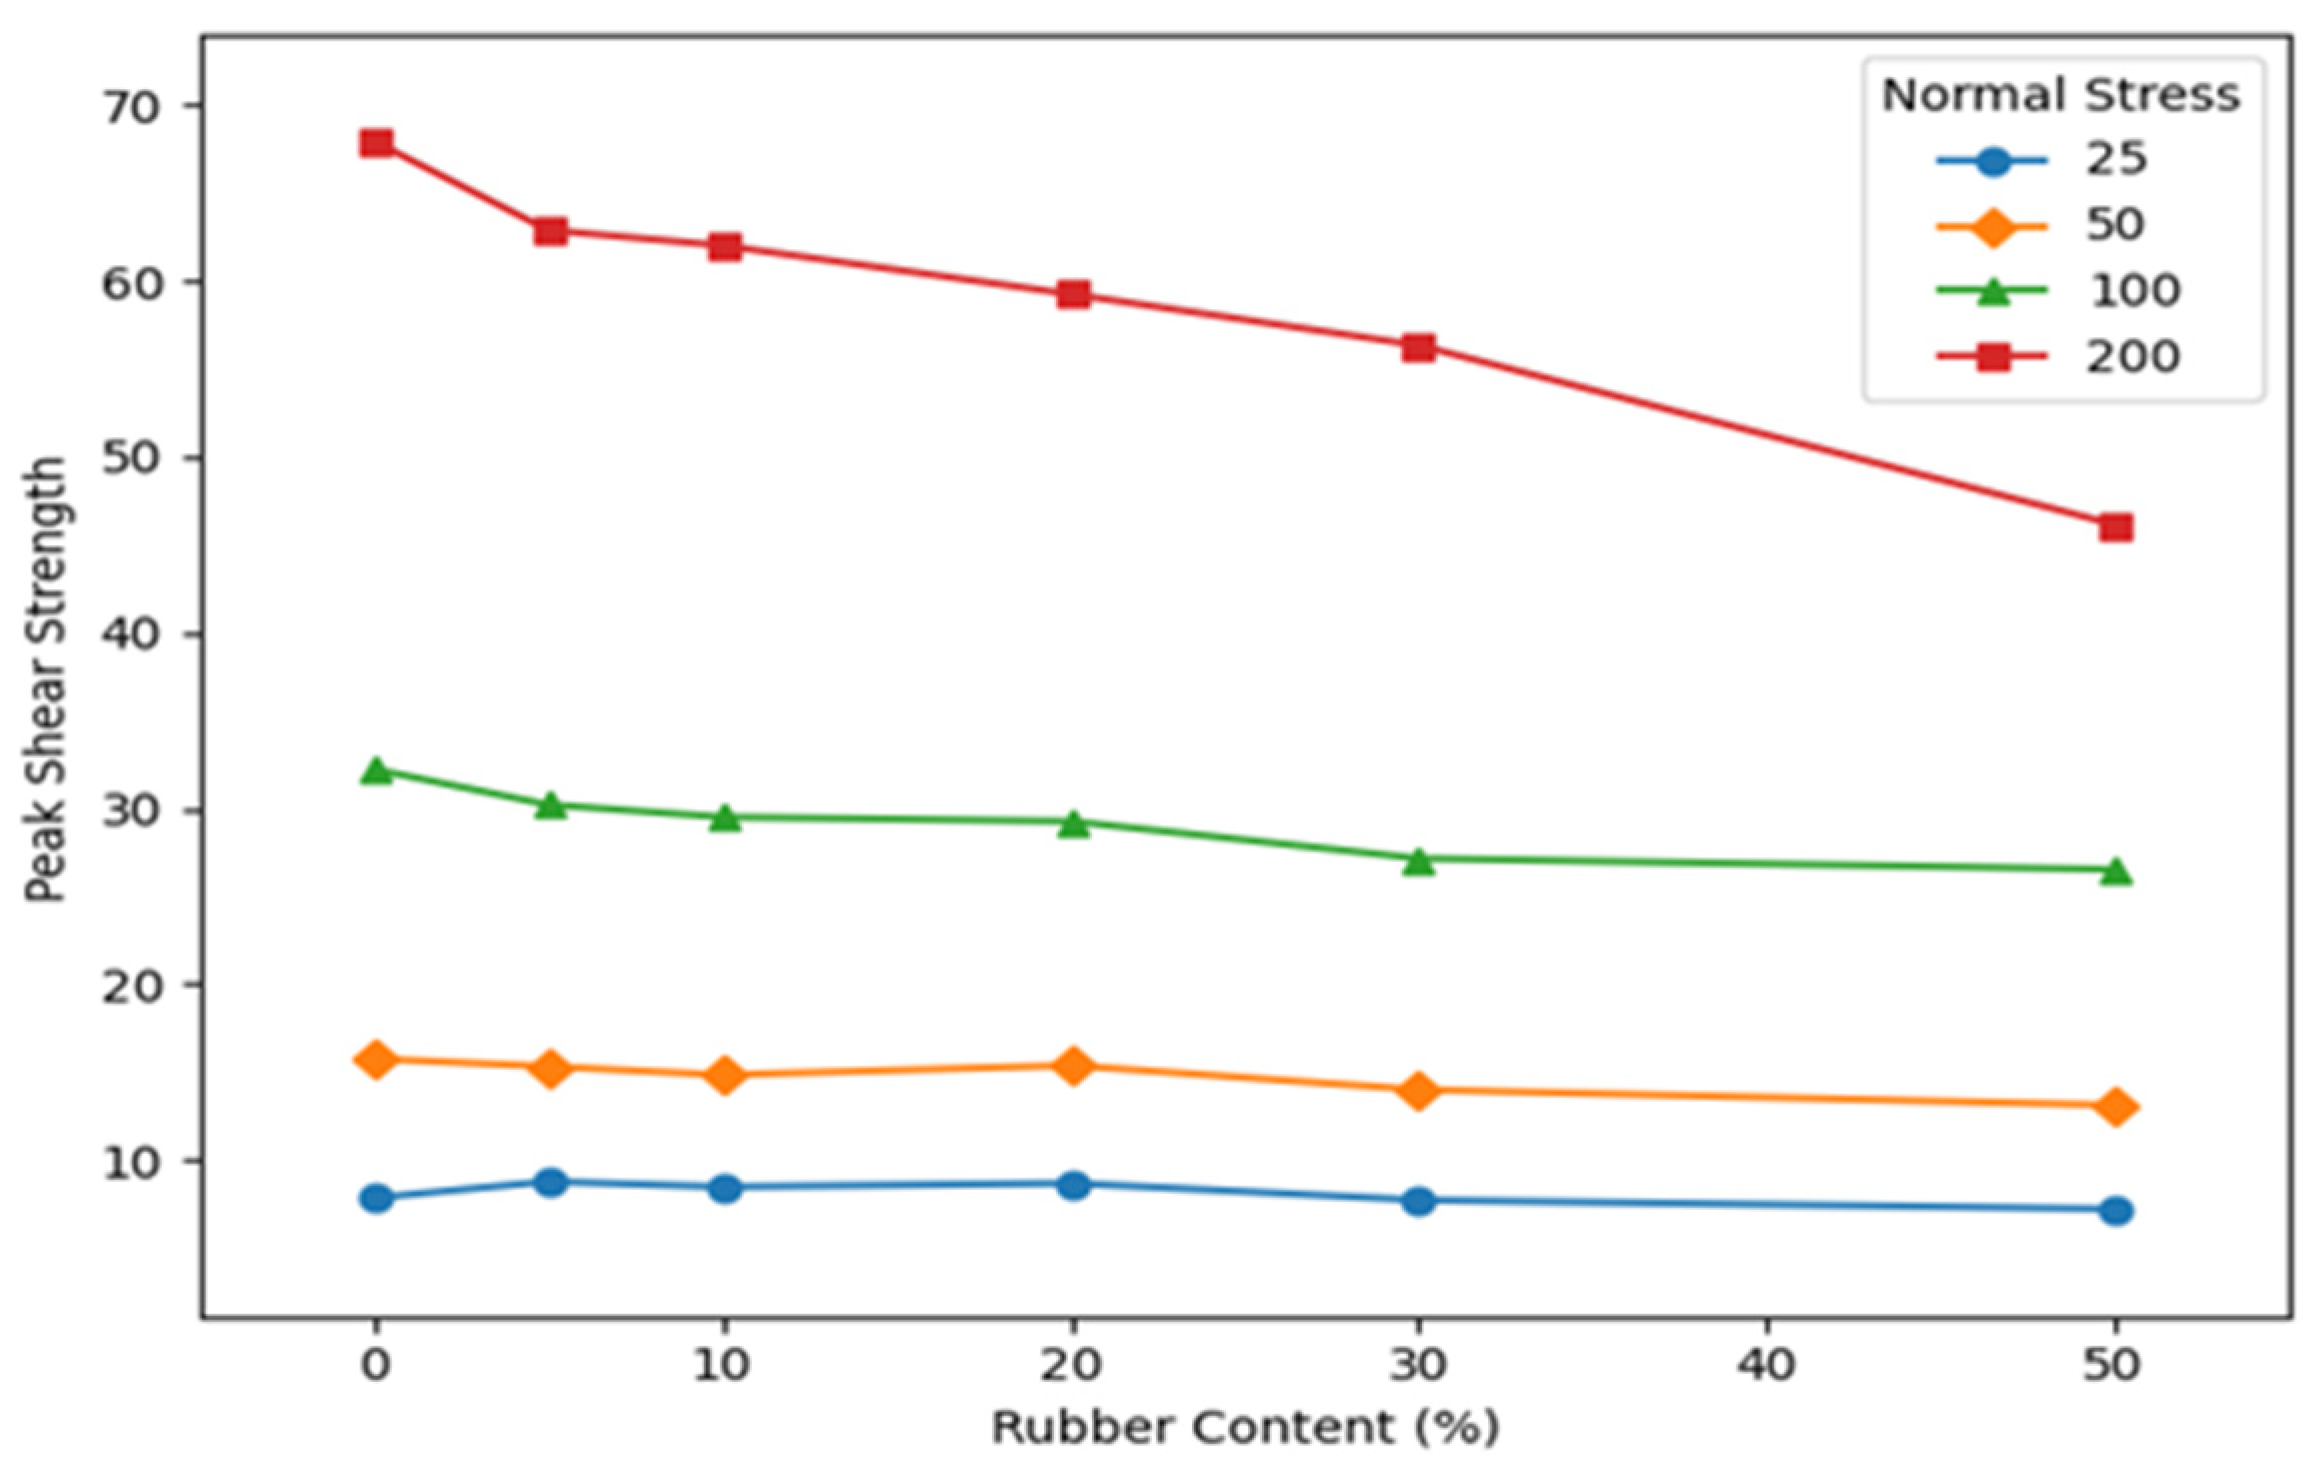
Figure 14.
Peak shear strength versus normalised roughness at four normal stress levels for Rubber A mixtures.
Figure 14.
Peak shear strength versus normalised roughness at four normal stress levels for Rubber A mixtures.
Figure 15.
Shear stress–displacement behaviour of sand–rubber mixtures at 200 kPa normal stress with varying rubber content (RC %). (a) Sand A on smooth steel, (b) Sand A on rough steel, (c) Sand B on smooth steel, and (d) Sand B on rough steel.
Figure 15.
Shear stress–displacement behaviour of sand–rubber mixtures at 200 kPa normal stress with varying rubber content (RC %). (a) Sand A on smooth steel, (b) Sand A on rough steel, (c) Sand B on smooth steel, and (d) Sand B on rough steel.
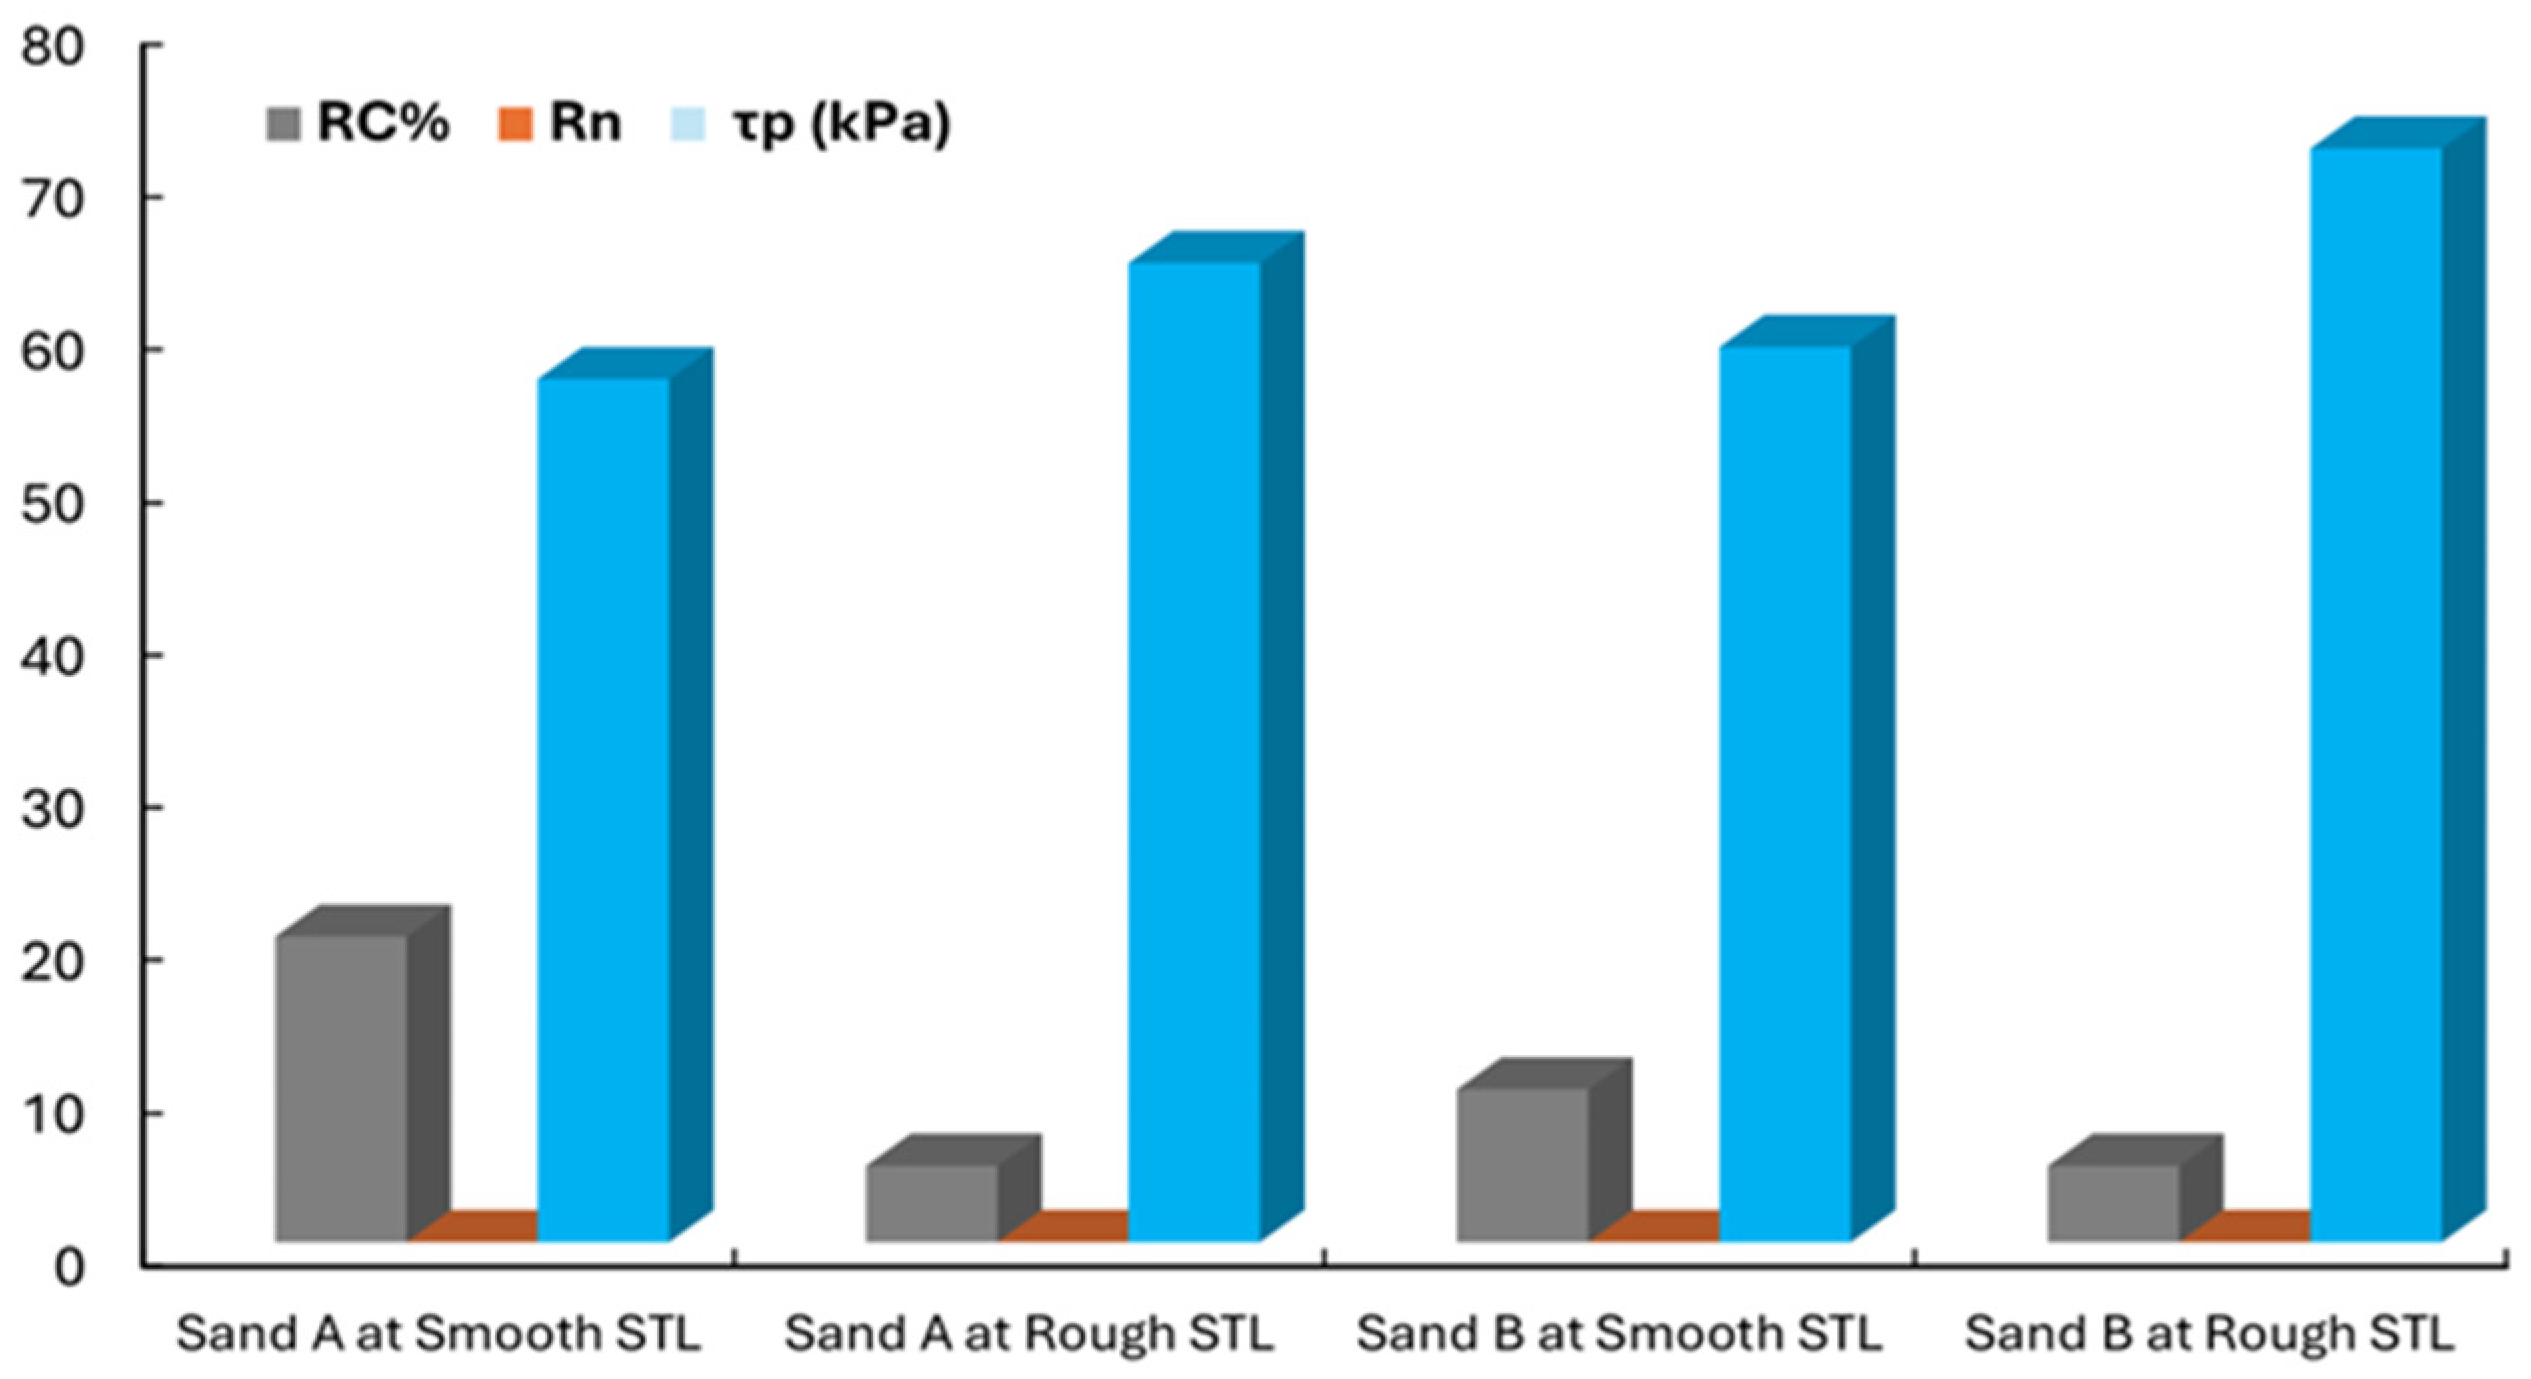
Figure 16.
Comparison of peak shear stress (τp) for selected sand–rubber mixtures, showing the influence of rubber content (RC %) and normalised roughness (Rn) under 200 kPa normal stress.
Figure 16.
Comparison of peak shear stress (τp) for selected sand–rubber mixtures, showing the influence of rubber content (RC %) and normalised roughness (Rn) under 200 kPa normal stress.
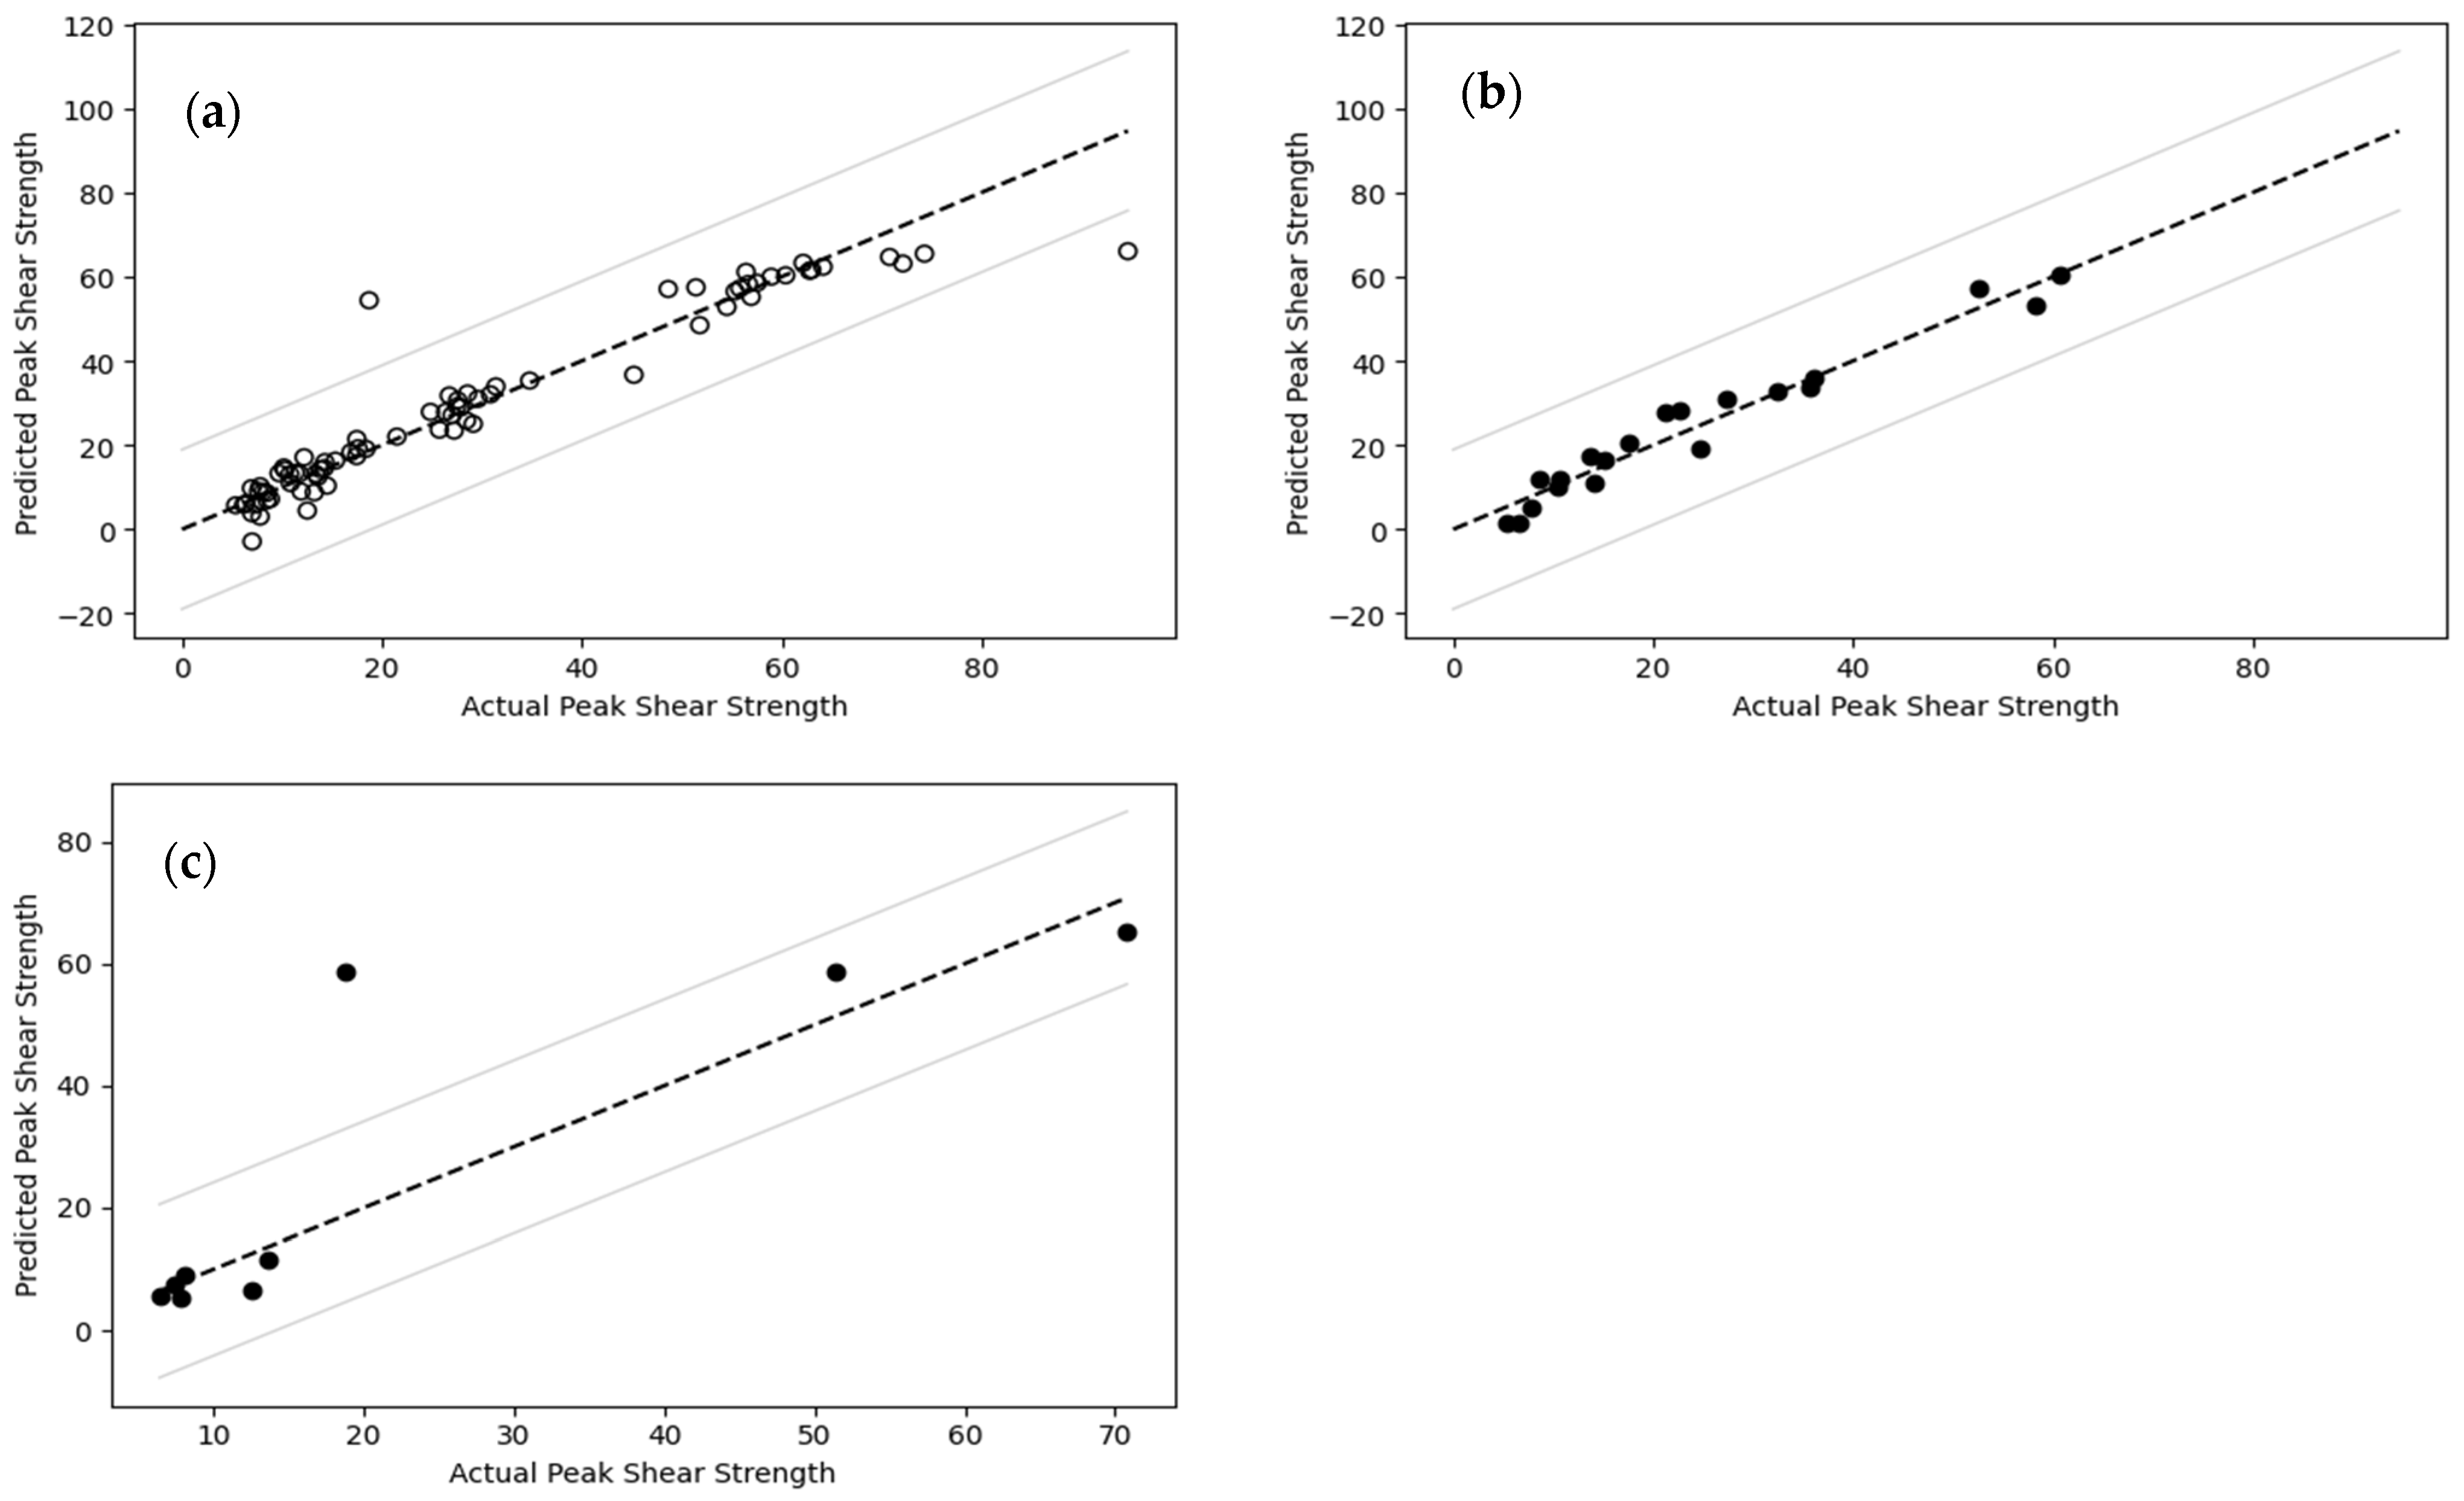
Figure 17.
Comparison of actual and predicted peak interface shear strength using MLR for (a) the training dataset, (b) the testing dataset, and (c) 10-fold cross-validation.
Figure 17.
Comparison of actual and predicted peak interface shear strength using MLR for (a) the training dataset, (b) the testing dataset, and (c) 10-fold cross-validation.
Figure 18.
Effect of rubber content (RC %) on peak interface shear strength (τp) under different normal stresses.
Figure 18.
Effect of rubber content (RC %) on peak interface shear strength (τp) under different normal stresses.
Figure 19.
Comparison of actual and predicted residual interface shear strength using MLR for (a) the training dataset, (b) the testing dataset, and (c) 10-fold cross-validation.
Figure 19.
Comparison of actual and predicted residual interface shear strength using MLR for (a) the training dataset, (b) the testing dataset, and (c) 10-fold cross-validation.
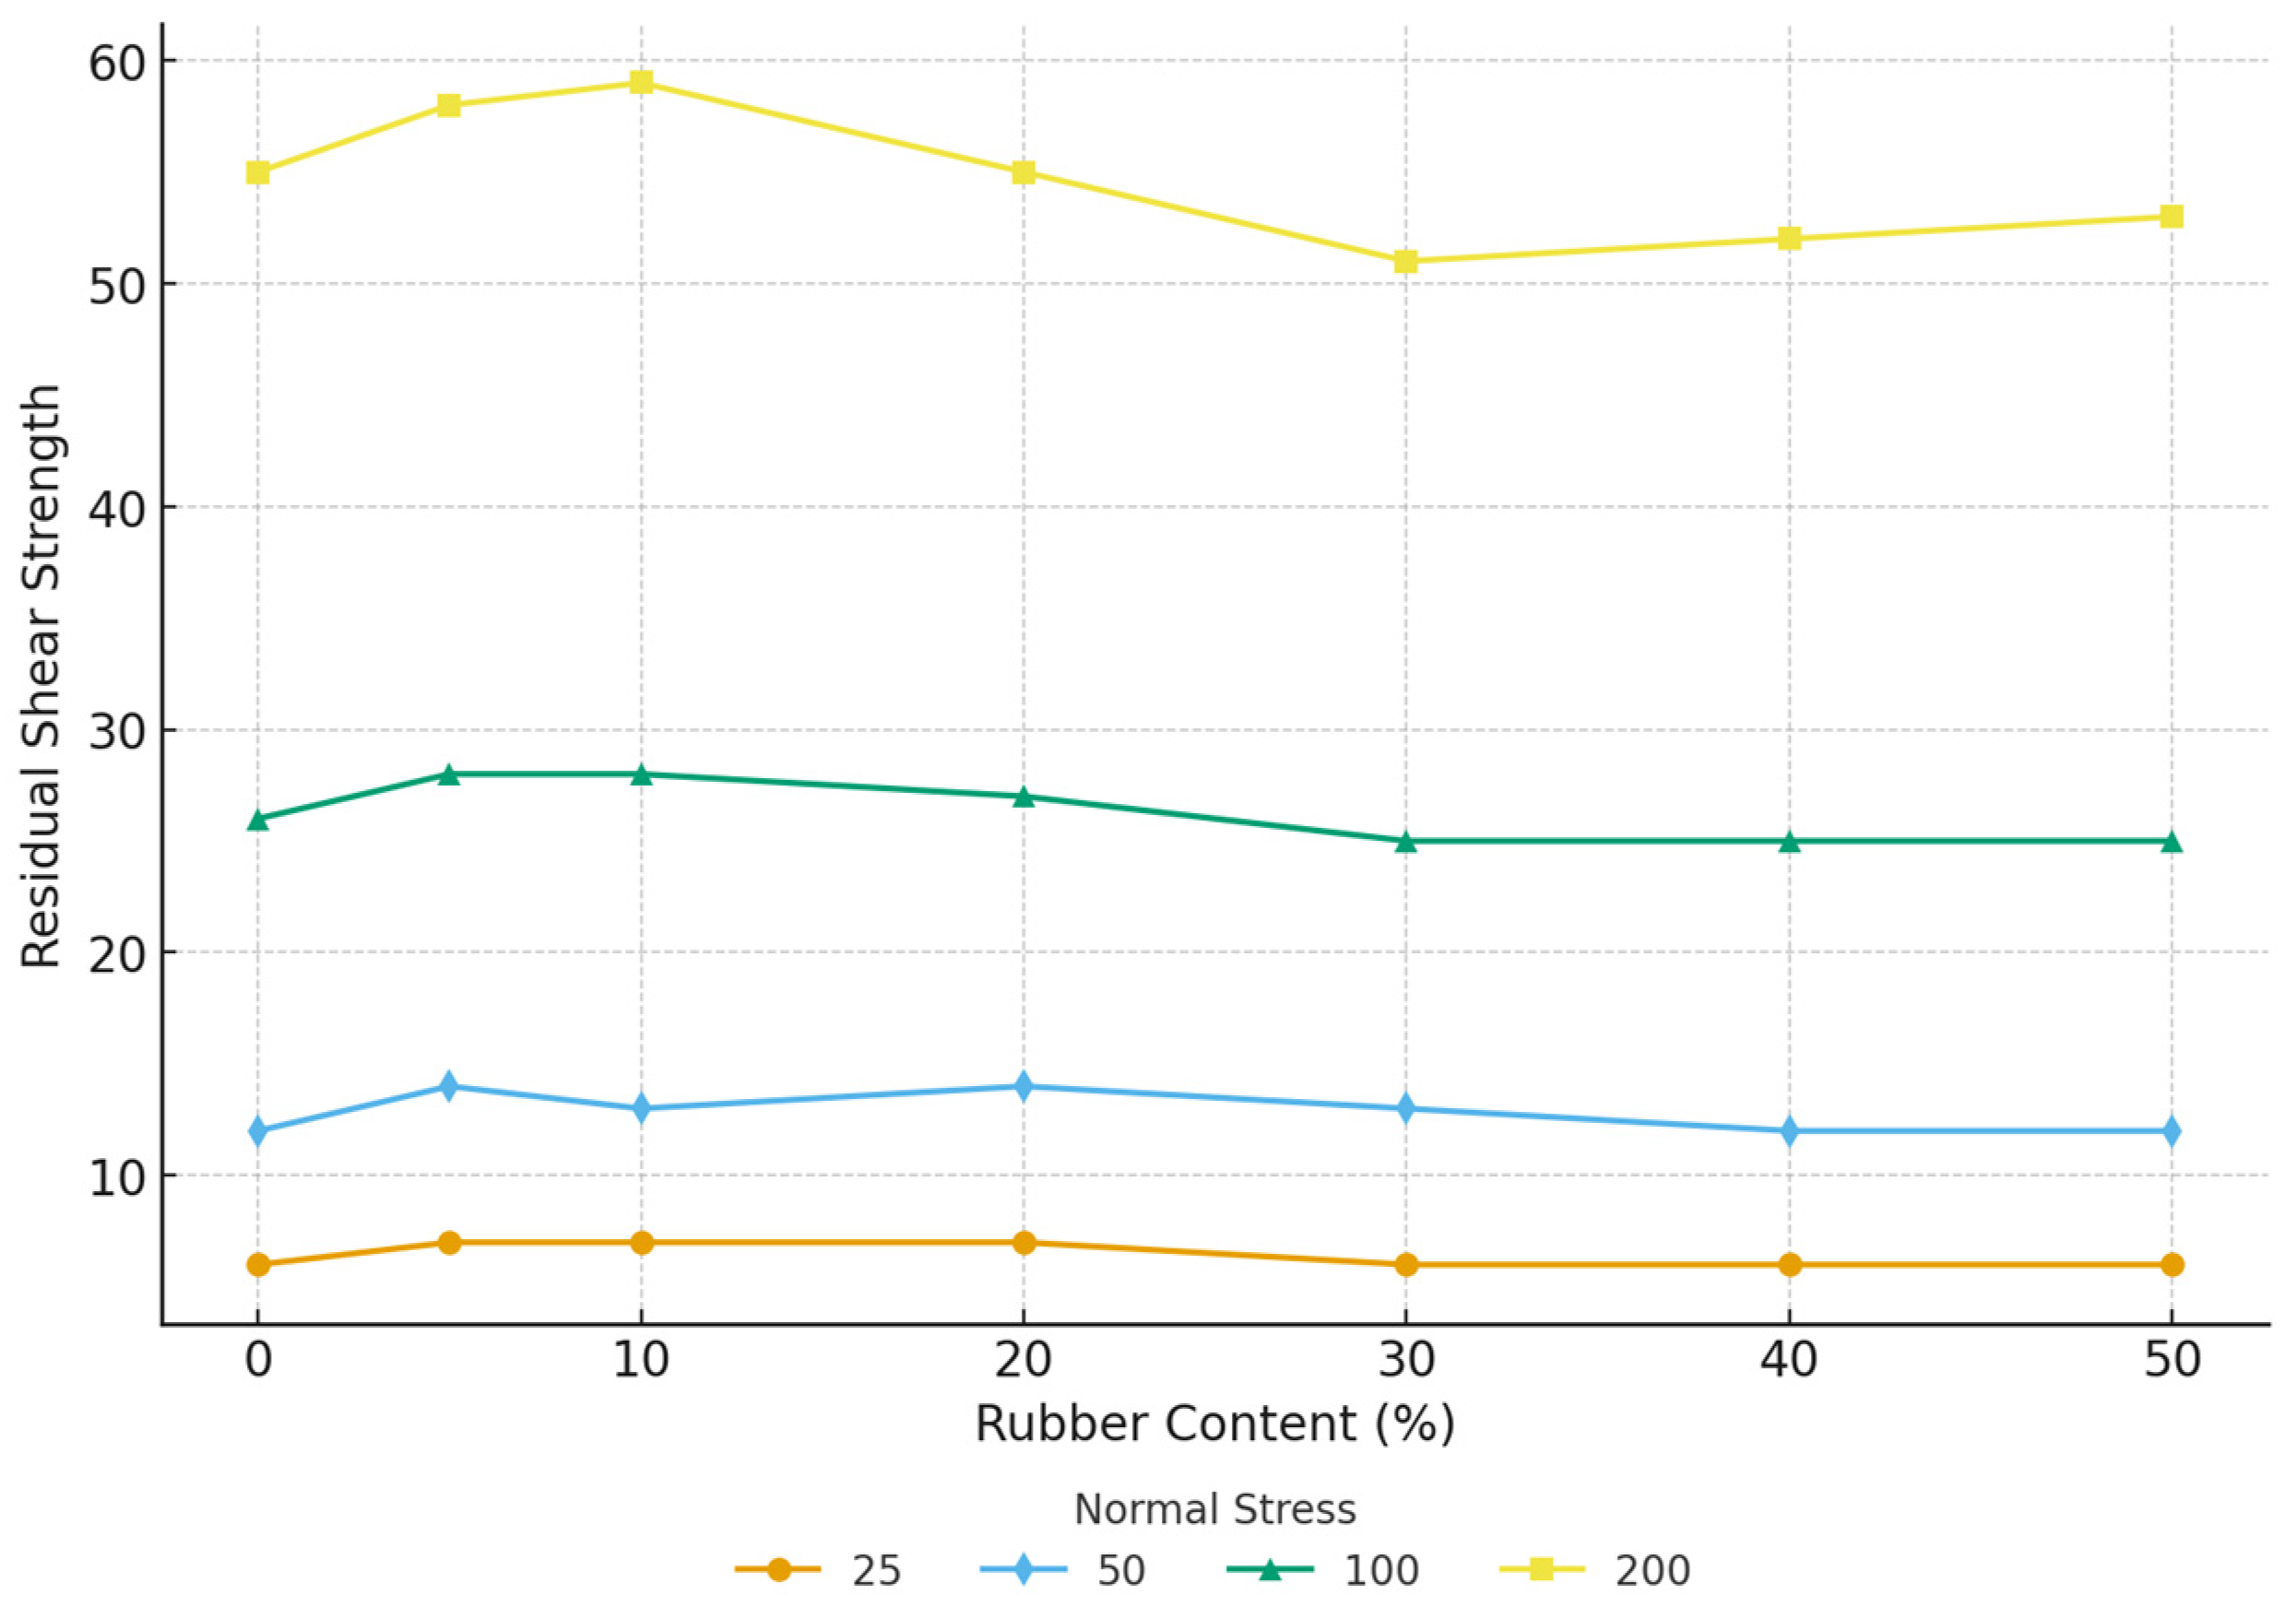
Figure 20.
Effect of rubber content (RC %) on residual interface shear strength (τp) under different normal stresses.
Figure 20.
Effect of rubber content (RC %) on residual interface shear strength (τp) under different normal stresses.
Figure 21.
Comparison of actual and predicted peak interface shear strength using RFR for (a) the training dataset, (b) the testing dataset, and (c) 10-fold cross-validation.
Figure 21.
Comparison of actual and predicted peak interface shear strength using RFR for (a) the training dataset, (b) the testing dataset, and (c) 10-fold cross-validation.
Figure 22.
Comparison of actual and predicted residual interface shear stress using RFR for (a) the training dataset, (b) the testing dataset, and (c) 10-fold cross-validation.
Figure 22.
Comparison of actual and predicted residual interface shear stress using RFR for (a) the training dataset, (b) the testing dataset, and (c) 10-fold cross-validation.
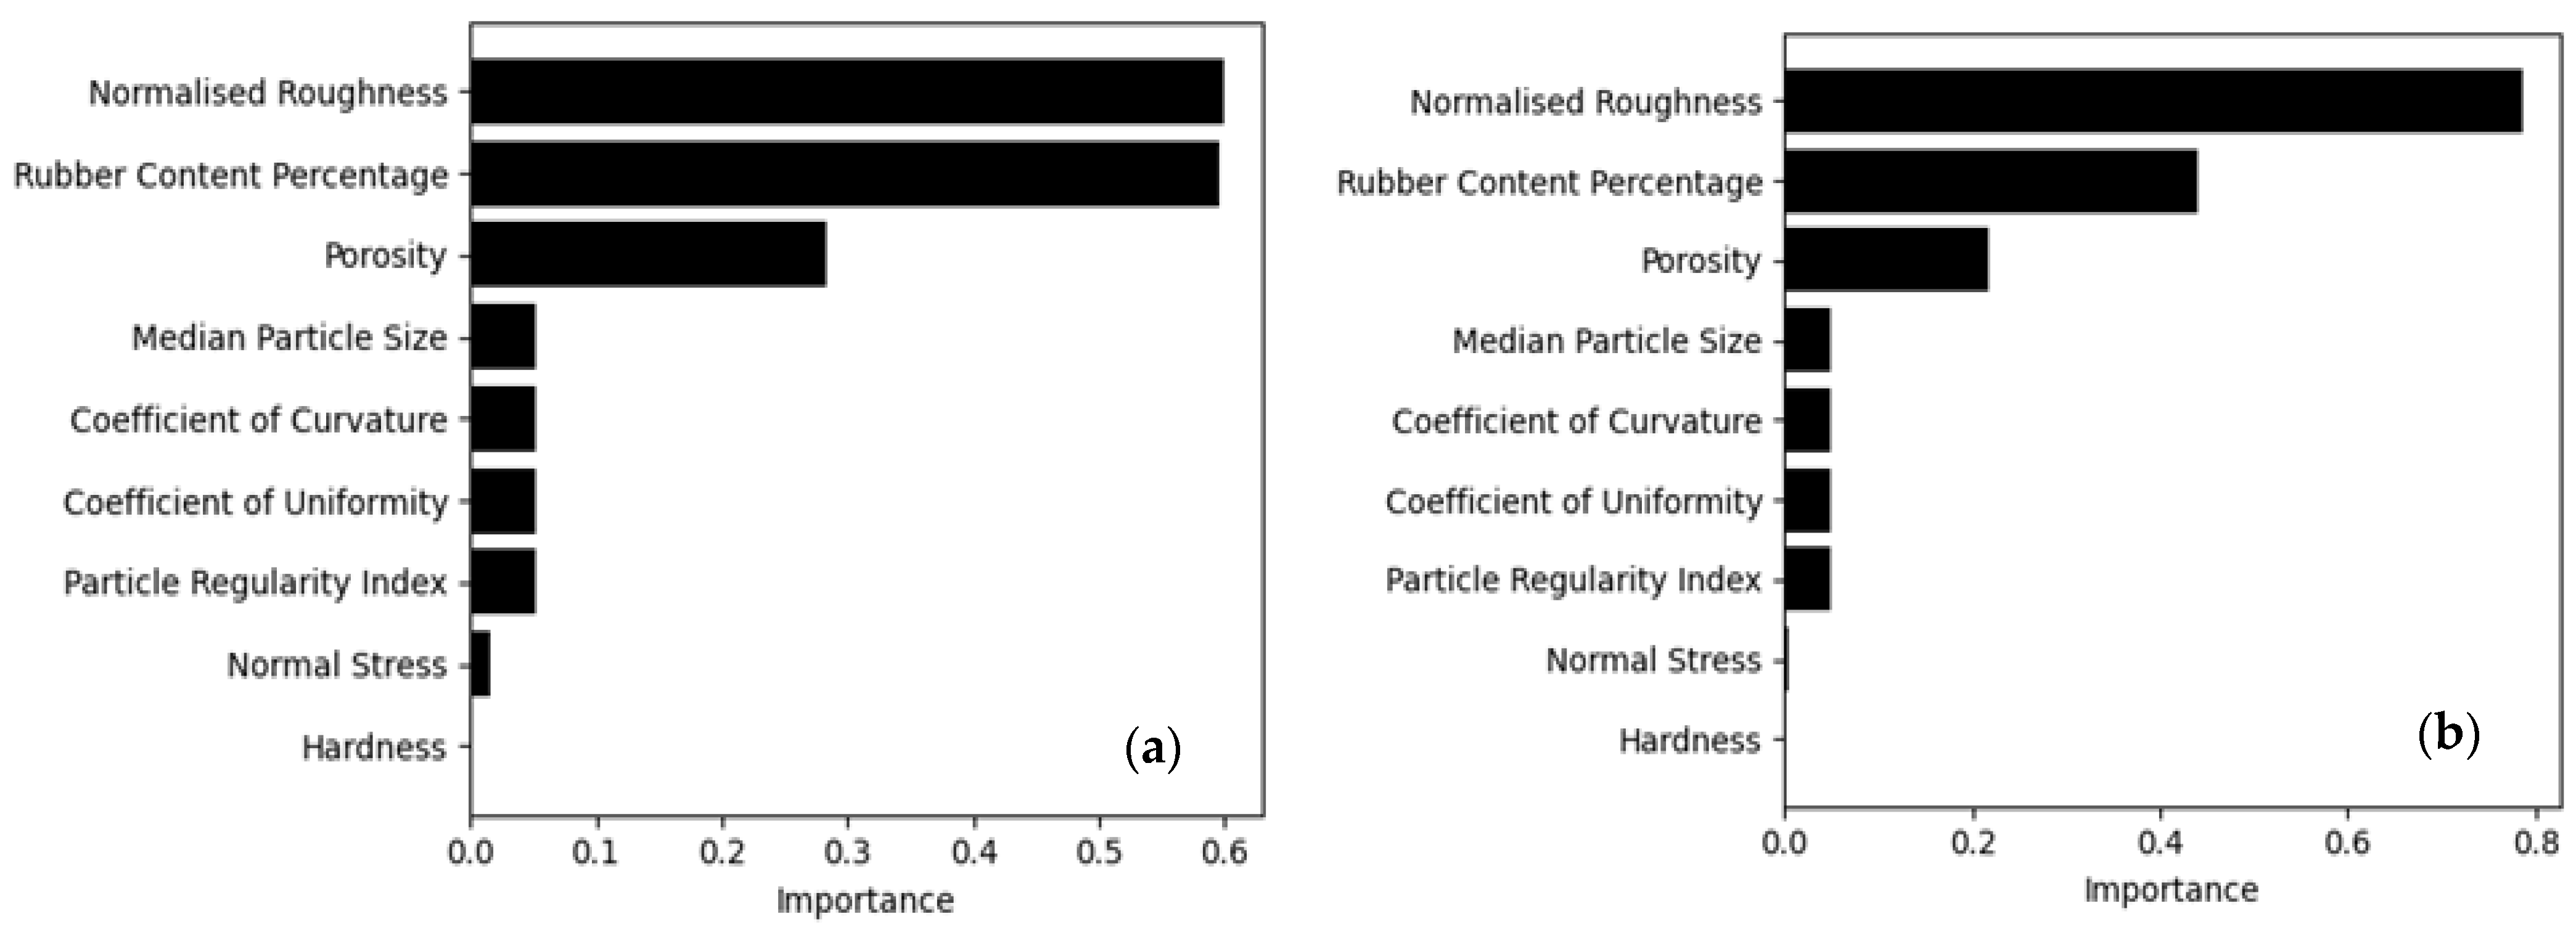
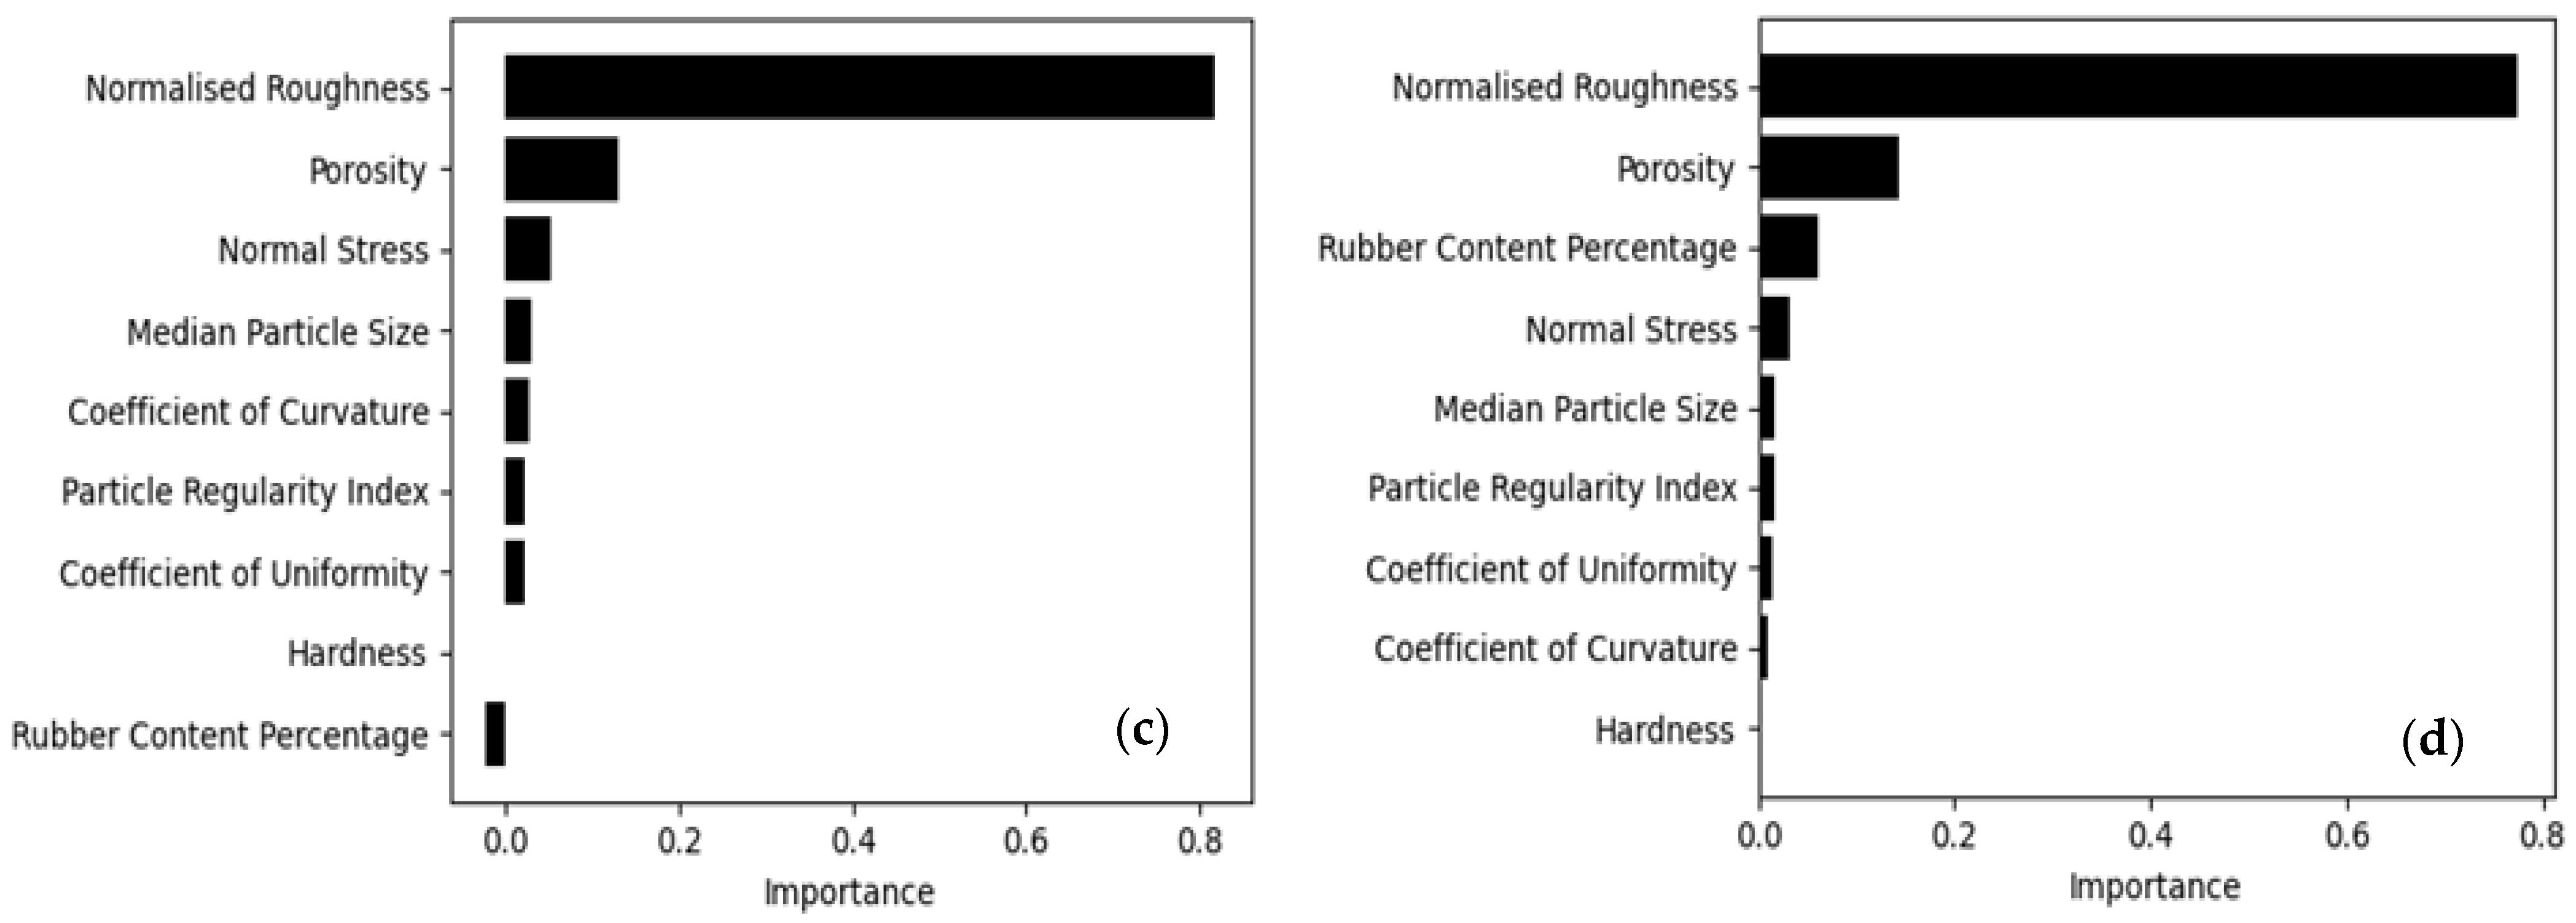
Figure 23.
Feature importance for predicting shear strength factor using (a) MLR–peak, (b) MLR–residual, (c) RFR–peak, and (d) RFR–residual. The feature importance values reported here are averaged over 10-fold cross-validation and are therefore representative of the full dataset rather than a single split.
Table 1.
Properties of soil used in the study.
Table 1.
Properties of soil used in the study.
| Soil | Type | Gs | D50 (mm) | Cu | Cc | RI |
|---|
| A | Quartz Medium Sand | 2.65 | 0.51 | 0.97 | 0.72 | 0.72 |
| B | Quartz Coarse Sand | 2.65 | 1.77 | 1.45 | 0.96 | 0.40 |
Table 2.
Properties of the Recycled Material used in the study.
Table 2.
Properties of the Recycled Material used in the study.
| Recycled Material | D50 (mm) | Cu | Cc | Gs | ρr |
|---|
| Rubber-A | 0.54 | 3.26 | 1.18 | 1.13 | 0.46 |
| Rubber-B | 1.58 | 2.10 | 1.12 | 1.13 | 0.46 |
Table 3.
Properties of the Continuum surfaces used in the study.
Table 3.
Properties of the Continuum surfaces used in the study.
| Material | Rt (μm) | HD (HV) |
|---|
| Smooth Steel | 7.48 | 112.2 |
| Rough Steel | 22.23 | 112.2 |
Table 4.
Key parameters and their descriptions.
Table 4.
Key parameters and their descriptions.
| Feature | Description |
|---|
| D50 | Median particle size influencing contact area and interlocking at the interface. |
| RI | Regularity index representing particle shape consistency, affecting interface friction. |
| n | Porosity influencing packing density and interparticle contact at the interface. |
| Cu | Coefficient of uniformity reflecting particle size distribution and packing behaviour. |
| Cc | Coefficient of curvature indicating gradation characteristics and interparticle arrangement. |
| RC | Recycled rubber content by dry weight, controlling soil compressibility and interface response. |
| σn | Applied normal stress on the interface, governing shear mobilisation. |
| Rn | Normalised roughness influencing mechanical interlocking at the soil–structure interface. |
| HD | Surface hardness of the continuum, affecting shear resistance and deformation behaviour. |
Table 5.
Peak shear stress (τp) and normalised roughness (Rn) for selected sand–rubber mixtures at 200 kPa, showing lowest and highest interface strengths.
Table 5.
Peak shear stress (τp) and normalised roughness (Rn) for selected sand–rubber mixtures at 200 kPa, showing lowest and highest interface strengths.
| Sand–Interface | Rn | τp max (kPa) | RC max (%) | τp min (kPa) | RC min (%) |
|---|
| Sand A–Smooth | 0.003 | 56.5 | 20 | 44 | 0 |
| Sand A–Rough | 0.006 | 71.6 | 5 | 50 | 30 |
| Sand B–Smooth | 0.002 | 58.6 | 10 | 45 | 30 |
| Sand B–Rough | 0.004 | 71.6 | 5 | 55 | 50 |
Table 6.
Evaluation of MLR model accuracy in predicting interface shear strength.
Table 6.
Evaluation of MLR model accuracy in predicting interface shear strength.
| | | Training Database | Testing Database | 10-Fold CV |
|---|
| | Observations | 76 | 20 | 96 |
| Peak | MAE | 3.40 | 3.07 | 3.30 |
| RMSE | 6.29 | 3.63 | 5.07 |
| RMSLE | 0.33 | 0.35 | 0.25 |
| R2 | 0.91 | 0.95 | 0.91 |
| Residual | MAE | 2.01 | 2.24 | 2.09 |
| RMSE | 2.96 | 2.70 | 2.77 |
| RMSLE | 0.20 | 0.20 | 0.17 |
| R2 | 0.97 | 0.96 | 0.97 |
Table 7.
Evaluation of RFR model accuracy in predicting interface shear strength.
Table 7.
Evaluation of RFR model accuracy in predicting interface shear strength.
| | | Training Database | Testing Database | 10-Fold CV |
|---|
| | Observations | 72 | 18 | 90 |
| Peak | MAE | 1.15 | 3.60 | 3.01 |
| RMSE | 2.33 | 6.80 | 4.98 |
| RMSLE | 0.08 | 0.20 | 0.15 |
| R2 | 0.98 | 0.83 | 0.91 |
| Residual | MAE | 0.69 | 2.06 | 1.91 |
| RMSE | 0.93 | 2.55 | 2.45 |
| RMSLE | 0.04 | 0.13 | 0.11 |
| R2 | 0.99 | 0.97 | 0.98 |
Table 8.
Evaluation of MLR versus RFR on training, testing, and 10-fold cross-validation datasets.
Table 8.
Evaluation of MLR versus RFR on training, testing, and 10-fold cross-validation datasets.
| | | Multiple Linear Regression | Random Forest Regression |
|---|
| | | Training Data | Testing Data | 10-Fold CV | Training Data | Testing Data | 10-Fold CV |
|---|
| | Observation | 76 | 20 | 96 | 72 | 18 | 90 |
| Peak | MAE | 3.40 | 3.07 | 3.30 | 1.15 | 3.60 | 3.01 |
| RMSE | 6.29 | 3.63 | 5.07 | 2.33 | 6.80 | 4.98 |
| RMSLE | 0.33 | 0.35 | 0.25 | 0.08 | 0.20 | 0.15 |
| R2 | 0.91 | 0.95 | 0.91 | 0.98 | 0.83 | 0.91 |
| Residual | MAE | 2.01 | 2.24 | 2.09 | 0.69 | 2.06 | 1.91 |
| RMSE | 2.96 | 2.70 | 2.77 | 0.93 | 2.55 | 2.45 |
| RMSLE | 0.20 | 0.20 | 0.17 | 0.04 | 0.13 | 0.11 |
| R2 | 0.97 | 0.96 | 0.97 | 0.99 | 0.97 | 0.98 |
