Article

Physicochemical Properties of Alkali-Activated Ground-Granulated Blast Furnace Slag (GGBS)/High-Calcium Fly Ash (HCFA) Cementitious Composites

1
XPCC Surveying Designing Institute Group Co., Ltd., Urumqi 830002, China
2
State Key Laboratory of Chemistry and Utilization of Carbon-Based Energy Resources, College of Chemistry, Xinjiang University, Urumqi 830017, China
3
Xinjiang Xinlu Shunjie Engineering Consulting Co., Ltd., Urumqi 830017, China
*
Authors to whom correspondence should be addressed.
These authors contributed equally to this work.
Buildings 2025, 15(18), 3265; https://doi.org/10.3390/buildings15183265
Submission received: 18 August 2025 / Revised: 2 September 2025 / Accepted: 8 September 2025 / Published: 10 September 2025
(This article belongs to the Collection Sustainable and Green Construction Materials)

Abstract

This study advances alkali-activated cementitious materials (AACMs) by developing a ground-granulated blast furnace slag/high-calcium fly ash (GGBS/HCFA) composite that incorporates Tuokexun desert sand and by establishing a clear linkage between activator chemistry, mix proportions, curing regimen, and microstructural mechanisms. The innovation lies in valorizing industrial by-products and desert sand while systematically optimizing the aqueous glass modulus, alkali equivalent, HCFA dosage, and curing temperature/time, and coupling mechanical testing with XRD/FTIR/SEM to reveal performance–structure relationships under thermal and chemical attacks. The optimized binder (aqueous glass modulus 1.2, alkali equivalent 6%, and HCFA 20%) achieved 28-day compressive and flexural strengths of 52.8 MPa and 9.5 MPa, respectively; increasing HCFA beyond 20% reduced compressive strength, while flexural strength peaked at 20%. The preferred curing condition was 70 °C for 12 h. Characterization showed C-(A)-S-H as the dominant gel; elevated temperature led to its decomposition, acid exposure produced abundant CaSO4, and NaOH exposure formed N-A-S-H, each correlating with strength loss. Quantitatively, acid resistance was weaker than alkali resistance and both deteriorated with concentration: in H2SO4, 28-day mass loss rose from 1.22% to 4.16%, with compressive/flexural strength retention dropping to 75.2%, 71.2%, 63.4%, and 57.4% and 65.3%, 61.6%, 58.9%, and 49.5%, respectively; in NaOH (0.2/0.5/0.8/1.0 mol/L), 28-day mass change was +0.74%, +0.88%, −1.85%, and −2.06%, compressive strength declined in all cases (smallest drop 7.77% at 0.2 mol/L), and flexural strength increased at lower alkalinity, consistent with a pore-filling micro-densification effect before gel dissolution/cracking dominates. Practically, the recommended mix and curing window deliver structural-grade performance while improving high-temperature and acid/alkali resistance relative to non-optimized formulations, offering a scalable, lower-carbon route to utilize regional desert sand and industrial wastes in durable cementitious applications.

1. Introduction

In recent years, with the deepening of reforms in the field of building materials and the active implementation of building energy conservation policies in China, new building materials featuring energy efficiency, emission reduction, and sustainable development have been increasingly emphasized by the state [1]. The Ministry of Industry and Information Technology released the 14th Five-Year Plan for Industrial Green Development (2021–2025) in December 2021, which clearly stipulates requirements for comprehensive resource utilization of industrial solid waste, to fully improve the utilization rate of industrial solid waste and reduce or even eliminate environmentally harmful disposal practices such as stockpiling and landfilling [2]. Currently, the potentially active raw materials in industrial solid waste include red mud (RM) [3], coal gangue (CG) [4], fly ash (FA) [5], ground-granulated blast furnace slag (GGBS) [6,7], steel slag [8], coal gangue, etc. These industrial solid wastes can be made into green, environmentally friendly materials with cementitious properties under the action of alkali activators [9,10]. As a result, utilizing industrial solid wastes as raw materials for alkali-activated cementitious materials (AACMs) has significant implications in terms of resource reuse, energy savings, and emission reduction [11]. Furthermore, cementitious materials utilized in building projects confront numerous durability issues, including acid and alkali assault, sulfate attack, alkali aggregate reaction, and low fire resistance [12,13], which must be investigated.
Alkali-activated cementitious materials (AACMs) are a class of inorganic, non-metallic binders that have been widely studied. Compared with ordinary Portland cement (OPC) [14], AACMs generally exhibit superior mechanical performance, acid and alkali resistance [15], freeze–thaw resistance, high-temperature resistance [16], and carbonation resistance [17]. Researchers have reported that the contents of ground-granulated blast furnace slag (GGBS) and fly ash (FA) [18,19], the water-to-binder ratio, alkali activator dosage and concentration, and curing conditions all influence the mechanical properties and durability of AACMs [20,21,22]. During alkali activation, these parameters govern system reactivity and shape the morphology of the reaction products [8].
Lee et al. [23] found that the compressive strength of alkali-activated fly ash–slag blends increases with higher slag content, while it decreases with increasing water-to-binder ratio. Elyamany et al. [24] evaluated the mechanical properties and microstructure of geopolymer mortars, showing that elevated curing temperature and higher sodium hydroxide molarity effectively enhance both compressive and flexural strength. For alkali-activated slag, some studies report that compressive strength rises with increasing silicate modulus [25], whereas others observe the opposite trend [26]. Wang Min et al. [27] compared single and combined activation of FA and showed that co-activation with Na2SiO3 and NaOH accelerates reaction kinetics and yields higher strength at equivalent curing ages. Gao et al. [28] investigated high-modulus sodium silicate solutions and demonstrated that modulus, temperature, and residence time significantly affect the silicate network structure at 50 g/L; the polymerization degree of sodium polysilicate anions increased as the modulus rose from 1.5 to 3.0 and decreased with longer residence time.
AACMs also offer practical advantages, including a simplified preparation process, elimination of high-temperature calcination, lower energy consumption, and improved environmental performance. They are a viable alternative to OPC and hold substantial potential for the valorization of industrial solid wastes [9]. The most commonly reported activation routes are alkali, phosphate, and sulfate activation. These methods enhance hydration kinetics in cementitious systems by catalyzing the hydration of mineral admixtures; however, as curing progresses, the hydration rate gradually declines and eventually stabilizes, approaching completion [29,30]. Although many factors influencing AACM performance have been identified and notable progress has been made worldwide, systematic studies on the hydration mechanisms of AACMs—particularly those based on high-calcium fly ash (HCFA)—remain scarce.
High-calcium fly ash (HCFA) contains substantial free CaO; if not properly managed, it can cause poor volume stability in concrete or mortar and late-age expansion that inhibits strength development [31]. Crystalline Ca-bearing phases are key contributors to strength in alkali-activated systems, and the phase transformations of calcium species in HCFA during activation are critical for material characterization and optimization [32,33]. Compared with low-calcium fly ash, processing routes and methodological advances for HCFA are less mature, leading to an incomplete understanding of its behavior.
Using HCFA as the primary precursor, Feng Zeping [34] achieved a 28-day compressive strength of 51.7 MPa (83.3 MPa at 120 days) for an HCFA-based AACM at a sodium silicate modulus of 1.1, an activator dosage of 8%, and a water-to-binder ratio of 0.37. Chai Shuyuan [35] prepared AACMs from HCFA using NaOH–Na2SiO3 composite activators and reported a nonmonotonic trend in compressive strength with increasing silicate modulus: strength first increased and then decreased. High early-age strength was observed, with a 3-day compressive strength of 55.4 MPa at a modulus of 1.5 and an activator-to-binder ratio of 0.43, whereas the gains at 7 and 28 days were limited. The water-to-solid ratio had a pronounced effect on binder performance. Overall, studies on the effects of sodium silicate (aqueous glass) modulus and alkali equivalent, FA dosage, and curing temperature and time on the mechanical properties of alkali-activated HCFA-based composite binders provide valuable practical guidance.
In this study, GGBS and HCFA industrial solid wastes were used as raw materials and combined with Tuokexun desert sand to produce an alkali-activated GGBS/HCFA composite cementitious material. The sodium silicate modulus and alkali equivalent were adopted as control variables to analyze how mechanical properties evolve with activator composition and curing age. An optimal mix was then identified and used to examine the effect of HCFA dosage on mechanical performance. Steam-curing experiments were conducted on specimens prepared with the optimal mix to assess the influence of steam-curing temperature and duration, elevated temperature exposure, and acid and alkali environments on mechanical properties and microstructure. XRD, FTIR, and SEM were employed to characterize the phase assemblage, chemical bonding, and microstructure of hydration products across conditions and ages, thereby elucidating the hydration mechanisms and the coupled evolution of mechanical properties and microstructure.
This study primarily addresses the following gaps: the lack of a systematic, quantitative understanding of the coupled relationships among mix design, activator chemistry (aqueous glass modulus and alkali equivalent), curing regime, hydration products, and macroscopic mechanical properties in alkali-activated composite systems using granulated blast furnace slag (GGBS) and high-calcium fly ash (HCFA) as precursors with Tuokexun desert sand; in particular, insufficient mechanistic evidence regarding the relative sensitivity of alkali equivalent versus modulus, the threshold for “alkaline water damage” triggered by excessive alkalinity, and the differential effects of HCFA dosage on compressive versus flexural strength; and a scarcity of targeted data and characterization to support durability performance and microscale failure pathways (e.g., evolution and phase transformations of C-(A)-S-H gels) under high-temperature and acidic/alkaline environments. By establishing optimal mix proportions and curing windows and elucidating hydration–property linkages via XRD/FTIR/SEM, this study seeks to fill these gaps and provide a foundation for the engineering application of aeolian sand resources and industrial solid waste in alkali-activated cementitious materials.

2. Materials and Experiments

2.1. Material

The primary materials used in this study were ground-granulated blast furnace slag (GGBS), high-calcium fly ash (HCFA), Tuokexun desert sand, and alkali activators. The GGBS was an S95-grade mineral powder (white in appearance) sourced from the Huaneng Shang’an Power Plant (Shijiazhuang, China); its technical requirements and performance indices, compliant with GB/T 18046-2017 [36] (ground-granulated blast furnace slag used in cement, mortar, and concrete), are summarized in Table 1. The HCFA was supplied by Henan Xingyang No. 1 Power Plant, Zhengzhou, China. Tuokexun desert sand was collected from an aeolian dune field in Tuokexun County, Turpan, Xinjiang, China (WGS84: g88.51675987,42.57609077). After removing the surface crust, eight sub-samples at 0–20 cm depth along a ~200 m transect were composited and reduced by quartering to ~30 kg, sealed in PE bags, and stored dry. Prior to use the sand was oven-dried at 105 ± 5 °C for 24 h and dry-sieved to remove particles >2.36 mm; no washing was applied., The sand has a bulk density of 1602.5 kg/m3, an apparent density of 2604.5 kg/m3, and a clay content of 0.4%; its fineness modulus of approximately 2.89 qualifies. The composite activator consisted of NaOH and Na2SiO3 solution [37,38]. NaOH (industrial-grade flakes, 98% purity) was procured from Xinjiang Zhongtai Chemical Co., Ltd. (No. 39, Yangchenghu Road, Urumqi Economic and Technological Development Zone, Xinjiang, China). The Na2SiO3 solution (Na2O content of 8.2%, SiO2 content of 26.4%, solids content of 35%, modulus 3.12) was supplied by Xinjiang Qihang Aqueous Glass Technology Co., Ltd., Qinhuangdao, China. The preparation procedure for the alkaline activator is shown in Figure 1. Compressive specimens were cast as sets of three 150 mm cubes, and flexural specimens were standard prisms (150 × 150 × 550 mm; width × height × length), three per set, in accordance with GB/T 50081 [39]. Curing temperature (60, 70, 80, or 90 °C) and curing duration (8, 12, 16, or 20 h) were varied to evaluate the development of flexural and compressive strengths at 3, 7, and 28 days for alkali-activated fly ash composite cementitious materials with different FA or HCFA contents under different curing regimes.
Figure 2 shows the SEM images of several raw materials, such as GGBS, HCFA, and Tuokexun desert sand. GGBS particles are irregular angular shapes with sharp edges, appearing similar to lamellar irregular structure particles, mostly gravelly and of variable size. GGBS is formed in the blast furnace temperature of thousands of degrees Celsius in the molten state of GGBS after water-cooled molding, rapid water quenching, and cooling of the blast furnace slag crystals in the destruction of a variety of complex chemical bonding structures, so that the electron microscope scanning mineral particles show a variety of sizes of variable morphology and even appear in the phenomenon of clusters [40]. HCFA has spherical particles of different sizes agglomerated with each other, and its surface has smaller particles attached to the spherical surface. These tiny particles are agglomerated with voids between each other, and the surface is not smooth. Tuokexun desert sand is a granular regional geologic material composed of mineral particles that have been eroded by the wind over the years and have an elevated, rougher surface that is mostly oval in shape [41].
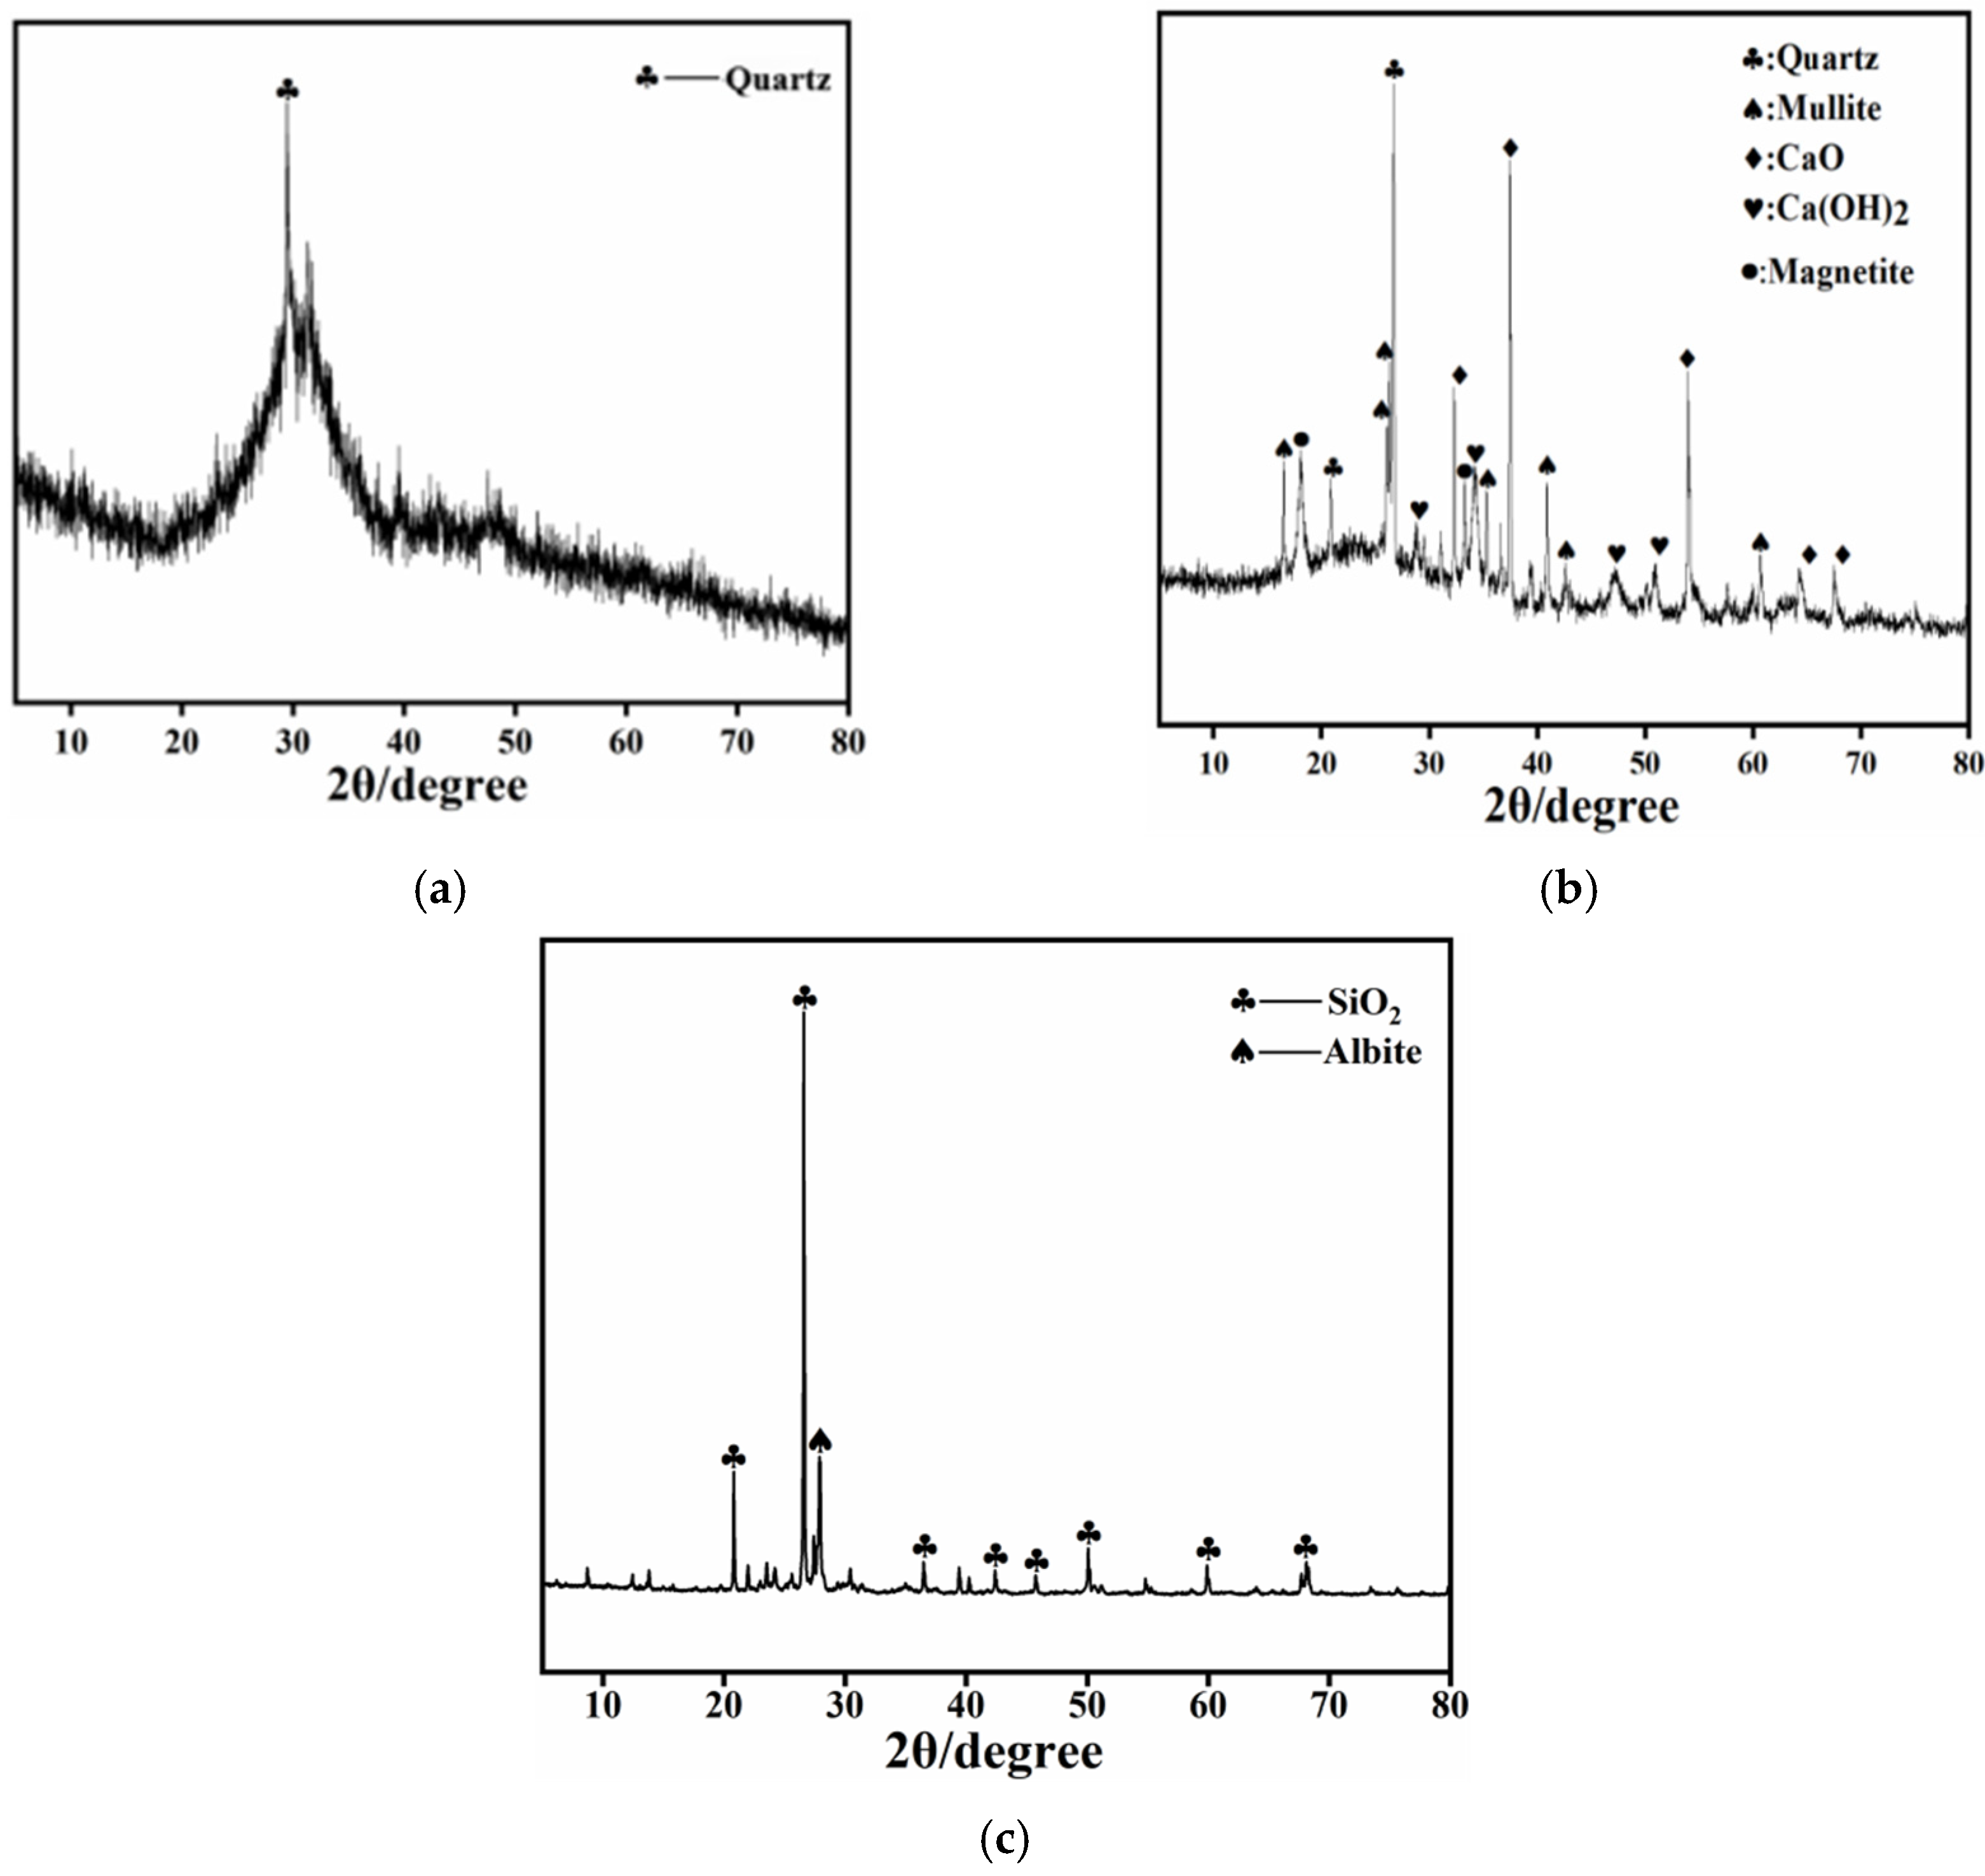
Figure 3 shows the phase composition of the raw material. The broad hump between 20° and 40° 2θ in the powder XRD (Figure 3a–c) pattern indicates the presence of abundant amorphous structures, including SiO2 and other glassy phases. In addition, several diffraction peaks represent crystalline phases, namely small amounts of crystalline SiO2 [42]. The raw HCFA sample contains quartz (SiO2), mullite, CaO, and Ca(OH)2. There are also Ca-rich glassy/crystalline phases, such as calcium aluminate and dicalcium aluminate, which exhibit higher reactivity. Because HCFA is rich in calcium, its diffraction pattern is complex and includes CaO, Ca(OH)2, and minor crystals of CaCO3 and CaSO4. The calcium-bearing phases in HCFA are highly reactive and hydrate readily. Tuokexun desert sand is mainly composed of SiO2 and contains the sodium aluminosilicate mineral albite (NaAlSi3O8). Accordingly, the amorphous glassy fraction corresponding to the 20–40° (2θ) hump is the principal reactive source for forming N-A-S-H and C-(A)-S-H; among the crystalline phases, inert silicoaluminate minerals primarily act as nucleation sites and fillers, whereas Ca-bearing crystalline phases increase alkalinity and supply Ca and Al, biasing the system toward C-(A)-S-H and hybrid gels [43]. A moderate Ca supply promotes synergistic gel formation and densification, while excess Ca reduces the proportion of N-A-S-H, yields lower-polymerized C-(A)-S-H, and may coarsen the pore structure [44].
According to the chemical composition of each substance in Table 2, the main chemical components of HCFA are SiO2, Al2O3, and CaO, and their CaO content is higher than 10%, which belongs to HCFA. Due to the high content of free CaO in the components, HCFA will cause poor system stability and even strength shrinkage when it is used for slurry, which is rarely used in the civil industry at present. The correlation coefficients of each chemical composition of mineral powder are as follows:
Activity   coefficient :   H 0 = A l 2 O 3 S i O 2 = 0.51 > 0.25
Alkaline   coefficient :   M 0 = C a O + M g O S i O 2 + A l 2 O 3 = 0.77 > 1
Hydraulic   module :   b = C a O + M g O + A l 2 O 3 S i O 2 = 1.67 > 1.4
Mass   coefficient :   K = C a O + M g O + A l 2 O 3 S i O 2 + M g O + T i O 2 = 1.4 > 1.2
Based on the chemical analysis, the GGBS used in this study has relatively high SiO2 and CaO contents. Higher values of the reactivity index and the hydraulic modulus generally indicate greater slag reactivity and higher early strength under alkali activation; likewise, a higher basicity index reflects stronger alkalinity in the slag. The mass coefficient—an empirical composition-based index analogous to the alkalinity/hydraulic modulus (e.g., (CaO + MgO + Al2O3)/SiO2 or (CaO + MgO)/SiO2)—characterizes the proportion of network-modifying oxides (CaO, MgO, and Al2O3) relative to the network former SiO2. A larger value implies a more depolymerized slag–glass network, which facilitates dissolution–polycondensation and accelerates the formation of C-(A)-S-H hydrates, leading to higher reactivity and early strength. All test results comply with GB/T 18046-2017 [36], confirming that this GGBS is suitable for use as a binder in alkali-activated systems. According to the grading of Tuokexun natural desert sand (Table 3), the particle size is predominantly 0.6–2.36 mm; the cumulative passing of the coarser sieves reaches about 99%, indicating a uniform particle size and texture with no obvious coarse particles, although its plasticity is inferior to that of river sand.

2.2. The Mixture Ratio and the Sample Preparation

2.2.1. Mix Design and Specimen Preparation

The chemical composition of aqueous glass can be expressed as Na2O.nSiO2, and n is the modulus of aqueous glass, which is the molar ratio of SiO2 and Na2O in aqueous glass. Research by Wu et al. [44] indicate that three different moduli of 1.2, 1.4, and 1.6 are used to ensure a good activation effect. Because the existing aqueous glass modulus is 3.12, it is necessary to add NaOH to the aqueous glass to reduce the modulus, that is, from the modulus 3.12 to 1.2, 1.4, and 1.6, respectively. The calculation process for aqueous glass modulus is as follows:
Let the mass of Na+ required for the experiment be x, then the mass of Na2O required is 1.348x;
Given the molar ratio of SiO2/Na2O in the final solution is 1.2, and SiO2 is provided entirely by the original aqueous glass solution, we can determine that the mass of Na2O in the original solution is 1.348/3.12 = 0.432x.
Therefore, the mass of Na2O provided by NaOH is 1.348x − 0.432x = 0.916x. Given 2NaOH → Na2O + H20, we obtain MNaOH = 0.916x × 80/62 = 1.182x; aqueous glass = 0.432x/8.7% = 4.966x.
Based on the amount of cementitious material used, the quantities of aqueous glass and flake NaOH added can be calculated to obtain the following results: Na2O ≈ 61.98 g/mol, SiO2 ≈ 60.08 g/mol, and SiO2 ≈ 60.08 g/mol.
To investigate the effect of different aqueous glass moduli, alkali equivalents, HCFA dosages, curing temperatures, and curing times on the flexural and compressive strength of AACMs, GGBS was used as a compound mixing agent with HCFA, and NaOH and aqueous glass were mixed as a compounding activation, and the test ratios were determined according to Table 4. The modulus and alkali equivalent of aqueous glass were established at three levels, 1.2, 1.4, and 1.6, respectively, with alkali equivalents of 4%, 6%, and 8% and a water–cement ratio of 0.5. According to preliminary pre-tests and the relevant literature, mechanical characteristics were best at 80% of the GGBS dose and 20% of the HCFA dosage at the appropriate age after maintenance [45].
The quality ratio of cementitious sand is one part cement, three parts Tuokexun desert sand, and half a part water, according to the GB/T17671-2021 [46]. The container of material requires 450 g ± 2 g of cementitious material, 1350 g ± 5 g of Tuokexun desert sand, and 225 g ± 1 g of water. A 40 mm*40 mm*160 mm triple mold of cemented sand specimens was created to investigate the variation rule of flexural and compressive strengths at three, seven, and twenty-eight d of age. The three test bodies were molded under the identical test conditions as the glue sand specimen.
According to the above test design and test results, the optimal ratio combination was selected to design the parameters such as HCFA mixing amount (40%, 30%, 20%, and 0%), curing temperature (60 °C, 70 °C, 80 °C, and 90 °C), curing time (8 h, 12 h, 16 h, and 20 h), etc., and analyze the change rules of flexural strength and compressive strength of alkali-activated composite cementing materials in different HCFA content mixtures after 3 d, 7 d, and 28 d under different curing systems.

2.2.2. Mechanical Properties Test and Durability Test Design

(1) Mechanical Performance test
The compressive strength of the specimen is tested according to the method specified in the GB/T 17671-2021 [46]. An automatic pressure machine was used in the test.
The pieces prepared with the optimal ratio were selected for the durability test.
(2) High-temperature resistance performance test
The specimens were placed in a muffle furnace at 200 °C, 400 °C, 600 °C, and 800 °C for high-temperature testing. The muffle furnace was heated at a rate of 15 °C/min. After 2 h, the furnace was closed and cooled to room temperature before being removed. The rate of change in mass and flexural compressive strength was tested.
(3) Acid and alkali resistance test
Specimens were immersed in 0.2 mol/L, 0.5 mol/L, 0.8 mol/L, and 1.0 mol/L concentrations of H2SO4, NaOH solution for 7 d and 28 d, respectively, to attain the corresponding age to test the mass, compute the rate of change in mass, and perform flexural and compressive strength tests.
(4) Quality change test
The volume of the specimen is 40 mm × 40 mm × 160 mm, and the mass change rate of the alkali-activated FA composite cement material is calculated by formula (1):
Wm =(M1 − M0)/M0 ×100%
where Wm—mass change rate (%); M1—initial sample mass (g); and M0—post-test sample mass (g).

2.3. Test the Equipment and Methods

This study employed complementary analytical techniques to elucidate the hydration mechanism of the cementitious system: X-ray fluorescence spectroscopy (XRF model EDX1800B, the manufacturer is Jiangsu Skyray Instrument Co., Ltd., and the place of manufacture is Kunshan City, Jiangsu Province, China) quantified the chemical composition (oxide contents) of the raw materials [46]; X-ray diffraction (XRD model Bruker D8,the manufacturer is Bruker Corporation (Germany), and the place of manufacture is Karlsruhe, Germany) provided qualitative phase identification of hydration products and tracked their evolution with aqueous glass (sodium silicate) modulus, alkali equivalent (dosage), and curing age; Fourier-transform infrared spectroscopy (FTIR model Great 10, the manufacturer is Zhongke Ruijie (Tianjin) Technology Co., Ltd., and the place of manufacture is Tianjin, China), using the KBr pressed-pellet method (KBr: sample ≈ 150:1; scan range 400–4000 cm−1), characterized bonding environments—especially Si–O and Al–O vibrations—to identify hydration product types and support mechanism analysis; and scanning electron microscopy (SEM model Hitachi S-4800, the manufacturer is Hitachi High-Tech Corporation (Japan), and the place of manufacture is Tokyo Metropolis, Japan) observed the micromorphology of the cementitious matrix to correlate microstructural features with phase assemblage and curing conditions. Together, these methods integrate composition (XRF), crystal phases (XRD), bonding environments (FTIR), and microstructure (SEM) to provide a coherent picture of hydration under varying aqueous glass moduli, alkali equivalents, and curing ages.

3. Results and Discussion

3.1. Microscopic Analysis of Composite Cementitious Materials and Their Mechanical Properties

3.1.1. XRD Analysis

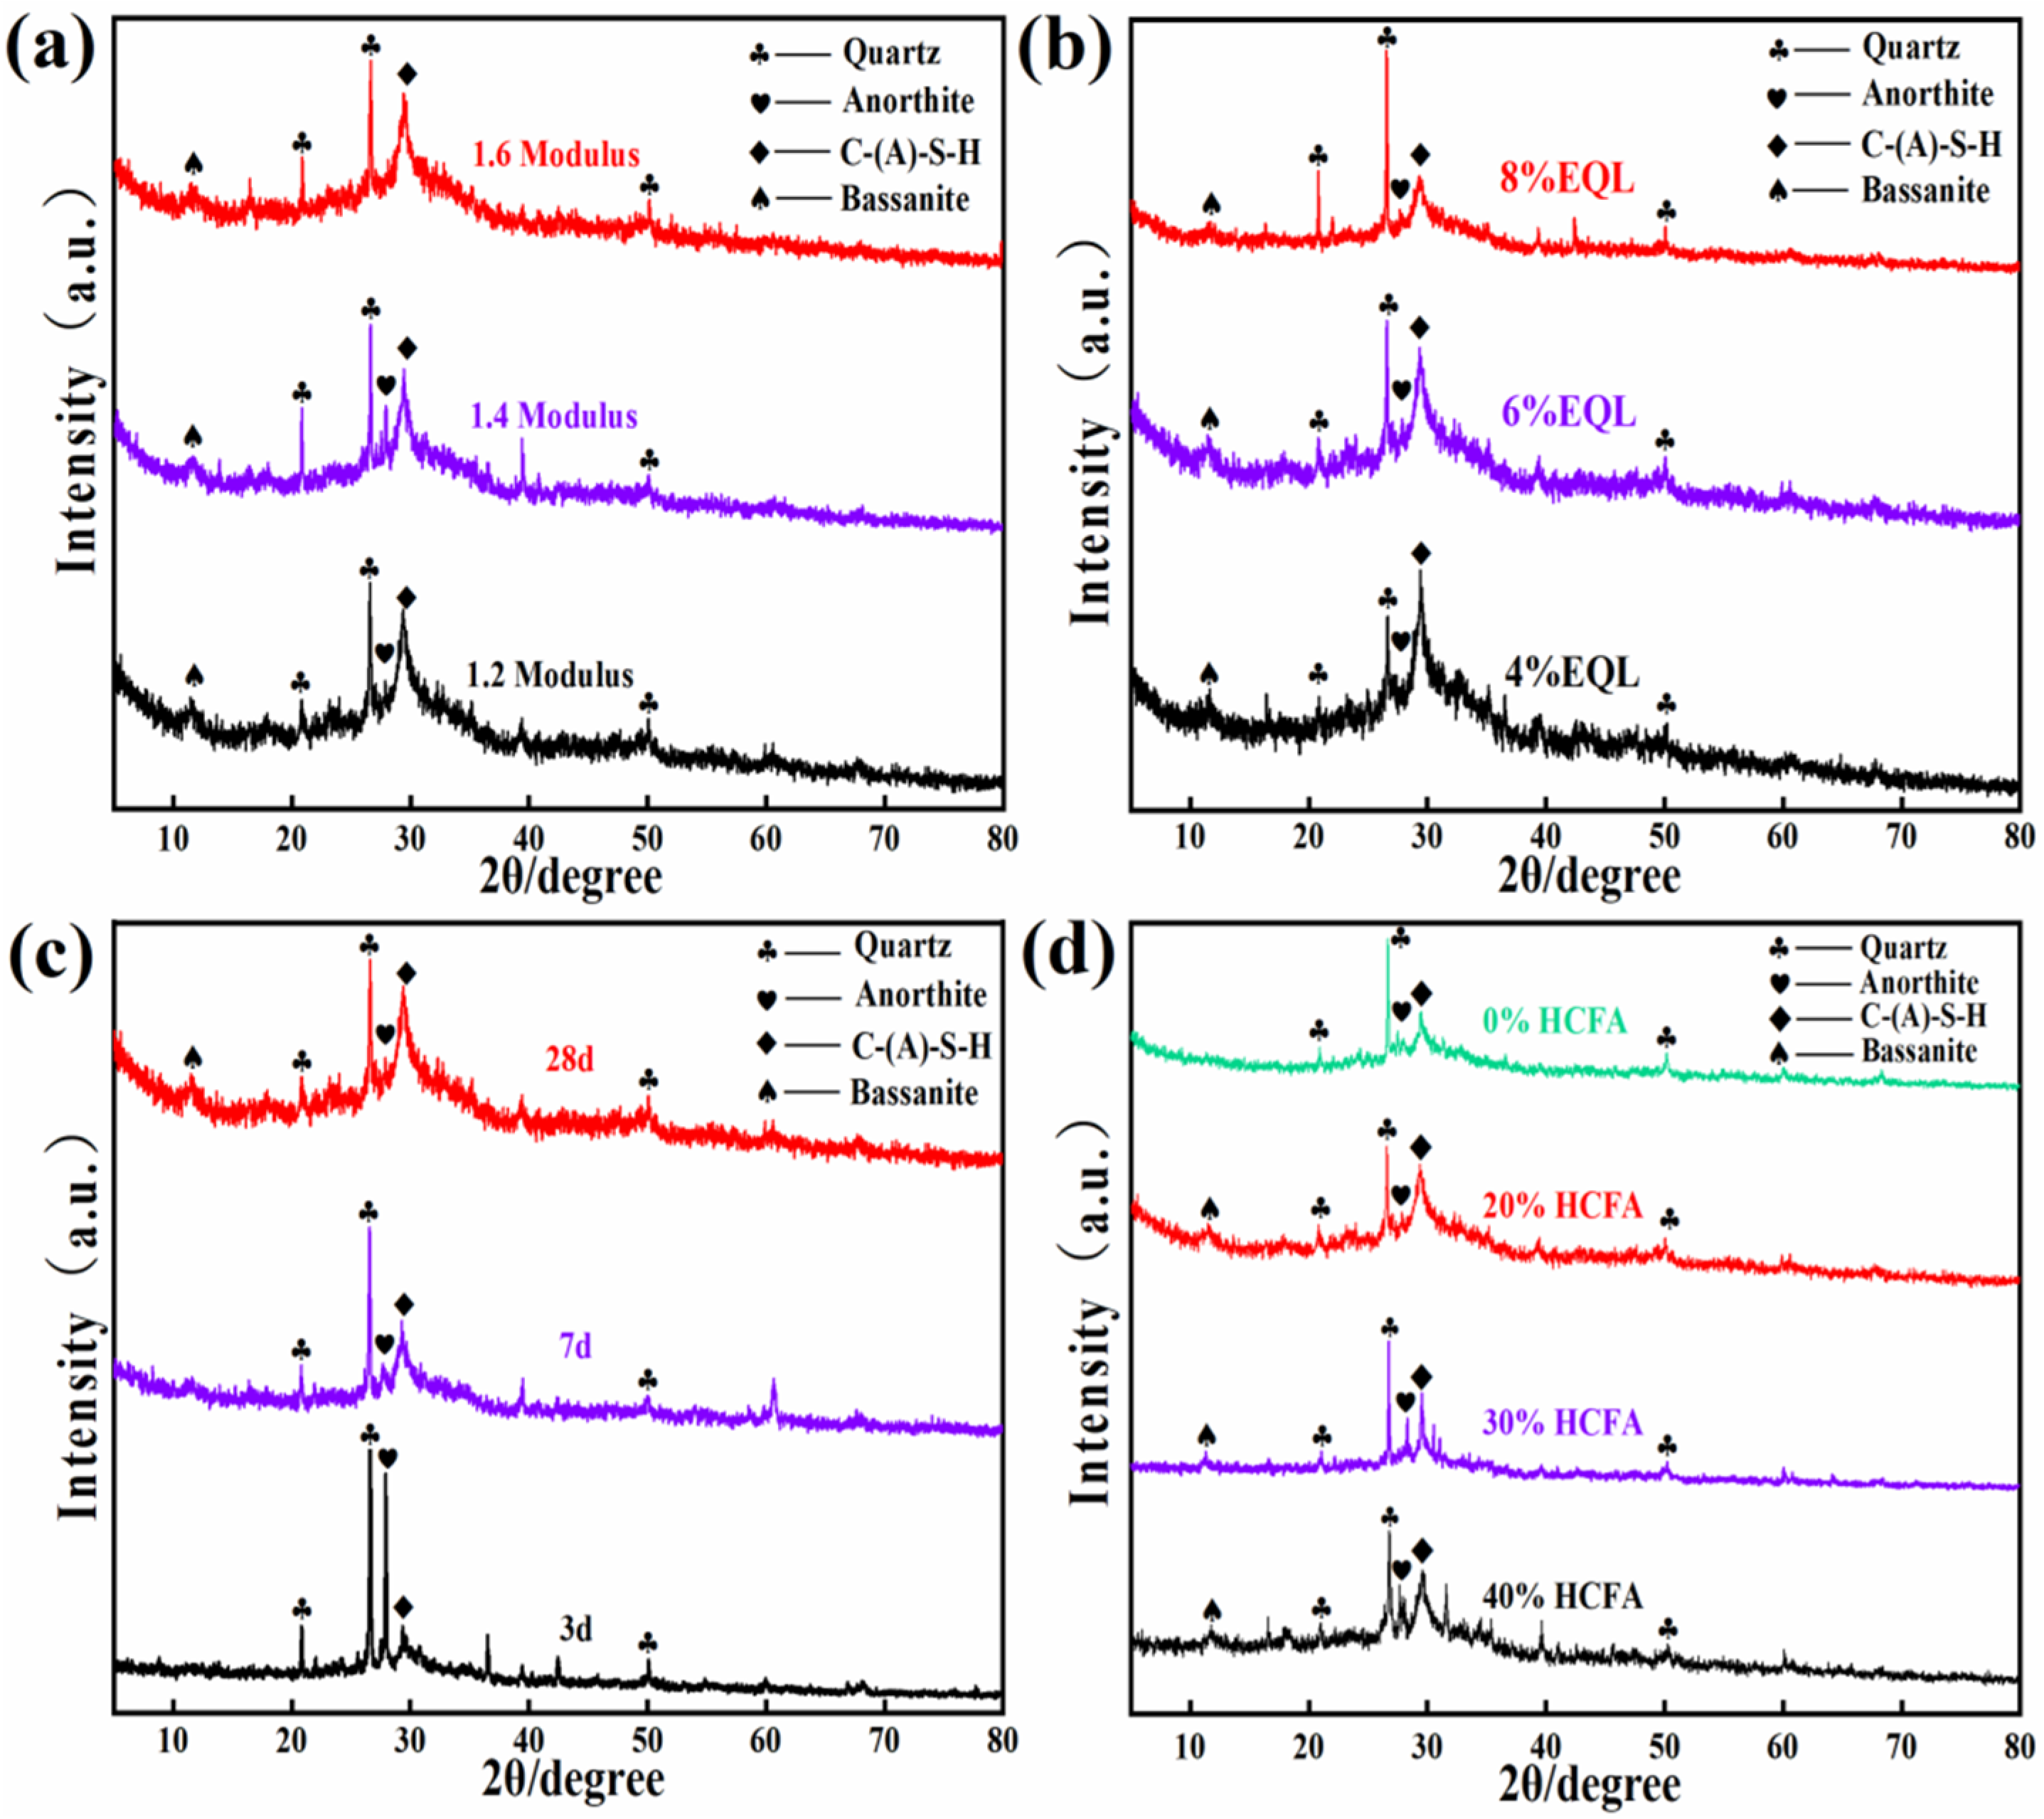
In Figure 4, the main hydration products are SiO2, calcium–aluminium silicate hydrate (C-(A)-S-H), anorthite, and bassanite. Across the XRD patterns, a broad hump around 2θ ≈ 29° indicates the formation of C-(A)-S-H gel, and a weak diffraction peak at 2θ ≈ 13° is observed; sulfate minerals in HCFA may have led to the formation of burned gypsum (CaSO4·0.5H2O) during hydration. Figure 4a shows that the peak areas and heights associated with C-(A)-S-H differ only slightly, suggesting that the aqueous glass modulus has a minor effect on C-(A)-S-H formation. Figure 4b indicates that at 4% and 6% alkali equivalents the gel-phase peaks, indicating that C-(A)-S-H are stronger, reflecting a more complete hydration reaction, whereas at 8% the excessively high OH concentration triggers a passivation effect: the glassy slag initially dissolves faster, but a dense Si-rich passivation layer rapidly forms on particle surfaces, hindering sustained Ca and Al dissolution and mass transport; the high pH also complexes Ca as Ca(OH)+ and related species and keeps silicate mainly as monomers/low oligomers, thereby lowering the effective Ca/Si ratio, weakening polycondensation, and favoring Na-enriched secondary phases. Consequently, the yield and degree of polymerization of C-(A)-S-H decrease, the microstructure coarsens, and strength declines, which is consistent with the weakened amorphous C-(A)-S-H hump in the XRD at high alkali dosage. Figure 4c shows that the diffraction peaks of quartz and anorthite diminish with time while those of C-(A)-S-H increase, indicating ongoing gelation; the gel strength is proportional to the amount of C-(A)-S-H generated [47], and the area of this phase continues to grow with age, implying increased strength. Figure 4d demonstrates that all HCFA dosages yield a calcium silicate phase, and its diffraction peak intensifies as HCFA incorporation increases.

3.1.2. FTIR Analysis

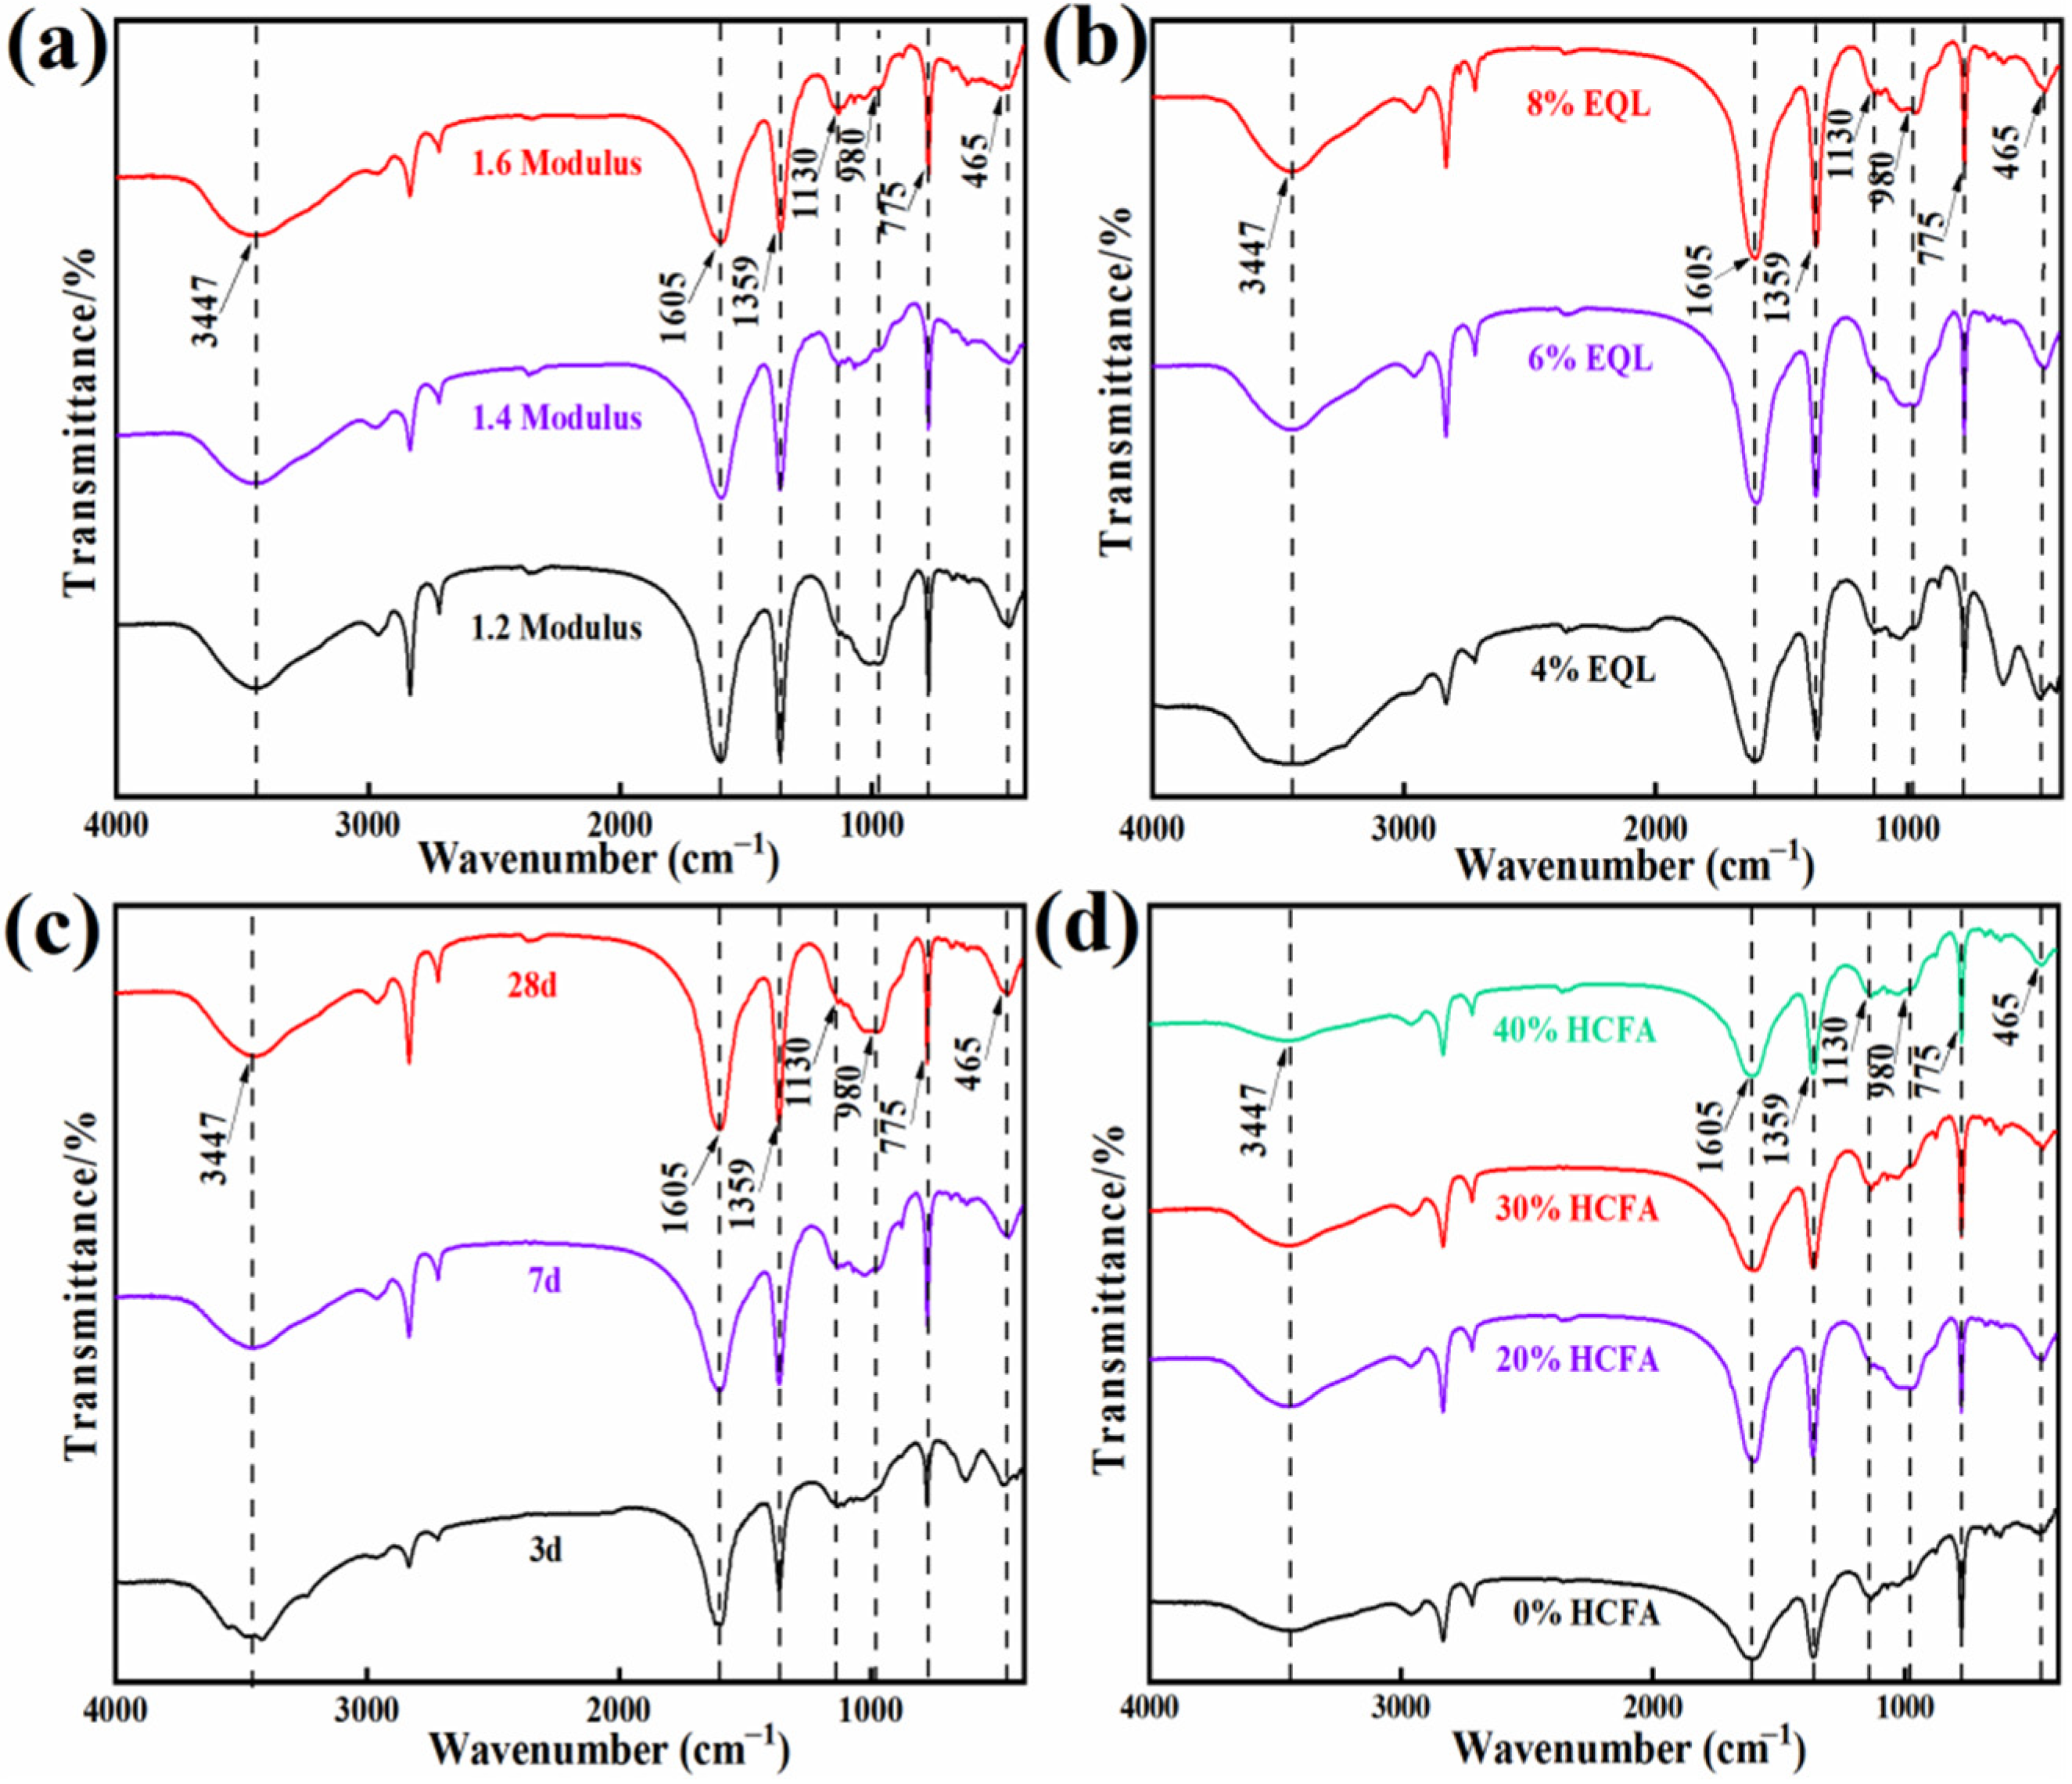
Figure 5a indicates that as the aqueous glass (sodium silicate) modulus increases, the absorption peak around 980 cm−1, which corresponds to the C-(A)-S-H gel [48], becomes weaker. Figure 5b shows that at an alkali equivalent of 6%, the C-(A)-S-H-related absorption peak is most pronounced, with a broad band and high intensity; when the alkali equivalent increases to 8%, the peak decreases, indicating that a moderate increase in OH− concentration can promote C-(A)-S-H formation, but once the alkali equivalent reaches a certain level the system contains excess OH, the rate of gel formation far exceeds the dissolution rate of aluminosilicates, polymerization is thereby suppressed, and the C-(A)-S-H content declines [49]. Figure 5c shows that with increasing curing age, hydration products increase substantially at 28 d, thereby enhancing strength and strengthening the peak near 980 cm−1; Figure 5d shows that with an HCFA content of 20%, the product absorption peaks are stronger, the extent of Al–O substituting for Si–O is greater, and more C-(A)-S-H gel is produced. The shift of the absorption band around 900–1200 cm−1 and the appearance of the absorption peak near 460 cm−1 indicate that alkali-activated GGBS/HCFA composite binders generate C-(A)-S-H gel [50]. Overall, excessive alkalinity suppresses C-(A)-S-H formation via multiple pathways: solution-phase stabilization (OH drives Si/Al to exist as species such as SiO(OH)3− and [Al(OH)4] that pair with Na+, reducing their likelihood of copolymerizing with Ca2+); interfacial and mass-transfer passivation (rapid formation of Si-rich rims/Na silicate films on particle surfaces and dense early gels leads to diffusion limitation and a precipitation rate > dissolution rate mismatch); preferential formation of competing phases (AFm, and Na/Al–silicate gels divert and immobilize Ca and Al); and an imbalanced aqueous glass modulus increases silicate polymerization in the activator, further hindering dissolution. These combined effects restrict the nucleation and sustained growth of C-(A)-S-H, so its content and the FTIR absorption intensity near 980 cm−1 decrease at higher alkali equivalents.

3.1.3. SEM Analysis

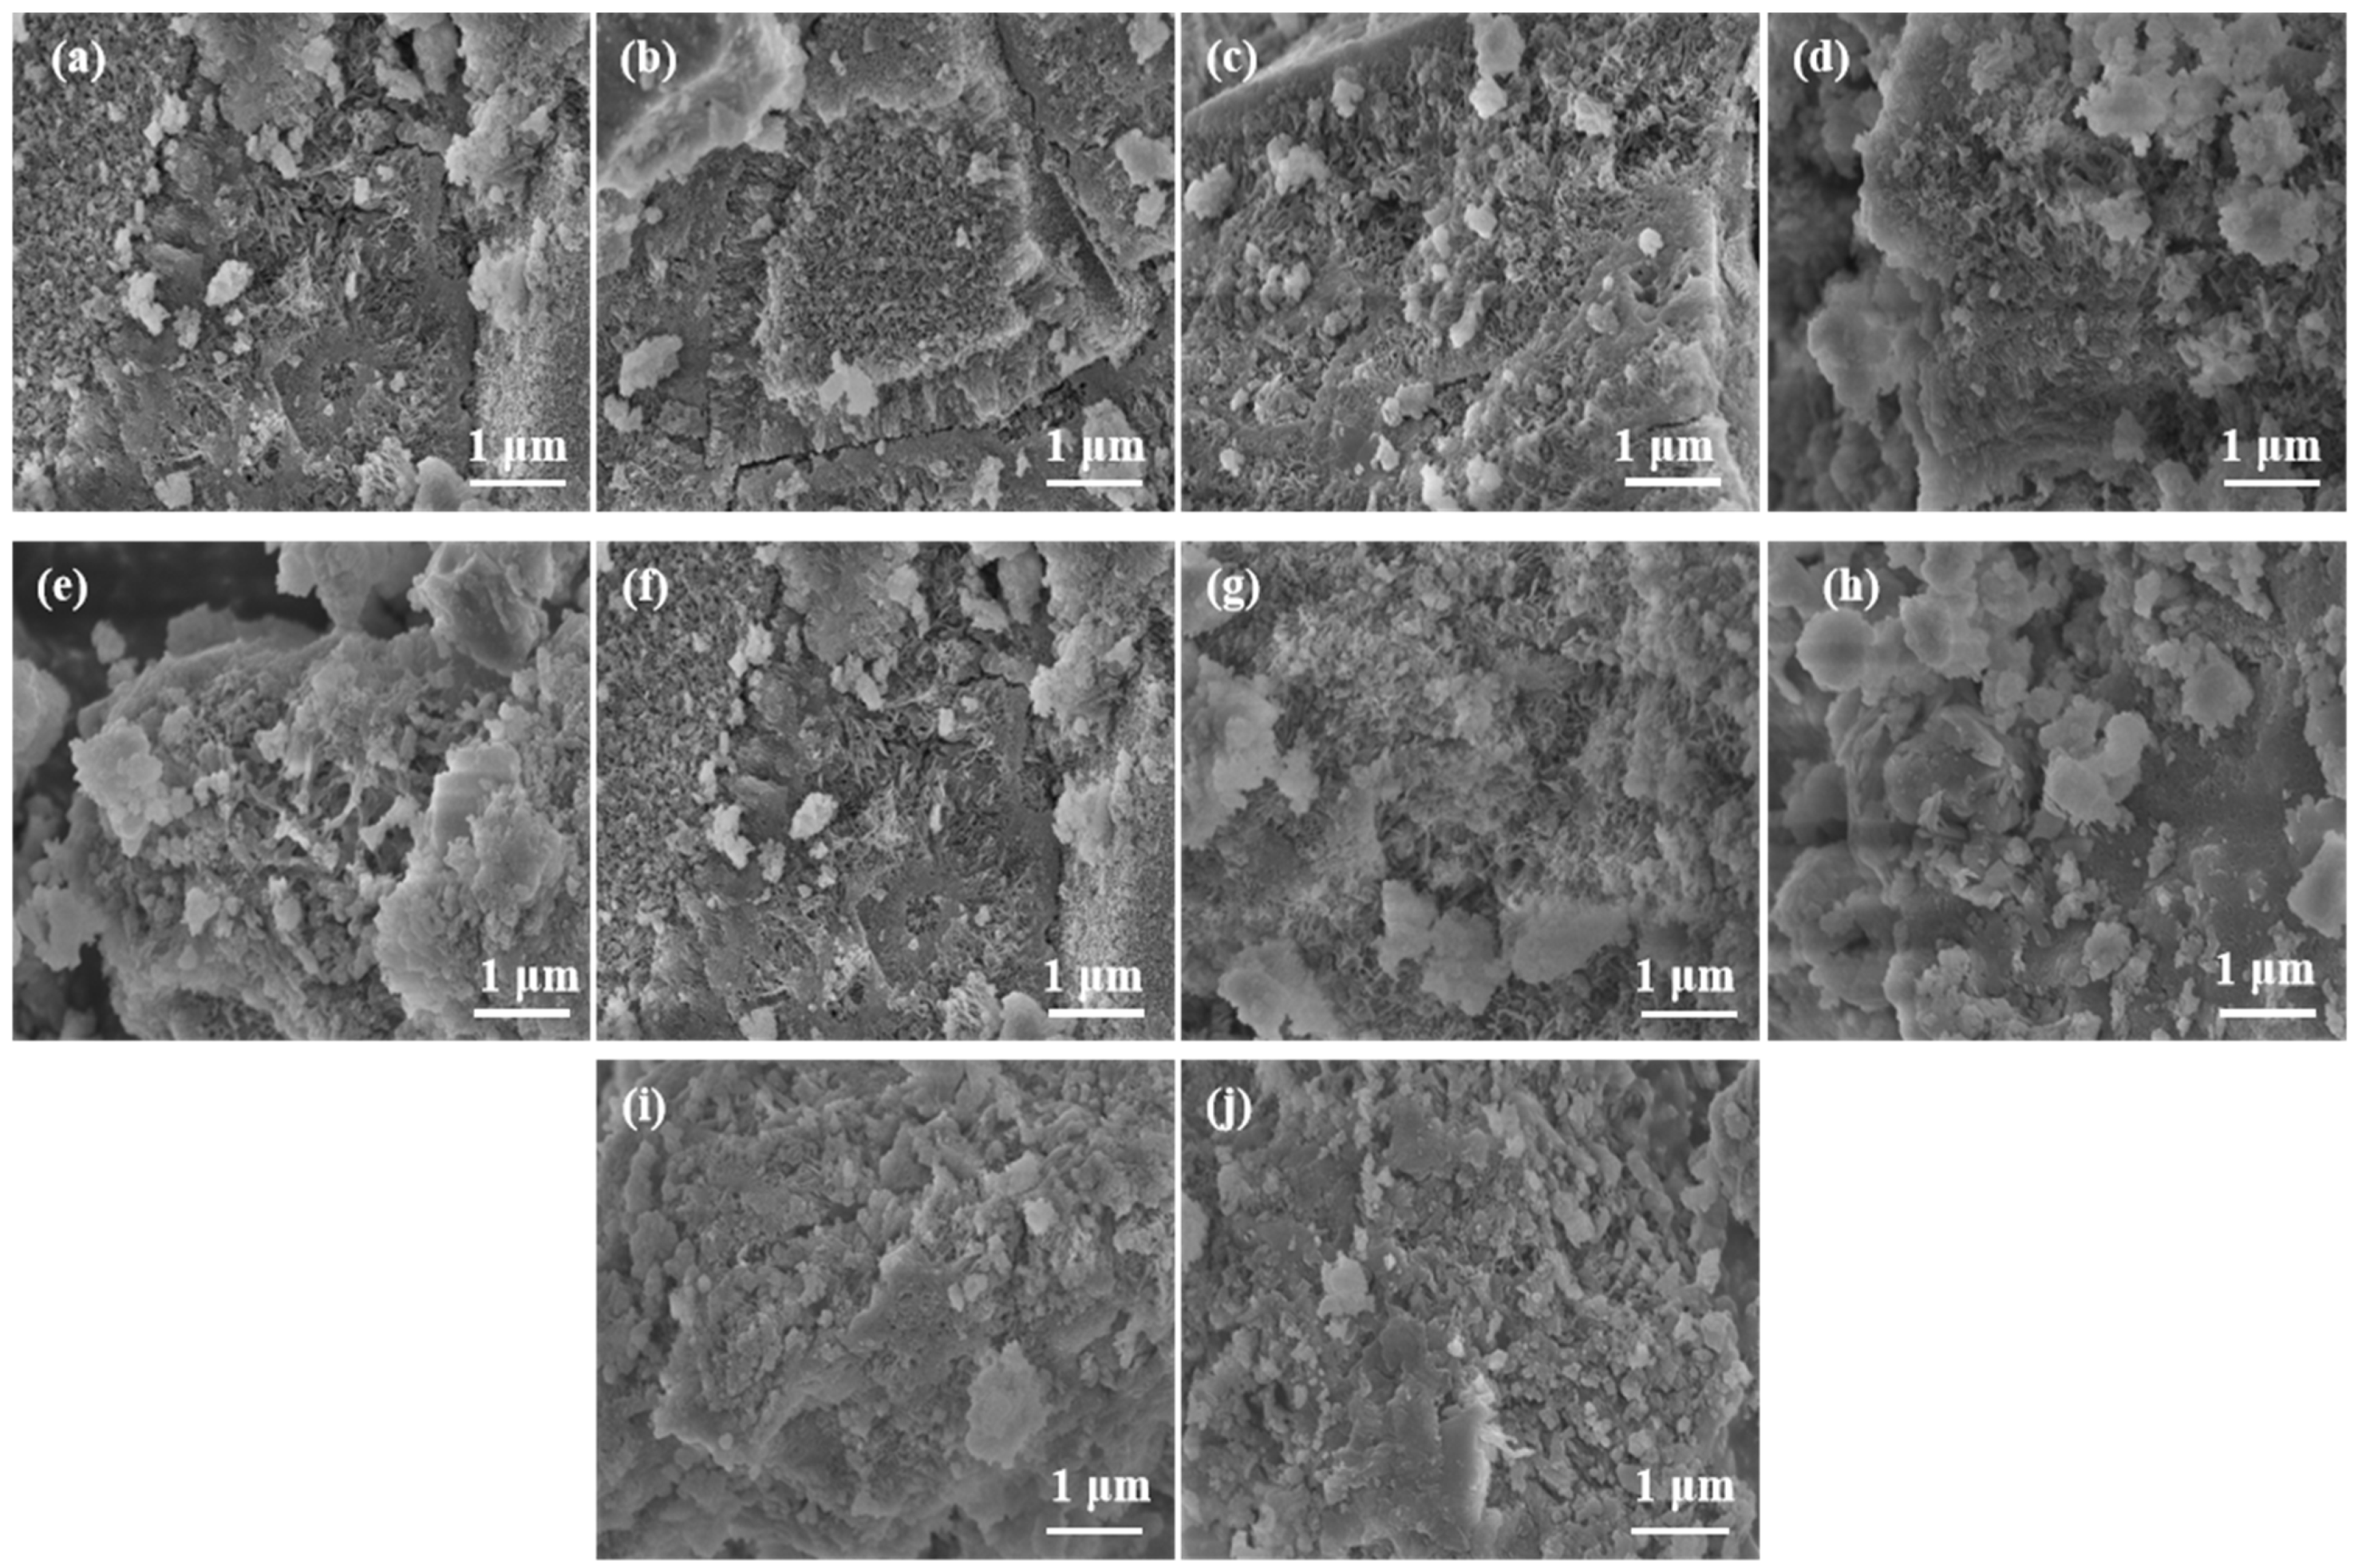
Figure 6 shows the microscopic morphology changes in GGBS/HCFA under different conditions and at different ages. Figure 6a,b,g show the gel C-S-H/C-(A)-S-H product sample under different moduli of hydration: the 1.4 modulus is close; the 1.6 modulus can still observe incomplete hydration reactants. In the system with the aqueous glass modulus, the number of microcracks in the system gradually increased; in particular, when the aqueous glass modulus was 1.6, the number of cracks in the system was significantly increased and the cracks were wider. However, combined with the mechanical properties, these microcracks did not significantly affect the fracture resistance strength. No obvious spherical morphology of HCFA was found in the figure, indicating that the silica–aluminum raw material in HCFA has been dissolved under different modes; Figure 6c,d,g show that the system is well hydrated at 4%, 6%, 8%, and 8% alkali equivalents, but there are still microcracks on the surface. Due to the high content of CaO in HCFA and the 4% base equivalent, OH-binding to Ca2+ in the system can indirectly provide a good alkaline environment for the hydration reaction, so the system can still be effectively stimulated at a lower base equivalent. At a 6% base equivalent, the OH is sufficient, combined with the mechanical properties of the performance. This base equivalent is better for stimulating the system; when the base equivalent increases to 8%, the high concentration of OH- inhibits the hydration reaction, resulting in less generated gel products. The compressive strength is therefore reduced. Figure 6e–g show that the 3 d and 7 d samples were observed at 3 d and 7 d; however, some of the silica–aluminum matrix is not involved in hydration or occurred at 28 d. Without obvious gaps and cracks in the microscopic morphology, a large number of C-(A)-S-H gel structures can be observed: the substrate is more dense, with more intense wrapping. Figure 6g–j indicate that when HCFA incorporation is increased, HCFA particles in the system gradually decrease with increasing GGBS content; no HCFA spherical particles appeared, showing that GGBS can promote HCFA dissolution. In addition, when HCFA incorporation is reduced, the sample matrix gradually becomes dense, and the hydration products change to a certain extent, forming massive or granular C-(A)-S-H gels on the surface [51]. At 8% alkali equivalent, excess OH and soluble silicate shift the system to a fast-dissolution/slow-precipitation regime: OH lowers Ca2+ activity and keeps silicate highly deprotonated, raising the nucleation barrier for C-(A)-S-H; silica/alumina-rich passivation rims form on GGBS/HCFA particles, and higher ionic strength/viscosity slows ion transport. As a result, effective supersaturation, nucleation density, and gel connectivity decrease, microcracking/porosity increase, and the overall degree of hydration is lower than at 6%, and compressive strength drops despite similar phase types.

3.1.4. Mechanical Performance Analysis

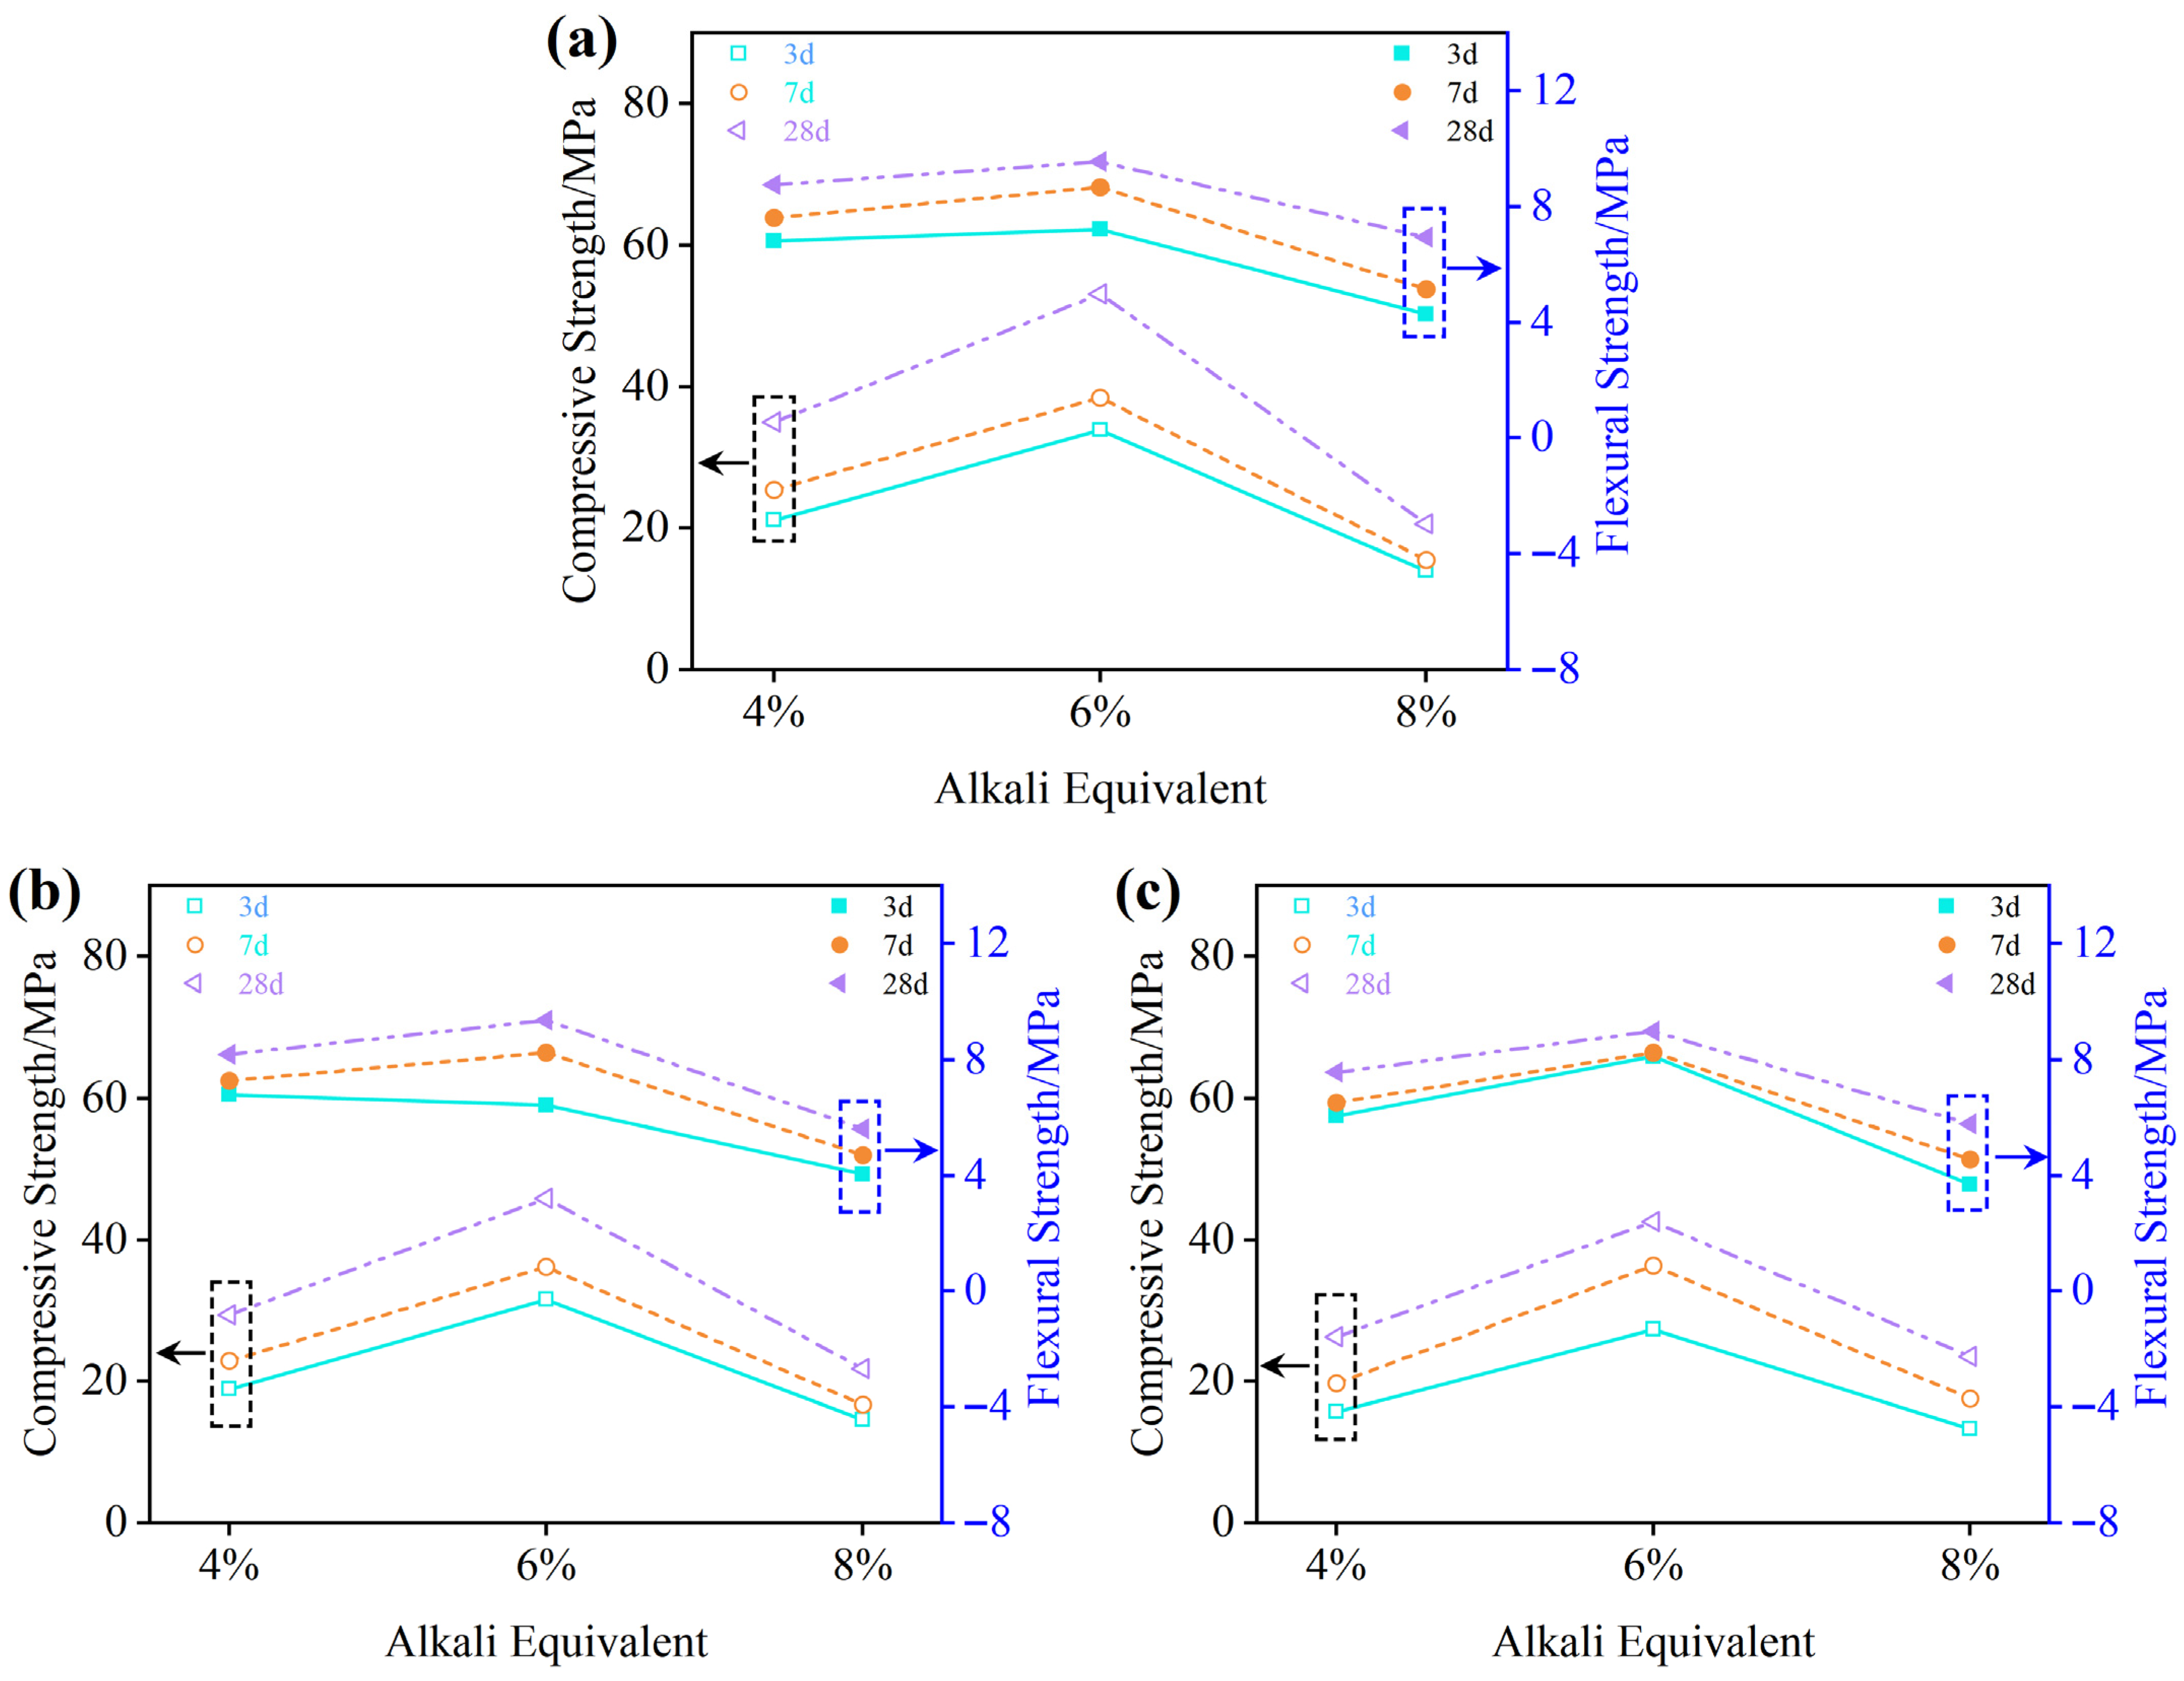
Figure 7 shows that the strength of all of the specimens grows over time. We also discovered that the flexural and compressive strengths of alkali-activated GGBS/HCFA composite cementitious materials decreased when the aqueous glass modulus increased from 1.2 to 1.6 for the same alkali equivalent. The flexural and compressive strengths of alkali-activated GGBS/HCFA composite cementitious materials increased and then reduced as the alkali equivalent increased from 4% to 8% with the same modulus as aqueous glass, peaking at 6% alkali equivalent. When the system’s alkali equivalent is 4% lower, the OH- in the system may satisfy the hydration process, and the flexural strength improves significantly [45]. When the alkali equivalent was increased to 6%, the flexural strength values at 28 d were 9.5 MPa, 9.4 MPa, and 9.1 MPa, and the compressive strength values were 52.8 MPa, 46.6 MPa, and 42.8 MPa for the 1.2, 1.4, and 1.6 moduli, respectively, and the specimens reached the optimal flexural and compressive strength values. Compared to 4% alkali equivalent, compressive strength improved by 52.2%, 56.4%, and 60.3%, while flexural strength increased by 10.6%, 13.3%, and 19.7%, respectively. When the alkali equivalent is increased to 8%, the compressive strength reduces by 61%, 45.3%, and 43%, respectively, while the flexural strength at 28 d decreases by 29.5%, 40.4%, and 35.2%.
The foregoing results demonstrate that the influence of alkali equivalent is far more than that of aqueous glass modulus. Furthermore, low aqueous glass modulus and alkali equivalent values do not promote complete activation of HCFA and GGBS activation, whereas high aqueous glass modulus and alkali equivalent values produce OH on the surface of HCFA, resulting in a passivation effect that prevents depolymerization and dissolution of the silica–alumina glass phase in HCFA, and the hydration reaction is slow. The resulting hydration products, calcium silicate hydrate and calcium aluminate hydrate, were lowered, which adversely affected the strength.
Figure 8 shows that with increasing HCFA content, the compressive and flexural strengths of the alkali-activated composite binder at ages of 3, 7, and 28 days first rise and then fall. The flexural strength reaches its maximum at 20% HCFA, and at 28 days, it is only slightly affected by HCFA content. When the HCFA content increases from 0% to 20%, the compressive strength at 3, 7, and 28 days increases by 7.2%, 16.8%, and 14.7%, respectively, while the flexural strength increases by 54.3%, 8.8%, and 10.5%; when the content reaches 40%, the compressive strength at 3, 7, and 28 days decreases by 42%, 34.2%, and 30.9%, and the flexural strength decreases by 22.5%, 14.9%, and 11.6%, respectively. As HCFA rises from 0% to about 20%, its soluble Ca and reactive glassy phase accelerate dissolution–polymerization, promoting rapid formation of interpenetrating mixed gels of C-(A)-S-H and N-A-S-H, together with nucleation–filling and micro-aggregate effects that refine the pore structure and improve the interfacial transition zone (ITZ), thereby enhancing early-age compressive and flexural strengths (the gain in flexural strength is more pronounced because it is more sensitive to microcracks and interfaces). As the content further increases to about 40%, a dilution effect on the more reactive precursors appears, while imbalanced Ca/Si and Na/Al ratios lead to premature precipitation of low-degree-of-polymerization, Ca-rich gels; along with residual unreacted hollow spheres, pore coarsening, and localized microcracks, these defects disrupt the continuity and compactness of the gel network, causing the strengths to decline. By 28 days, the flexural strength is relatively insensitive to HCFA content, mainly because later-formed Ca-based gels provide some crack-bridging and blunting effects, partially offsetting the adverse influence of pores and defects, making flexural strength less sensitive to overall gel content and porosity than compressive strength.
Figure 9 shows the specimen in steam curing at the same period, and after switching to normal curing after 28 d, its compressive strength and flexural strength increase and then drop as the curing temperature increases. After steam curing at 60 °C, 70 °C, 80 °C, and 90 °C, the compressive strength of 28 d rose by 32.8% and 21.9%, which are increases of 13% and 6.4% compared to 3 d. The lower the temperature, the greater the increase. At 70 °C, the compressive strength after 28 d achieved 53.4 MPa, which is somewhat greater than the normal curing strength for 28 d. The compressive strength increased to 53.4 MPa at 70 °C at 28 d. At 60 °C, the Al-O and Si-O monomers failed to completely disassemble, with low dissolution rates of aluminate monomers in GGBS and HCFA, and insufficient precursors for polymerization reactions, which eventually led to low initial compressive strength at this temperature. The flexural strength of the sample increased first and then decreased with the increase in temperature, with a peak at 70 °C, with values of 8.4 MPa at 3 d and 7.2 MPa at 28 d, reducing by about 14.3%. This shows that the folding resistance in the initial hydration reaction is higher than in the later period. At 70 °C, the flexural strength at 28 d was reduced by about 24.2% compared with the strength at 28 d under standard maintenance, with a large decrease. The high curing temperature can increase the compressive strength of the sample in a short time, but cannot make the antiflexural strength reach the optimal value under standard curing.
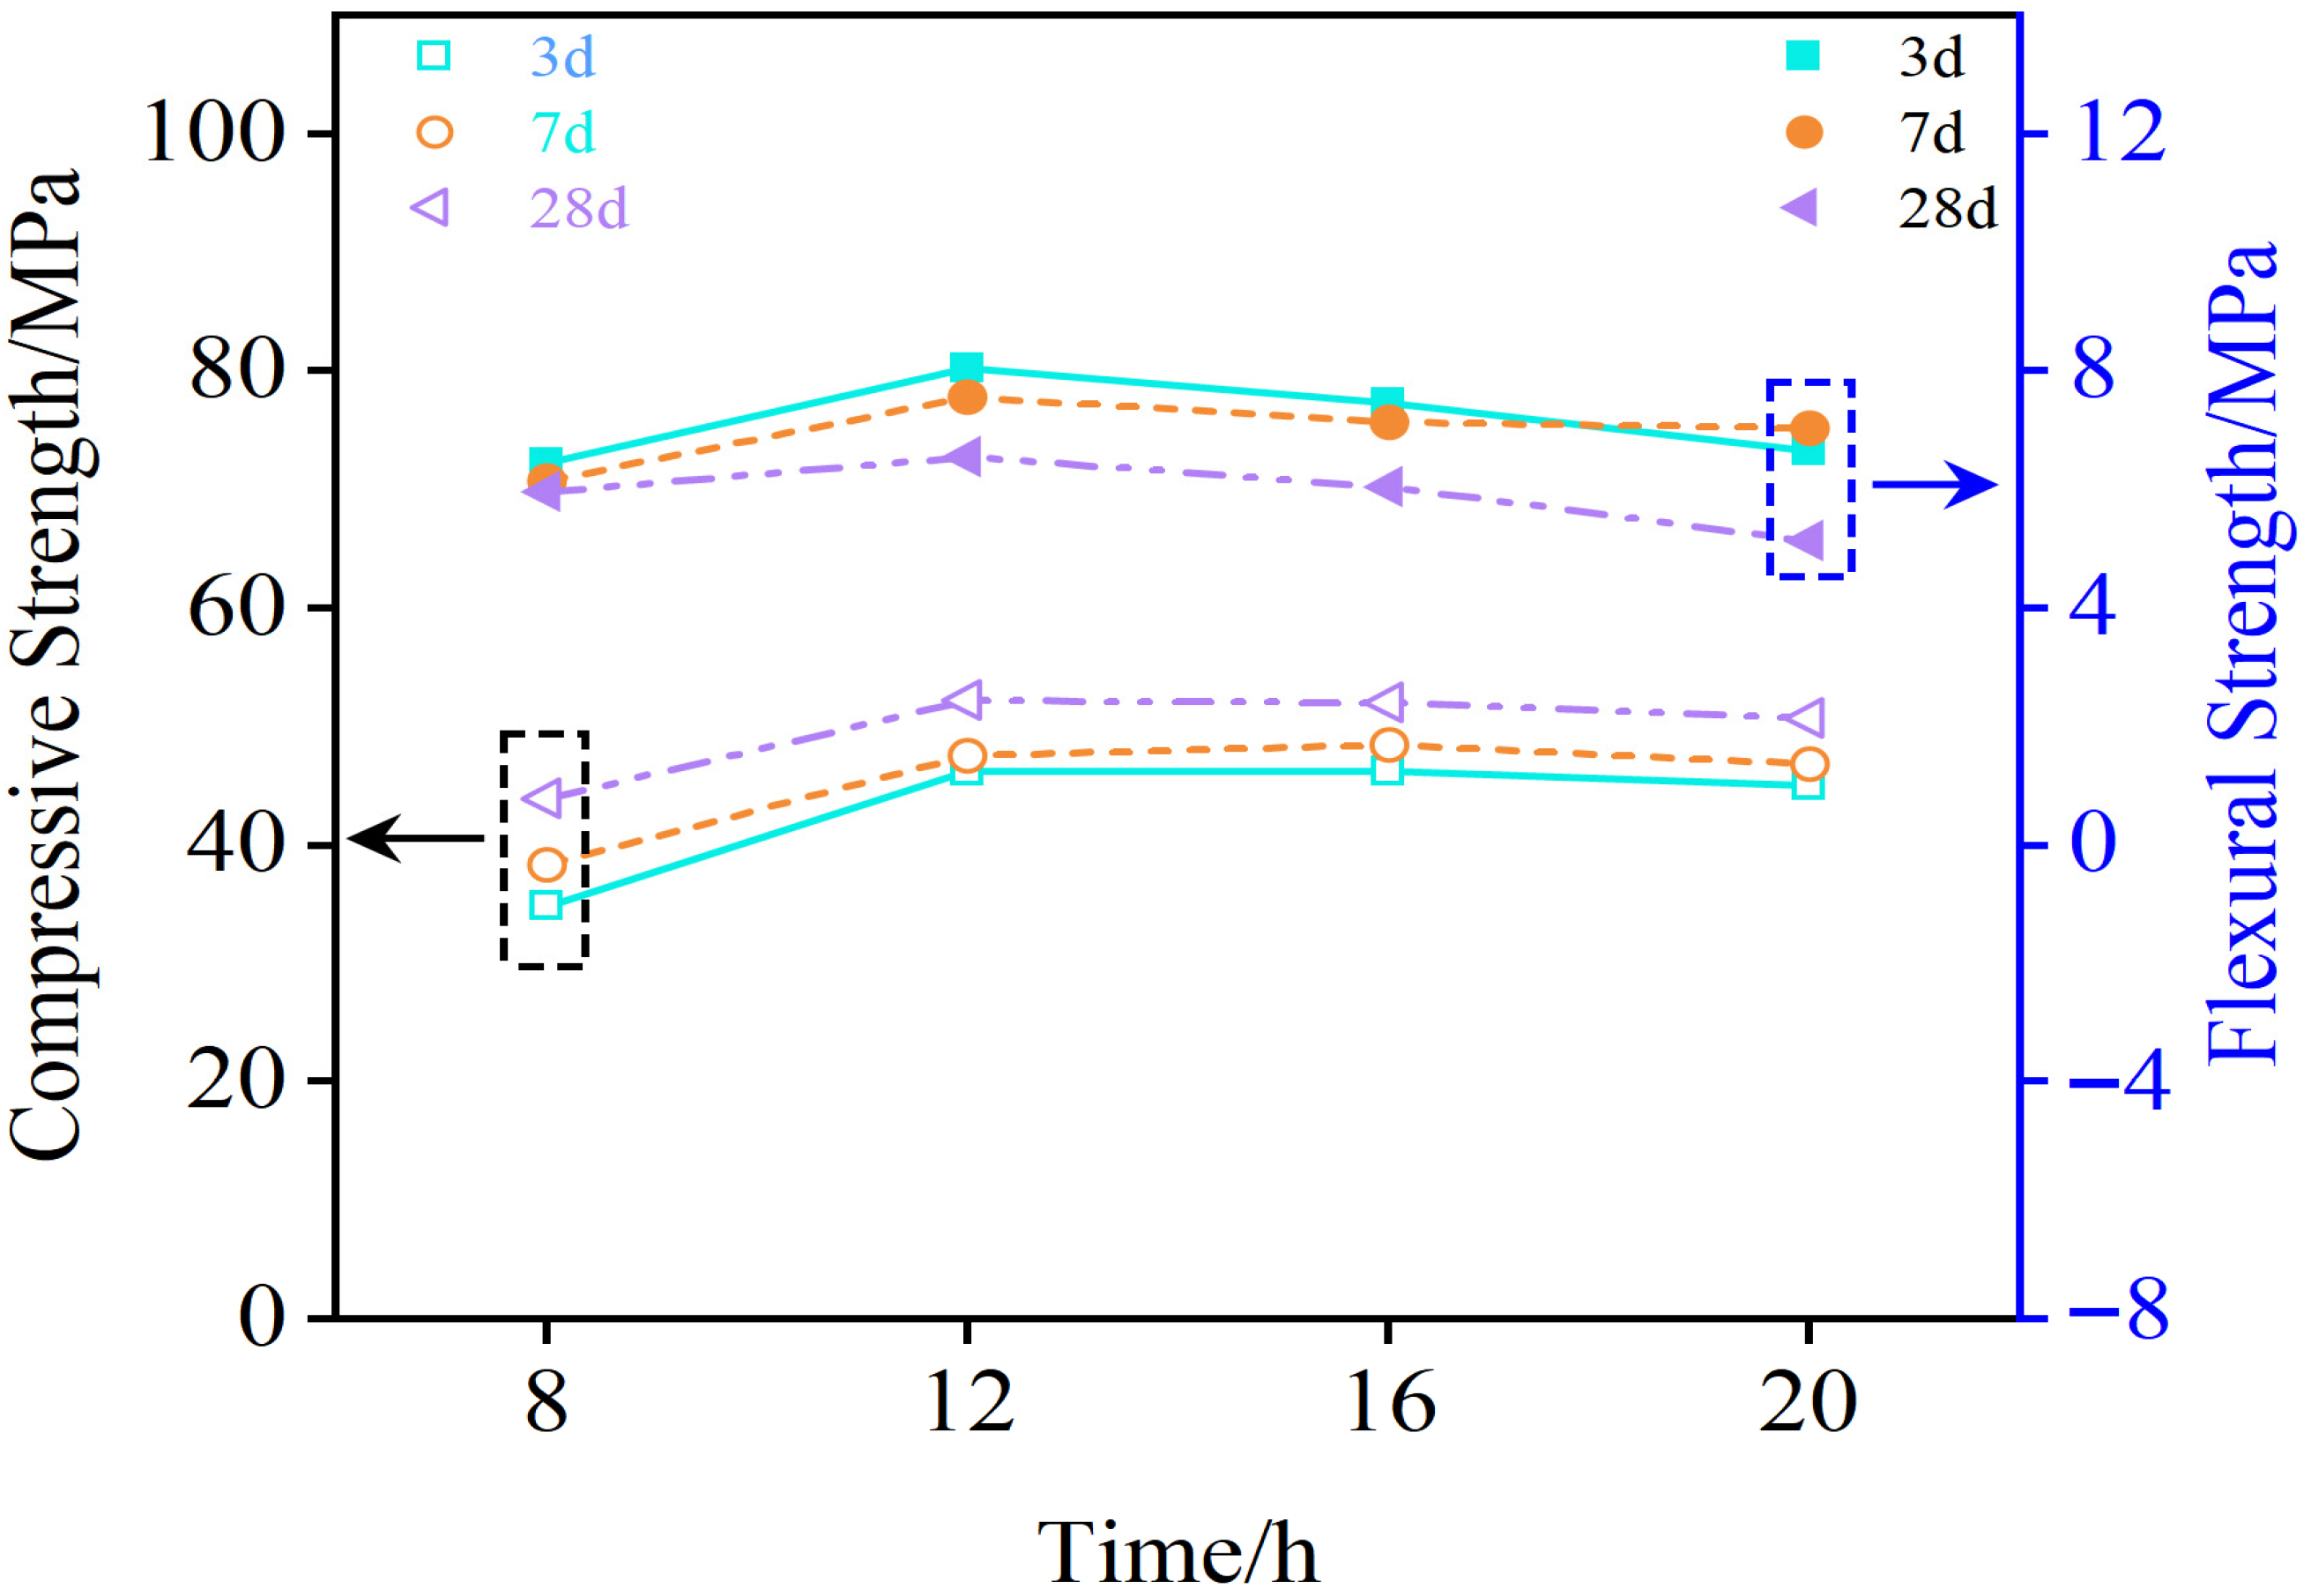
Figure 10 indicates that, for specimens preconditioned by steam curing and then transferred to standard curing, both compressive and flexural strengths first increase and then decrease as the steam-curing duration varies; with continued time under standard curing, the compressive strength keeps rising, whereas flexural strength declines. After 8, 12, 16, and 20 h of steam curing, the 28 d compressive strength exceeded the 3 d value by 19.8%, 12.9%, 10.9%, and 11.7%, respectively; the optimum occurred at 12 h, yielding 52.3 MPa (compressive) and 8.2 MPa (flexural), with the flexural strength still markedly below the conventional-curing value of 9.5 MPa (≥13.7% lower). The seemingly uncommon decrease in flexural strength with age can be rationalized by steam-curing-induced microstructural effects: rapid early reaction at elevated temperature produces a coarser, Si-rich passivated C-(A)-S-H shell and Na-rich secondary phases; subsequent cooling and moisture redistribution generate autogenous/thermal/drying shrinkage and ITZ mismatch, introducing microcracks. Standard curing then densifies the bulk matrix—raising compressive strength—but cannot heal these flaws; instead, increased gel rigidity and pore coarsening reduce fracture energy and toughness, so pre-existing defects dominate crack initiation and propagation under bending, leading to a gradual decline in flexural strength despite continued gains in compressive strength.

3.2. Durability of Composite Gel Materials

3.2.1. XRD Analysis

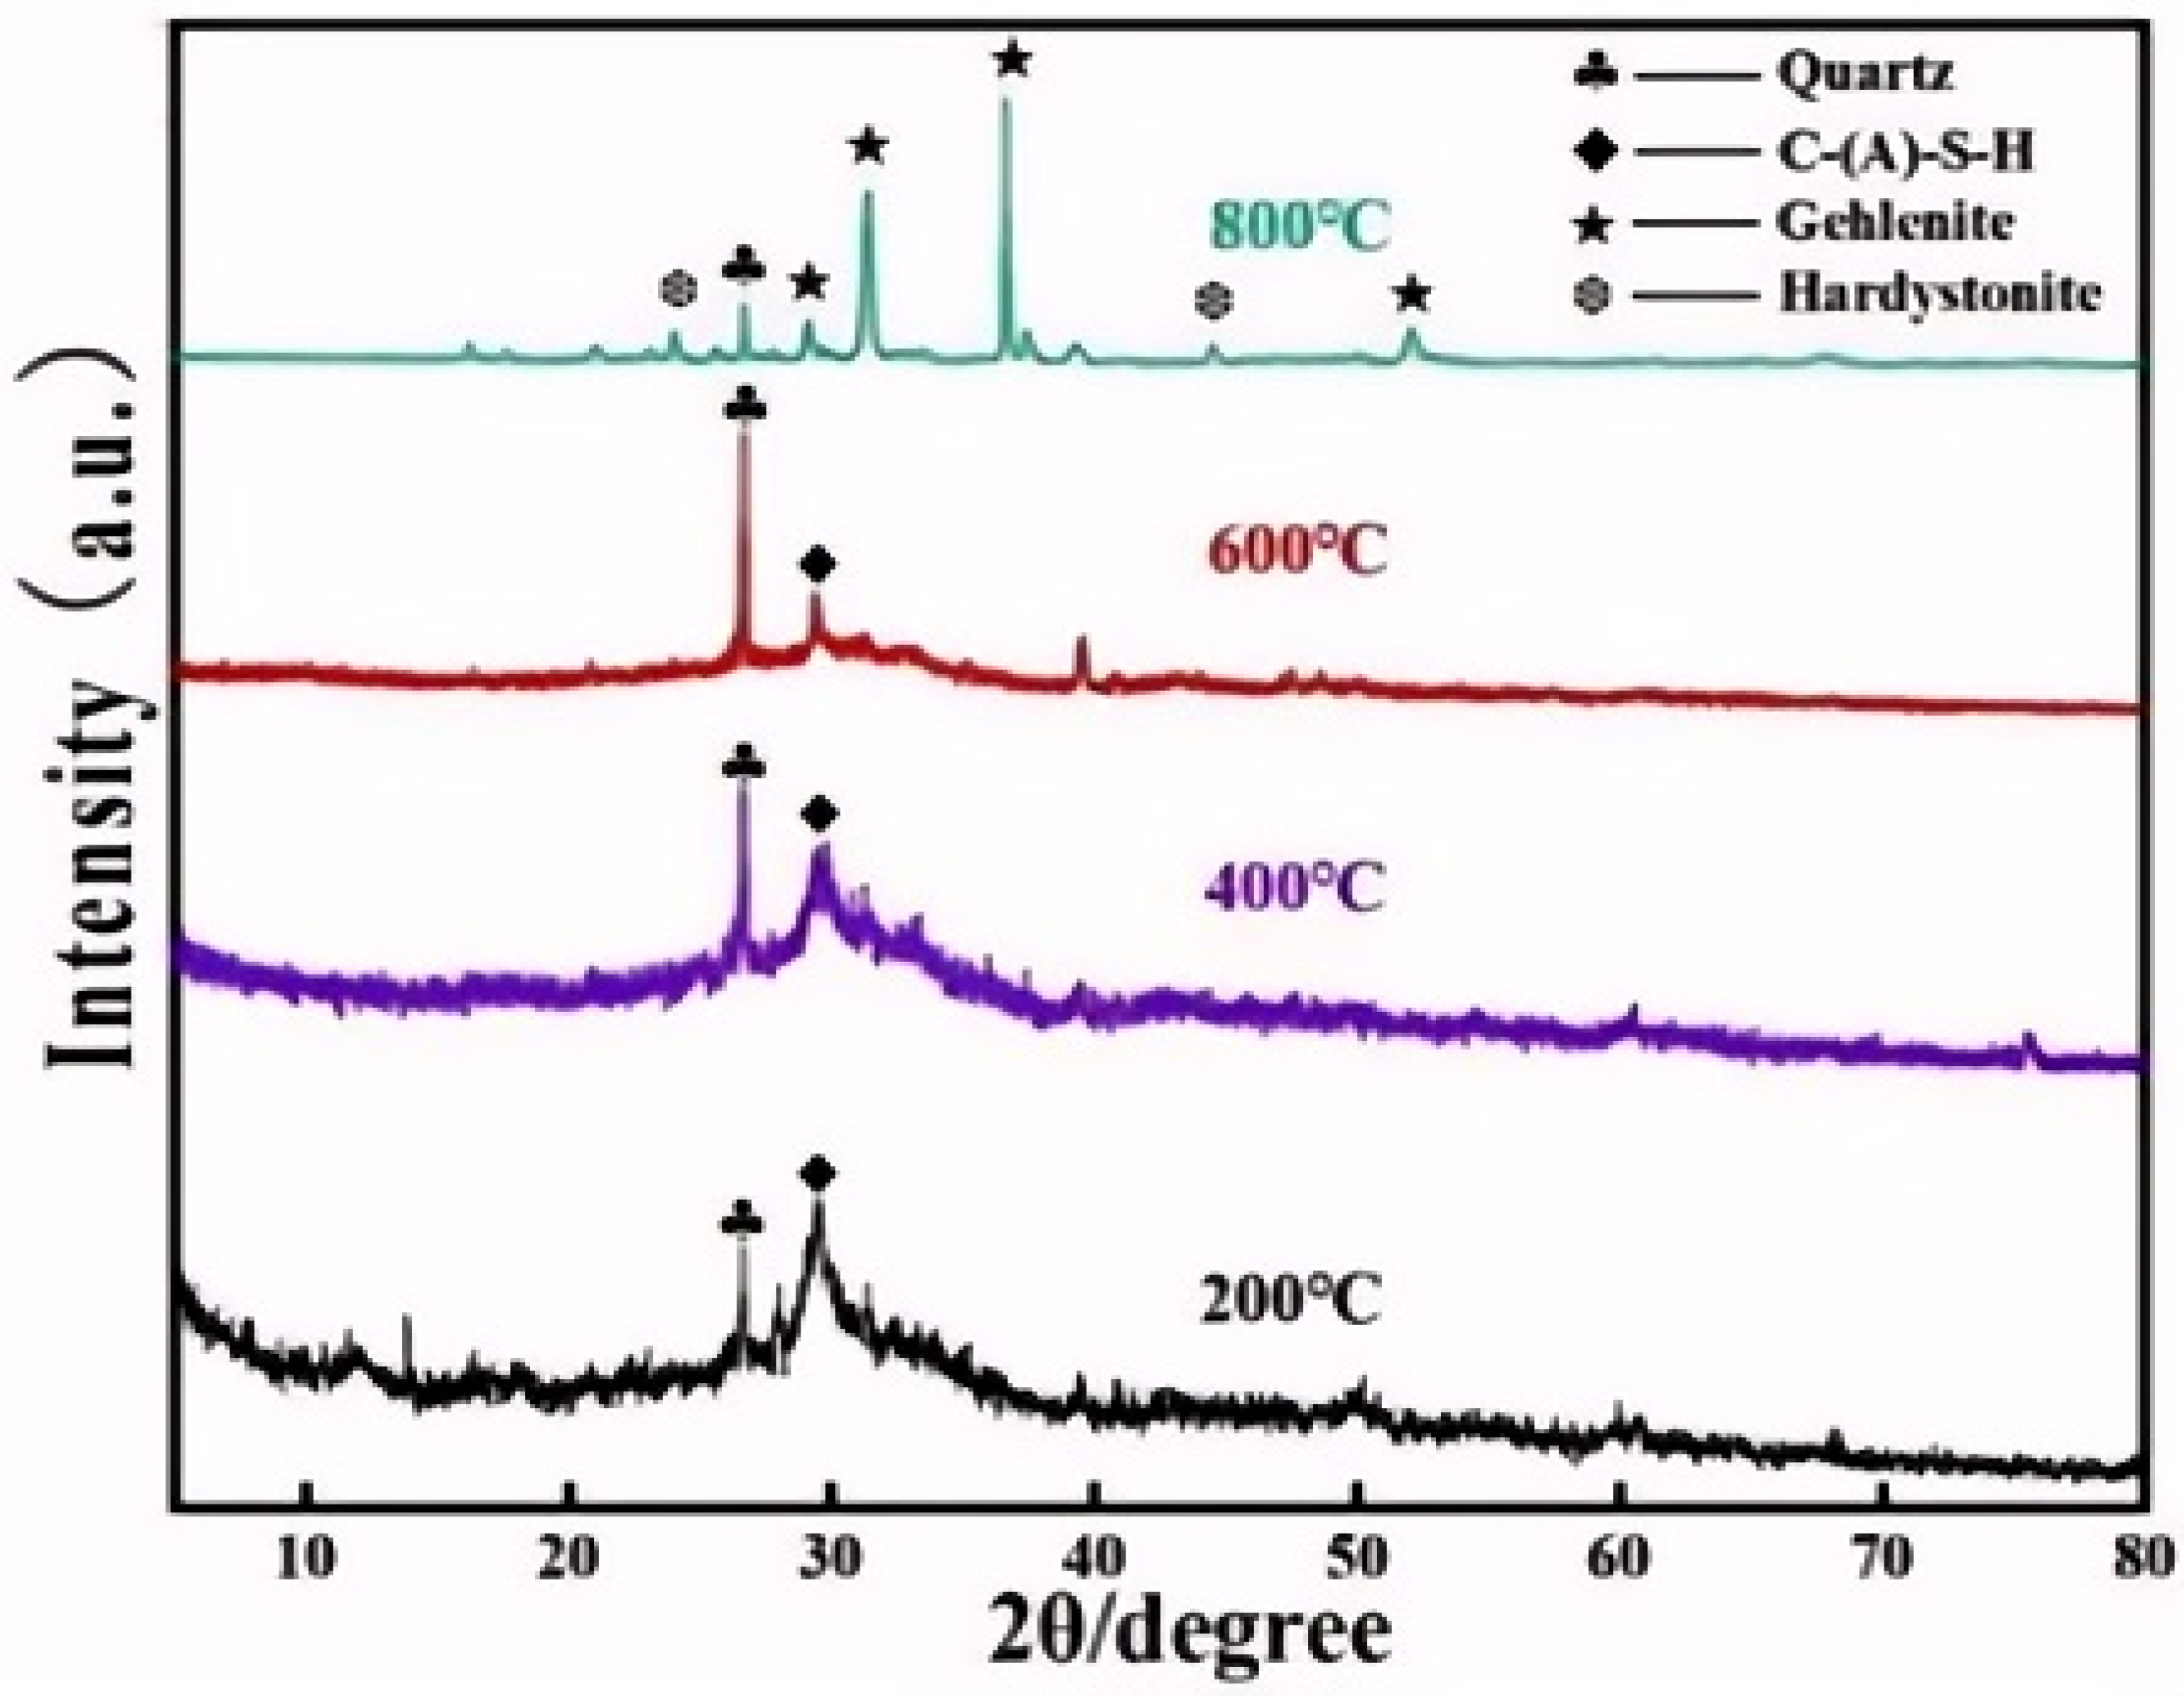
Figure 11 shows that the diffraction peaks of the hydration products are basically the same before and after the test at a high temperature of 200 °C, and there is no obvious phase transition. However, the diffraction peaks undergo a phase transition after the test at 400 °C, the C-(A)-S-H peaks are weakened, and the quartz diffraction peaks are strengthened, and the change in the diffraction peaks is more obvious after the test at 600 °C. With the exposure temperature increased to 800 °C, the system exhibited calcium aluminum yellow (Ca2Al(AlSi)O7) and zinc yellow crystal phases (Ca2ZnSi2O7), two new crystals, and the formation of C-(A)-S-H gel crystallization; therefore, a sharp diffraction peak at 2θ = 31° corresponding to the C-(A)-S-H peak or the amorphous “hump” completely disappeared, indicating that C-(A)-S-H was completely decomposed or crystallized, thus the structure was destroyed during the phase transition.
After immersing the alkali-activated GGBS/HCFA composite cementitious material in acid for a duration of 28 d, the diffraction peak of the hydration product C-(A)-S-H vanished and the CaSO4 diffraction peak formed, as shown in Figure 12. The CaSO4 diffraction peak becomes stronger as the concentration of H2SO4 increases, whereas the strength of the SiO2 diffraction peak slowly declines. This is because sulfuric acid interacts with C-(A)-S-H to produce CaSO4, and the higher the concentration of sulfuric acid, the more CaSO4 is produced, which precipitates on the surface of SiO2, decreasing the SiO2 diffraction signals.
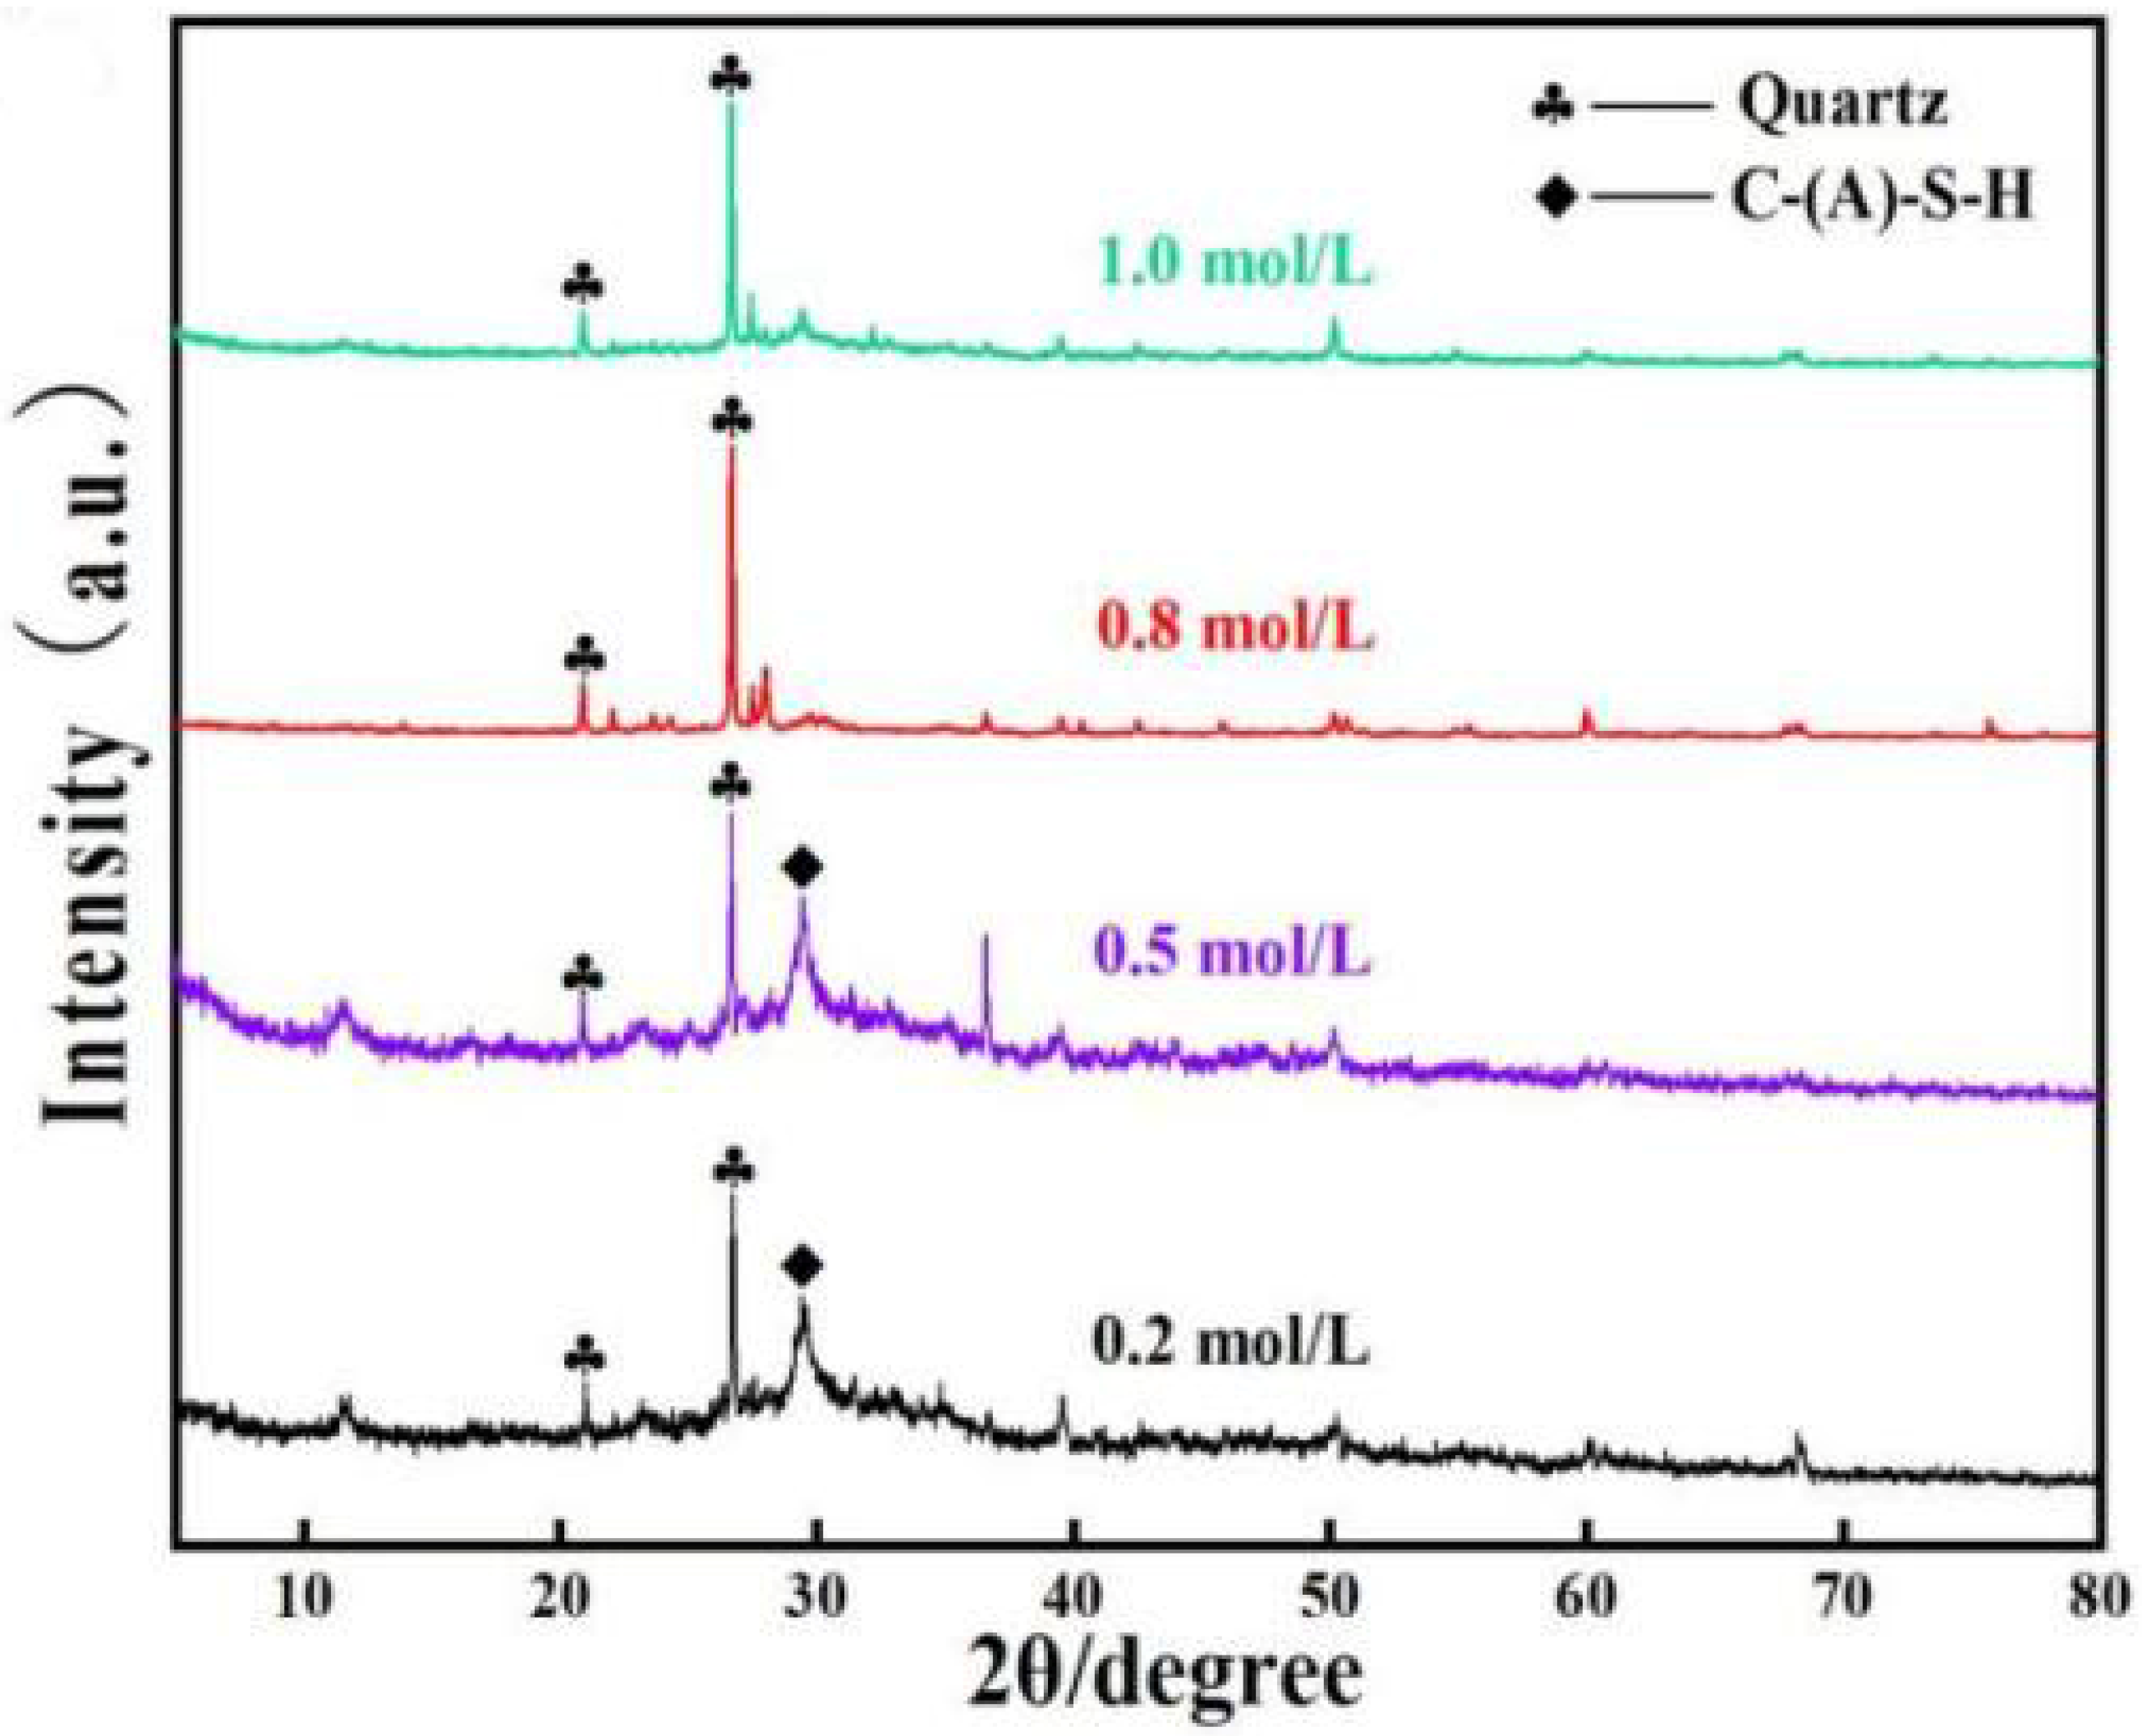
Figure 13 shows that a small quantity of OH- has no obvious erosion effect on the specimens of the alkali-activated GGBS/HCFA composite cementitious material, which is related to the presence of a large amount of OH- in the system; as the concentration of OH- increases, the specimens’ hydration product C-(A)-S-H gel is eroded, and the erosion is more severe at 0.8 mol/L. Combined with the mechanical properties, the specimens’ strength reduced as the OH- concentration increased, although there was no continuous decrease, which was related to the depth of alkali erosion.

3.2.2. FTIR Analysis

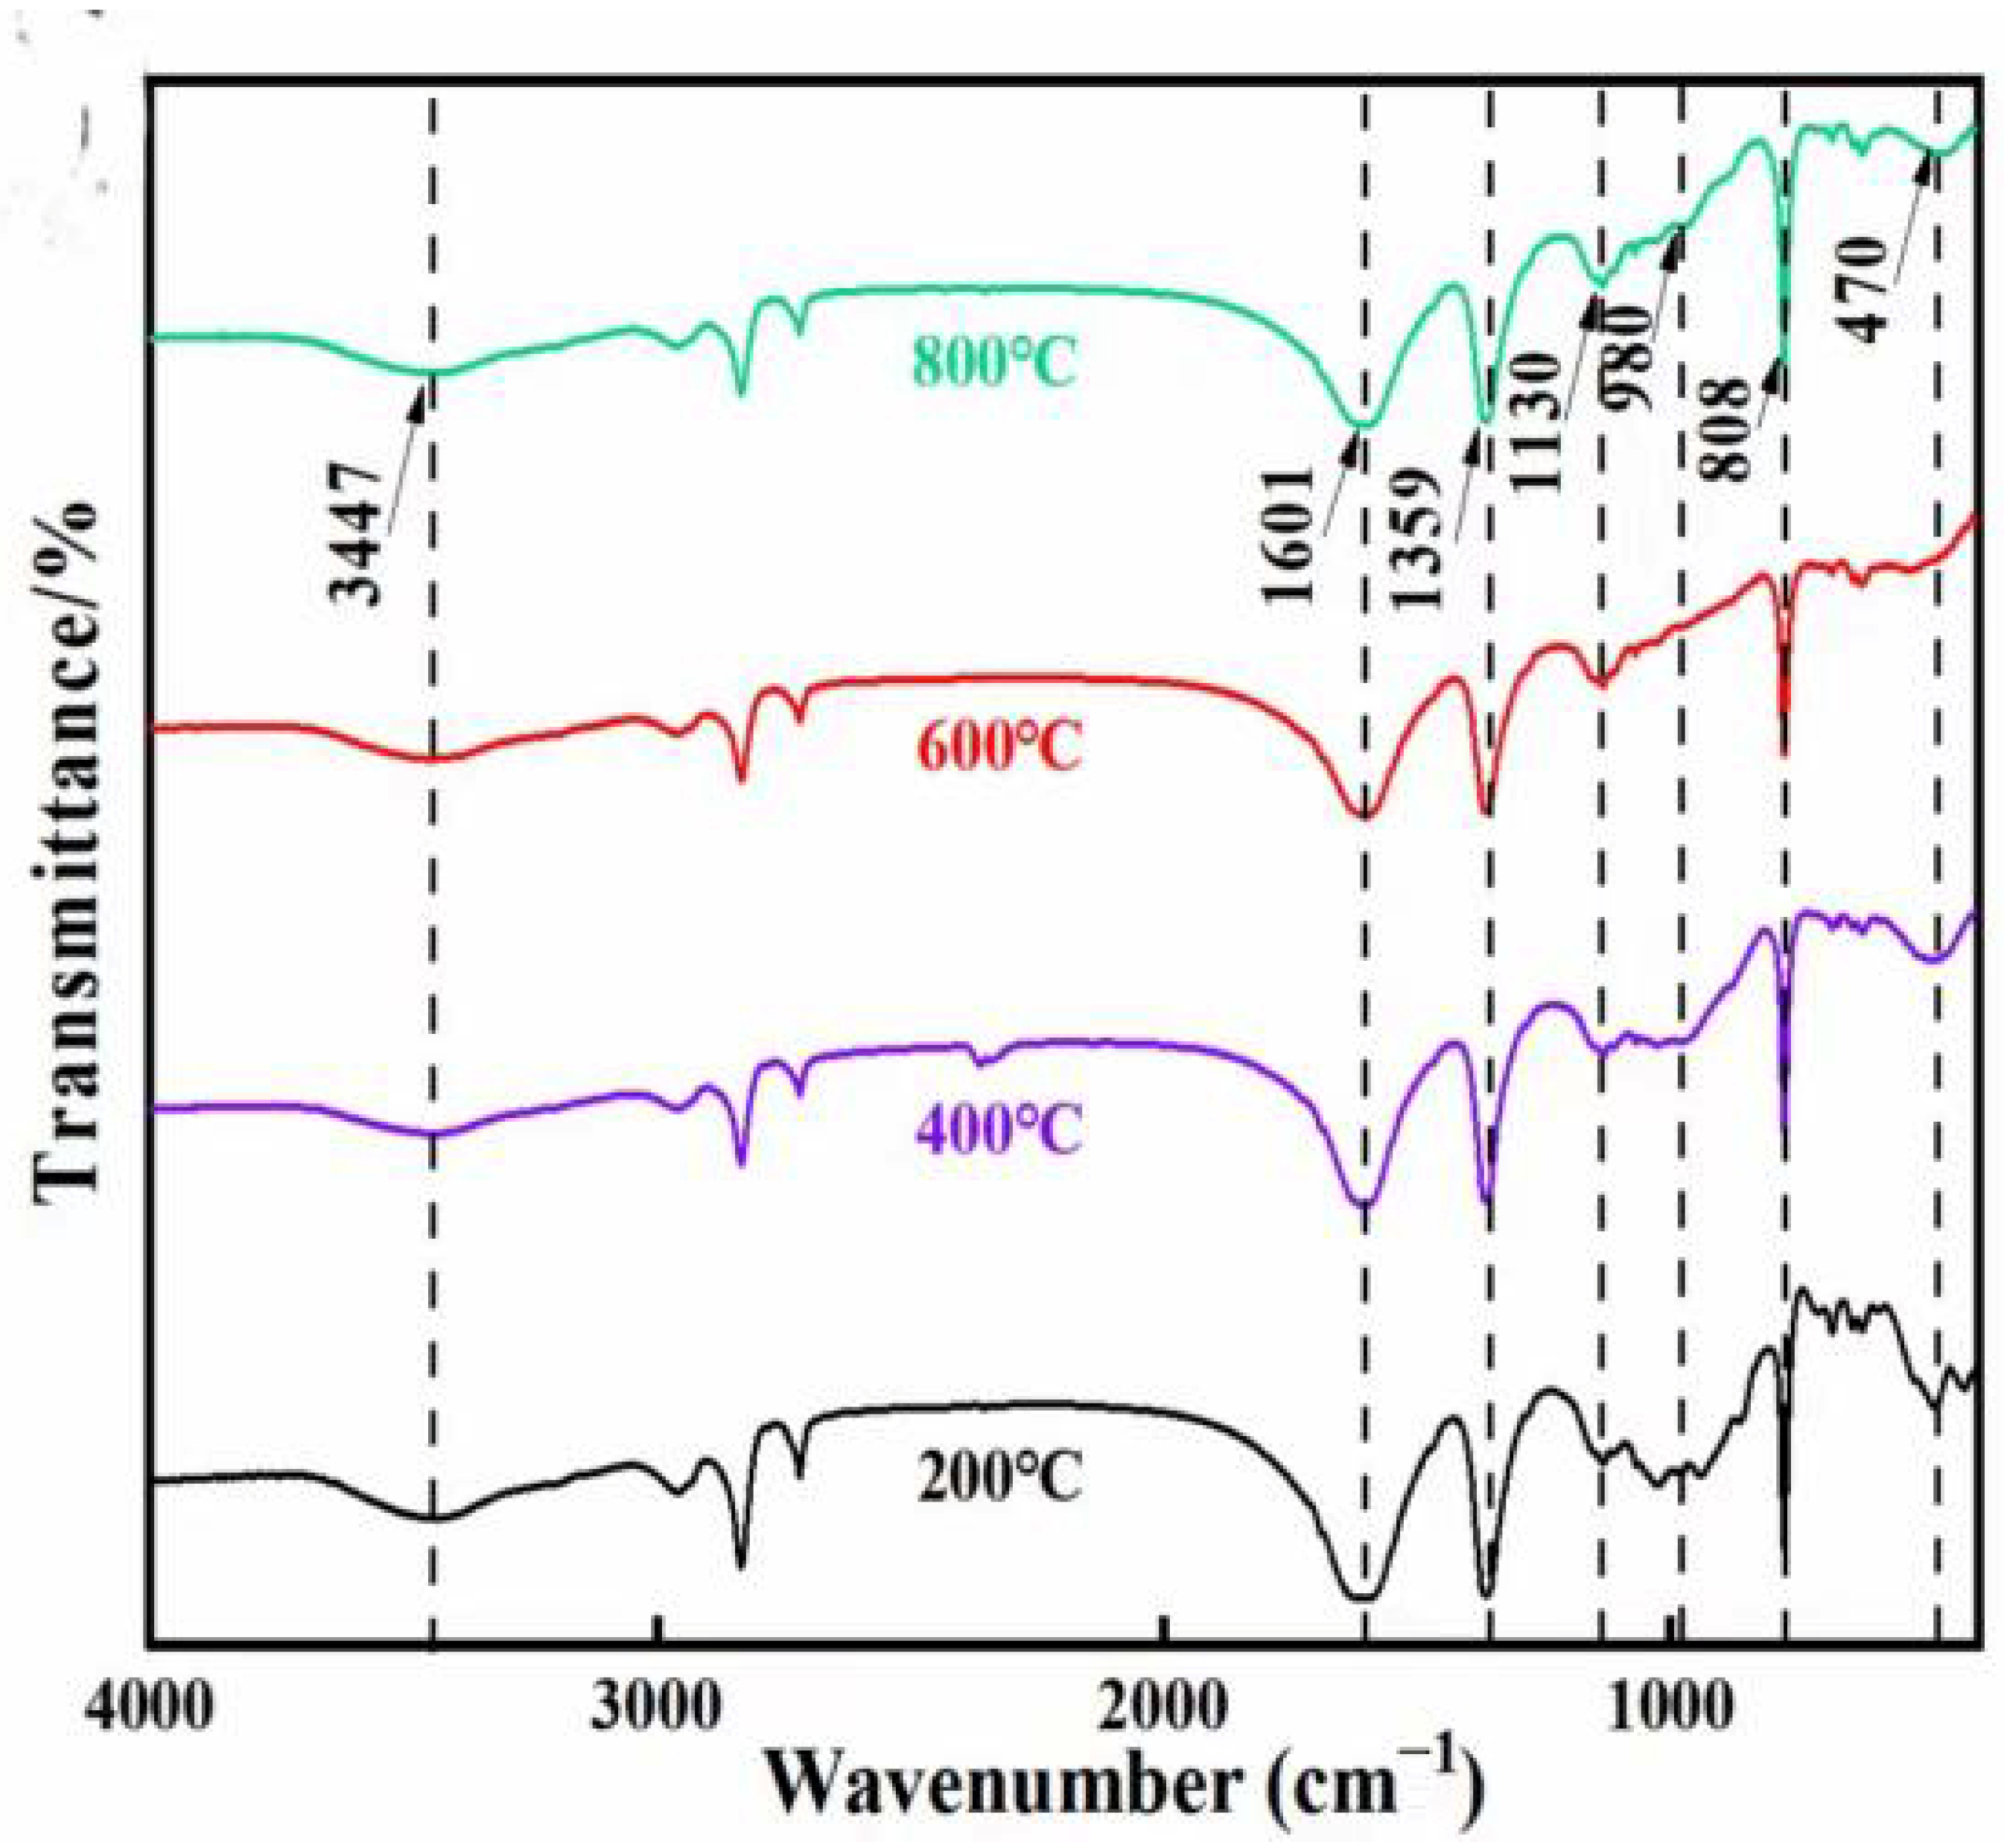
Figure 14 shows temperature-driven peak shifts that reflect changes in hydrogen bonding and the silicate network. The broad ν(OH) band near 3450 cm−1 (H-bonded Si–OH/adsorbed H2O) becomes narrower and typically shifts slightly to a higher wavenumber (a blue shift) before vanishing, consistent with progressive weakening of hydrogen bonding as physisorbed and gel water are removed; in contrast, the H–O–H bending band moves from 1630 toward 1600 cm−1 (a red shift) as bulk-like water is lost first and more constrained interlayer/bound water dominates and then disappears upon dehydroxylation. The asymmetric T–O–T stretch (T = Si, Al) of C-(A)-S-H initially centered around 970–990 cm−1 shifts to a lower wavenumber (950–960 cm−1) with heating, indicating depolymerization of silicate chains and increased Si–O–Al linkages during decalcification; at ≥600–800 °C this band collapses as the gel breaks down and recrystallizes to Ca-silicate phases, in line with the disappearance of the 980 cm−1 peak and the XRD results. Low-frequency Si–O–Si bending near 470 cm−1 shows only minor shifts (reflecting subtle changes in network connectivity and Al substitution) before weakening at high temperature. Carbonate-related bands (1450 and 875 cm−1), if present, may drift slightly due to polymorphic rearrangement and then diminish above 700–800 °C as CaCO3 decomposes. In this context, blue shifts (to a higher wavenumber) denote weakened hydrogen bonding/greater OH “freedom,” whereas red shifts (to a lower wavenumber) in the silicate region signify chain depolymerization and Al incorporation prior to phase transformation.
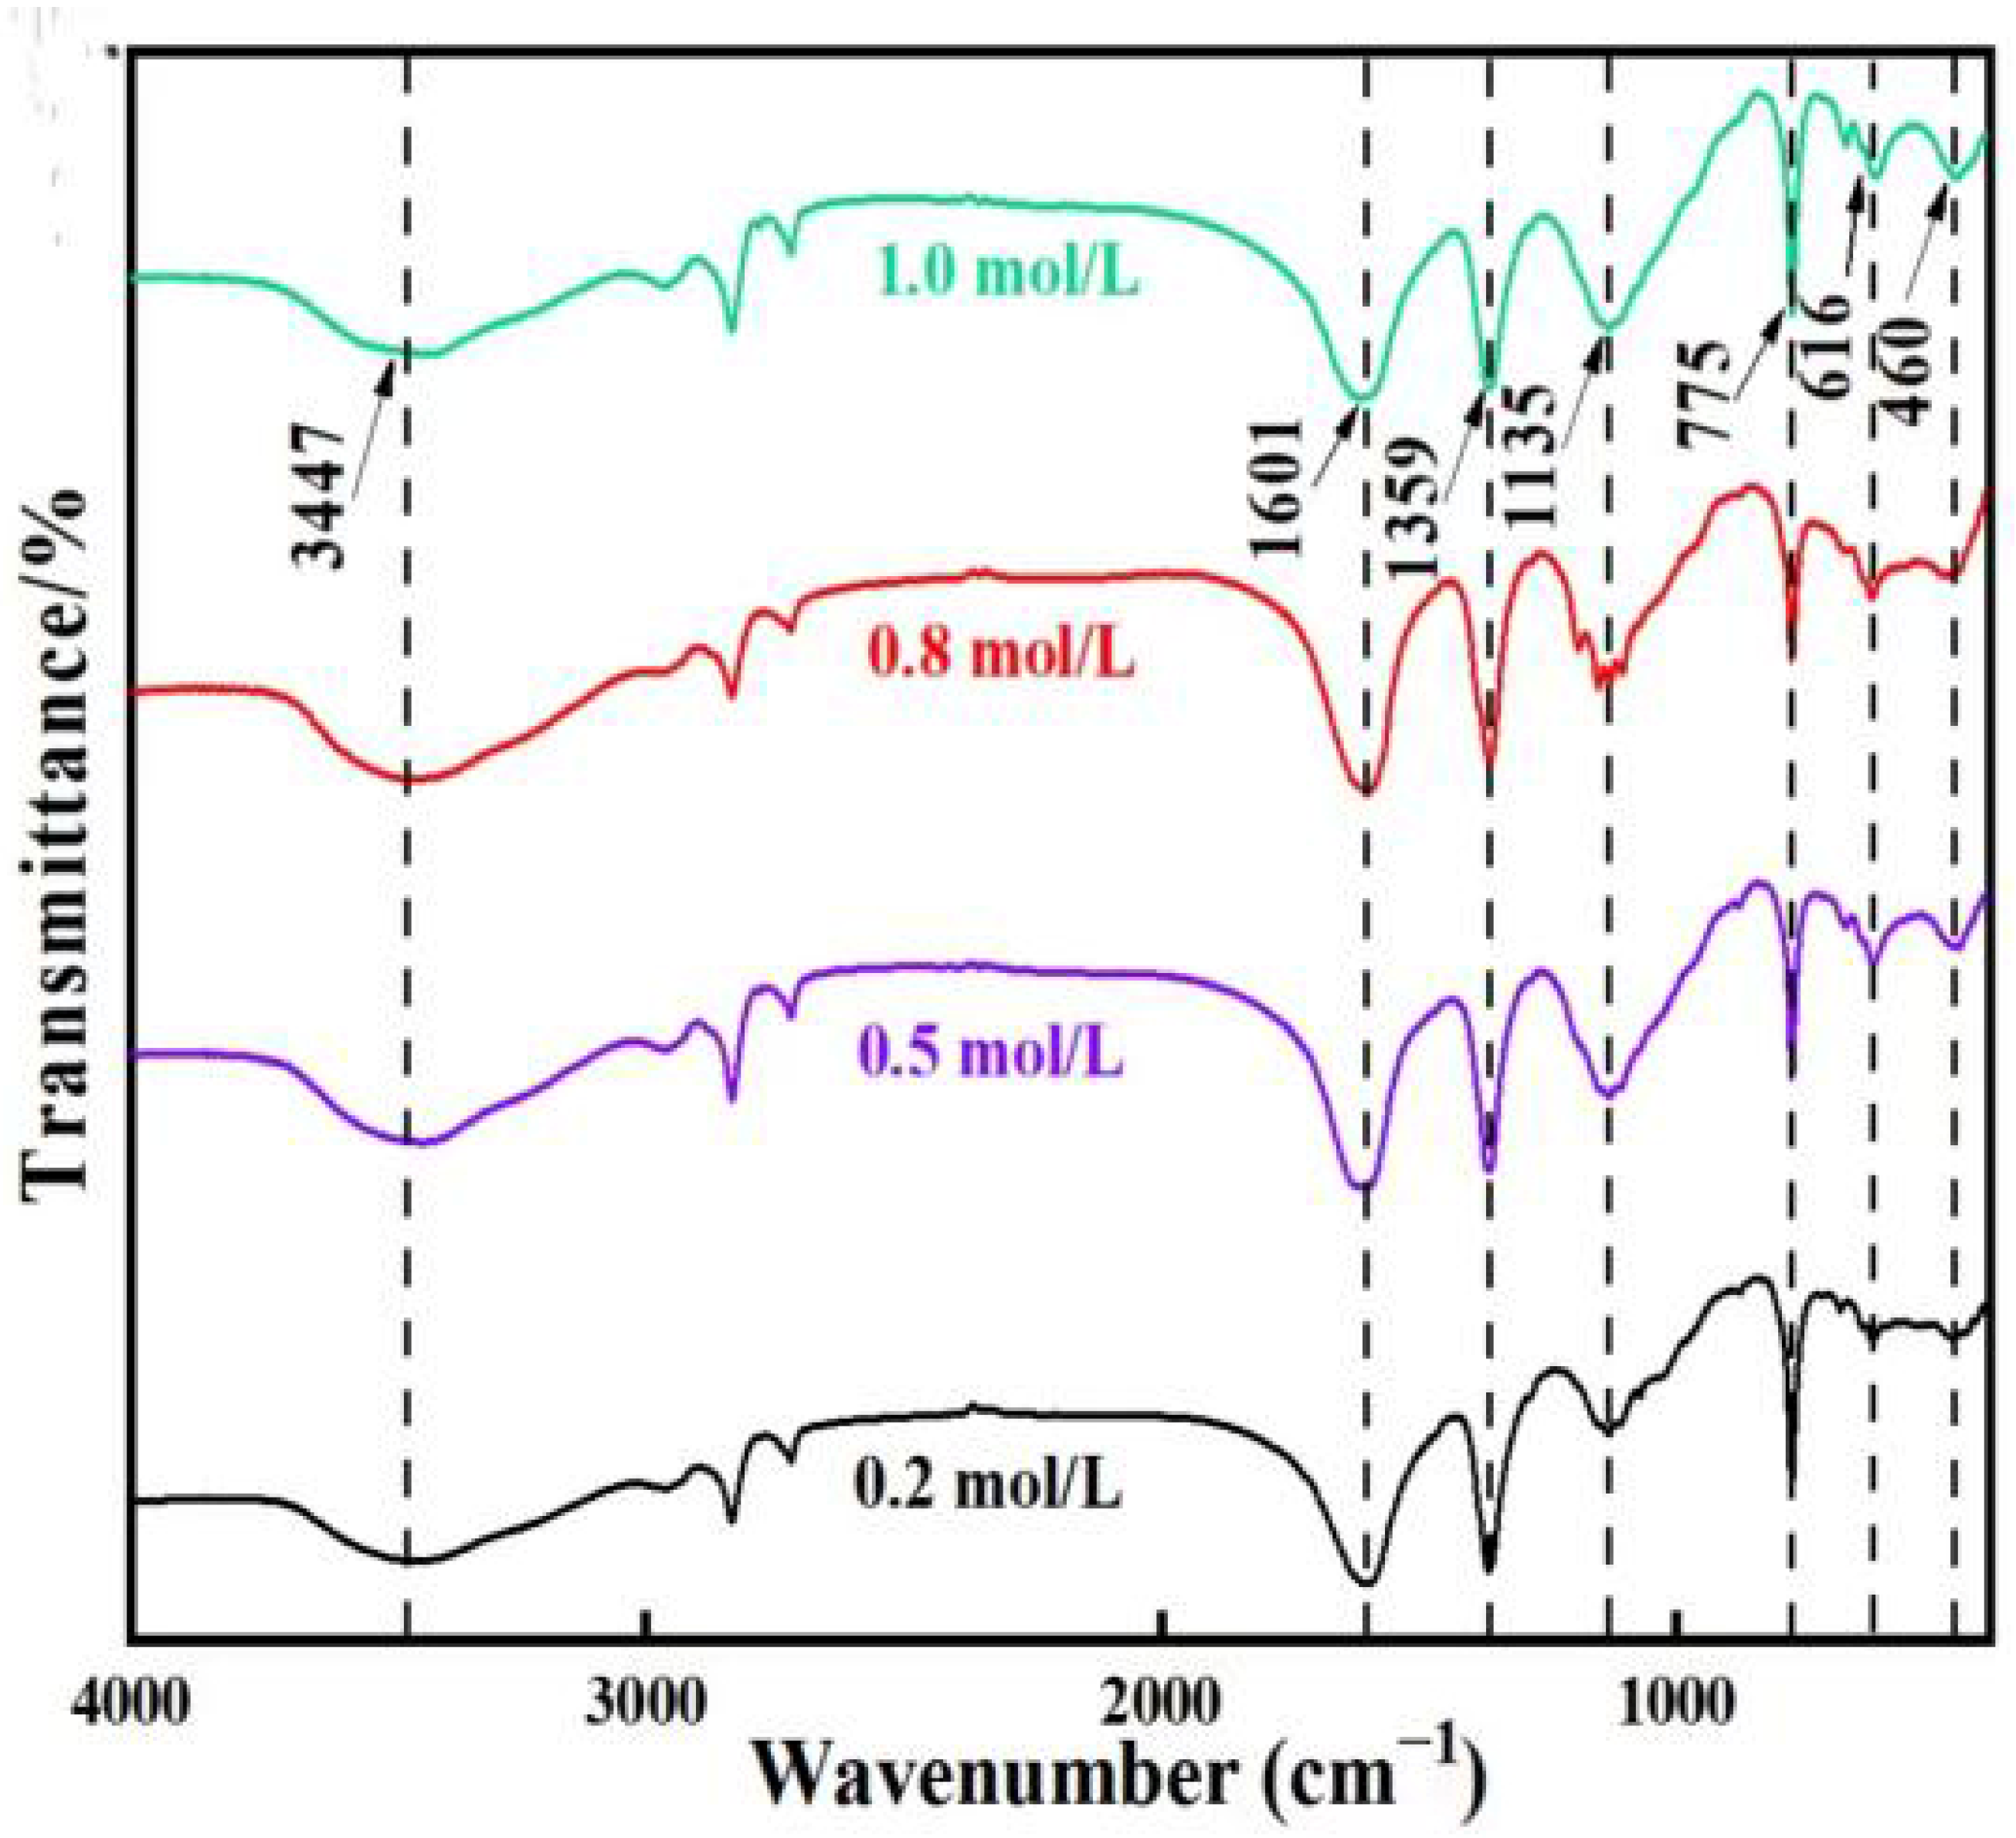
Figure 15 demonstrates that the alkali-activated material combines with C-(A)-S-H to capture Ca2+ to create gypsum due to the presence of SO42− at various H2SO4 immersion concentrations, and the gypsum products rise as the H2SO4 concentration increases. Figure 15 indicates an increased absorption peak at 1135 cm−1 associated with SiO2, implying that the conversion of C-(A)-S-H to SiO2 is linked to CaSO4. The alkali-activated GGBS/HCFA composite cementitious material exhibited a distinctive peak of SO42− at 616 cm−1, which became stronger with increasing H2SO4 concentration, corresponding with the XRD data.
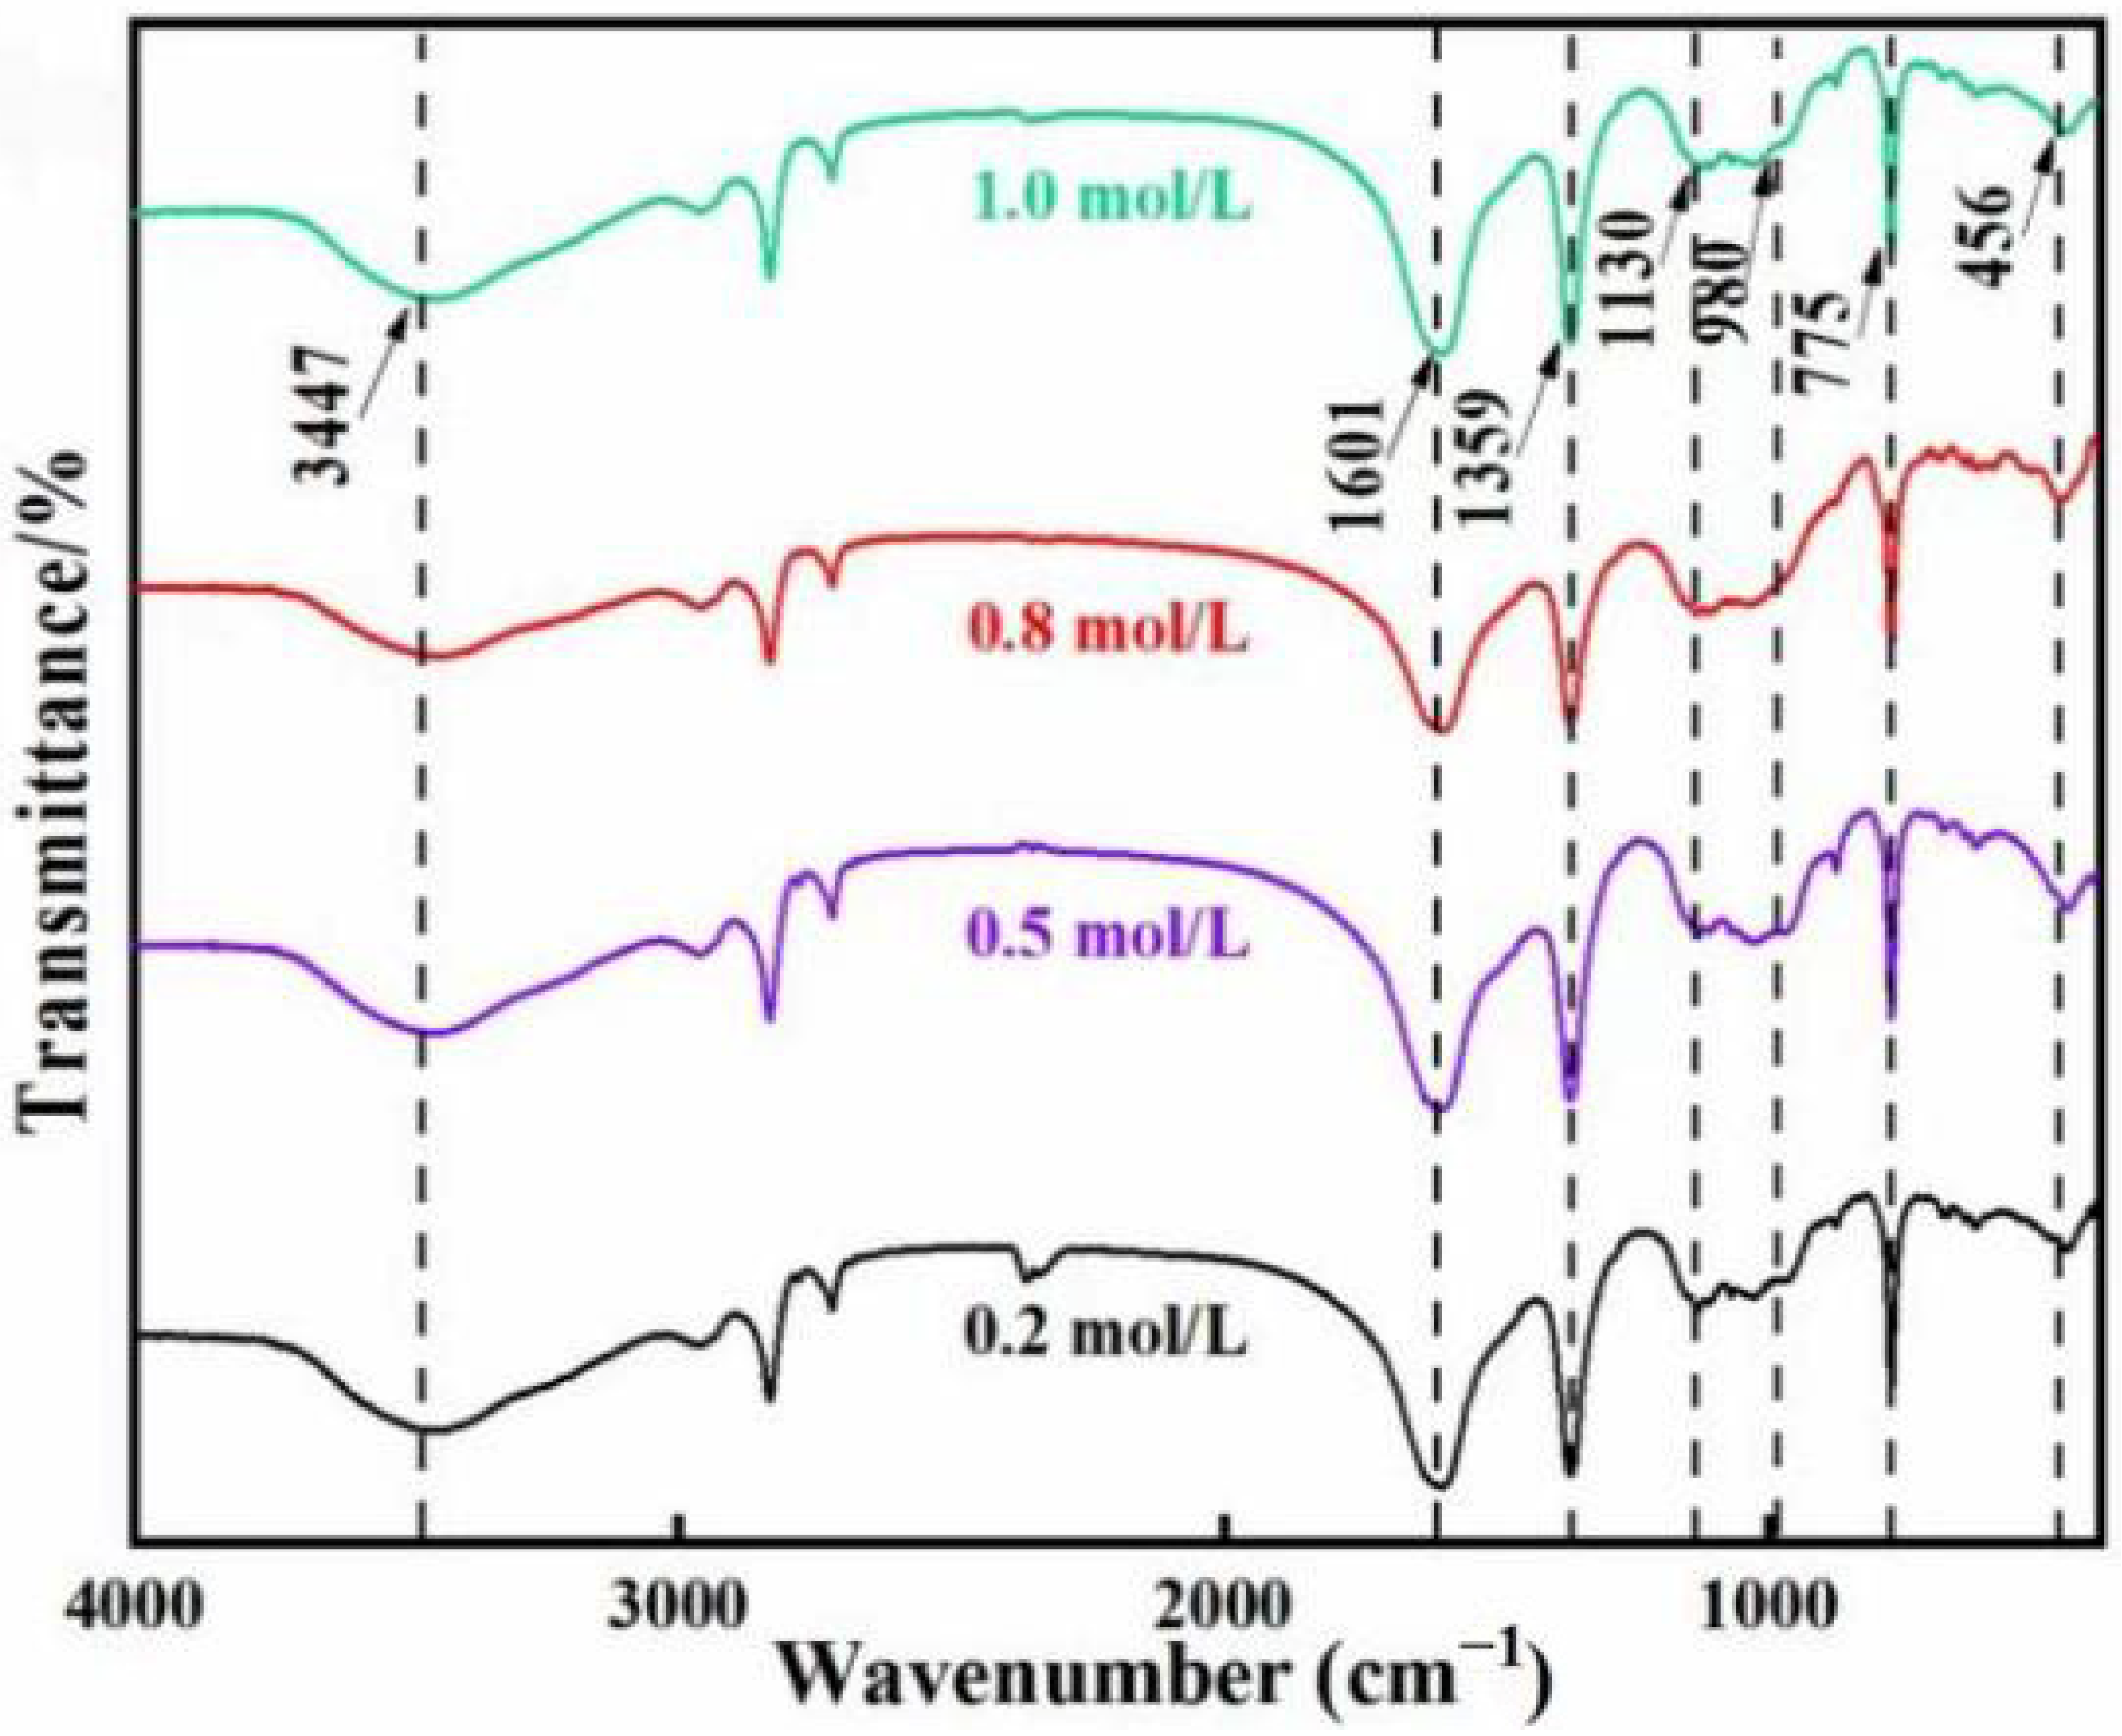
In Figure 16, peak positions change only subtly with NaOH concentration, indicating that the same gel phases form while their local environments evolve. The broad ν(OH) band near 3447 cm−1 shows a slight blue shift and narrowing as NaOH increases, consistent with weaker hydrogen bonding when silanol groups are partially deprotonated and water becomes more Na+-coordinated rather than H-bonded. The H–O–H bending band around 1600–1630 cm−1 shifts marginally to a lower wavenumber as the fraction of interlayer/ion-structured water increases. The principal νas(T–O–T, T = Si, Al) band of the aluminosilicate/C-(A)-S-H gel near ~980–990 cm−1 exhibits only a few-cm−1 shift because two opposing effects coexist: higher alkalinity promotes dissolution and crosslinking, which tends to blue-shift the band, while increased Al-for-Si substitution and Na+ charge-balancing weaken the T–O bond and red-shift it. The near-constant position, therefore, implies that network polymerization and Al incorporation largely offset each other across 0.2–1.0 mol/L NaOH, so the short-range bonding environment remains similar. Low-frequency Si–O–Si/O–Si–O modes (1130, 775, and 456 cm−1) also move by only a few cm−1, reflecting minor adjustments in network connectivity rather than a change in phase assemblage. Overall, intensity variations mainly track the extent of gel formation, whereas the very small peak shifts confirm that the bonding motifs are preserved under the tested alkalinity.

3.2.3. SEM Analysis

Figure 17 shows the microscopic morphology after alkali activation of the GGBS/HCFA composite adhesive material at high temperature. When the temperature rises to 200 °C, the dense silica–aluminate mesh structure forms on the surface of the material. Because of the desorption of adsorbed water and a very tiny number of pores, the material’s performance does not significantly decline. At 400 °C, the inside of the material has changed significantly and the removal of the C-(A)-S-H binding water causes more holes inside; at this temperature, the intensity decreased significantly. At 600 °C, the material changes significantly and exhibits a high number of hollow structures, which is due to the fact that the hydration products begin to shrink after dehydration and the C-(A)-S-H begins to break down, resulting in the material’s dissolution. Small and wide fractures can also be detected in the material, showing discontinuities caused by damage from pore pressure and thermal stresses, the slow disintegration of the gel, and the formation and expansion of larger cracks along the margins. Cracks typically form around the interfacial transition zone between unreacted particles and reaction products, expanding and localizing at relatively weak interfaces, resulting in a significant loss of material strength. In Figure 17d, at 800 °C, the gelation products continue to dissolve by C-(A)-S-H, the crack width widens, and the thick structural layer is severely degraded, resulting in continual internal structure shrinkage, gel material breaking, and the formation of larger holes. The samples were mounted on aluminum stubs with carbon adhesive tabs, air-dried, and coated with [10] nm carbon using a [carbon coater model] (to avoid Au/Pd peaks during EDS). SEM imaging was performed on a Hitachi S-4800 at [5 kV] and [10 mm] working distance (SE detector, high vacuum).
Figure 18 clearly illustrates that the microstructure of the gel material was degraded after 28 d of invasion in H2SO4 solution. After 0.2 mol/L erosion, slight cracks appeared on the surface of the composite gel material, and as the concentration of H2SO4 increased, a large number of irregular gypsum crystals were attached to the surface, which was caused by the combination of Ca2+ and SO42− in C-(A)-S-H to form CaSO4 deposited on the surface of the hydration product, and the C-(A)-S-H collapsed and formed pores due to Ca loss. And the higher the concentration of H2SO4, the more CaSO4 was produced; at 1.0 mol/L, the most holes were discovered, and the cracking phenomenon was most visible. The greater strength C-(A)-S-H was transformed into lower strength CaSO4, causing the gel material’s strength to diminish.
Figure 19 shows the microscopic morphology of the alkali-activated GGBS/HCFA composite material NaOH for 28 d, with the smaller cracks in the low concentration of NaOH solution with increasing concentration. At the NaOH concentration of 0.8 mol/L, the sample hole is clearly visible, the erosion effect is greater than the activation effect, and the mechanical properties of the material decrease with the increase in NaOH concentration and age.

3.2.4. Durability Test

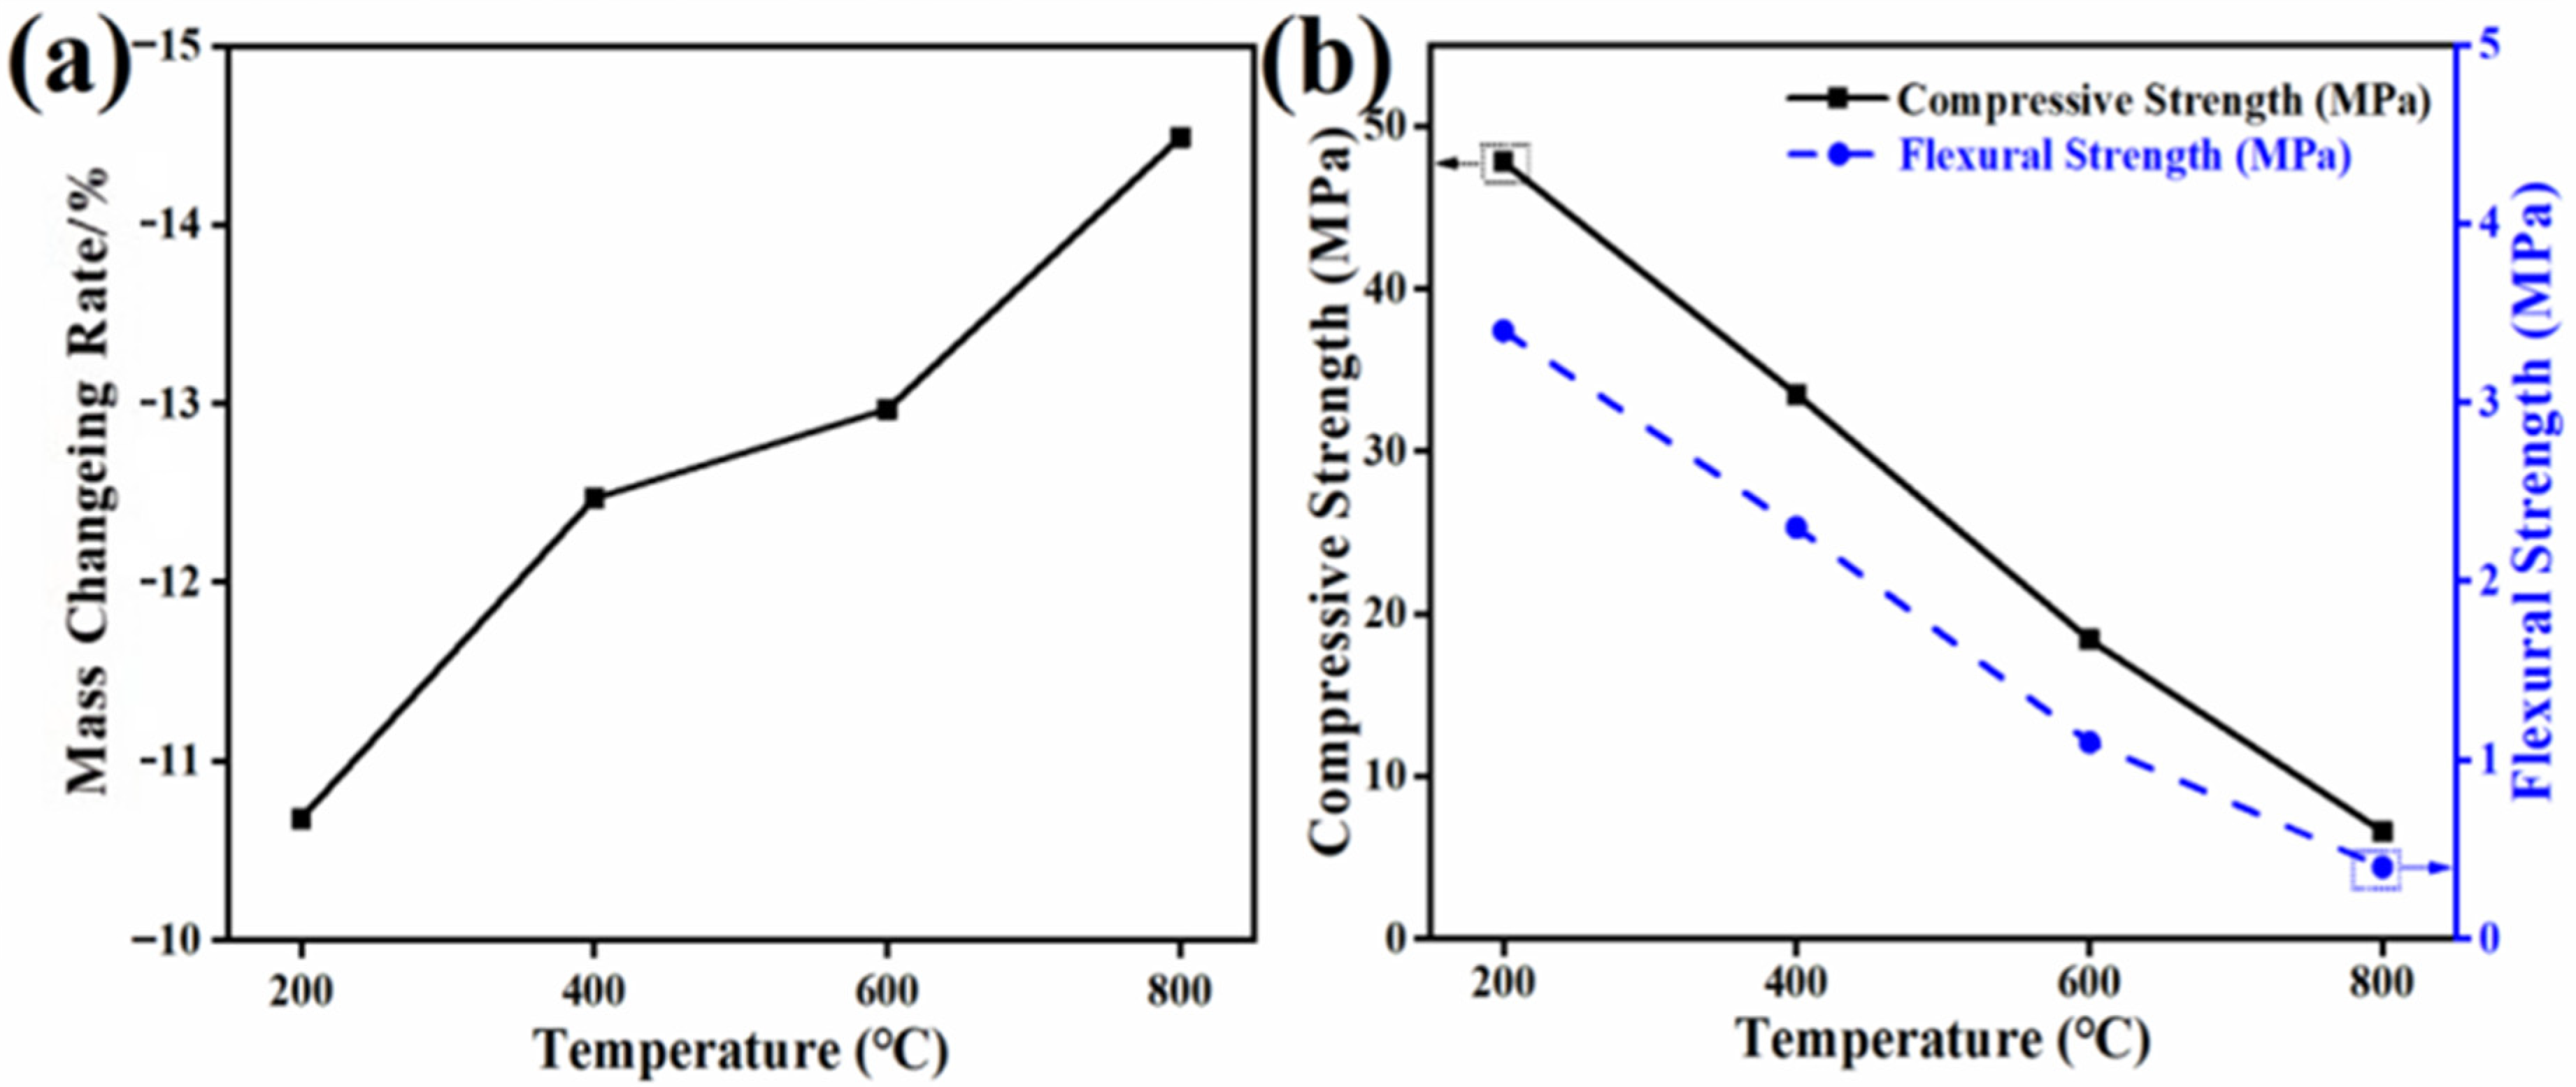
Figure 20 shows that although the mass loss increases only slightly from 10.68% to 14.49% with temperature, strength—particularly flexural—drops precipitously in a stepwise manner (at 200, 400, 600, 800 °C, and air-cooled), compressive strength decreases by 9.47%, 36.55%, 65.15%, and 87.5%, respectively, while flexural strength decreases by 64.21%, 75.79%, 88.42%, and 95.79%; at 200 °C the flexural strength is only 3.4 MPa whereas the compressive strength remains 47.8 MPa, indicating that the governing factor at high temperature is not mass loss per se but thermally induced phase transformations that trigger microcrack network percolation and destabilization of the gel skeleton: up to about 200 °C, evaporation of free water and part of the capillary/interlayer water raises pore pressure and causes differential shrinkage, preferentially generating microcracks at the surface and within the aggregate–matrix interfacial transition zone (ITZ), which severely degrades the tension-sensitive flexural strength while leaving compressive strength relatively intact; between 200 and 400 °C, C-(A)-S-H and hydrotalcite-like phases undergo dehydration/dehydroxylation, leading to gel-chain depolymerization, interlayer collapse, and reduced interfacial bond strength, with correspondingly large strength losses; from 400 to 600 °C, in addition to continued dehydroxylation, quartz aggregate undergoes the transition near 573 °C with a volume change, and the thermal-expansion mismatch between quartz and the C-(A)-S-H/GGBS gel induces alternating tensile–compressive thermal stresses that rapidly propagate and link ITZ cracks—mass decreases only slightly (12.47%→12.97%), yet both compressive and flexural strengths plunge, highlighting the dominant roles of structural phase transitions and thermal mismatch; from 600 to 800 °C, C-(A)-S-H and minor N-A-S-H further decompose and crystallize from amorphous precursors, potentially forming new calcium silicate and calcium aluminosilicate crystalline phases (e.g., wollastonite, anorthite/gehlenite) and Na–aluminosilicate crystals, accompanied by calcite decarbonation and incipient sintering/embrittlement, whereby the original continuous gel network is replaced by discrete crystals, losing toughness and crack-bridging capacity, which manifests macroscopically as a color change from white–gray to yellowish-white and a catastrophic decline in load-bearing capacity. Overall, this alkali-activated (AA) GGBS/HCFA system can retain good compressive strength at ≤400 °C by relying on a not-yet-collapsed gel framework and a not-yet-percolated crack network, but phase-transition-induced interfacial instability and crystallization-induced embrittlement severely impair flexural strength even at low temperatures, and at ≥600 °C, both strengths collapse concurrently.
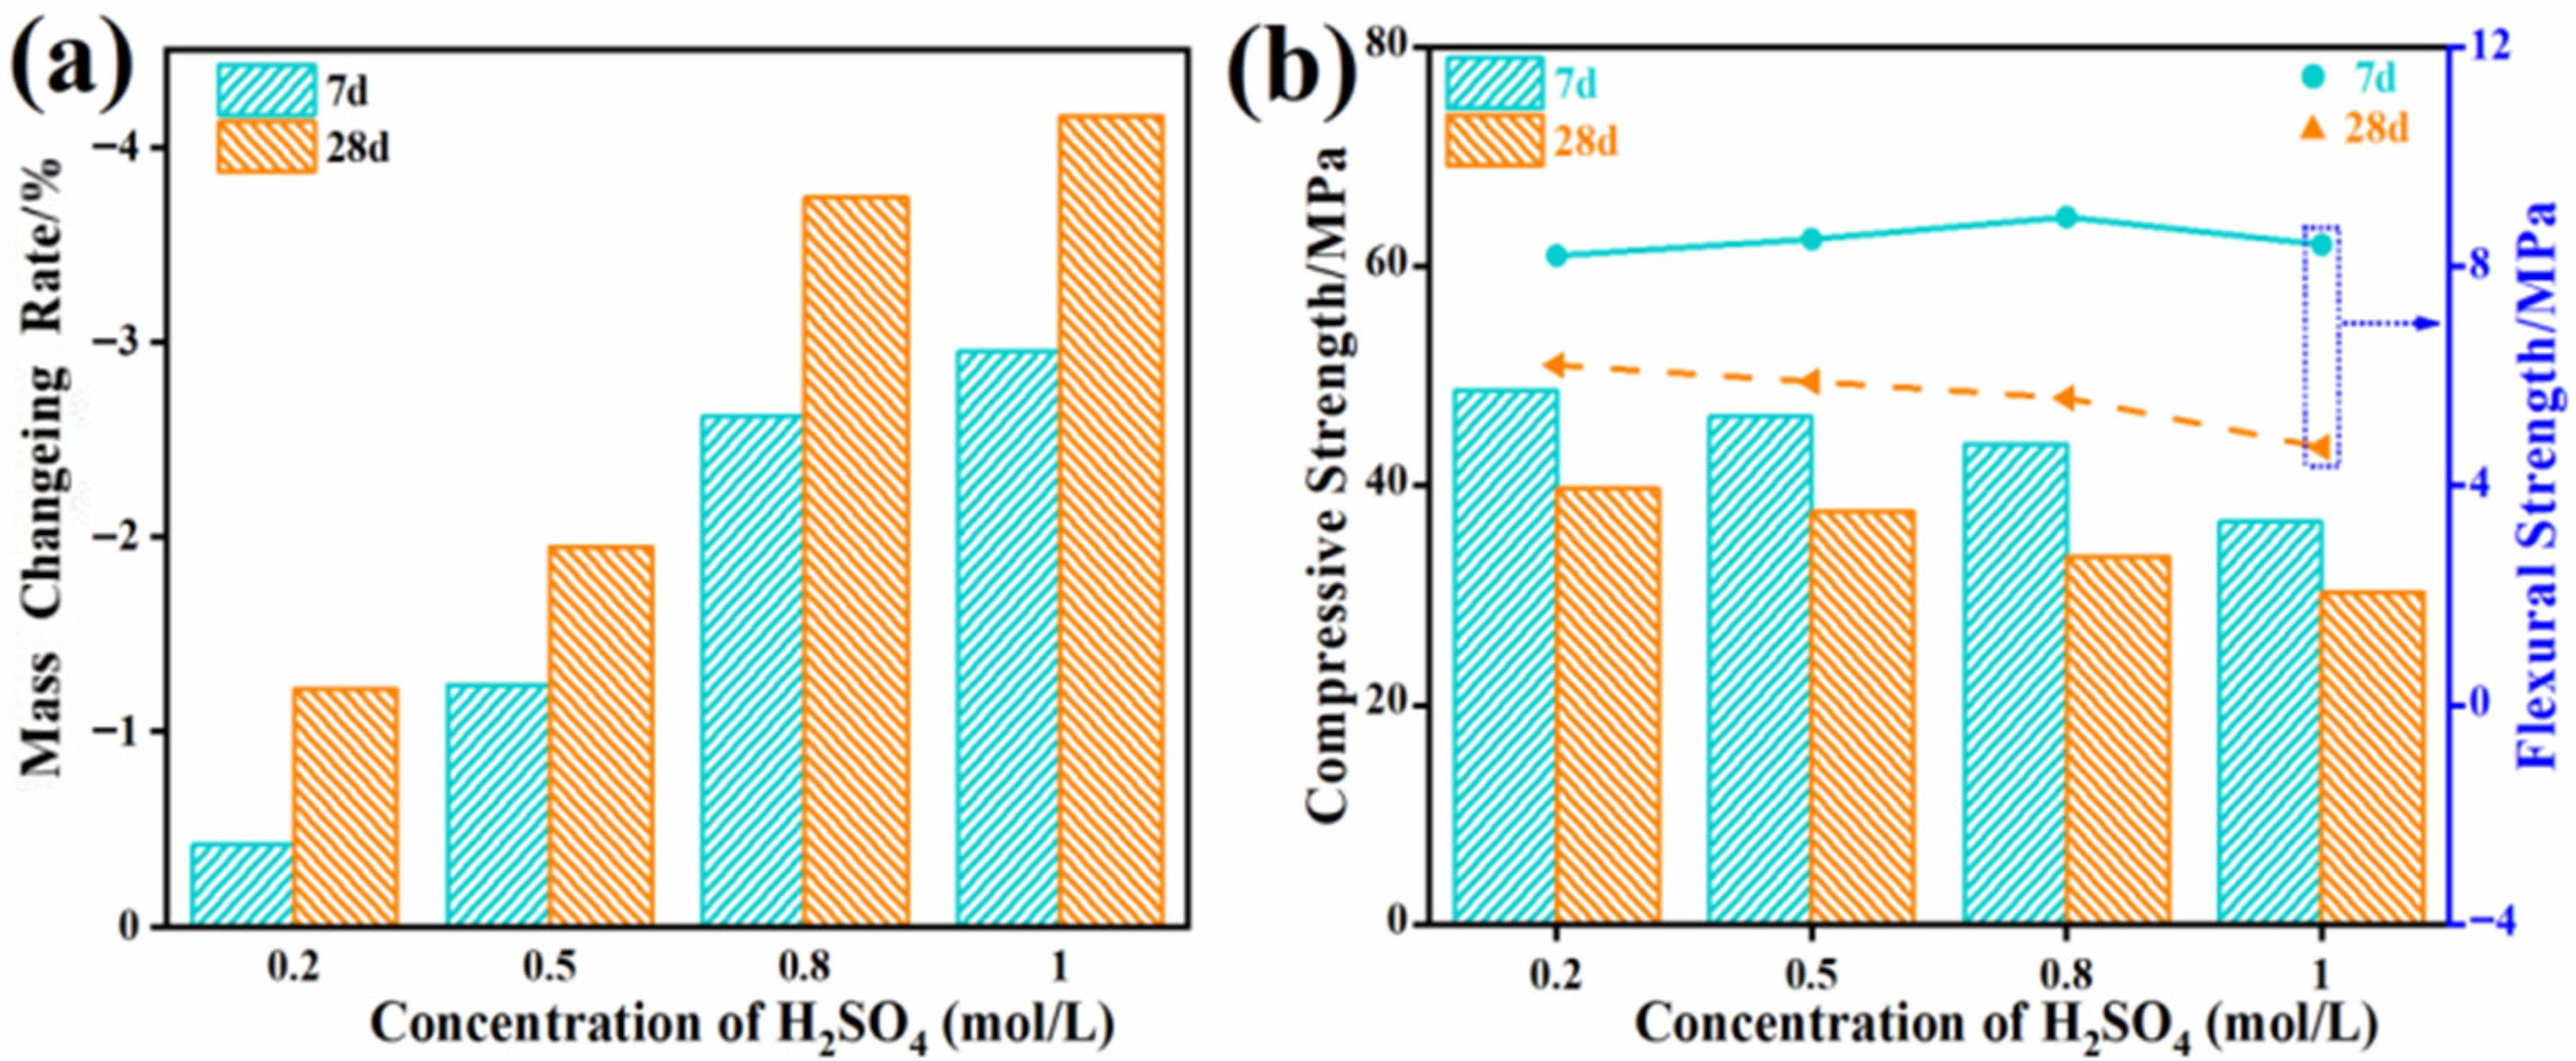
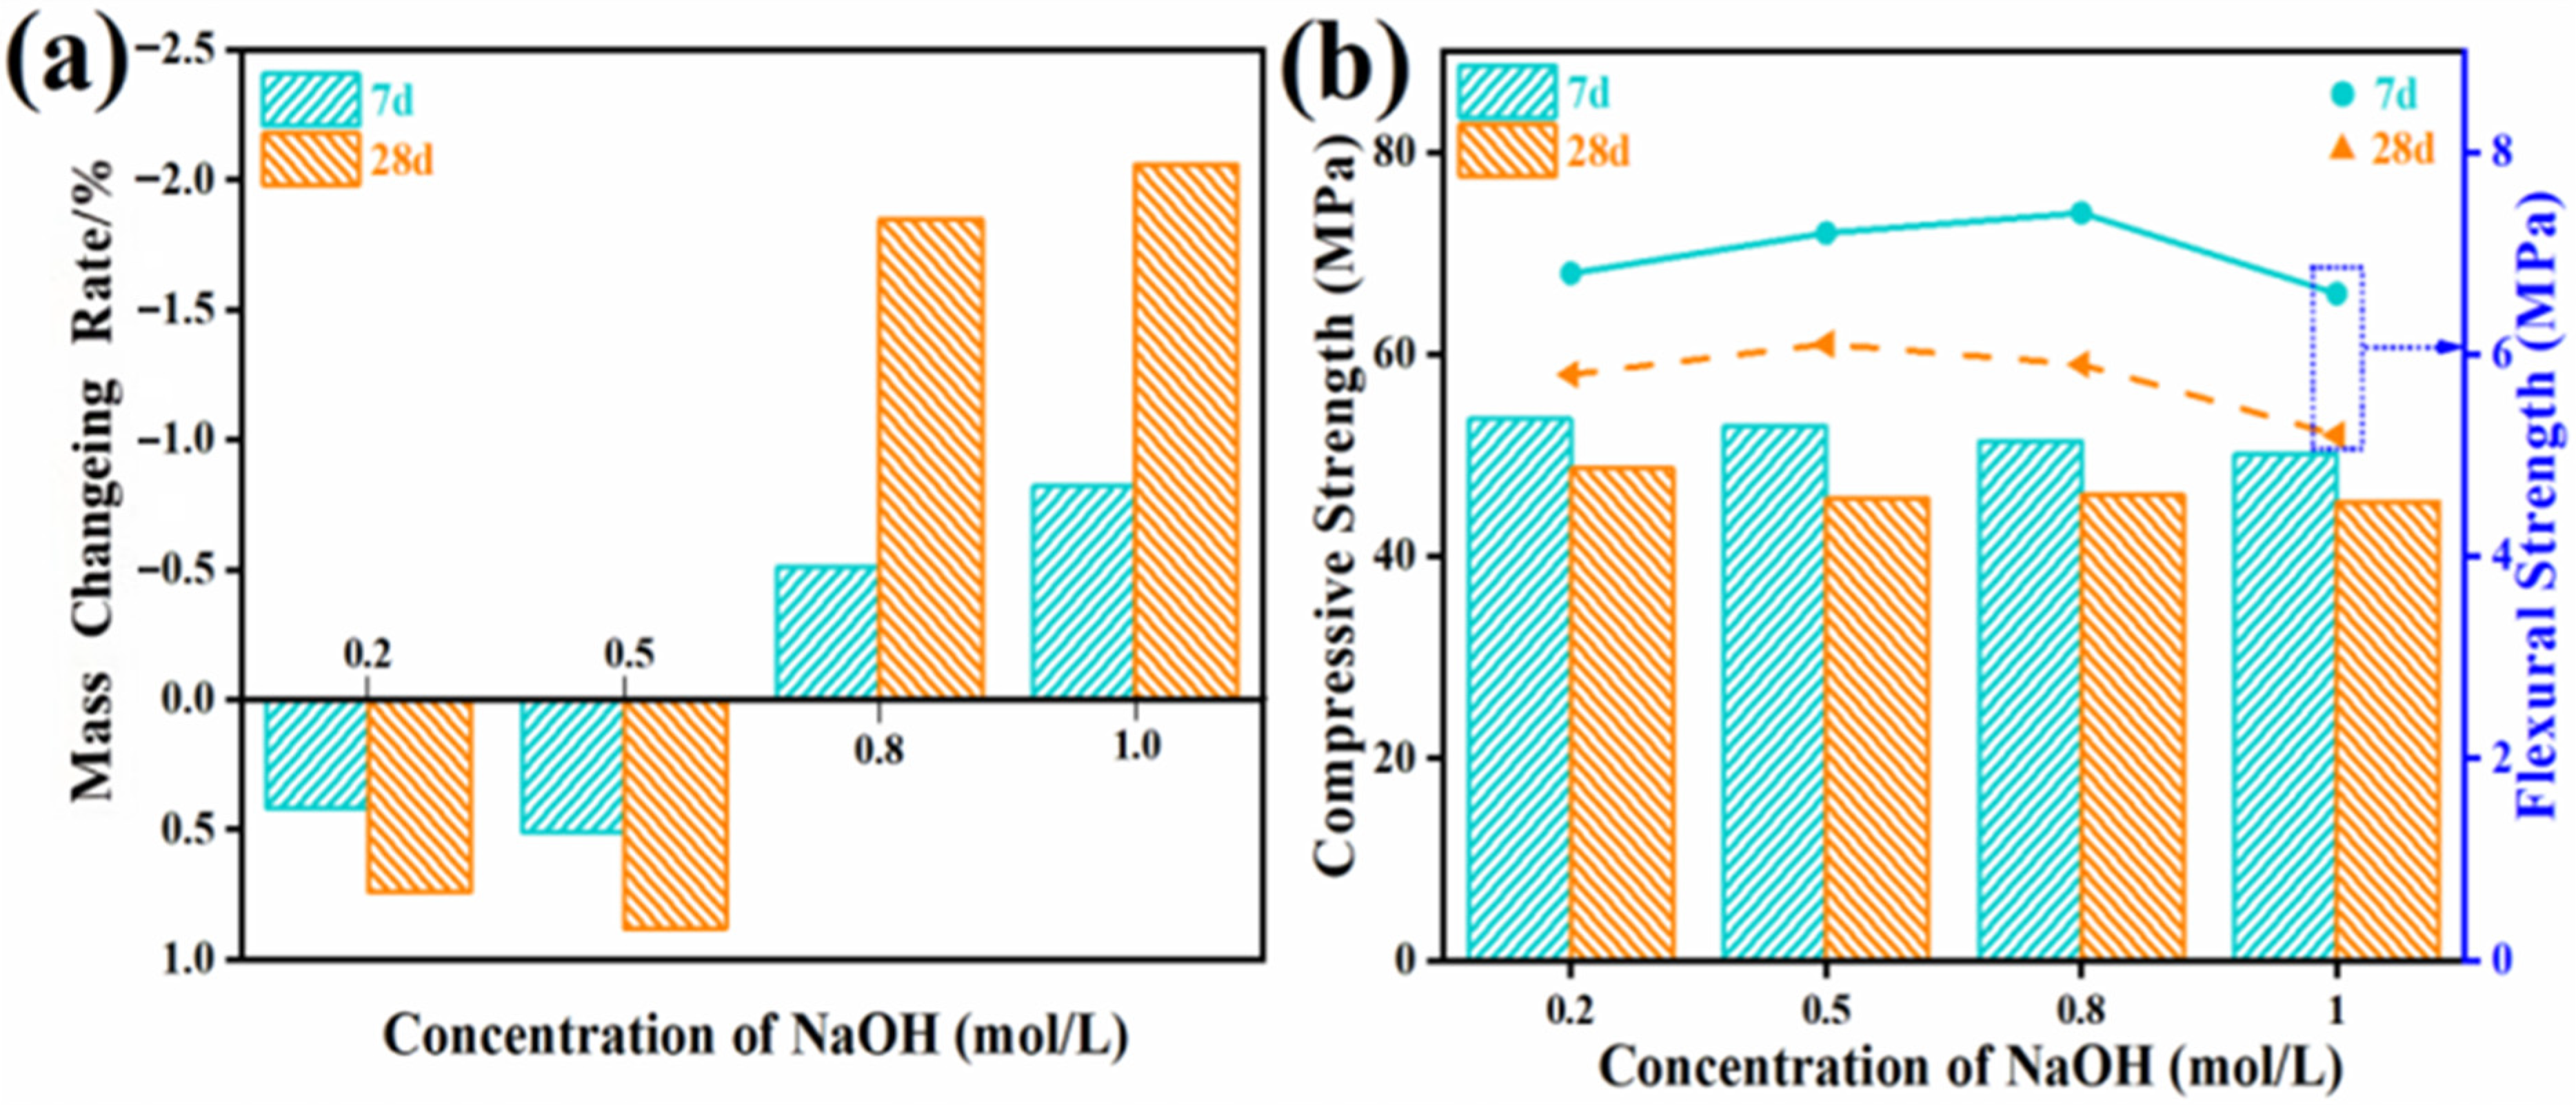
After curing the specimens prepared with the optimal mix proportion in a standard curing room for 28 d, they were removed and immersed separately in H2SO4 and NaOH solutions at concentrations of 0.2, 0.5, 0.8, and 1.0 mol/L for 7 d and 28 d. At the corresponding ages, their masses were measured to calculate the mass change rate, and flexural and compressive strength tests were conducted.
As shown in Figure 21a,b, as the H2SO4 concentration increases, the 28 d mass loss rises from 1.22% to 4.16%, while compressive and flexural strengths decline to 75.2%, 71.2%, 63.4%, and 57.4% and to 65.3%, 61.6%, 58.9%, and 49.5% of the original values, respectively, indicating that deterioration is governed by a coupled “corrosion products–microstructure evolution” mechanism: in acidic media, H+ first decalcifies and dealuminates C-(A)-S-H together with minor N-A-S-H phases, releasing Ca2+ and Al3+ and leaving a Si-rich amorphous skeleton; the outward-migrating Ca2+ reacts rapidly with SO42− to form gypsum (CaSO4·2H2O) and, in Al-rich zones, ettringite (AFt) [52]. These sulfate crystals can transiently fill near-surface pores and, together with the Si-rich “silica gel,” form a weak densified layer, producing a competition between dissolution (mass loss) and deposition (mass gain) that limits early mass change; however, crystallization-induced expansion and volumetric mismatch generate microcracks at the surface and within the interfacial transition zone (ITZ). As the acid front advances inward, gel depolymerization increases porosity and connectivity; once cracks coalesce, the deposition layer spalls off, yielding a net mass decrease and continuous strength degradation, with the tension-sensitive flexural strength deteriorating earlier because it depends more on interfacial bonding and gel bridging. By contrast, in alkaline (e.g., NaOH) media, OH nucleophilically attacks Si–O–Si/Si–O–Al bonds, depolymerizing C-(A)-S-H and N-A-S-H and driving ion exchange (Na+ for Ca2+), possibly converting to C–N–A–S–H with reduced crosslink density; concurrent reaction with reactive silica in sand or glass forms water-absorbing, expansive alkali–silica-reaction (ASR) gels that build internal stress and propagate cracks. Alkaline corrosion thus tends to be dominated by gel dissolution/expansion with secondary deposition, so mass may show slight initial gain (water uptake/gel filling) before shifting to spalling-induced loss; in both acidic and alkaline environments, the net effect is pore coarsening, ITZ weakening, and crack-network percolation, consistent with Figure 20: higher acid concentration and longer exposure lead to greater mass loss and stepwise strength decline [17].
As can be seen in Figure 22 above, when the NaOH concentration is lower than 0.5 mol/L, the mass increases with the increase in the concentration. There is mass loss in the high concentration of NaOH solution, and the greater the concentration, the greater the mass loss rate. In the concentrations of 0.2 mol/L, 0.5 mol/L, 0.8 mol/L, and 1.0 mol/L NaOH solution, the 28 d mass change rates were 0.74%, 0.88%, −1.85%, and −2.06%, respectively; in different NaOH solution concentrations, the 28 d age compressive strength decreased. The NaOH concentration was 0.2 mol/L, demonstrating the smallest decline, which was a decrease of about 7.77%; the 28 d age flexural strength showed an upward trend. This is due to the fact that the material itself has a high alkalinity, and the silica–aluminum raw material is not eroded in lower concentrations of NaOH solution. Additionally, because there are some voids inside the specimen, NaOH will fill the voids, resulting in an increase in the mass of the specimen, and the mass increases with NaOH concentration [53]. As the concentration increases, the alkalinity inside the specimen is exceeded, causing the gel material to erode and disintegrate, resulting in mass loss. The decrease in compressive and flexural strength with time in NaOH solution is caused by the ion exchange of some of the C-(A)-S-H with NaOH, resulting in N-A-S-H with decreased strength [54]. Alkali activation of the GGBS/HCFA composite cementitious material’s alkali resistance in high-alkaline environments can also be excellent.

4. Conclusions

In this paper, industrial solid waste GGBS and HCFA are used as precursors to prepare alkali-activated GGBS/HCFA composite cementing materials with Tuokexun desert sand. By adjusting the modulus and alkali equivalent of aqueous glass, HCFA dosage, and parameters such as maintenance temperature and maintenance time, the hydration mechanism of the material is systematically investigated in relation to the mechanical properties, and the collodion prepared with the optimal ratio is selected for durability analysis. The full text is summarized as follows:
(1) Alkali-activated GGBS/HCFA composite cementitious materials were prepared with Tuokexun desert sand via composite activation. The optimal mix (aqueous glass modulus 1.2, alkali equivalent 6%, HCFA 20%, and w/b 0.5) achieved 52.8 MPa compressive and 9.5 MPa flexural strengths. Compressive strength decreased with increasing HCFA, while flexural strength peaked at 20%; optimal curing was 70 °C for 12 h. XRD/FTIR indicated the highest C-(A)-S-H formation, and alkali equivalent had a greater effect than aqueous glass modulus—activation improved at 4% but “alkaline water damage” appeared at 8% (consistent with HCFA’s higher CaO/activity).
(2) High-temperature calcination caused mass loss and reductions in compressive/flexural strength with increasing temperature, attributable (by XRD) to gel dehydration and phase changes. Significant degradation was evident by 600 °C; at 800 °C, the C-(A)-S-H gel was destroyed, Ca–Al phases formed, surface cracks developed, and strength dropped sharply.
(3) With increasing H2SO4 concentration, mass, flexural strength, and compressive strength decreased. XRD/SEM showed gel decomposition, gypsum formation covering the surface, and widening cracks; higher acid concentrations produced more gypsum. The material is acid-resistant in mildly acidic environments.
(4) In NaOH solutions, low concentrations led to slight mass gain and minor strength loss, while high concentrations reduced both mass and strength and induced cracking. Overall, the material exhibits excellent alkali tolerance.
(5) Limitations and future directions: This study used single-source GGBS, HCFA, and Tuokexun desert sand and optimized mixes under short-term, elevated-temperature curing; variability in raw material chemistry and grading, ambient/field curing, long-term hydration, shrinkage/creep, and rheology/workability were not systematically addressed. Durability was assessed for thermal exposure and H2SO4/NaOH solutions; resistance to chloride ingress, carbonation, sulfate attack (Na2SO4/MgSO4), freeze–thaw and wet–dry cycling, and long-term leaching/efflorescence requires verification. Microstructural characterization was primarily XRD/FTIR/SEM; future work should incorporate quantitative gel chemistry and pore structure/kinetics (e.g., MIP, NMR, and isothermal calorimetry), optimize activator formulations for lower alkalinity and cost/CO2, evaluate alternative aggregates or fiber reinforcement, and undertake life-cycle assessment, scale-up, and field trials.

Author Contributions

Conceptualization, Y.S. and Y.H.; methodology, R.L., M.Z. and B.Y.; validation, M.L.; formal analysis, Y.S. and M.Z.; investigation, H.W., T.L. and Y.H.; resources, R.L. and Y.H.; data curation, M.Z.; writing—original draft preparation, H.W. and M.L.; writing—review and editing, Y.S.; supervision, T.L.; project administration, B.Y.; All authors have read and agreed to the published version of the manuscript.

Funding

This work was supported by the key research and development projects Xinjiang Uygur Autonomous Region (2023B03011-2) and the Tianshan Talents Project in Xinjiang Uygur Autonomous Region (2024TSYCCX0020).

Institutional Review Board Statement

Not applicable.

Informed Consent Statement

Not applicable.

Data Availability Statement

The data presented in this study are available on request from the corresponding authors.

Conflicts of Interest

Yi Si, Runtao La, Ming Zhou and Meng Li was employed by the company XPCC Surveying Designing Institute Group Co., Ltd.) and Bo Yang was employed by the company (Xinjiang Xinlu Shunjie Engineering Consulting Co., Ltd.). Hong Wu, Ting Liu, Yong Huang hereby declare for the record that this study was conducted in the absence of any business or financial relationship that could be construed as conflicts of interest.

References

  1. Gluth, G.J.G.; Mundra, S.; Henning, R. Chloride binding by layered double hydroxides (LDH/AFm phases) and alkali-activated slag pastes: An experimental study by RILEM TC 283-CAM. Mater. Struct. 2024, 57, 72. [Google Scholar] [CrossRef]
  2. Habert, G.; Miller, S.A.; John, V.M.; Provis, J.L.; Favier, A.; Horvath, A.; Scrivener, K.L. Environmental impacts and decarbonization strategies in the cement and concrete industries. Nat. Rev. Earth Environ. 2020, 1, 559–573. [Google Scholar] [CrossRef]
  3. Zakira, U.; Zheng, K.; Xie, N.; Birgisson, B. Development of high-strength geopolymers from red mud and blast furnace slag. J. Clean. Prod. 2023, 383, 135439. [Google Scholar] [CrossRef]
  4. Chen, J.; Guan, X.; Zhu, M.; Gao, J.; Zhao, D. Mechanism on Activation of Coal Gangue Admixture. Adv. Civ. Eng. 2021, 2021, 5436482. [Google Scholar] [CrossRef]
  5. Abudawaba, F.; Gomaa, E.; Gheni, A.A.; Feys, D.; ElGawady, M.A. Evaluation of fresh properties of high calcium content fly ash-based alkali-activated 3D-Printed mortar. J. Build. Eng. 2025, 104, 112244. [Google Scholar] [CrossRef]
  6. Long, Q.; Zhao, Y.; Zhang, B.; Yang, H.; Luo, Z.; Li, Z.; Zhang, G.; Liu, K. Interfacial Behavior of Slag, Fly Ash, and Red Mud-Based Geopolymer Mortar with Concrete Substrate: Mechanical Properties and Microstructure. Buildings 2024, 14, 652. [Google Scholar] [CrossRef]
  7. Rathee, M.; Misra, A.; Kolleboyina, J.; Sarma, P.S.K. Study of mechanical properties of geopolymer mortar prepared with fly ash and GGBS. Mater. Today Proc. 2023, 93, 377–386. [Google Scholar] [CrossRef]
  8. Han, F.; Zhu, Z.; Zhang, H.; Li, Y.; Fu, T. Effect of Steel Slag on the Properties of Alkali-Activated Slag Material: A Comparative Study with Fly Ash. Materials 2024, 17, 2495. [Google Scholar] [CrossRef]
  9. Wang, Y.; Zhang, N.; Zhou, Y.; Li, C.; Zhao, J.; Zhang, Y. Photocatalysis in alkali activated cementitious materials. J. Build. Eng. 2022, 46, 103749. [Google Scholar] [CrossRef]
  10. Sun, L.; Shicheng, S. A Review of the Current Status of Research on Alkali-Activated Cementitious Materials. Green Build. Mater. 2019, 11, 16+18. [Google Scholar] [CrossRef]
  11. Zhang, S.; Li, J.; Chen, Z.; He, Y.; Cui, X.-M.; Liu, J.-H.; Liu, Q. Design, preparation, and performance of marine resource-based alkali-activated cementitious materials. J. Build. Eng. 2024, 97, 110822. [Google Scholar] [CrossRef]
  12. Amer, I.; Kohail, M.; El-Feky, M.; Rashad, A.; Khalaf, M.A. A review on alkali-activated slag concrete. Ain Shams Eng. J. 2021, 12, 1475–1499. [Google Scholar] [CrossRef]
  13. Zhao, Y. Research on road performance of alkali-activated cementitiousmaterials mixed with fly ash. Shangdong Jiaotong Keji 2023, 4, 44–47. [Google Scholar]
  14. Khajeh, A.; Ebrahimi, S.A.; MolaAbasi, H.; Chenari, R.J.; Payan, M. Effect of EPS beads in lightening a typical zeolite and cement-treated sand. Bull. Eng. Geol. Environ. 2021, 80, 8615–8632. [Google Scholar] [CrossRef]
  15. Ariyadasa, P.W.; Manalo, A.C.; Lokuge, W.; Aravinthan, V.; Gerdes, A.; Kaltenbach, J.; Galvan, B.A. Macro and microstructural evolution of low-calcium fly ash-based geopolymer mortar exposed to sulphuric acid corrosion. Cem. Concr. Res. 2024, 178, 107436. [Google Scholar] [CrossRef]
  16. Pan, Z.; Tao, Z.; Cao, Y.-F.; George, L.; Wuhrer, R. High-temperature performance of alkali-activated binders of fly ash and calcium aluminate. Ceram. Int. 2023, 49, 14389–14398. [Google Scholar] [CrossRef]
  17. Mohamed, O.A. Effects of the Curing Regime, Acid Exposure, Alkaline Activator Dosage, and Precursor Content on the Strength Development of Mortar with Alkali-Activated Slag and Fly Ash Binder: A Critical Review. Polymers 2023, 15, 1248. [Google Scholar] [CrossRef] [PubMed]
  18. Nosrati, S.A.; Negahdar, A.; Negahdar, H. Stabilizing the clayey sand contaminated with heavy metals by zeolite and rice husk ash absorbents. Arab. J. Geosci. 2021, 14, 1907. [Google Scholar] [CrossRef]
  19. Zanj, A.; Chenari, M.J.; Zolfalizadeh, M.; Salimi, M.; Hosseinpour, I.; Payan, M. Experimental study on freeze-thaw durability of high plasticity clay treated with waste glass powder and waste tire textile fibers. Results Eng. 2025, 27, 106221. [Google Scholar] [CrossRef]
  20. Adeshokan, M.O.; Arum, C. Comparison between the Compressive Strength of Binary and Ternary Alkaline-activated Pozzolanic Concrete. J. Appl. Sci. Environ. Manag. 2023, 27, 747–752. [Google Scholar] [CrossRef]
  21. Fang, G.; Zhang, M. Multiscale micromechanical analysis of alkali-activated fly ash-slag paste. Cem. Concr. Res. 2020, 135, 106141. [Google Scholar] [CrossRef]
  22. Alomayri, T. Mechanical and microstructure characteristics of alkali-activated coal ash with α-phase ultrafine Al2O3 nanoparticles and basalt fibres. J. Taibah Univ. Sci. 2022, 16, 646–659. [Google Scholar] [CrossRef]
  23. Zhang, D.; Zhang, T.; Yang, Q. Mechanical Properties and Damage Layer Thickness of Green Concrete under a Low-Temperature Environment. Materials 2022, 15, 7409. [Google Scholar] [CrossRef]
  24. Kancir, I.V.; Serdar, M. Contribution to Understanding of Synergy between Red Mud and Common Supplementary Cementitious Materials. Materials 2022, 15, 1968. [Google Scholar] [CrossRef]
  25. Surehali, S.; Simon, A.; Ramasamy, R.K.; Neithalath, N. A Comparison of the Effect of Activator Cations (Sodium and Potassium) on the Fresh and Hardened Properties of Mine Tailing-Slag Binders. Constr. Mater. 2023, 3, 389–404. [Google Scholar] [CrossRef]
  26. Sitarz, M.; Castro-Gomes, J.; Hager, I. Strength and Microstructure Characteristics of Blended Fly Ash and Ground Granulated Blast Furnace Slag Geopolymer Mortars with Na and K Silicate Solution. Materials 2022, 15, 211. [Google Scholar] [CrossRef]
  27. Kurda, R.; Silva, R.V.; de Brito, J. Incorporation of Alkali-Activated Municipal Solid Waste Incinerator Bottom Ash in Mortar and Concrete: A Critical Review. Materials 2020, 13, 3428. [Google Scholar] [CrossRef] [PubMed]
  28. Gao, X.; Zhou, Q.; Wang, Y.; Qi, T.; Shen, L.; Liu, G.; Peng, Z.; Li, X. Coal fly ash resource utilization: Structure of siloxy group of high-modulus sodium silicate solution. Process Saf. Environ. Prot. 2023, 171, 396–404. [Google Scholar] [CrossRef]
  29. Rosas-Casarez, C.; Arredondo-Rea, S.; Ramos-Ortiz, G.; Corral-Higuera, R.; Cruz-Enríquez, A.; Gómez-Soberón, J.; Velusamy, J.; Zárraga-Núñez, R.; Campos-Gaxiola, J. Excitation-dependent photoluminescent properties in geopolymers with addition of Eu2+ Dy3+ co-doped strontium silicoaluminate. Mater. Lett. 2019, 250, 170–173. [Google Scholar] [CrossRef]
  30. Sakthieswaran, N.; Moorthy, N.; Renisha, M.; Chinnadurai, M. Optimization of Strength Properties of Reactive Powder Concrete by Response Surface Methodology. J. Shanghai Jiaotong Univ. 2024, 29, 900–908. [Google Scholar] [CrossRef]
  31. He, S. The application of high calcium fly ash in modern concrete. Sichuan Build. Mater. 2020, 46, 15–16. [Google Scholar]
  32. Jiang, T.; Jin, Y. Phase Analysis of Alkali-Activated Slag Hybridized with Low-Calcium and High-Calcium Fly Ash. Sustainability 2022, 14, 3767. [Google Scholar] [CrossRef]
  33. Feng, J.; Zhang, Z.; Guan, W.; Wang, W.; Xu, X.; Song, Y.; Liu, H.; Su, H.; Zhao, B.; Hou, D. Review of the Backfill Materials in Chinese Underground Coal Mining. Minerals 2023, 13, 473. [Google Scholar] [CrossRef]
  34. Gunasekara, C.; Atzarakis, P.; Lokuge, W.; Law, D.W.; Setunge, S. Novel Analytical Method for Mix Design and Performance Prediction of High Calcium Fly Ash Geopolymer Concrete. Polymers 2021, 13, 900. [Google Scholar] [CrossRef] [PubMed]
  35. Chai, S.Y.; Li, Y.; Zhang, X.F.; Gang, L. Study on the Preparation and Strength Characteristics of High-Calcium Fly Ash Geopolymer. Wall Mater. Innov. Build. Energy Effic. 2019, 11, 70–72. [Google Scholar] [CrossRef]
  36. GB/T 18046-2017; Ground Granulated Blast Furnace Slag Used for Cement, Mortar and Concrete. Standardization Administration of the People’s Republic of China: Beijing, China, 2018.
  37. Yang, N. The physical and chemical basis of alkali-gel materials (I). J. Chin. Ceram. Soc. 1996, 209–215. [Google Scholar]
  38. Yang, N. The physical and chemical basis of alkali-gel materials (II). J. Chin. Ceram. Soc. 1996, 459–465. [Google Scholar]
  39. GB/T 50081-2019; Standard for Test Methods of Concrete Physical and Mechanical Properties. Ministry of Housing and Urban-Rural Development of the People’s Republic of China: Beijing, China, 2019.
  40. Verma, N.K.; Rao, M.C.; Kumar, S. Effect of Curing Regime on Compressive Strength of Geopolymer Concrete. IOP Conf. Ser. Earth Environ. Sci. 2022, 982, 012031. [Google Scholar] [CrossRef]
  41. Barabanshchikov, Y.G.; Usanova, K.Y.; Umarov, S.; Salimbayev, M.; Bazarov, D. Properties of concrete containing high-calcium fly ash artificial aggregate. E3S Web Conf. 2023, 401, 03016. [Google Scholar] [CrossRef]
  42. Zhu, J.; Wang, Z.; Tao, Y.; Ju, L.; Yang, H. Macro–micro investigation on stabilization sludge as subgrade filler by the ternary blending of steel slag and fly ash and calcium carbide residue. J. Clean. Prod. 2024, 447, 141496, ISSN 0959-6526. [Google Scholar] [CrossRef]
  43. Li, Z.; Xiang, E.; Yang, C.; Huang, H.; Jiang, J.; Lyu, J. Radial variation in the sorption behavior of water-saturated bamboo with graded fibrous structure. Constr. Build. Mater. 2025, 494, 143324, ISSN 0950-0618. [Google Scholar] [CrossRef]
  44. Wu, J.; Chen, J.; Tian, X.; Li, J.; Gao, W.; Yue, Y.; Kang, J. Influence of Al2O3/SiO2 Ratio on the Structure and Properties of Na+/K+ Ion Exchange Na2O-MgO-Al2O3-SiO2 Glasses. J. Wuhan Univ. Technol. Mater. Sci. Ed. 2024, 39, 606–612. [Google Scholar] [CrossRef]
  45. Viet, H.V.; Le Van, Q. Early strength enhancement of high-volume fly ash mortar using accelerating admixtures. Transp. Commun. Sci. J. 2024, 75, 1149–1158. [Google Scholar] [CrossRef]
  46. GB/T 17671-2021; Test Method of Cement Mortar Strength (ISO Method). Standardization Administration of the People’s Republic of China: Beijing, China, 2021.
  47. Khajeh, A.; Chenari, R.J.; Payan, M.; MolaAbasi, H. Assessing the effect of lime-zeolite on geotechnical properties and microstructure of reconstituted clay used as a subgrade soil. Phys. Chem. Earth 2023, 132, 103501. [Google Scholar] [CrossRef]
  48. Li, S.; Huang, Y.; Sun, J.; Cui, Q.; Yu, R.; Liu, Y. Mechanisms of concentration control alkali activated fly ash stabilized saline soil in seasonally frozen regions. Sci. Rep. 2025, 15, 285. [Google Scholar] [CrossRef]
  49. Kaya, H.; Ngo, D.; Gin, S.; Kim, S.H. Spectral changes in Si–O–Si stretching band of porous glass network upon ingress of water. J. Non-Cryst. Solids 2020, 527, 119722. [Google Scholar] [CrossRef]
  50. Li, C.; Li, G.; Chen, D.; Gao, K.; Cao, Y.; Zhou, Y.; Mao, Y.; Fan, S.; Tang, L.; Jia, H. The Effects of Diatomite as an Additive on the Macroscopic Properties and Microstructure of Concrete. Materials 2023, 16, 1833. [Google Scholar] [CrossRef]
  51. Zuo, Y.; Nedeljković, M.; Ye, G. Pore solution composition of alkali-activated slag/fly ash pastes. Cem. Concr. Res. 2019, 115, 230–250. [Google Scholar] [CrossRef]
  52. Zhu, X.; Zhang, Z.; Luan, M.; Yang, K.; Li, J. Temperature-sensitively dissolving of GGBS in neutral and alkali media. Constr. Build. Mater. 2024, 418, 135353. [Google Scholar] [CrossRef]
  53. Liu, X.; Feng, P.; Li, W.; Geng, G.; Huang, J.; Gao, Y.; Mu, S.; Hong, J. Effects of pH on the nano/micro structure of calcium silicate hydrate (C-S-H) under sulfate attack. Cem. Concr. Res. 2021, 140, 106306. [Google Scholar] [CrossRef]
  54. Zhang, F.; Xi, X.; Yang, S. Research Progress in Corrosion Mechanism of Reinforced Alkali-Activated Concrete Structures. Corros. Mater. Degrad. 2021, 2, 641–656. [Google Scholar] [CrossRef]
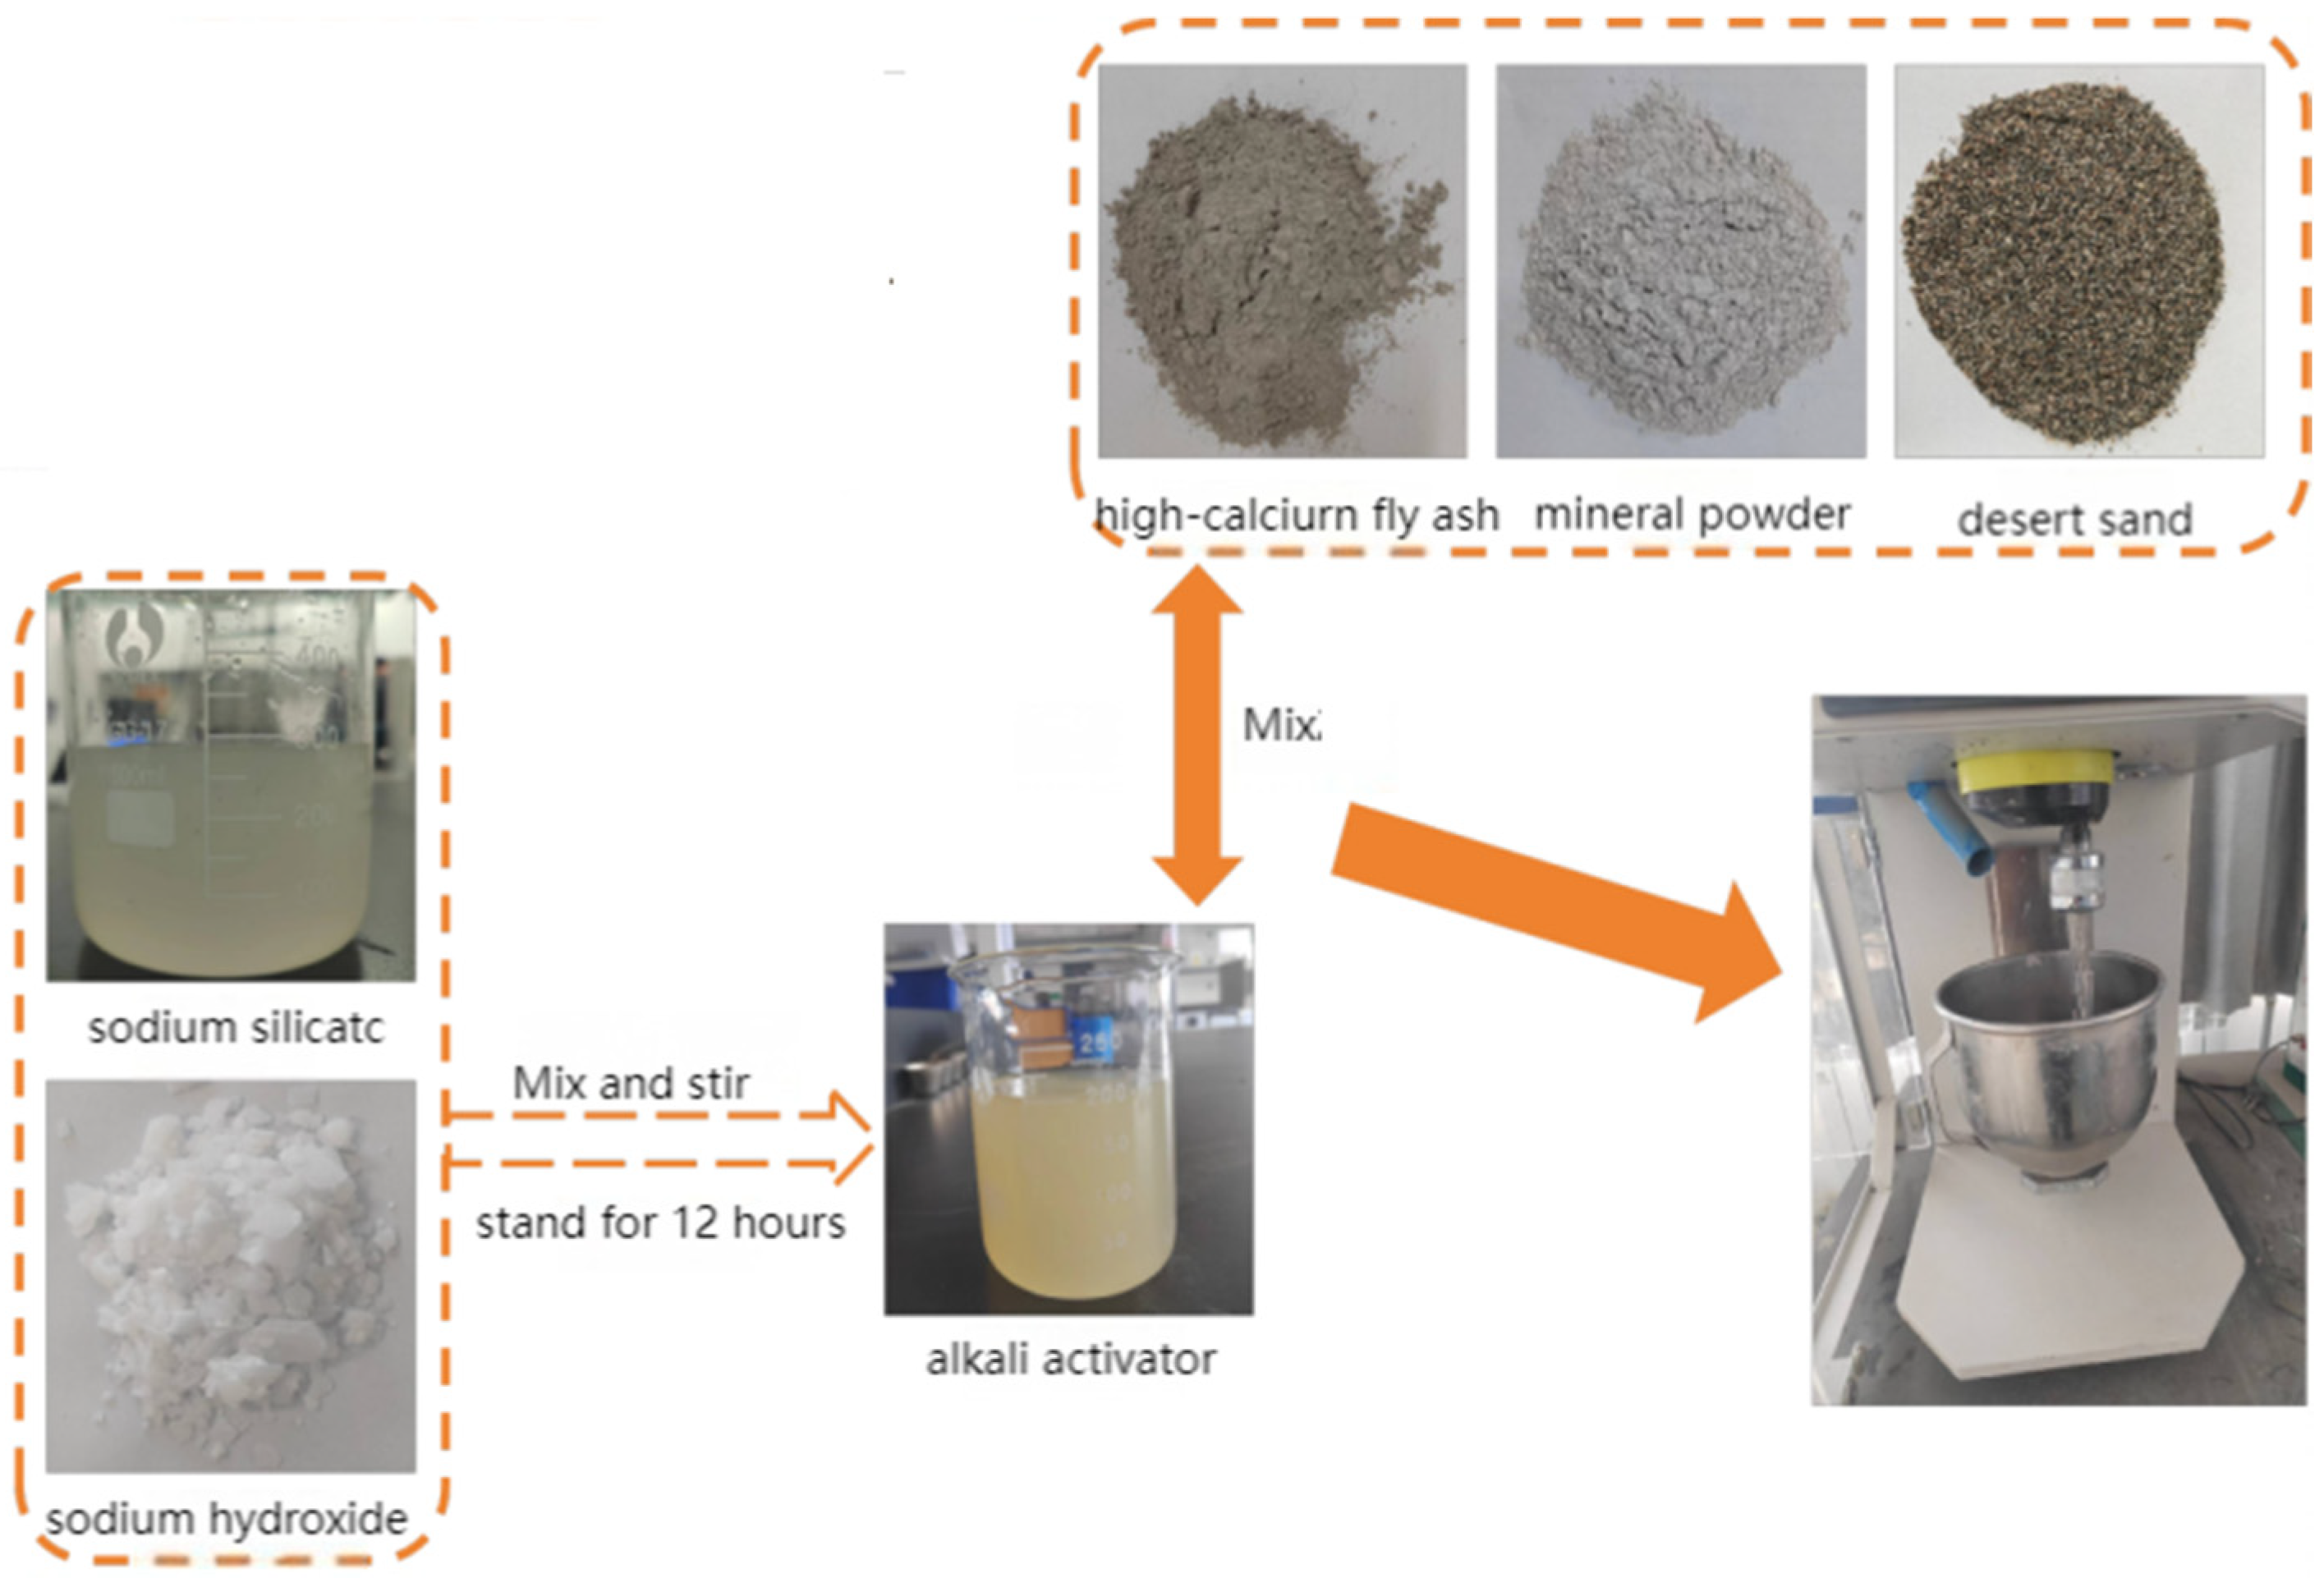
Figure 1. The sample preparation process.
Buildings 15 03265 g001
Figure 2. SEM images of (a) FA, (b) GGBS, and (c) TD.
Buildings 15 03265 g002
Figure 3. XRD spectra of GGBS, HCFA, and Tuokexun desert sand: (a) GGBS, (b) HCFA, and (c) Tuokexun desert sand.
Buildings 15 03265 g003
Figure 4. XRD plots of composite cementitious materials with 20% HCFA: (a) −8% alkali equivalent at different moduli for 28 d; (b) modulus 1.2 at different alkali equivalents for 28 d; (c) moduli at different ages; and (d) moduli at different amounts of HCFA for 28 d.
Buildings 15 03265 g004
Figure 5. FTIR of composite cementitious materials with 20% HCFA: (a) −8% alkali equivalent at different moduli for 28 d; (b) modulus 1.2 at different alkali equivalents for 28 d; (c) moduli at different ages; and (d) moduli at different HCFA amounts for 28 d.
Buildings 15 03265 g005
Figure 6. SEM of HCFA percentage of 20% composite cementitious material maintained for 28 d. (a,b) 1.4 and 1.6 moduli; (c,d) 4% and 8% alkali equivalent; (eg) 3 d, 7 d, and 28 d; and (hj) 0%, 30%, and 40% HCFA.
Buildings 15 03265 g006
Figure 7. Effect of the aqueous glass modulus and alkali equivalent on the flexural and compressive strength of AACMs with 20% HCFA: (a) aqueous glass modulus 1.2; (b) aqueous glass modulus 1.4; and (c) aqueous glass modulus 1.6.
Buildings 15 03265 g007
Figure 8. Effect of high-calcium fly ash dosage on the flexural compressive strength of alkali-activated GGBS/HCFA.
Buildings 15 03265 g008
Figure 9. Effect of temperature on the flexural and compressive strength of AACMs with 20% HCFA.
Buildings 15 03265 g009
Figure 10. Effect of autoclaving time on the flexural and compressive strength of AACMs with 20% HCFA.
Buildings 15 03265 g010
Figure 11. XRD plot after high-temperature testing of the composite gel material.
Buildings 15 03265 g011
Figure 12. XRD plot of the composite gentitious material after soaking in H2SO4 for 28 d.
Buildings 15 03265 g012
Figure 13. The composite gentitious material was soaked for 28 d in NaOH after XRD.
Buildings 15 03265 g013
Figure 14. FTIR profiles after high-temperature testing of the composite cemented material.
Buildings 15 03265 g014
Figure 15. FTIR profiles after soaking H2SO4 in composite cemented materials for 28 d.
Buildings 15 03265 g015
Figure 16. FTIR profiles of NaOH for 28 d.
Buildings 15 03265 g016
Figure 17. The SEM diagram of the composite cementitious material at high temperature.
Buildings 15 03265 g017
Figure 18. SEM plot of H2SO4 for 28 d.
Buildings 15 03265 g018
Figure 19. SEM plot of NaOH for 28 d.
Buildings 15 03265 g019
Figure 20. Change in mass, flexural strength, and compressive strength of alkali-activated GGBS/HCFA composite materials: (a) mass change with temperature; (b) HCFA compressive strength and flexural strength change with temperature.
Buildings 15 03265 g020
Figure 21. Rate of mass change, flexural strength, and compressive strength of the alkali-activated GGBS/HCFA composite with H2SO4 concentration: (a) mass rate of change; (b) flexural strength and compressive strength.
Buildings 15 03265 g021
Figure 22. Rate of mass change, flexural strength, and compressive strength of the alkali-stimulated GGBS/HCFA composite with NaOH concentration: (a) mass change; (b) flexural strength and compressive strength.
Buildings 15 03265 g022
Table 1. Indicators of physical properties of GGBS.
ParameterGB/T 18046-2017The Detection Value
Specific area (m2/kg)≥400429.00
The flow (%)≥9598.00
Activity index/%(28 d)≥9598.50
Density (g/cm3)≥2.83.10
Loss on ignition %≤1.00.84
Water content %≤1.00.45
Table 2. Chemical composition of mineral powder, HCFA, and Tuokexun natural desert sand.
Chemical CompositionSiO2Al2O3CaOFe2O3MgOK2OTiO2SO3Na2O
GGBS34.5017.7034.001.036.01--0.04-
HCFA39.1219.7128.426.621.321.660.870.84-
Tuokexun Desert Sand73.1014.632.692.131.372.96--2.70
Table 3. Tuokexun natural desert sand grading.
Mesh Size (mm)0.0750.150.30.61.182.364.75
Percentage of screening (%)0.61.22.819.189.499.0100
Table 4. Test ratio of the GGBS/HCFA composite system.
NumberGGBS (%)HCFA (%)Modulus of Aqueous Glass (n)Base Equivalent (%)Alkaline Stimulating Agent (g)Water (g)
180201.2481.74182
280201.26123.46160.34
380201.28164.21138.78
480201.4481.74182
580201.46123.46160.34
680201.48164.21138.78
780201.6481.74182
880201.66123.46160.34
980201.68164.21138.78
Note: The amount of alkali-stimulating agent is calculated according to the alkali equivalent; the solid content of aqueous glass is 35%. The amount of water used takes into account the water in the aqueous glass and the water produced by the dissolution of NaOH.
Disclaimer/Publisher’s Note: The statements, opinions and data contained in all publications are solely those of the individual author(s) and contributor(s) and not of MDPI and/or the editor(s). MDPI and/or the editor(s) disclaim responsibility for any injury to people or property resulting from any ideas, methods, instructions or products referred to in the content.