Article

Aseismic Experimental Research on Safety-Belt System of a Low-Gravity-Center Cable-Stayed Bridge

1
Department of Civil Engineering, Beijing University of Technology, Beijing 100124, China
2
Key Laboratory of Earthquake Engineering and Structural Retrofit of Beijing, Beijing 100124, China
3
School of Civil Engineering, Southeast University, Nanjing 211189, China
4
School of Civil and Transportation Engineering, Beijing University of Civil Engineering and Architecture, Beijing 102616, China
*
Author to whom correspondence should be addressed.
Buildings 2025, 15(18), 3268; https://doi.org/10.3390/buildings15183268
Submission received: 4 July 2025 / Revised: 29 August 2025 / Accepted: 1 September 2025 / Published: 10 September 2025
(This article belongs to the Special Issue Advances and Applications in Structural Vibration Control)

Abstract

The seismic performance of low-gravity-center cable-stayed bridges is influenced by their structural system. This paper introduces a novel anti-seismic structural system designed to enhance the earthquake resistance of low-gravity-center cable-stayed bridges while reducing secondary internal forces during operation. A total of 47 groups of shaking table tests were conducted, considering four types of seismic waves and acceleration levels. In the shaking table tests, a safety-belt device was constructed and integrated into a scale model of a low-gravity-center cable-stayed bridge. The anti-seismic performance of the safety-belt system was validated by comparing the shaking table test results of the asymmetric restraint system and floating system reported in previous studies. The experimental findings revealed that the strain response at the tower bottom and the displacement response at the tower top were lower in the safety-belt system model. The safety-belt system shows potential for application in low-gravity-center cable-stayed bridges to reduce earthquake impacts. Furthermore, this study elucidates the damage mechanism of low-gravity-center cable-stayed bridges equipped with the safety-belt system under seismic loading, providing references for optimizing the anti-seismic design of such bridges.

1. Introduction

With the development of urban bridges, there are more and more cable-stayed bridges without navigation needs. Among them, the number of low-gravity-center cable-stayed bridges is also increasing, such as China’s Jinan Third Bridge and Songhua River Bridge [1]. With the proposal of the new structural concept of the low-gravity-center cable-stayed bridge, it is urgent to carry out in-depth research on the differences between its structural characteristics and those of the conventional cable-stayed bridge. Based on the principle of structural mechanics, this study proposes determination criteria for the low-center-gravity cable-stayed bridge: Under the action of an earthquake, in the case that the ratio of the tower bottom moment in the floating system (FS) to that in the fixed articulated system (FAS) exceeds a certain threshold, the cable-stayed bridge can be identified as a low-gravity-center cable-stayed bridge [2].
The seismic analysis and design of cable-stayed bridges are critical areas of research [3]. In bridge engineering, the twin-tower suspension bridge is usually divided into three structural systems: asymmetric constraint system, FAS, and FS. The asymmetric constraint system is usually unfavorable to the seismic performance of a double-tower suspension bridge. In contrast, the FAS can improve the seismic resistance of the bridge through the coordinated force of the two towers. However, it cannot relieve the secondary internal force generated by the deformation of the girder under the action of hot load. Although the FS can effectively solve the problem of secondary internal force, it will lead to significant displacement response [4].
In recent years, numerous studies have investigated the seismic performance of conventional cable-stayed bridges under strong earthquakes through shaking table tests and even nonlinear analysis [5,6,7,8,9]. The seismic performance of these bridges is generally evaluated based on two aspects: internal forces and displacement [10]. A better seismic performance is characterized by lower internal forces and displacements. However, these two aspects often exhibit a trade-off under seismic loading; reducing internal force responses typically results in increased displacements and vice versa [11].
Many researchers have proposed passive energy dissipation devices for cable-stayed bridges, tailored to the dynamic characteristics of different structural systems. Generally, passive energy dissipation devices are widely applied in the seismic control and mitigation of cable-stayed bridges. Various types of passive control systems, such as friction dampers, metallic yield dampers, viscous fluid dampers, and viscoelastic dampers, have been employed [12,13]. Some studies have also explored anti-seismic systems that combine Transverse Steel Dampers (TSDs) with conventional sliding bearings [14,15,16]. However, these passive energy dissipation devices often involve complex installation processes and high fabrication costs [17,18,19,20,21].
Shaking table testing remains one of the most effective methods for assessing the performance of passive energy dissipation devices and studying the seismic response of scaled models under different seismic waves [21,22,23,24,25].
Later studies introduced the concept of the low-gravity-center cable-stayed bridge, focusing on the transmission path of the horizontal inertia force of the girder [2]. Criteria for identifying low-gravity-center cable-stayed bridges were established, based on simplified calculations of the fundamental frequency of cable-stayed bridges combined with response spectrum analysis [1]. These studies reported that the dynamic properties of low-gravity-center cable-stayed bridges differ from those of conventional cable-stayed bridges [26,27].
Furthermore, the nonlinear seismic response of cable-stayed bridges is a crucial issue in assessing structural safety [28,29]. For low-gravity-center cable-stayed bridges, there is a lack of real earthquake testing and nonlinear seismic response studies. Research on the structural damage of low-gravity-center cable-stayed bridges under strong earthquakes, particularly in terms of longitudinal seismic damage, is scarce [5].
In view of the above technical problems, this study proposes a system conversion scheme (safety-belt system, SBS) based on the belt connection device. This scheme effectively solves the problem of cooperative force under seismic load in an asymmetric constraint system (ARS) and eliminates the secondary internal force effect caused by deformation in FAS under temperature load. Additionally, the low-gravity-center cable-stayed bridge with the FAS is better than the FS in the control of internal force at the base of the tower [2]. In addition, it is not costly for the manufacturing of a safety-belt device fabricated by steel material, which has significant economic advantages.
To investigate the damage mechanism of the low-gravity-center cable-stayed bridges with a SBS under strong earthquakes, this study fabricated a safety-belt device, constructed a 1:75 scale model of a low-gravity-center cable-stayed bridge, and conducted 47 groups of shaking table tests. The safety-belt device was installed between tower and girder. The experiment considered four types of seismic waves (El Centro, TianJin, EMC_FAIRVIE, and site-specific artificial wave) and different acceleration levels (PGA ranging from 0.1 g to 1.4 g).
The safety-belt system’s effectiveness was validated by comparing the shaking table test results from this study with those of the ARS and FS reported in previous research. The damage mechanism of low-gravity-center cable-stayed bridges under strong earthquakes was observed through the grading of seismic wave loading. This safety-belt system has potential in term of enhancing the aseismic performance of low-gravity-center cable-stayed bridges, and this study can provide a reference for optimizing the seismic design of such bridges.

2. Safety-Belt System

2.1. Design of Safety-Belt Device

The safety-belt system (SBS) is a vibration-reducing restraint system. It means a safety-belt device is installed at the tower–girder connection area of non-fixed pier on an asymmetric restraint system (ARS). The safety-belt device can be activated by dynamic acceleration [30]. This device consists of a safety-belt tie, a connecting block, a locking shaft, and a fixing platen, as illustrated in Figure 1a.
During normal operation, the locking shaft remains in position A, allowing the safety-belt tie to move longitudinally with the beam. This design accommodates the relative displacement between the bridge tower and the main girder caused by daily temperature variations. At this stage, the locking shaft rolls within position A without dropping to position B, keeping the longitudinal connection between the tower and the girder unrestricted until the acceleration of the lower crossbeam reaches a predefined threshold for the first time. When an earthquake occurs, the ground motion acceleration causes the locking shaft to fall from position A to the locked position B. This action restricts the relative displacement between the girder and the bridge tower, thereby enhancing the seismic performance of the low-gravity-center cable-stayed bridge. The safety-belt device used in this study was fabricated as shown in Figure 1b,c.

2.2. Mechanical Principles

The mechanical principle of the safety-belt device is illustrated in Figure 2a. The relationship between the force and the relative displacement of the safety-belt device, corresponding to the locking process between the girder and the lower crossbeam, is depicted in Figure 2b.
The connection between girder and lower crossbeam will not be fixed until the acceleration of the girder exceeds the acceleration threshold ak (Stage I). Once this threshold is exceeded, the safety-belt device will be activated (Stage II), causing the locking shaft to roll from position A to position B.
If the relative displacement between girder and lower crossbeam exceeds Δ1, an uncompleted locked connection is established (Stage II). At this moment, the restraint force Fs is mainly from the friction between the safety-belt tie and the locking shaft (at position B). When the relative displacement reaches Δ2, a completed locked connection is established (Stage III). At this moment, the restraint force Fs is mainly offered by the deformation of the locked safety-belt tie. Once the force that the safety-belt tie is enduring exceeds the ultimate strength, the restraint force Fs reaches the maximum (Stage IV). The constitutive equations of the safety-belt device are shown in Equation (1):
F ( t ) = 0 0 K s ( d t Δ 1 ) K b ( d t Δ 2 ) F s ; ; ; ; ; t < t * t t * t t * t t * t t * , , , , d t < Δ 1 Δ 1 < d t Δ 2 d t < Δ 2 d t Δ 2 + F s / K b
where F(t) is the force exerted on the safety-belt device; t is the dynamic acceleration action time; t* is the moment when the safety-belt device is activated; and it is the relative displacement between tower and girder.

3. Experiment Design

3.1. Design of Experimental Structure

3.1.1. Similarity Ratio

To ensure that the experimental structure exhibited the same dynamic characteristics as those observed in previous studies, the vertical compression–strain similarity ratio between the test model and the real bridge structure was set to 1.0, as referenced in earlier research [26]. Considering the dimensions and load capacity of the shaking table, the similarity ratio between the test model and the prototype structure was determined to be 1:75. The similarity ratio of the elastic modulus for the concrete main tower was set at 0.3, while the elastic modulus similarity ratio for the steel girder was 1.0. Additionally, the acceleration similarity ratio was maintained at 1.0, as shown in Table 1.

3.1.2. Experimental Structure

The dynamic characteristics of a low-gravity-center cable-stayed bridge are significantly influenced by the different connection types between the tower and the girder. Additionally, the stress distribution within the main tower is heavily impacted by the type of restraint used between the tower and the girder.
To enable a meaningful comparison between the experimental results in this paper and those from previous studies, and to validate the advantages of the SBS, the experimental structure was designed to closely resemble the structure used in earlier research [26]. The seismic systems in the earlier research are the ARS and the FS.
It facilitates a comprehensive demonstration of the SBS’s advantages by comparing SBS with ARS and FS. The structural system of the SBS is similar to that of the ARS before the safety-belt device is activated. Comparison with the ARS can intuitively reflect the advantages of the SBS. FS as a traditional structural system, has limitations in terms of seismic performance, and has a potential risk of girder collision resulting from excessive displacement response under great earthquake action. The comparison between SBS and FS could provide an experimental reference for expanding the experiment record of the low-gravity-center cable stayed bridges with FS.
The types of restraints and their corresponding designations for towers in different structural systems are detailed in Table 2.
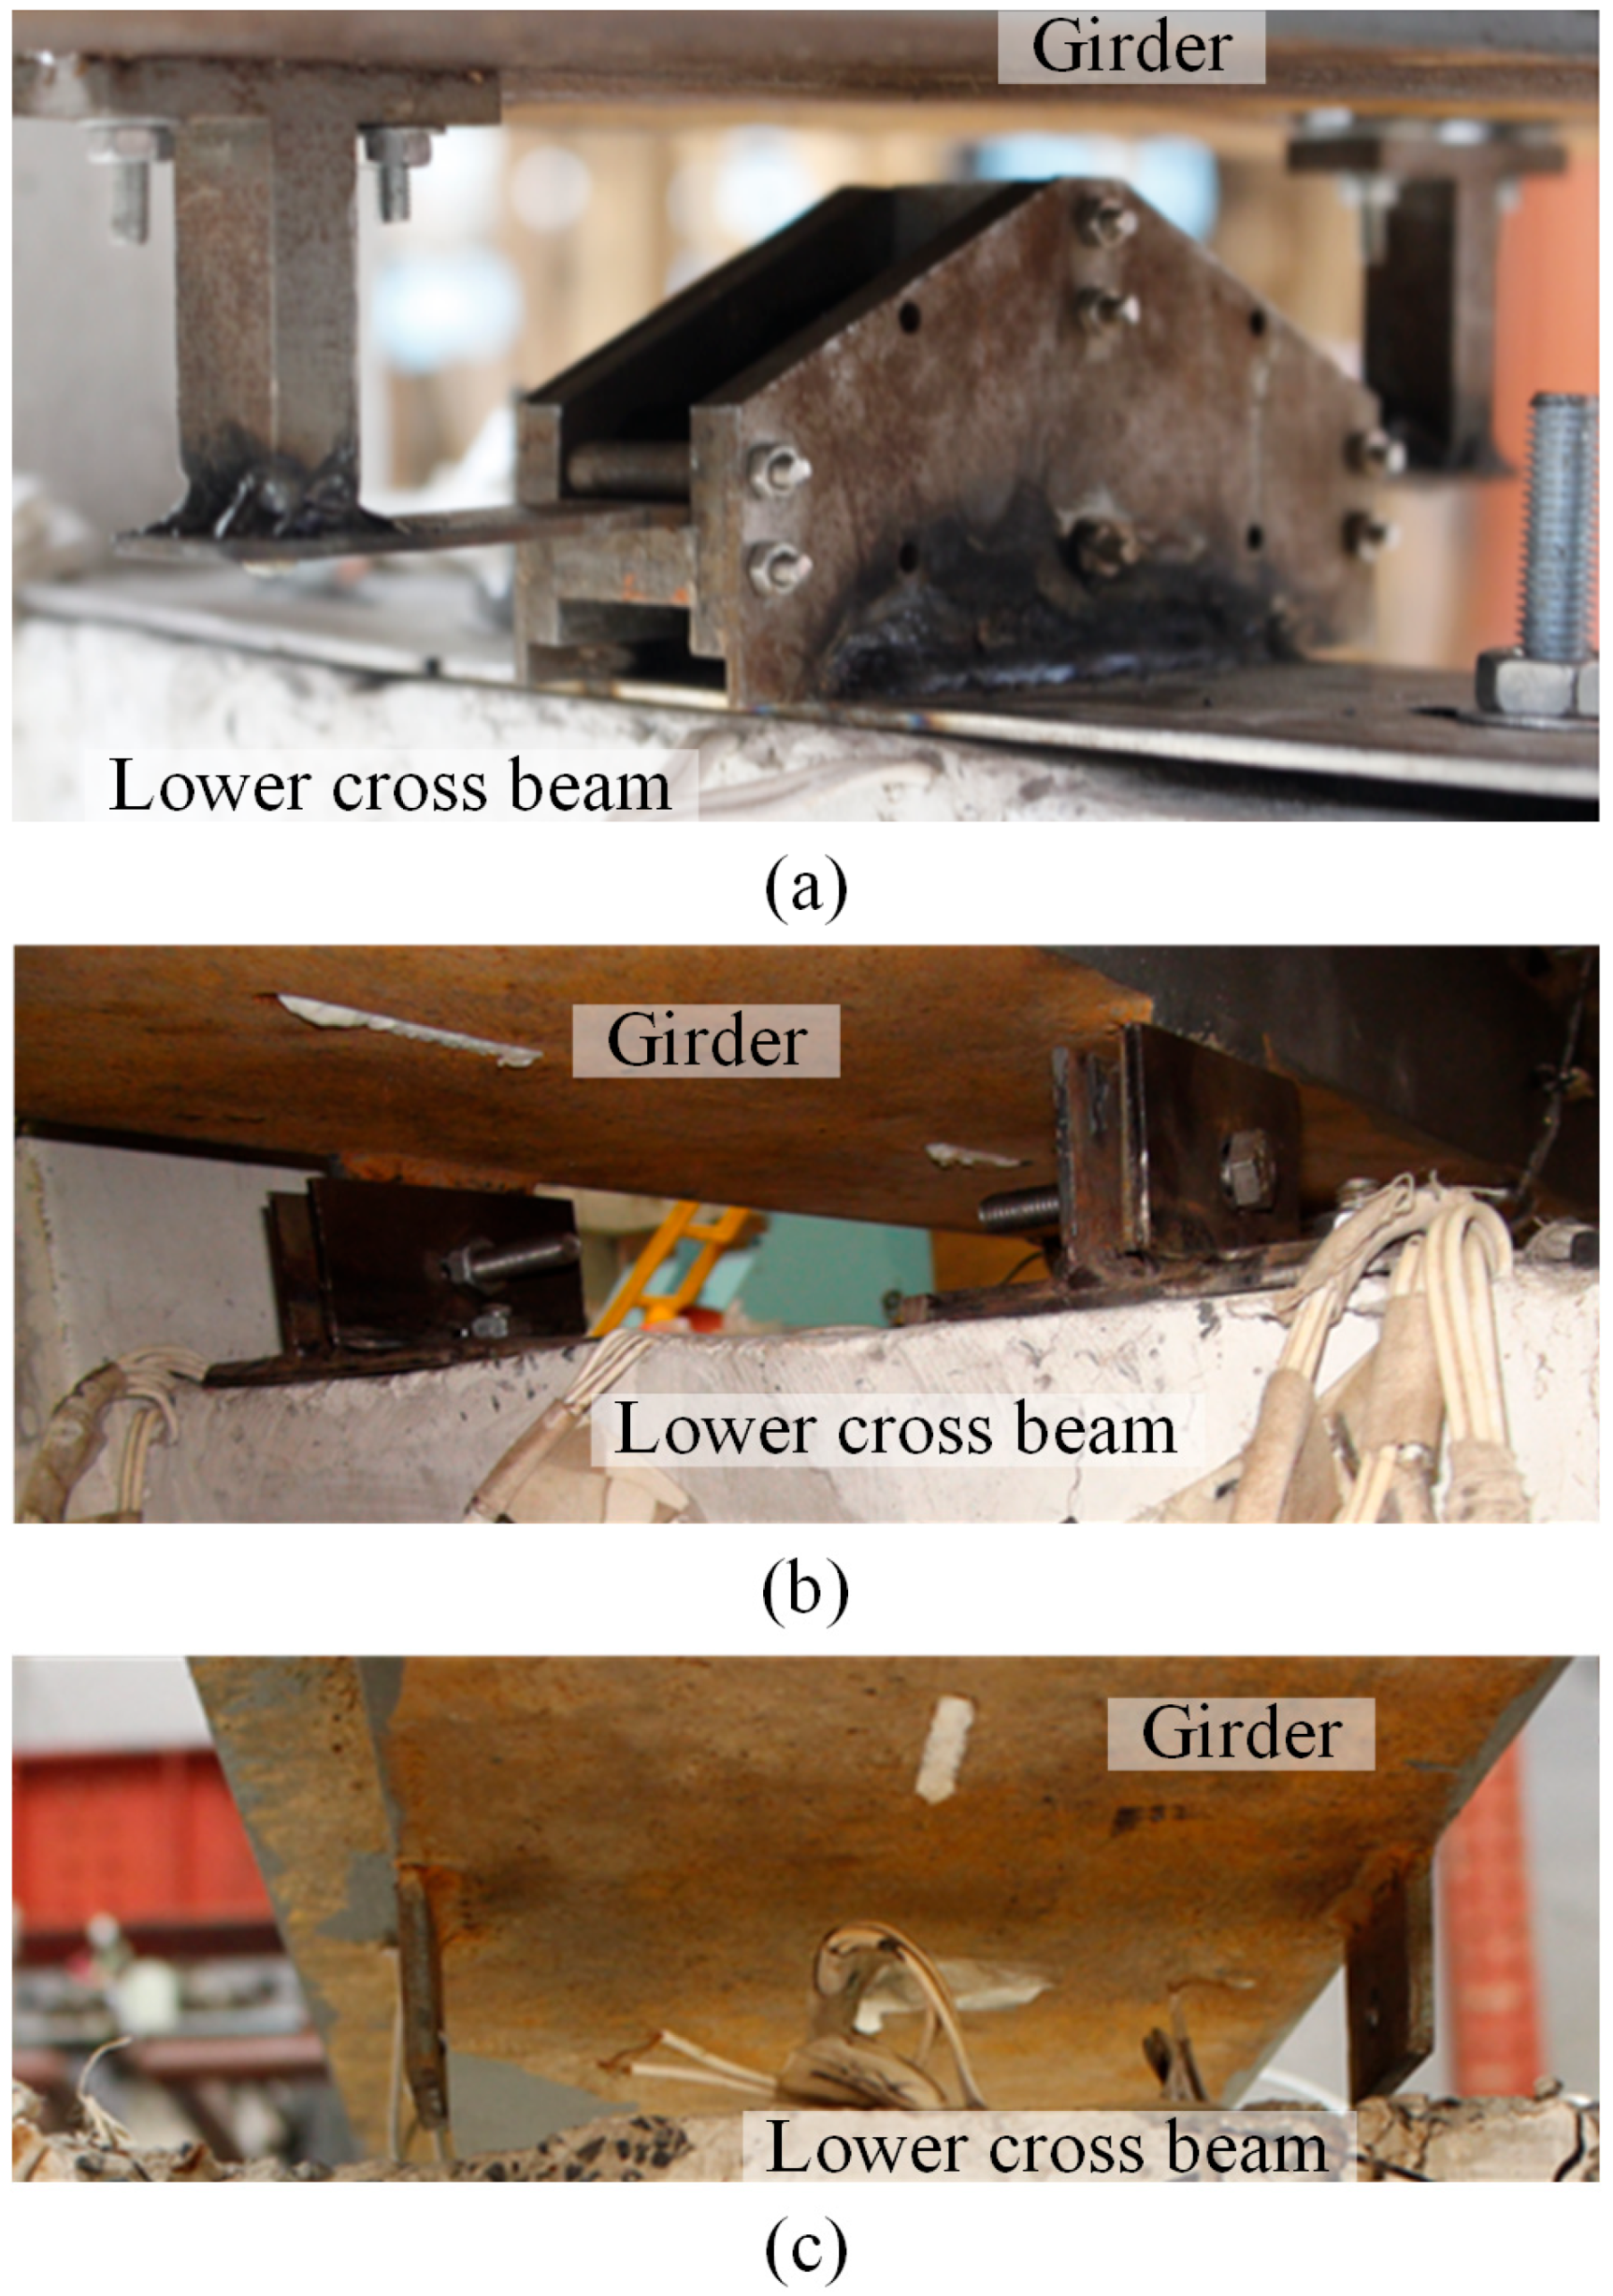
The connection of the safety-belt device is presented in Figure 3a. The fixed constraint type of the SBS and ARS is illustrated in Figure 3b, and the free-sliding constraint of FS is illustrated in Figure 3c.
The cross-sectional design of the main tower, main girder, and auxiliary pier in the experimental structure was guided by the principle of flexural stiffness equivalence. In the reinforcement design for the main concrete tower, the bearing capacity of the normal section was determined using the principle of equivalent bending capacity, while the oblique section’s bearing capacity was designed based on the principle of equivalent shear capacity.
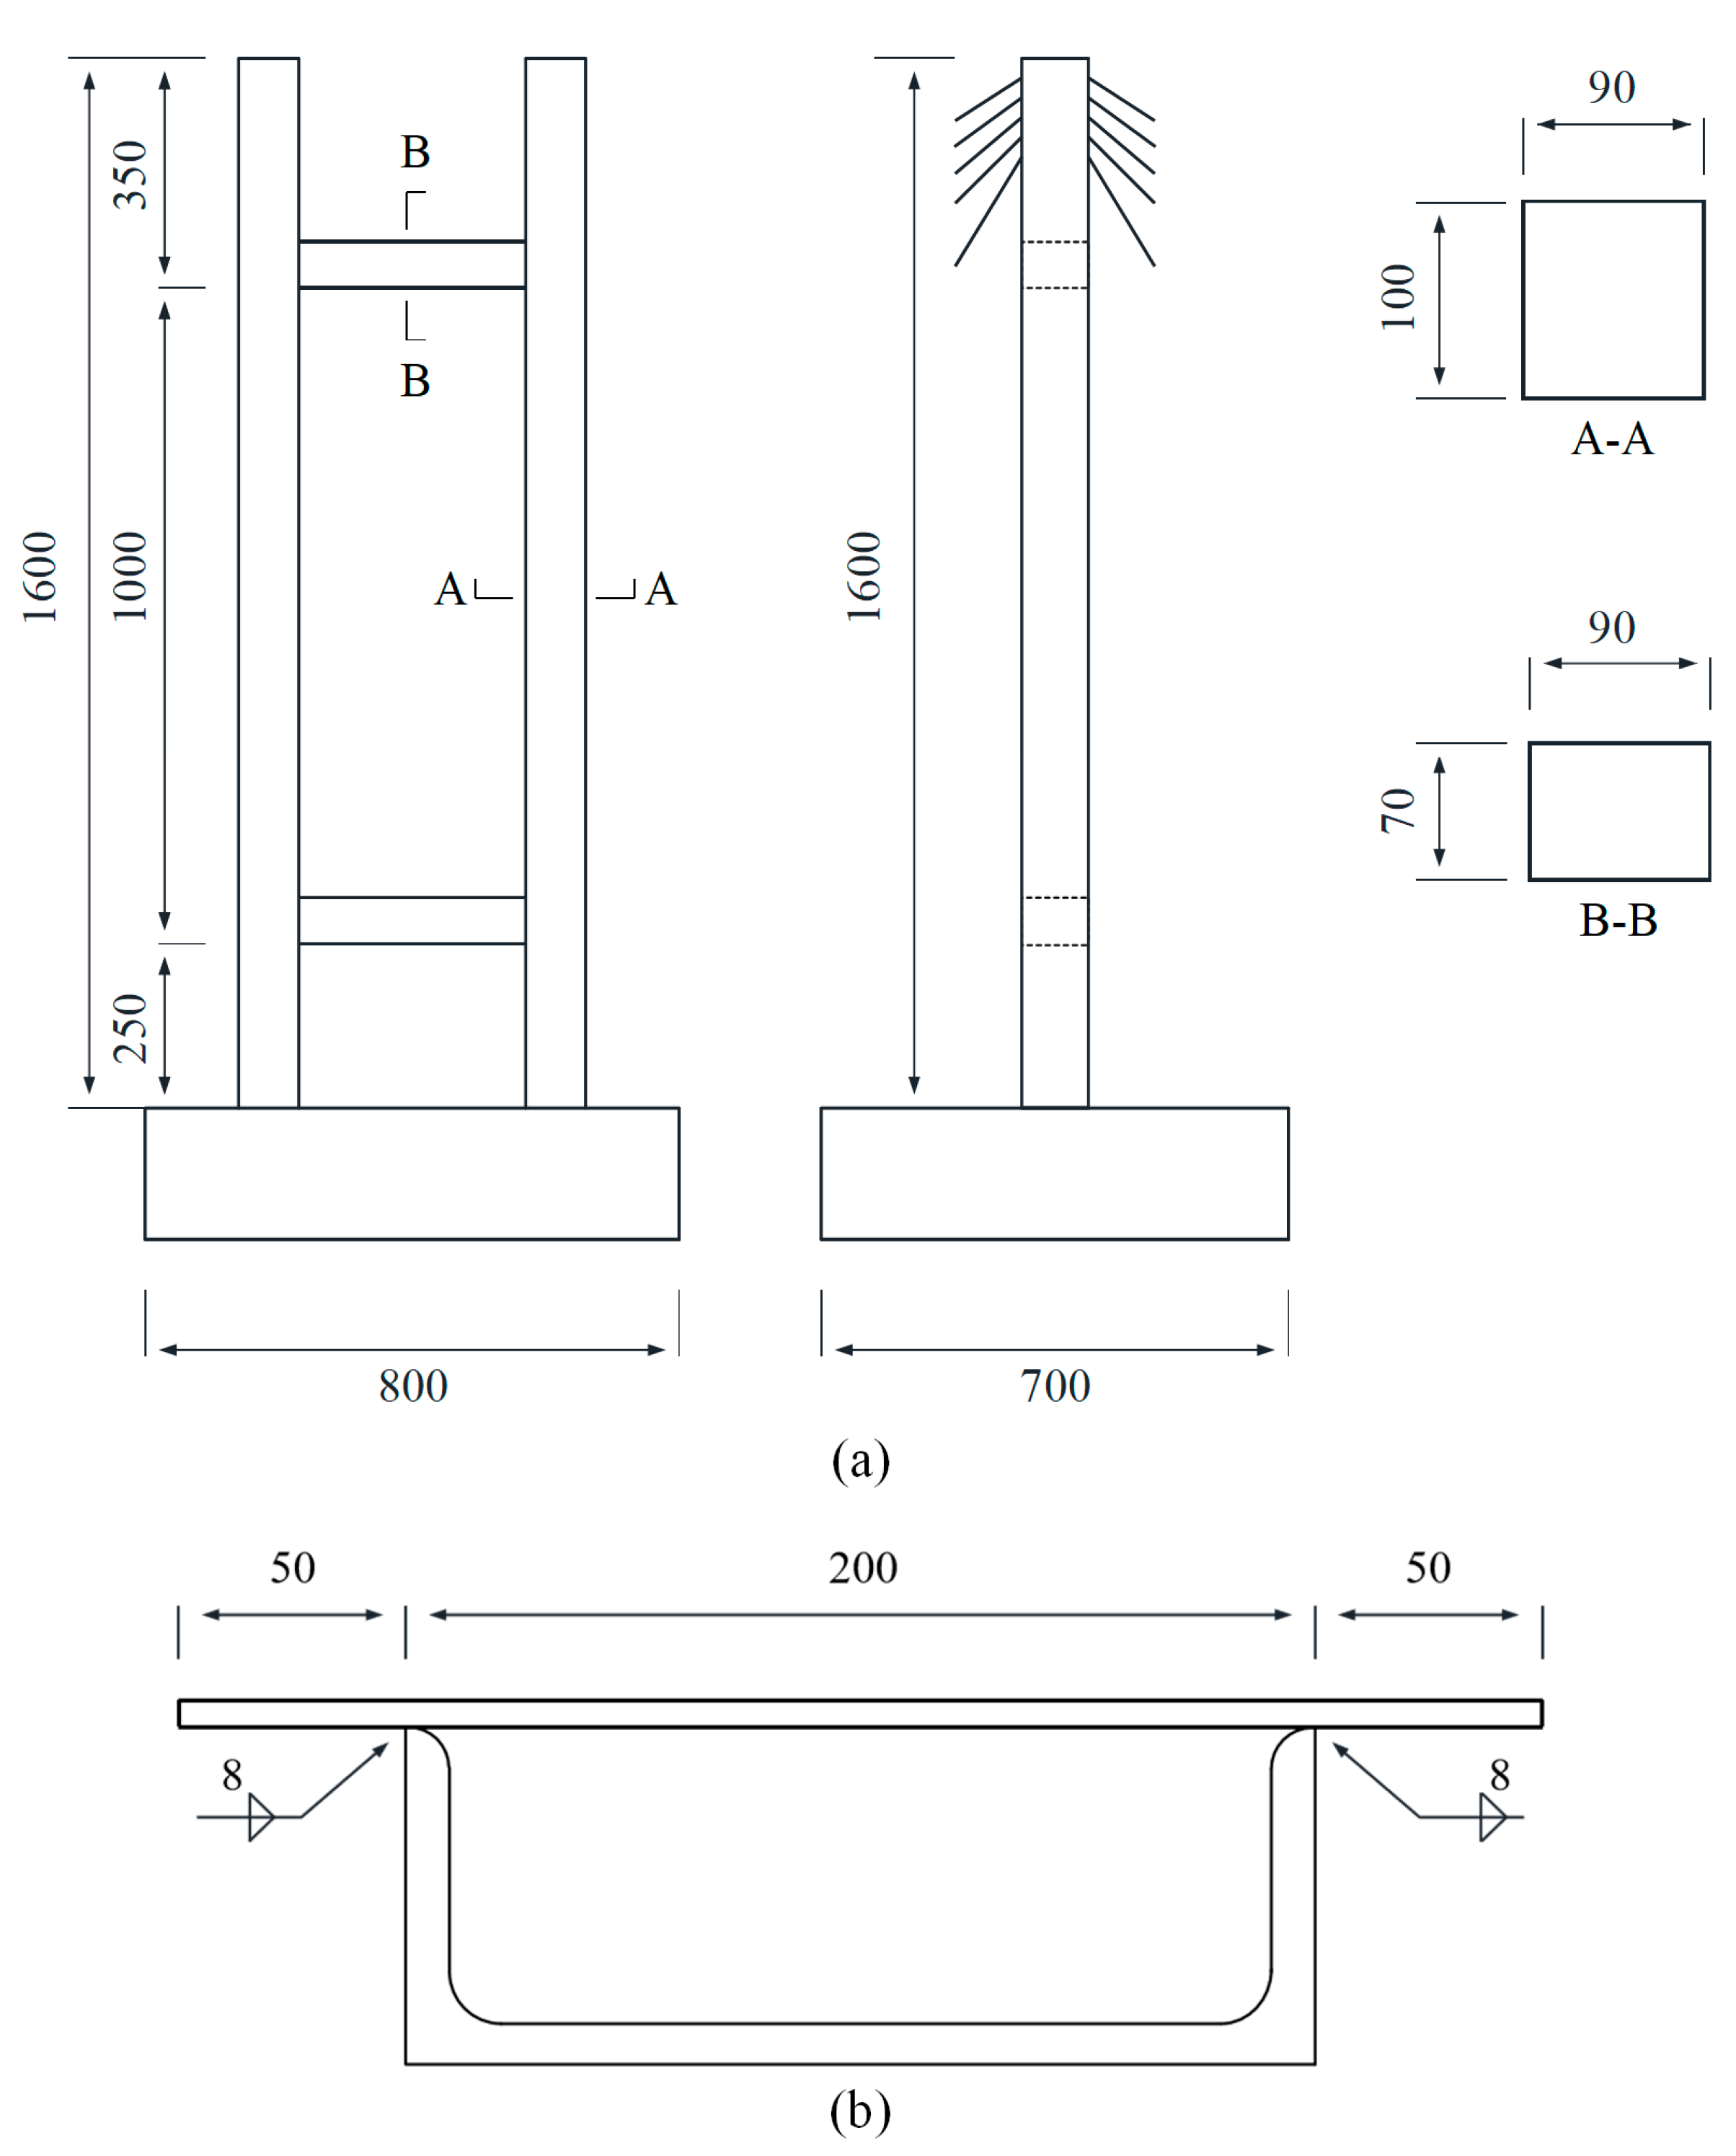
The H-shaped main tower of the experimental structure was constructed using C15 self-compacting concrete (SCC), reinforced with six HRB335 round steel bars and 14# galvanized iron wires for stirrups. The dimensions of the main tower structure are illustrated in Figure 4a, and the cross-section of the main girder is depicted in Figure 4b.
The main girder of the experimental structure was constructed using Q345D H-shaped steel, consistent with the materials used in previous studies [26]. The mechanical properties of the selected materials were tested, and the results are summarized in Table 3.

3.1.3. Counterweight

In this experiment, standard iron blocks identical to those used in previous studies were employed to simulate the weight of a low-gravity-center cable-stayed bridge. The counterweight configuration of the experimental structure is detailed in Table 4.

3.2. Design of Ground Motions

To investigate the damage characteristics and seismic response of a low-gravity-center cable-stayed bridge under great earthquake, three actual seismic records, including El Centro (ELC), TianJin (TJ), and EMC_FAIRVIE (EMC), and one site-specific artificial (SA) wave were selected as input seismic waves for the shaking table test.
The selected ground motions are representative of different site conditions. Specifically, the ELC record is typical of Site Classes II–III, while the TJ record corresponds to Site Classes III–IV. The EMC record is representative of a Site Class III condition, and the site category of the AS wave also falls within Site Class III. All site classifications are defined in accordance with the Chinese Seismic Design Code [26,30].
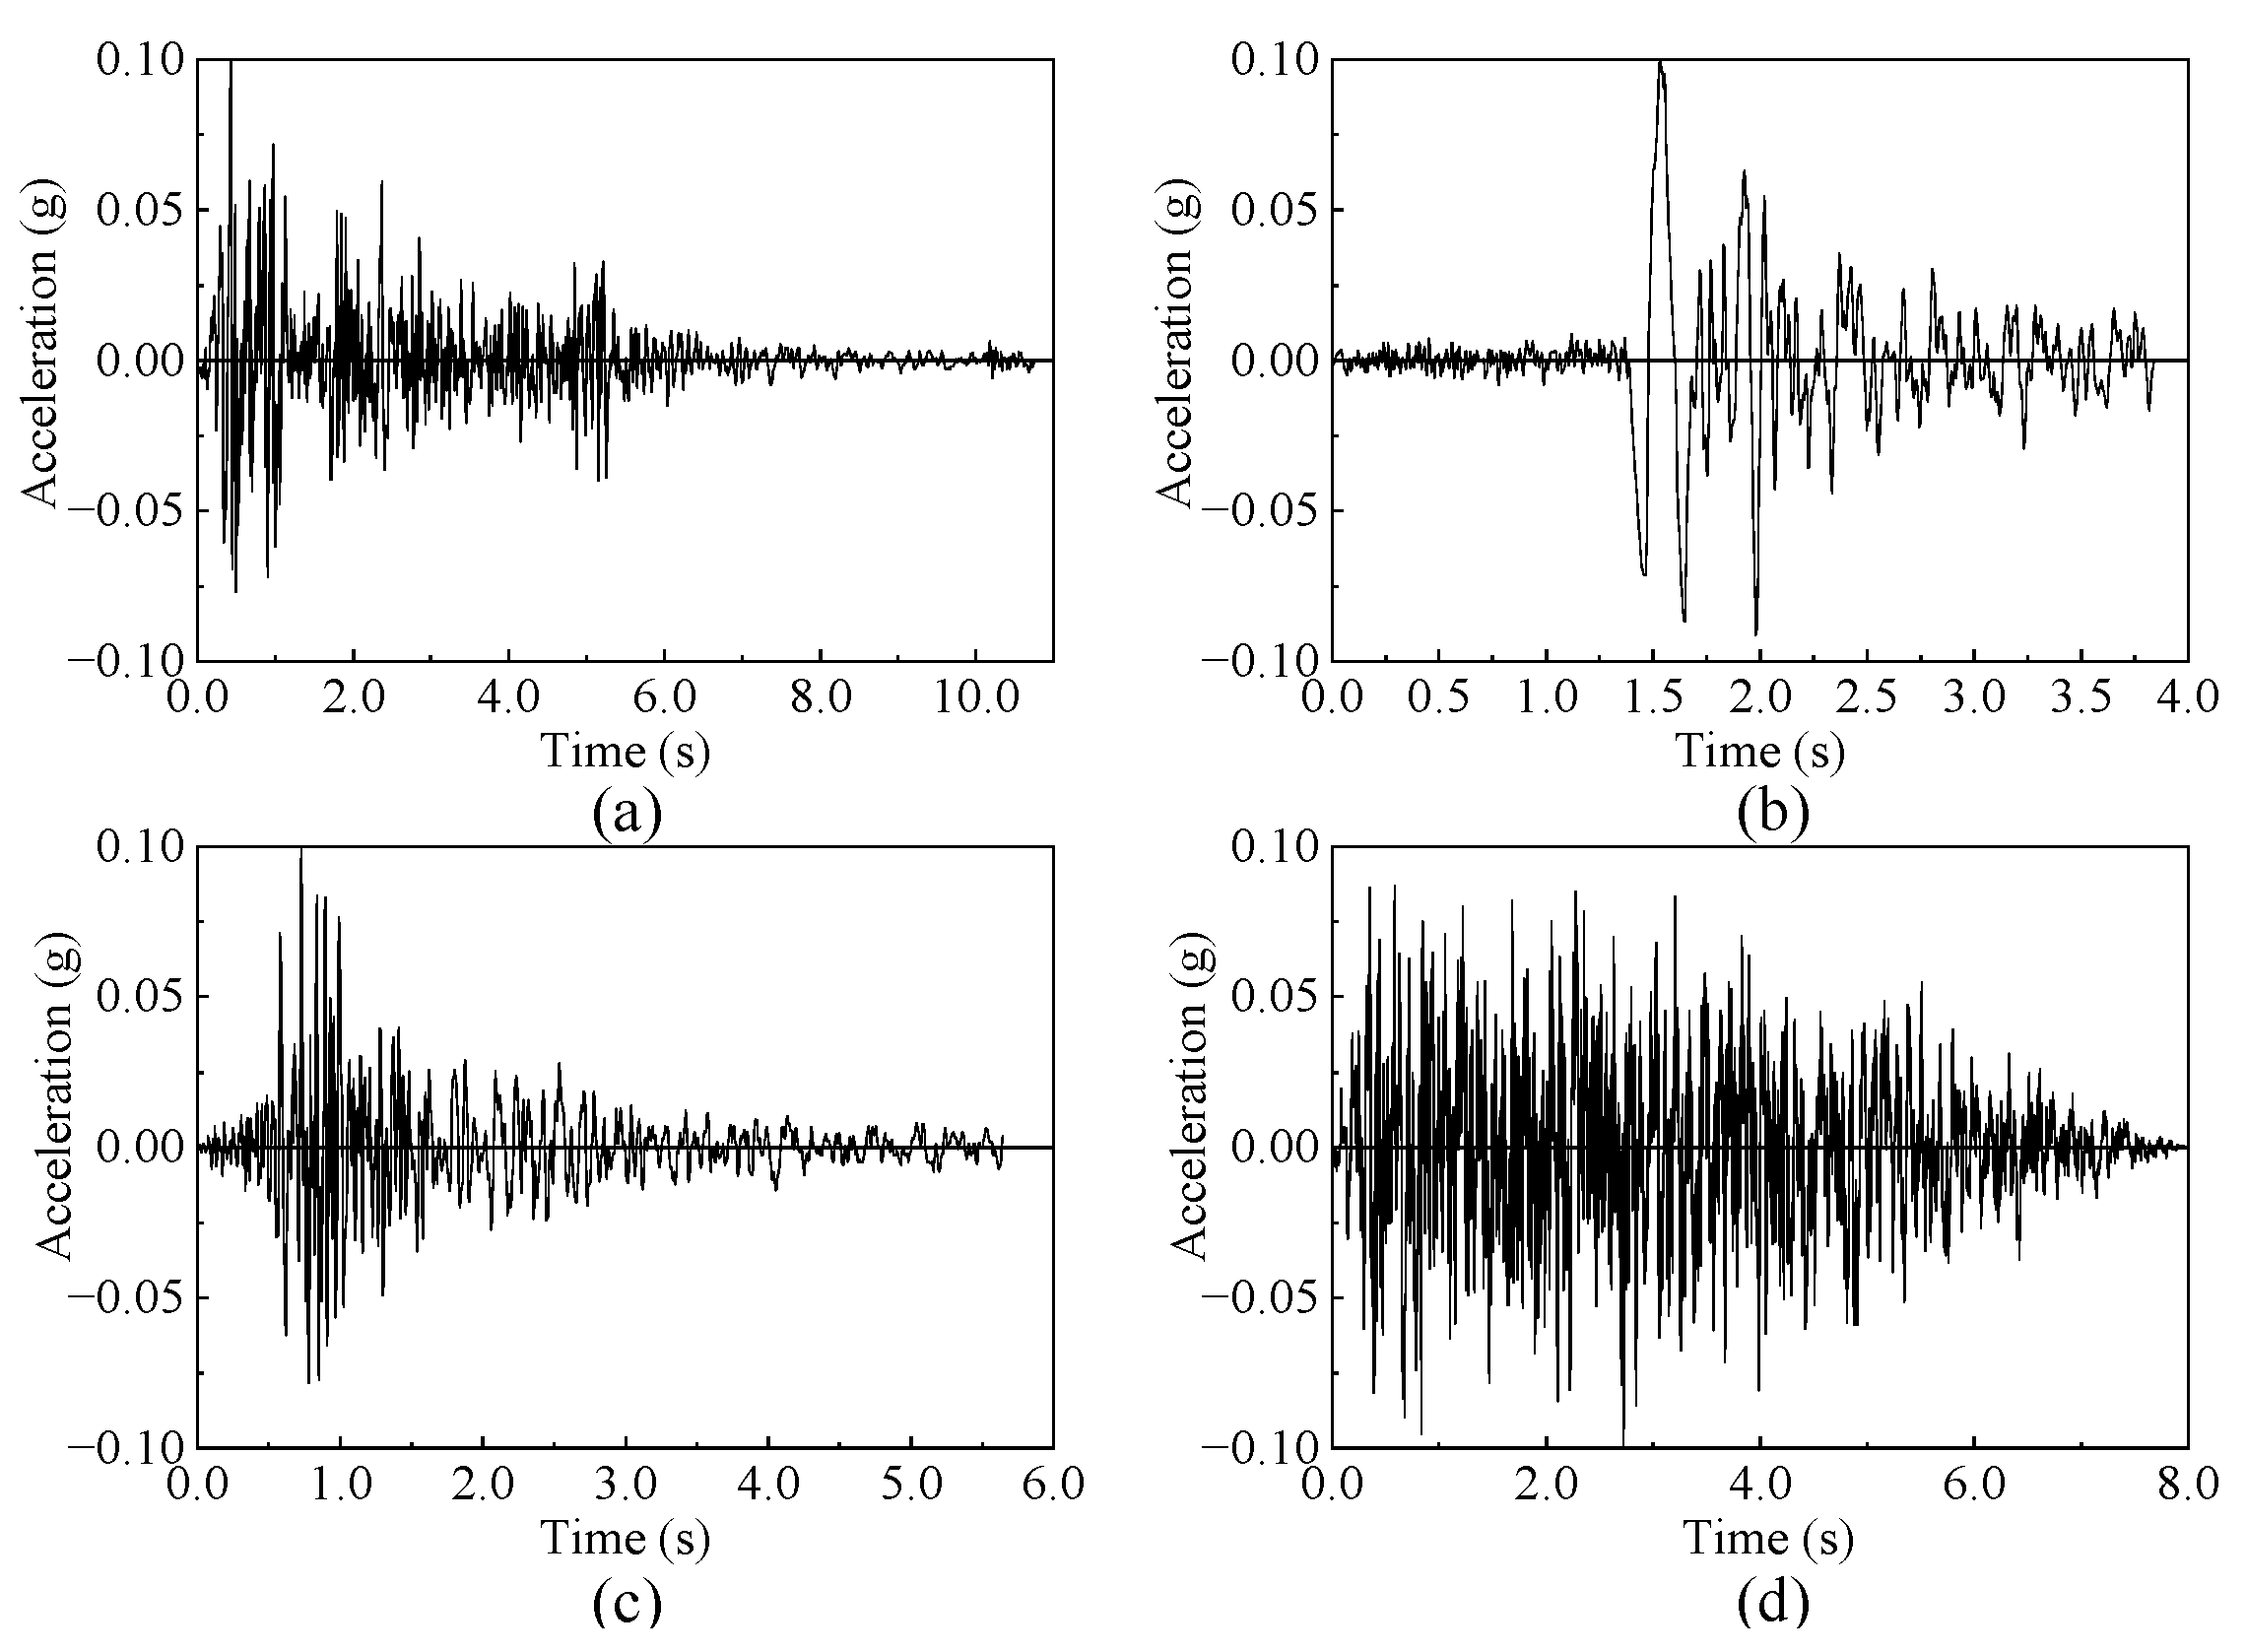
To achieve consistent earthquake loading, the duration of each seismic wave was compressed to 1/5 of its original length. Following the normalization of peak acceleration and the adjustment of input time compression, the time-history curves of ground motion acceleration for the four waves are presented in Figure 5. Additionally, the initial acceleration peaks of these four seismic waves were uniformly adjusted to 0.1 g.
Each seismic wave was applied along the longitudinal direction of the experimental structure. During each loading stage, the seismic waves were applied in the following order: ELC, TJ, EMC, and SA. The peak ground acceleration (PGA) of each seismic wave was incrementally increased from 0.1 g to 1.1 g, with 0.1 g increments at each loading stage. Only the PGA of the TJ wave was subsequently increased to 1.4. The changes in the dynamic characteristics of the test structure were recorded before and after the initiation of each loading stage.

3.3. Experimental Arrangement

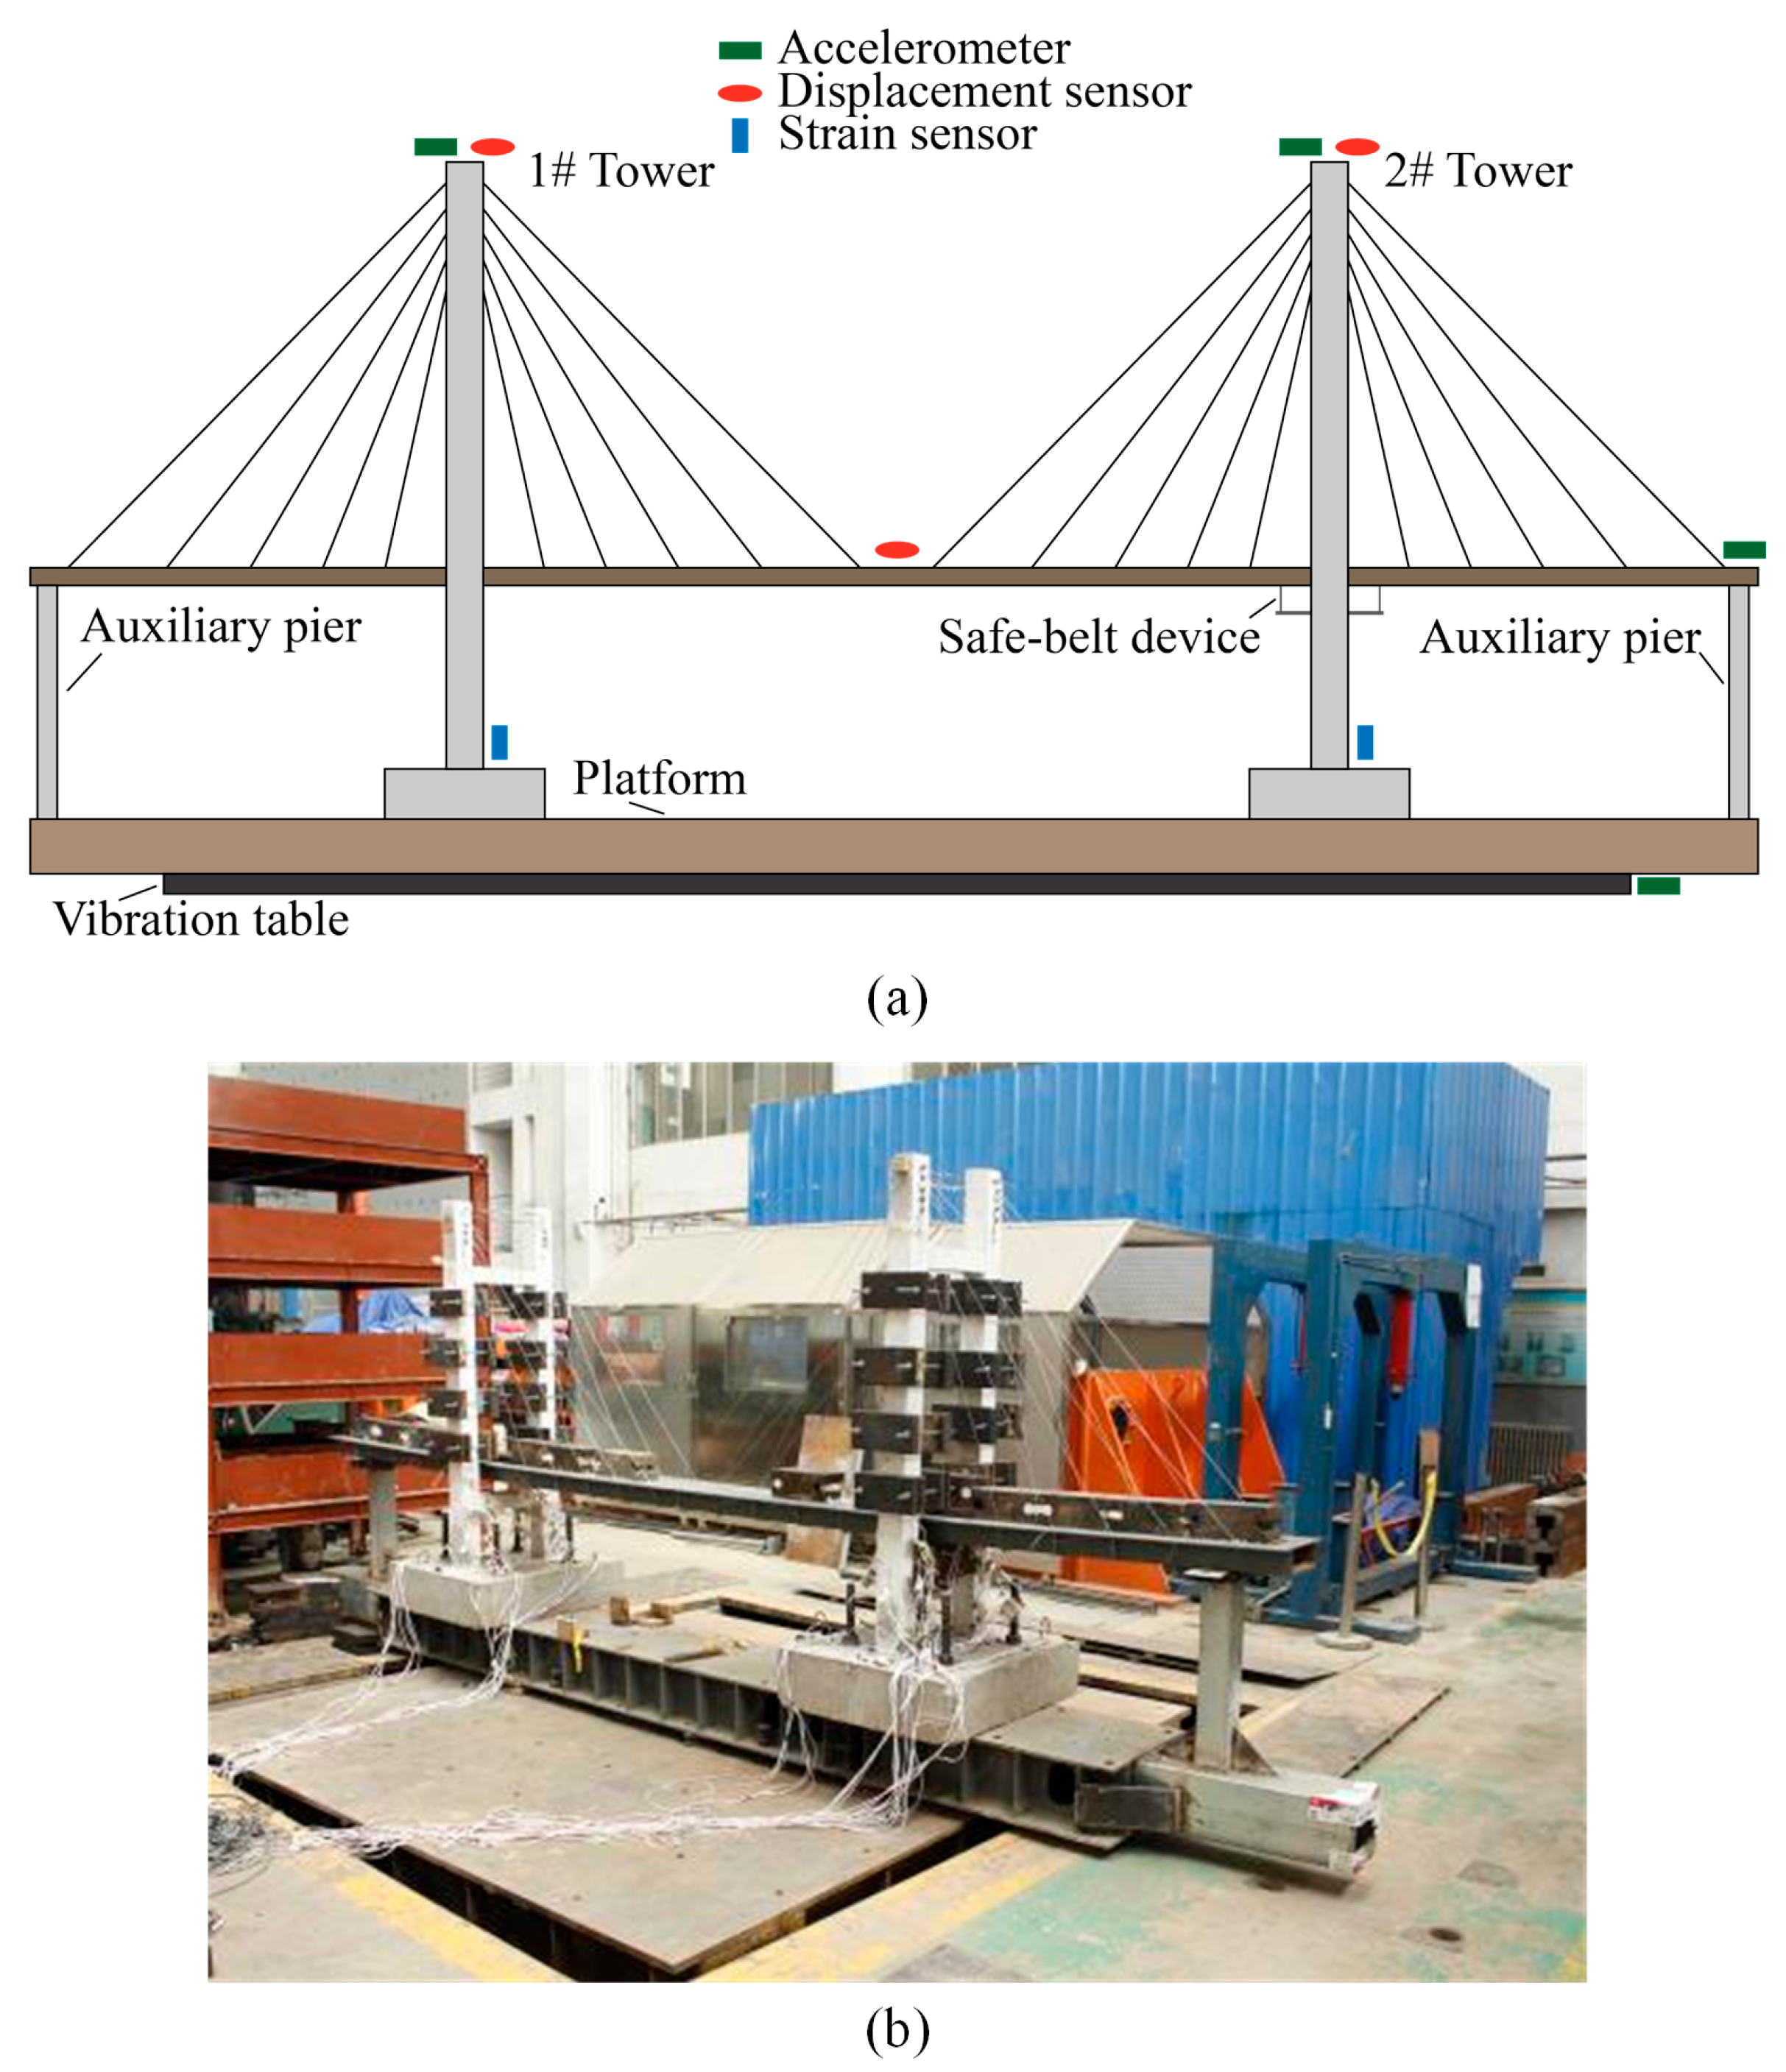
During the shaking table test, displacement, acceleration, and strain were recorded at each loading step. The study evaluated the seismic performance of various anti-seismic structural systems from these three aspects [31,32]. The arrangements of the accelerometer, displacement sensor, and strain sensor are illustrated in Figure 6a, and the experimental structure is depicted in Figure 6b.
Before each loading step, the self-vibration characteristics of the experimental structure were assessed using a white noise vibration test. This test was conducted to evaluate the dynamic response capabilities of the structure and to detect any structural faults. During each loading step, responses at monitoring sites (displacement, acceleration, and strain) were recorded, and the locations and extent of any damage were observed throughout the experiment.

4. Results

4.1. Self-Vibration Frequency

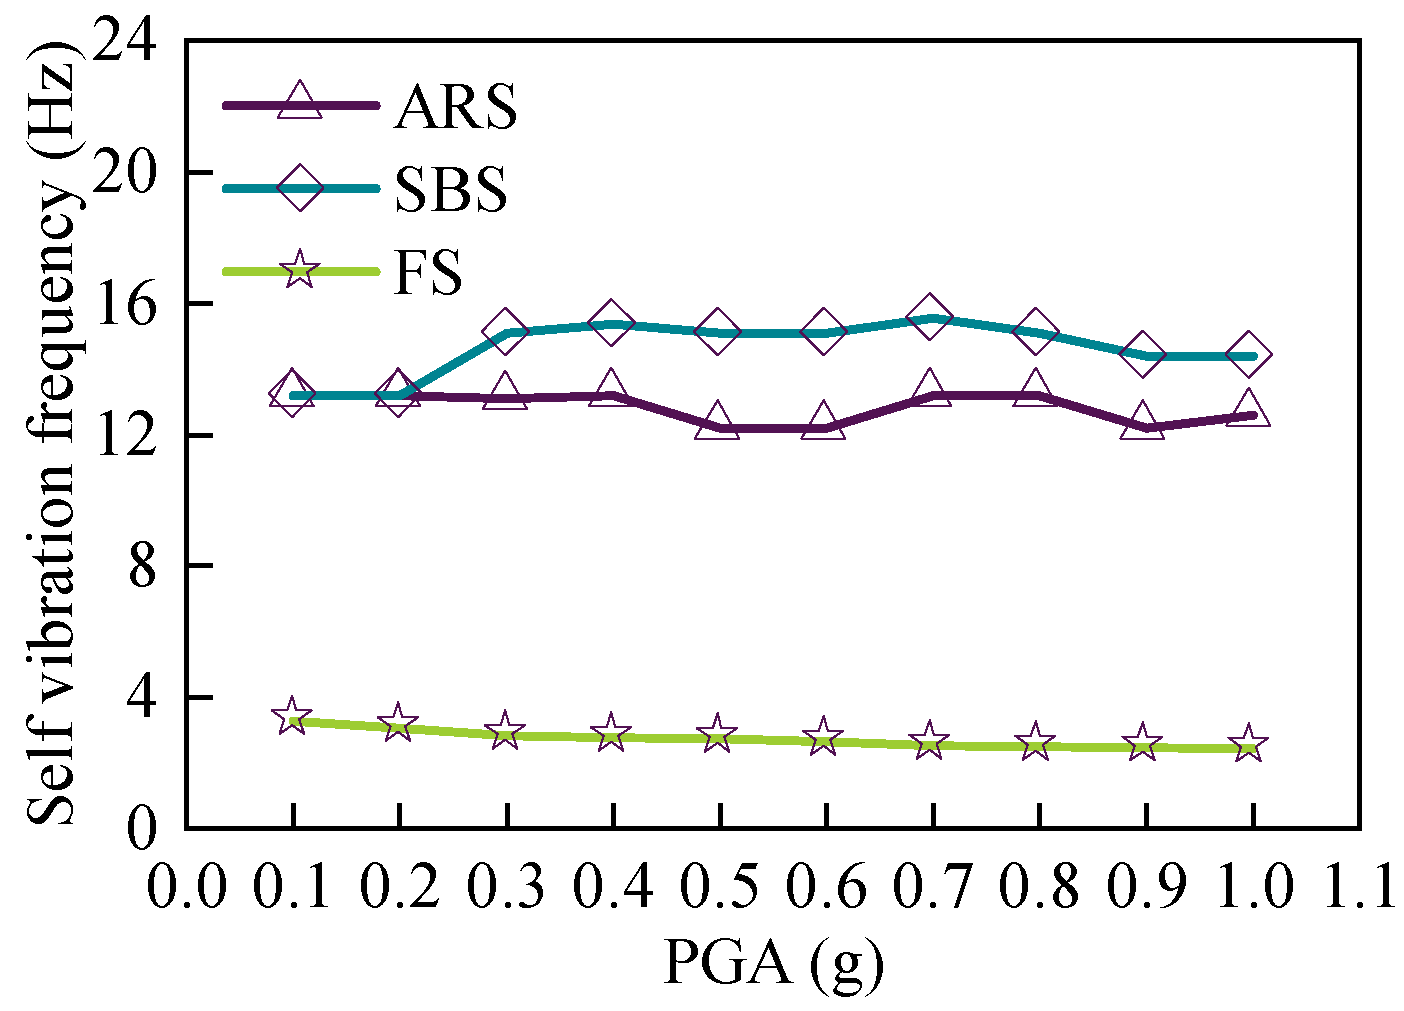
In the previous study, the self-vibration frequencies of two anti-seismic structural systems were evaluated: the ARS and the FS. The acceleration time-history curve at the top of the main tower, recorded before each loading step, was Fourier transformed to obtain the corresponding spectral curve [26]. For this study, the dynamic characteristics of the SBS needed to be comparable to those of the ARS. The self-vibration frequencies of the three anti-seismic structural systems are shown in Figure 7.
Before the activation of the safety-belt device, the self-vibration frequency of the SBS was almost similar to that of the ARS. This facilitated the comparison of anti-seismic capabilities between experimental structures with the ARS and the SBS. After the activation of the safety-belt device, the self-vibration frequencies of the SBS were slightly higher than those of the ARS. This conformed to the expectation of the dynamic characteristic of the SBS.

4.2. Experimental Phenomenon

The threshold accelerations were recorded when the safety-belt device was activated under the four seismic waves, as shown in Table 5.
The first activation of the safety-belt device occurred under the action of the TJ wave when the PGA was 0.3 g, but the locking shaft had not fallen into the locked position; at this moment, the relative displacement between the girder and tower was small, and the tower and girder were not locked, thus the safety-belt device has not yet fully functioned.
The safety-belt device was activated for the first time under the 0.4 g PGA of the ELC wave but it has not yet fully functioned. It was activated for the first time under the 0.5 g PGA of the SA wave, but it has not yet fully functioned as well, while it fully functioned under the action of the TJ wave with 0.5 g PGA. When PGA reached 0.8 g, it functioned under the action of both the EL Centro wave and the SA wave. When PGA reached 1.0 g, it was activated and functioned under the action of the EMC wave.
The damage observed with the gradual increase of PGA is shown in Table 6. It can be seen that the first crack appeared at the location of the lower crossbeam of 1# tower with some concrete surface peeling off when PGA was 0.8 g. When PGA was 1.4 g, the safety-belt ties buckled and the bolts at the connection between the safety-belt device and the main girder broke due to the shear force.
Table 6. Phenomena of the SBS under different PGA action.
PGAPhenomena
0.1 g~0.7 gNo damage
0.8 gObvious cracks with some concrete surface peeling appeared on 1# tower crossbeam, as Figure 8a,b show.
1 gHorizontal cracks appeared on the two tower bottoms of 1# tower, as Figure 8g,h show.
The original cracks on the lower crossbeam of 1# tower extended and concrete fragmentation occurred, as Figure 8c,d show.
1.1 gThe original cracks on 1# tower bottom extended to an around-tower-bottom circle crack and aggravated concrete fragmentation occurred.
Reinforcement at the column corner of the tower bottom was exposed.
The lower crossbeam had further concrete damage, as Figure 8f shows.
1.2 gNew oblique cracks appeared on the 1# tower nearing the lower crossbeam, as Figure 8e shows.
1.4 gOn the lower crossbeam of the 2# tower, the bolt used in fixing the safety-belt device and main girder broke under shearing, and the safety-belt device was broken, as Figure 8i shows.
Figure 8. The damage observed of the SBS 1# tower: (a) the southern lower crossbeam when PGA was 0.8 g; (b) the northern lower crossbeam when PGA was 0.8 g; (c) the southern lower crossbeam when PGA was 1.0 g; (d) the northern lower crossbeam when PGA was 1.0 g; (e) the northern tower column when PGA was 1.2 g; (f) the northern lower crossbeam when PGA was 1.1 g; (g) the southern tower bottom when PGA was 1.0~1.2 g; (h) the northern tower bottom when PGA was 1.0 and 1.1 g; and (i) the safety-belt system 2# tower damage state.
Buildings 15 03268 g008

4.3. Experimental Phenomena Comparison

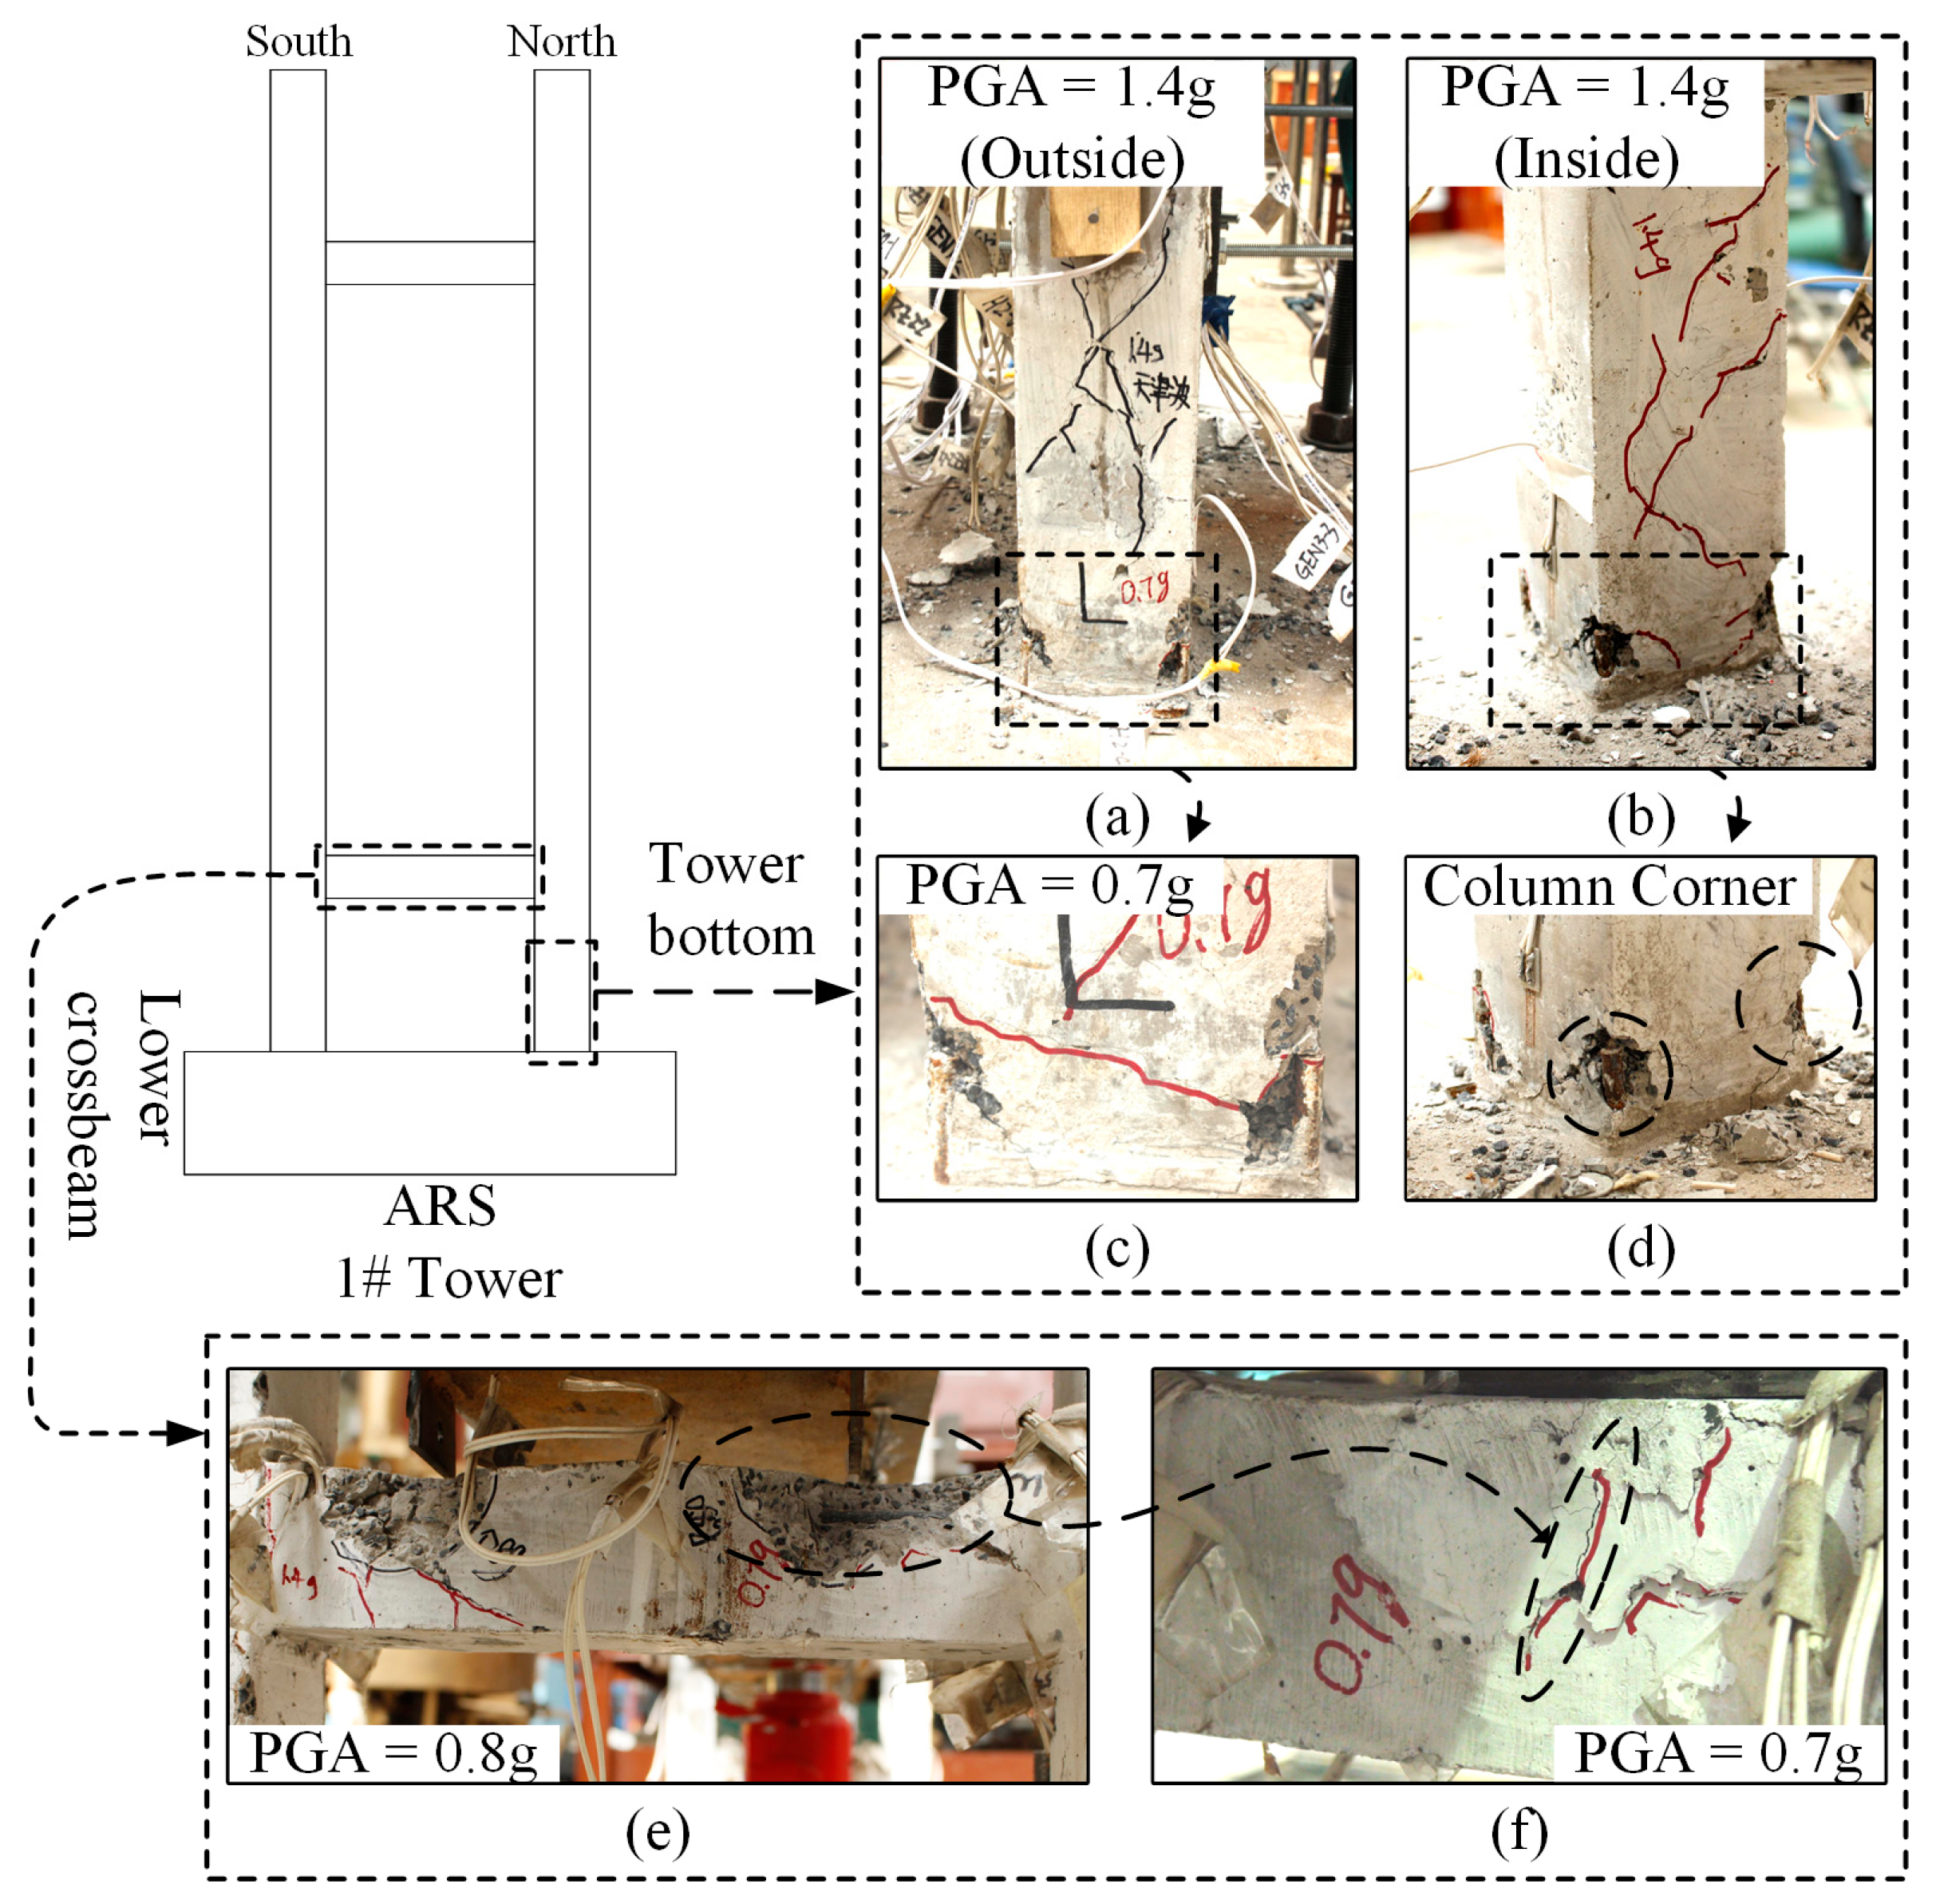
The damage information of the ARS and the FS are summarized, based on the previous study [26]. The damage of the ARS occurred earlier than that of the SBS. The first appearance of cracks was at the moment when PGA reached 0.7 g, as Table 7 shows. The damage of the ARS is shown in Figure 8.
Table 7. Phenomena of the ARS experimental structure under different PGA action.
PGAPhenomena
0.1 g~0.6 gNo damage
0.7 gA crack located at the lower tower column of 1# tower appeared as Figure 9c shows.
A diagonal crack at the location of the fixed support of 1# tower appeared as Figure 9f shows.
0.8 gThe extension of original cracks of 1# lower crossbeam beam occurred with local concrete fragmentation, as Figure 9e shows.
1.1 gA through crack appeared at 1# tower bottom with a large amount of concrete fragmentation, and the main reinforcements of the column corner of the 1# tower bottom were exposed, as Figure 9d shows.
1.4 gA large amount of concrete fragmentation occurred at the lower crossbeam of 1# tower, and the reinforcements were exposed. Meanwhile, many cracks appeared at the bottom of the 1# tower, as Figure 9a,b show.
Figure 9. The damage observed of the ARS 1# tower: (a) the outside of the northern lower tower column when PGA was 1.4 g; (b) the inside of the northern lower tower column when PGA was 1.4 g; (c) the outside of northern lower tower column when PGA was 0.7 g; (d) the inside of northern lower tower column corner when PGA was 0.7 g; (e) the eastern side of lower crossbeam when PGA was 0.8 g; and (f) the eastern side of lower crossbeam when PGA was 0.7 g.
Buildings 15 03268 g009
The damage of the FS occurred earlier than the ARS or the SBS. The first appearance of cracks in the FS was at the moment when PGA was 0.5 g, as Table 8 shows. The damage of the FS is shown in Figure 9.
Table 8. The phenomenon of FS experimental structure under different PGA action.
PGAPhenomenon
0.1 g~0.4 gNo damage
0.5 gTwo obvious cracks appeared at the location near the lower crossbeam of 1# tower, as Figure 10a shows.
One crack appeared at the location near the lower crossbeam of the 2# tower, as Figure 10c shows.
0.6 gA new crack appeared at the location near the lower crossbeam of the 2# tower, as Figure 10c shows.
The obvious collision between the girder and the auxiliary pier occurred under the action of the TJ wave.
0.8 gFour parallel cracks appeared at the central part of the 2# tower column, as Figure 10b shows.
Two cracks appeared at 2# tower bottom, as Figure 10d shows.
1 gThe collisions between the girder and auxiliary pier occurred under the action of the ELC wave, TJ wave, and SA wave.
1.1 gThe outermost diagonal cable of 2# tower lost the anchored state.
Figure 10. The damage observed of FS 1# and 2# tower: (a) the location of 1# tower southern side near the lower crossbeam when PGA was 0.5 g; (b) the location of 2# tower southern tower column when PGA was 0.8 g; (c) the location of 2# tower column southern side near the lower crossbeam when PGA was 0.5 g and 0.6 g; and (d) the northern side of 2# tower bottom.
Buildings 15 03268 g010
The damage details for different structural systems can be summarized by combining the results from previously reported studies. Obviously, the PGA (0.8 g), first rendering the SBS to be damaged, is higher than those PGAs (0.7 g and 0.5 g) first rendering the ARS and the FS to be damaged. Additionally, the cracks of the SBS were less. The damage situation of experimental structures with different anti-seismic systems is shown in Table 9.

5. Analysis of Seismic Response

5.1. Displacement Response

The displacement response of the three structural systems under different seismic waves is shown in Figure 11a,b. After the activation of the safety-belt device, the displacement response of the tower top and girder of the SBS is slightly smaller than that of the ARS under the action of ELC, EMC, and SA waves.
However, under the action of the TJ wave, the displacement response of the tower top and girder of the SBS is larger than that of the ARS. This might result for the following reasons: (1) Although the safety belt was activated, due to the pulse effect of TJ waves, the maximum structural response occurred before the safety-belt device could fully function; (2) the SBS has a larger dynamic magnification factor under the effect of TJ wave. This indicates that the seismic damage characteristics of low-gravity-center cable-stayed bridges are not only related to the type of structural system but also related to the characteristics of the ground vibration suffered.
Compared with the FS, the displacement response of the tower top and girder of the SBS is smaller under the action of different seismic waves. This indicated that the SBS could effectively control the displacement response of the structure compared with the FS.

5.2. Acceleration Response

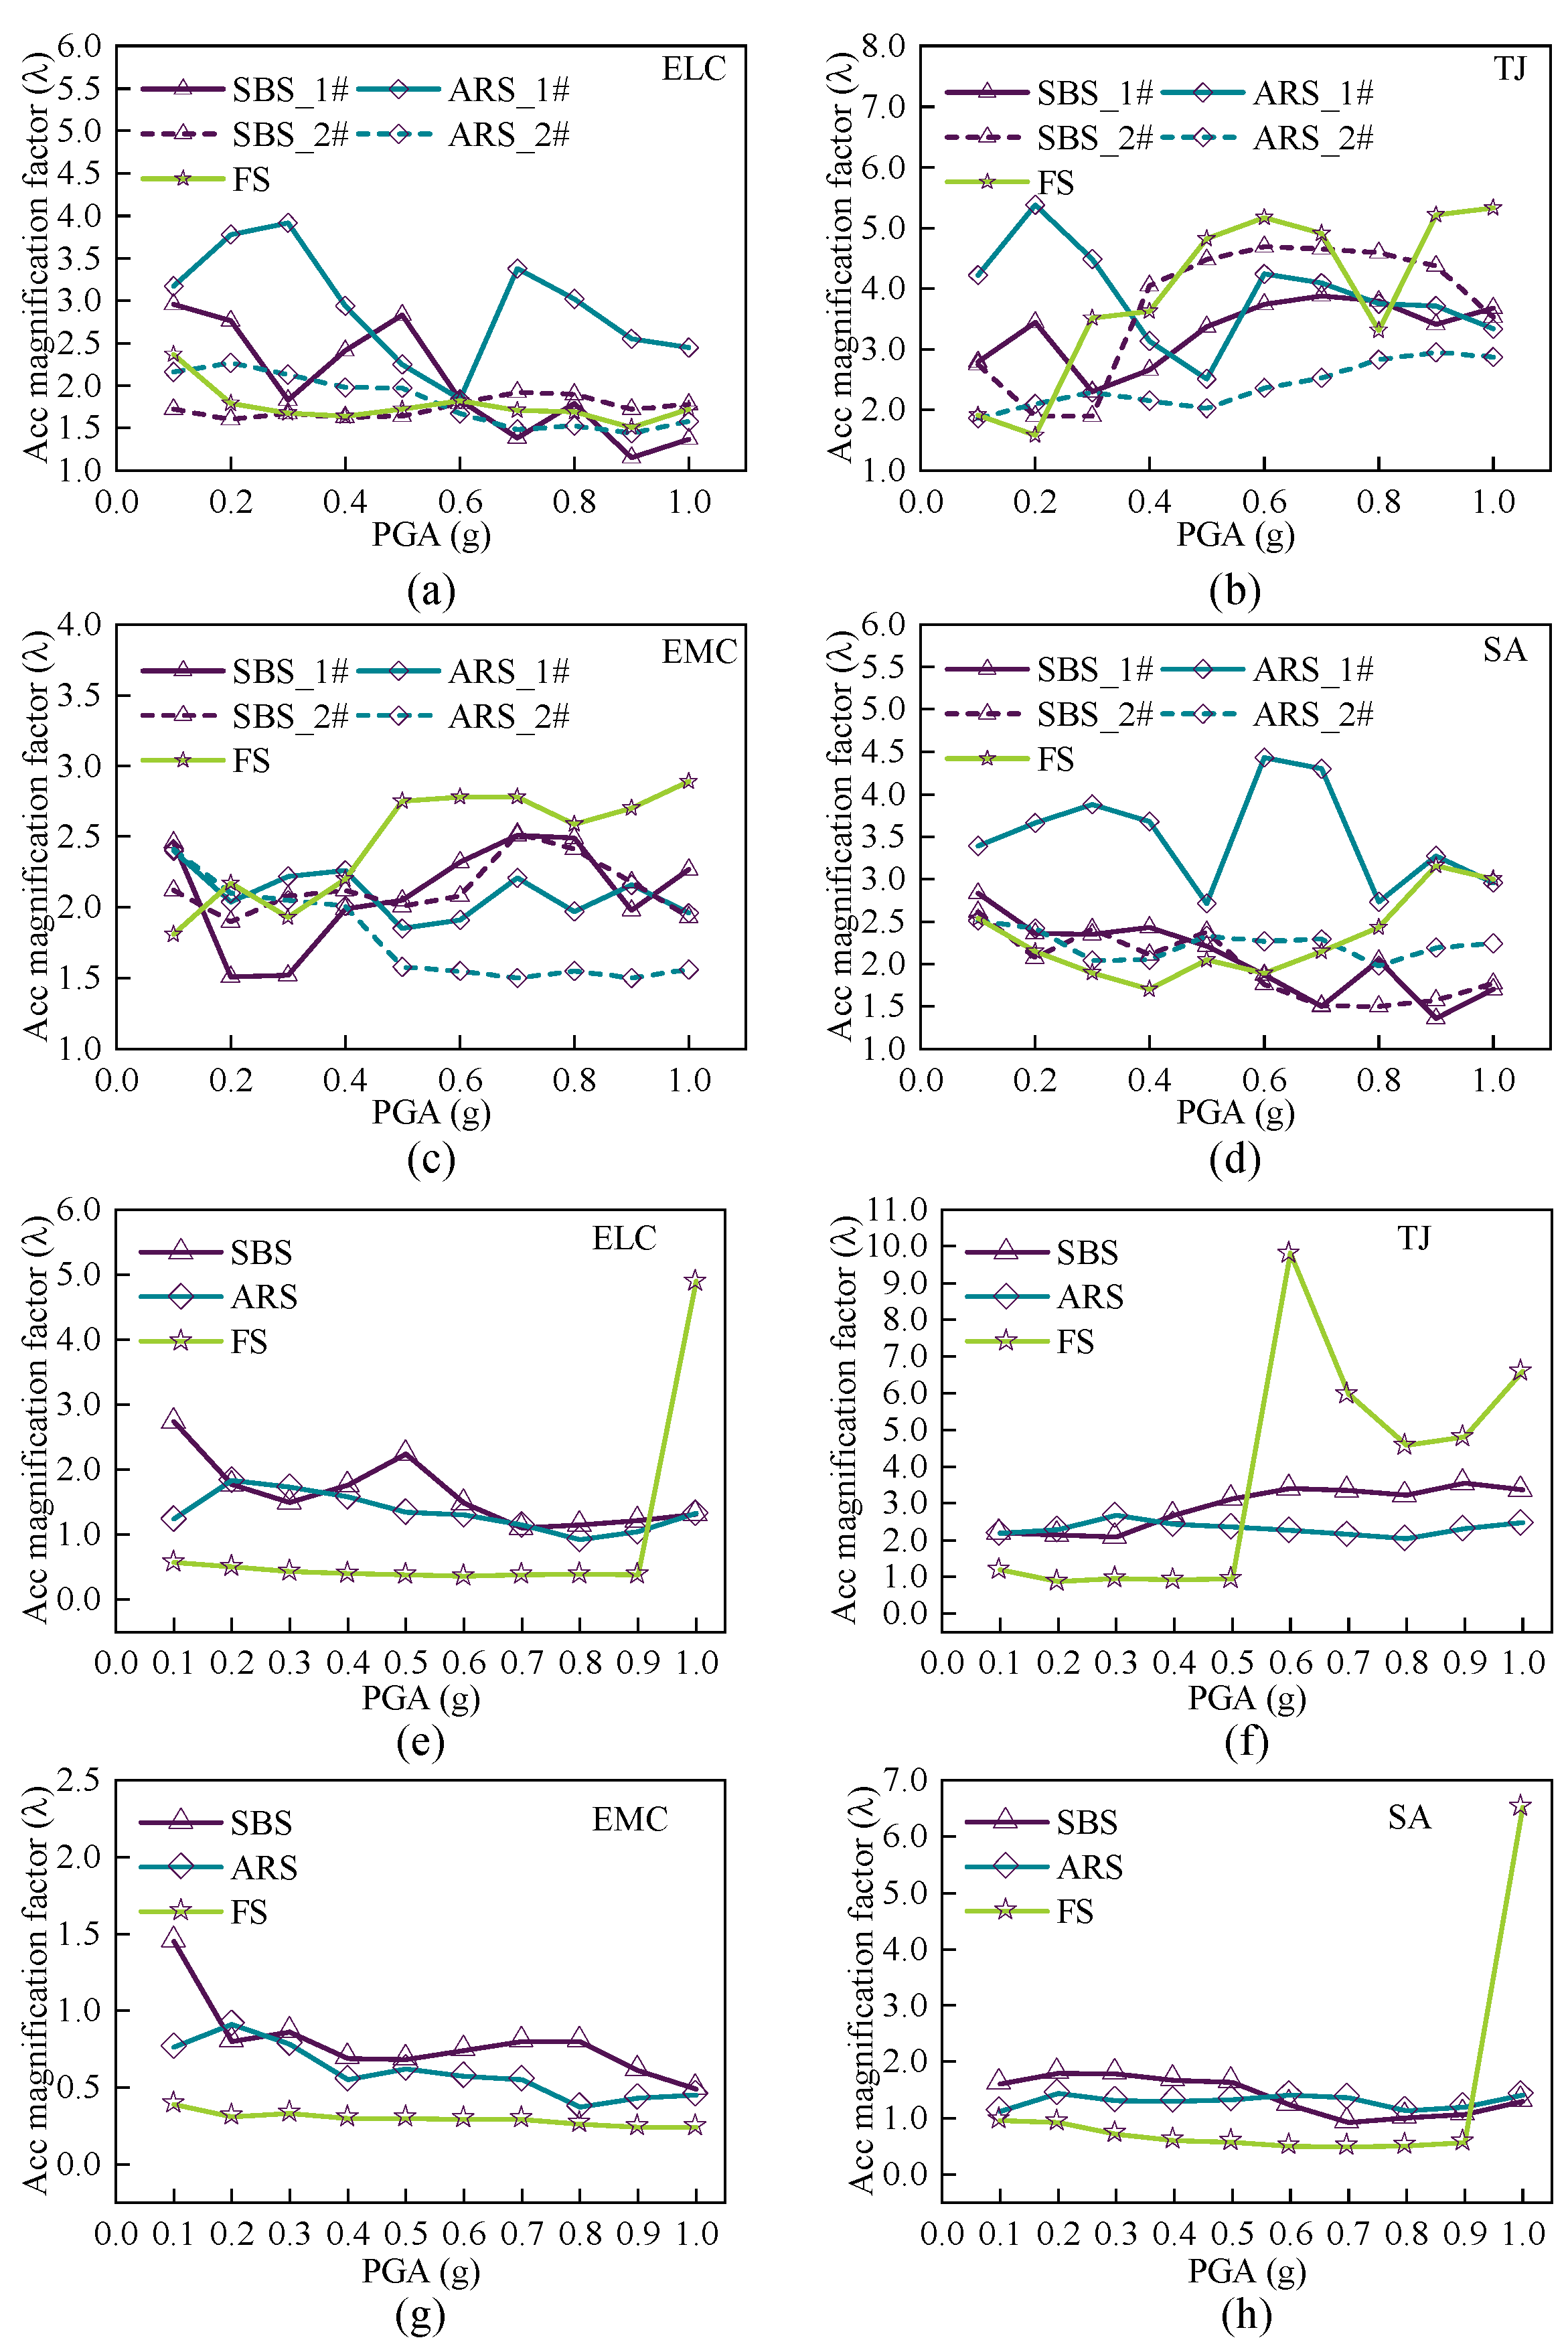
The acceleration responses of different structural systems were compared. An acceleration amplification factor λ (the ratio of the acceleration to the inputted PGA) was used in normalizing the acceleration response.
After the safety-belt device was activated, the maximum acceleration response of the SBS tower top is lower than that of the ARS experimental structure 1# tower, under the action of the ELC wave, and SA wave, as Figure 12a shows. However, the acceleration response at the tower top of the SBS is larger than that of the ARS under the action of the TJ wave and EMC wave. This might be caused by the additional restraint on the tower of the free pier that resulted from activation of the safety-belt device.
From Figure 12b, the acceleration response of the girder of the FS increases significantly when the PGA effect is large, under the action of the ELC wave, TJ wave, and SA wave. This is due to the sudden increase in the acceleration response caused by the excessive displacement of the girder, which is lifted by the tension cable and collides with the auxiliary pier when it falls back. Although the FS has a smaller acceleration response, excessive displacement response may lead to unforeseen collisions.

5.3. Strain Response

The internal force response and damage mechanism of the SBS under seismic action were analyzed by analyzing the strain of reinforcement in the tower. The strain response at the bottom of 1# tower and 2# tower was selected for analysis.
Compared with the 1# tower of the ARS and the FS, after activation of the safety-belt device, the strain response of the 1# tower bottom of the SBS is smaller under the action of the four seismic waves, as shown in Figure 13a.
Compared with the 2# tower of the ARS, after activation of the safety-belt device, the strain response of the 2# tower bottom of the SBS is larger than that of the ARS under the action of the four seismic waves, as Figure 13b shows. This might result from the load-sharing effect of the safety-belt device set at the connection between the 2# tower and the girder. It confirms the expectation of the effect of a safety-belt device.

5.4. Evaluation of Decreasing Amplitude Effect

The decreasing amplitude effect of the SBS in displacement and strain compared with the ARS and the FS is used to present the seismic performance of the SBS. The decreasing amplitude effect is defined by the decreasing amplitude ratio, as Equation (2):
λ = R S B S R 0 R 0 × 100 %
where λ denotes the decreasing amplitude ratio, RSBS denotes the seismic response indicator of SBS, and R0 denotes the seismic response indicator of the ARS or the FS.
In terms of displacement response, the SBS and the ARS both had a better vibration damping effect than the FS, which was been reported in Section 5.1.
Under some specific seismic waves, like ELC and EMC waves, the SBS performed better than the ARS with an effect of 10–30%, in term of the tower displacement, as shown in Figure 14a. Notably, the decreasing amplitude ratio degraded since the PGA of the TJ wave exceeded 0.4 g. This was likely caused by the locked safety-belt device being prematurely broken, resulting from a suddenly increased acceleration of the TJ wave. Additionally, the decreasing amplitude ratio degraded since the PGA of the SA wave exceeded 1.0 g. It is resulted from that the locked safety-belt device was broken and failed to offer a restraint for displacement.
Under the actions of ELC and TJ waves, the SBS performed better than ARS in decreasing girder displacement, as Figure 14c shows. However, the performance of the SBS apparently displayed a degradation in decreasing displacement amplitude under EMC wave action. This was likely resulted from that the safety-belt device was not being activated and did not function until the PGA of EMC wave reached 1.0 g. Additionally, the decreasing amplitude ratio degraded under the SA wave of 1.0–1.1 g PGA, which was caused by the reason that the locked safety-belt device had been broken.
The vibration damping effect of the SBS is overall better than the ARS in terms of strain response, as Figure 14e shows. This suggests that the functioning safety-belt device allowed the free tower to participate in bearing seismic action and reduced the strain response. Compared with the FS, the SBS performs better entirely, as Figure 14b,d,f show.

6. Conclusions

To improve the anti-seismic capability of a low-gravity-center cable-stayed bridge, a seismic structural system named the SBS was proposed. An experimental structure was constructed for shaking table tests. The anti-seismic performance of SBS was obtained. The advantages of the SBS were validated by comparison with the seismic performances of the ARS and the FS. The main research conclusions were as follows:
(1)
The installation of the safety-belt device has no obvious impact on the dynamic characteristics (self-vibration frequency) of the low-gravity-center cable-stayed bridge, before the activation of the safety-belt device. It will not influence the daily operation of the bridge. In the aspect of alleviating the influence of secondary internal force caused by the deformation of a girder, the SBS is the same as the ARS.
(2)
The seismic damage characteristics of low-gravity-center cable-stayed bridges are related to the type of structural system and the characteristics of seismic sites.
(3)
The safety-belt device can improve the seismic performance of low-gravity-center cable-stayed bridges. The functioning safety-belt device may reduce the internal force response of the restrained tower and the displacement response of the girder by letting the free tower with the safety-belt device bear the seismic action together.
(4)
The SBS has potential value in the seismic resistance of low-gravity-center cable-stayed bridges. In this paper, preliminary research was conducted on the seismic performance of the SBS low-gravity-center cable-stayed bridge by shaking table tests. The study on the seismic design theory and seismic fortification level division of the SBS low-gravity-center cable-stayed bridge should be carried out in the future.
Additionally, the core function of the SBS is to achieve a system conversion (from sliding support to fixed support) under great earthquake action. It is theoretically applicable to all bridge structures that require such systemic conversion. For instance, it can be installed at the free pier of continuous beam bridges to replace the conventional expansion joint and convert the sliding support into a bending resistant node. In addition, the modular design of the SBS allows convenient installation and prevents traffic from interruption.

7. Limitations and Recommendations

In this research, the SBS experimentally performed better than the ARS and the FS, but a more meticulous comparison between the SBS and the FAS is needed, so as to achieve a more precise verification for the superiority of the SBS. The constraint type of which the safety-belt device is installed changes after the activation and functioning. In this case, the SBS will be similar to the FAS. Thus, the differences between their seismic performance need to be clarified. Notably, the significant difference between them is the ductility of safety-belt device when it is fully locked. Under great earthquake action, the fully locked safety-belt device can be sacrificed to protect the concrete components. Meanwhile, the broken safety-belt device is easy to replace with a new one.
Additionally, the SBS has not been applied in real bridges. Further studies concentrating on the application of the SBS are needed, such as refined numerical and experimental research on the SBS application on different low-gravity-center cable-stayed bridges.
In this paper, only longitudinal direction earthquake action was considered. In fact, vertical earthquake action is also an important factor resulting in bridge damage. It is necessary to study the effect of vertical vibration on the SBS for systemically optimizing the design of the SBS. Furthermore, it is possible to quantify the vertical seismic response of the SBS by a computer-vision-based modal identification method for a more systemic assessment of the SBS seismic performance [33].
In addition, the temperature is also a factor affecting the durability and sensitivity of passive devices. It is necessary to study the effect of temperature on the performance degradation of the safety-belt device.

Author Contributions

Methodology, Q.L. and X.L.; Validation, Q.L. and R.F.; Resources, Z.W.; Writing—original draft, Q.L. and X.L.; Writing—review & editing, Q.L. and X.L. All authors have read and agreed to the published version of the manuscript.

Funding

This research received no external funding.

Data Availability Statement

Data are contained within the article.

Conflicts of Interest

The authors declare no conflict of interest.

References

  1. Chen, Y.; Wang, Y.; Zhang, W.; Liang, K.; Du, X. Simplified Criterion for Low Gravity Center Cable-Stayed Bridge Based on Response Spectrum Analyses. Sustainability 2022, 14, 10570. [Google Scholar] [CrossRef]
  2. Zhang, W.; Li, J.; Li, H. Study of Seismic Response Characteristics of Low Gravity Center Cable-Stayed Bridge. Bridge Constr. 2007, 5, 21–23+41. [Google Scholar]
  3. Franchini, A.; Sebastian, W.; D’Ayala, D. Surrogate-based fragility analysis and probabilistic optimisation of cable-stayed bridges subject to seismic loads. Eng. Struct. 2022, 256, 113949. [Google Scholar] [CrossRef]
  4. Li, H.; Liu, J.; Ou, J. Investigation of Seismic Damage of Cable-Stayed Bridges with Different Connection Configuration. J. Earthq. Tsunami 2009, 03, 227–247. [Google Scholar] [CrossRef]
  5. Xu, Y.; Zeng, S.; Duan, X.; Ji, D. Seismic experimental study on a concrete pylon from a typical medium span cable-stayed bridge. Front. Struct. Civ. Eng. 2018, 12, 401–411. [Google Scholar] [CrossRef]
  6. Javanmardi, A.; Ibrahim, Z.; Ghaedi, K.; Jameel, M.; Khatibi, H.; Suhatril, M. Seismic response characteristics of a base isolated cable-stayed bridge under moderate and strong ground motions. Arch. Civ. Mech. Eng. 2017, 17, 419–432. [Google Scholar] [CrossRef]
  7. Yoo, H.; Na, H.S.; Choi, D.H. Approximate method for estimation of collapse loads of steel cable-stayed bridges. Steel Constr. 2012, 72, 143–154. [Google Scholar] [CrossRef]
  8. Song, W.K.; Kim, S.E. Analysis of the overall collapse mechanism of cable-stayed bridges with different cable layouts. Eng. Struct. 2007, 29, 2133–2142. [Google Scholar] [CrossRef]
  9. Raheem, S.E.A.; Hayashikawa, T. Parametric Study on Steel Tower Seismic Response of Cable-Stayed Bridges Under Great Earthquake Ground Motion. Doboku Gakkai Ronbunshu 2003, 2003, 25–41. [Google Scholar] [CrossRef][Green Version]
  10. Guo, R. Research on Static and Dynamic Performance of Different Structural Systems of 140 m+240m+140m Single Cable-Stayed Bridge. Master’s Thesis, Shijiazhuang Tiedao University, Shijiazhuang, China, 2015. [Google Scholar]
  11. Ye, A.; Hu, S.; Fan, L. Research on Aseismatic Structural System of Cable-stayed Bridge. Bridge Constr. 2002, 4, 1–4. [Google Scholar][Green Version]
  12. Soong, T.T.; Spencer, B.F., Jr. Supplemental energy dissipation: State-of-the-art and state-of-the-practice. Eng. Struct. 2002, 24, 243–259. [Google Scholar] [CrossRef]
  13. Soong, T.T. Supplemental Energy Dissipation: State-of-the-Art and State-of-the-Practice. In Proceedings of the International Conference on Advances in Structural Dynamics Vol. I, Hong Kong, China, 13–15 December 2000. [Google Scholar]
  14. Shen, X.; Wang, X.; Ye, Q.; Ye, A. Seismic performance of Transverse Steel Damper seismic system for long span bridges. Eng. Struct. 2017, 141, 14–28. [Google Scholar] [CrossRef]
  15. Ahmad, F.; Rawat, S.; Yang, R.C.; Zhang, L.; Zhang, Y.X. Fire resistance and thermal performance of hybrid fibre-reinforced magnesium oxychloride cement-based composites. Constr. Build. Mater. 2025, 472, 140867. [Google Scholar] [CrossRef]
  16. Nasir, A.; Butt, F.; Ahmad, F. Enhanced mechanical and axial resilience of recycled plastic aggregate concrete reinforced with silica fume and fibers. Innov. Infrastruct. Solut. 2025, 10, 4. [Google Scholar] [CrossRef]
  17. Niu, J.; Ding, Y.; Shi, Y.; Li, Z. A simplified design method for metallic dampers used in the transverse direction of cable-stayed bridges. Earthq. Eng. Eng. Vib. 2020, 19, 15. [Google Scholar] [CrossRef]
  18. Raza, M.U.; Butt, F.; Ahmad, F.; Waqas, R.M. Seismic safety assessment of buildings and perceptions of earthquake risk among communities in Mingora, Swat, Pakistan. Innov. Infrastruct. Solut. 2025, 10, 124. [Google Scholar] [CrossRef]
  19. Ahmad, F.; Rawat, S.; Yang, R.; Zhang, L.; Fanna, D.J.; Soe, K.; Zhang, Y.X. Effect of metakaolin and ground granulated blast furnace slag on the performance of hybrid fibre-reinforced magnesium oxychloride cement-based composites. Int. J. Civ. Eng. 2025, 23, 853–868. [Google Scholar] [CrossRef]
  20. Ahmad, F.; Qureshi, M.I.; Rawat, S.; Alkharisi, M.K.; Alturki, M. E-waste in concrete construction: Recycling, applications, and impact on mechanical, durability, and thermal properties—A review. Innov. Infrastruct. Solut. 2025, 10, 246. [Google Scholar] [CrossRef]
  21. Rawat, S.; Saliba, P.; Estephan, P.C.; Ahmad, F.; Zhang, Y. Mechanical performance of hybrid fibre reinforced magnesium oxychloride cement-based composites at ambient and elevated temperature. Buildings 2024, 14, 270. [Google Scholar] [CrossRef]
  22. Pang, Y. Seismic Fragility Assessment of an Isolated Multipylon Cable-Stayed Bridge Using Shaking Table Tests. Adv. Civ. Eng. 2017, 2017, 9514086. [Google Scholar] [CrossRef]
  23. Li, J.; Yan, J.; Peng, T.; Han, L. Shake Table Studies of Seismic Structural Systems of a Taizhou Changjiang Highway Bridge Model. J. Bridge Eng. 2015, 20, 04014065. [Google Scholar] [CrossRef]
  24. Zhou, R.; Zong, Z.H.; Huang, X.Y.; Xia, Z.H. Seismic response study on a multi-span cable-stayed bridge scale model under multi-support excitations. Part II: Numerical analysis. J. Zhejiang Univ. Sci. A Appl. Phys. Eng. 2014, 15, 405–418. [Google Scholar] [CrossRef]
  25. Zong, Z.H.; Zhou, R.; Huang, X.Y.; Xia, Z.H. Seismic response study on a multi-span cable-stayed bridge scale model under multi-support excitations. Part I: Shaking table tests. J. Zhejiang Univ. Sci. A Appl. Phys. Eng. 2014, 15, 351–363. [Google Scholar] [CrossRef]
  26. Wang, Z.; Zhang, W.; Fang, R.; Zhao, H. Dynamic Model Testing of Low-Gravity-Center Cable-Stayed Bridges with Different Girder-to-Tower Connections. J. Bridge Eng. 2021, 26, 04020112. [Google Scholar] [CrossRef]
  27. Zhao, L.; Huang, J.; Zhang, W. Influence of Height of Gravity Center on Tower-girder Elastic Connecting Device’s Damping Effect in Cable-stayed Bridge. Highway 2015, 60, 79–82. [Google Scholar]
  28. Yi, R.; Li, X.; Zhu, S.; Li, Y.; Xu, X. A deep leaning method for dynamic vibration analysis of bridges subjected to uniform seismic excitation. Soil Dyn. Earthq. Eng. 2023, 168, 107830. [Google Scholar] [CrossRef]
  29. Zhang, J.; Yang, Z.Y.; Yuan, D.P.; Zheng, S.X.; Hu, Y.R. Seismic Response of Two Site Models and Their Effects on the Railway Cable-Stayed Bridge. KSCE J. Civ. Eng. 2021, 25, 4724–4741. [Google Scholar] [CrossRef]
  30. Fang, R.; Zhang, W.; Chen, Y.; Zhang, L. Aseismic effect and parametric analysis of the safe-belt device for a continuous bridge with equal height piers. Eng. Struct. 2019, 199, 109553. [Google Scholar] [CrossRef]
  31. Ahamed, I.Z.A.K.; Magar, R.B. Dynamic Response of Cable-Stayed Bridge Under Seismic Vulnerability Analysis: State of the Art. In Emerging Trends in Composite Structures Select Proceedings of ICC-IDEA 2023; Lecture Notes in Civil Engineering; Springer: Singapore, 2024; Volume 387. [Google Scholar]
  32. Yan, X.; Cunyu, C.; Zeng, Z.; Shijie, Z. Shake table experimental study of cable-stayed bridges with two different design strategies of H-shaped towers. Earthq. Eng. Eng. Vib. 2021, 20, 483–493. [Google Scholar] [CrossRef]
  33. Liao, R.; Zhang, Y.; Wang, H.; Lu, L.; Chen, Z.; Wang, X.; Zuo, W. An effective ship detection approach combining lightweight networks with supervised simulation-to-reality domain adaptation. Comput.‐Aided Civ. Infrastruct. Eng. 2025, 1–26. [Google Scholar] [CrossRef]
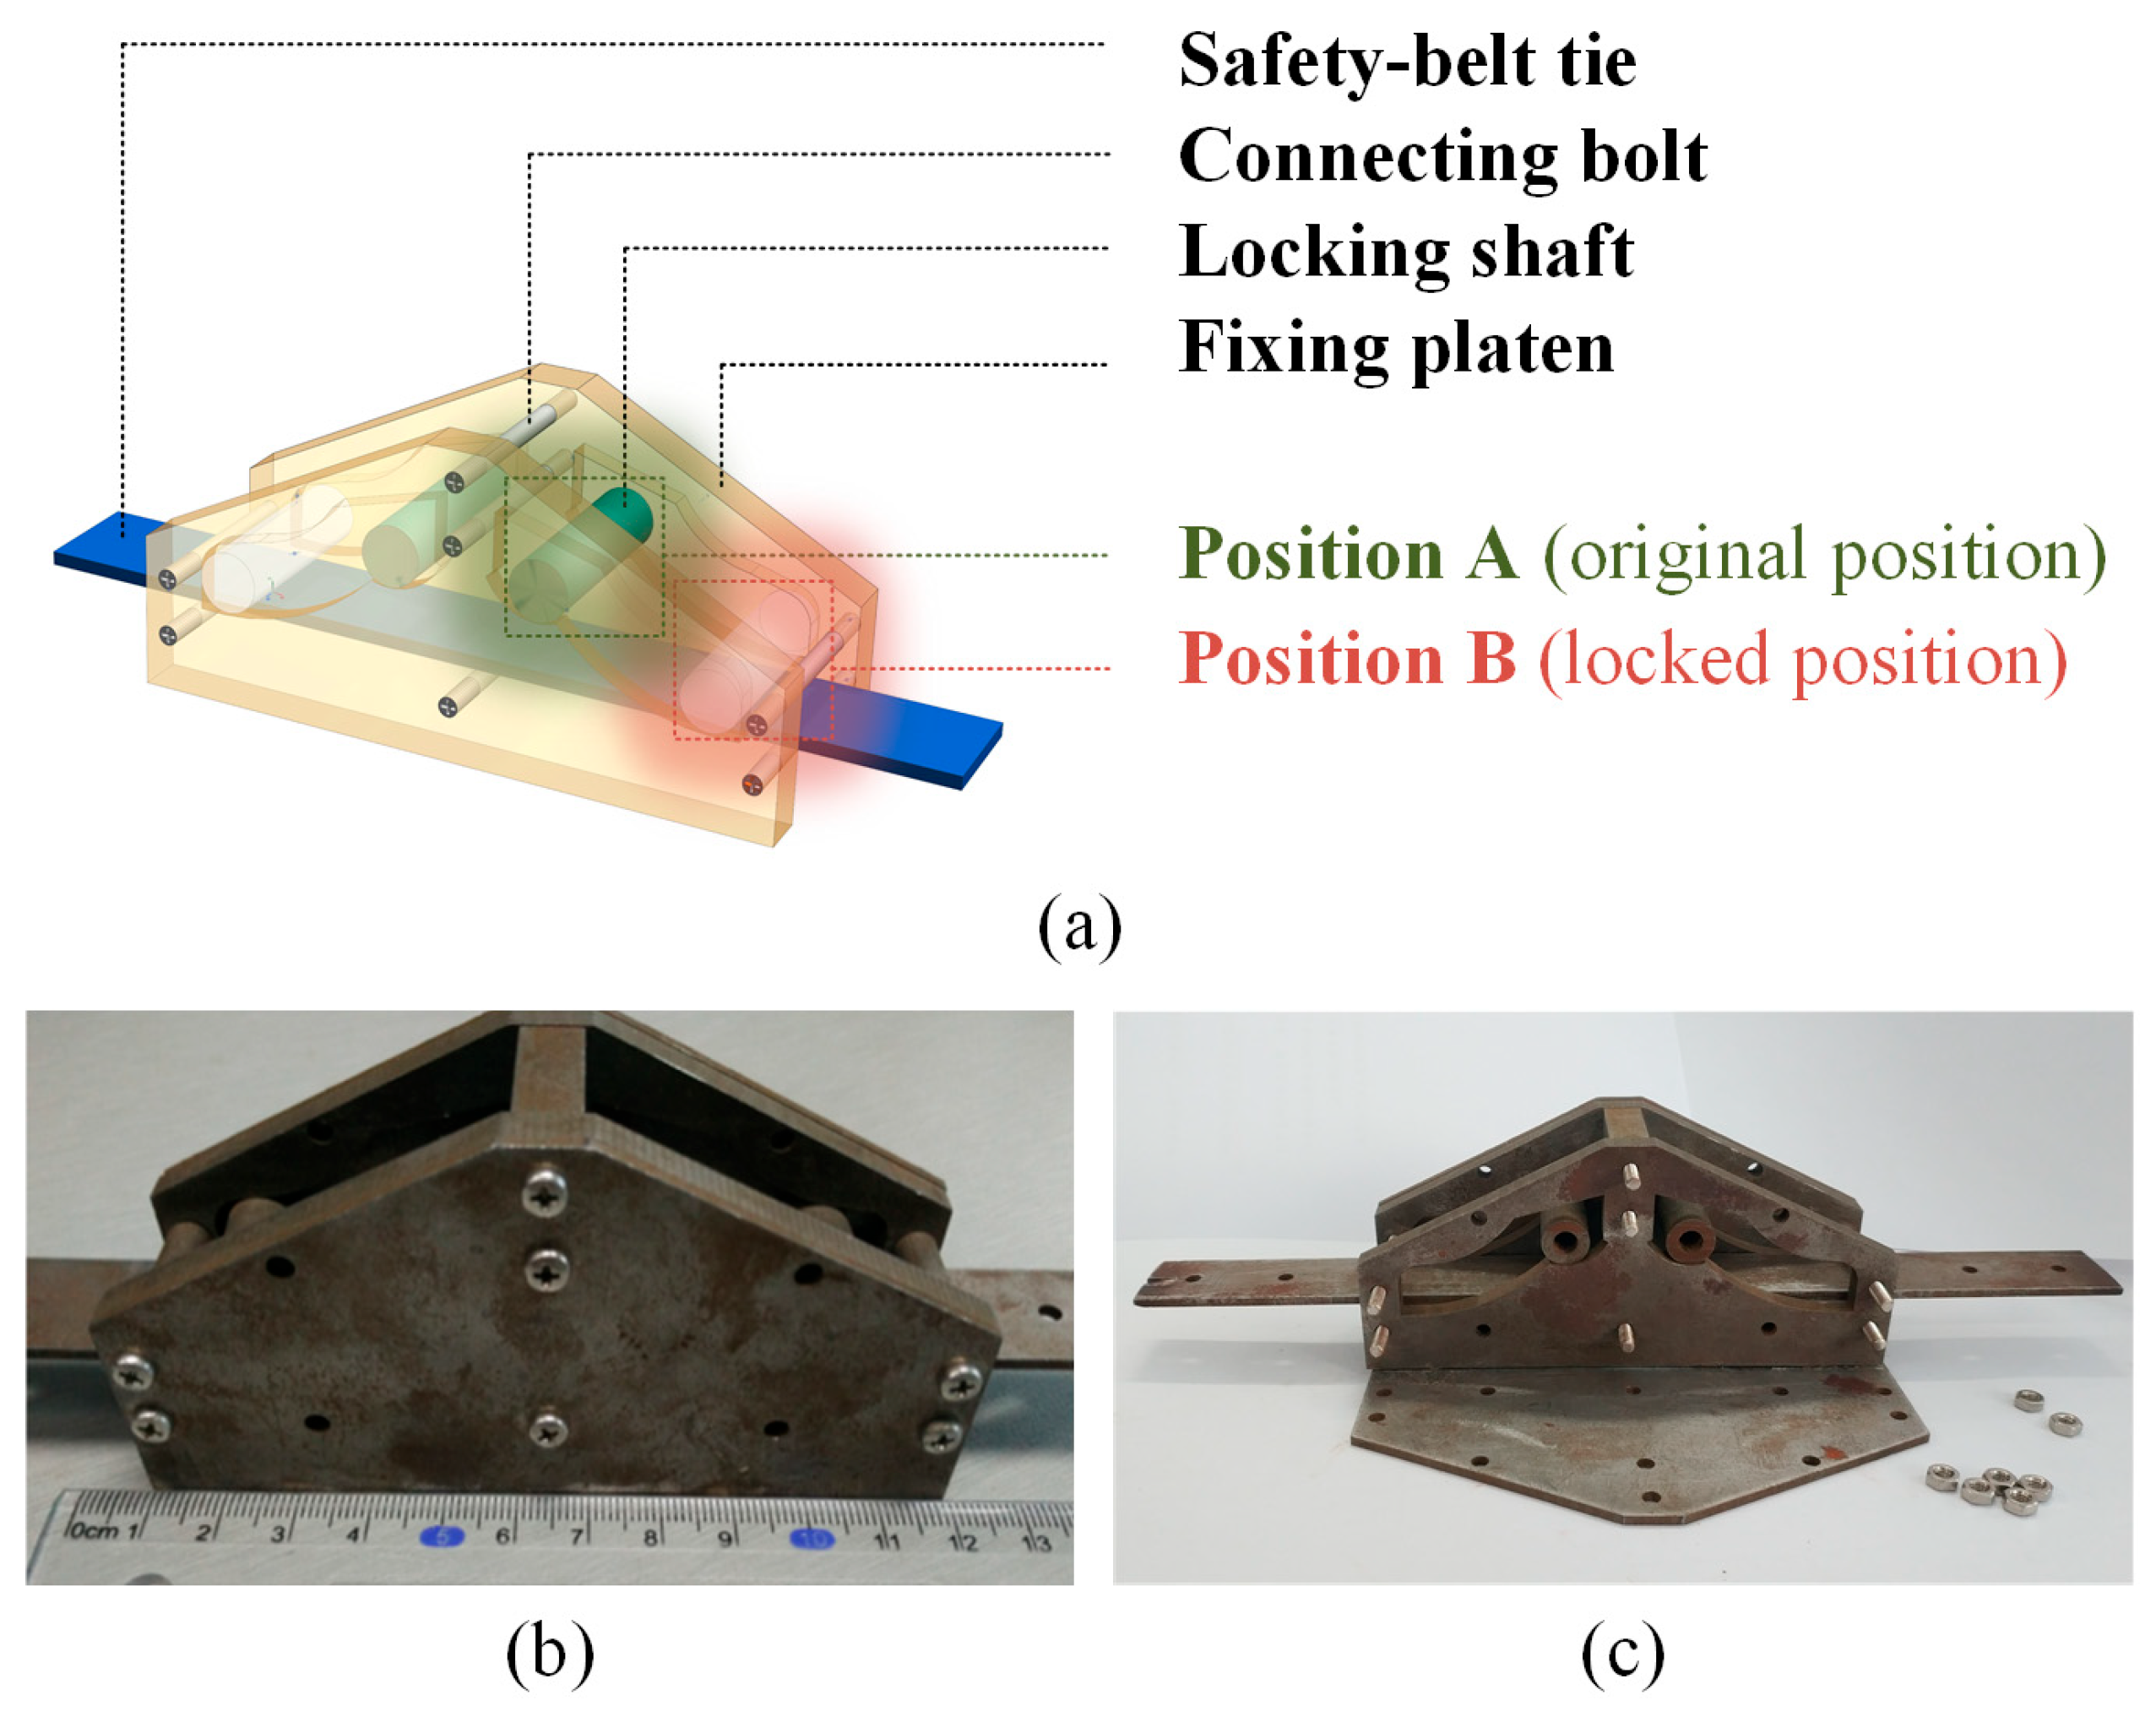
Figure 1. Structure of safety-belt device: (a) configuration of safety-belt device; (b) safety-belt device after installation; and (c) safety-belt device before installation.
Buildings 15 03268 g001
Figure 2. Mechanical principle and force–displacement relationship: (a) mechanical principle of safety-belt device; (b) force–displacement relationship of safety-belt device.
Buildings 15 03268 g002
Figure 3. Support types: (a) Connection of safety-belt device; (b) Fixed support constraint and (c) Free-sliding constraint.
Buildings 15 03268 g003
Figure 4. Structural design: (a) tower (unit: mm) and (b) girder (unit: mm).
Buildings 15 03268 g004
Figure 5. Acceleration time-history curves of ground motions: (a) ELC wave; (b) TJ wave; (c) EMC wave; and (d) SA wave.
Buildings 15 03268 g005
Figure 6. Arrangement of shaking table test: (a) arrangement of sensors and (b) experimental structure.
Buildings 15 03268 g006
Figure 7. Self-vibration frequencies of the three anti-seismic structural systems.
Buildings 15 03268 g007
Figure 11. Displacement response of tower and girder under different waves: (a) tower response under ELC; (b) tower response under TJ; (c) tower response under EMC; (d) tower response under SA; (e) girder response under ELC; (f) girder response under TJ; (g) girder response under EMC; and (h) girder response under SA.
Buildings 15 03268 g011
Figure 12. Acceleration response of tower and girder under different waves: (a) tower response under ELC; (b) tower response under TJ; (c) tower response under EMC; (d) tower response under SA; (e) girder response under ELC; (f) girder response under TJ; (g) girder response under EMC; and (h) girder response under SA.
Buildings 15 03268 g012
Figure 13. Strain response of 1# and 2# tower: (a) 1# tower response under ELC; (b) 1# tower response under TJ; (c) 1# tower response under EMC; (d) 1# tower response under SA; (e) 2# tower response under ELC; (f) 2# tower response under TJ; (g) 2# tower response under EMC; and (h) 2# tower response under SA.
Buildings 15 03268 g013
Figure 14. Decreasing amplitude effect of displacement and strain: (a) Decreasing amplitude ratio of tower displacement compared with ARS, (b) Decreasing amplitude ratio of tower displacement compared with FS; (c) Decreasing amplitude ratio of girder displacement compared with ARS; (d) Decreasing amplitude ratio of girder displacement compared with FS; (e) Decreasing amplitude ratio of strain compared with ARS; (f) Decreasing amplitude ratio of strain compared with FS.
Buildings 15 03268 g014
Table 1. Required scaling factors for the concrete towers.
TypePhysics
Parameters
SymbolSimilarity Ratio
(Model/Prototype)
Geometry propertyGeometrySl0.0133
Material propertiesStrain1.0
Elastic modulusSE = Sσ0.3
StressSσ0.3
Mass densitySρ = SE/SaSL22.5
Poisson’s ratioSμ1.0
MassSm = SρSl30.000053
Dynamic
properties
TimeSt = (Sm/Sk) 0.50.1155
FrequencySf = 1/St8.66
Damping ratioSc = Sm/St0.00046
VelocitySv = Sl/St0.1155
AccelerationSa1.0
Table 2. Constraint types of different structural systems.
Classification1# Tower–Girder Connection2# Tower–Girder Connection
FSFree slidingFree sliding
ARSFixed constraintFree sliding
SBSFixed constraintSafety-belt device
Table 3. Test result of micro concrete and steel bar specimens.
IndexCompressive Strength of Concrete (MPa)Elastic Modulus of Concrete (GPa)Yield Stress of Steel Bar (MPa)
Measured value17.5712.1367
16.8210.1362
15.6414.14376
Average value16.6812.11368
Table 4. Additional masses of the single tower and steel girder.
ComponentSelf-Weight (kg)Additional Mass (kg)Total Mass (kg)Theoretical Mass (kg)
Steel girder193.36320513.36514.13
Single tower82.71140222.71224.64
Table 5. PGA when the safety-belt device was activated and functioned.
Seismic WavesELCTJEMCSA
PGA (Activated)0.4 g0.3 g1.0 g0.5 g
PGA (Functioned)0.8 g0.5 g1.0 g0.8 g
Table 9. Observed damage details.
PGAFSARSSBS
0.5 g2 cracks occurred (1# tower)
1 crack occurred (2# tower)
No damageNo damage
0.6 g1 new crack occurred (2# tower)
Pier-girder collision
No damageNo damage
0.7 g1 crack occurred (1# tower)
1 crack occurred (1# tower fixed pier)
No damage
0.8 g4 parallel cracks occurred (2# tower)
2 cracks occurred (2# tower)
Original cracks extended (1# tower)
Concrete fragmentation (1# tower)
Concrete fragmentation
(of 1# tower crossbeam)
1.0 gIntense pier-girder collision
(ELC, TJ, and SA wave)
Horizontal cracks occurred
(1# tower column)
Original cracks extended
(1# tower bottom)
1.1 gOutmost stayed cable unanchored
(2# tower)
Penetrating cracks occurred
(1# tower bottom)
Intense fragmentation occurred
(1# tower column corner)
Original cracks extended
(1# tower bottom)
1.2 g1 new crack occurred (1# tower)
1 oblique crack occurred (1# tower)
1.4 gIntense fragmentation
(1# tower lower crossbeam)
Plenty of cracks occurred (1# tower)
Bolt was broken
(safety belt device)
Disclaimer/Publisher’s Note: The statements, opinions and data contained in all publications are solely those of the individual author(s) and contributor(s) and not of MDPI and/or the editor(s). MDPI and/or the editor(s) disclaim responsibility for any injury to people or property resulting from any ideas, methods, instructions or products referred to in the content.