Article

Post-Fire Performance of Bolted Steel T-Joints with Varying Coating Thicknesses: Experimental and Finite Element Analysis

1
Department of Civil Engineering, Faculty of Engineering, Sakarya University, 54200 Sakarya, Türkiye
2
Civil Engineering Department, Faculty of Engineering and Architecture, Erzurum Technical University, 25010 Erzurum, Türkiye
3
Maali Çelik Ar-Ge Danışmanlık, Müh. İnş. Taah. Tarım ve Hayvancılık Company, Atateknokent, 25030 Erzurum, Türkiye
4
Department of Civil Engineering, Atatürk University, 25030 Erzurum, Türkiye
5
ACADEMY Sağlık Hiz. Müh. İnş. Taah. Elekt. Yay. Trade Industry Ltd. Co., Atateknokent, 25030 Erzurum, Türkiye
*
Author to whom correspondence should be addressed.
Buildings 2025, 15(18), 3257; https://doi.org/10.3390/buildings15183257
Submission received: 20 July 2025 / Revised: 25 August 2025 / Accepted: 1 September 2025 / Published: 9 September 2025

Abstract

This study investigates the structural performance of bolted T-joints in steel elements exposed to elevated temperatures, with a focus on the influence of fire-resistant coatings. A total of 36 T-joint specimens were tested under four different temperature levels (300 °C, 450 °C, 600 °C, and 900 °C), incorporating three IPE section sizes and three fire-resistant paint thicknesses (200 µm, 400 µm, and 600 µm). The experimental program aimed to evaluate the combined effects of temperature, cross-sectional geometry, and coating thickness on the axial load-bearing capacity and deformation characteristics of T-joints. To examine the influence of web geometry, T-sections were designed in accordance with Eurocode 3, and the flange-to-web thickness ratios (tf/tw) were varied between 1.52 and 1.58. Results showed that applying 200 µm and 400 µm coatings at 300 °C and 450 °C improved the axial load capacity by approximately 10% and 20%, respectively, compared to uncoated specimens. However, effective fire protection at higher temperatures (600 °C and 900 °C) required a minimum coating thickness exceeding 400 µm. Finite Element Models developed using ABAQUS (2017) were designed to predict post-fire load–displacement behavior, stiffness degradation, and failure modes. Predictions were validated against experimental results, with deviations ranging from 0.97% to 9.73% for maximum load and 1.18% to 42.13% for energy dissipation, confirming the model’s reliability in simulating the thermo-mechanical response of steel joints under fire exposure.

1. Introduction

Column–beam connections play a crucial role in all frame-type structural systems (Figure 1). Ensuring the integrity of these connections under all loads and conditions is paramount for the safety of entire buildings. These connections could potentially lose their integrity due to unpredictable or repetitive dynamic loads or high heat from fires. The likelihood of fire, compounded by damage to gas and power lines after an earthquake, could block access to firefighting equipment, and damage fire detection, alarm, and suppression systems, making it challenging to combat the numerous fires that commonly occur shortly after an earthquake.
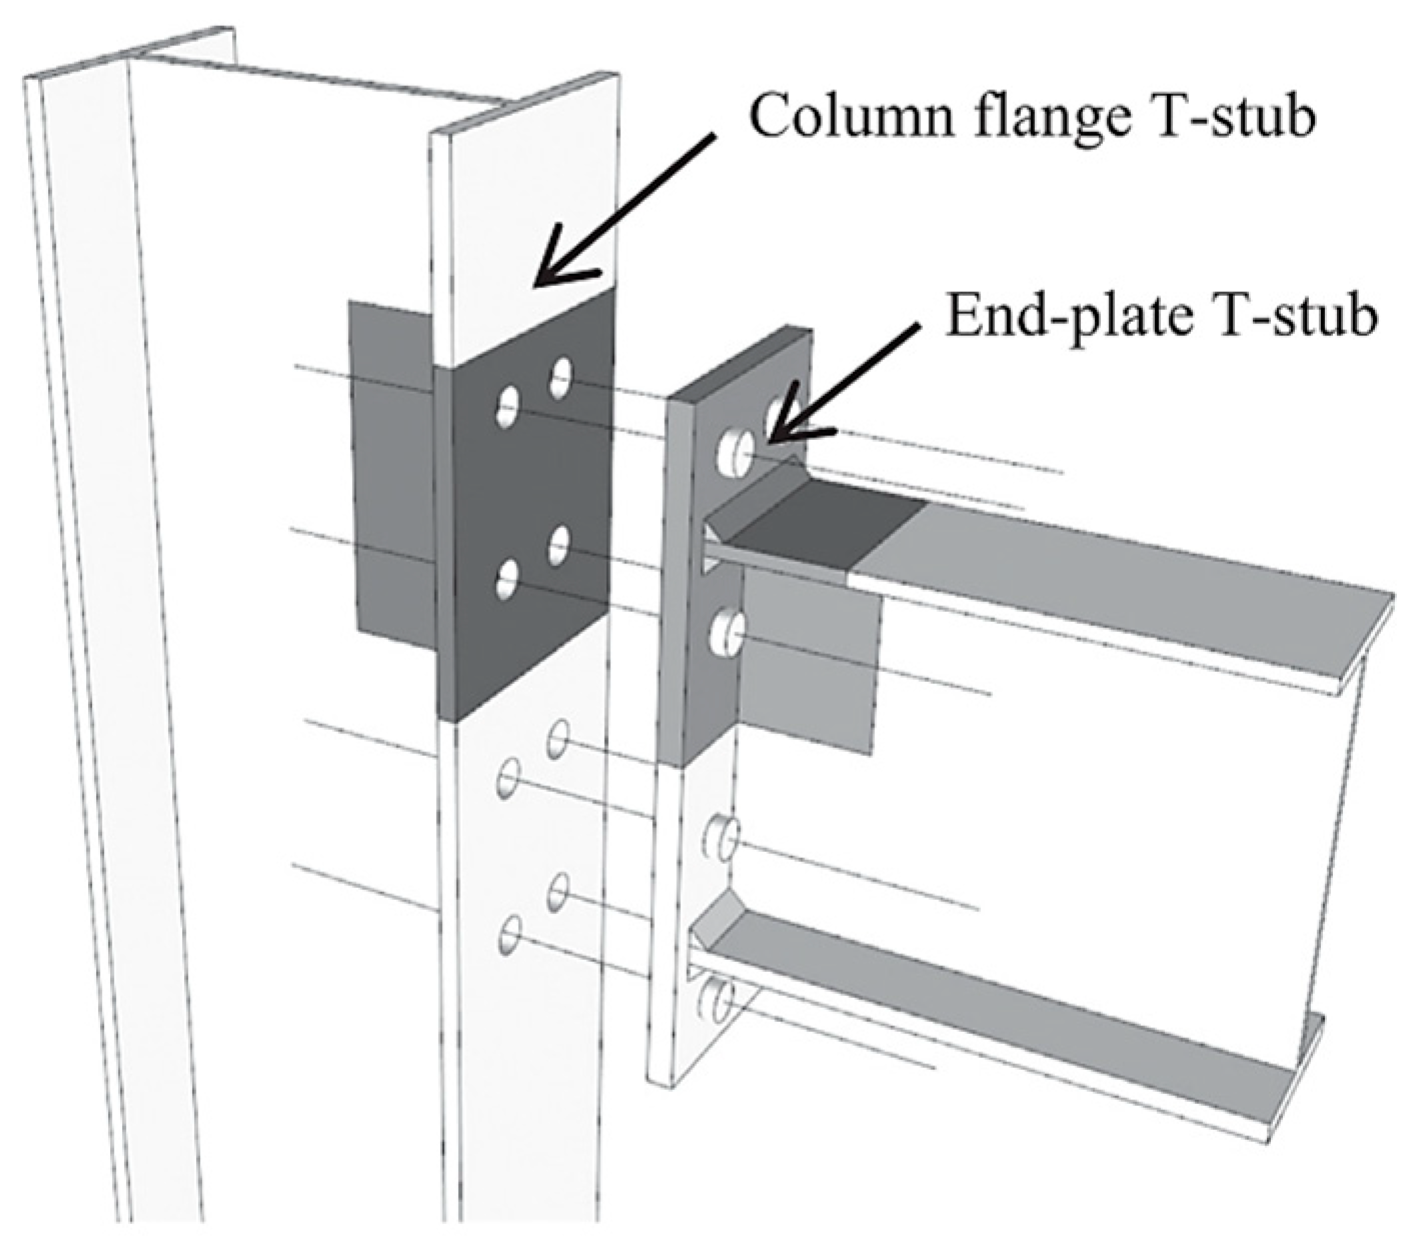
Fire safety is particularly important for steel structures due to their low fire resistance. Fires can damage these structures, causing fragmentation and loss of strength at the joints. The safety of column–beam joints is crucial for preserving the integrity of the entire system. There are various design possibilities for column–beam connections in steel structures. A common model used is the T-stub model [1,2,3,4,5]. The T-stub model is employed to assess the performance of components under tension, known for their high deformation capability and contribution to joint ductility, such as the bending column flange and the end plate. A T-stub is a T-shaped section fastened in the connection’s tension area (Figure 2) [6,7]. These T-stub models can be created using either bolts or welding. Bolted connections are often favored over welded connections in steel structures due to their ease of installation, low dependence on labor skills, and weather resistance. Nevertheless, fire poses a substantial risk to these connections, as it can rapidly degrade the steel’s strength and potentially lead to structural collapse. Extensive research, including studies by [8,9,10,11,12], has been undertaken to understand the behavior of different types of bolted connections in fire conditions. The frequency of fires compared to other disasters, such as earthquakes and tsunamis, necessitates an improved focus on building fire performance.
The catastrophic collapse of the World Trade Centre (WTC) in 2001 following terrorist attacks underscored the imperative need for enhanced focus on the robustness of steel structures under accidental loadings, including impacts, explosions, and particularly, fires [13,14]. The event illuminated certain deficiencies in design and construction techniques related to structural steel connections, which underperformed when subjected to the combination of impact loading and subsequent fire [15]. The structural failure of the WTC was not attributable solely to the initial impact. In steel structures, an impact typically causes localized damage to the directly affected area. However, the ensuing fire played a more consequential role in the structure’s collapse. In the face of high temperatures, connections at the ends of heated steel beams—being the first link in the load path of gravity loading—are potentially the most susceptible components [15].
Failure of these joints could instigate a chain reaction, precipitating a progressive collapse of floors under the compounded effects of impact and overload, facilitating the propagation of fire between stories, and eventually leading to the collapse of unsupported columns on the intermediate floors. Consequently, it was not the initial impact, but the subsequent fire that was primarily responsible for the widespread damage and the eventual failure of the entire structure. This pivotal insight underscores the urgent need for intensified research into bolstering the fire resistance of steel structures, particularly focusing on their connections, as a strategy to prevent analogous catastrophic failures in the future. Therefore, a substantial amount of scholarly attention has been devoted to the study of the post-fire behaviors of structural members, including bolted joints [16,17,18,19,20,21]. The T-stub model is a widely used simplification of tension areas in end-plate connections, aiding the investigation of the tensile behavior of different bolts under various conditions [1,22,23,24,25]. Different design codes, such as Eurocode 3, AIJ (Architectural Institute of Japan), and BS5950, provide varied predictions of bolt strength at high temperatures [26,27,28].
A focus has been placed on the impact of temperature, with several studies examining numerical models of bolts under high temperatures [29] and their fracture behavior [9], and sliding behavior [11]. The importance of the continuity and ductility of joints in preventing disproportionate collapse in joint areas has been highlighted [30].
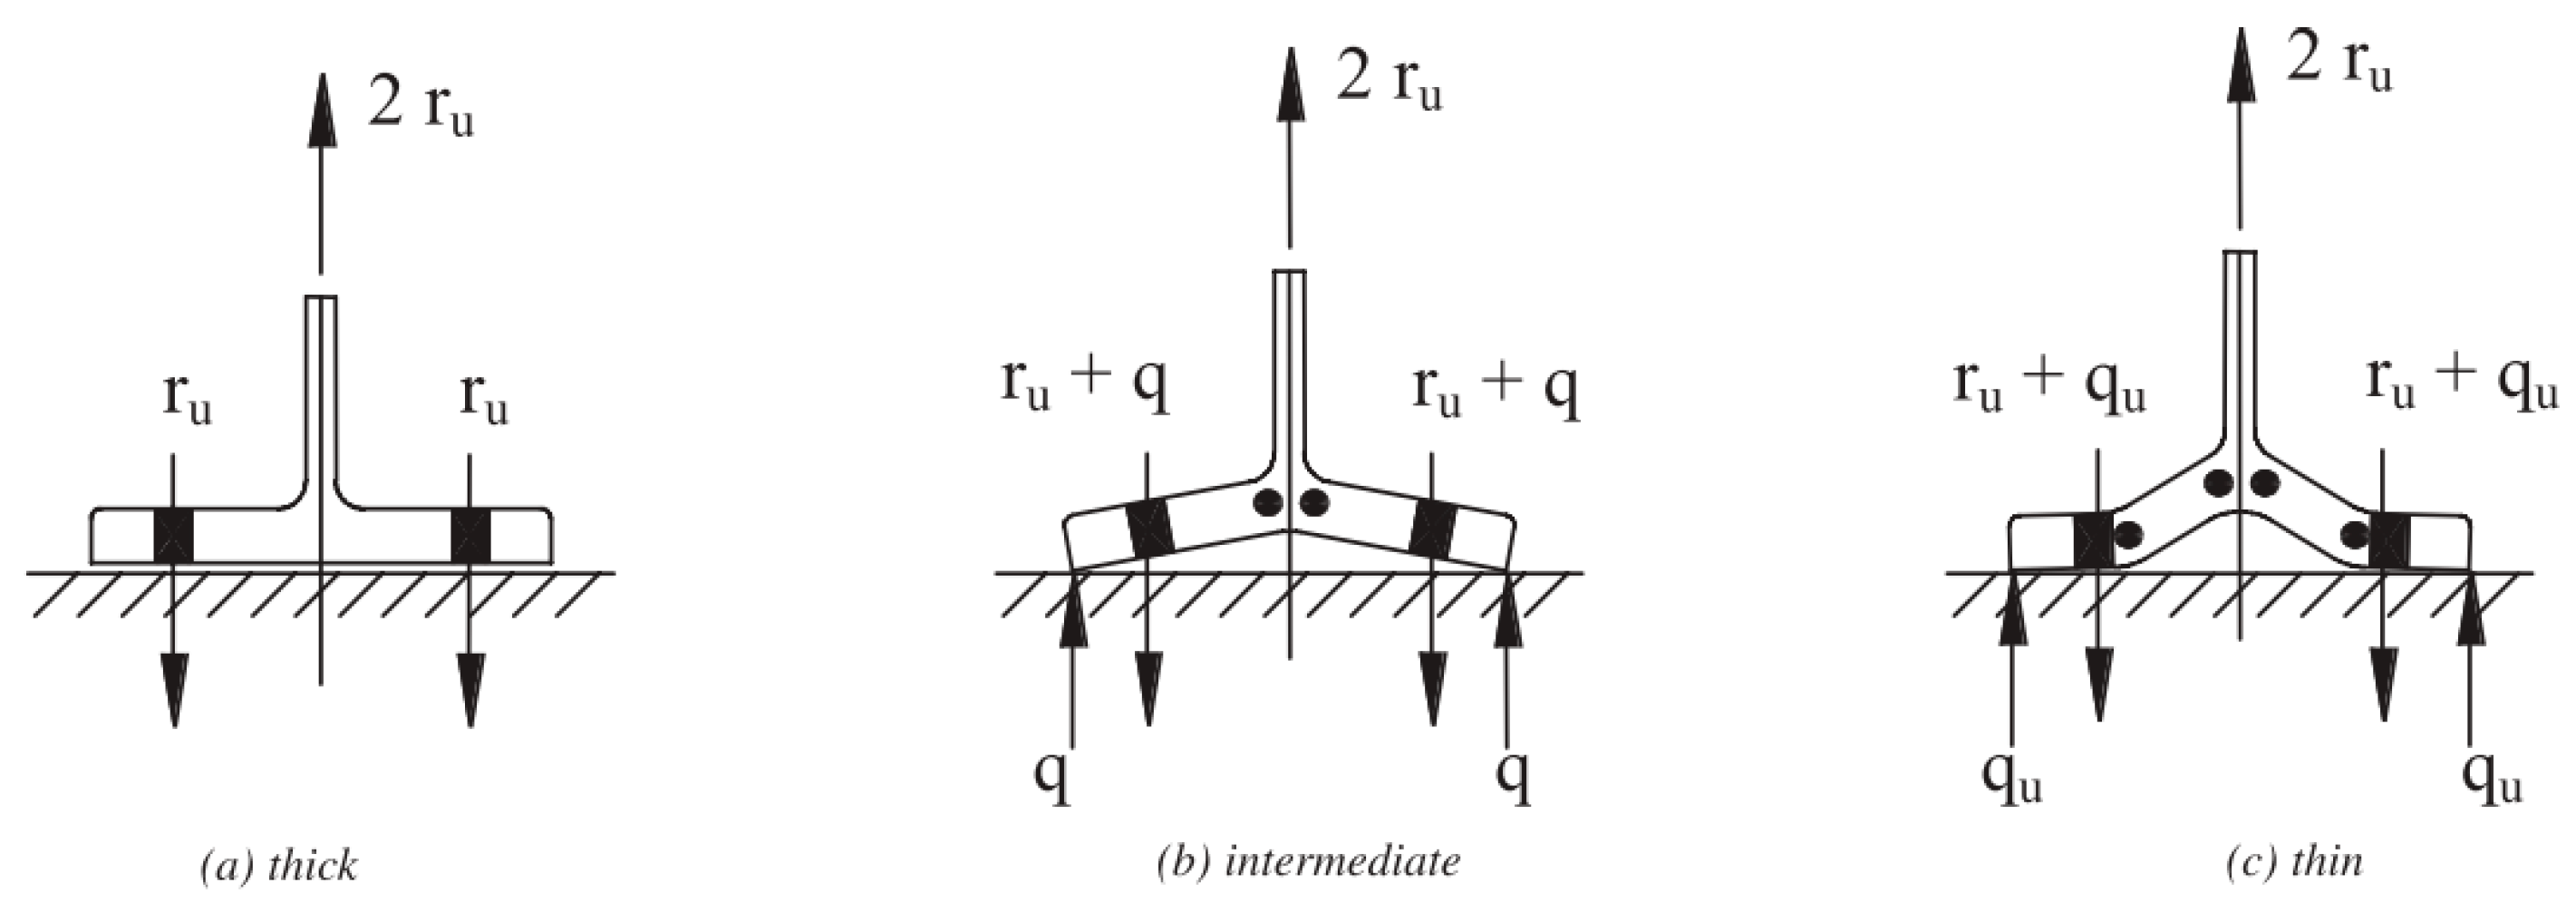
T-stub connections serve as an important model for understanding the behavior of beams connected to rigid columns and tension elements connected to rigid beams, and have been incorporated into regulations [4,31]. The first modeling of the connection region as a T-stub connection was proposed by Zoetemeijer [32] in 1974. According to the Component Method in Eurocode 3 part 8.1, it is proposed that the T-stub connection model is used to determine the mechanical properties of the bolts that provide the connection between the end plate and the column flange in momentum transfer connections. The tensile force value of T-stub models can be examined by taking advantage of the symmetry of their connections [10,12]. In the T-stub connection, the tensile force applied to the bolts changes the value of the prying action, which is expressed as buoyancy. Buoyancy is due to the eccentricity between the bolt line and the tensile force, and its value varies with flange thickness and flexural rigidity (Figure 3) [33,34] and the position of the bolts [4]. As Herrera et al. [35] stated in their experimental and numerical studies, the bending of the bolts is caused by the prying effect. Since prying action increases the pulling force on the bolt, it can cause the connection to displace more quickly. This force is often overlooked, yet it is quite significant [36]. The bending of the flange and the tensile and bending strength of the bolt are effective in reaching the limit value of the T-stub connection [37,38].
Experiments on the connection formed with high-strength bolts by Douty and McGuire and Nair et al. [36,37,38,39] showed that the strength of the bolts was effective in reaching the limit value of the connection. In another study, different types of bolts, referred to as hole-anchored bolts, were used in the connection and it was observed that the connection strength of anchored bolts after fire was greater than for other bolts [23,25,40]. Additionally, connections using four bolts in T-stub connections displayed more uniform energy distributions than those with two bolts [24]. To understand which flange and bolt are more effective in T-stub connections, experiments have been conducted on the connections formed with high-strength bolts [36,37,38,39]. It has been shown that the strength of the bolts was effective in reaching the limit value of the connection. The susceptibility of T-stub joints to disruptions when exposed to high temperatures can potentially cause fractures or runoffs, prompting a cascade of failures across an entire steel structure [19,41]. Consequently, various techniques have been employed to enhance the fire resistance of steel elements. Among the most prevalent is the use of intumescent coatings, which swell to form an insulating char that delays heat transfer and reduces temperature rise in steel members. Recent reviews and studies document their performance on structural steel and provide thermal property data and design guidance, as well as validated approaches for finite element/thermal modeling of coated members (e.g., temperature-dependent conductivity/specific heat, swelling/char growth laws, and coupled thermo-mechanical responses). Additionally, several studies have demonstrated FE implementations (ABAQUS/SAFIR) calibrated against fire tests of protected steel elements. For outdoor or aggressive environments, epoxy-based systems (often zinc-rich primers) and polyurethane topcoats are widely used to provide durable protection (corrosion + weathering) and can be combined with fire-protective layers where required [42,43,44,45,46,47]. Moreover, these coatings minimize thermal conductivity while providing elasticity, hardness, and durability. However, their effectiveness can be considerably reduced when exposed to water and moisture [48].

1.1. Aim and Innovation of the Study

This study aims to quantify how protective coating thickness and connection geometry affect the post-fire (after cooling) structural performance of bolted T-stub joints fabricated from standard IPE sections. To this end, a comprehensive experimental–numerical program was conducted to examine the influence of geometric parameters, thermal exposure, and coating thickness on load–deformation response and failure modes. Using three different IPE sections, a total of 36 T-stub specimens were prepared. Each specimen was coated at prescribed thicknesses with an intumescent, fire-resistant paint and subjected to four elevated temperature regimes.
Widely preferred for its relatively low environmental impact and thin-film application, intumescent fire coatings function as thermal barriers by expanding under heat and insulating a steel surface. To evaluate the effect of web length on load–deformation response, T-sections were proportioned in accordance with Eurocode 3. In addition, the flange-to-web thickness ratio (tf/tw) was taken as dictated by the as-rolled dimensions of the selected IPE profiles and evaluated in the range of approximately 0.57–0.65. In this way, the influence of this ratio on deformation characteristics was investigated. The experimental findings were validated with finite element models developed in Abaqus, after which parametric analyses were performed to identify the critical factors governing post-fire residual load-bearing capacity, stiffness retention, and energy dissipation.
A distinctive aspect of this study is the production of weld-free T-joints by using standard IPE profiles instead of conventional welded plate fabrication. This strategy eliminates issues such as local stress concentrations and strength reductions that can occur in weld regions, enabling a clear and realistic examination of how geometry and coating thickness affect post-fire behavior. Considering the limited literature on weld-free T-joints under fire exposure, the findings provide new insights and actionable design guidance. Overall, the results emphasize that protective coatings and realistic section geometries jointly play a critical role in improving the fire resistance and structural integrity of steel connections exposed to high temperatures and subsequently returned to service.

1.2. T-Stub Connections in Eurocode 3

The stress fields due to tension and compression in T-stub connection regions commonly found in beam–column joints, as according to Eurocode 3, are shown in Figure 1. The literature defines regions exhibiting T-stub behavior in beam and column sections within beam–column connections (Figure 2). In bolted connections, a T-stub under tension can be used to simulate the bending of the end plate, flange cleat, and base plate. The behavior of flange and end plates in T-stub connections exposed to axial tension is analyzed in three ways according to Eurocode 3 (Figure 3).
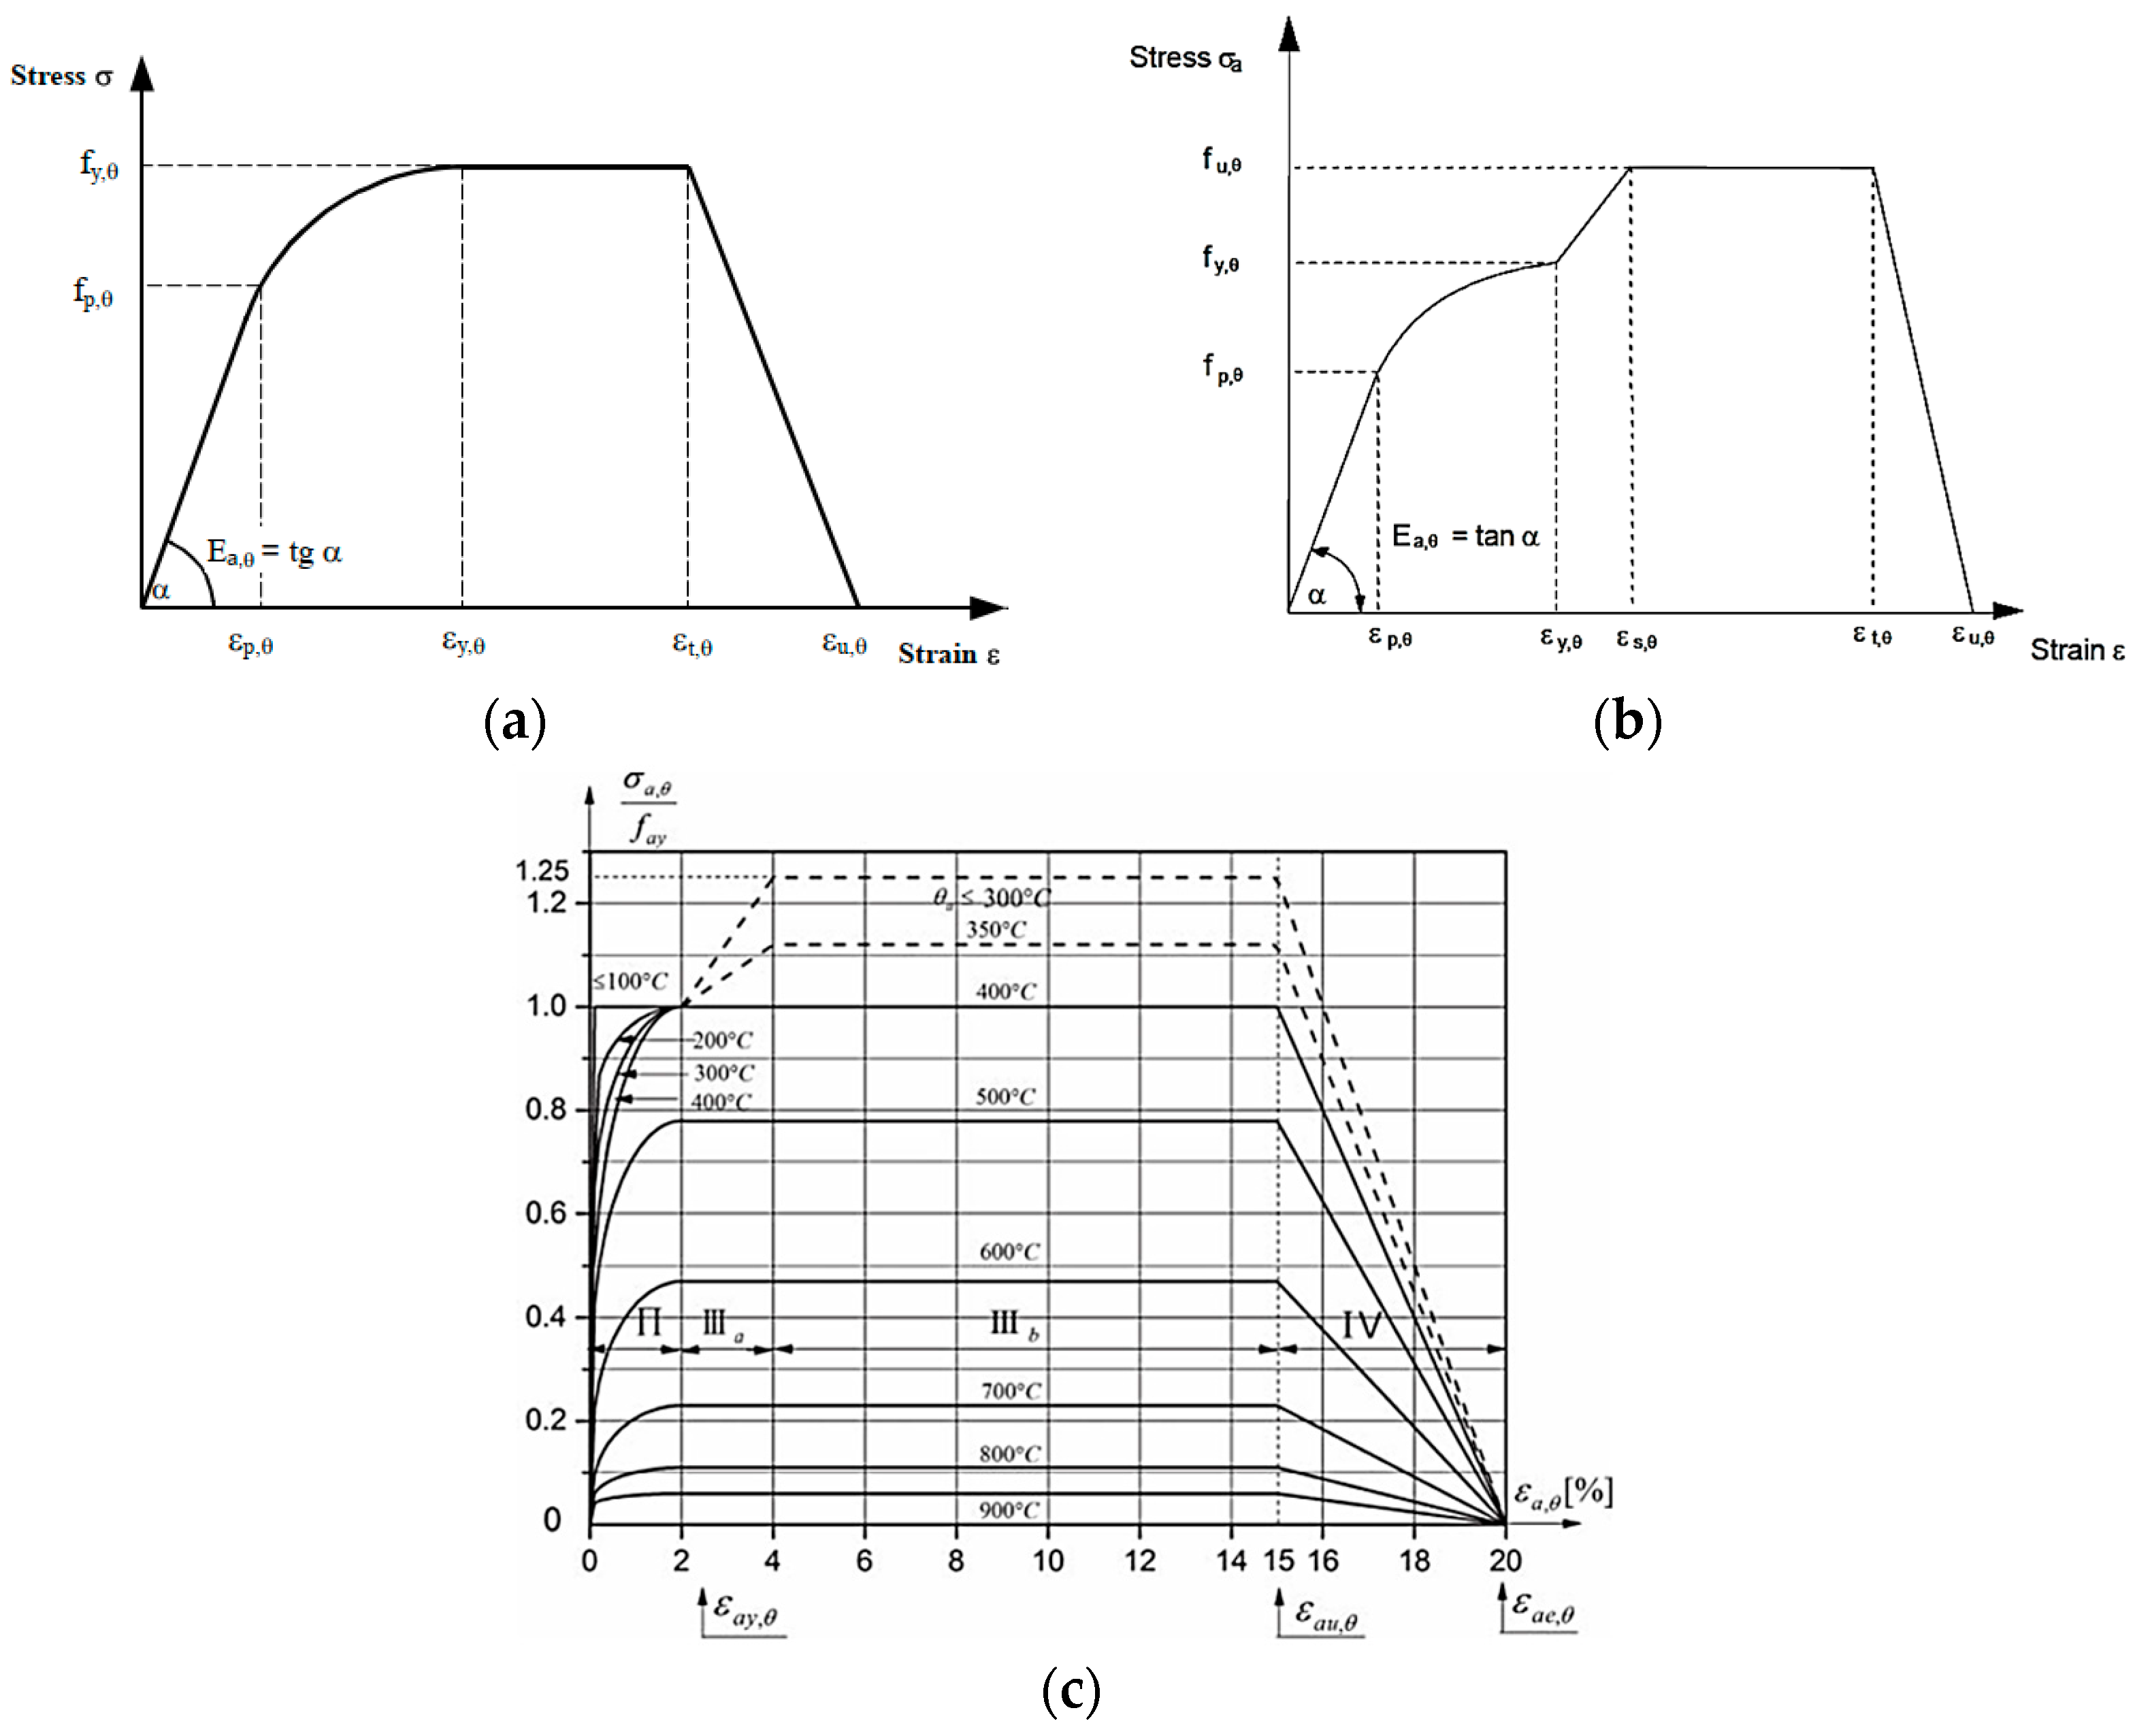
Eurocode 3 stipulates the stress–strain relationship of carbon steel exposed to high temperatures, as in Figure 4a. It states that as long as the highest temperature is below 400 °C, if there are no delicate parts in the cross-section as an alternative to the stress–strain graph shown in Figure 4a, i.e., if local buckling does not occur, the hardening stress–strain graph provided in Figure 4b can be used. Depending on the temperature value, the hardening stress–strain graph is accepted as in Figure 4c.

2. Experimental Study

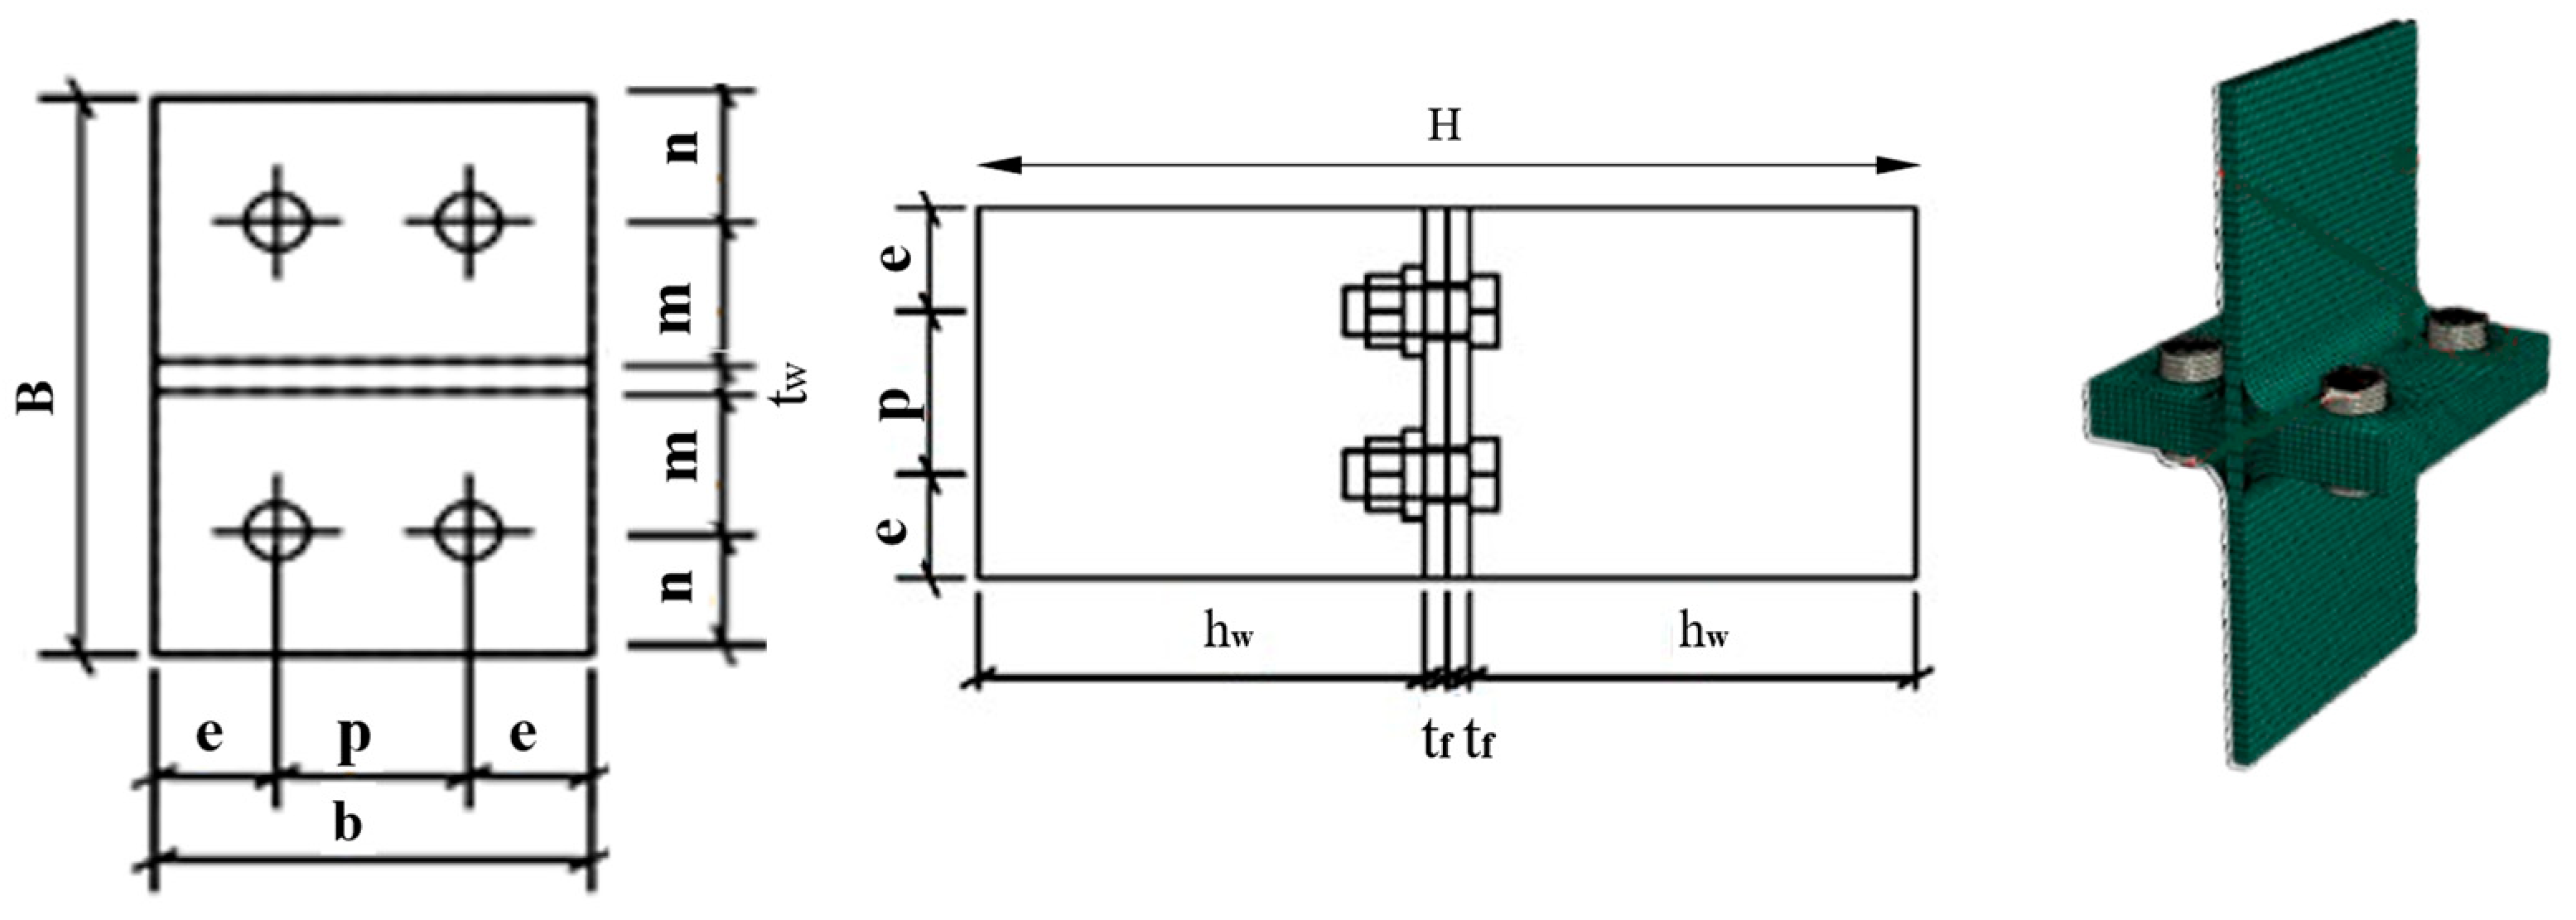
The geometric parameters for T-joints which were subjected to the axial tensile test are provided in Figure 5. The experimental study was carried out with a total of 36 test samples. It was created using three different profile sections consisting of IPE 200, IPE 220, and IPE 240. All profiles are made of S275 steel. IPE 200, IPE 220, and IPE 240 profiles’ one flanges were divided from their bodies and T-joints were obtained by combining the T-sections from their flanges. A bolt was used as a joining tool. Due to geometrical constraints, 4 bolt holes were drilled in all test elements and M12 bolts made of 8.8 steel were placed in these holes. The bolt placement is designed not to create any eccentricity, as illustrated in Figure 5. The geometric properties of the thirty-six T-joint specimens are listed in Table 1. The name of each specimen indicates the profile type, exposed temperature, and applied paint thickness. For instance, I200-T300-200 μm means that it is made of the IPE 200 profile, exposed to 300 °C, and has 200 μm paint thickness
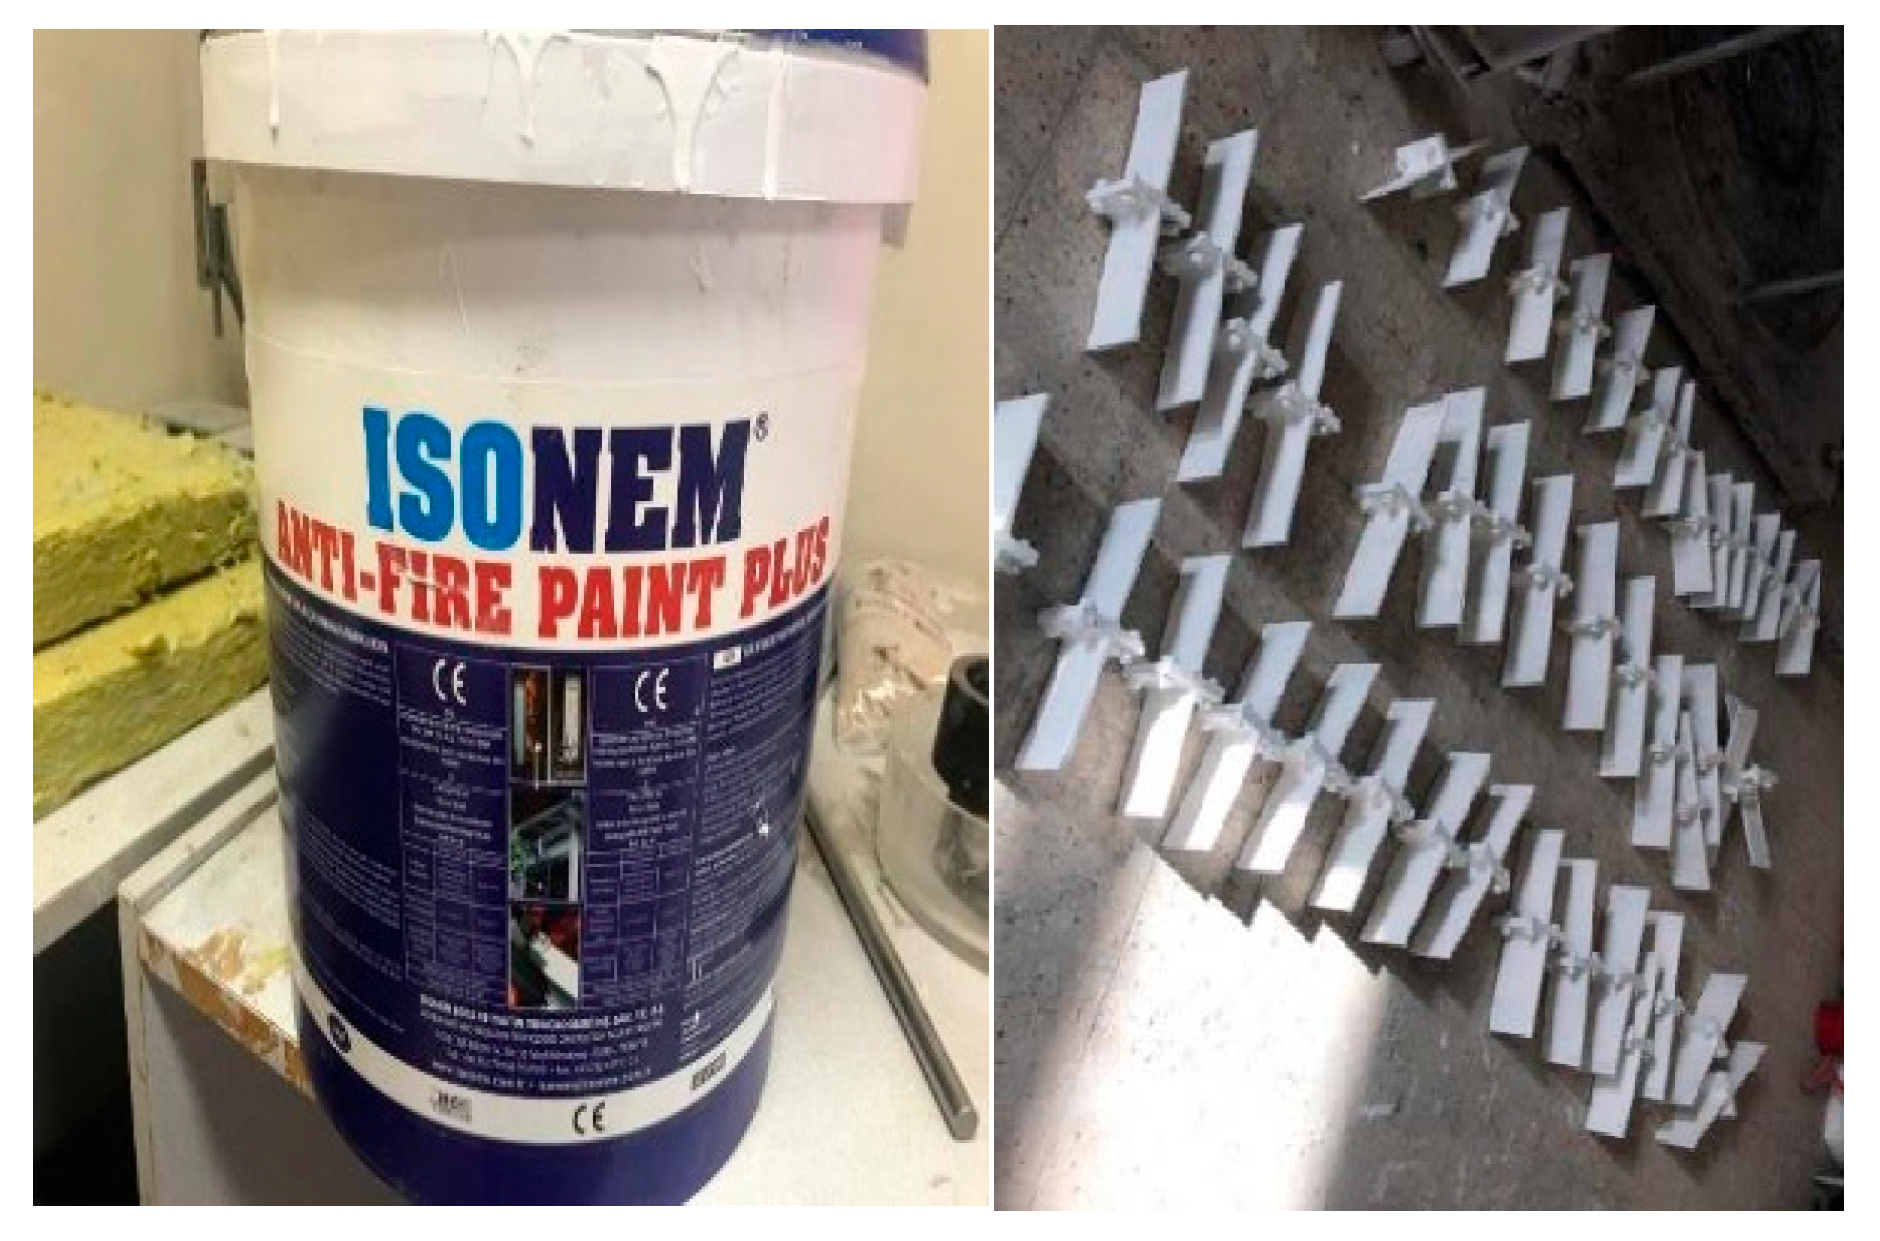
By using anti-fire paint manufactured by ISONEM in accordance with TS EN13501-1 [49], the test samples were protected against the effects of high temperatures (Figure 6). This paint has a fire-retardant, water-based structure that prevents the temperature on the surface from rising to critical levels, with a swelling structure that provides fire insulation by expanding by chemical reaction in case of fire. The technical properties of the paint used in this study are shown in Table 2. According to the manufacturer’s certification (EN 13381-8 [50] test; EN 13501-2 [51] classification by Efectis ERA Eurasia), the coating achieves R15–R180 for steel I/H members within Hp/A = 65–527 m−1 and θcrit = 300–750 °C. Film thickness (DFT) is project-specific and increases with the target fire-resistance time; the datasheet provides ≈ 1.5 mm (≈3.5 kg/m2) as a reference value. In this study, coatings of 200–600 μm were used to evaluate post-fire residual performance rather than to attain prescriptive R-ratings [52].
A water-based intumescent coating (ISONEM ANTI FIRE PAINT) was used in this study. Prior to application, all surfaces were cleaned and dried; oil, dirt, mud, and any loose/flaking particles were removed. The intumescent paint was applied with a suitable spray applicator after being mixed to homogeneity. Target dry film thicknesses (DFTs) were 200, 400, and 600 µm. During application, the wet film per coat was controlled using an ISO 2808 [53]—compliant wet-film comb; the final DFT was verified after curing with a calibrated magnetic DFT gauge. For each specimen, measurements were taken at a minimum of six locations (on the flange and web surfaces, including around the bolt line). Acceptance criteria required that the specimen-level mean DFT fall within ±10% of the target and that no individual reading deviate by more than ±15%. Areas outside tolerance were recoated and remeasured.
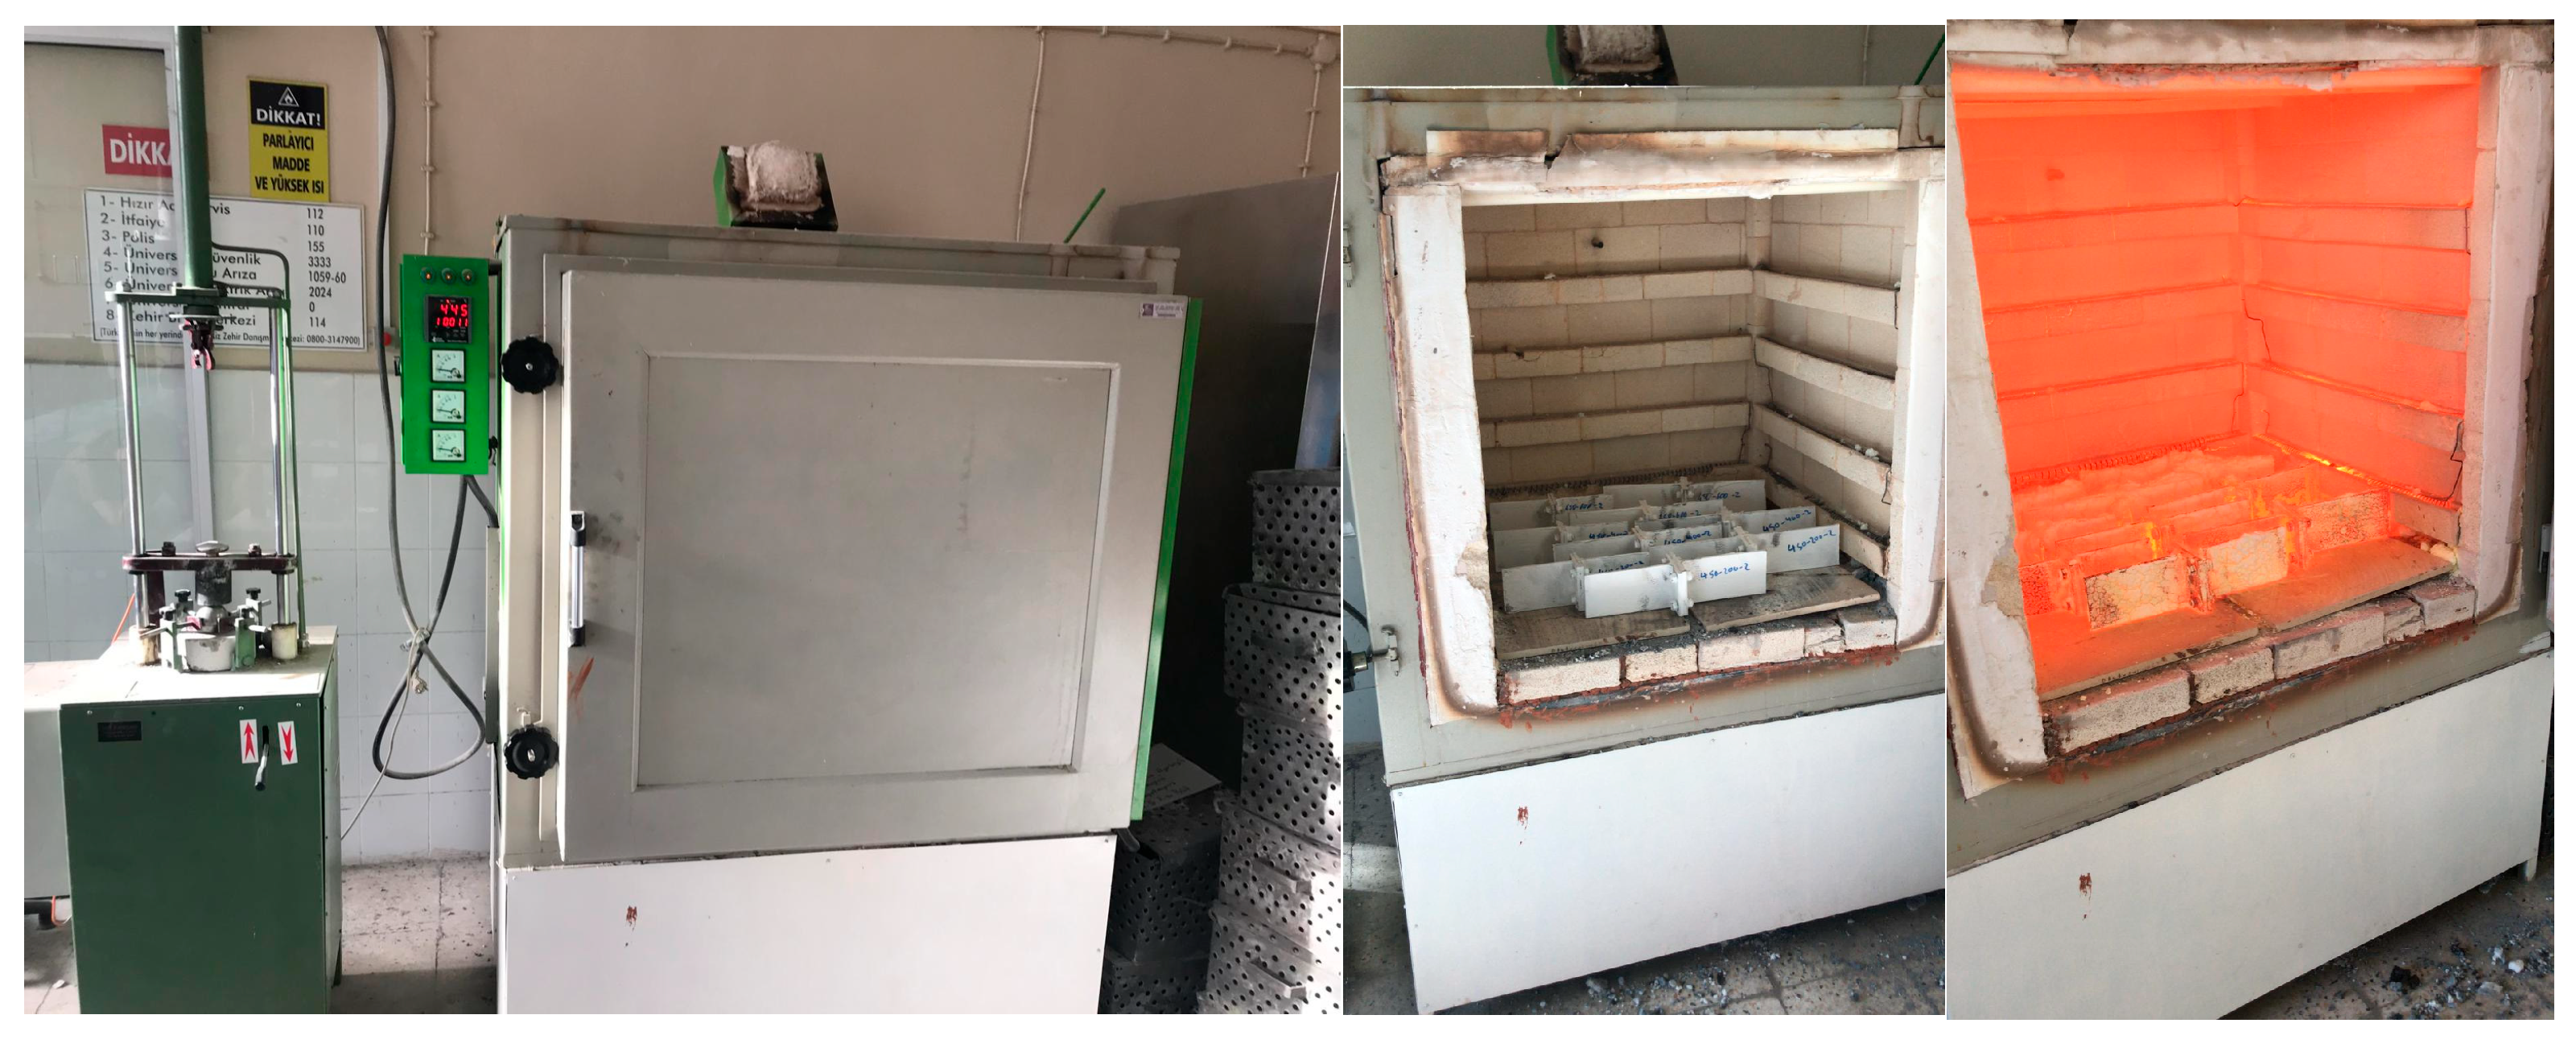
To expose the test elements to high temperatures, the furnace with 800 × 800 × 800 mm dimensions, 512 lt internal volume, and a single-cell structure that can reach a maximum temperature of 900 °C, was used. Thanks to the single-cell structure, the resistors were kept in a closed area and sample splashes and arcing were prevented (Figure 7).
Test specimens were exposed to 300, 450, 600, and 900 °C following the standard temperature–time curve defined in ISO 834-1 [54] and EN 1991-1-2 [55]. This curve represents a fully enclosed compartment fire that is unaffected by external conditions. The 450 °C level was selected as a single representative point within the 400–500 °C transition region indicated by Eurocode 3 stress–strain behavior (Figure 4), thereby covering key degradation regimes without disproportionately enlarging the experimental program.
To expose the test elements to the desired temperature, a completely closed environment was heated to the desired temperature. When the temperature inside the furnace reached the desired temperature, the samples were placed inside.
To simulate the progressive heating that occurs in a real fire—where temperature rises with exposure time and thermal severity—the specimens were placed into a non-preheated furnace in ambient conditions. The furnace was then ramped to the prescribed setpoint in accordance with the standard temperature–time curve; upon reaching the setpoint (60 to 120 min depending on target temperature), the specimens were held in the furnace isothermally for the equivalent exposure duration calculated from Equation (1) and were subsequently removed and then allowed to cool naturally to room temperature.
In Equation (1), “Өg” is the gas temperature in the fire compartment (°C), and “t” is the time (minutes).
Өg = 20 + 345 log10(8t + 1)
Fire heating was carried out in a single-cell electric furnace (internal volume 512 L; 800 × 800 × 800 mm; maximum 900 °C). The furnace was operated to follow the ISO 834/EN 1991-1-2 standard temperature–time curve and the 60 min exposure time was measured from the moment the target setpoint was reached at the specimen face. Prior to testing, furnace temperature uniformity and calibration were verified in accordance with EN 1363-1 Annex A [56], using traceable reference thermocouples. During the tests, Type-K (Class 1) thermocouples were used for control and monitoring. These thermocouples were installed on the web region and the bolted joint region of several randomly selected specimens.
To determine the mechanical characteristics of the test specimens, 30 tensile coupon tests were completed in accordance with TS EN ISO 6892-1 [57]. The coupon tension test of the structural steel material flange and the web of the T-Stub profile was carried out using a 150 kN capacity Bestmark machine (Figure 8). Experiments were carried out using a tensile test setup with a 150 kN capacity and 900 mm torque opening. The experiments were carried out under a loading speed of 3 mm/s until the T-joints reached failure mode. Deformations and displacements at T-joints were measured using linear variable displacement transducers (LVDTs) with a maximum displacement capacity of 100 mm. (Figure 8). All measurements were collected using a data logger consisting of load cells recording data at one-second intervals and digitized by an application program compatible with the data collector and processed in Excel.
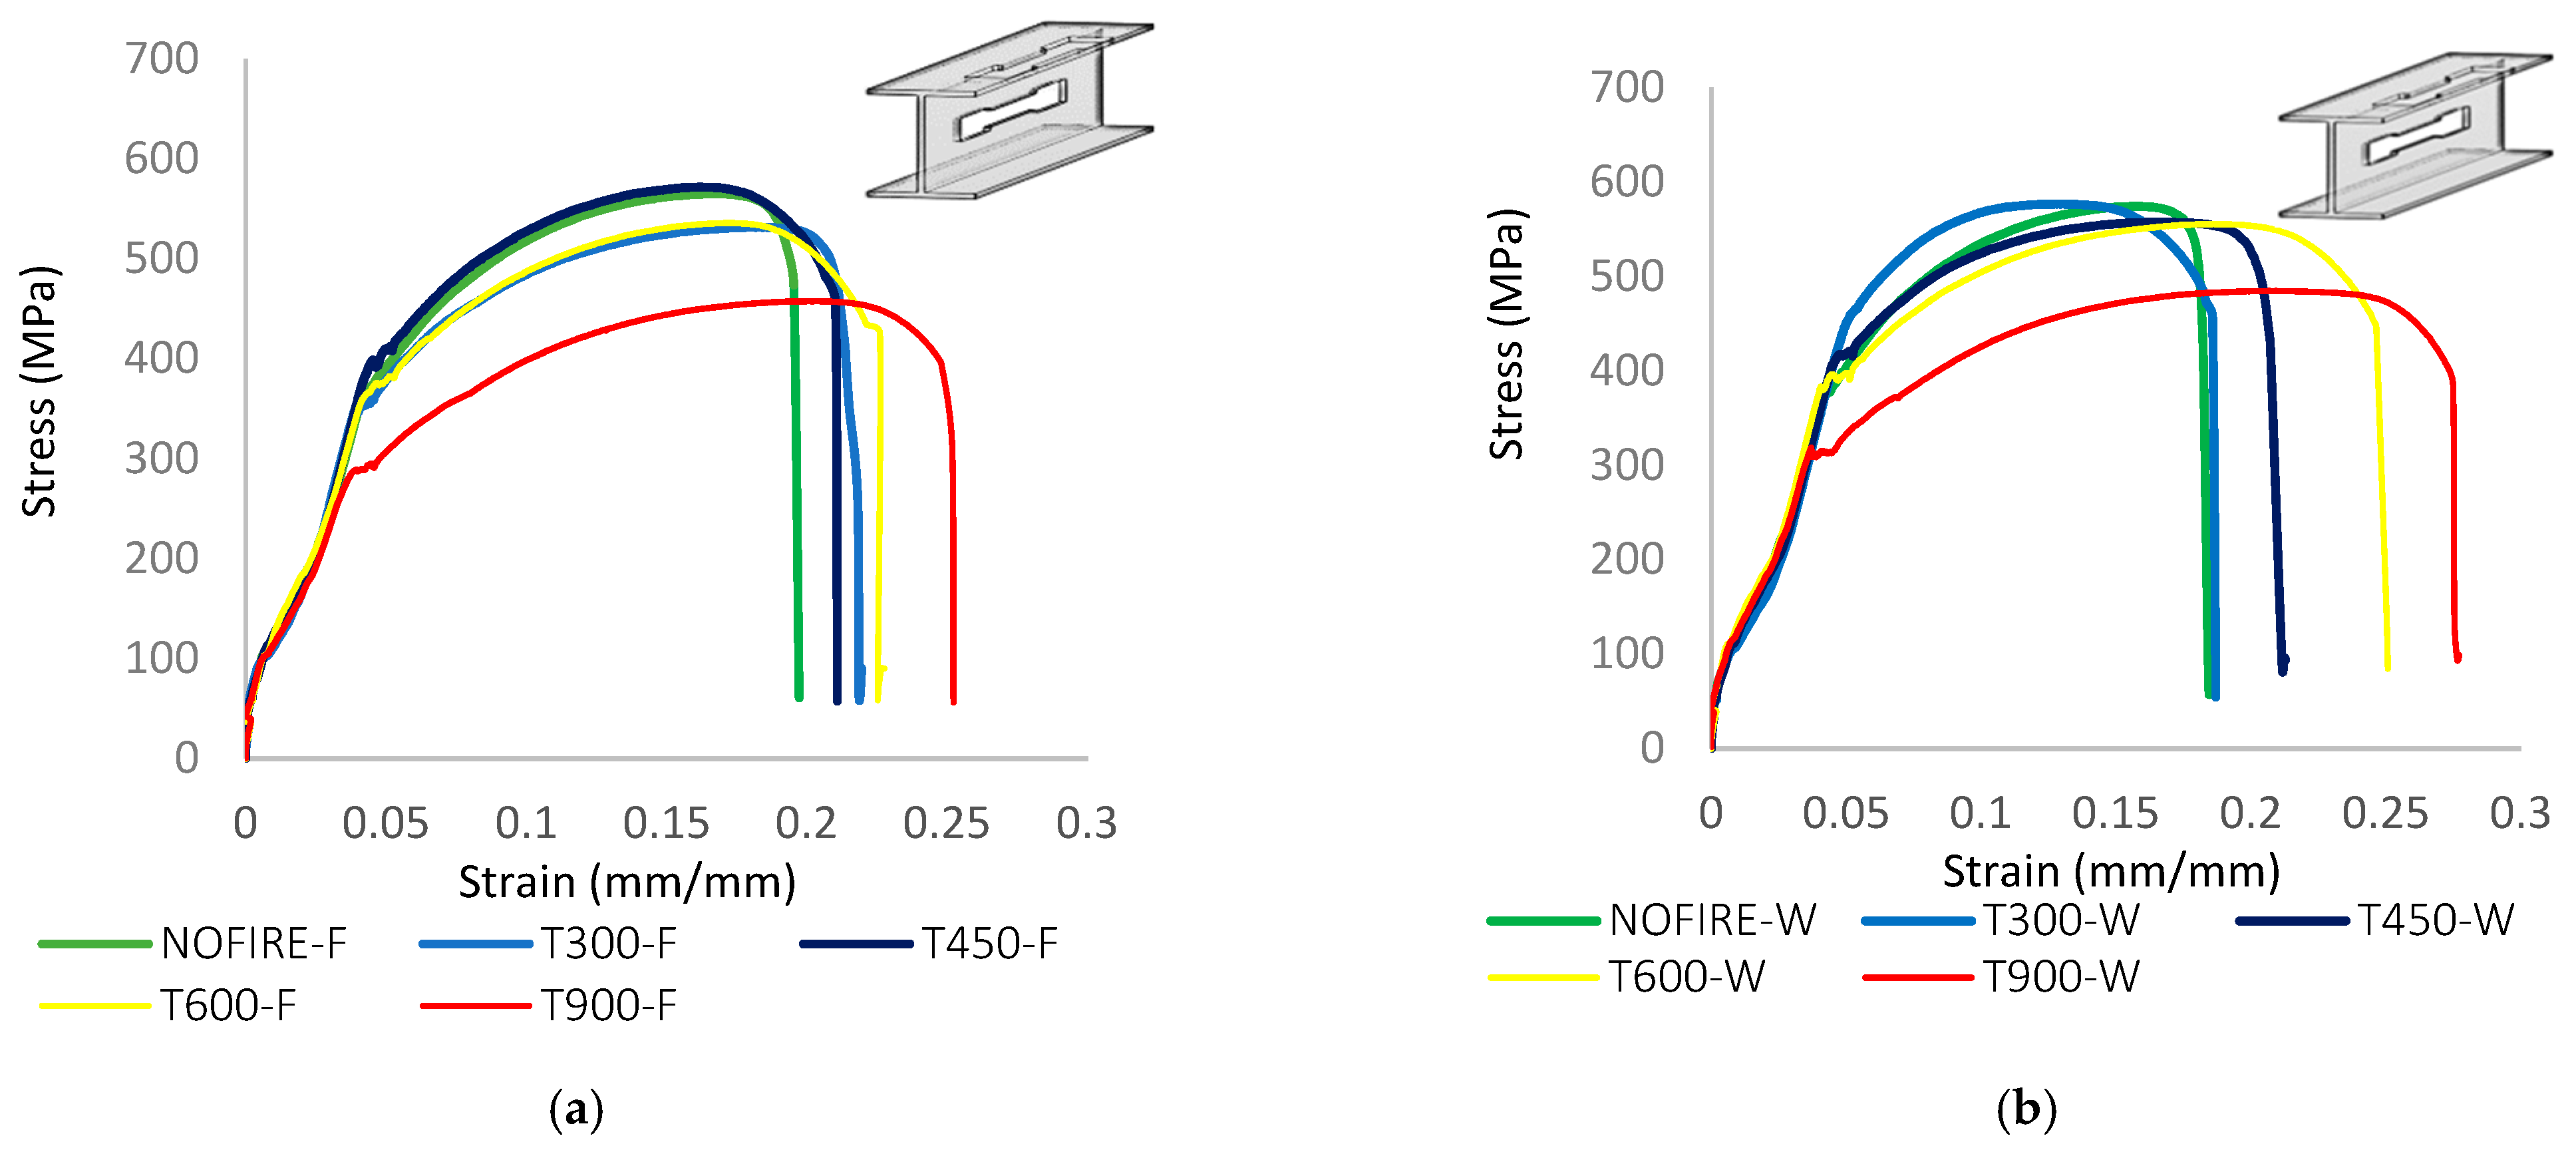
Figure 9 displays the locations of the flange and web coupons. In Figure 9, the test element that has not been exposed to heat is named coupon, and the test elements that have been exposed to heat are named to indicate the temperature they are exposed to. The axial tensile test results of coupon samples are presented in Table 3. Next, each bolt (8.8) was put through a tension test to ascertain its mechanical characteristics in accordance with ISO 898-1-2013 [58].
When examining the axial tensile test results of coupon samples taken from the web region of IPE profiles made from S275 steel, with thicknesses of 8.5–9.2–9.8 mm, it was observed that the samples not exposed to fire began to yield at stress values ranging from 368 to 401 MPa. The same coupons exhibited tensile strengths in the range of 533 to 570 MPa. An increase in tensile strength was noted in samples exposed to 300 and 450 °C and subsequently subjected to axial tensile stress after cooling. A similar trend was observed in coupon samples taken from flanges with thicknesses of 5.6–5.9–6.2 mm. Samples exposed to temperatures up to 450 °C expanded due to high heat and contracted due to rapid cooling, resulting in a loading–unloading effect that caused strain hardening. However, this hardening phenomenon was not observed at temperatures of 600 °C and above, since at such elevated temperatures the microstructural degradation of S275 steel significantly reduces its yield and tensile strength, eliminating the strain hardening effect. The stress–strain curves in Figure 9 clearly illustrate the variations in mechanical behavior at different temperatures, showing both increases and decreases in performance compared to the baseline state.

3. Experimental Results and Discussion

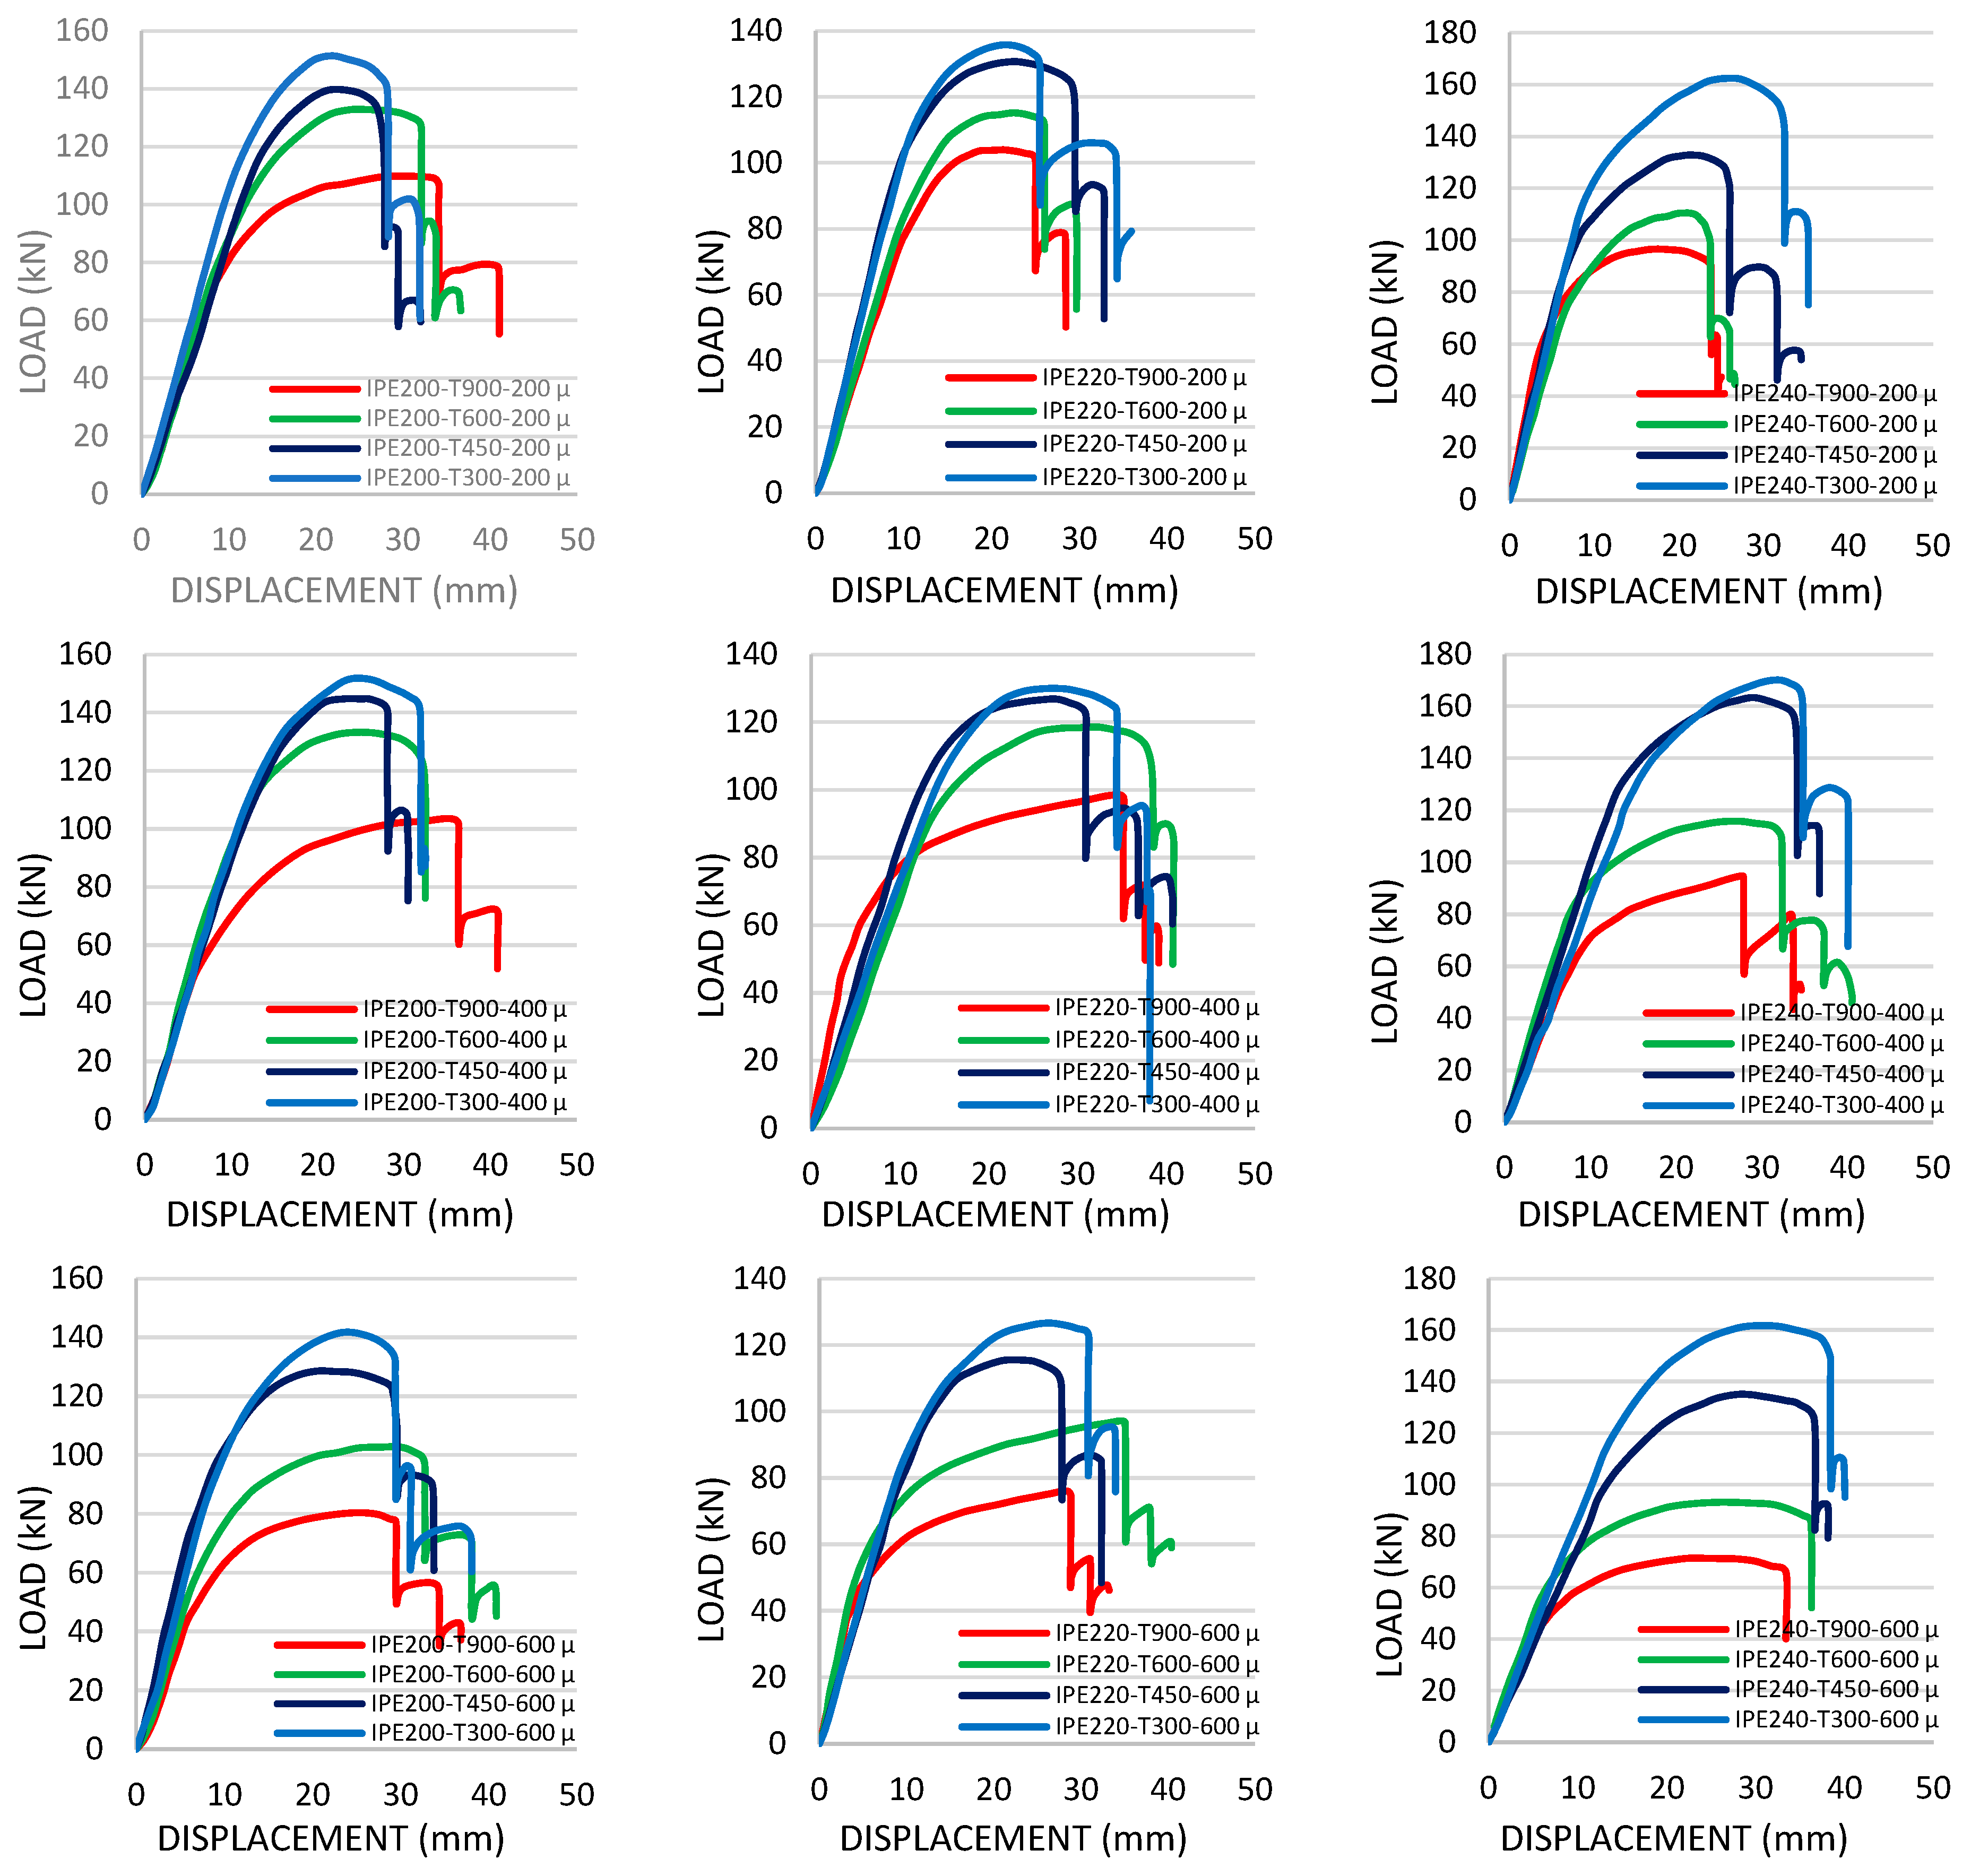
The force–strain graphs obtained as a result of the experiments are also presented in Figure 10. Yield stress, maximum stress values, and shear stress were determined from the load–strain curve. The test results obtained for 36 T-joint specimens with various steel bolts with different fire insulation thicknesses and different post-fire conditions are provided in Table 4.
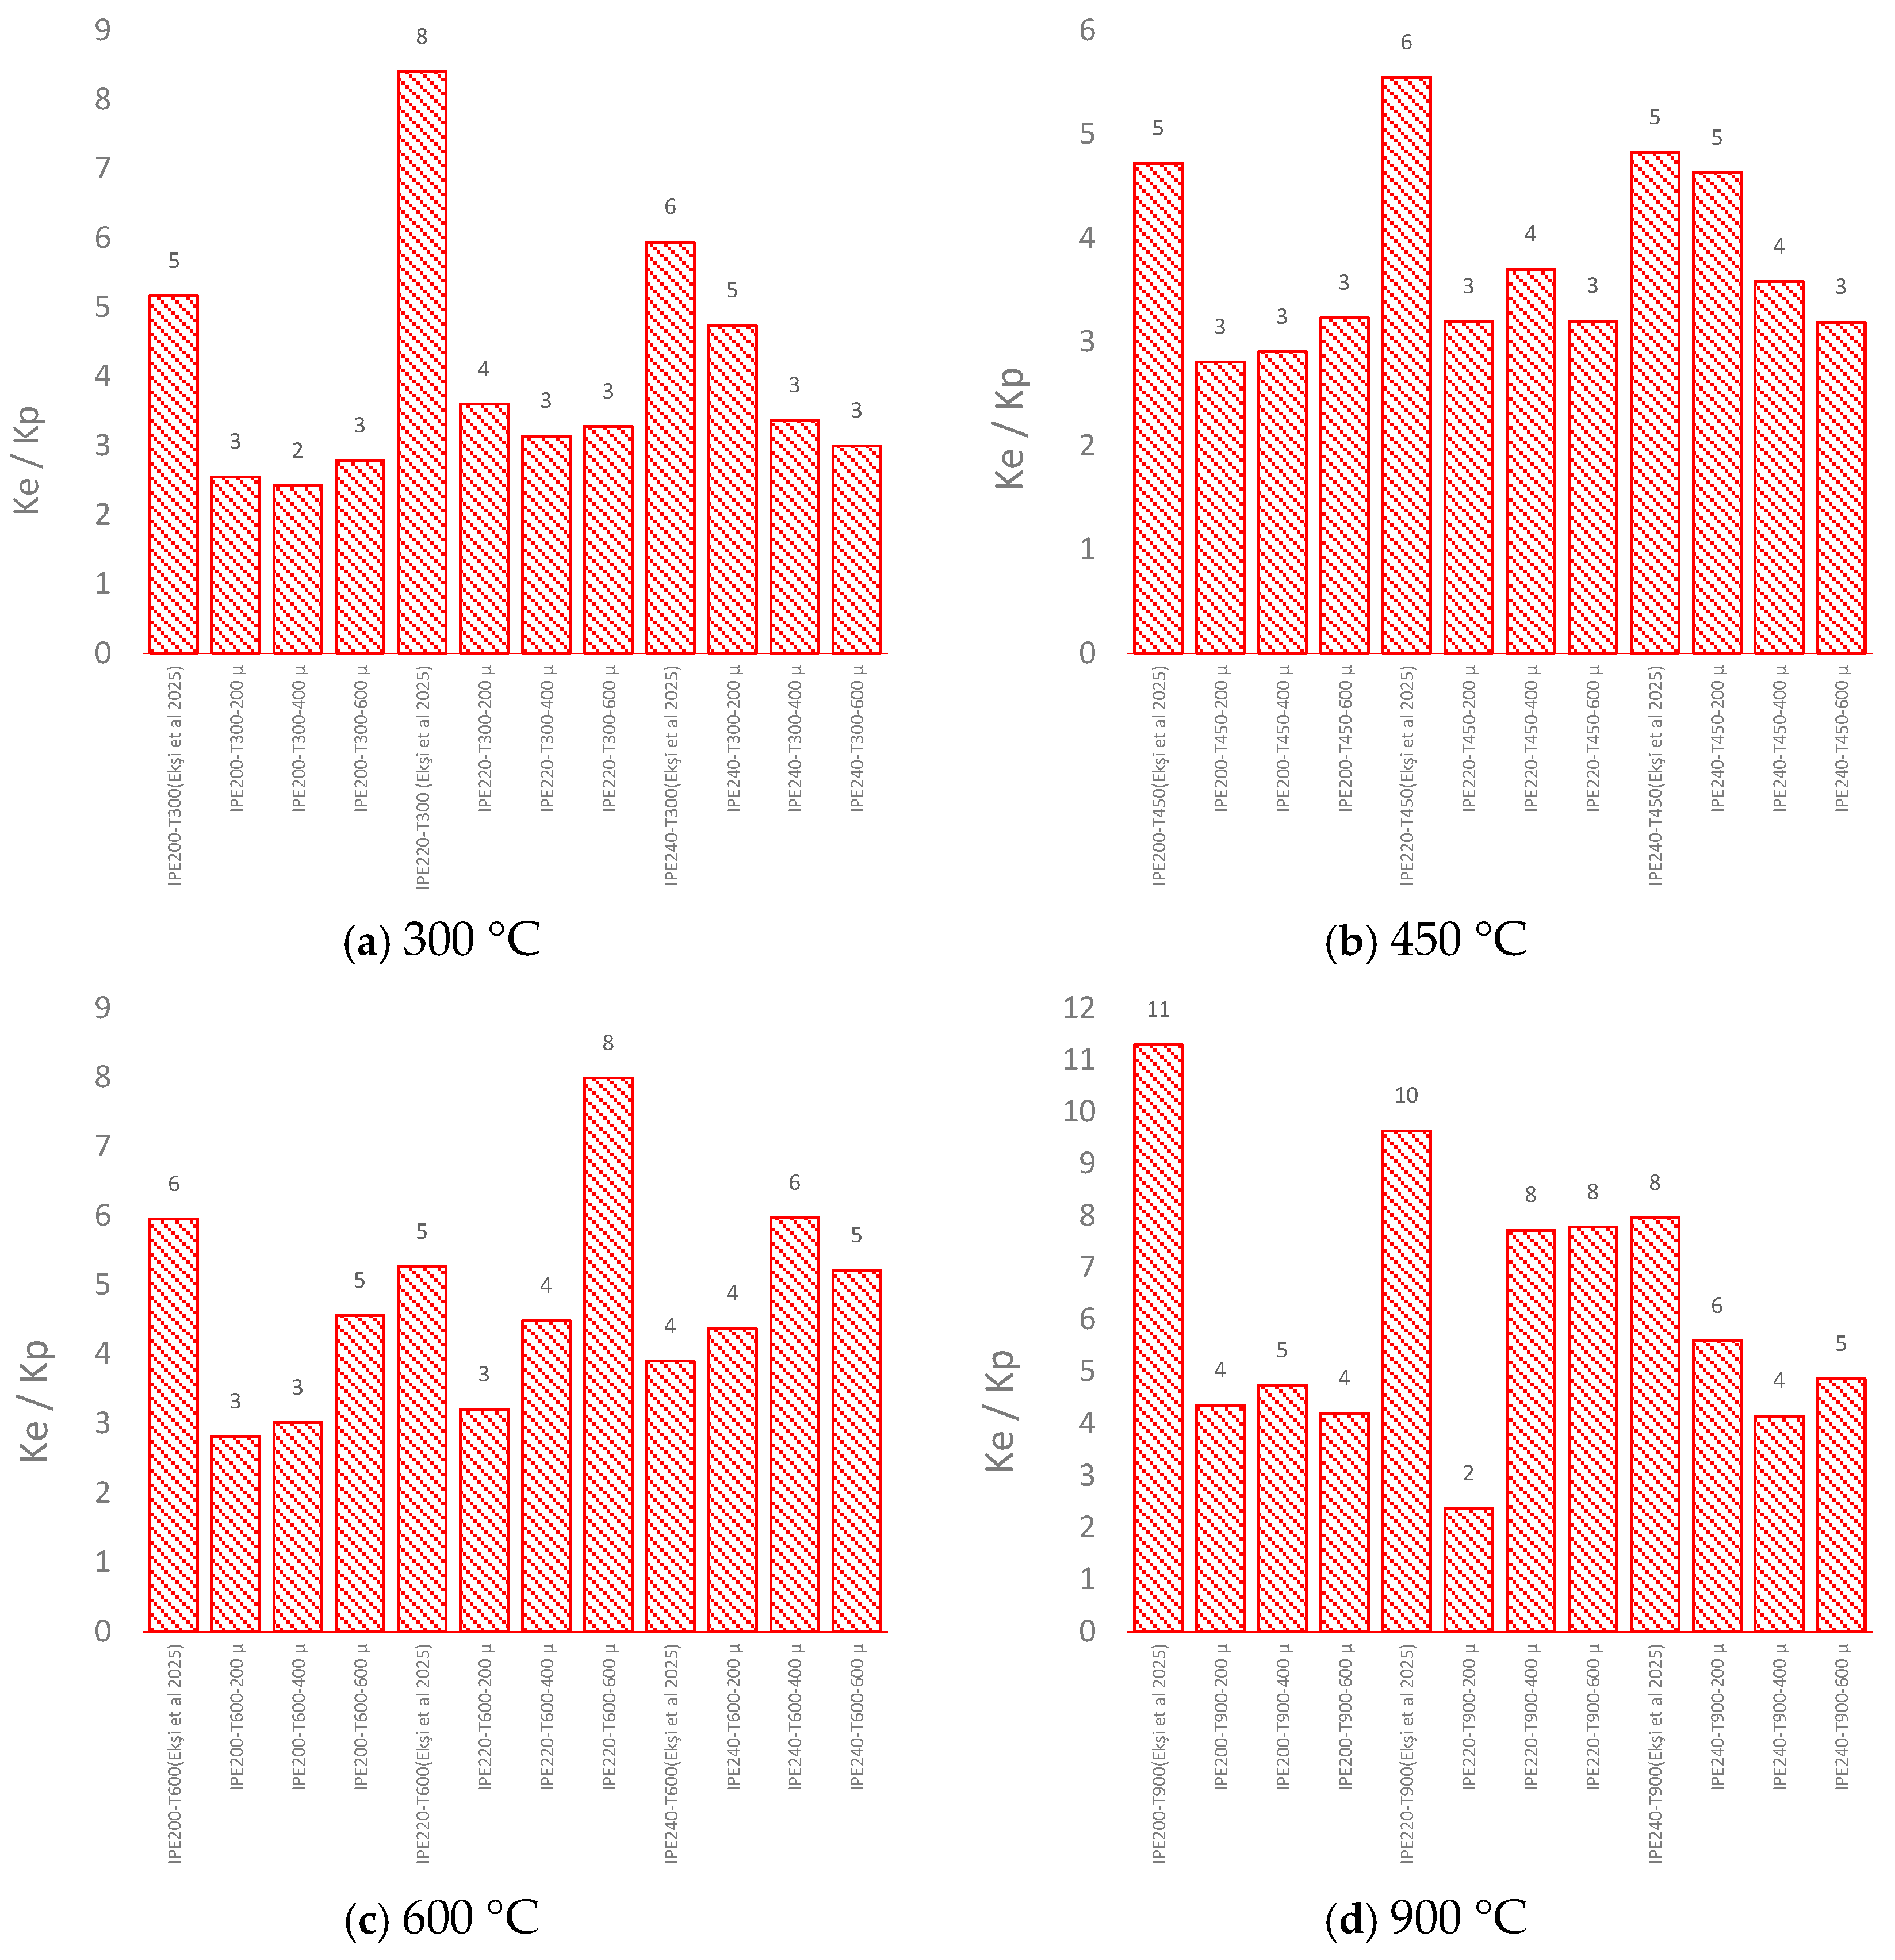
Stiffness (initial and post-limit), deformation capacity, and energy dissipation values obtained from the analysis of the test results are also presented in Table 4. Initial stiffness and post-limit stiffness values in the load–displacement curves obtained as a result of the experimental study were calculated as shown in Figure 11, where Ke represents the elastic (initial) stiffness and Kp denotes the post-yield stiffness. In addition, Fy is the yield load, Fu is the ultimate load, Δy is the yield displacement, and Δf is the peak displacement. These parameters were determined directly from the experimental load–displacement curves to characterize strength, ductility, and energy dissipation capacity.
The axial load that the bolts in the connections are theoretically allowed to carry according to ANSI/AISC 360-10 (2010) [60] was calculated with Equation (2).
F n t   =   0.75   F u b
In this equation, Fub is the characteristic tensile strength of the bolt material.
Table 4 compares the load value that the bolts are allowed to carry according to the strength requirements with the experimental axial load carrying capacity. Table 5 presents the elastic deformation, plastic deformation, and maximum deformation values of 36 T-Joints and the change rates of these values relative to each other.

3.1. Load Carrying Capacity

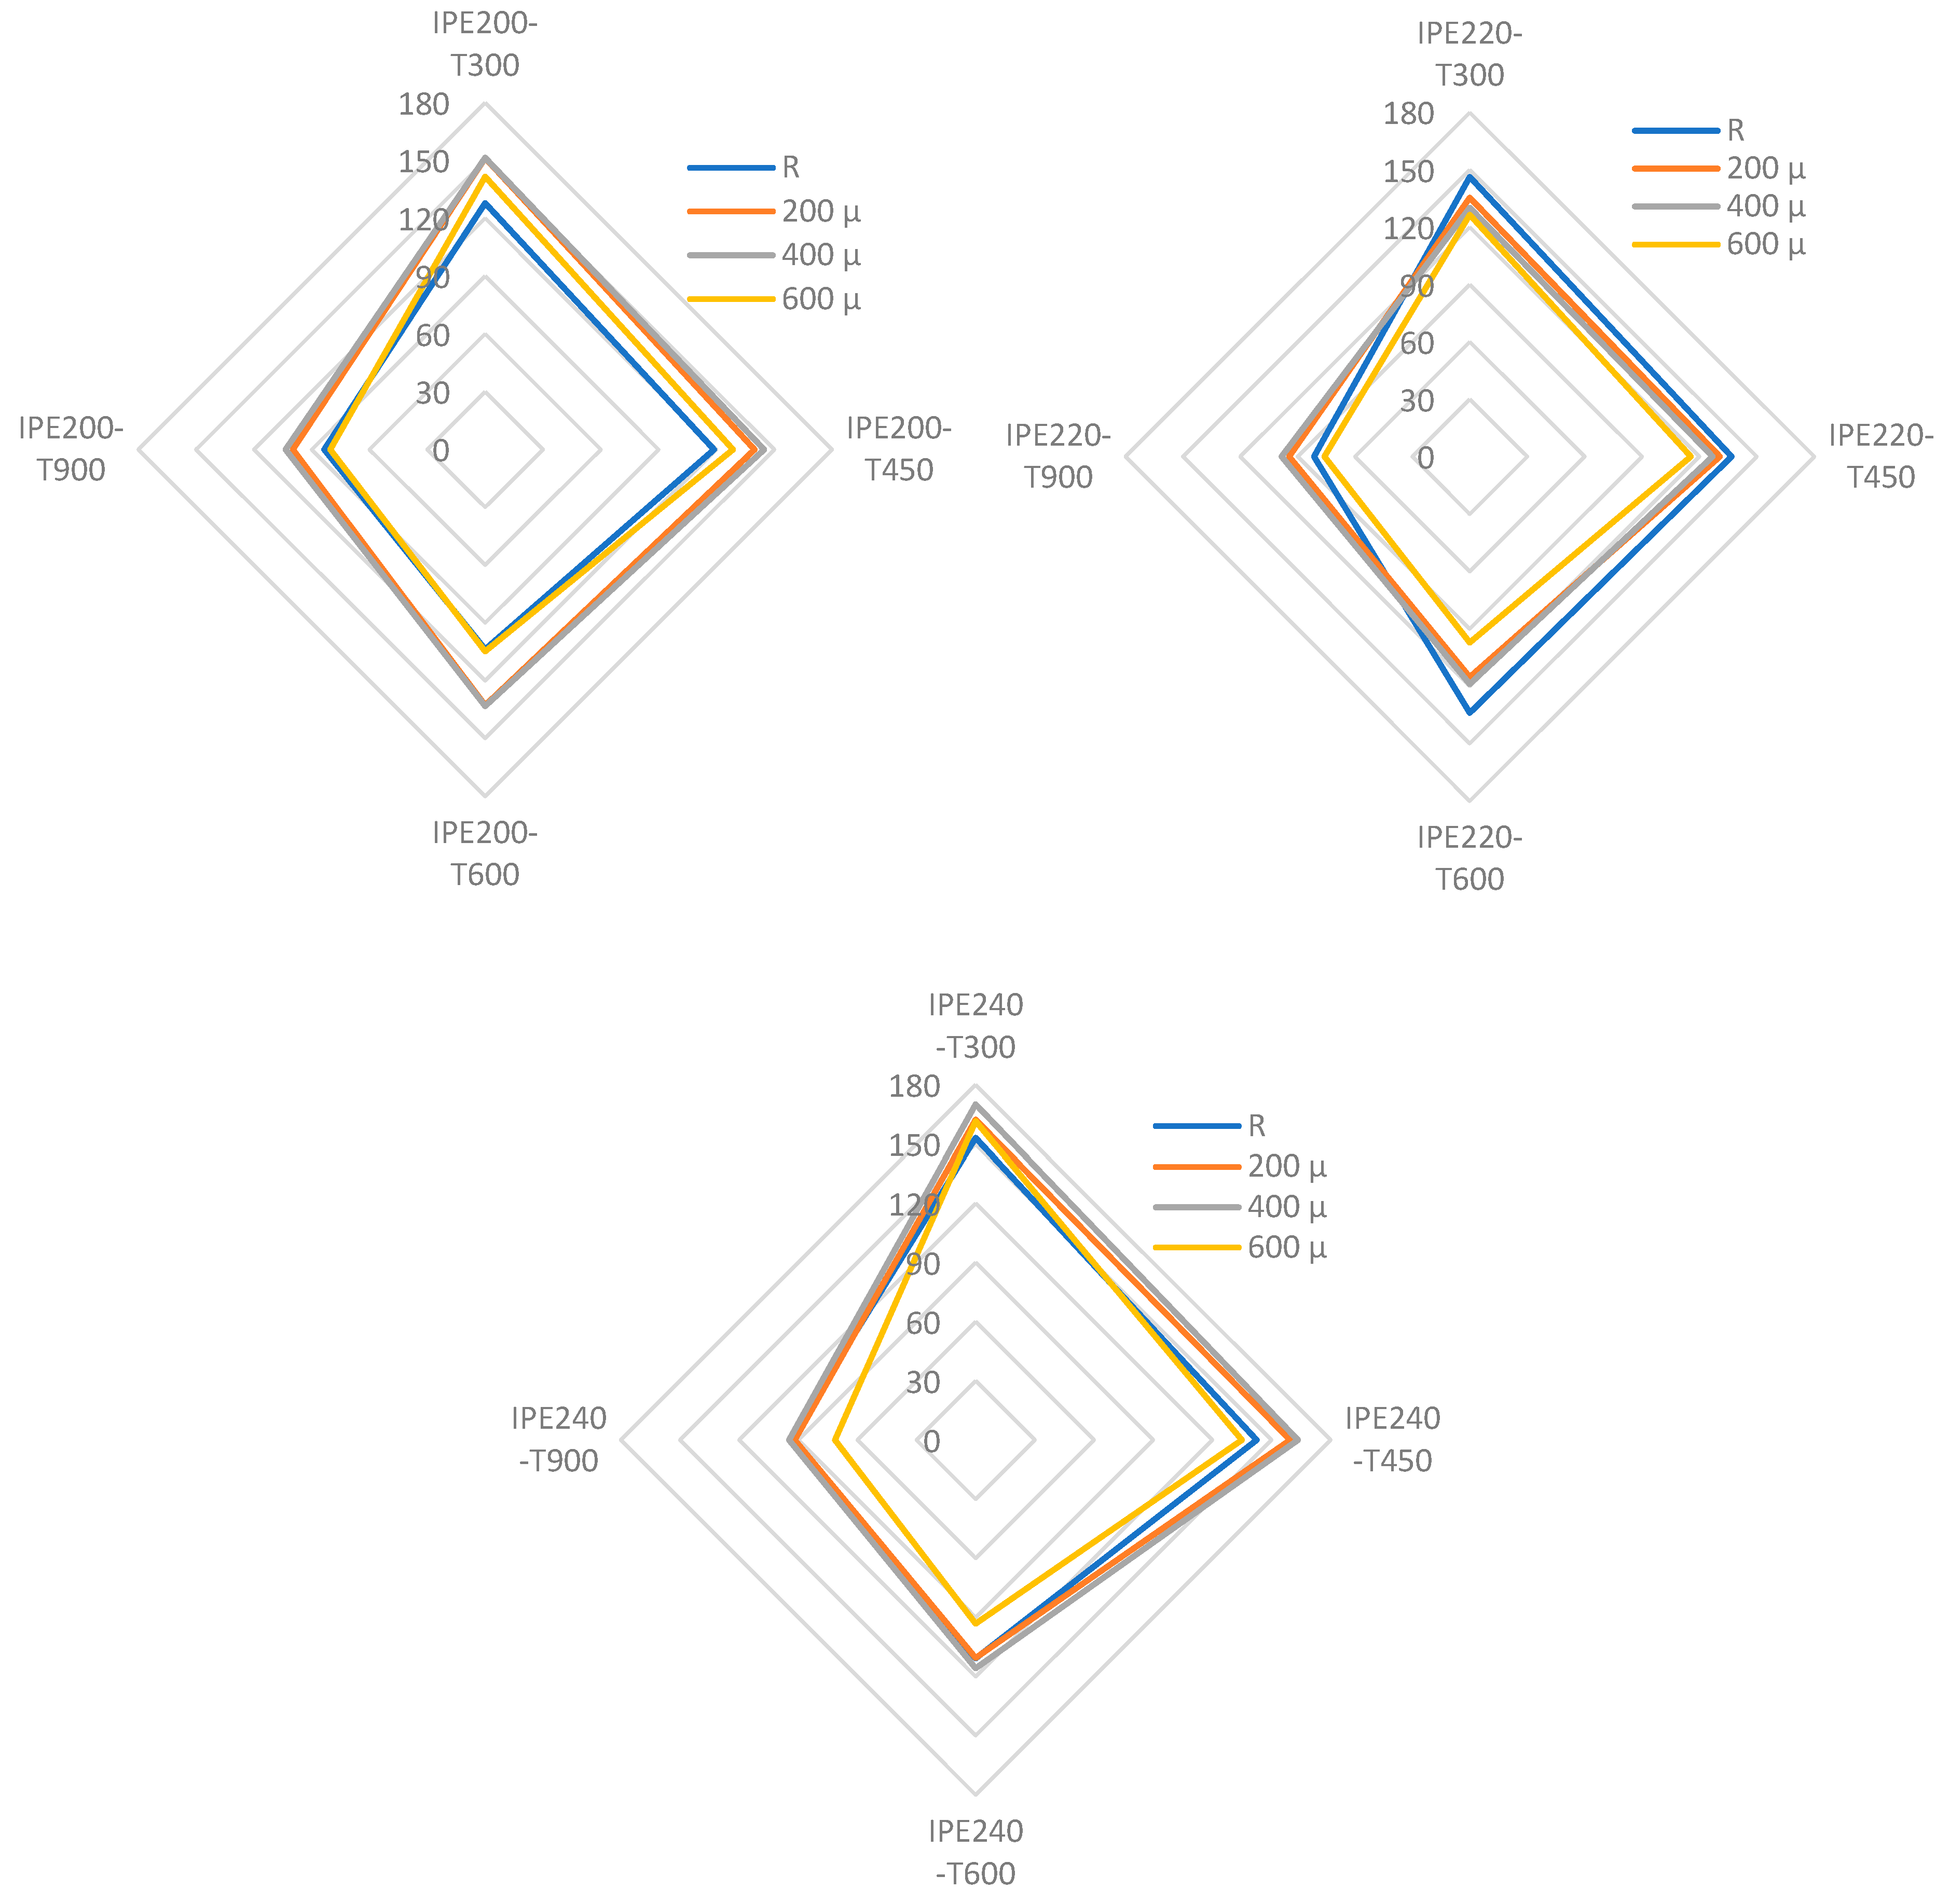
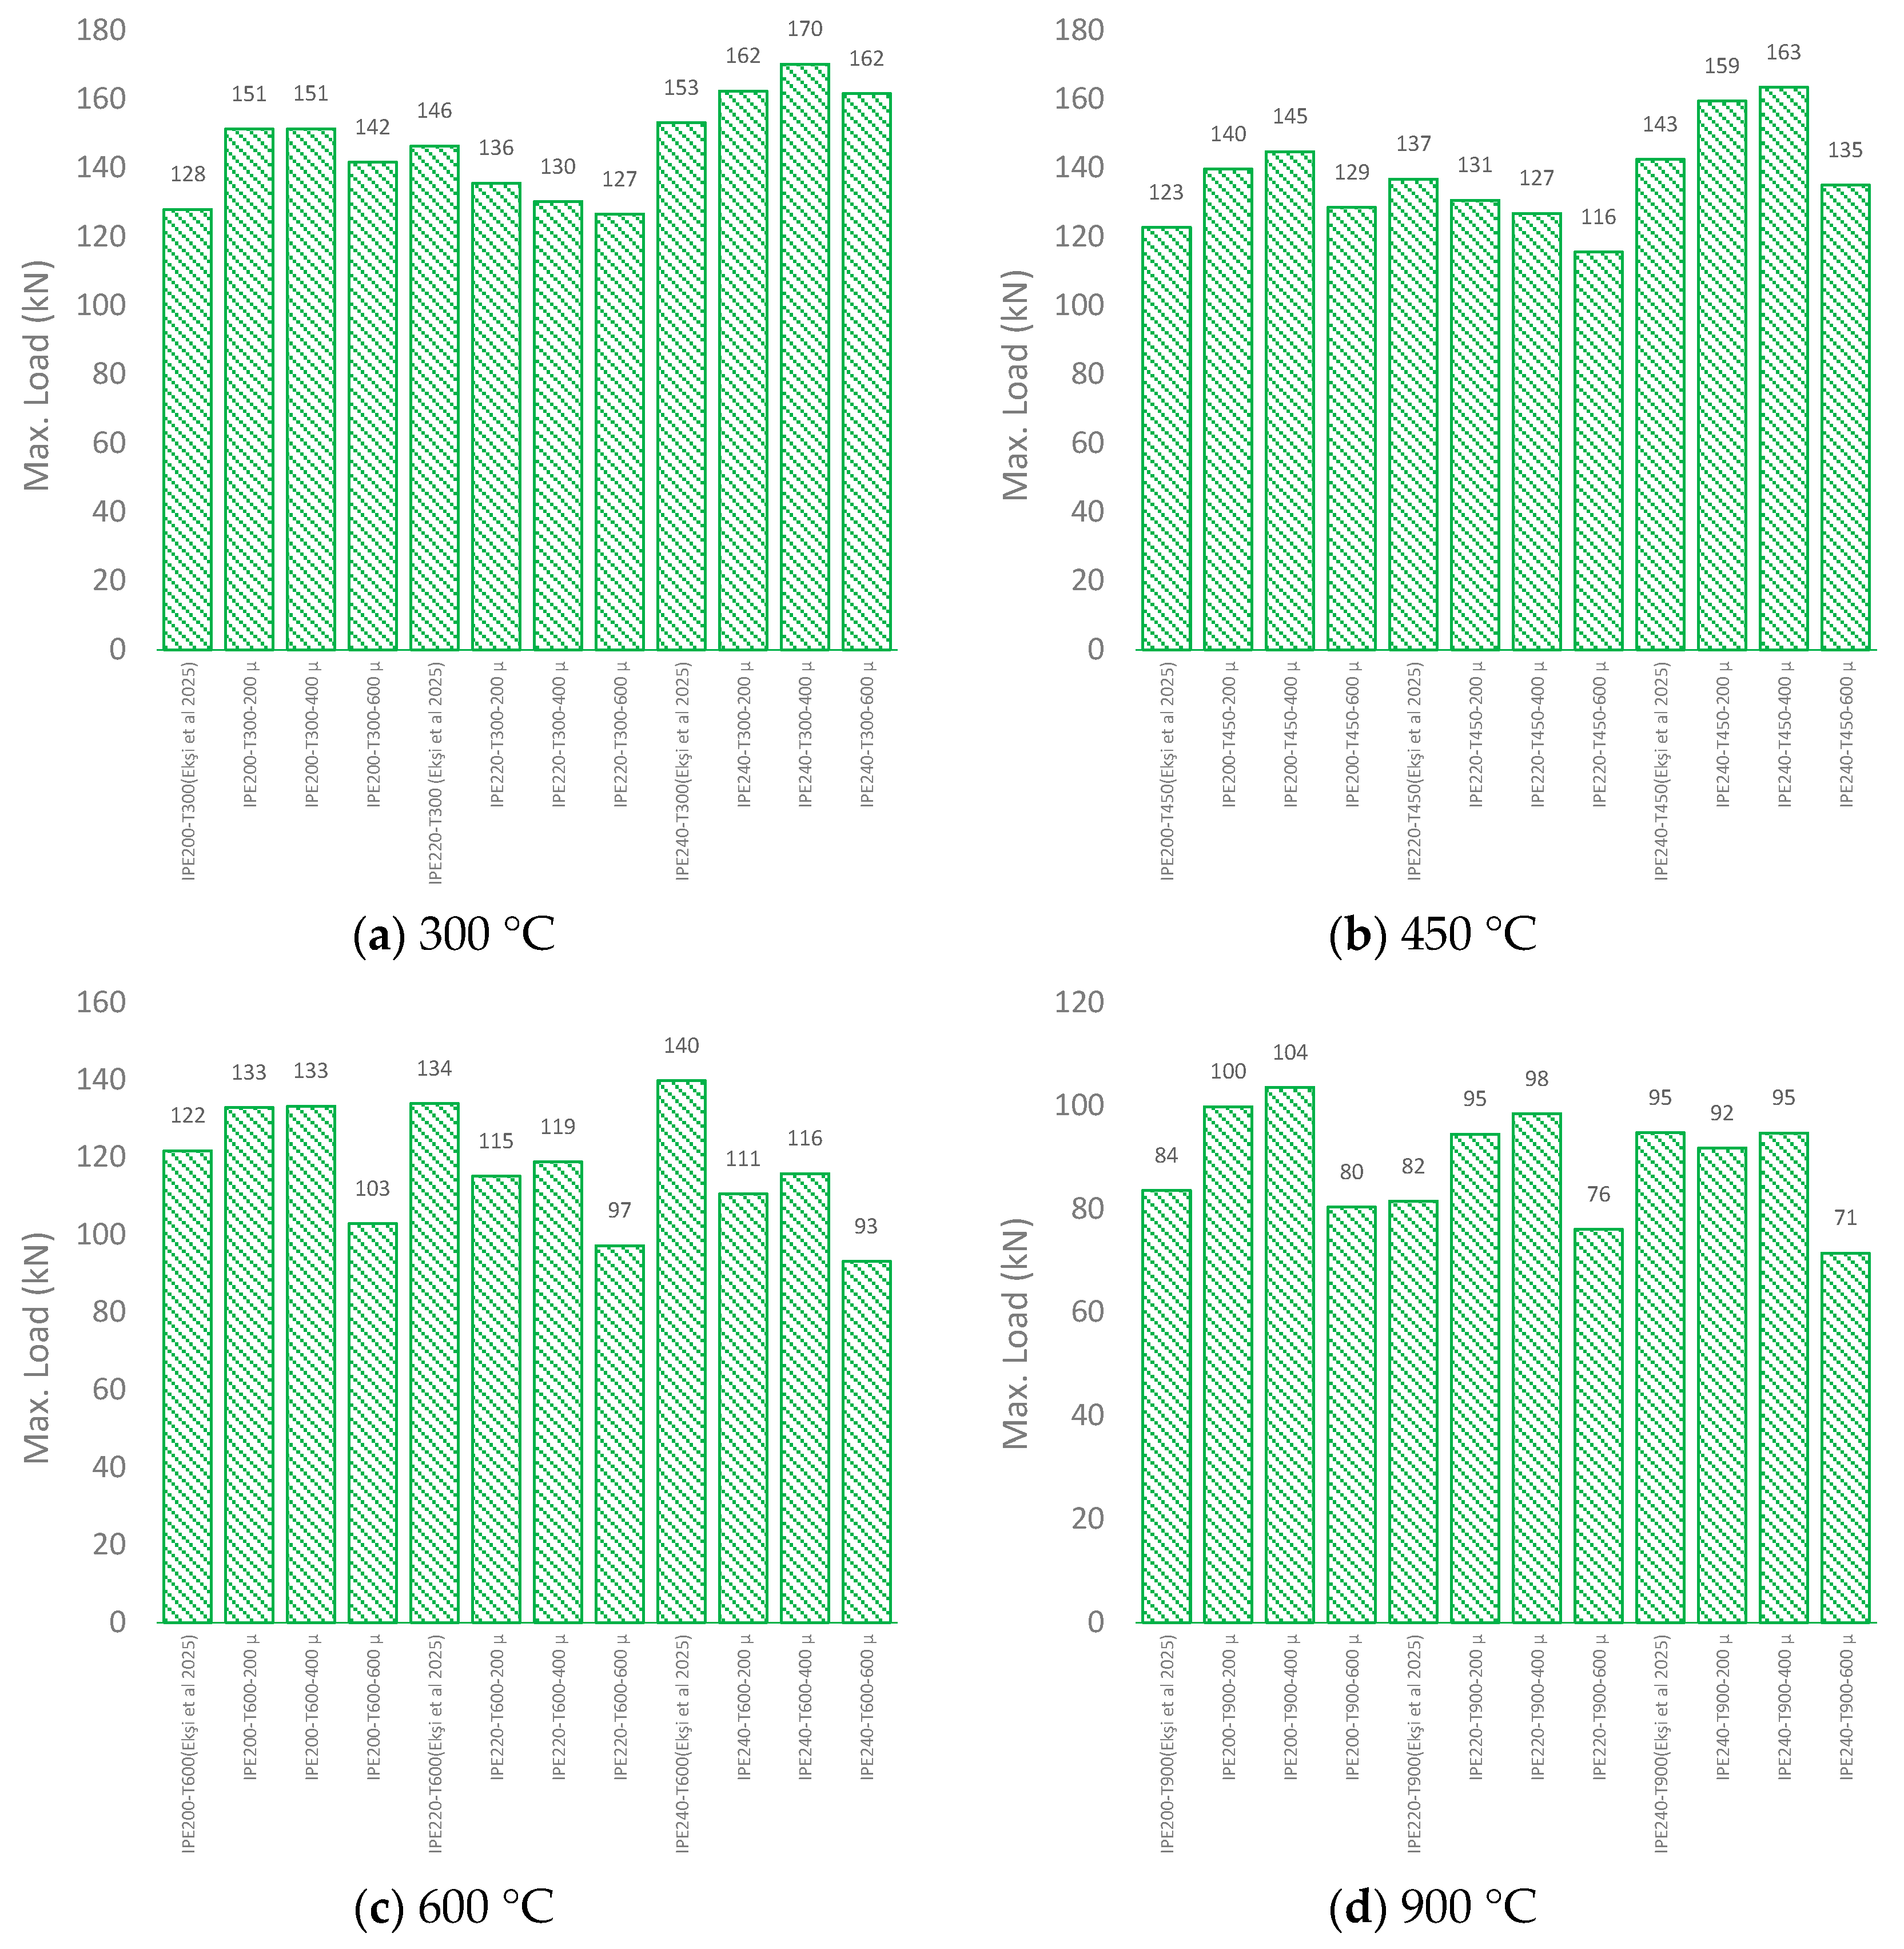
When the test results were examined, a specific increase was observed in the axial load-carrying levels of all specimens of IPE 200 and IPE 240 profiles with 200 μm, 400 μm, and 600 μm paint applied at 300 and 450 °C temperatures compared to the reference (unpainted) elements. While this rate of increase is around 10% in IPE 200 and IPE 240 profiles exposed to a temperature of 300 °C, it is around 20% in IPE 200 and IPE 240 profiles exposed to a temperature of 450 °C (Figure 12).
When the ratios of the experimental load-carrying capacity of the combination to the load-carrying capacity of the bolts calculated according to the ANSI/AISC 360 [60] standard were examined, it was observed that there was an average increase of around 15% in the IPE 200 and IPE 240 profiles in the experimental set with 200 μm and 400 μm paint thickness and 300 °C and 450 °C temperatures (Figure 12 and Figure 13). Although 600 μm paint thickness contributed to the axial tensile strength at 300 °C, the axial tensile strength decreased significantly at 450 °C and beyond. While it played an active role in the axial tensile strength at 300 °C and 450 °C with 200 μm and 400 μm paint thickness, the presence of paint did not positively contribute to the axial tensile strength at 600 °C and later. This can be interpreted as an indication that the anti-fire paint does not work actively after a temperature of 450 °C, regardless of its applied thickness. The presence of paint caused a decrease in the initial stiffness values of the profiles and an increase in the post-limit stiffness values. This indicates that high temperature reduces the rigidity of the joint, restricts the elastic behavior by reducing the yield strength of the material, and expands the limits of plastic behavior.
When the ratios of maximum load to bolt capacity in Figure 13 are examined in detail, it is seen that the beneficial effect of fire-protective paint is most evident in IPE 200 and IPE 240 specimens at 300–450 °C with 200–400 μm thickness, where the ratios increase by about 15–20% compared to the unpainted condition. This improvement can be explained by the delay in thermal penetration into the connection zone, which allows the bolts to retain a higher proportion of their nominal strength. In contrast, IPE 220 specimens show a reduction in normalized capacity as the coating thickness increases, which may be related to their lower flange-to-web ratio and higher sensitivity to stress redistribution at elevated temperatures. At 600 °C and above, the protective effect of the coating diminishes for all profiles, particularly when the thickness exceeds 400 μm. This suggests that the coating loses efficiency after prolonged heating and may even contribute to localized degradation by trapping heat. Overall, the results indicate that the optimum paint thickness is between 200 and 400 μm, beyond which the mechanical benefit becomes limited regardless of the profile size.
Also, Table 4 and Table 5 show that the maximum load, stiffness, and energy dissipation capacity values in the three groups were examined depending on the temperature and paint thickness. It was observed that the unit elongation decreased due to the expansion with the effect of temperature while the sample was unpainted. The energy dissipation capacity values were higher than in the painted state. When the samples were considered painted and unpainted, the force reached maximum value when it started to form plastic deformation by undergoing yield strength from the moment the temperature was 450 °C. At the same time, it was observed that the amount of elongation and energy dissipation capacity decreased compared to the initial values. Also, Table 5 shows that Δemax ratio decreased as temperature and paint thickness increased. However, Δpmax ratio increased by increased temperature degree and paint thickness.
In the samples exposed to fire at 300 °C, 450 °C, 600 °C, and 900 °C in the experiments with IPE 200, the maximum load capacity value up to 400 μm paint thickness increased by 15.48%, 17.98%, 22.16%, and 19.28%, respectively, compared to the unpainted sample. In addition, in the IPE 240 samples exposed to 300 °C, 450 °C, and 600 °C fire in the experiments, the maximum load capacity values increased by 9.9%, 12.79%, and 4.34%, respectively, compared to the unpainted sample, with paint thickness up to 400 μm. Additionally, in these two groups of experiments (IPE 200 and IPE 240), a decrease in maximum load capacity was observed after the paint thickness exceeded 400 μm. Look at the results of the IPE 220 tests in Figure 14; there is a decrease in the maximum load capacity as the paint thickness increases. As a result, for maximum load capacity-ideal T-stub connection to protect against fire, the paint thickness should be between 200 and 400 μm and the tf/tw ratio should be less than 0.63.

3.2. Stiffness (Ke/Kp)

According to these test results (Figure 15), in the samples exposed to fire at 300 °C, 450 °C, 600 °C, and 900 °C in the experiments with IPE 200, the stiffness ratio up to 600 μm paint thickness decreased by 84.95%, 46.13%, 30.48%, and 169.69%, respectively, compared to the unpainted sample. In addition, in the IPE 220 samples exposed to 300 °C, and 450 °C fire in the experiments, the stiffness ratio decreased by 156.40% and 73.43%, respectively, compared to the unpainted sample, with paint thickness up to 400 μm. Look at the results of the IPE 240 tests in Figure 15; there is a decrease in the stiffness ratio as the paint thickness increases up to 400 μm. However, Figure 15 shows that in the samples exposed to fire at 600 °C and 900 °C in the experiments with IPE 220 and IPE240, the stiffness ratio up to 600 μm paint thickness increased by 34.17%, 26.47%, 25.14%, and 63.78%, respectively, compared to the unpainted sample. As a result, for the stiffness ratio value-ideal T-stub connection to protect against fire temperatures of 600 °C and 900 °C the paint thickness should be between 400 μm and 600 μm and the tf/tw ratio should be less than 0.64.

3.3. Energy Dissipation

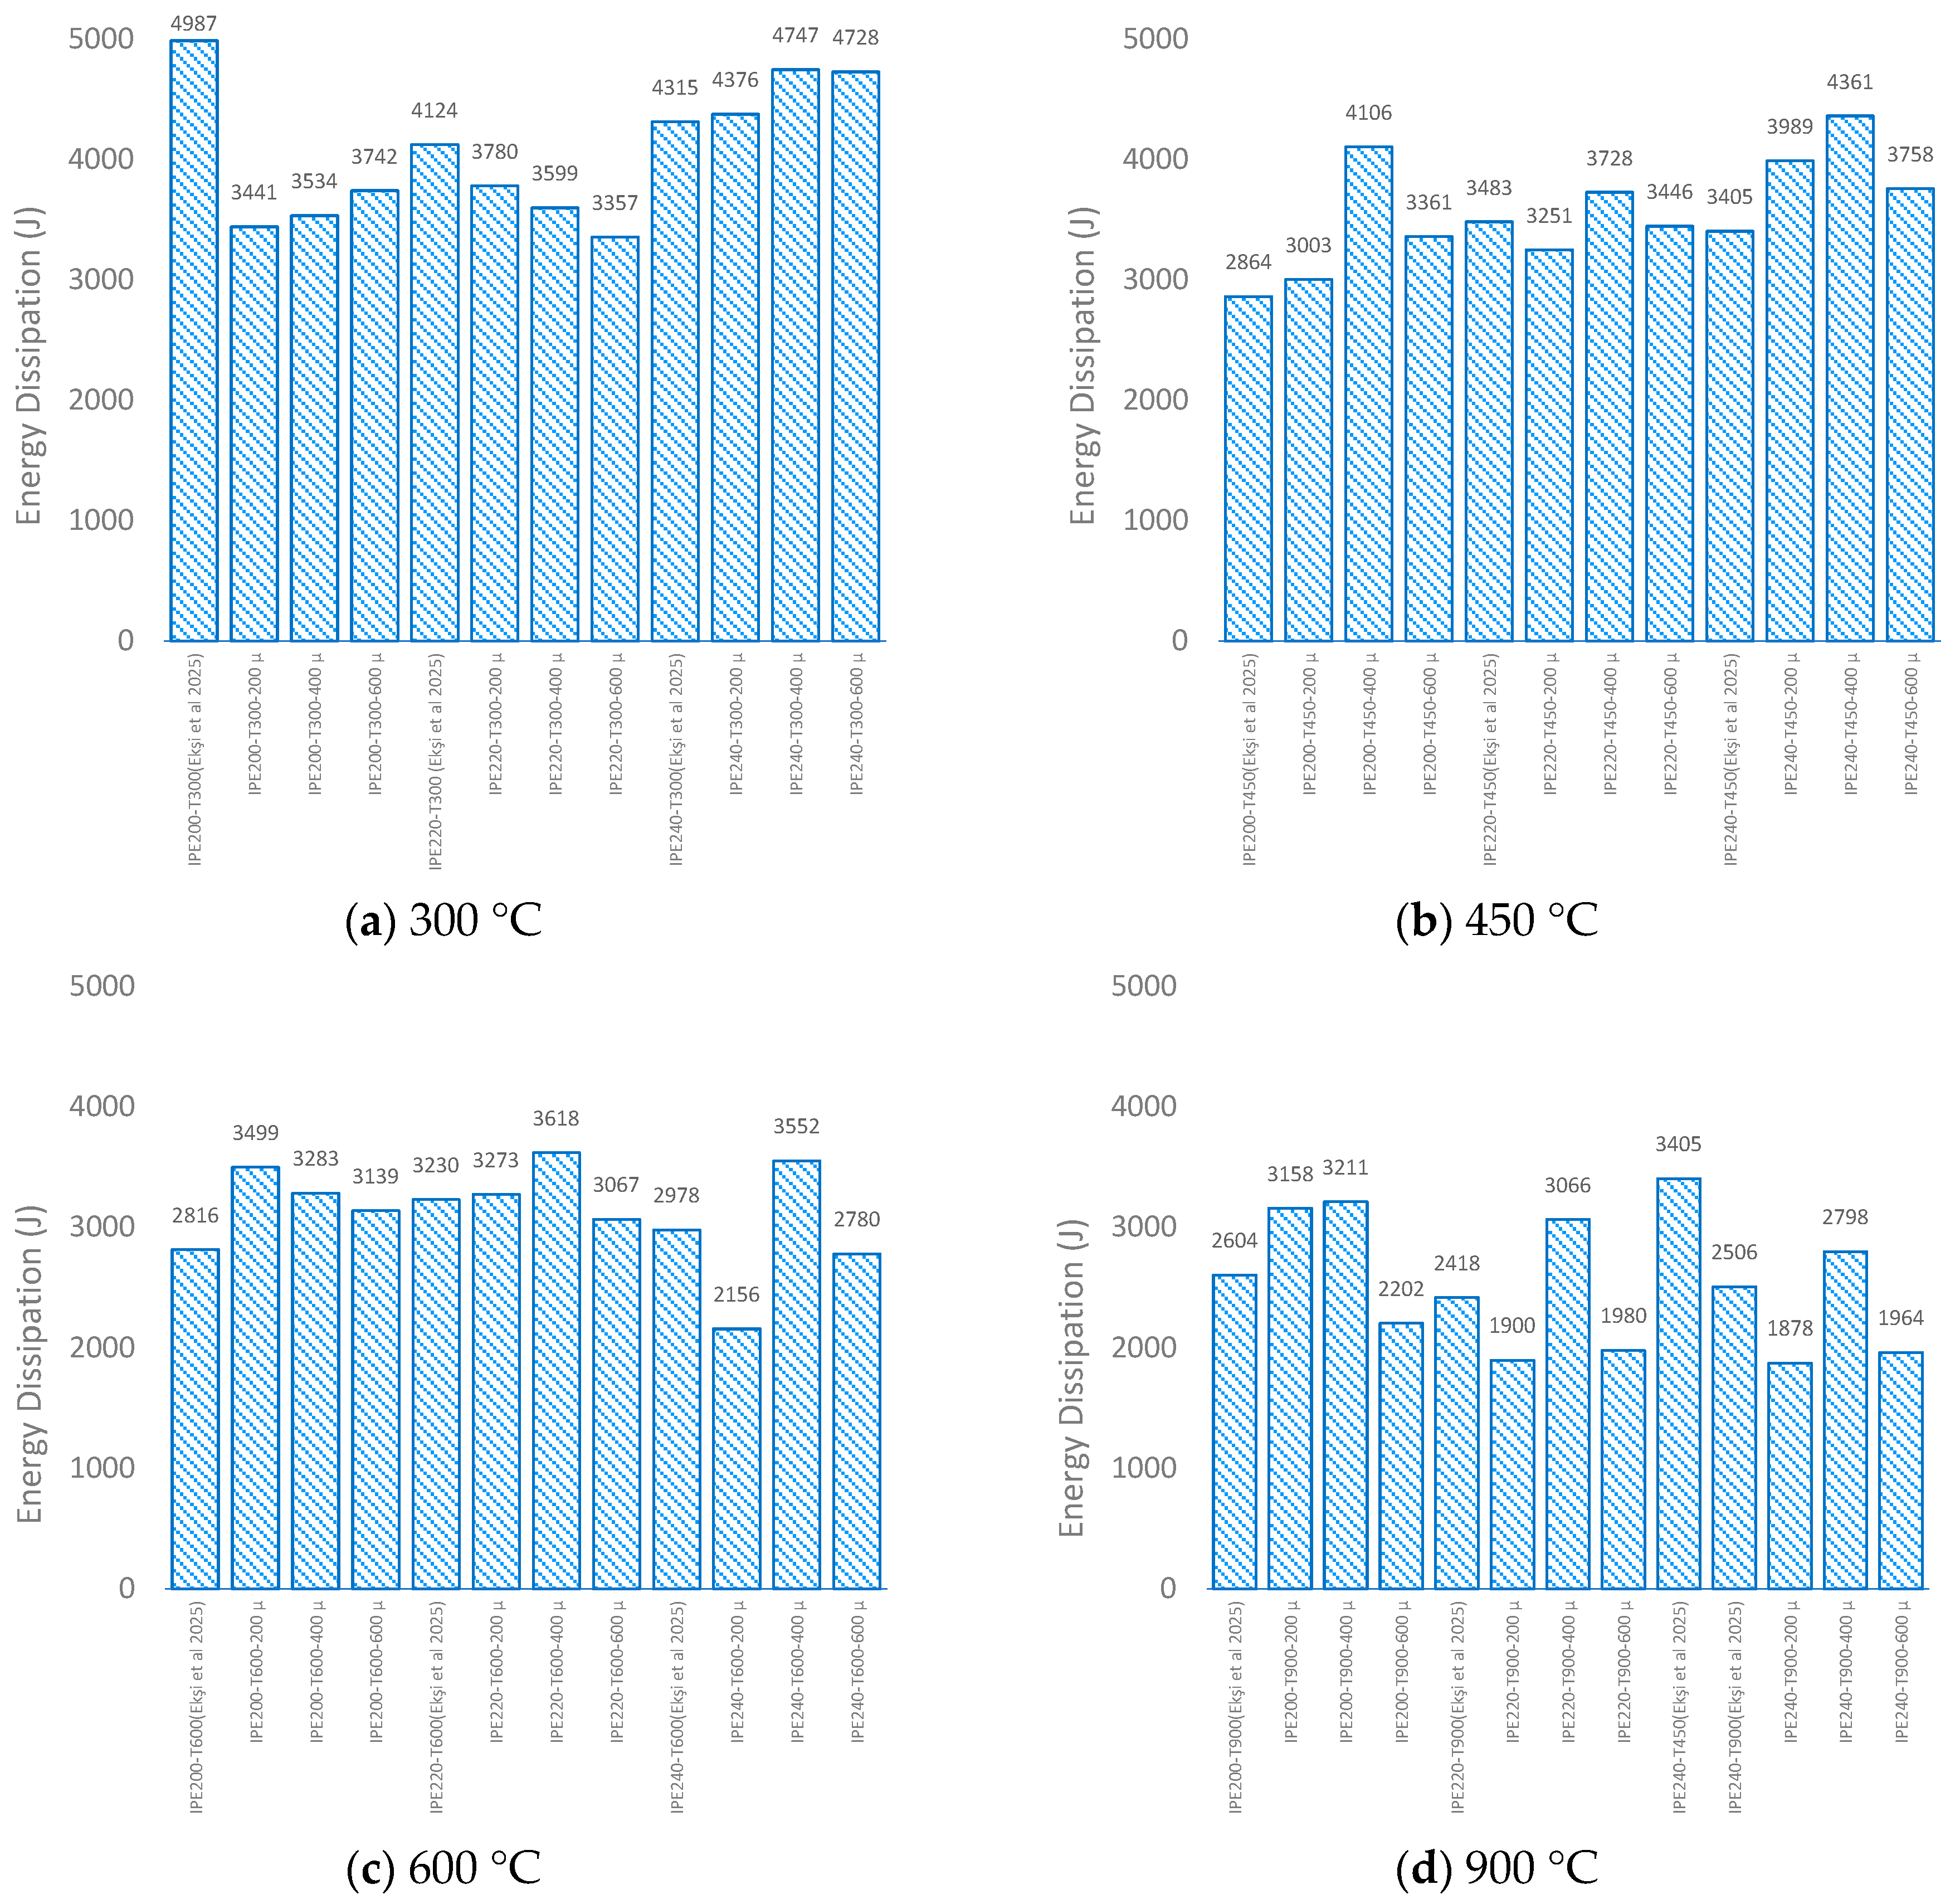
Energy dissipation (J) was computed as the area under the experimental force–displacement curve using the trapezoidal rule. Integration was carried out until specimen failure/termination displacement as defined in the test protocol. The resulting per-specimen EEE values were grouped by temperature (300/450/600/900 °C), coating thickness (200/400/600 µm), and section type (IPE 200/220/240) to construct Figure 16.
According to these test results (Figure 16), in the samples exposed to fire at 450 °C, 600 °C, and 900 °C in the experiments with IPE 200, the energy dissipation capacity value up to 400 μm paint thickness increased by 30.25%, 14.24%, and 18.91%, respectively, compared to the unpainted sample. In addition, in the IPE 220 samples exposed to 450 °C, 600 °C, and 900 °C fire in the experiments, the energy dissipation capacity value increased by 6.5%, 10.72%, and 21.14%, respectively, compared to the unpainted sample, with paint thicknesses up to 400 μm. Additionally, in these two groups of experiments (IPE 200 and IPE 220), a decrease in energy dissipation capacity was observed after the paint thickness exceeded 400 μm. Look at the results of the IPE240 tests in Figure 16; there is an increase in the energy dissipation capacity as the paint thickness increases. As a result, for the energy dissipation capacity-ideal T-stub connection to protect against fire, the paint thickness should be between 200 and 400 μm and the tf/tw ratio should be less than 0.63.

4. Numerical Investigation

Using the commercial FE program Abaqus/standard [61], six three-dimensional numerical models were developed to assess how bolted T-stub connections would behave in various post-fire scenarios. The measured cross-sectional dimensions, the original geometric faults, the material properties from the coupon tensile tests, and other factors were all taken into account in the FE model.

4.1. Material Properties, Element Type and Mesh Size

The incremental plasticity model, which also included the nonlinear material properties from actual stress–logarithmic plastic strain curves, was used to represent the T-Stub. The engineering stress–strain curve was utilized to create the following equations, which were then used to determine the actual stress–strain relationship:
σ t r u e = σ ( 1 + ε )
ε t r u e ( p l ) = l n 1 + ε σ t r u e E
where E stands for Young’s modulus, true and true (pl) stand for the true stress and strain used in numerical modeling and for the engineering stress and strain, respectively. It is mentioned in the present paper’s section “2.2. Mechanical Properties” that the FE model used measured values of material parameters from tensile coupon testing. For elevated temperatures, the degradation of steel mechanical properties was modeled using temperature-dependent stress–strain curves in accordance with Eurocode 3-1-2 [1]. This method allows for capturing both stiffness and strength reduction during heating and cooling phases and is consistent with established FE modeling practices in the literature [19]. The temperature-dependent data were directly implemented into ABAQUS using the temperature-dependent material property option. Initial geometric imperfections were not included in the FE models, as the specimens were precisely fabricated and relatively short, making any out-of-plane deviations negligible compared with the deformations observed under loading. Given the study’s focus on validating the FE results against post-fire experiments, the influence of such imperfections on the overall response was considered insignificant.
The solid element C3D8R (eight-node reduced integration brick element), which may replicate nonlinearities in both geometrical and material behavior, was used to build the complete model. A mesh sensitivity analysis was conducted to ensure the accuracy and efficiency of the FE simulations. The results indicated that a mesh size of 3 mm × 3 mm (length × width) for the T-stub plates provided an optimal balance between computational cost and result accuracy. For the bolts, a finer mesh of 2 mm × 2 mm (length × breadth) was adopted. To capture local stress concentrations more accurately, especially around the rounded corners and flange holes, even smaller mesh sizes were applied in these critical regions. This approach ensured that the numerical model could reliably reproduce the stress distribution and deformation patterns observed in the experiments (Figure 17).

4.2. Boundary Conditions and Loading Procedure

The contact interactions in the FE model were defined following the methodology used in previous studies on intumescent-coated steel connections [62,63,64,65]. Specifically, the bolt head–flange top surface and the bolt shank–bolt hole inner surface were modeled using a “hard contact” formulation in the normal direction, allowing separation after initial contact, and a penalty-based tangential contact with a friction coefficient of μ = 0.3, as adopted in [19]. The FE analysis consisted of four sequential steps. In the first step, each bolt was assigned a pretension of 50 kN, which corresponds to 0.7 times the tensile strength recommended in the Eurocode [1]. In the second and third steps, transient thermal loading was applied, following the temperature–time history recorded in the experimental program, similar to the ISO 834 fire curve approach in [62,63,64,65]. The final step involved monotonic displacement-controlled loading applied at the end of the web until the target displacement values (Table 4 and Table 5) were reached. Failure criteria for bolts and plates were based on material yielding and ultimate strain limits derived from the temperature-dependent stress–strain curves [19]. For the intumescent coating, the same modeling strategy as in [62,63,64,65] was used, where the coating was represented as a separate surface layer tied to the bolt surface, with temperature-dependent properties defined in tabular form. This modeling approach is considered valid because it integrates experimentally derived, temperature-dependent material properties into the FE framework, enabling realistic representation of swelling, insulation, and degradation processes of intumescent coatings. Previous studies have confirmed that such models, when validated against standard and large-scale fire tests, achieve close agreement with experimental observations, thereby ensuring both physical accuracy and predictive reliability for post-fire performance assessments [49,64,65]. The coefficient of swelling was set to a maximum of 3.0, activated above 250 °C and reaching its peak at 600 °C, consistent with both manufacturer’s data and the values reported in [1,2]. The thermal conductivity (λ) was defined in the range of 0.025–0.060 W/m·K, decreasing slightly with temperature, and the specific heat capacity (Cp) was defined as between 1000 and 1500 J/kg·K, both in agreement with the cited literature [62,63,64,65].

5. Validation of the Finite Element Method (FEM)

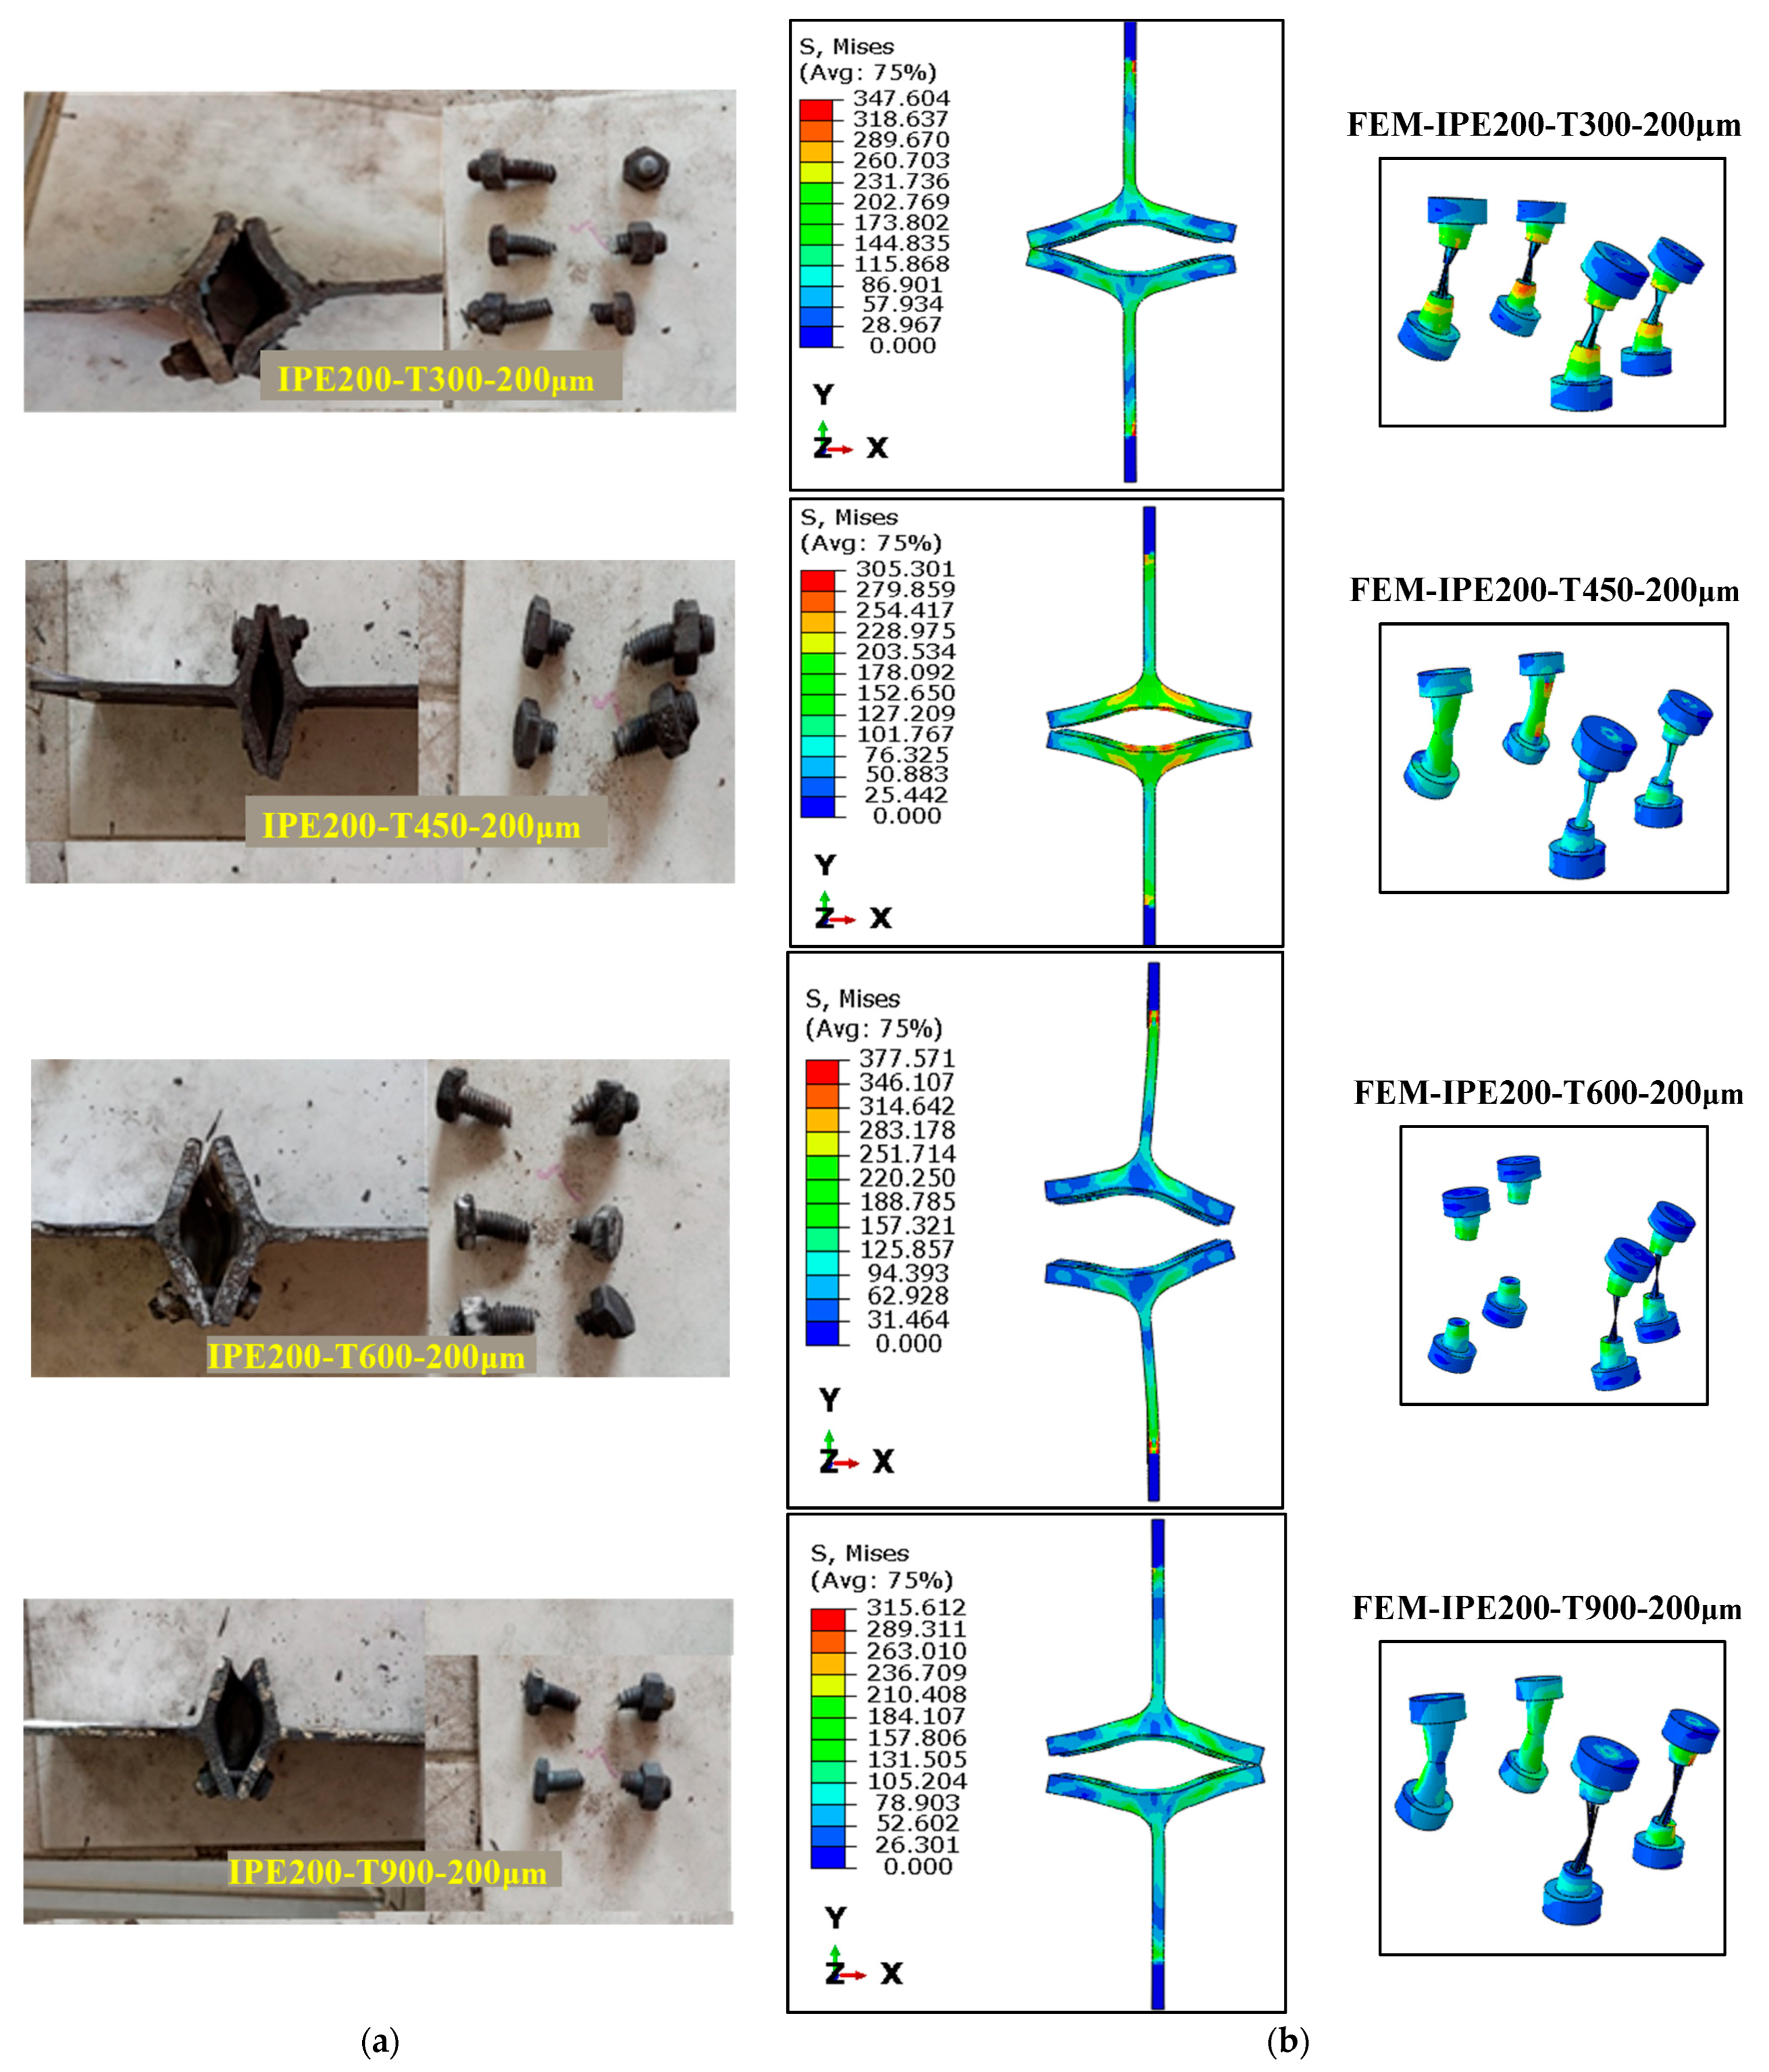
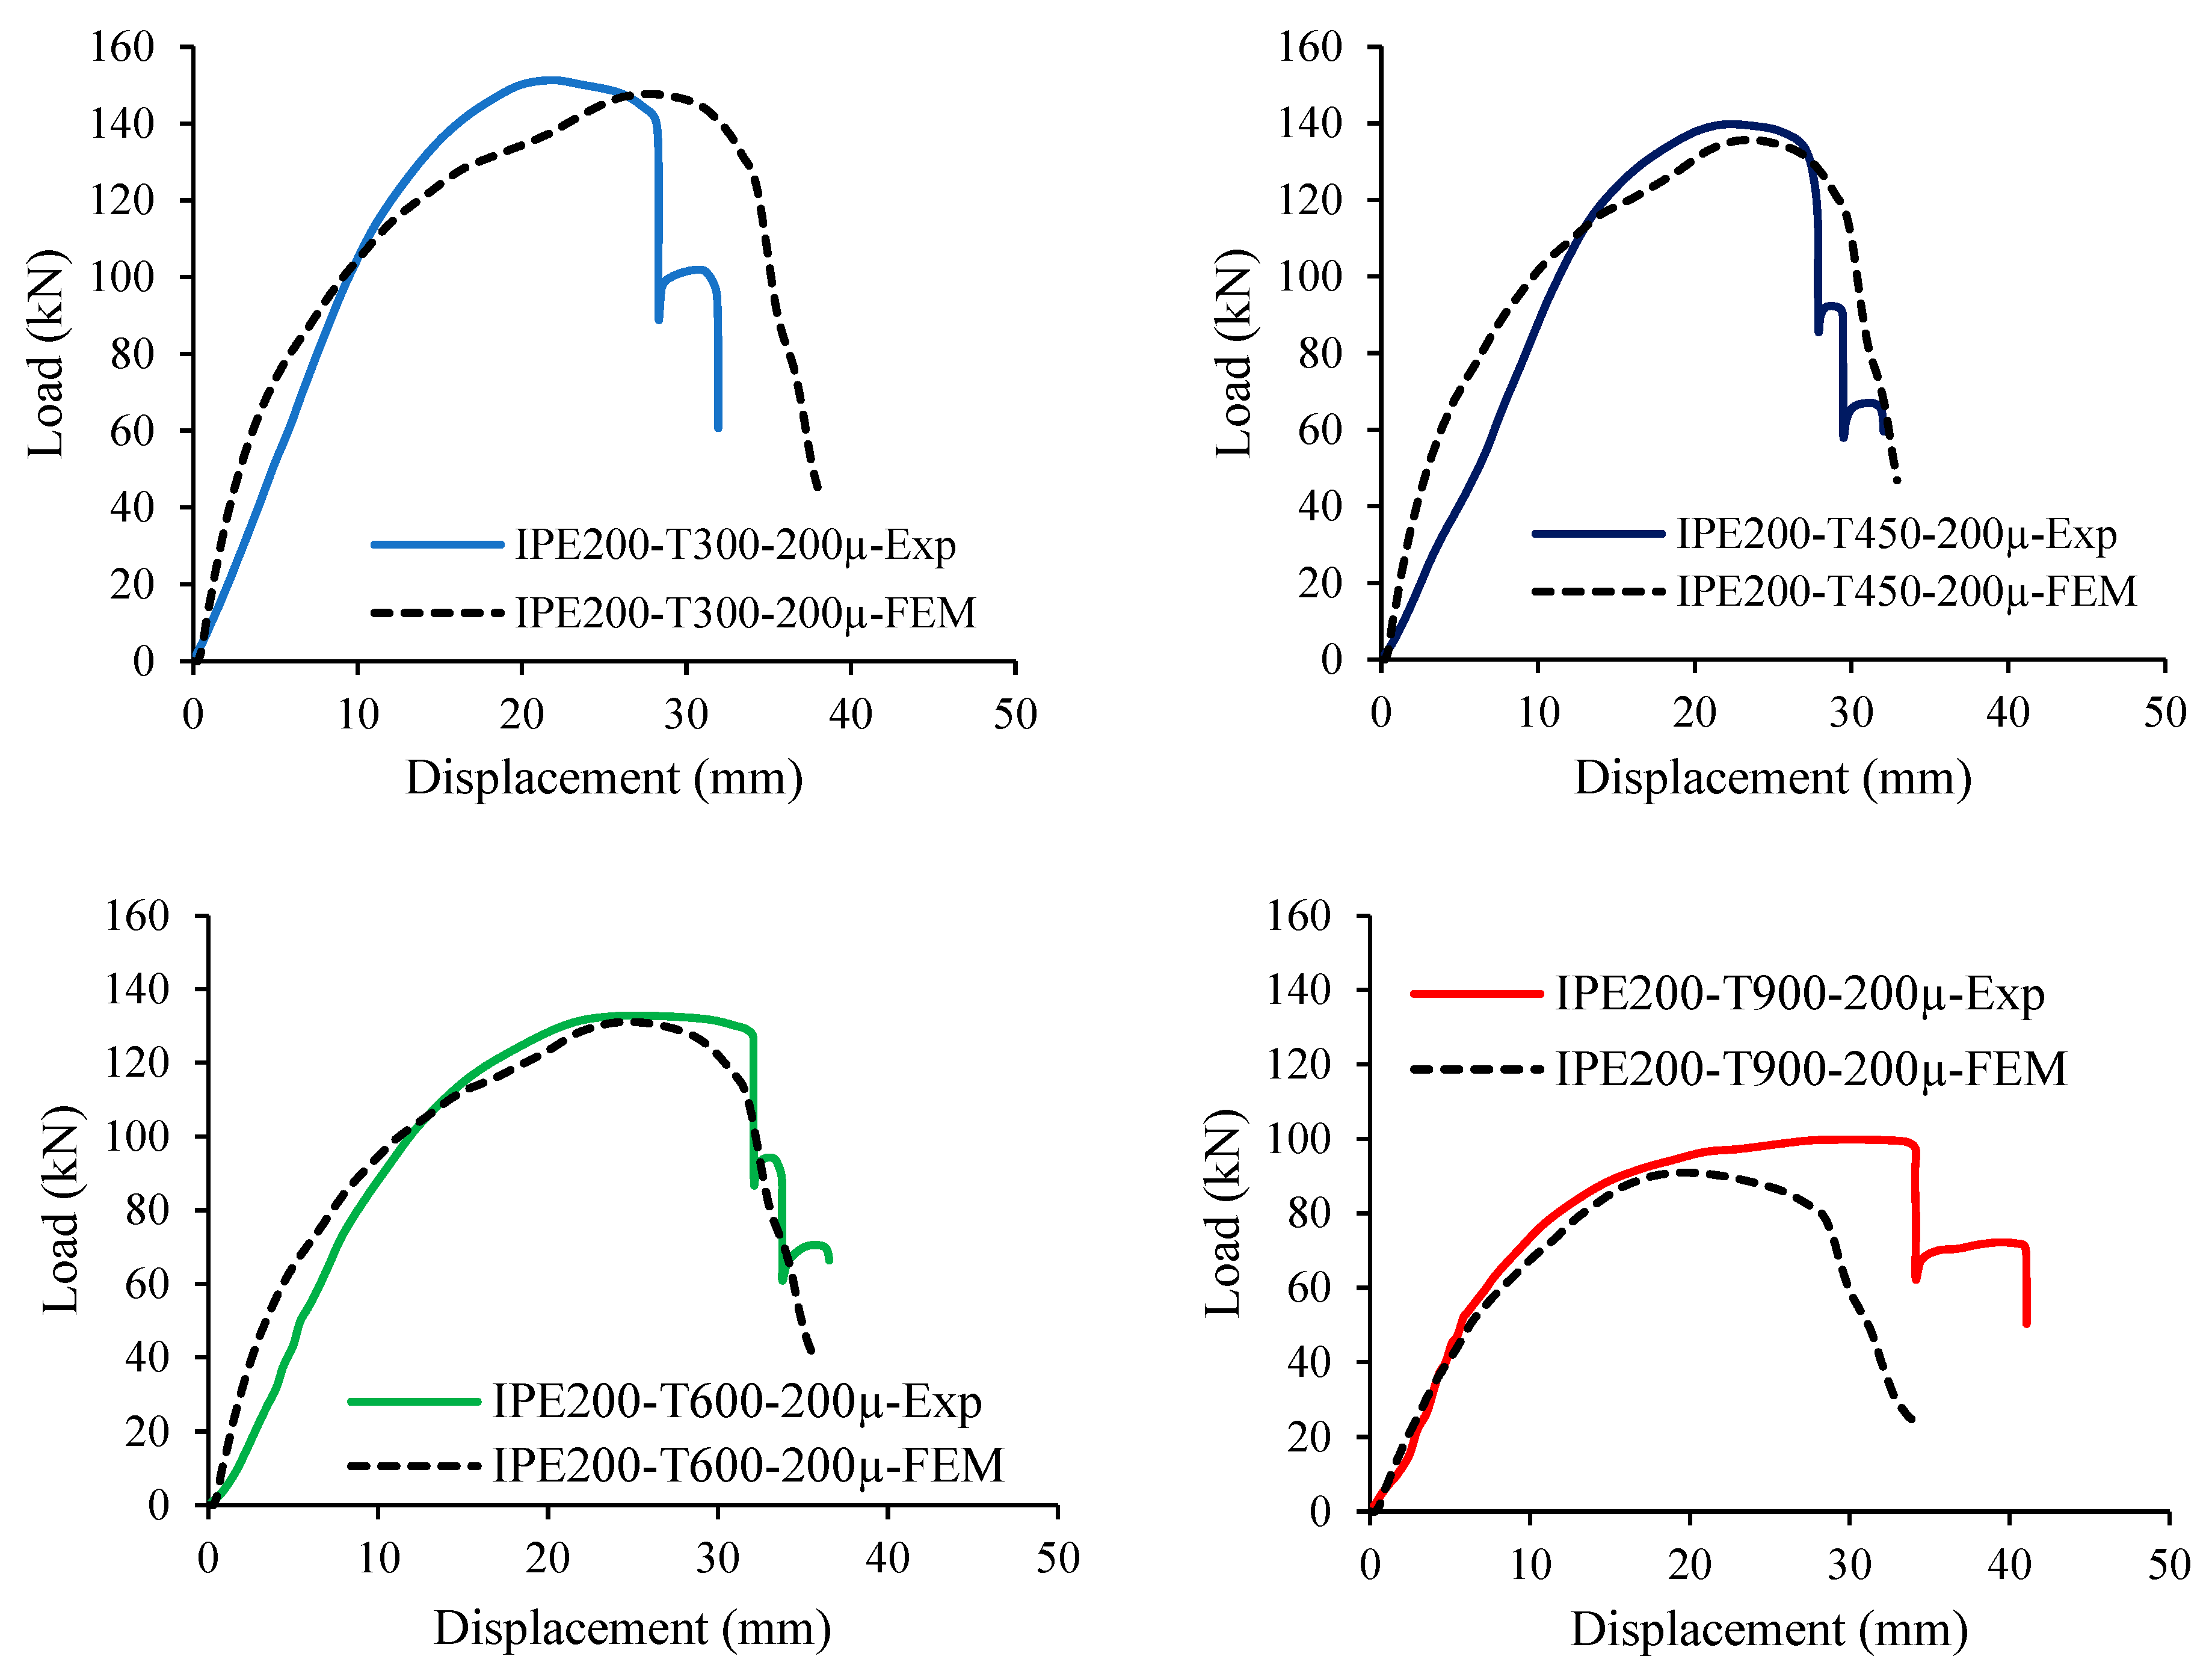
In this study, the finite element method (FEM) was validated against experimental results for the mechanical behavior of IPE 200 specimens subjected to various levels of loading, as shown by the following description. The specimens were tested at different temperatures (T300, T450, T600, and T1900) and the resulting deformations and failure modes were captured. Figure 18 shows the post-experiment and corresponding FEM post-analysis failure modes, indicating that the FEM was able to accurately capture the progressive failure and deformation of the specimens. Furthermore, the validation is evident from the close agreement between the experimental- and FEM-predicted load–displacement curves presented in Figure 19. The curves demonstrate a consistent pattern across different temperature treatments, with only slight deviations between the experimental (Exp) and FEM results, which are quantified in Table 6. The maximum load and energy dissipation values from the FEM closely match the experimental data, with differences ranging from 0.97% to 9.73% for load and 1.18% to 42.13% for energy dissipation, indicating reasonable predictive capability of the FEM models. The comparison of buckling shapes and failure locations between the FEM predictions and the experimental observations also supports the reliability of the FEM approach for simulating the behavior of steel structures under high-temperature conditions (Figure 20). Concerning the maximum load capacity, the results are conservative as expected, with the difference between the numerical and experimental values generally under 10% [62,63,64,65]. The discrepancies between the experimental and FEM load–displacement curves in Figure 19 mainly arise from modeling idealizations and inherent experimental variability. In the FEM, material properties were based on coupon tests, but simplified stress—strain definitions may not fully capture strain hardening and residual effects from heating and cooling. Uniform temperature application in the model neglects the thermal gradients present in experiments, while the omission of initial geometric imperfections and simplifications in contact and friction modeling can influence stiffness, especially in the initial and post-peak stages. Additionally, unpredictable fracture and bolt slip in experiments produce sudden stiffness drops that the deterministic FEM cannot replicate. Despite these factors, the FEM predictions showed good agreement for maximum load, with deviations mostly within 1.12–9.73%.
Limitations of the current study include the absence of fracture modeling, damage evolution criteria, and non-uniform thermal field simulation. The present study has certain limitations that should be acknowledged. The FE model adopted uniform thermal fields and did not explicitly account for initial geometric imperfections, residual stresses, or bolt slippage. Moreover, fracture and progressive damage mechanisms were not simulated, and the experimental program was restricted to a single coating type under post-fire conditions only. Future research should therefore focus on incorporating advanced constitutive models for fracture and damage evolution, applying transient non-uniform thermal analyses, and extending validation to a wider range of coating chemistries (e.g., hybrid epoxy–PU) and joint configurations. These improvements would enhance the predictive capability of FE models and provide a more comprehensive framework for post-fire assessment of steel joints.

6. Conclusions

This study comprehensively evaluated the fire resistance performance of bolted T-stub joints by investigating the effects of fire-resistant coating thickness, elevated temperature exposure, and geometric parameters such as flange-to-web thickness ratio (tf/tw). Experimental and numerical analyses were conducted on 36 T-joint specimens fabricated from IPE profiles and coated with water-based intumescent paint of varying thicknesses. Key conclusions drawn from the study are as follows:
  • The application of 200 μm and 400 μm fire-resistant paint at 300 °C and 450 °C led to significant improvements in axial load capacity—approximately 10% at 300 °C and 20% at 450 °C—compared to uncoated specimens.
  • Under these conditions, the 200 μm and 400 μm fire-resistant coating maintained capacity after high production runs. This appeared to be due to two physiological factors:
    (a)
    Thermal lag, where the medium-trail coating slows down heat input, limiting strength loss in the steel and relaxation of the bolt pre-stressing.
    (b)
    Mechanical buffering, where the charred/swollen layer formed during the cooling phase acts as a compliant interlayer, reducing differential shrinkage and residual stresses.
  • Protective coatings reduced the initial stiffness of the joints while increasing their post-limit stiffness, indicating a shift in mechanical behavior under elevated temperatures from elastic to more ductile response due to yield strength degradation.
  • With increasing temperature and coating thickness, the elastic deformation ratio (Δe/Δmax) decreased, while the plastic deformation ratio (Δp/Δmax) increased, showing a tendency toward enhanced ductility at higher thermal exposure.
  • IPE 200 specimens with 400 μm coatings showed maximum load capacity gains of 15.48%, 17.98%, 22.16%, and 19.28% at 300 °C, 450 °C, 600 °C, and 900 °C, respectively. These findings suggest that optimal fire resistance in terms of load-bearing performance can be achieved with 200–400 μm coatings and a tf/tw ratio below 0.63.
  • Despite improved load capacity, stiffness ratios declined considerably with increased coating thickness up to 600 μm, especially at 600 °C and 900 °C. For effective fire resistance at these high temperatures, a coating thickness between 400 and 600 μm and a tf/tw ratio under 0.64 are recommended.
  • Energy dissipation capacity increased with paint thickness up to 400 μm for specimens exposed to 450 °C and above. IPE 200 and IPE 220 specimens showed enhancements up to 30.25% and 21.14%, respectively, emphasizing the benefit of controlled coating application for structural resilience under fire.
  • Finite element analyses performed using Abaqus demonstrated high agreement with experimental data, with deviations in maximum load and energy dissipation ranging from 0.97% to 9.73% and 1.18% to 42.13%, respectively. The FEM models accurately predicted deformation patterns and failure mechanisms, validating their reliability for simulating steel joints under fire exposure.
  • Overall, this study highlights the effectiveness of fire-resistant coatings and geometric optimization in improving the structural performance of steel T-stub joints under elevated temperatures and demonstrates the accuracy of FEM tools in predicting their thermo-mechanical behavior.
  • This study suggests that for bolted T-joints exposed to conditions similar to this one, a medium-thickness (200–400 μm) intumescent coating may provide an appropriate protection/thickness balance by balancing thermal retardation and coal layer integrity. In practice, designers and inspectors may prioritize verifying coal layer continuity/adhesion after fire, re-coating in areas experiencing coal loss, and considering the balance between thermal performance and mechanical strength of the coal layer when selecting coatings. While code/standard calibration is beyond the scope of this study, observed trends can inform coating selection and repair evaluations for similar connections.

Author Contributions

Conceptualization, Z.Y., M.M., E.A. and A.C.A.; methodology, Z.Y., M.M., E.A. and A.C.A.; software, M.S.S.; validation, Z.Y., M.M., E.A. and M.S.S.; formal analysis, Z.Y., M.M., E.A. and A.C.A.; investigation, Z.Y., M.M., E.A., M.S.S. and H.E.; resources, Z.Y., M.M., E.A., M.S.S. and H.E.; data curation, Z.Y., M.M., E.A. and M.S.S.; writing—original draft preparation, Z.Y., M.M. and E.A.; writing—review and editing, Z.Y., M.M., E.A., M.S.S. and A.C.A.; visualization, Z.Y., M.M., E.A., M.S.S. and A.C.A.; supervision, Z.Y., M.M., E.A. and A.C.A.; project administration, Z.Y., M.M., E.A. and A.C.A.; funding acquisition, M.M. and A.C.A. All authors have read and agreed to the published version of the manuscript.

Funding

This research received no external funding.

Conflicts of Interests

Author Mahyar Maali is employed by the Maali Çelik Ar-Ge Danışmanlık, Müh. İnş. Taah. Tarım ve Hayvancılık Company. Author Abdulkadir Cüneyt Aydin is employed by the ACADEMY Sağlık Hiz. Müh. İnş. Taah. Elekt. Yay. Trade Industry Ltd. Co. The remaining authors declare that the research was conducted in the absence of any commercial or financial relationships that could be construed as a potential conflict of interest.

References

  1. Eurocode 3. EN1993 Design of Steel Structures; European Committee for Standardization: Brussels, Belgium, 2005. [Google Scholar]
  2. Bezerra, L.M.; Bonilla, J.; Silva, W.A.; Matias, W.T. Experimental and numerical studies of bolted T-stub steel connection with different flange thicknesses connected to a rigid base. Eng. Struct. 2020, 218, 110770. [Google Scholar] [CrossRef]
  3. Özkılıç, Y.O. The capacities of thin plated stiffened T-stubs. J. Constr. Steel Res. 2021, 186, 106912. [Google Scholar] [CrossRef]
  4. Bezerra, L.M.; Bonilla, J.; Freitas, C.S.; Massicotte, B. Behavior of T-stub steel connections bolted to rigid bases. J. Constr. Steel Res. 2022, 192, 107242. [Google Scholar] [CrossRef]
  5. Zhang, Y.; Gao, S.; Guo, L.; Qu, J.; Wang, S. Ultimate tensile behavior of bolted T-stub connections with preload. J. Build. Eng. 2022, 47, 103833. [Google Scholar] [CrossRef]
  6. Stamatopoulos, G.N.; Ermopoulos, J.C. Influence of the T-stub flexibility on its strength. Int. J. Steel Struct. 2010, 10, 73–79. [Google Scholar] [CrossRef]
  7. Faralli, A.C.; Latour, M.; Tan, P.J.; Rizzano, G.; Wrobel, P. Experimental investigation and modelling of T-stubs undergoing large displacements. J. Constr. Steel Res. 2021, 180, 106580. [Google Scholar] [CrossRef]
  8. Liu, X.; Hao, Z.; Luo, X.; Jin, Z. Experimental behavior and modelling of steel bolted T-stub connections. Buildings 2023, 13, 575. [Google Scholar] [CrossRef]
  9. Wang, Y.; Sun, L.; Wang, P.; Hou, G.; Cai, X.; He, M. Feasibility study of TSOB replacing standard high-strength bolt in T-stub connection. In Structures; Elsevier: Amsterdam, The Netherlands, 2024; Volume 62, p. 106246. [Google Scholar] [CrossRef]
  10. Sarfarazi, S.; Shamass, R.; Guarracino, F.; Mascolo, I.; Modano, M. Exploring the stainless-steel beam-to-column connections response: A hybrid explainable machine learning framework for characterization. Front. Struct. Civ. Eng. 2025, 19, 34–59. [Google Scholar] [CrossRef]
  11. Shen, Y.; Li, M.; Li, Y. A reliable cyclic envelope model for partially-restrained steel beam-column bolted T-stub connections based on experimental data. Thin-Walled Struct. 2024, 200, 111951. [Google Scholar] [CrossRef]
  12. de Cisneros Fonfría, J.J.J.; Amador, A.M.G.; González, A.Q.; Fernández, L.P. Investigating the T-stub connection with different web-to-flange joint configurations. Eng. Struct. 2023, 294, 116715. [Google Scholar] [CrossRef]
  13. LaMalva, K.J.; Barnett, J.R.; Dusenberry, D.O. Failure analysis of the World Trade Center 5 building. J. Fire Prot. Eng. 2009, 19, 261–274. [Google Scholar] [CrossRef]
  14. Ahmadi, M.T.; Aghakouchak, A.A.; Mirghaderi, R.; Tahouni, S.; Garivani, S.; Shahmari, A.; Epackachi, S. Collapse of the 16-story Plasco building in Tehran due to fire. Fire Technol. 2020, 56, 769–799. [Google Scholar] [CrossRef]
  15. FEMA403; Federal Emergency Management Agency: Washington, DC, USA; New York, NY, USA, 2002. Available online: https://www.fema.gov/pdf/library/fema403_ch2.pdf (accessed on 1 February 2023).
  16. Meng, B.; Li, H.; Liew, J.Y.R.; Li, S.; Kong, D.Y. Enhancing the collapse resistance of a composite subassembly with fully welded joints using sliding inner cores. J. Struct. Eng. 2024, 150, 04024085. [Google Scholar] [CrossRef]
  17. Ketabdari, H.; Daryan, A.S.; Hassani, N. Predicting post-fire mechanical properties of grade 8.8 and 10.9 steel bolts. J. Constr. Steel Res. 2019, 162, 105735. [Google Scholar] [CrossRef]
  18. Wang, P.; You, Y.; Wang, Q.; Gu, H.; Wang, G.; Liu, Y.; Liu, F. Post-fire tensile behavior of hole-anchored bolted T-stub connection. J. Constr. Steel Res. 2021, 187, 106941. [Google Scholar] [CrossRef]
  19. Gao, F.; Liu, Z.; Guan, X. Fire resistance behavior of T-stub joint components under transient heat transfer conditions. Eng. Struct. 2021, 237, 112164. [Google Scholar] [CrossRef]
  20. Qiang, X.; Shu, Y.; Jiang, X.; Xiao, Y. Nonlinear analysis on mechanical behaviour of high strength steel extended endplate connections and equivalent T-stubs in fire considering axial force. Case Stud. Constr. Mater. 2023, 19, e02402. [Google Scholar] [CrossRef]
  21. Qiang, X.; Shu, Y.; Jiang, X. Mechanical behaviour of high strength steel T-stubs at elevated temperatures: Experimental study. Thin-Walled Struct. 2023, 182, 110314. [Google Scholar] [CrossRef]
  22. Irvani, M.; Ezati, H.; Khafajeh, R.; Jaari, V.R.K. Numerically study on the seismic response of partially restrained moment connection with structural fuse T-stub for European sections. In Structures; Elsevier: Amsterdam, The Netherlands, 2022; Volume 35, pp. 82–105. [Google Scholar] [CrossRef]
  23. Wang, P.; You, Y.; Liu, M.; Zhang, B.; Zhou, S.; Chen, J. Behavior of thread-fixed one-side bolted T-stubs with backing plates at ambient and elevated temperatures. J. Constr. Steel Res. 2020, 170, 106093. [Google Scholar] [CrossRef]
  24. Sebbagh, H.R.; Kerdal, D.E.D.; Abidelah, A.; Bouchaïr, A. T-stubs with two and four bolts under monotonic and cyclic loading. J. Constr. Steel Res. 2021, 178, 106486. [Google Scholar] [CrossRef]
  25. Wang, P.; Sun, L.; Zhang, B.; Yang, X.; Liu, F.; Han, Z. Experimental studies on T-stub to hollow section column connection bolted by T-head square-neck one-side bolts under tension. J. Constr. Steel Res. 2021, 178, 106493. [Google Scholar] [CrossRef]
  26. Cai, W.Y.; Jiang, J.; Li, G.Q.; Wang, Y.B. Fracture behavior of high-strength bolted steel connections at elevated temperatures. Eng. Struct. 2021, 245, 112817. [Google Scholar] [CrossRef]
  27. AIJ.; Design Standard for Steel Structures–Based on Allowable Stress Concept. Architectural Institute of Japan: Tokyo, Japan, 2005.
  28. Standard, B. Eurocode 1: Actions on Structures; British Standard: London, UK, 2006. [Google Scholar]
  29. Wang, W.; Fang, H.; Wang, Z. Comprehensive studies on the behaviors of high strength steel T-stubs with thin-walled flange at elevated temperatures. Thin-Walled Struct. 2023, 190, 110998. [Google Scholar] [CrossRef]
  30. Meng, B.; Qiangqiang, D.; Zhong, W.; Tan, Z.; You, K. Tensile resistance and deformation of novel bending T-stub connections against progressive collapse. J. Constr. Steel Res. 2023, 201, 107733. [Google Scholar] [CrossRef]
  31. Khani, R.; Hosseinzadeh, Y.; Asl, M.H. Improving the T-stub component behavior tied to a rigid base. J. Constr. Steel Res. 2023, 211, 108199. [Google Scholar] [CrossRef]
  32. Zoetemeijer, P. A design method for the tension side of statically loaded, bolted beam-to-column connections. HERON 1974, 20, 1974. [Google Scholar]
  33. Khani, R.; Hosseinzadeh, Y.; Asl, M.H. Investigating the prying force magnitude and location in the T-stub connection based on the energy method. Eng. Struct. 2023, 280, 115655. [Google Scholar] [CrossRef]
  34. Hantouche, E.G.; Abboud, N.H. Stiffness modeling of bolted thick built-up T-stub connections including secondary prying effect. J. Constr. Steel Res. 2014, 95, 279–289. [Google Scholar] [CrossRef]
  35. Herrera, R.A.; Bravo, M.; Gómez, G.; Aedo, G. Performance of built-up T-stubs for Double T moment connections. J. Constr. Steel Res. 2013, 88, 289–295. [Google Scholar] [CrossRef]
  36. Nair, R.S.; Birkemoe, P.C.; Munse, W.H. High strength bolts subject to tension and prying. J. Struct. Div. 1974, 100, 351–372. [Google Scholar] [CrossRef]
  37. de la Croix Kombate, T.J.; Taşkın, K. State-of-the-art review on the behaviour of T-stubs and prying action. J. Constr. Steel Res. 2022, 191, 107203. [Google Scholar] [CrossRef]
  38. Hu, D.; Papadopoulos, J.; Adams, G.G. Prying action in an elastic T-stub tensile connection. J. Constr. Steel Res. 2020, 169, 106027. [Google Scholar] [CrossRef]
  39. Douty, R.T.; McGuire, W. High strength bolted moment connections. J. Struct. Div. 1965, 91, 101–128. [Google Scholar] [CrossRef]
  40. You, Y.; Liu, M.; Liu, Y.; Wang, P.; Zhou, S.; Chen, J. Experimental studies on thread-fixed one-side bolted T-stubs in tension at elevated temperatures. J. Constr. Steel Res. 2020, 171, 106139. [Google Scholar] [CrossRef]
  41. Both, I.; Duma, D.; Dinu, F.; Dubina, D.; Zaharia, R. The influence of loading rate on the ultimate capacity of bolted T-stubs at ambient and high temperature. Fire Saf. J. 2021, 125, 103438. [Google Scholar] [CrossRef]
  42. de Silva, D.; Alam, N.; Nadjai, A.; Nigro, E.; Ali, F. Finite element modelling for structural performance of slim floors in fire and influence of protection materials. Appl. Sci. 2021, 11, 11291. [Google Scholar] [CrossRef]
  43. Nazrun, T.; Hassan, M.K.; Hasnat, M.R.; Hossain, M.D.; Ahmed, B.; Saha, S. A comprehensive review on intumescent coatings: Formulation, manufacturing methods, research development, and issues. Fire 2025, 8, 155. [Google Scholar] [CrossRef]
  44. Zhang, L.; Hu, Y.; Li, M. Research on thermal response behavior of the intumescent coating at high temperature: An experimental and numerical study. Buildings 2022, 12, 1014. [Google Scholar] [CrossRef]
  45. Bogatu, N.; Buruiana, D.L.; Muresan, A.C.; Ghisman, V.; Lupu, A.; Mardare, L.; Herbei, E.E.; Basliu, V.; Ceoromila, A.; Florescu, S. Assessment of the Effectiveness of Protective Coatings in Preventing Steel Corrosion in the Marine Environment. Polymers 2025, 17, 378. [Google Scholar] [CrossRef] [PubMed]
  46. Li, S.; Liew, J.R.; Xiong, M.X.; Lai, B.L. Experimental investigation on fire resistance of high-strength concrete encased steel composite columns. Fire Saf. J. 2021, 121, 103273. [Google Scholar] [CrossRef]
  47. Du, E.F.; Shu, G.P.; Qin, L.; Lai, B.L.; Zhou, X.L.; Zhou, G.G. Experimental investigation on fire resistance of sandwich composite walls with truss connectors. J. Constr. Steel Res. 2022, 188, 107052. [Google Scholar] [CrossRef]
  48. Oliveira, R.B.; Moreno, A.L.; Vieira, L.C.M. Intumescent paint as fire protection coating. Rev. IBRACON Estrut. Mater. 2017, 10, 220–231. [Google Scholar] [CrossRef]
  49. TS EN13501-1; Fire Classification of Construction Products and Building Elements—Part 1: Classification Using Data from Reaction to Fire Tests. Institute of Turkish Standards: Ankara, Türkiye, 2019.
  50. EN 13381-8:2013; Test Methods for Determining the Contribution to the Fire Resistance of Structural Members—Part 8: Applied Reactive Protection to Steel Members. European Committee for Standardization: Brussels, Belgium, 2013.
  51. EN 13501-2:2016; Fire Classification of Construction Products and Building Elements: Classification Using Data from Fire Resistance Tests, Excluding Ventilation Services. European Committee for Standardization: Brussels, Belgium, 2016.
  52. ISONEM Anti-Fire Paint Plus: Technical Data Sheet (TDS). 2025. Available online: https://isonem.ge/wp-content/uploads/2025/04/TDS-EN-ISONEM-ANTI-FIRE-PAINT-PLUS.pdf (accessed on 1 January 2025).
  53. ISO 2808; Paints and Varnishes—Determination of Film Thickness. ISO: Geneva, Switzerland, 2019.
  54. ISO 834-1; Fire-Resistance Tests—Elements of Building Construction. ISO: Geneva, Switzerland, 2025.
  55. EN 1363-1; Fire Resistance Tests—Part 1: General Requirements. European Committee for Standardization: Brussels, Belgium, 2020.
  56. EN 1991-1-2; Eurocode 1: Actions on Structures—Part 1–2: General Actions on Structures Exposed to Fire. European Committee for Standardization: Brussels, Belgium, 2024.
  57. TS EN ISO 6892-1; Metallic Materials—Tensile Testing—Part 1: Method of Test at Room Temperature (ISO 6892-1:2019). Institute of Turkish Standards(TSE): Ankara, Türkiye, 2020.
  58. ISO 898-1:2013; Mechanical Properties of Fasteners Made of Carbon Steel and Alloy Steel Part 1: Bolts, Screws and Studs with Specified Property Classes—Coarse Thread and Fine Pitch Thread. ISO: Geneva, Switzerland, 2013.
  59. Ekşi, H.; Maali, M.; Yaman, Z.; Ağcakoca, E.; Sadid, M.S.; Aydın, A.C. Experimental Investigation of Steel Bolted T-Stub Connections at Different Post-Fire Condition. Arch. Civ. Mech. Eng. 2025. under review. [Google Scholar]
  60. AISC (American Institute of Steel Construction). ANSI/AISC360-10: Specification for Structural Steel Buildings; A.I.S.C.: Chicago, IL, USA, 2010. [Google Scholar]
  61. ABAQUS. G Abaqus 6.11; Dassault Systemes Simulia Corporation: Providence, RI, USA, 2011; p. 3. [Google Scholar]
  62. Chen, B.; Roy, K.; Uzzaman, A.; Lim, J.B. Moment capacity of cold-formed channel beams with edge-stiffened web holes, un-stiffened web holes and plain webs. Thin-Walled Struct. 2020, 157, 107070. [Google Scholar] [CrossRef]
  63. Schaumann, P.; Tabeling, F.; Weisheim, W. Numerical simulation of the heating behaviour of steel profiles with intumescent coating adjacent to trapezoidal steel sheets in fire. J. Struct. Fire Eng. 2016, 7, 158–167. [Google Scholar] [CrossRef]
  64. Weisheim, W.; Schaumann, P.; Sander, L.; Zehfuß, J. Numerical model for the fire protection performance and the design of intumescent coatings on structural steel exposed to natural fires. J. Struct. Fire Eng. 2020, 11, 33–50. [Google Scholar] [CrossRef]
  65. Barata, P.; Ribeiro, J.; Rigueiro, C.; Santiago, A.; Rodrigues, J.P. Assessment of the T-stub joint component at ambient and elevated temperatures. Fire Saf. J. 2014, 70, 1–13. [Google Scholar] [CrossRef]
Figure 1. According to Eurocode 3 and EN1993-1-8, the active elements in the bolted connection between a beam and a column [1].
Buildings 15 03257 g001
Figure 2. Two T-stubs are present: one in the end plate and the other in the column flange [1].
Buildings 15 03257 g002
Figure 3. Three stages of T-stub flange plate behavior [1].
Buildings 15 03257 g003
Figure 4. Stress–strain curves according to Eurocode 3: (a) idealized bilinear stress–strain model for carbon steel at ambient or moderate temperatures; (b) bilinear model including strain-hardening effects; (c) temperature-dependent stress–strain curves at elevated temperatures (300–900 °C) [1].
Buildings 15 03257 g004
Figure 5. Geometries of T-Stub specimens and descriptions of nomenclatures. tw—web thickness; tf—flange thickness; hw—web height; H—height of the beam-to-column connection; B—length of the T-stub connection; b—width of the T-stub connection; p—distance between the centers of the diameters of two bolts; e—distance from the middle of the diameter of the bolt to the outside of the T-stub connection.
Buildings 15 03257 g005
Figure 6. “Anti-Fire Paint” (ISONEM®) and coated specimens.
Buildings 15 03257 g006
Figure 7. Exposure to high temperatures.
Buildings 15 03257 g007
Figure 8. Test instruments.
Buildings 15 03257 g008
Figure 9. Stress–strain curves of coupon tests: (a) flange (F) and (b) web (W).
Buildings 15 03257 g009
Figure 10. The load-displacement graphs obtained as a result of the experiments.
Buildings 15 03257 g010
Figure 11. Determination of initial stiffness and post-limit stiffness.
Buildings 15 03257 g011
Figure 12. Max axial load of all IPE profiles with anti-fire paint.
Buildings 15 03257 g012
Figure 13. Maximum load to bolt load capacity of all test specimens çevir.
Buildings 15 03257 g013
Figure 14. Maximum load capacity of all specimen tests [59].
Buildings 15 03257 g014
Figure 15. Stiffness capacity ratio of all specimen tests [59].
Buildings 15 03257 g015
Figure 16. Energy dissipation capacity of all specimen tests [59].
Buildings 15 03257 g016
Figure 17. Finite element model of experimental specimens and boundary conditions.
Buildings 15 03257 g017
Figure 18. Comparison of post-fire experimental and numerical failure modes of IPE 200 specimens with 200 µm coating at different temperatures: (a) post-fire experimental results and (b) corresponding FEM results from Abaqus showing von Mises stress distribution (MPa).
Buildings 15 03257 g018
Figure 19. Comparison of the force-displacement experimental and FEM graphs.
Buildings 15 03257 g019
Figure 20. Failure modes of FE models.
Buildings 15 03257 g020
Table 1. Experiment matrix.
GroupPaint Thickness (μm)SpecimensTemperature (°C)Bolttf (mm)tw (mm)H (2hw + 2tf) (mm)B (mm)n (mm)m (mm)b (2e + P) (mm)e (mm)p (mm)
IPE 200200I200-T300-200 μ300M128.55.63801002225.21002060
I200-T450-200 μ450
I200-T600-200 μ600
I200-T900-200 μ900
400I200-T300-400 μ30024.527.55
I200-T450-400 μ450
I200-T600-400 μ600
I200-T900-400 μ900
600I200-T300-600 μ30026.530.4
I200-T450-600 μ450
I200-T600-600 μ600
I200-T900-600 μ900
IPE 220200I220-T300-200 μ300M129.25.94201102225.21002060
I220-T450-200 μ450
I220-T600-200 μ600
I220-T900-200 μ900
400I220-T300-400 μ30024.527.55
I220-T450-400 μ450
I220-T600-400 μ600
I220-T900-400 μ900
600I220-T300-600 μ30026.530.4
I220-T450-600 μ450
I220-T600-600 μ600
I220-T900-600 μ900
IPE 240200I240-T300-200 μ300M129.86.24601202225.21002060
I240-T450-200 μ450
I240-T600-200 μ600
I240-T900-200 μ900
400I240-T300-400 μ30024.527.55
I240-T450-400 μ450
I240-T600-400 μ600
I240-T900-400 μ900
600I240-T300-600 μ30026.530.4
I240-T450-600 μ450
I240-T600-600 μ600
I240-T900-600 μ900
Table 2. Technical Properties of “Anti-Fire Paint”(© ISONEM) [52].
Surface heat conductivity valuemin 0.80
Thermal paint surface resistance (RS)0.0495 ± 1.5%
Thermal conductivity coefficient (W/mK)0.023; λ < 0.060
Impact resistanceNo cracking, no breaking
Density (25 °C, g/mL)1.40 ± 0.10
pH (25 °C)7.0–9.0
Viscosity (25 °C, mPas)12,500–15,000
Resistance5 kOhm: 30–150 mm
Resistance tolerance± %20
Load resistance100 kOhm.min
Solids ratio (% by Weight)76 ± 2
Water transfer rate (kg/m2.h0.5)<0.1 Grade W3
Water vapor permeability (m)5 ≤ SD ≤ 50 Grade II
Table 3. Average characteristic values for structural steels and bolts (M10-8.8).
Bolt
(M10-8.8)
IPE 200
Web
IPE 200
Flange
IPE 220
Web
IPE 220
Flange
IPE 240
Web
IPE 240
Flange
E (MPa)-203,214204,314204,444204,215205,116206,301
fy (MPa)817.2368367396393401398
fu (MPa)902.5533526565553570568
ρy = fy/fu0.910.690.700.700.710.710.72
E—Young’s modulus; fy—static yield; fu—tensile stresses.
Table 4. Load–deformation characteristics for all specimens.
GroupBolt Load
Capacity (kN)
SpecimensMax. Load
(kN)
Max.Load
/ Bolts Load
Capacity
Stiffness (kN/mm)Energy
Dissipation (Joule)
Initial Stiffness (Ke)Post-Limit Stiffness (Kp)Ke/KpKp/Ke
IPE 200135.648IPE200-T300 (Ekşi et al. 2025)127.970.948.571.665.160.194987.48
IPE200-T450 (Ekşi et al. 2025)118.700.9015.863.364.720.212863.89
IPE200-T600 (Ekşi et al. 2025)103.700.9015.002.525.950.172815.65
IPE200-T900 (Ekşi et al. 2025)83.600.6213.331.1811.300.092603.54
IPE200-T300-200 μ151.351.1210.003.922.550.393441.07
IPE200-T450-200 μ139.661.038.753.122.800.363003.22
IPE200-T600-200 μ132.830.989.223.282.810.363498.93
IPE200-T900-200 μ99.820.748.832.034.350.233158.13
IPE200-T300-400 μ151.421.129.293.842.420.413533.93
IPE200-T450-400 μ144.731.076.652.292.900.344106.30
IPE200-T600-400 μ133.230.989.763.243.010.333283.36
IPE200-T900-400 μ103.560.768.621.824.740.213210.93
IPE200-T300-600 μ141.681.0410.503.772.790.363741.66
IPE200-T450-600 μ128.560.9512.413.843.230.313360.60
IPE200-T600-600 μ104.830.768.571.884.560.223138.87
IPE200-T900-600 μ80.390.597.501.794.190.242201.79
IPE 220IPE220-T300 (Ekşi et al. 2025)146.401.0810.931.308.410.124123.50
IPE220-T450 (Ekşi et al. 2025)136.801.0112.822.315.550.183482.50
IPE220-T600 (Ekşi et al. 2025)133.900.9912.892.455.260.193230.04
IPE220-T900 (Ekşi et al. 2025)81.500.6010.891.139.640.102417.50
IPE220-T300-200 μ135.601.0010.402.893.600.283780.49
IPE220-T450-200 μ130.620.969.783.063.200.313250.55
IPE220-T600-200 μ115.160.856.402.003.200.313273.41
IPE220-T900-200 μ94.520.708.503.582.370.421900.43
IPE220-T300-400 μ130.250.967.292.323.140.323598.55
IPE220-T450-400 μ126.820.938.182.213.700.273727.68
IPE220-T600-400 μ118.850.876.851.534.480.223618.14
IPE220-T900-400 μ98.470.7312.501.627.720.133065.51
IPE220-T300-600 μ126.590.938.682.653.280.313357.49
IPE220-T450-600 μ115.540.857.142.233.200.313445.52
IPE220-T600-600 μ97.210.7212.141.527.990.133067.05
IPE220-T900-600 μ76.060.5611.431.477.780.131979.75
IPE 240IPE240-T300 (Ekşi et al. 2025)153.201.1312.002.025.940.174314.70
IPE240-T450 (Ekşi et al. 2025)142.501.059.171.904.830.213405.10
IPE240-T600 (Ekşi et al. 2025)110.801.038.502.183.900.262978.37
IPE240-T900 (Ekşi et al. 2025)94.750.707.880.997.960.132505.80
IPE240-T300-200 μ162.371.2013.752.904.740.214375.86
IPE240-T450-200 μ159.471.1816.893.654.630.223989.23
IPE240-T600-200 μ110.540.8111.332.594.370.232156.21
IPE240-T900-200 μ91.810.6815.942.855.590.181877.63
IPE240-T300-400 μ170.171.258.622.563.370.304746.73
IPE240-T450-400 μ163.411.209.062.533.580.284361.47
IPE240-T600-400 μ115.830.8510.381.745.970.173551.94
IPE240-T900-400 μ94.720.706.711.624.140.242798.28
IPE240-T300-600 μ161.621.198.652.883.000.334727.62
IPE240-T450-600 μ134.981.007.522.363.190.313758.08
IPE240-T600-600 μ93.130.6910.001.925.210.192780.18
IPE240-T900-600 μ71.450.538.161.684.860.211963.72
(Ekşi et al. 2025) [59].
Table 5. Displacement of experiment specimens.
SpecimensΔmax
(mm)
Δe
(mm)
Δp
(mm)
Δp/ΔeΔe/ ΔmaxΔp/ΔmaxΔmax/ΔeΔmax/Δp
IPE 200IPE200-T300-200 μ31.939.521.872.300.300.683.361.46
IPE200-T450-200 μ32.0412.821.661.690.400.682.501.48
IPE200-T600-200 μ36.619.224.192.630.250.663.981.51
IPE200-T900-200 μ41.056.229.064.690.150.716.621.41
IPE200-T300-400 μ32.4411.223.552.100.350.732.901.38
IPE200-T450-400 μ40.6215.833.162.100.390.822.571.22
IPE200-T600-400 μ32.478.224.633.000.250.763.961.32
IPE200-T900-400 μ40.85.835.166.060.140.867.031.16
IPE200-T300-600 μ38.07823.32.910.210.614.761.63
IPE200-T450-600 μ33.785.820.543.540.170.615.821.64
IPE200-T600-600 μ40.87729.814.260.170.735.841.37
IPE200-T900-600 μ36.84625.84.300.160.706.141.43
IPE 220IPE220-T300-200 μ39.0810.0520.972.090.260.543.891.86
IPE220-T450-200 μ32.84922.952.550.270.703.651.43
IPE220-T600-200 μ39.6212.530.042.400.320.763.171.32
IPE220-T900-200 μ29.19815.411.930.270.533.651.89
IPE220-T300-400 μ38.151426.041.860.370.682.731.47
IPE220-T450-400 μ40.721127.682.520.270.683.701.47
IPE220-T600-400 μ40.771332.32.480.320.793.141.26
IPE220-T900-400 μ39.18433.948.490.100.879.801.15
IPE220-T300-600 μ35.789.235.083.810.260.983.891.02
IPE220-T450-600 μ40.4911.227.172.430.280.673.621.49
IPE220-T600-600 μ40.434.234.578.230.100.869.631.17
IPE220-T900-600 μ33.283.5288.000.110.849.511.19
IPE 240IPE240-T300-200 μ35.29826.073.260.230.744.411.35
IPE240-T450-200 μ34.466.121.573.540.180.635.651.60
IPE240-T600-200 μ26.616.421.063.290.240.794.161.26
IPE240-T900-200 μ25.023.217.535.480.130.707.821.43
IPE240-T300-400 μ40.0814.532.142.220.360.802.761.25
IPE240-T450-400 μ36.7613.829.012.100.380.792.661.27
IPE240-T600-400 μ40.547.927.363.460.190.675.131.48
IPE240-T900-400 μ40.798.232.764.000.200.804.971.25
IPE240-T300-600 μ40.0413.329.462.220.330.743.011.36
IPE240-T450-600 μ38.1613.527.72.050.350.732.831.38
IPE240-T600-600 μ36.285.525.324.600.150.706.601.43
IPE240-T900-600 μ33.395.1522.684.400.150.686.481.47
Δmax—maximum displacement; Δe—elastic displacement; Δp—plastic displacement.
Table 6. Comparison of experimental and FEM.
SpecimenMax Load
(kN)
Energy Dissipation
(Joules)
ExpFEMDif (%)ExpFEMDif (%)
IPE200-T300-200 μ151.35147.72.473441.074209.218.25
IPE200-T450-200 μ139.66135.652.973003.223341.810.1
IPE200-T600-200 μ132.83131.361.123498.933458.021.18
IPE200-T900-200 μ99.8290.979.733158.132222.0542.13
Disclaimer/Publisher’s Note: The statements, opinions and data contained in all publications are solely those of the individual author(s) and contributor(s) and not of MDPI and/or the editor(s). MDPI and/or the editor(s) disclaim responsibility for any injury to people or property resulting from any ideas, methods, instructions or products referred to in the content.