Article

Human Behavior Patterns in Meso-Scale Waterfront Public Spaces from a Visual Accessibility Perspective—A Case Study of Xiaoqinhuai Historic District, Yangzhou (China)

1
Department of Architecture, School of Architecture, Southeast University, Nanjing 210096, China
2
School of Architecture and Art, North China University of Technology, Beijing 100144, China
*
Authors to whom correspondence should be addressed.
Buildings 2025, 15(17), 3247; https://doi.org/10.3390/buildings15173247
Submission received: 26 July 2025 / Revised: 2 September 2025 / Accepted: 5 September 2025 / Published: 8 September 2025
(This article belongs to the Section Architectural Design, Urban Science, and Real Estate)

Abstract

Understanding visitors’ outdoor activities in urban public spaces and their relationship with the physical environment is essential for improving the precision of public space design. This study, set in the context of Yangzhou, China, focuses on physical activity and other wellbeing behaviors in meso-scale waterfront public spaces, aiming to explore the characteristics of visitor behavior. A professional behavioral observation protocol was employed, combined with object detection and multi-object tracking algorithms, to systematically code visitor activities in the waterfront area. Subsequently, agent-based modeling (ABM) and three-dimensional isovist analysis (3D isovist) were introduced to construct a quantitative framework for assessing visual accessibility. The results reveal a significant positive correlation between facade Visual Exposure Time (seen from the observer) and isovist field area (seen from the object), providing strong evidence that visual accessibility is a primary causal driver of pedestrian behavior—independent of other causality. Based on these findings, this study proposes actionable design guidelines: “Prioritize small-scale, high-density waterfront building facade layouts to maximize visual efficiency” and “Leverage topographical variation along the waterfront by introducing cross-river visual corridors at intervals of ≤45 m”. The integrated analytical toolkit developed in this study—combining behavioral simulation with spatial–visual analysis—provides not only a theoretical foundation but also clear practical guidance for the fine-grained renewal and design of waterfront public spaces.

1. Introduction

In recent years, China’s urbanization has been undergoing a profound shift from “incremental expansion” toward “stock optimization” [1]. This emerging model of new-type urbanization increasingly centers on enhancing the quality of existing urban spaces [2] rather than pursuing indiscriminate expansion. Waterfront zones—critical components of urban public space—have garnered considerable attention in regeneration efforts [3]. As linear open spaces, urban waterfronts function as gateways that embody a city’s identity and character, drawing both residents and tourists for sustained engagement [4]. Such waterfront public spaces—whether along lakeshores or riverbanks—play a pivotal role in urban spatial systems, serving not only as ecological transition zones between water and land but also as vital connectors between nature and urban crowds [5]. A deeper understanding of the mechanisms linking urban morphological form to individuals’ subjective perceptions [6] can inform strategies to bolster urban vibrancy.
Within the dynamic “person–environment” system, urban form shapes and regulates individuals’ subjective perceptions via visual channels, thereby influencing behavioral adaptability [7]. Empirical studies indicate that distinct morphological elements—such as isovist (visual corridors), path configuration, and facade articulation—establish a framework of visible information that captures visual attention and governs selection processes, ultimately driving cognitive appraisal and action choice [8,9]. For instance, the continuity of a linear urban landscape can profoundly shape the unfolding visual experience, in turn affecting spatial wayfinding and emotional responses [10]. This visually mediated perceptual pathway not only enhances people’s efficiency in discerning environmental cues but also strengthens their sense of environmental fit, facilitating rapid behavioral adjustment [11]. Consequently, examining the interplay between urban morphology and human behavior through the lens of visual perception holds both significant theoretical and practical implications.
However, existing quantitative research on the “environment–behavior” nexus predominantly operates at two scales. At the macro-urban scale, studies quantify population distribution patterns and analyze spatial clustering characteristics of crowds [12], often employing spatial computation and GIS-based methods [13]; yet, these approaches lack the granularity to capture users’ perceptual hierarchies. At the micro-architectural scale, investigations focus on individuals’ preferences for built environments [14], typically utilizing Experience Sampling Methodology (ESM), eye-tracking, and virtual reality (VR) technologies—methods whose scalability is severely constrained by exponential increases in workload when experiments are expanded [15]. Research addressing meso-scale urban public spaces remains scarce [16] despite the fact that the meso-scale (neighborhood or district level) transcends the limitations of single-building optimization and differs from broad macro-planning by precisely integrating parcel, street, green-space, and open-space morphologies and functions [17]. At this intermediate scale, methodologies principally rely on surveys and interviews as well as direct and video-based observation [18]. Although these methods yield real-time behavioral data, they similarly suffer from a lack of perceptual-level insights and high labor costs, which constrain their applicability at scale [19].
To address this gap, this study adopts a hybrid methodology that integrates qualitative observation with vision-based quantitative techniques. In a meso-scale spatial context, we employ the validated SOPARC (System for Observing Play and Recreation in Communities) and MOHAWk (Method for Observing pHysical Activity and Wellbeing) protocols to collect in situ pedestrian data, complemented by computer vision (CV) algorithms to process behavioral metrics [20]. This combined approach delivers high data validity and real-time monitoring while minimizing operational costs. At the individual perceptual level, we develop an agent-based model (ABM) grounded in empirical observations and visual accessibility analysis to simulate visitor behavior within the spatial environment, embedding visual indicators to quantify each visitor’s actual field of view. Examining meso-scale crowd dynamics through the lens of visual accessibility thus represents an innovative methodological contribution.

1.1. SOPARC, MOHAWk, and Other Observation Tools

Specifically, to examine how different activity types distribute spatially, researchers have traditionally employed social interviews, behavioral observation, and behavior mapping techniques [21]. With advances in digital technology, scholars increasingly utilize methods such as GPS tracking, mobile-network signaling [22], and UAV-based capture [23] to acquire large-scale behavioral datasets.
Among standardized observational instruments, the most widely used tools for documenting population activities are SOPLAY (System for Observing Play and Leisure Activities), SOPARC, and MOHAWk. SOPLAY is designed to observe and assess physical activity and play behaviors within school and community settings (including playgrounds and other recreational areas) [24]. SOPARC employs instantaneous scan sampling and has been validated in environment–activity association studies to record socio-demographic attributes alongside physical activity (PA) levels [18]. The MOHAWk tool extends these dimensions by incorporating social connectivity (“connect”) and environmental mindfulness (“take notice”) into the health and wellbeing category [25], replacing discrete scans with continuous observation and adapting precisely to urban contexts such as residential streets and pocket parks.
For meso-scale spaces, data collection often requires finely grained protocols within a confined area. At this scale, combining SOPARC and MOHAWk tools offers a more holistic perspective, capturing both physical activity patterns and social–environmental interactions [26].

1.2. Visual Accessibility

In the field of visual perception, the “isovist” was proposed by Benedikt as a spatial concept and measure in urban morphology to characterize visibility and its visual properties within the built environment [8]. Isovists are closely linked to user behavior and have been employed to identify visual features in both natural and architectural settings [27]. In this framework, visibility denotes the extent of space that can be perceived visually, often referred to as the isovist. Through isovist analysis, one can determine the angular range encompassed by the human visual field [28]. In recent years, scholars have sought to extend the 2D isovist into 3D. The 3D isovist more comprehensively captures spatial visibility across varying heights and perspectives by accounting for the 3D structure of urban objects, and studies have shown that 3D visibility outperforms 2D measures in effectiveness [29].
The concept of visual accessibility traces its origins to urban design and environmental psychology [30]. It refers to how individuals use visual cues to recognize, interpret, and navigate a given space. Research indicates that high visual accessibility significantly enhances spatial cognition and utilization rates [31]. The continuity and openness of visual fields often determine whether people are willing to enter and engage in social activities within a space [32]. Whereas visual accessibility evaluates a space’s overall visual performance from multiple viewpoints or along paths, the isovist provides the precise geometric data for a single viewpoint’s field of view and thus serves as its fundamental unit of measurement [33]. In this study, we employ 3D isovists to evaluate the spatial–visual accessibility of riverside building facades. Visual accessibility is conceptualized as a cognitive intermediary linking spatial morphology to behavioral outcomes.

1.3. Integrated Visual Perception Approaches to Pedestrian Behavior Research

With the advancement of spatial analysis technologies, an increasing number of studies have integrated visual analysis with crowd behavior research to further explore the intrinsic relationship between human behavior and the built environment [34]. In recent years, the mechanisms by which visibility influences crowd dynamics have been increasingly elucidated. Existing research indicates that visual accessibility serves as a key regulatory factor in cognitive-behavioral models of human–environment interaction [30,35]. Specifically, navigational decisions are shaped by the topological configuration of architectural spaces [36], and both visibility and vertical visual continuity have been shown to directly affect wayfinding behaviors and performance in spatial settings [37]. Isovist-based analysis methods have been widely employed in everyday navigation and exploratory tasks [38]. Studies have demonstrated that various isovist metrics—including isovist area, occlusivity, perimeter, and compactness—are significantly correlated with wayfinding efficiency [39,40]. For example, isovist area is often considered a key predictor of perceived openness and navigational ease [41], while geometric characteristics such as perimeter and compactness are associated with subtle differences in spatial cognition and route selection [42]. Notably, these visual field attributes can even subconsciously influence individuals’ spatial choices in daily life [43], such as the preference for more open or visually accessible paths, thereby reflecting an internalized feedback mechanism related to perceived environmental safety and spatial understanding [37]. Furthermore, the geometric properties of the environment—as captured by isovist representations—have been shown to correspond closely with human mental representations of spatial legibility [39].
On the technical front, eye-tracking and VR techniques have been widely employed to investigate how individuals perceive and make decisions within complex environments [44]. However, these methods are ill-suited to large-scale or highly dynamic settings, as the high complexity of routes and the diversity of fixation targets dramatically increase the workload of eye-movement data analysis, rendering unified processing impractical [15]. For meso-scale spatial scenarios, agent-based modeling grounded in the Social Force Model is considered an effective approach; by simulating the interactions between individual agents and their environment, it can faithfully reproduce crowd movement patterns under varying conditions [45]. MassMotion, a mature ABM platform, has been extensively validated for its reliability in pedestrian simulations [46]. In these simulations, visual parameters (e.g., cone of vision, viewing distance) are assigned to each agent, enabling analysis of how visual accessibility influences crowd dynamics and space utilization. This method builds on the concept of “the set of visible elements from an agent’s current position” (as with isovists) and leverages 3D crowd simulation outputs in MassMotion—specifically agent location and orientation—to automatically and accurately identify visual attention points within the environment [47].

2. Research Aim and Questions

This study aims to systematically encode visitor behavioral patterns in meso-scale waterfront public spaces using the SOPARC and MOHAWk observation tools, thereby addressing the lack of international evidence on crowd behavior in such spaces within the Chinese context. Based on this objective, this study first proposes a testable hypothesis: visual accessibility constitutes the primary causal driver of pedestrian behavior independent of other influencing factors, such as unmeasured social variables. To examine this hypothesis, we analyze empirically observed behavioral data as the evidential basis and establish statistical association models linking visitor behavioral characteristics with visual accessibility metrics, thereby elucidating how visual perception shapes behavioral decision-making. The findings will contribute evidence-based design strategies for enhancing the vitality of waterfront spaces and advance an integrated computational framework—combining visualized behavioral simulation with spatial parameter optimization—to support data-driven decision-making by architects and urban planners.
Accordingly, the research addresses the following three core questions:
  • What are the behavioral patterns of visitors in meso-scale waterfront public spaces, as exemplified by the Xiaoqinhuai Historic District?
  • How can the 3D isovist of linear riverside building facades and the actual visible range from a pedestrian’s perspective be accurately assessed?
  • To what extent does the visual accessibility of riverside buildings determine visitor behavior in public waterfront spaces, after controlling for socio-demographic and contextual confounders?

3. Research Design and Methods

3.1. Research Design

To address our research questions and achieve our objectives, this study proposes an experimental framework for modeling and analyzing crowd behavior in waterfront public spaces. Drone videography was used to capture the spatiotemporal distribution of site visitors, while camera-based fixed-point videography collected instantaneous activity data at key locations. These data were processed using the SOPARC and MOHAWk scales in conjunction with object detection and multi-object tracking algorithms to characterize visitor behavior. The resulting insights informed the construction of an ABM of crowd behavior into which visual metrics were integrated. Simulated measures of riverside facade visual exposure and 3D isovist of building fronts—derived from empirical observations—were combined, and regression analyses of two indicators (visual exposure time and isovist field parameters) were conducted to evaluate the impact of visual accessibility on waterfront crowd behavior. A comparative analysis of the east and west riverbanks was also performed to assess how building renewal influences visitor patterns. As illustrated in Figure 1, this study’s workflow comprises four main phases: baseline data collection, data processing, modeling with integrated visual analysis, and results interpretation.

3.2. Study Area

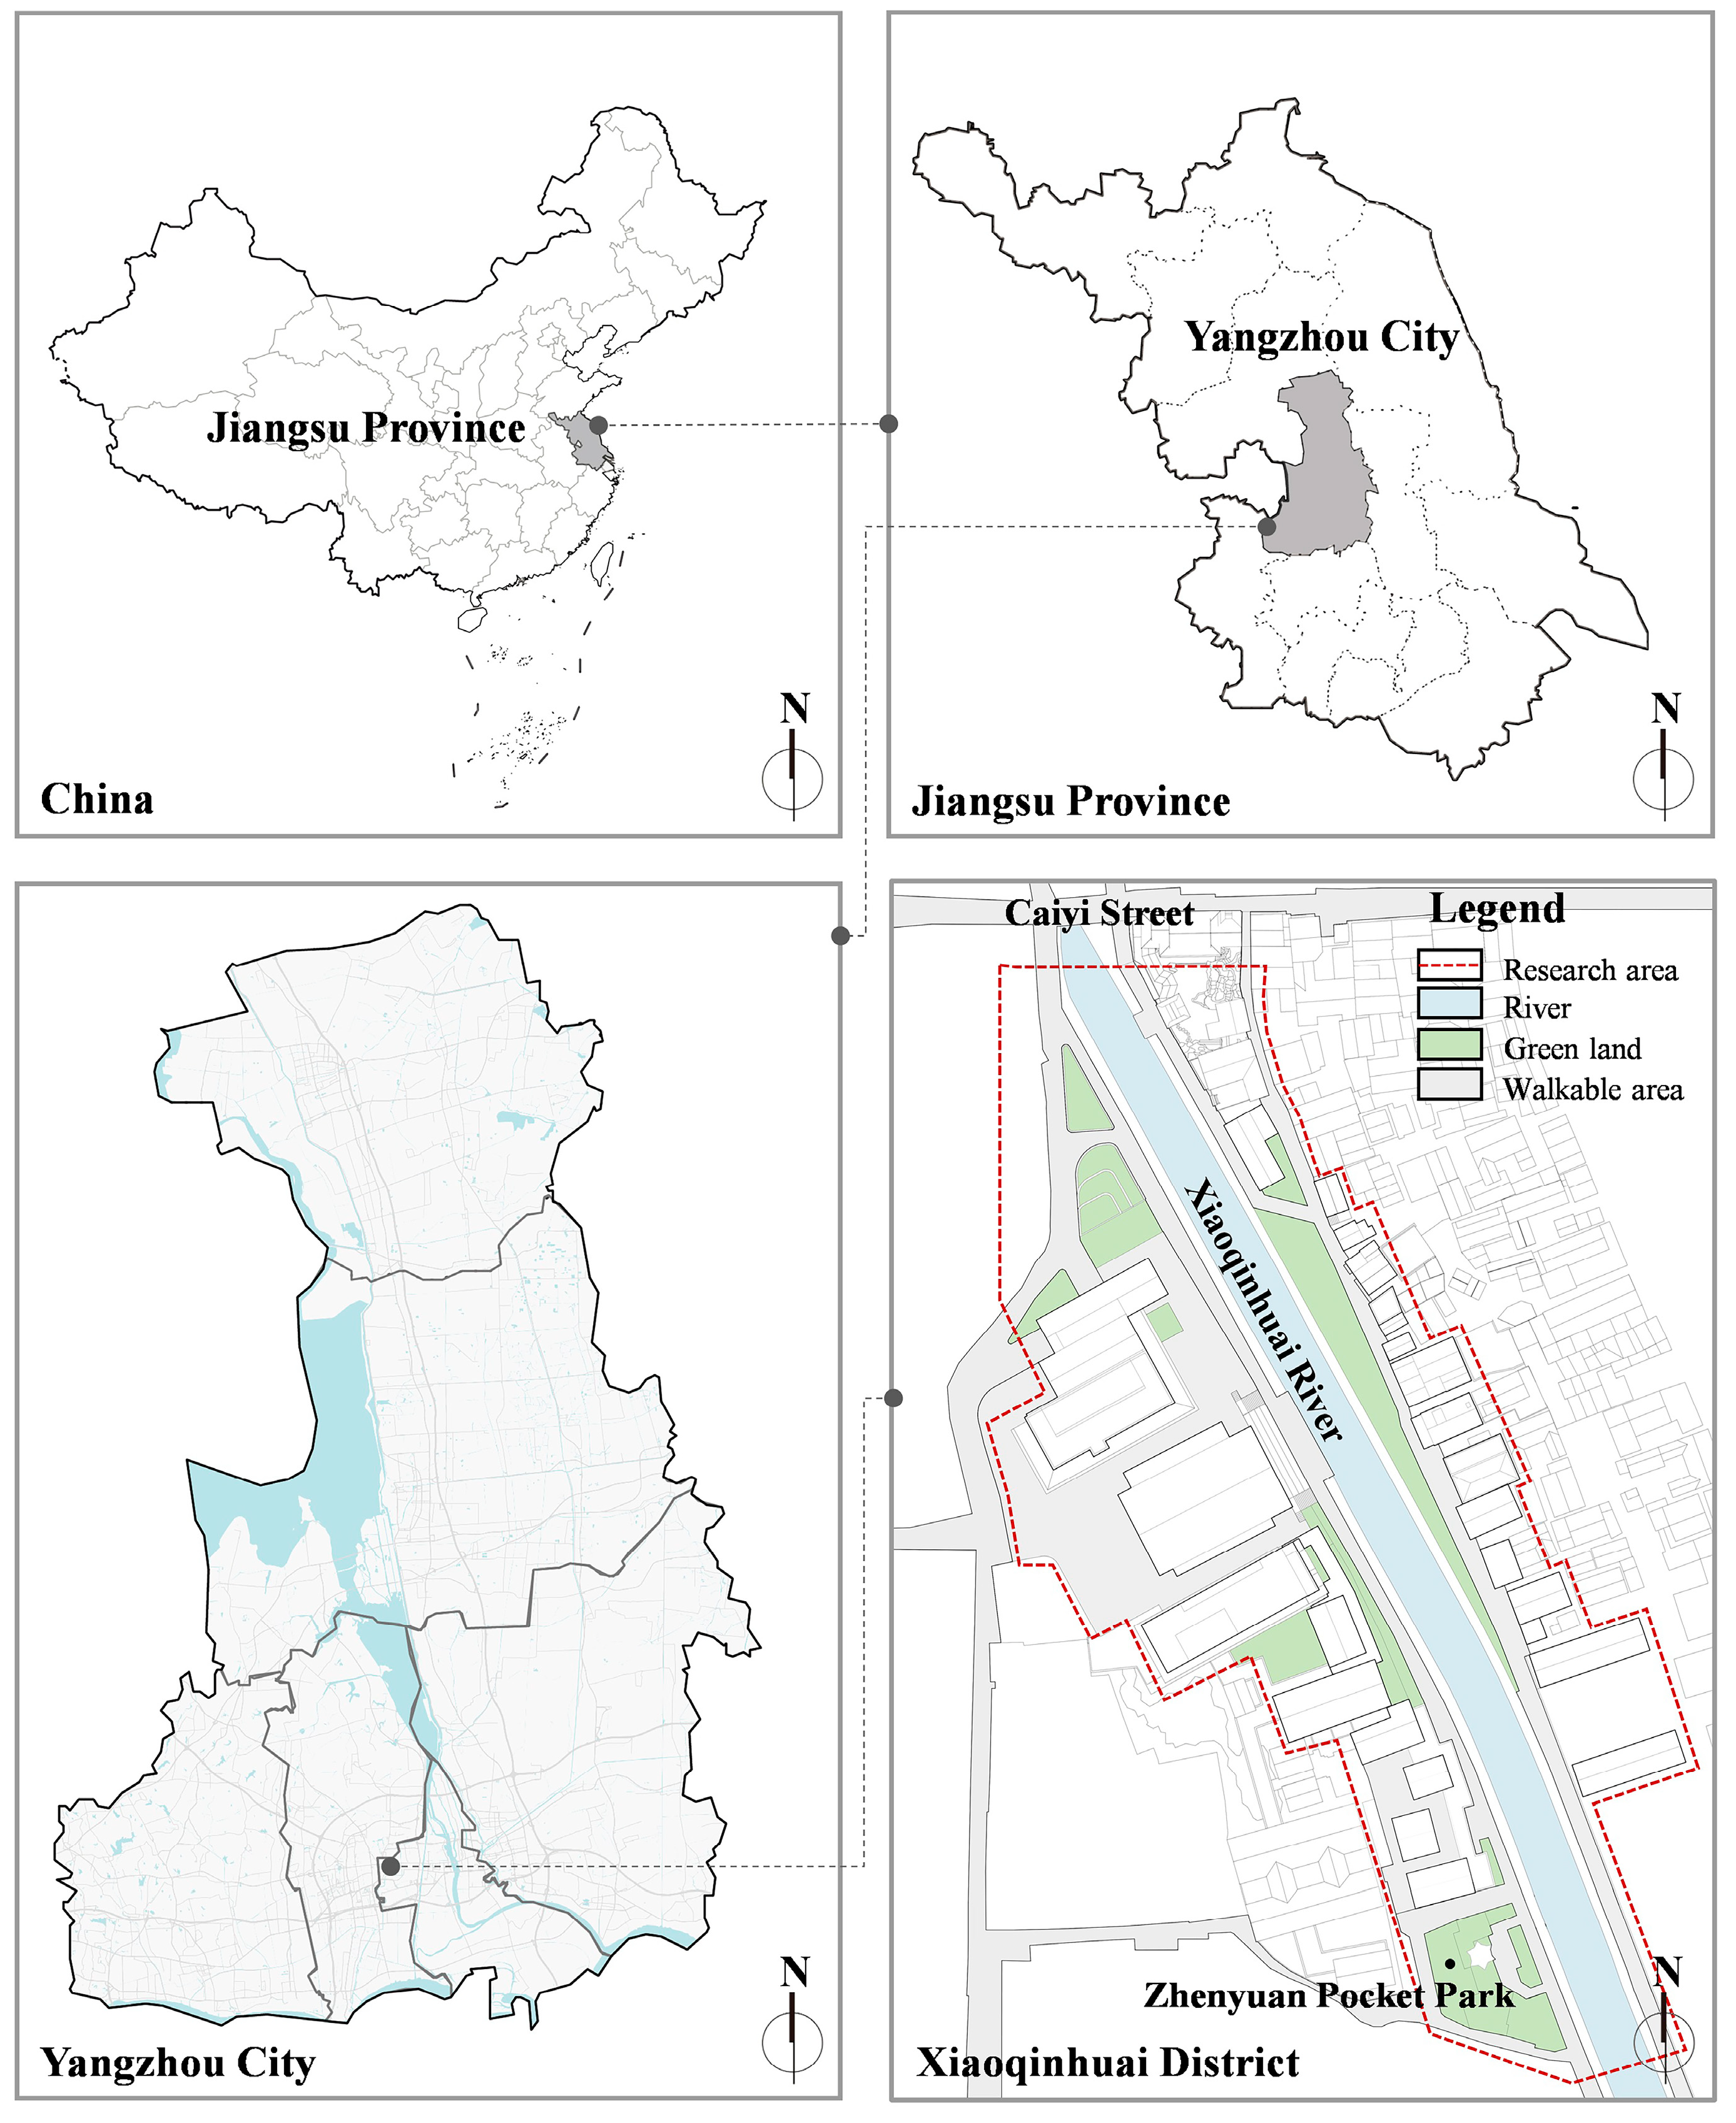
Yangzhou is one of the first cities designated as a National Historical and Cultural City by the State Council of China, as well as one of the earliest recipients of the titles “Excellent Tourism City of China” and “National Model City for Tourism Standardization.” The Xiaoqinhuai River Historic District is located in the central historic area of Yangzhou. The Xiaoqinhuai River, approximately 1.98 km in length, is the only remaining inner-city waterway in the old town of Yangzhou. The original river width was around 25 m, while the current width is approximately 12 m. In 2023, the Xiaoqinhuai River Preservation and Renewal Project was included in the first batch of urban renewal pilot projects in Jiangsu Province, with the northern section designated as a tourism corridor by the planning team.
This study focuses on the northern section of the Xiaoqinhuai River, specifically a 250 m long riverfront segment stretching from “Zhenyuan Pocket Park” in the south to “Caiyi Street” in the north (Figure 2). The analysis encompasses both the riverside walkway and adjacent accessible public spaces, with visitor behavior patterns recorded and quantitatively evaluated across all walkable waterfront areas.
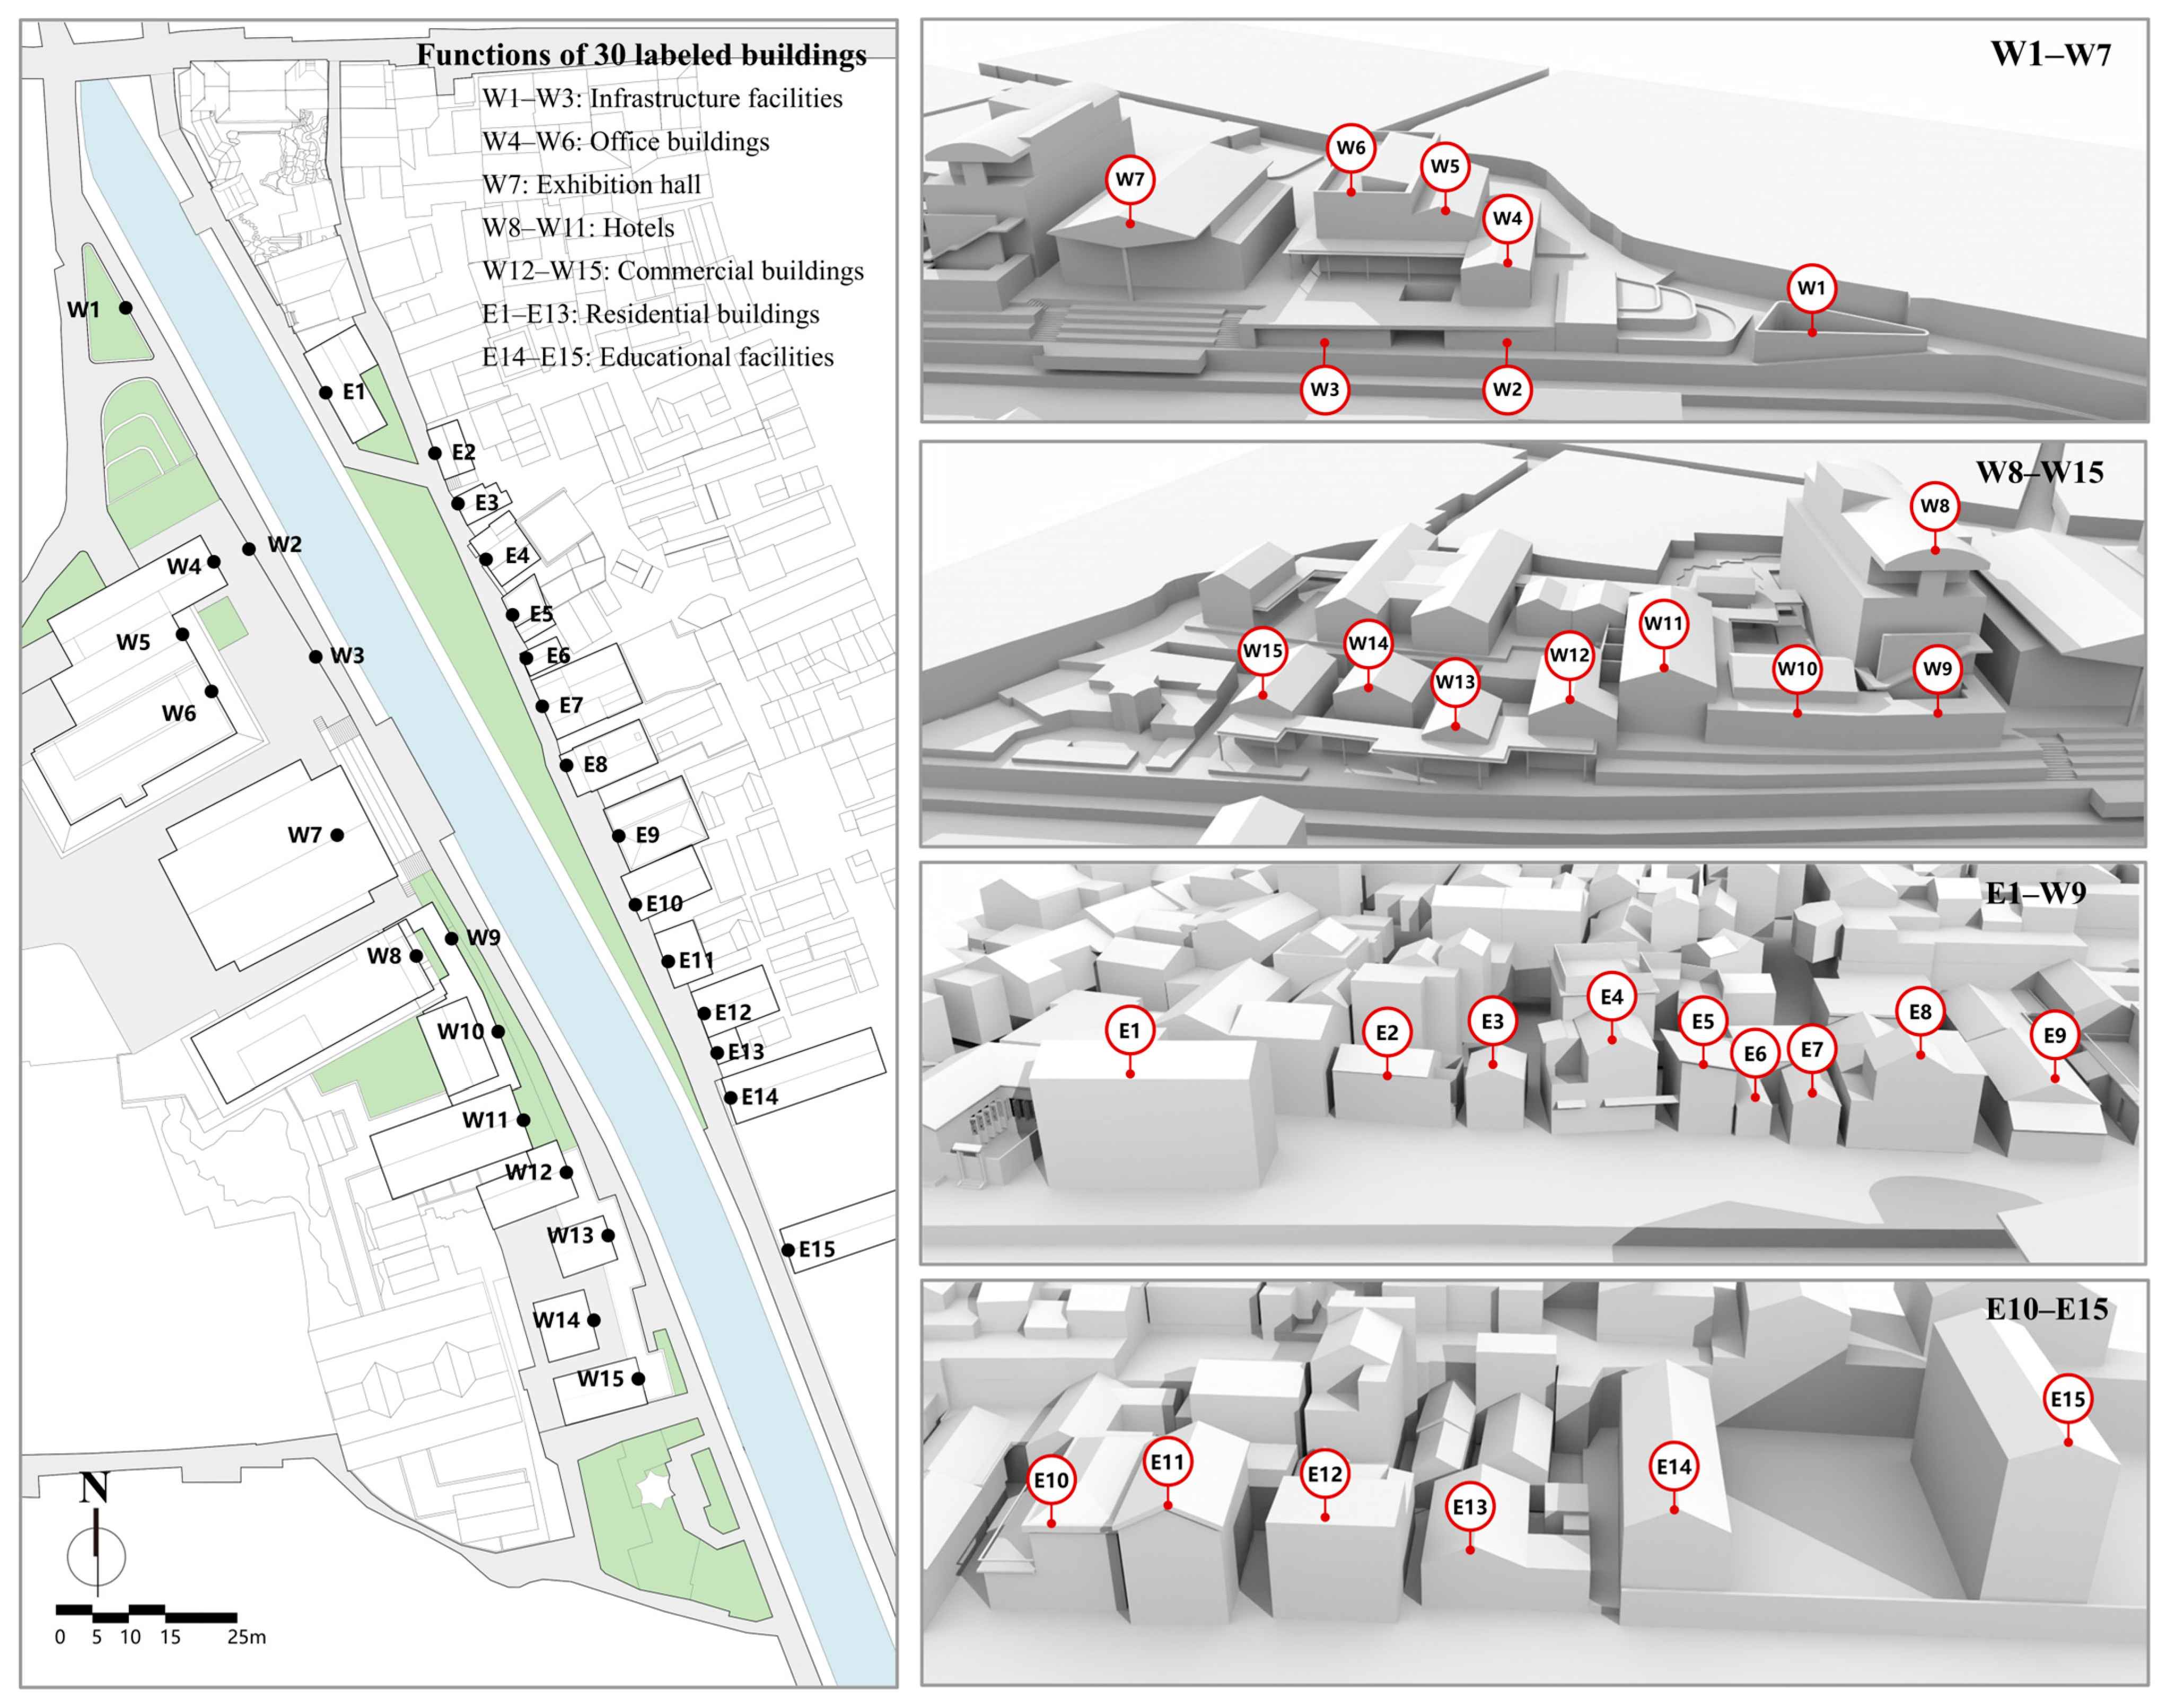
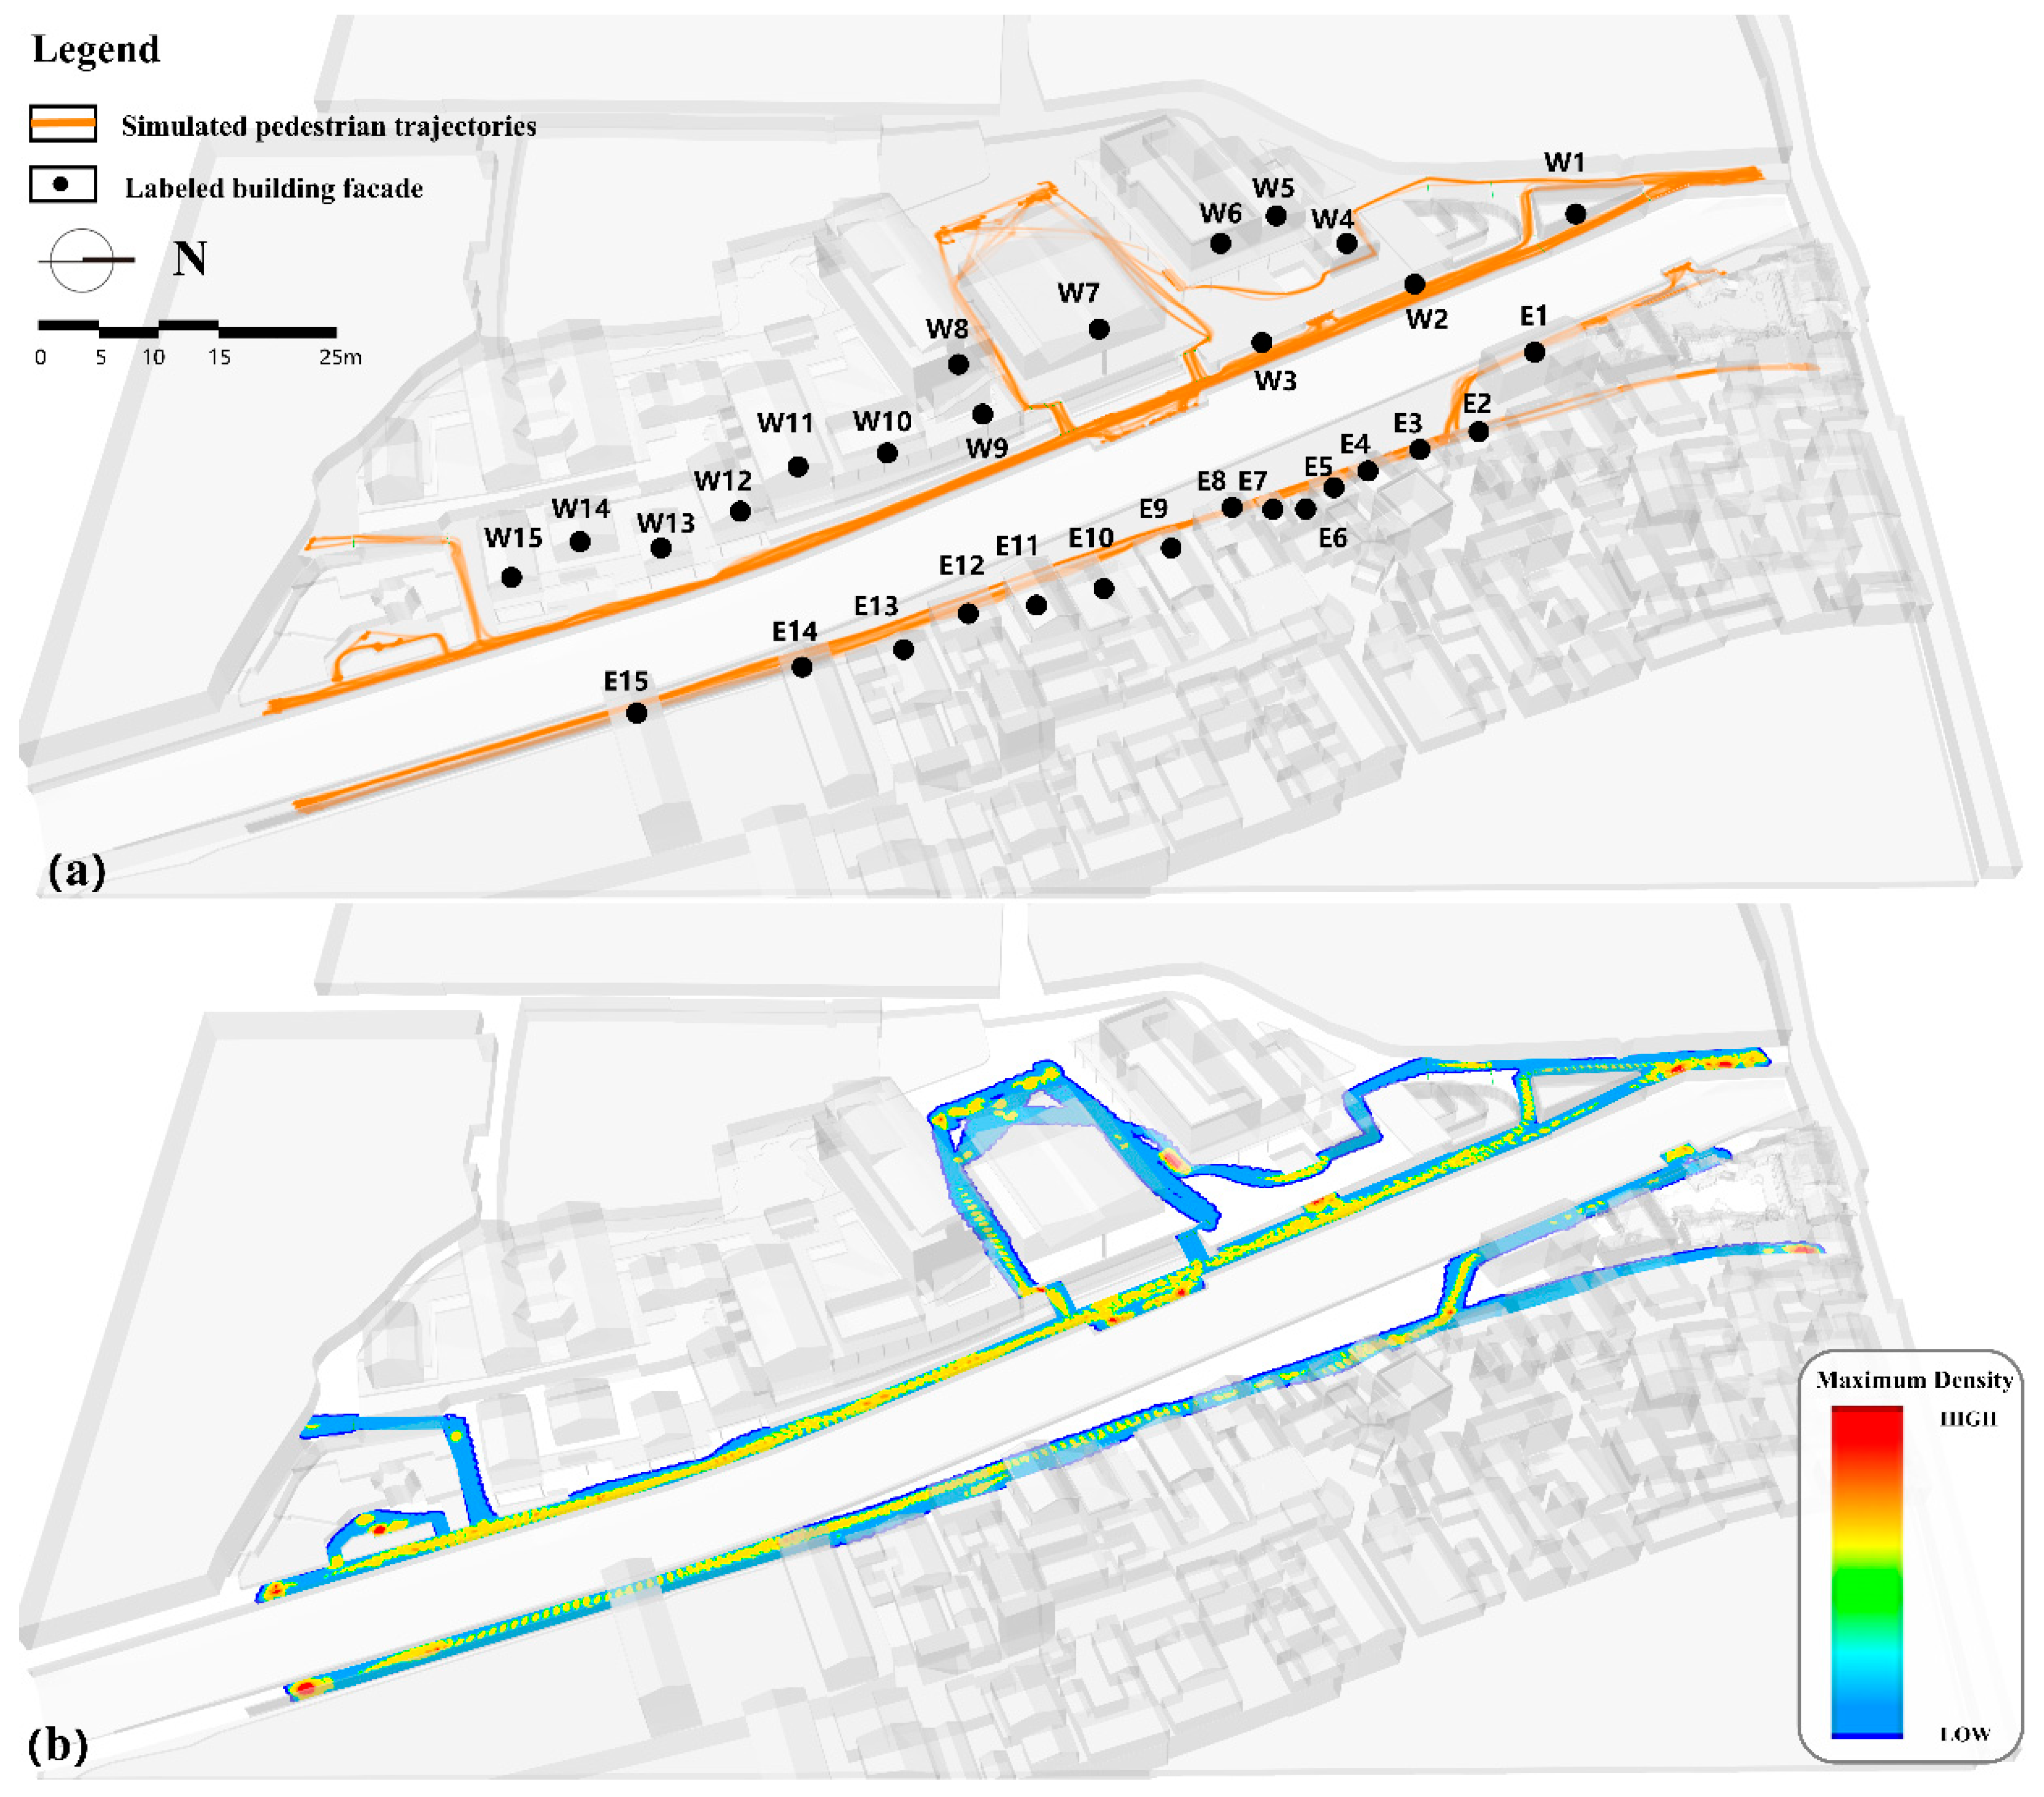
The selected waterfront site is divided by the Xiaoqinhuai River into east and west banks. We identified 30 representative primary buildings within the site and assigned labels, as illustrated in Figure 3: buildings on the east bank are denoted E1–E15, and those on the west bank W1–W15, yielding a total of 30 building volumes for quantitative analysis. The functional attributes of these buildings are also indicated in the figure. The west-bank buildings have already undergone renewal and renovation and are gradually being opened to the public. Characterized by larger scales, their functions are predominantly commercial; notably, W7 serves as the landmark building of the site and will subsequently be repurposed as an exhibition hall. In contrast, the east-bank buildings remain in the planning and design phase, retaining their pre-renewal condition. These buildings are relatively small in scale, are arranged in dense clusters, and primarily function as residential dwellings. By conducting a comparative analysis of visitor behaviors across the east and west banks—representing unrenewed and renewed waterfront public spaces, respectively—this study develops a new data-driven approach that provides evidence-based support for future urban planning and design decisions.

3.3. Data Collection

3.3.1. Site Space Data

Spatial information is primarily derived from the existing CAD drawings of the area, which are supplemented and refined using aerial imagery and on-site field surveys. By distinguishing between hard surfaces (e.g., paved areas) and soft surfaces (e.g., lawns and vegetated areas) within the CAD files, the overall spatial configuration of the site is clarified, including the functions and forms of nodal public spaces, the layout and number of pathways, and the locations of entrances and exits.

3.3.2. Spatiotemporal Crowd Distribution Data

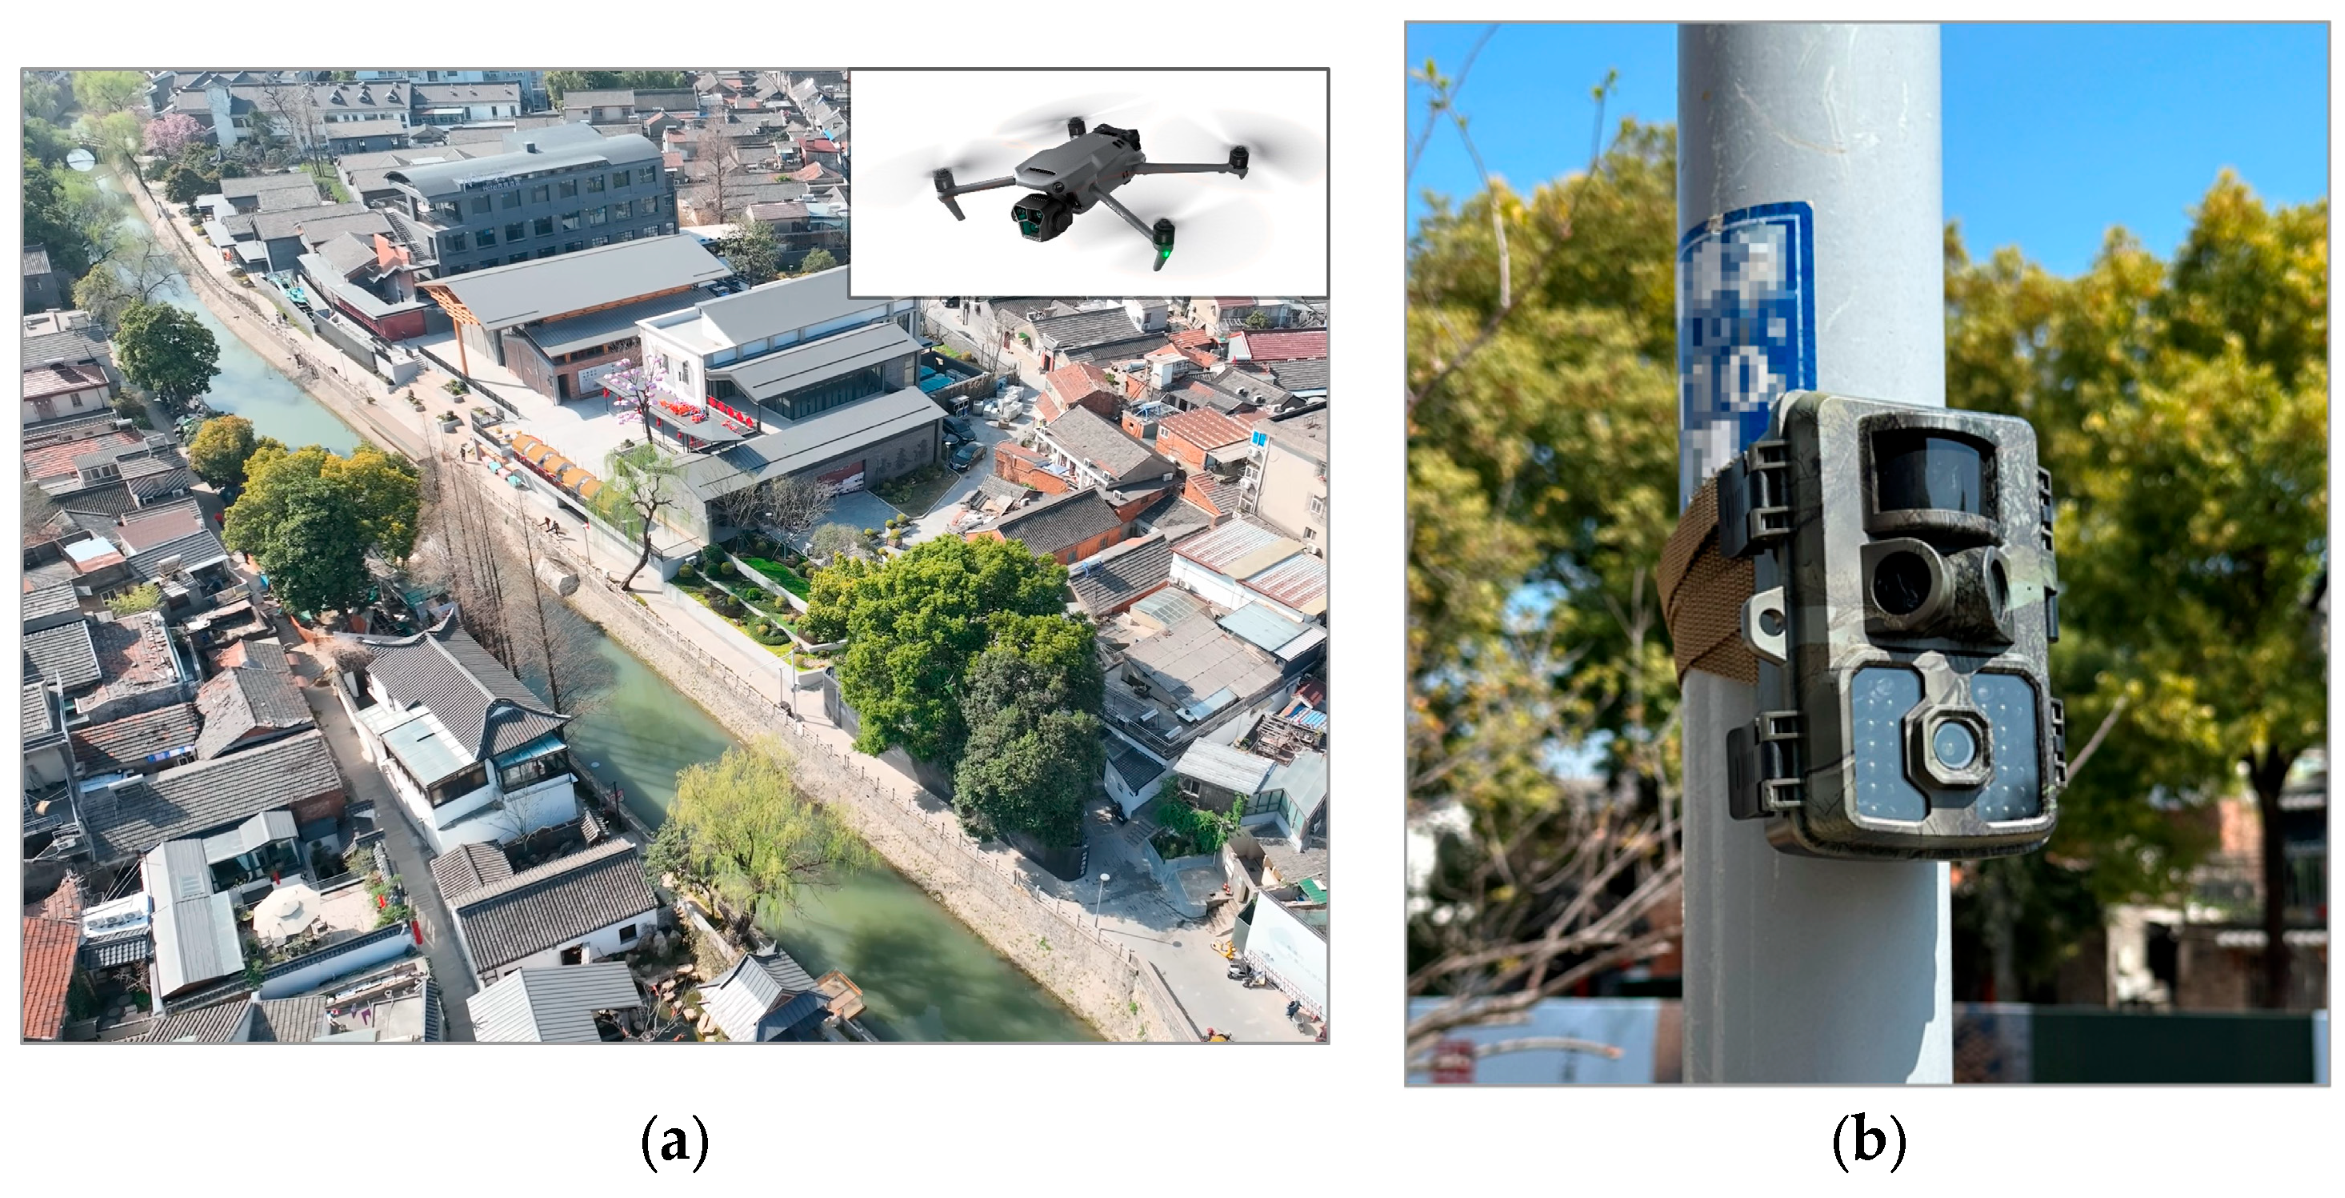
For spatiotemporal crowd distribution data, we employed a DJI Mavic 3 Pro drone [48] —manufactured by SZ DJI Technology Co., Ltd., headquartered in Shenzhen, Guangdong, China—to capture comprehensive, multitemporal video recordings of the study site under suitable weather conditions (Figure 4a). The objective was to collect data on at least three weekdays and three weekends, with all recordings conducted on non-rainy days to examine patterns and variations in all-day crowd activities within the site. The final dataset consists of six days of video footage (three weekdays and three weekend days), recorded at six fixed time intervals, each starting at 7:30 a.m., 9:30 a.m., 11:30 a.m., 2:00 p.m., 4:00 p.m., and 6:30 p.m. [49]. Each observation moment was recorded for 15 min, resulting in a total of 36 video segments.

3.3.3. Instantaneous Crowd Activity

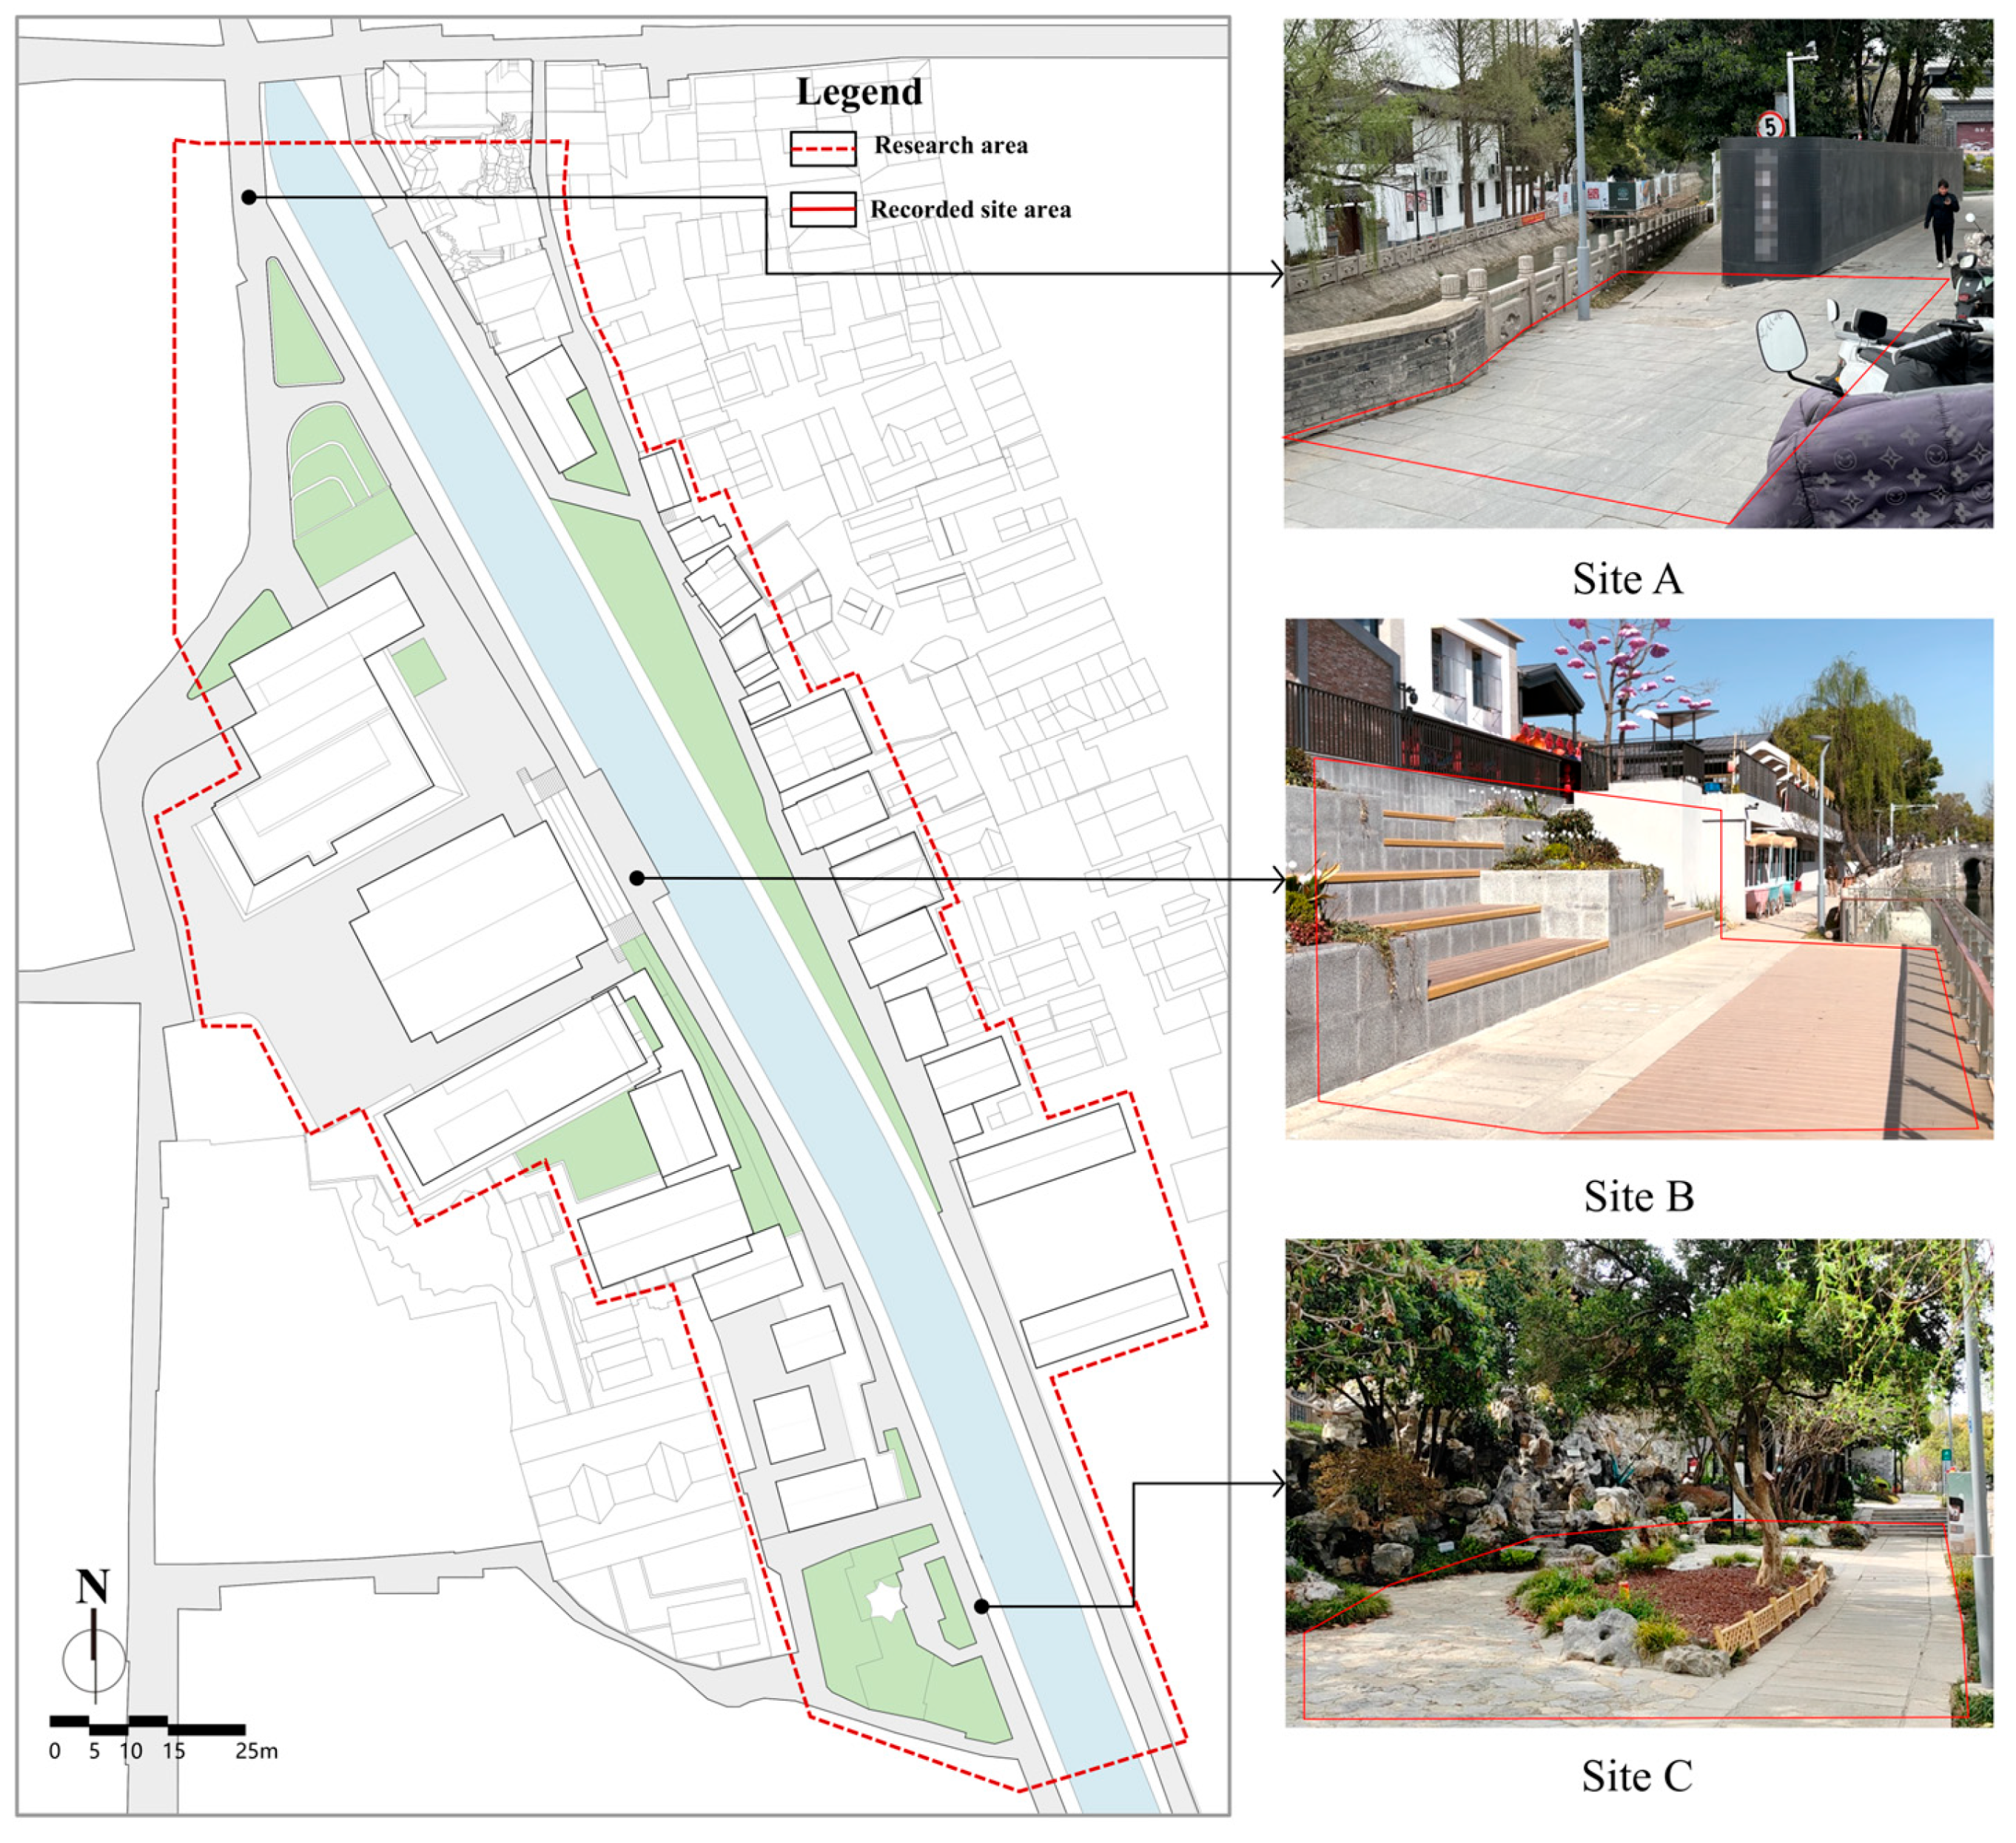
Drone videography was used to capture the spatiotemporal distribution of crowds; however, drone-based methods alone are not sufficiently precise for identifying fine-grained activities at key nodes. Considering the site’s linear waterfront configuration with activity-oriented nodes, we selected three key sites along the riverside walkway (Figure 5) to observe crowd behaviors and assess socio-demographic characteristics and physical activity (PA) levels.
The characteristics and facilities of the three sites are as follows:
  • Site A, at the northern bridgehead of the promenade, doubles as an expanded node and the main northern entrance to the river trail. With its sweeping sightlines and high-quality landscaping, it is a favored spot for visitors to pause and take photographs.
  • Site B, located mid-promenade, connects east to a waterfront viewing platform and west to a stepped terrace with ample seating. It also serves as a circulation hub, with two staircases leading to the renovated building complex and public square on the western bank.
  • Site C, at the southern end of the trail, borders a pocket park with lawns, rockeries, and a pavilion. These features draw many visitors who linger to enjoy the greenery and capture photos.
Previous research has shown that fixed video cameras deliver higher observational accuracy, lower costs, and greater deployment flexibility than alternative methods while remaining unobtrusive and avoiding self-conscious behavior biases [50]. To capture fine-grained crowd patterns and frequencies for our agent-based simulations, we supplemented aerial footage with human eye-level recordings.
We deployed “Kashi D3” wireless cameras (Figure 4b), configured for full-color 2K video at 60 fps and a 120° field of view. Each unit recorded continuously at preset intervals—day and night (using infrared after dusk)—independent of motion detection. Recording sessions ran concurrently with drone flights to ensure uniform weather conditions. Over six days, at six time slots per day across three sites, we collected 108 video segments for detailed behavioral analysis.

3.4. Data Processing

3.4.1. Object Detection and Multi-Object Tracking Algorithms

In processing the 36 drone video segments, we employed the YOLOv8 object detection algorithm—well-suited for detecting and tracking moving targets in drone-based applications [51]—along with the DeepSORT multi-object tracking algorithm [52], to extract and record the spatiotemporal distribution patterns of pedestrian activity. All videos were recorded from the same aerial perspective with a consistent background, which contributed to improved stability and efficiency in both detection and tracking processes.
From each video segment, 50 frames were evenly sampled, yielding a drone-based small-object-detection dataset comprising 1800 images. Human figures in these images were manually annotated using LabelImg version 1.8.6, a graphical image annotation tool (released 11 October 2021). Given the relatively small size of the dataset, random multi-scale training was adopted to enhance model accuracy during the training phase [53]. The pedestrian trajectory for each video was obtained as follows.
First, YOLOv8 was used to detect pedestrians in each frame, where each bounding box was described by four parameters: the horizontal coordinate u, the vertical coordinate v of the center point, the area r of the bounding box, and the aspect ratio h.
Second, DeepSORT was used to perform multi-object tracking, enabling the association of the same individual across consecutive frames. Specifically, an 8-dimensional state vector (u, v, r, h, u∗, v∗, r∗, h∗) was used to describe the pedestrian’s motion state at a given time, where u∗, v∗, r∗, and h∗ represent the motion velocities of u, v, r, and h across frames, respectively. The Hungarian algorithm was applied to match bounding boxes between frames [54], and the resulting matched bounding boxes for the same individual were used to reconstruct movement trajectories. Additionally, we recorded the appearance and disappearance times of each unique ID in the video to determine the temporal extent of each pedestrian’s complete trajectory.
This processing pipeline ultimately outputs the following key information: the total number of detected targets (i.e., unique IDs), the spatial trajectory coordinates and corresponding visualized paths for each target, and the time intervals that define the full duration of each trajectory.

3.4.2. Protocol for the Instantaneous Observations

Video observations were coded using two validated methods: SOPARC and MOHAWk. Both are reliable and effective field-based observation tools widely used to assess physical activity and social wellbeing behaviors in public settings.
SOPARC documents socio-demographic characteristics and PA levels. Observers estimate each individual’s age group (children 0–12 years; adolescents 13–20 years; adults 21–59 years; older adults ≥ 60 years) and gender, and they categorize activity into three groups: sedentary/standing, walking, or engaging in vigorous physical activity [18].
MOHAWk focuses on assessing wellbeing behaviors, with particular emphasis on “social interaction” and “take notice (TN)” behaviors. Using MOHAWk coding, we recorded the number of individuals engaging in specific types of social interaction during observation periods: (a) talking to others; (b) engaging in physical contact; (c) interacting through smiling or eye contact; and (d) participating in group activities [25]. Additionally, an individual was considered to be taking notice when they slowed down or paused to consciously observe their surroundings. Typical examples include gazing at scenery for an extended period, stopping to take photographs or inspect an object, or turning the head to visually follow a particular object or landscape feature.
In the context of behavioral studies in waterfront public spaces, MOHAWk coding is particularly valuable for capturing wellbeing-related behaviors among visitors. Given the high frequency and diversity of recreational behaviors in such spaces, accurately recording behavioral patterns at key nodes supports more precise and realistic ABM of crowd dynamics.

3.5. Modeling Integrated with Visual Analysis

3.5.1. ABM Driven by the Coupling of Data-Driven and Rule-Based Approaches

To advance the agent-based model of pedestrian behavior, we first calibrated behavioral parameters using multi-source observational data. Drone footage was employed to estimate visitor numbers, reconstruct trajectories with timestamps, and, combined with site geometry, derive walking speeds. Complementary fixed-position cameras at key nodes provided further behavioral evidence, including node-specific walking speeds, the probabilities of engaging in wellbeing-related behaviors, and the duration of such activities. For a 15 min simulation window, we determined the total number of active individuals on site and distributed agents across reconstructed paths based on drone-derived trajectories. Each agent was then assigned attributes—such as walking speed and probabilistic engagement in node-based wellbeing behaviors—according to the observed patterns. Under these settings, agent activities were formalized as state-transition sequences, enabling a more faithful representation of crowd dynamics within the site.
Although these ABM parameters are grounded in empirical observations, MassMotion’s pedestrian simulation is not purely data-driven but also incorporates rule-based elements. In MassMotion, a modified Social Forces model nonlinearly couples three component forces—(a) the driving force toward a desired velocity, (b) repulsive forces maintaining distance from geometric boundaries and other agents, and (c) attractive forces driving agents toward targets—into a system of Langevin equations to predict and control agent trajectories. During simulation, whenever environmental changes occur (e.g., obstacles or congestion), agents continuously evaluate the utility of alternative routes or movement strategies, perceive stimuli in real time, and select the optimal response to, for example, minimize time to an exit, dynamically adjusting the weight of each force to honor both physical constraints and individual decision logic [55].

3.5.2. Three-Dimensional Vision Field Assessment

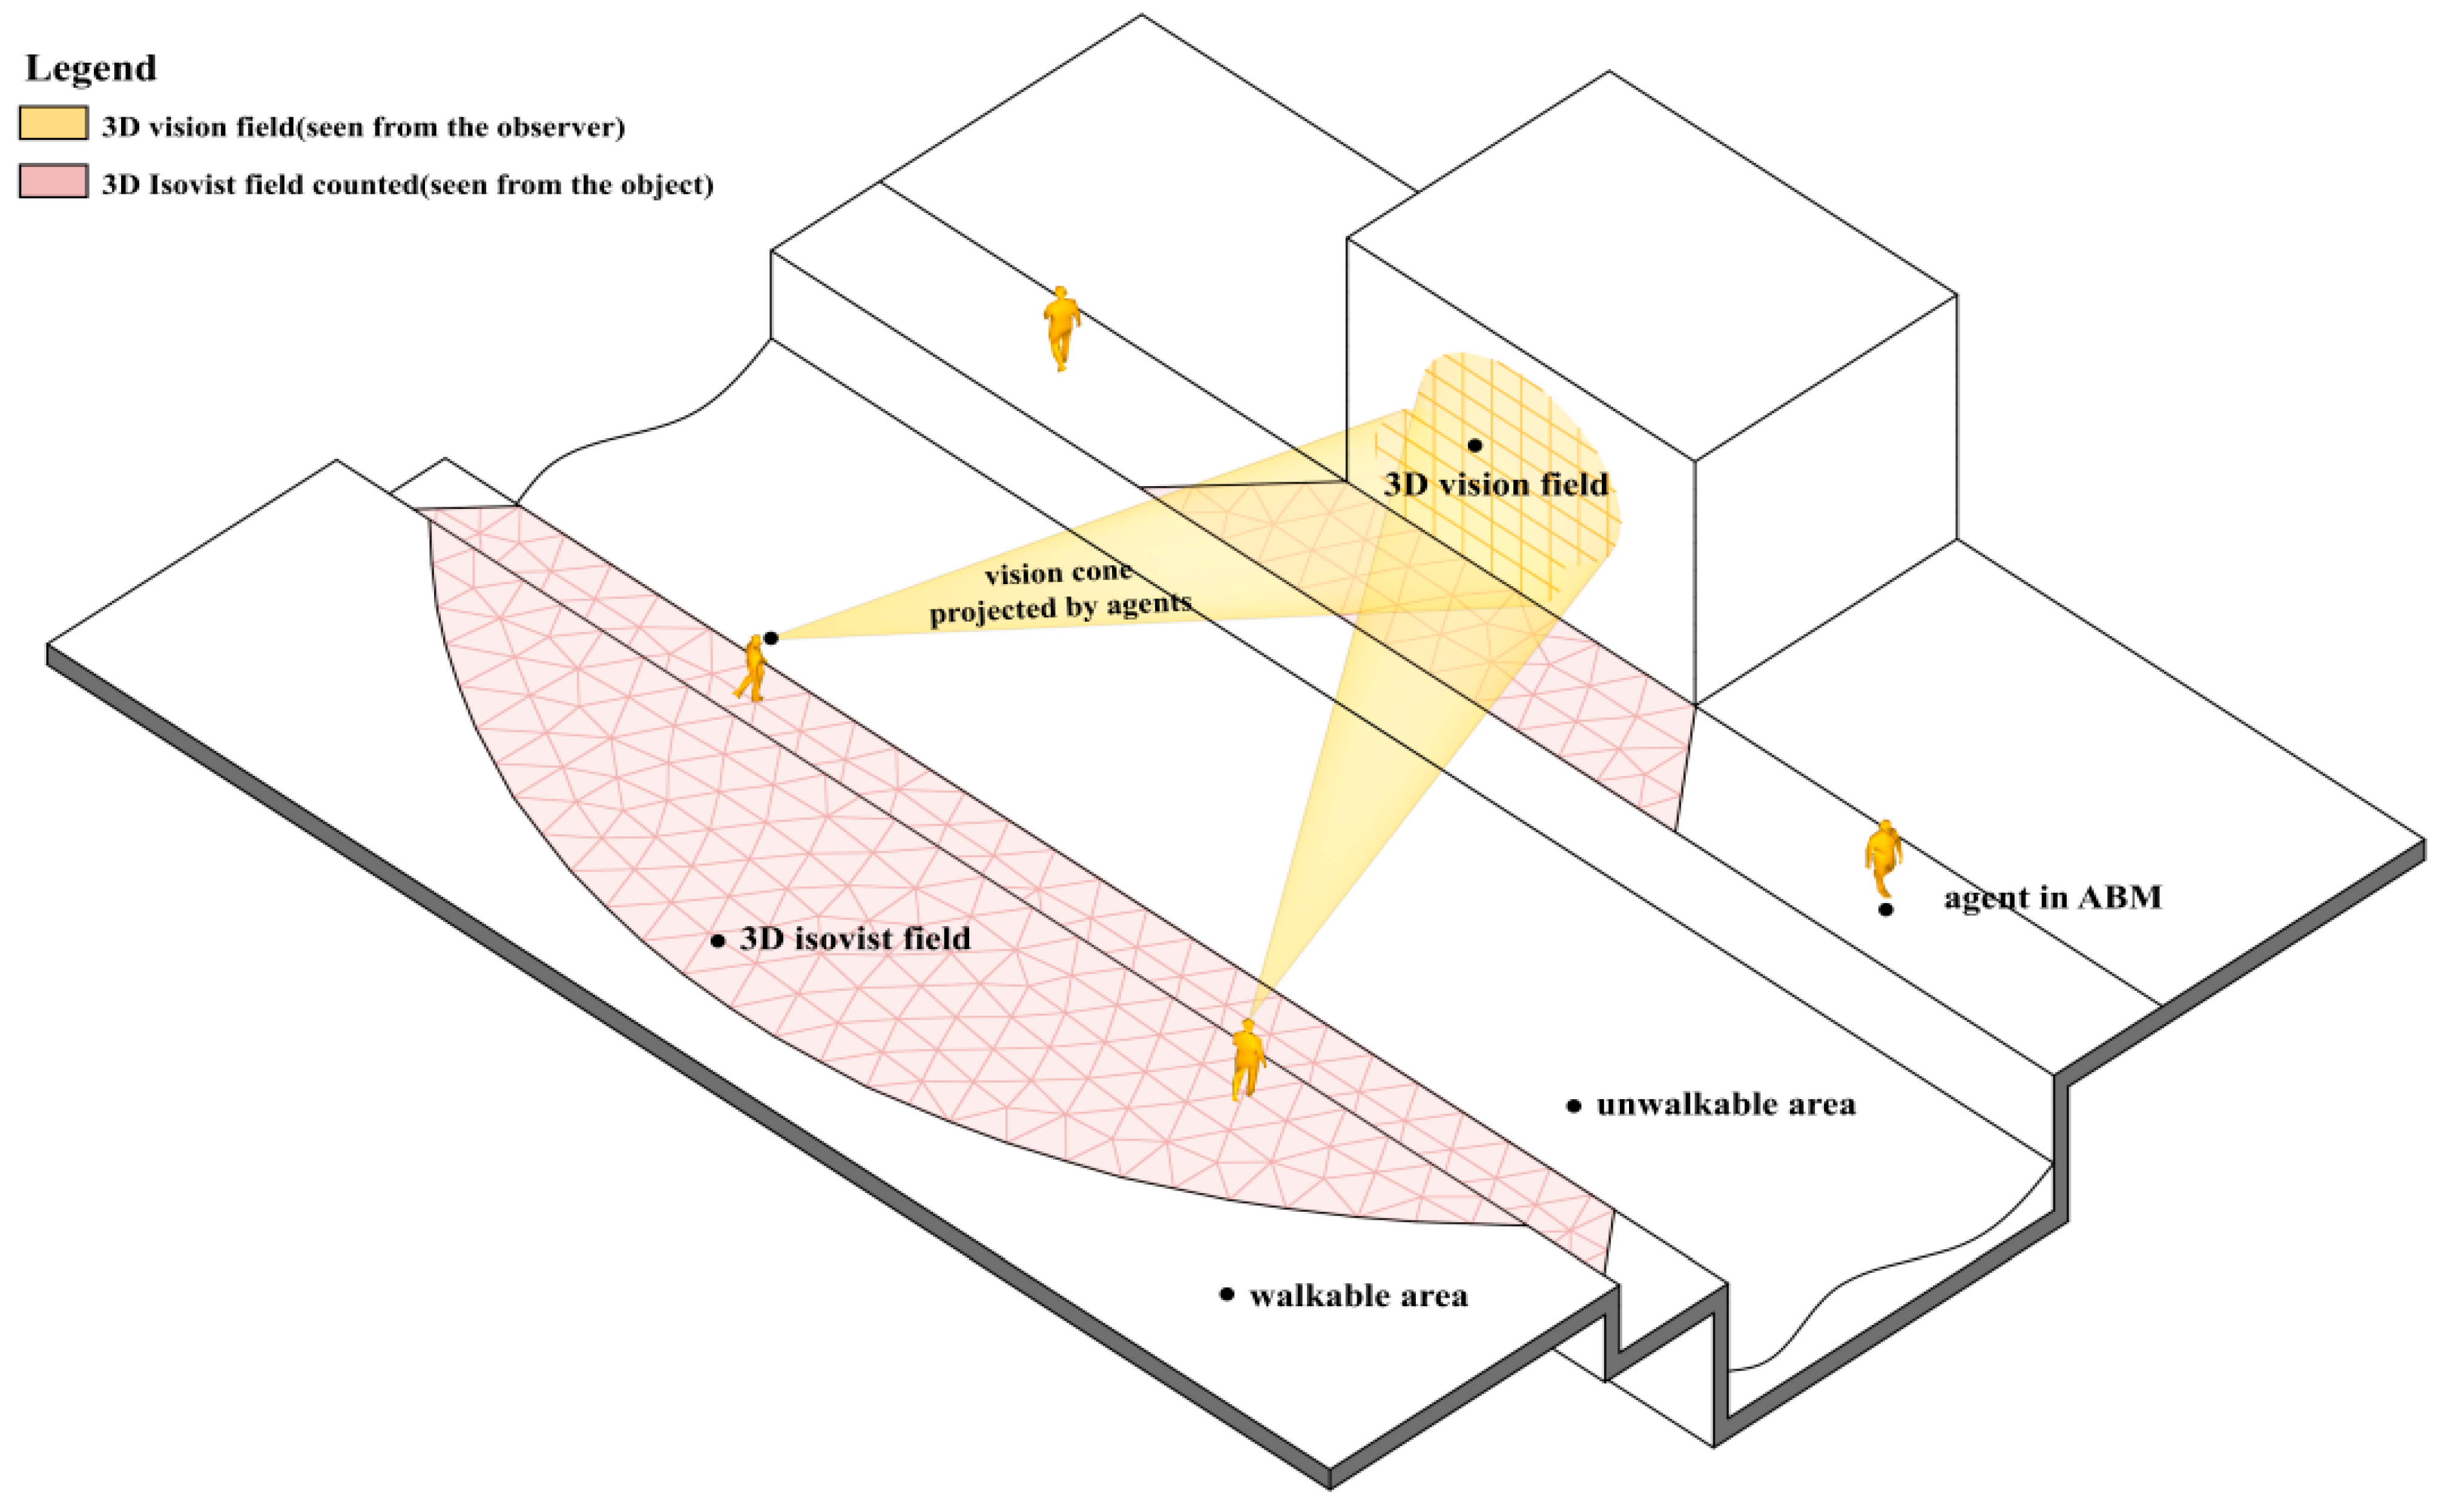
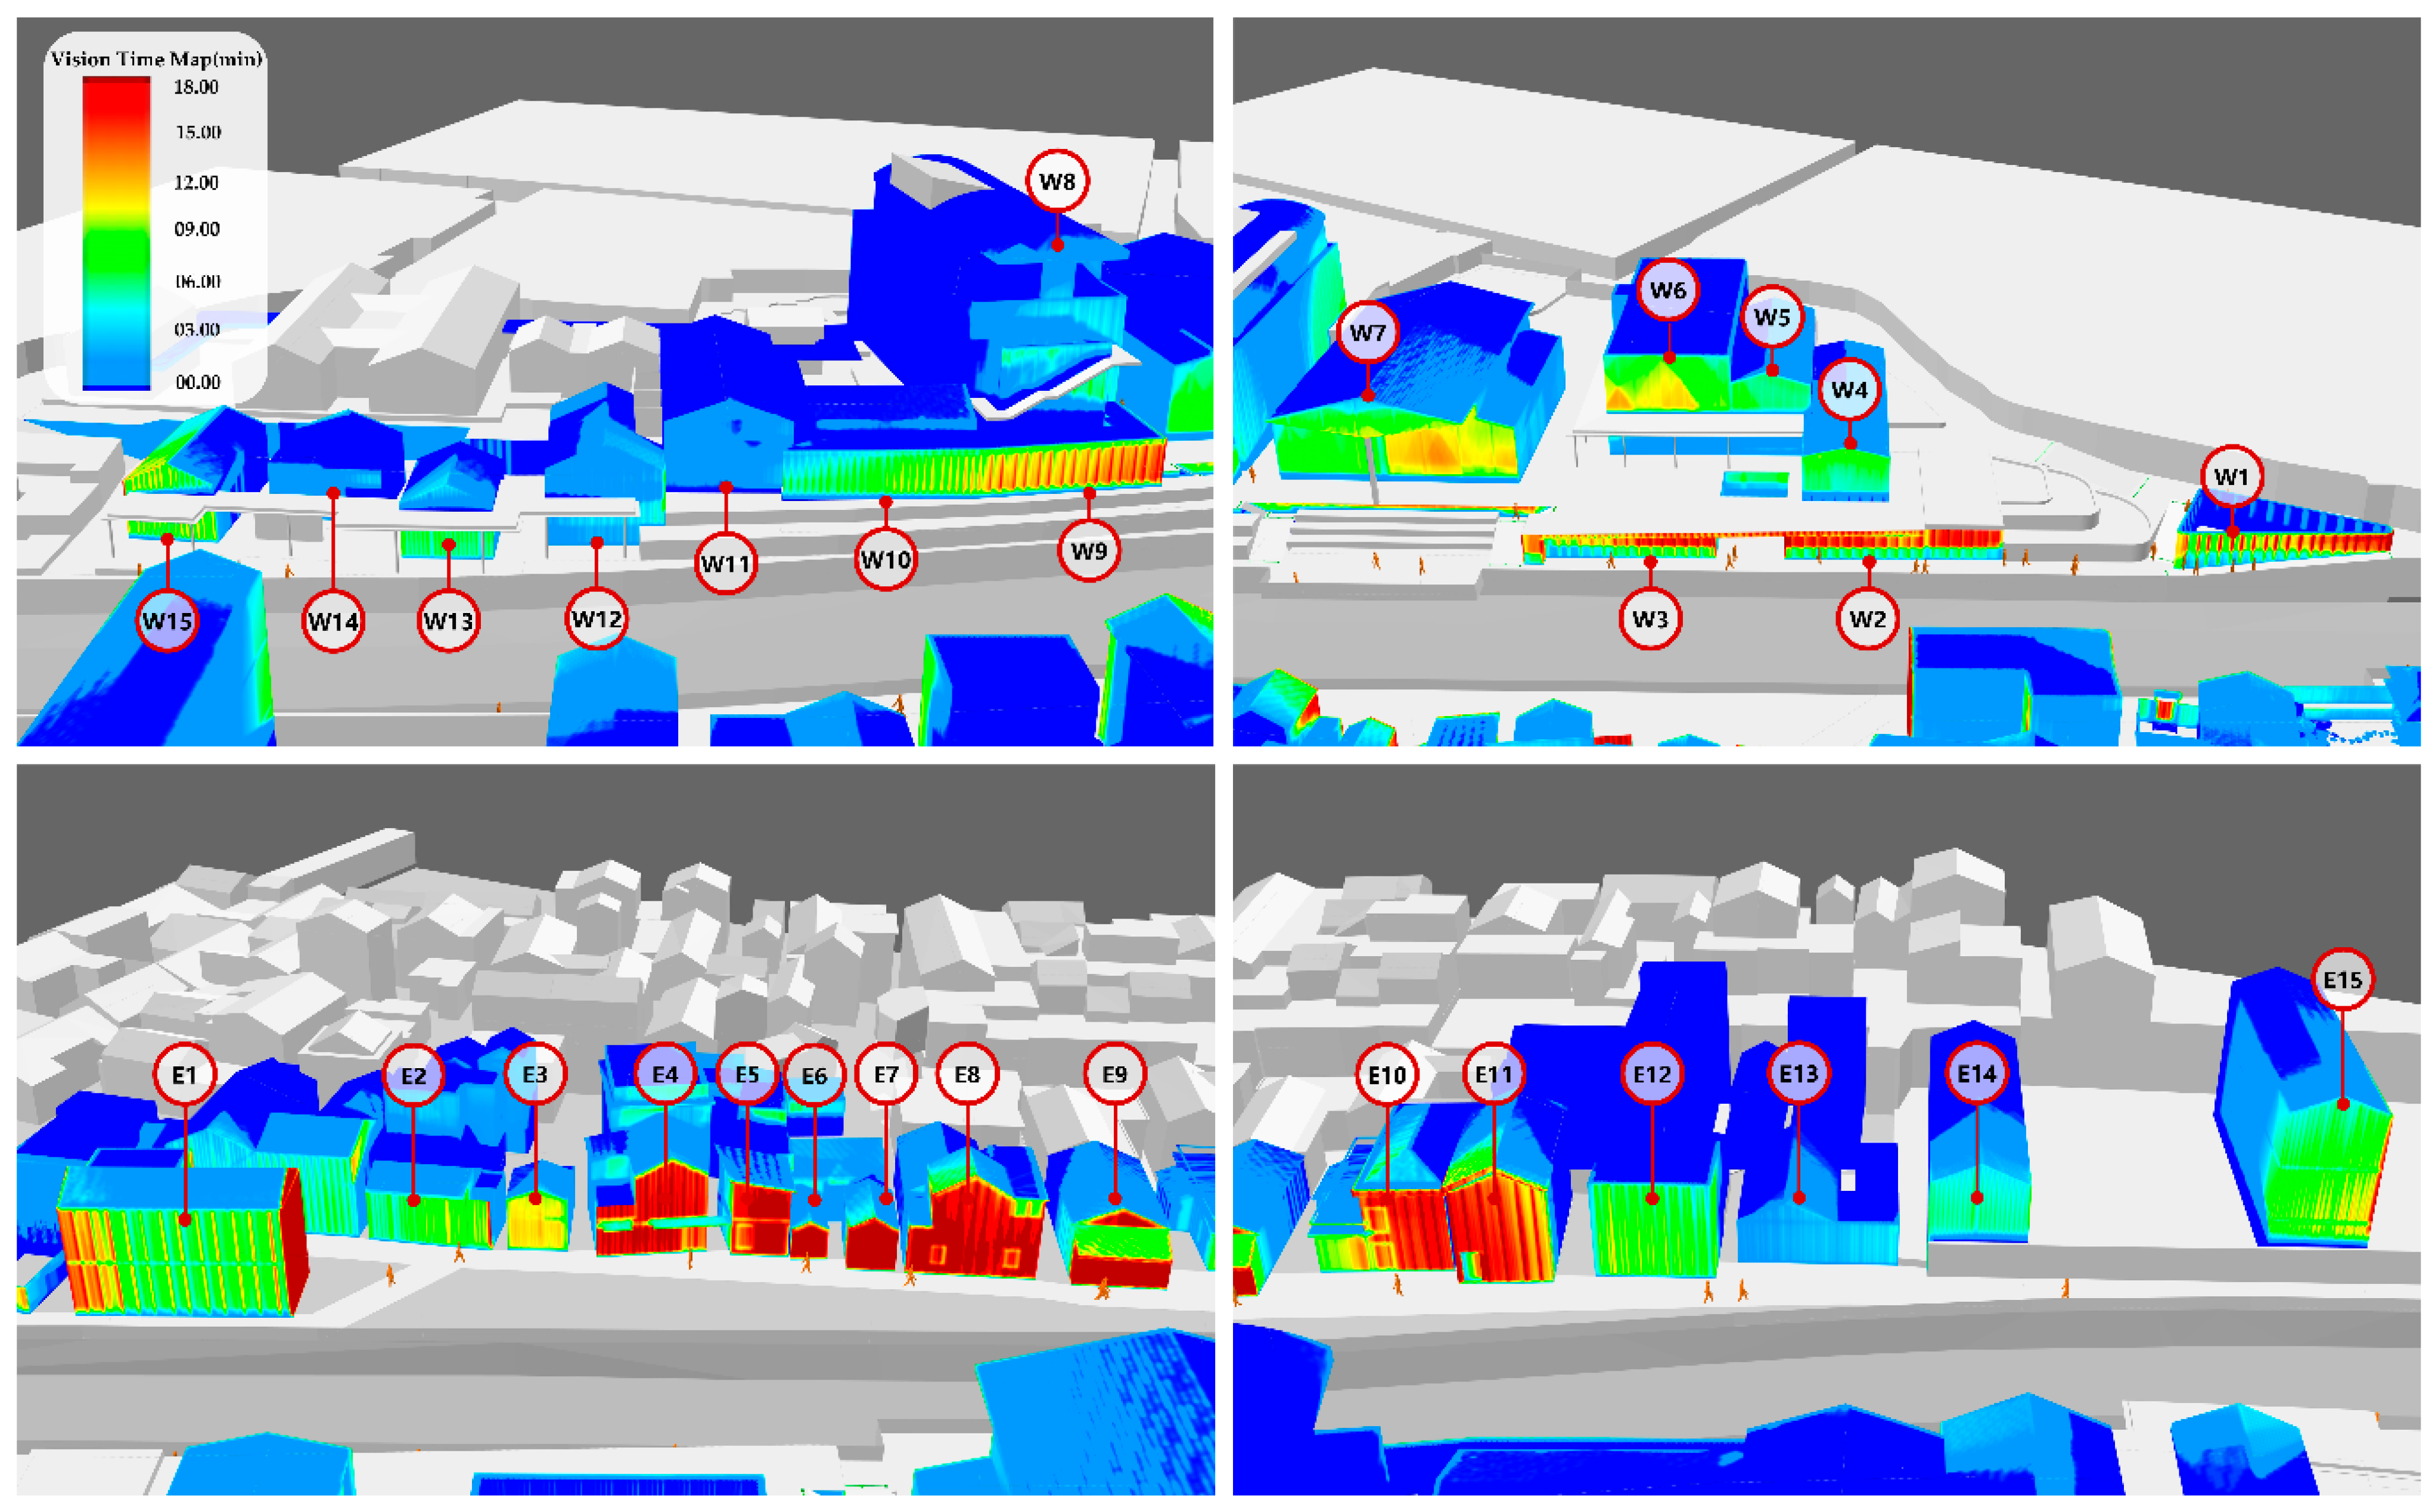
We calculated “Visual Exposure Time (VET)” within the ABM environment. In MassMotion, by definition, vision maps can be used to qualitatively assess the locations that agents attend to during a simulation. The underlying mechanism of vision maps involves assigning each agent a forward-projected cone of vision that moves along with the agent [56]. The parameters of the vision cone can be adjusted as needed. Elements within the environment model, such as floors and walls, are converted into “voxels,” and the voxels within the agent’s vision cone are marked as visible. Visual perception theory defines the horizontal field of view (FOV) as ±30° around the central axis, yielding a 60° central visual field. Distractions can narrow this range by 7% [57], but given the frequent social interactions observed, we adopt a pedestrian vision cone of 55.8° to capture the central attentional region [58]. While attention to small-scale elements (e.g., billboards, wayfinding signs) generally extends to 30 m [59], our medium-scale, open-space context warrants a 45 m visual distance—below the empirically established “effective perception and engagement” maximum of 60 m [60]—within which pedestrians reliably perceive waterfront building facades. Only those objects that intersect with the vision cone will be marked as “seen”. Based on the above rules, a 3D vision field is generated on the surface of the objects (Figure 6—yellow cone-shaped area on the building facade). The Visual Time Map displays the cumulative time that agents spend observing a given object. Specifically, according to MassMotion’s definition of this map, it should be noted that the value displayed at a point represents the sum of all agent records collected for that point. Based on this principle, if two agents each observe a point for 4 s and a third agent observes the same point for 8 s, the value displayed at that point would be 8 [56]. In this study, the “Visual Time Map” is employed to reflect the degree of visual exposure of waterfront building facades. A grid is superimposed on the surface of each building object to quantify and calculate visual exposure based on accumulated viewing time.

3.5.3. Visual Accessibility of Building Facades

The effectiveness of combining pedestrian trajectory with visual attention assessment has been validated in small-scale urban squares [16]. However, the selected meso-scale riverside site in this study presents significant elevation differences between the two banks, rendering conventional 2D methods inadequate for accurately capturing visual characteristics in such topographically complex environments. In waterfront spaces, the position, size, and shape of building facades all influence their visual accessibility. Therefore, it is necessary to develop a tool capable of capturing the 3D visual accessibility of waterfront building facades in order to quantitatively evaluate their 3D isovist properties.
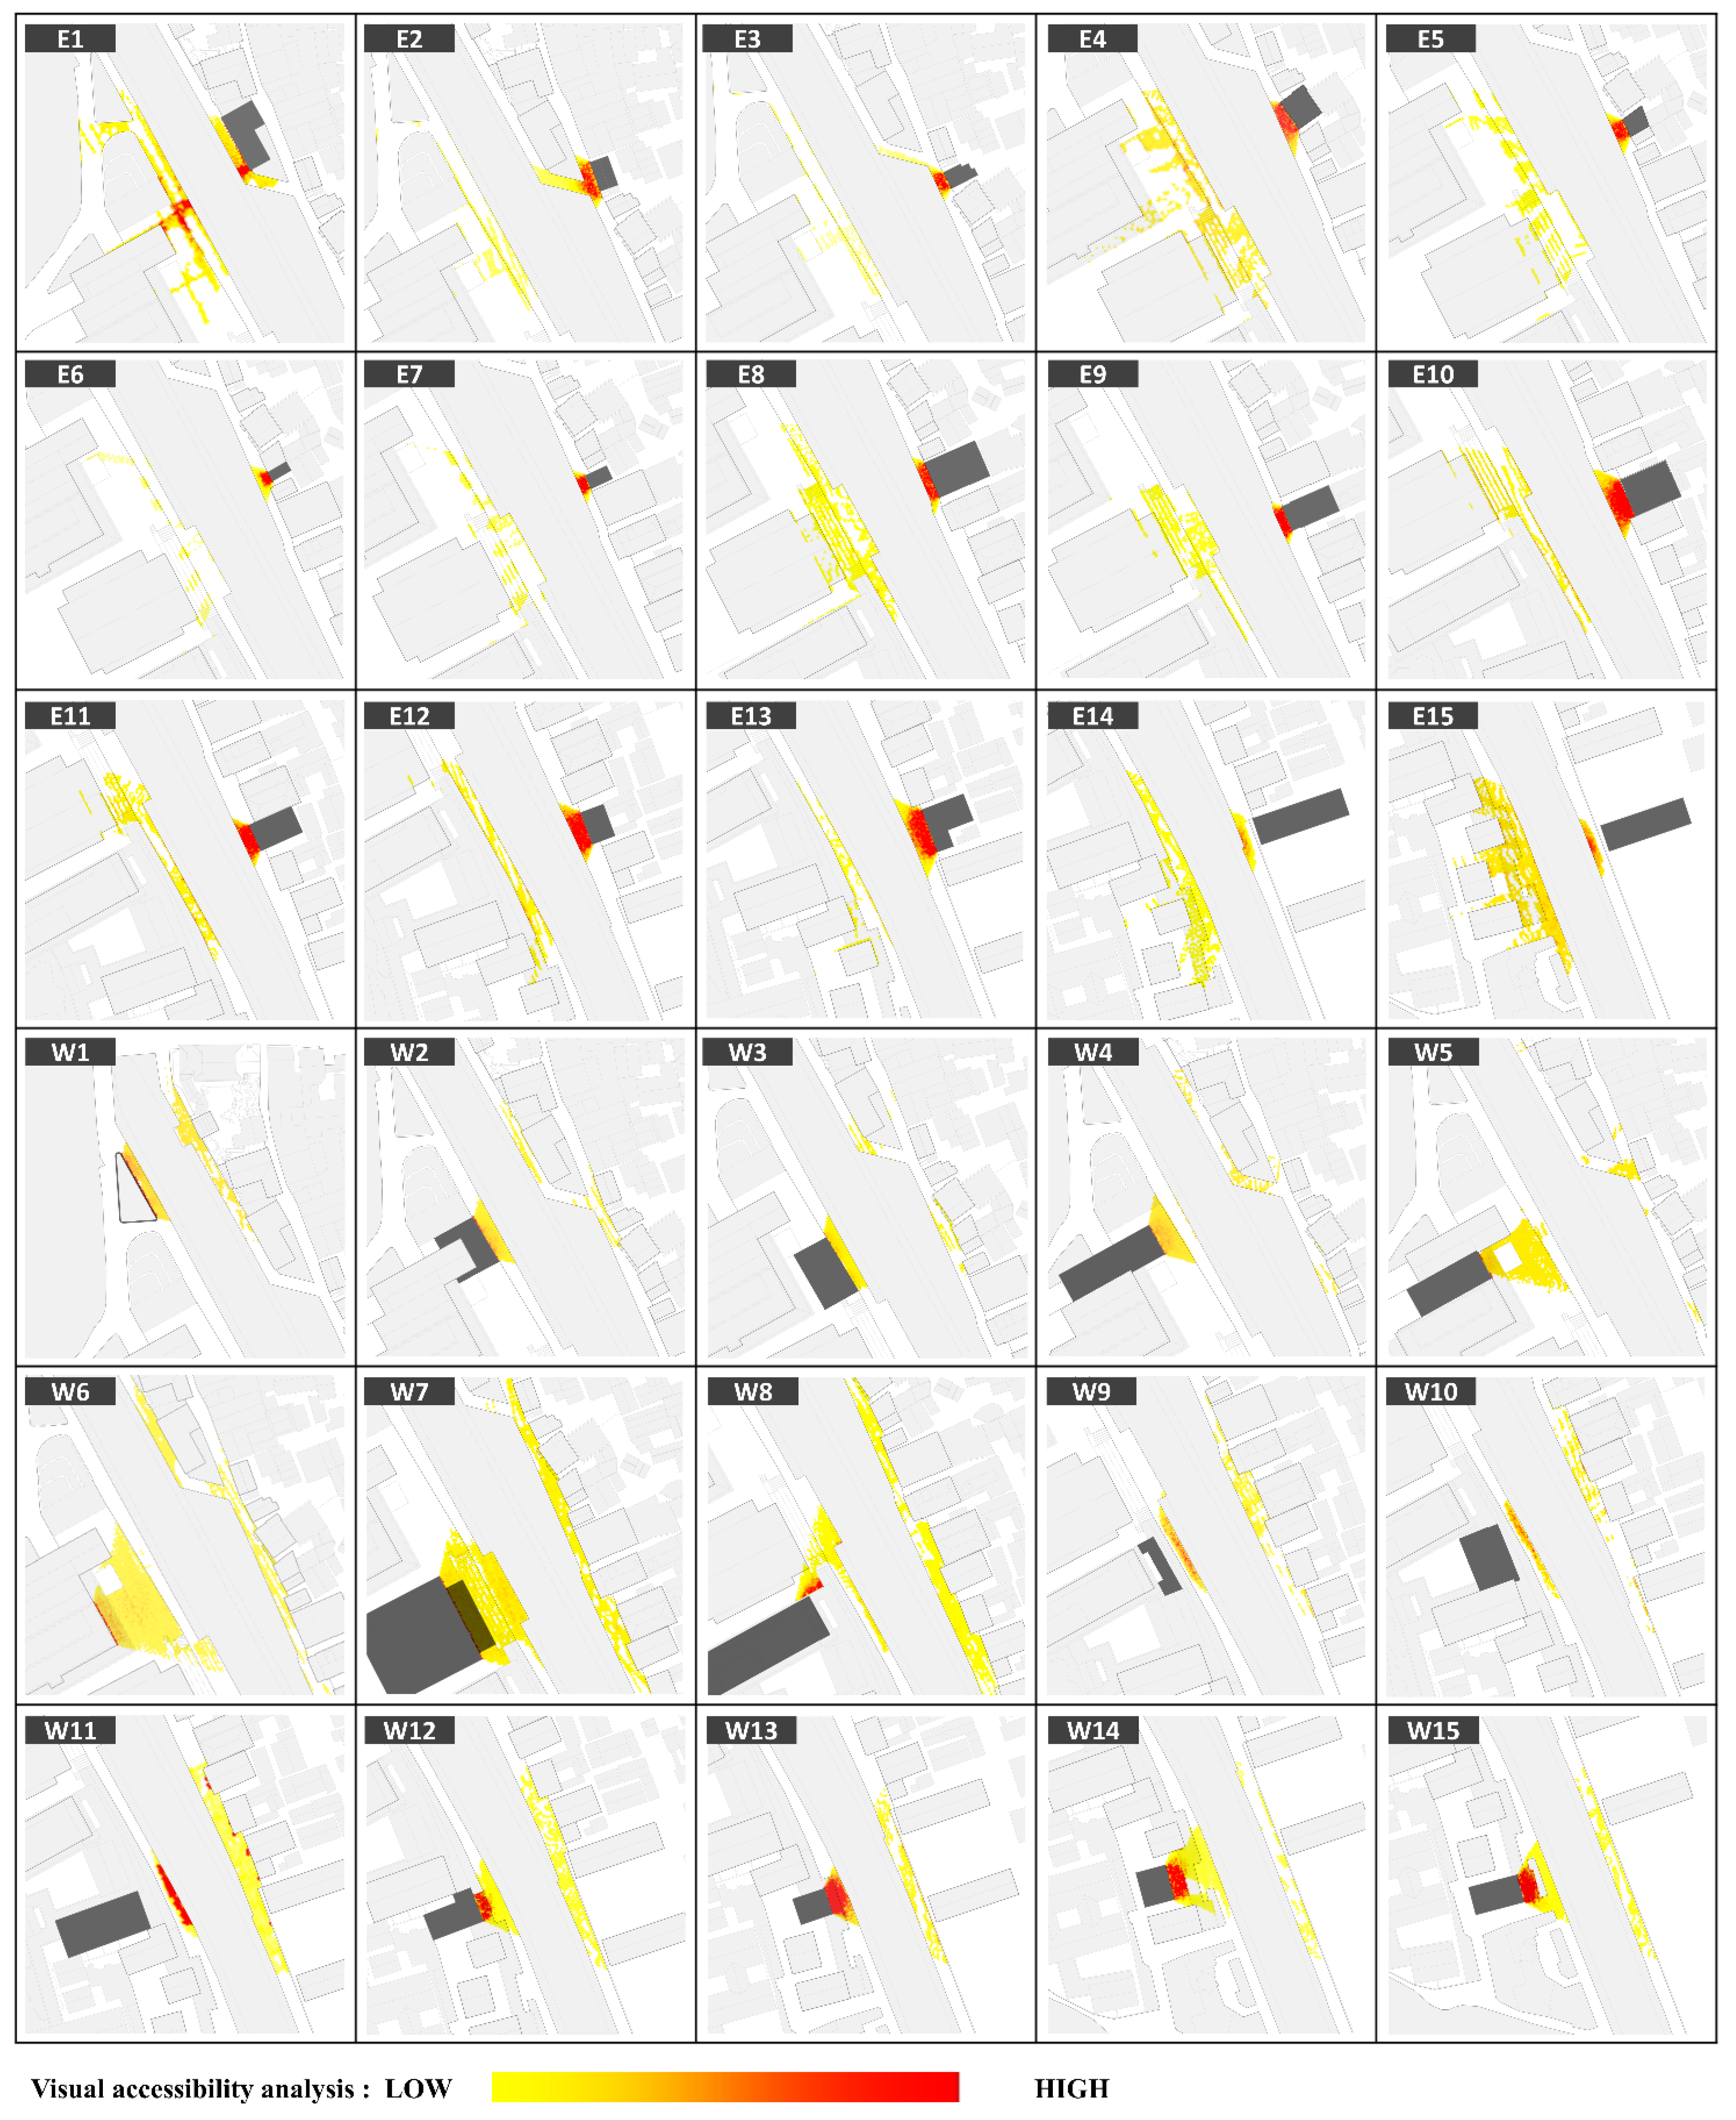
An isovist field is an analytical tool used to characterize the visual properties of space, widely applied in the study of buildings and built environments. In practice, an isovist field is generated by systematically mapping all visible features within a building or spatial setting [61] (as illustrated by the red-shaded areas on the ground in Figure 6). Given that isovists vary considerably in shape and size, quantitative measures are commonly employed to numerically represent these variations. These measures collectively form a set of isovist fields, which describe the spatial–visual characteristics along specific paths within a given environment [8]. This study employs the Grasshopper parametric environment within the Rhino modeling platform to conduct 3D isovist analysis on 30 identified waterfront buildings. The procedure is as follows:
  • The input building facade meshes are restructured into quadrilateral grids, with observation points assigned to each grid vertex. Grid density is controlled via the “Target Count” parameter, which adjusts the number of observation points according to facade area.
  • A ray-casting algorithm is constructed in Grasshopper: for each observation point, a conical ray bundle—replicating the properties of a human visual cone—is projected in the direction of the facade’s surface normal. The ray projection process follows two strict physical constraints: (1) rays are immediately terminated upon intersecting other solid building elements; and (2) in unobstructed conditions, the maximum viewing distance is limited to 45.00 m. All valid point clouds intercepted within a vertical error margin of ±0.15 m on walkable pedestrian surfaces (with a valid point capture rate ≥83%) are input into a “Convex Hull” component to compute their boundary, followed by “TriRemesh” to generate a triangulated mesh.
  • The number of rays falling on each mesh surface is used to apply a color gradient, visually representing lines of sight. Key geometric parameters of the mesh are then calculated: polygonal surface area (m2), representing vertical visual openness, and the total boundary polyline length (m), representing spatial boundary complexity. These parameters jointly establish a 3D isovist metric system, which allows for the quantification of the spatial–visual accessibility of each waterfront building and provides deeper insights into how visual properties shape pedestrian behavior.
Finally, we conducted regression analyses on the two key indicators (VET and 3D isovist field parameters) across the 30 designated buildings. These two indicators, respectively, represent visual attention from the observer’s perspective and visual accessibility from the building’s perspective. For the isovist field parameters, it is necessary to assess the significance of the area and perimeter factors in order to evaluate their explanatory power for predicting VET. When applying a multiple linear regression model, the multicollinearity of these two factors must also be examined. This regression analysis serves to test the hypothesis proposed in this study and to reveal the influence of visual accessibility on human behavior in waterfront public spaces.

4. Results

4.1. Spatiotemporal Distribution Patterns of Crowds

4.1.1. Evaluation and Validation of the Detection Results

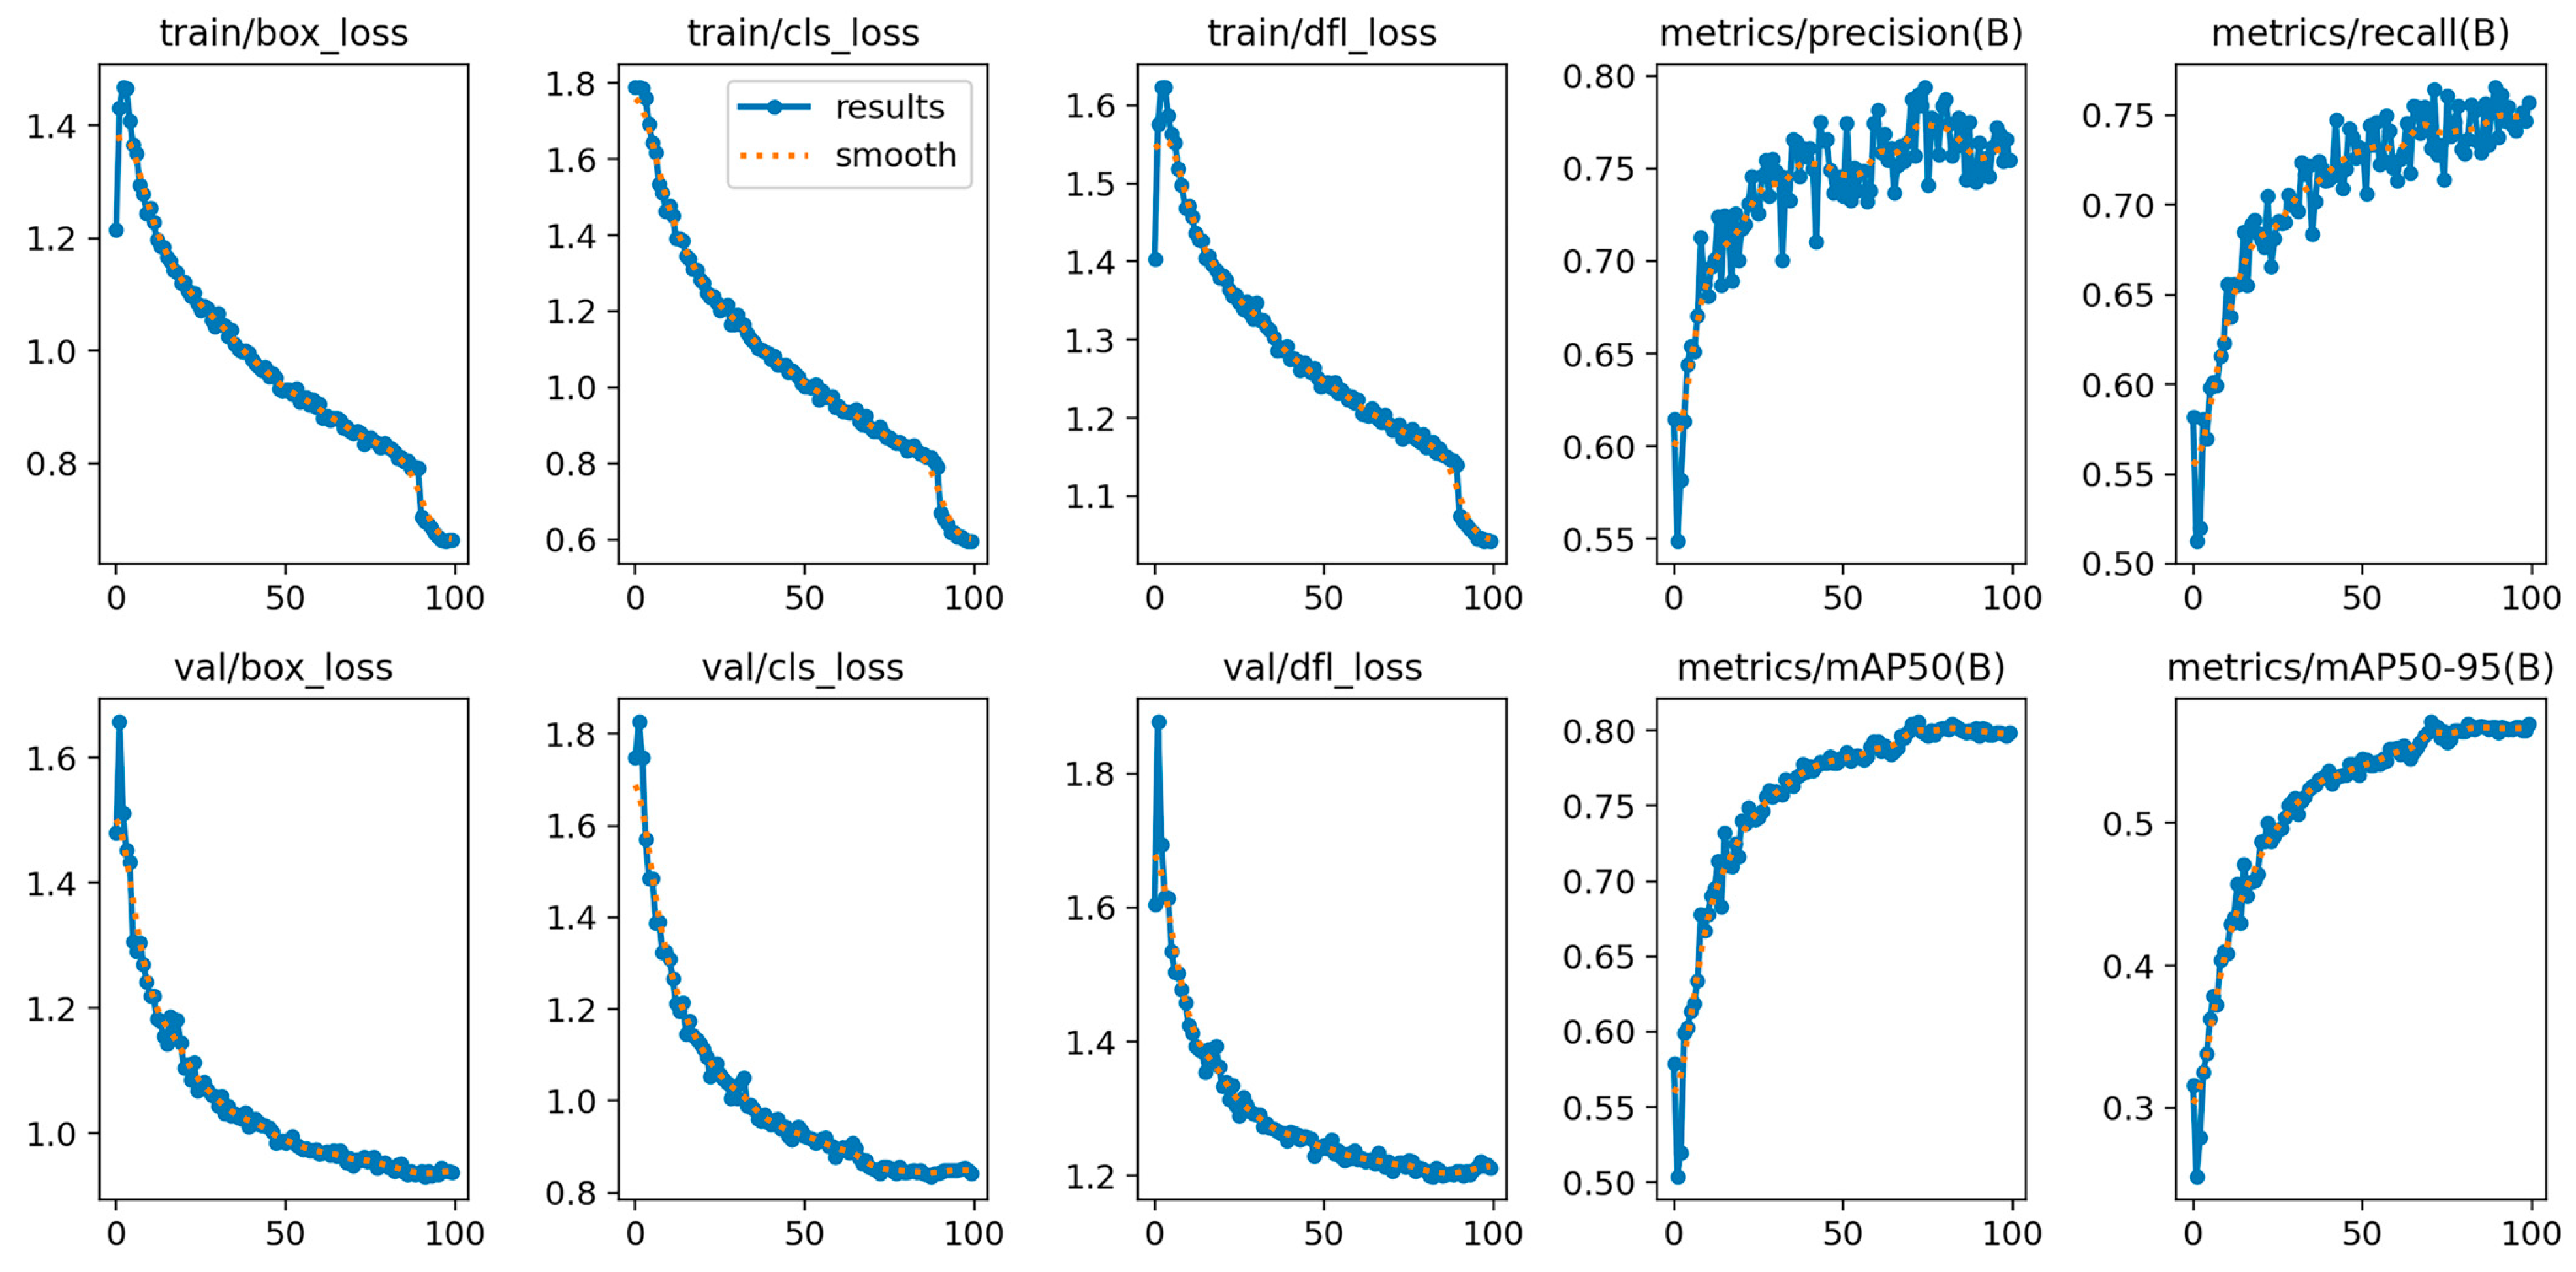
This study employed the YOLOv8n model in conjunction with the DeepSORT algorithm to perform pedestrian detection and trajectory tracking on a dataset of 1800 drone-captured images, each containing an average of 30 individuals against a uniform background. A random multi-scale training strategy was adopted, and the evolution of key metrics during training is illustrated in Figure 7. All loss components—including box loss, classification loss (cls), and distribution focal loss (dfl)—exhibited a steady downward trend, with no evidence of overfitting between the training and validation phases, indicating strong model generalization. In terms of detection performance, the final precision reached 0.75 and recall approached 0.74, demonstrating robust stability under complex yet consistently patterned crowd distributions. Overall, the YOLOv8n + DeepSORT pipeline exhibits practical feasibility for applications with moderate accuracy requirements—such as aerial surveillance and pedestrian flow monitoring—where stability and efficiency are paramount.

4.1.2. Crowd Trajectory Distributions

Using object detection and multi-object tracking algorithms, we analyzed 36 video segments captured by drone. The total number of unique IDs obtained per video slightly exceeded the actual headcount, since individuals occluded by buildings or trees for extended periods and then reappearing were occasionally assigned new IDs; such duplicate IDs were manually corrected.
Following MassMotion modeling conventions, we annotated key elements within the site model (Figure 8), including three observation sites (Site A, Site B, Site C) and six portals (Portal a, Portal b1, Portal b2, Portal c, Portal d, Portal e). A riverside promenade links the north side of Site B to a public restroom. On the west side of Site B stands a set of newly renovated buildings (not yet open to the public), surrounded by a public square. We observed that some visitors passed through Site B, ascended a staircase into this square, and paused or wandered there; consequently, we designated the square as a “Circulation Portal” to capture visitor dwell and circulation behaviors.
As is shown in Figure 8, we identified five direction-agnostic core pedestrian trajectories:
  • Trajectory d–c (Portal d to Portal c);
  • Trajectory e–c (Portal e to Portal c);
  • Trajectory a–B–b1 (Portal a → Site B → Portal b1);
  • Trajectory a–B–b2 (Portal a → Site B → Portal b2);
  • Trajectory a–B–a (Portal a → Site B → return to Portal a).
The temporal and numeric distributions of visitors along these trajectories were aggregated by date (Table 1). A total of 1608 visitors were recorded. On the east bank, visitor counts along d–c and e–c were similar, although the average traversal time for d–c was slightly shorter. East-bank volumes accounted for only 33% of the total, indicating far lower use than the west bank. On the west bank, 47% of all visitors (n = 756) followed trajectory a–B–b1, spending an average of 4.43 min; 7% of visitors traveled the a–B–a loop, departing Portal a, reaching Site B via the promenade, then returning by the same route. No visitors were observed starting from Portal b1 or Portal b2 and returning to their point of origin, suggesting that attractions north of Site B draw stronger visitation than those to the south.
Beyond these core trajectories, we recorded several atypical behaviors on the west bank (Table 2): 13% of visitors on the west bank used the public restroom; 5% rode electric bicycles along the promenade (average 1.46 min, significantly faster than walking); 10% paused or circulated within the western public square (Circulation Portal); and 12% cut across a surface parking lot via an unofficial shortcut (Figure 8f)—likely in response to temporary closures on the square’s west side, which led visitors to avoid retracing their route down to the main promenade. This finding offers a valuable planning insight: formalizing this high-frequency desire line as an official pedestrian route could improve circulation and user experience.

4.1.3. Temporal Fluctuations of Aggregate Visitors on Both River Banks

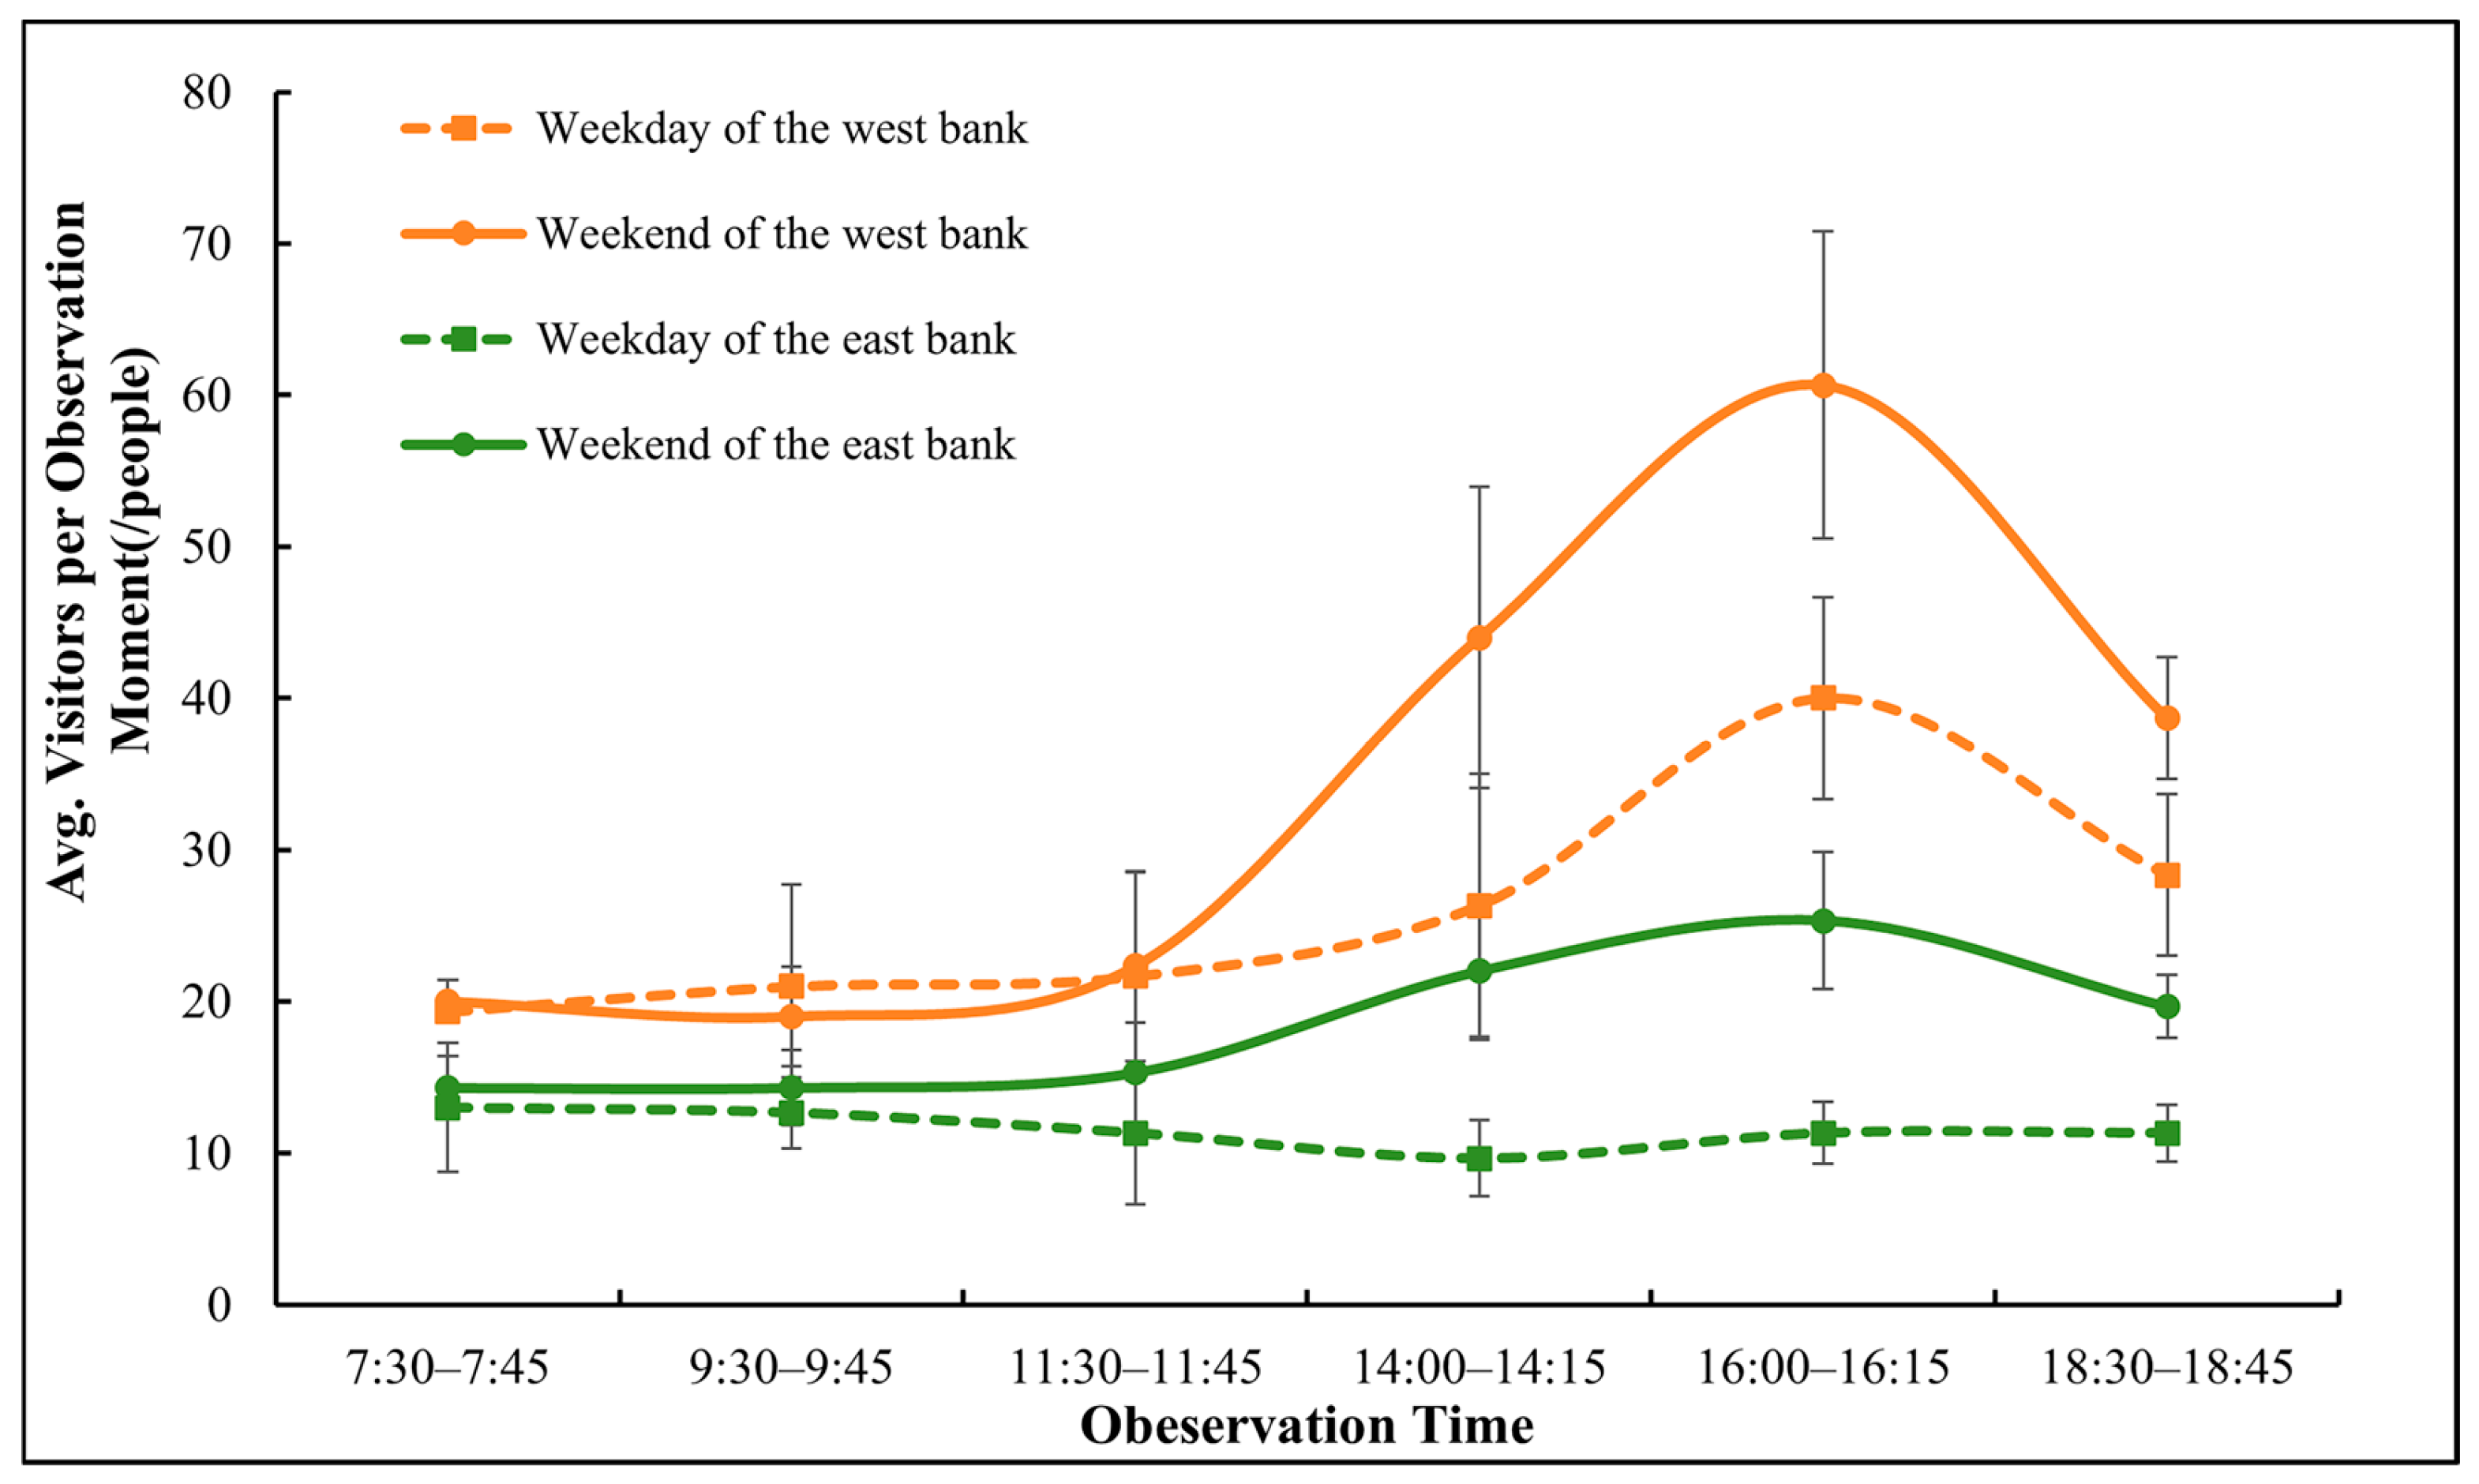
Figure 9 illustrates the temporal fluctuations in total visitor counts on the east and west riverbanks. On weekdays, the east bank exhibits no pronounced time of day variation, maintaining a relatively stable visitor flow. Both banks record steady visitation before 11:30 a.m., after which counts gradually rise and peak at 4:00 p.m., with the highest count observed on weekend afternoons at 61 visitors on the west bank. Thereafter, totals decline steadily.
A comparison between weekday and weekend data shows that from 7:30 a.m. to 11:30 a.m., overall visitation remains stable with no significant difference between weekdays and weekends. However, after 11:30 a.m., weekend visitor volumes on both banks substantially exceed their weekday counterparts. For example, on the west bank at 4:00 p.m., weekend visitation reaches 61 people versus 40 people on weekdays.
Finally, contrasting the two banks reveals that the west bank consistently attracts more visitors than the east bank: in the morning, the west bank averages only 6 more visitors than the east bank; while in the afternoon the gap widens to as many as 40. This disparity is largely attributable to the fact that the east bank remains unrenovated, whereas the west bank’s recent renewal has enhanced the quality of its public spaces and the appeal of its architecture, thereby drawing larger crowds.

4.2. Crowd Behavior Pattern Analysis

4.2.1. Descriptive Statistics

Table 3 presents descriptive statistics of visitors at the three sites across 36 observation periods, with the data derived from standardized MOHAWk coding protocols. Site A, Site B, and Site C registered total visitor counts of 1386, 1208, and 1174, respectively. The significantly higher count at Site A is attributable to its location at a bridgehead transit node, which captured some passersby who did not enter the riverside promenade.
All three sites are located along the western waterfront trail and thus attract visitors with similar socio-demographic characteristics. In terms of age distribution, adults make up the largest age group, averaging around 69%, followed by older adults at 16%. Children account for approximately 10%, while adolescents and infants comprise smaller proportions. The gender ratio is nearly balanced across all three sites, with male and female visitors present in comparable numbers.

4.2.2. Crowd Behavior Patterns in Waterfront Public Spaces

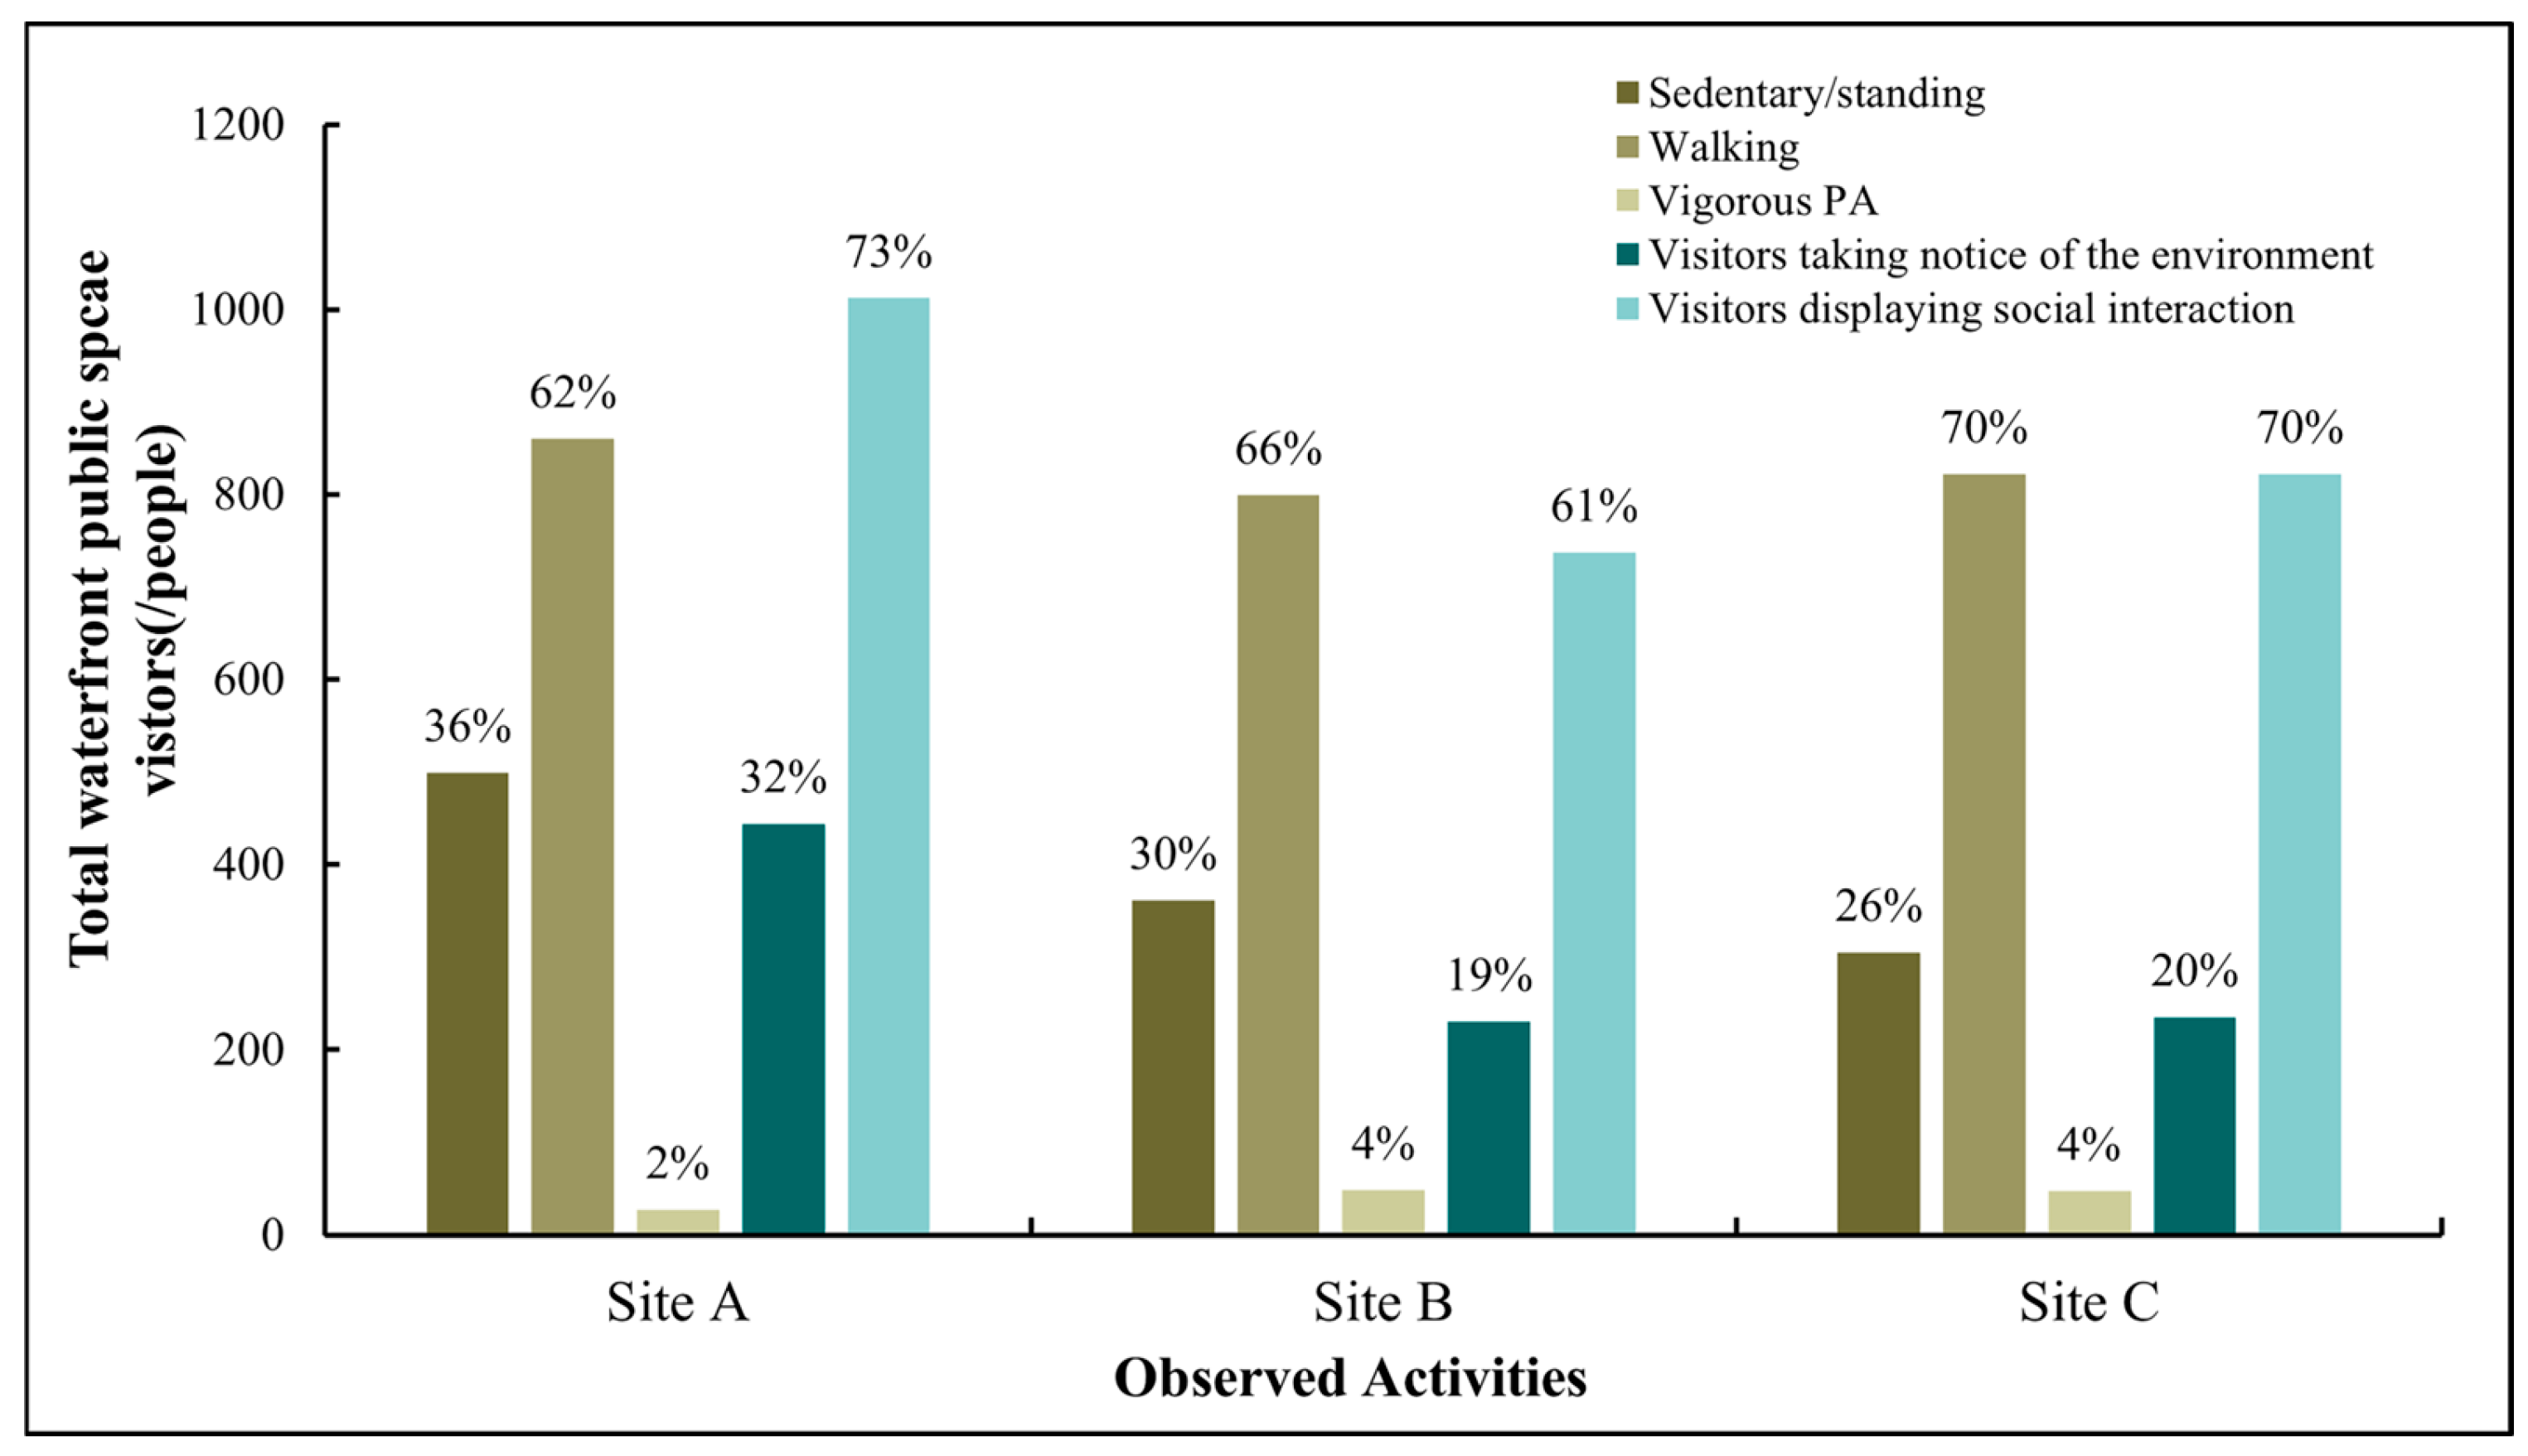
We observed and evaluated visitor physical activity and other wellbeing behaviors at three key sites within the waterfront public space. Figure 10 provides a visual analysis of the visitor activities summarized in Table 3. The analysis reveals that Site A exhibits a markedly different behavioral profile: sedentary/standing behavior is most prevalent there (36%), and it also has the highest incidence of social interaction (73%). In contrast, dynamic activities dominate at Site B and Site C, with walking accounting for over 70% of observed behaviors (73% at Site B and 70% at Site C), compared to 62% at Site A. Vigorous physical activity is a secondary behavior across all three sites: 4% of visitors exercise on the expanded riverside platform at Site B, while another 4%—primarily children—engage in playful climbing on the adjacent rockery at Site C. This analysis provides direct guidance for configuring visitor behaviors at different nodes in subsequent ABM.
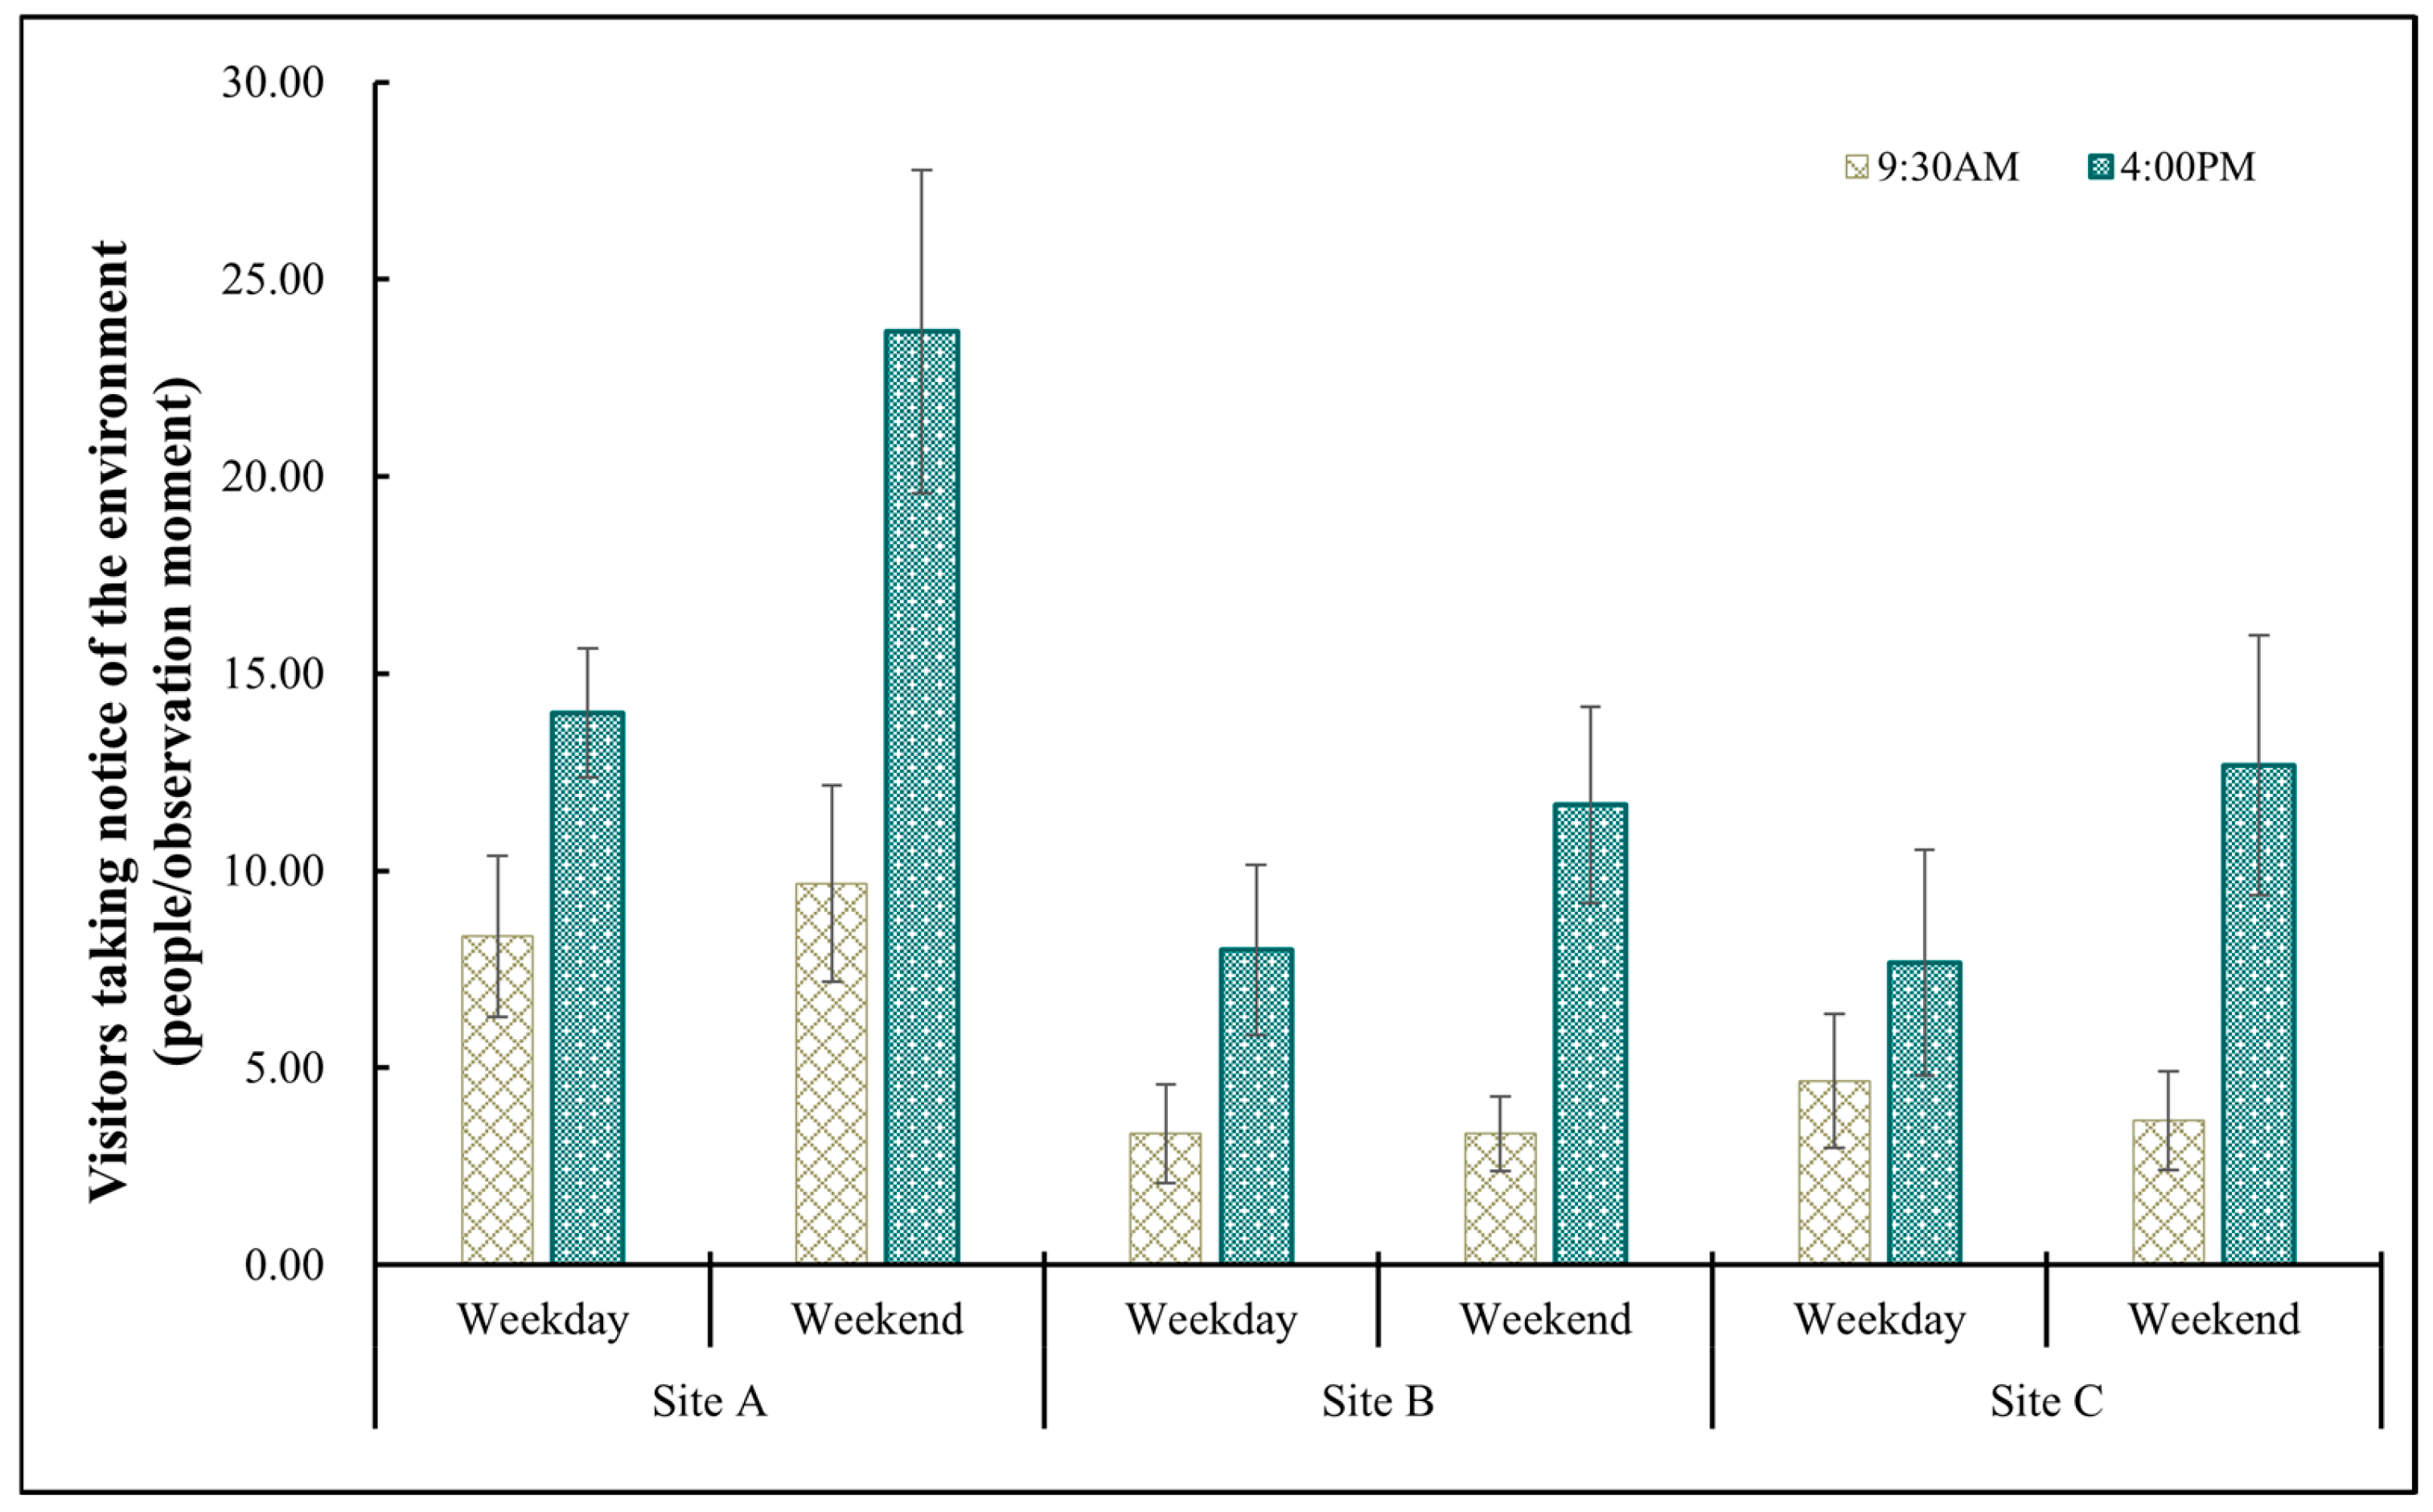
TN behaviors are particularly important in waterfront studies because they directly reflect the influence of the physical setting on visitor visual perception. Time-series observations of this behavior at peak periods (9:30 a.m. and 4:00 p.m.; Figure 11) show that Site A consistently attracts significantly more TN activity, with an average of 32% of visitors engaging in this behavior, versus 19% at Site B and 20% at Site C. It is noteworthy that the recorded sedentary/standing category at Site B includes a substantial TN component; the 11% difference between sedentary/standing and TN at Site B—larger than at Site A or Site C—reflects more diverse visitor behaviors, including 6% of visitors sitting on the rest terrace specifically to observe the surroundings. Finally, temporal analysis indicates that TN behaviors are more frequent in the afternoon across all sites, with this afternoon–morning difference being especially pronounced on weekends.

4.3. Visual Analysis

4.3.1. ABM Settings

We selected the weekend afternoon peak period at 4:00 p.m. to conduct ABM and simulation of pedestrian behavior in the Xiaoqinhuai River waterfront public space. This time slot was chosen because visitor counts are highest and TN behaviors are most frequent, yielding the most pronounced features for our visual analysis. Based on the empirical data, we instantiated 61 agents on the west bank and 31 agents on the east bank, each entering the simulation at random times over a 15 min interval. In MassMotion, we defined six “Journey” activities corresponding to the five principal trajectories and one off-designated path identified in our observations. We also created one “Circulation” activity to simulate visitor dwell and exploratory movements between the Circulation Portal and Site B. Participant numbers for each activity were allocated in proportion to the distributions reported in Figure 10 and Figure 11. Walking speeds were derived from measured traversal times. We used the d–c trajectory (247 m in length), which involves no intermediate stops, to calculate a uniform speed distribution ranging from 0.47 m/s to 1.87 m/s, with a mean of 1.17 m/s—slightly below the Fruin’s default of 1.35 m/s (commuting speed) [62].
Table 4 summarizes the behavior-setting parameters for agents at the three key sites and for observed special behaviors. Six distinct “Wait Space” zones were configured to replicate stationary and TN behaviors, each mapped to the specific activities recorded in the field.

4.3.2. Visual Exposure Time Based on 3D Vision Field Simulation

Figure 12a illustrates the simulated pedestrian trajectories during the weekend afternoon peak period at 4:00 p.m. The Maximum Density Map (Figure 12b) shows the maximum density reached at every point during the given time range. In the ABM, each agent possesses a forward-projecting visual cone to simulate its 3D vision field, enabling it to observe both the surrounding environment and other agents while moving. Within MassMotion, we computed the Visual Exposure Time for selected waterfront facades using the Vision Time Map, defined as the product of elapsed time and the number of agents observing a given element. The Vision Time Map dynamically visualizes, in three dimensions, the zones of concentrated visual attention as agents traverse the site. We labeled the principal riverside buildings on both banks (Figure 12a) to assess their visual exposure.
Analysis of the linear facade exposure heatmap reveals the actual 3D visible range from a pedestrian’s perspective (Figure 13). At Site B, an enlarged viewing platform attracted 19% of agents to pause and observe, and as a key vertical circulation node on the west bank, Site B concentrates substantial foot traffic. Consequently, the opposite-bank buildings centered on E8 received the highest levels of visual attention (Figure 13: E4–E11). By contrast, on the west bank itself, facades W6, W7, and W9 exhibited the greatest exposure locally (Figure 13: W6, W7, W9), but their values remained markedly lower than those of the opposite-bank cluster. This contrast demonstrates that at the meso-scale, visual exposure of buildings is heavily influenced by the density of pedestrian flows across the water. Conversely, facades W8, W11, W12, W13, and W14 received the lowest exposure; these buildings are separated from the simulated walkway by transitional spaces—such as colonnades and landscaping—which significantly reduced their visual prominence relative to facades directly abutting the promenade. Moreover, corner buildings (Figure 13: E1, W9, W15) exhibited notably higher exposure than their adjacent neighbors, highlighting the propensity of convex urban spaces to attract greater visual attention.

4.3.3. Visual Accessibility Analysis Based on 3D Isovist

We applied a 3D isovist to quantify the spatial–visual accessibility of waterfront buildings. Table 5 shows the statistical indicators of 30 labeled buildings, where Afacade is facade area, Wfacade is facade width, Hfacade is facade height, VE represents visual efficiency, VET represents Visual Exposure Time, Aiso is isovist area, and Piso is isovist perimeter. Wfacade is defined as the maximum coverage width of the building facade. For pitched-roof buildings, Hfacade is calculated as the vertical distance from the eaves line to the midpoint height of the ridge.
Figure 14 presents the isovist fields generated through ray casting for the 30 labeled building facades. In research on spatial cognition and environmental psychology, an isovist—defined as the polygon of visible space—yields two key quantitative indicators: isovist area, which represents visual openness or spaciousness, and isovist perimeter, which reflects contour complexity (i.e., boundary undulation and interface density) [27]. This dual-indicator model has shown significant predictive power across real environments, virtual settings, and urban public spaces, forecasting both recognition efficiency and the willingness to stay. These findings carry important implications for urban planning, architectural design, and behavioral simulation: balancing large isovist areas to ensure legibility and cognitive mapping alongside moderate contour complexity to elevate engagement and emotional appeal [63].
In this study, we use isovist area to represent visual openness and the total length of its boundary polyline (in meters) to quantify the complexity of spatial boundaries. A total of 30 buildings were analyzed to obtain the corresponding isovist-based quantitative indicators (Table 5). Our site survey data indicate that the average elevation of the western riverside path is approximately 2.6 m higher than that of the eastern side, resulting in significant spatial divergence in the isovist fields of buildings on both banks. The analysis reveals considerable spatial variation in isovist areas (standard deviation σ = 149.69 m2), with field morphology closely linked to the geometric parameters and spatial positions of building facades. Statistical analysis shows that isovist area is significantly positively correlated with facade width (p-value = 0.0001, Pearson’s r = 0.650) and also with facade height (p-value = 0.0012, r = 0.563). In addition, the boundary complexity of the isovist shapes is jointly influenced by the alignment of the waterfront axis and the elevation difference between riverbanks. A representative example is Building W4 on the western bank, which, due to its elevation advantage of +5 m, achieves an isovist area of 198.04 m2—31.75% greater than that of the similarly scaled E4 building on the eastern bank (150.32 m2). However, the perimeter of W4’s isovist field is 408.54 m, 27.21% shorter than that of E4 (561.30 m). This contrast highlights the impact of vertical elevation differences on visual accessibility in waterfront spaces.

4.3.4. The Impact of Building Visual Accessibility on Pedestrian Behavior

The objective of this study is to examine the influence of waterfront building visual accessibility on visitor behavior. We simulated and computed Visual Exposure Time (VET) from the observer’s perspective and, using 3D isovists, measured the visible area of the walkable domain from the building’s perspective. Both datasets share a common reference coordinate system and adhere to identical measurement standards owing to the reversibility of light paths. A multiple linear regression model was then employed to predict VET based on objectively computed isovist metrics.
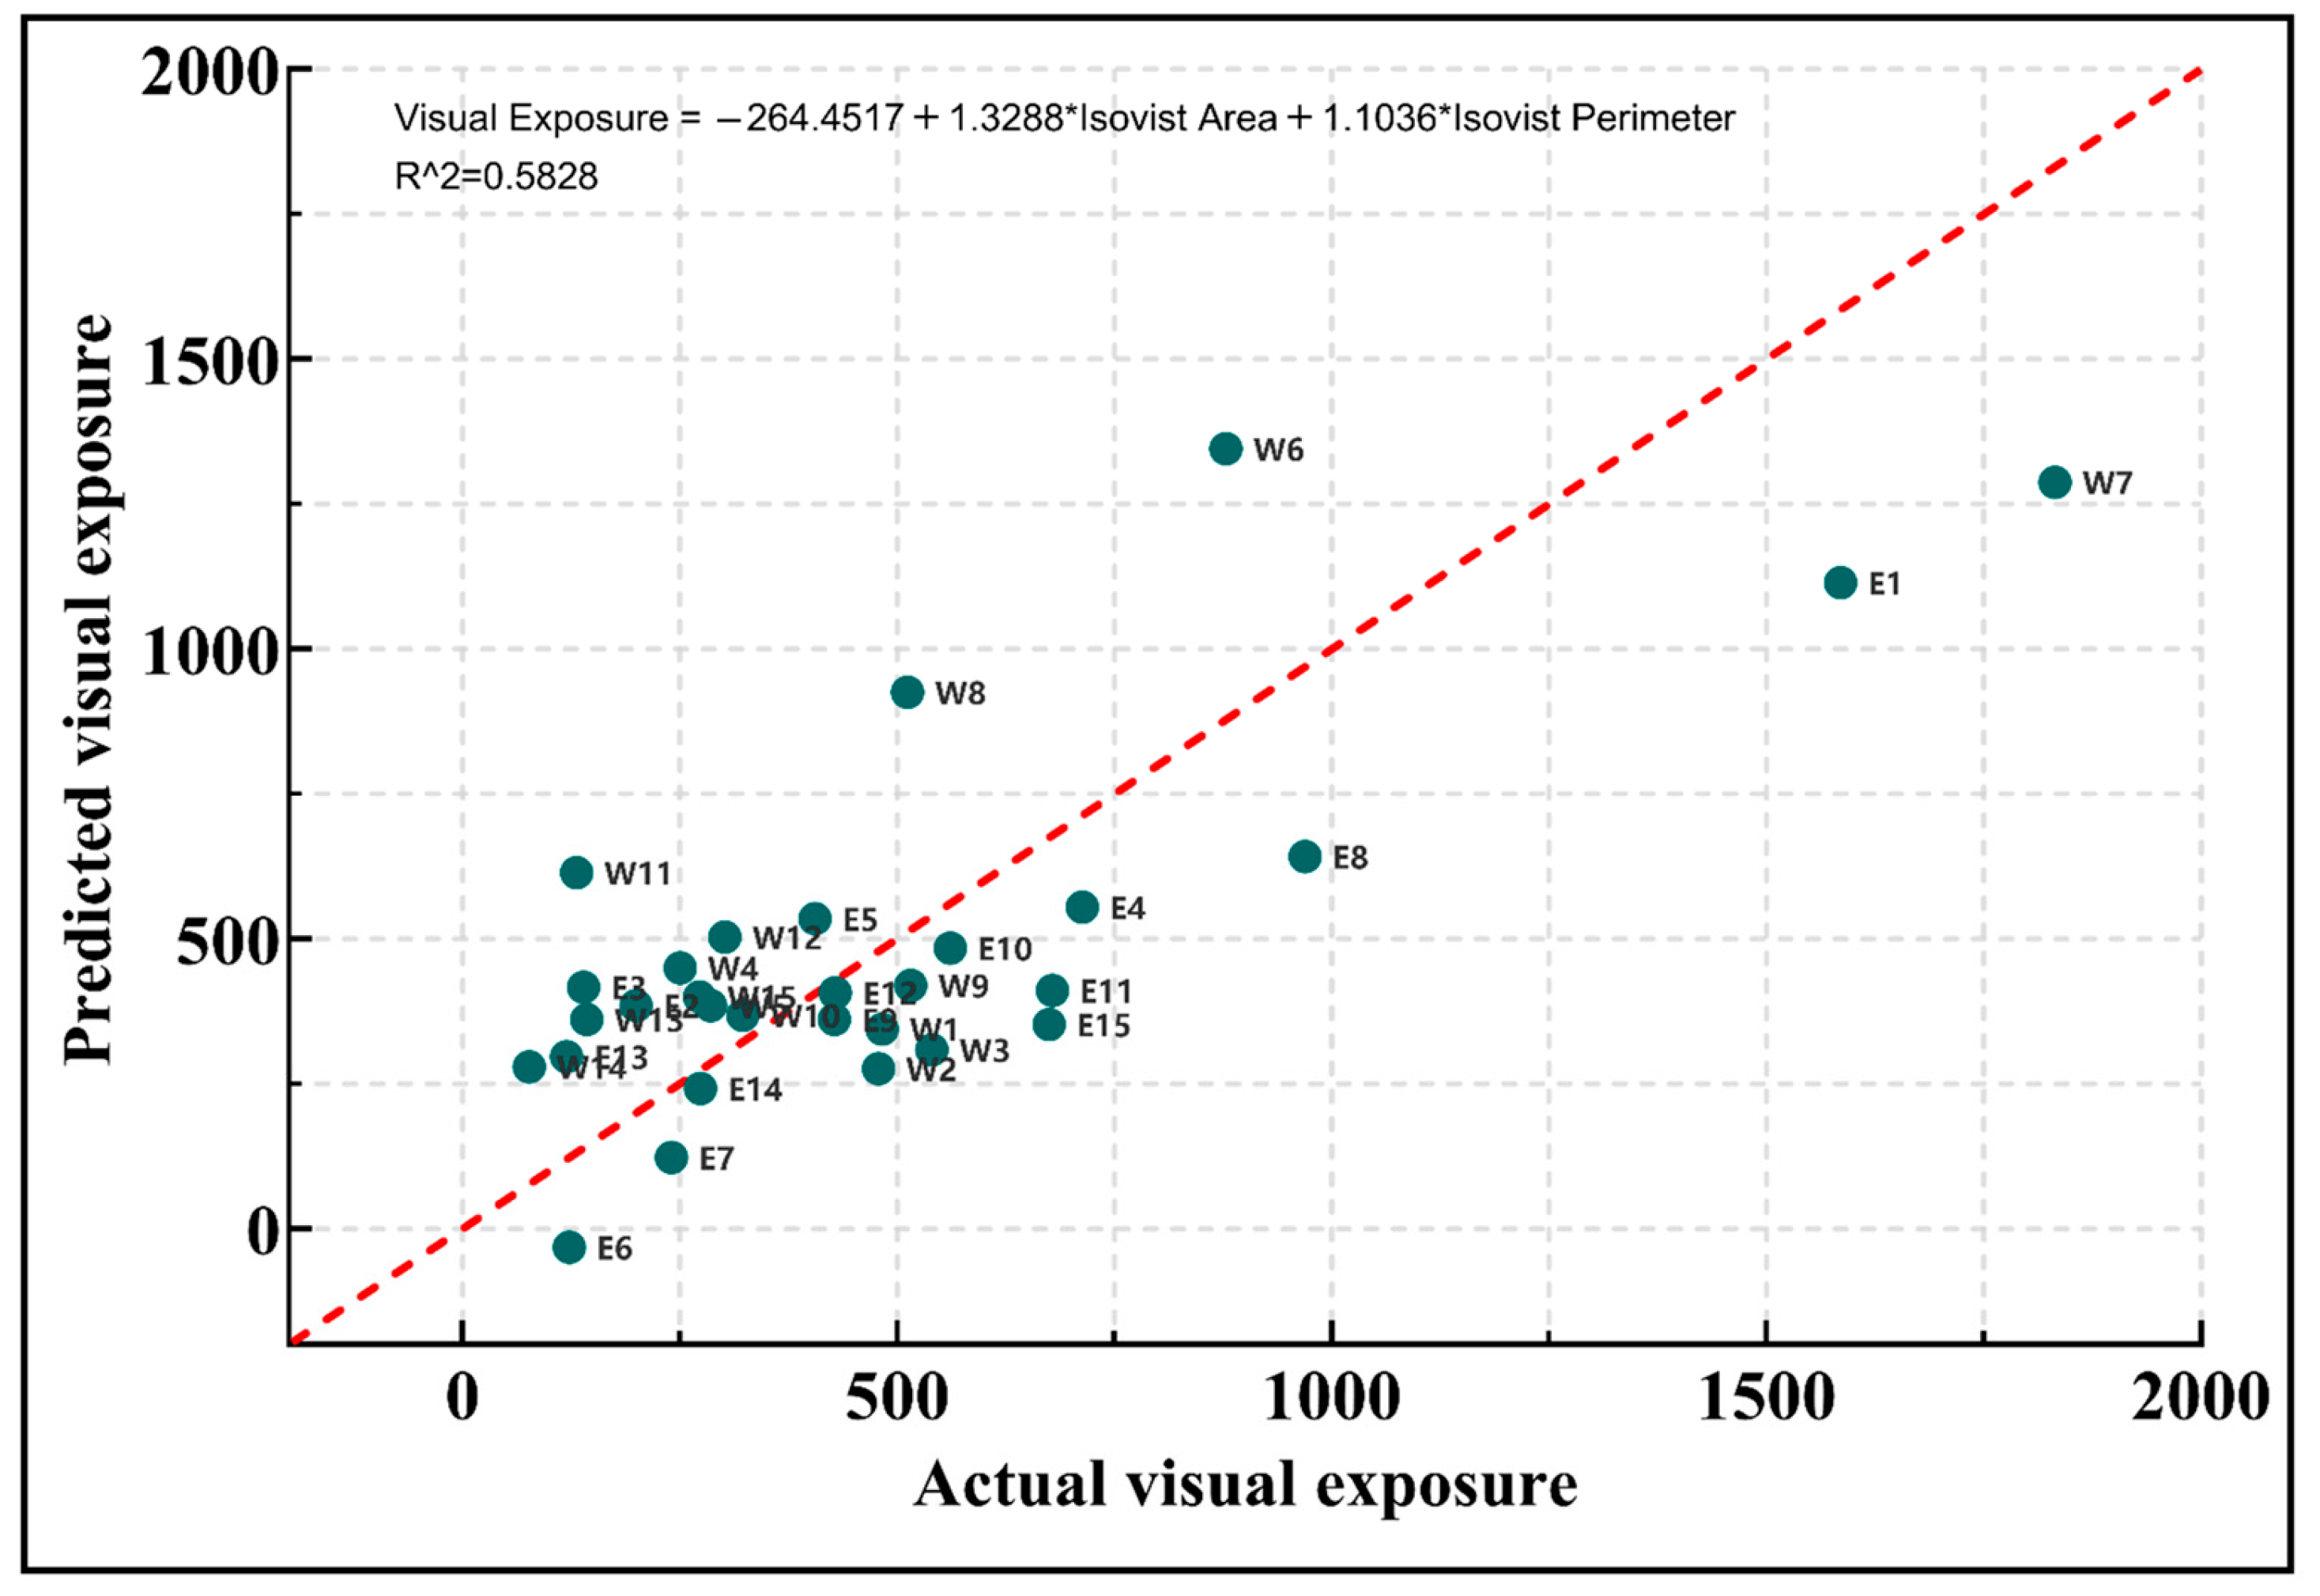
Using data from 30 east- and west-bank buildings, the resulting regression equation is
V E T = 264.4517 + 1.3288   A i s o + 1.1036   P i s o
where VET represents Visual Exposure Time, Aiso is isovist area, and Piso is isovist perimeter.
This model is statistically significant (Figure 15), with an F statistic of 18.86 (p-value < 0.0001). The two predictors together explain 58.28% of the variance in Visual Exposure Time, indicated by the Coefficient of Determination (R-squared) value of 0.5828. Individually, the isovist area coefficient is highly significant (regression coefficient β = 1.3288, p-value = 0.0038), indicating that each additional square meter of visible area corresponds to an average increase of 1.33 min of exposure. The isovist perimeter coefficient is also significant (β = 1.1036, p-value = 0.0374), suggesting that each additional meter of perimeter length yields an average increase of 1.10 min. The Variance Inflation Factor (VIF) for both predictors is low (VIF = 1.613), ruling out multicollinearity. Residuals satisfy the normality assumption (Shapiro–Wilk W = 0.9796, p-value = 0.8150), supporting model validity. Compared to a univariate model using only isovist area, this multivariate formulation improves explanatory power by 7.4% while effectively accounting for confounding between predictors and maintaining robustness. Thus, it provides an effective quantitative framework for predicting the visual exposure of waterfront facades.
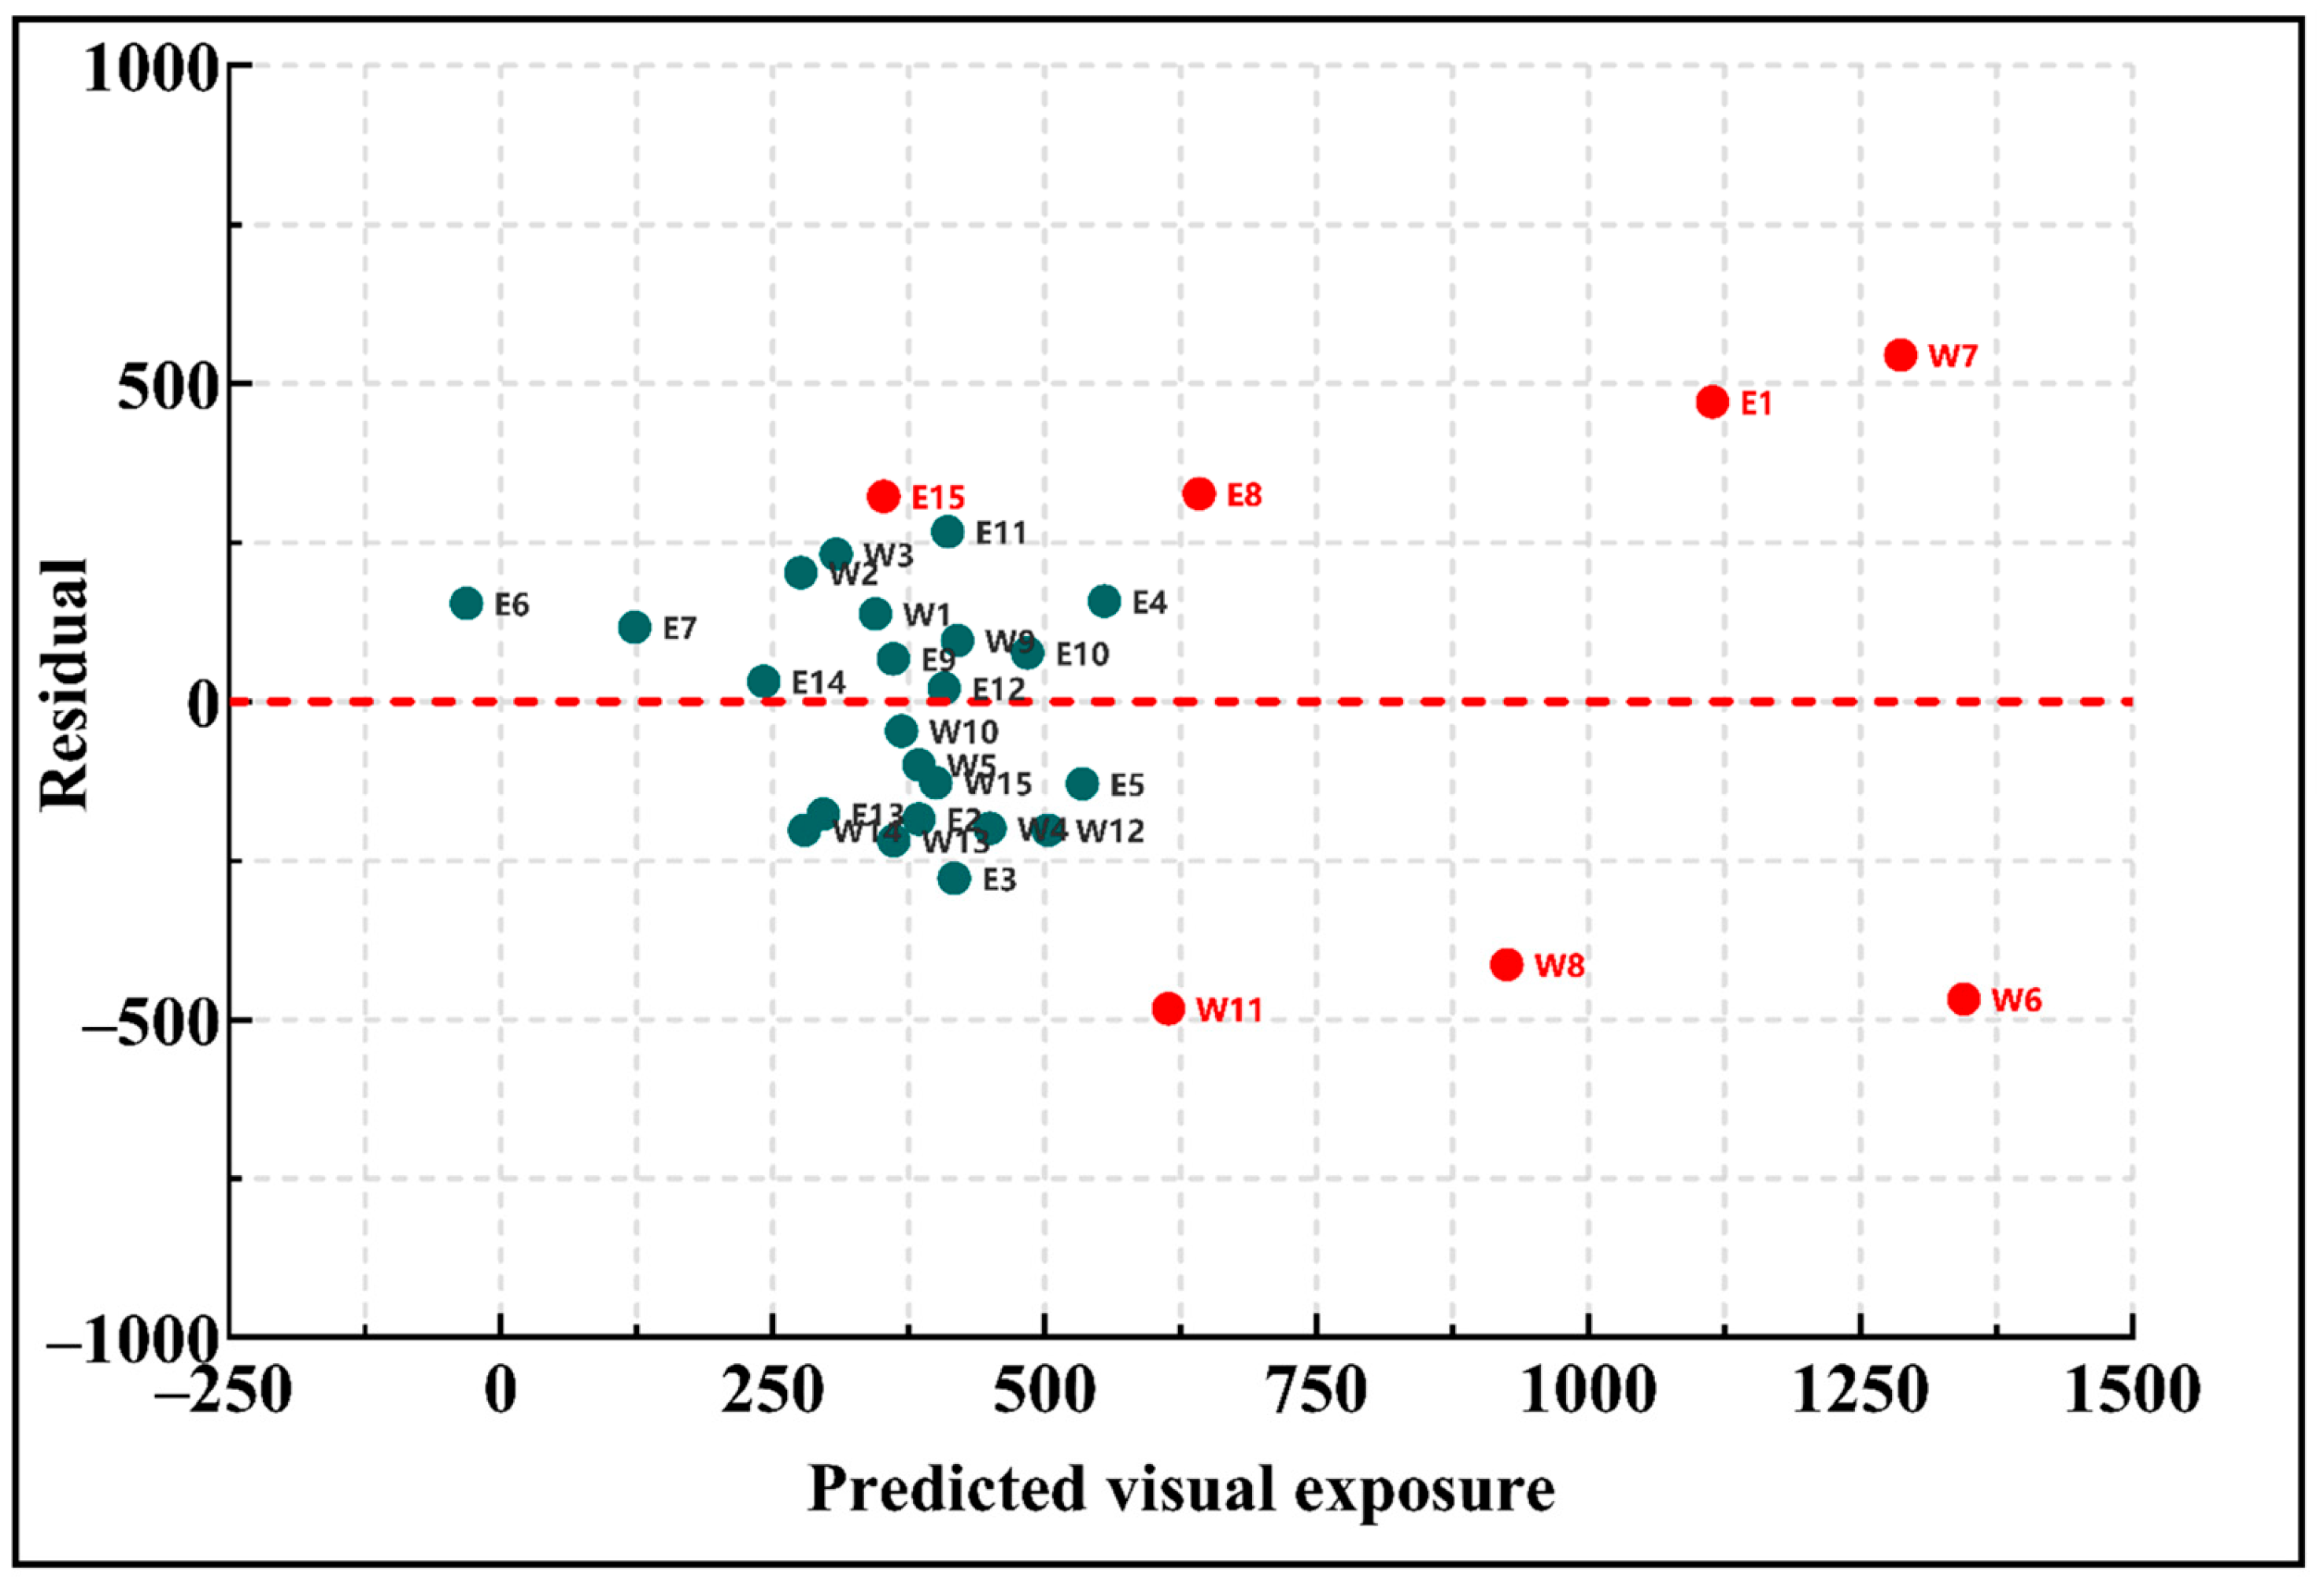
Residual analysis (Figure 16) further elucidates how deviations from predicted exposure time reflect a building’s visual attraction. Positive residuals indicate underestimation by the model—i.e., buildings exhibiting stronger-than-expected visual draw. Building W7, the core landmark of the renovated west-bank complex, shows the largest positive residual, likely due to its distinctive form and proximate public square and viewing platform at Site B. Similarly, east-bank clusters E1, E8, and E15 exhibit substantial underestimation (residuals > 250 min), underscoring that at the meso-scale, visual exposure is heavily influenced by opposite-bank foot traffic; when viewing distances exceed the river’s average width (12 m), opposite-bank facades gain a relative advantage. Conversely, facades W6, W8, and W11 display large negative residuals, indicating that their elevated and set-back positions (+5 m above the east-bank ground level and > 7 m from the water’s edge) reduce their actual visual exposure despite favorable isovist metrics. This finding reaffirms that at the meso-scale, visual accessibility primarily shapes the behavior of visitors on the opposite bank.

5. Discussion

The core of this study lies in analyzing visitor behavior patterns in meso-scale waterfront public spaces from the perspective of visual accessibility. The preceding sections address and provide answers to one testable hypothesis and three central research questions. Regarding the hypothesis—namely, that visual accessibility is a primary causal driver of pedestrian behavior independent of other causality (i.e., unmeasured social variables)—we validated this through regression analysis, demonstrating that visual accessibility accounts for 58.28% of the variance in the behavioral indicator VET.
In response to Question 1, we extracted crowd trajectory distribution patterns and temporal fluctuations in the number of visitors within the public space by applying pedestrian detection and trajectory tracking algorithms to aerial video footage. We then coded crowd behavior at three sites in detail and, in Section 4.2.2, compared visitor PA levels and TN behaviors across these locations.
In response to Question 2, we employed a 3D isovist method to analyze the 3D visible fields of the facades of 30 labeled linear waterfront buildings (Section 4.3.3). Furthermore, through agent-based modeling, we visualized pedestrians’ actual visible range using vision maps (Section 4.3.2).
In response to Question 3, as detailed in Section 4.3.4, we constructed a multiple linear regression model based on quantitative data from 30 riverside buildings. By using architectural visual accessibility metrics, we predicted the facade visual exposure duration from a pedestrian’s perspective. This model establishes an objective linkage between the physical environment and pedestrian behavior. A residual plot was employed to elucidate the distinct contributing factors.
Specifically, this study delineates the waterfront into east and west banks, focusing on 15 representative building clusters on each side. The following section presents a detailed comparative visual analysis of the renovated west bank and the unrenovated east bank. This comparison aims to provide actionable insights for future urban design and planning.

5.1. Comparative Analysis of Visual Efficiency in Waterfront Building Complexes: Pre- vs. Post-Renovation

The selected site features fully renovated buildings on the west bank that have been progressively opened to visitors, whereas east-bank structures remain in the planning and design phase and retain their pre-renewal condition. To compare the efficiency with which facades attract visual attention, we introduce the visual efficiency (VE) metric, defined as
V E = V E T A f a c a d e ,
where VE represents visual efficiency and Afacade is facade area.
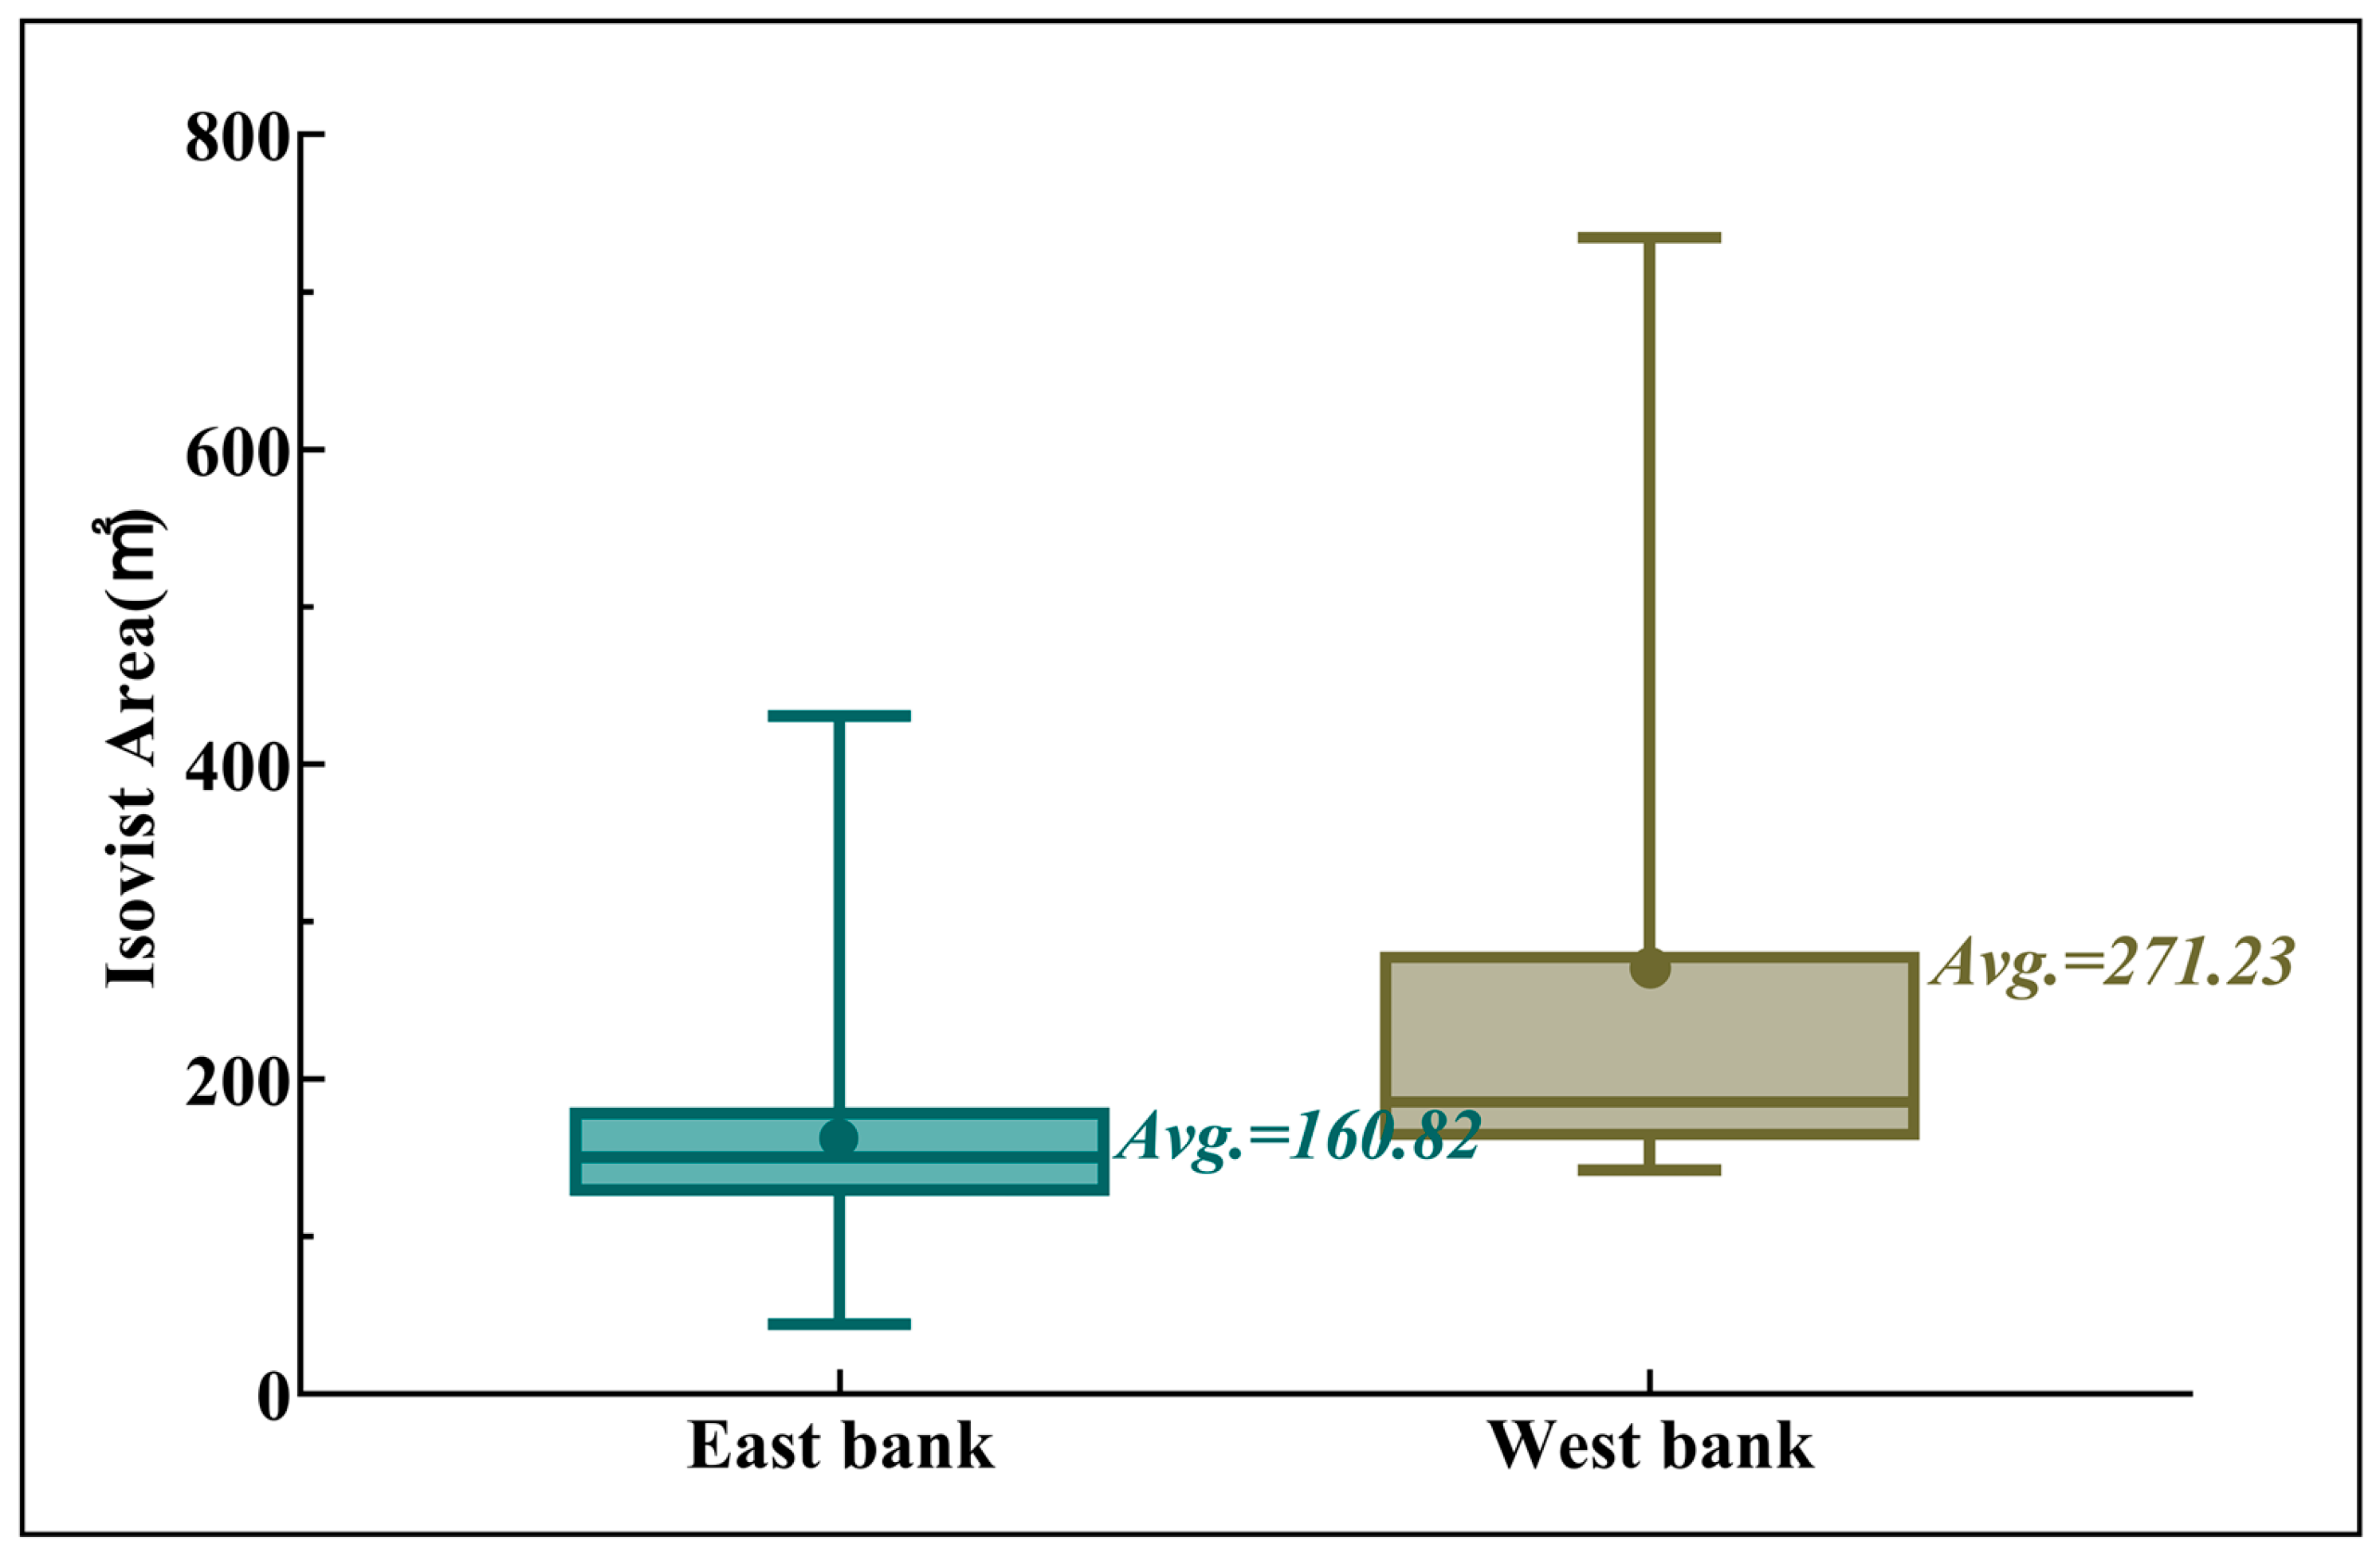
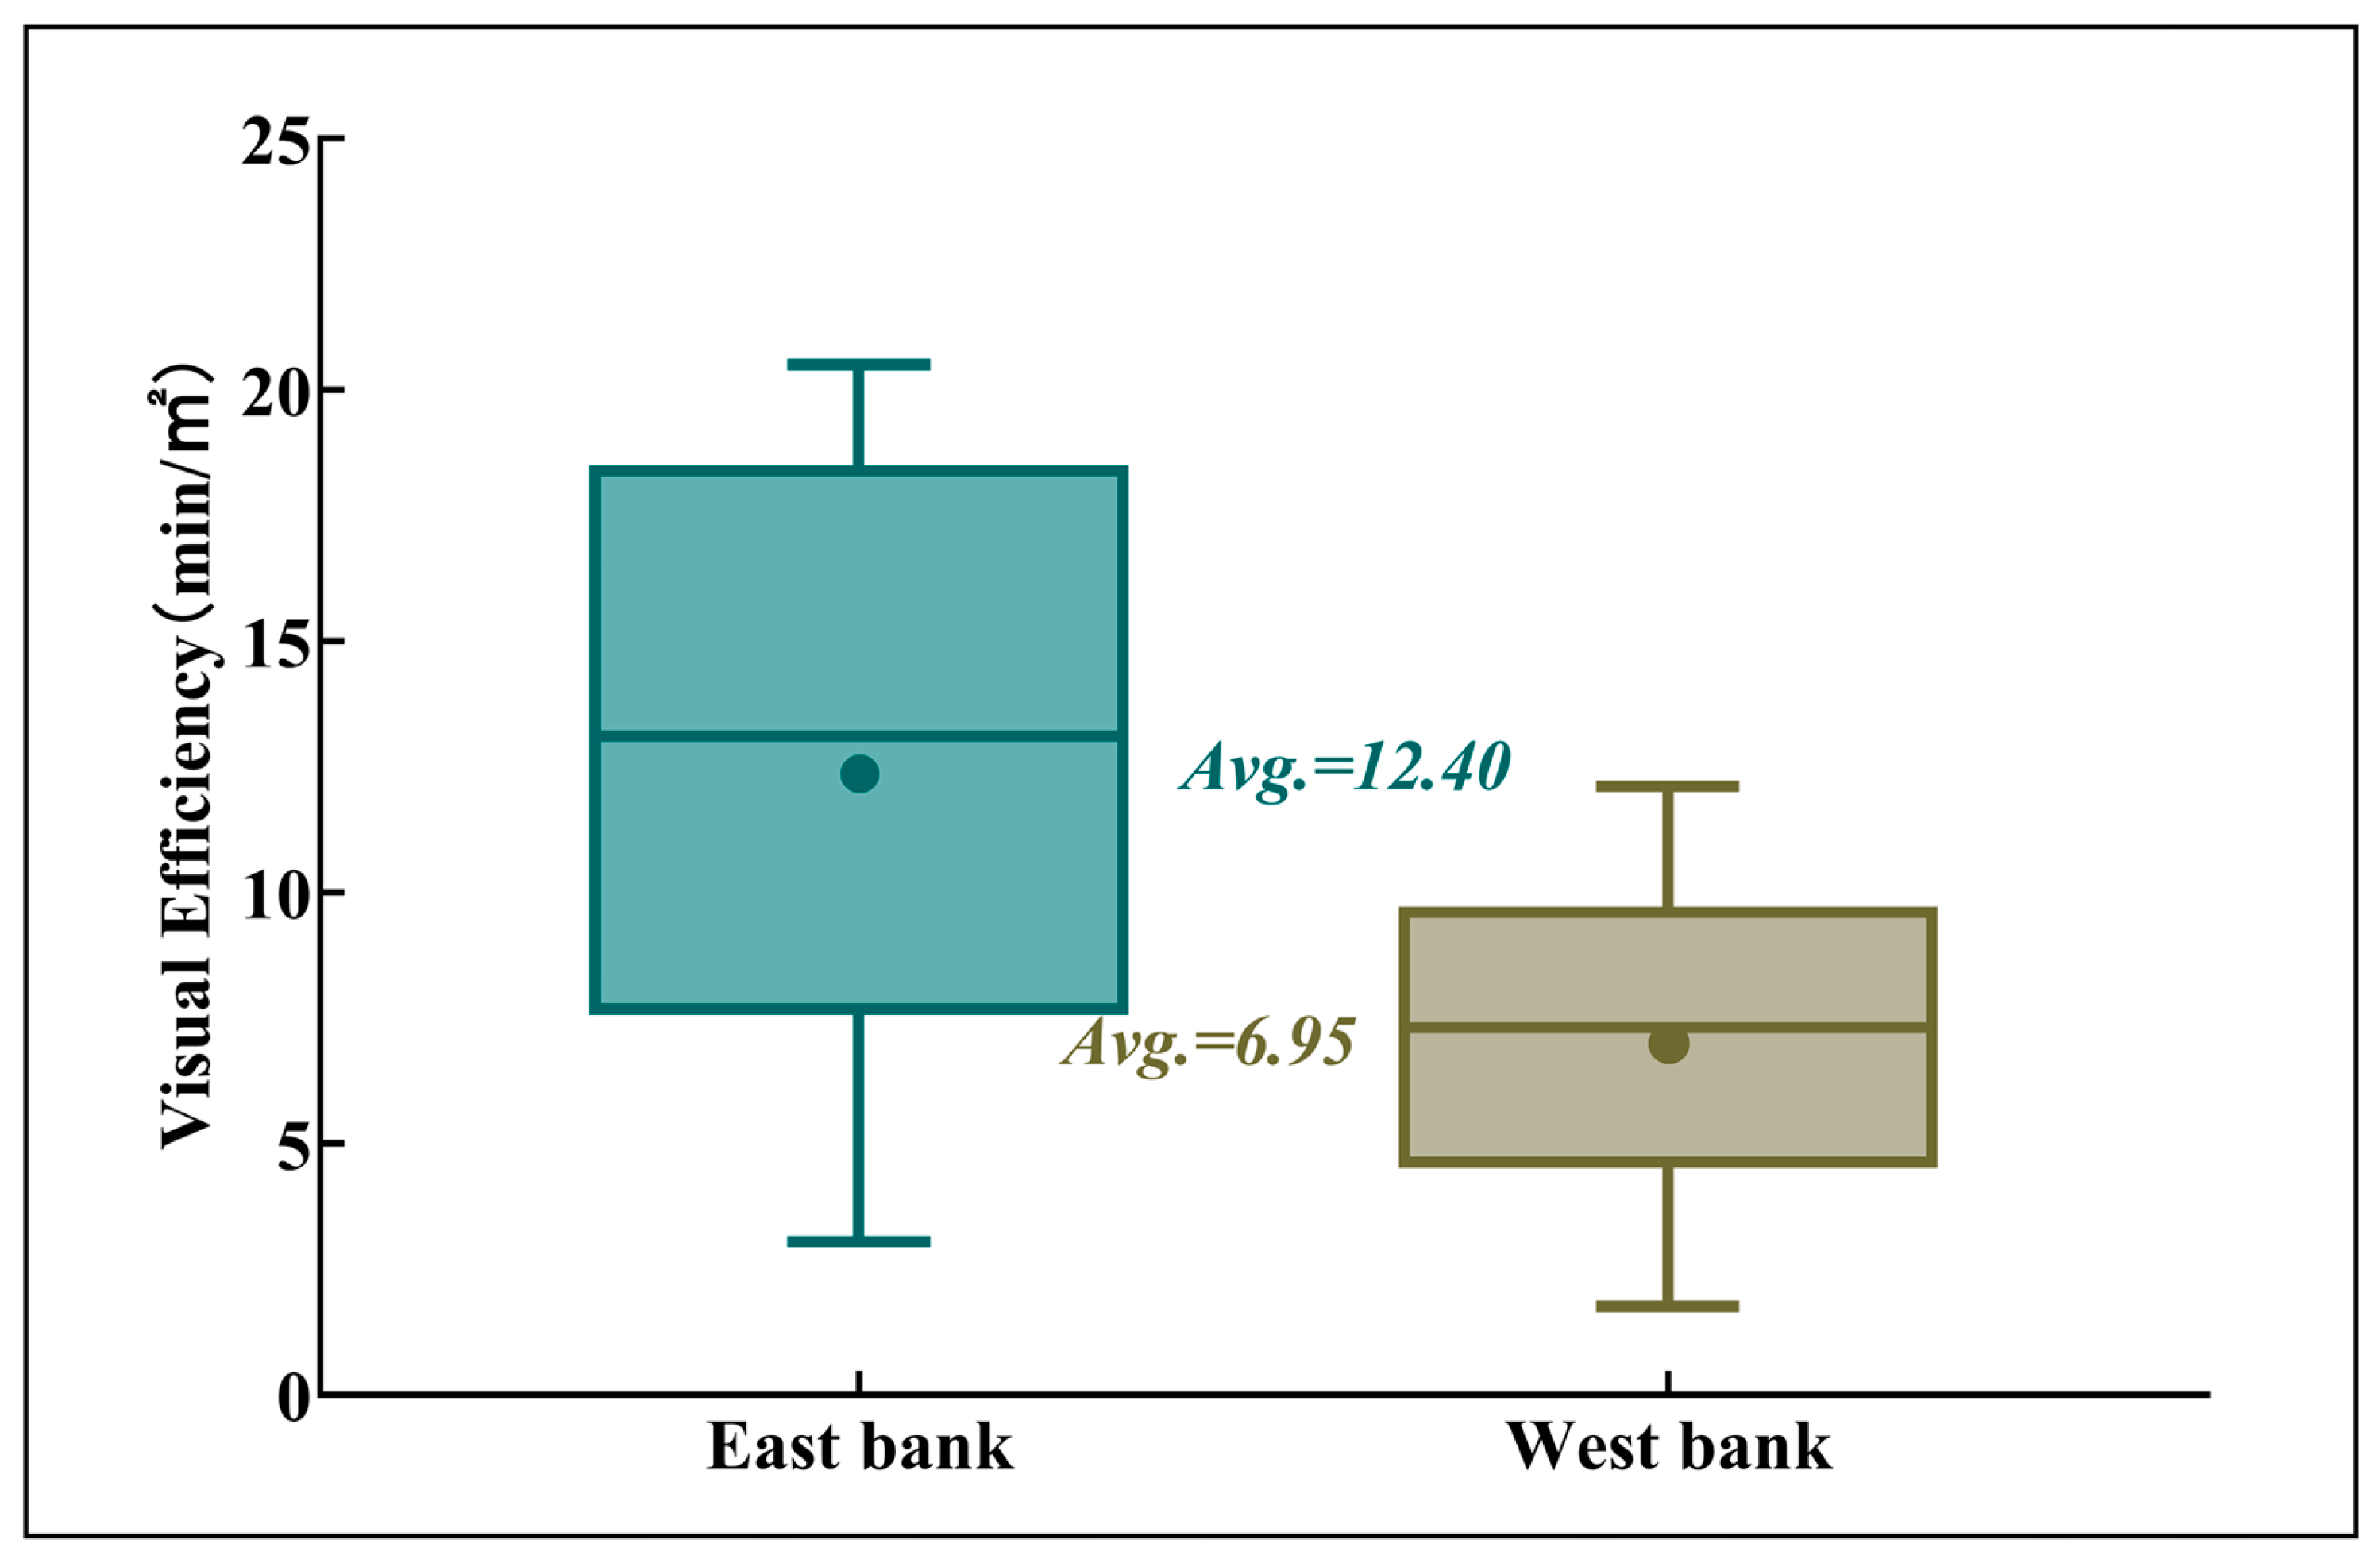
Using the isovist field area as a key indicator of 3D visibility, we grouped and contrasted the 15 east-bank and 15 west-bank buildings to produce the two box plots shown in Figure 17 and Figure 18. Although the renovated west-bank buildings have larger facades (mean Afacade = 68.27 m2) and greater isovist field areas (mean Aiso = 271.23 m2, 68.7 percent higher than the unrenovated east bank’s 160.82 m2), their average VE (6.95 min/m2) is substantially lower than that of the east-bank buildings (12.40 min/m2), revealing a “large but inefficient” pattern (Table 5).
These differences must be interpreted in light of pedestrian flow dynamics: visitor volumes on the west bank are more than twice of those on the east bank post-renewal, directly shaping the allocation of visual resources in this meso-scale waterfront environment. The west bank’s open spaces and dense network of landscape nodes objectively generate “passive visual exposure” for east-bank facades—when visitors linger on the west bank, their lines of sight naturally extend to the opposite shore, granting east-bank buildings substantial Visual Exposure Time despite their unaltered facades. Further analysis underscores the spatial advantages of a compact, small-scale facade layout. East-bank buildings, with smaller facades (mean Afacade = 45.89 m2) and moderate isovist field areas (mean Aiso = 160.82 m2), achieve more balanced visual resource distribution. For example, Building E8, with an Aiso of 184.94 m2, achieves a VE of 18.49 min/m2, demonstrating the effectiveness of a densely arranged, small-scale facade for focusing visitor attention.
Accordingly, design strategies should transcend individual building optimization and instead pursue holistic coordination of pedestrian flows and spatial configurations. On the east bank, accelerating the renewal of waterfront public spaces—while retaining the visual advantages of small-scale, dense building forms—will boost vitality. Adding pause points (e.g., viewing platforms, seating) and optimizing sight corridors can actively attract west-bank visitors across the river. On the west bank, overly large facades (e.g., Building W8, with a height exceeding 16 m and an Aiso above 400 m2) suffer from diluted visual appeal, resulting in a low VE of 3.05 min/m2. This finding suggests that post-renewal site and facade planning on the west bank should emphasize efficiency enhancement, incorporating dynamic elements (lighting layout, interactive art) to strengthen visual anchoring and convert passive crossings into active visual engagement. Such bidirectional activation is poised to establish a positive feedback loop: increased east-bank visitation will boost local VE values and, via cross-river visual corridors, further invigorate west-bank facades.

5.2. Comparisons with Other Methods and Academic Contributions

In large-scale urban studies, particularly those focusing on expansive urban parks, observational methods such as SOPARC are often combined with KDE analysis to generate heatmaps that reflect crowd behavior and urban spatial vitality [64]. These methods have been validated to effectively capture trends in crowd aggregation and dispersion. However, they fall short in providing granular insights into crowd behavior patterns, especially activities related to human health and wellbeing. Specifically, when it comes to visual aspects of crowd behavior, building visual exposure is often not directly reflected in trajectory heatmaps. For instance, our study found that visitors maintaining a certain distance from a building (in our case, visitors on the opposite riverbank) provided more visual attention to the building, which was not captured in the trajectory heatmap.
For meso- and micro-scale urban environments, survey questionnaires and on-site observations are commonly employed experimental methods. However, these methods face significant challenges due to high labor costs and the subjectivity inherent in manual labeling, making them difficult to scale. Additionally, virtual reality (VR)-based eye-tracking technologies can capture visual information in simulated urban environments, particularly adept at processing users’ visual attention [65]. Nevertheless, these methods have limitations, including substantial workload and the fact that experimental results are obtained in virtual environments, which may not fully represent real physical settings [66]. In contrast, our study utilized real-world data collected through video recordings, employing object detection methods that significantly reduced manual labeling efforts. Conducting the research in actual environments enhances the credibility and applicability of the findings.
These observations underscore the need for advanced methodologies that bridge the gap between large-scale spatial analyses and detailed behavioral insights, particularly concerning visual exposure and its impact on crowd behavior and wellbeing. Thus, the primary contributions of this study can be summarized as follows.
First, regarding methodology for crowd behavior research, this study reduces the labor intensity of traditional on-site observations by collecting pedestrian behavior data through video recordings. Object detection and multi-object tracking techniques were applied to drone footage, significantly reducing manual processing and enabling scalable spatial behavior analysis.
Second, in terms of experimental tools, a 3D isovist analysis tool was developed within the Rhino Grasshopper environment, extending traditional ray-casting methods to account for building heights and terrain elevation differences. Empirical evidence demonstrates that 3D isovists more accurately capture urban spatial characteristics, particularly in areas with complex topography [67].
Third, regarding practical application, this study focuses on small-scale, incremental renewal projects within Chinese urban contexts. The proposed methodology can be directly employed in design-scenario simulations to support generative architectural design, scheme optimization, and design decision-making. It is especially suitable for architectural design processes driven by a form–performance–feedback loop. Based on simulation analyses of specific cases, this study proposes design guidelines with applicability to meso-scale waterfront spaces.

5.3. Limitations

This study has several methodological limitations. First, it is highly site-specific, focusing exclusively on the Xiaoqinhuai River; future research should examine a broader range of waterfront typologies (e.g., harbors versus canals) to assess the generalizability of the findings. Second, although crowd behaviors were coded in strict accordance with SOPARC and MOHAWk protocols, the manual coding process inevitably introduces a degree of subjectivity. Subsequent studies could therefore explore the use of automated techniques, such as age–gender recognition and pose estimation, to reduce reliance on manual annotation. Third, the aerial footage employed in this study was captured from a fixed perspective with a consistent background, and the pedestrian detection model was trained on a relatively small dataset (1800 images). For more complex urban scenarios, expanding the dataset and incorporating more diverse conditions would strengthen the robustness and external validity of the results. Finally, although the physical environment of the waterfront public space was systematically modeled, our field observations began in February, when canopy closure was relatively low and its occlusion effect on visibility analysis was therefore minimal. Future work should incorporate more detailed arboreal survey data—particularly for summer periods with high canopy closure—to improve the ecological and seasonal accuracy of the isovist analysis.
In terms of results, although the regression analysis (Section 4.3.4) suggests that visual accessibility drives the behavioral indicator (VET) and the hypothesis proposed in this study assumes independence from other causality, it is still important to acknowledge the potential bidirectionality between these variables (e.g., aesthetic preferences influencing visual attention). For instance, outliers such as Building W7 (see Figure 16) highlight this issue—iconic waterfront buildings may be primarily influenced by unmeasured social or design-related variables. Future research could pursue more in-depth longitudinal studies (e.g., strictly distinguishing between pre- and post-renovation conditions) to further clarify the causal relationships among different factors.

5.4. Further Work and Potential Applications in Related Studies

The proposed framework has two principal avenues for future application.
First, it supports a visual evaluation system for spatial renewal schemes. Drawing on visual accessibility theory, this study established a comparative analysis paradigm between the renovated west bank and the unrenewed east bank. The agent-based pedestrian simulation model was rigorously calibrated against field-observed video data to ensure simulation validity. This approach can be extended to preliminary assessment of design proposals—for example, multiple renewal scenarios for the east bank could be simulated by ABM to predict changes in spatial vitality, providing quantitative guidance for design optimization [68].
Second, it paves the way for smarter behavioral observation. While drone-based object detection and multi-object tracking have automated much of the video parsing, fixed-camera footage still relies on manual annotation. Future work could incorporate deep-learning-based human behavior recognition to directly evaluate crowd PA levels and wellbeing indicators. Such advancements will necessitate higher-precision video acquisition protocols and refined model-training strategies.

6. Conclusions

This study establishes an integrated framework that combines agent-based modeling (ABM) with three-dimensional (3D) isovist analysis through multi-source behavioral data acquisition and computational simulation techniques in order to quantify the visual accessibility of waterfront building facades and their influence on crowd behavior. The research responds to the call by the International Union of Architects (UIA) to “promote health and wellbeing in buildings and urban spaces through data-driven design approaches” by encoding visitor wellbeing behaviors [69]. The data-driven and rule-based coupled ABM approach provides a multifaceted contribution to meso-scale urban design methodologies.
The study yields the following key conclusions.
First, in terms of crowd distribution patterns, the west bank of the river is more attractive than the east bank, with visitor numbers in waterfront spaces exhibiting regular fluctuations, particularly pronounced during weekends and afternoon periods (see Section 4.1.3, Figure 9). This is attributable to urban regeneration: on the one hand, facade renovation, infrastructure upgrades, and the creation of additional riverside public spaces have substantially improved the quality of the physical environment; on the other hand, the west bank’s functional transformation from a residential neighborhood to a commercial district (with hotels, exhibition halls, restaurants, etc., see Section 3.2, Figure 3) has drawn more visitors. By contrast, the east bank is characterized by lower-quality building facades, a lack of public riverside spaces, and a predominance of single-use residential housing with limited public accessibility. These findings reflect the effectiveness of urban regeneration in enhancing the vibrancy of public spaces in historic districts.
Second, with regard to visual accessibility, a significant positive correlation exists between facade Visual Exposure Time and 3D isovist parameters. Pedestrian flow across the river is identified as a key factor shaping visual attention. This study confirms the effectiveness of incorporating vertical-direction isovist field analysis in linear waterfront environments.
Finally, concerning generalizable applications, this study provides design guidelines that can be extended to other meso-scale waterfront typologies (e.g., riversides and lakeshores) with comparable spatial and visual characteristics. In such linear waterfronts, compact arrangements of small-scale buildings can further enhance visitors’ visual focus (see Section 5.1, where east-bank buildings exhibit higher visual efficiency). For terraced or multi-level waterfronts, it is recommended to strategically leverage elevation changes and integrate cross-river sightlines at intervals of ≤45 m—corresponding to the maximum effective viewing distance—to strengthen visual continuity. Given the strong site specificity of this case study, further empirical testing is required for larger-scale waterfront typologies.
These findings validate the mechanism by which visual accessibility influences visitor behavior. The integrated “behavior simulation–isovist analysis” framework developed in this study provides a viable methodological approach for environmental behavior research and offers a quantifiable, reproducible technical paradigm for the refined redevelopment of waterfront spaces.

Author Contributions

Conceptualization, T.L., X.H., and J.W.; methodology, T.L., X.H., and J.W.; software, T.L.; validation, X.H., T.L., and Y.Z.; formal analysis, T.L.; investigation, X.H. and T.L.; resources, J.W. and X.H.; data curation, T.L.; writing—original draft preparation, T.L. and X.H.; writing—review and editing, X.H., Y.Z., and J.W.; visualization, T.L. and X.H.; supervision, X.H., Y.Z., and J.W.; project administration, X.H. and J.W.; funding acquisition, X.H., Y.Z., and J.W. All authors have read and agreed to the published version of the manuscript.

Funding

This research is supported by the National Natural Science Foundation of China (52208039) and the Joint Strategic and Advisory Project of the Chinese Academy of Engineering and the National Natural Science Foundation of China (2024-ZCQ-12).

Data Availability Statement

The original contributions presented in this study are included in the article. Further inquiries can be directed to the corresponding author.

Conflicts of Interest

The authors declare no conflicts of interest.

References

  1. Li, Y.; Wang, Z.; Liang, W.; Yang, F.; Wu, G. Green Renovation of Existing Public Buildings in China: A Synergy Mechanism of State-Owned Enterprises Based on Evolutionary Game Theory. J. Clean. Prod. 2024, 434, 140454. [Google Scholar] [CrossRef]
  2. Mu, B.; Mayer, A.L.; He, R.; Tian, G. Land Use Dynamics and Policy Implications in Central China: A Case Study of Zhengzhou. Cities 2016, 58, 39–49. [Google Scholar] [CrossRef]
  3. Hao, X.; Wei, W. The Application of GIS to Study Urban Waterfront District Planning—A Case Study of Landscape Planning in Guyang Lake. In Proceedings of the 2013 Fifth International Conference on Measuring Technology and Mechatronics Automation, Hong Kong, China, 16–17 January 2013; IEEE: Hong Kong, China, 2013; pp. 1132–1134. [Google Scholar]
  4. Liu, S.; Lai, S.-Q.; Liu, C.; Jiang, L. What Influenced the Vitality of the Waterfront Open Space? A Case Study of Huangpu River in Shanghai, China. Cities 2021, 114, 103197. [Google Scholar] [CrossRef]
  5. Niu, Y.; Mi, X.; Wang, Z. Vitality Evaluation of the Waterfront Space in the Ancient City of Suzhou. Front. Archit. Res. 2021, 10, 729–740. [Google Scholar] [CrossRef]
  6. Rossetti, T.; Lobel, H.; Rocco, V.; Hurtubia, R. Explaining Subjective Perceptions of Public Spaces as a Function of the Built Environment: A Massive Data Approach. Landsc. Urban Plan. 2019, 181, 169–178. [Google Scholar] [CrossRef]
  7. Natapov, A.; Cohen, A.; Dalyot, S. Urban Planning and Design with Points of Interest and Visual Perception. Environ. Plan. B Urban Anal. City Sci. 2024, 51, 641–655. [Google Scholar] [CrossRef]
  8. Benedikt, M.L. To Take Hold of Space: Isovists and Isovist Fields. Environ. Plan. B Plan. Des. 1979, 6, 47–65. [Google Scholar] [CrossRef]
  9. Gibson, J.J. The Ecological Approach to Visual Perception: Classic Edition, 1st ed.; Psychology Press: London, UK, 2014; ISBN 978-1-315-74021-8. [Google Scholar]
  10. Jin, X.; Wang, J. Assessing Linear Urban Landscape from Dynamic Visual Perception Based on Urban Morphology. Front. Archit. Res. 2021, 10, 202–219. [Google Scholar] [CrossRef]
  11. Bundesen, C.; Habekost, T.; Kyllingsbæk, S. A Neural Theory of Visual Attention: Bridging Cognition and Neurophysiology. Psychol. Rev. 2005, 112, 291–328. [Google Scholar] [CrossRef]
  12. Sharifi, A. Resilient Urban Forms: A Macro-Scale Analysis. Cities 2019, 85, 1–14. [Google Scholar] [CrossRef]
  13. Xia, H.; Liu, Z.; Efremochkina, M.; Liu, X.; Lin, C. Study on City Digital Twin Technologies for Sustainable Smart City Design: A Review and Bibliometric Analysis of Geographic Information System and Building Information Modeling Integration. Sustain. Cities Soc. 2022, 84, 104009. [Google Scholar] [CrossRef]
  14. Dijkstra, J.; Timmermans, H. Towards a Multi-Agent Model for Visualizing Simulated User Behavior to Support the Assessment of Design Performance. Autom. Constr. 2002, 11, 135–145. [Google Scholar] [CrossRef]
  15. Moreno-Arjonilla, J.; López-Ruiz, A.; Jiménez-Pérez, J.R.; Callejas-Aguilera, J.E.; Jurado, J.M. Eye-Tracking on Virtual Reality: A Survey. Virtual Real. 2024, 28, 38. [Google Scholar] [CrossRef]
  16. Ai, D.; Wang, H.; Kuang, D.; Zhang, X.; Rao, X. Measuring Pedestrians’ Movement and Building a Visual-Based Attractiveness Map of Public Spaces Using Smartphones. Comput. Environ. Urban Syst. 2024, 108, 102070. [Google Scholar] [CrossRef]
  17. Sharifi, A. Urban Form Resilience: A Meso-Scale Analysis. Cities 2019, 93, 238–252. [Google Scholar] [CrossRef]
  18. McKenzie, T.L.; Cohen, D.A.; Sehgal, A.; Williamson, S.; Golinelli, D. System for Observing Play and Recreation in Communities (SOPARC): Reliability and Feasibility Measures. J. Phys. Act. Health 2006, 3, S208–S222. [Google Scholar] [CrossRef]
  19. Swiezy, N.; Smith, T.; Johnson, C.R.; Bearss, K.; Lecavalier, L.; Drill, R.; Warner, D.; Deng, Y.; Xu, Y.; Dziura, J.; et al. Direct Observation in a Large-Scale Randomized Trial of Parent Training in Children with Autism Spectrum Disorder and Disruptive Behavior. Res. Autism Spectr. Disord. 2021, 89, 101879. [Google Scholar] [CrossRef]
  20. Wang, L.; He, W. Analysis of Community Outdoor Public Spaces Based on Computer Vision Behavior Detection Algorithm. Appl. Sci. 2023, 13, 10922. [Google Scholar] [CrossRef]
  21. Mu, B.; Liu, C.; Mu, T.; Xu, X.; Tian, G.; Zhang, Y.; Kim, G. Spatiotemporal Fluctuations in Urban Park Spatial Vitality Determined by On-Site Observation and Behavior Mapping: A Case Study of Three Parks in Zhengzhou City, China. Urban For. Urban Green. 2021, 64, 127246. [Google Scholar] [CrossRef]
  22. Geng, H.; Lin, T.; Van Bodegom, P.M.; Hu, M.; Zheng, Y.; Jia, Z.; Zhang, J.; Guo, X.; Chen, Y.; Lin, M.; et al. Forest or Grassland? A Quantitative Analysis of Urban Residents’ Green Exposure Preference by Using Multi-Temporal Mobile Signal Data. Urban For. Urban Green. 2025, 108, 128826. [Google Scholar] [CrossRef]
  23. Feng, Y.; Duives, D.; Daamen, W.; Hoogendoorn, S. Data Collection Methods for Studying Pedestrian Behaviour: A Systematic Review. Build. Environ. 2021, 187, 107329. [Google Scholar] [CrossRef]
  24. Saint-Maurice, P.F.; Welk, G.; Ihmels, M.A.; Krapfl, J.R. Validation of the SOPLAY Direct Observation Tool with an Accelerometry-Based Physical Activity Monitor. J. Phys. Act. Health 2011, 8, 1108–1116. [Google Scholar] [CrossRef]
  25. Benton, J.S.; Anderson, J.; Pulis, M.; Cotterill, S.; Hunter, R.F.; French, D.P. Method for Observing pHysical Activity and Wellbeing (MOHAWk): Validation of an Observation Tool to Assess Physical Activity and Other Wellbeing Behaviours in Urban Spaces. Cities Health 2022, 6, 818–832. [Google Scholar] [CrossRef]
  26. Poppe, L.; Van Dyck, D.; De Keyser, E.; Van Puyvelde, A.; Veitch, J.; Deforche, B. The Impact of Renewal of an Urban Park in Belgium on Park Use, Park-Based Physical Activity, and Social Interaction: A Natural Experiment. Cities 2023, 140, 104428. [Google Scholar] [CrossRef]
  27. Wiener, J.M.; Franz, G. Isovists as a Means to Predict Spatial Experience and Behavior. In Proceedings of the International Conference on Spatial Cognition, Frauenchiemsee, Germany, 11–13 October 2004; Springer: Berlin/Heidelberg, Germany, 2004; pp. 42–57. [Google Scholar]
  28. Sengke, M.M.C.; Atmodiwirjo, P. Using Isovist Application to Explore Visibility Area of Hospital Inpatient Ward. In Proceedings of the IOP Conference Series: Materials Science and Engineering, Kuala Lumpur, Malaysia, 8–9 August 2017; IOP Publishing: Bristol, UK, 2017; Volume 185, p. 012008. [Google Scholar]
  29. Kim, G.; Kim, A.; Kim, Y. A New 3D Space Syntax Metric Based on 3D Isovist Capture in Urban Space Using Remote Sensing Technology. Comput. Environ. Urban Syst. 2019, 74, 74–87. [Google Scholar] [CrossRef]
  30. Kaplan, S. A Model of Person-Environment Compatibility. Environ. Behav. 1983, 15, 311–332. [Google Scholar] [CrossRef]
  31. Gehl, J. Cities for People; Island Press: Washington, DC, USA, 2013; ISBN 1-59726-984-0. [Google Scholar]
  32. Lynch, K. The Image of the City; MIT Press: Cambridge, MA, USA, 1964; ISBN 0-262-62001-4. [Google Scholar]
  33. Turner, A.; Doxa, M.; O’sullivan, D.; Penn, A. From Isovists to Visibility Graphs: A Methodology for the Analysis of Architectural Space. Environ. Plan. B Plan. Des. 2001, 28, 103–121. [Google Scholar] [CrossRef]
  34. Zhang, H.; Andrade, B.; Wang, X.; Aburabee, I.; Yuan, S. A Study of Spatial Cognition in the Rural Heritage Based on VR 3D Eye-Tracking Experiments. Herit. Sci. 2024, 12, 141. [Google Scholar] [CrossRef]
  35. Nenci, A.M.; Troffa, R. Space Syntax in a Wayfinding Task. Cogn. Process. 2006, 7, 70–71. [Google Scholar] [CrossRef]
  36. Penn, A. Space Syntax and Spatial Cognition: Or Why the Axial Line? Environ. Behav. 2003, 35, 30–65. [Google Scholar] [CrossRef]
  37. Gath-Morad, M.; Thrash, T.; Schicker, J.; Hölscher, C.; Helbing, D.; Aguilar Melgar, L.E. Visibility Matters during Wayfinding in the Vertical. Sci. Rep. 2021, 11, 18980. [Google Scholar] [CrossRef]
  38. Snopková, D.; De Cock, L.; Juřík, V.; Kvarda, O.; Tancoš, M.; Herman, L.; Kubíček, P. Isovists Compactness and Stairs as Predictors of Evacuation Route Choice. Sci. Rep. 2023, 13, 2970. [Google Scholar] [CrossRef]
  39. Meilinger, T.; Franz, G.; Bülthoff, H.H. From Isovists via Mental Representations to Behaviour: First Steps toward Closing the Causal Chain. Environ. Plan. B Plan. Des. 2012, 39, 48–62. [Google Scholar] [CrossRef]
  40. De Cock, L.; Ooms, K.; Van de Weghe, N.; Vanhaeren, N.; Pauwels, P.; De Maeyer, P. Identifying What Constitutes Complexity Perception of Decision Points during Indoor Route Guidance. Int. J. Geogr. Inf. Sci. 2021, 35, 1232–1250. [Google Scholar] [CrossRef]
  41. Krukar, J.; Manivannan, C.; Bhatt, M.; Schultz, C. Embodied 3D Isovists: A Method to Model the Visual Perception of Space. Environ. Plan. B Urban Anal. City Sci. 2021, 48, 2307–2325. [Google Scholar] [CrossRef]
  42. Li, C. Visual Typology: A Numerical Taxonomy of Urban Spaces Using Isovist Analysis. In Proceedings of the The International Conference on Computational Design and Robotic Fabrication, Shanghai, China, 6–7 July 2024; Springer: Berlin/Heidelberg, Germany, 2024; pp. 525–535. [Google Scholar]
  43. Benedikt, M.L.; McElhinney, S. Isovists and the Metrics of Architectural Space. In Proceedings of the 107th ACSA Annual Meeting, Pittsburgh, PA, USA, 28–30 March 2019; Association of Collegiate Schools of Architecture: Pittsburgh, PA, USA, 2019; pp. 1–10. [Google Scholar]
  44. Xie, Q.; Zhang, L. Entropy-Based Guidance and Predictive Modelling of Pedestrians’ Visual Attention in Urban Environment. Build. Simul. 2024, 17, 1659–1674. [Google Scholar] [CrossRef]
  45. Jalalian, A.; Chalup, S.K.; Ostwald, M.J. Architectural Evaluation of Simulated Pedestrian Spatial Behaviour. Archit. Sci. Rev. 2011, 54, 132–140. [Google Scholar] [CrossRef]
  46. Morrow, E. Efficiently Using Micro-Simulation to Inform Facility Design–A Case Study in Managing Complexity. In Pedestrian and Evacuation Dynamics; Springer: Berlin/Heidelberg, Germany, 2011; pp. 855–863. [Google Scholar]
  47. Morrow, E.; Mackenzie, I.; Nema, G.; Park, D. Evaluating Three Dimensional Vision Fields in Pedestrian Micro-Simulations. Transp. Res. Procedia 2014, 2, 436–441. [Google Scholar] [CrossRef]
  48. Chen, T.; Lang, W.; Li, X. Exploring the Impact of Urban Green Space on Residents’ Health in Guangzhou, China. J. Urban Plan. Dev. 2020, 146, 05019022. [Google Scholar] [CrossRef]
  49. Zhou, C.; Xie, M.; Zhao, J.; An, Y. What Affects the Use Flexibility of Pocket Parks? Evidence from Nanjing, China. Land 2022, 11, 1419. [Google Scholar] [CrossRef]
  50. Benton, J.S.; Evans, J.; Anderson, J.; French, D.P. Using Video Cameras to Assess Physical Activity and Other Well-Being Behaviors in Urban Environments: Feasibility, Reliability, and Participant Reactivity Studies. JMIR Public Health Surveill. 2024, 10, e66049. [Google Scholar] [CrossRef]
  51. Sohan, M.; Sai Ram, T.; Rami Reddy, C.V. A Review on Yolov8 and Its Advancements. In Proceedings of the International Conference on Data Intelligence and Cognitive Informatics, Tirunelveli, India, 18–20 November 2024; Springer: Berlin/Heidelberg, Germany, 2024; pp. 529–545. [Google Scholar]
  52. Wojke, N.; Bewley, A.; Paulus, D. Simple Online and Realtime Tracking with a Deep Association Metric. In Proceedings of the 2017 IEEE International Conference on Image Processing (ICIP), Beijing, China, 17–20 September 2017; IEEE: New York, NY, USA, 2017; pp. 3645–3649. [Google Scholar]
  53. He, K.; Zhang, X.; Ren, S.; Sun, J. Spatial Pyramid Pooling in Deep Convolutional Networks for Visual Recognition. IEEE Trans. Pattern Anal. Mach. Intell. 2015, 37, 1904–1916. [Google Scholar] [CrossRef] [PubMed]
  54. Bewley, A.; Ge, Z.; Ott, L.; Ramos, F.; Upcroft, B. Simple Online and Realtime Tracking. In Proceedings of the 2016 IEEE International Conference on Image Processing (ICIP), Phoenix, AZ, USA, 25–28 September 2016; IEEE: New York, NY, USA, 2016; pp. 3464–3468. [Google Scholar]
  55. Kinsey, M.; Walker, G.; Swailes, N.; Butterworth, N. The Verification and Validation of MassMotion for Evacuation Modelling; Ove Arup & Partners Ltd.: London, UK, 2015. [Google Scholar]
  56. Massmotion User Manual. Available online: https://www.oasys-software.com/wp-content/uploads/2019/06/MassMotion-10.0-Help-Guide.pdf (accessed on 26 August 2025).
  57. Kremer, M.; Haworth, B.; Kapadia, M.; Faloutsos, P. Watch Out! Modelling Pedestrians with Egocentric Distractions. In Proceedings of the Motion, Interaction and Games, Virtual Event, SC, USA, 16–18 October 2020; ACM: New York, NY, USA, 2020; pp. 1–10. [Google Scholar]
  58. Kotseruba, I.; Rasouli, A. Intend-Wait-Perceive-Cross: Exploring the Effects of Perceptual Limitations on Pedestrian Decision-Making. In Proceedings of the 2023 IEEE Intelligent Vehicles Symposium (IV), Anchorage, AK, USA, 4–7 June 2023; IEEE: New York, NY, USA, 2023; pp. 1–6. [Google Scholar]
  59. Geisler, W.S. Visual Perception and the Statistical Properties of Natural Scenes. Annu. Rev. Psychol. 2008, 59, 167–192. [Google Scholar] [CrossRef] [PubMed]
  60. Norman, J.F.; Adkins, O.C.; Dowell, C.J.; Shain, L.M.; Hoyng, S.C.; Kinnard, J.D. The Visual Perception of Distance Ratios Outdoors. Atten. Percept. Psychophys. 2017, 79, 1195–1203. [Google Scholar] [CrossRef] [PubMed]
  61. Davis, L.S.; Benedikt, M.L. Computational Models of Space: Isovists and Isovist Fields. Comput. Graph. Image Process. 1979, 11, 49–72. [Google Scholar] [CrossRef]
  62. Fruin, J.J. Pedestrian Planning and Design; Metropolitan Association of Urban Designers and Environmental Planners, Inc.: New York, NY, USA, 1971. [Google Scholar]
  63. Filomena, G.; Verstegen, J.A.; Manley, E. A Computational Approach to ‘The Image of the City’. Cities 2019, 89, 14–25. [Google Scholar] [CrossRef]
  64. Wang, X.; Tang, P.; He, Y.; Woolley, H.; Hu, X.; Yang, L.; Luo, J. The Correlation between Children’s Outdoor Activities and Community Space Characteristics: A Case Study Utilizing SOPARC and KDE Methods in Chengdu, China. Cities 2024, 150, 105002. [Google Scholar] [CrossRef]
  65. Yuan, S.; Browning, M.H.E.M.; Li, F.; Duchowski, A.; Hallo, J.; Nicolette, M. Can Visual Attention Help Uncover the Effects of Visitor Density on Urban Park Experience? An Eye-Tracking and Virtual Reality Study. J. Environ. Psychol. 2025, 106, 102631. [Google Scholar] [CrossRef]
  66. Niu, S.; Pan, W.; Zhao, Y. A Virtual Reality Integrated Design Approach to Improving Occupancy Information Integrity for Closing the Building Energy Performance Gap. Sustain. Cities Soc. 2016, 27, 275–286. [Google Scholar] [CrossRef]
  67. Yang, P.P.-J.; Putra, S.Y.; Li, W. Viewsphere: A GIS-Based 3D Visibility Analysis for Urban Design Evaluation. Environ. Plan. B Plan. Des. 2007, 34, 971–992. [Google Scholar] [CrossRef]
  68. Briscoe, D. Beyond BIM: Architecture Information Modeling; Routledge: London, UK, 2015; ISBN 1-315-76899-2. [Google Scholar]
  69. 2023 UIA Guidebook for the 2030 Agenda—International Union of Architects. Available online: https://www.uia-architectes.org/en/resource/2023-uia-guidebook-for-the-2030-agenda/ (accessed on 26 August 2025).
Figure 1. The workflow of this study.
Buildings 15 03247 g001
Figure 2. Location of Xiaoqinhuai River Historic District in Yangzhou City, China.
Buildings 15 03247 g002
Figure 3. Thirty representative buildings labeled within the waterfront urban environment.
Buildings 15 03247 g003
Figure 4. Observation tools. (a) Drone videography schematic. (b) Photograph of a mounted camera.
Buildings 15 03247 g004
Figure 5. Observation sites.
Buildings 15 03247 g005
Figure 6. Schematic diagram of visual analysis. As shown in the figure, the yellow cone-shaped area projected onto the facade illustrates the actual 3D vision field from the pedestrian’s perspective. The red-shaded area on the ground indicates the portion of the 3D isovist field counted in our analysis.
Buildings 15 03247 g006
Figure 7. Relevant parameter variations.
Buildings 15 03247 g007
Figure 8. Site elements and main trajectories.
Buildings 15 03247 g008
Figure 9. Average visitors per observation moment on weekdays and on the weekend. Error bars indicate standard deviation.
Buildings 15 03247 g009
Figure 10. Total visitors engaged in physical activity and other wellbeing behaviors.
Buildings 15 03247 g010
Figure 11. Total visitors engaged in TN behaviors per observation moment. Key observation periods (9:30 a.m.; 4:00 p.m.) at three sites on weekdays vs. weekends. Error bars indicate standard deviation.
Buildings 15 03247 g011
Figure 12. (a) Simulated pedestrian trajectories. (b) Maximum Density Map.
Buildings 15 03247 g012
Figure 13. “Vision Exposure Time” of 30 waterfront building facades.
Buildings 15 03247 g013
Figure 14. Heatmap of 3D isovist field for 30 labeled building facades.
Buildings 15 03247 g014
Figure 15. Scatter plot of visual indicators for 30 building facades.
Buildings 15 03247 g015
Figure 16. Residual plot of visual indicators for 30 building facades. The red markers represent several points with excessively large positive or negative residuals.
Buildings 15 03247 g016
Figure 17. Box plot of Aiso. Error bars indicate standard deviation.
Buildings 15 03247 g017
Figure 18. Box plot of VE. Error bars indicate standard deviation.
Buildings 15 03247 g018
Table 1. Visitor statistics: main trajectories.
The East BankThe West Bank
Main Trajectories d–ce–ca–B–b1a–B–b2a–B–a
Total waterfront
public space visitors
26 February24301083145
01 March60521333318
12 March293483246
15 March53521755225
26 March39521302913
29 March4559127416
Total N (%)250 (16)279 (17)756 (47)210 (13)113 (7)
Mean (SD) duration of passage/min3.51 (1.74)3.73 (1.91)4.43 (2.12)4.36 (2.13)5.44 (1.97)
Table 2. Visitor statistics: atypical behaviors observed.
Visitors’ Public Restroom UseVisitors’
E-Bike Use
Visitors in Square CirculationVisitors Using
Off-Designated Path
Total N (% of visitors on west bank)142 (13)58 (5)109 (10)126 (12)
Mean (SD) duration of passage/min2.76 (0.92)1.46 (2.16)1.97 (0.97)5.13 (2.13)
Table 3. Descriptive statistics of the observed waterfront public visitors at three sites.
Site ASite BSite C
Total N (%)Mean (SD) per Observation MomentTotal N (%)Mean (SD) per Observation MomentTotal N (%)Mean (SD) per Observation Moment
Total waterfront public space visitors138638.5 (16.70)120833.56 (17.52)117432.61 (19.75)
Waterfront public use
by age groups
Infants9 (1)0.25 (0.49)12 (1)0.33 (0.56)8 (1)0.22 (0.42)
Children149 (11)4.14 (2.68)109 (9)3.03 (2.67)106 (9)2.94 (2.54)
Teens33 (2)0.92 (1.72)48 (4)1.33 (1.89)70 (6)1.94 (2.91)
Adults973 (70)27.03 (11.62)834 (69)23.17 (11.39)801 (68)22.25 (11.06)
Older adults222 (16)6.17 (2.82)205 (17)5.69 (3.18)189 (16)5.25 (2.88)
Waterfront public space use by sex
Women721 (52)20.03 (10.61)592 (49)16.44 (8.61)591 (50)16.42 (8.69)
Men665 (48)18.47 (8.63)616 (51)17.11 (7.63)583 (50)16.19 (7.86)
Activities
Sedentary/standing499 (36)13.86 (8.59)361 (30)10.03 (6.48)305 (26)8.47 (5.08)
Walking860 (62)23.89 (9.39)799 (66)22.19 (11.13)822 (70)22.83 (11.68)
Vigorous PA27 (2)0.75 (1.44)48 (4)1.33 (1.87)47 (4)1.31 (1.97)
Visitors taking notice of the environment444 (32)12.33 (8.06)230 (19)6.39 (3.29)235 (20)6.53 (4.42)
Visitors displaying social interaction1012 (73)28.11 (15.09)737 (61)20.47 (14.00)822 (70)22.83 (17.13)
Table 4. Agent behavior pattern configuration for different scenarios.
Mean
Walking Speed
Concrete Behaviors
Observed
Rate of
Occurrence
If Wait, Mean
Waiting Time (SD)
Agent passing through Site A1.17 m/sTN32%0.92 min (0.45)
Agent passing through Site B1.17 m/sTN19%0.58 min (0.25)
Taking a seat6%4.04 min (1.40)
Agent passing through Site C1.17 m/sTN (towards river)13%0.28 min (0.13)
TN (towards pocket park)7%0.75 min (0.39)
Agent passing through Circulation Portal1.17 m/sSpread out randomly
around the square
100%1.97 min (0.97)
Agent passing through public toilet1.17 m/sUsing public restroom13%2.76 min (0.92)
Agent using e-bike2.95 m/sNA5%NA
Table 5. Statistical indicators of 30 labeled buildings.
Building
Facade ID
Afacade
(m2)
Wfacade
(m)
Hfacade
(m)
VE
(min/m2)
VET
(min)
Aiso
(m2)
Piso
(m)
E1160.5519.148.009.881585.43430.52730.83
E234.708.903.905.75199.53181.82368.96
E317.734.174.257.83138.83143.15444.77
E441.337.666.6517.25712.94150.32561.30
E521.603.935.5018.76405.22150.58542.87
E66.422.502.5719.11122.6944.45157.26
E711.713.303.5520.50240.0666.71270.67
E852.378.706.7518.50968.85184.94598.67
E925.596.224.1116.71427.61134.78404.29
E1042.778.806.0013.11560.71181.08460.24
E1148.766.197.8713.91678.25146.28435.85
E1256.607.957.127.57428.46197.67370.68
E1339.2410.703.953.05119.68171.05302.23
E1448.006.537.355.70273.60103.21334.17
E1580.926.4012.658.34674.87125.71407.20
W149.6417.102.909.72482.50185.65328.17
W242.6012.173.5011.23478.40157.40299.87
W351.8714.823.5010.41539.97161.22324.70
W438.617.804.956.48250.19198.04408.54
W560.287.468.054.73285.12246.98290.65
W6120.1011.6610.307.31877.93640.95686.91
W7191.8122.119.469.551831.79734.47521.60
W8167.7312.2516.603.05511.58426.79564.10
W942.5814.193.0012.11515.64179.02404.42
W1042.4214.143.007.59321.97143.32400.74
W1151.769.305.852.53130.95225.23524.76
W1254.798.456.805.50301.35280.92357.38
W1331.616.424.934.52142.88172.21359.62
W1443.428.435.151.7776.85142.33321.21
W1534.896.655.257.81272.49173.87392.62
Disclaimer/Publisher’s Note: The statements, opinions and data contained in all publications are solely those of the individual author(s) and contributor(s) and not of MDPI and/or the editor(s). MDPI and/or the editor(s) disclaim responsibility for any injury to people or property resulting from any ideas, methods, instructions or products referred to in the content.