Article

Evaluating Algorithm Efficiency in Large-Scale Dome Truss Optimization Under Frequency Constraints

by
Ibrahim Behram Ugur
Department of Civil Engineering, Sirnak University, Sirnak 73000, Turkey
Buildings 2025, 15(17), 3238; https://doi.org/10.3390/buildings15173238
Submission received: 28 July 2025 / Revised: 21 August 2025 / Accepted: 2 September 2025 / Published: 8 September 2025
(This article belongs to the Section Building Structures)

Abstract

Incorporating frequency constraints into the optimum design of large-scale truss dome structures is crucial for maintaining seismic resilience, as the natural frequencies must remain within specified ranges. In this work, seven metaheuristic algorithms—including three variants of the Fitness–Distance–Balance-based Adaptive Guided Differential Evolution (FDB-AGDE), the Cheetah Optimizer (CO), the Bonobo Optimizer (BO), the Flood Algorithm (FLA), and the Lung Performance Optimization (LPO) are applied to solve high-dimensional truss sizing problems under strict frequency limitations. Their convergence characteristics and solution quality are systematically compared across multiple dome configurations. Besides traditional measures of computational efficiency and final weight minimization, a suite of statistical analyses is conducted: the Wilcoxon rank-sum test to assess pairwise performance significance, the Friedman test to establish overall rank ordering, and Cohen’s test to quantify effect sizes. The results reveal that LPO, BO, CO, and the first variant of FDB-AGDE consistently produce lighter feasible designs with lower variability, whereas FLA and other variants of FDB-AGDE exhibit heavier structures or higher dispersion. The findings underscore the value of robust, well-tuned metaheuristics and rigorous statistical evaluation in structural optimization, offering clear guidance for seismic-focused designers seeking both lightweight solutions and reliable performance across repeated runs.

1. Introduction

Dome structures are known for their aesthetic appeal, durability, and structural efficiency, making them a sustainable choice for modern construction. Their ability to cover large areas with minimal material usage offers economic advantages, and they can be adapted for various applications, including residential, commercial, cultural, and recreational spaces. Additionally, domes are versatile in size, with large-scale domes used for logistics and exhibition spaces, and smaller ones for shelters or kiosks.
The natural frequency of a truss is a critical design parameter, particularly when the structure is exposed to dynamic excitations. In practice, many engineering trusses are subjected to dynamic loading arising from operational conditions or unexpected events, which may result in undesirable vibrations and noise. Such effects can become hazardous if resonance occurs; therefore, natural frequency constraints must be imposed to ensure structural safety and performance [1,2,3,4]. Structural optimization aims to balance safety by meeting natural frequency constraints while minimizing material use and weight, enhancing both performance and efficiency. Metaheuristic algorithms [5,6,7,8,9,10,11,12,13,14,15] have become a valuable tool in optimizing such structures, offering efficient solutions to complex, nonlinear design problems. Numerous studies have been conducted by researchers on the optimal design of truss structures with frequency constraints using various metaheuristics [1,2,3,4,16]. A detailed chronological literature review focusing on the optimization of large-scale dome truss structures with frequency constraints in recent years is presented as follows:
Kaveh and Ilchi Ghazaan [17] employed the Enhanced Colliding Bodies Optimization (ECBO) method, using a cascading approach to break down the optimization process into autonomous stages. This approach improved design optimization across large-scale dome structures with multiple frequency constraints. Kaveh [18] used Democratic Particle Swarm Optimization (DPSO) for decomposing the eigenproblem of dome trusses, enabling more efficient optimization. This method significantly reduced computational time and demonstrated promising results in structural optimization. Dede et al. [19] introduced the Jaya algorithm for braced dome structures, focusing on weight minimization while adhering to frequency constraints. The integration of the Jaya algorithm with MATLAB and finite element analysis proved effective in solving constrained optimization problems. Liu et al. [20] enhanced the Fruit Fly Optimization Algorithm (FOA) by introducing a memory-based adaptive search radius and an elitist improved rule. These modifications reduced redundant analyses and improved computational efficiency. Applied to frequency-constrained truss optimization problems, the method outperformed traditional FOAs in both quality and efficiency. Degertekin et al. [21] proposed the parameter-free Jaya algorithm (PFJA), which adapts population size throughout the optimization process. PFJA demonstrated superior performance in terms of weight optimization, convergence speed, and statistical reliability. Kaveh et al. [22] developed the Enhanced Forensic-Based Investigation (EFBI) algorithm, improving communication between search components for dome-like trusses. EFBI showed enhanced performance compared to the original FBI and matched other metaheuristics in optimization tasks. Kaveh et al. [23] introduced a chaotic version of the Water Strider Algorithm (WSA) for large-scale frequency-constrained structural optimization. The chaotic WSA alternates between explorative and exploitative states, improving convergence speed and resulting in lighter designs compared to the basic WSA. An improved version of the Arithmetic Optimization Algorithm (IAOA) [24] addressed exploration and convergence issues in the original AOA. IAOA outperformed its predecessor and other state-of-the-art algorithms, optimizing benchmark dome trusses effectively. Dede et al. [25] applied Rao algorithms for optimizing dome trusses, using a MATLAB-GUI-based program integrated with finite element analysis. Their work highlighted the effectiveness of Rao-2, which produced optimal designs in fewer generations. Khodadadi and Mirjalili [26] proposed the Generalized Normal Distribution Optimization (GNDO) algorithm for truss design under frequency constraints. GNDO demonstrated superior reliability, stability, and efficiency compared to other metaheuristic algorithms in structural optimization tasks. Kaveh et al. [27] improved the Slime Mould Algorithm (ISMA) with an elitist strategy and enhanced exploration to overcome slow and premature convergence. Tested on large-scale dome trusses, ISMA outperformed the classical SMA and other methods. Öztürk and Kahraman [28] tackled challenges in truss optimization, such as inconsistent settings and a lack of stability analysis. They proposed a standardized simulation environment and a benchmark suite of nine problems. Their findings identified LSHADE-EpSin as the top-performing and most stable algorithm, achieving a 90% success rate across all truss problem types. Kaveh et al. [29] utilized the Success-History Based Adaptive Differential Evolution (SHADE) algorithm, which incorporates a historical memory of successful parameters, to optimize dome trusses under frequency constraints. This method demonstrated efficiency by achieving optimal designs with fewer structural analyses. Moosavian et al. [30] evaluated Differential Evolution (DE), its variants (IDE, LSHADE), and the covariance matrix adaptation evolution strategy (CMAES) for frequency-constrained truss optimization. CMAES showed superior performance and stability with minimal deviation, excelling in smaller populations but requiring more evaluations for larger-scale problems. Goodarzimehr et al. [31] introduced the Improved Marine Predators Algorithm (IMPA) for truss optimization with frequency constraints, featuring an adaptive factor for step size control. Applied to various benchmarks, IMPA outperformed state-of-the-art algorithms, proving highly effective and robust. Sheng-Xue [32] introduced the Medalist Learning Algorithm, a heuristic inspired by group learning behaviors, for truss optimization with frequency constraints. The algorithm identifies top-performing “medalists” for self-learning and allows common learners to imitate medalists and past experiences. Tested on six benchmark truss problems, it showed superior best and average weights with moderate computational cost, achieving minimal worst-case weights and fewer evaluations in certain cases. Truong and Chou [33] developed the Enterprise Development Optimizer (ED), a metaheuristic inspired by the enterprise development process. It updates solutions by switching activities at each step. Applied to steel structure optimization under frequency constraints, the algorithm efficiently optimized component weights for various dome structures, demonstrating optimal solutions with fewer function evaluations. Goodarzimehr and Topal [34] introduced the self-adaptive Bonobo Optimizer (SABO) to improve the original Bonobo Optimizer (BO) by incorporating adaptive mechanisms to enhance exploration and avoid premature convergence. SABO showed superior performance in minimizing truss weight under frequency constraints across five benchmark problems. Abbasi and Zakian explored [35] dome-shaped truss optimization with frequency constraints using seven metaheuristic algorithms: Social Network Search, Jellyfish Search Optimizer, Equilibrium Optimizer, Teaching-Learning-Based Optimization, Grey Wolf Optimizer, Colliding Bodies Optimization, and the Improved Grey Wolf Optimizer. They introduced a hyperparameter tuning procedure to improve algorithm performance, demonstrating its efficiency through statistical analysis on five benchmark problems.
This study systematically explores the capability of multiple metaheuristic algorithms—three variants of Fitness–Distance–Balance-based Adaptive Guided Differential Evolution (FDB-AGDE), Cheetah Optimizer (CO), Bonobo Optimizer (BO), Flood Algorithm (FLA), and Lung Performance Optimization (LPO)—to handle natural frequency constraints in large-scale dome truss designs, which are crucial for seismic resilience. In addition to evaluating performance based on best, mean, and worst weights, a comprehensive statistical assessment is performed using Wilcoxon rank-sum tests, Friedman ranking, and Cohen’s effect sizes. These analyses quantify both statistical significance and practical importance, offering a more rigorous evaluation than simple comparisons. Furthermore, by examining dome structures with up to 1410 members, this study demonstrates how selected metaheuristics effectively manage high-dimensional complexity. This provides valuable insights into the scalability and reliability of these algorithms for large-scale structural optimization problems.
Unlike earlier studies, this work delivers a more comprehensive and rigorous statistical comparison while systematically evaluating algorithms that originate from diverse conceptual inspirations: natural phenomena (CO and FO), human anatomy (LPO), animal social behavior (BO), and evolutionary computation (FDB-AGDE variants). This diversity enables an in-depth analysis of how performance differences emerge across fundamentally different algorithmic paradigms when applied to frequency-constrained dome truss optimization. This is the first study to jointly benchmark these seven metaheuristics on high-dimensional structural design problems, thereby offering unique insights into their comparative strengths, weaknesses, and scalability.
The remainder of this paper is as follows: Section 2 presents the formulation for the design optimization of truss domes under frequency constraints. Section 3 introduces the optimization algorithms employed in this study. In Section 4, the performance of the algorithms is evaluated through three well-established dome structure problems, and the results are compared with previous studies, including performance rankings based on statistical analysis. Finally, Section 5 summarizes the conclusions.

2. Optimization of Truss Structures

The main objective in truss optimization is to minimize the structural weight while adhering to all constraints imposed. In this study, natural frequencies are used as critical constraints to ensure structural performance. The objective function, defined in terms of the structure’s weight, is expressed as:
W ( X ) = γ i = 1 n m A i L i         i = 1 , 2 , n m
where W denotes the total weight of structure, A i represents the cross-sectional area of the i-th member, γ is the density of material, L i   is the length of member, and “nm” is the total number of structural members.

Natural Frequency Constraints

Natural frequencies are critical for ensuring structural stability under dynamic loading conditions. These are determined by solving the eigenvalue problem derived from the mass and stiffness matrices of the structure. The natural frequencies ω are calculated by solving:
K ω 2 M ϕ = 0
This equation represents a standard eigenvalue problem:
K λ M ϕ = 0
where K is the global stiffness matrix, M denotes the global mass matrix, ϕ represents mode shape vector (eigenvector) corresponding to the natural frequency, and λ is an eigenvalue related to the square of the natural frequency ( λ = ω 2 ) .
The eigenvalues are computed as
λ k = ϕ k T · K · ϕ k ϕ k T · M · ϕ k
Here, k represents the k-th mode of vibration, ϕ k and ϕ k T are k-th mode eigenvector and its transpose, respectively. The frequency of the k-th vibration mode is the square root of the eigenvalue ( w k = λ k ).
The natural frequency constraints ensure that the calculated frequencies remain within the specified bounds:
w j w j u w k w k l
where w j and w j u denote the j-th natural frequency value and the maximum allowable frequency, respectively. In a similar way, w k and w k l are k-th natural frequency and the minimum allowable frequency value. For size optimization, the cross-sectional areas must satisfy:
A i m i n A i A i m a x
where A i m i n and A i m a x are the bounds for cross-sectional areas. To differentiate between feasible and infeasible designs with respect to the natural frequency constraints, a penalized objective function f p is employed. The penalized objective function augments the structural weight with a multiplicative penalty term that grows as a function of the normalized constraint violation ( v ) . This mechanism assigns larger objective values to infeasible designs, thereby reducing their likelihood of survival in the search process, while at the same time permitting exploration in the vicinity of the constraint boundaries. The f p A is expressed as follows:
f p A = W A × 1 + v e
where e is the exponential penalty coefficient, taken as 2 in this study. This selection is consistent with Degertekin et al. [10], who showed that a quadratic penalization scheme is effective for frequency-constrained structural optimization. It also falls within the practical range suggested by Kaveh and Yosufpour [21] and follows the general principle outlined by Kaveh et al. [3] that penalty parameters should balance exploration and exploitation.
The term ν represents the sum of the penalties for natural frequency constraints that are not satisfied, calculated as:
v = j = 1 n j v w j + k = 1 n k v w k
Here nj and nk are numbers of natural frequency constraints that are bounded from above and below, respectively. v w j and v w k are the penalty values for the j-th and k-th natural frequencies, determined as:
v w j = 0 i f   w j w j u   w j w j u w j u i f   w j > w j u
v w k = 0 i f   w j w j l   w k w k l w k l i f   w k < w k l

3. Optimization Algorithms

This section provides an overview of seven metaheuristic algorithms used in this study, including the three variants of FDB-AGDE, CO, LPO, BO, and FLA. These algorithms were selected for their unique capabilities in solving complex optimization problems.

3.1. Full Distance-Based-Adaptive Guided Differential Evolution Algorithm (FDB-AGDE)

The FDB-AGDE algorithm was developed by Guvenc et al. [36], aiming to handle trapping local optima and premature convergence of the Adaptive Guided Differential Evolution (AGDE) [37] by efficiently selecting reference positions for guiding the search process and then integrating them into AGDE. By applying the fitness distance-based method (FDB) [38] to the mutation process, local solution traps can be avoided. AGDE eliminates the need for user-defined control parameters, and various strategies have been developed to integrate the FDB selection method systematically. To direct the AGDE search process efficiently, the top three strategies with the best search performance were implemented. The integration of a probabilistic FDB method—using a roulette-wheel approach based on FDB scores—transformed the greedy selection process. This method was employed to construct mutant vectors, as defined in three variations as given below:
v i G + 1 = X r G + F X p b e s t G X p w o r s t G × C a s e   1 : X r G = X F D B r o u l e t t e   w h e e l G C a s e   2 : X p b e s t G = X F D B r o u l e t t e   w h e e l G C a s e   3 : X p w o r s t G = X F D B r o u l e t t e   w h e e l G
v i G + 1 is the mutant vector at generation G + 1 for the i-th individual. The mutant vector is a candidate solution that is generated for the next iteration of the algorithm. X r G refers to the position of the randomly selected individual G. The position represents a solution in the search space. F is the scaling factor, typically a constant used to scale the difference between two positions in the mutation process. The scaling factor controls the step size and the impact of the mutation. X p b e s t G represents the position of the best solution of the i-th individual at generation G. It is used to guide the search towards better solutions. X p w o r s t G refers to the position of the worst solution of the i-th individual at generation G. X F D B r o u l e t t e   w h e e l G represents a position selected using the fitness distance-based (FDB) method, which is guided by a roulette-wheel selection based on fitness distance scores. The roulette-wheel selection ensures that individuals with better fitness have a higher chance of being selected, thus guiding the mutation towards promising regions of the search space. n FDB-AGDE-1, the position of X r G (the randomly selected individual) is chosen using the roulette-wheel method based on FDB scores, prioritizing individuals with higher fitness. In FDB-AGDE-2, the position of X p b e s t G (the best solution) is selected using the same roulette-wheel selection method, focusing on exploiting the best-found solutions. In FDB-AGDE-3, the position of X p w o r s t G (the worst solution) is chosen through the roulette-wheel method with FDB scores, promoting exploration by incorporating less-optimal solutions into the search process.

3.2. Cheetah Optimizer (CO)

The Cheetah Optimizer (CO) was proposed by Akbari et al. [12], inspired by hunting behaviors of cheetah using searching, sitting-and-waiting, attacking, and returning home strategies to solve complex optimization problems.

3.2.1. Searching

Cheetahs search their surroundings for prey. This searching strategy is modeled as a random exploration, adjusting their position according to the conditions of the prey and their environment. The position of a cheetah, which represents a solution, is updated by
X i , j t + 1 = X i , j t + r ^ i , j 1 · a i , j t
where X i , j t + 1 and X i , j t denote the next and current position of the cheetah i in arrangement of j, respectively. r ^ i , j 1 and a i , j t the random parameter and step length for i-th cheetah in arrangement j, respectively.

3.2.2. Sit-and-Wait Strategy

In this strategy, the cheetah remains in its position still to avoid alerting the prey, waiting for it to come closer. The update rule is
X i , j t + 1   = X i , j t
in order not to change all cheetahs simultaneously in each group so that we can avoid premature convergence in the optimization.

3.2.3. Attack Strategy

Cheetahs use speed and flexibility to attack prey. When attacking, the cheetah follows the prey’s position and adjusts its path to intercept. Mathematically, the position update for the attacking cheetah is
X i , j t + 1 = X B , j t + r ^ i , j · β i , j t
where X B , j t is the prey’s current position, r ^ i , j is the random tuning factor, and β i , j t is the interaction with the leader or neighboring cheetah.

3.2.4. Leave the Prey and Go Back Home

At this step, if the cheetah fails to hunt, it changes its position or returns to its territory. In a case with no hunting action for a while, it changes the position to the last known prey location to resume the search.

3.3. Bonobo Optimizer (BO)

The Bonobo Optimizer [13] is a metaheuristic algorithm inspired by bonobos’ social and reproductive behaviors. It uses a fission–fusion approach, dividing the population into smaller groups that reunite to balance exploration and exploitation. BO employs four mating strategies—restricting, promiscuous, extragroup, and consortship—to maintain diversity and avoid premature convergence. The top solution, the α-bonobo, guides the search, and the algorithm utilizes various parameters to optimize complex, non-convex problems effectively.

3.3.1. Bonobo Selection Using Fission–Fusion Social Strategy:

A bonobo is selected for mating using the fission–fusion social strategy, which mimics the dynamic group formations seen in bonobo communities. The population is divided into small temporary sub-groups of random sizes, based on a factor t s g s f a c t o r .
To select a mate, a bonobo is chosen by randomly selecting a temporary sub-group from the population (excluding the bonobo itself). The fittest bonobo from this sub-group is compared with the original bonobo (i-th-bonobo). If the selected bonobo has better fitness, it becomes the mating partner (p-th-bonobo). If not, a random bonobo from the temporary group is chosen as the p-th-bonobo. This process ensures diversity and effective mating for the offspring generation.

3.3.2. Promiscuous and Restrictive Mating Used During the Positive Phase

The phase probability parameter (pp) determines the mating strategy of the bonobo. If a randomly generated number is less than pp, a new bonobo is created using the following equation.
N e w B o n o b o j = b o n o b o j i + r 1 × s c a b × a j b o n o b o b o n o b o j i + 1 r 1 × s c s b × f l a g × b o n o b o j i b o n o b o j p
where a j b o n o b o , b o n o b o j i , and b o n o b o j p are the j-th components of alpha bonobo, the i-th bonobo, and the p-th bonobo, respectively. s c a b and s c s b are the sharing coefficients for the alpha bonobo. flag parameter is taken as 1 for promiscuous mating, and −1 for restrictive mating.

3.3.3. Consortship and Extra-Group Mating Is Used During the Negative Phase

The strategies for consortship and extra-group matings are determined randomly based on the phase probability and are expressed through the probability of extra-group mating (pxgm). The generation of a new bonobo is performed as follows:
  i f   a j b o n o b o b o n o b o j i   a n d   r 3 p d N e w B o n o b o j = b o n o b o j i + e r 4 2 + r 4 2 r 4 × V a r m a x j b o n o b o j i
i f   a j b o n o b o b o n o b o j i   a n d   r 3 > p d N e w B o n o b o j = b o n o b o j i e r 4 2 + r 4 2 r 4 × b o n o b o j i V a r m i n j
i f   a j b o n o b o < b o n o b o j i   a n d   r 3 p d N e w B o n o b o j = b o n o b o j i e r 4 2 + r 4 2 r 4 × b o n o b o j i V a r m i n j
i f   a j b o n o b o < b o n o b o j i   a n d   r 3 > p d N e w B o n o b o j = b o n o b o j i + e r 4 2 + r 4 2 r 4 × V a r m a x j b o n o b o j i
where Var_max and Var_min are the upper and lower bounds.
In situations where r 2 is greater than pxgm, the consortship mating strategy is employed to generate the new bonobo, as described below:
N e w B o n o b o j = b o n o b o j i + f l a g × e r 5 × b o n o b o j i b o n o b o j p   i f   ( f l a g = 1   | | r 6 p d ) b o n o b o j p ,   o t h e r w i s e

3.4. Flood Algorithm (FLA)

The Flood Algorithm (FLA) is a novel metaheuristic optimization algorithm presented by Ghasemi et al. [14] and inspired by the movement and flow patterns of water during flooding events in river basins. It mathematically models key natural phenomena such as water movement towards slopes, flow rates over time, soil permeability effects, and periodic changes in water levels due to precipitation and loss. By using these models, FLA guides the movement of a population of potential solutions to achieve optimal results.
FLA operates in two phases: the regular movement phase, where the population moves toward the best solution, and the flooding phase, which introduces random disturbances to enhance diversity. During the flooding phase, new solutions are periodically introduced while weaker solutions are discarded, mimicking natural water cycles.
As the water flow from the river increases, floods and turbulence may be induced due to variations in the movement of the water volume. The depletion coefficient or water flow is modeled as a function of the algorithm’s iterations, as shown in the following equation:
            P K = M a x I t i t 2 + 1 + 1 M a x I t 4 i t ln M a x I t i t 2 + 1 + M a x I t 4 i t 2 3 1.2 i t
where P K is a scaling factor adjusting the magnitude of a movement, it and MaxIt represent the current and maximum iteration number, respectively.

3.4.1. Regular Movement Phase

The population (or water) moves naturally toward better solutions, similar to water flowing downhill toward a slope. The movement is modeled as follows:
P e i = f S i f min f max f min 2
i f   r a n d > r a n d + P e i                                           S i n e w = S i + P k r a n d I t e r × r a n d × S m a x S m i n + S m i n else               S i n e w = S b e s t + r a n d × S j S i
P e i represents the fitness probability of the i-th solution, which is calculated by normalizing the cost function value f S i of the solution S i with respect to the minimum and maximum values of the population represented by f min and f max , respectively. rand denotes a random variable uniformly distributed between 0 and 1. S i n e w is the new position of the i-th solution, S b e s t and S i are the positions of the best solution and a random solution, respectively. S m a x and S m i n denote the upper and lower limits of the search space.

3.4.2. Flooding Phase: Increase and Decrease in Basin Water

In this phase, random disturbances are considered to maintain diversity within the population and prevent premature convergence. The algorithm selectively replaces weaker solutions with new, randomly generated solutions, mimicking the behavior of flooding that introduces new water into a system. The mathematical model of this phase is given below:
P t = sin rand Iter
where Pt is a flooding probability, calculated based on the current iteration with a random parameter. If this probability is met, the flooding phase is triggered.
S e new = S best + rand × rand × S max S min + S min           e = 1 : N e
Here, Ne is the number of evaporated water particles representing the weakest members.

3.5. Lung Performance Algorithm (LPO)

The Lung Performance Optimization (LPO), proposed by [15], is a novel meta-heuristic algorithm inspired by the natural processes of the lungs in the human body, specifically the efficiency of gas exchange in the respiratory system. The algorithm’s inspiration draws from the lungs’ ability to exchange oxygen and carbon dioxide, which is a highly efficient and adaptive process. This makes the lungs an ideal model for optimization problems that require the balancing of exploration and exploitation in a solution space. LPO operates through the mechanism of a “swarm”, analogous to the air and blood masses in the lungs, adjusting their positions based on feedback similar to the way oxygen is delivered to the bloodstream and carbon dioxide is removed. The optimization is based on Fick’s law of diffusion and the pressure changes in the respiratory system, which can be modeled as an electrical circuit with resistances and reactances.

3.5.1. The Entrance and Exit of Air Into and Out of the Lungs

The process of air entering and exiting the lungs is modeled by the position updates of the population particles. This is similar to the way air moves in and out of the lungs, and it is mathematically represented by:
M i n e w , 1 = M i + M i × f M i 2 + 1 2 π D i m f M i C i 2 × sin 2 π D i m i t e r × sin 2 π D i m i t e r + θ i
θ i = tan 1 1 2 π × D i m × f M i × C i
C i = f M i 2 × sin θ i
In this equation, M i and M i n e w , 1 are the current and the firstly updated position of the air and blood mass, respectively, f M i is the fitness value of the i-th solution, Dim denotes the number of design variables, and θ i and C i represent the control parameters of the LPO algorithm.

3.5.2. Carbon Dioxide Separation from the Air and Blood Movement in the Veins

The oxygen extracted by the lungs enters the blood, similar to how particles in an optimization algorithm move through the problem space. These particles shift from areas of higher fitness (more pressure) to lower fitness (less pressure), seeking optimal solutions.
M i new , 2 = M i new , 1 + K i 1 × α i × M i new , 1 M 1 + K 23 × α i × M 3 M 2
where K i 1 and K 23 are direction vectors based on fitness comparisons, α i denotes a scalar factor controlling movement magnitude, M 1 ,   M 2 ,   a n d   M 3 are reference points in the solution space, and M i new , 2 is the second updated position of the i-th solution.

3.5.3. Carbon Dioxide Separation from Blood

This is akin to the crossover and composition of the swarm, where particles (blood) are recombined to form new solutions. It is modeled as follows:
m i , j n e w , 3 =   m i , 1 + a i × m 3 , j m 2 , j ,     i f   s i > r a n d     m i , j n e w , 3 = m i , j n e w , 2 ,             e l s e  
Here, s i is a probability that decreases with each cycle (exhalation), a i is a scaling factor of the i-th iteration, and m i , j denotes the j-th design variable of the i-th solution.

4. Numerical Examples

In this section, the efficiency of the proposed algorithms—three different versions of FDB-AGDE, BO, CO, FLA, and LPO—is demonstrated by applying them to three large-scale structural optimization problems involving frequency constraints. The problems include a 600-bar single-layer dome truss, a 1180-bar single-layer dome truss, and a 1410-bar double-layer dome truss. The material properties, bounds on cross-sectional areas, and frequency constraints for these problems are summarized in Table 1.
Given the stochastic nature of metaheuristic algorithms, 20 independent successful runs are conducted for each problem, using different randomly generated initial populations for each run. For each experiment, the best, worst, and mean weights, along with the standard deviation (SD) of the optimized weights across the runs, are recorded. Statistical tests (Wilcoxon rank-sum) are performed, and Cohen’s d effect sizes are calculated to assess both the significance and magnitude of differences among algorithms. The design variables corresponding to the best solutions are presented. Furthermore, the number of structural analyses (NSAs) representing the total objective function evaluations required to obtain the best design, and the percentage of constraint violations (CVs) are reported. Specific parameters employed for the seven distinct techniques are presented in Table 2.
The Friedman rank test is also employed to rank the algorithms based on the best, mean, and worst weights, as well as the standard deviation of the optimized weights. The maximum number of structural analyses is set to 20,000, which serves as the termination criterion for the search process.
It is important to highlight that many algorithms in the literature fail to meet the frequency constraints of these problems. As a result, only proposed algorithms are considered for comparison.

4.1. The 600-Bar Spatial Dome Truss

The first case study, illustrated in Figure 1, examines a truss dome structure consisting of 600 members and 216 nodes. The design process considers the cross-sectional areas of the members as the primary variables. Exploiting the cyclic symmetry of the dome, the members within each substructure—defined by 9 nodes and 25 members—are assigned a uniform cross-sectional area, thereby reducing the number of independent design variables. The substructures are arranged with an angular spacing of 15 degrees between consecutive segments, and the nodal coordinates for each substructure are provided in Table 3. A nonstructural mass of 100 kgf is considered in all unconstrained nodes.
Table 4 compares proposed optimization algorithms—including three variants of the FDB-AGDE approach (FDB-AGDE-1, FDB-AGDE-2, and FDB-AGDE-3), CO, BO, FLA, and LPO—for the optimum design of a 600-bar dome truss. Among all methods, LPO achieves the lightest “best” design with 6335.178 kg, slightly outperforming the second-best method, FDB-AGDE-2 (6339.990 kg), and third-best, BO (6345.948 kg). CO follows closely with 6352.864 kg for its best solution, whereas FDB-AGDE-3 and FDB-AGDE-1 have best solutions of 6507.928 kg and 6598.659 kg, respectively. FLA yields a substantially higher best weight with 8260.930 kg, indicating that it was less effective in exploring the design space for this specific problem setup.
The last row in Table 4 provides a Friedman rank comparison, showing that LPO is ranked first overall (the best), followed in order by FDB-AGDE-2 (second), BO (third), CO (fourth), FDB-AGDE-3 (fifth), FDB-AGDE-1 (sixth), and FLA (seventh). This statistical ranking underscores the superior performance of LPO on the 600-bar truss example.
Table 5 shows the natural frequencies for the first five modes calculated by two different finite-element solvers (MATLAB-based routines and SAP2000) for each optimized design. In all cases, the frequencies closely match the required constraints; CO and BO algorithms are pushing the first two modes near or at the 5.0 Hz boundary and the next three modes near 7.0 Hz. Overall, all listed designs remain feasible, satisfying the natural frequency constraints while achieving varied levels of weight reduction.
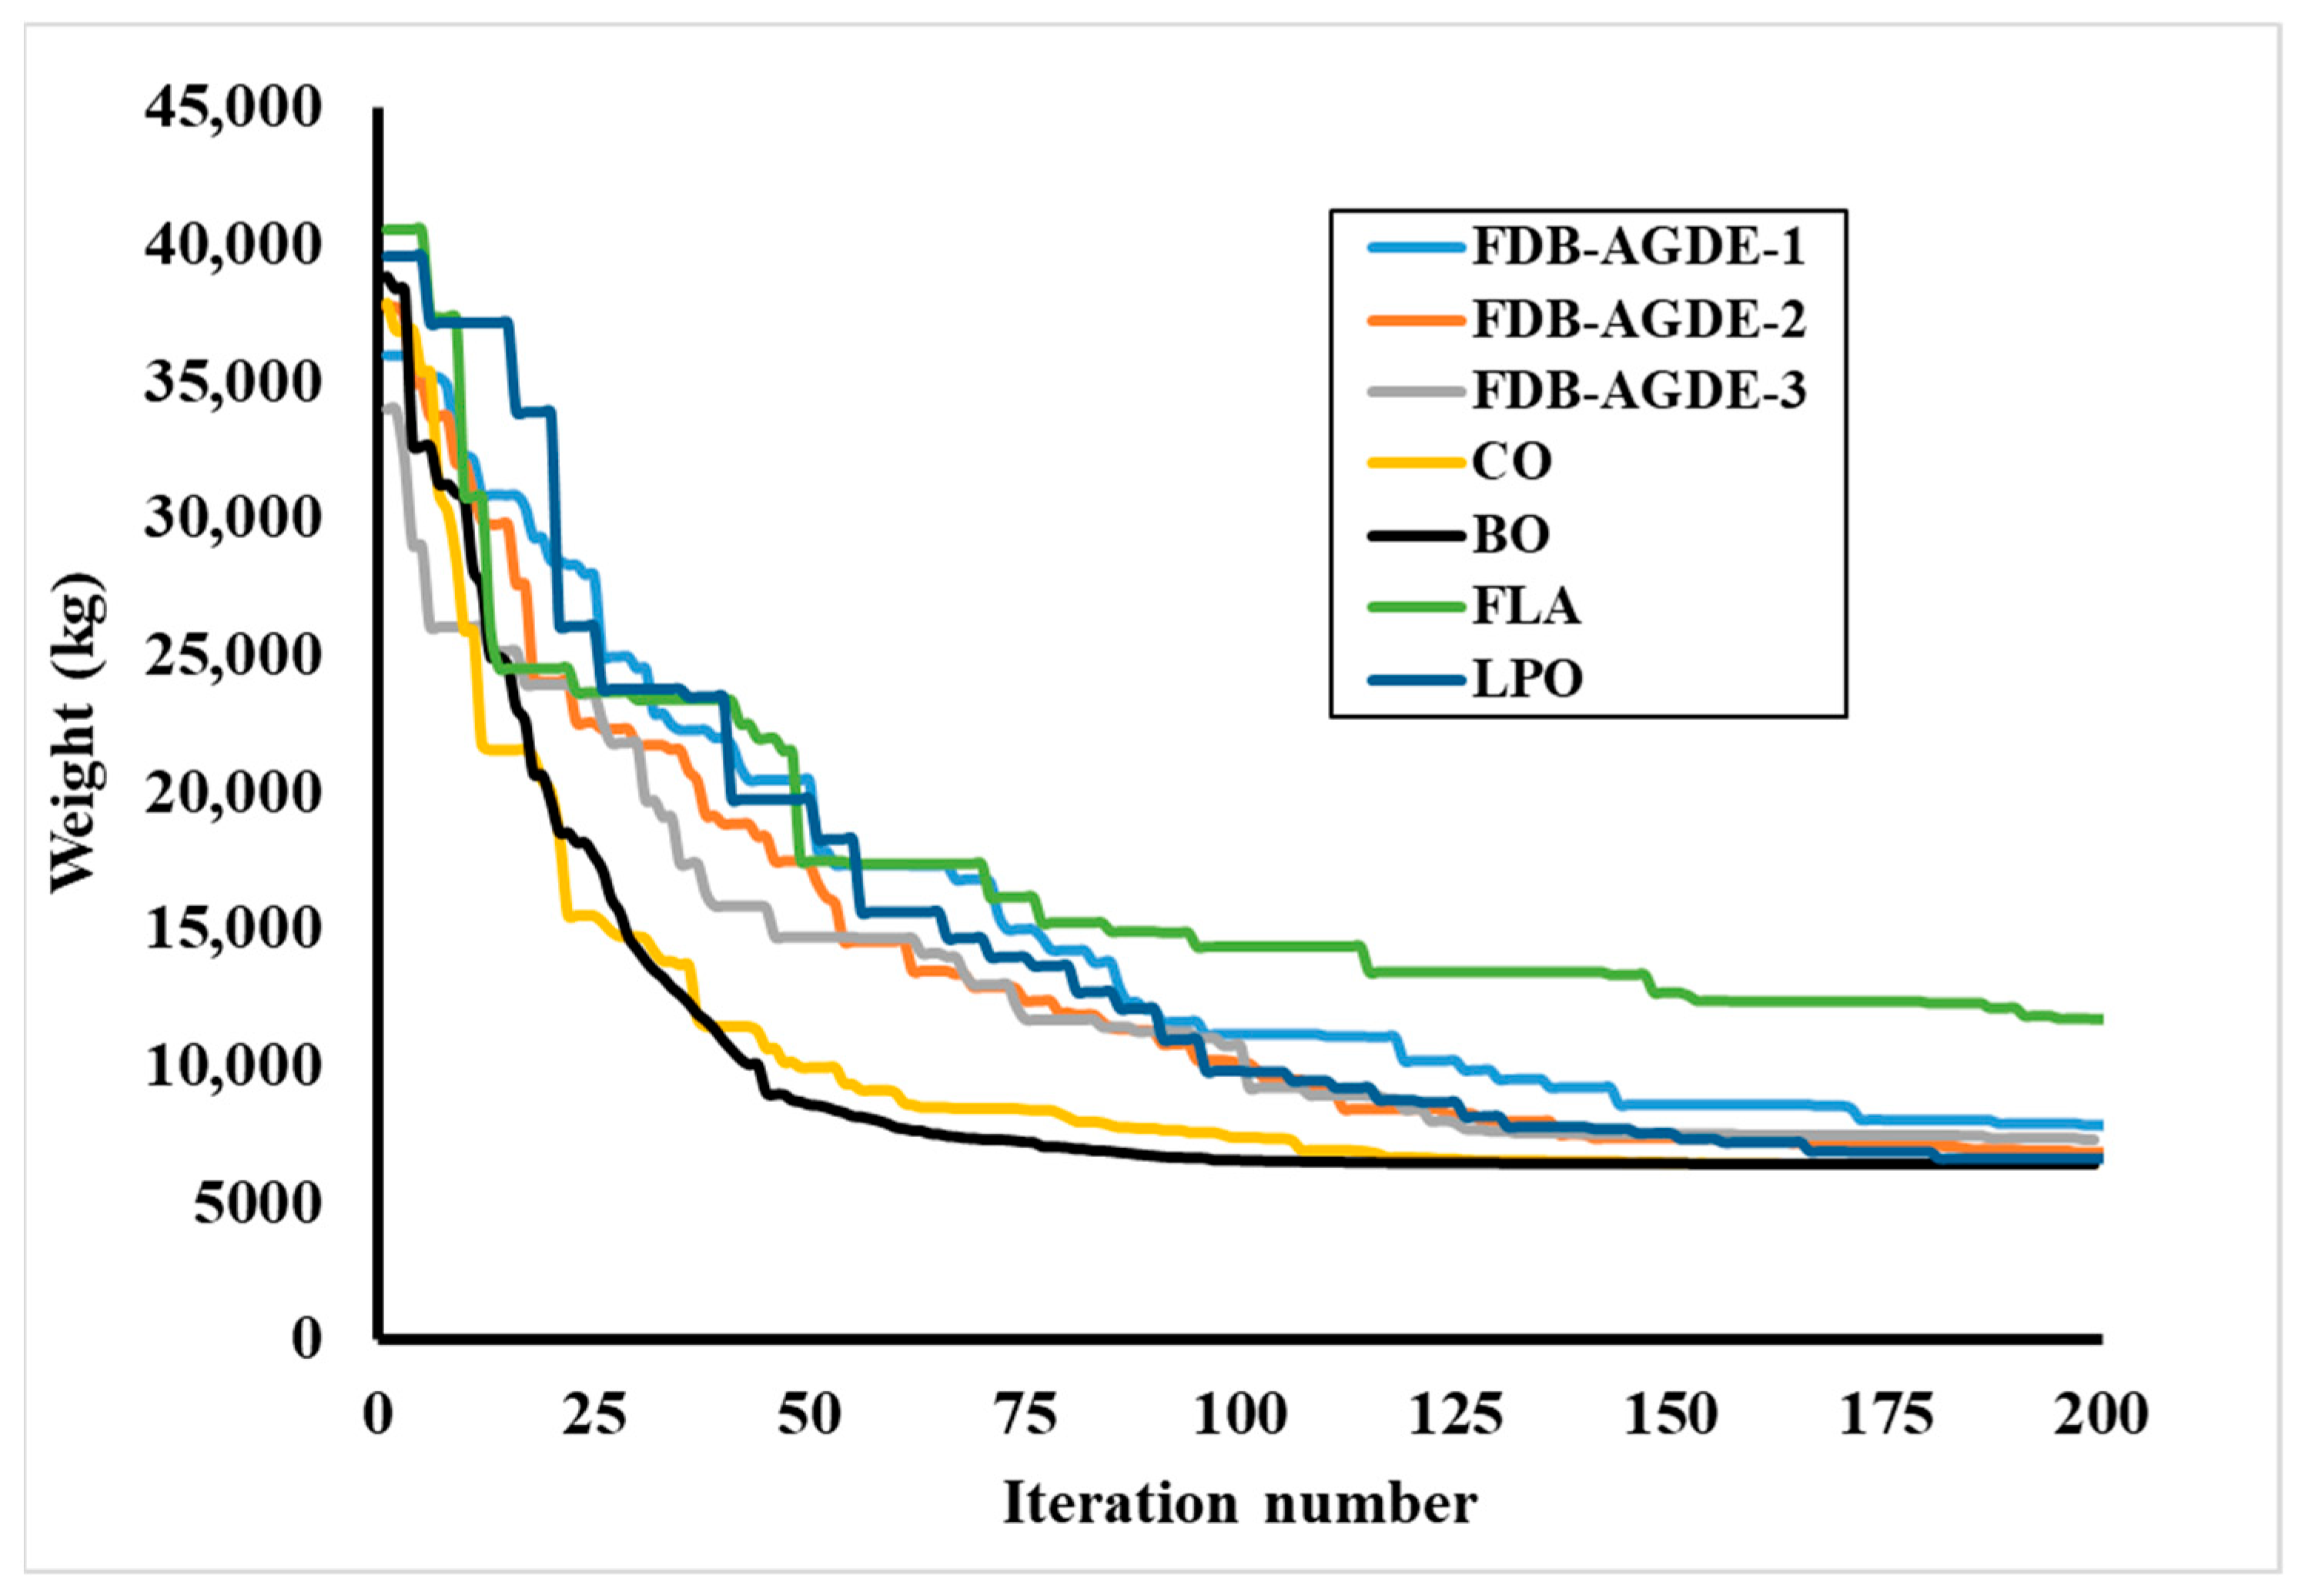
Figure 2 shows the weight reduction trajectories of seven metaheuristics over 200 iterations for the 600-bar dome truss problem. The proposed algorithms exhibit a rapid decrease in weight within the first 25–50 iterations, reflecting their ability to locate promising regions of the design space early on. For instance, FDB-AGDE-2, BO, and LPO all see significant weight drops in the first 25 iterations, suggesting strong global search components.
While all methods continue refining solutions over time, some plateau sooner than others. FLA levels off at a relatively higher weight (above ~10,000 kg) and does not appear to improve substantially after about 100 iterations. In contrast, LPO and FDB-AGDE-2 exhibit steady progress into the later stages, converging to lower final weights. By iteration 200, LPO and FDB-AGDE-2 appear to reach the best overall solutions, whereas FLA lags behind. CO, BO, and the FDB-AGDE-1 and 3 variants end up in intermediate positions. Overall, the convergence trends highlight a trade-off between how quickly different metaheuristics exploit “good” designs versus how effectively they continue refining solutions in the later stages of the run.
Figure 3 provides a statistical snapshot of final weights across multiple runs of each algorithm, FDB-AGDE-2 and LPO. Box plots are centered around the lowest weights. BO, FDB-AGDE-1, and FDB-AGDE-3 occupy the middle range, typically around 6500–7500 kg. CO is somewhat more scattered but mostly between 7000 and 8500 kg. By far the highest weights—and widest spread—are seen in FLA, reflecting both higher mean solutions and greater variability. A single run of FDB-AGDE-2 produced a slightly heavier design (>7000 kg), whereas BO shows a few runs dipping below its typical range. While FDB-AGDE-2 and LPO both feature lower medians, LPO’s box and whiskers are typically very narrow, suggesting it is consistently near its best solutions. FDB-AGDE-2, though capable of similar or better solutions, shows a slightly broader spread. The red marks in the figure denote outliers, individual runs that fall outside the expected whisker range In practical engineering contexts, lower spreads and smaller outliers can be advantageous, as they indicate greater reliability of the algorithm across repeated optimization runs.
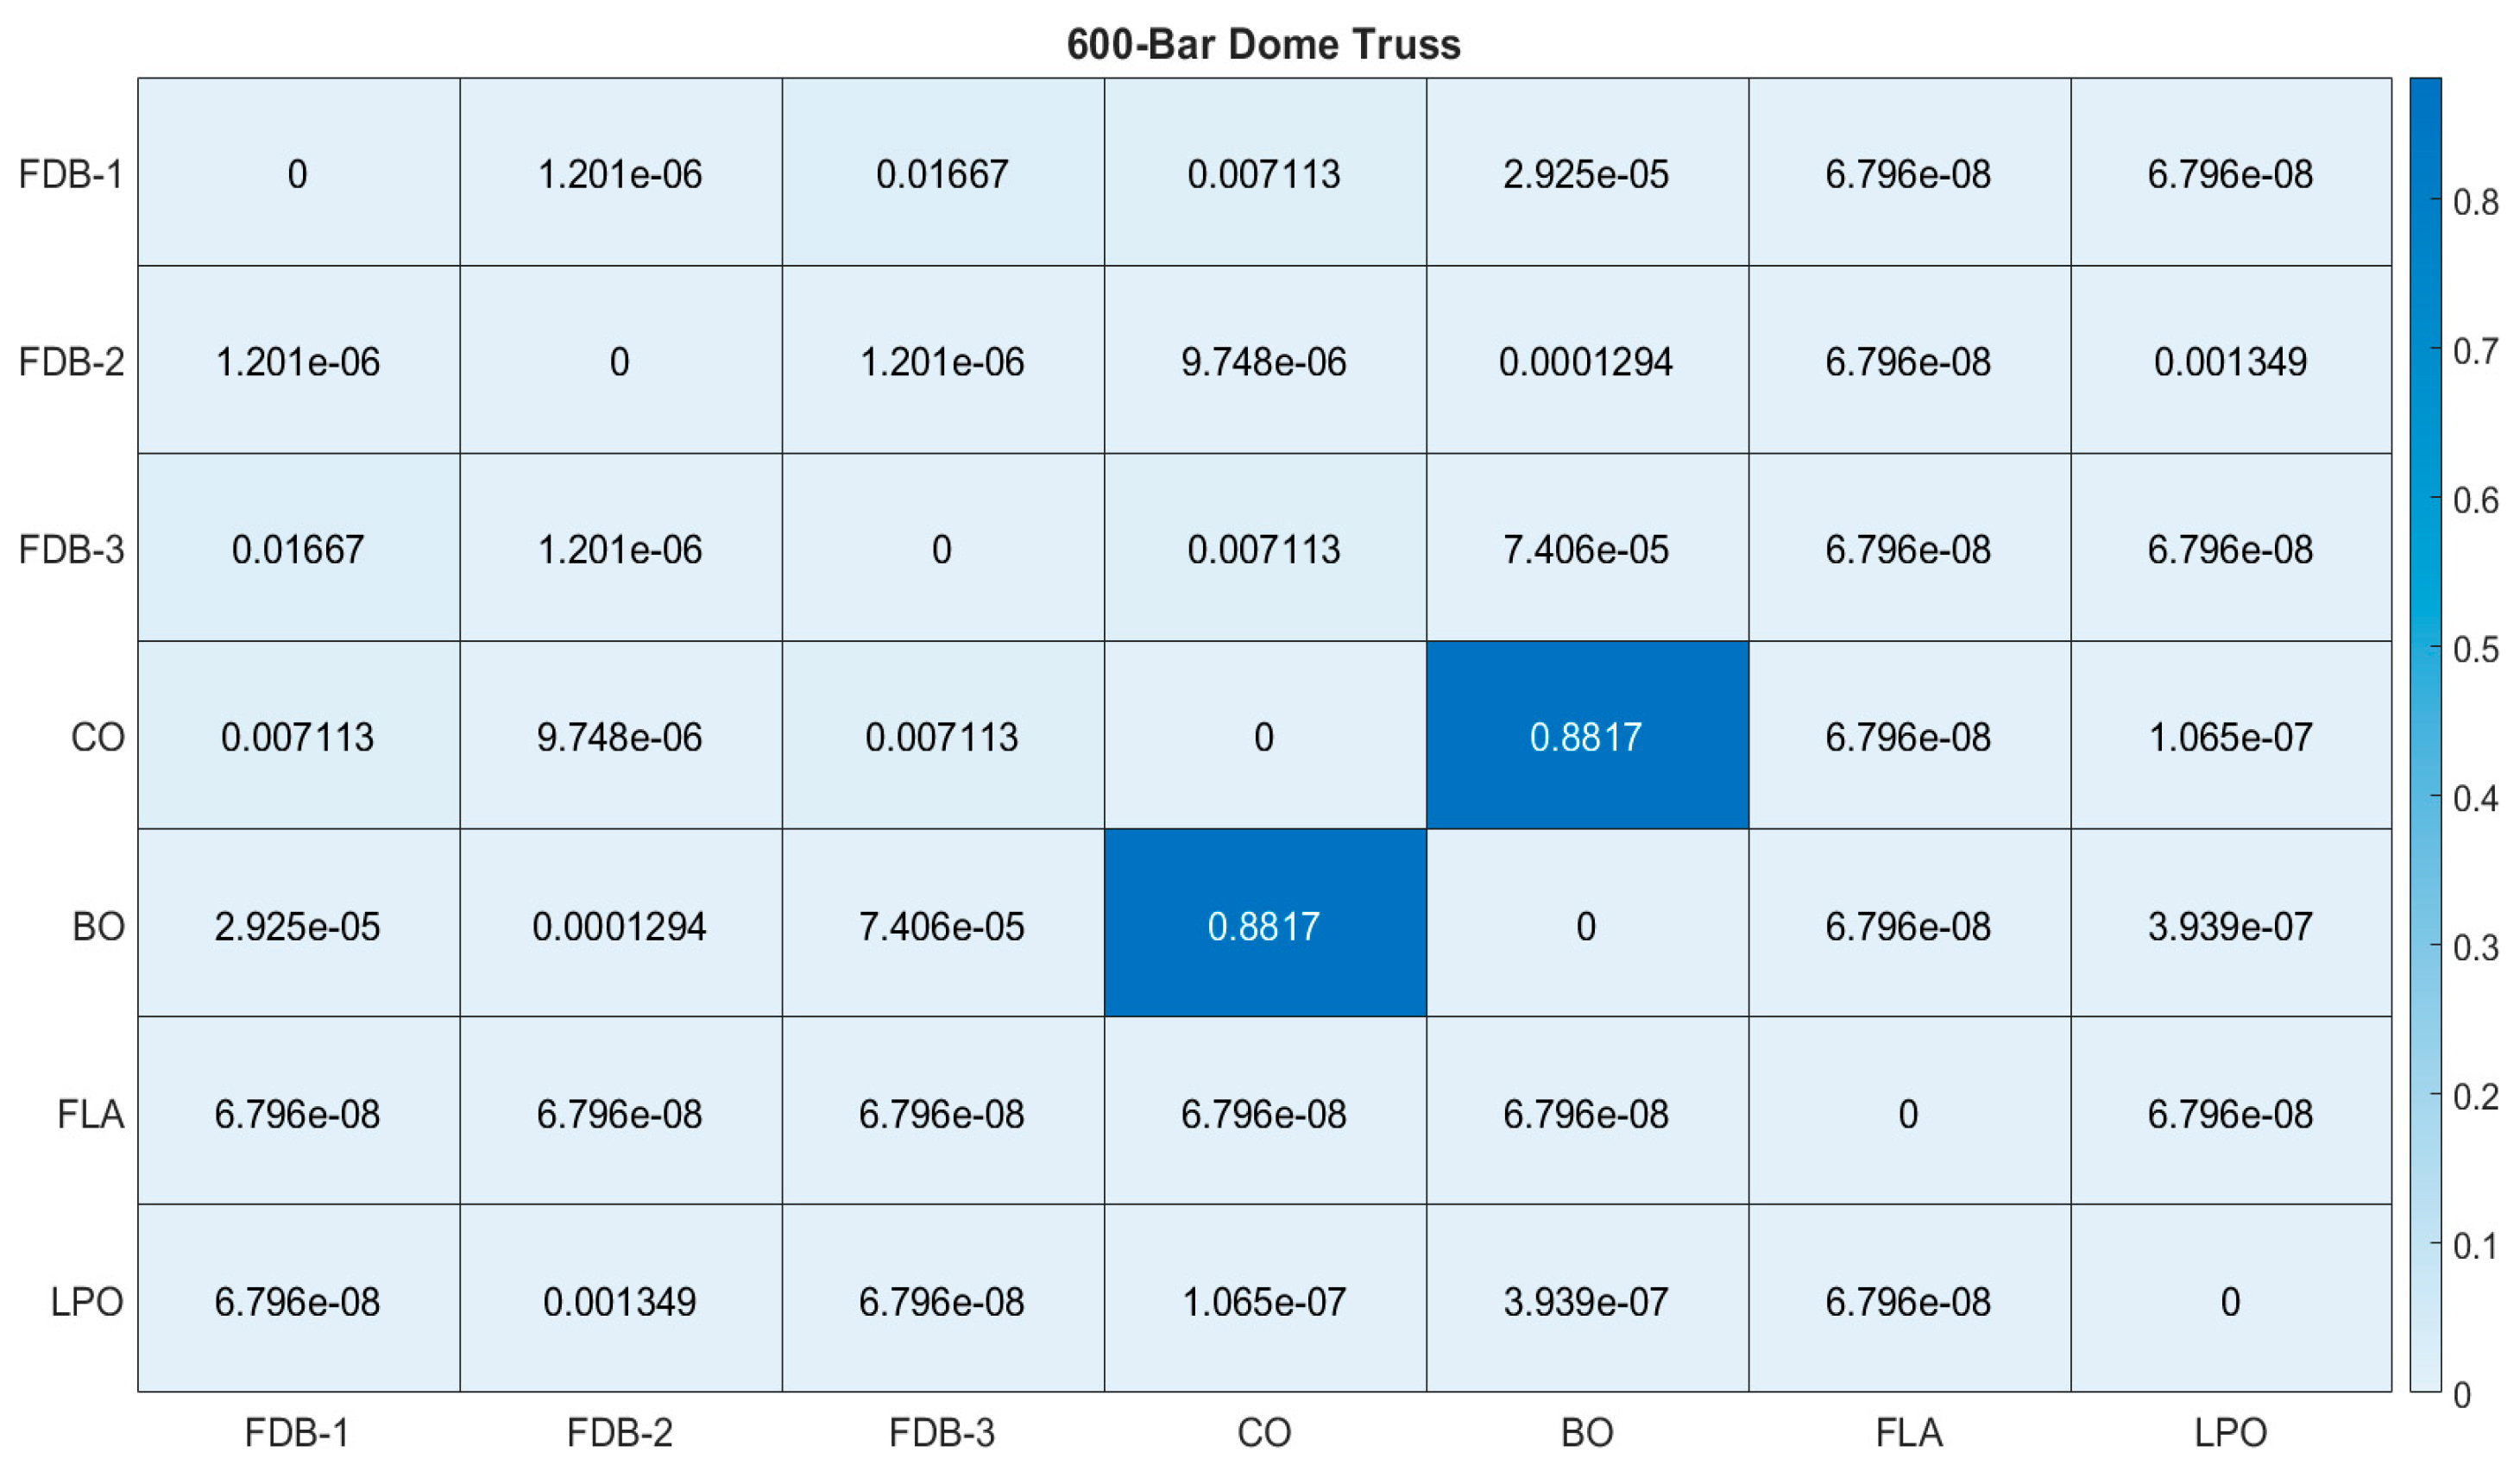
Figure 4 provides the p-values from pairwise Wilcoxon rank-sum tests comparing the final weights of each pair of algorithms. Typically, a p-value < 0.05 is taken to indicate a statistically significant difference between two methods. The cells showing values on the order of 10−6 or 10−8 are highly significant. If a pairwise p-value is relatively large, such as 0.88 in the BO–CO comparison, it suggests there is insufficient evidence to conclude these two algorithms’ distributions differ. On the other hand, extremely small p-values < 10−6 indicate strong evidence that one algorithm outperforms the other on average. From the figure, LPO differs significantly from most other approaches, reflecting that its results are consistently among the best. FLA, by contrast, also exhibits highly significant differences from the rest, but in the opposite direction, and tends to yield consistently higher and more variable final weights.
Table 6 reports Cohen’s d effect sizes for each pairwise comparison of algorithms. Whereas the Wilcoxon test focuses on whether two distributions differ significantly, Cohen’s d gauges how large that difference is. Typical benchmarks for Cohen’s d are as follows:
d = 0.2: Small effect;
d = 0.5: Medium effect;
d = 0.8: Large effect.
LPO vs. FDB-AGDE-1 at d ≈ 6.16, FLA vs. FDB-AGDE-1 at d ≈ 4.23 far exceed 0.8, implying a very large practical difference. Such large d values confirm that the performance gap is not only statistically significant but also highly meaningful in engineering practice. In contrast, effect sizes near 0.02–0.34, such as CO vs. BO, BO vs. FDB-AGDE-3, suggest relatively small practical distinctions in their final weight distributions.

4.2. The 1180-Bar Spatial Dome Truss

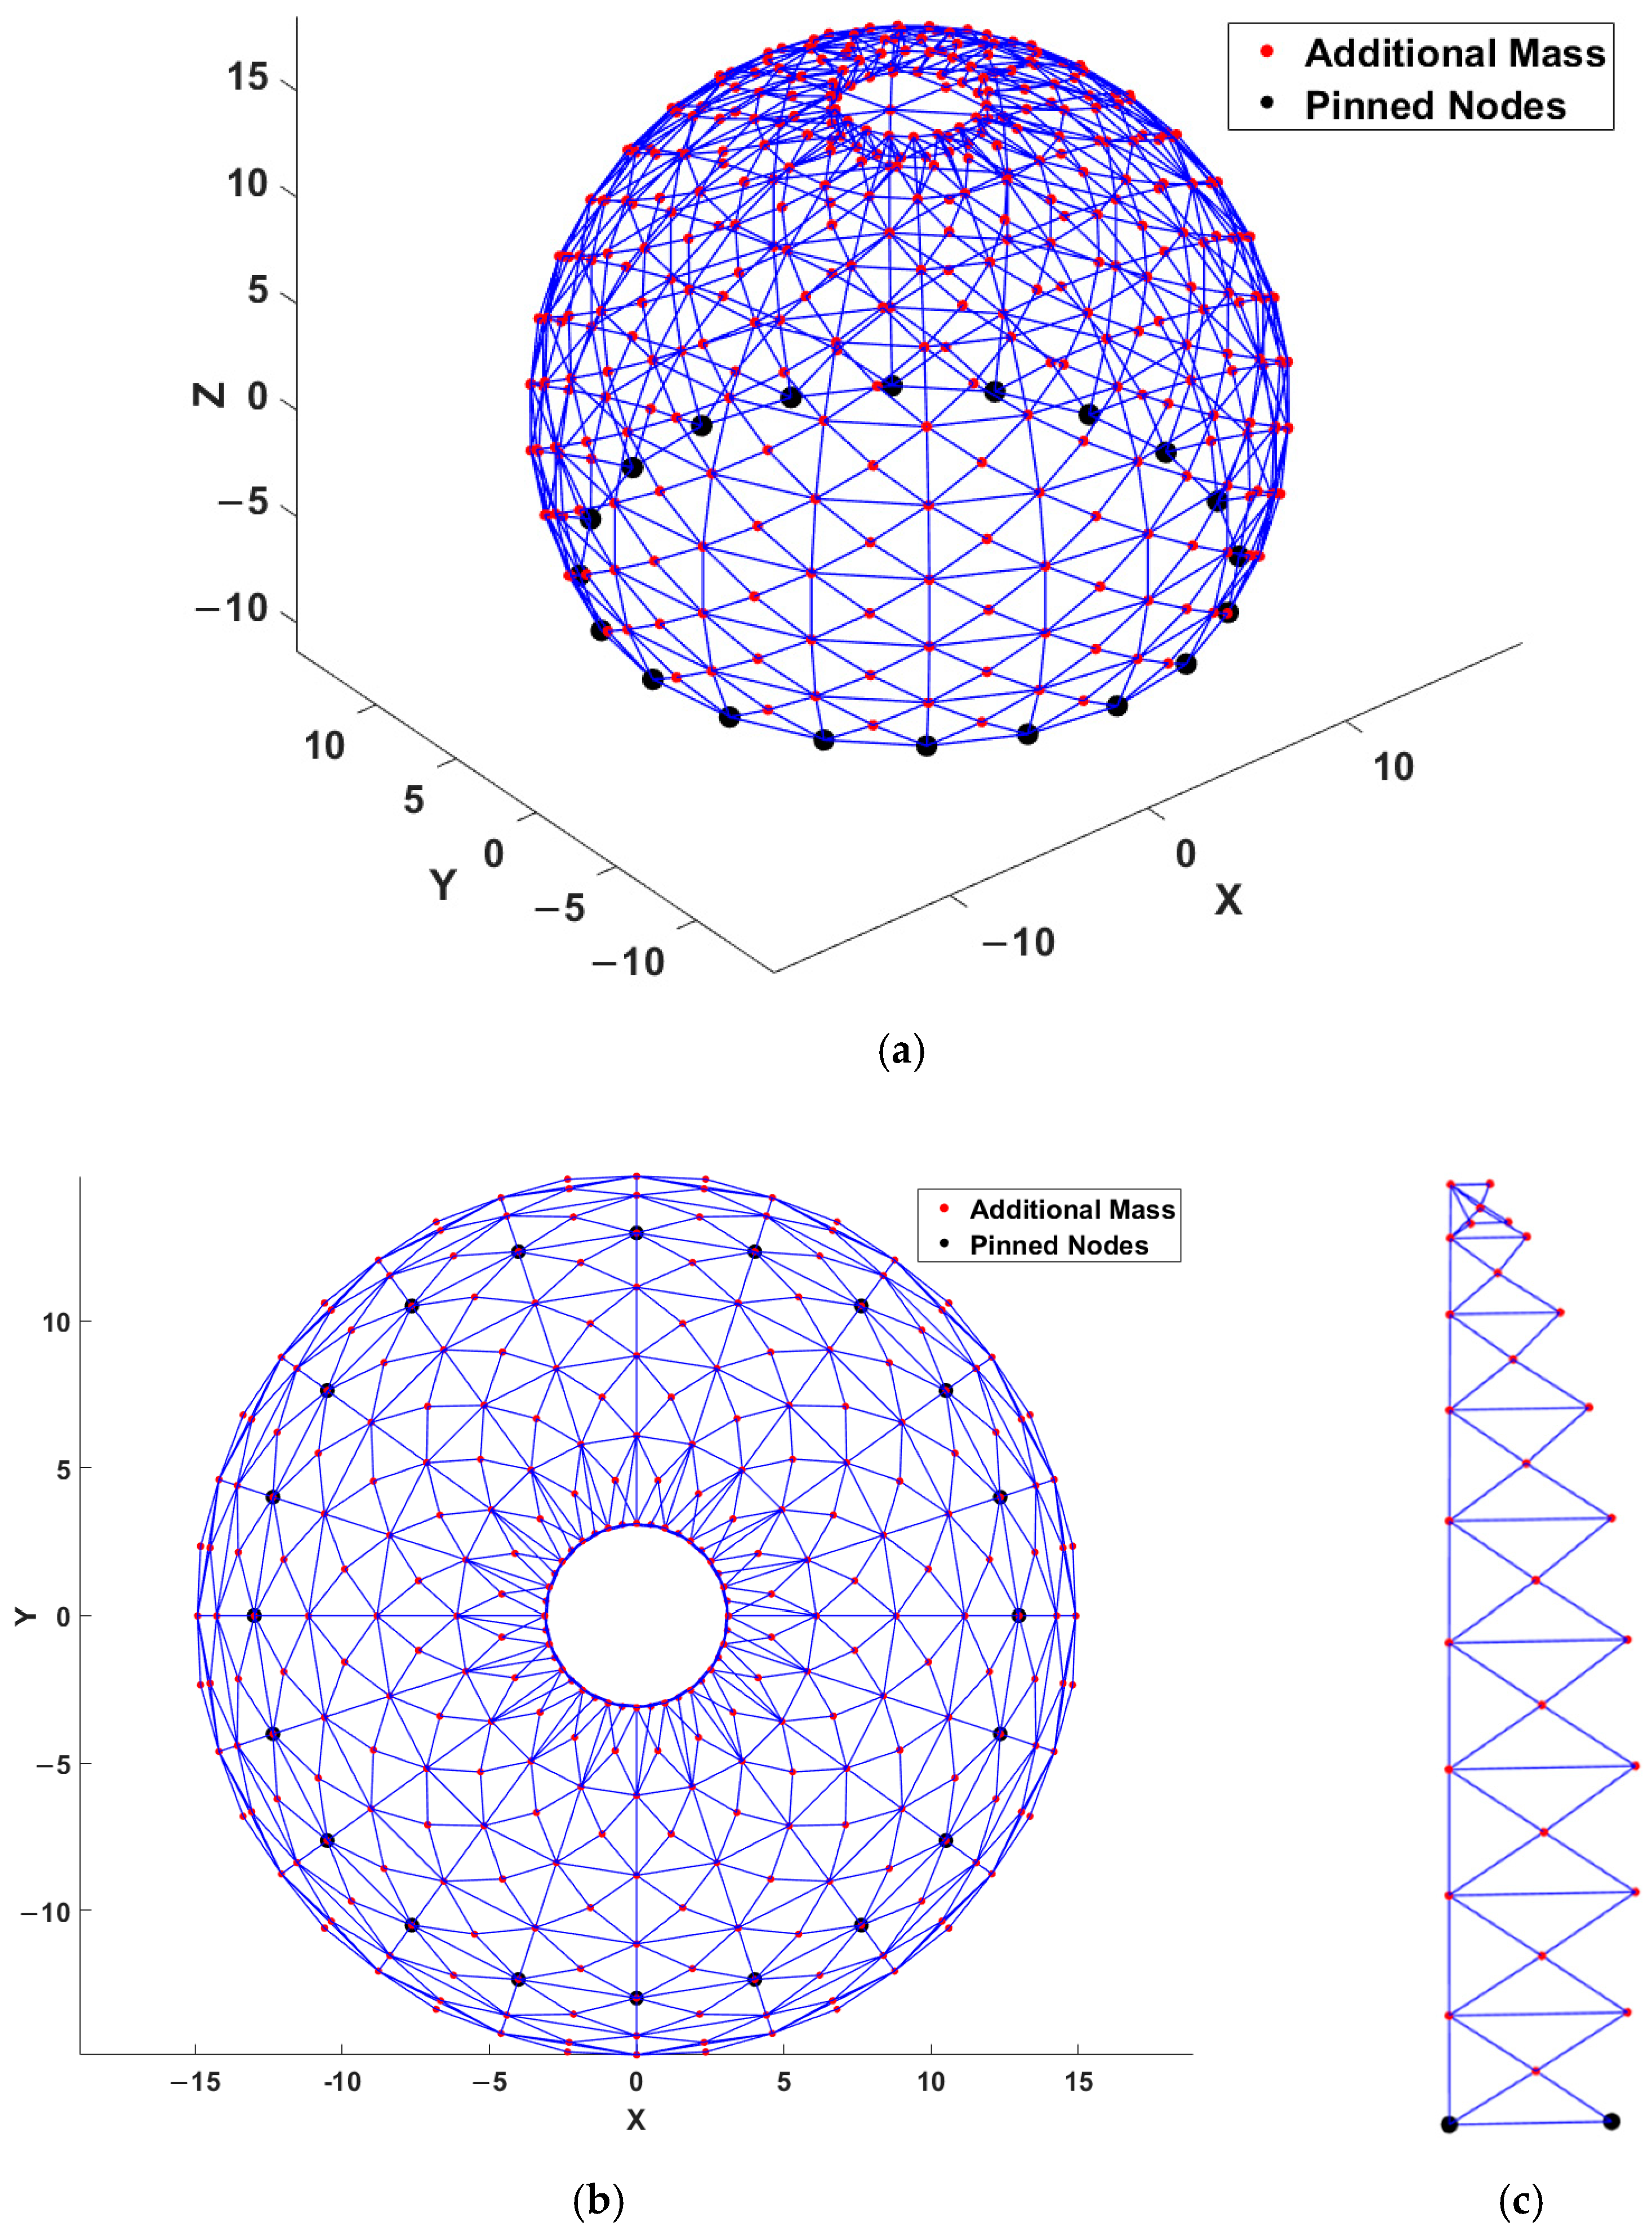
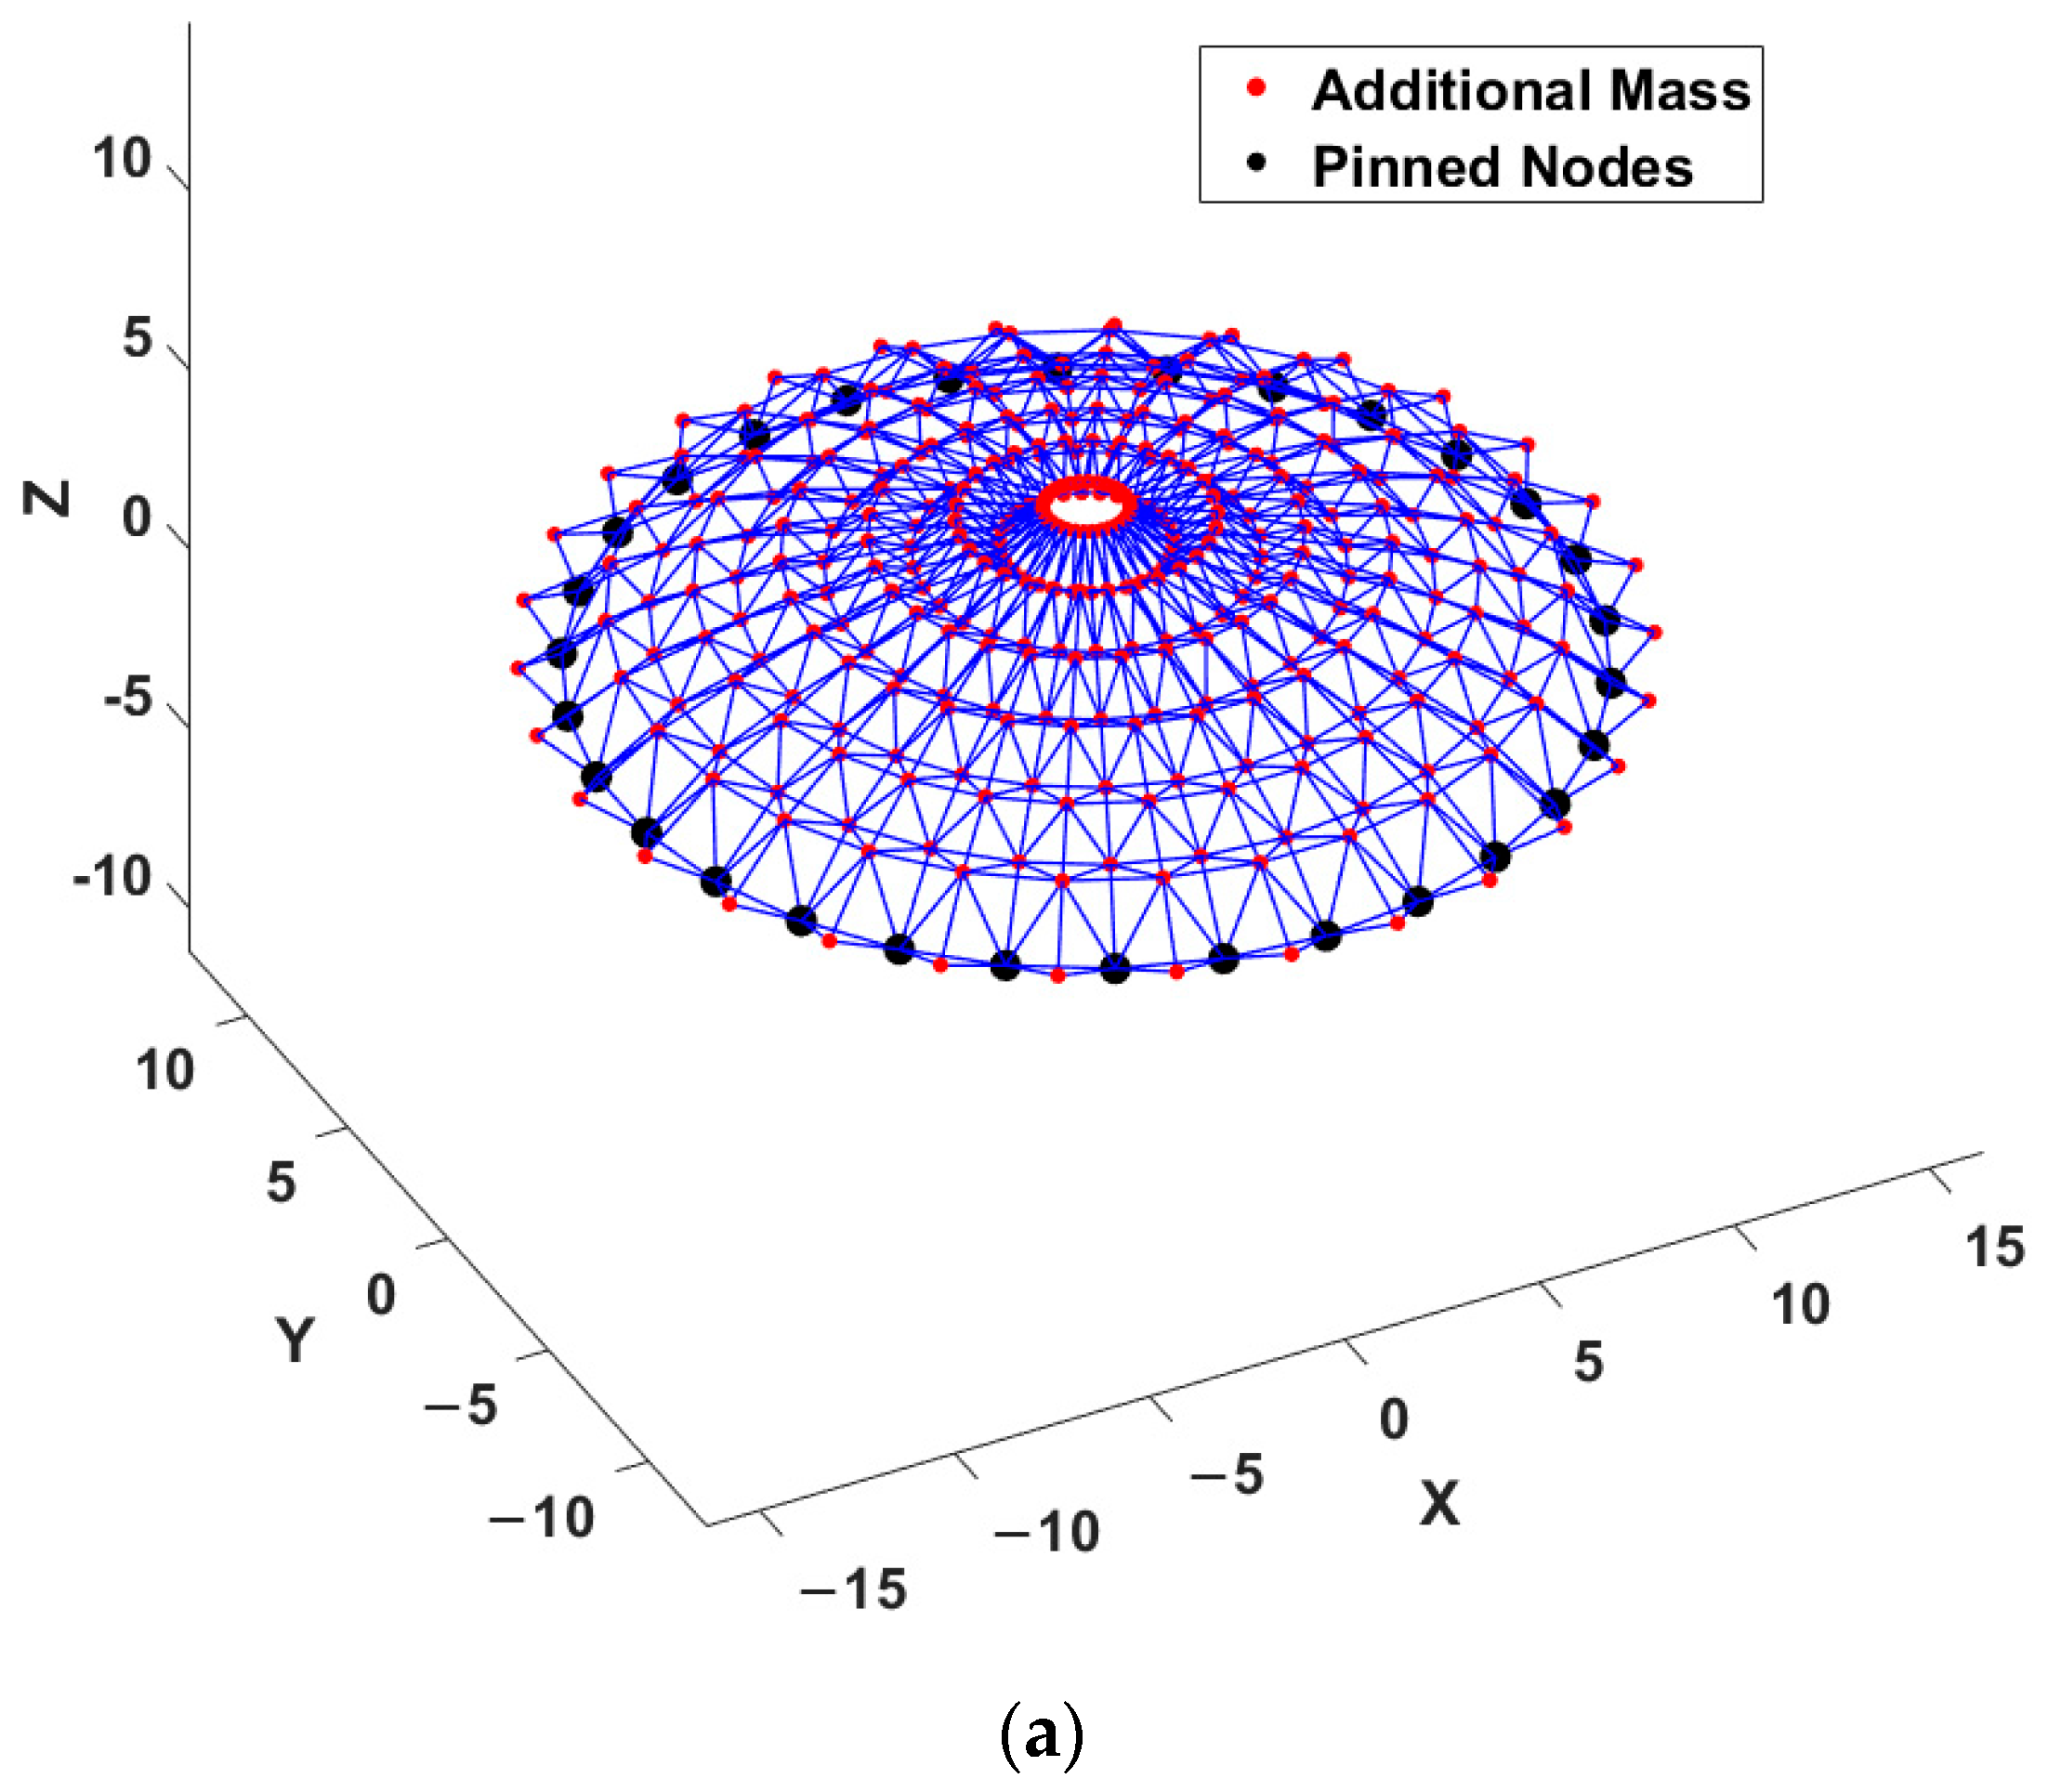
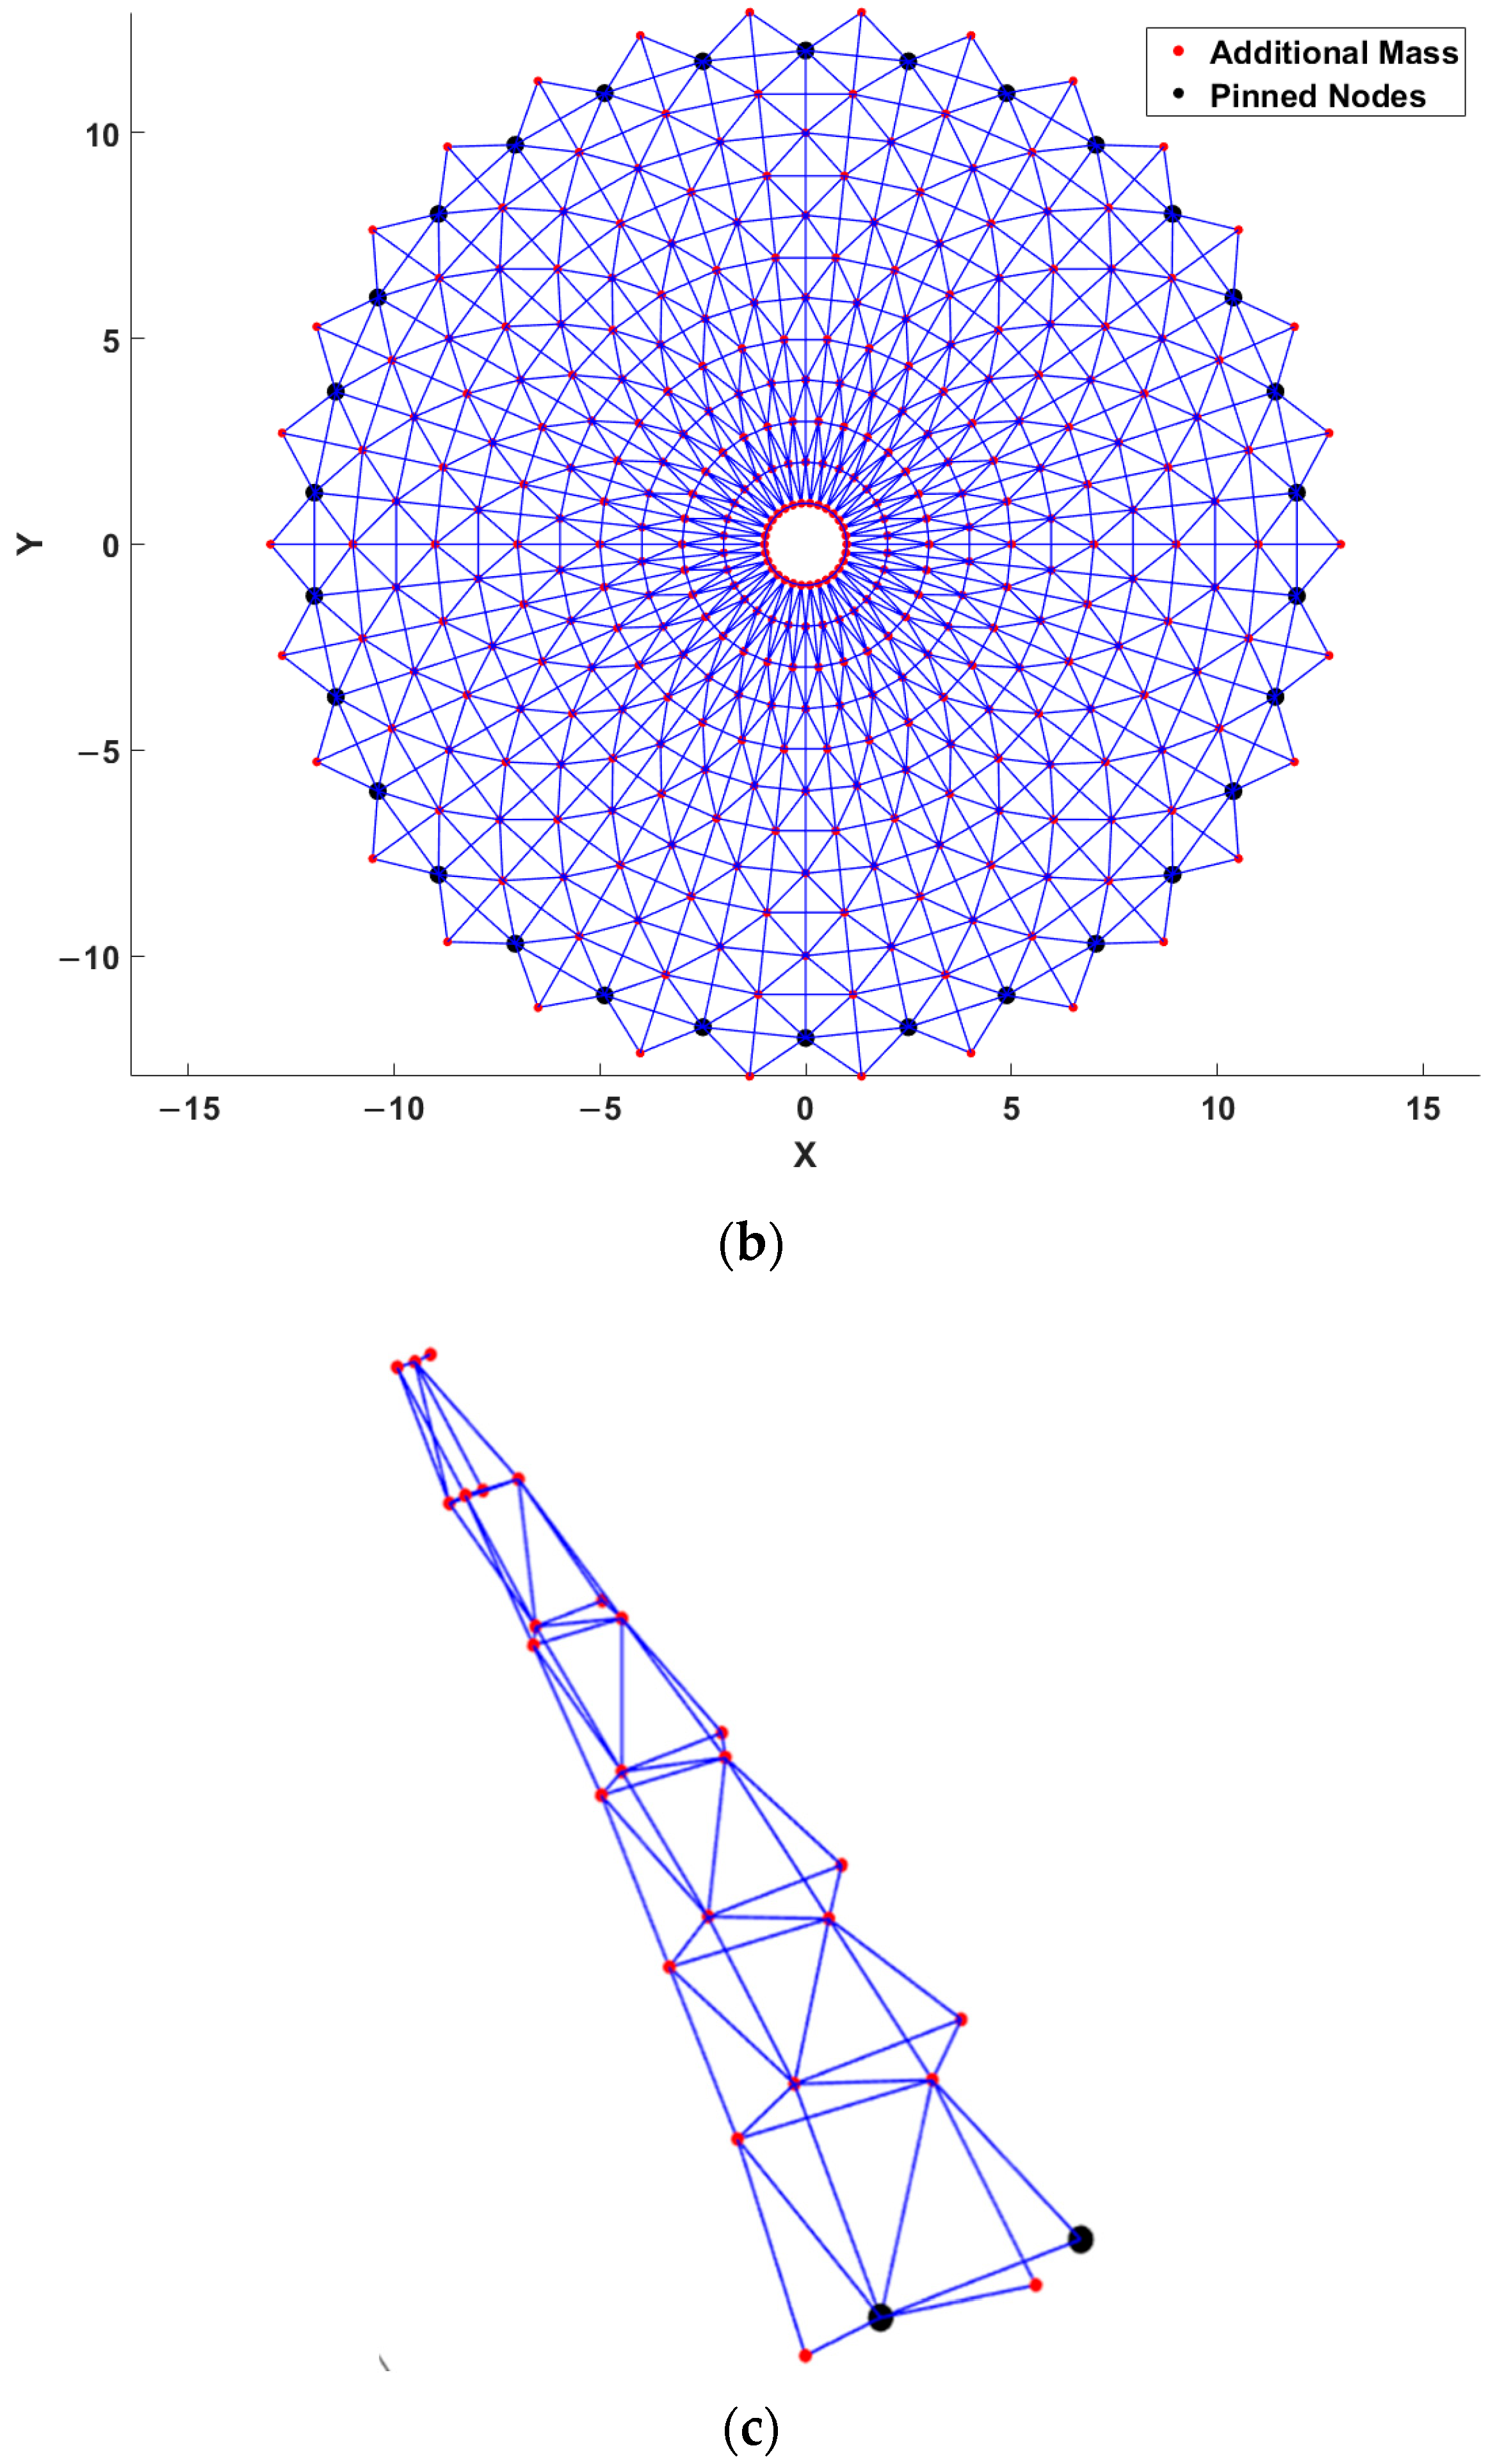
In the second case study, illustrated in Figure 5, a dome-type truss with 1180 members and 400 nodes is investigated. The principal design variables are the cross-sectional areas of the truss members. To exploit the dome’s cyclic symmetry, the structure is divided into substructures, each composed of 20 nodes and 59 members. Within each substructure, all members share the same cross-sectional area, effectively reducing the total number of independent variables. The substructures are arranged with an 18-degree angular spacing between segments, and the nodal coordinates for one representative segment are listed in Table 7. Furthermore, an additional mass of 100 kgf is considered for all unconstrained nodes.
Table 8 presents the optimization results of the proposed algorithms. The best-found design is achieved by BO with a value of 38,030 kg, followed closely by LPO at 38,610 kg, CO at 38,963 kg, and FDB-AGDE-2 at 38,768 kg. FLA ranks last with a design weight of 76,891 kg. BO also demonstrates stable performance, with a low mean value of 38,863 kg and a relatively small standard deviation of 409 kg. Both LPO and CO exhibit similar robustness in their results. In contrast, FLA shows a significantly higher average of 100,367 kg and a large standard deviation of 12,928 kg. Considering the overall distribution and performance, BO ranks first, followed by LPO in second place and FDB-AGDE-2 in third. FLA occupies the lowest rank, securing seventh place, as summarized in the final row of Table 8.
Table 9 demonstrates that all final designs maintain natural frequencies that are either near or slightly above the specified lower bound—approximately 7 Hz for the first two modes and around 9 Hz for the next three modes. Upon examining the results, it is evident that BO reaches these limit values with only a very small difference, indicating an effort to obtain the optimal solution. It is important to note that the MATLAB solver produces frequency values that are entirely consistent with those obtained from SAP2000, validating the accuracy of the finite-element modeling approach.
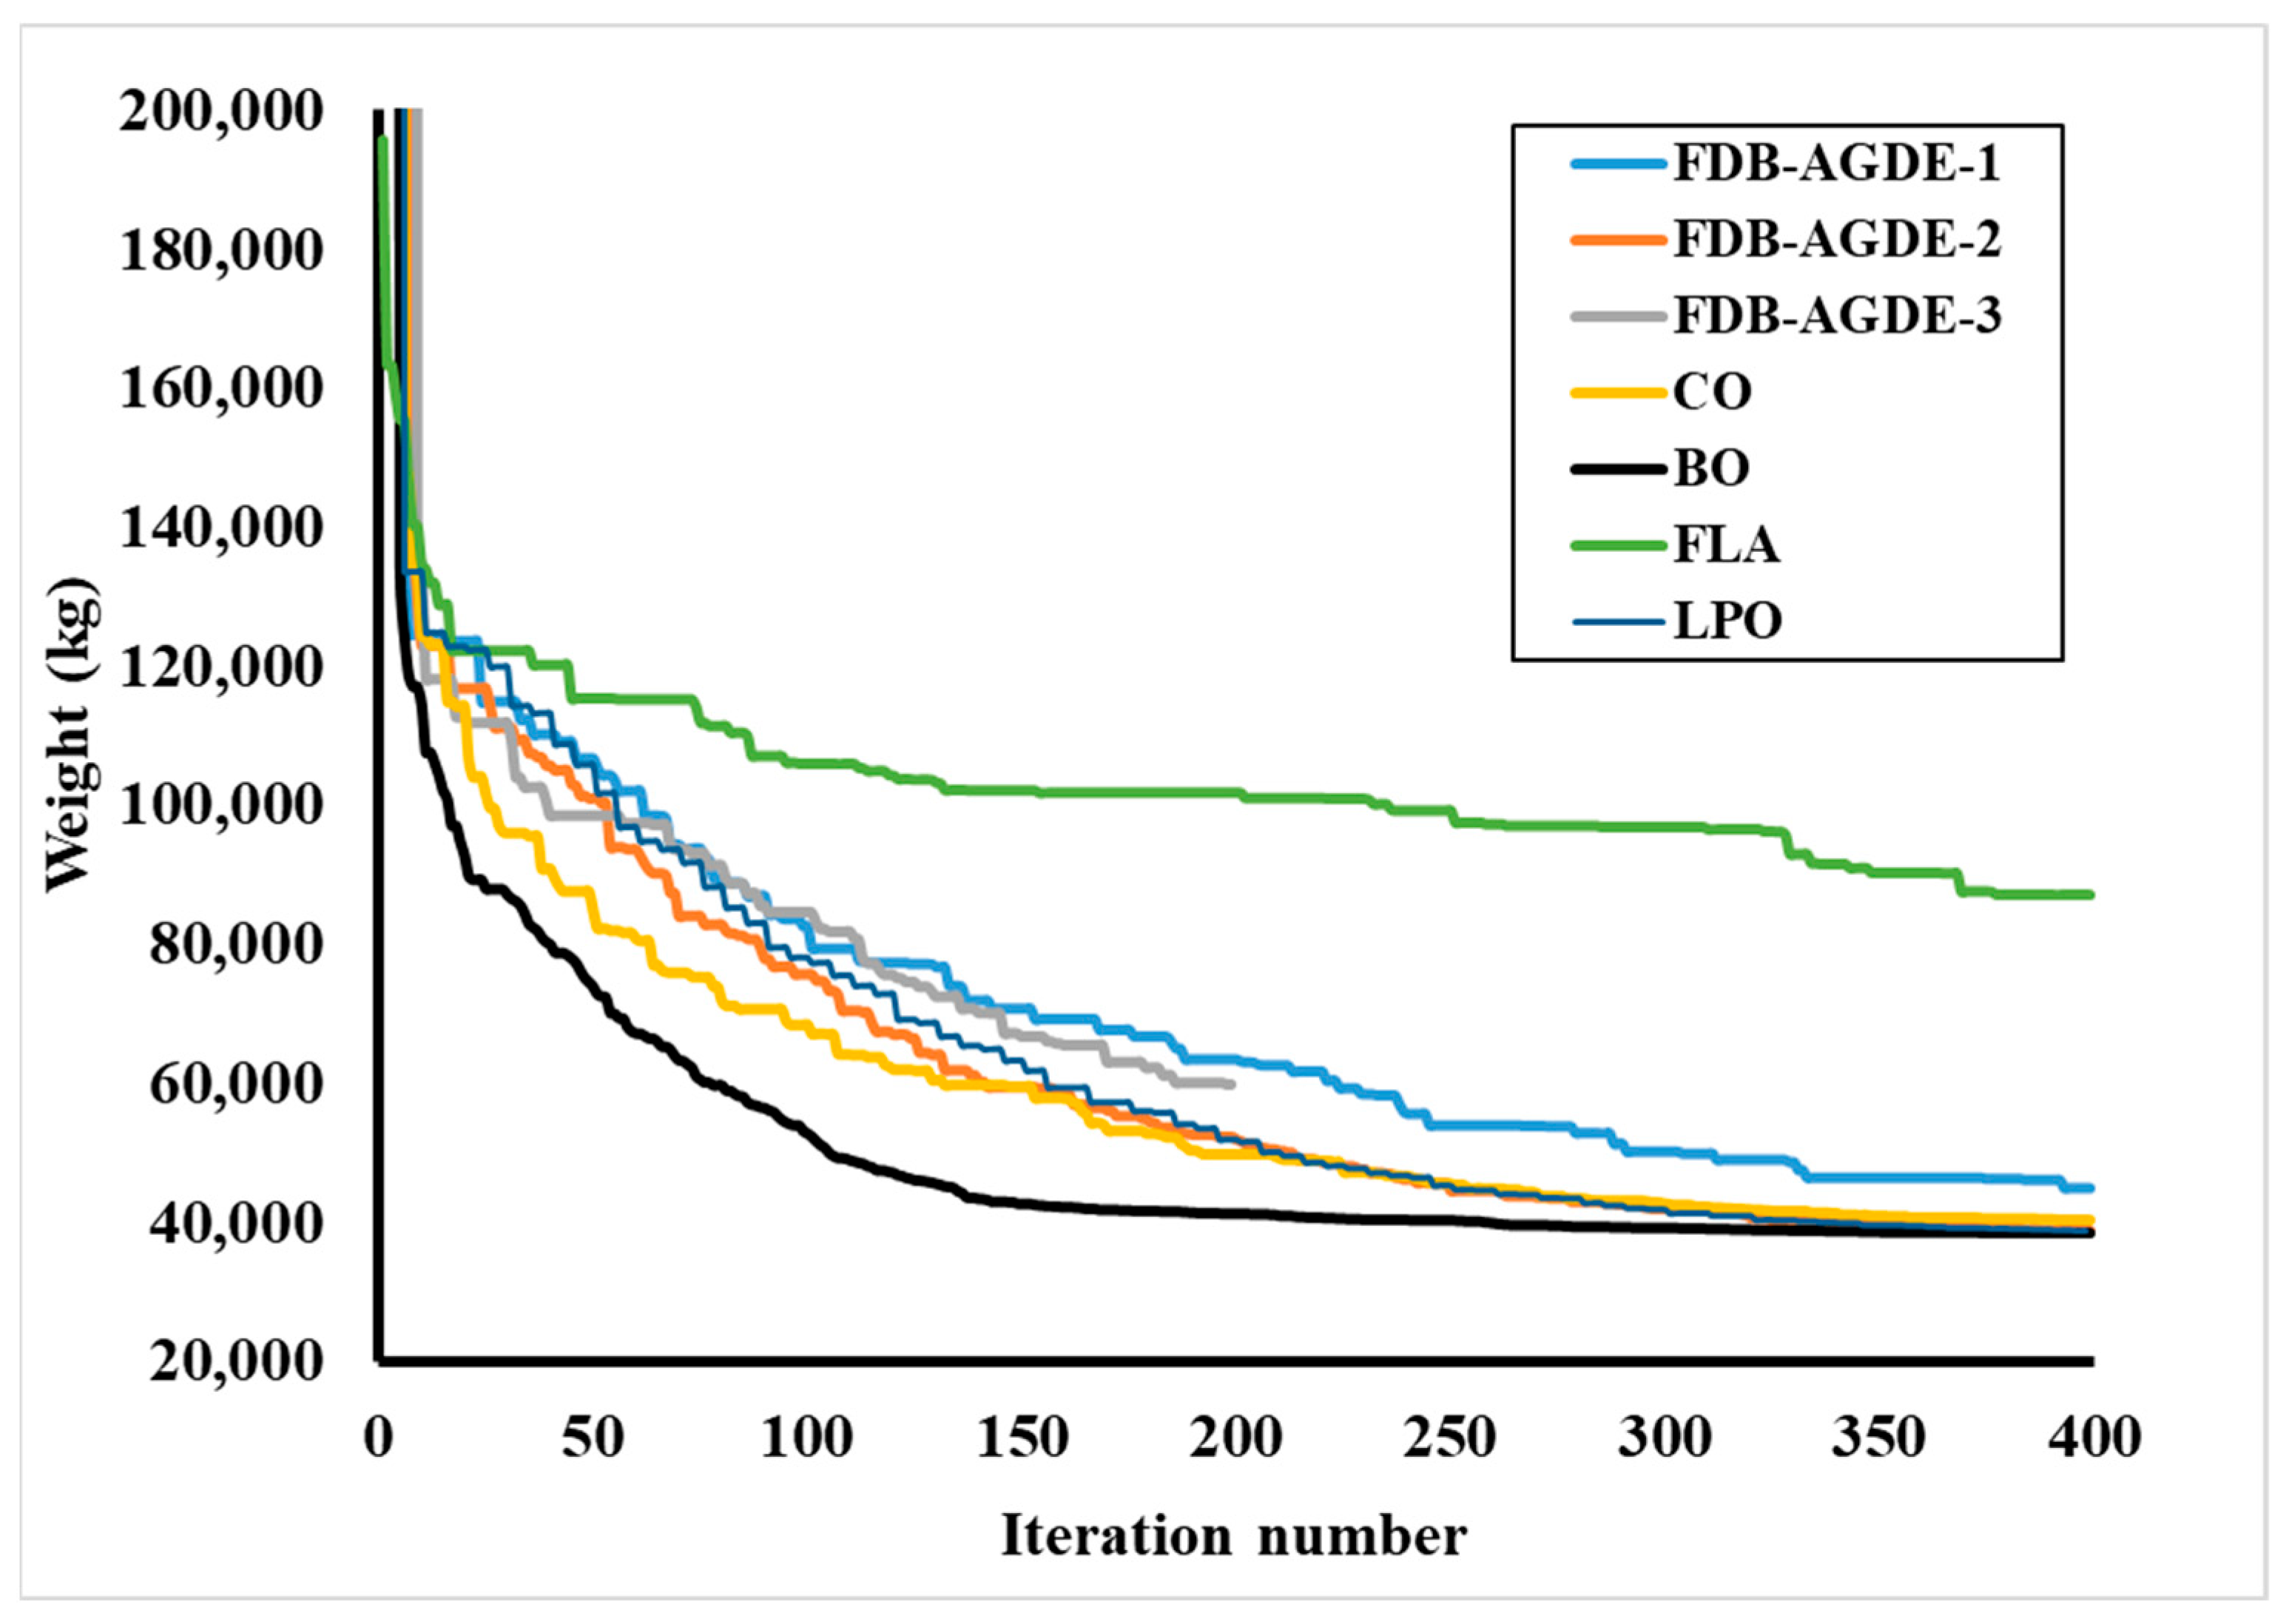
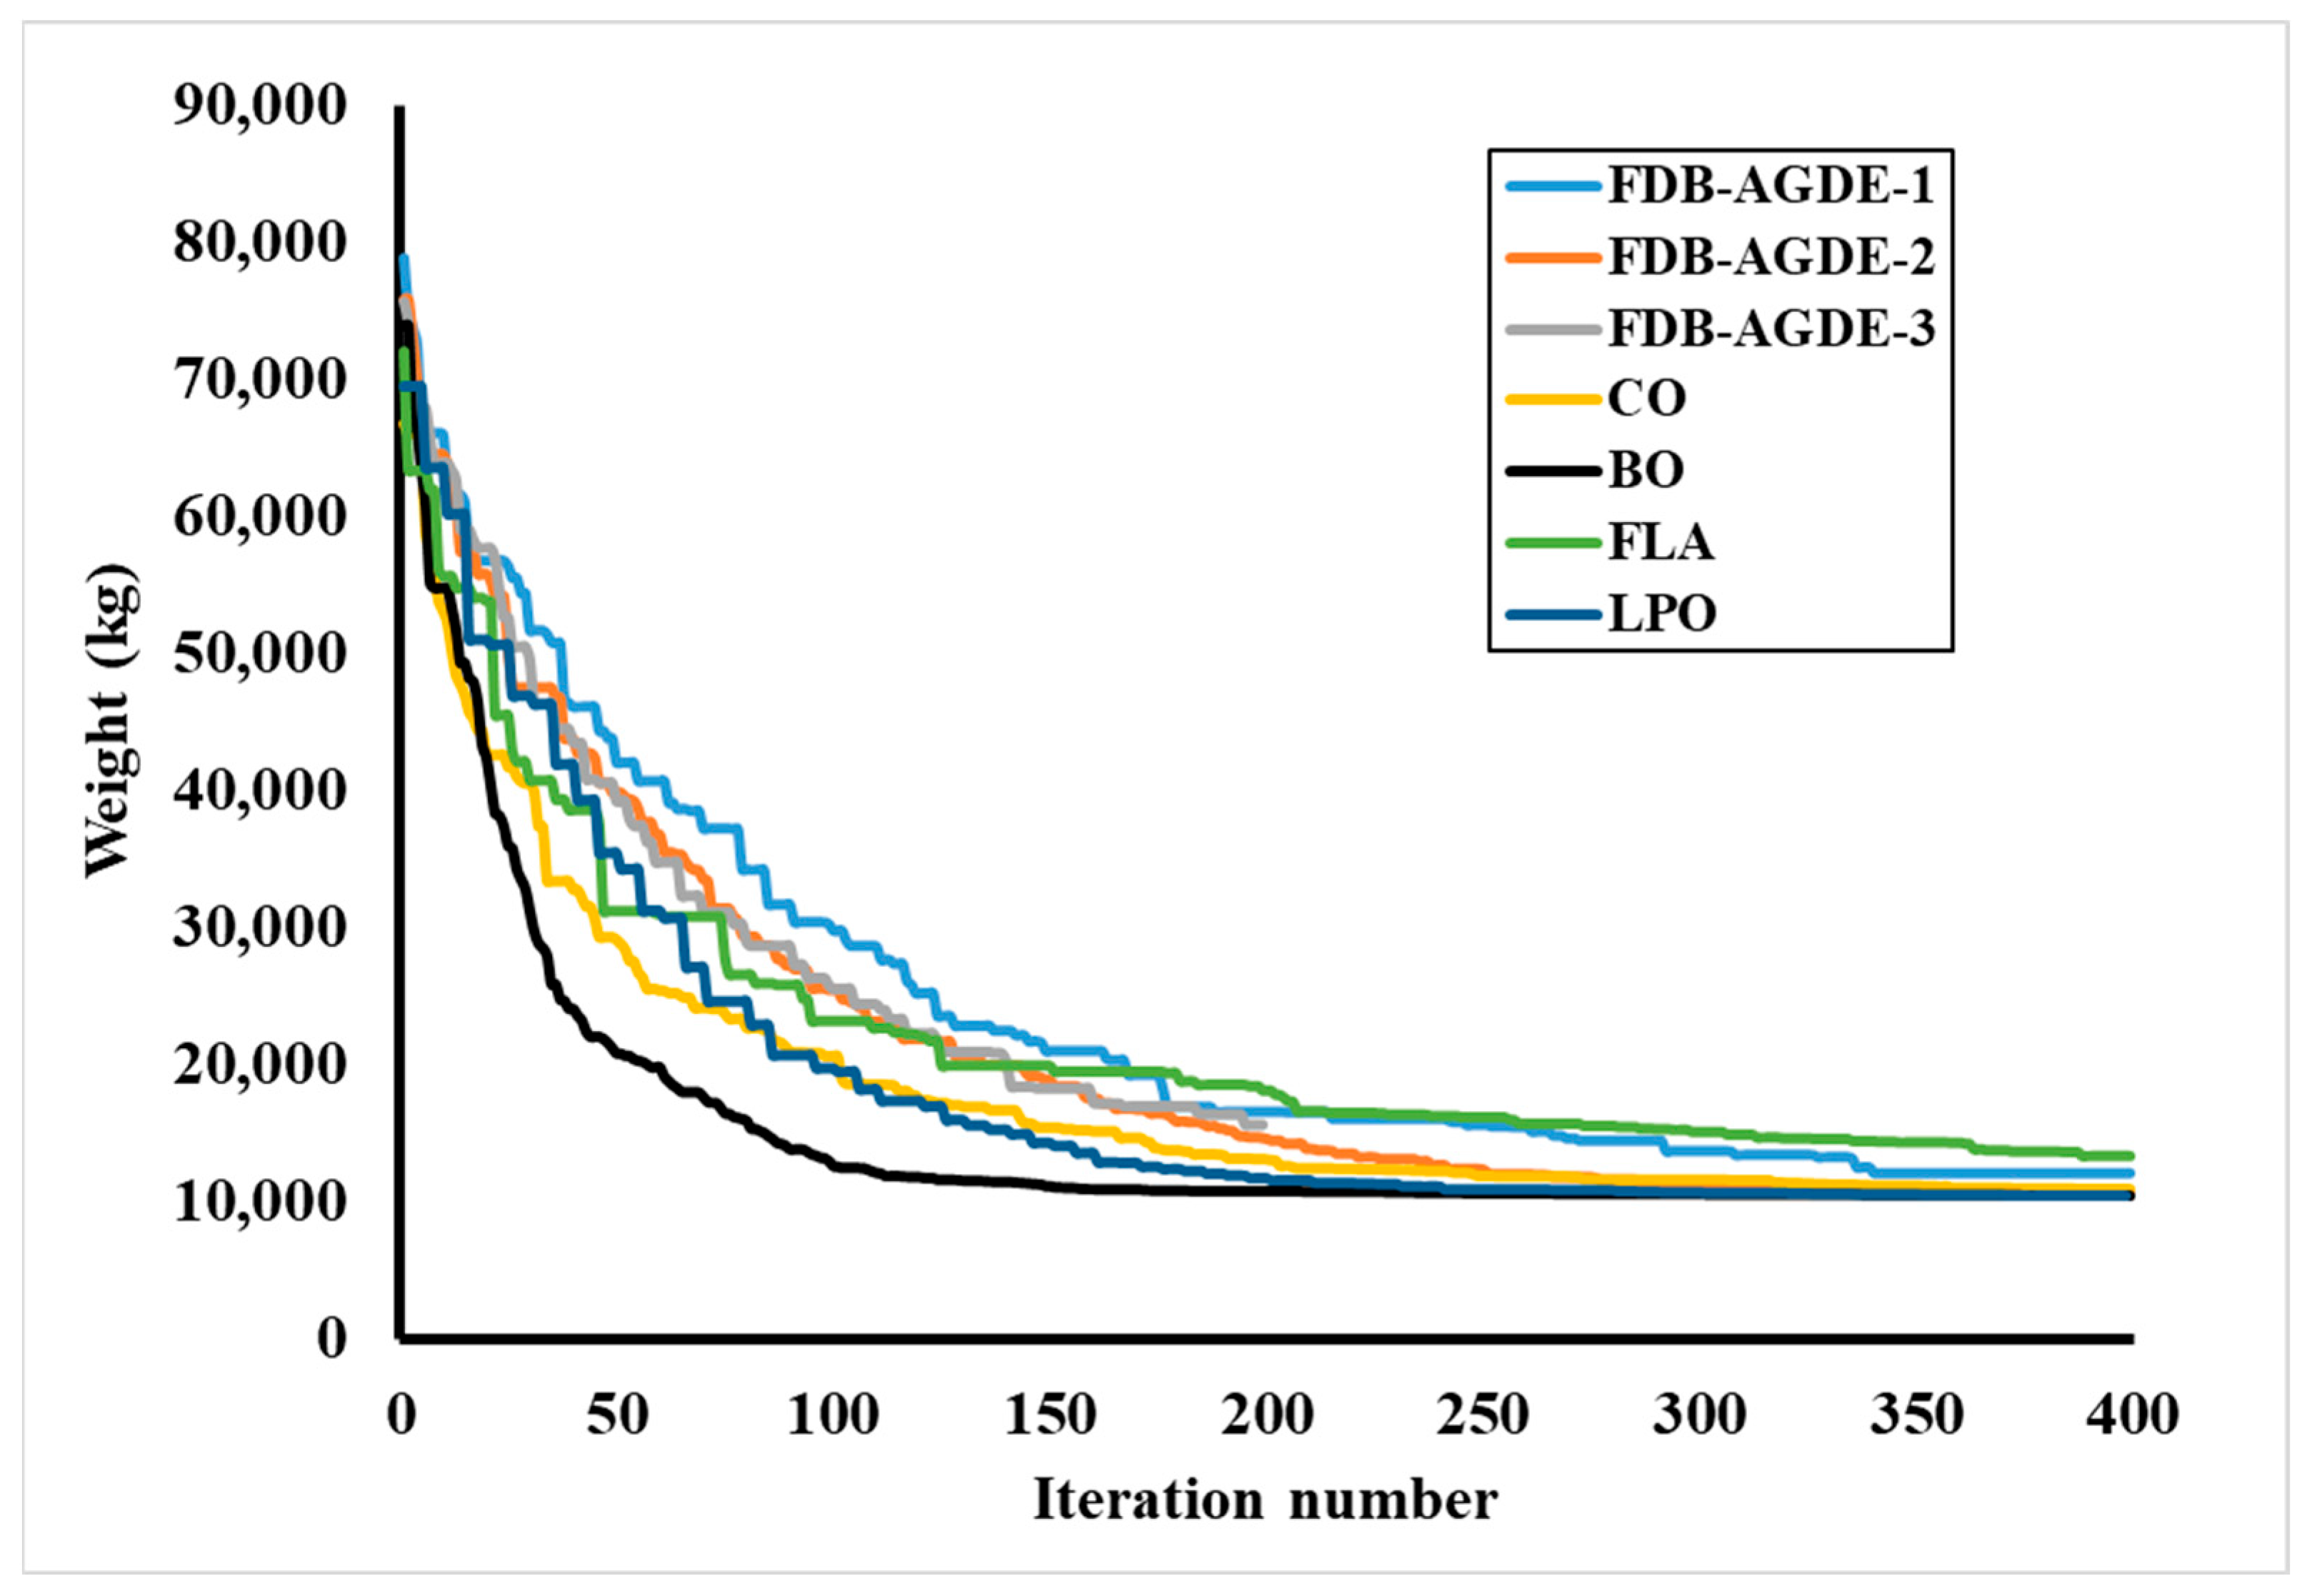
Figure 6 displays the convergence behaviors for seven metaheuristics over 200 iterations in optimizing the 1180-bar dome truss. All algorithms make substantial progress in the first 20–30 iterations, reflecting strong initial exploration of the design space. However, by iteration ~50, their performance diverges, with BO, CO, FDB-AGDE-2, and LPO continuing to trend downward more aggressively. FDB-AGDE-1 and FDB-AGDE-3 show a steady but slower improvement over the later iterations, leveling off at higher total weights than their top-performing counterparts. FLA converges prematurely to a considerably heavier design, illustrating that its parameter settings or exploration strategy may be less effective in this large-scale dome problem. BO, LPO, and CO continue to make modest refinements past iteration ~100. Although the improvement slows, these refinements cumulatively lead to lower final weights by iteration 200. FDB-AGDE-2 also shows a relatively sustained descent, though it levels off slightly sooner than BO or LPO.
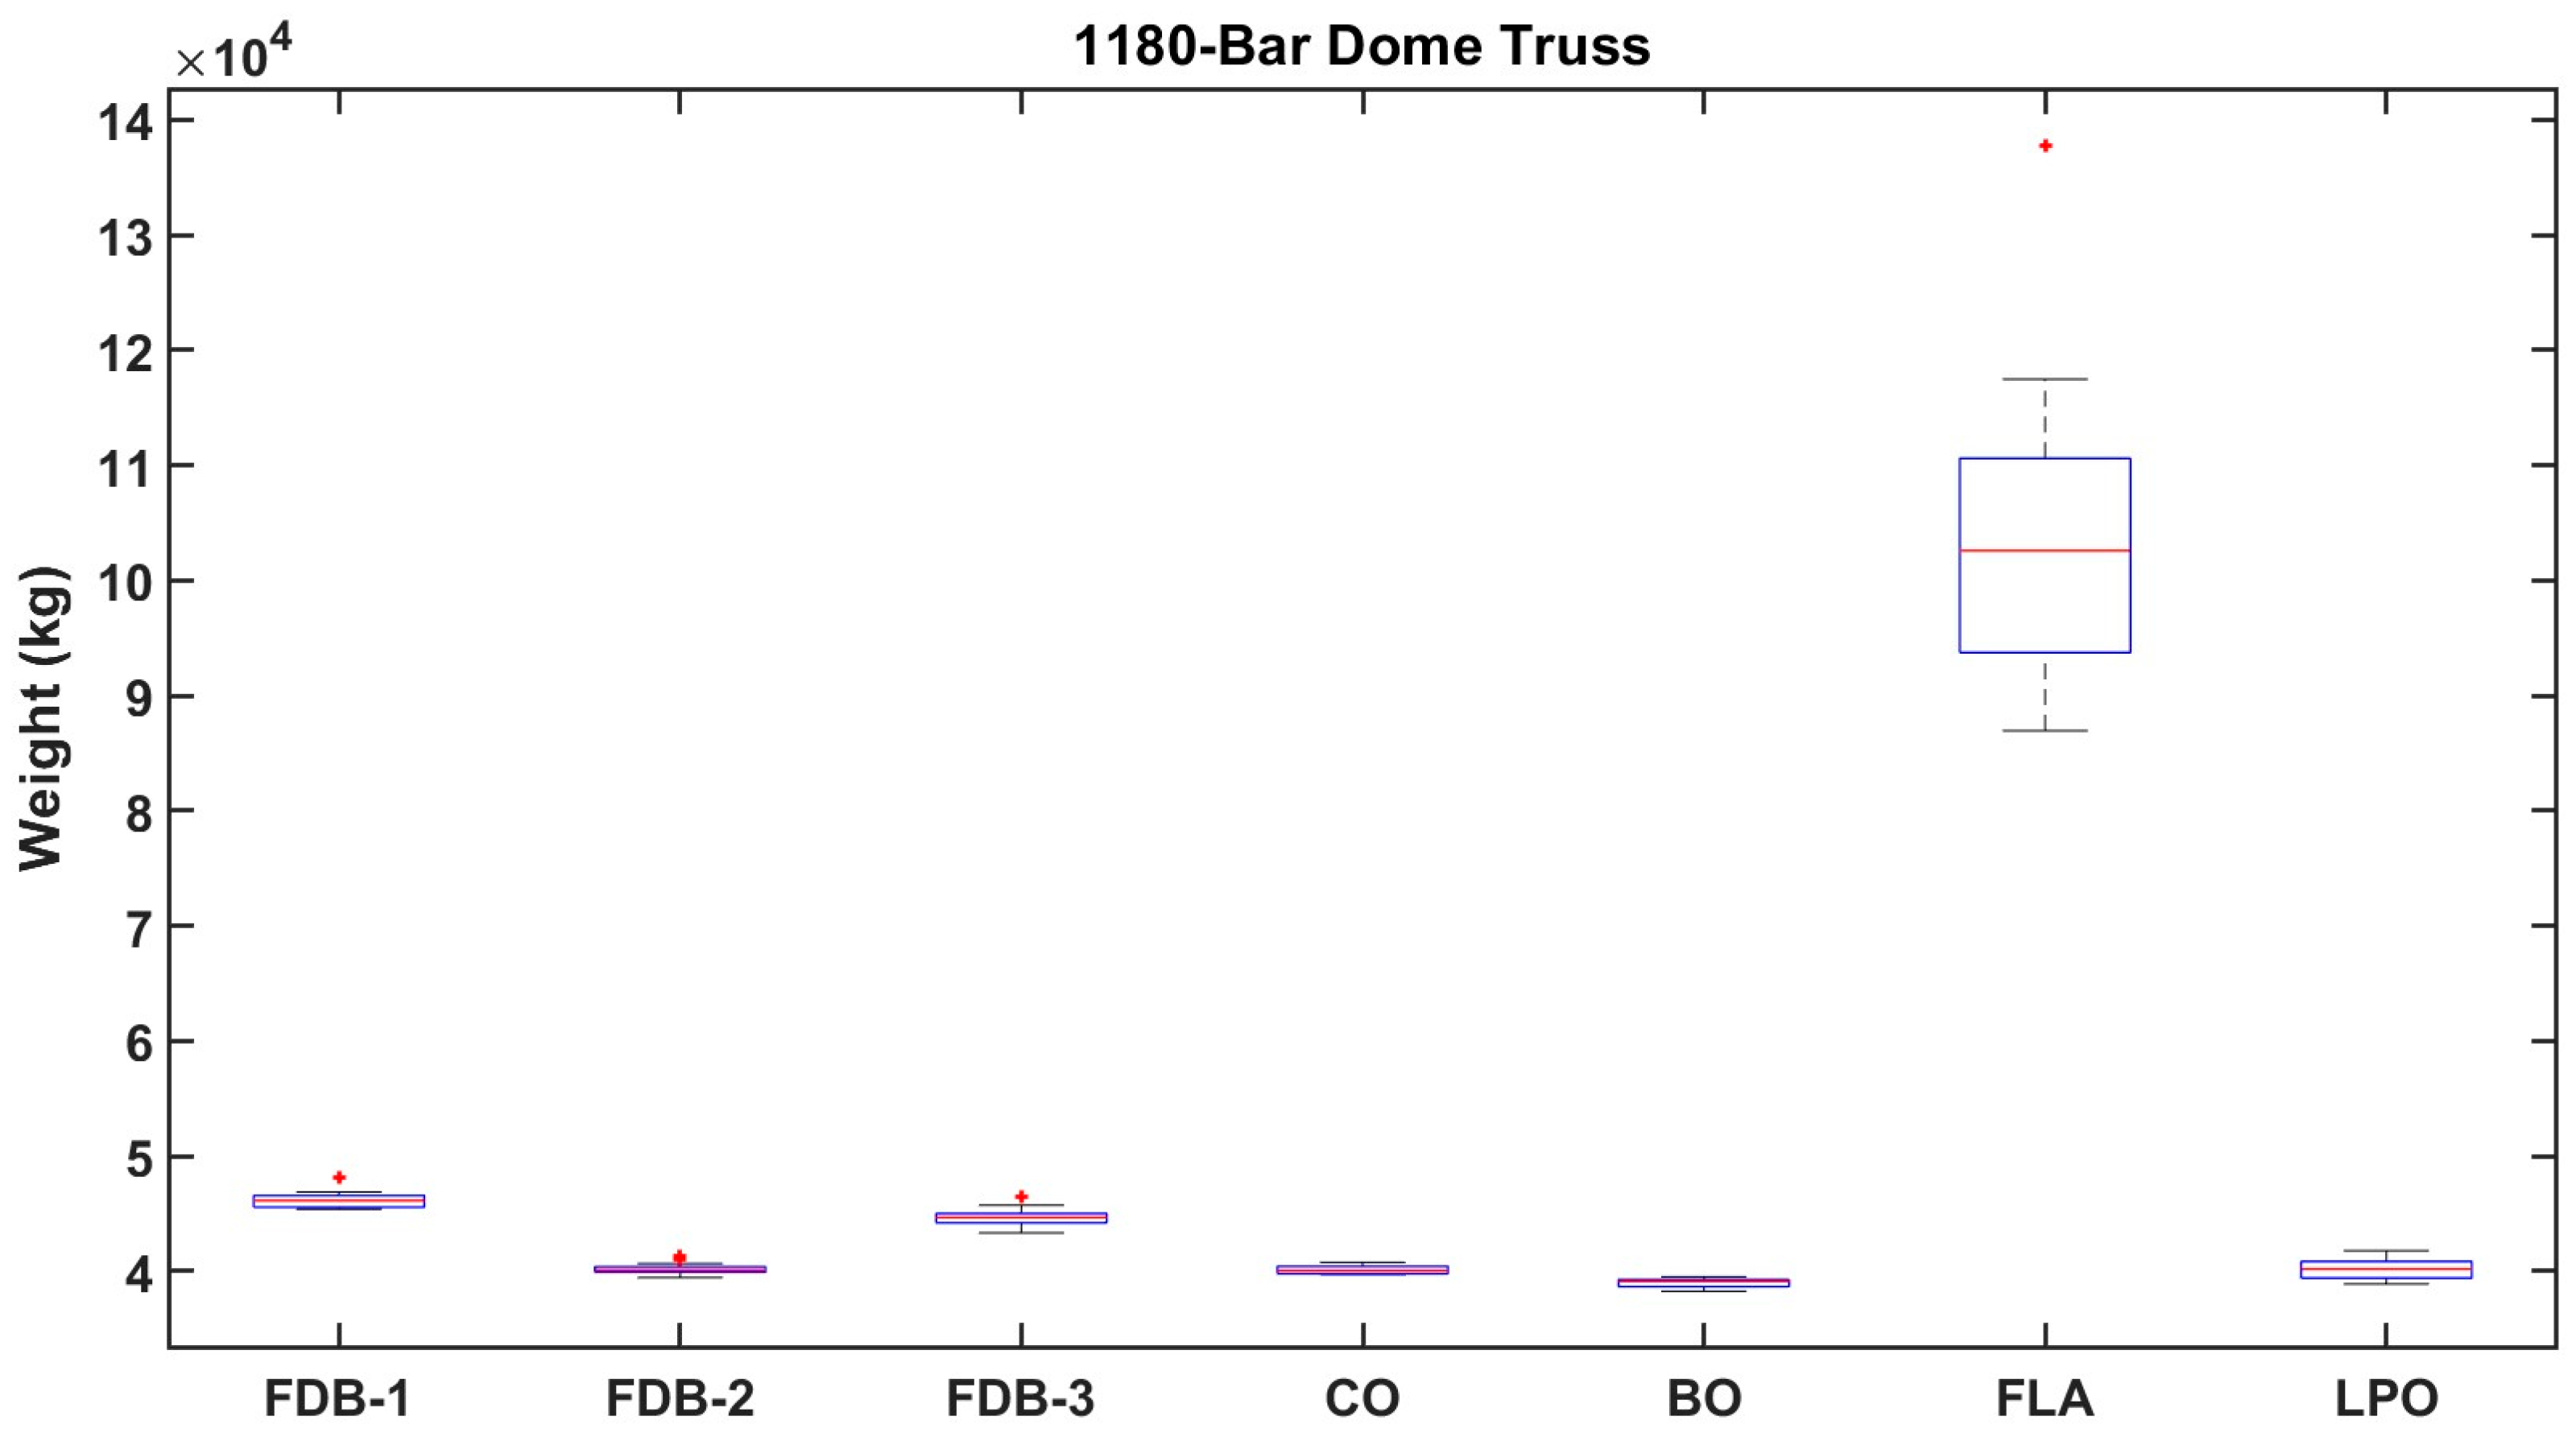
Figure 7 provides a statistical comparison of the final solution quality across multiple runs. BO attains the smallest median weight (approximately 38,800 kg) with a very narrow spread, indicating both strong performance and high consistency. LPO and CO also show relatively tight distributions, though their means and medians are slightly higher. FDB-AGDE-2 yields competitive solutions, with some runs closely rivaling those of BO. However, the other variants, namely FDB-AGDE-1 and FDB-AGDE-3, display higher medians and wider spreads in their results. This performance gap may stem from differences in parameter tuning or the hybridization strategies used in each variant. FLA’s box reveals both high median weight (>70,000 kg) and large spread, confirming it struggles with this high-dimensional dome truss relative to the other algorithms. Notably, FLA exhibits a single outlier far above its median, indicating an exceptionally heavy design compared to the rest of its runs.These results underscore that not only is the final weight important, but so too is consistency across runs.
Figure 8 illustrates the p-values from Wilcoxon rank-sum tests, while Table 10 reports Cohen’s d-effect sizes for pairwise comparisons. Extremely low p-values between BO and other algorithms confirm that the performance differences in final weights are statistically significant. Where p-values approach 1.0 in some comparisons among CO, FDB-AGDE-2, and LPO, there is insufficient evidence to claim one method definitively outperforms the other. Several pairwise comparisons yield very large d-values, indicating not just statistical significance but also high practical importance. For instance, comparing BO and FLA yields d ≈ 7.73, emphasizing that FLA’s inferior results are both reliably and substantially worse. Conversely, when d < 0.1, the two methods’ distributions are nearly indistinguishable from a practical standpoint.

4.3. The 1410-Bar Spatial Dome Truss

In the final and the largest example, a dome structure comprising 390 nodes and 1410 members is utilized, as illustrated in Figure 9. The geometry is divided into repeating substructures, each containing 13 nodes and 47 members, with the nodal coordinates for one representative substructure provided in Table 11. The primary objective is a sizing optimization, where the cross-sectional areas of the 47 member groups serve as the design variables. In addition, each free node is assigned a nonstructural mass of 100 kg.
Table 12 presents the best, mean, and worst structural weights found by each metaheuristic, along with their standard deviations, constraint violations (CVs), and Friedman ranks. LPO achieves the lightest best solution at 10,407 kg, closely followed by BO at 10,524 kg and CO at 10,573 kg. FDB-AGDE-2 also performs well, reaching a best solution of 10,738 kg, while FDB-AGDE-1 and FDB-AGDE-3 converge to slightly heavier best solutions, with values of 12,136 kg and 11,450 kg, respectively. FLA yields the heaviest best weight of 13,400 kg, indicating less effective exploration or local refinement in this high-dimensional problem. LPO again stands out with the lowest mean weight of 10,576 kg, reflecting consistently good performance across multiple runs. The methods ranked second and third in terms of mean weight are CO with 10,846 kg and FDB-AGDE-2 with 10,946 kg. FLA, on the other hand, not only exhibits a higher mean weight of 18,448 kg but also shows a large standard deviation of 2413 kg, indicating significant variability in its results across different runs. This high variability stands in stark contrast to the top-performing algorithms, which maintain standard deviations below approximately 300 kg. According to the Friedman ranking, LPO holds the top position (rank 1), followed by CO in second (rank 2), BO in third (rank 3), and FDB-AGDE-2 in fourth (rank 4). FLA ranks last (7), confirming its comparatively weaker performance under these conditions.
Table 13 confirms that all designs meet the frequency constraints, with only minor differences in the first five modes. Upon examining the table, it becomes clear that approaching the frequencies of the fourth and fifth modes is critical for attaining the optimum solution. While BO and CO achieve the limit in all five frequency modes, other algorithms fall short, particularly in approximating the limits of the fourth and fifth mode frequencies. The near-identical results from MATLAB and SAP2000 validate that each algorithm’s final design remains feasible in two different solvers.
Figure 10 shows how each of the seven metaheuristics reduces the dome’s weight over 200 iterations. Almost all algorithms lower the structural weight dramatically in the first 20–30 iterations, indicating strong early-stage exploration. In particular, BO, CO, and LPO drop below 40,000 kg after ~50 iterations, outpacing FLA and the FDB-AGDE variants at that stage. After ~75 iterations, differences among methods become clearer. LPO and CO continue steady improvement, with LPO approaching ~10,000 kg near iteration 150. FDB-AGDE-2 also exhibits consistent progress, stabilizing around ~11,000 kg by iteration 200. By the end, LPO, BO, and CO converge to lighter designs than FDB-AGDE-1/-3, FDB-AGDE-2, or FLA. FLA lags significantly behind, indicating possible difficulties in converging on the global optima.
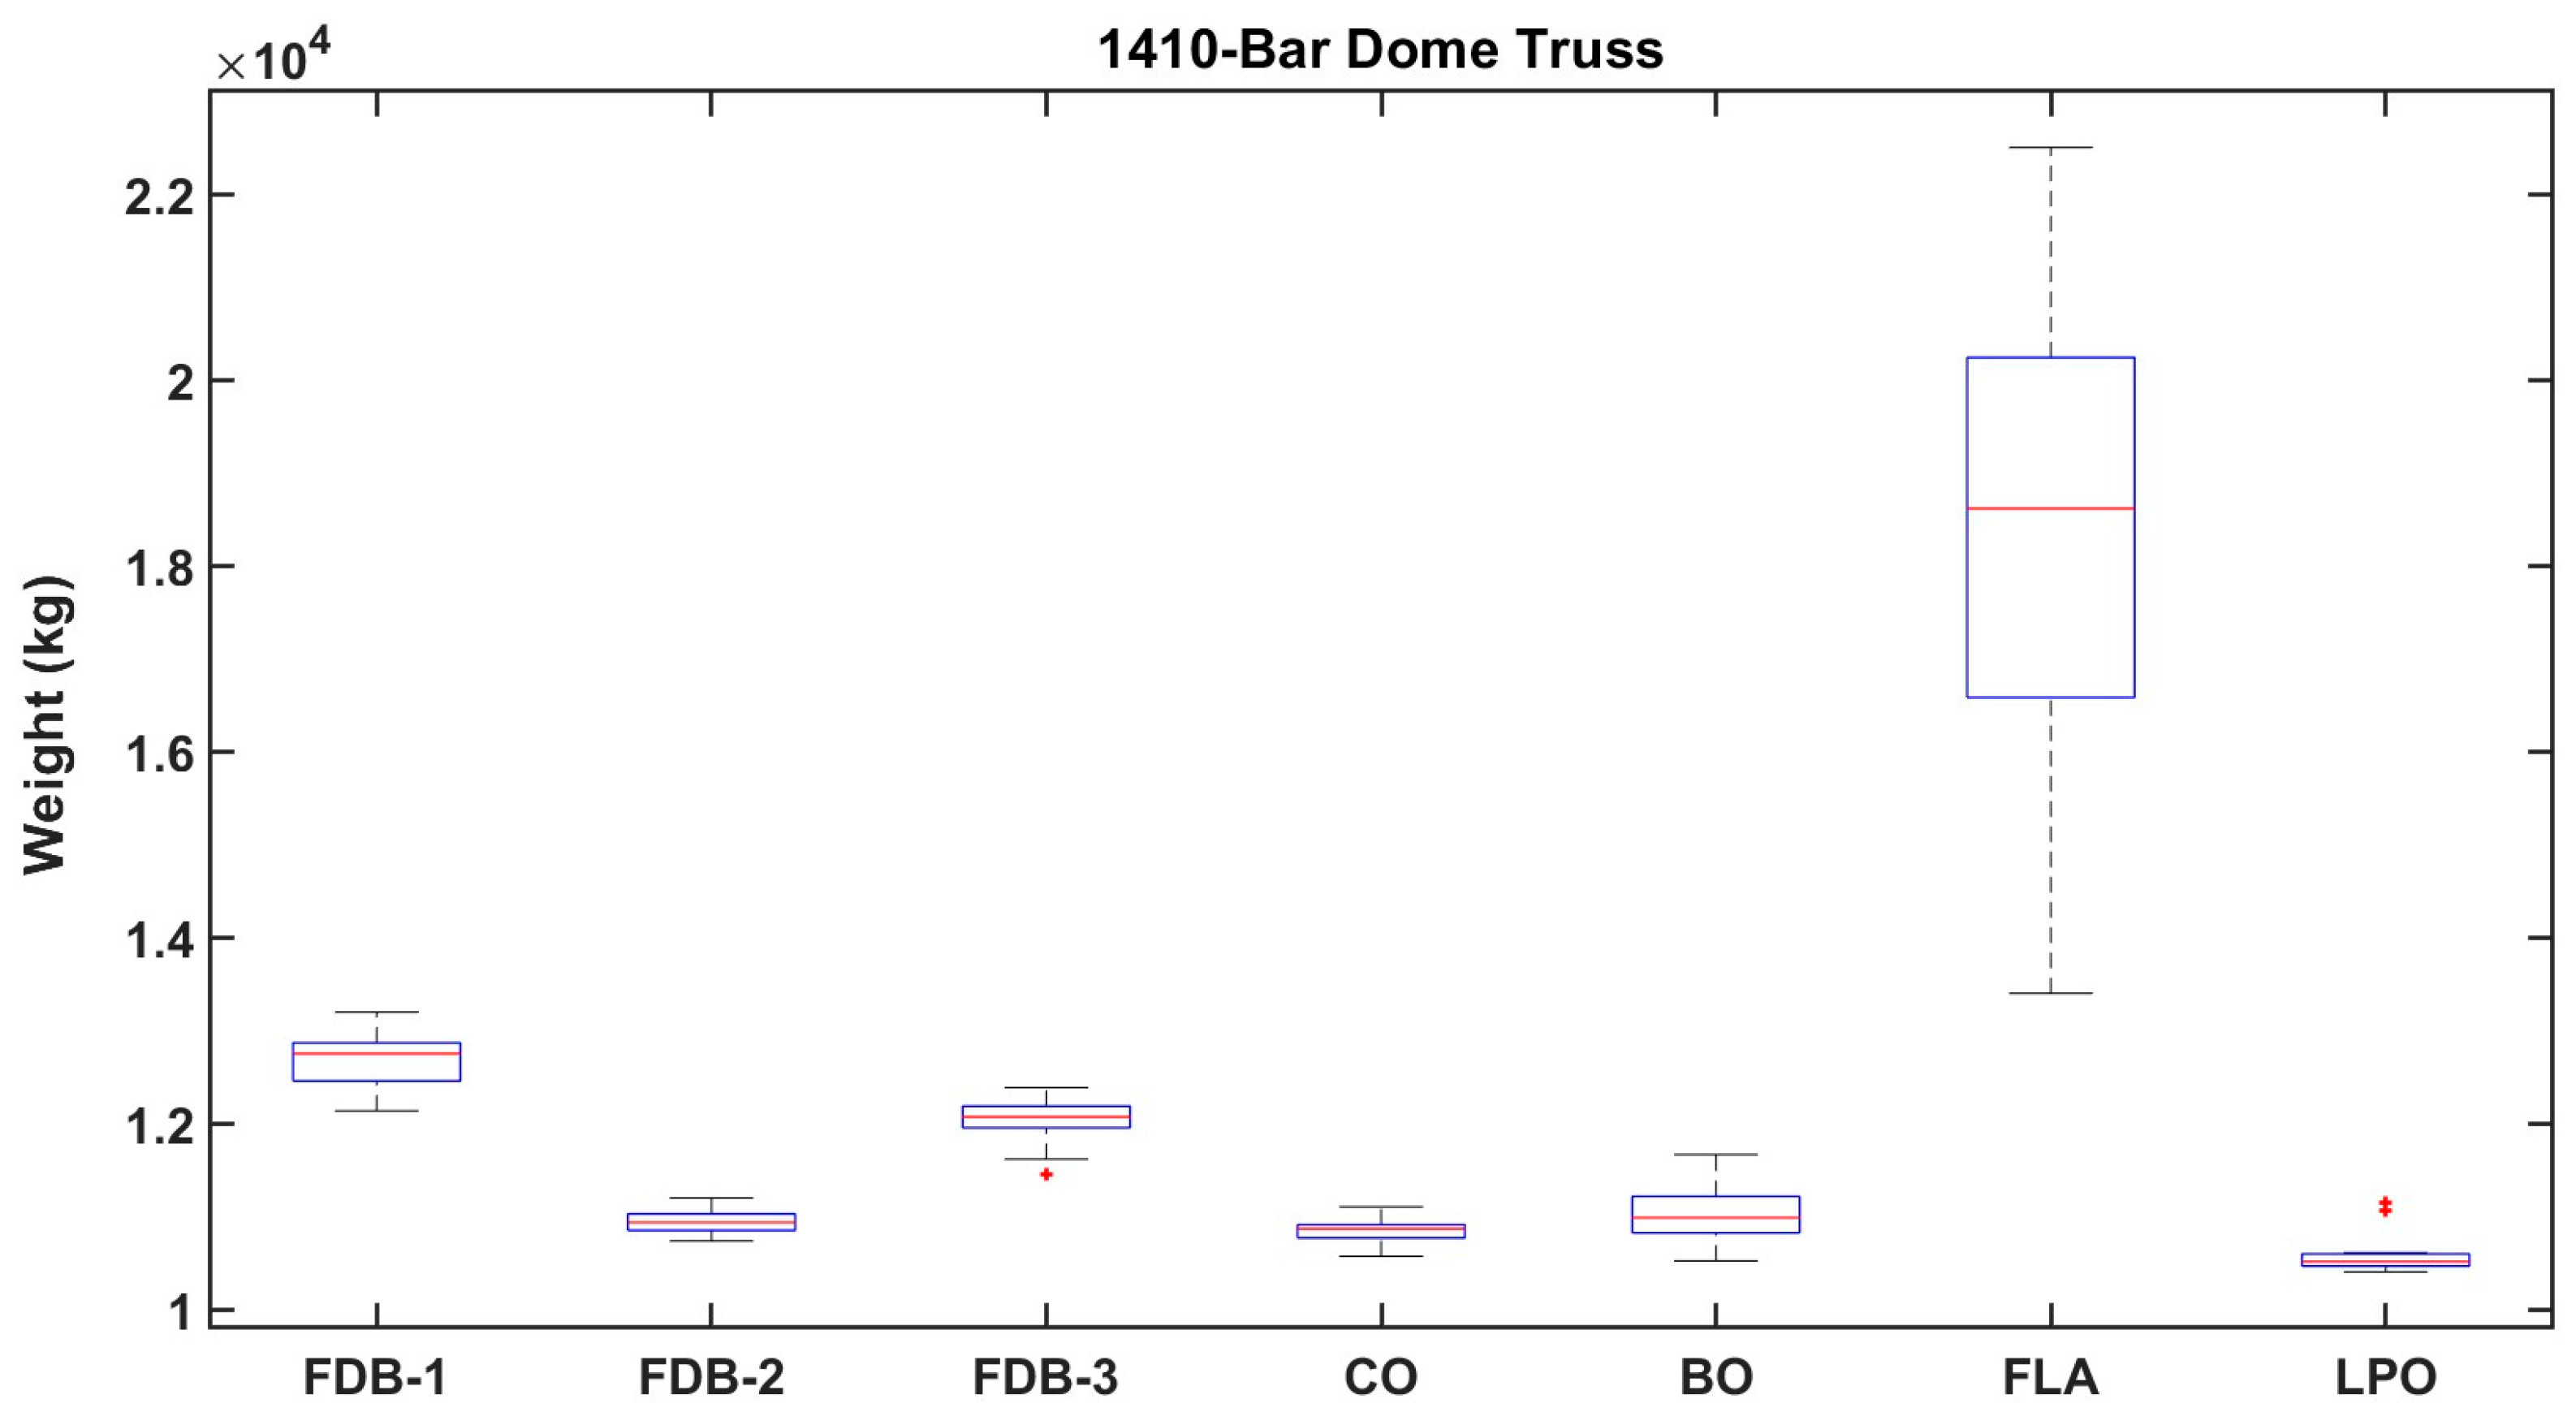
Figure 11 provides box plots of final weights from repeated runs. LPO’s box is centered around the lowest overall weight (~10,500 kg), reflecting a strong and consistent performance. BO and CO follow closely, each with medians slightly above LPO’s. By contrast, FLA exhibits the highest median (>18,000 kg) and a large interquartile range, highlighting both heavier solutions and higher variability. FDB-AGDE-2 outperforms FDB-AGDE-1 and FDB-AGDE-3, with a somewhat lower median and narrower spread. Nevertheless, it still ranks below CO, BO, and LPO in terms of final weight. A few outliers appear for BO and LPO, suggesting occasional runs may deviate from their typical performance. However, these outliers remain relatively close to the main distribution, underscoring the general reliability of these methods.
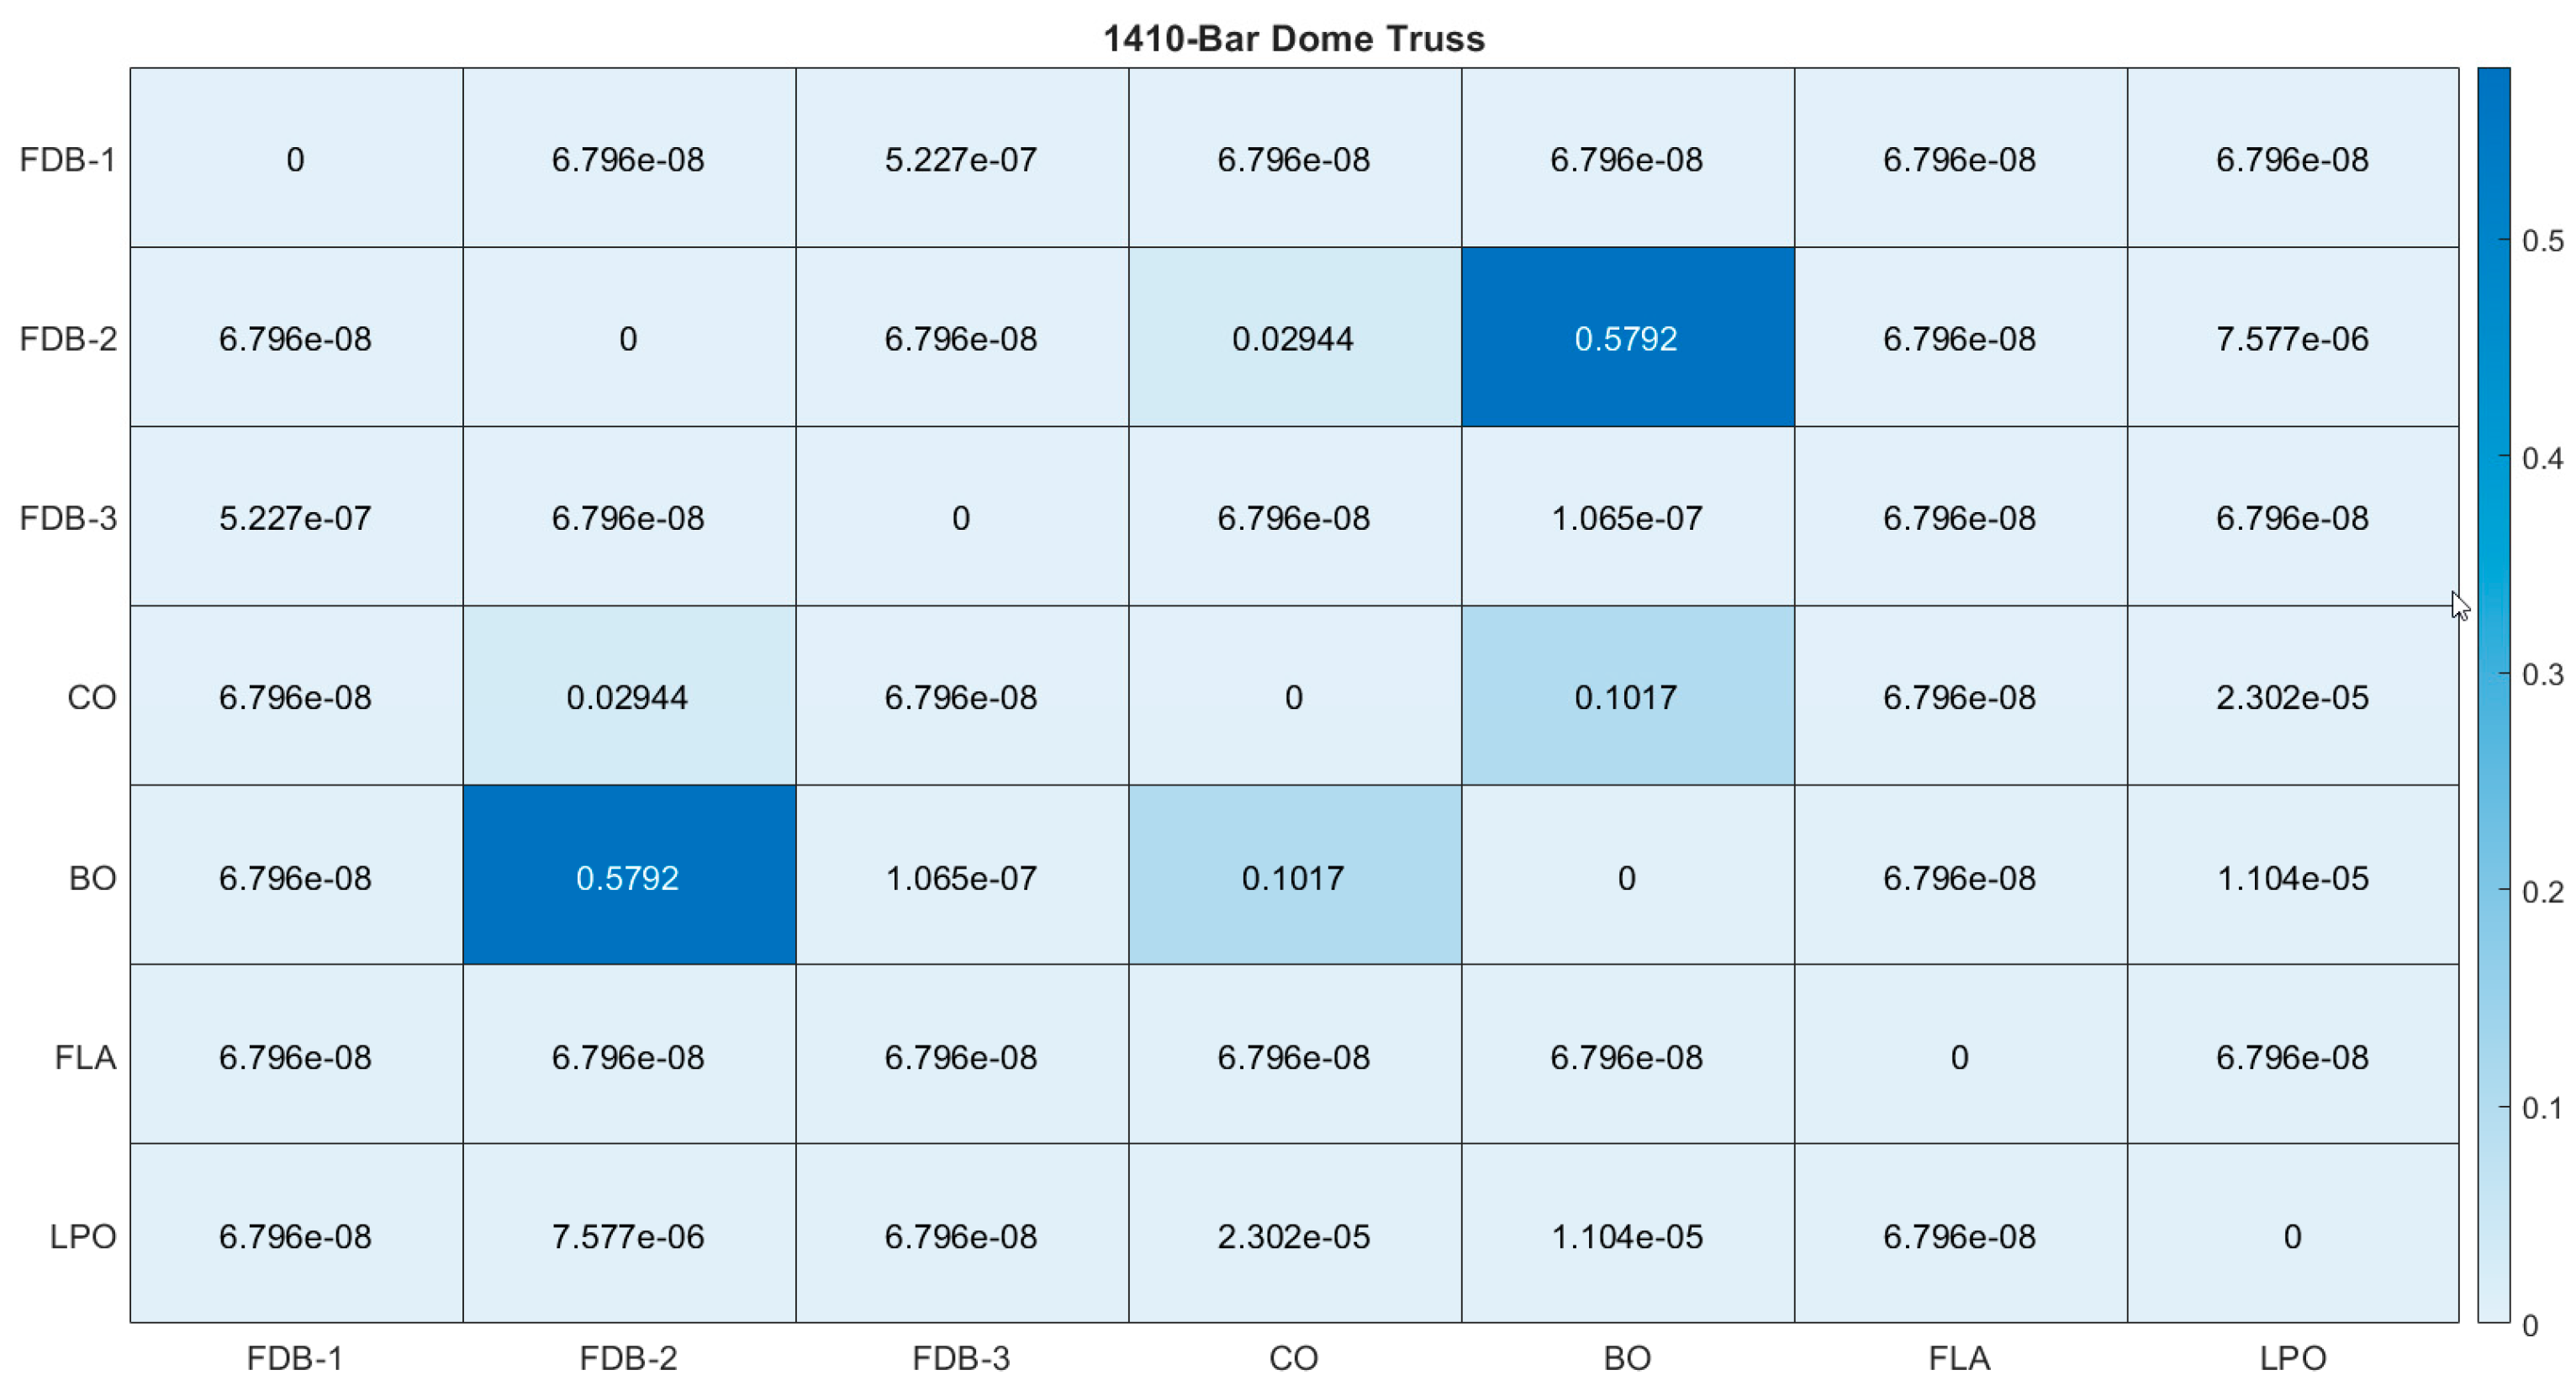
Figure 12 presents pairwise p-values from the Wilcoxon rank-sum test for the final weights. The cells reveal extremely small p-values when comparing a top performer, such as LPO, with a weaker performer, like FLA or FDB-AGDE-1, confirming that the differences in final weights are statistically robust. In certain comparisons among CO, BO, and LPO, moderate to larger p-values are observed, such as 0.1017 or 2.302 × 10⁻⁵, indicating that while the methods are not always identical, their weight distributions are often quite similar, making it less conclusive in distinguishing the best among them. These test results suggest that LPO, BO, and CO generally form a statistically distinct top tier, while the FDB-AGDE variants and FLA typically rank lower.
Table 14 details Cohen’s d effect sizes for each pairwise comparison. Many pairs involving FLA exhibit d-values above 4.0 (e.g., FLA vs. LPO at 4.60), signifying a substantial practical difference in final weights. Similarly, comparing LPO to FDB-AGDE-1 yields d ≈ 8.65, reinforcing that these two methods lie on opposite ends of the performance spectrum. Comparisons between CO and BO, or BO and LPO, often produce d-values near or below 1.0, indicating that while still statistically different, in practical terms they may yield designs of similar quality.
Taken together, the effect sizes confirm that the performance gaps among the top algorithms like LPO, BO, and CO are smaller than those separating them from methods like FLA or FDB-AGDE-1.

5. Conclusions

This study assessed the performance of metaheuristic algorithms FDB-AGDE (FDB-AGDE-1, FDB-AGDE-2, FDB-AGDE-3), CO, BO, FLA, and LPO in designing large-scale truss and dome structures under frequency constraints. Three case studies were examined: a 600-bar truss, an 1180-bar dome, and a 1410-bar dome. Minimizing the overall structural weight subjected to prescribed natural frequency bounds. Across all three case studies, LPO and BO consistently produced the lightest designs and exhibited relatively small standard deviations, indicating both high solution quality and repeatability. FDB-AGDE-2 performed nearly as well in many trials, particularly for the 600-bar and 1180-bar domes. CO also achieved competitive performance, especially in the two larger dome cases. Meanwhile, FDB-AGDE-1 and FDB-AGDE-3 converged to feasible solutions but tended to plateau at heavier weights, suggesting that their balance between global exploration and local exploitation may require further refinement for high-dimensional truss problems. By contrast, FLA displayed noticeably heavier designs and higher variance, pointing to algorithmic limitations or parameter settings that were less suited to the complexity of these structures. The Friedman test rankings reveal that algorithmic performance is influenced by the problem size. Across all cases, LPO and BO consistently achieve the best rankings, while FLA remains the weakest performer. As the truss size increases from 600 to 1410 bars, CO improves in relative ranking, moving from mid-level performance to second place, which suggests that its adaptive search dynamics scale well with dimensionality. In contrast, the FDB-AGDE variants show a gradual decline in rank with problem size, indicating that their differential-based updating mechanisms are less effective in very large search spaces. These observations suggest a general trend: algorithms with strong adaptive exploration–exploitation control, such as CO, LPO, and BO, demonstrate better scalability, whereas methods with more rigid update rules, like FDB-AGDE variants, tend to lose efficiency as dimensionality increases. In addition to the best, mean, and worst weights, the Wilcoxon rank-sum and the Cohen’s d effect sizes are calculated to assess both the significance and magnitude of differences among algorithms. These tests confirmed that the top-tier methods (LPO, BO, CO, and occasionally FDB-AGDE-2) form a statistically distinct group in terms of solution quality and robustness. The frequency analyses showed that all optimized designs satisfied dynamic constraints without any discrepancies between MATLAB and SAP2000 solvers, thus validating the feasibility of each final design.
The findings highlight LPO, BO, and CO as especially promising methods, owing to their balanced exploitation–exploration behavior, robustness in converging to lightweight solutions, and comparatively low variance across runs. In practice, LPO and BO are more suitable when robustness and consistency are prioritized, whereas CO is advantageous in cases requiring faster convergence. For implementation, optimized continuous designs can be mapped to standard catalog sections, thereby yielding code-compliant and feasible solutions. Looking ahead, future research may focus on adaptive or hybrid strategies that combine the strengths of these algorithms, extend the framework to larger and more complex structural systems with discrete optimization, and incorporate multi-hazard considerations such as seismic and wind effects, as well as applications to different structural types such as steel frames.

Funding

This research received no external funding.

Institutional Review Board Statement

Not applicable.

Informed Consent Statement

Not applicable.

Data Availability Statement

The data presented in this study are included in the article; further inquiries can be directed to the corresponding author.

Conflicts of Interest

The authors declare no conflicts of interest.

References

  1. Salajegheh, F.; Salajegheh, E.; Shojaee, S. Optimum Design of Truss Structures with Frequency Constraints by an Enhanced Particle Swarm Optimization Method with Gradient Directions Based on Emigration Philosophy. Eng. Optim. 2023, 55, 434–456. [Google Scholar] [CrossRef]
  2. Azizi, M.; Aickelin, U.; Khorshidi, H.A.; Shishehgarkhaneh, M.B. Shape and Size Optimization of Truss Structures by Chaos Game Optimization Considering Frequency Constraints. J. Adv. Res. 2022, 41, 89–100. [Google Scholar] [CrossRef] [PubMed]
  3. Millan-Paramo, C.; Abdalla Filho, J.E. Size and Shape Optimization of Truss Structures with Natural Frequency Constraints Using Modified Simulated Annealing Algorithm. Arab. J. Sci. Eng. 2020, 45, 3511–3525. [Google Scholar] [CrossRef]
  4. Mortazavi, A. Size and Layout Optimization of Truss Structures with Dynamic Constraints Using the Interactive Fuzzy Search Algorithm. Eng. Optim. 2021, 53, 369–391. [Google Scholar] [CrossRef]
  5. Karaboga, D.; Basturk, B. A Powerful and Efficient Algorithm for Numerical Function Optimization: Artificial Bee Colony (ABC) Algorithm. J. Glob. Optim. 2007, 39, 459–471. [Google Scholar] [CrossRef]
  6. Goldberg, D.E. Genetic Algorithms in Search, Optimization, and Machine Learning; Addison-Wesley: Reading, MA, USA, 1989. [Google Scholar]
  7. Kirkpatrick, S.; Gelatt, C.D.; Vecchi, M.P. Optimization by simulated annealing. Science 1983, 220, 671–680. [Google Scholar] [CrossRef]
  8. Karaboga, D.; Basturk, B. On the Performance of Artificial Bee Colony (ABC) Algorithm. Appl. Soft Comput. J. 2008, 8, 687–697. [Google Scholar] [CrossRef]
  9. Venkata Rao, R. Jaya: A Simple and New Optimization Algorithm for Solving Constrained and Unconstrained Optimization Problems. Int. J. Ind. Eng. Comput. 2016, 7, 19–34. [Google Scholar] [CrossRef]
  10. Rao, R.V.; Savsani, V.J.; Vakharia, D.P. Teaching-Learning-Based Optimization: A Novel Method for Constrained Design Optimization Problems. Comput. Des. 2011, 43, 303–315. [Google Scholar] [CrossRef]
  11. Yang, X.S. Firefly Algorithms for Multimodal Optimization. In Stochastic Algorithms: Foundations and Applications; Lecture Notes in Computer Science (Including subseries Lecture Notes in Artificial Intelligence and Lecture Notes in Bioinformatics); Springer, Berlin/Heidelberg, Germany, 2009; Volume 5792 LNCS. [Google Scholar]
  12. Akbari, M.A.; Zare, M.; Azizipanah-abarghooee, R.; Mirjalili, S.; Deriche, M. The Cheetah Optimizer: A Nature-Inspired Metaheuristic Algorithm for Large-Scale Optimization Problems. Sci. Rep. 2022, 12, 1–20. [Google Scholar] [CrossRef]
  13. Das, A.K.; Pratihar, D.K. Bonobo Optimizer (BO): An Intelligent Heuristic with Self-Adjusting Parameters over Continuous Spaces and Its Applications to Engineering Problems. Appl. Intell. 2022, 52, 2942–2974. [Google Scholar] [CrossRef]
  14. Ghasemi, M.; Golalipour, K.; Zare, M.; Mirjalili, S.; Trojovský, P.; Abualigah, L.; Hemmati, R. Flood Algorithm (FLA): An Efficient Inspired Meta-Heuristic for Engineering Optimization. J. Supercomput. 2024, 80, 22913–23017. [Google Scholar] [CrossRef]
  15. Ghasemi, M.; Zare, M.; Zahedi, A.; Trojovský, P.; Abualigah, L.; Trojovská, E. Optimization Based on Performance of Lungs in Body: Lungs Performance-Based Optimization (LPO). Comput. Methods Appl. Mech. Eng. 2024, 419, 116582. [Google Scholar] [CrossRef]
  16. Tang, H.; Huynh, T.N.; Lee, J. A Novel Adaptive 3-Stage Hybrid Teaching-Based Differential Evolution Algorithm for Frequency-Constrained Truss Designs. Structures 2022, 38, 434–456. [Google Scholar] [CrossRef]
  17. Kaveh, A.; Ilchi Ghazaan, M. Optimal Design of Dome Truss Structures with Dynamic Frequency Constraints. Struct. Multidiscip. Optim. 2016, 53, 605–621. [Google Scholar] [CrossRef]
  18. Kaveh, A. Optimal Analysis and Design of Large-Scale Domes with Frequency Constraints. In Applications of Metaheuristic Optimization Algorithms in Civil Engineering; Springer: Berlin/Heidelberg, Germany, 2017. [Google Scholar]
  19. Dede, T.; Grzywiński, M.; Venkata Rao, R. Jaya: A New Meta-heuristic Algorithm for the Optimization of Braced Dome Structures. In Advanced Engineering Optimization Through Intelligent Techniques; Advances in Intelligent Systems and, Computing; Venkata Rao, R., Taler, J., Eds.; Springer: Singapore, 2020; Volume 949, pp. 13–20. [Google Scholar] [CrossRef]
  20. Liu, S.; Zhu, H.; Chen, Z.; Cao, H. Frequency-Constrained Truss Optimization Using the Fruit Fly Optimization Algorithm with an Adaptive Vision Search Strategy. Eng. Optim. 2020, 52, 777–797. [Google Scholar] [CrossRef]
  21. Degertekin, S.O.; Yalcin Bayar, G.; Lamberti, L. Parameter Free Jaya Algorithm for Truss Sizing-Layout Optimization under Natural Frequency Constraints. Comput. Struct. 2021, 245, 106461. [Google Scholar] [CrossRef]
  22. Kaveh, A.; Hamedani, K.B.; Kamalinejad, M. An Enhanced Forensic-Based Investigation Algorithm and Its Application to Optimal Design of Frequency-Constrained Dome Structures. Comput. Struct. 2021, 256, 106643. [Google Scholar] [CrossRef]
  23. Kaveh, A.; Amirsoleimani, P.; Dadras Eslamlou, A.; Rahmani, P. Frequency-Constrained Optimization of Large-Scale Dome-Shaped Trusses Using Chaotic Water Strider Algorithm. Structures 2021, 32, 1604–1618. [Google Scholar] [CrossRef]
  24. Kaveh, A.; Hamedani, K.B.; Hamedani, K.B.; Kamalinejad, M. Improved Arithmetic Optimization Algorithm for Structural Optimization with Frequency Constraints. Int. J. Optim. Civ. Eng. 2021, 11, 663–693. [Google Scholar]
  25. Dede, T.; Atmaca, B.; Grzywinski, M.; Venkata Rao, R. Optimal Design of Dome Structures with Recently Developed Algorithm: Rao Series. Structures 2022, 42, 65–79. [Google Scholar] [CrossRef]
  26. Khodadadi, N.; Mirjalili, S. Truss Optimization with Natural Frequency Constraints Using Generalized Normal Distribution Optimization. Appl. Intell. 2022, 52, 10384–10397. [Google Scholar] [CrossRef]
  27. Kaveh, A.; Biabani Hamedani, K.; Kamalinejad, M. Improved Slime Mould Algorithm with Elitist Strategy and Its Application to Structural Optimization with Natural Frequency Constraints. Comput. Struct. 2022, 264, 106760. [Google Scholar] [CrossRef]
  28. Öztürk, H.T.; Kahraman, H.T. Meta-Heuristic Search Algorithms in Truss Optimization: Research on Stability and Complexity Analyses. Appl. Soft Comput. 2023, 145, 110573. [Google Scholar] [CrossRef]
  29. Kaveh, A.; Hamedani, K.B.; Hamedani, B.B. Optimal Design of Large-Scale Dome Truss Structures with Multiple Frequency Constraints Using Success-History Based Adaptive Differential Evolution Algorithm. Period. Polytech. Civ. Eng. 2023, 67, 36–56. [Google Scholar] [CrossRef]
  30. Moosavian, H.; Mesbahi, P.; Moosavian, N.; Daliri, H. Optimal Design of Truss Structures with Frequency Constraints: A Comparative Study of DE, IDE, LSHADE, and CMAES Algorithms. Eng. Comput. 2023, 39, 1499–1517. [Google Scholar] [CrossRef]
  31. Goodarzimehr, V.; Talatahari, S.; Shojaee, S.; Gandomi, A.H. Computer-Aided Dynamic Structural Optimization Using an Advanced Swarm Algorithm. Eng. Struct. 2024, 300, 117174. [Google Scholar] [CrossRef]
  32. Sheng-Xue, H. Truss Optimization with Frequency Constraints Using the Medalist Learning Algorithm. Structures 2023, 55, 1–15. [Google Scholar] [CrossRef]
  33. Truong, D.-N.; Chou, J.-S. Metaheuristic Algorithm Inspired by Enterprise Development for Global Optimization and Structural Engineering Problems with Frequency Constraints. Eng. Struct. 2024, 318, 118679. [Google Scholar] [CrossRef]
  34. Goodarzimehr, V.; Topal, U.; Das, A.K.; Vo-Duy, T. SABO Algorithm for Optimum Design of Truss Structures with Multiple Frequency Constraints. Mech. Based Des. Struct. Mach. 2024, 52, 7745–7777. [Google Scholar] [CrossRef]
  35. Abbasi, M.; Zakian, P. Optimal Design of Truss Domes with Frequency Constraints Using Seven Metaheuristic Algorithms Incorporating a Comprehensive Statistical Assessment. Mech. Adv. Mater. Struct. 2024, 31, 12533–12559. [Google Scholar] [CrossRef]
  36. Guvenc, U.; Duman, S.; Kahraman, H.T.; Aras, S.; Katı, M. Fitness–Distance Balance Based Adaptive Guided Differential Evolution Algorithm for Security-Constrained Optimal Power Flow Problem Incorporating Renewable Energy Sources. Appl. Soft Comput. 2021, 108, 107421. [Google Scholar] [CrossRef]
  37. Mohamed, A.W.; Mohamed, A.K. Adaptive Guided Differential Evolution Algorithm with Novel Mutation for Numerical Optimization. Int. J. Mach. Learn. Cybern. 2019, 10, 253–277. [Google Scholar] [CrossRef]
  38. Kahraman, H.T.; Aras, S.; Gedikli, E. Fitness-Distance Balance (FDB): A New Selection Method for Meta-Heuristic Search Algorithms. Knowl.-Based Syst. 2020, 190, 105169. [Google Scholar] [CrossRef]
  39. Kaveh, A.; Kamalinejad, M.; Hamedani, K.B.; Arzani, H. Quantum Version of Teaching-Learning-Based Optimization Algorithm for Optimal Design of Cyclic Symmetric Structures Subject to Frequency Constraints. Int. J. Optim. Civ. Eng. 2022, 12, 245–278. [Google Scholar]
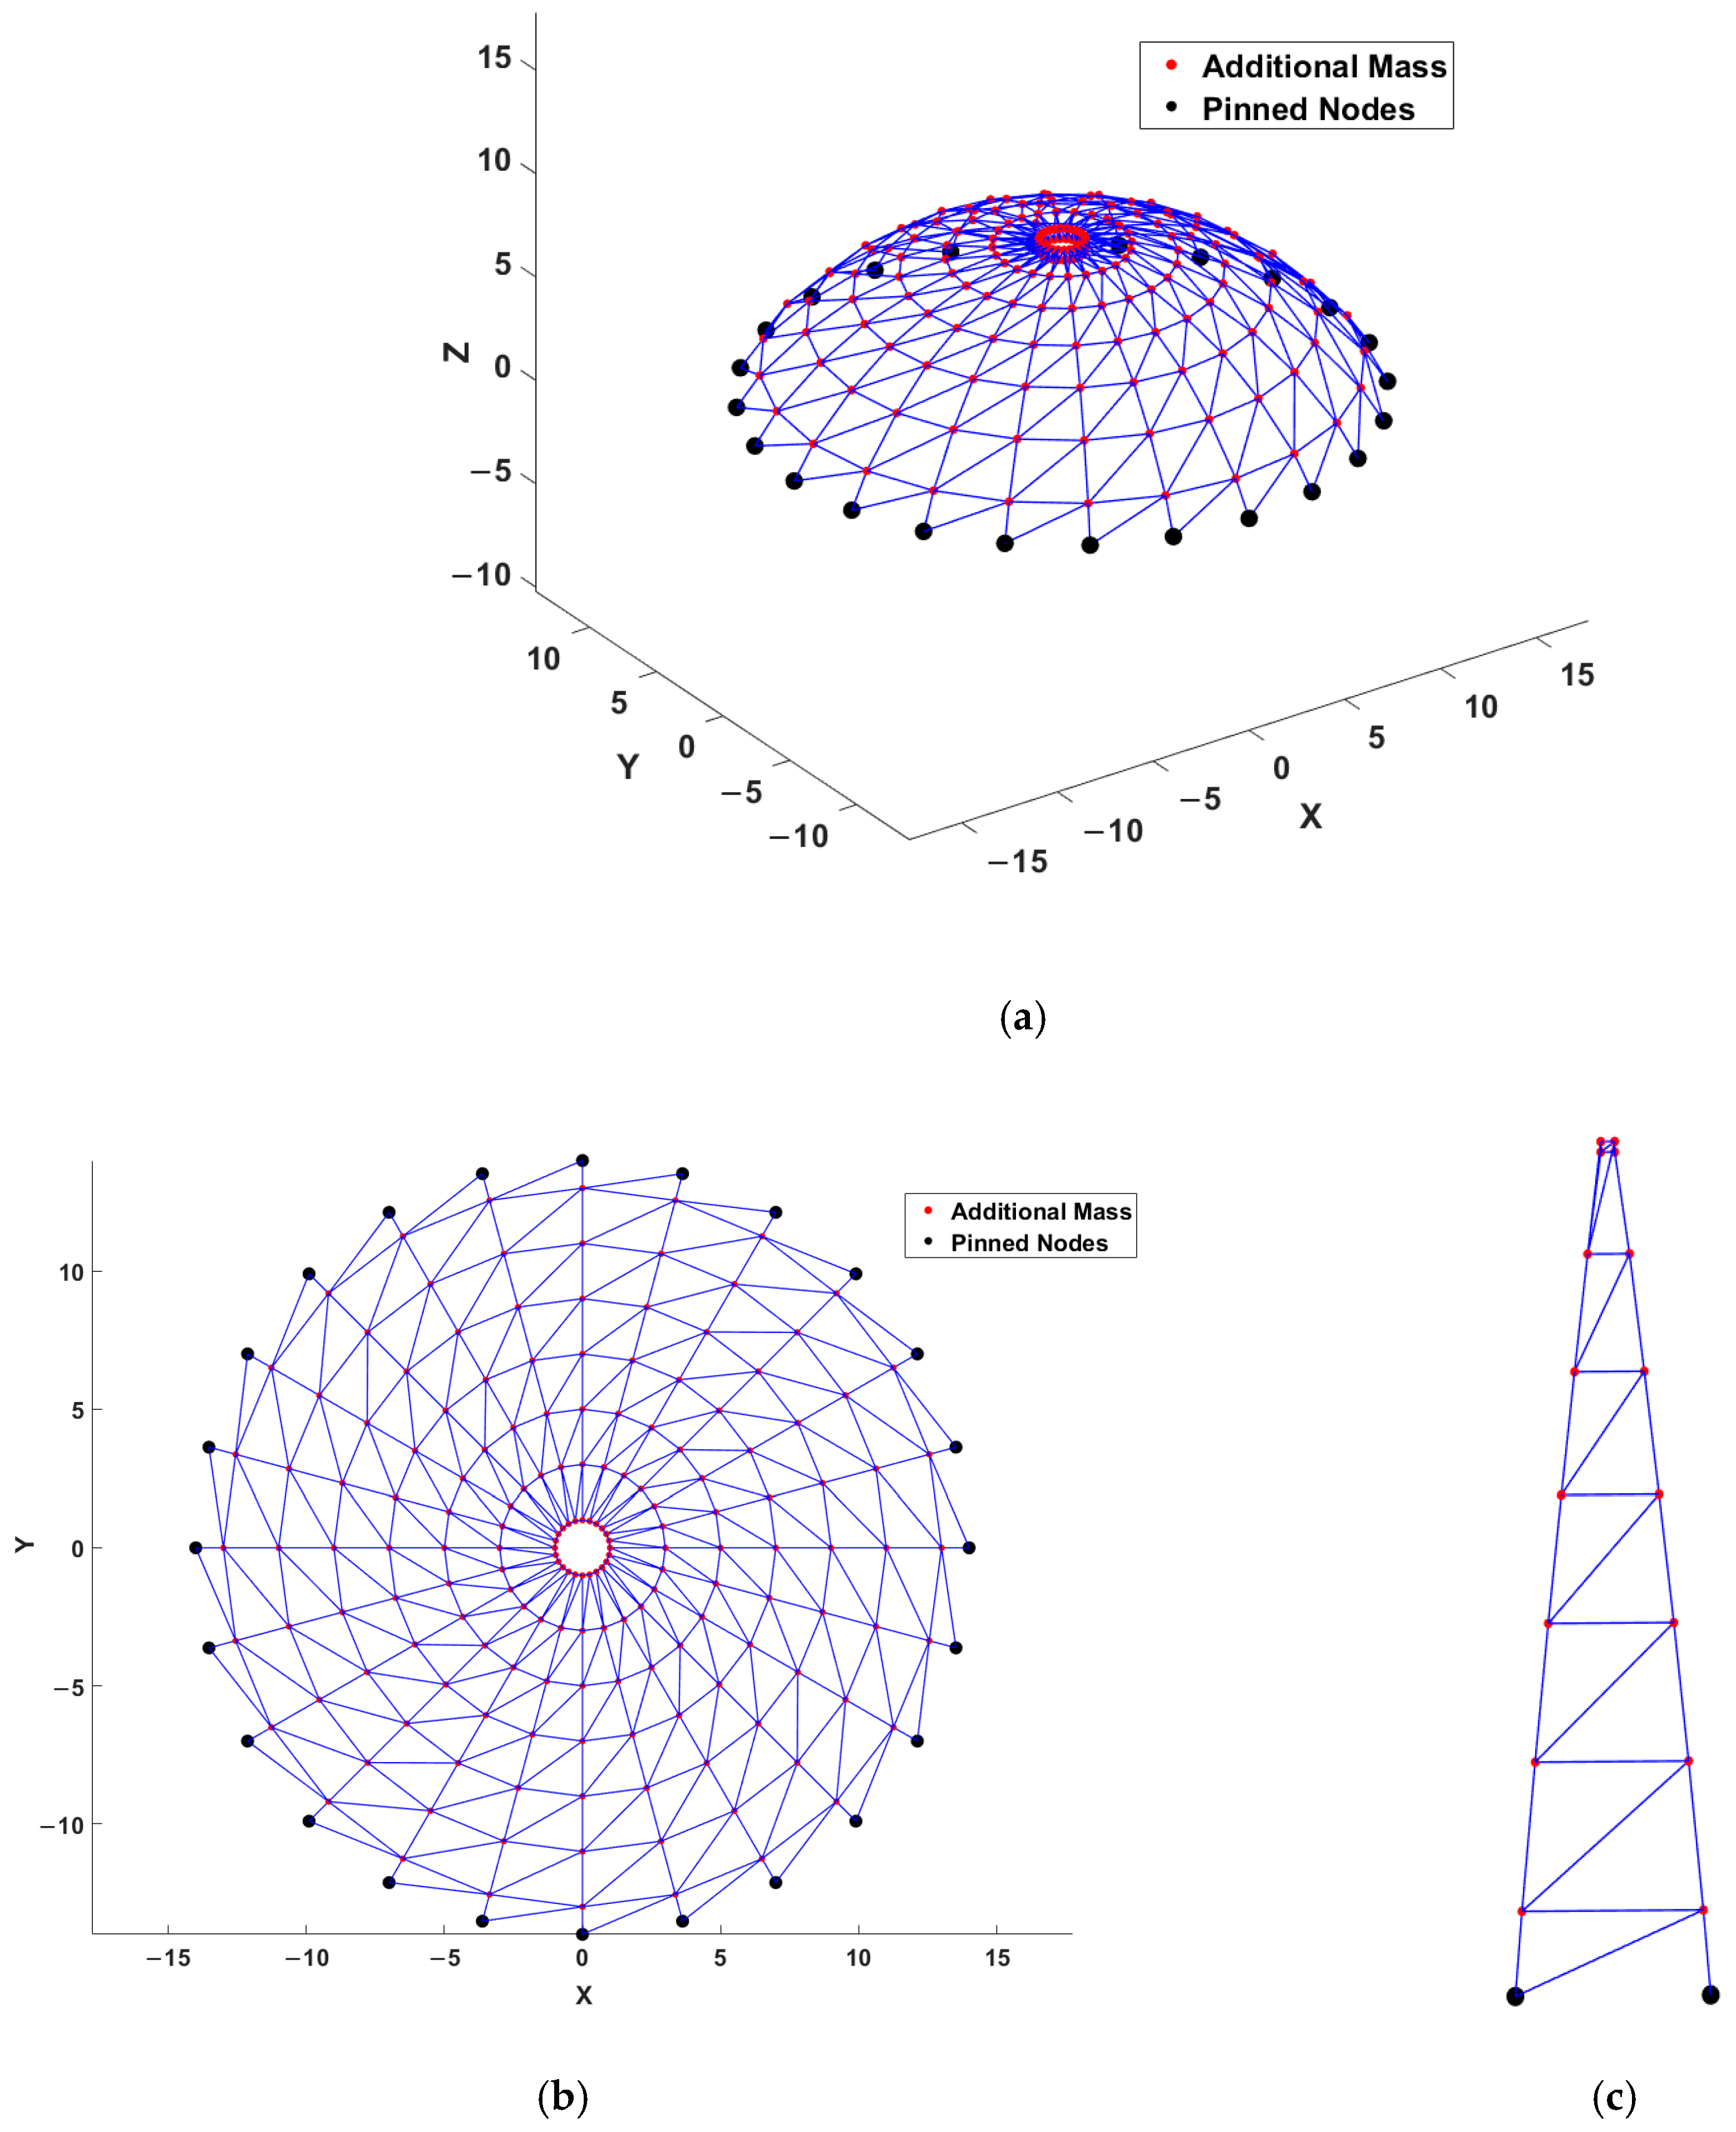
Figure 1. The 600-bar truss dome: (a) top view, (b) isometric view, and (c) a substructure.
Buildings 15 03238 g001
Figure 2. Convergence curves of various methods for optimum design of a 600-bar truss.
Buildings 15 03238 g002
Figure 3. Performance comparison of metaheuristics for the optimum design of a 600-bar dome truss.
Buildings 15 03238 g003
Figure 4. p-values from the Wilcoxon rank-sum test for 600-bar dome truss optimization.
Buildings 15 03238 g004
Figure 5. The 1180-bar truss dome: (a) top view, (b) isometric view, and (c) a substructure.
Buildings 15 03238 g005
Figure 6. Convergence curves of various methods for optimum design of the 1180-bar truss.
Buildings 15 03238 g006
Figure 7. Performance comparison of metaheuristics for the optimum design of the 1180-bar dome truss.
Buildings 15 03238 g007
Figure 8. p-values from the Wilcoxon rank-sum test for the 1180-bar dome truss.
Buildings 15 03238 g008
Figure 9. The 1410-bar truss dome: (a) top view, (b) isometric view, and (c) a substructure.
Buildings 15 03238 g009aBuildings 15 03238 g009b
Figure 10. Convergence curves of various methods for optimum design of 1410-bar truss.
Buildings 15 03238 g010
Figure 11. Performance comparison of metaheuristics for the optimum design of a 1410-bar dome truss.
Buildings 15 03238 g011
Figure 12. p-values from the Wilcoxon rank-sum test for the 1410-bar dome truss.
Buildings 15 03238 g012
Table 1. Material properties and frequency constraints of design examples.
Truss ExampleModulus of Elasticity, E (N/m2)Material Density, q (kg/m3)Allowable Cross-Sectional Areas, A (cm2)Natural Frequency Constraints (Hz)
600-bar dome truss2.1 × 101178001 ≤ A ≤ 100   ω 1 5 ,   ω 3 7
1180-bar dome truss2.1 × 101178601 ≤ A ≤ 100   ω 1 7 ,   ω 2 7 ,
ω 3 9
1410-bar dome truss2.1 × 101178601 ≤ A ≤ 100   ω 1 7 ,   ω 3 9
Table 2. Specific parameters of the utilized algorithms.
AlgorithmsSpecific Parameters
FDB-AGDE-1-
FDB-AGDE-2-
FDB-AGDE-3-
BOpxgm_init = 0.03; scab = 1.25; scsb = 1.3; rcpp = 0.0035;
tsgsfactor = 0.05; pp = pd = 0.5
COm = 2
FLANe = 5
LPONe = 5
Table 3. Nodal coordinates of the substructure of the 600-bar dome truss [39].
Node Number x, y, and z Coordinates (m)Node Numberx, y, and z Coordinates (m)
11.0  0.0  7.069.0  0.0  5.0
21.0  0.0  7.5711.0  0.0  3.5
33.0  0.0  7.25813.0  0.0  1.5
45.0  0.0  6.75914.0  0.0  7.0
57.0  0.0  6.0
Table 4. Comparison of optimization results for the 600-bar truss.
Design
Variables Ai (cm2)
FDB-AGDE-1FDB-AGDE-2FDB-AGDE-3COBOFLALPO
A1 3.0237911.1291011.8764141.6297171.2579636.7289391.246882
A22.0138711.1636171.9040151.2418921.3862391.2310961.240454
A35.1435884.2810717.3944534.3956614.3148452.3822984.243337
A41.2629151.3386213.6497601.4902431.0000001.0021971.243932
A519.98331917.85401819.91336418.39648118.11473821.18163018.071250
A630.92353536.26152042.80121635.30074739.27011631.48074038.225070
A714.67252814.12249611.80766515.16194213.31692513.86390014.108590
A815.43732716.82948617.12957916.81112016.74151218.78473016.636750
A912.26997813.44670013.10512012.20851213.17159021.82185013.183480
A108.8665459.5826059.43364310.0054819.3390578.4234719.449940
A119.5171199.40006710.3700559.18331310.1864148.7513629.537473
A129.69314710.0158339.4222589.6871019.96168814.2266209.879310
A137.4525637.1911786.1469927.2249466.9167958.3734277.297250
A145.9159145.5831755.5440195.5443845.5206144.6858995.591398
A156.6610436.9973727.1609146.5266076.53254721.2432407.003780
A165.2121285.0392844.6620895.4719544.9286924.1403405.257701
A175.8079823.8209443.5743813.6839453.9180222.5715513.851501
A187.7225937.6676138.5959777.7282007.6540247.1570817.516086
A193.8828744.1947814.6568533.8430374.3664775.4773644.088303
A201.9180842.1761752.1075022.0586672.4820421.3772862.251530
A214.8046004.9820805.5349564.5774544.8415153.9152024.529711
A223.0432383.3245482.8212053.3112813.9709282.7334763.628636
A232.2736511.7521161.9056041.9997311.6831725.3496171.796958
A246.1190644.9779845.5042285.0501564.89080218.2688504.905784
A252.0845421.6731621.6326601.5726831.5200683.3723081.598683
Best weight (kg)6598.65926339.99026507.92796352.86376345.94848260.93006335.1780
Mean weight (kg)6706.94396400.59986625.13246719.01546563.473410,368.30006345.0550
Worst weight (kg)6873.64747728.28146809.61147753.35767831.887112,274.36006361.9060
STD (kg)72.5950250.917573.0005600.6546451.18561221.33305.6611
CV (%)0000000
NSA20,00020,00020,00020,00020,00020,00020,000
Friedman Rank6254371
Table 5. Natural frequencies calculated for the optimized designs of the 600-bar truss structure.
ModeFDB-AGDE-1FDB-AGDE-2FDB-AGDE-3COBOFLALPO
15.2231255.0105745.0242695.0002215.0003685.1951235.010798
25.2231255.0105745.0242695.0002215.0003685.1951235.010798
MATLAB37.0196557.0002397.0180637.0001117.0000017.0244057.000080
47.0196557.0006187.0180637.0001117.0000107.0244057.000133
57.0225607.0006187.0200287.0002247.0000107.0825347.000133
15.2231255.0105745.0242695.0002215.0003685.1951235.010798
25.2231255.0105745.0242695.0002215.0003685.1951235.010798
SAP200037.0196557.0002397.0180637.0001117.0000017.0244057.000080
47.0196557.0006187.0180637.0001117.0000107.0244057.000133
57.0225607.0006187.0200287.0002247.0000107.0825347.000133
Table 6. Cohen’s effect sizes for pairwise comparisons of metaheuristics in 600-bar dome truss optimization.
FDB-AGDE-1FDB-AGDE-2FDB-AGDE-3COBOFLALPO
FDB-AGDE-1 1.279730.812250.0191120.5602444.2251516.156702
FDB-AGDE-21.27973 1.0141660.6215750.3228014.430770.355874
FDB-AGDE-30.812251.014166 0.1651090.356344.300466.188649
CO0.0191120.6215750.165109 0.3431113.7918430.880433
BO0.5602440.3228010.356340.343111 4.1907870.660715
FLA4.2251514.430774.300463.7918434.190787 4.658568
LPO6.1567020.3558746.1886490.8804330.6607154.658568
Table 7. Nodal coordinates of the substructure of the 1180-bar dome truss [39].
Node Number x, y, and z Coordinates (m)Node Numberx, y, and z Coordinates (m)
13.1181    0.0  14.6723114.5788    0.7252  14.2657
26.1013    0.0  13.7031127.4077    1.1733  12.9904
38.8166    0.0  12.1354139.9130    1.5701  11.1476
411.1476  0.0  10.03651411.9860  1.8984  8.8165
512.9904  0.0  7.50001513.5344  2.1436  6.1013
614.2657  0.0  4.63581614.4917  2.2953  3.1180
714.9179  0.0  1.56761714.8153  2.3465  0.0
814.9179  0.0  −1.56771814.4917  2.2953  −3.1181
914.2656  0.0  −4.63591913.5343  2.1436  −6.1014
1012.9903  0.0  −7.5001203.1181   0.0   13.7031
Table 8. Comparison of optimization results for the 1180-bar truss.
Design
Variables Ai (cm2)
FDB-AGDE-1FDB-AGDE-2FDB-AGDE-3COBOFLALPO
A1 7.8742577.4066617.1376837.3410928.03343612.0658707.586136
A210.0637808.89525111.7887998.34432610.40324918.8838708.903712
A34.9101374.80931313.6147193.1802612.71135426.73783011.403790
A414.69524419.06924923.67990016.39222715.00678928.30865015.534610
A52.9098455.2938586.9863003.3459573.89630612.9049803.764825
A67.1159047.0954406.2282956.5542375.85160027.0766606.674349
A76.8462206.8364206.3876486.0906457.2899348.8649437.834553
A88.8004117.5433619.5906886.2080246.94954113.5449406.571596
A91.6732413.4761352.4754253.5407161.8799561.0923582.190498
A1014.99177211.8816587.96440911.48388611.31129110.19171011.688330
A1116.3632907.16723511.7912466.1785957.47193529.1243407.865906
A128.4812765.03326711.7632595.5372356.06552663.7626806.436489
A136.1703498.0998397.2456518.1551727.1012606.7087427.969050
A149.0159046.59302211.53472511.3778836.8986316.0133087.292745
A159.38334310.24324810.1538428.7046009.75248772.30502010.477170
A165.0841307.7260608.5013156.5424696.5459878.5049655.577529
A179.9019668.1489656.4349326.8121647.21048816.6840409.067837
A187.2124949.4231088.0264477.6346678.75158425.9178307.722360
A1914.90010510.7381949.96843612.85757514.05403018.07310013.969100
A204.4714799.15571411.4794318.2000106.42933620.4788909.843234
A219.8340718.3474138.41997910.32989710.04745235.69152011.025380
A2212.4643609.2009025.7637019.2104659.07001014.2277409.142028
A2313.27992715.73480920.93281617.56653317.17201919.17801021.280410
A2412.9093239.8793898.87957213.23665410.76574042.41618010.116070
A2519.84941014.45098216.2542589.78282813.64331734.92003012.228450
A2617.11646611.1027536.02764311.31438910.42772319.34196012.398480
A2725.23004426.51342521.52970027.20338122.74226215.16270025.406910
A2811.38461214.16990319.22352016.70812111.94971954.15625013.552570
A2913.25616618.42071119.72673022.51211115.48374436.37235021.023240
A3018.70679114.48331016.38339516.62700316.01319627.27313017.371400
A3142.96001139.07831248.41771835.34435437.50383439.23740033.663920
A3216.49011519.40218925.78656117.69473519.67884538.98594019.147790
A3330.20026624.41904128.72383334.86307829.03153259.19503026.353450
A3426.42899421.44124623.84224320.77448121.35104743.42956020.196950
A3554.48977648.29233359.66686346.11709053.20261879.60957043.312430
A3623.64172422.00393538.88007727.76057527.03361933.18702028.010940
A3729.13456730.74403126.40869637.22995532.89360739.65542034.872710
A3822.69680534.24525048.07007831.97638830.07067439.79900027.073780
A3941.18119147.06092236.88165336.82176235.53928844.50725033.745320
A405.9133381.9889462.6557452.6076681.0000003.0094411.408517
A417.5477798.0190238.53663914.90461310.47843611.0276308.988470
A4216.8204107.33867710.5790217.8757475.84065871.2828906.986653
A437.4693417.6467558.2136466.8619875.94952910.6402707.601176
A449.1316125.7366077.6356847.3615326.34099055.2417206.781792
A455.7964409.0244263.7395995.7542506.8934569.9121747.375494
A466.8317078.6530407.9667215.6460055.60043824.7136706.003010
A4710.74358410.8459347.1183267.5630968.92046723.3650309.659027
A4813.5414369.55450013.6735558.8662475.66520418.2995007.527485
A4911.7313939.54709410.03608612.79250710.70986717.92691011.049190
A5012.89098912.42999014.56726910.1817829.28073823.10263011.502510
A5125.56324213.64054611.93090315.20916913.41152376.95352014.859430
A5210.11851114.69824513.80455413.11919312.72347713.04316014.238340
A5319.80214219.56289216.25970619.47867919.15010143.75737017.925480
A5427.25178718.09175916.66713518.80920921.33489043.90444016.480130
A5539.50008319.88281119.70323721.96242026.30958332.65763028.848710
A5620.85258424.35012430.31942525.52255224.62513926.11453026.045850
A5747.36458032.66471241.99932828.32251434.80363674.92418035.628560
A5840.43851337.17243247.68866035.95534936.75549751.76249037.183100
A5911.9014045.3763995.2218283.6496745.16610313.0867306.384748
Best weight (kg)42,941.68338,767.64843,042.69338,963.13638,030.27276,891.10038,610.050
Mean weight (kg)46,075.98440070.64844,339.27840,032.33938,863.27010,0367.20039,999.660
Worst weight (kg)48,104.62241,353.29946,513.24340,761.89639,511.108137,741.50041,774.340
STD (kg)970.924563.950770.571426.182408.77212,928.480815.643
CV (%)0000000
NSA20,00020,00020,00020,00020,00020,00020,000
Friedman Rank6354172
Table 9. Natural frequencies calculated for the optimized designs of the 1180-bar truss structure.
ModeFDB-AGDE-1FDB-AGDE-2FDB-AGDE-3COBOFLALPO
MATLAB17.0091747.0039157.0031537.0010287.0001157.0176117.003076
27.0091747.0039157.0031537.0010287.0001157.0176117.003076
39.0431739.0134619.1052099.0044969.0003239.1562279.047232
49.0431739.0134619.1052099.0044969.0003239.1562279.047232
59.4622999.2335259.2009319.1906419.0004209.5515429.172685
SAP200017.0091747.0039157.0031537.0010287.0001157.0176117.003076
27.0091747.0039157.0031537.0010287.0001157.0176117.003076
39.0431739.0134619.1052099.0044969.0003239.1562279.047232
49.0431739.0134619.1052099.0044969.0003239.1562279.047232
59.4622999.2335259.2009319.1906419.0004209.5515429.172685
Table 10. Cohen’s effect sizes for pairwise comparisons of metaheuristics in 1180-bar dome truss optimization.
FDB-AGDE-1FDB-AGDE-2FDB-AGDE-3COBOFLALPO
FDB-AGDE-1 10.414992.22591411.1790713.439346.8650088.20034
FDB-AGDE-210.41499 7.3934420.0824392.8674577.5861720.018019
FDB-AGDE-32.2259147.393442 7.90380110.011457.047145.924849
CO11.179070.0824397.903801 3.1918287.5924720.036963
BO13.439342.86745710.011453.191828 7.7293451.907356
FLA6.8650087.5861727.047147.5924727.729345 7.576501
LPO8.200340.0180195.9248490.0369631.9073567.576501
Table 11. Nodal coordinates of the substructure of 1410-bar dome truss.
Node Number x, y, and z Coordinates (m)Node Numberx, y, and z Coordinates (m)
11.0    0.0    4.0 81.989    0.209    3
23.0    0.0    3.7593.978    0.418    2.75
35.0    0.0    3.25105.967    0.627    2.25
47.0    0.0    2.75117.956    0.836    1.75
59.0    0.0    2129.945    1.0453  1
611.0  0.0    1.251311.934  1.2543  −0.5
713.0  0.00  0.0
Table 12. Comparison of optimization results for the 1410-bar truss.
Design
Variables Ai (cm2)
FDB-AGDE-1FDB-AGDE-2FDB-AGDE-3COBOFLALPO
A1 5.1817483.5942794.1288425.0981853.3303432.6794166.395886
A21.9450985.3739305.4911094.5115583.7952504.3605874.697734
A333.63018923.01174321.19712024.71187916.4736443.40586231.194970
A410.1789468.71795810.1866176.7665759.31402211.67034010.309150
A53.6737425.9511887.1290775.3481206.6299643.0585176.045048
A66.0597752.8422693.0882782.3926261.5740744.3690001.608069
A728.68273018.05547117.46848412.74097531.71906769.74382016.595200
A811.92239511.44090612.5960997.9032939.91694017.4421409.176643
A94.5146353.2511356.2352592.9597661.6846948.0805192.562129
A103.1902103.8787195.0206972.8216282.4857402.2768782.728512
A118.53875410.7112616.25813610.72172412.23506418.4863706.636622
A1211.45512610.64107610.39851111.8692048.31916610.64577010.014390
A139.0438162.5097102.6899182.4862072.9794541.0283912.002495
A145.8895395.2675943.8319964.9905234.4752789.5973725.723452
A1519.98115115.6285179.68584114.25372010.80911719.89566017.743890
A167.0708238.0650096.1076789.2157848.82564915.1758808.554423
A174.7550795.3271186.6776183.9062213.5127084.7705854.330146
A186.7473424.7197846.6359546.1871406.31204711.1681006.739172
A197.5917665.3271649.05403010.39195413.39272812.4665109.594120
A2010.86392215.01013216.61775115.56086613.38352615.07472013.816910
A218.7630714.5112773.7936915.3179875.4127118.7397915.802691
A227.2662037.1574926.9522736.4317958.3624468.0535867.125749
A236.8650315.7363436.5409012.1018871.0000001.6144721.541427
A242.8099763.7289147.2591286.3791804.6922436.3610134.646534
A252.8854403.7740842.6586452.4394252.8430811.7031432.851894
A264.8884483.5824246.7748995.0234495.5408751.3780225.251167
A272.7491996.7363153.5503364.9514995.8489414.9423476.898313
A2810.49541611.46215710.5443619.33683711.95024010.12617012.228630
A294.5438334.3976803.7626134.2546054.0762594.4224583.572397
A301.5639681.5541404.2456852.7739762.0391537.7846551.545229
A314.1803242.3732792.8447683.6992971.7397219.7569182.421220
A327.7285483.41097111.1287075.2409783.0580708.8229983.724947
A334.0873585.9986525.8263175.7340296.3457322.5247704.162181
A344.3296443.8303424.4984343.8765743.2616771.8363762.599018
A357.7192264.0051013.7398672.5000212.7697244.4885862.737338
A364.6115454.3903131.0515591.5651003.0721662.1603843.413748
A378.4907246.8929187.2368479.5575725.9288349.4116597.220829
A386.3787974.8848256.8970344.5432754.3527313.5151125.408577
A392.3600774.6965294.9519454.2043153.2892147.9442063.544814
A403.7339571.0327983.2034681.1877271.0000001.2114641.085991
A418.0022007.6610738.2674257.9717567.4384684.9511906.904313
A424.7645195.6506345.2972605.5374566.3107693.0087246.314960
A4310.9705465.0040715.1040245.3901385.3140273.4786414.912087
A441.3650501.3817802.5668341.1557121.0367711.0361641.000000
A455.0981317.4292537.1547997.9560318.01067811.3502507.727939
A463.6661734.7376085.1802183.9266155.0037535.9122363.267847
A478.4267471.6667731.5403861.2740953.0524831.9075821.142857
Best weight (kg)12,136.58510,738.56311,450.26610,573.07410,524.03613,400.36010,407.260
Mean weight (kg)12,695.50910,946.30612,043.61210,845.92411,021.86318,448.18010,575.910
Worst weight (kg)13,198.01411,200.83012,387.13011,105.41911,666.72022,500.48011,157.420
STD (kg)287.632139.758230.137135.411313.7992413.004193.226
CV (%)0000000
NSA20,00020,00020,00020,00020,00020,00020,000
Friedman Rank6452371
Table 13. Natural frequencies calculated for the optimized designs of the 1410-bar truss structure.
FDB-AGDE-1FDB-AGDE-2FDB-AGDE-3COBOFLALPO
MATLAB7.0043497.0059657.0149407.0012177.0003257.0372617.002323
7.0043497.0059657.0149407.0012177.0003257.0372617.002323
9.0621869.0067299.0089209.0005249.0001509.2791179.004569
9.1404029.0143899.0467519.0005249.0001509.2791179.004569
9.1404029.0143899.0467519.0017579.0004239.3035499.017862
SAP20007.0043497.0059657.0149407.0012177.0003257.0372617.002323
7.0043497.0059657.0149407.0012177.0003257.0372617.002323
9.0621869.0067299.0089209.0005249.0001509.2791179.004569
9.1404029.0143899.0467519.0005249.0001509.2791179.004569
9.1404029.0143899.0467519.0017579.0004239.3035499.017862
Table 14. Cohen’s effect sizes for pairwise comparisons of metaheuristics in 1410-bar dome truss optimization.
FDB-AGDE-1FDB-AGDE-2FDB-AGDE-3COBOFLALPO
FDB-AGDE-1 7.7355652.5027158.2277565.5602813.3478248.650732
FDB-AGDE-27.735565 5.7635210.7295120.311064.3893422.196544
FDB-AGDE-32.5027155.763521 6.3433283.7132093.7366326.907323
CO8.2277560.7295126.343328 0.7280224.4485311.618359
BO5.5602810.311063.7132090.728022 4.3160721.711356
FLA3.3478244.3893423.7366324.4485314.316072 4.599055
LPO8.6507322.1965446.9073231.6183591.7113564.599055
Disclaimer/Publisher’s Note: The statements, opinions and data contained in all publications are solely those of the individual author(s) and contributor(s) and not of MDPI and/or the editor(s). MDPI and/or the editor(s) disclaim responsibility for any injury to people or property resulting from any ideas, methods, instructions or products referred to in the content.