Article

Parametric Analysis of a 400-Meter Super-High-Rise Building: Global and Local Structural Behavior

1
CABR Technology Co., Ltd., Beijing 100013, China
2
National Engineering Research Center of Building Technology, Beijing 100013, China
3
China Merchants Shekou Industrial Zone Holding Co., Ltd., Chengdu Branch, Chengdu 610041, China
*
Author to whom correspondence should be addressed.
Buildings 2025, 15(17), 3199; https://doi.org/10.3390/buildings15173199
Submission received: 19 July 2025 / Revised: 30 August 2025 / Accepted: 1 September 2025 / Published: 4 September 2025
(This article belongs to the Section Building Structures)

Abstract

Super high-rise buildings of 400 m and above are currently rare globally, making their design and construction data invaluable. Due to their enormous size, the structural safety, architectural effect, and construction cost are key concerns of all parties. This study employs parametric analysis to research the lateral force-resisting system and key local structural issues of a 400 m under-construction super-high-rise structure. The overall analysis results show that the 8-mega-column scheme can relatively well balance architectural effect and structural performance; the 5-belt truss design minimizes the steel consumption. The local research results indicate that the inward inclination of bottom columns leads to increased axial forces in floor beams significantly, necessitating reinforcement; horizontal braces directly connected to the core tube enhance folded belt truss integrity under rare earthquakes; failure of bottom gravity columns in the folded secondary frame increases beam bending moments and axial forces substantially. Steel consumption sensitivity analysis shows that when the structural first-order period is reduced by 0.1 s, adjusting the section sizes of the members in the belt truss minimizes the increase in steel consumption, while adjusting steel beams maximizes it. These findings provide essential design insights for similar super-high-rise projects.

1. Introduction

Over the past few decades, rapid urbanization and the growing demand for space have led to the rise of super-high-rise buildings around the globe, transforming city skylines and redefining architectural possibilities. In 1931, the Empire State Building, standing at 381 m, was completed in New York and held the title of “the world’s tallest building” for the next 40 years [1]. In 1974, the Sears Tower, measuring 442 m, was completed in Chicago, USA, and became the tallest building until 1998 [2]. In 2010, the Burj Khalifa in Dubai, United Arab Emirates, reached a height of 828 m, making it the current tallest building in the world. China has also seen the completion of notable super-high-rise buildings, such as the Jin Mao Tower in Shanghai, which was completed in 1999 at 365 m [3], Taipei 101 at 508 m in 2004, and the Shanghai Tower in 2016, standing at 632 m, currently the third tallest building in the world [4].
Since entering the 21st century, super-high-rise buildings have emerged rapidly worldwide, especially in China [5]. Structures reaching heights of 300 m and above have become important symbols of a city’s economic strength and status, while those exceeding 400 m have served as “skyline landmarks” and core carriers of urban spatial strategies [6,7]. According to statistics from the Council on Tall Buildings and Urban Habitat (CTBUH) [3], as of 2024, a total of 241 high-rise buildings over 300 m have been completed globally, but only 25 buildings reach the 400 m threshold. Therefore, the accumulation of design and research data for super-high-rise buildings of approximately 400 m or above remains extremely scarce and valuable.
As a landmark building in the region, 400 m class super-high-rise buildings should balance architectural imagery, structural safety, and economic efficiency [8,9]. However, achieving this balance poses significant challenges. In terms of architectural imagery, due to their great height, these super-high-rise buildings have a significant impact on the urban landscape. Therefore, their forms should integrate regional culture with contemporary aesthetics [10]. Additionally, builders often have stringent requirements for internal functionality and space utilization, such as for office and residential spaces. As a result, maximizing the fulfillment of architects’ demands presents a considerable challenge. In terms of structural safety, the extremely high-altitude environment and enormous structural self-weight require the structural system to have higher safety redundancy. For instance, due to its extremely high building height, the building’s own weight is very large. All of the self-weight is concentrated on the columns and walls at the bottom floor. Therefore, it is essential to focus on reducing the overall weight of the structure and ensuring the safety of the components at the base. To achieve this, various materials are utilized in the construction of super-high-rise structures [11]. Additionally, as building height increases, so do the lateral forces and deformations caused by horizontal wind loads and seismic activity [12]. Consequently, selecting an appropriate lateral force-resisting system becomes a critical consideration [13]. Moreover, it is important to focus on specific structural practices that arise from the architect’s design requirements for certain parts of the building. In terms of economic efficiency, the massive construction volume makes material consumption and construction costs non-negligible issues. How to minimize material consumption while still meeting the functional requirements of the building through the reasonable layout of the structure and the optimization of materials is a question worth considering [9,14,15]. In conclusion, against the backdrop of global infrastructure transitioning towards “technologization, greenization, and efficiency”, achieving dynamic balance among spatial performance, safety reserves, and economic costs through structural system innovation, member optimization, and exploration of material performance has become one of the core research propositions in the engineering field [16].
This paper takes an under-construction super-high-rise structure with a height of approximately 400 m as the research object. Based on the height, shape characteristics, and functional features of this super-high-rise building, it concentrates on and solves the following issues:
(1)
How to select the lateral force-resisting system of the structure and determine the appropriate number of exterior frame columns.
(2)
How to determine the number and position of the belt trusses.
(3)
The problems caused by the inward inclination of the bottom columns and their solutions.
(4)
The problems brought about by the folded floor outline and their corresponding solutions.
(5)
The optimization efficiency of various components?
At the same time, this paper employs parametric analysis techniques to provide a detailed comparison process and calculation results, thereby enhancing computational efficiency. Finally, by extracting technical guidelines and optimization strategies throughout the design process, the research in this paper can provide references for the design of the super-high-rise structures under similar heights, planar shapes, and design conditions, and the parametric analysis technique adopted can support future research on more complex super-high-rise structures.

2. Research Objects and Methods

2.1. Project Overview

This project is a super-high-rise tower in the southwest of China, as shown in Figure 1. The structure is 396 m in height, with 83 floors above ground. The floors below the 65th are for office use, while the floors above the 65th are for hotel and observation deck functions. There are five floors underground and a 5-story podium. Starting from the 5th floor above ground, a refuge floor is set every ten floors. The floor plan is larger at the bottom and smaller at the top, with the floor outline gradually narrowing. The bottom floor outline is roughly square-shaped, while the top is close to an octagon, and there are some folded angles in the middle of the side edges. The facade curtain wall has turning lines that change in two directions along the height, and the corners at the bottom are cut off. The low-rise office floor outline is 63 m × 63 m, and the high-rise hotel floor outline is 52 m × 52 m. The core tube is square with a nine-grid internal layout, and its bottom outline is 29.4 m × 29.4 m.
The seismic fortification intensity of this project is 7 degrees (0.1 g) for a Class II site; the design seismic group is the third group, and the characteristic period of the site is 0.45 s [17]. The basic wind pressure in this area is 0.35 kN/m2, and it falls under Class B terrain [18]. For super-high-rise structures in areas with similar seismic intensity, site conditions and wind loads, the research results presented in this paper have considerable reference value. However, they are not applicable to some regions with extremely high horizontal loads, such as those with a seismic intensity of 8 degrees or above, or those located in coastal areas with strong typhoons.
The additional permanent dead load on the office area floor is 2.0 kN/m2, the live load is 3.5 kN/m2, the additional permanent dead load on the hotel area floor is 4.5 kN/m2, and the live load is 3.0 kN/m2. Since the internal functions of most buildings over 300 m in height are for offices or hotels [4], the vertical load values for this project have a certain degree of universality.
In terms of structural materials, the structure employs a concrete core tube combined with a steel-concrete composite exterior frame, which leverages the advantages of both steel and concrete materials comprehensively [19]. With a relatively low self-weight, it achieves high bearing capacity and good seismic performance [20]. The exterior frame columns adopt steel-reinforced concrete (SRC) cross-sections, which must meet a minimum steel ratio of 4% [21].

2.2. Research Methods and Approach

With the advancement of computer technology, parametric modeling analysis techniques are being increasingly applied in the field of building structures. In the field of super-high-rise buildings, their application can significantly enhance the efficiency of modeling, analysis, and design [22,23,24,25,26,27].
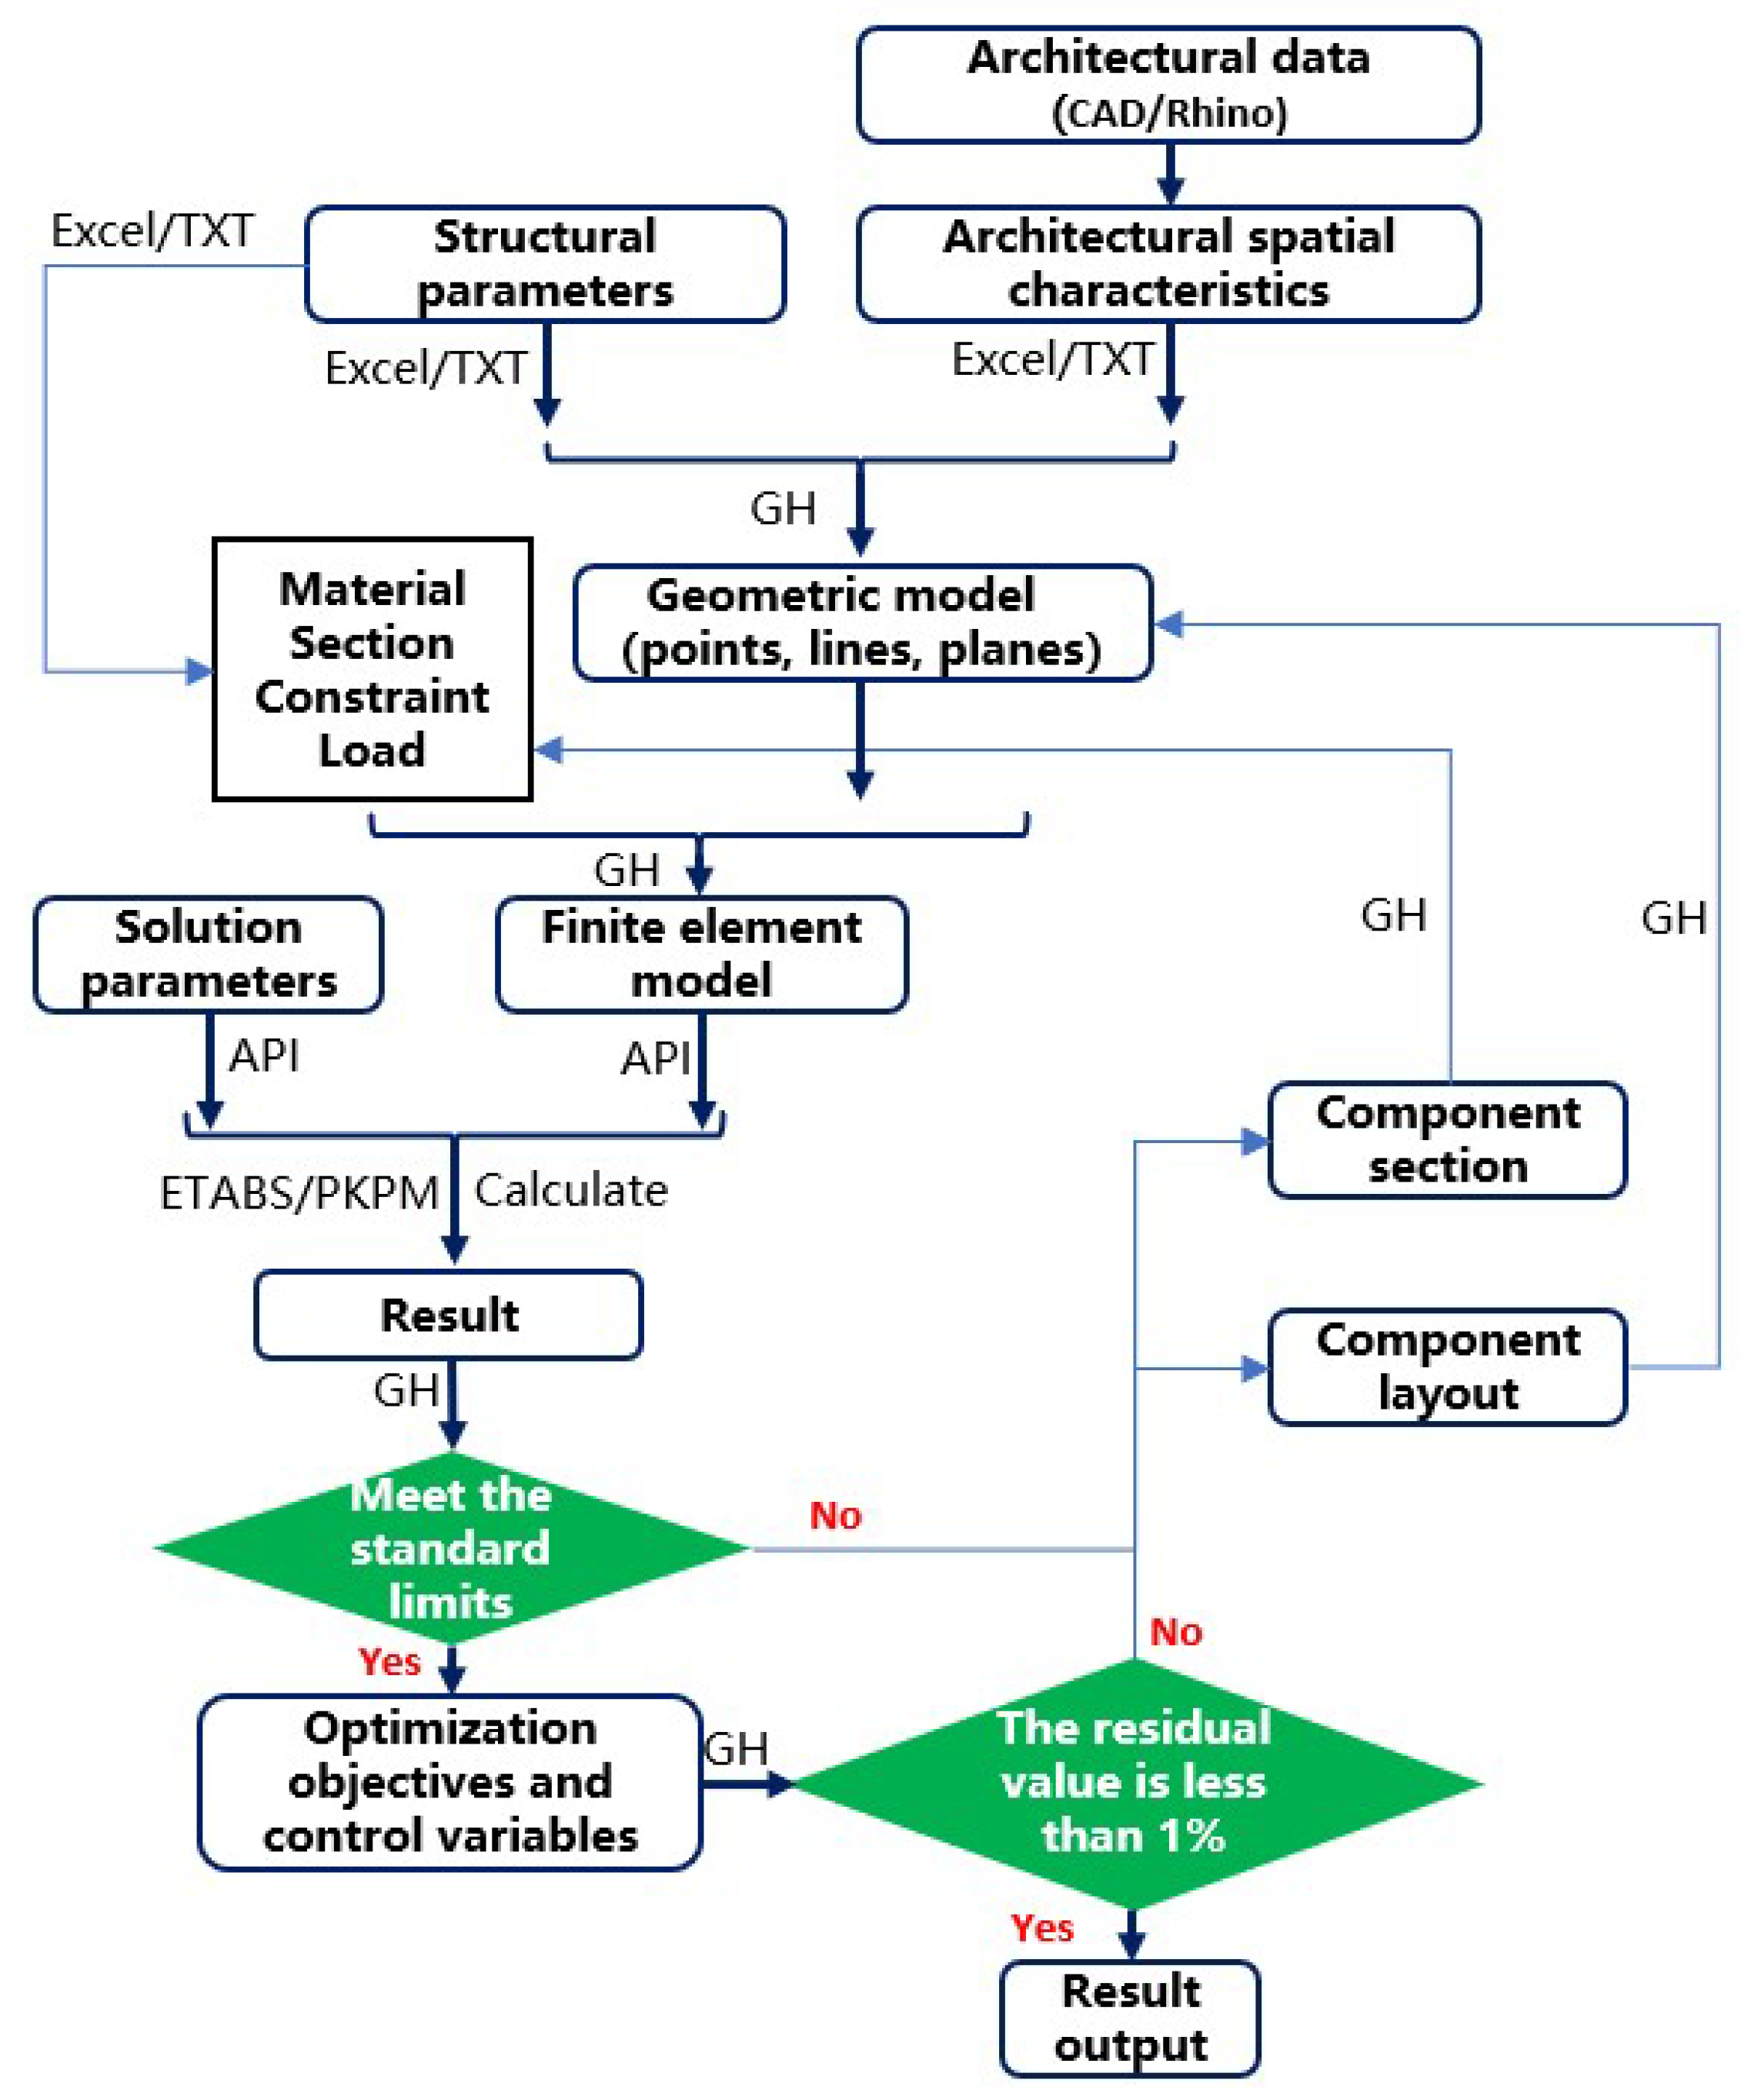
This study introduces the parametric analysis technique and conducts research and secondary development based on the Grasshopper (GH) platform. It establishes a parametric analysis method from the structural geometric model to the finite element model, and subsequently to solution calculation, result extraction, and optimization, as shown in Figure 2. First, based on the CAD floor plan or Rhino geometric model provided by the architect, key structural geometric feature data are extracted and formatted into Excel files or TXT files through preprocessing. Second, in GH, specific components are selected, and related components are developed using programming languages such as C#. The geometric information in the files is read, and a geometric model is established. Following this, the material properties, section dimensions, boundary conditions, and loads for the finite element model are defined, and the finite element model itself is created. Third, through the use of the ETABS Open API and the PKPM API, direct calls and calculations in these two software applications are executed within GH, and the calculation results are generated. The structural index limits are then assessed, including metrics such as period, displacement angle, displacement ratio, and axial compression ratio. If these limits are not met, the component sections are adjusted and recalculated until the requirements are satisfied. Finally, the component optimization principles and goals are set, results are evaluated, components are modified, and recalculations are performed repeatedly until the optimization goals are achieved. This entire parametric analysis process has been tested and verified with simple models prior to its application, and in this study, the intermediate process models and calculation results are manually reviewed to ensure their reliability.
In terms of software versions, ETABS operates on version 2021, while PKPM uses version 2024. The calculations and designs adhere to Chinese standards. The structural calculation model for the tower building accounts for 4 floors below ground and 83 floors above ground. After conducting a calculation, we found that the lateral stiffness ratio of the underground first floor compared to the first floor of this project is greater than 2, which complies with the relevant standards [17,28]. As a result, the top slab of the basement is treated as a fixed end, allowing us to disregard the interaction between the soil and the structure in our analysis. The floor slabs utilize elastic membranes, which means that in-plane stiffness is considered, while out-of-plane stiffness is disregarded. The construction sequence of the model is based on a layer-by-layer approach. Preliminary calculations are carried out according to the relevant standard [28], the gravity second-order effect needs to be considered in the model calculation.
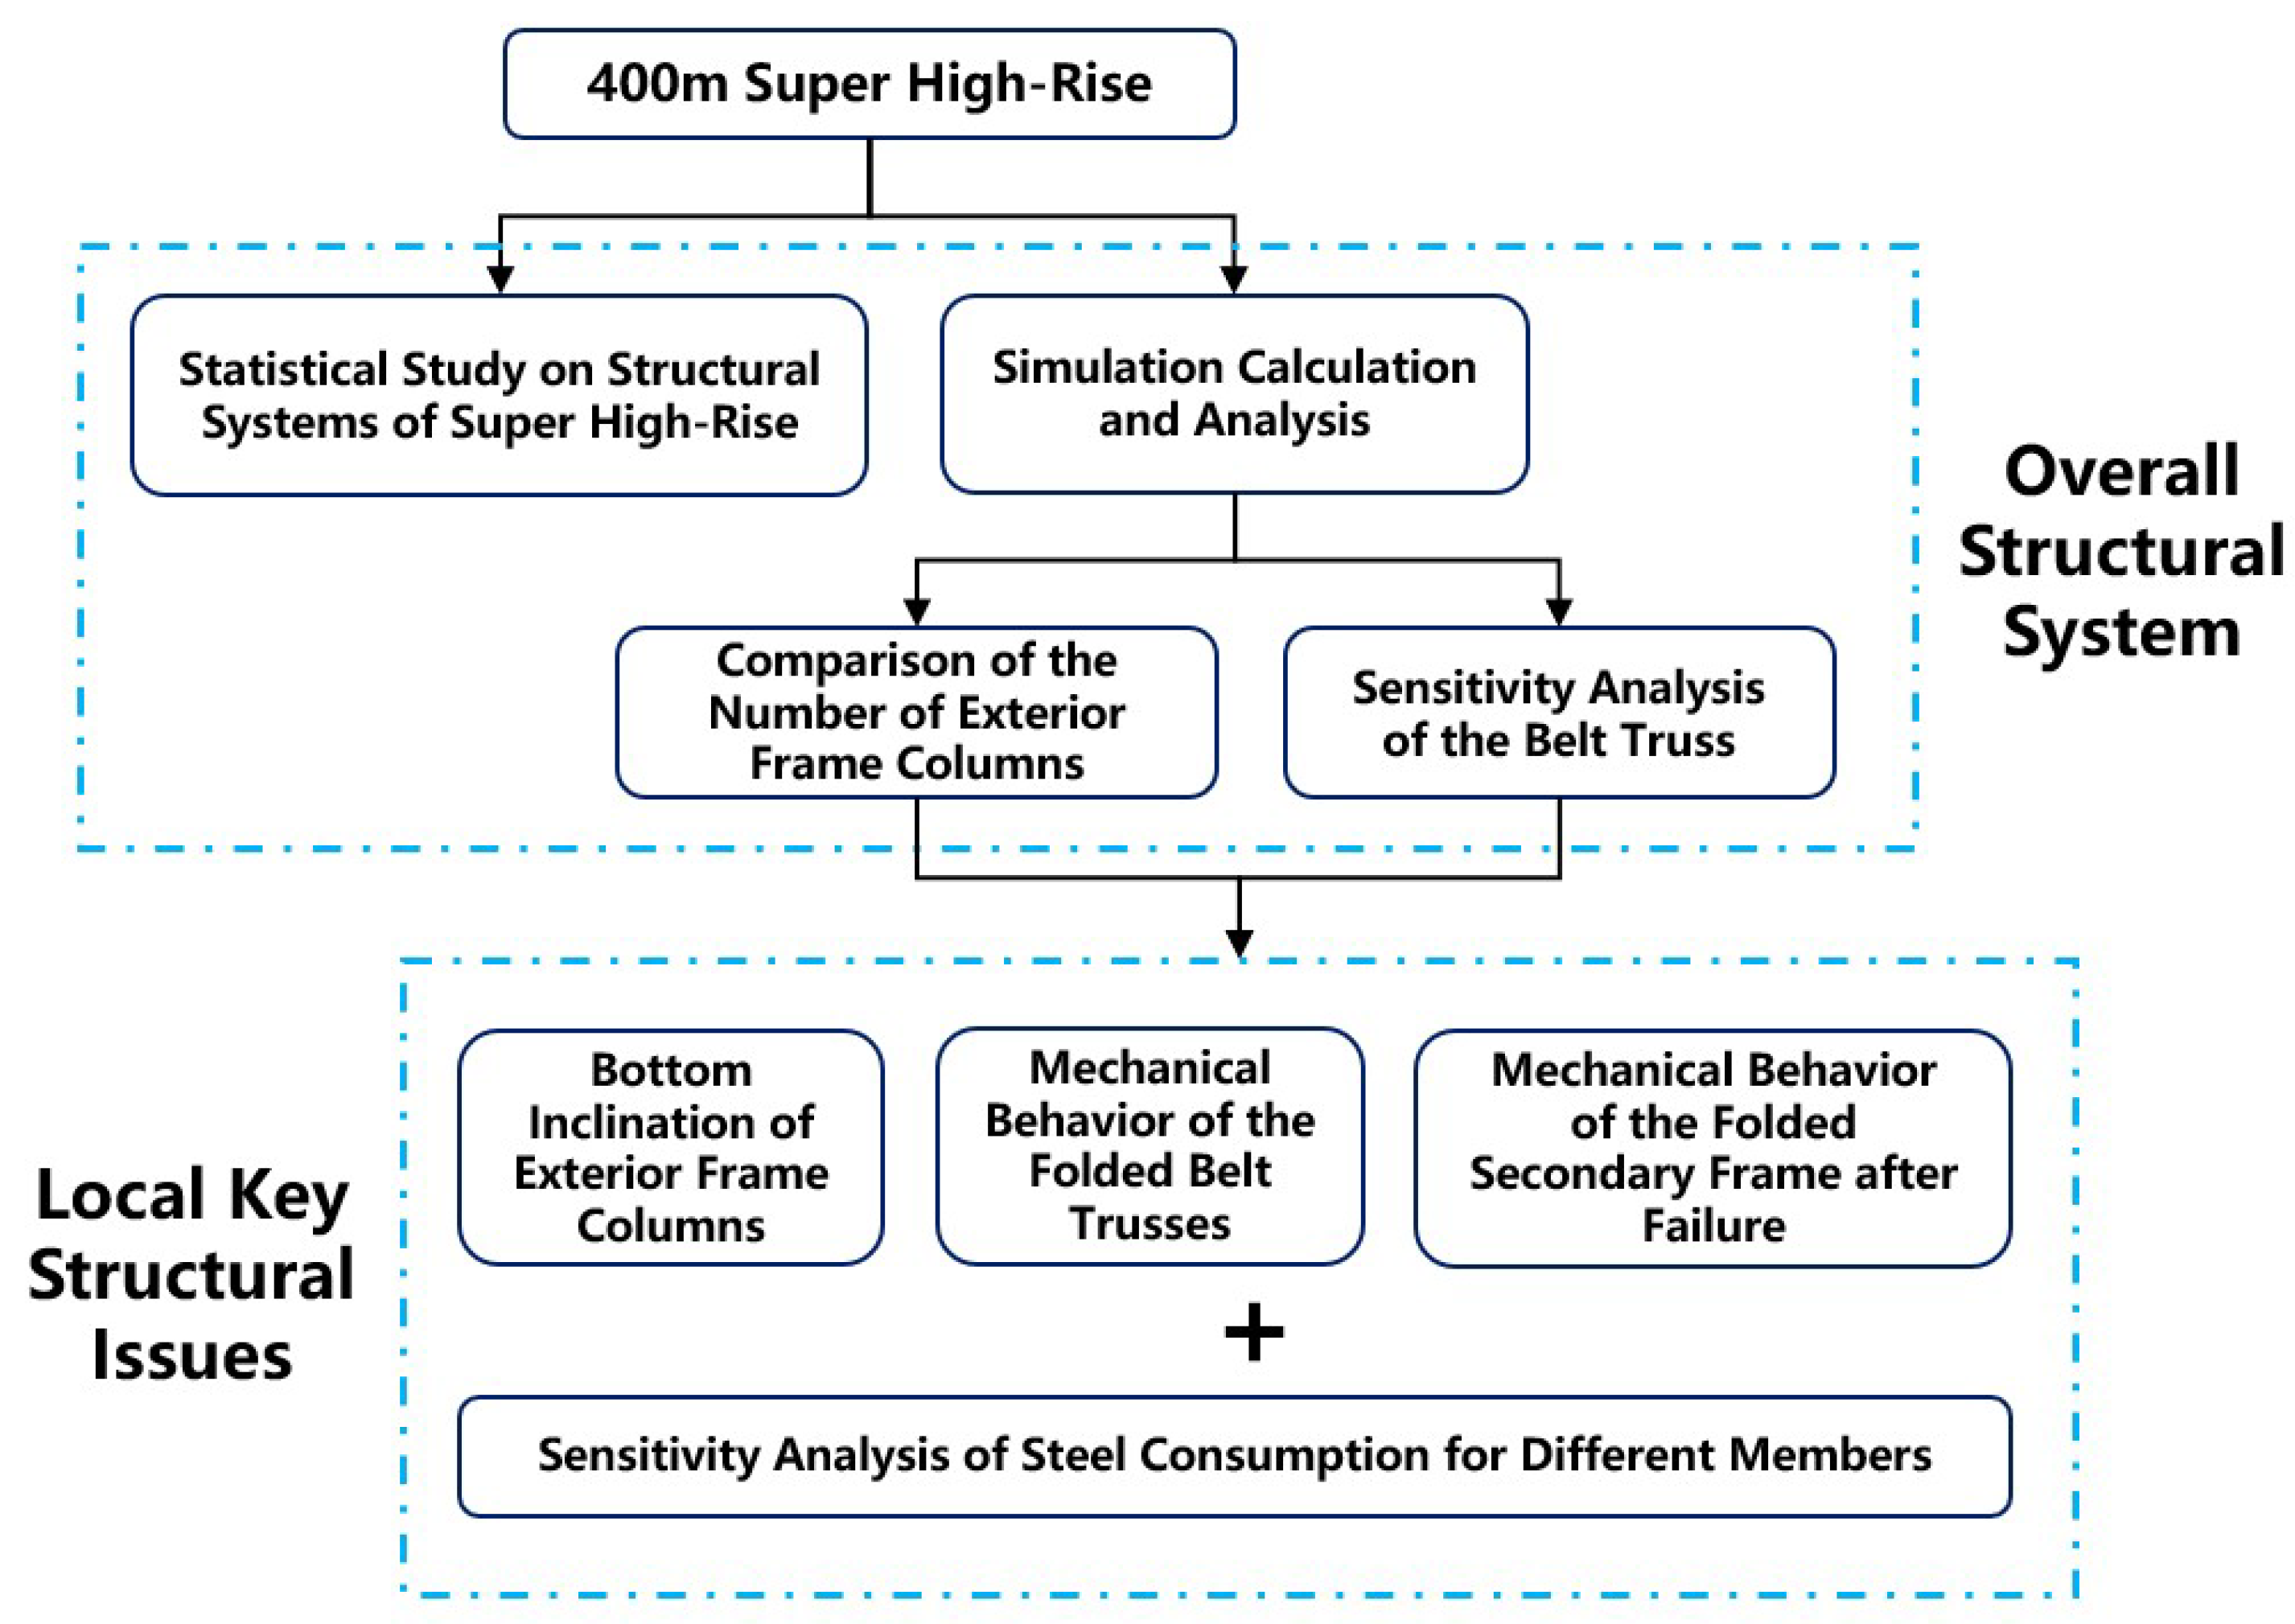
This paper divides its research into two main steps, considering the height and planar characteristics of the project. First, the overall system is examined and compared across two approaches: case data statistics and numerical simulation. Second, specific key structural issues are analyzed in detail. The overall research framework is illustrated in Figure 3.

3. Research on Structural Lateral Force-Resisting System

3.1. Statistical Study on Structural Systems of Super-High-Rise Buildings

The structural system of high-rise buildings, commonly referred to as the “force transmission system,” classifies these structures based on their various force transmission properties and the composition of their structural components. Among these, the “lateral force-resisting structural system” is crucial for super-high-rise buildings [13], as it must consider two main factors: the building’s intended function and its height [29]. The purpose of the building, along with the internal space provided by the structural system, is a primary focus of the structural design. Additionally, different structural systems possess varying stiffness and load-bearing capacities, which means their suitable height ranges differ as well [30].
For super-high-rise structures, the commonly used lateral force-resisting systems mainly include three types, as shown in Figure 4, namely the frame–core tube structure, the mega-column and core tube structure, and the tube-in-tube (closely spaced columns exterior frame structure) structure [31,32,33,34].
The frame–core tube structure refers to a structural system with an appropriate number of exterior frame columns and relatively uniform column spacing. Typically, there are no fewer than 12 exterior frame columns, and the spacing between columns generally does not exceed 15 m. This structural system has a large and flexible space, but its lateral stiffness is relatively low, so structural engineers usually reinforce it by adding multiple rigid strengthening layers [35]. This structural system is commonly seen in super-high-rise buildings with a height of no more than 300 m, such as the T1 tower of Sanya Joy City [36], and the D building of Hefei Greenland Center [37].
The mega-column and core tube structure is a system designed with fewer exterior frame columns that have larger cross-sections while ensuring the stiffness of the exterior frame. Typically, the number of mega-columns is usually no more than 8. This structural system usually consists of two or more structural forms. Generally, it is formed by large-section components that form the main structure of the exterior frame, such as the mega-columns and the belt trusses, and small components are flexibly arranged inside to form the secondary structure. Together, they constitute the entire structure. During the force-bearing process, the main structure bears most of the load and plays a primary role, while the load on the secondary structure can be transferred to the main structure. Therefore, the load acting on the secondary structure is relatively small, and it cooperates with the main structure. Due to the smaller column spacing and load of the secondary structure, smaller beam and column sections can be utilized, enabling more efficient use of floor space and greater flexibility in the structural layout [11,38]. This structural system is commonly employed in super-high-rise buildings exceeding 300 m in height, such as the super-high-rise project in Chengdu Tianfu New District [39], and the CITIC Building in Beijing [40].
The tube-in-tube structure resists lateral forces by making the exterior frame columns denser and smaller, so that the exterior frame can have the effect of a tube. Typically, the column spacing of this structural system is usually less than 4.0 m, providing high lateral stiffness. However, the excessively tight column spacing can make the building’s shape rigid and result in inflexible space divisions, which often do not meet the architectural needs of super-high-rise office towers. Additionally, the shear lag effect is quite pronounced in this design [35]. Therefore, this scheme has been rarely adopted in China in recent years, with representative examples including the Shenzhen Headquarters Building of China Resources [41].
To deepen our understanding of the relationship between the lateral force-resisting system and various factors like building height, this paper collected 46 cases of super-high-rise buildings with a height exceeding 300 m [4,42] and conducted statistical analysis. Furthermore, in the following sections of this paper, the exterior frame columns of frame–core tube structures and tube-in-tube structures will be collectively referred to as “conventional column” in contrast to mega-column.
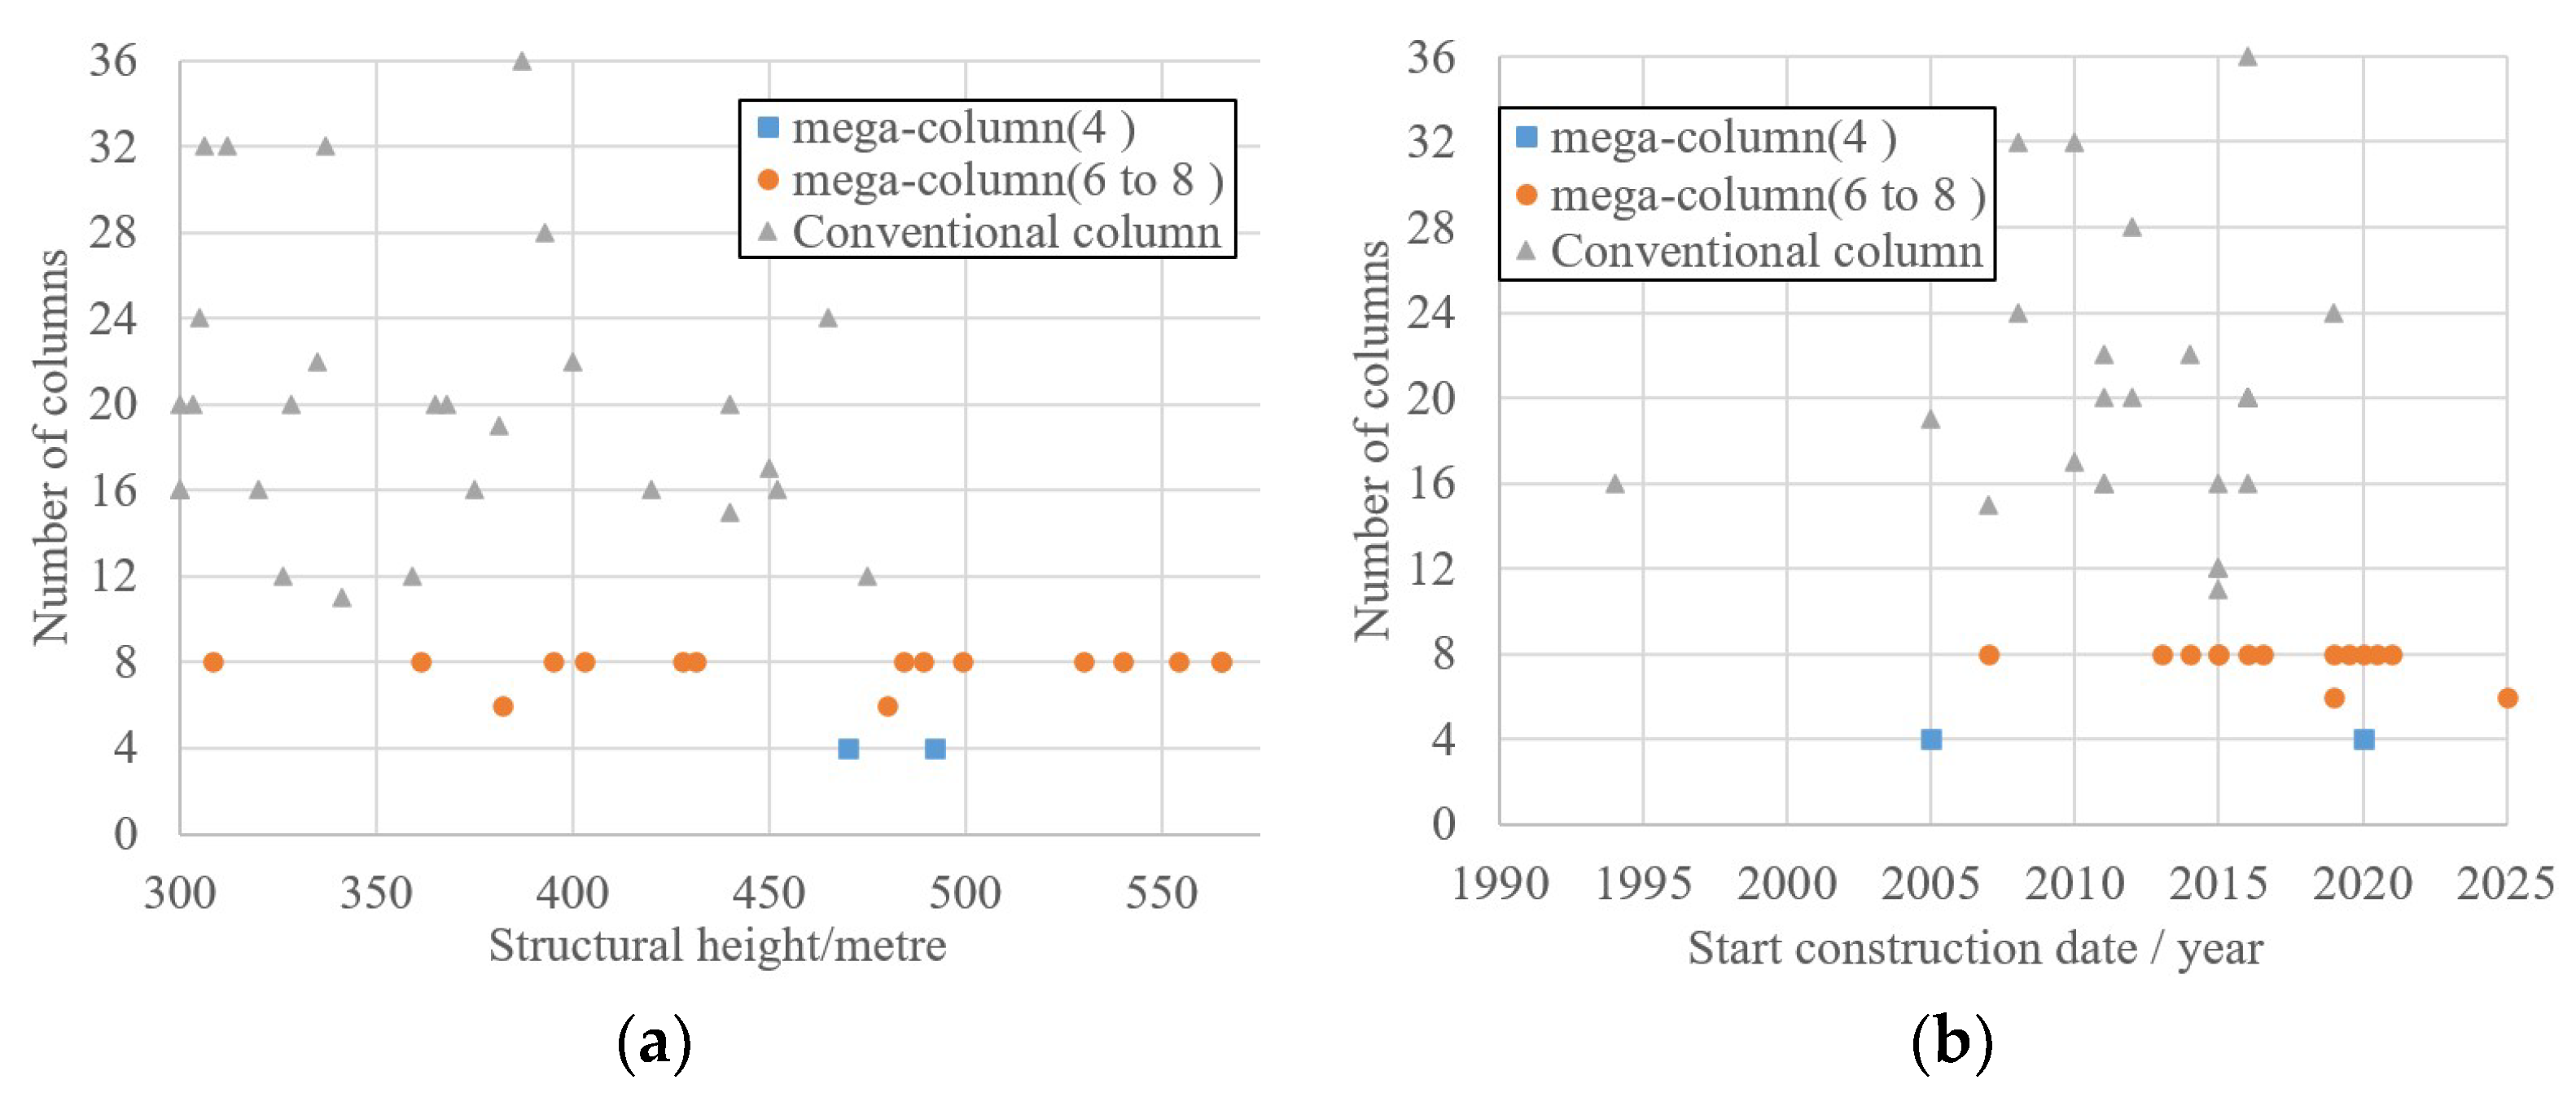
The relationship between the types of exterior frame columns and the structural height is shown in Figure 5a. For super-high-rise buildings below 350 m, the exterior frame columns are mainly conventional columns. For those above 450 m, the exterior frame columns are mainly mega-columns. For super-high-rise buildings with a height ranging from 350 m to 450 m, both types of column cross-sectional forms are widely adopted. Among engineering cases involving mega-columns, the 8-mega-column scheme is in the majority, and the number of columns in projects with conventional columns is mainly concentrated in the range of 12 to 24.
The relationship between construction start time and the type of exterior frame columns is shown in Figure 5b. It can be seen that before 2013, conventional columns were more commonly used in super-high-rise buildings. After 2013, the number of super-high-rise buildings adopting mega-column gradually increased. This might be related to architectural aesthetics, economy, as well as the development of materials and construction technologies [30].
The relationship between the structural planar shape and the number of columns is shown in Table 1. Twenty-seven super-high-rise buildings feature a square planar shape, among which 14 adopt the mega-column, with 6 to 8 mega-columns as the main type. For super-high-rise buildings with other planar shapes, conventional columns are the main type in terms of column type.

3.2. Comparative Study on the Number of Exterior Frame Columns

3.2.1. Comparison Scheme

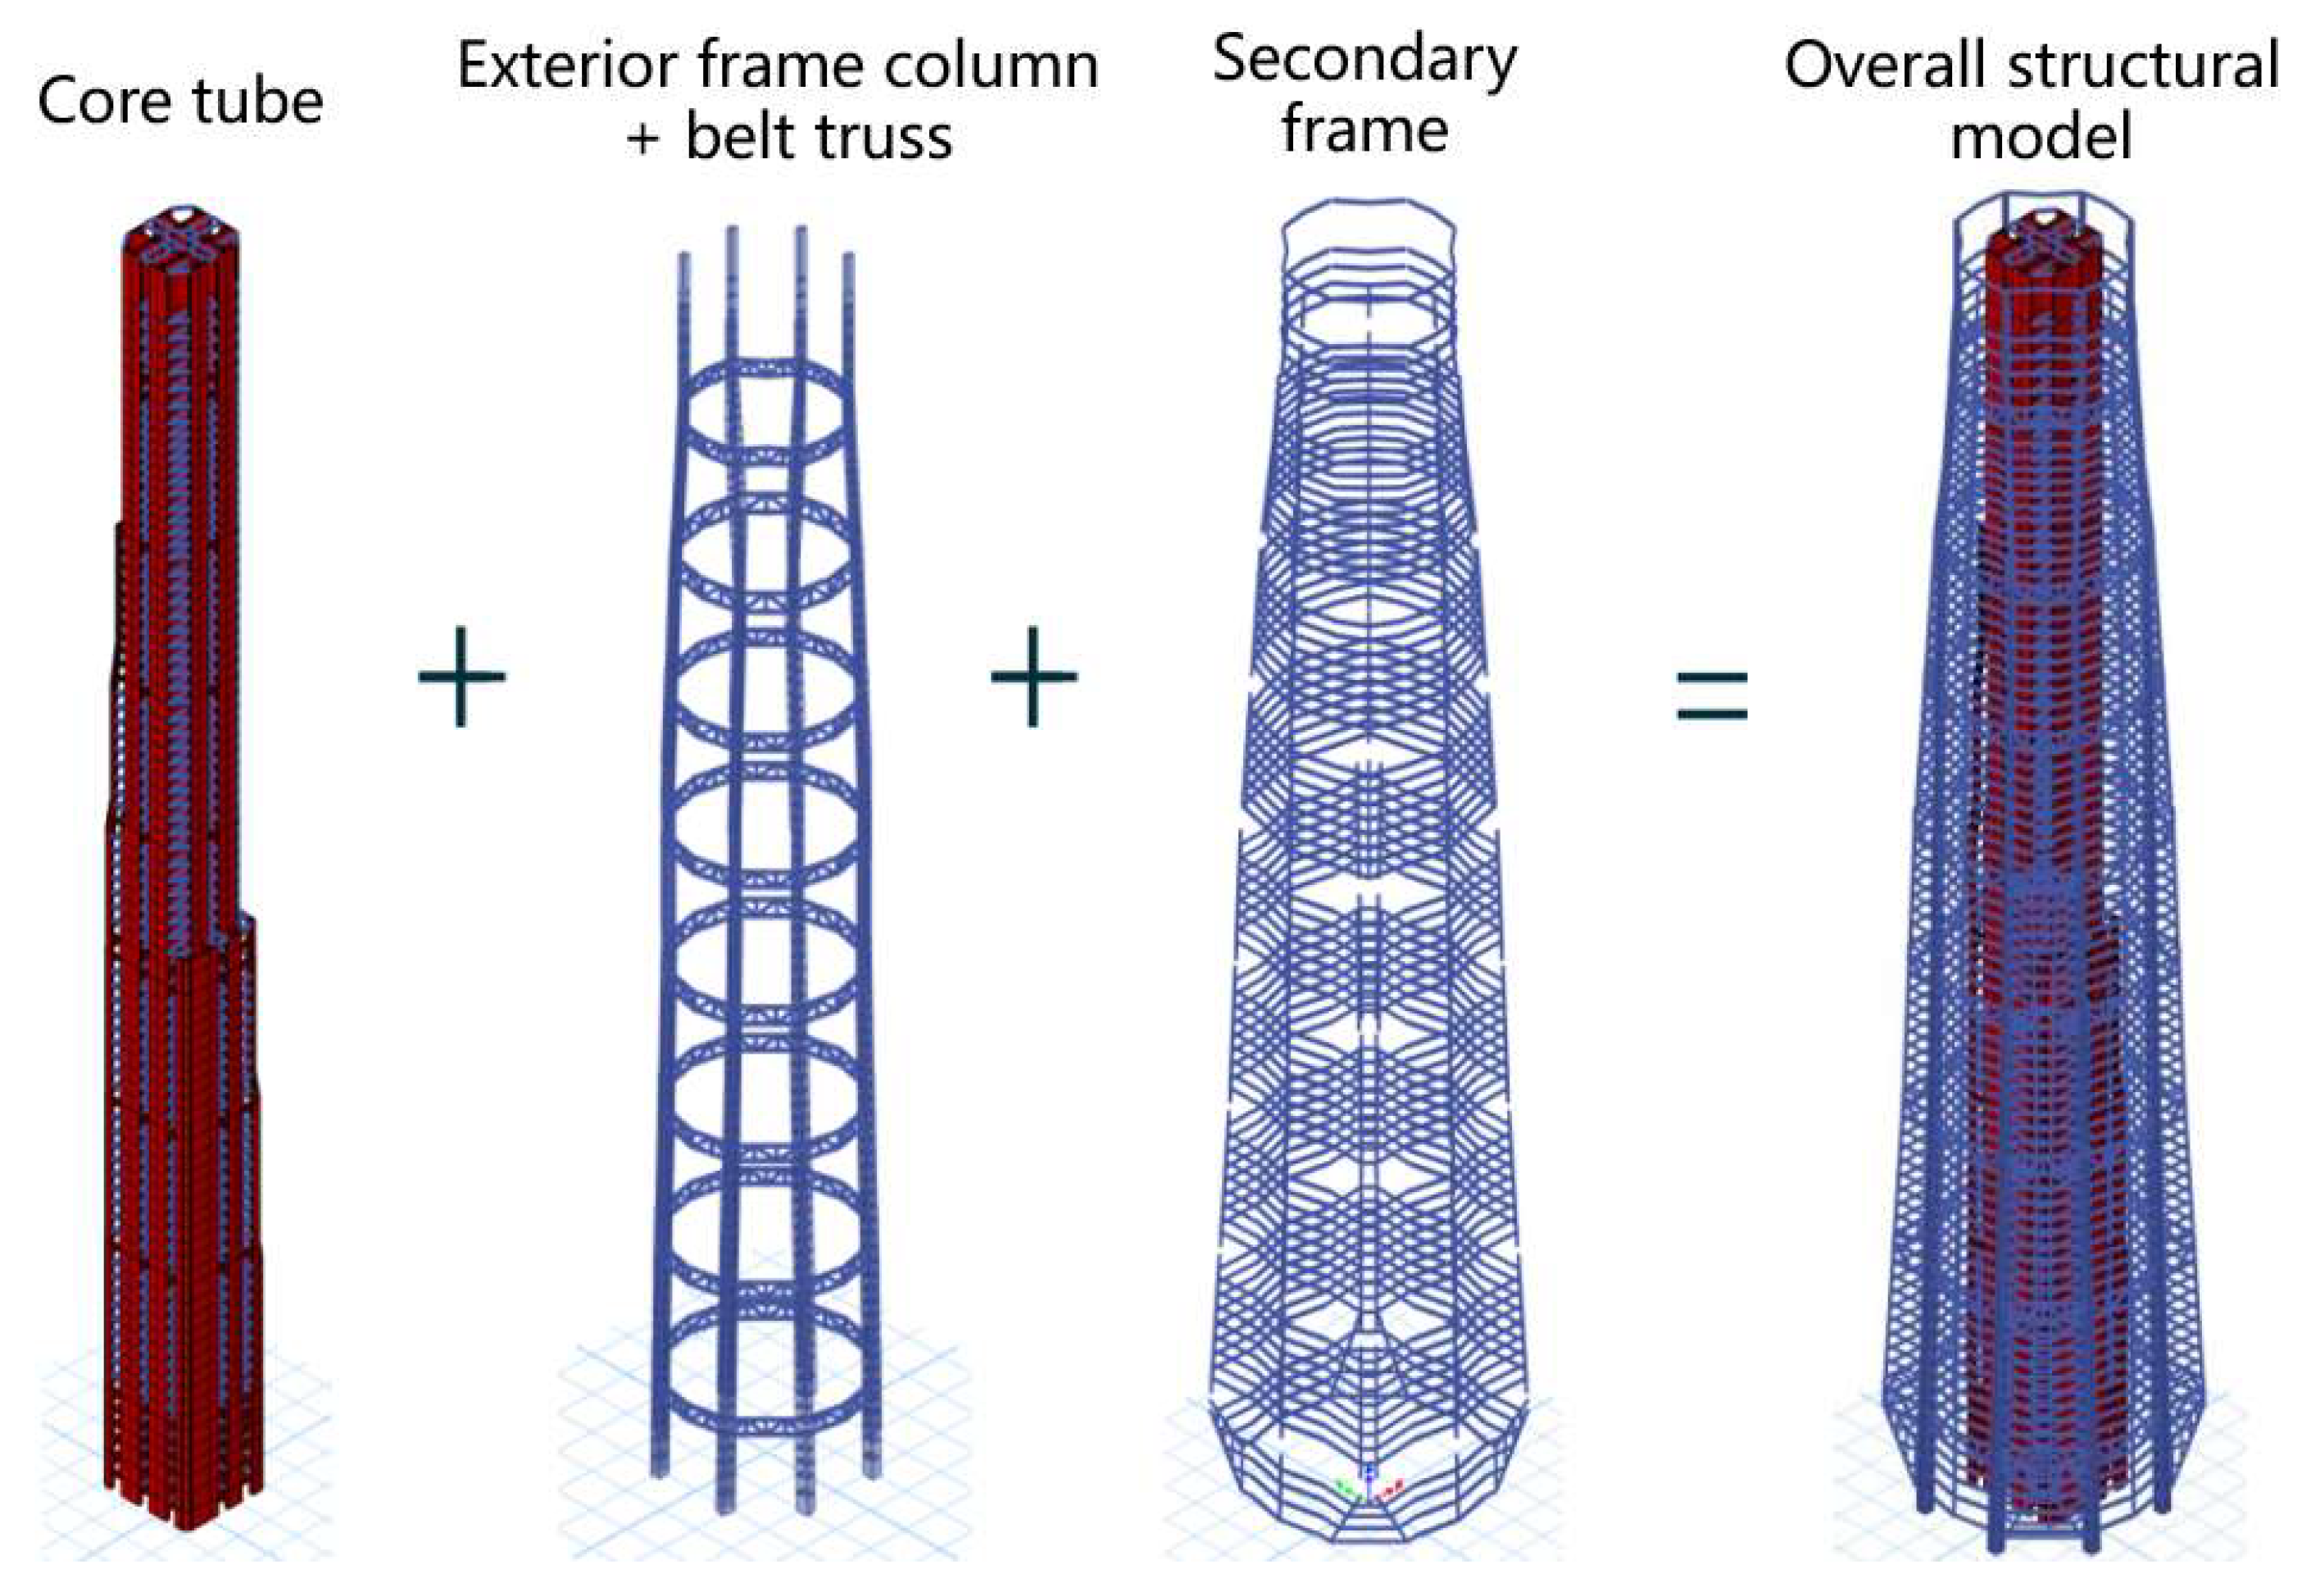
By analyzing and summarizing previous engineering cases, it is initially determined that the overall lateral force-resisting system of the structure consists of exterior frame columns/mega-columns, belt trusses, and a core tube. The core tube is slightly retracted in the middle and upper areas. The exterior frame columns follow the retraction and changes in the building’s exterior contour. They are also inclined inward and to the left and right as the height increases. Combined with the building’s refuge floors and equipment floors, the belt trusses are arranged starting from the 5th floor, with one belt truss installed every 10 floors, resulting in a total of 8 belt trusses. The super-high-rise structural system studied in this paper is shown in Figure 6.
While keeping the building’s exterior contour, core tube wall thickness, number of belt trusses, and material unchanged, by adjusting the number and section size of the exterior frame columns, the differences in the overall mechanical performance, material consumption, architectural effect, and construction difficulty of different exterior frame column quantity schemes are studied.
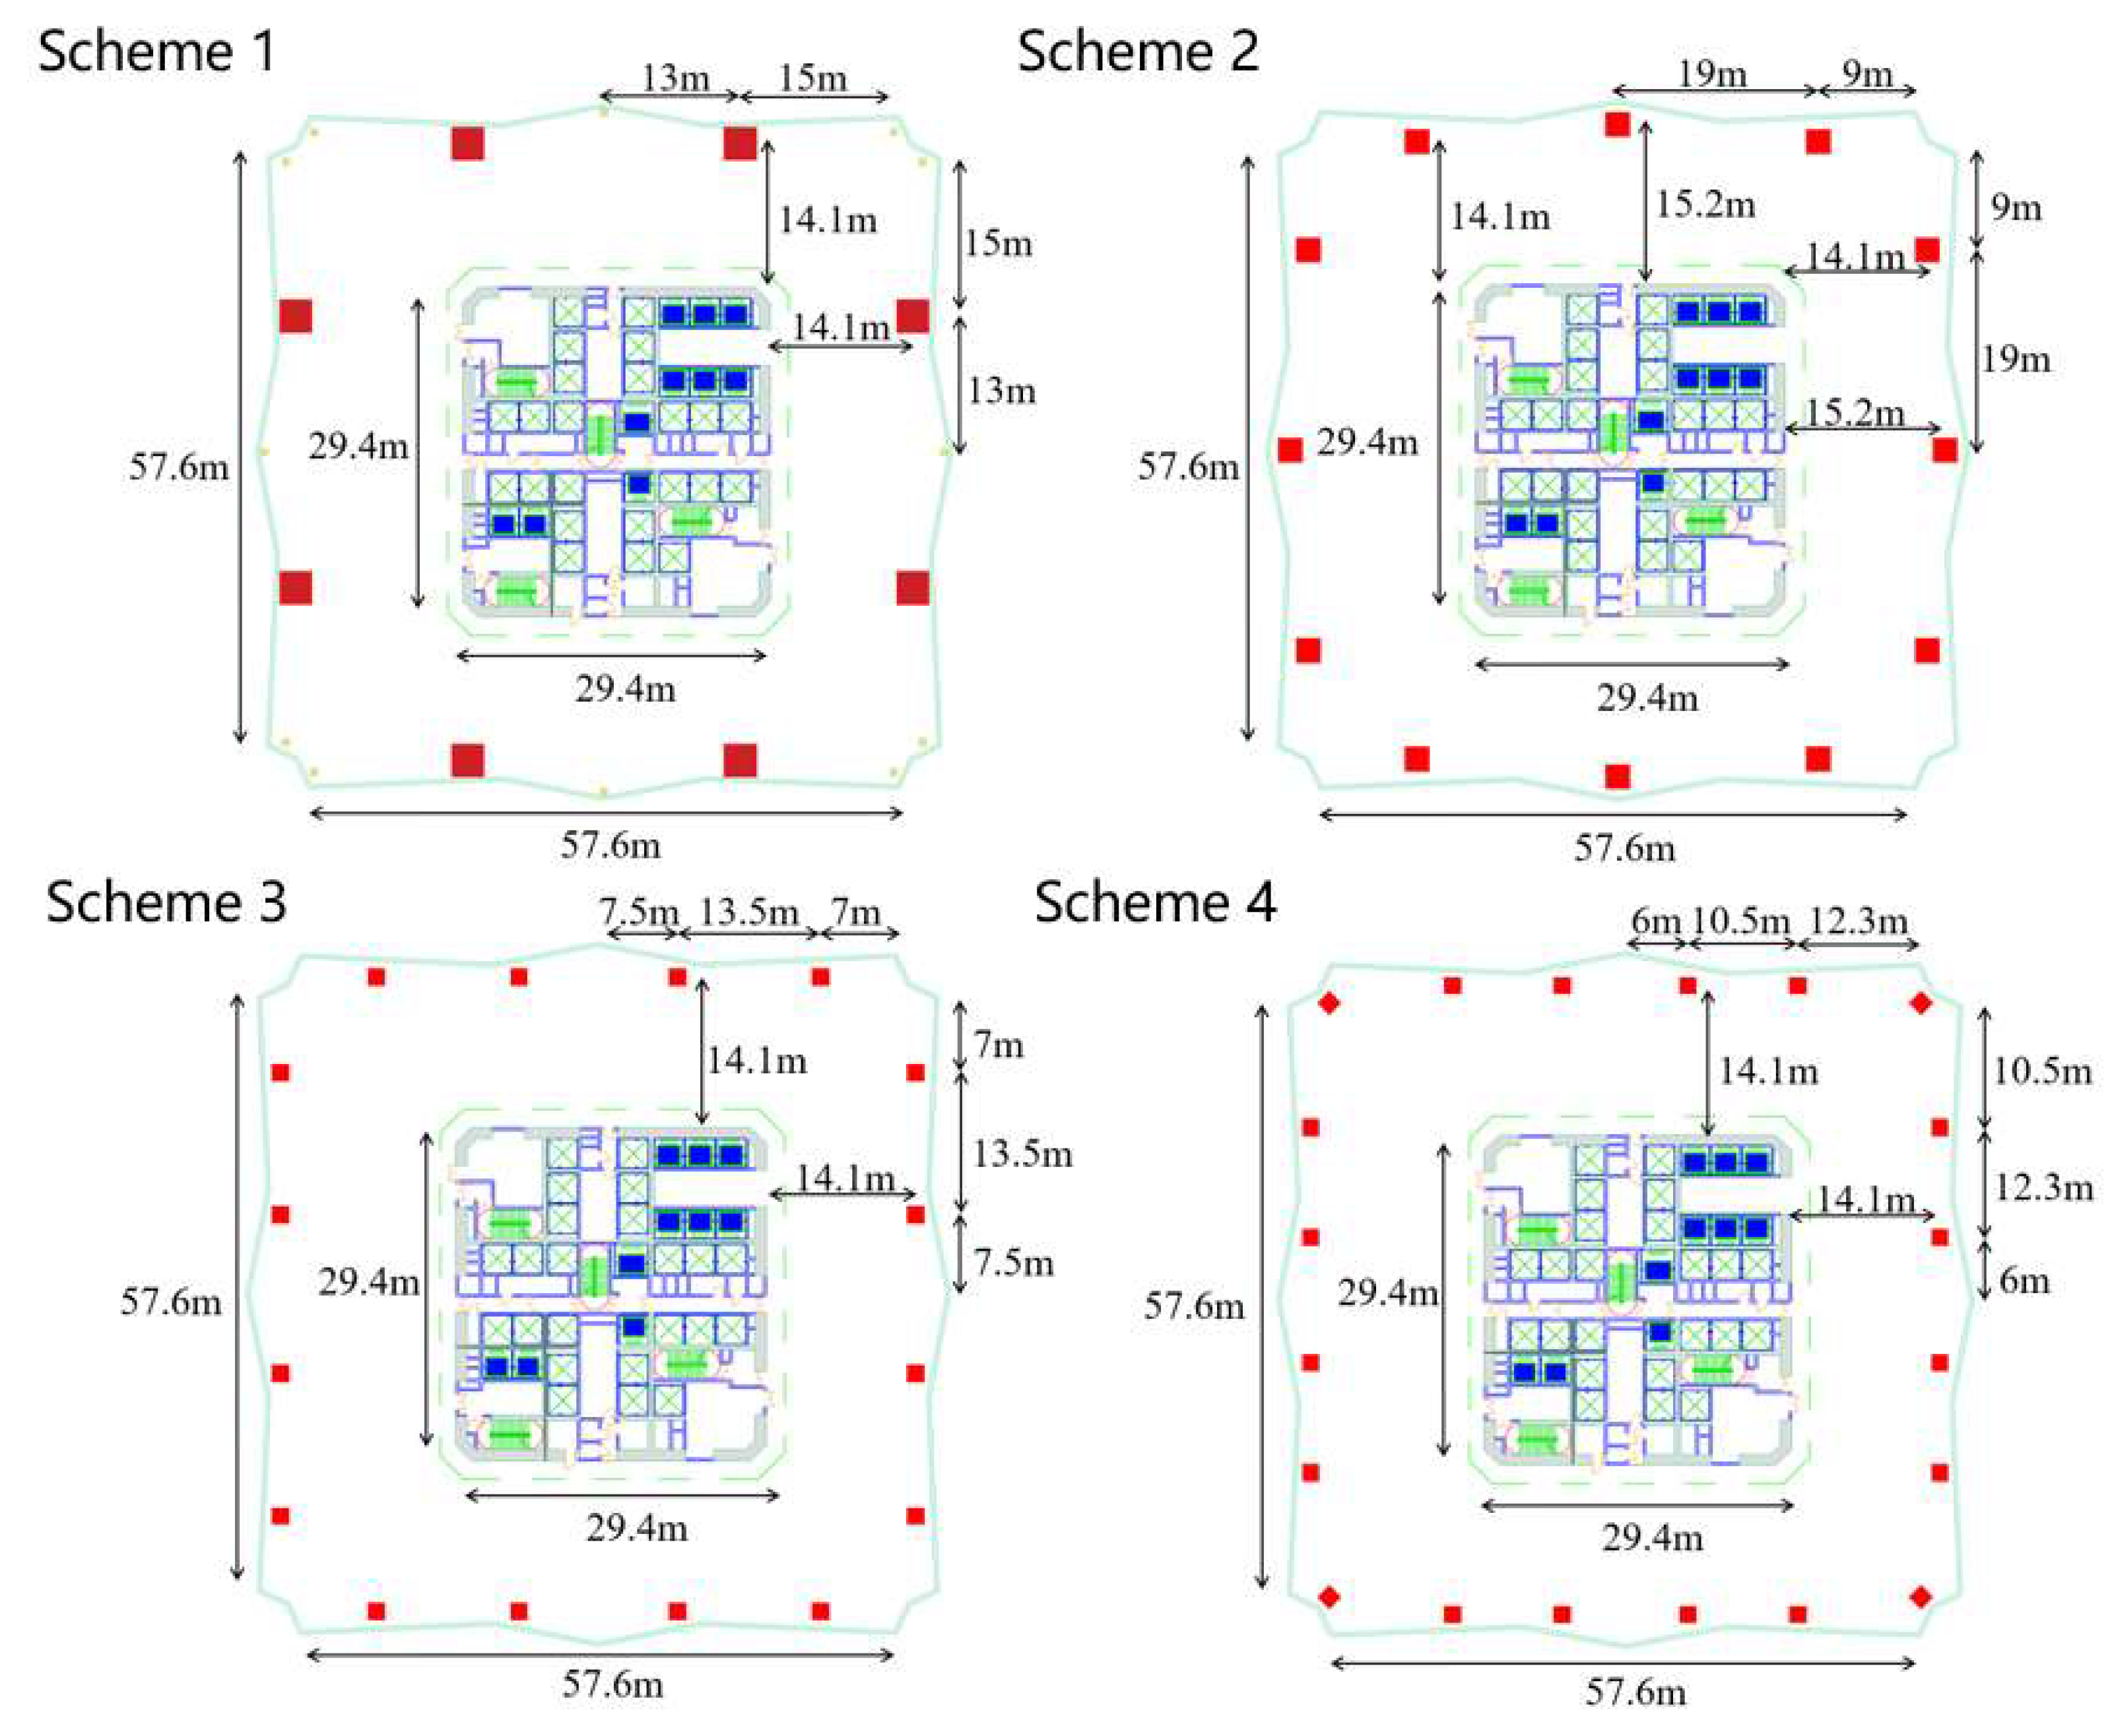
Due to the nearly square shape of the floor plan, considering the visual requirements of the building’s corners, columns should be avoided from being placed at the corners, especially those with larger cross-sections. As a result, the minimum number of columns required is 8; at the same time, the architect prefers that the spacing between columns should not be less than 10 m. Based on this, the maximum number of columns estimated is 20. Thus, four different schemes featuring varying numbers of columns have been developed, as shown in Figure 7. In each scheme, the thickness of the bottom wall is 1400 mm, the thickness of each floor slab is 120 mm, and the height of the steel beams is controlled not to exceed 1000 mm. The concrete grades for walls and columns range from C70 to C50 from bottom to top, the floor slabs use C35 concrete [43], and the steel material is G390GJ [44].
Scheme 1 adopts 8 exterior frame mega-columns. The cross-section of the bottom mega-columns is 3 m × 3 m, the spacing between the mega-columns is 26 m, and the cantilever length is 15 m. Due to the large column spacing, 4 steel gravity columns are set in the middle of the mega-columns, and 8 steel gravity columns are set at the cantilevered corners to control structural deformation.
Scheme 2 adopts 12 exterior frame columns. The cross-section of the bottom column is 2.45 m × 2.45 m, the column spacing is 19 m, the cantilever length at the corners is 9 m, and there are no gravity columns.
Scheme 3 adopts 16 exterior frame columns. The cross-section of the bottom column is 2.1 m × 2.1 m, the column spacing is approximately 13.5–15 m, the cantilever length at the corners is 7 m, and there are no gravity columns.
Scheme 4 adopts 20 exterior frame columns. The cross-section of the bottom column is 1.85 m × 1.85 m, the column spacing is approximately 10.5–12.3 m, there is no cantilever at the corners, and there are no gravity columns.
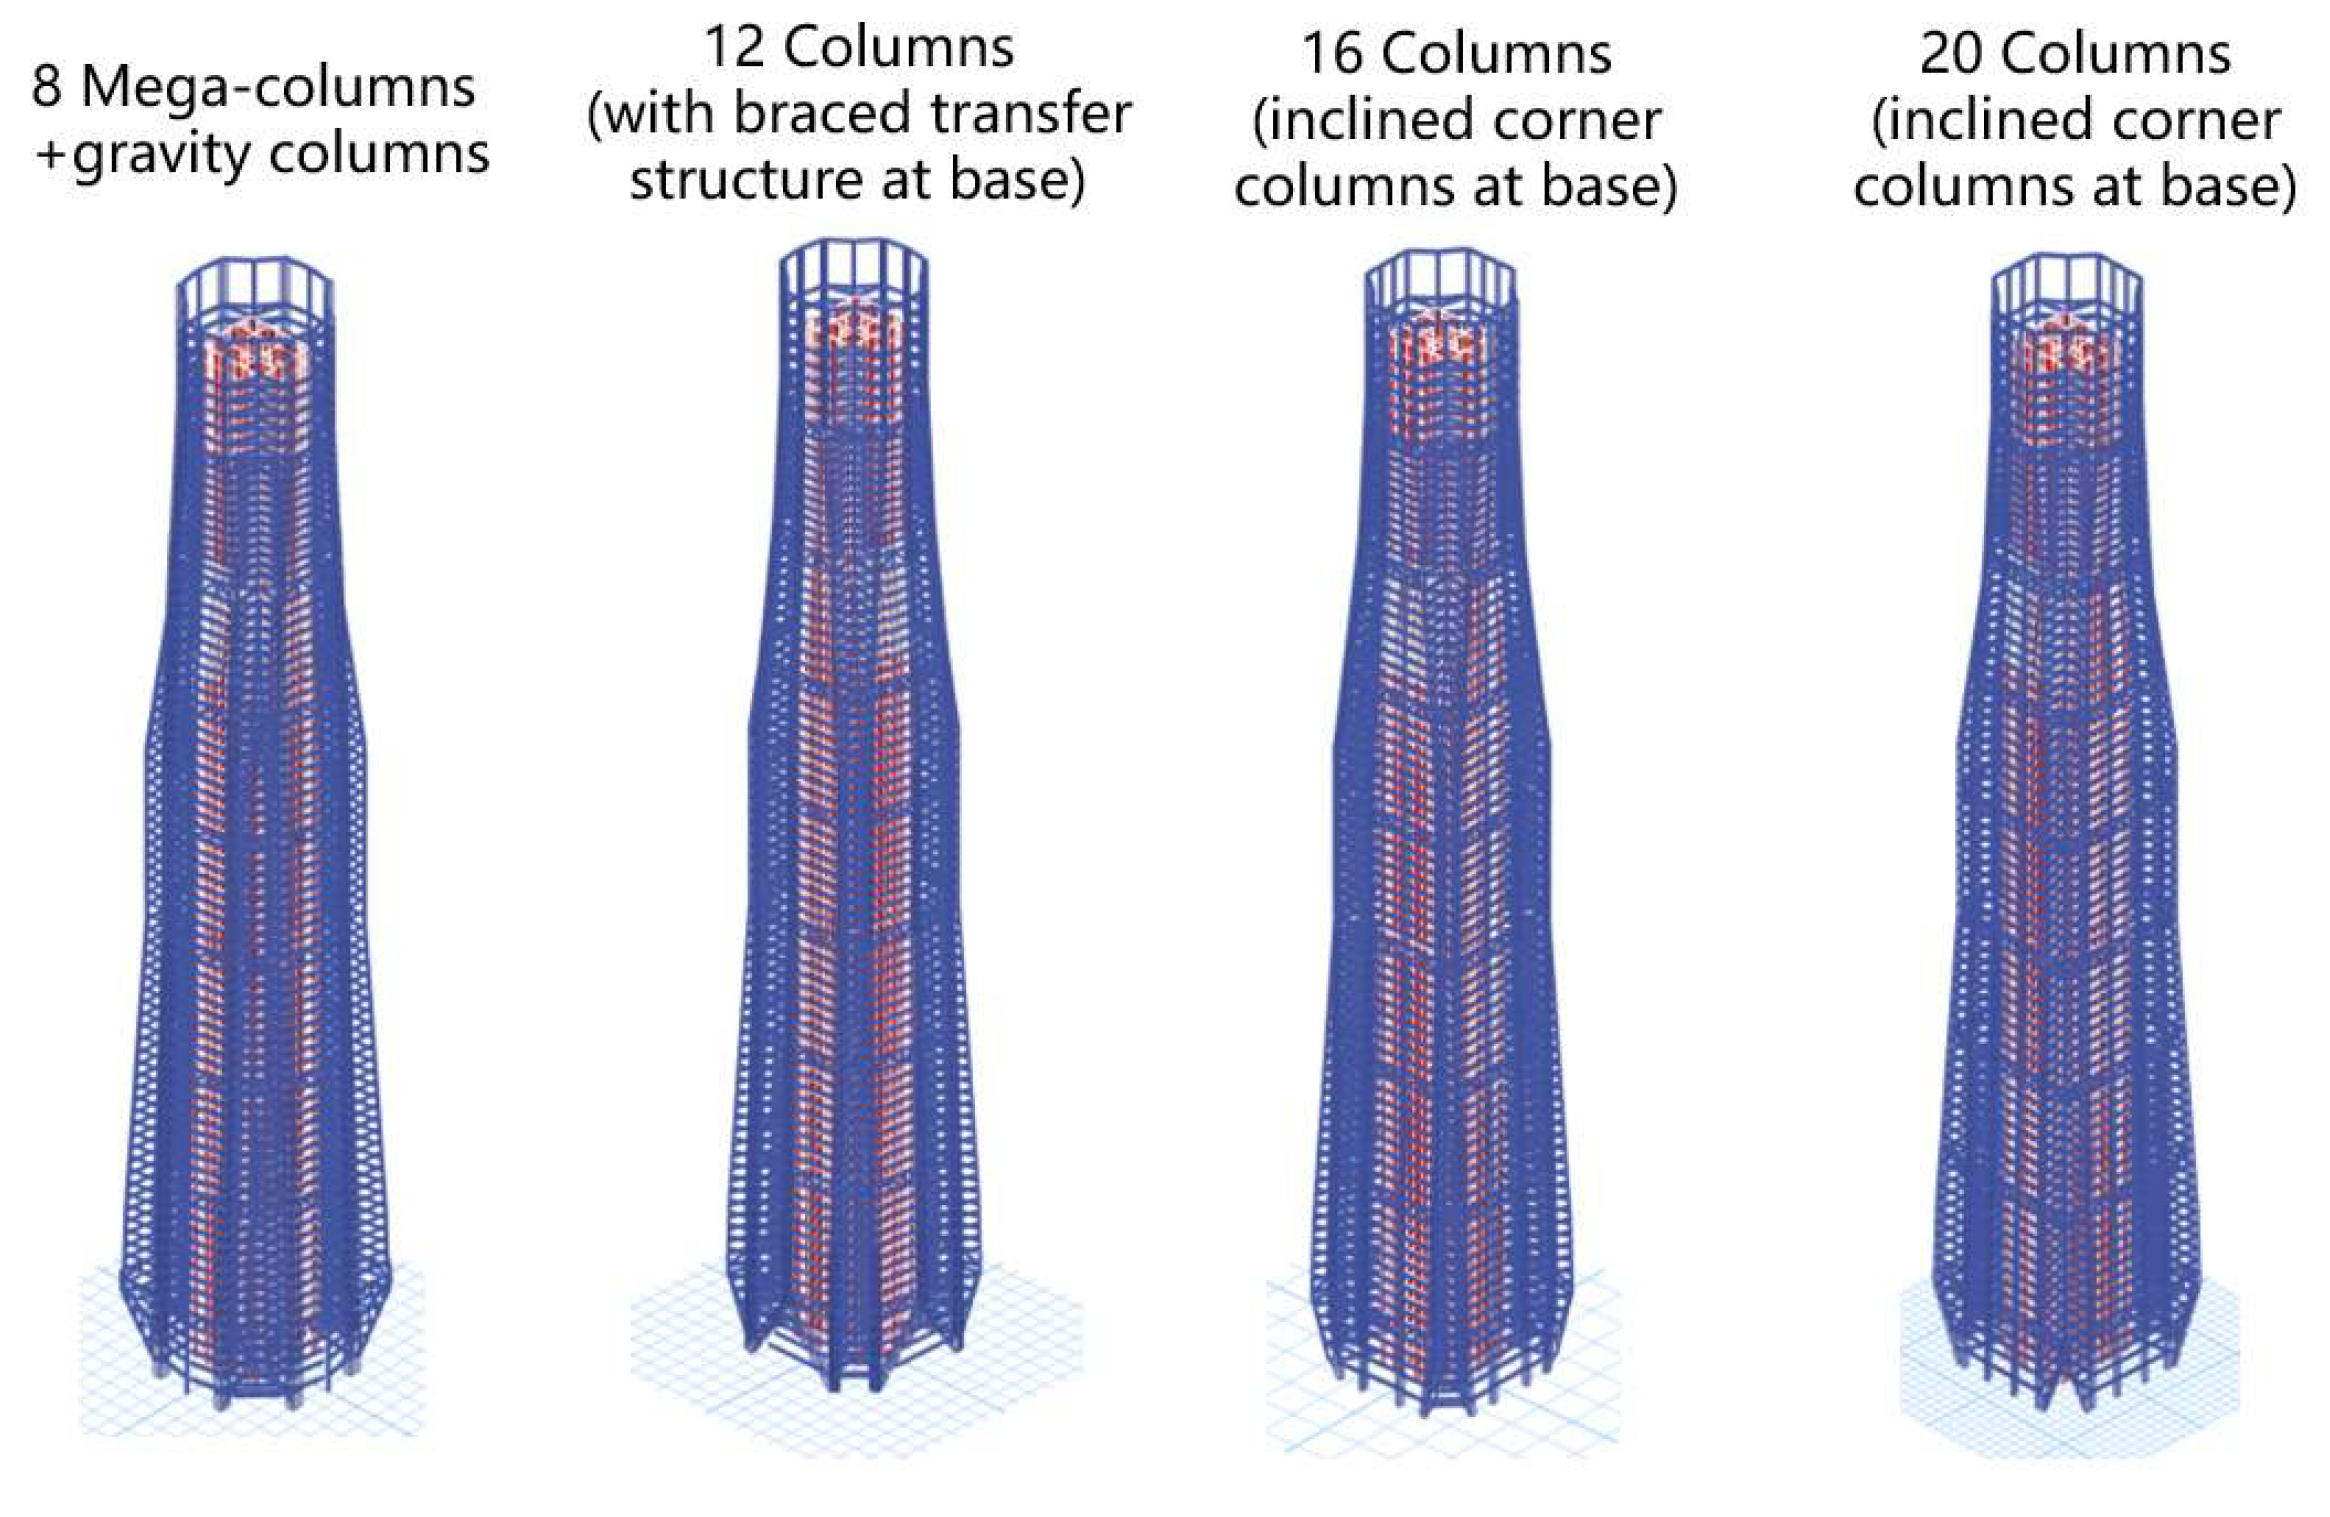
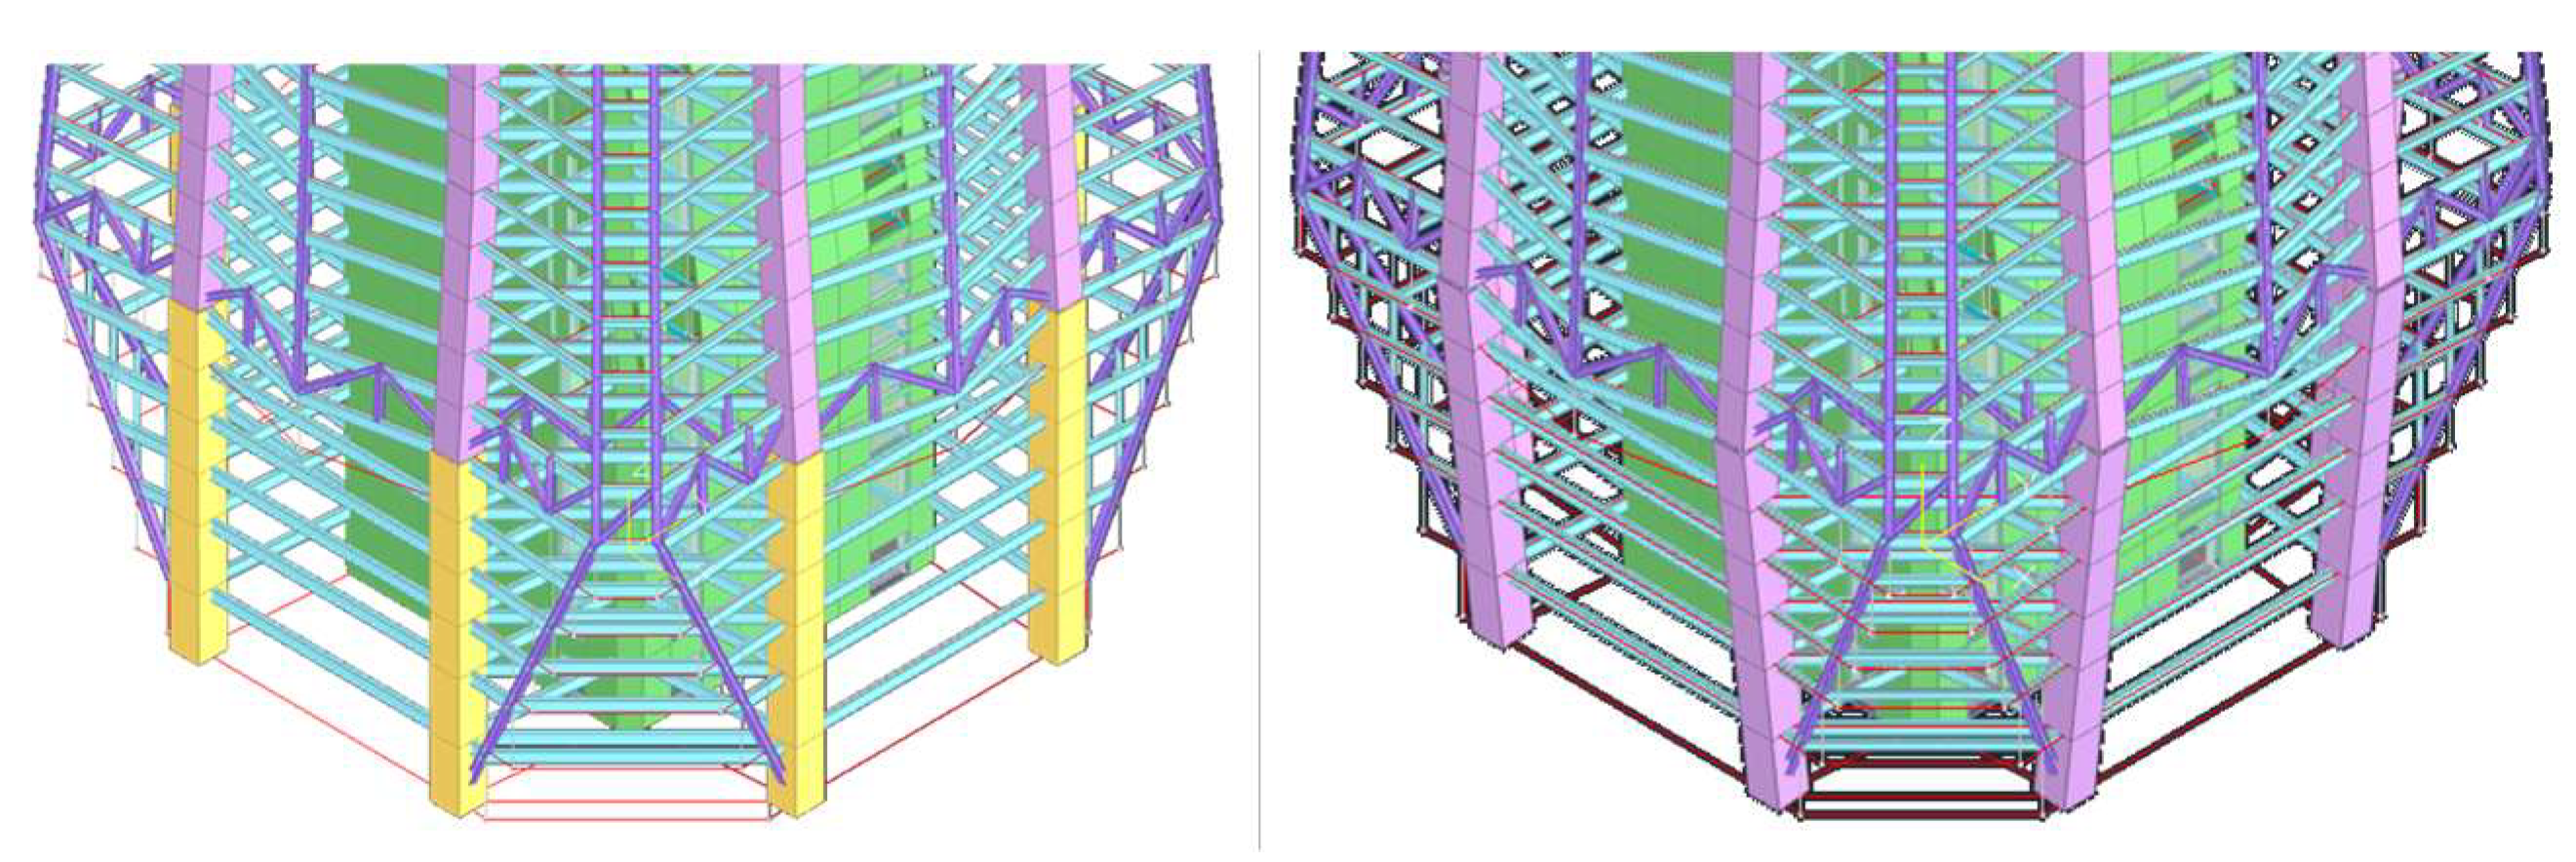
In terms of architectural effect, the influence of column spacing and column cross-section on the office view needs to be considered. In addition, to meet the spatial requirements at the entrance of the first floor lobby and the form of corner chamfering at the bottom floor, the 12-column scheme requires structural transfer of the middle columns at the bottom, while the 16-column and 20-column schemes need to adopt inclined columns or adopt structural transfer at the corners, respectively, as shown in Figure 8 and Figure 9.
In terms of structural rationality, on the basis of ensuring reliable force transmission of the structure, the principles for modifying and determining the cross-sectional dimensions of the exterior frame columns are as follows: control the first-order natural vibration period of the structure not to exceed 8.0 s to avoid insufficient structural stiffness; ensure that the displacement angle meets the requirement of 1/500 [28]; the steel content of the exterior frame column section is controlled at 4.8%. And when other indicators are met, it should be ensured that the axial compression ratio of the columns in each scheme is as close as possible to the limit value.

3.2.2. Results

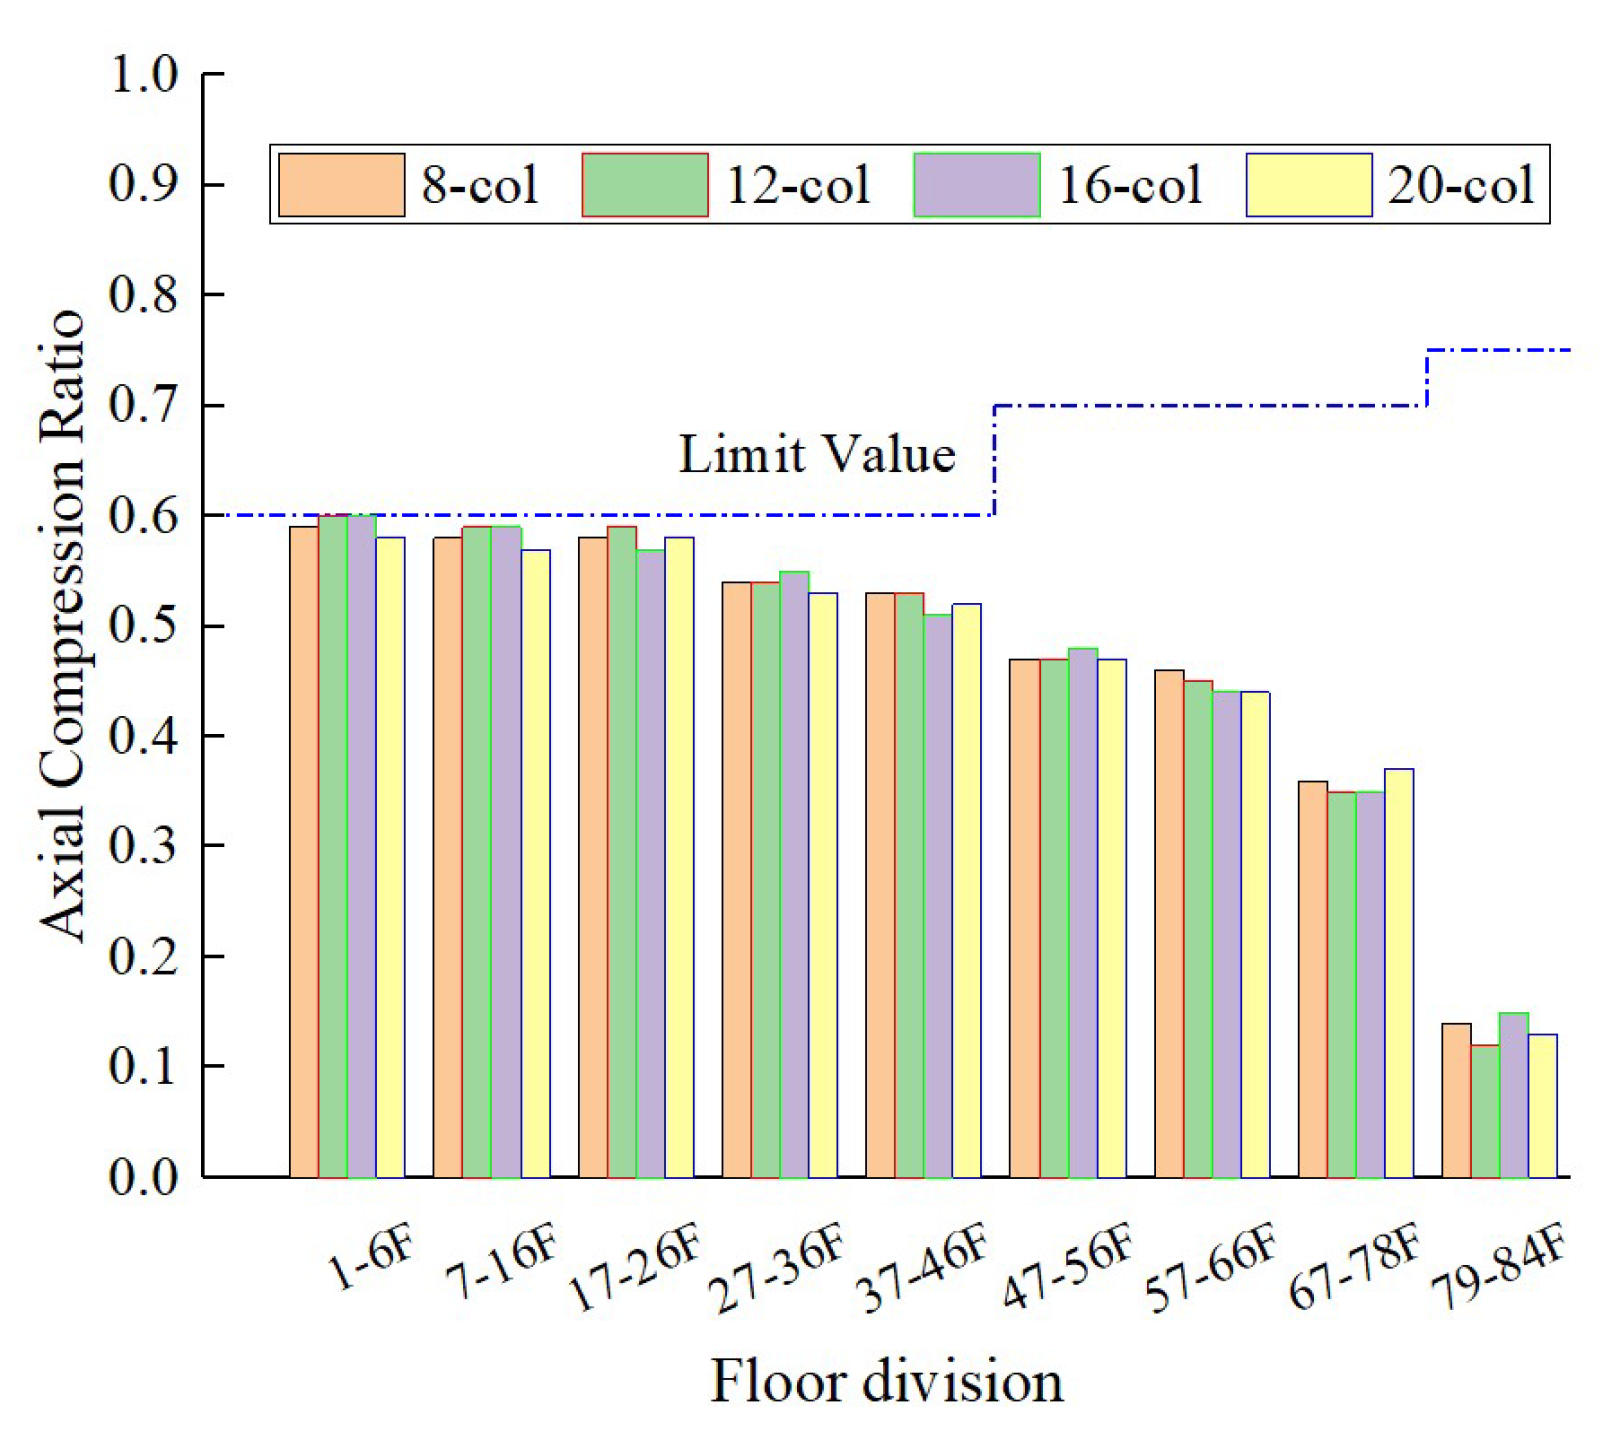
The axial compression ratios of the exterior frame columns for each scheme are shown in Figure 10. The axial compression ratios of the columns in different height zones across the four schemes are basically controlled at the similar level. Notably, the axial compression ratios of the columns in the middle and low zones are utilized relatively fully, with ratios below the 26th floor approaching the limit value of 0.6, and those below the 46th floor remaining above 0.5. In contrast, the axial compression ratios of the columns in the higher floors are relatively lower, primarily to ensure that the column sections do not decrease too rapidly with height, which could lead to non-compliance with other structural indicators such as period, displacement angle, and stiffness ratio.
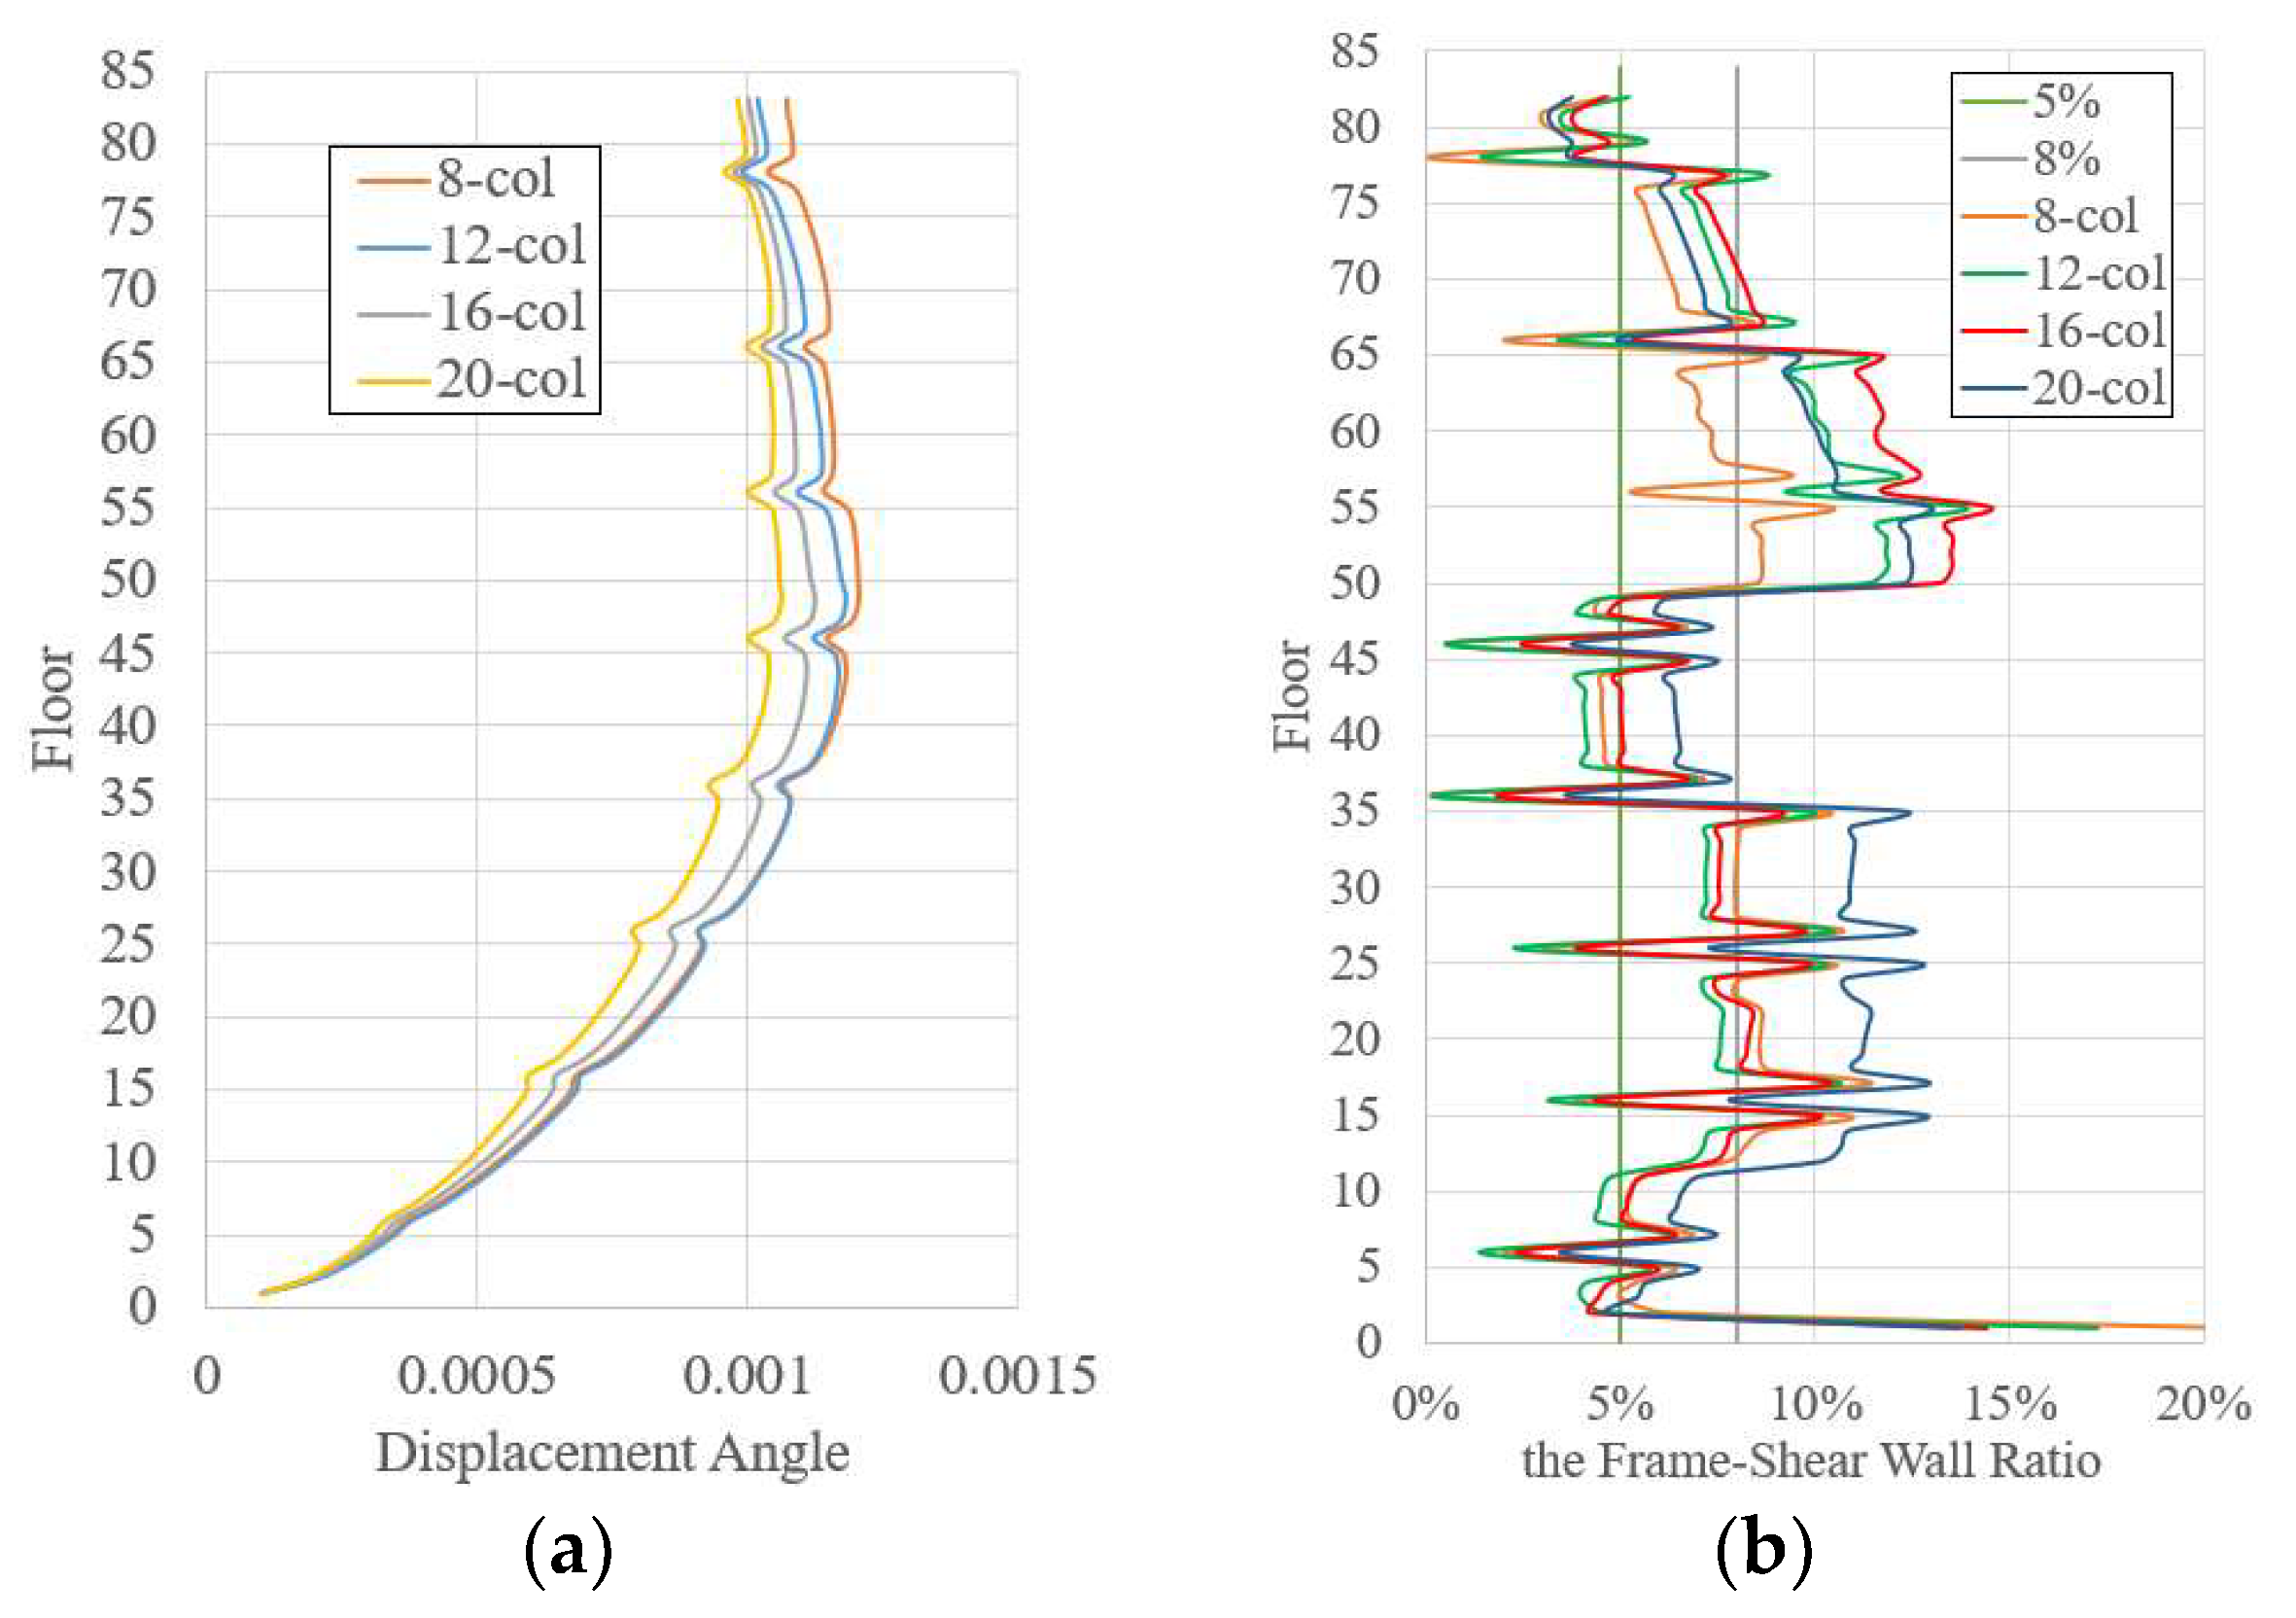
The overall indicators of each scheme are shown in Table 2, and the seismic displacement angles and frame-shear ratios [28] of each scheme are shown in Figure 11. The first-order period of the four schemes ranges from 6.71 s to 7.23 s, with the first two modes corresponding to translational periods and the third mode representing a torsional period. The period ratios are approximately 0.61, which comply with the limit requirement of no more than 0.85, indicating that the structural torsional stiffness is relatively strong. The maximum displacement angles under earthquake and wind loads all satisfy the limit requirement of 1/500, and there is a considerable margin. Furthermore, the seismic displacement angles for each scheme are greater than those under wind load, highlighting that an earthquake is the primary factor affecting horizontal displacement.
(1)
Comparison of structural lateral stiffness
The translational period and displacement angle of a structure can reflect the magnitude of its overall lateral stiffness. Based on the variation in the first-order period in each scheme and the change in the displacement angle curve in Figure 11a, it can be concluded that the overall lateral stiffness of the structure increases gradually as the number of columns increases. By analyzing the reasons, increasing the number of columns can enhance the integrity of the outer frame, thereby increasing the lateral stiffness.
(2)
Comparison of seismic forces
As the number of columns increases, the structural base seismic shear force first decreases and then increases, and the shear-weight ratio follows the same trend, consistent with the variation trend of the base shear force. Among the schemes, the 20-column scheme has the largest base seismic shear force, followed by the 16-column and 8-column schemes, while the 12-column scheme has the smallest base seismic shear force. Overall, the seismic shear forces of the four schemes are quite close, with the difference not exceeding 2.2%.
(3)
Distribution of internal and external shear forces
For super-high-rise structures, there should be a proper ratio between the lateral stiffness of the core tube and that of the exterior frame, in order to meet the requirements of dual seismic fortification [28]. Among the four schemes, the 20-column scheme has the largest proportion of floors where the frame–shear ratio exceeds 0.08, accounting for 54%, which meets the requirements. The proportion of such floors in the remaining schemes is less than 50%, with the 12-column scheme having the smallest proportion at 34%. According to the relevant literature [45], for structures where the structural stiffness decreases with height, appropriate relaxation can be applied. Additionally, to ensure that the exterior frame has sufficient shear resistance capacity under earthquakes, calculations are conducted separately for the exterior frame by assuming it bears 25% of the shear force at the bottom floor [46,47,48], and for the exterior frame columns using the adjustment coefficient method [49,50] to verify the shear resistance capacity of the exterior frame columns, ensuring that the shear resistance capacity of the exterior frame columns meets the requirements. Thus, the frame–shear ratio requirement can be relaxed to such that the frame–shear ratio of most floors is not less than 0.05. Under this adjusted requirement, all four schemes meet the criteria, though the 12-column scheme still has the smallest proportion of compliant floors, standing at 76%.
(4)
Comparison of steel consumption
As the number of exterior frame columns increases, the steel consumption of the exterior frame columns first increases and then decreases. The 8-column scheme shows the lowest steel consumption for columns, while the 12-column scheme has the highest consumption. However, the total steel consumption of the structure gradually decreases as the number of exterior frame columns increases. The total steel consumption for the 12-column and 16-column schemes is 3% lower than that of the 8-column scheme, with a maximum reduction of about 700 tons. The 20-column scheme exhibits a larger reduction of 7.4%, equating to approximately 1900 tons.
A comprehensive analysis of the four schemes is presented in Table 3, focusing on four aspects: structural rationality, architectural effect, construction difficulty, and material cost.
In terms of structural efficiency, the 12-column scheme and the 20-column scheme have lower force transmission efficiency for vertical members due to the need for a transfer structure on the first floor, while the 8-column and 16-column schemes allow all columns to be directly grounded, enabling more direct and reliable force transmission. Regarding architectural effects, the 8-column scheme, which has the fewest columns, achieves the best performance in terms of the first-floor lobby space, corner view, and office view. Although the 12-column scheme incorporates transfer structures, it still has a significant impact on the first-floor lobby. The 16-column scheme, due to its smaller column spacing, has a certain impact on the views of the first floor and offices. The 20-column scheme, with the smallest column spacing, has the worst architectural effect. In terms of construction difficulty, the differences among the four schemes are not significant, and all have good construction feasibility. For material cost, the 20-column scheme has the lowest material cost, while the cost difference among the other three schemes is within 3%, making their costs relatively close.
Considering multiple factors, although the 8-column scheme has a slightly higher material cost than the others, it offers the best architectural effect, a reasonable structural system, and feasible construction. Therefore, the 8-column scheme is finally selected for this project.

3.3. Sensitivity Analysis of the Number of the Belt Truss

Based on the 8-mega-column and gravity column scheme, a sensitivity analysis is conducted on the number and position of the belt trusses in the structure. Belt trusses are usually arranged on the refuge floors and equipment floors of the building. They not only play a role in enhancing the lateral stiffness of the structure, but also serve as the transfer structure for the gravity columns and ensure the integrity of the exterior frame.
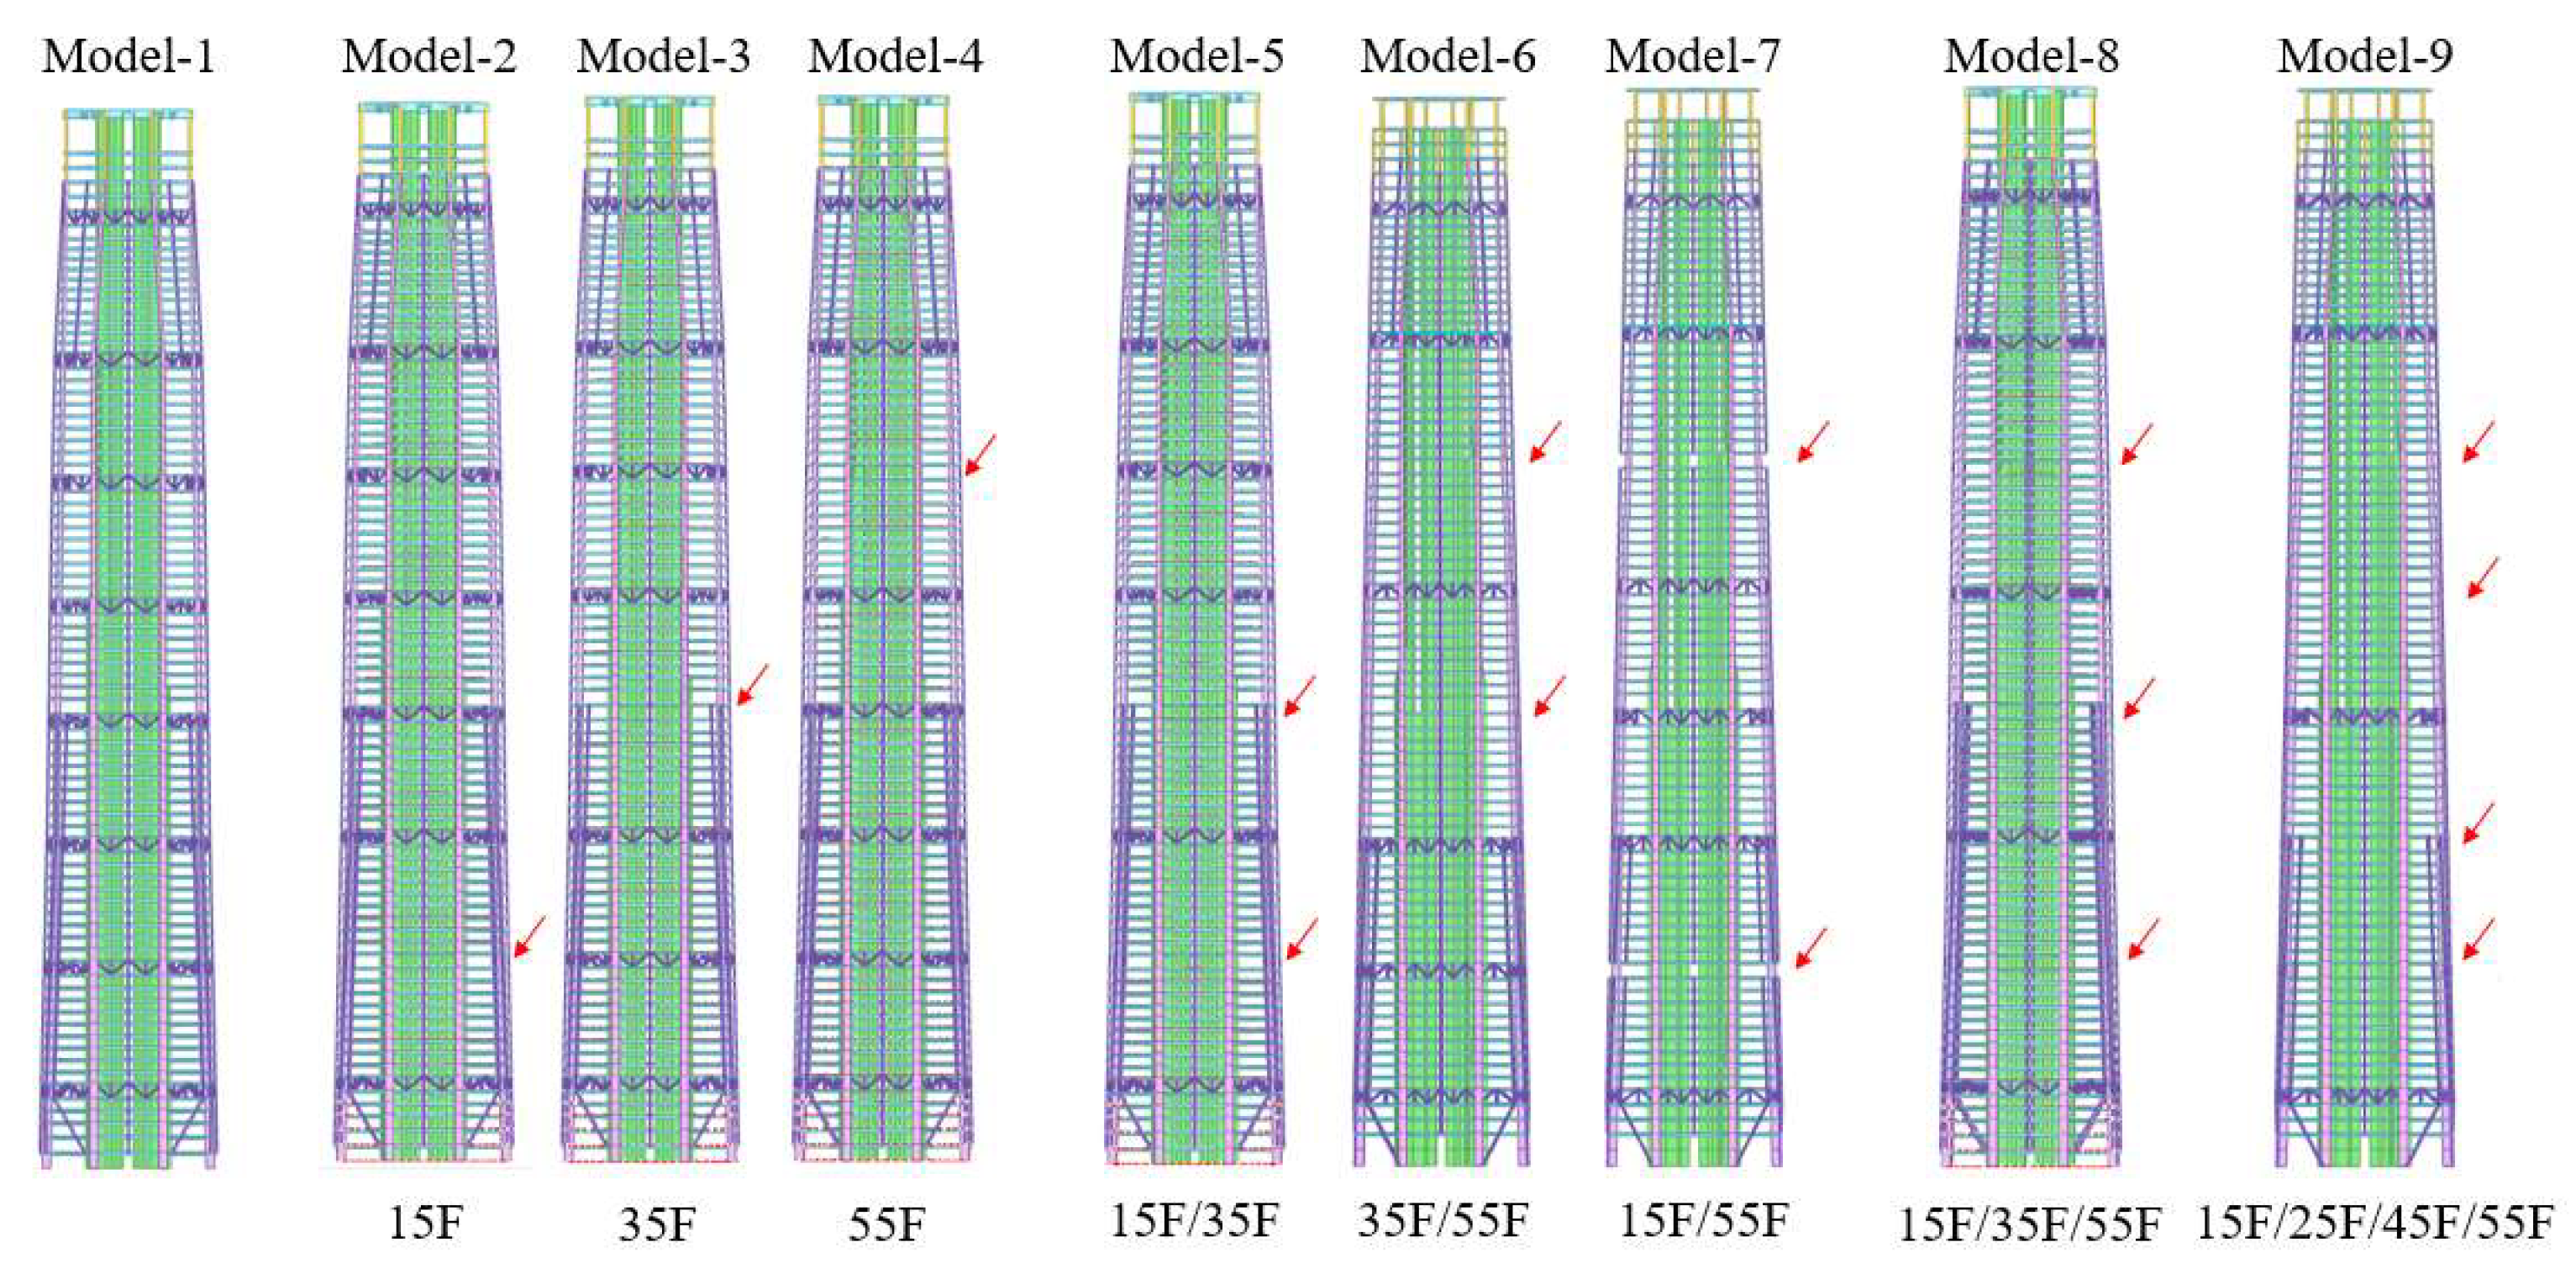
The sensitivity analysis of the belt trusses adopts the decreasing method, which starts with 8 belt trusses and gradually reduces their quantity. The comparison schemes for the sensitivity analysis of the belt trusses are shown in Figure 12. The first model is the initial 8-belt trusses model. In the other models, the arrows indicate the positions where the trusses are to be removed. The Model-2 to Model-4 have had a belt truss removed, the Model-5 to Model-7 have had two belt trusses removed, and the Model-8 and Model-9, respectively, have had three and four belt trusses removed. Moreover, it should be noted that three belt trusses cannot be removed: the first one at the 5th floor at the bottom, which is used to suspend the lower gravity columns, and the two at the top, which are, respectively, used to support the crown and serve as the transfer structure between the hotel and office areas.
In terms of control indicators and model component adjustments, while ensuring that the overall indicators of each model meet the requirements and the model displacement angles are basically consistent, the models after belt truss removal are optimized or strengthened.
The calculation results for the overall indicators of each scheme are presented in Table 4. The indicators for the period, displacement angle, and frame–shear ratio of each scheme all meet the specified requirements. Additionally, the displacement angle levels across all schemes are relatively consistent. The cross-sectional areas of the mega-columns and walls are determined by the axial compression ratio and are not significantly influenced by the number or positioning of the belt trusses; therefore, these details are not included here.
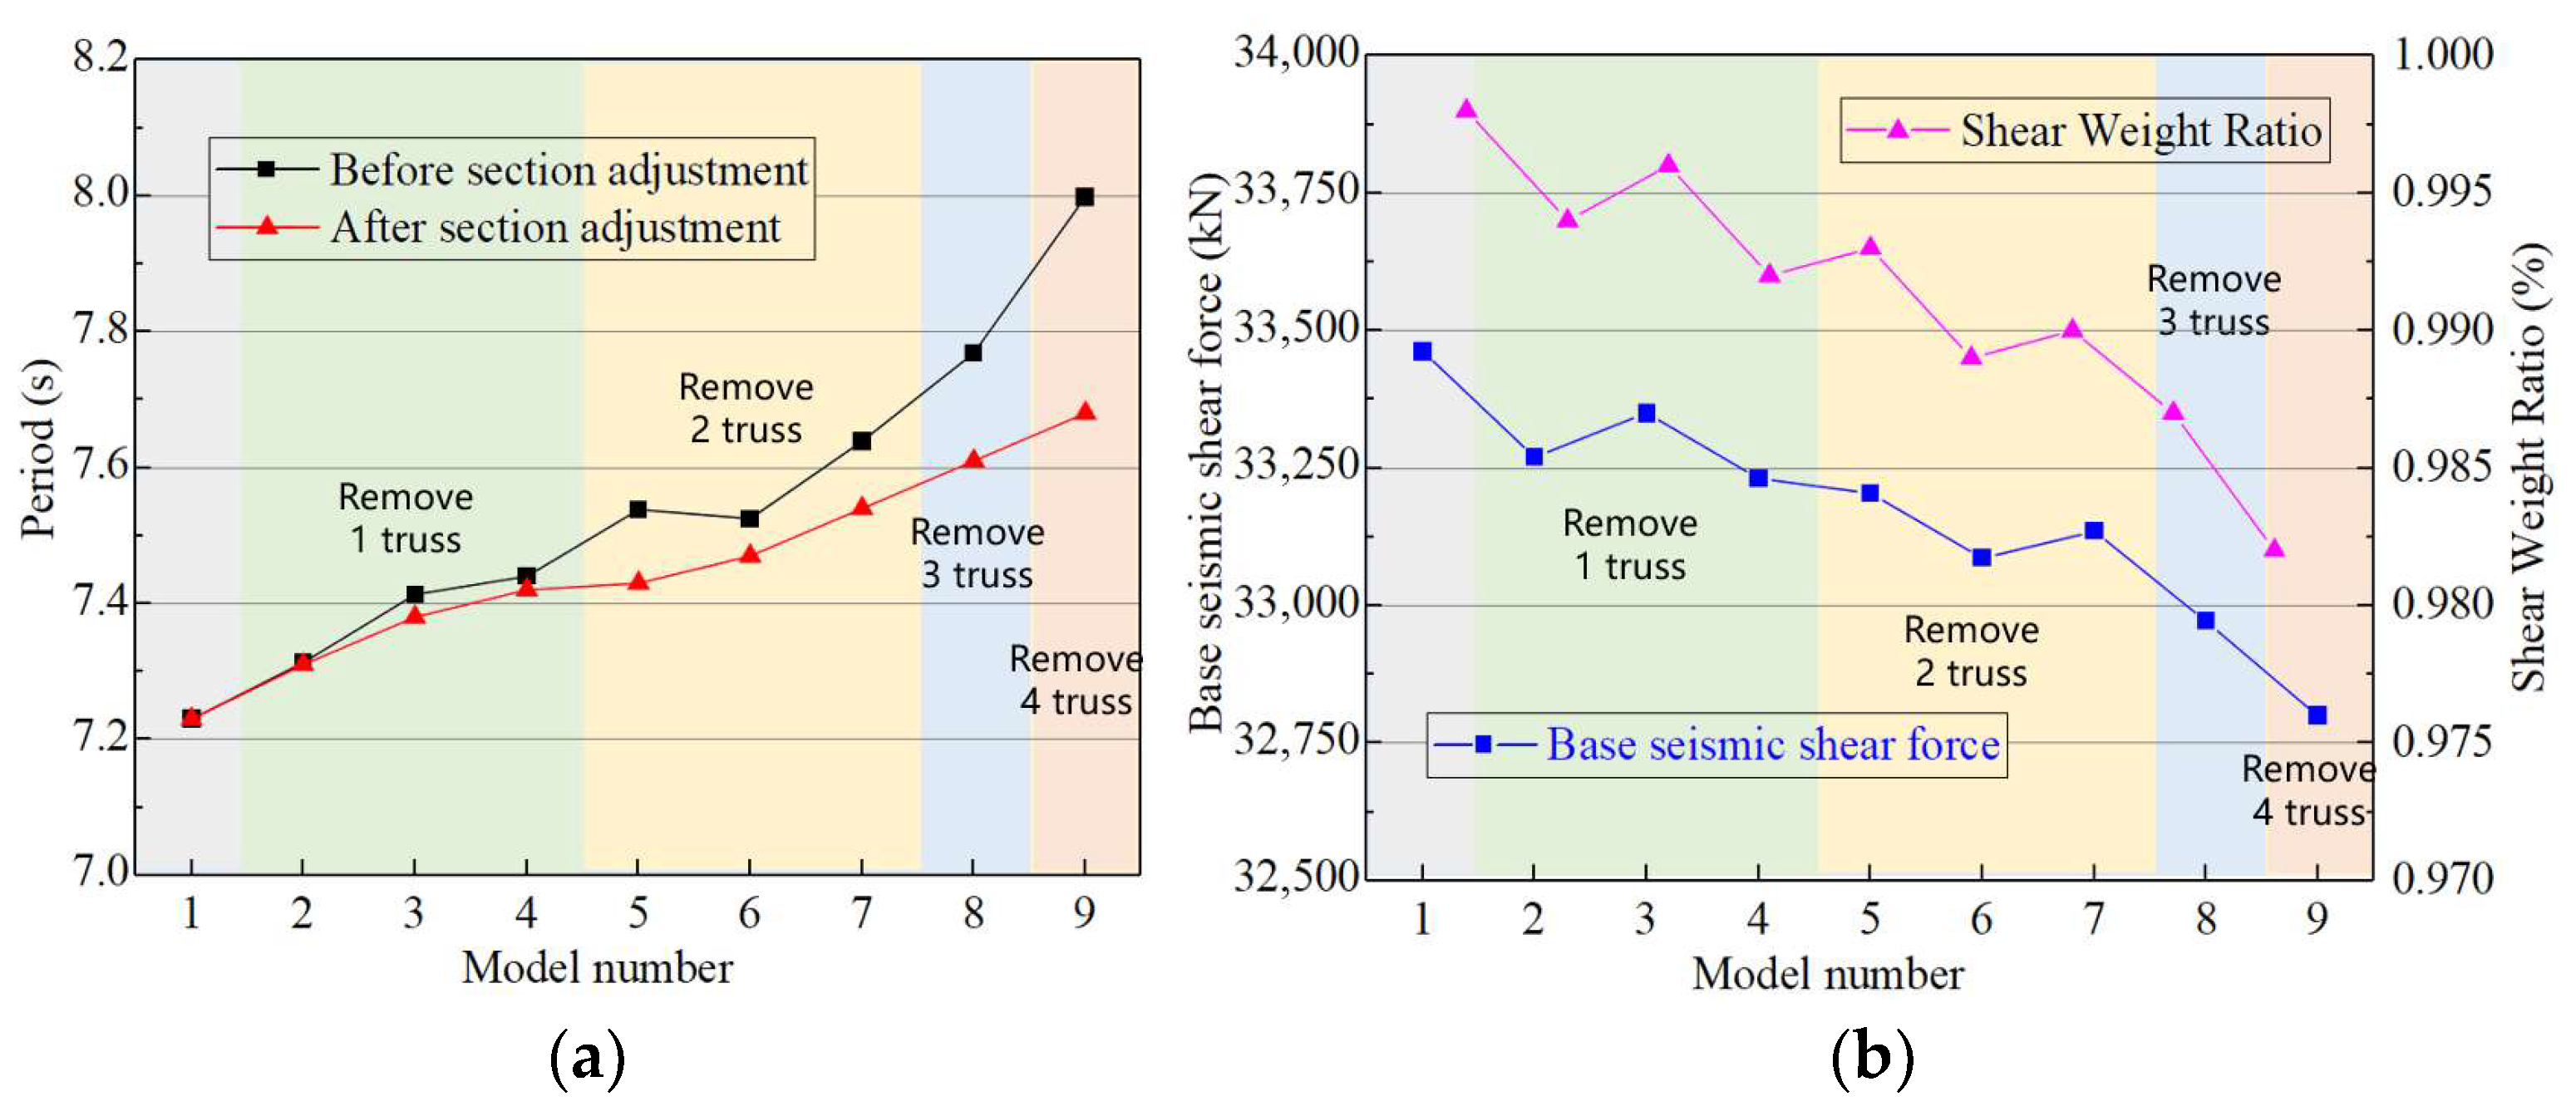
The first-order periods for each scheme are shown in Figure 13a. The term “period before adjustment” refers to the structural period observed when only the belt trusses are removed, without any optimization or strengthening of the structural members. In contrast, “period after adjustment” describes the structural period following further optimization or adjustments made after the removal of the belt trusses. From the figure, we can draw two conclusions:
  • As the number of removed belt trusses increases, the overall translational stiffness of the structure decreases, and the first-order period becomes longer. Optimizing or strengthening structural members does not change this law, indicating that the impact of adjusting the number of belt trusses on structural stiffness is greater than that of modifying member sizes.
  • The contribution of belt trusses located in the high zone to structural stiffness is generally greater than that of those situated in the low zone.
The base shear force and shear-weight ratio of each scheme are shown in Figure 13b. Both the base shear force and shear-weight ratio exhibit a similar trend: they decrease as the number of belt trusses is reduced. This indicates a reduction in seismic action, which reflects decreased structural stiff-ness and aligns with previous conclusions. There is no clear pattern regarding how changes in the positions of the belt trusses affect the base shear force.
In terms of the distribution of internal and external shear forces in the structure, according to Table 4, the proportion of floors with a frame–shear ratio greater than 5% is relatively close for each scheme. Overall, as the number of belt trusses decreases, the proportion of floors meeting the requirements increases slightly, indicating that the frame–shear ratio is not sensitive to the number and positions of the belt trusses.
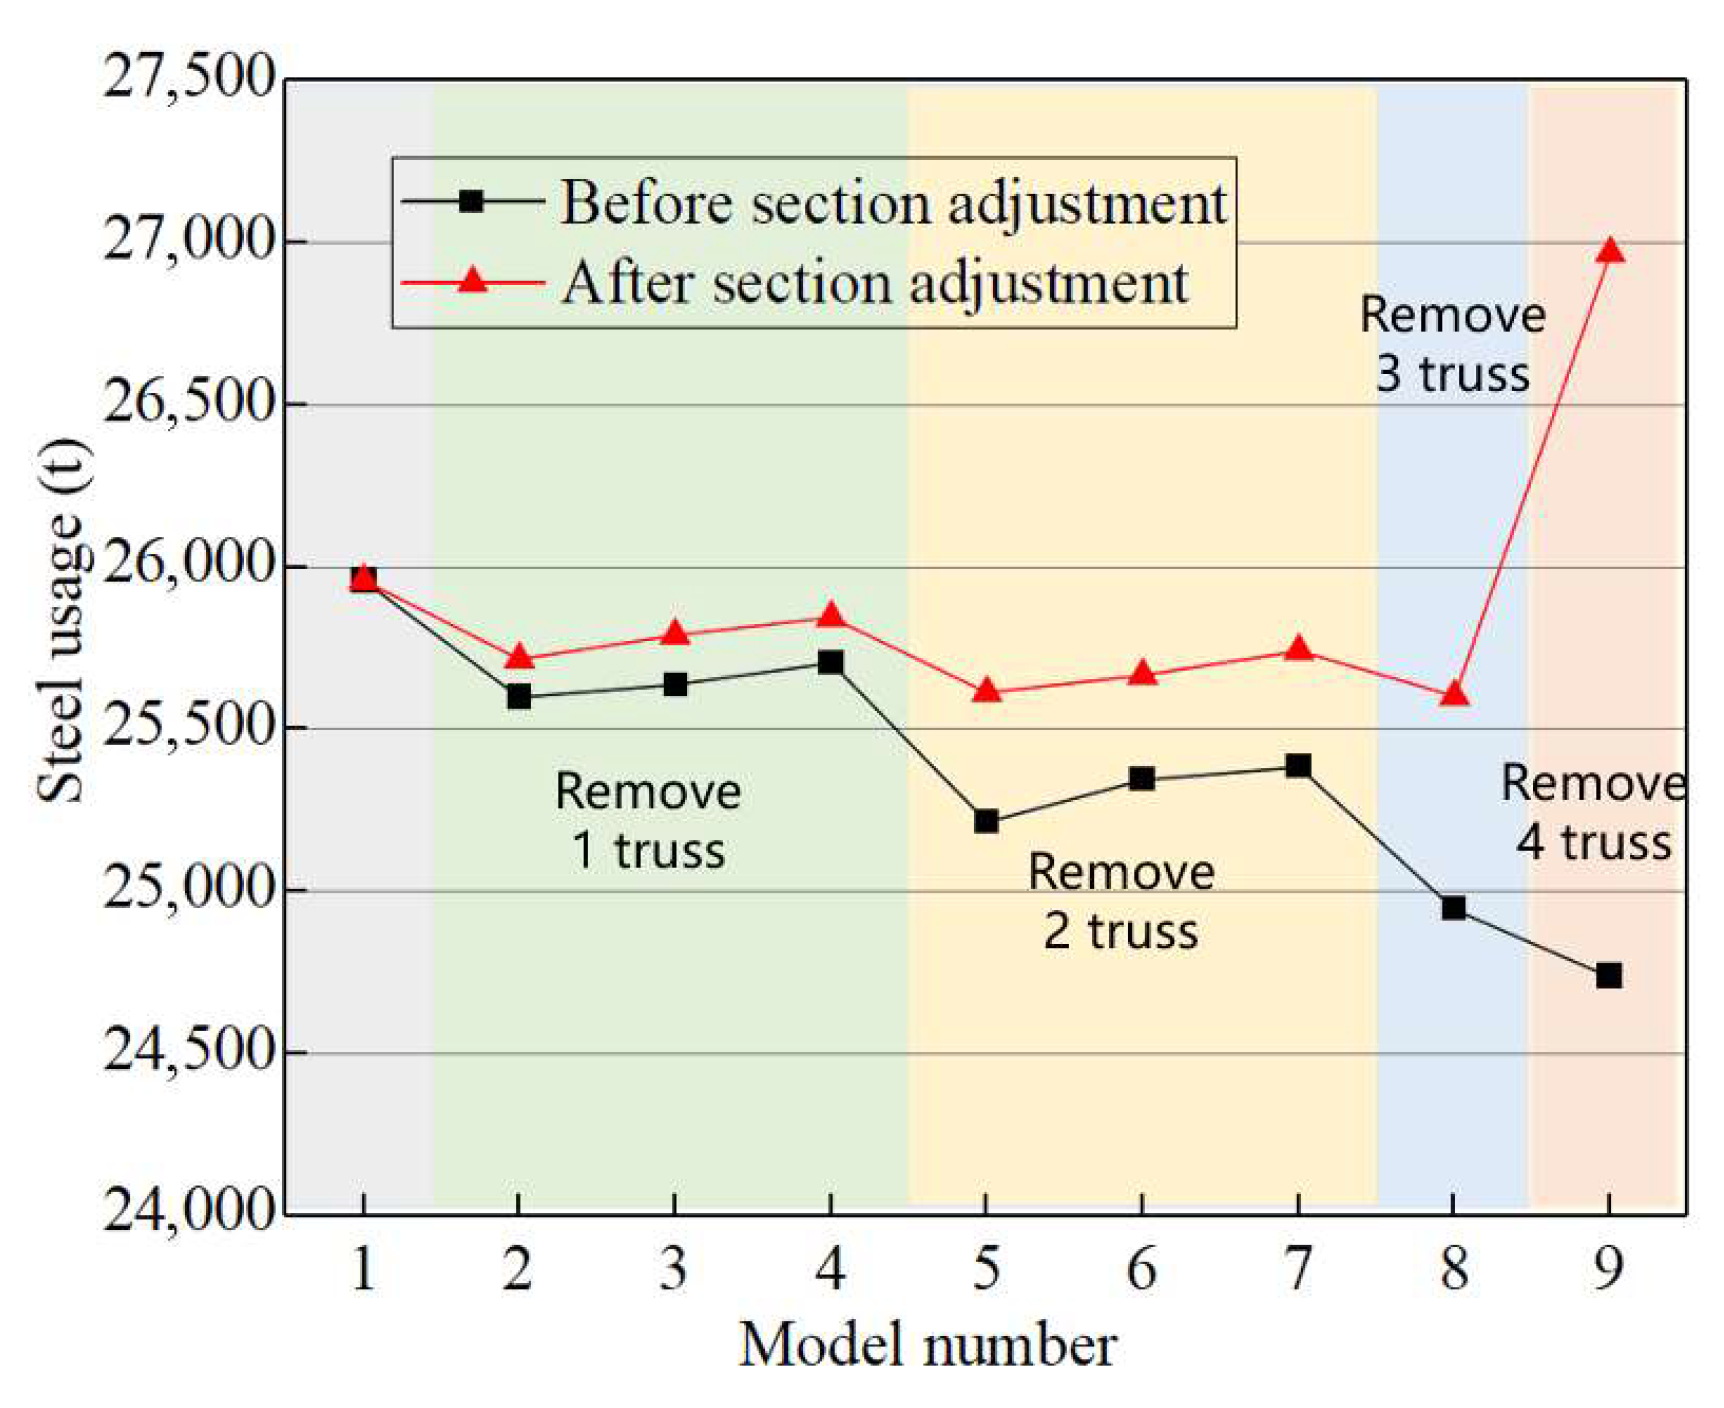
In terms of material consumption, as shown in Figure 14, as the number of belt trusses decreases, the structural members need to be strengthened. The increased steel consumption caused by such strengthening is more sensitive to the number of removed belt trusses than to the positions of the removed belt trusses.
Reducing the number of belt trusses does not lead to a continuous decrease in the total steel consumption of the structure. Instead, the total steel consumption initially decreases and then increases as the number of belt trusses decreases. When three belt trusses are removed and the spacing between the remaining belt trusses does not exceed 20 floors, the total steel consumption of the structure is the lowest. However, if four belt trusses are removed, the steel consumption significantly increases, even exceeding the level associated with having 8 belt trusses. This increase occurs because the spacing between the remaining trusses reaches 30 floors, which weakens the integrity of the exterior frame. Moreover, the cumulative effect of vertical loads leads to a significant increase in the axial force of the gravity columns. As a result, additional strengthening of the steel gravity columns and frame beams is required, leading to a rapid rise in steel consumption. Therefore, at least this conclusion can be drawn: when the number of floors between two adjacent belt trusses reaches or exceeds 30 floors, the consumption of steel becomes uneconomical.
In summary, considering the reduction in seismic action, the minimization of steel consumption, and the preservation of architectural functions, the Model-8 scheme (with five belt trusses) is the optimal solution and is ultimately chosen.

4. Research on Key Local Issues of the Structure

4.1. Study on the Bottom Inclination of Mega-Columns

In accordance with the architectural requirements, the design for the mega-columns on the bottom five floors will feature an inwardly inclined shape with an inclination angle of 6°. To assess the impact of this inclination, a comparison is made between the bottom straight columns and the bottom inclined columns, as shown in Figure 15.
After the calculation, the overall indicators of the two schemes show only a minor difference. The first-order period of the inclined column scheme is approximately 1% longer than that of the straight column scheme. However, other indicators, such as the displacement angle and the overall frame-shear ratio, remain largely unchanged. Additionally, the total mass decreases by about 0.4%.
In terms of member force, the axial compression ratios of the bottom 5 floors of the mega-columns and shear walls in both schemes remain basically unchanged, with differences within 0.01. However, there is a significant difference in the axial force of the floor beams located near the folded corner of the mega-columns, as shown in Figure 16a. This analysis focuses on the results under two load combinations: 1.3D + 1.5L and 1.0D + 0.5L + 1.0Ex (for a rare earthquake, which has a 2% to 3% probability of exceedance in 50 years) [17]. The tensile force of the floor beams in the inclined column scheme is significantly greater than that in the straight column scheme. The maximum axial force of the floor beams occurs at the 5th floor (the corner floor), and then the tensile force of the beams in floors farther from the corner floor decreases. Taking the corner floor beam as an example, under the two combinations, the maximum tensile force of the floor beams in the inclined column scheme reaches 4730 kN and 5230 kN, respectively. It is verified that the beam section will enter a yield state due to the axial force alone, so it is necessary to strengthen the beam section. In contrast, the tensile forces in the straight column scheme are 800 kN and 1180 kN, with a reduction in axial force of 83% and 77%, respectively. The force transmission before and after the overall inward inclination of the mega-columns at the bottom is shown in Figure 16b.
Based on the analysis, from the perspective of force-bearing, the inclined column scheme will lead to an increase in the axial force of the beams and an increase in their cross-sections. Moreover, from the perspective of seismic resistance, the inclined column scheme is less favorable. Therefore, the seismic grade of the inclined columns and their surrounding members should be increased by one level. At the same time, the floor slabs in this area require structural reinforcement, including increasing the slab thickness, additional full-length steel reinforcement bars, and enhancing the connection between the floor slab and the core tube. From the perspective of node design and construction, the axial force level of the floor beams in the inclined column scheme is very high, complicating the design of connections between the floor beams and the core tube, which will also necessitate specialized node design and finite element analysis. All these factors will contribute to higher construction costs and increased difficulty in execution, leading us to abandon the idea of using inward-inclined columns in favor of a straight column scheme.

4.2. Mechanical Behavior of the Folded Belt Trusses and Floor Strengthening

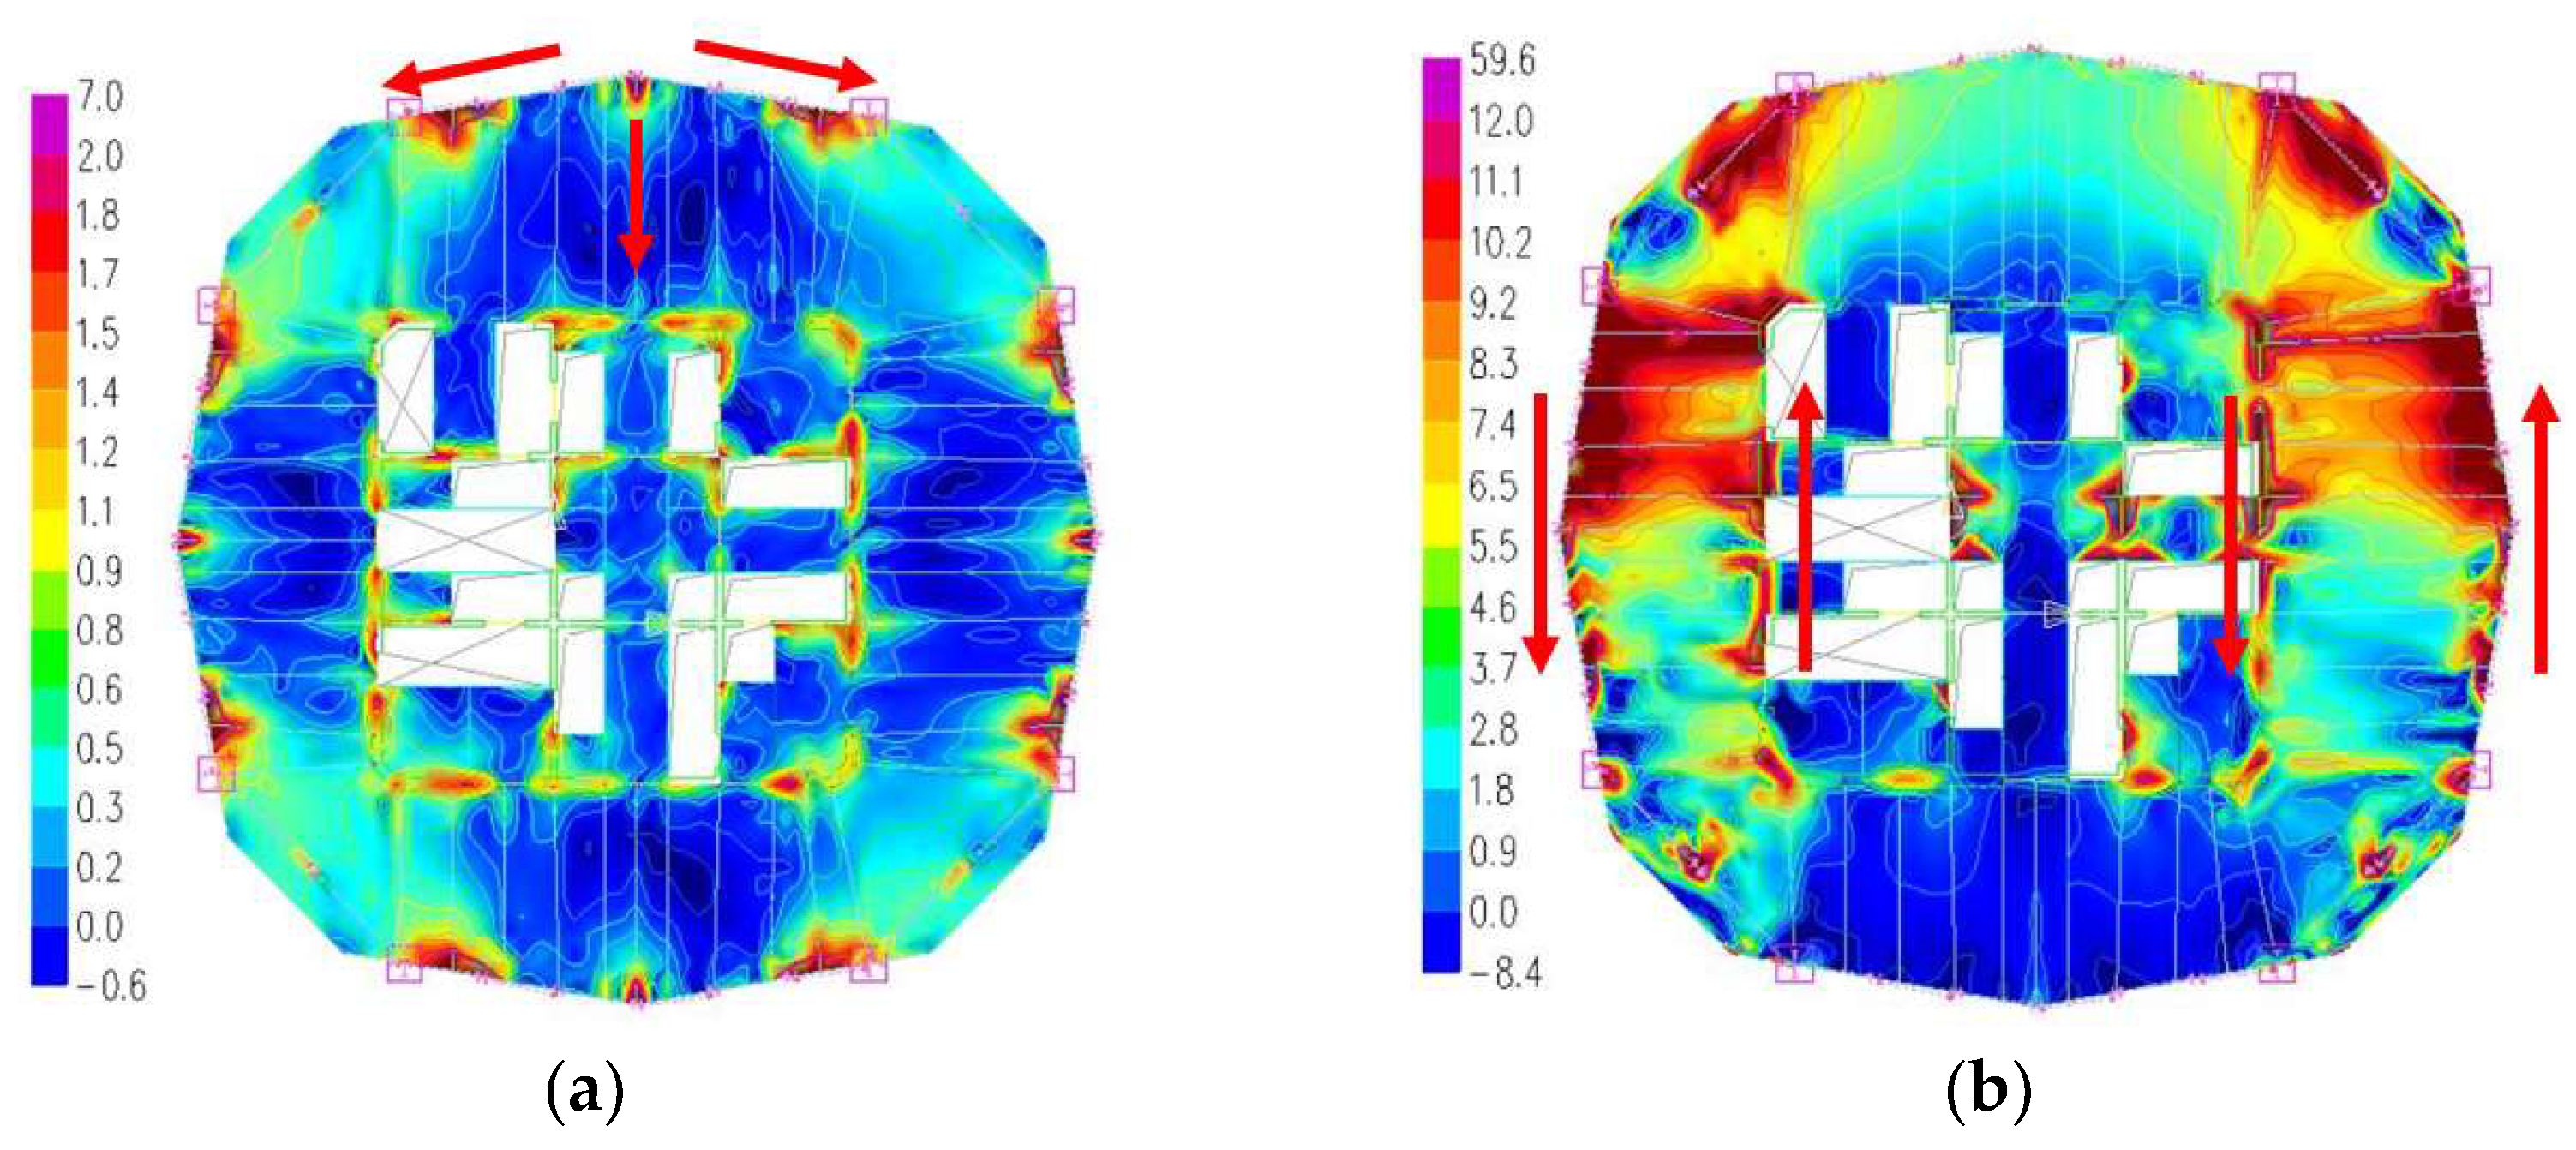
Due to the building’s shape requirements, there is a 10° to 16° fold angle in the exterior frame beam between the two mega-columns on each floor. Correspondingly, the belt truss at this location has an angle as well, as shown in Figure 17. As the transfer structure of the upper gravity columns, this angle will cause the belt truss to twist under vertical loads, thereby resulting in horizontal forces on both the upper and lower chords of the belt truss. As shown in Figure 18a, under the action of dead and live loads, the concrete near the upper chord of the belt truss experiences significant tension, with the maximum principal stress reaching 7.0 MPa, exceeding the specified tensile strength of the floor concrete (ftk = 2.2 MPa) [43]. Moreover, under the seismic action, the enhanced stiffness by the belt truss leads to increased horizontal forces on the floor; however, the angle reduces the integrity of the floor in the belt truss layer, resulting in large shear stress between the core tube and the exterior frame during a rare earthquake (which has a 2% to 3% probability of exceedance in 50 years) [17], as shown in Figure 18b. The red arrows in Figure 18a,b indicate the directions of the tensile and shear forces acting on the floor. In conclusion, the floors at the location of the belt trusses require strengthening.
Two strengthening schemes are attempted for this project, as shown in Figure 19. Taking the belt truss on the 45th floor as an example, the thickness of the floor slab at this location is 180 mm, and the cross-section of the horizontal brace is 250 mm × 16 mm (square steel tube).
As shown in Table 5, under the two horizontal brace schemes, the floor slab stress, horizontal deformation caused by torsion of the belt truss, the axial force of the floor beam, and the weak-axis bending moment of the belt truss chord have all been reduced. Among them, Scheme 1 demonstrates a slightly better reduction effect compared to Scheme 2. However, both schemes have little effect on reducing the stress ratio of the floor beam and the belt truss chord, and cannot prevent the floor from cracking.
In terms of the axial force of the horizontal braces, under dead load, the axial force of the horizontal braces in both schemes is small, and the effect is limited. However, under a rare earthquake, the axial force of the horizontal braces increases significantly, and the effect is remarkable (the cross-section meets the requirement of no yielding under a rare earthquake), which better improves the integrity of the floor between the core tube and the belt truss, and Scheme 2 performs significantly better than Scheme 1. Analyzing the reasons, under the vertical load, the torsional deformation of the belt truss without horizontal supports is relatively small, only 5.2 mm. Therefore, the setting of horizontal supports provides relatively little assistance in constraining the deformation, and the corresponding axial force is also relatively small. Under the horizontal seismic action, the deformation and internal force transfer are mainly within the plane. Therefore, the horizontal supports can play a significant role in constraining the in-plane deformation, resulting in a significant increase in their axial force. In Scheme 2, the horizontal supports directly connect the belt truss and the core tube, directly coordinating the interior and exterior deformations, and the force transmission is more direct than in Scheme 1, making the floor structure more integral. Therefore, the axial force is greater under the seismic action.
In terms of the increase in steel consumption, the total for the 5 belt truss layers is about 530 tons for Scheme 1 and about 360 tons for Scheme 2. Therefore, Scheme 2 is more economical, saving 170 tons of steel.
In conclusion, the horizontal braces have no significant impact on the section size of the existing structural members. However, from the perspective of seismic concept, it can improve the structural integrity of the belt truss layer after the floor slabs stop working, and Scheme 2 has better effects and lower costs. Therefore, Scheme 2 is adopted.

4.3. Mechanical Behavior of the Folded Secondary Frame After the Failure of a Gravity Column

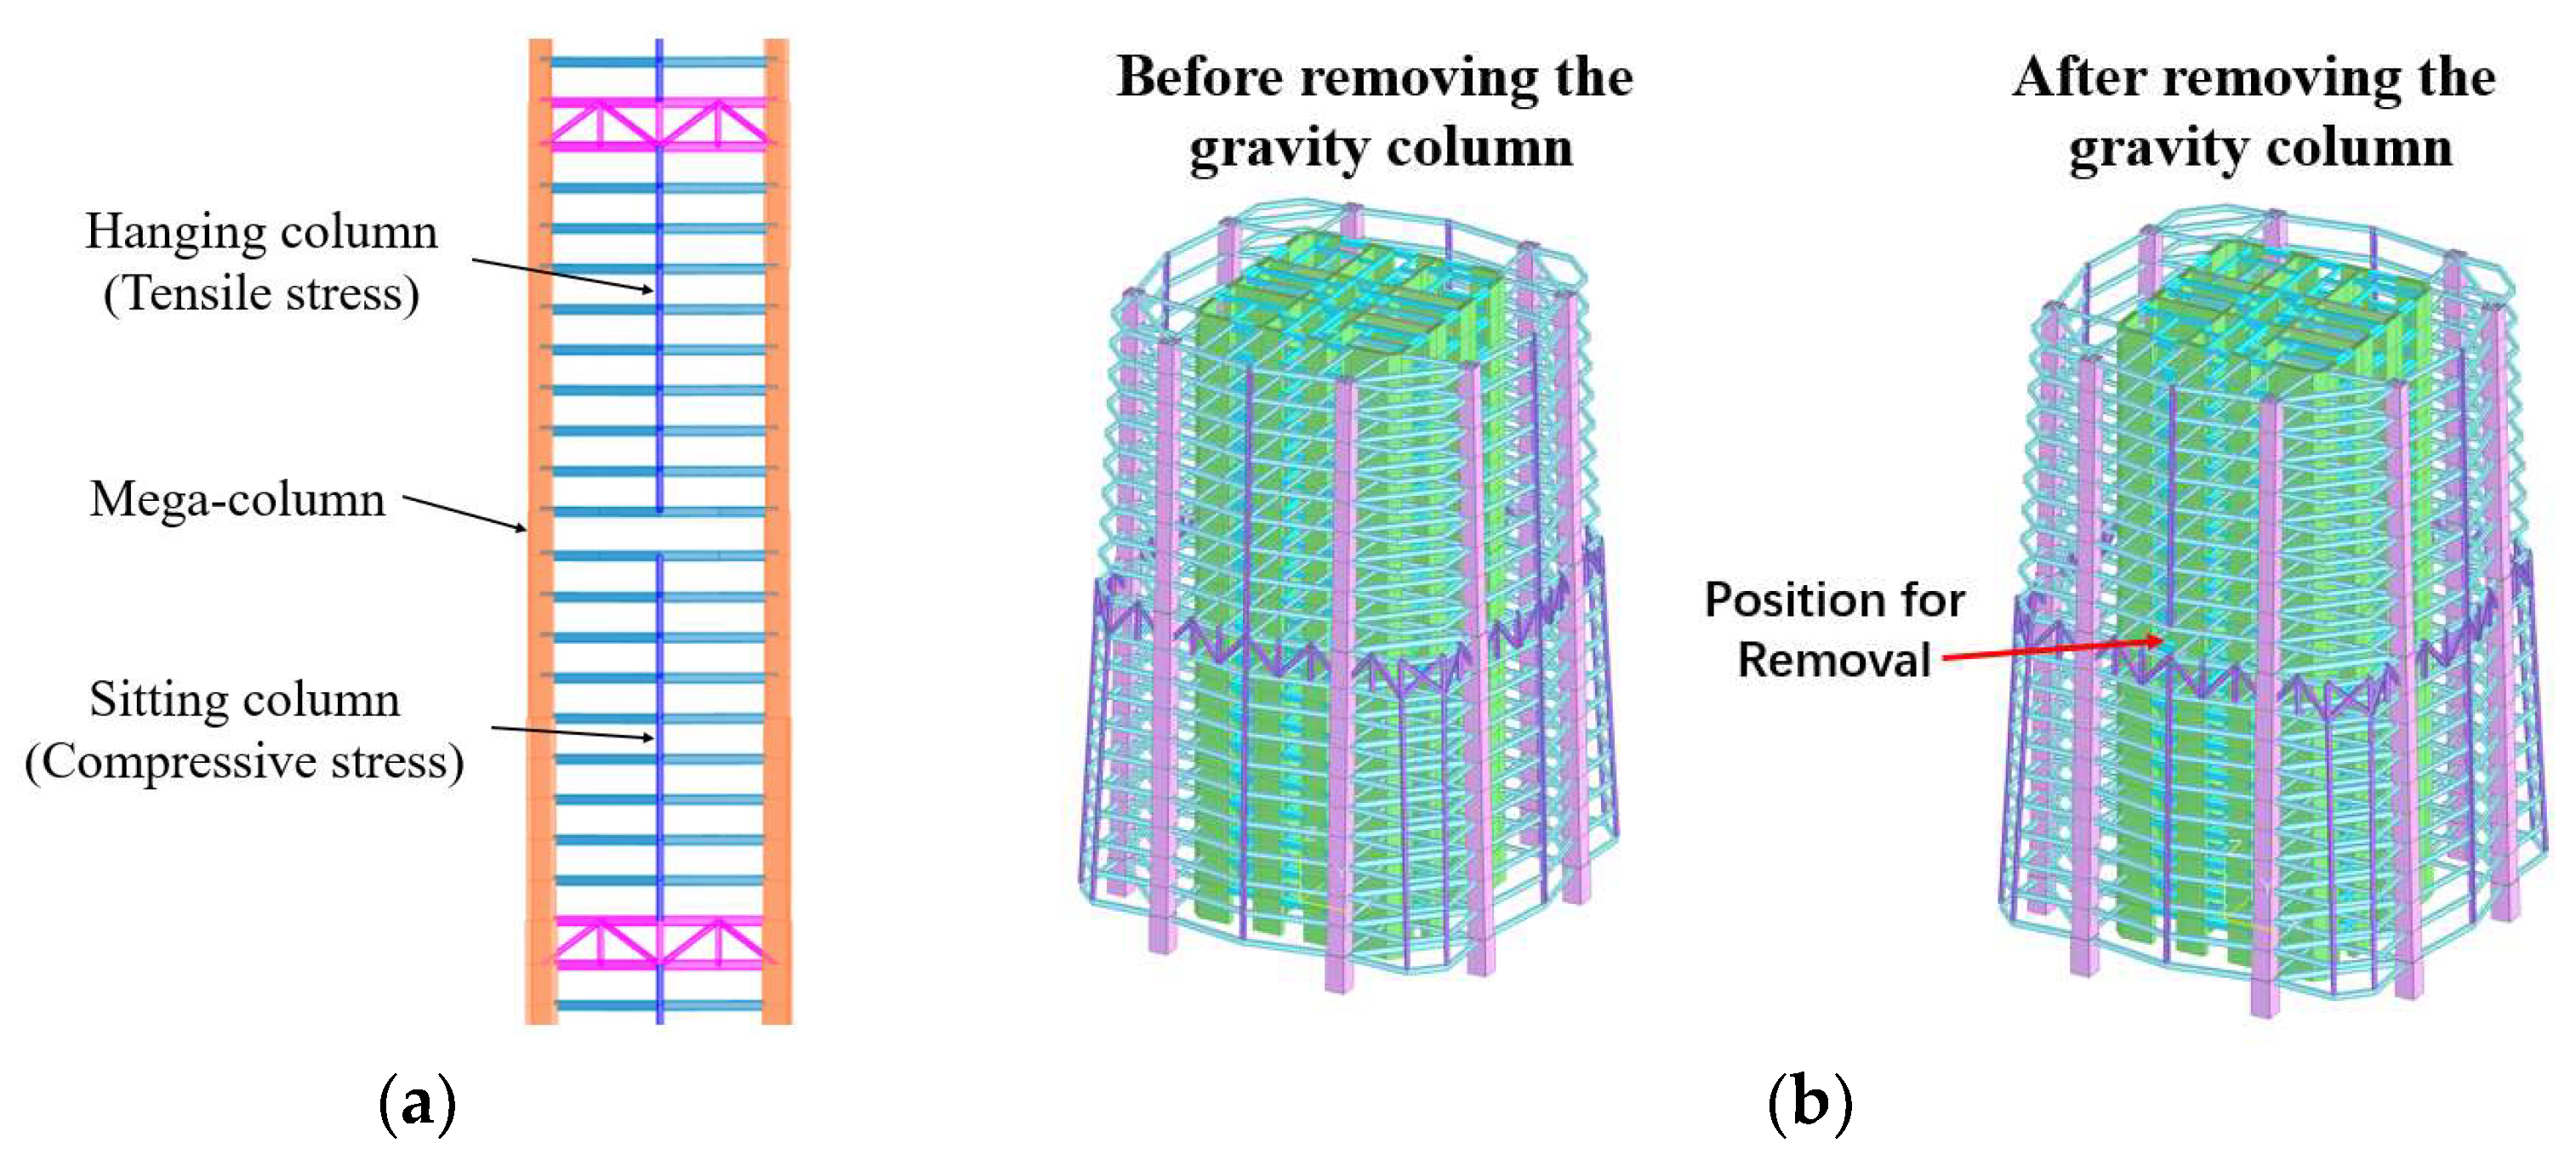
Between the mega-columns and the belt trusses of this project, a folded secondary frame is formed by gravity columns and folded beams. This secondary frame adopts a “half-sitting half-hanging” design [51], meaning that the gravity columns are either supported by or hanging from the belt trusses, providing support for the folded exterior frame beams with I-shaped cross-sections on each floor, as shown in Figure 20a. When local instability or damage occurs to the gravity columns, the span of the exterior frame beams can change from 13 m to 26 m, leading to a significant increase in mid-span vertical deformation and altering the stress state of the members. Additionally, the folded exterior frame beams will experience torsional deformation, causing the I-shaped cross-section beams to undergo torsion and weak-axis bending. Therefore, it is essential to conduct a comparative analysis of the force conditions of the exterior frame beams before and after the removal of the gravity columns to avoid continuous failure. Between every two adjacent belt trusses, the topmost and bottommost gravity columns, respectively, bear the maximum tensile force and the maximum compressive force. Failure of these columns would be the most detrimental to the secondary frame. Therefore, in this study, the bottom gravity column is selected for removal, and the removed column is located above the belt truss on the 15th floor, as shown in Figure 20b.
In the analysis, the contribution of floor stiffness is not considered, and the investigated load combination is 1.3D + 1.5L. The comparison results are presented in Table 6. After the failure of the gravity column, there is a significant increase in the vertical deformation, axial force, and strong-axis bending moment of the exterior frame beam, while the weak-axis bending moment and torque experience slight increases that are minimal and can be disregarded. After the removal of the gravity column, the axial force of the remaining gravity columns decreases by 98%, but its strong-axis bending moment (towards the core tube) increases significantly. Overall, the removal of the gravity column will lead to more unfavorable force conditions on the exterior frame beam and the remaining gravity column, and corresponding strengthening is required. The folded beams primarily experience major-axis bending and axial force, and there is no need to consider the influence of torsion or weak-axis bending.
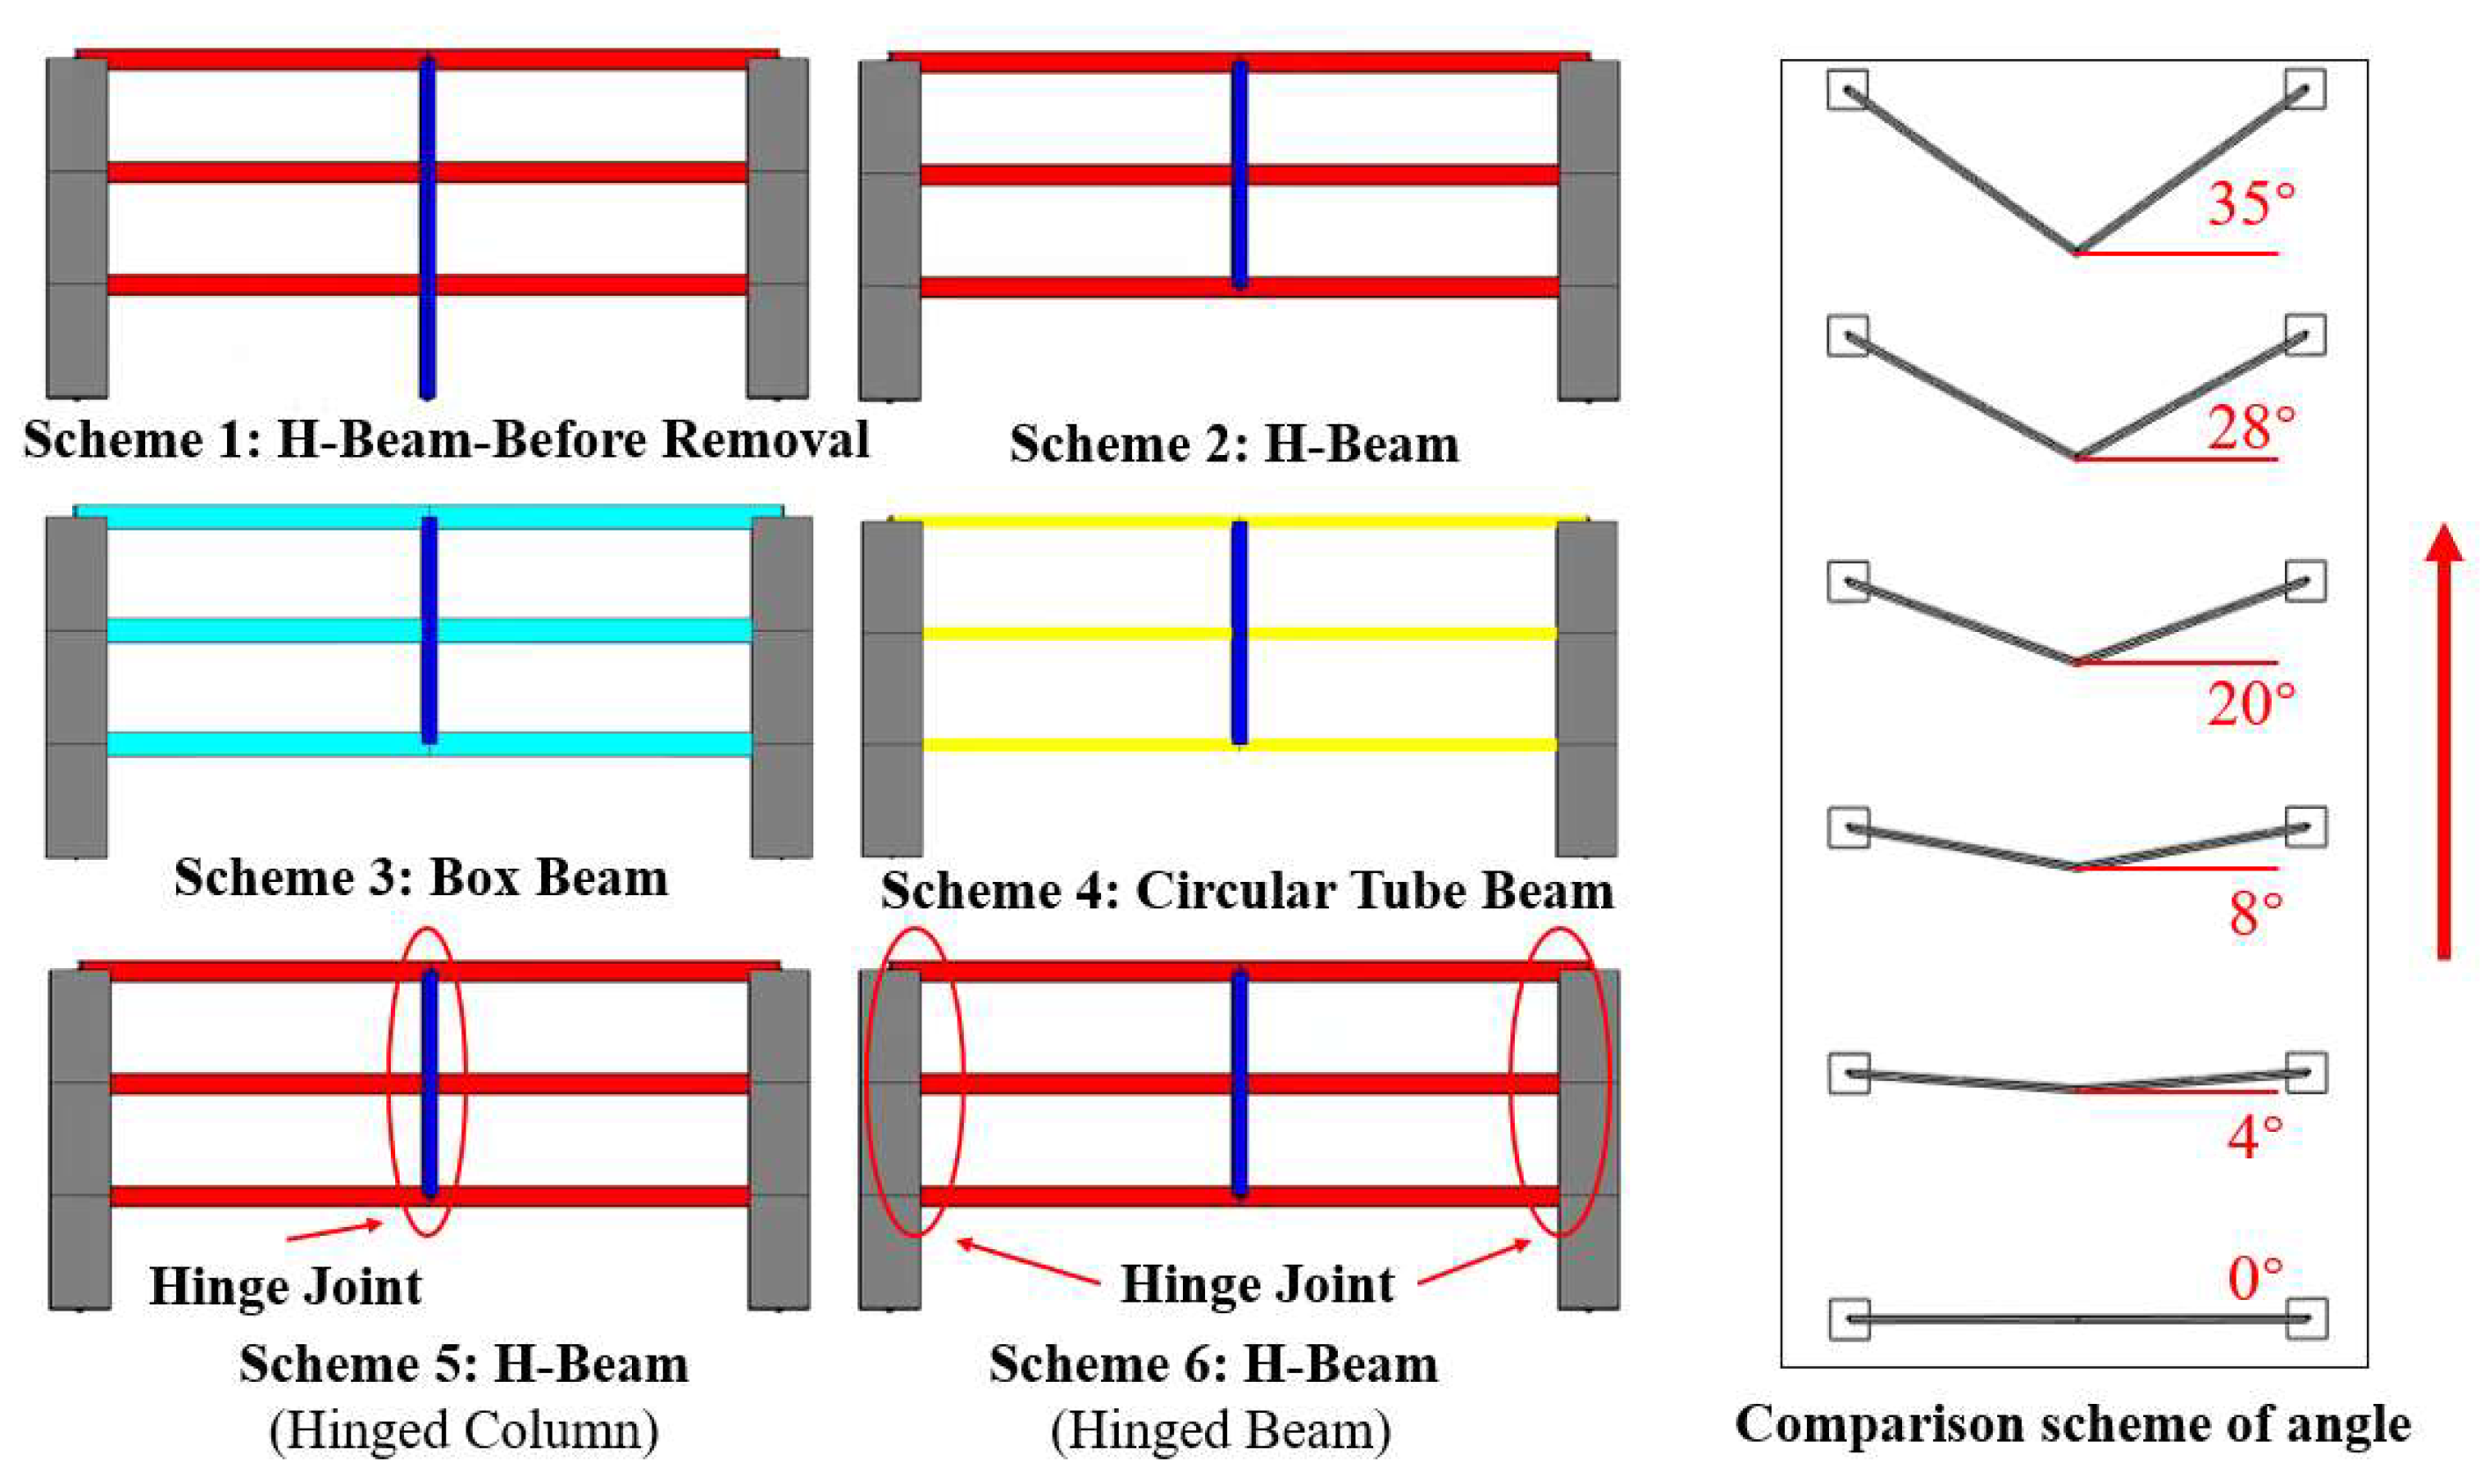
To further investigate the mechanical behavior of the folded beams in the secondary frame after the failure of the gravity column, a local simplified analytical model is established. A parametric analysis is conducted to examine different folded angles, beam section types, and constraint conditions. The folded angle is considered to be six different working conditions within the range of 0° to 35°. The beam sections considered include H-shaped, circular tube-shaped, and box-shaped sections (considering axial stiffness equivalence or flexural stiffness equivalence). In addition, based on the previous analysis, the beam end bending moment and the gravity column bending moment increase significantly after the removal of the gravity column. Therefore, a scheme with hinged ends of the beam and the column is supplemented to simulate the structural stress after the formation of plastic hinges. The comparison scheme is shown in Figure 21.
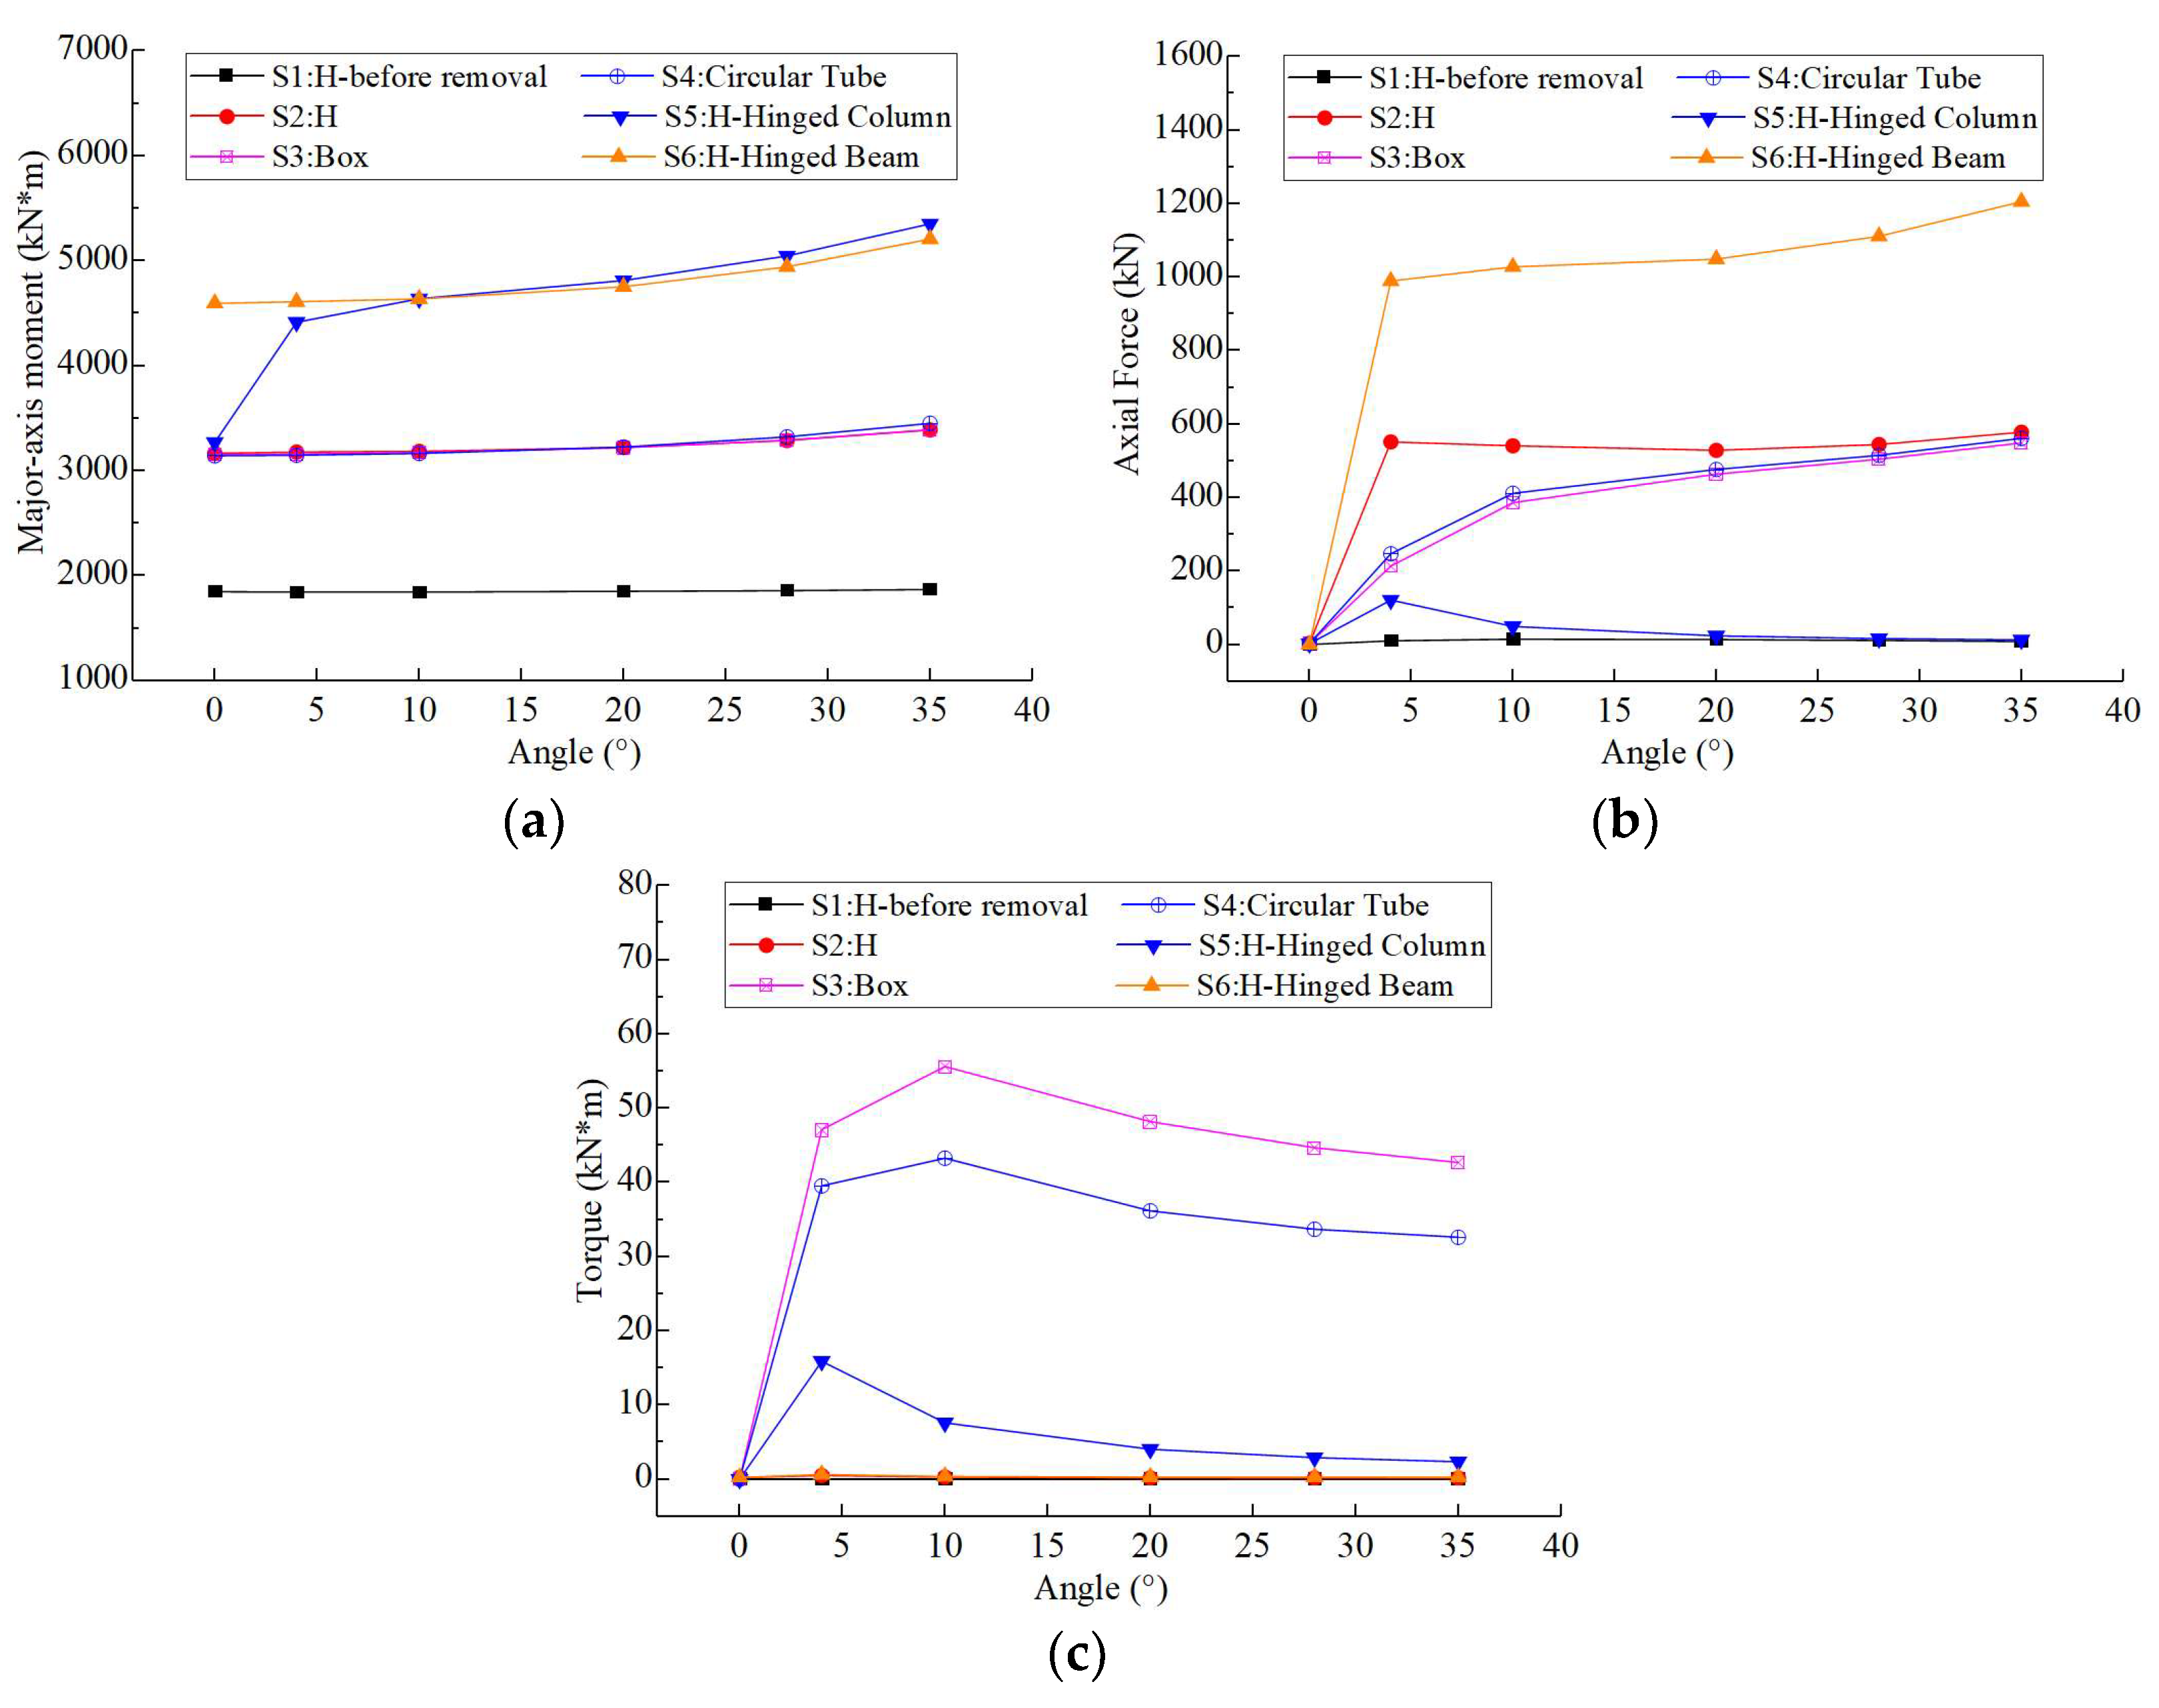
As shown in Figure 22a, for the strong-axis bending moment of the folded beam, with the increase in the folded angle, the bending moment of the folded beam before gravity column removal (Scheme 1) remains basically unchanged. For the scheme with a plastic hinge at the column end (Scheme 5), the bending moment increases significantly from 0° to 4°, and then increases slightly with the increase in the angle. For the other schemes, the bending moments increase slightly as the angle increases. Comparing different types of folded beam sections, the section type has no significant impact on the bending moment of the strong axis. Among all six schemes, the bending moment of the folded beam before column removal (Scheme 1) is the smallest. The scheme with a plastic hinge at the column end (Scheme 5) and the scheme with a plastic hinge at the beam end (Scheme 6) have significantly larger bending moments, and their values are relatively close. In the case of Scheme 5, the maximum bending moment of the folded beam appears at the beam end, and there is a tendency that the bending moment shifts from the mid-span to the beam end as the angle increases. In the case of Scheme 6, the maximum bending moment of the folded beam appears at the mid-span.
As shown in Figure 22b, for the axial force of the folded beam, under the working condition of 0° folded angle, the initial axial force of all schemes is 0. When the angle changes from 0° to 4°, the axial force of each scheme increases significantly except for Scheme 1. After that, as the angle continues to increase, the axial force of the box-shaped section scheme (Scheme 3), circular tube-shaped section scheme (Scheme 4) and the beam hinge scheme (Scheme 6) will gradually increase, while the axial force of the H-shaped beam scheme (Scheme 2) remains basically unchanged, and the axial force of the column hinge scheme (Scheme 5) gradually decreases to 0. Comparing different types of folded beam sections, the axial force of the H-shaped section beam is the largest, and the axial forces of the box-shaped and circular tube-shaped sections are close. As the angle increases, the axial forces of the three types tend to be consistent. Among all six schemes, the axial force of the beam before the column removal (Scheme 1) is always 0; the axial force of the beam hinge scheme (Scheme 6) is significantly larger than other schemes; and the axial force of the column hinge scheme (Scheme 5) is the smallest.
As shown in Figure 22c, for the torque of the folded beam, the torque is generally low, not exceeding 60 kN·m, but exhibits a strong regularity. At the folded angle of 0°, the initial torque of all schemes is 0. As the angle increases, the torque of the Scheme 1, the Scheme 2, and Scheme 6 is nearly at 0; the torque of the box-shaped section scheme (Scheme 3), circular tube-shaped section scheme (Scheme 4), and the column hinge scheme (Scheme 5) first increases and then decreases. The peak value of the former two appears around 10° of the folded angle, and the peak value of Scheme 5 appears around 4° of the folded angle. Comparing different section types, the H-shaped section shows virtually no torque, while the box-shaped and circular tube-shaped section demonstrate significant torque. Among all six schemes, the torque of the box-shaped section scheme (Scheme 3) is the largest, followed by the circular tube-shaped section scheme (Scheme 4) and the column hinge scheme (Scheme 5), with the remaining schemes exhibiting minimal torque.
The weak-axis bending moment of the folded beam is small, generally not exceeding 40 kN·m. Therefore, it is a non-controlling internal force with no obvious regularity, and further discussion will not be provided here.
In summary, the following conclusions can be drawn:
(1)
Within the range of 0° to 35° of the angle, for the common cross-sectional types and the above-mentioned constraint conditions, the folded beam mainly bears the strong-axis bending moment and axial force, while the torque and weak-axis bending moment are relatively small and their influences can be ignored.
(2)
With the increase in the angle, the strong-axis bending moment and axial force of the folded beam generally show an increasing trend, while the torque first increases and then decreases.
(3)
The cross-sectional type has little influence on the bending moment of the folded beam, but has a certain influence on the axial force and torque of the beam. In terms of axial force, the order is H-shaped section > circular tube section ≈ box-shaped section; in terms of torque, the order is box-shaped section > circular tube section, and the torque of the H-shaped section is negligible.
(4)
After removing the lower gravity column, the strong-axis bending moment, axial force of the folded beam, and the bending moment of the gravity column will increase significantly, and the vertical deformation will also increase considerably. Once plastic hinges appear at the beam end or the end of the gravity column, the bending moment and vertical deformation will further increase sharply, which may lead to a progressive collapse. Therefore, in the design, it is necessary to ensure that the gravity column or the folded beam has sufficient redundancy to avoid such a situation.

4.4. Sensitivity Analysis of Steel Consumption for Different Members

For this project, steel consumption is the main controlling factor of the structural material cost. In Section 3 of this paper, we explored how the number of mega-columns and belt trusses affects structural indicators and steel consumption from the perspective of the overall structural system. On the premise that the overall structural scheme is determined, in order to find the most efficient and steel-saving strengthening or optimization strategies at the member level, adjustments and comparative studies are, respectively, conducted on the cross-sections of mega-columns, gravity columns, frame beams, and the belt truss members.
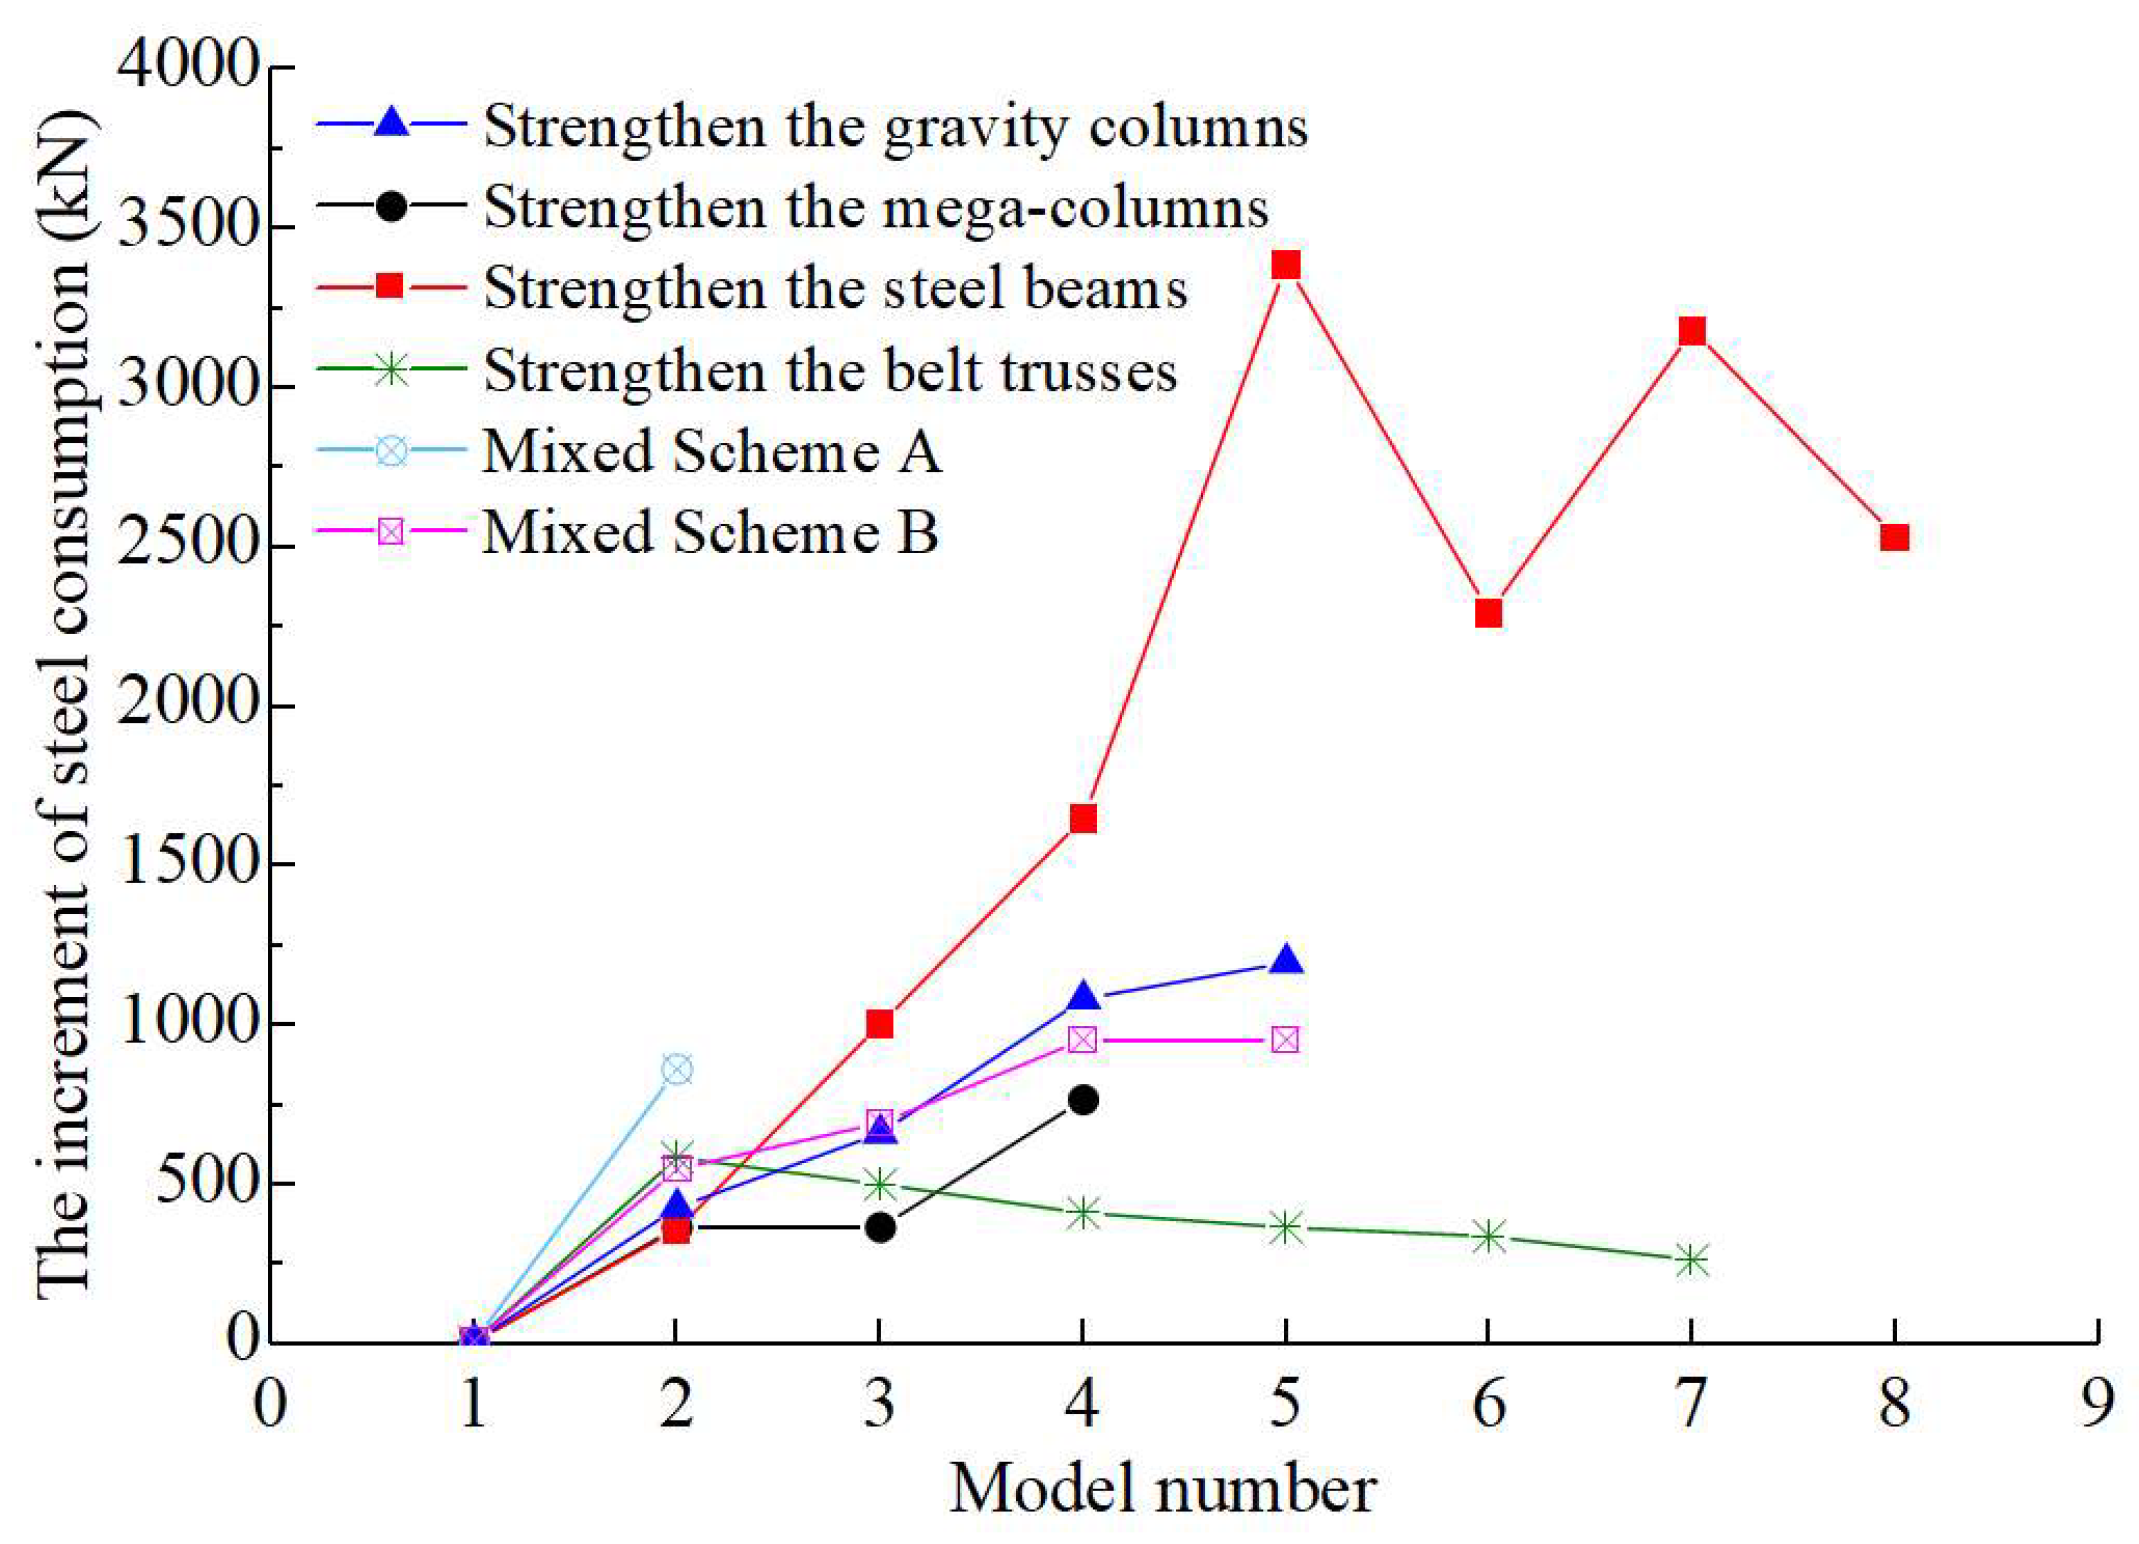
The first-order period of the super-high-rise structure is a fundamental characteristic that remains unaffected by external loads, determined by the distribution of the structure’s mass and stiffness. It has certain correlations with indicators such as the stiffness weight ratio, shear weight ratio, and the maximum displacement angle, serving as a comprehensive indicator that effectively reflects the structural characteristics [33]. For super-high-rise buildings that are up to 400 m tall, it is usually necessary to control their first-order period so that it does not become too long. This is to prevent it from exceeding the reasonable period range of the structure [33], which typically indicates insufficient structural stiffness and inadequate seismic forces. Furthermore, based on calculations of this project and previous experiences for super-high-rise structures, under the premise of reasonable buildings and structures, the adjustment of member cross-sections usually has an impact on the period within 0.2 s. Therefore, the adjustment and iteration goal for each scheme is to control the decrease in the first-order period by 0.1 s, and then the increase in steel consumption of each scheme is compared. The scheme with the smallest increase in steel consumption is the most efficient adjustment strategy.
The iterative calculation results of each scheme are shown in Figure 23. The horizontal axis represents the number of model iterations, while the vertical axis represents the increase in steel consumption relative to the initial state after each iteration. Among them, the mixed scheme A considers adjusting the cross-sections of both belt truss members and gravity columns, and the mixed scheme B considers adjusting the cross-sections of belt truss members, frame steel beams, and mega-columns simultaneously. The results show that the scheme with the smallest increase in steel consumption is the one that only adjusts the belt truss members, and the scheme with the largest increase in steel consumption is the scheme that only adjusts the steel beams. The efficiency of cross-section adjustment in descending order is: belt truss member > mega-column > mixed A > mixed B > gravity column > steel beam.

5. Conclusions

For a super-high-rise structure of approximately 400 m in height, a comprehensive research is conducted from both the overall and local perspectives of the structure. Comparisons and analyses are made on the structural system, column schemes, belt truss schemes, strengthening measures for belt truss floors, and folded secondary structures, leading to the following conclusions:
(1)
First, through a statistical analysis of the structural systems of super-high-rise building cases with a height of over 300 m, the structural system for this project is initially established. Then, four types of exterior frame column schemes (8, 12, 16, and 20 columns) are calculated and compared. Considering the structural performance, material consumption, and architectural effect comprehensively, the 8-mega-column scheme is ultimately determined.
(2)
Starting from the 8 belt trusses, the sensitivity analysis of the belt trusses is carried out using the decreasing method. Finally, the solution corresponding to Model-8 belt trusses (with five belt trusses) is determined as the optimal solution. Regarding the structural stiffness, the high-zone belt trusses usually contribute more than the low-zone belt trusses; for the total steel consumption of the structure, as the number of belt trusses decreases, the steel consumption first decreases and then increases, and the steel consumption is minimized when the spacing between belt trusses is 20 floors.
(3)
Using the inwardly inclined column scheme for the bottom mega-columns will significantly increase the axial force of the floor beams compared to the straight column scheme, resulting in an increase in the beam section, greater difficulty in connecting with the core tube, and a more unfavorable situation in terms of seismic resistance. Therefore, the seismic grade of the relevant beams and columns should be raised by one level, the thickness and reinforcement of the floor slabs should be strengthened, and the connection nodes between the beams and the core tube need further analysis and treatment.
(4)
Horizontal braces can enhance the integrity of polygonal belt trusses when floor slabs crack and lose their function under rare earthquakes, but their role under vertical loads is limited, and the scheme of horizontal braces directly connected to the core tube is more effective and cost-efficient.
(5)
For the secondary frame structure composed of gravity columns and folded beams, after removing a lower gravity column, the internal forces of the beams and the remaining gravity columns increase significantly. Once plastic hinges form, the internal forces and deformations will further increase, so strengthening measures are required in the design to avoid progressive collapse. After removing a lower gravity column, the folded beams are mainly subjected to the strong-axis bending moment and axial force, while the torque and weak-axis bending moment are relatively small and can be ignored. The strong-axis bending moment and axial force of the folded beam will increase with the increasing angle. The section type has little influence on the bending moments of the folded beams: the axial force of the H-shaped section is greater than that of the circular tube and box-shaped sections; the torque of the box-shaped section is larger than that of the circular tube section; and the torque of the H-shaped section can be ignored.
(6)
A sensitivity analysis of steel consumption is carried out for different types of structural members. The scheme with the smallest increase in steel consumption is the one that only adjusts the belt truss members, and the scheme with the greatest increase in steel consumption is the one that only adjusts the steel beams. The efficiency of cross-section adjustment in descending order is as follows: belt truss members > mega-column > mixed A > mixed B > gravity column > steel beam.
This study systematically presents the comparison and establishment process of the overall lateral force-resisting system of a 400 m high super-high-rise structure. It discusses the adverse effects of the inward inclination of the bottom exterior frame columns and reveals the mechanical mechanisms and strengthening measures of both the folded belt truss and the folded secondary frame structure. Additionally, it compares the efficiency of various component optimizations. The research findings can serve as a reference and guide for the structural analysis and optimization of super-high-rise buildings with similar heights, loads, or architectural characteristics.

Author Contributions

Conceptualization, J.C. and W.H.; methodology, J.C.; software, J.C.; validation, W.H. and W.C.; formal analysis, J.C.; investigation, J.C. and H.C.; resources, H.C. and J.W.; data curation, J.C. and W.H.; writing—original draft preparation, J.C. and H.C.; writing—review and editing, J.C. and W.C.; visualization, J.C.; supervision, W.H. and J.W.; project administration, W.C. and J.W.; funding acquisition, W.H. All authors have read and agreed to the published version of the manuscript.

Funding

This research was funded by China Academy of Building Research Co., Ltd. Youth Fund, grant number 20230122331030006.

Data Availability Statement

The data presented in this study are available on request from the corresponding author. The data are not publicly available due to privacy.

Acknowledgments

We are grateful to the anonymous reviewers for their constructive comments.

Conflicts of Interest

Authors Jiafeng Chen, Wei Hao, Weihong Cheng and Haokai Chen were employed by the company CABR Technology Co., Ltd. Author Jie Wang was employed by the company China Merchants Shekou Industrial Zone Holding Co., Ltd. All authors declare that the research was conducted in the absence of any commercial or financial relationships that could be construed as a potential conflict of interest. The sponsors had no role in the design, execution, interpretation, or writing of the study.

References

  1. Shepherd, R. Skyscraper: An Architectural Record Book; McGraw-Hill Education: New York, NY, USA, 2002; pp. 10–25. ISBN 978-0071369701. [Google Scholar]
  2. Zhen, Q.H. The Analysis of Some Key Problems in Structural Design of a High-Rise Building in Guangzhou. Master’s Thesis, South China University of Technology, Guangzhou, China, 2011. [Google Scholar]
  3. Sarkisian, M.; Mathias, N.J.; Long, E.; Mazeika, A.; Gordon, J.; Chakar, J.-P. Jin Mao Tower’s Influence on China’s New Innovative Tall Buildings. In Proceedings of the 2006 International Seminar of Design and Construction Technologies of Super High-Rise Buildings, Shanghai, China, 15–16 May 2006; pp. 1–6. [Google Scholar]
  4. CTBUH Council on Tall Buildings and Urban Habitat. Illinois Institute of Technology, S.R. Crown Hall, 3360 South State Street, Chicago, IL, USA. Available online: www.ctbuh.org (accessed on 20 June 2025).
  5. Gong, J.; Fang, T.; Zuo, J. A Review of Key Technologies Development of Super High-Rise Building Construction in China. Adv. Civ. Eng. 2022, 13, 5438917. [Google Scholar] [CrossRef]
  6. Al, S. Supertall: How the World’s Tallest Buildings Are Reshaping Our Cities and Our Lives; WW Norton & Company: New York, NY, USA, 2022. [Google Scholar]
  7. Li, J.; Wang, D.; Geng, J. Relationship Between Super-tall Buildings and the Economic Development. Constr. Technol. 2014, 15, 1–5. [Google Scholar] [CrossRef]
  8. Ilgın, H.E.; Aslantamer, Ö.N. Comparative Analysis of Space Efficiency in Skyscrapers with Prismatic, Tapered, and Free Forms. Buildings 2024, 14, 3345. [Google Scholar] [CrossRef]
  9. Lai, H.; Lin, S.; Tang, J. Research on Structural System Compatibility of Super High-rise Building. Build. Struct. 2024, 54, 1–5. [Google Scholar]
  10. Dong, X.; Wang, Y. Reshaping the city: Does the skyscraper cause the formation of subcenters? Real Estate Econ. 2025, 53, 763–807. [Google Scholar] [CrossRef]
  11. Li, Y. Research on the Selection of a Super-High-Rise Building Structure. Master’s Thesis, Zhengzhou University, Zhengzhou, China, October 2017. [Google Scholar]
  12. Fur, L.-S.; Yang, H.T.Y.; Ankireddi, S. Vibration Control of Tall Building under Seismic and Wind Loads. J. Struct. Eng. 1996, 122, 122–126. [Google Scholar] [CrossRef]
  13. Smith, F.C. The Architecture of Tall Buildings; McGraw-Hill Education: New York, NY, USA, 1991; ISBN 978-0-07-059352-9. [Google Scholar]
  14. Wang, D.; Zhou, J.; Bao, L. Analysis on the Cost of Structural Construction in Super-Tall Buildings. Build. Struct. 2012, 42, 1–7. [Google Scholar]
  15. Zhou, J.; Bao, L.; Qian, P. Study on the Economy of Structural Design of Super-Tall Buildings and Relevant Issues. Eng. Mech. 2015, 36, 9–15. [Google Scholar] [CrossRef]
  16. Qu, J.; Wang, Z.; Du, P. Comparative Study on the Development Trends of High-rise Buildings Above 200 Meters in China, the USA and the UAE. Int. J. High Rise Build. 2021, 10, 63–71. [Google Scholar] [CrossRef]
  17. GB 50011-2010; Code for the Seismic Design of Buildings. China Architecture & Building Press: Beijing, China, 2010.
  18. GB 50009-2012; Load Code for the Design of Building Structures. China Architecture & Building Press: Beijing, China, 2012.
  19. Abed, J.; Rayburg, S.; Rodwell, J.; Neave, M. A Review of the Performance and Benefits of Mass Timber as an Alternative to Concrete and Steel for Improving the Sustainability of Structures. Sustainability 2022, 14, 5570. [Google Scholar] [CrossRef]
  20. Qu, J.; Zhuang, K.; Zhou, J. Structural and Material Comparison Analysis of Super High-Rise Buildings Above 300 Meters Height. Archit. Tech. 2021, 27, 32–35. [Google Scholar]
  21. JGJ 138-2016; Code for Design of Composite Structures. China Architecture & Building Press: Beijing, China, 2016.
  22. Qi, F. Application of Parametric Method Based on Grasshopper in Structure Design. J. Civ. Eng. Inf. Technol. 2018, 10, 105–110. [Google Scholar] [CrossRef]
  23. Liang, D.; Hou, S.; Wang, X.; Jin, L. Application of Parametric Modeling in Structural Design of a Super High-Rise Building Tower in Ningbo Eastern New Town. Build. Struct. 2018, 48, 30–35. [Google Scholar] [CrossRef]
  24. Liu, Y.; Li, Q.; Xing, Y.; Kang, Y. Secondary Development and Application of Parametric Modeling and Integrated Analysis Program for Super High Rise Structure Based on GH and SAP2000. Build. Struct. 2021, 51, 212–216. [Google Scholar]
  25. Li, Y.; Zhou, J. Application of Parametric Technology in Structural Design. Build. Struct. 2022, 52, 142–147. [Google Scholar] [CrossRef]
  26. Yang, L.; Zhang, J.; Sun, Y.; Wang, H.; Gong, M. Application of Parametric Technology in the Design of Super High-Rise Structures. Build. Struct. 2022, 52, 29–37. [Google Scholar] [CrossRef]
  27. Sha, X.; Li, H.; Li, Y.; Qiu, H.; Chen, Z. Application of Numerical Intelligence Design of Building Structure Under the Development of Information Technology. Buildings 2024, 6, 128–131. [Google Scholar]
  28. JGJ 3-2010; Technical Specification for Concrete Structure of Tall Building. China Architecture & Building Press: Beijing, China, 2010.
  29. Bin, W. Analysis on Structural Selection and Economy of Super High-Rise Building. Urban. Archit. 2021, 18, 88–90. [Google Scholar]
  30. Yang, W. Study and Optimization on the Structural Scheme Selection of Ultra High-Rise Building. Master’s Thesis, Chang’an University, Xi’an, China, 2013. [Google Scholar]
  31. Ali, M.M.; Al-Kodmany, K. Structural systems for tall buildings. Encyclopedia 2022, 2, 1260–1286. [Google Scholar] [CrossRef]
  32. Yu, D.; Lin, H.; Lv, W. Structural scheme selection for Wuhan CTF Finance Centre. Build. Struct. 2017, 47, 6–11. [Google Scholar]
  33. Xu, P.; Chen, C.; Qiu, S. Study on reasonable range of fundamental natural period of vibration of high-rise buildings. J. Build. Struct. 2024, 45, 16–24. [Google Scholar]
  34. Wang, D.; Bao, L. Development and prosperity of structural design of super tall buildings in China. Build. Struct. 2019, 49, 11–24. [Google Scholar]
  35. Zhao, Q. Research on the Design Theory of Support Columns in the Super High-Rise Multi-Column Frame-Core Tube Structure Constructed by the Top-Down Technique. Ph.D. Thesis, Tianjin University, Tianjin, China, 2017. [Google Scholar]
  36. Xia, H.; Zhang, X.; Li, W.; Chen, C. Design and research on a sparse column frame-corewall office building in high wind pressure area. J. Build. Sci. 2023, 39, 174–182. [Google Scholar]
  37. Ke, C.; Fan, Y.; Chen, L. Ultra-limit High-rise Structural Design of Building D in Hefei Greenland Center. J. Anhui Jianzhu Univ. 2021, 29, 15–19. [Google Scholar]
  38. Cao, L. Structure Systems and Optimization Program of Super-High-Rise Buildings. Low Temp. Archit. Technol. 2011, 12, 52–54. [Google Scholar]
  39. Wu, X.; Peng, Z.; Liu, Y.; Chen, Q.; Xie, J.; Zhang, Q.; Qin, P.; Tu, Y. Structural design of super high-rise project in Chengdu Zhonghai Tianfu New District. Build. Struct. 2024, 54, 1–10. [Google Scholar]
  40. Gong, Z.; Yang, Y.; Chang, W. Design Research on Mega Columns of CITIC Tower. Ind. Constr. 2022, 52, 80–86. [Google Scholar]
  41. Wu, G.; Fu, X.; Huang, Y.; Liu, Y.; Zhang, X.; He, Z. Structural design on Shenzhen Bay Headquarters Building of China Resources Group. Build. Struct. 2019, 49, 43–50. [Google Scholar]
  42. Ilgın, H.E. Space Efficiency in Tapered Super-Tall Towers. Buildings 2023, 13, 2819. [Google Scholar] [CrossRef]
  43. GB 50010-2010(2015); Code for Design of Concrete Structures. China Architecture & Building Press: Beijing, China, 2010.
  44. GB 50017-2017; Standard for Design of Steel Structures. China Architecture & Building Press: Beijing, China, 2017.
  45. Chen, C.; Wang, C.; Pan, C. Study on the Frame-Shear Ratio of Frame-Core Tube Structure Based on the Cooperative Work Principle. Build. Sci. 2019, 35, 1–6. [Google Scholar] [CrossRef]
  46. ASCE/SEI 7-05; Minimum Design Loads for Buildings and Other Structures. ASCE: Reston, VA, USA, 2005.
  47. IBC 2009; International Building Code. ICC: Country Club Hills, IL, USA, 2009.
  48. Fu, C.; Zhang, X.; Zhou, L. Frame-Core Wall Structural System and Seismic Shear Distribution Ratio. Build. Struct. 2015, 45, 1–8. [Google Scholar]
  49. Chen, C.; Wang, C.; Pan, Y.; Xiong, Y.; Pan, C. Research on Frame Shear Adjustment Method of the Frame-Core Tube Structure. Build. Struct. 2021, 51, 8–14. [Google Scholar] [CrossRef]
  50. Xiao, C.; Li, J.; Sun, C.; Wei, Y.; Li, Y. Discussion on Performance-Based Seismic Design Method of Out-of-Code High-Rise Structures. Build. Struct. 2022, 52, 8–13. [Google Scholar] [CrossRef]
  51. Huang, G.; Cheng, W.; Zhang, Q.; Xie, Z.; Chen, C.; Xiong, Y.; Chen, H. Design study of half-sitting half-hanging secondary frames in Chengdu Zhonghai Tianfu New Area super high-rise project. Build. Struct. 2025, 55, 29–33. [Google Scholar]
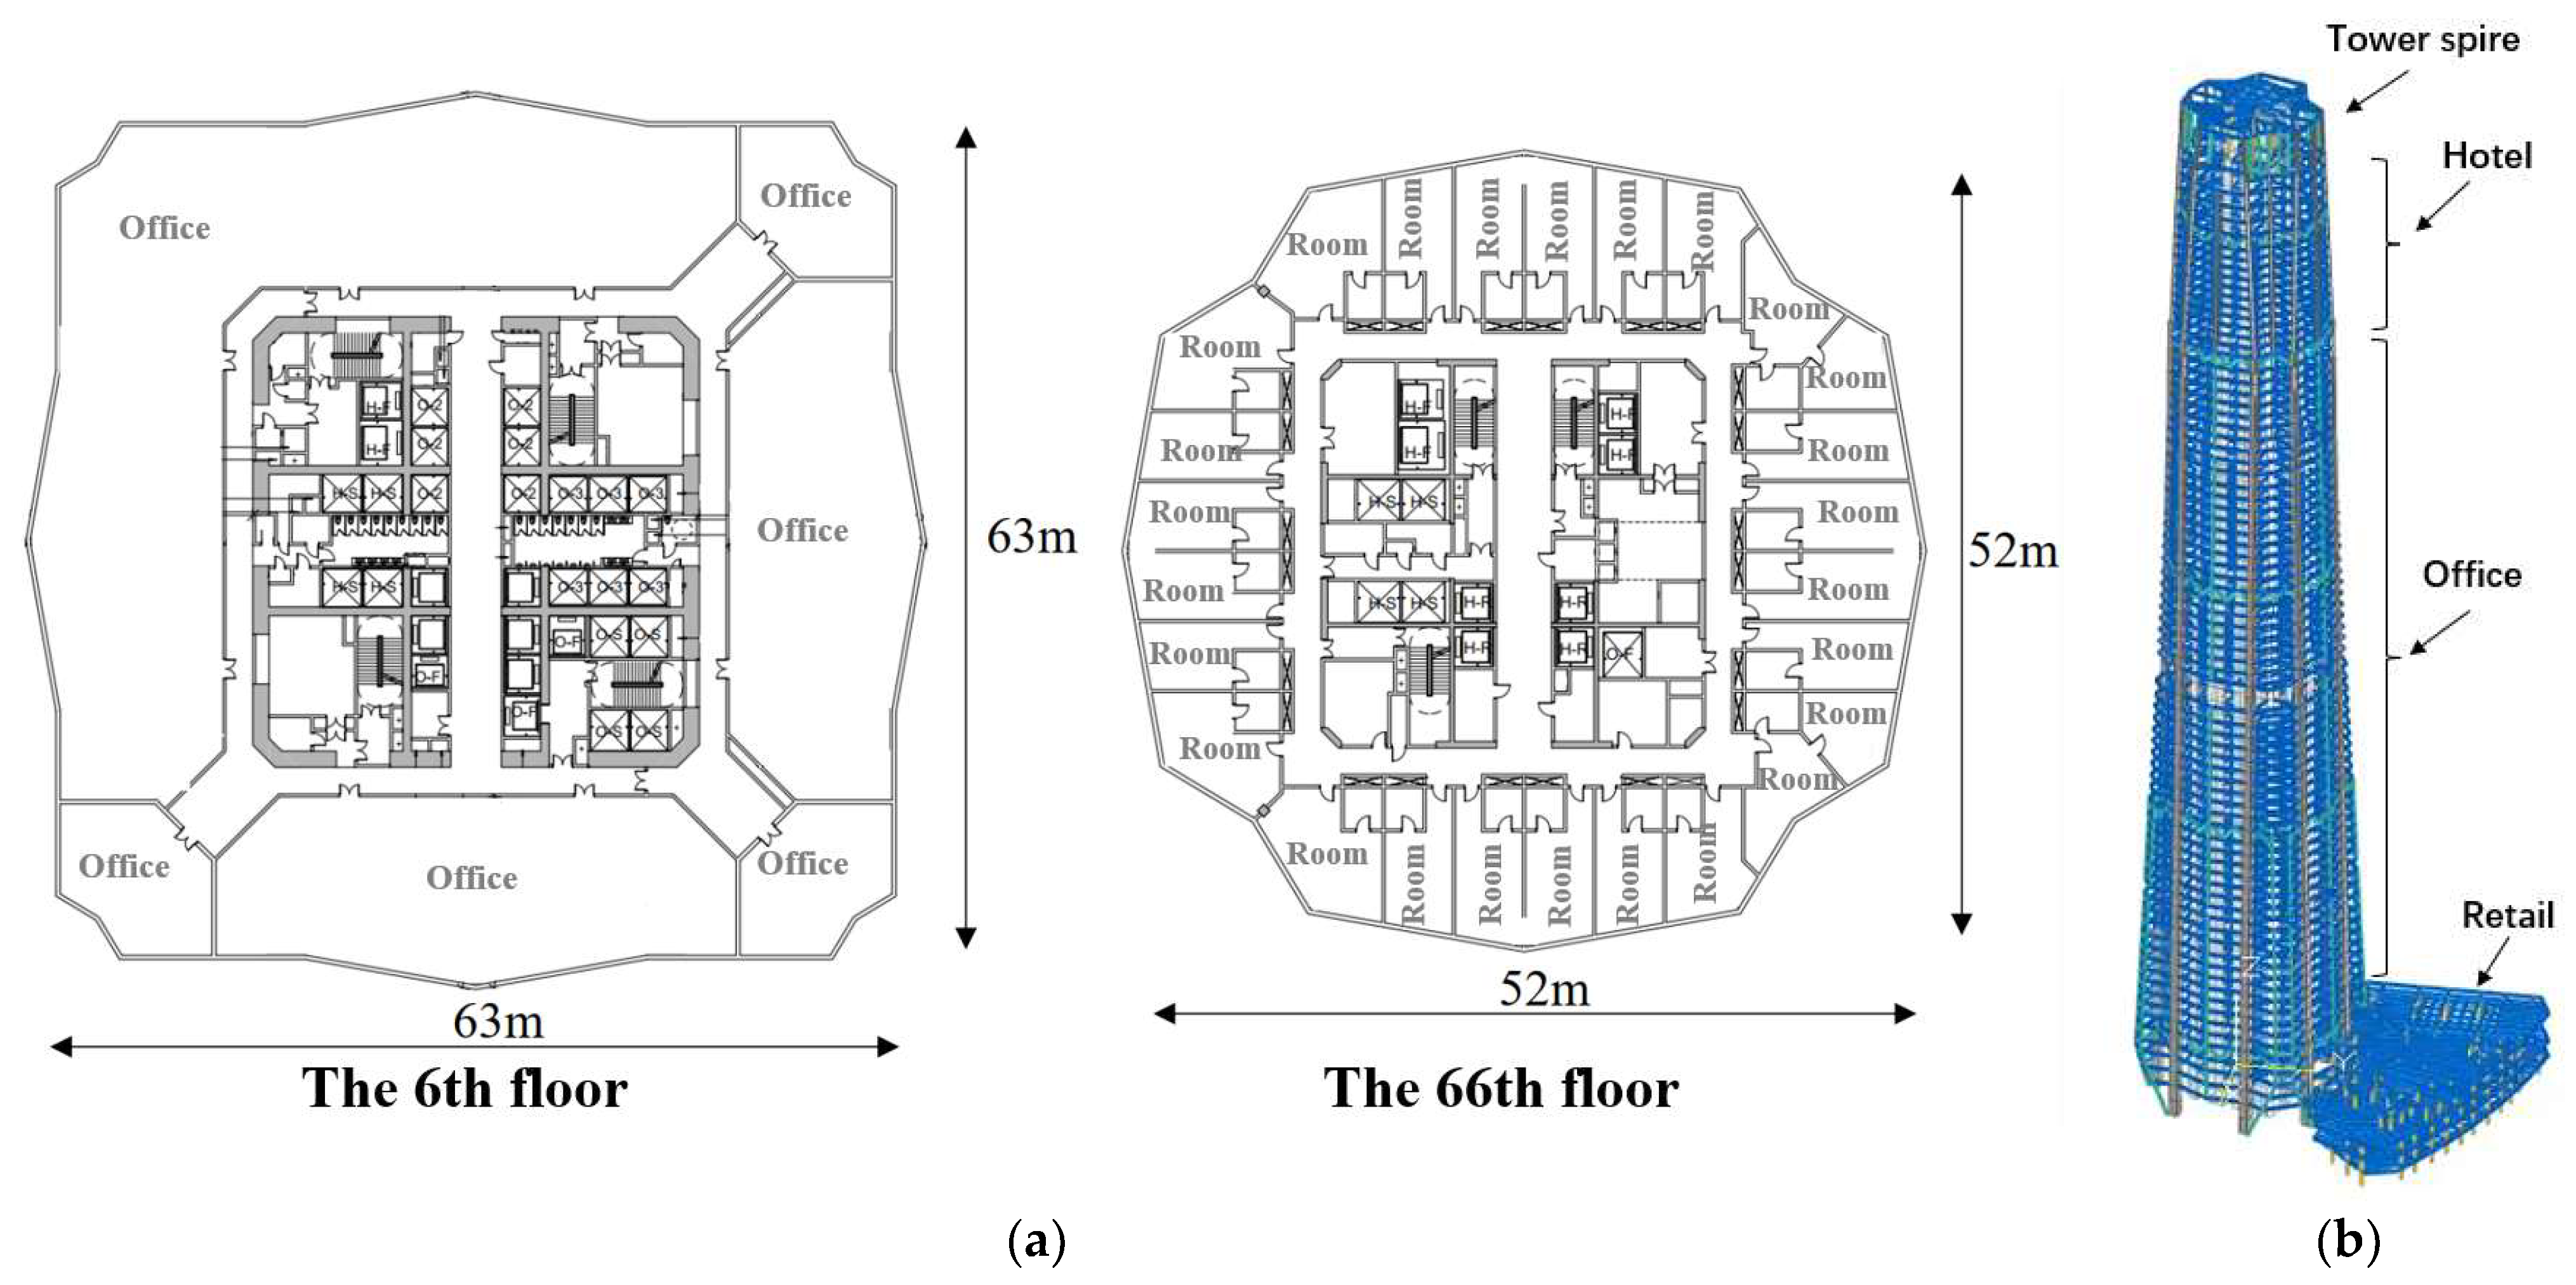
Figure 1. The floor plan and overall shape of the tower. (a)Typical floor plan; (b)The tower model.
Buildings 15 03199 g001
Figure 2. The workflow for structural parametric modeling analysis and optimization.
Buildings 15 03199 g002
Figure 3. The research framework of this paper.
Buildings 15 03199 g003
Figure 4. Three types of lateral force-resisting systems for super-high-rise structures.
Buildings 15 03199 g004
Figure 5. Statistics on the number of columns, structural height and construction time. (a) The relationship between the number of columns and the structural height; (b) The relationship between the number of columns and the start construction date.
Buildings 15 03199 g005
Figure 6. Composition of the structural system.
Buildings 15 03199 g006
Figure 7. Typical floor plan of different column arrangement schemes (the 6th floor).
Buildings 15 03199 g007
Figure 8. Structural models of different column schemes.
Buildings 15 03199 g008
Figure 9. The positioning of the bottom columns in different column schemes.
Buildings 15 03199 g009
Figure 10. Axial compression ratio of the bottom columns in different floors of each scheme.
Buildings 15 03199 g010
Figure 11. Curves of seismic displacement angle and frame–shear ratio. (a) the seismic displacement angle; (b) the frame-shear ratio.
Buildings 15 03199 g011
Figure 12. Different schemes for the arrangement and quantity of belt trusses (The arrows in the figure indicate the positions where the trusses are to be removed).
Buildings 15 03199 g012
Figure 13. The changes in periods, base seismic shear forces and shear weight ratios of different belt truss schemes. (a) the period; (b) the base seismic shear force and shear weight ratio.
Buildings 15 03199 g013
Figure 14. The steel consumption of different belt truss schemes.
Buildings 15 03199 g014
Figure 15. Comparison between inclined columns and straight columns at the bottom.
Buildings 15 03199 g015
Figure 16. Comparison of internal forces between straight columns and inclined columns. (a) Beam axial force curve; (b) The force transmission of the two schemes.
Buildings 15 03199 g016
Figure 17. The folded belt truss.
Buildings 15 03199 g017
Figure 18. Stress distribution of floor slab (the 45th floor). (a) under dead and live loads; (b) under a rare earthquake.
Buildings 15 03199 g018
Figure 19. Layout scheme of horizontal bracing for strengthening layer floor (the 45th floor). (a) Scheme 1: not connected to the core tube; (b) Scheme 2: connected to the core tube.
Buildings 15 03199 g019
Figure 20. The scheme for removing the gravity columns of the folded secondary frame structure. (a) The folded secondary frame structure; (b) The position where the gravity column was removed.
Buildings 15 03199 g020
Figure 21. Comparison schemes for secondary frames.
Buildings 15 03199 g021
Figure 22. The internal forces of the folded beam with varying angles. (a) Strong-axis moment; (b) Axial force; (c) Torque.
Buildings 15 03199 g022
Figure 23. Calculation model iteration curves for strengthening strategies of different members.
Buildings 15 03199 g023
Table 1. Statistics on the shape of the floor plan.
Column TypeSquareCircleTriangleOther
4 mega-columns2000
6–8 mega-columns14011
conventional column (≥12)112312
Table 2. The overall structural indicators for different column schemes.
Structural Indicator8-Col12-Col16-Col20-Col
Period/sT17.237.116.966.71
T27.27.096.946.69
T34.374.424.224.11
Period Ratio≤0.850.600.620.610.61
Displacement Angle (Maximum)earthquake1/6281/6471/6901/742
wind1/11081/11371/12071/1230
Frame-Shear Ratio>0.0583%76%87%97%
>0.0837%34%43%54%
Shear Weight Ratio1.071%1.061%1.082%1.093%
Seismic shear force/kN33,46333,16033,83434,193
Total weight/t (D + 0.5L)328,198329,149315,453311,667
Column steel consumption/t4894572255875323
Total steel consumption/t25,95925,628 (−1.3%)25,258 (−2.7%)24,048 (−7.4%)
Table 3. Comprehensive comparison of different schemes.
Structural Scheme8-Col12-Col16-Col20-Col
Structural PerformancereasonableNeeds transfer structure at the first floor,
low efficiency
reasonableNeeds transfer structure at the first floor,
low efficiency
Architectural EffectTransparent, goodTransfer structure at the first floor, poorrelatively poorSmall column spacing,
worst effect
Construction ComplexityGeneralGeneralGeneralGeneral
Material CostRelatively highModerateRelatively smallMinimum
Comprehensive EvaluationOptimalPoorGeneralPoor
Table 4. The results of the overall structural indicators.
Model NumberPosition of Removing the Belt TrussPeriod/s
(Adjusted)
Seismic
Displacement Angle
Frame–Shear
Ratio > 0.05
Steel Consumption/t
T1T2T3EXEYXY
1No7.237.204.371/6281/65084%83%25,959
215F7.317.274.521/6301/64984%85%25,716
335F7.387.344.541/6351/65685%84%25,791
455F7.427.374.501/6331/65385%87%25,845
515F/35F7.437.394.681/6331/65185%87%25,613
635F/55F7.477.424.651/6351/65185%87%25,667
715F/55F7.547.494.671/6401/65989%87%25,742
815F/35F/55F7.617.564.811/6371/65291%89%25,602
915F/25F/45F/55F7.687.624.901/6311/64689%88%26,968
Table 5. Comparison of floor strengthening schemes.
Load CaseResultsInitialScheme 1Scheme 2
Dead loadFloor slab stress/MPa7.05.65.1
Torsional deformation of the belt truss/mm5.23.13.8
axial force of the floor beam/kN484313365
axial force of the horizontal bracing/kN-238181
Weak-axis bending moment of the belt truss chords/kN·m315200239
Rare EarthquakeFloor slab stress/MPa59.651.850.0
Torsional deformation of the belt truss/mm2.31.41.9
axial force of the floor beam/kN422228297
axial force of the horizontal bracing/kN-9852553
Weak-axis bending moment of the belt truss chords/kN·m292166214
Table 6. The calculation results.
Type of MemberResultsBefore RemovalAfter Removal
Folded Exterior Frame BeamVertical deformation/mm7103
Axial force/kN3701210
Strong-axis moment/kN·m24776494
Weak-axis moment/kN·m0.413
Torque/kN·m1.02.6
Gravity ColumnAxial force/kN254326
Strong-axis moment/kN·m2371022
Weak-axis moment/kN·m11.6
Torque/kN·m00
Disclaimer/Publisher’s Note: The statements, opinions and data contained in all publications are solely those of the individual author(s) and contributor(s) and not of MDPI and/or the editor(s). MDPI and/or the editor(s) disclaim responsibility for any injury to people or property resulting from any ideas, methods, instructions or products referred to in the content.