Article

Theoretical and Experimental Study on the Control Effect of Isolation Piles on Soil Subsidence Induced by Excavation in Sandy Stratum

College of Civil Engineering, Huaqiao University, Xiamen 361021, China
*
Author to whom correspondence should be addressed.
Buildings 2025, 15(17), 3188; https://doi.org/10.3390/buildings15173188
Submission received: 7 August 2025 / Revised: 1 September 2025 / Accepted: 3 September 2025 / Published: 4 September 2025
(This article belongs to the Section Construction Management, and Computers & Digitization)

Abstract

To investigate the effect of isolation piles on surface subsidence induced by excavation and to explore the influence of isolation pile layout parameters on the subsidence behind the piles, this study employs a combined approach of theoretical calculation and model testing to systematically analyze the control effect of isolation piles on excavation-induced deformation. Based on a three-stage analysis method, the Kerr three-parameter foundation model is first introduced to solve the deflection differential equation and calculate the lateral deformation of the underground continuous wall induced by excavation. The boundary element method is then used to compute the additional stress near the isolation piles caused by the wall displacement, considering the shielding effect of pile groups. The lateral deformation of the isolation piles due to excavation is calculated, and the boundary element method is applied again to determine the additional stress induced by the pile displacement. Finally, the Mindlin solution is employed to compute the surface subsidence behind the isolation piles. Laboratory-scale experiments on subsidence control using isolation piles are conducted, and the results are compared with theoretical calculations to verify the validity of the theory. The results show that, compared to the condition without isolation piles, the presence of isolation piles reduces the surface subsidence by 0.099 mm. Increasing the diameter, elastic modulus, or pile-to-wall distance of the isolation piles, as well as reducing the spacing between isolation piles, helps reduce both the lateral deformation of the isolation piles and the surface subsidence behind the piles. Under the parameters used in this study, the reduction in lateral deformation of the underground continuous wall reaches 0.112 mm, 0.054 mm, 0.147 mm, and 0.172 mm, while the reduction in subsidence reaches 0.07 mm, 0.027 mm, 0.094 mm, and 0.124 mm, demonstrating significant deformation control effects. The conclusions derived from this study can be directly applied to practical foundation pit engineering. They offer valuable insights for optimizing the selection and arrangement of isolation piles, thereby providing effective guidance for controlling ground subsidence induced by excavation activities on site.

1. Introduction

With the rapid development of urbanization, the engineering of underground spaces, represented by foundation pit projects, has been increasingly implemented, while numerous challenges emerge during deformation control [1,2,3]. Metro foundation pits are typically located in urban central areas with complex surrounding environments, where excavation activities may significantly impact adjacent structures. When geological conditions are unfavorable, greater safety risks may arise [4,5,6,7]. As a crucial subsidence control measure, isolation pile reinforcement has been widely adopted in underground space engineering construction [8,9].
Before constructing isolation piles, their design parameters must first be considered, including piles’ diameter, spacing, and distance to protected structures. These parameters directly affect both construction costs and deformation control’s effectiveness, thus requiring thorough clarification of the working mechanism of isolation piles. To clarify the working mechanism of isolation piles, researchers have systematically studied this issue through various methods, including centrifuge tests [10,11], numerical simulations [12,13,14,15], laboratory-scale experiments [16,17,18], and theoretical calculations [19,20,21,22]. Existing research shows that isolation piles are widely used in both foundation pit and tunnel construction. Although their excavation unloading patterns differ, the working mechanism of isolation piles remains the same. These studies all demonstrate that the working mechanism of isolation piles is to block ground displacement. Therefore, the core of this study focuses on the barrier role of isolation pile arrangements on surface subsidence, while also examining the deformation patterns of the piles themselves and their control effect on the lateral deformation of underground continuous walls.
Although centrifuge tests, laboratory-scale experiments, and numerical simulations can visually observe the control effect of isolation piles on surface subsidence, they cannot clarify the control mechanism of isolation piles. The working mechanism of isolation piles needs to be analyzed using theoretical methods. Cao et al. [20,21] used the elastic continuum method to study the control effect of isolation piles on ground deformation induced by tunnel excavation. However, their research focused on the relative sliding at the pile–soil interface, while the most important effect of isolation piles should be their barrier role on surface subsidence, a mechanism that cannot be neglected. Additionally, their method ignored the lateral deformation of the piles themselves. Wei et al. [22] employed the energy variation method to investigate the influence of different isolation pile parameters on the control of tunnel’s deformation. However, their study treated foundation pits’ excavation as a simple unloading problem, failing to account for the influence of the underground continuous wall. The presence of the underground continuous wall restricts ground subsidence outside the pit and directly affects its distribution pattern, leading to unavoidable calculation errors in this method. Moreover, their analysis of isolation piles was based on an oversimplified Winkler elastic foundation beam model, which cannot consider soil shear characteristics or deformation continuity. Huang et al. [23] analyzed the control effect of isolation piles on surface subsidence based on Melan’s solution and Loganathan’s formula. However, their study was based on a plane strain problem, unable to consider the spatial arrangement of isolation piles or their shielding effect. Consequently, it could not analyze the influence of pile spacing. Since isolation piles are never installed as single piles in practice, the guidance provided by this method for field construction is limited.
To analyze the barrier role of isolation piles on surface subsidence, this study adopts a three-stage analytical approach. In the first stage, the Kerr model [24] is introduced to calculate the lateral deformation of the underground continuous wall caused by excavation. This model accounts for both soil shear characteristics and deformation continuity, while considering the influence of the underground continuous wall on isolation piles’ deformation. The second stage employs the boundary element method [25,26] combined with Mindlin’s solution [27] to compute the additional stresses near isolation piles resulting from excavation. The shielding effect of pile groups is incorporated in this analysis, and the lateral deformation of isolation piles is determined based on the Kerr model. The boundary element method is then reapplied to calculate the additional stresses induced by the pile displacement. Finally, the vertical displacement component of Mindlin’s solution is utilized to compute the surface subsidence behind the isolation piles.

2. Laboratory-Scale Experiment

2.1. Overview of the Referred to Project

This study is based on a metro station foundation pit project in Xiamen. The station has a total length of 360 m, with a standard section width of 19.9 m and an excavation depth of 15 m. The underground continuous wall was constructed using C35 reinforced concrete, with a thickness of 800 mm and a depth of 30 m. The model test was conducted under 1 g scaled conditions, which cannot fully satisfy all physical and mechanical similarity requirements. Considering the limitations of the laboratory environment, a similarity ratio of 1:50 was adopted. The purpose of this model test is to qualitatively investigate the controlling effect of isolation piles on surface subsidence induced by excavation, rather than to provide quantitative predictions for the actual project. Therefore, to simplify the experiment, only the dimensional similarity of the foundation pit and supporting structures was considered, while complete similarity of design for the soil was not implemented.

2.2. Test Chamber

The model box measures 3.6 m × 0.5 m × 1.1 m (length × width × height). The left, right and rear sides and bottom of the box consist of steel plates welded together to form a steel frame. The front side of the box is made of transparent acrylic sheet bonded to the steel frame with adhesive. Both front and rear sides are reinforced with four angle steels to prevent lateral deformation of the model box under soil pressure. During the design of the model box and the specific experimental setup, efforts should be made to minimize boundary effects as much as possible [28]. To reduce the influence of boundary effects, a full-scale model box was designed with increased dimensions. Additionally, before filling the box with soil and installing the underground continuous wall, a uniform layer of Vaseline was applied to the inner surfaces of the model box and the contact areas between the box and the underground continuous wall to mitigate boundary effects. Furthermore, the dimensions of the model box were designed to exceed the excavation depth of the foundation pit six times. In this experiment, a factor of eight times the excavation depth was adopted to ensure that the subsidence monitoring area outside the pit adequately met experimental requirements, thereby avoiding measurement errors caused by insufficient model box size.

2.3. Test Materials and Properties

Due to the small scale of the model tests and the millimeter-level magnitude of foundation pit deformations, the consistent use of International System of Units (SI) would be overly cumbersome. Therefore, this study does not strictly adhere to SI units in its presentations. The same approach applies to the subsequent sections and will not be reiterated.
The underground continuous walls were simulated with 4 mm thick transparent acrylic plates measuring 60 cm in depth and 50 cm in width (elastic modulus: 3.37 GPa), with two panels spaced 40 cm apart, while the isolation piles were modeled using 13 PVC pipes (diameter: 0.6 cm; length: 40 cm; elastic modulus: 2 GPa) spaced at 1.2 cm intervals (twice the diameter) with a 4 cm pile-to-wall distance, and internal supports consisted of six 40 cm long PVC columns (5 × 5 mm cross-section) and six 40 cm long PVC tubes (6 mm diameter). The soil tested was sand. Parameters of the soil were determined through a series of laboratory tests, including density tests, direct shear tests, consolidation tests, particle size distribution tests, relative density tests, and specific gravity tests, as summarized in Table 1.
Table 1 presents the fundamental parameters used in the theoretical calculations, including soil density, internal friction angle, compression modulus, cohesion, Poisson’s ratio, and other relevant properties.

2.4. Monitoring Equipment and Measurement Points

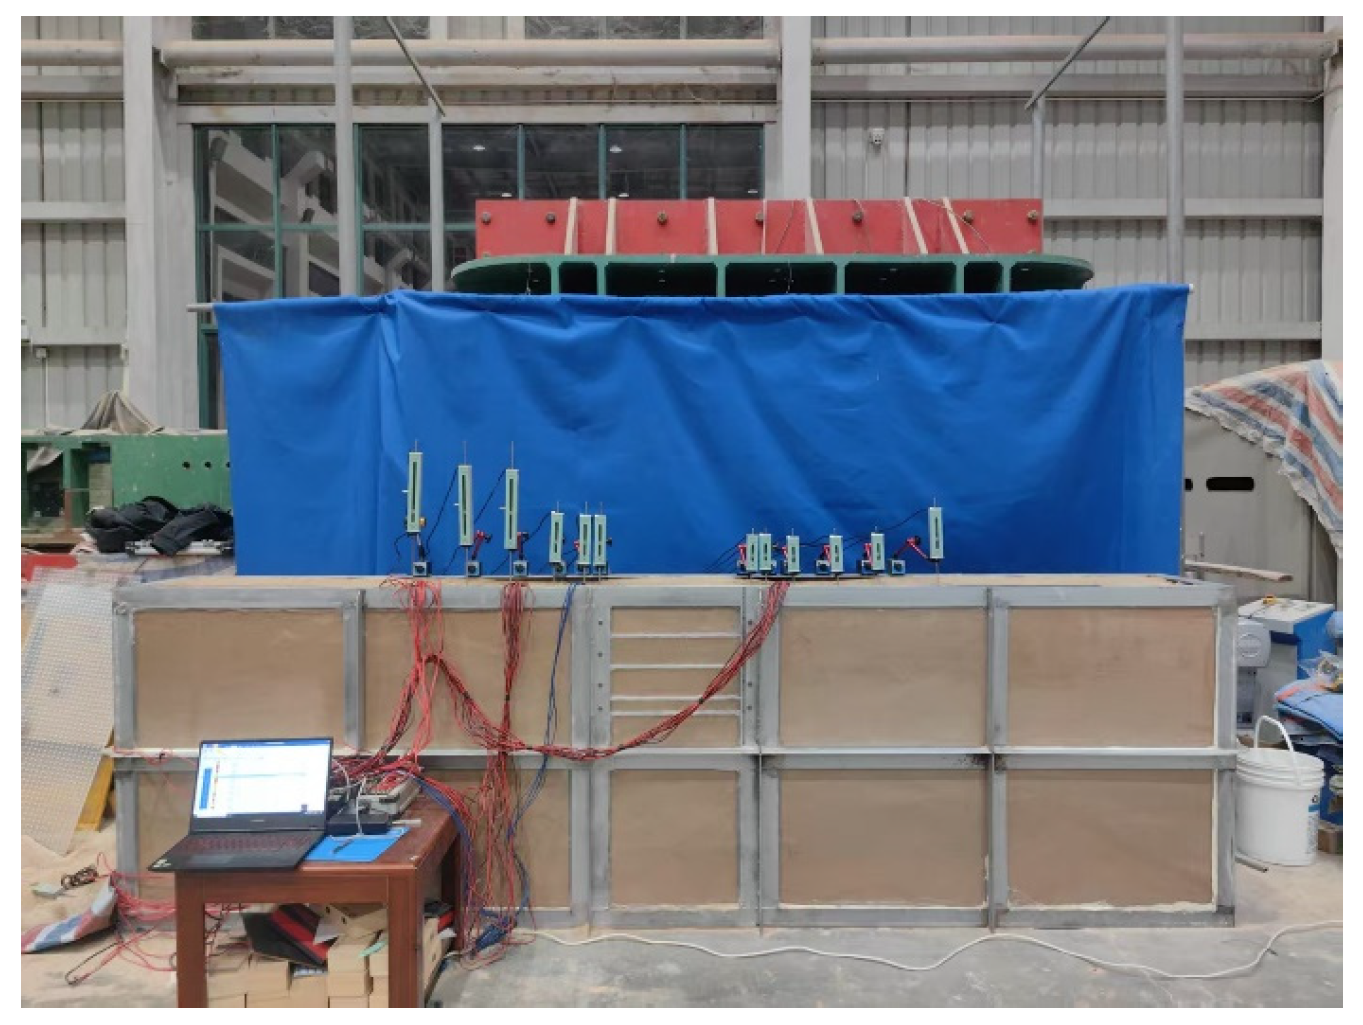
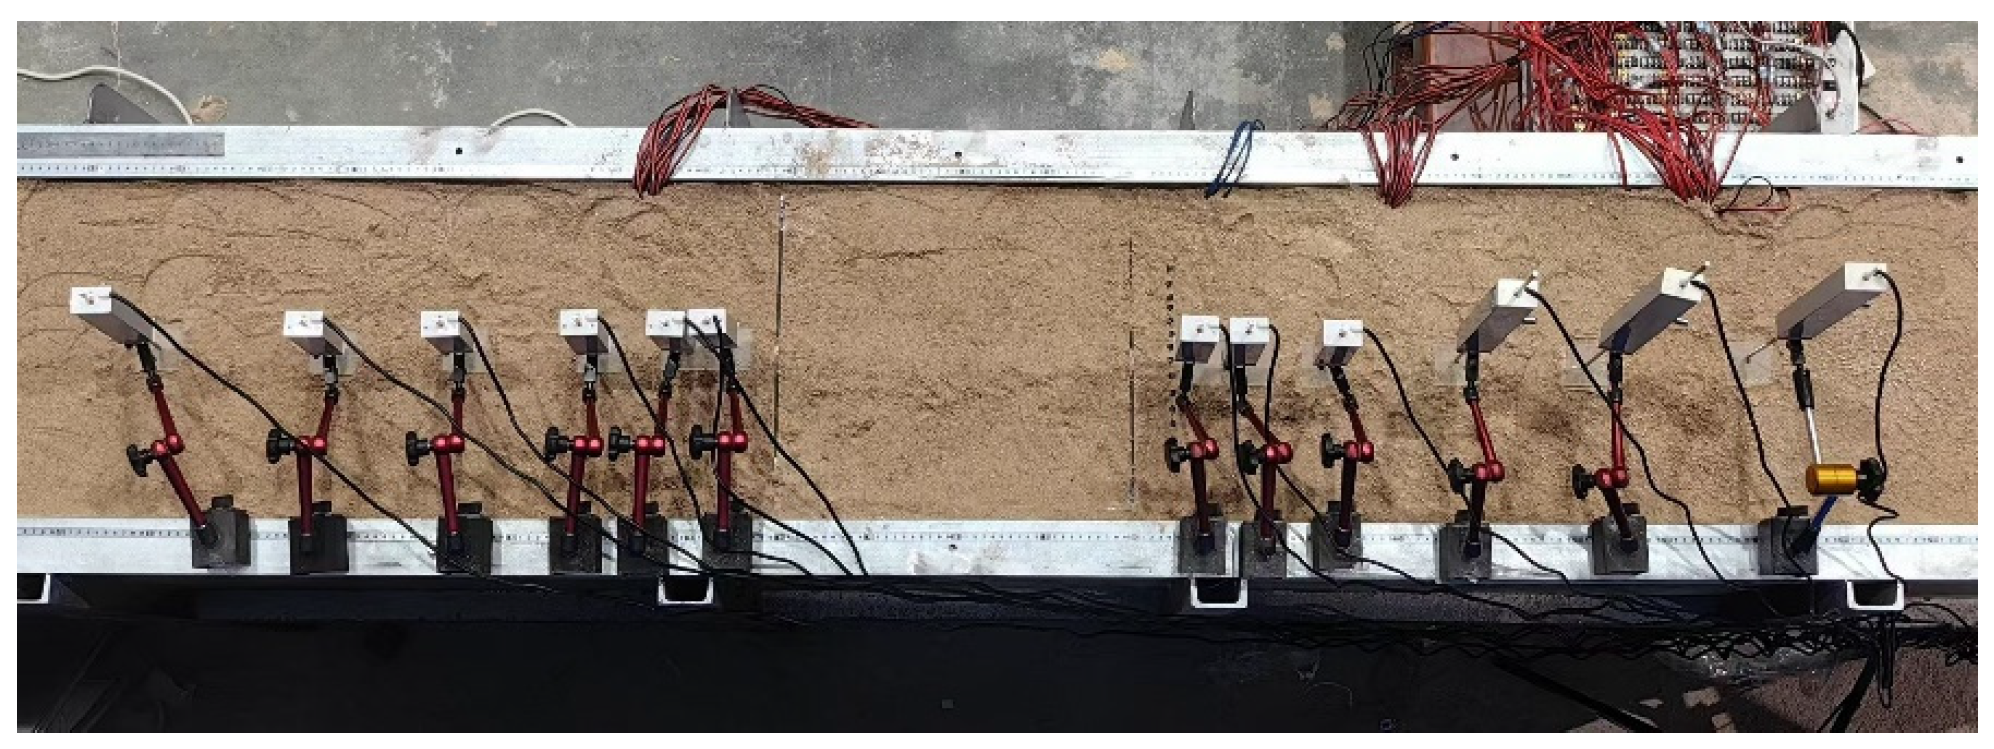
The monitoring system consisted of DH3816 data acquisition units, displacement meters, and strain gauges. Twelve displacement meters (six on each side, symmetrically arranged at 5 cm, 10 cm, 20 cm, 35 cm, 55 cm, and 80 cm from the underground continuous wall) measured surface subsidence. Thirty-eight strain gauges monitored lateral deformations of both underground continuous walls (14 gauges per wall, vertically spaced at 10 cm intervals along the central axis with bilateral symmetry) and isolation piles (10 gauges per pile group, vertically spaced at 10 cm intervals with bilateral symmetry). Detailed layouts are shown in Figure 1, Figure 2, Figure 3 and Figure 4.
Monitoring instruments must be strictly deployed according to the specific monitoring plan to ensure precise positioning. Additionally, all instruments should be calibrated before the start of the experiment to minimize testing errors.

2.5. Specific Test Plan and Test Cycle

The strain gauges were first attached to specified locations on the underground continuous walls and isolation piles and connected to the DH3816 data acquisition system. The model box was then filled with sand using the sand-raining method, with compaction performed after every 10 cm of filling. When the fill reached 48 cm depth, the underground continuous walls were installed at the predetermined central position with 40 cm spacing. Filling continued to 68 cm depth, where isolation piles were installed at a 1.2 cm spacing and 4 cm from the underground continuous walls. Subsequent filling proceeded to 105 cm depth for installation of the first internal support, followed by additional filling to 108 cm depth with final compaction, after which displacement meters were positioned at designated locations. Excavation was then conducted in four layers using small shovels: the first layer to 4 cm depth, the second layer to 9 cm depth with installation of the second internal support, the third layer to 9 cm depth with installation of the third internal support, and the fourth layer to 9 cm depth with installation of the fourth internal support. The complete test duration is detailed in Table 2.
The testing procedure was strictly carried out in accordance with the experimental timeline outlined in Table 2, ensuring that soil deformation reached a stable state at each phase. This approach effectively minimized measurement errors during the experiment.

3. Theoretical Calculation

3.1. Stage 1: Calculation of Underground Continuous Wall Lateral Deformation

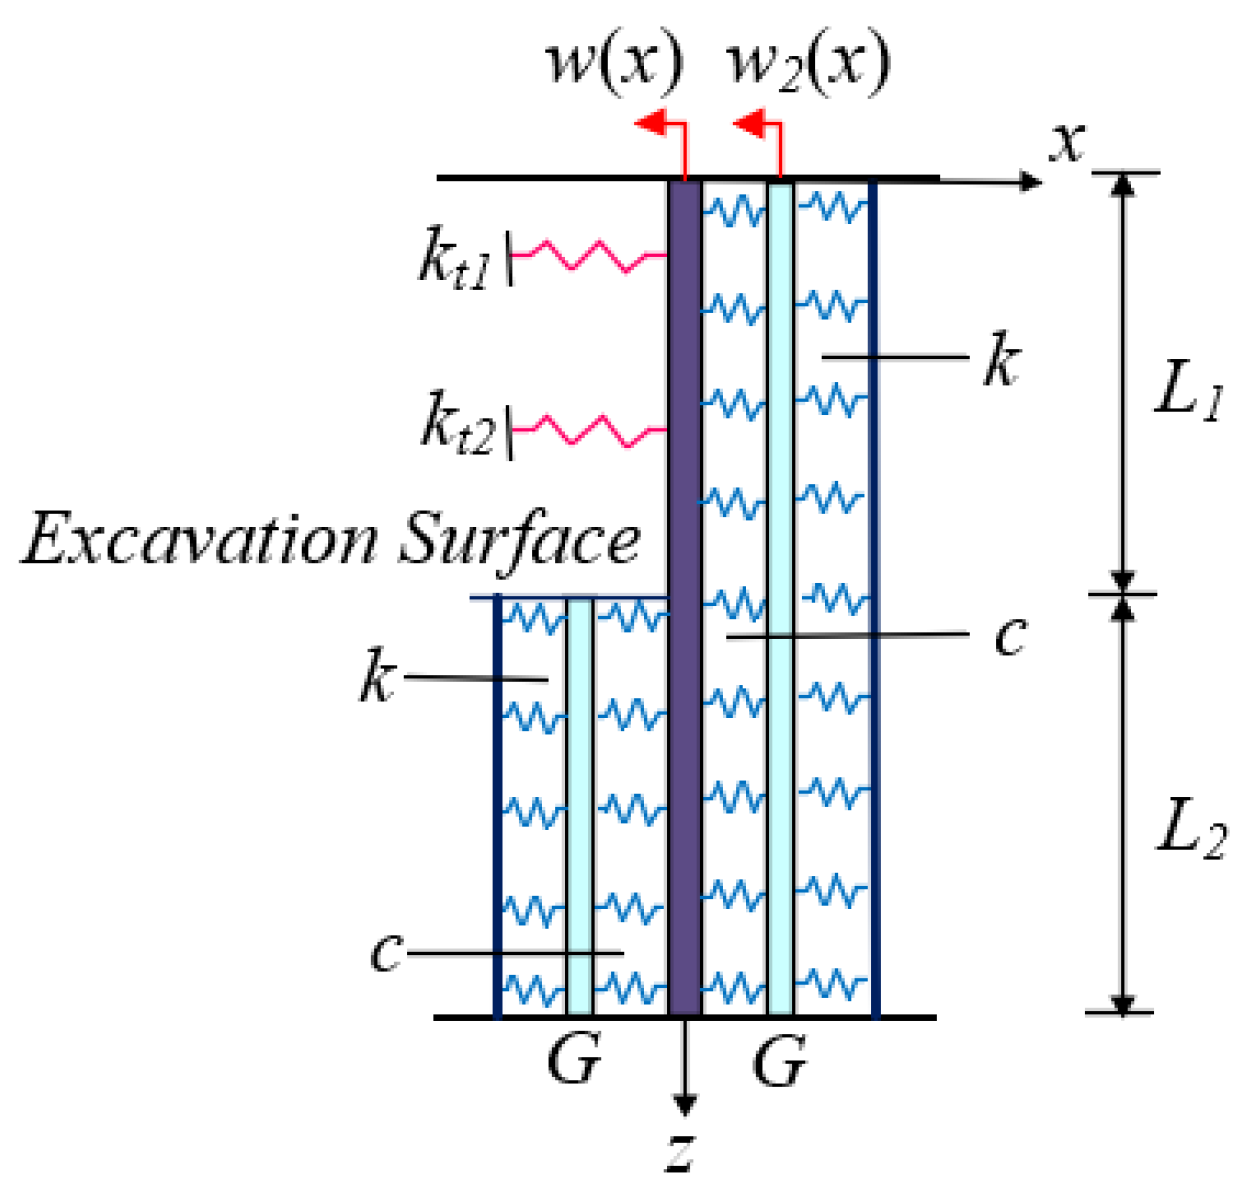
Figure 5 shows the schematic diagram for calculating lateral deformation of the underground continuous wall using the Kerr three-parameter foundation model. The depth above the excavation surface is denoted as L1, while the depth below the excavation surface is L2. The model parameters include: k (external subgrade reaction modulus), c (internal subgrade reaction modulus), and G (shear modulus of the shear layer). The blue line represents the subgrade reaction modulus of the soil, while the red line represents the elastic modulus of the internal support.
The deflection differential equation of the loaded segment:
E I G i c i d 6 w 2 d z 6 + E I c i + k i c i d 4 w 2 d z 4 G i d d 2 w 2 d z 2 P i k i w 2 d + k t i w 2 + k t i c i + k i c i w 2 = 0
The bending differential equation of the embedded segment:
E I G i c i d 6 w 2 d z 6 + E I c i + k i c i d 4 w 2 d z 4 2 G i d d 2 w 2 d z 2 + 2 k i w 2 d Δ P i d = 0
The parameter selection methodology and calculation process can be referenced in the authors’ previous publication [25].

3.2. Stage 2: Calculation of Isolation Pile Lateral Deformation Considering Boundary Element Method and Shielding Effect

3.2.1. Calculation of Additional Stress at Excavation Boundary

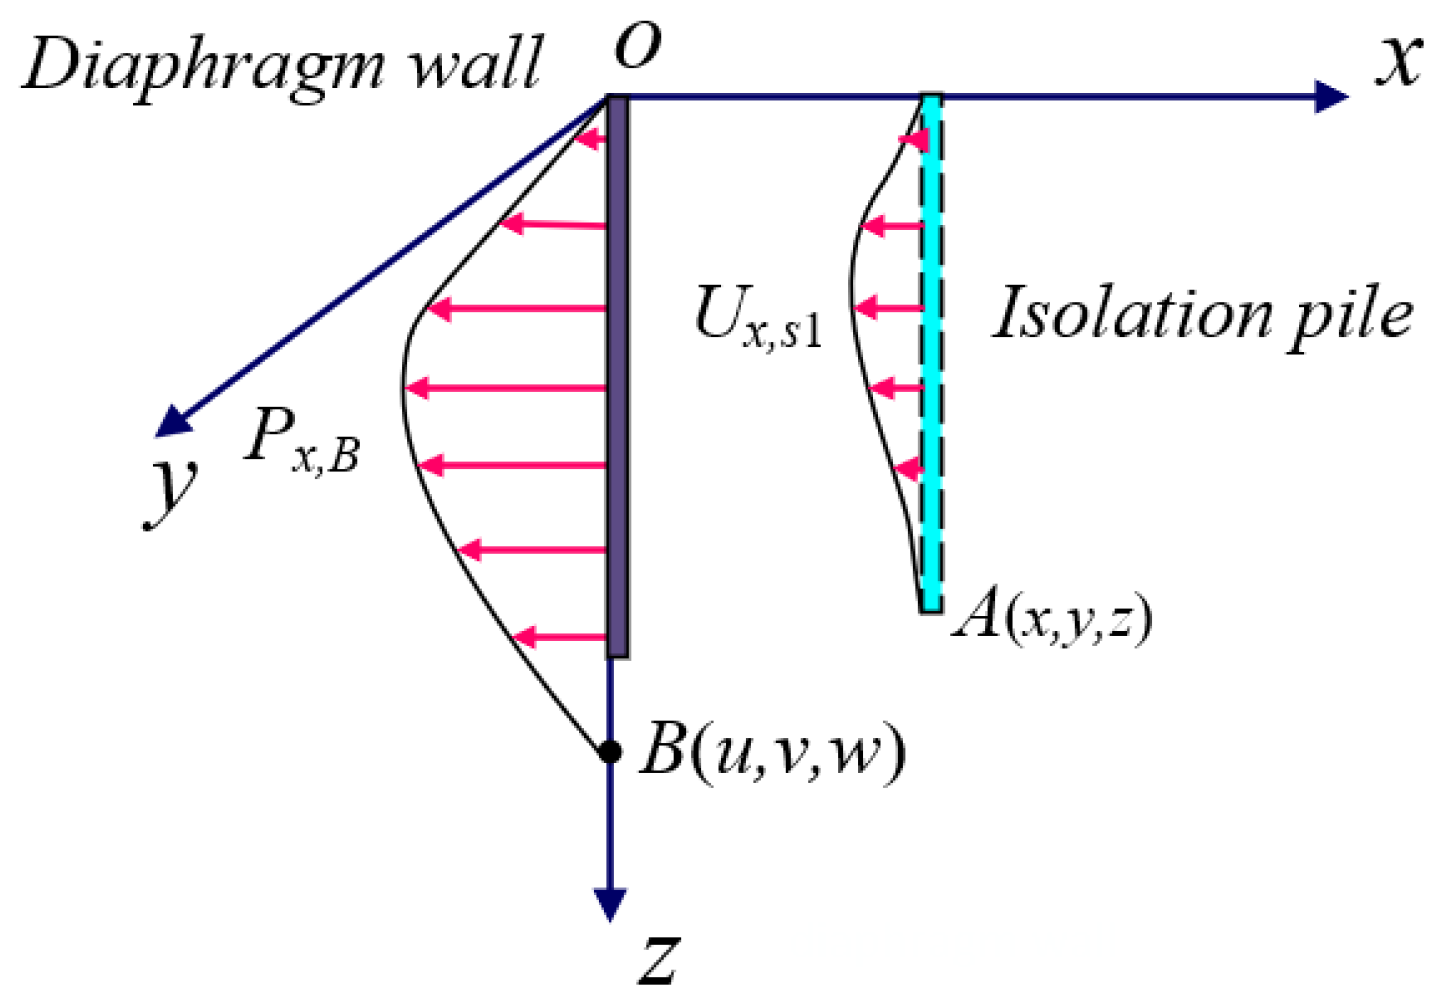
The boundary element method was employed to solve the free-field lateral deformation of soil caused by excavation. According to the fundamental principles of this method, when virtual forces act on the excavation boundary, they induce corresponding virtual stress and displacement fields in the surrounding soil. When the virtual displacement field satisfies the actual boundary conditions of the excavation, these virtual fields can be considered to represent the boundary effects induced by the excavation. Mindlin [27] provided displacement solutions for arbitrary positions under horizontal concentrated loads in an elastic half-space. The computational model is illustrated in Figure 6.
The lateral deformation Ux,A at point A induced by a horizontal concentrated force Px,B applied at point B in the semi-infinite space can be expressed as Equation (3):
U x , A = K x P x , B
K x = 1 16 π G 1 v d 3 4 v d R 1 + 1 R 2 + X 2 R 1 3 + 3 4 v d X 2 R 2 3 + 2 w z R 2 3 1 3 X 2 R 2 3 + 4 1 v d 1 2 v d R 2 + Z 2 1 X 2 R 2 R 2 + Z 2
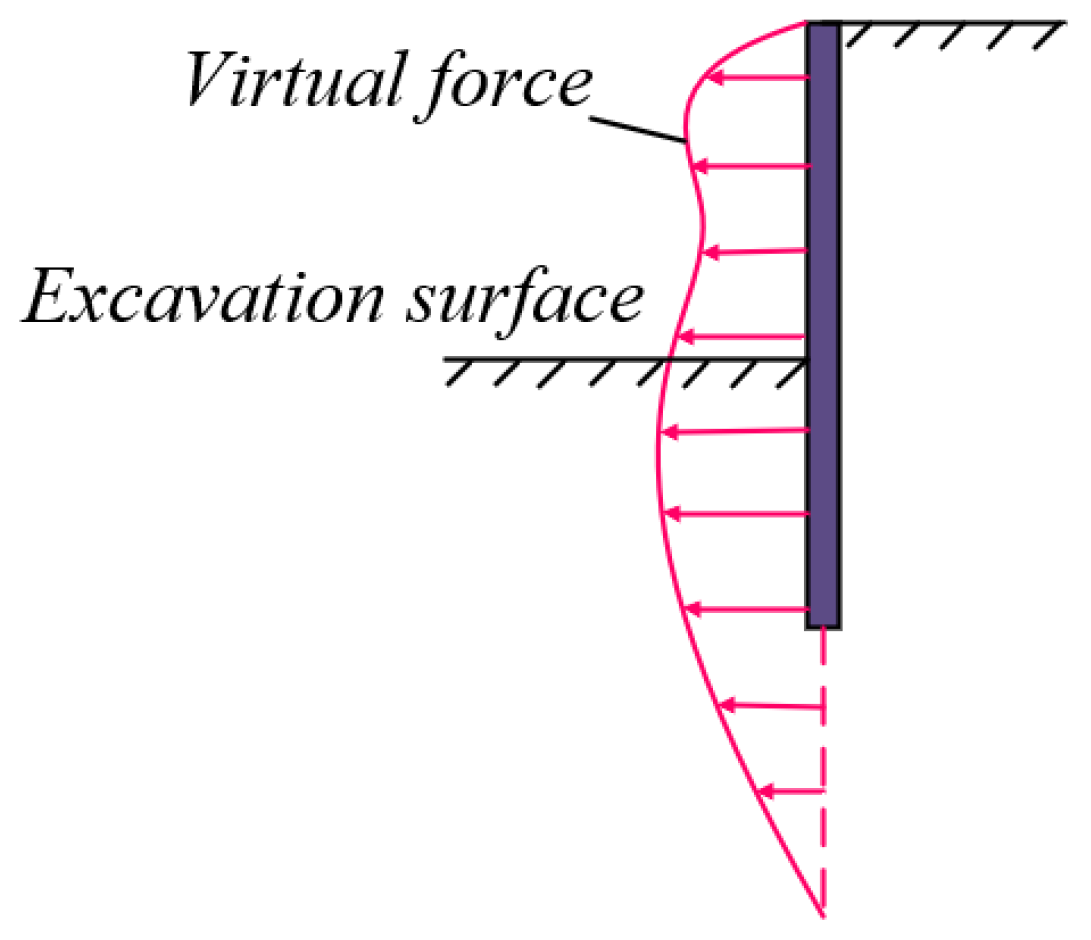
Assume that a certain virtual force is applied along the boundary of the foundation pit’s supporting structure. This virtual force refers to the force generated near the underground continuous wall corresponding to its lateral deformation caused by excavation. When using the boundary element method to solve for the free-field lateral deformation of the soil induced by excavation, according to the fundamental principles of the method, the virtual force acting on the pit boundary will induce corresponding virtual stress and displacement fields in the surrounding soil. When the boundary conditions of the virtual displacement field (i.e., the lateral deformation of the underground continuous wall) match the actual displacement boundary conditions of the foundation pit, the virtual displacement and stress fields generated by the virtual force can be considered to represent the boundary effects induced by the excavation. The virtual force is illustrated in Figure 7; the following boundary integral equation can be established by integrating Equation (3) along this boundary:
U x , A = L K x P x , B d L
U x , A = i = 1 m P x , B , i L i K x , i d L i
where L denotes the excavation boundary, and Px,B represents the virtual force acting at point B on boundary L.
The following matrix expression can be derived from Equation (6):
U x , A , 1 U x , A , j U x , A , m = G 11 G 1 j G 1 m G j 1 G j j G j m G m 1 G m j G m m P x , B , 1 P x , B , j P x , B , m
where G j i = L i K x , i d L i .
Equation (7) can be rewritten in simplified form as
P x , B = G 1 U x , A
Both the matrix G and the actual boundary conditions Ux,A are known quantities, enabling the calculation of the virtual horizontal additional stresses Px,B acting on the excavation boundary.

3.2.2. Calculation of Lateral Deformation and Additional Stress in Soil near Isolation Piles

The lateral deformation of free-field soil near isolation piles (Figure 8) was obtained by integrating Equation (9) along the load depth using the calculated horizontal additional stresses at the excavation boundary.
U x , s 1 = K x P x , B d w
where Px,B represents the additional stress at the underground continuous wall location induced by the wall’s lateral deformation, and Ux,s1 denotes the free-field soil lateral deformation at the isolation pile location caused by excavation without considering the presence of isolation piles.
The lateral deformation Ux,s1 near the isolation piles is converted into horizontal additional stress Px,s1 for subsequent calculation of the piles’ lateral deformation.
P x , s 1 = k U x , s 1 G U x , s 1

3.2.3. Calculation of Single Isolation Pile’s Lateral Deformation Under Additional Stress

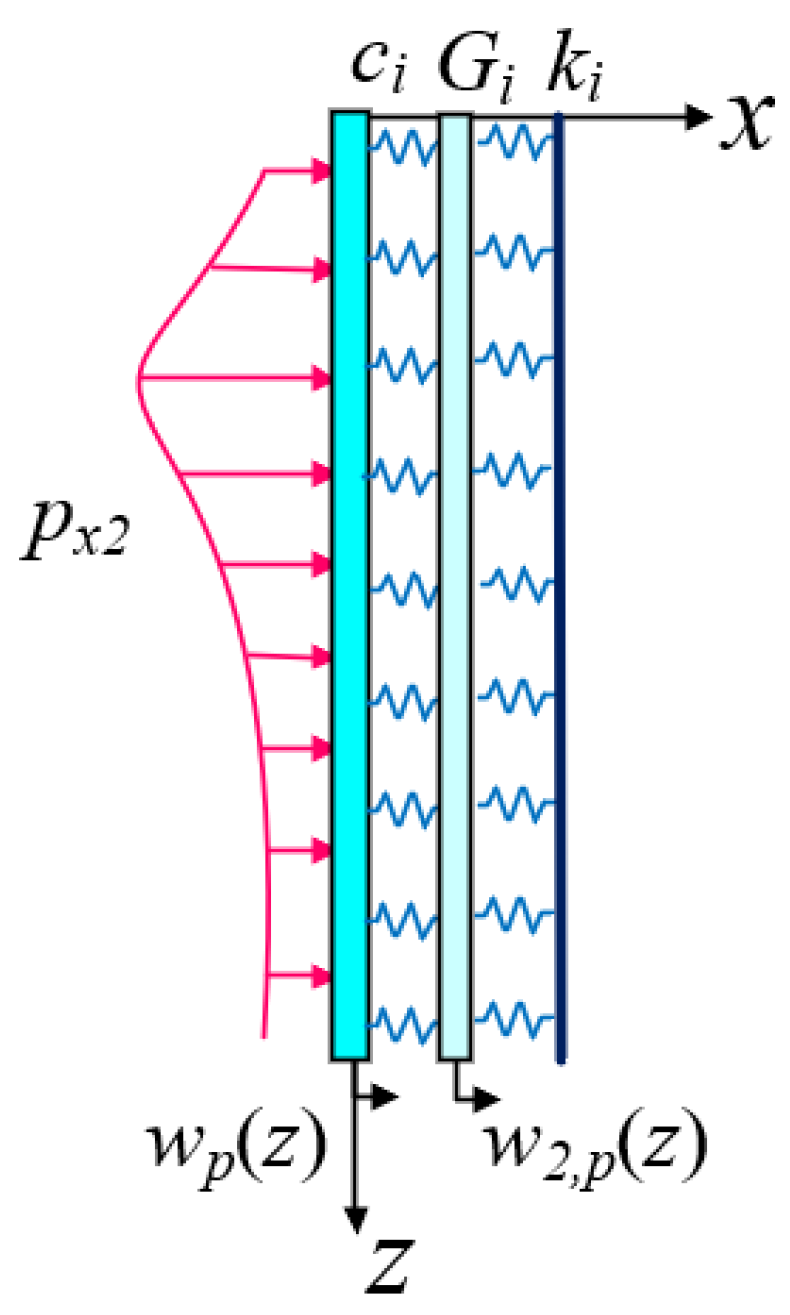
Figure 9 shows the pile-–oil interaction model based on the Kerr foundation. The pile is modeled as a vertical circular cross-section Euler–Bernoulli beam with diameter dp and stiffness EpIp. The differential equation for determining the lateral deformation w2,p of the isolation pile is established.
E p I p G i d p c i d 6 w 2 , p d z 6 + E p I p c i + k i d c i d 4 w 2 , p d z 4 G i d 2 w 2 , p d z 2 k w 2 , p = P x , s 1
where Px,s1 denotes the additional stress acting on the pile foundation, and dp and EpIp represent the radius and flexural rigidity of the isolation pile’s circular cross-section, respectively. Other parameters maintain the same definitions as in Equations (1) and (2).
Equation (11) can be transformed using the finite difference method as follows:
A ( w 2 , p ) i 3 + B ( w 2 , p ) i 2 + C ( w 2 , p ) i 1 + D ( w 2 , p ) i + C ( w 2 , p ) i + 1 + B ( w 2 , p ) i + 2 + A ( w 2 , p ) i + 3 = p x , s 1 , i
where i = 0, 1, …, n; A, B, C, and D are all simplified coefficients from Equation (11); (w2,p)i is the displacement of the foundation shear layer at the i-th node of the isolation pile; and px,s1,i is the additional stress at the i-th node of the isolation pile induced by the lateral deformation of the underground continuous wall. Based on the finite difference characteristics, it follows that
A B C D = 1 0 0 0 6 1 0 0 15 4 1 0 20 6 2 1 × E p I p G i d p c i l 6 E p I p ( c i + k i ) d p c i l 4 G i l 2 k i
where l is the length of the finite difference nodal element, L is the length of the isolation pile, and l = L/n. The isolation pile is discretized into n + 7 nodal elements (including 6 virtual elements at both ends). The pile deflection, rotation angle, bending moment, and shear force refer to the literature [29].
Based on the boundary conditions, by eliminating the virtual nodes, the displacement equation of the shear layer is obtained:
w 2 , p = K 1 P x , s 1
w 2 , p = w 2 , p 0 , w 2 , p 1 , , w 2 , p n T
p x 1 = p x , s 1 0 , p x , s 1 1 , , p x , s 1 n T
The horizontal stiffness matrix of the soil is
K = D + 2 C + 4 B 8 A 4 B 10 A 2 B + 2 A 2 A C + 2 B + 6 A D B 2 A C A B A B 2 A C A D C B A A B C D C B A A B C D C B A A B C D C B A B C D C A A B C + A D + B + 8 A
The lateral deformation of the isolation pile’s shear layer is calculated using Equation (14), followed by determining the isolation pile’s lateral deformation through Equation (18):
w p = 1 + k i c i w 2 , p G i c i d 2 w 2 , p d x 2

3.2.4. Lateral Deformation Calculation of Isolation Pile Groups Considering Shielding Effects

In the analysis of horizontally loaded pile groups, the phenomenon where soil displacement is constrained by the piles due to their significantly higher stiffness compared to the surrounding soil is referred to as the “shielding effect” of passive piles in pile groups. This shielding effect represents a stress redistribution mechanism, whereby pile–soil–pile interactions collectively reduce the deformation and loading on individual piles. For pile group foundations, the actual displacement of a single pile equals the algebraic sum of its isolated pile displacement and the group shielding displacement, where the shielding displacement acts in the opposite direction to the free-field single pile displacement. The shielding effect of pile groups is analyzed using the finite difference method and Mindlin’s solution.
The analysis begins by examining the pile-to-pile interaction through a two-pile model, which is subsequently extended to the entire pile group. A simplified model of adjacent pile groups is illustrated in Figure 10. The lateral deformation wp of Isolation Pile 1 is calculated using Equation (18), while the free-field soil displacement Ux,s1 near Isolation Pile 1 is determined through Equation (9). Consequently, the shielding displacement Δ U x , p 1 generated at Pile 1 can be expressed as
Δ U x , p 1 = U x , s 1 w p
As shown in Figure 10, due to pile–soil-pile–interactions, the shielding displacement of Isolation Pile 1 generates shielding stress at Isolation Pile 2, thereby restraining its displacement. The analysis first calculates the shielding stress Px,p1 of Isolation Pile 1, then determines the free-field soil displacement Ux,s2 at Isolation Pile 2 under the influence of this shielding stress.
P x , p 1 = k Δ U x , p 1 G Δ U x , p 1
Δ U x , s 2 = K x P x , p 1
The free-field soil displacement Ux,s2 at Isolation Pile 2 is then converted into shielding stress Px,s2 and applied to Isolation Pile 2. The deflection differential equation of Isolation Pile 2 is established to calculate its lateral deformation wp2 under the shielding stress condition generated by Isolation Pile 1.
E p I p G i d p c i d 6 w 2 , p 2 d z 6 + E p I p c i + k i d c i d 4 w 2 , p 2 d z 4 G i d 2 w 2 , p 2 d z 2 k w 2 , p 2 = P x , s 2
w p 2 = 1 + k i c i w 2 , p 2 G i c i d 2 w 2 , p 2 d x 2
Finally, through the principle of superposition, the final lateral deformation wpi of isolation pile i under the shielding effects of piles 1, 2, …, n is calculated.
w p i = w p w p 1 w p i 1

3.3. Stage 3: Calculation of Ground Subsidence Behind Piles Induced by Excavation Considering Isolation Piles

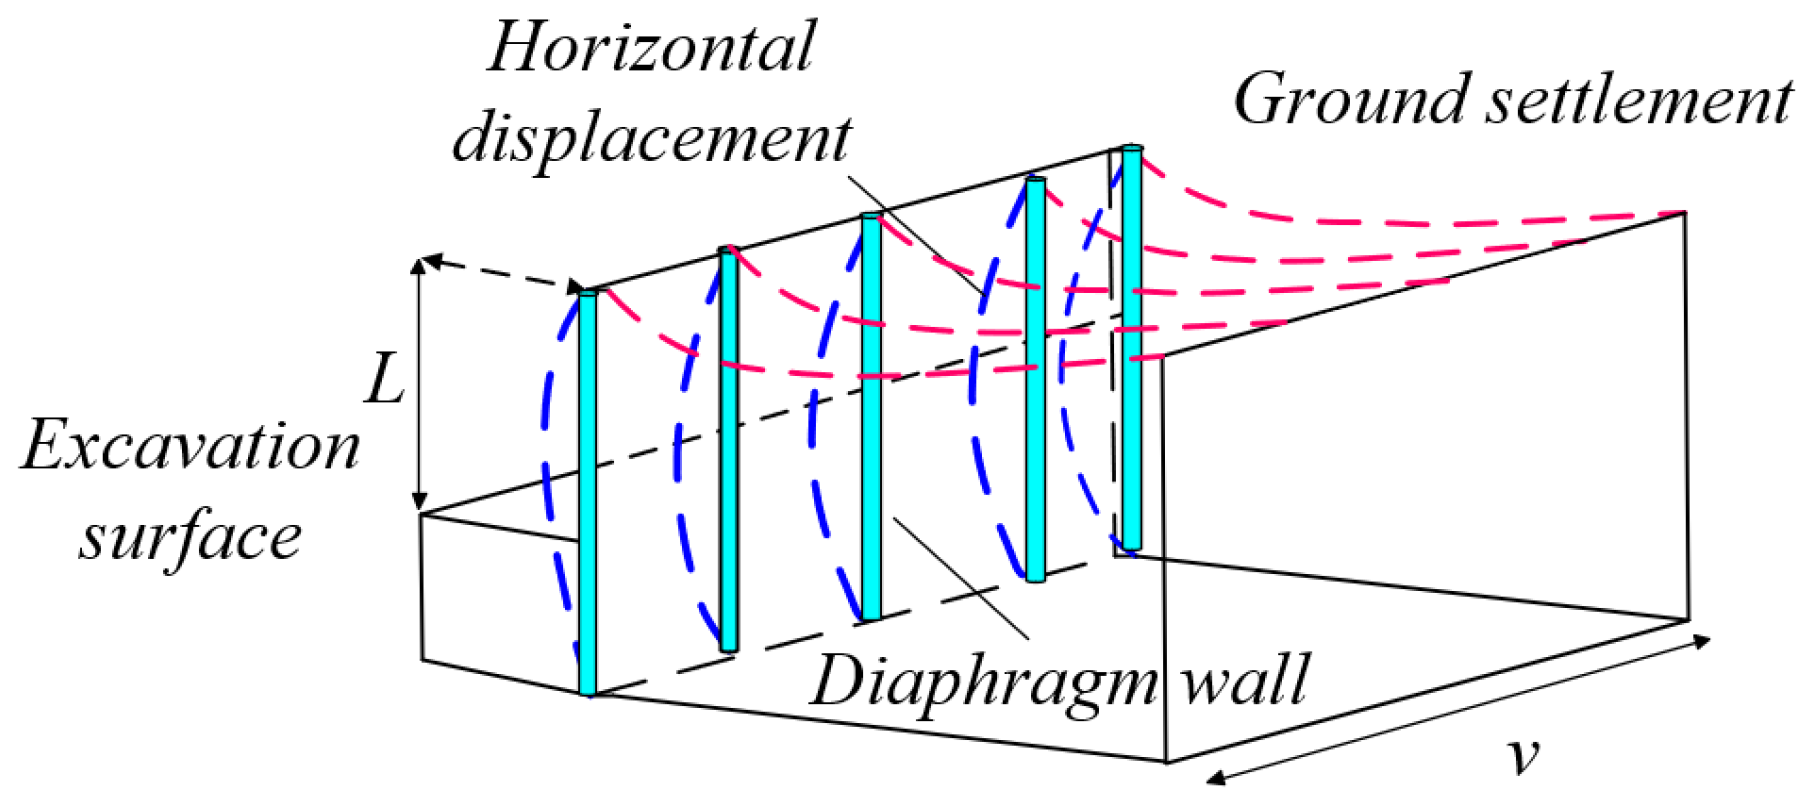
The boundary element method is employed to inversely analyze the additional stress Px,p induced by lateral deformation of isolation piles (see Equations (5)–(8)), following the same methodology used for analyzing the underground continuous wall’s additional stress (details omitted). Subsequently, Mindlin’s vertical displacement solution (Equation (25)) is applied through superposition to calculate the ground surface subsidence behind the isolation pile group caused by their lateral deformation. The computational model for ground subsidence behind isolation piles is illustrated in Figure 11.
As shown in Figure 11, the surface subsidence at each location results from the superposition of subsidences induced by the lateral deformations of all isolation piles. During the calculation process, it is necessary to compute the additional stress generated by the lateral deformation of each individual isolation pile. These stresses are then integrated using Mindlin’s solution to determine the total surface subsidence.
w z = P x , p X 16 π G 1 v d Z 1 R 1 3 + 3 4 v d Z 1 R 2 3 6 w z Z 2 R 2 5 + 4 1 v d 1 2 v d R 2 R 2 + Z 2
Equation (25) represents Mindlin’s solution for vertical displacement. After inversely deriving the lateral deformation of the isolation piles using the boundary element method, the result is substituted into Equation (25) to calculate the surface subsidence behind the piles.

4. Analysis of Test Results

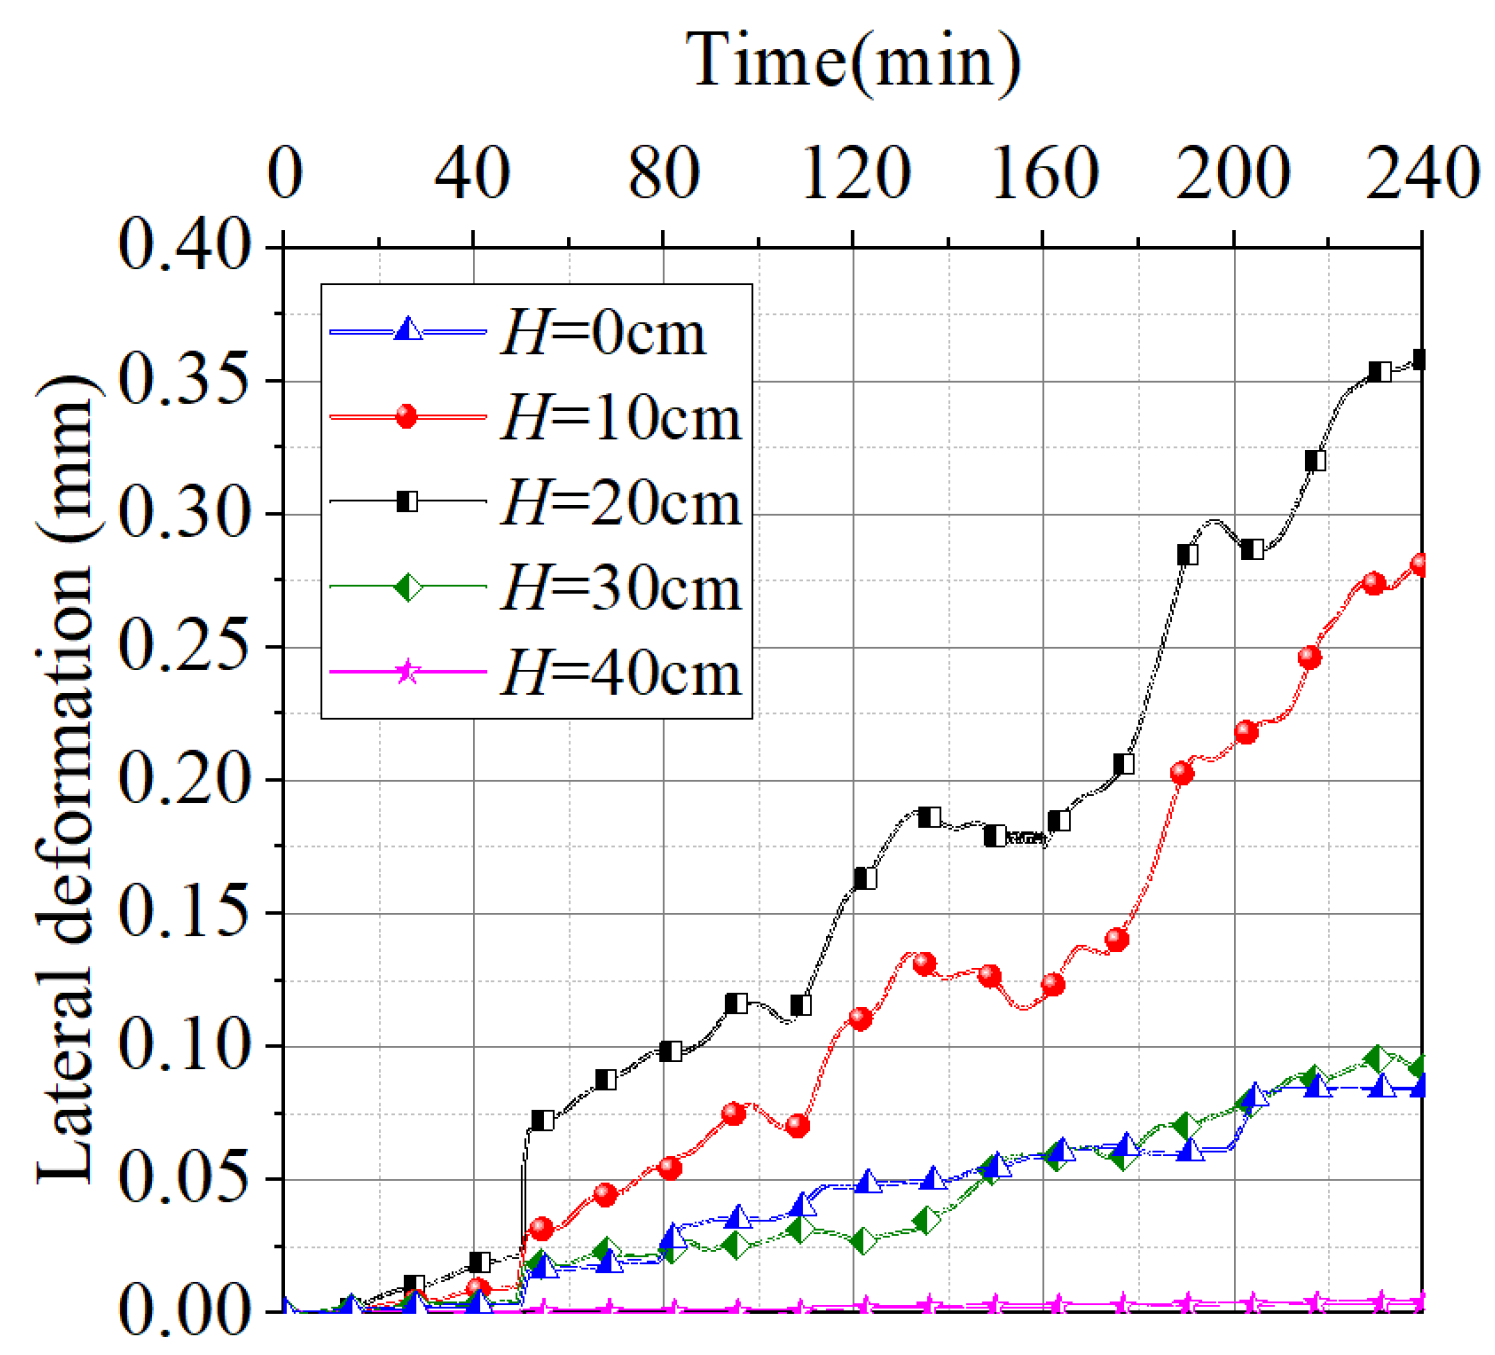
As shown in Figure 12, the deformation of isolation piles gradually increases with test duration. During the first excavation layer (4 cm depth), the pile’s lateral deformation remains minimal. With each subsequent excavation layer, the lateral deformation progressively increases, reaching its maximum at 20 cm depth while maintaining near-constant displacement at the pile tip.
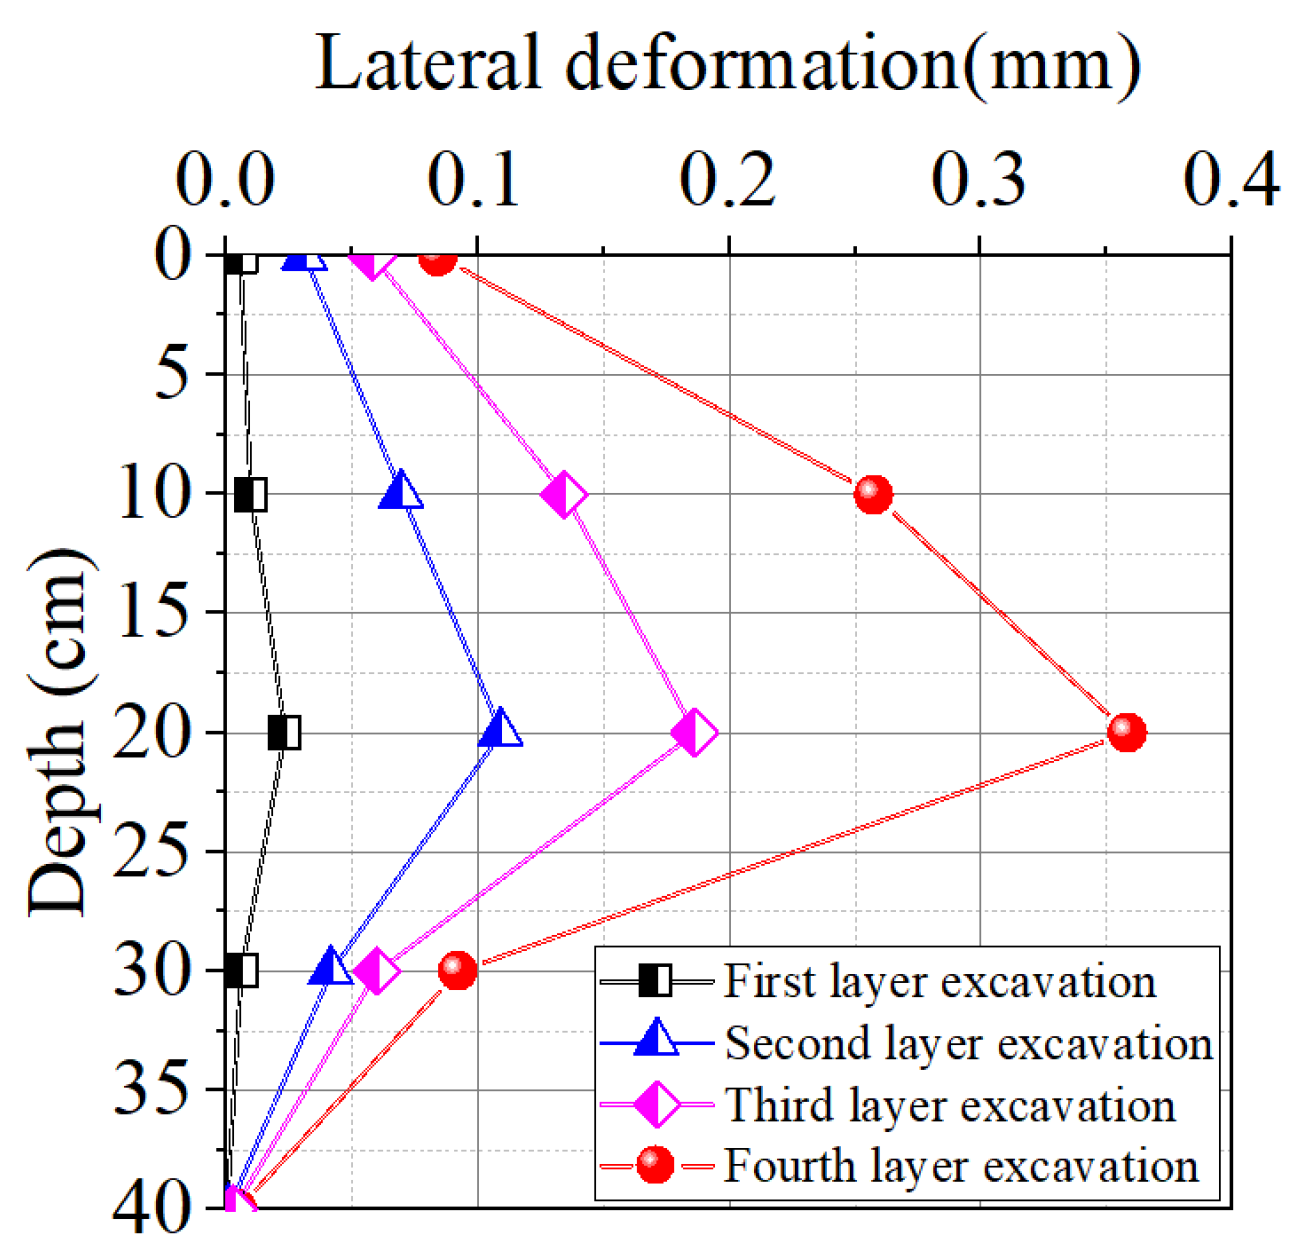
As illustrated in Figure 13, the maximum lateral deformations of the isolation piles corresponding to the excavation of the first, second, third, and fourth layers are 0.024 mm, 0.109 mm, 0.186 mm, and 0.358 mm, respectively. When scaled to real-world engineering conditions based on the similarity ratio, these values translate to 1.2 mm, 5.45 mm, 9.3 mm, and 17.9 mm, respectively. These displacements account for 6.7%, 30.4%, 52%, and 100% of the final lateral deformation, respectively. The maximum lateral deformation occurs at the 20 cm depth of the isolation piles, followed by the 10 cm depth, while the minimum displacement is observed at the piles’ bottom.
In Figure 14, a comparison is made between the lateral deformations of the underground continuous wall with and without isolation piles. The maximum lateral deformation of the underground continuous wall with isolation piles is 0.436 mm, while it is 0.472 mm without isolation piles. The presence of isolation piles reduces the lateral deformation of the underground continuous wall by 0.036 mm. When scaled to the actual project according to the similarity ratio, this reduction corresponds to 1.8 mm, accounting for 7.6% of the maximum lateral deformation without isolation piles. This indicates that isolation piles have a certain controlling effect on the lateral deformation of the underground continuous wall, but the impact is not significant. The presence of isolation piles does not alter the distribution pattern of the underground continuous wall’s lateral deformation, which follows a “bulging” shape.
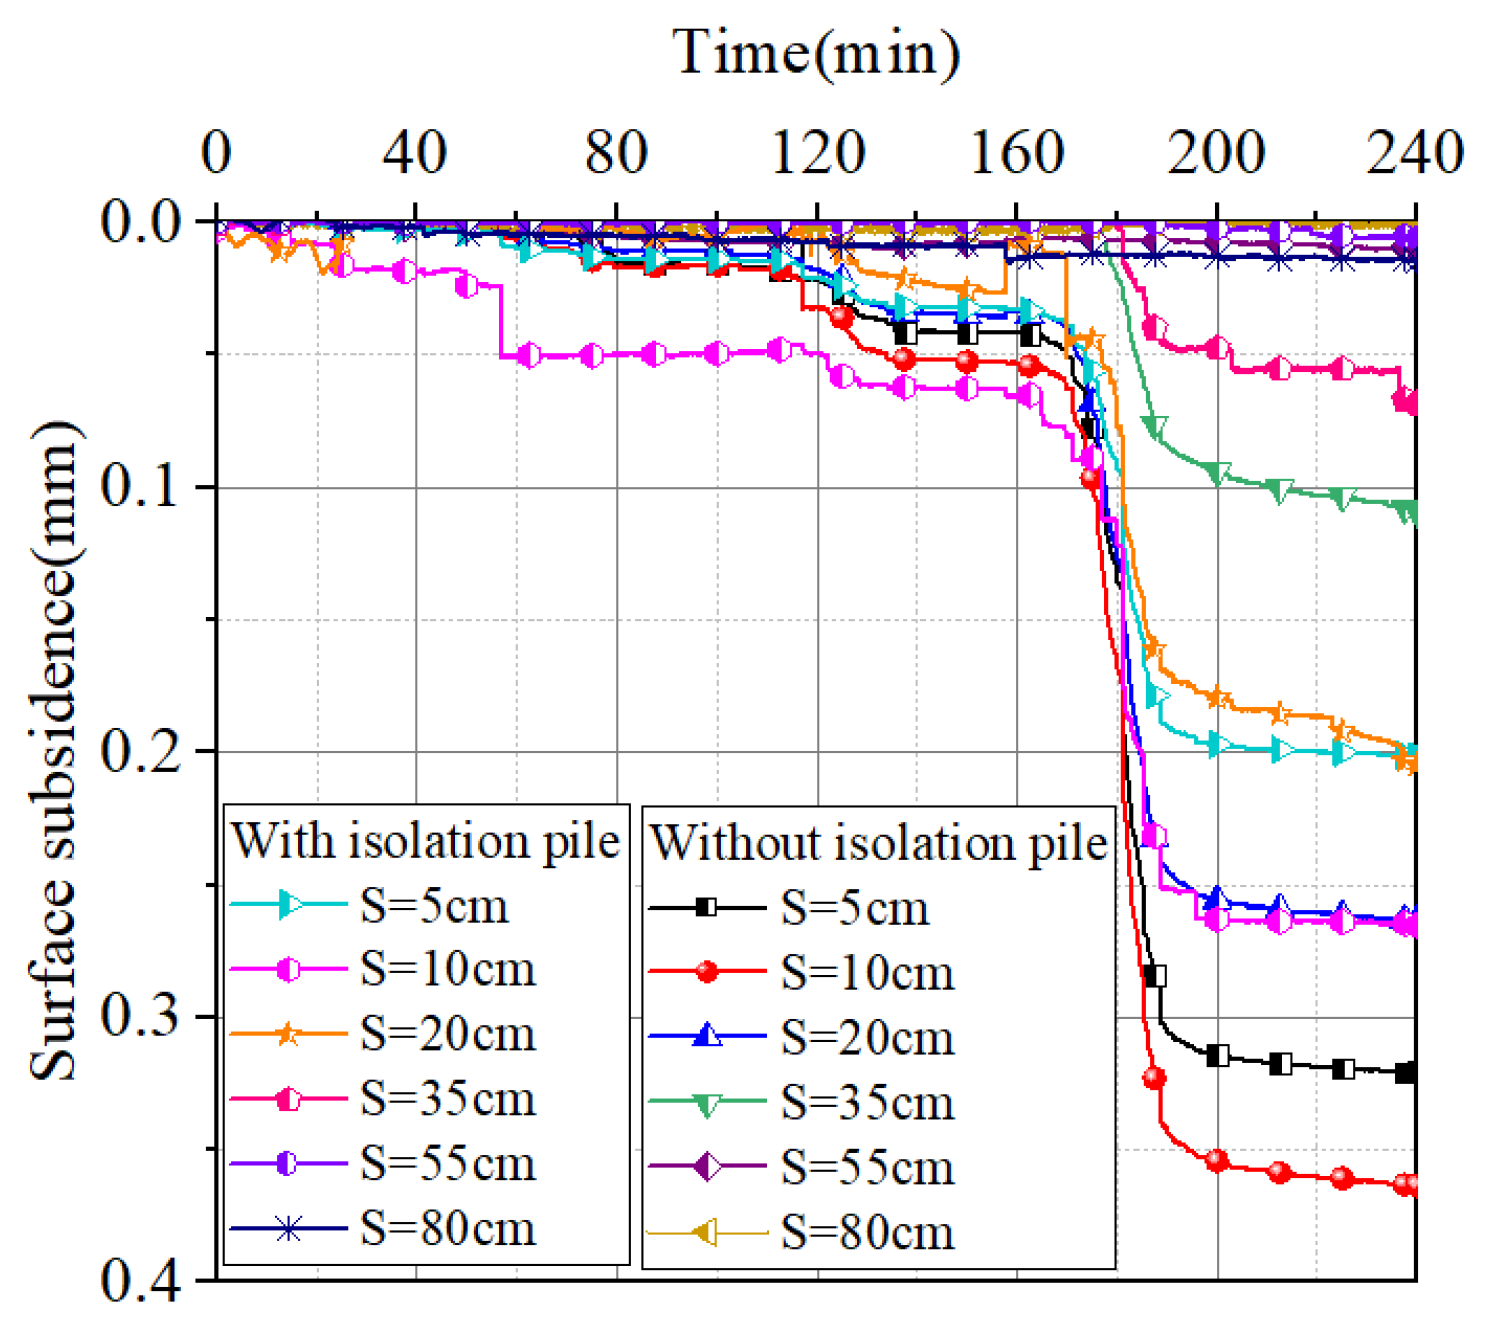
In Figure 15, the temporal variation in ground surface subsidence is presented. The ground subsidence progressively increases with ongoing excavation, where each excavation stage causes an immediate subsidence increase followed by stabilization. At identical distances from the underground continuous wall, subsidences with isolation piles are significantly smaller than those without, demonstrating their substantial effectiveness in subsidence control.
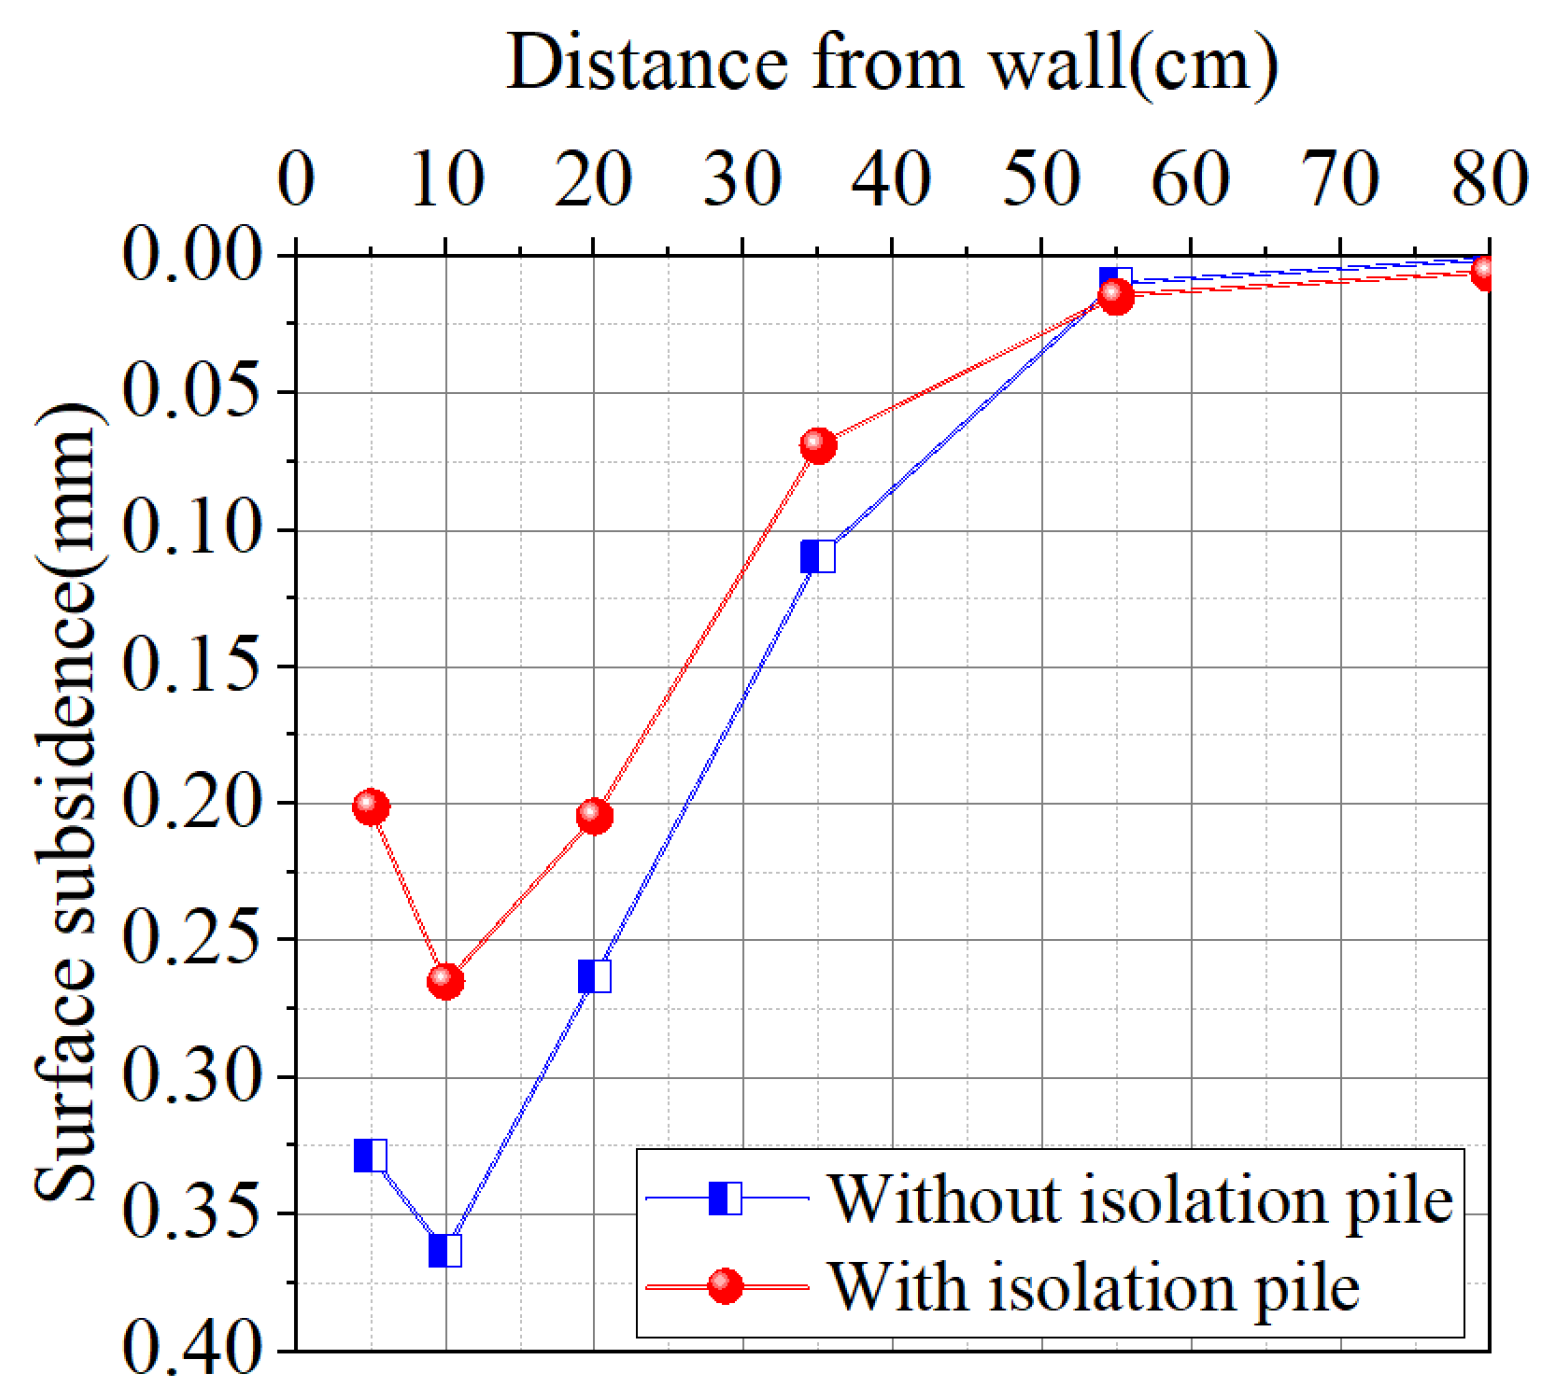
In Figure 16, the spatial distribution of surface subsidence is illustrated. The surface subsidence with isolation piles is significantly smaller than that without isolation piles. The maximum surface subsidence with isolation piles is 0.265 mm, compared to 0.364 mm without isolation piles, resulting in a reduction of 0.099 mm. When scaled to real-world engineering conditions based on the similarity ratio, this reduction corresponds to 4.95 mm—a considerable decrease in subsidence. This reduction accounts for 27.2% of the maximum surface subsidence observed without isolation piles, demonstrating the notable effectiveness of isolation piles in controlling surface subsidence.

5. Theoretical Verification and Isolation Pile Parameter Analysis

5.1. Theoretical Verification

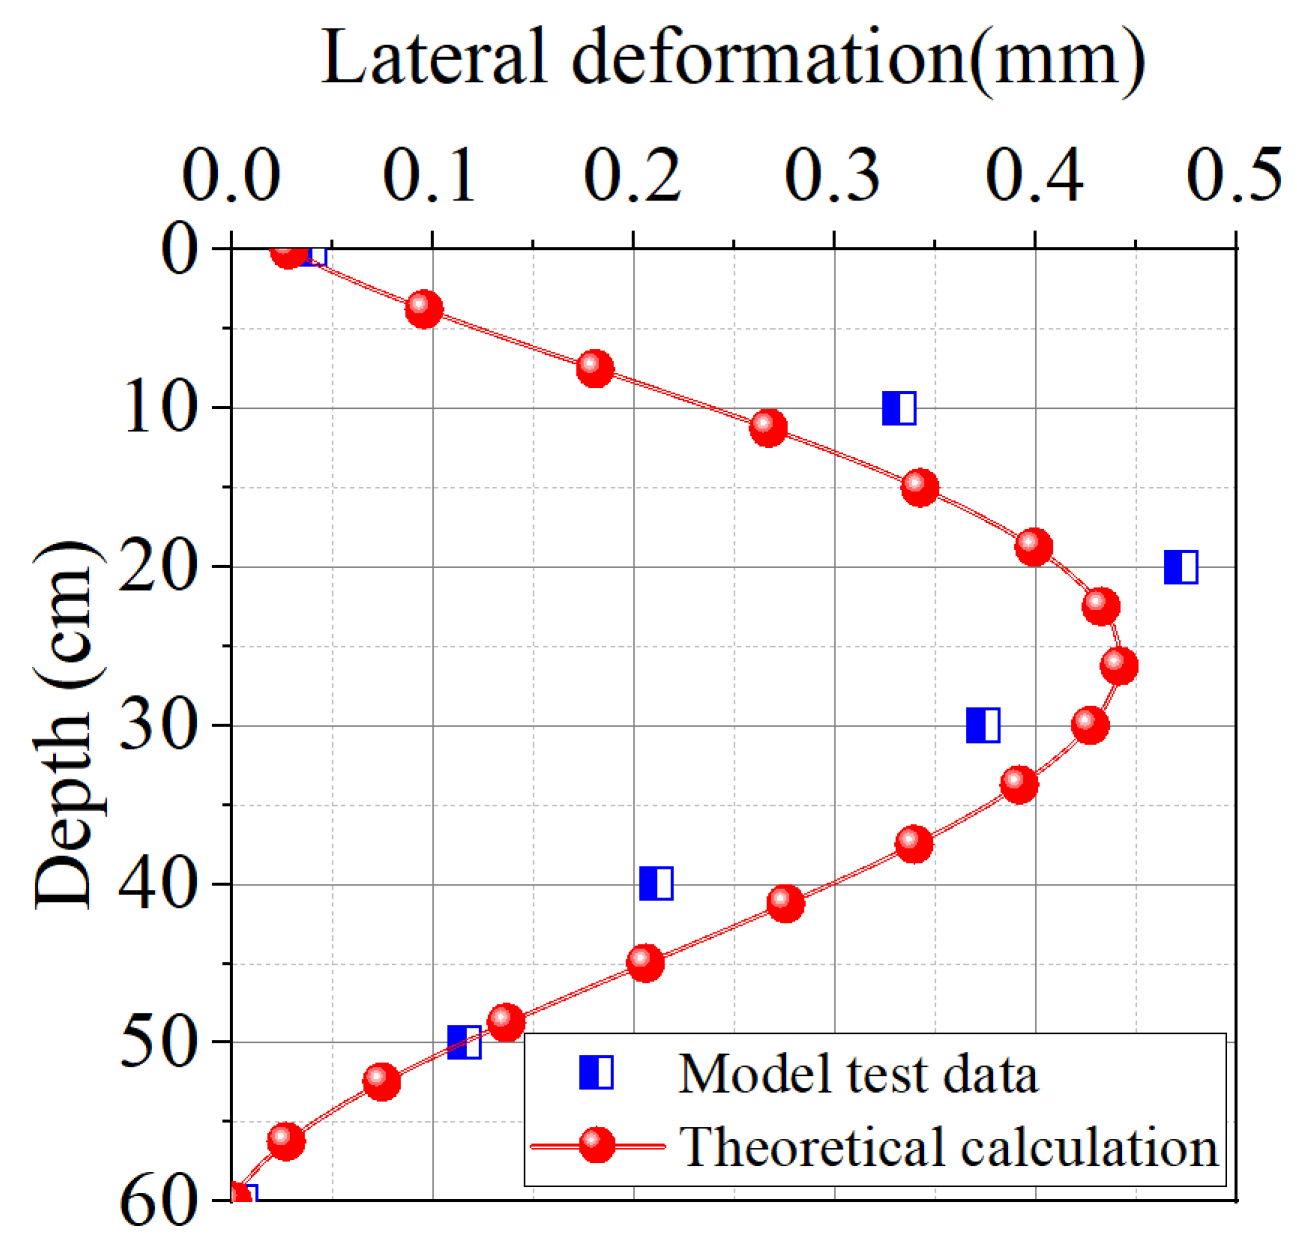
The laboratory-scale experiment results were validated using the proposed theoretical method. Figure 17 compares the theoretical calculations and experimental measurements of the underground continuous wall’s lateral deformation. The theoretical results show good agreement with experimental data, with maximum lateral deformations of 0.441 mm and 0.472 mm, respectively—a difference of 0.031 mm (6.6% error). Although the theoretical model predicts the maximum displacement at a greater depth than measured, this discrepancy may arise from possible unmonitored critical locations, and the margin of error remains within acceptable limits, confirming the validity of the proposed theoretical approach.
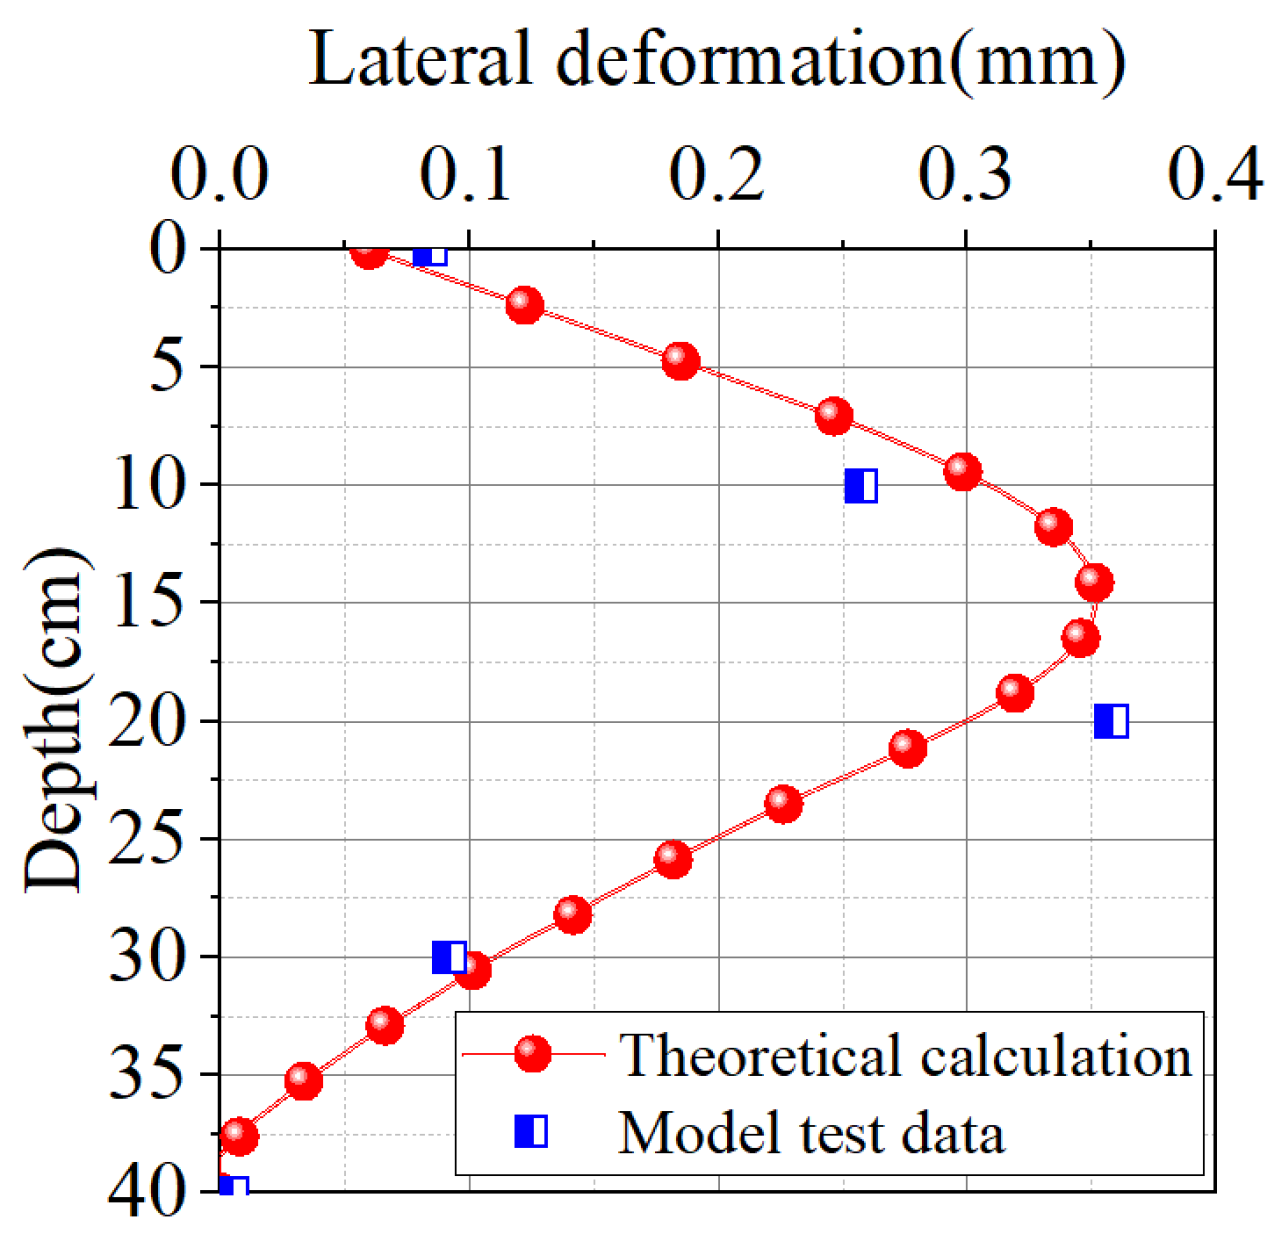
In Figure 18, the laboratory-scale experimental results and theoretical calculations of the isolation piles’ lateral deformation are compared. Both exhibit a “bulging” distribution pattern, with maximum lateral deformations of 0.351 mm (experimental) and 0.358 mm (theoretical), respectively. The minor discrepancy of 0.003 mm (2% error) demonstrates that the theoretical method accurately predicts the isolation piles’ lateral deformation behavior in laboratory-scale experiments. Regarding the depth at which the maximum lateral deformation of the isolation piles occurs, the theoretical calculation results and experimental monitoring results indicate depths of 15 cm and 20 cm, respectively, showing a certain level of discrepancy. However, the primary function of the isolation piles is to control surface subsidence. In the theoretical analysis, the focus is placed on the magnitude of the lateral deformation to calculate the resulting surface subsidence behind the piles, while the depth of the maximum displacement has a negligible impact on the surface subsidence behavior. Therefore, the theoretical approach adopted in this study remains rational for evaluating the lateral deformation of the isolation piles.
Figure 19 presents comparative curves of ground surface subsidence with and without isolation piles. As shown in Figure 19a, without isolation piles, the maximum theoretical and experimental subsidences are 0.349 mm and 0.364 mm, respectively, with a difference of 0.015 mm (4.1% error). Both cases show maximum subsidence occurring approximately 10 cm from the isolation piles, exhibiting a “spoon-shaped” distribution pattern.
Figure 19b displays the subsidence comparison with isolation piles. The theoretical and experimental values are 0.242 mm and 0.265 mm, respectively, differing by 0.023 mm (8.7% error). While both share the same location of maximum subsidence, some discrepancy exists in the range of subsidence influence. However, as subsidences approach zero at greater distances, causing negligible environmental impact, this margin of error remains acceptable. These results confirm that the proposed theoretical framework accurately predicts ground subsidence behind isolation piles.

5.2. Influence of Isolation Pile Diameter

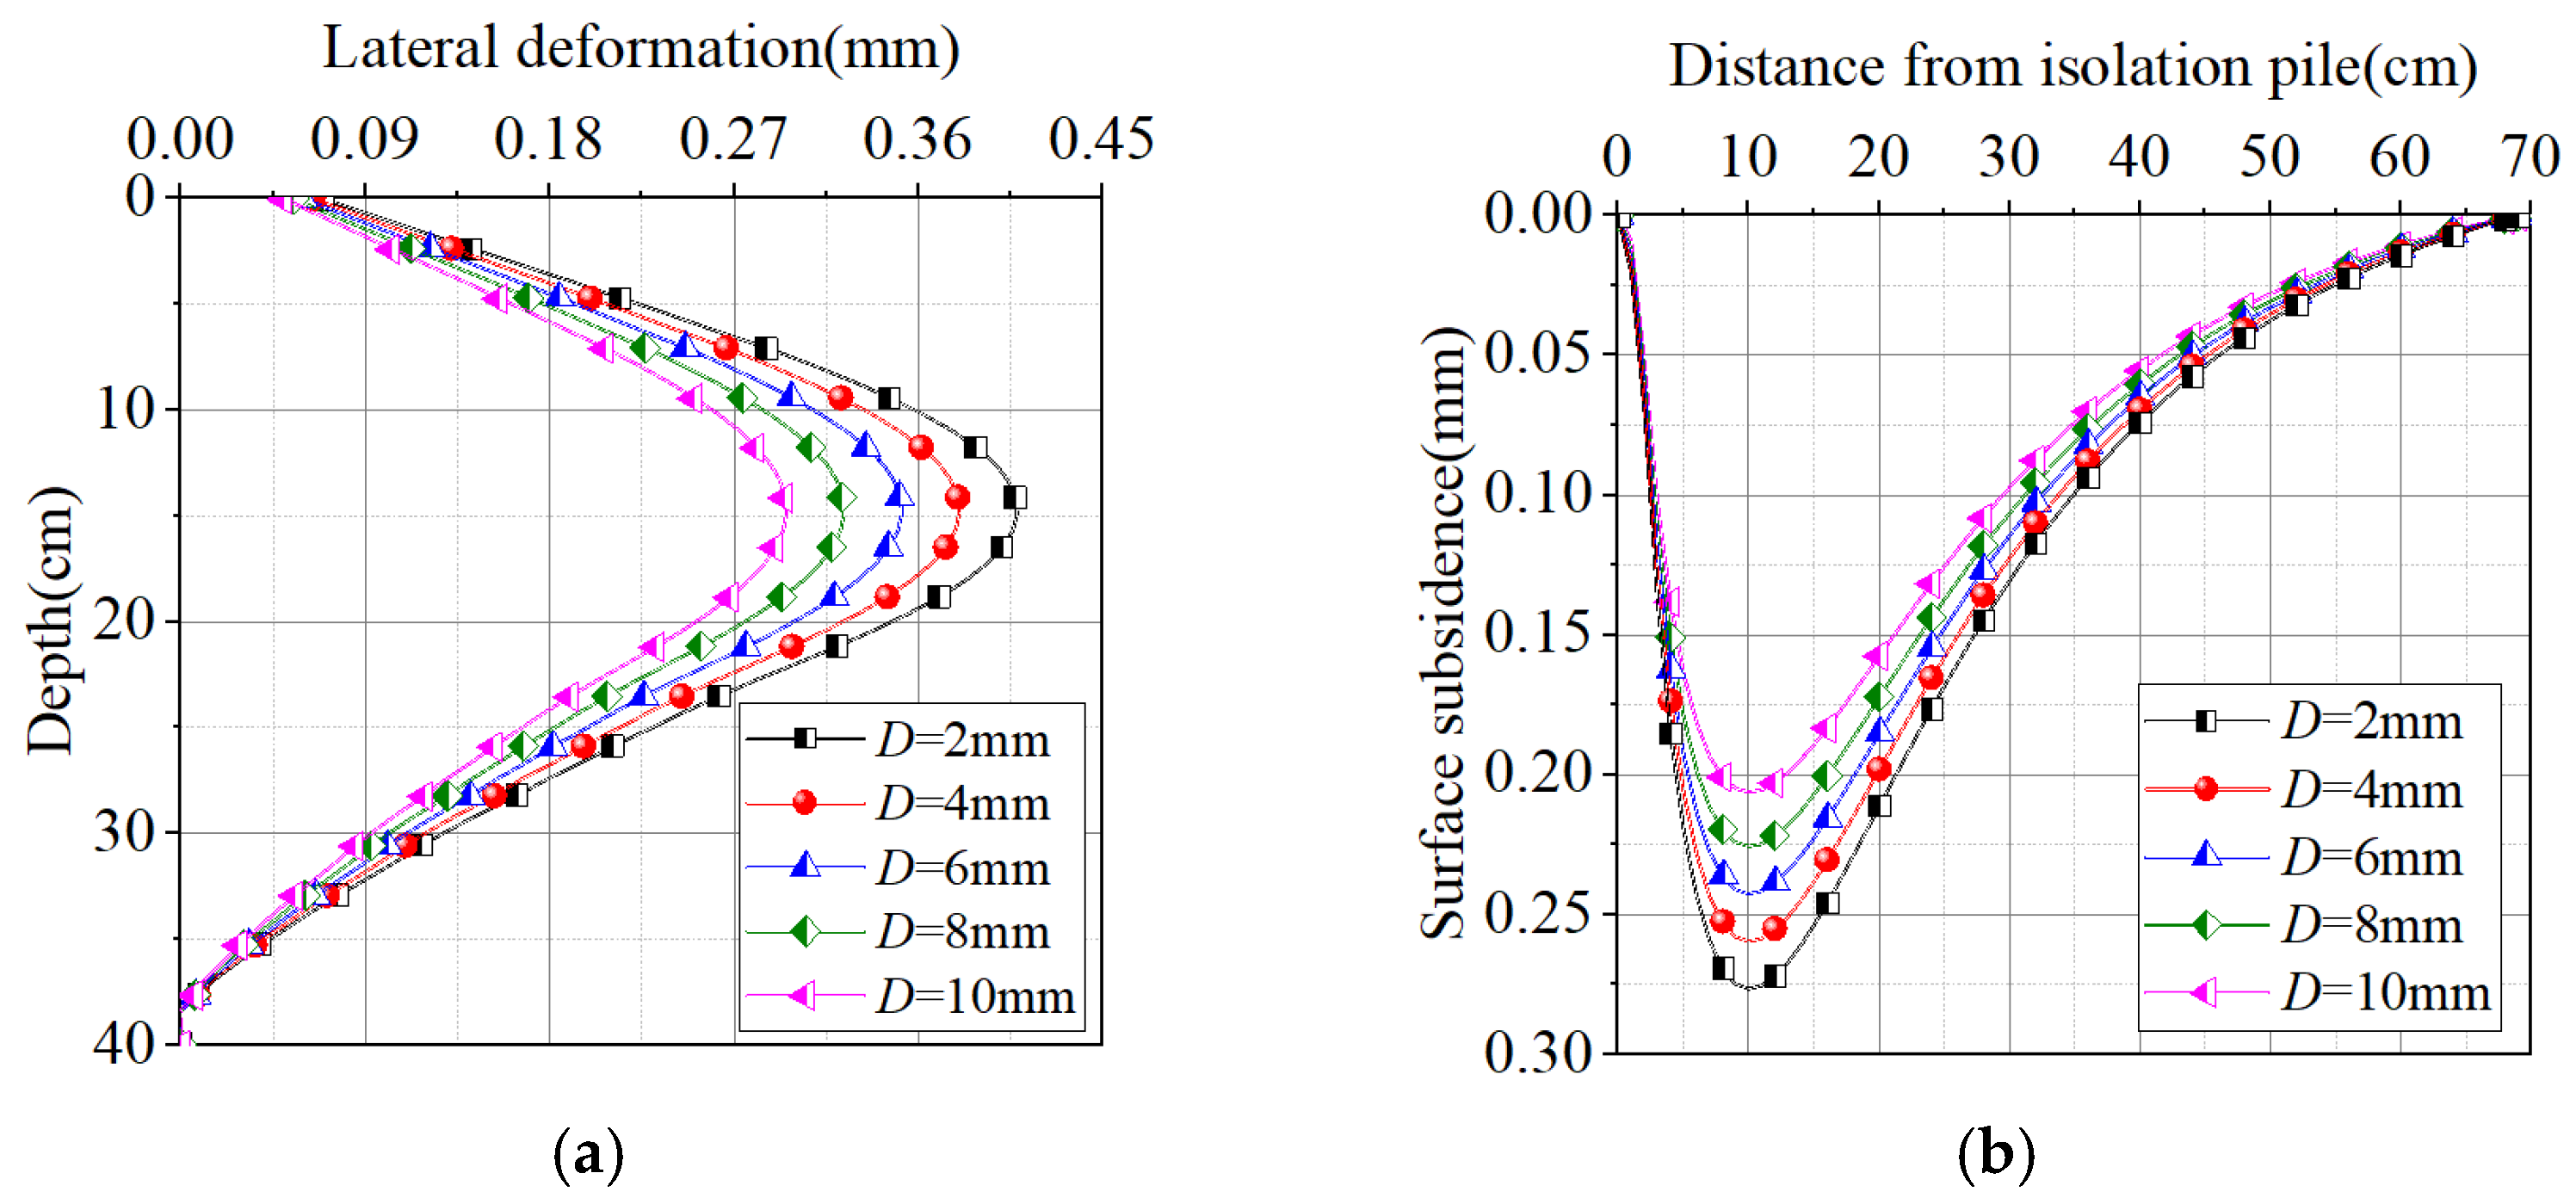
Figure 20 presents the theoretical investigation of isolation pile diameter effects on lateral deformation and ground subsidence while keeping other parameters constant. Five diameters were analyzed: D = 2 mm, 4 mm, 6 mm, 8 mm, and 10 mm. As shown in Figure 20a, the maximum lateral deformations of the isolation piles corresponding to different pile diameters are 0.407 mm, 0.379 mm, 0.351 mm, 0.323 mm, and 0.295 mm, respectively, with a maximum difference of 0.112 mm. When scaled to real-world engineering conditions based on the similarity ratio, this difference corresponds to 5.6 mm—a significant reduction in deformation. This reduction accounts for 31.9% of the lateral deformation observed in the experimental scenario, indicating that increasing the diameter of the isolation piles can effectively reduce their lateral deformation.
As shown in Figure 20b, the maximum surface subsidences behind the piles corresponding to different isolation pile diameters are 0.206 mm, 0.226 mm, 0.242 mm, 0.259 mm, and 0.276 mm, respectively, with a maximum difference of 0.07 mm. When converted to real-world engineering conditions based on the similarity ratio, this difference corresponds to 3.5 mm—a notable reduction in subsidence. This reduction accounts for 28.9% of the surface subsidence behind the piles under the experimental conditions, demonstrating that increasing the diameter of the isolation piles significantly reduces surface subsidence.

5.3. Effect of Isolation Pile Elastic Modulus

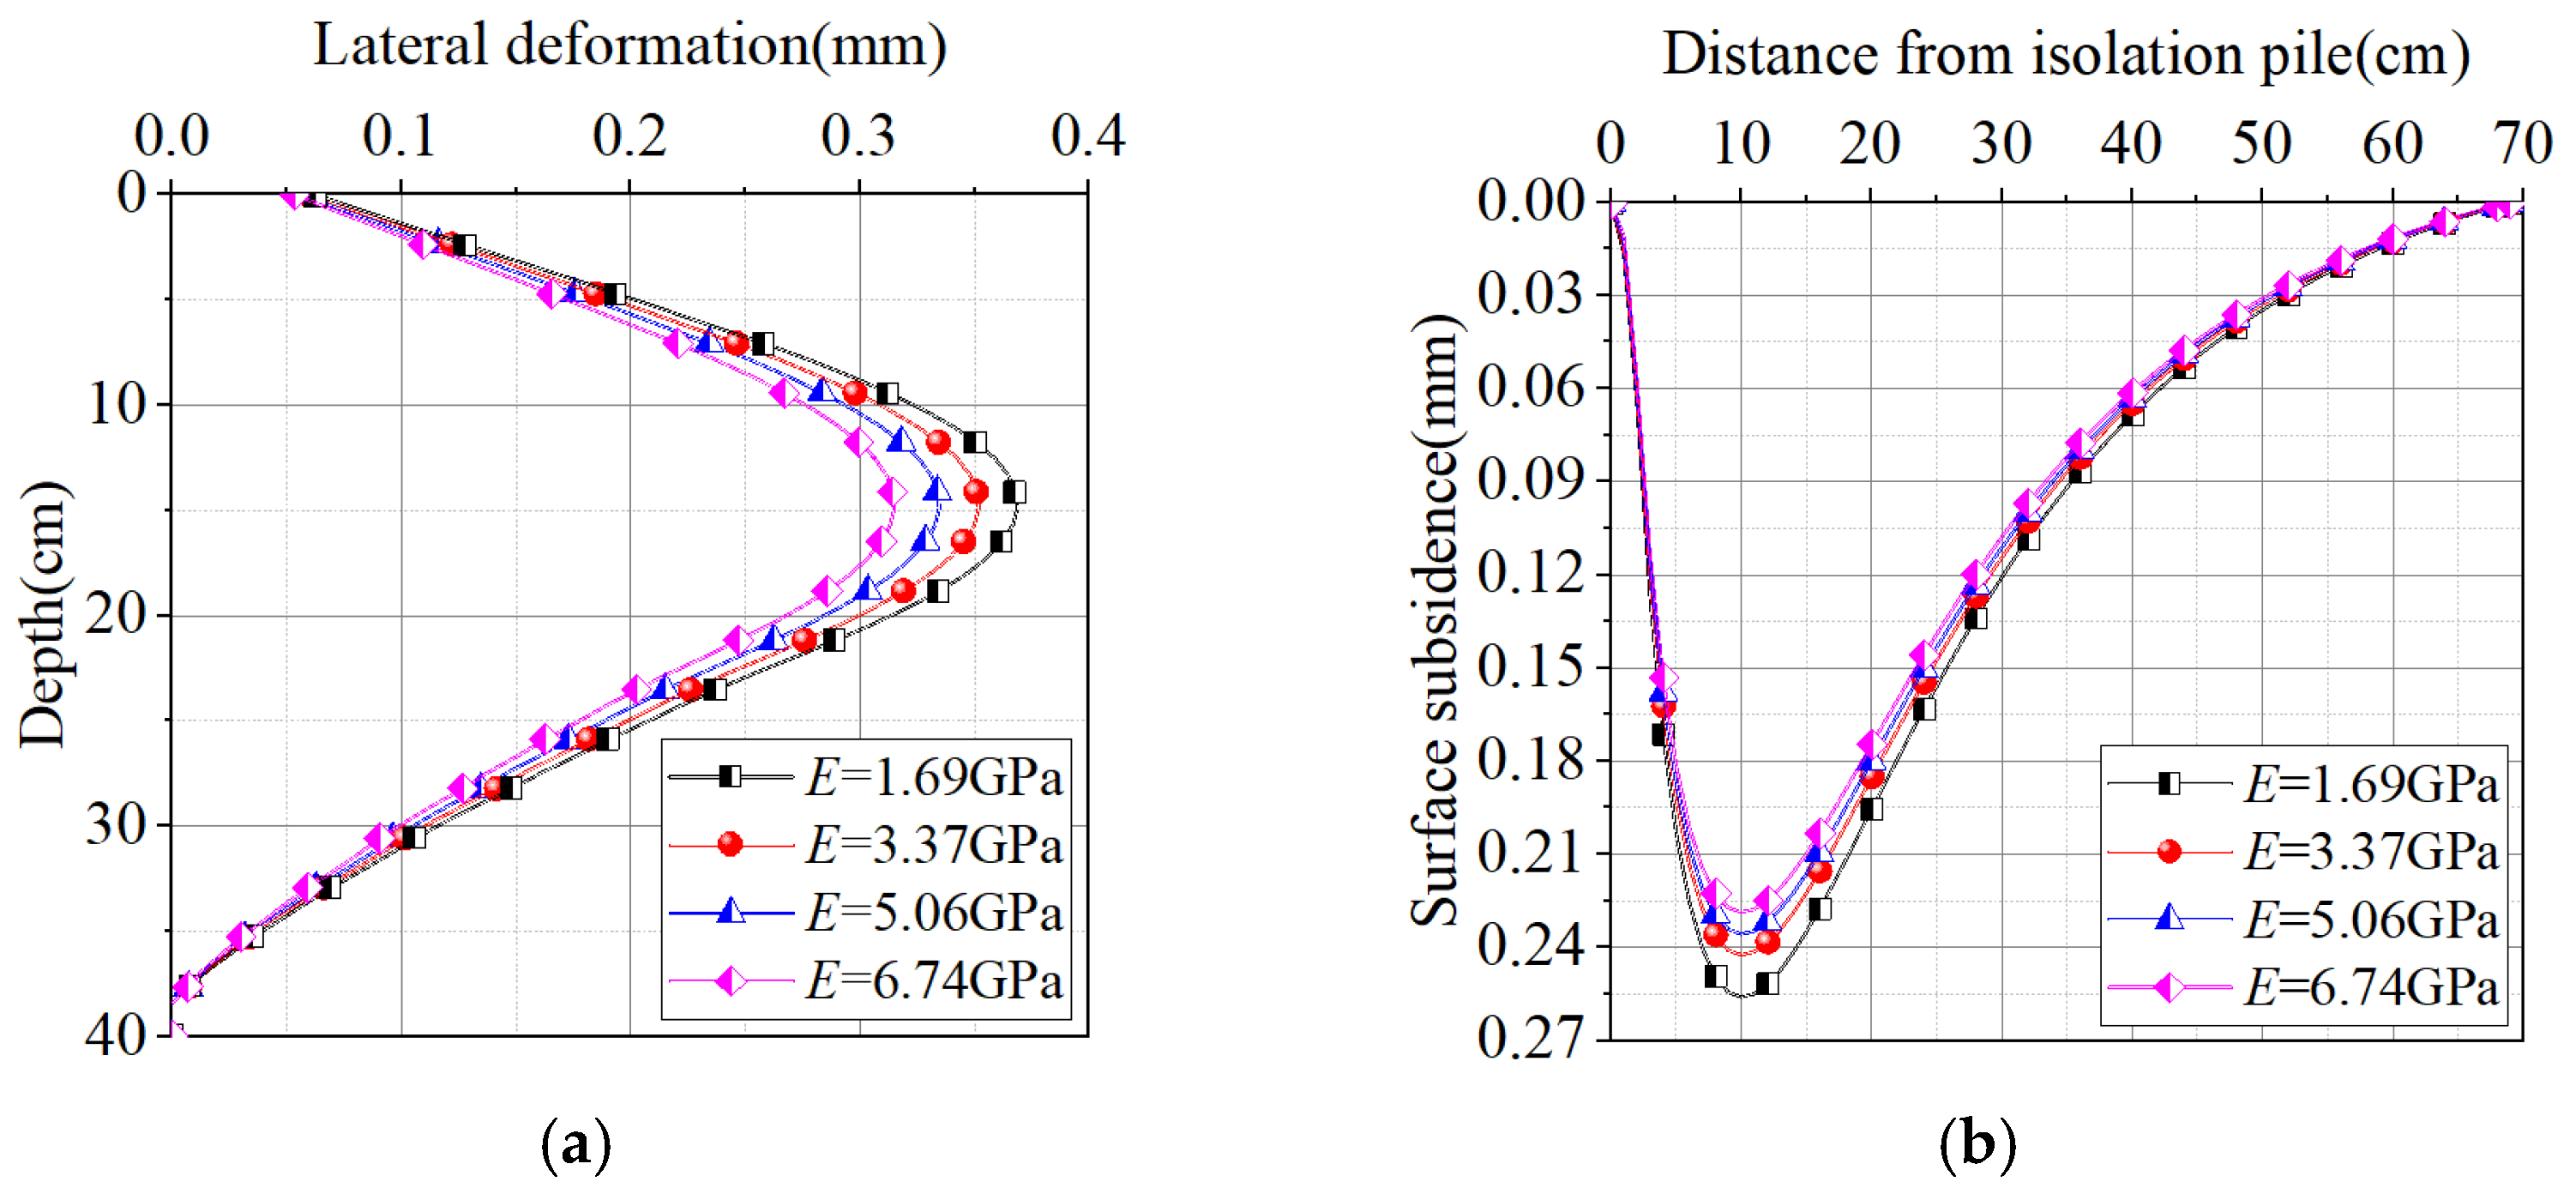
As shown in Figure 21, while keeping all other parameters consistent with the laboratory-scale experiment conditions, only the elastic modulus of the isolation piles was varied to theoretically investigate its influence on piles’ lateral deformation and ground surface subsidence behind the piles. The analysis considered four elastic modulus values: E = 1.69 GPa, 3.37 GPa, 5.06 GPa, and 6.74 GPa.
As shown in Figure 21a, the maximum lateral deformations of the isolation piles corresponding to different elastic moduli are 0.368 mm, 0.351 mm, 0.334 mm, and 0.314 mm, respectively, with a maximum difference of 0.054 mm. When scaled to real-world engineering conditions according to the similarity ratio, this difference translates to 2.7 mm—a considerable reduction in deformation. This reduction accounts for 15.4% of the lateral deformation observed under experimental conditions, indicating that increasing the elastic modulus of the isolation piles can significantly reduce their lateral deformation.
As shown in Figure 21b, the maximum surface subsidences behind the piles corresponding to different elastic moduli of the isolation piles are 0.256 mm, 0.242 mm, 0.236 mm, and 0.229 mm, respectively, with a maximum difference of 0.027 mm. When scaled to real-world engineering conditions based on the similarity ratio, this difference corresponds to 1.35 mm—a significant reduction in deformation. This reduction accounts for 11.2% of the surface subsidence behind the piles under the experimental conditions, demonstrating that increasing the elastic modulus of the isolation piles effectively reduces surface subsidence.

5.4. Effect of Isolation Pile Spacing

As shown in Figure 22, keeping all other parameters the same as those in the laboratory-scale experiment, only the isolation pile spacing is changed. The theoretical analysis further investigates the effect of isolation pile spacing on the lateral deformation of the isolation piles and the surface subsidence behind the piles. The isolation pile spacings are taken as S1 = 0.6 cm, 0.9 cm, 1.2 cm, 1.5 cm, and 1.8 cm, respectively. As shown in Figure 22a, the maximum lateral deformations of the isolation piles corresponding to different pile spacings are 0.274 mm, 0.313 mm, 0.351 mm, 0.390 mm, and 0.421 mm, respectively, with a maximum difference of 0.147 mm. When scaled to real-world engineering conditions based on the similarity ratio, this difference corresponds to 7.35 mm—a substantial reduction in deformation. This reduction accounts for 41.9% of the lateral deformation observed under experimental conditions, indicating that reducing the spacing of isolation piles can significantly decrease their lateral deformation.
As illustrated in Figure 22b, the maximum surface subsidences behind the piles corresponding to different isolation pile spacings are 0.199 mm, 0.223 mm, 0.242 mm, 0.274 mm, and 0.293 mm, respectively, with a maximum difference of 0.094 mm. Converted to actual engineering conditions according to the similarity ratio, this difference translates to 4.7 mm—a notable control effect on deformation. This reduction represents 38.8% of the surface subsidence behind the piles in the experimental scenario, demonstrating that decreasing the spacing of isolation piles effectively reduces surface subsidence.

5.5. Effect of Pile-Wall Spacing

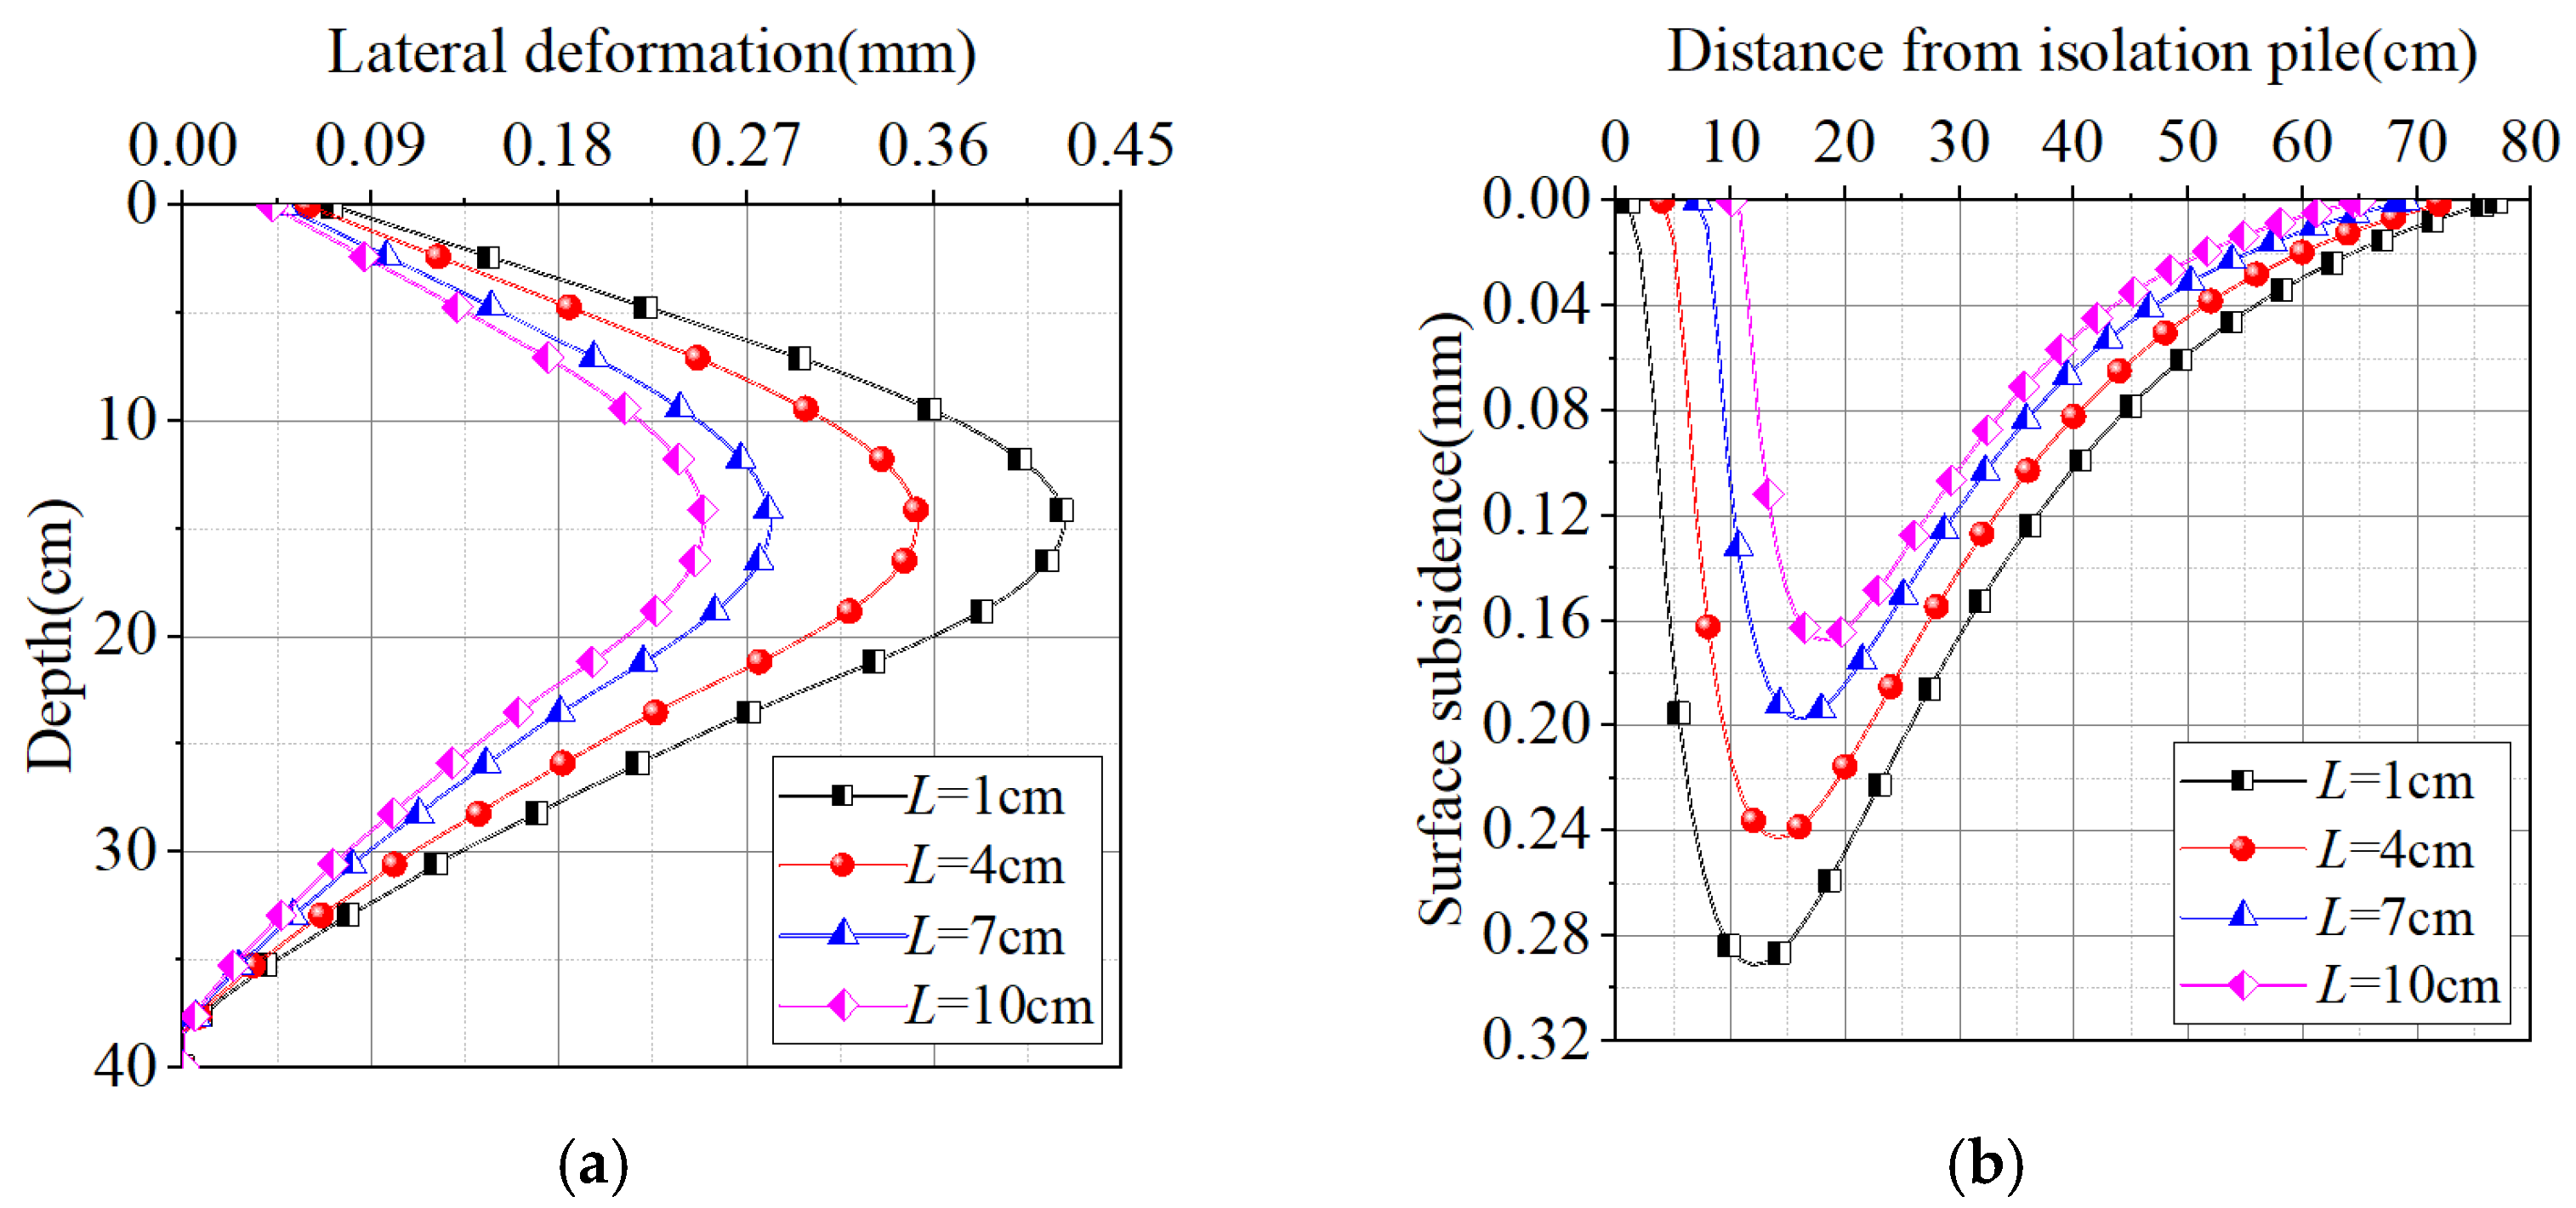
As shown in Figure 23, with all other parameters kept consistent with the laboratory-scale experiment parameters, only the pile wall spacing is varied. Theoretical analysis is used to further investigate the effect of pile wall spacing on the lateral deformation and the surface subsidence behind the piles. The pile wall spacings are selected as L = 1 cm, L = 4 cm, L = 7 cm, and L = 10 cm.
As shown in Figure 23a, the maximum lateral deformations of the isolation piles corresponding to different pile-to-wall distances are 0.421 mm, 0.351 mm, 0.281 mm, and 0.249 mm, respectively, with a maximum difference of 0.172 mm. When scaled to real-world engineering conditions based on the similarity ratio, this difference corresponds to 8.6 mm—a substantial reduction in deformation. This reduction accounts for 49% of the lateral deformation observed under experimental conditions, indicating that increasing the pile-to-wall distance can significantly reduce the lateral deformation of the isolation piles.
As illustrated in Figure 23b, the maximum surface subsidences behind the piles corresponding to different pile-to-wall distances are 0.291 mm, 0.242 mm, 0.196 mm, and 0.167 mm, respectively, with a maximum difference of 0.124 mm. Converted to actual engineering conditions according to the similarity ratio, this difference translates to 6.2 mm—demonstrating considerable effectiveness in deformation control. This reduction represents 51.2% of the surface subsidence behind the piles in the experimental scenario, confirming that increasing the pile-to-wall distance effectively reduces surface subsidence.

6. Conclusions

This study investigates the control effect of isolation piles on surface subsidence and pile displacement induced by excavation in sandy strata through a combined approach of theoretical calculations and laboratory model tests. The main conclusions are as follows:
(1)
Indoor laboratory-scale experiments on isolation piles show that they have a certain control effect on lateral deformation of the underground continuous wall. The lateral deformations of the underground continuous wall with and without isolation piles are 0.436 mm and 0.472 mm, respectively, resulting in a difference of 0.036 mm. When scaled to the actual project, this difference corresponds to 1.8 mm, representing 7.6% of the displacement observed without isolation piles. These results indicate that isolation piles provide some control over the lateral deformation of the underground continuous wall, but the effect is relatively limited.
(2)
The maximum surface subsidences with and without isolation piles are 0.265 mm and 0.364 mm, respectively, resulting in a difference of 0.099 mm. When scaled to the actual project, this difference corresponds to 4.95 mm, accounting for 27.2% of the maximum surface subsidence without isolation piles. This demonstrates that isolation piles have a highly significant controlling effect on surface subsidence. Compared to the 1.8 mm reduction in the lateral deformation of the underground continuous wall, the control effect of isolation piles on surface subsidence is markedly greater than that on the lateral deformation of the underground continuous wall.
(3)
The theoretical calculation results were compared with the experimental data from the model tests to validate the rationality of the theoretical approach. Following this validation, further analysis was conducted to examine the influence of isolation pile layout parameters. This study indicates that increasing the isolation pile diameter, elastic modulus, and pile-to-wall distance effectively reduces both the lateral deformation of the isolation piles and the surface subsidence behind the piles. Under the given conditions, the corresponding reductions in the lateral deformation of the underground continuous wall are 0.112 mm, 0.054 mm, and 0.172 mm, respectively. When scaled to real-world conditions according to the similarity ratio, these values translate to 5.6 mm, 2.7 mm, and 8.6 mm. Similarly, the reductions in surface subsidence are 0.07 mm, 0.027 mm, and 0.124 mm, which correspond to 3.5 mm, 1.35 mm, and 6.2 mm under actual engineering conditions. These results demonstrate a significant effect in deformation control. Furthermore, reducing the isolation pile spacing also contributes to a decrease in both lateral deformation and surface subsidence, with reductions of 0.147 mm and 0.094 mm, respectively. Converted via the similarity ratio, these values equate to 7.35 mm and 4.7 mm in actual working conditions, indicating considerable effectiveness in controlling deformation.

Author Contributions

Conceptualization, K.L. and S.C.; methodology, K.L. and S.C.; software, K.L. and Z.Z.; validation, K.L. and Z.Z.; formal analysis, K.L.; investigation, K.L. and S.C.; resources, S.C.; writing—original draft preparation, Z.Z.; writing—review and editing, K.L. and S.C.; visualization, K.L. and Z.Z.; supervision, S.C.; funding acquisition, S.C. All authors have read and agreed to the published version of the manuscript.

Funding

This research was supported by the Science and Technology Plan of Fujian Provincial Department of Housing and Urban–Rural Development (grant No. 2022K292).

Data Availability Statement

The data presented in this study are available on request from the corresponding author due to project privacy.

Conflicts of Interest

The authors declare no conflicts of interest. The funders had no role in the design of this study; in the collection, analyses, or interpretation of data; in the writing of this manuscript; or in the decision to publish the results.

References

  1. Liu, L.L.; Cai, G.J.; Liu, S.Y.; Chen, Y. Deformation characteristics and control for foundation pits in floodplain areas of Nanjing, China. Bull. Eng. Geol. Environ. 2021, 80, 5527–5538. [Google Scholar] [CrossRef]
  2. Tan, Y.; Wang, D.L. Characteristics of a large-scale deep foundation pit excavated by the central-island technique in shanghai soft clay. I: Bottom-up construction of the central cylindrical shaft. J. Geotech. Geoenviron. Eng. 2013, 139, 1875–1893. [Google Scholar] [CrossRef]
  3. Guo, C.; Yang, X.D.; Guo, C.C.; Li, P.F. Analysis of Deformation of Deep and Large Foundation Pit Support Structure and Impact on Neighbouring Buildings in Complex Environments. Buildings 2025, 15, 1435. [Google Scholar] [CrossRef]
  4. Zhu, J.H.; Qian, F.; Cai, J.P. Research on a Calculation Method for the Lateral deformation of the Retaining Structure of Deep Foundation Pits. Buildings 2024, 14, 1694. [Google Scholar] [CrossRef]
  5. Liu, L.L.; Wu, R.G.; Congress, S.S.C.; Du, Q.W.; Cai, G.J.; Li, Z. Design optimization of the soil nail wall-retaining pile-anchor cable supporting system in a large-scale deep foundation pit. Acta. Geotech. 2021, 16, 2251–2274. [Google Scholar] [CrossRef]
  6. Li, G.; Qin, F.; Yan, N.H.; Qiao, X.L.; Si, L.J.; Zhao, S. Surface Deformation Characteristics and Influencing Factors in Deep Foundation Pit Excavations for Subway Projects in Ningbo’s Soft Soil Area. Buildings 2025, 15, 1229. [Google Scholar] [CrossRef]
  7. Tong, L.Y.; Li, H.J.; Ha, S.; Liu, S.Y. Lateral bearing performance and mechanism of piles in the transition zone due to pit-in-pit excavation. Acta Geotech. 2021, 17, 1935–1948. [Google Scholar] [CrossRef]
  8. Li, Y.X.; Zou, Z.X. Numerical Investigation on the Influence of Super-Large-Diameter Shield Tunneling on Nearby Existing Metro Tunnels and the Protection Scheme. Appl. Sci. 2023, 13, 13179. [Google Scholar] [CrossRef]
  9. Qiu, H.S.; Wang, Z.; Ayasrah, M.; Fu, C.B.; Gang, L. Numerical Study on the Reinforcement Measures of Tunneling on Adjacent Piles. Symmetry 2022, 14, 288. [Google Scholar] [CrossRef]
  10. Bilotta, E.; Taylor, R.N. Centrifuge modelling of tunnelling close to a underground continuous wall. Int. J. Phys. Model. Geotech. 2005, 5, 27–41. [Google Scholar] [CrossRef]
  11. Bilotta, E. Use of underground continuous walls to mitigate ground movements induced by tunnelling. Géotechnique 2008, 58, 143–155. [Google Scholar] [CrossRef]
  12. Ali, A.; Tohid, A.; Hooshang, K. Effect of a row of soldier piles on the subsidence of adjacent buildings due to tunnelling: Numerical study. Int. J. Geotech. Eng. 2022, 16, 616–631. [Google Scholar] [CrossRef]
  13. Rampello, S.; Fantera, L.; Masini, L. Efficiency of embedded barriers to mitigate tunnelling effects. Tunn. Undergr. Space Technol. 2019, 89, 109–124. [Google Scholar] [CrossRef]
  14. Xiao, Z.; Xie, S.; Hu, A.; Chen, Y.; Wang, M.H. Displacement control in irregular deep excavation adjacent to tunnel groups in structural soil: A case study of MJS cement-soil composite piles and grouting rectification. Case Stud. Constr. Mater. 2024, 20, e03085. [Google Scholar] [CrossRef]
  15. Zheng, G.; Wang, J.F.; Du, M.Y.; Diao, Y.; Lei, Y.W.; Cheng, X.S. The Efficiency of the Ability of Isolation Piles to Control the Deformation of Tunnels Adjacent to Excavations. Int. J. Civ. Eng. 2018, 16, 1475–1490. [Google Scholar] [CrossRef]
  16. Ding, H.B.; Wang, X.P.; Tong, L.H.; Lu, Q.; Xu, C.J.; Guang, L.X. Performance of isolation piles in protecting subway tunnels adjacent to foundation pits: Experimental and numerical investigations. Tunn. Undergr. Space Technol. 2025, 156, 106221. [Google Scholar] [CrossRef]
  17. Liu, K.; Xu, X.B.; Hu, Q.; Zeng, L.B.; Wang, J.C. 1 g Model Test on the Use of Isolation Piles for Tunnel Protection Adjacent to Soft Soil Excavation. Transp. Geotech. 2022, 35, 100790. [Google Scholar] [CrossRef]
  18. Nie, G.P.; Liu, Y.; Lv, P.L.; Ma, S.K.; Chen, Z.; He, X.S. The Effects of Isolation Pile on the Ground Deformation due to a Deep Pit Excavation. Adv. Mater. Sci. Eng. 2022, 2022, 7101767. [Google Scholar] [CrossRef]
  19. Cao, L.Q.; Chen, X.S.; Shen, X.; Zhang, D.L.; Su, D.; Fang, H.C. Theoretical analysis of the barrier effect of embedded isolation piles on tunneling-induced vertical ground displacements. Comput. Geotech. 2022, 144, 104609. [Google Scholar] [CrossRef]
  20. Cao, L.Q.; Chen, X.S.; Lin, X.T.; Su, D.; Fang, H.C.; Lu, D.C. Analytical solutions for the restraint effect of isolation piles against tunneling-induced vertical ground displacements. J. Rock. Mech. Geotech. 2023, 15, 2582–2596. [Google Scholar] [CrossRef]
  21. Cao, L.Q.; Lu, D.C.; Chen, X.S.; Chen, S.D.; Zhou, X. Theoretical investigation of the resistance effect of embedded isolation piles on tunneling-induced lateral ground movements. Tunn. Undergr. Space Technol. 2025, 155, 106166. [Google Scholar] [CrossRef]
  22. Wei, G.; Qi, Y.J.; Chen, C.L.; Zhang, S.M.; Qian, C.L.; Zhou, J. Analysis of the protective effect of setting isolation piles outside the foundation pit on the underpass tunnel side. Transp. Geotech. 2022, 35, 100791. [Google Scholar] [CrossRef]
  23. Huang, K.; Sun, Y.W.; Kuang, X.L.; Huang, X.Q.; Liu, R.N.; Wu, Q.J. Study on the Restraint Effect of Isolation Pile on Surface Subsidence Trough Induced by Shield Tunnelling. Appl. Sci. 2022, 12, 4845. [Google Scholar] [CrossRef]
  24. Kerr, A.D. On the Determination of Foundation Model Parameters. J. Geotech. Eng. 1985, 111, 1334–1340. [Google Scholar] [CrossRef]
  25. Li, K.P.; Chen, S.H.; Pei, R.P.; Li, Y.C. Theoretical Study on Underground continuous wall and Surface Deformation Due to Foundation Excavation Based on Three-Parameter Kerr Model. Sustainability 2024, 16, 2295. [Google Scholar] [CrossRef]
  26. Zhu, H.H.; Chen, Q.J.; Yang, L.D. Boundary Element Method and Its Application to Geotechnical Engineering; Tongji University Press: Shanghai, China, 1997; pp. 35–83. [Google Scholar]
  27. Mindlin, R.D. Force at point in the interior of a semi-infinite solid. Physics 1936, 7, 195–202. [Google Scholar] [CrossRef]
  28. Bao, Z.H.; Cui, X.Z.; Du, Y.F.; Jin, Q.; Hao, J.W.; Cao, T.C.; Zhang, X.N. Development and verification of subgrade service performance test system considering the principal stress rotation. Transp. Geotech. 2025, 50, 101474. [Google Scholar] [CrossRef]
  29. Zhang, Z.G.; Lu, M.H.; Xu, C.; Gong, J.F.; Zhao, Q.H. Simplified solution for tunnelling-induced pile foundation deformation based on the Kerr foundation model. Mod. Tunn. Technol. 2016, 53, 55–66. [Google Scholar] [CrossRef]
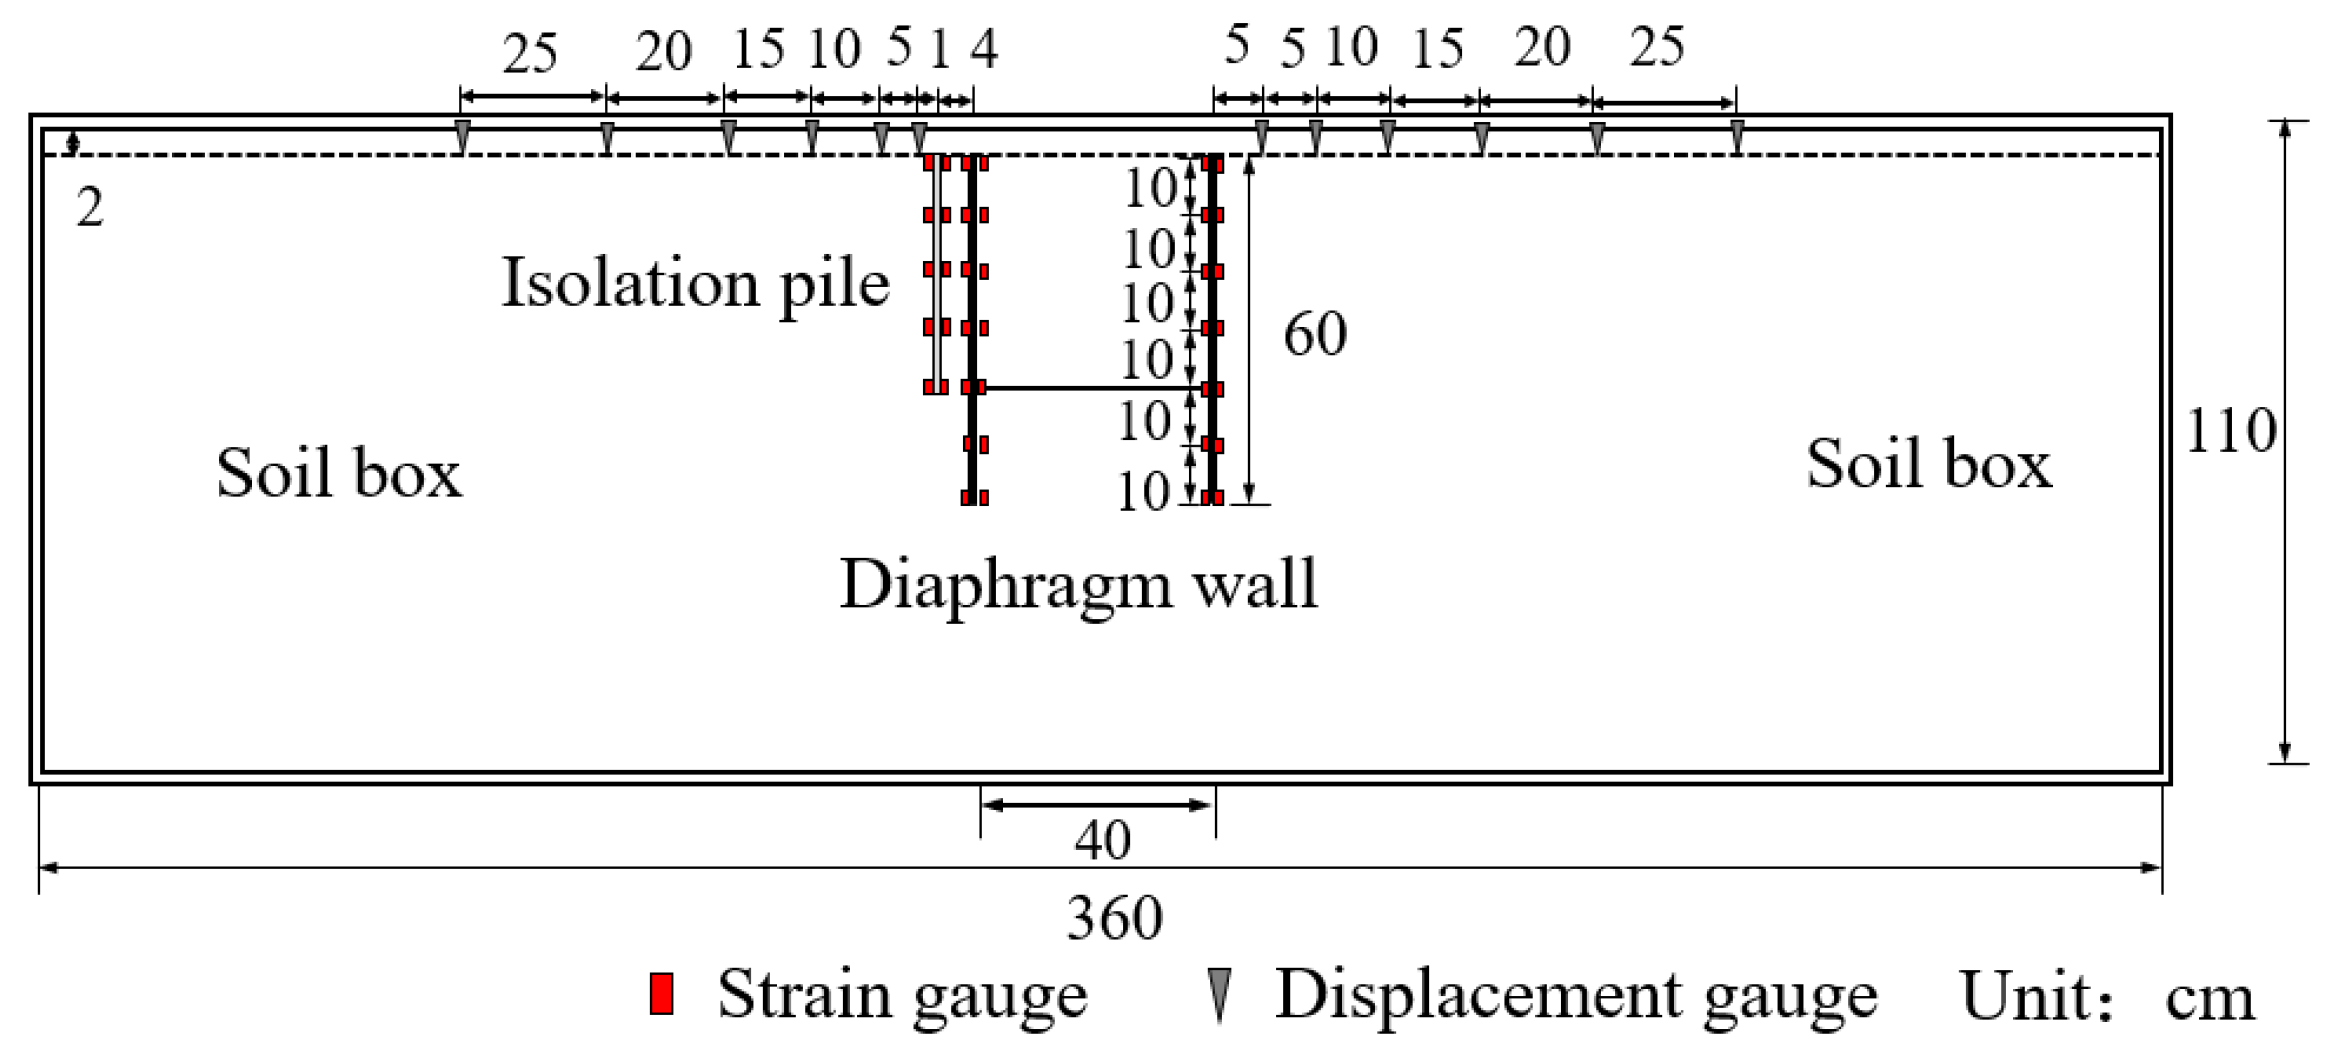
Figure 1. Front view.
Buildings 15 03188 g001
Figure 2. Top view.
Figure 2. Top view.
Buildings 15 03188 g002
Figure 3. Front view of displacement meter layout.
Buildings 15 03188 g003
Figure 4. Top view of displacement meter arrangement.
Buildings 15 03188 g004
Figure 5. Calculation model.
Buildings 15 03188 g005
Figure 6. Mindlin solution calculation model.
Buildings 15 03188 g006
Figure 7. Virtual force on boundary of foundation pit.
Buildings 15 03188 g007
Figure 8. Computational model for soil lateral deformation near isolation piles.
Buildings 15 03188 g008
Figure 9. Pile–soil interaction model based on Kerr foundation.
Buildings 15 03188 g009
Figure 10. Deformation and force diagram of isolation pile groups.
Buildings 15 03188 g010
Figure 11. Calculation diagram of surface subsidence behind isolation piles.
Buildings 15 03188 g011
Figure 12. Distribution of lateral deformation of isolation piles over time.
Buildings 15 03188 g012
Figure 13. Spatial distribution of lateral deformation in isolation piles.
Buildings 15 03188 g013
Figure 14. Comparison of lateral deformation of the underground continuous wall with and without Isolation Piles.
Buildings 15 03188 g014
Figure 15. Time distribution of surface subsidence.
Buildings 15 03188 g015
Figure 16. Comparison of spatial distribution of surface subsidence.
Buildings 15 03188 g016
Figure 17. Comparison of lateral deformation of underground continuous wall.
Buildings 15 03188 g017
Figure 18. Comparison of lateral deformation of isolation piles.
Buildings 15 03188 g018
Figure 19. Comparison of surface subsidence. (a) Without isolation pile. (b) With isolation pile.
Buildings 15 03188 g019
Figure 20. Influence of isolation pile diameter. (a) Lateral deformation effect. (b) Surface subsidence effect.
Buildings 15 03188 g020
Figure 21. Effect of elastic modulus of isolation pile. (a) Lateral deformation effect. (b) Surface subsidence effect.
Buildings 15 03188 g021
Figure 22. Effect of isolation pile spacing. (a) Lateral deformation effect. (b) Surface subsidence effect.
Buildings 15 03188 g022
Figure 23. Influence of pile–wall distance. (a) Lateral deformation effect. (b) Surface subsidence effect.
Buildings 15 03188 g023
Table 1. Soil mechanical parameters.
SoilDensity (g/cm3)Compression Modulus (MPa)Cohesion (kPa)Internal Friction AngleRelative Density Dr (%)Specific Gravity (Gs)
Sandy Soil1.3323.51038.974.32.67
Table 2. Test cycle.
Experimental ProcessTime/min
Standing1440
First layer excavation10
Standing40
Second layer excavation and installation of internal support20
Standing40
Third layer excavation and installation of internal support20
Standing40
Fourth layer excavation and installation of internal support20
Standing50
Disclaimer/Publisher’s Note: The statements, opinions and data contained in all publications are solely those of the individual author(s) and contributor(s) and not of MDPI and/or the editor(s). MDPI and/or the editor(s) disclaim responsibility for any injury to people or property resulting from any ideas, methods, instructions or products referred to in the content.