Article

A Comparative Study of Standardised Inputs and Inconsistent Outputs in LCA Software

by
Joseph Gong
1,*,
Vishnupriya Vishnupriya
1 and
Suzanne Wilkinson
2
1
School of Built Environment, Massey University, Auckland 0632, New Zealand
2
Faculty of Design & Creative Technologies, Auckland University of Technology, Auckland 1010, New Zealand
*
Author to whom correspondence should be addressed.
Buildings 2025, 15(17), 3174; https://doi.org/10.3390/buildings15173174
Submission received: 13 June 2025 / Revised: 30 July 2025 / Accepted: 6 August 2025 / Published: 4 September 2025
(This article belongs to the Special Issue Life Cycle Management of Building and Infrastructure Projects)

Abstract

Motivation: Life Cycle Assessment (LCA) is a valuable tool for quantifying environmental impacts in construction. However, inconsistencies between software outputs may compromise effective decision-making. Knowledge Gap: In New Zealand’s construction sector, practitioners have limited guidance in selecting suitable LCA tools due to gaps in software scope, data transparency, and the quality of result interpretation. Aim and Objectives: This study investigates inconsistencies in results produced by eight widely used LCA software tools and identifies the key factors contributing to these variations. Research Method: This study uses a comparative analysis with data from a timber-framed warehouse project in Auckland, New Zealand. Eight software tools (SimaPro V9.0, openLCA V2.0, LCAQuick V3.5, Building Carbon Calculator V1.0, CCaLC2 V3.1, eTool V5.0, One Click LCA, and Athena Impact Estimator for Buildings V5.4) were evaluated across 14 environmental impact categories using standardised inputs. Preliminary Findings: Substantial inconsistencies were observed even with standardised inputs, although SimaPro V9.0 and openLCA V2.0 provided the most consistent results. These findings highlight the importance of software selection for reliable environmental assessments. Research Significance: This study aids industry practitioners in selecting effective LCA tools for sustainable construction practices.

1. Introduction

This study addresses a key problem in the building sector: Even with identical input data, different LCA software packages often produce inconsistent environmental impact results, leading to confusion for practitioners and undermining decision-making. We focused on whether standardised inputs can yield consistent results across widely used LCA software tools. To investigate this, we applied detailed, controlled inputs from a timber-framed warehouse project in Auckland and ran it through selected LCA tools, including SimaPro V9.0, openLCA V2.0, LCAQuick V3.5, Building Carbon Calculator (BCC) V1.0, CCaLC2 V3.1, eTool V5.0, One Click LCA (OCLCA), and Athena Impact Estimator for Buildings (IE4B) V5.4. In BCC, “Calculator” is part of the software’s product name, but BCC V1.0 is considered an LCA software in this study. We do not aim to recommend a single best tool. Instead, we identify where inconsistencies appear, explain how differences in software design, databases, and assessment methods contribute to these outcomes, and highlight the factors most likely to affect results. The aim is to give practitioners clear, practical insights into the reliability and limitations of different LCA tools so that they can make more informed choices for the New Zealand construction sector.
Life Cycle Assessment (LCA) provides a structured approach to evaluating the environmental impacts of products, processes, or services across all life cycle stages—from raw material extraction to end-of-life disposal. A typical LCA includes four stages: (1) goal and scope definition, (2) life cycle inventory (LCI) analysis, (3) life cycle impact assessment (LCIA), and (4) interpretation of results. Each unit process in an LCA receives specific inputs and generates outputs that determine the environmental impacts. Assessment methods guide how these processes are allocated and calculated. LCA software streamlines this process by supporting data management, method selection, calculations, result aggregation, and visualisation. Although the use of LCA in the building sector is still developing, many software tools have been created internationally, often with unique principles and varying adherence to standards. Each tool may focus on different environmental impacts, depending on the project’s goals and available resources.
LCA software can be categorised as desktop-based, web-based, Excel-based, plug-in, or backend applications. This study is distinct in reviewing 14 impact categories across eight LCA software platforms using a New Zealand building as a case study. Each software offers unique features; no two platforms are entirely identical. Platform type remains a key point of difference. For instance, Karunaratne and Dharmarathna [1] classify LCA tools as passive tools, guidelines or checklists, and whole-building environmental LCA software (WBELCA-STs). However, further subdivisions are not provided for WBELCA-STs. Sartori [2] uses categories such as web-based, stand-alone, and plug-in, but does not consider desktop or Excel-based tools, which limits the completeness of those reviews. The European Commission [3] categorises accessibility as web interface, Excel-based, or installable software, but omits other essential performance indicators.
Desktop-based LCA software suites typically provide robust user experiences and reliable data management, as they do not require continuous internet access. However, they often lack integration with digital building models from software such as AutoCAD, SketchUp, or Revit [4]. Excel-based LCA tools can incorporate data and macros within spreadsheet templates, making them more accessible to practitioners with limited technical experience. Recent studies [5] indicate that users value the option to export results to Excel for custom visualisation and reporting. The diversity in software interfaces and user workflows makes cross-tool comparison challenging, since no universal standards exist for either developers or users. Figure 1 illustrates the wide range of LCA software and carbon modelling platforms currently used in construction.

2. Literature Review

2.1. Practitioner Experience and Common Modelling Errors

The practitioner’s experience with construction practice and knowledge of LCA may be essential factors in conducting LCAs. However, common mistakes in LCAs, like entry, rounding, translation, and other calculation errors, are difficult to avoid. Material selection mismatch and unit conversion errors are common among those issues. The product lifetimes chosen by the practitioners vary significantly, affecting the total material quantities in the LCAs because the environmental data has information on densities, which involves the calculated mass. Hence, substantial differences in the material quantities and the chosen environmental data affect the total environmental impact results [6].

2.2. Variability in Databases, EPDs, and Data Quality

Around 20 LCI databases are analysed using a four-step assessment framework in research that calculated the Percentage Relative Differences (PRD) to indicate inconsistency between results from various LCI databases. One of its conclusions highlights that when considering such complicated factors, having a clear understanding of the features of available databases helps end-users select a proper database or tool. It suggests that non-expert users can use simpler databases to reduce wrong contextualisation and potential deviations [7].
A study compared different environmental product declarations (EPDs) by developing various models for product inputs and analysing them using methods from the EPD system. It is believed that results calculated using EPDs should not be compared, even with modelling using various methods that are compliant with the EPD system. A specific product’s EPD can return very different impact scores under other guidelines. The manufacturers can deliberately publish their EPDs through the programme operators and use these methodological differences to their advantage [8].
Even though these mistakes are present in all the LCAs, they are more prominent in the LCAs conducted by practitioners with limited experience in building LCAs and LCA software. Inputting the data into the LCA software and selecting the appropriate environmental data causes the most uncertainty. F. Testa [9] agrees that the most critical issue is the collection of high-quality data as input data for LCA studies. The quality of databases can affect the final results of the LCA, thus influencing its credibility. Therefore, the database quality is considered an essential barrier to the further implementation of LCA among firms. More findings [10] reveal that the inconsistency in results decreases with the increased level of specific detail and the limited variation of options in input data. The building material inventory as input to the calculation is divided by the level of detail. The construction industry should focus on educating practitioners to conduct building LCAs in the same manner and provide clear guidelines on building LCAs [6], especially on carbon-related evaluation measures [11]. The investigation found a low awareness of LCA tools in New Zealand’s construction sector, with fewer than 3% familiar with commonly used tools and over 80% unfamiliar with others [12].

2.3. LCA Software Integration and Emerging Methods

The Circular Economy (CE) is a broad concept encompassing various directions, with LCA being one of them. Despite the narrower scope, this paper focuses on LCA software to provide a more in-depth exploration of this area. Out of 74 software suites identified in the study, only seven were developed as plug-ins to other platforms: Beacon, developed by Thornton Tomasetti, Buildings and Habitat Object Model (BHoM) by Buro Happold, Emission Reduction Tool (H\B:ERT) by Hawkins\Brown, Ladybug Tools by Ladybug Tools LLC, PHribbon by AECB, SolidWorks 2024 Sustainability by Dassault Systèmes, and tallyLCA by Building Transparency. Plug-in software represents a small portion of the LCA software market, with even the leading tools not being plug-ins. The “Computational methods” discussed here include computational design and artificial intelligence, which require further clarification due to their complex nature [13].

3. Methodology

This study consisted of two main stages: (1) Product system modelling and simulation, and (2) impact results analysis. A systematic investigation to collect LCA software of various types was conducted before the selection and learning stage. To identify the appropriate candidates, the investigation included multiple software types, such as desktop, Excel-based, web-based, and plug-in software. The construction project used in this research was to construct a simple warehouse in Auckland, New Zealand. Only conventional building materials, such as concrete, metal alloy, and polymers, were used in construction. It does not include complex structures incorporating fibre, ceramic, organic materials, or adhesives.

3.1. Building Case

A timber-framed single-story shed warehouse, shown in Figure 2, was used for assessment in this study. The shed requires little operational energy and maintenance during its service life. The volume of used materials is calculated using the sizes shown in the drawings. The product system of the shed warehouse is relatively simple. Seventeen cylindrical foundation footings are cast underneath to support timber frames. The building frames are made of kiln-dried and sawn Radiata pine wood. Timber wall studs are connected to the foundation by insertion and bracing. The walls and roof claddings are made of V-ribs colour steel Endura made from a G550 substrate and aluminium-zinc coating. A Kiwimesh Roof Safety Mesh made of galvanised steel is installed under the roof cladding. A DriStud RU24 Roof underlay is applied between the mesh and roof cladding. Roof flashings are made of cold-rolled colour steel Endura. An aluminium-framed timber door is installed for personal access, and two aluminium roller shutters are installed for cargo loading. The material inventory lists galvanised steel bolts, nuts, screws, and washer as ancillary connectors.

3.2. Software Selection

Eight LCA software packages, SimaPro V9.0, openLCA V2.0, LCAQuick V3.5, BCC V1.0, CCaLC2 V3.1, eTool V5.0, OCLCA, and IE4B V5.4, are selected from a wide range of tools (Figure 1). Over 50 software solutions were initially reviewed. Selection criteria included the software’s popularity, industry acceptance, and academic usage. Information about software was gathered through multiple sources. Academic literature and industry reports provided software comparisons and evaluations. Official websites, user manuals, and technical documentation clarified the tools’ capabilities and data availability. Direct communication with developers and software trials verified accessibility and relevance. Professional forums and user communities offered insights into the application. This multi-source review approach ensures relatively reliable information collection. Practical accessibility is perhaps one of the most crucial aspects, covering aspects like licenses, regional datasets, and documentation quality. Tools were chosen to represent different platform types (desktop, web-based, Excel-based). Transparency in methods and datasets, as well as coverage of essential impact categories, further guided selections. GaBi was excluded due to high licensing costs and limited practical accessibility. As a primarily North American and European-focused software, GaBi offers fewer relevant datasets for New Zealand. Additionally, SimaPro V9.0 provides similar or greater transparency with more suitable regional datasets. Including GaBi would not have significantly enhanced the study due to overlap in functionality and data quality. Excluding GaBi thus helped ensure cost-efficiency, regional relevance, and methodological fairness.
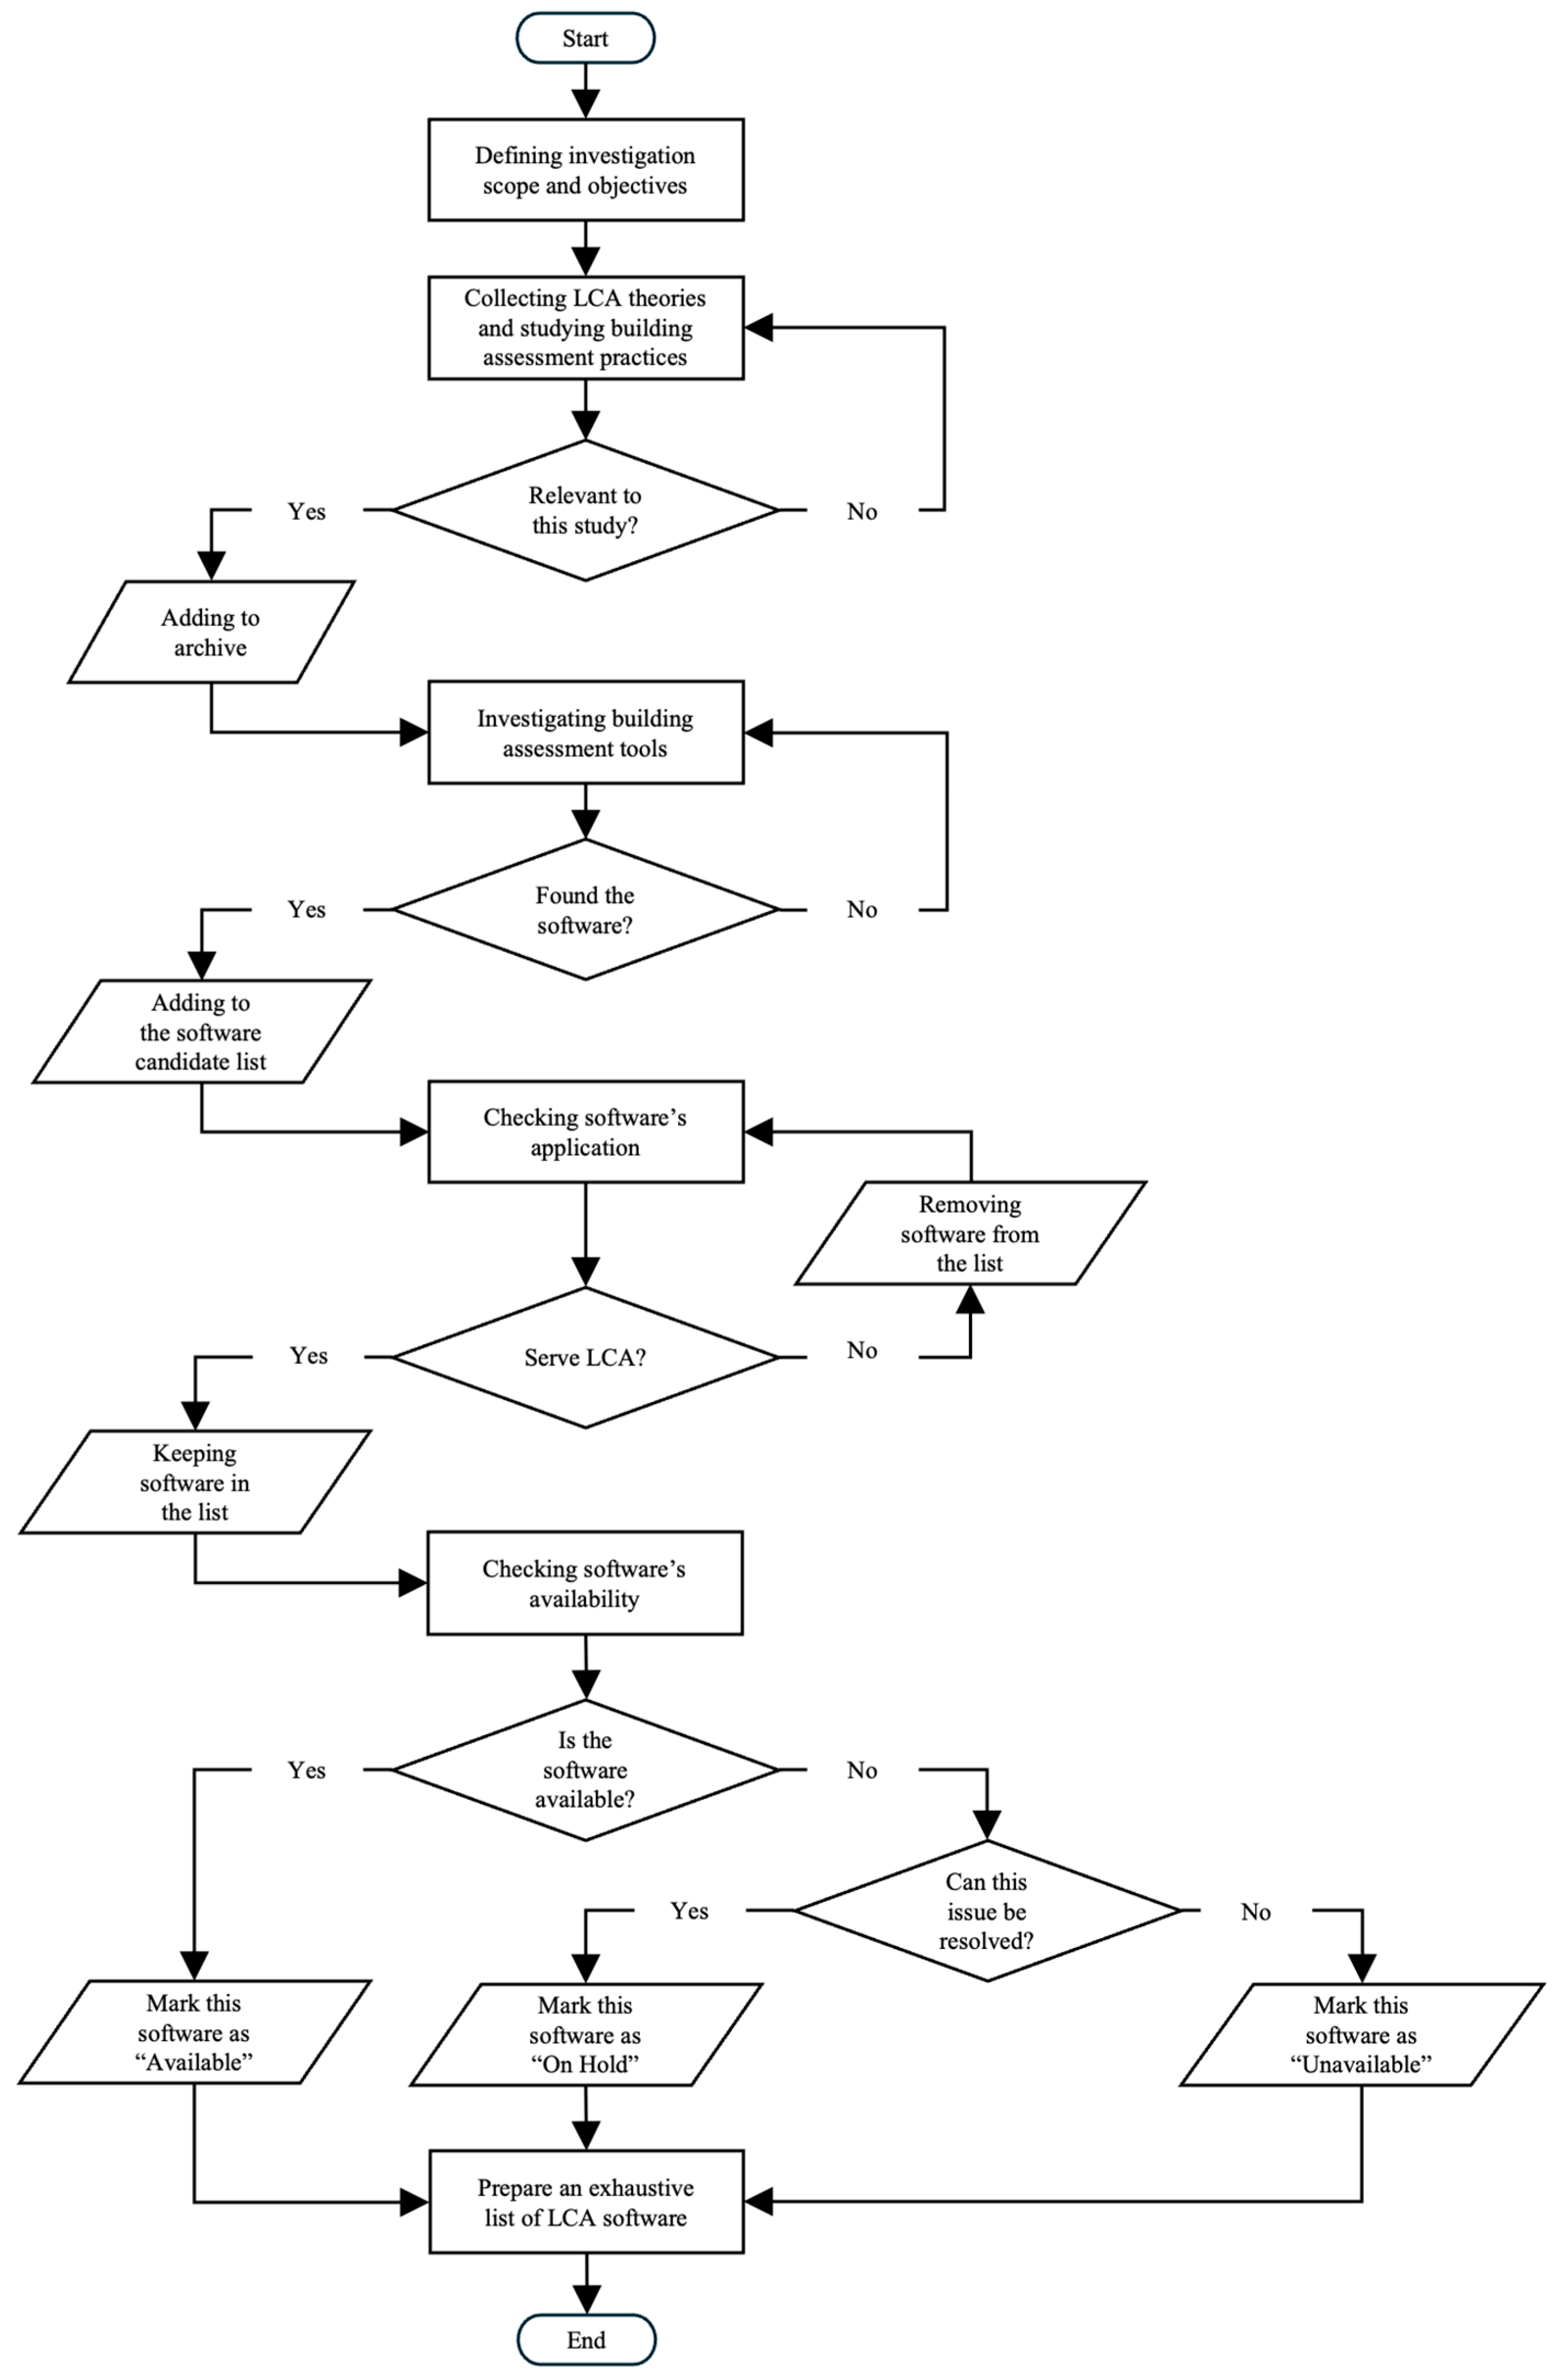
Software selection followed a systematic evaluation based on a structured flowchart (Figure 3), beginning with an initial background study and a literature review to identify relevant LCA criteria tailored explicitly to building applications. Information collection and software selection were conducted through a hierarchical process, starting by establishing the research scope and specific objectives. This was followed by an extensive gathering of software-related data and current building assessment practices. The accuracy and reliability of the collected data were ensured by documenting key information, including software developer details, software type, official webpage, launch year, headquarters location, and primary industrial application. If the relevance of a software suite to building LCA was insufficient or unclear, additional information was gathered and integrated into a comprehensive archive. Once their relevance to the study was confirmed, specific candidate software tools were identified from the archived dataset, encompassing a wide range of solutions developed across various industries. Each software application was then rigorously assessed to confirm alignment with the study’s objectives of supporting accurate LCA calculations in the construction sector. Tools explicitly designed for construction-sector LCA were retained in a candidate list, while software lacking clear building assessment capabilities or essential LCA functionality was systematically removed. Subsequently, shortlisted software applications underwent rigorous screening to ensure their direct applicability to building-specific LCA tasks. Finally, after completing the candidate list, software accessibility and availability were thoroughly evaluated, considering practical constraints such as ongoing development status or discontinued updates. Active software providers offering trial versions or relevant case studies were considered viable options. Software tools readily available for download were classified as “Available,” whereas those constrained by licensing restrictions or technical barriers were categorised as “On Hold” or “Unavailable.” This structured approach resulted in a comprehensive and rigorously vetted software selection process, enhancing methodological transparency, reducing selection bias, and increasing this research’s reproducibility and practical relevance.
To ensure a fair and transparent comparison, a consistent testing procedure was applied to the selected LCA software tools: SimaPro V9.0, openLCA V2.0, LCAQuick V3.5, BCC V1.0, CCaLC2 V3.1, eTool V5.0, OCLCA, and IE4B V5.4. All of the software was chosen based on compliance with ISO 14040/44 standards [14], the availability of transparent documentation and datasets, and a mix of open-source and commercial access to reflect typical industry practice. While GaBi is globally recognised for its modelling capabilities [15], it is excluded from this study due to licensing constraints and the lack of New Zealand-specific databases, which could have compromised fairness and regional relevance.

3.3. System Boundary and Functional Unit

This research focuses on studying the environmental impacts from cradle to gate, which includes raw material extraction, building material production, transportation, on-site assembly, and building construction processes. Compared to a whole life cycle assessment boundary, the limited life cycle stages bring more benefits than issues. The operational and EoL phases are excluded to maintain consistency across the selected LCA software, many of which lack the capability or transparency to model these stages with sufficient accuracy. The cradle-to-gate approach is practical for early-stage building assessments. This is when decisions about material selection and procurement have the most influence. The functional unit used in this study is one kg of building materials, defined as the final output from the product system. This unit was chosen because it provides a clear and consistent basis for quantifying environmental impacts across all software platforms, regardless of database structure or modelling approach differences. Using a mass-based functional unit allows for direct comparisons between tools, since each software assesses the environmental impacts associated with producing, transporting, and assembling an identical quantity of material. This approach makes a balanced comparison between theoretical studies and real construction decisions. A mass-based functional unit also allows for direct comparison, since each software evaluates the impacts of producing, transporting, and assembling the same material quantity. This ensures a balanced comparison between theoretical modelling and real construction decisions. As building material quantities are typically measured by weight, this approach also supports transparent benchmarking of results. It enhances their relevance for practitioners evaluating material choices and their environmental effects in actual projects.
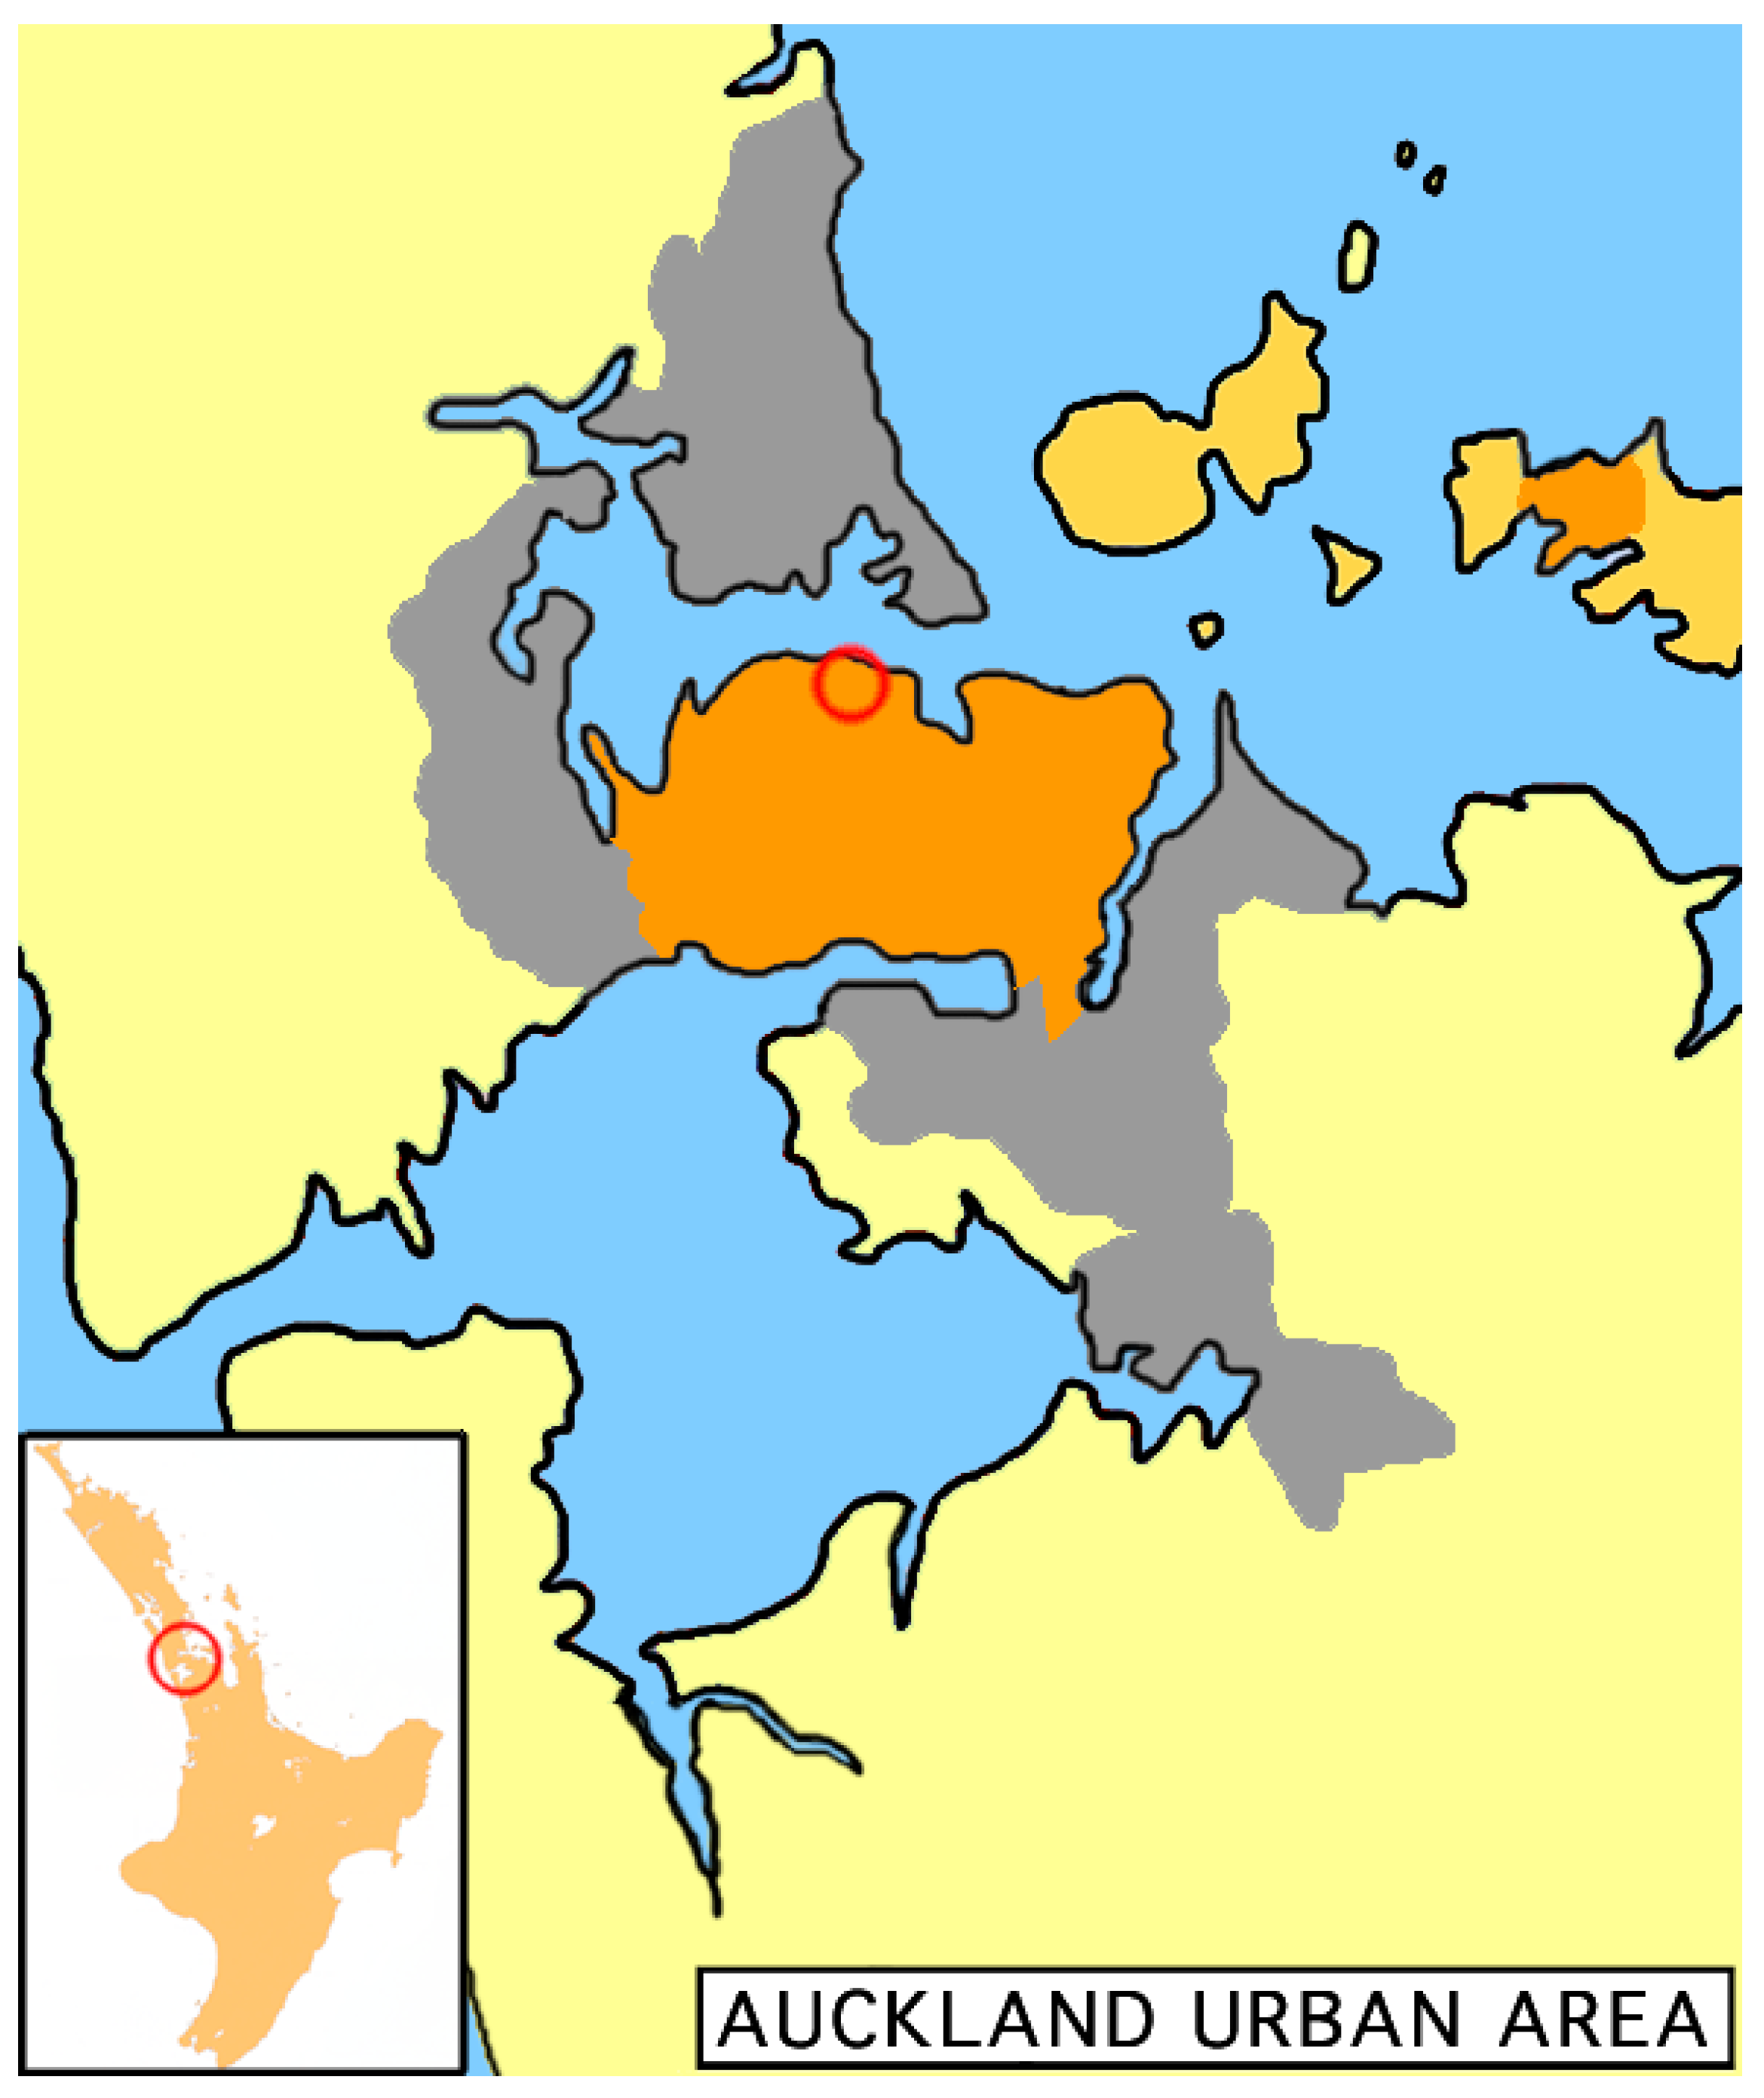
The simulation covers only the cradle-to-gate stages. Operation and end-of-life are omitted. Building materials are inputs, and the shed is the output. The project is in Auckland, New Zealand (see Figure 4). A transportation distance of 20 km per metric tonne is used where applicable. The product system may have more unit processes if the building materials are unavailable in the database or the database provides no product-level data. For example, ready-mixed concrete at 20 MPa made by Firth Concrete is a product which can be used as input directly to the reference flow. If the specific concrete is not in the database, cement, crushed gravel, water, and electricity can be used to produce the concrete, and this production process is a unit process.

3.4. Assumptions

This study is based on multiple assumptions covering input data, life cycle stages, and assessment methods. Regarding the life cycle stages, the operational and EoL stages are excluded from this study due to functional limitations in several of the LCA software assessed, particularly in modelling these stages with consistency and detail. While the EoL stage is critical to whole-building LCA in many directions, like circular design, modularity, and disassembly design, the simulations often require project-specific operational data or post-use scenarios that are not uniformly supported across tools. The EoL stage usually includes demolition, waste treatment, recycling and recovery, incineration, and landfilling. Although these processes are highly relevant for evaluating strategies like modular design and material reuse, many tools either lack a configurable EoL process or apply generic assumptions that vary significantly by database and region. EoL impacts are sensitive to variations in material types, like recycled and virgin materials, and this is even more difficult to control with different LCIA methods, which have different cut-off strategies. The waste management and characterisation factors also introduce uncertainties. The material and process flows connected to the EoL stage are often treated as inputs into new product systems, further complicating system boundaries and inflating uncertainties [16,17]. While excluding construction and EoL waste may lead to a conservative estimation of total environmental impacts, this limitation is a necessary trade-off to maintain methodological and configurative consistency across all software platforms studied.
The information and data sources used in this study are assumed to be reliable. The material information is collected from various sources, and verifying data quality is always challenging, although some pathways may improve data quality [18]. The database used in this study is assumed to be accurate. All building materials are considered to be purchased within New Zealand. A transportation of 20 km was applied to all materials and processes, covering most of the Auckland region. The transportation covers Auckland Central, Albany on the north shore, Henderson in the west of Auckland, Mangere in the south of Auckland, and East Tamaki. The materials are assumed to be transported by freight/lorry, and the truck’s size depends on available options. The transportation of building materials gives 265.65 tonne × kilometre (tkm) (this quantity equivalent to transporting 1 tonne of cargo by 265.65 km, or 265.65 t of freight by 1 km), calculated using 13.28 tonne by 20 km [19].

3.5. Material Inventory and Input Data

Standardised inputs refer to data or material specifications consistently defined and uniformly applied across all software tools and assessment scenarios within a study. In the context of LCA, this typically involves ensuring each tool receives identical information regarding detailed quantities, material types, product characteristics, and transport assumptions derived from a single, well-documented source. To ensure fairness and transparency, we first compiled a comprehensive inventory from construction documentation and supplier data, clearly defining each material type, composition, unit processes, quantity, and transportation. When exact material matches were unavailable within certain software tools, the closest available alternatives were selected based on similarity in composition, production processes, and geographical representativeness. Each substitution was carefully documented, and the rationale for selecting alternatives was clearly recorded to minimise variability. This systematic approach ensured consistent and transparent input data, enabling reliable and direct comparisons across different LCA software platforms.
The standardised inputs to the software simulation were derived from a detailed material inventory (Table 1) of the timber-framed warehouse (see Figure 2) constructed in Auckland, New Zealand (see Figure 4). This material inventory includes building components such as the concrete foundation, timber framing and columns, metal cladding, roof underlay, safety netting, flashing, fixings, and doors. Each item was quantified based on size, unit weight, and total calculated weight to enable material-level inputs across all LCA software. For instance, the concrete foundation comprised 4.76 m3 of 17.5 MPa casted concrete with a unit weight of 2240 kg/m3, resulting in a total weight of 10,662.40 kg. Timber components are specified by size and wood grade, like RAD MG SG8 H3.2. At the same time, steel and aluminium items such as roller shutters and roof flashing are calculated by area and corresponding unit weights. Miscellaneous components, primarily connectors, are included based on unit specifications. These values are used to construct the product system in each LCA tool, ensuring consistent data entry for reliable cross-tool comparison of environmental impacts. The building’s documentation contains little information about feedstocks and manufacturing processes. Data on material composition and energy use were collected from online stores, reports, and journal papers. Depending on the software, all materials were assumed to be transported by sea freight or land lorry.

3.6. Modelling Approach and Simulation Steps

This study employed the ReCiPe 2016 Midpoint (Hierarchist) method as the primary LCIA approach, chosen for its comprehensive coverage of environmental impact categories relevant to the construction sector and its widespread implementation in leading LCA software [20]. ReCiPe 2016 offers a harmonised and robust set of midpoint indicators. They are internationally recognised and allow comparisons between tools from different regions. While some tools support other methods like TRACI (North America) or ILCD (Europe), ReCiPe 2016 was chosen because it is available in most tools. It allows a comprehensive cross-platform assessment. Its balance of scientific rigour, practical relevance, and thorough documentation makes it suitable for comparative analysis. In cases where a software platform did not natively support ReCiPe 2016, results were mapped and harmonised using established conversion factors to maximise comparability. The conversion factors vary between LCIA methods and impact categories. For example, the GWP results of the ILCD method need to be multiplied by 0.43 before making a comparison with the results from the IMPACT method [21]. The 50-year assessment period was selected in alignment with international building LCA practices, and the system process model was preferred over the unit process model to enhance simulation accuracy.
There is an essential distinction in how tools handle input modelling. SimaPro V9.0 and openLCA V2.0 allow detailed material-level inputs. This makes it possible to represent building components precisely and adjust process assumptions. By contrast, LCAQuick V3.5, BCC V1.0, and others use product- or assembly-level inputs. This simplifies data entry but can hide the influence of specific material choices or manufacturing routes. This distinction affects the granularity of the inventory and can contribute to differences in impact results, especially when standardising inputs across tools. The material inventory was used as the common data set for all software to address this. Where direct material matches were unavailable in each software’s library, the most similar alternative, typically the closest product upstream in the supply chain, was transparently substituted and documented to maintain methodological consistency.
All software simulations followed the four stages defined by ISO 14040/44: goal and scope definition, inventory analysis, impact assessment, and interpretation [22]. Simulations were restricted to the cradle-to-gate system boundary to enhance comparability, as operational and end-of-life phases are not uniformly supported and are less relevant to early-stage design decisions [22]. All harmonisation, mapping, and conversion steps were carefully recorded. Impact results were exported and where necessary adjusted to ensure units and impact category definitions were comparable across all platforms. This comprehensive approach, alongside the rationale for software and method selection, ensures that the comparative analysis presented in this study is robust, transparent, and broadly applicable for both regional and international readers [14,20,23,24,25].

3.7. Impact Categories

Fourteen midpoint impact categories, including Global Warming Potential (GWP), Ecotoxicity, Fine Particulate Matter Formation, Fossil Resource Scarcity, Freshwater Eutrophication, Human Toxicity, Ionising Radiation, Land Use, Marine Eutrophication, Mineral Resource Scarcity, Ozone Formation, Stratospheric Ozone Depletion, Terrestrial Acidification, and Water Consumption, were compared across the assessed LCA software wherever the data are available. However, it is recognised that specific tools, such as the BCC V1.0, report only GWP. These tools were nonetheless included in the study to reflect the diversity of LCA practices and options currently available to practitioners, particularly in the New Zealand construction sector. Although their coverage is limited, GWP remains the most widely used and regulatory-relevant indicator, often serving as the core metric in building certification and policy contexts. By including such tools, the study highlights the strengths and limitations of prevalent LCA software and enables a more realistic and representative comparison. Where tools lacked coverage of specific impact categories, the analysis and interpretation are limited accordingly, and the implications of relying on simplified tools are discussed in the results and conclusion sections. For all tools, conversion factors are applied to harmonise results, ensuring comparability even when units differed or databases varied. SimaPro V9.0, with its comprehensive coverage and use of the ecoinvent LCI database, was used as a benchmark, following established practice in comparative LCA research [26], and the results from other software were compared relative to SimaPro V9.0 to maintain consistency in the evaluation.

4. Results

4.1. Data Harmonisation

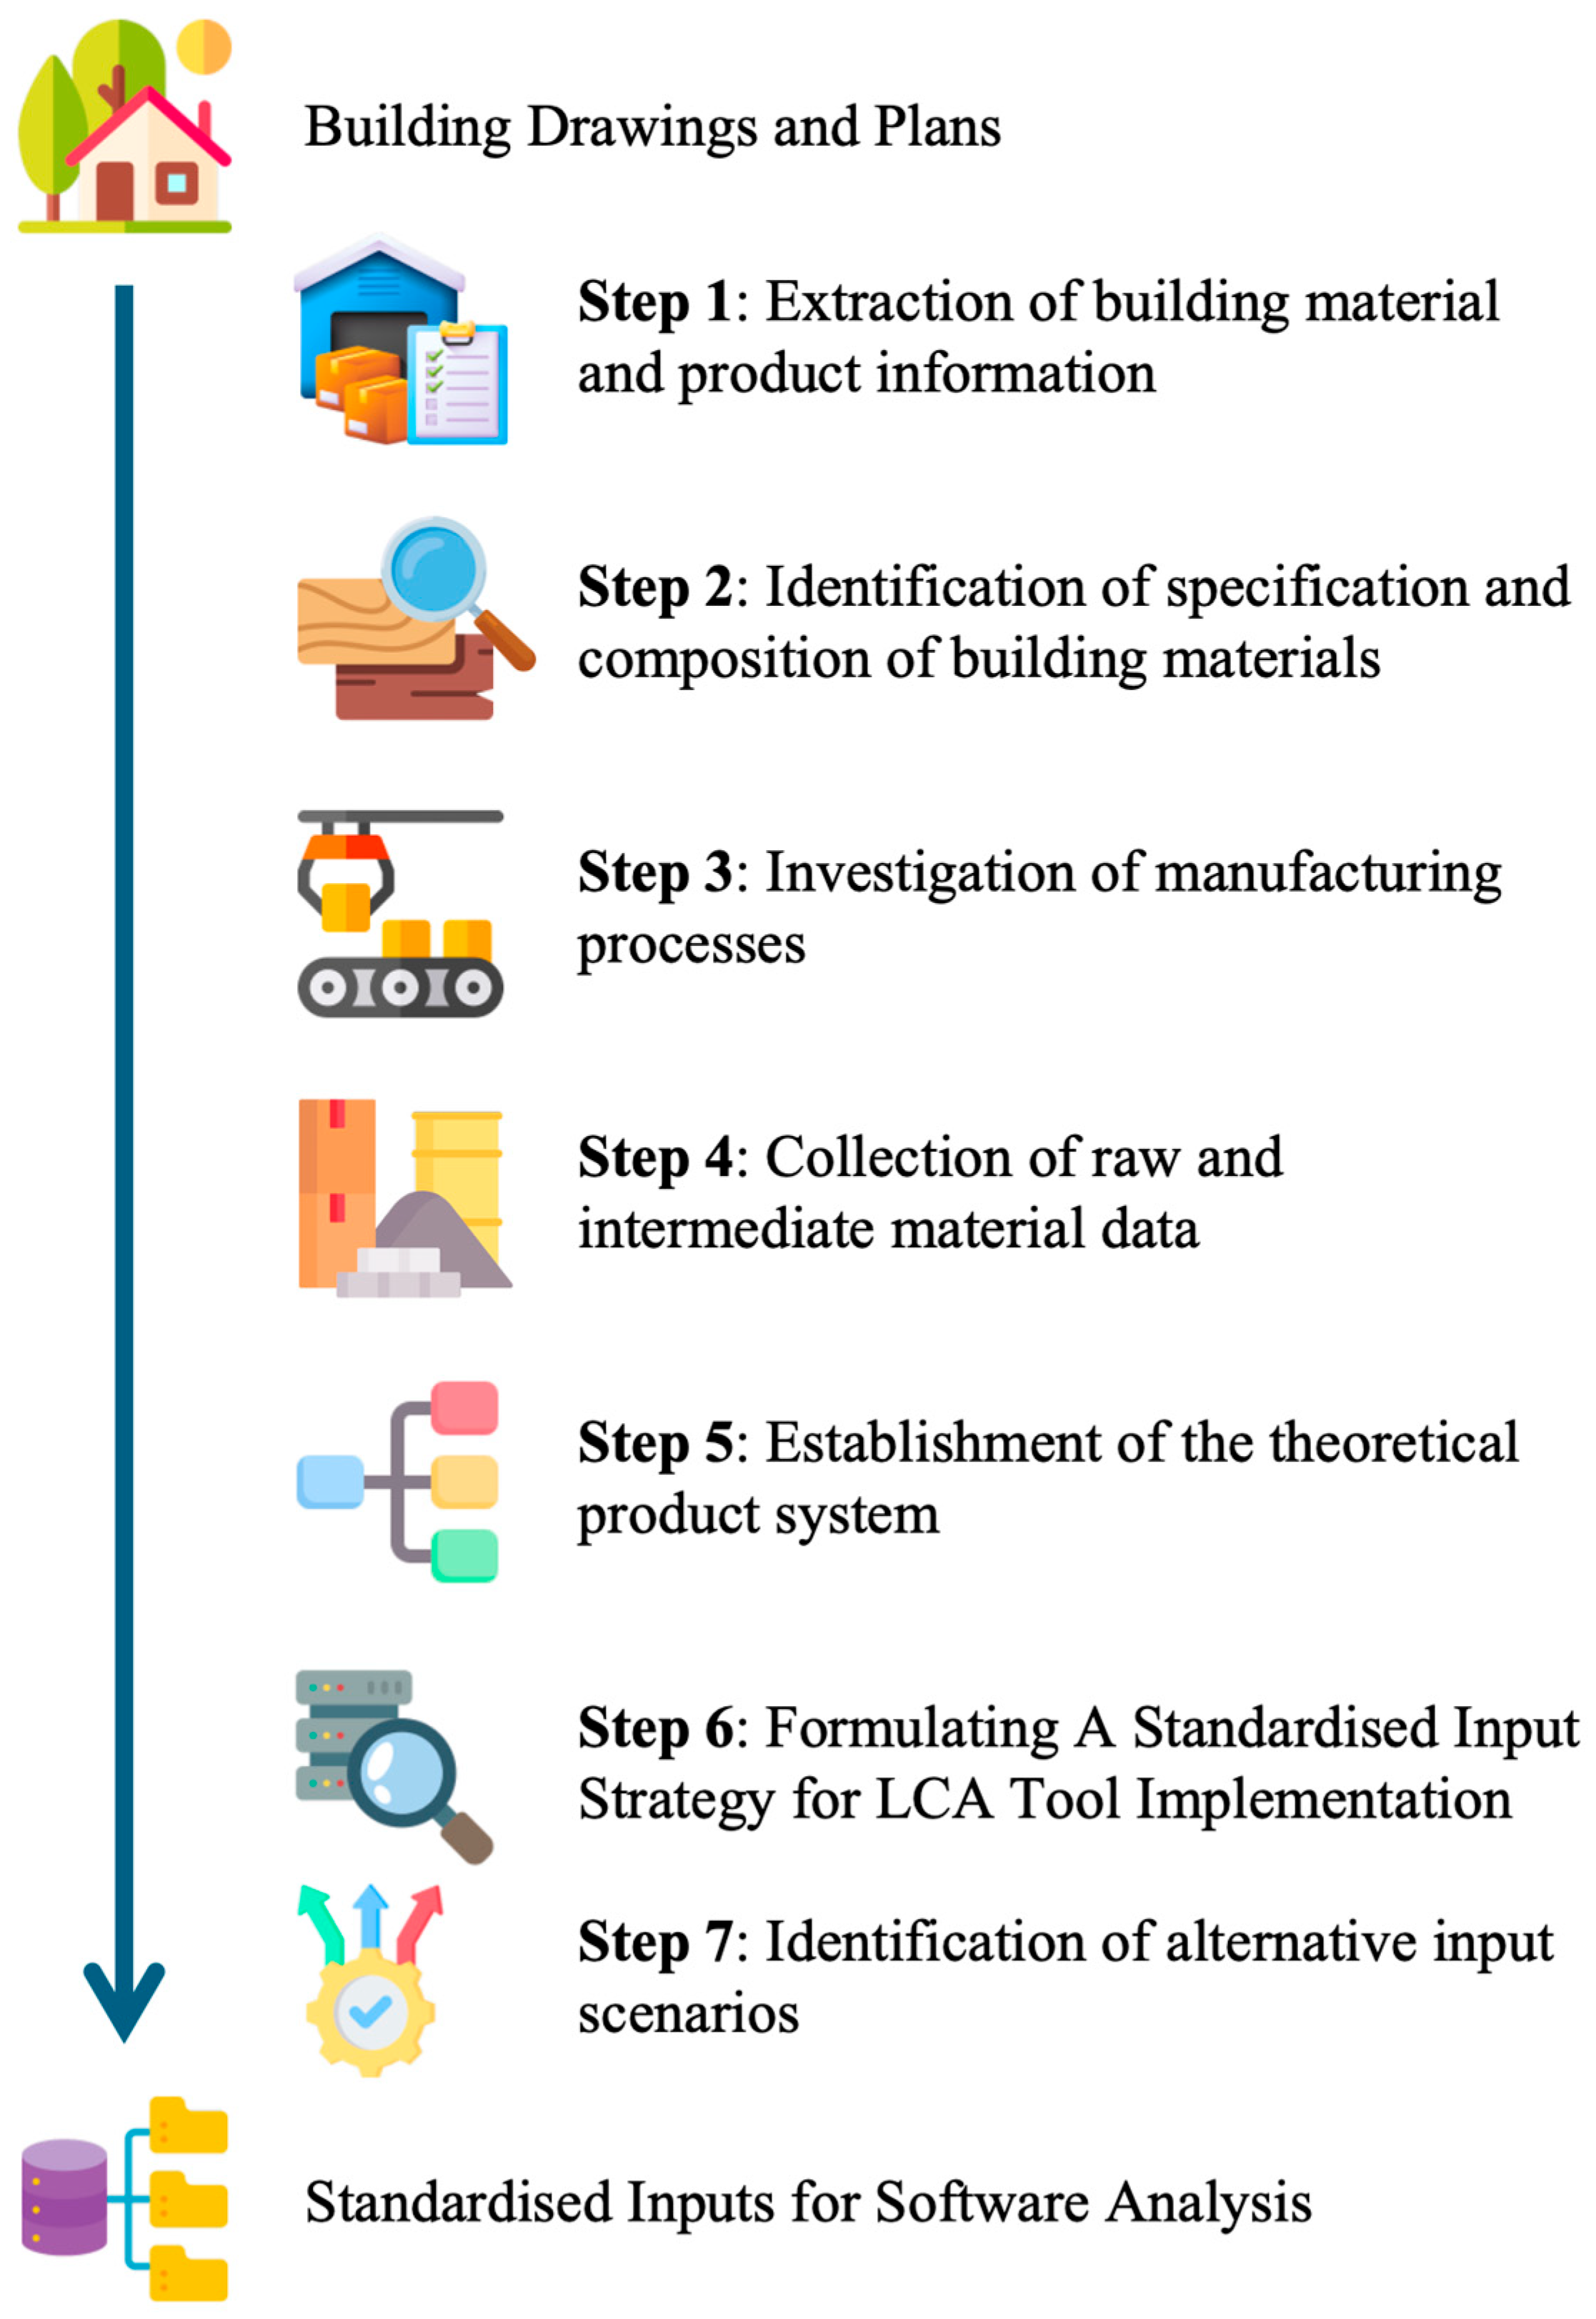
The process depicted in Figure 5 explains that the collection and preparation of input data for LCA software analysis were harmonised across all LCA software assessed in this study. This process begins with extracting building material and product information from construction drawings, plans, and other documentation, followed by identifying material specifications and compositions from searching the provided materials and products. Next came investigating the relevant manufacturing processes and collecting raw and intermediate material data. Because the documents only provided the name and category information, finding the exact manufacturing processes may be difficult. The processes that could not be identified were assumed based on information from the literature. After establishing a theoretical product system, an input strategy was formulated to ensure consistency across different LCA tools. Finally, alternative input scenarios were identified, preparing harmonised inputs for comparative software simulation. This process reduced the potential for discrepancies that often arise from input errors. Through the steps outlined in the workflow, each impact category was calculated from a unified set of inputs, thereby enabling meaningful and transparent comparisons of category results.

4.2. Quantitative Assessment Results

All of the impact category units presented have been carefully reviewed and standardised according to internationally recognised measurement conventions to ensure clarity and consistency. For example, Global Warming Potential is consistently reported in kilograms of carbon dioxide equivalent (kg CO2 eq). At the same time, Fossil Resource Scarcity is expressed in kilograms of oil equivalent (kg oil eq), following the definitions established by the ReCiPe 2016 method. Any unit assignments are explicitly stated in the table and clarified in the table caption to avoid ambiguity and facilitate accurate interpretation of the results.
Units for each impact category depend on the material datasets and the chosen assessment methods. Conversion factors should be used to enable fair comparisons between software and databases, even when results share the same units. Finding suitable conversion factors is challenging due to limited research. However, conversion factors exist for CML, EDIP, EF, EPD, ILCD, IMPACT, ReCiPe, and TRACI [21]. The ReCiPe method is available in both SimaPro V9.0 and openLCA V2.0. No conversion is required between SimaPro V9.0 and openLCA V2.0. The material datasets used by LCAQuick V3.5 are stated as EPD in the description. The assessment method is the EPD method. IE4B V5.4 uses TRACI (2012 version) in six impact categories: fine particulate matter formation, GWP, ozone formation, stratospheric ozone depletion, and terrestrial acidification.
Fossil resource scarcity from IE4B V5.4 is calculated using an unknown method, but the result is treated as from TRACI. The method used by BCC V1.0 and OCLCA remains unexpressed. No conversion factor was applied to the two software. Results from CCaLC2 V3.1 were assumed to be calculated using the CML method because units of most of the impact categories were aligned with the units in CML, with the exception of water consumption. The water consumption is from the ReCiPe method, which will not be converted. The method of eTool V5.0 is also unstated. According to the units of some impact categories, the method is assumed to be the EF method. However, the formation of fine particulate matter, land use, and terrestrial acidification are part of the IMPACT method. Those were converted using the factors for IMPACT. The marine eutrophication from eTool V5.0 is calculated using the EPD method.
Only results in the same category were converted. The mismatched categories were not used in the comparison. The conversion factors were applied to the categories based on the assessment method. If the method is not stated, the elements were selected based on the source of material characteristics. Several impact categories were combined for a better comparison. Freshwater ecotoxicity, marine ecotoxicity, and terrestrial ecotoxicity are incorporated into ecotoxicity. Human carcinogenic toxicity and human non-carcinogenic toxicity are integrated into human toxicity. Ozone formation, human health, and ozone formation in terrestrial ecosystems are connected to ozone formation. All of the combined impact categories share the same units. No conversion was applied between combined categories. All units were converted following the units used by the ReCiPe method. An impact category could be shown with different names from various methods. The category name from ReCiPe was used as the standard name for all impact categories. Only the midpoint categories of the ReCiPe were compared. The endpoint impact categories were not aligned with most assessments. The information about the default assessment method used by the software was collected from product sheets, user manuals, journal papers, commercial reports, and forums. Fourteen impact categories were evaluated, and the results are shown in Table 2.
Given the complexity and importance of applying conversion factors, additional documentation has been provided to outline the specific factors and assumptions used to harmonise results across different assessment methods and databases. All conversions were based on established research and, where possible, supported by official documentation or relevant studies. The selection process and rationale are explained when conversion or mapping was required due to unstated or ambiguous assessment methods. This approach enhances the transparency and reproducibility of the analysis and enables readers to critically evaluate the harmonisation procedures applied.
Figure 6 shows that SimaPro V9.0 and openLCA V2.0 cover all 14 impact categories included in this study. Both tools use standardised units, which allows for direct comparison. LCAQuick V3.5 reports seven categories in Excel. However, its units do not match those of SimaPro V9.0 and openLCA V2.0, so conversions are needed. BCC V1.0 and the trial version of OCLCA only provide results for global warming potential. This is due to limited dataset coverage. IE4B V5.4 includes nine categories, with seven used in the comparison. It applies TRACI-based methods, which also require unit conversion. eTool V5.0 reports 24 categories, but only a few overlap with the other tools. It uses EPD factors for water and minerals, and the IMPACT method for other impacts. CCaLC2 V3.1 outputs eight categories, mostly based on CML methods, and requires conversion for unit consistency. It uses ReCiPe for water impacts. These differences highlight the need for careful data alignment in cross-tool comparisons.
Figure 7 presents a comparison of impact results for human toxicity, ionising radiation, land use, marine eutrophication, and mineral resource scarcity using SimaPro V9.0 and openLCA V2.0. Both tools show similar trends for most categories, though differences in magnitude are evident. For human toxicity, openLCA V2.0 reports a higher value than SimaPro V9.0, while ionising radiation and land use show close agreement between the two. Marine eutrophication returns zero in both tools, indicating no impact under the selected scenario. For mineral resource scarcity, SimaPro V9.0 reports a higher value than openLCA V2.0. These variations highlight differences in database content and calculation methods between the two software platforms, even when using standardised inputs.
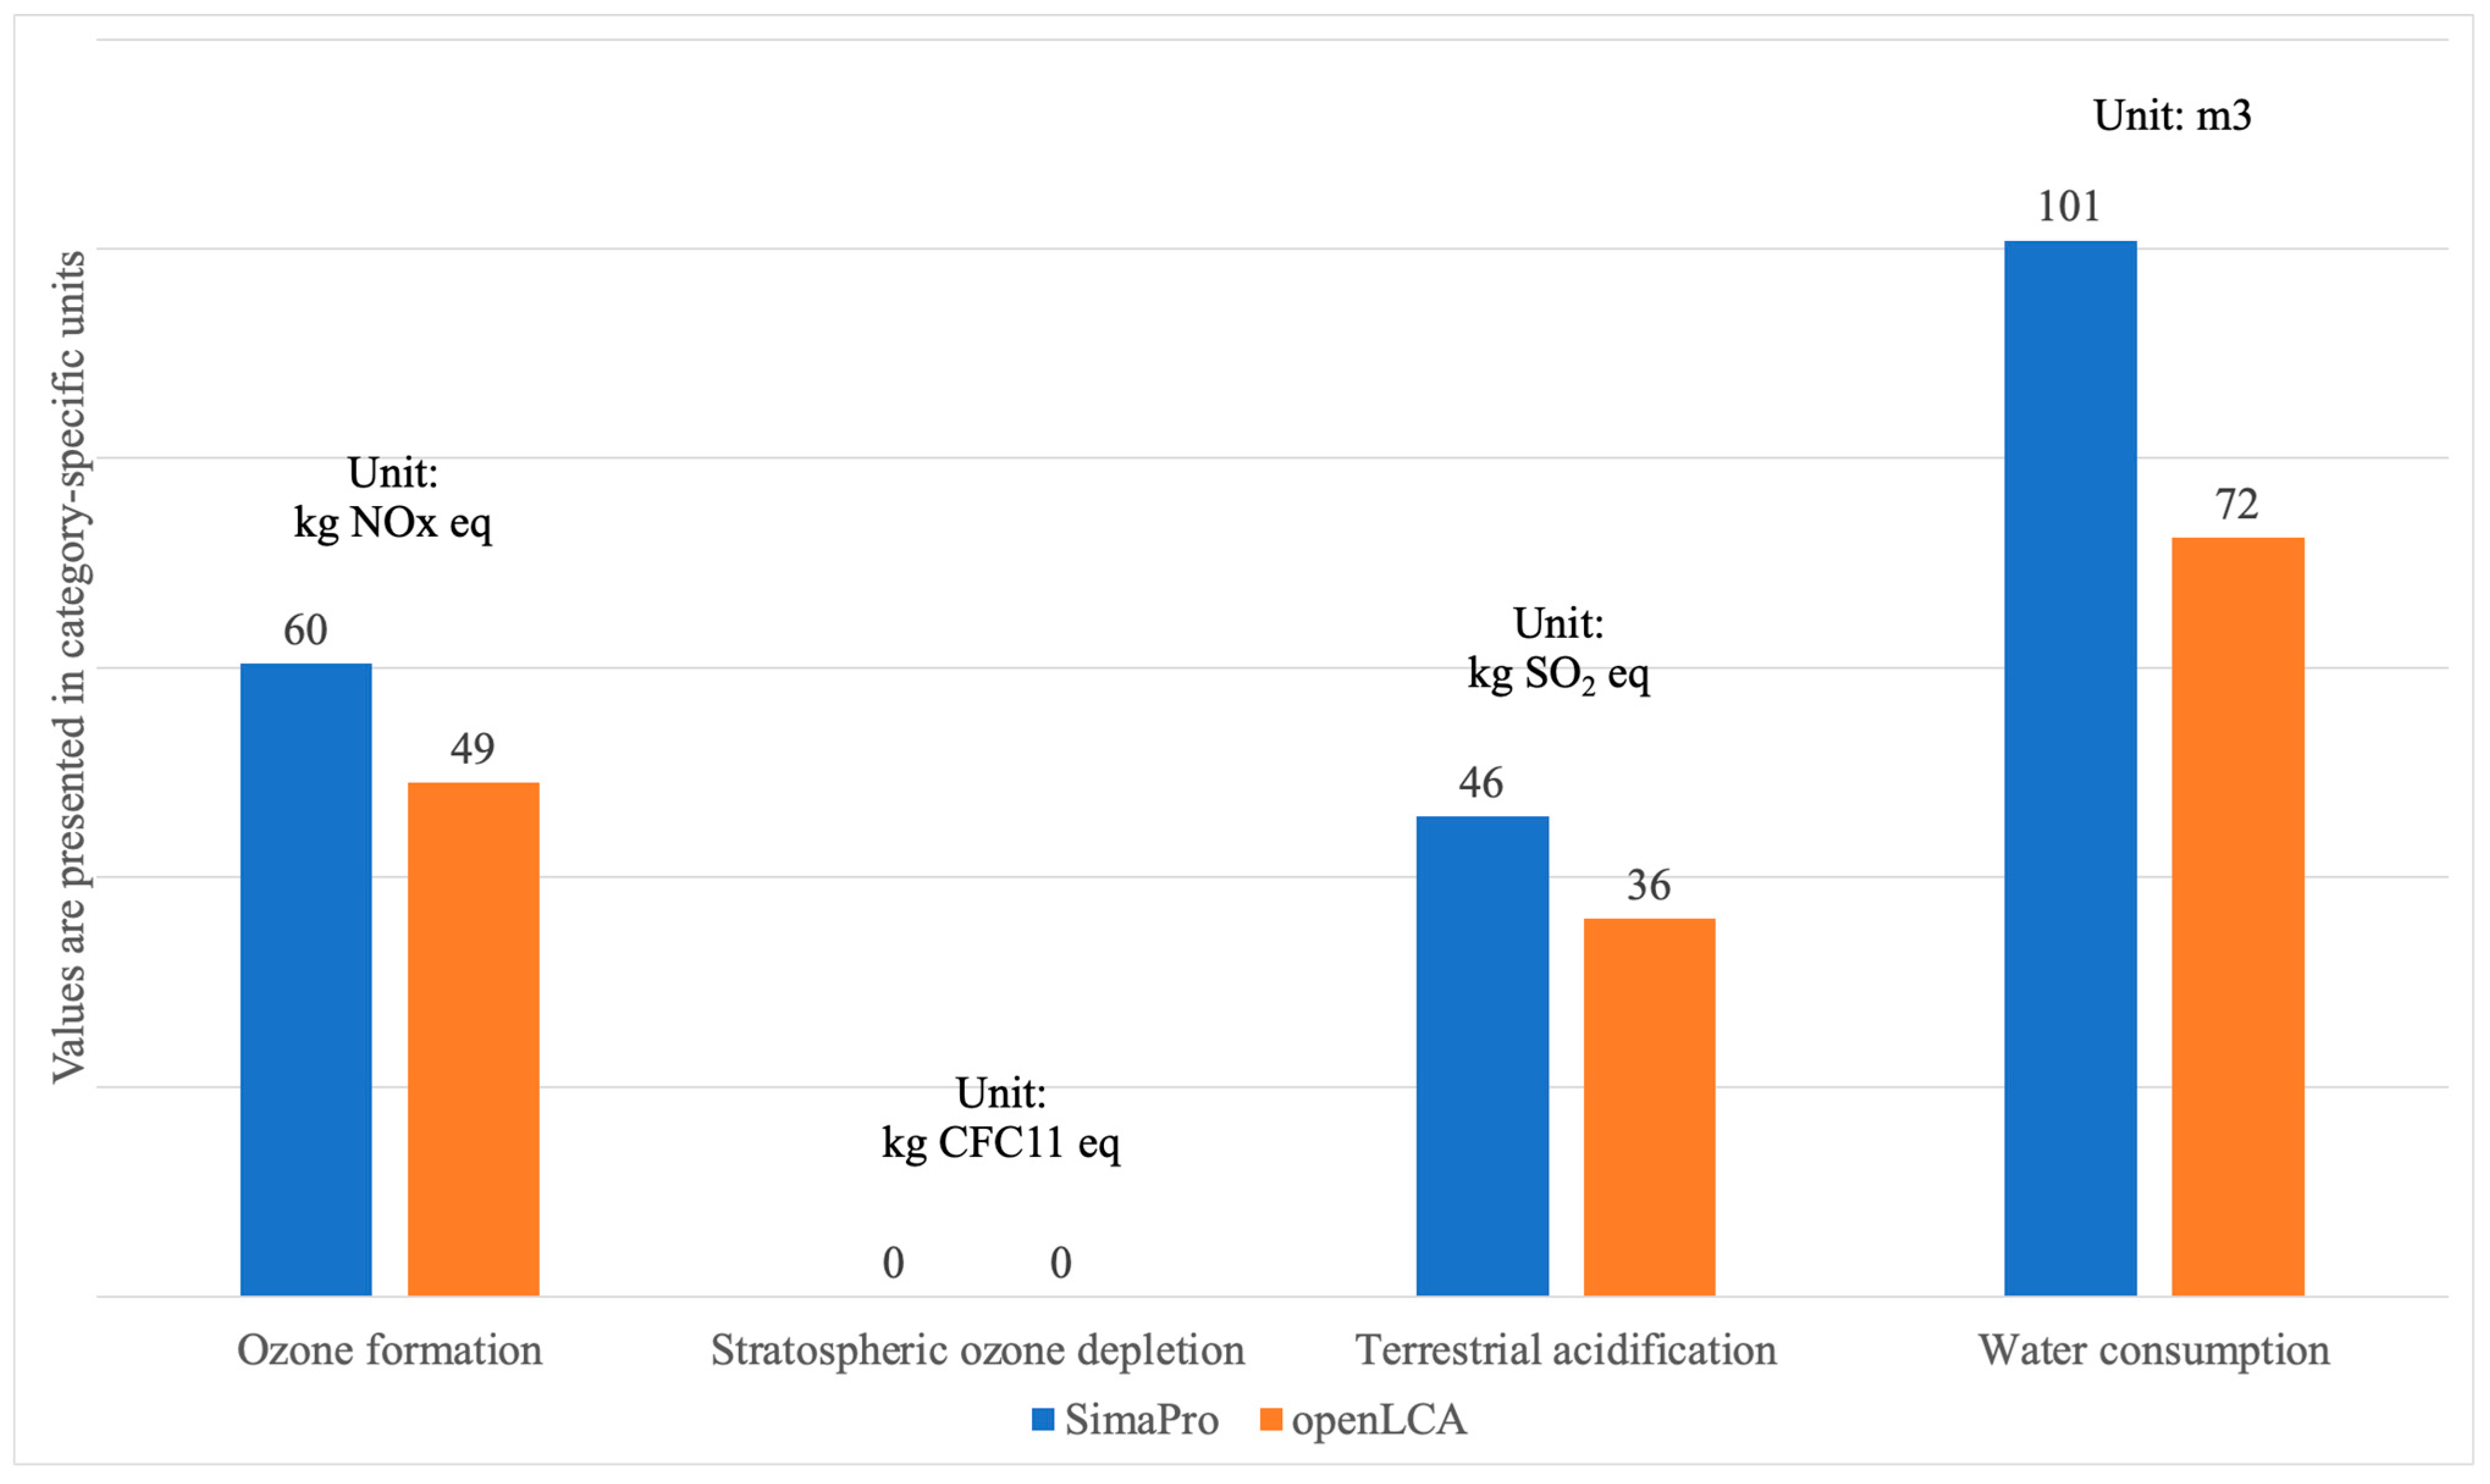
Figure 8 compares results for ozone formation, stratospheric ozone depletion, terrestrial acidification, and water consumption calculated by SimaPro V9.0 and openLCA V2.0. SimaPro V9.0 reports higher values than openLCA V2.0 for ozone formation, terrestrial acidification, and water consumption, while both tools show zero for stratospheric ozone depletion. These differences reflect variations in database content, calculation methods, and characterisation factors between the two software platforms, even when using standardised input data.
GWP is the most consistently reported and benchmarked category. However, there are significant variances in GWP results between different software. This can influence decision-making for both design and policy. Significant discrepancies may lead to inconsistent conclusions about a building’s environmental performance. This can affect material selection, certification, and the credibility of carbon reduction claims. Users should interpret GWP results carefully. Software choice and methods can significantly impact the assessment and its outcomes.
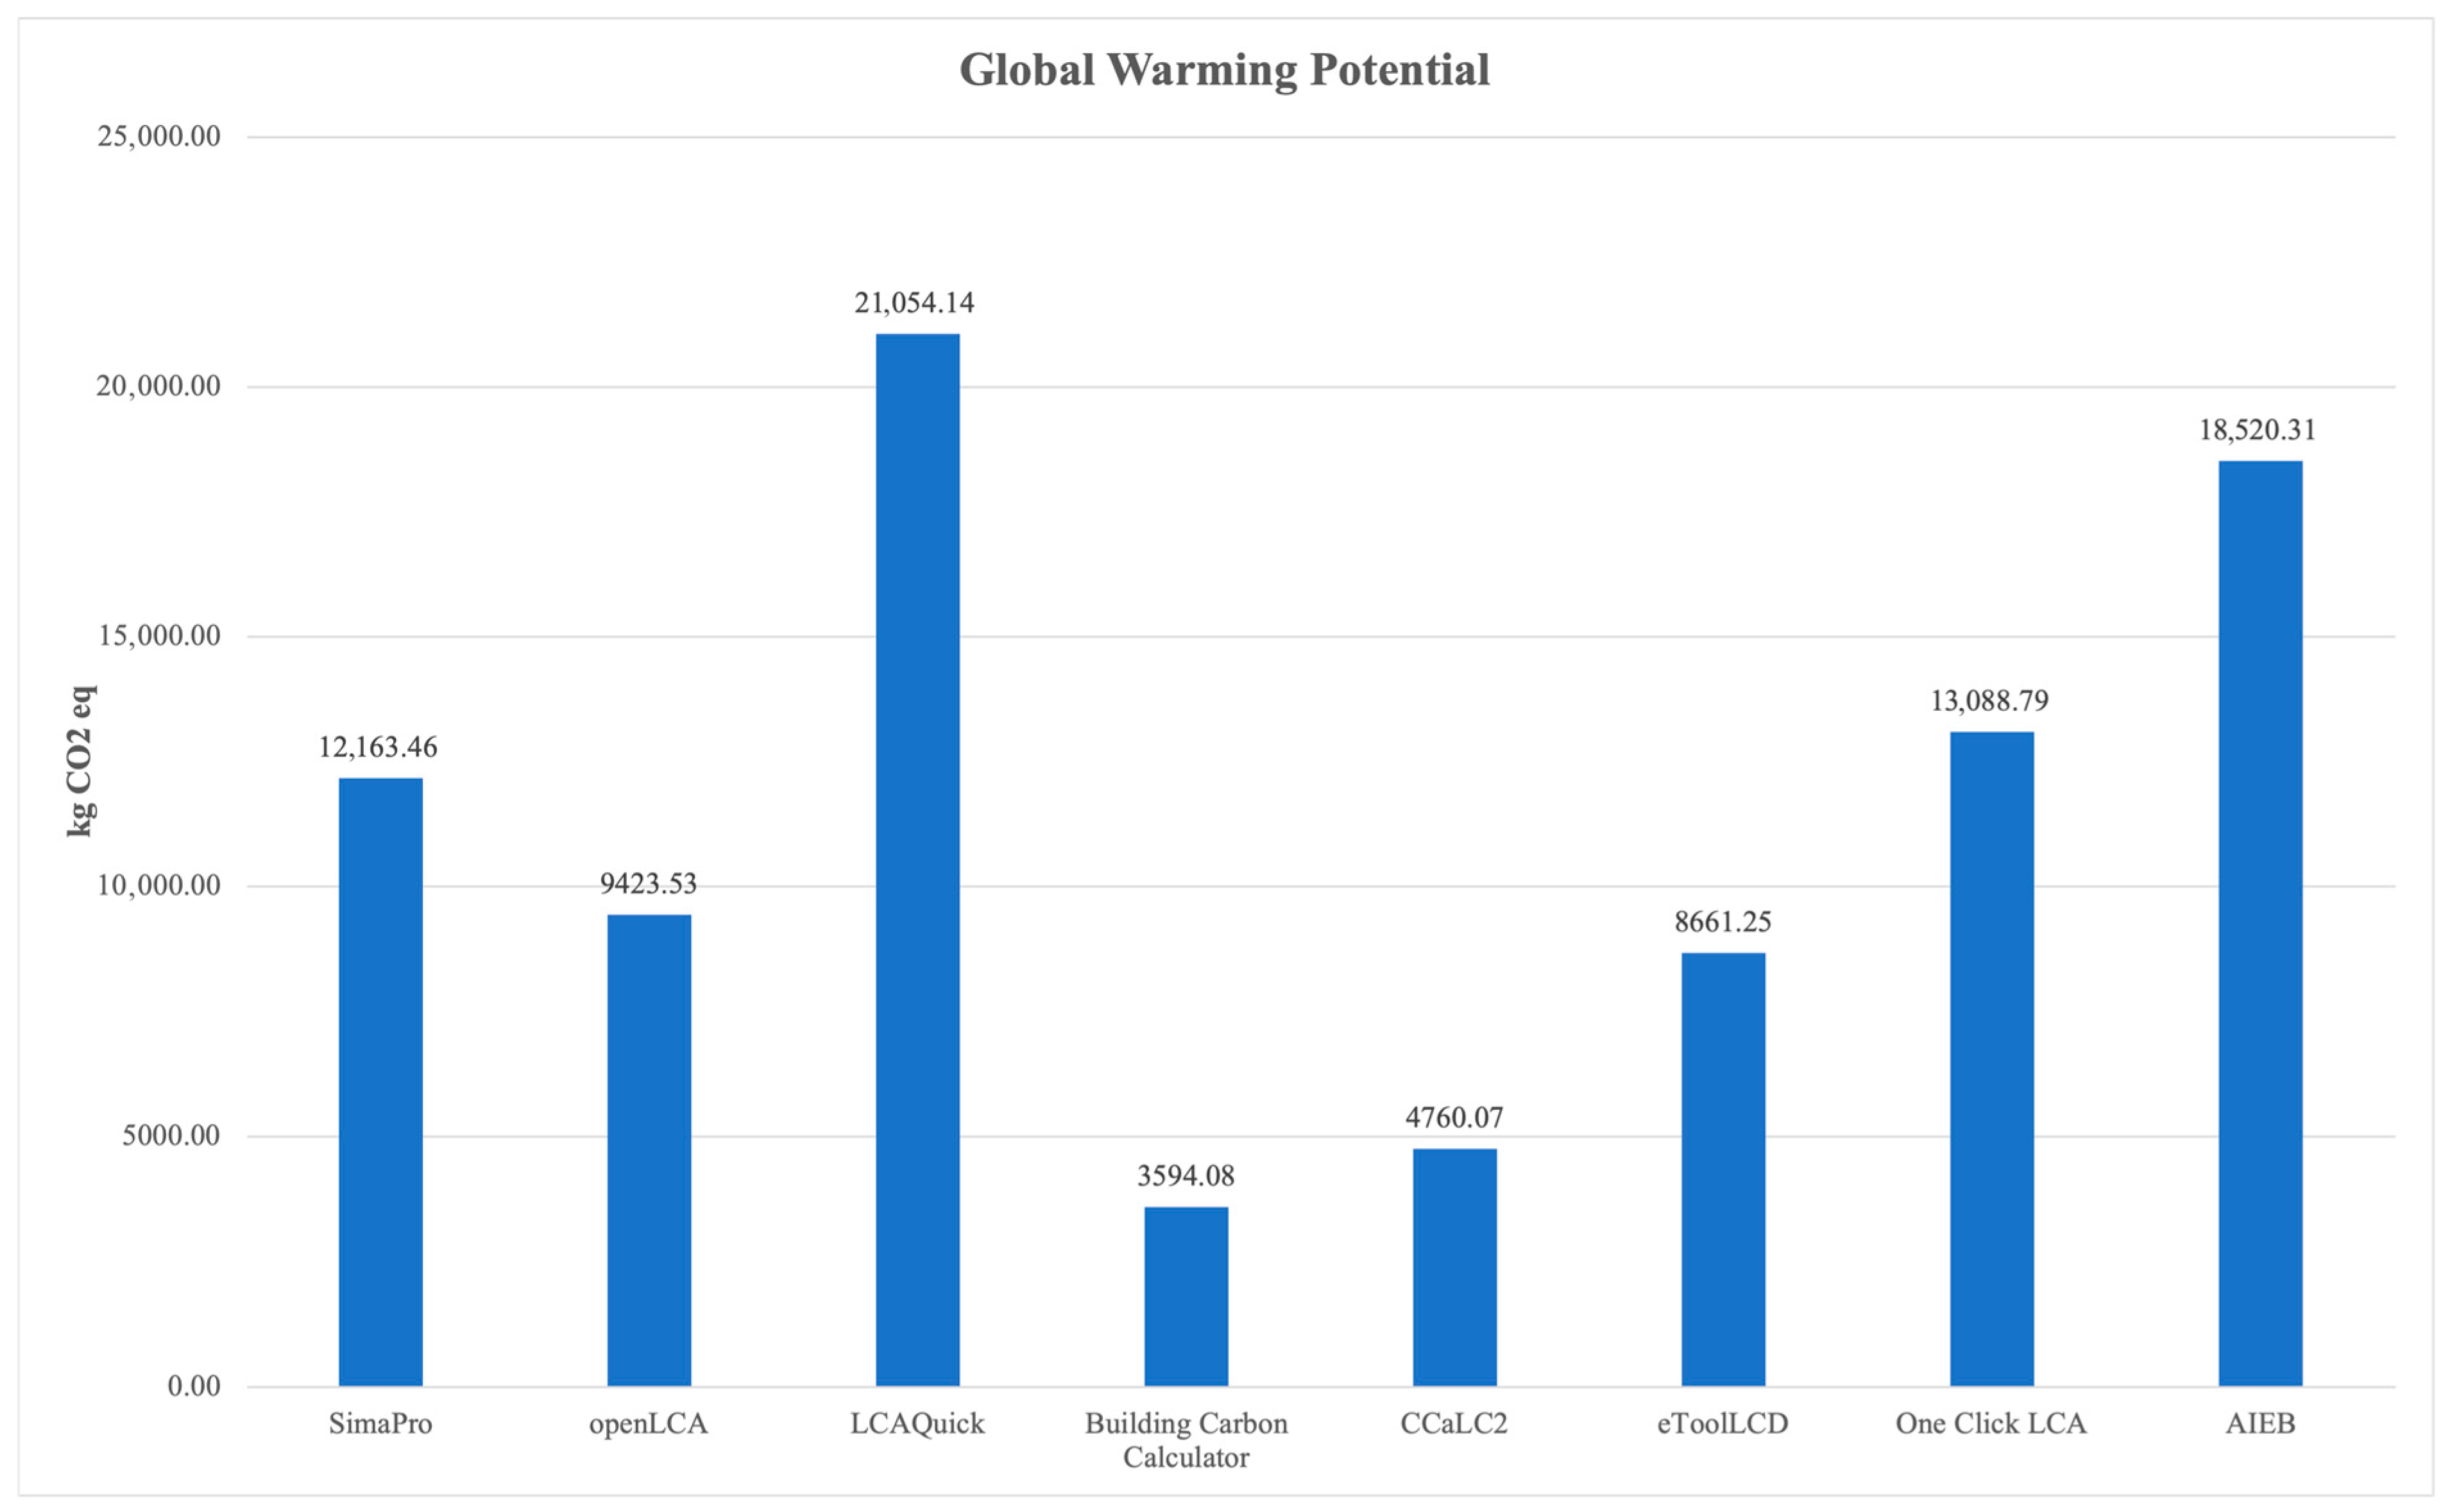
GWP Overview: The GWP was developed to quantify the warming effects of different gases, and it is measured in kilograms of carbon dioxide equivalent (kg CO2 eq). Precisely, it measures how much energy the emissions of one ton of a gas will absorb over a given period relative to the emissions of one ton of CO2. The larger the GWP, the more a given gas warms the Earth compared to CO2 over that time. If the GWP from SimaPro V9.0 is considered standard, the OCLCA shows a very close outcome. The openLCA V2.0 and eTool V5.0 provide lower but still relatively close results. The results from IE4B V5.4 and LCAQuick V3.5 are significantly higher than those from SimaPro V9.0. The results from CCaLC2 V3.1 and BCC V1.0 are relatively low compared to those of SimaPro V9.0. If considering the range between SimaPro V9.0 and openLCA V2.0 is acceptable, the OCLCA provides the most appropriate result of GWP. In GWP, SimaPro V9.0 and OCLCA show identical results. OpenLCA V2.0 and eTool V5.0 show lower but similar results, as shown in Figure 9. The similarity between BCC V1.0 and CCaLC2 V3.1 results likely stems from the simplicity of inputs and the limited assessment method options. Also, the impact is calculated by adding the impact scores, which does not aggravate the differences.
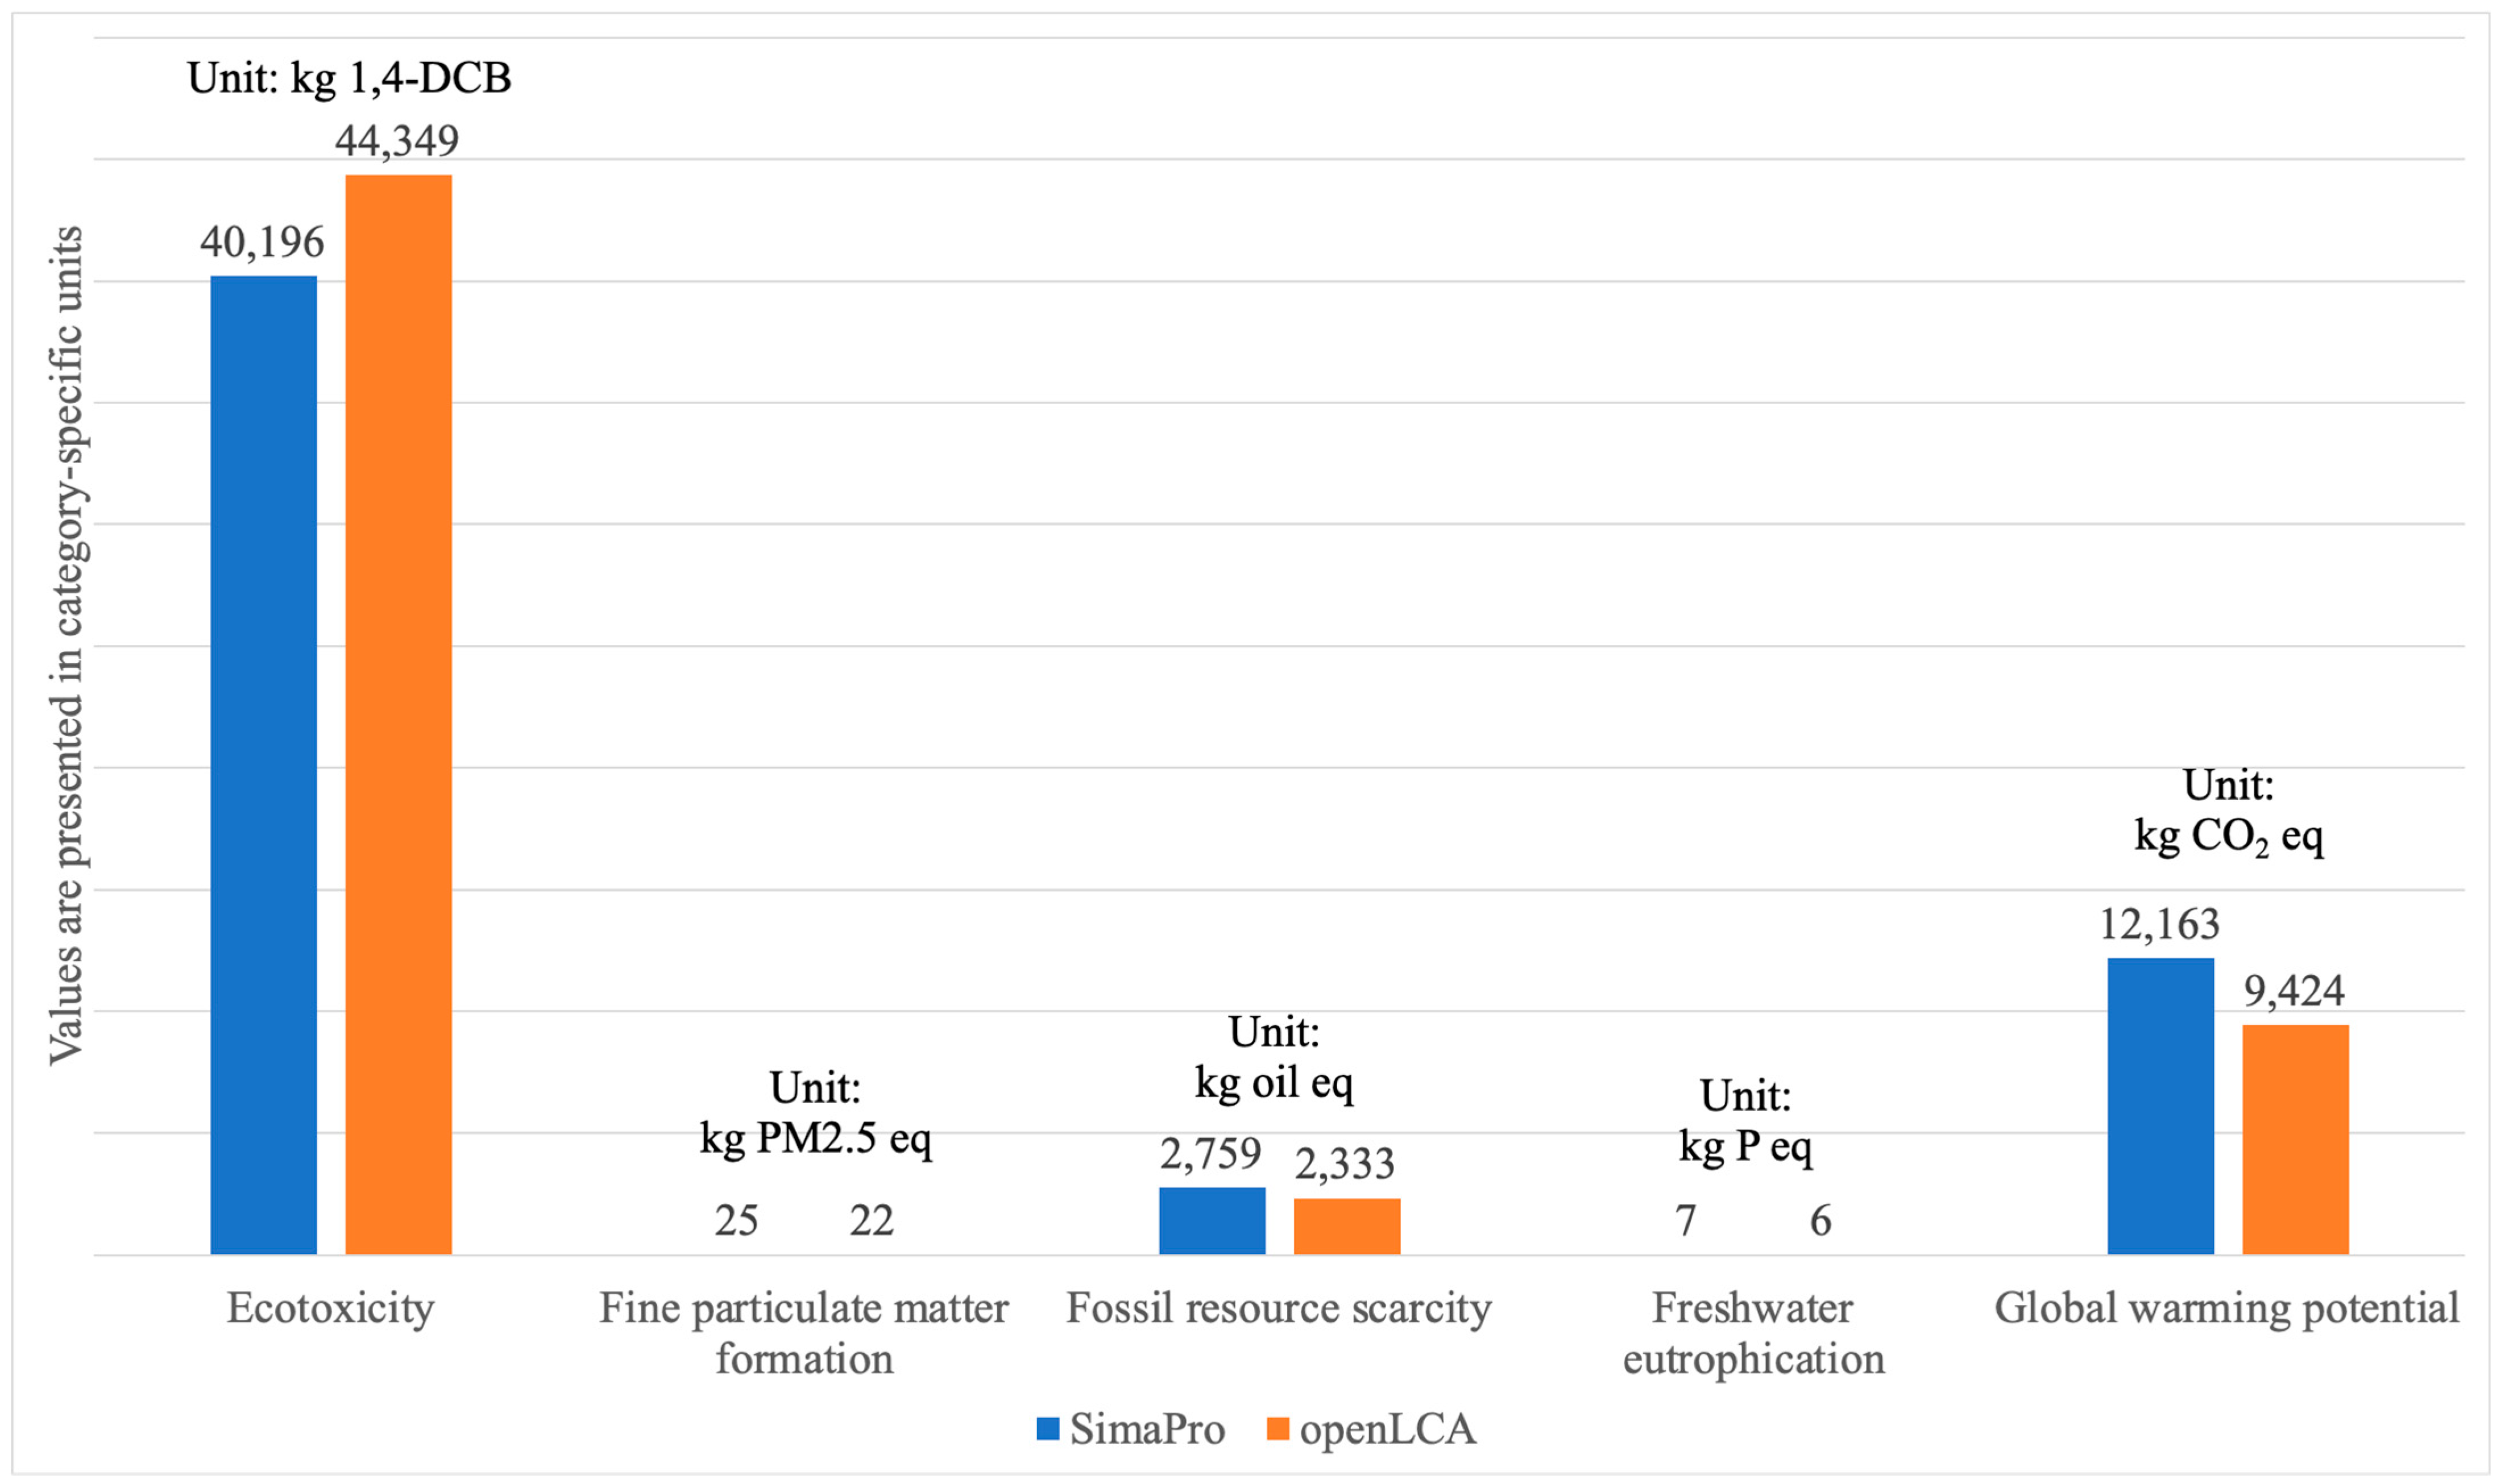
  • Ecotoxicity: openLCA V2.0 reported higher ecotoxicity values than SimaPro V9.0, likely due to the inclusion of polymers and energy-related emissions. The choice of polymers in construction can affect sustainability outcomes. SimaPro V9.0, openLCA V2.0, and IE4B V5.4 yielded similar fine particulate matter formation results.
  • Particulate matter formation: The SimaPro V9.0, openLCA V2.0, and IE4B V5.4 showed similar fine particulate matter formation results.
  • Fossil Resource Scarcity and Eutrophication: SimaPro V9.0, openLCA V2.0, and LCAQuick V3.5 provided identical results in fossil resource scarcity. The CCaLC2 V3.1 and eTool V5.0 results were lower, and the IE4B V5.4 results were significantly higher than the others.
  • Fresh eutrophication: SimaPro V9.0, openLCA V2.0, and LCAQuick V3.5 provided close results. The results of CCaLC2 V3.1, eTool V5.0, and IE4B V5.4 dropped down gradually.
  • Human toxicity and Land use: CCaLC2 V3.1 suggested a higher value, while openLCA V2.0 suggested a lower value compared to the result from SimaPro V9.0. The trend of values was generally aligned. The openLCA V2.0 tool obtained a slightly lower result in most categories except ecotoxicity and human toxicity. There were also notable differences in ecotoxicity, human toxicity, and land use. The emission of toxic chemicals primarily produces toxicity. The production of PVC coating and synthetic roof underlay could produce different chemical emissions based on feedstocks and techniques. The material inputs of the roof net and roof underlay are the most significant contributors to the inconsistency in results.
  • Ionising radiation, land use, and marine eutrophication: Compared to SimaPro V9.0, openLCA V2.0 showed lower values. The eTool V5.0 tool indicated a blooming value of mineral resource scarcity compared to SimaPro V9.0, openLCA V2.0, and LCAQuick V3.5.
  • Ozone formation: The SimaPro V9.0, openLCA V2.0, and IE4B V5.4 results were close. LCAQuick V3.5 suggested lower ozone formation. The CCaLC2 V3.1 and eTool V5.0 showed no ozone formation from the building. The eTool V5.0 was the only software that provided exceedingly high ozone depletion, while SimaPro V9.0, openLCA V2.0, LCAQuick V3.5, CCaLC2 V3.1, and IE4B V5.4 suggested no ozone depletion.
  • Terrestrial acidification: The OpenLCA V2.0 results were slightly lower than those of SimaPro V9.0, and IE4B V5.4 returned a higher impact. The openLCA V2.0 showed less water consumption than SimaPro V9.0, while the eTool V5.0 showed even less water consumption. If the range between openLCA V2.0 and SimaPro V9.0 is acceptable, the results from LCAQuick V3.5 and IE4B V5.4 are satisfactory. The openLCA V2.0 provided lower results when compared to SimaPro V9.0, and in some categories, the difference could be estimated.
  • Mineral resource scarcity: SimaPro V9.0 and openLCA V2.0 presented similar results. SimaPro V9.0, openLCA V2.0, and LCAQuick V3.5 presented relatively coherent results.
  • Terrestrial acidification: SimaPro V9.0 and openLCA V2.0 showed allied results.
  • Carbon dioxide (CO2), Methane (CH4), and Nitrous oxide (N2O): Three key materials contributed to emissions across both SimaPro V9.0 and openLCA V2.0: carbon dioxide (CO2), methane (CH4), and nitrous oxide (N2O). Among these, CO2 emissions from energy generation are the most dominant, accounting for approximately 88% of total carbon emissions in SimaPro V9.0 and over 90% in openLCA V2.0. Although methane and N2O have higher warming potentials, their overall contributions were below 10% in both tools. In this assessment of a timber building, over 98% of total emissions originated from these common materials.
Other factors assessed and compared:
  • CFCs, HFCs, and sulphur hexafluoride (SF6): SimaPro V9.0 identified additional greenhouse gases such as CFCs, HFCs, and sulphur hexafluoride (SF6), whereas openLCA V2.0 reported emissions from CHC-11 and other carbon dioxide variants. These differences likely stem from variations in supplier data and feedstock inputs, but the overall discrepancies between the tools remained below 5%.
  • Emissions from material production processes are a dominant contributor in both SimaPro V9.0 and openLCA V2.0, with SimaPro V9.0 attributing approximately 50% of total carbon emissions to iron and steel production and openLCA V2.0 reporting a similar pattern, with 52% of emissions arising from iron, steel, and zinc and 46% from energy-related processes. The observed discrepancy in emission values between the two tools likely stems from differences in steel grade selection, underlying LCI database versions, and the regional or technological assumptions embedded in each dataset. These factors can result in notable variation in emission intensities, even when modelling ostensibly similar materials. This highlights the importance of transparent material specification and database selection when comparing results across LCA platforms.
  • Coal and Natural gas: OpenLCA V2.0 reported 980 kg CO2 eq emissions for coal-based electricity, about 20% higher than SimaPro V9.0. OpenLCA V2.0 reported 443 kg CO2 eq for electricity from natural gas, which is 86% higher than the value reported by SimaPro V9.0. OpenLCA V2.0 tends to generate higher emission estimates for energy and metal production.
  • Emissions from iron and steel production: The most substantial discrepancy was in estimating emissions from iron and steel production. SimaPro V9.0 calculated a total of 3053 kg CO2 eq from five processes, while openLCA V2.0 reported 10,324 kg CO2 eq across eight processes, an increase of 238%. This significant difference likely stems from variations in selected steel grades and feedstock assumptions.
Analysing the aligned impact categories from outputs could explain the dissimilarities between the assessed software. The impact results indicate the total effects of material extraction, production, transportation, energy consumption, and EoL waste treatment [27].
The SimaPro V9.0 and openLCA V2.0 take data entry at the material level, while the LCAQuick V3.5 takes the product as data entry. This should increase the inconsistency when comparing the material contribution and process contribution. The database plays the most critical role in an LCA assessment. Using the same database is likely to give comparable results, although the inconsistency of inputs may increase the inconsistency in results. In comparing SimaPro V9.0 and openLCA V2.0, most impact categories of fossil resource scarcity and global warming are aligned. If the inputs of most of the energy-intensive materials are used, the results should be generally similar. SimaPro V9.0 and openLCA V2.0 provide global warming impacts by materials and processes from the top ten contributors to global warming impact, as assessed by SimaPro V9.0 and openLCA V2.0. A consequence of using the same database is that the material contributions are shown in the material name, which gives a better comparison. Both results show that carbon dioxide is the most influential contributor.
The SimaPro V9.0 and openLCA V2.0 provided comprehensive and meaningful impact results. However, users may be confused by the discrepancies between the results. Past studies have reported discrepancies in results from SimaPro V9.0 and openLCA V2.0 when considering GWP as an impact category [28]. They attributed the mismatches to the mismatches of the database version shared by both tools, undocumented internal calculations, and close system behaviour. For instance, rounding or cutoff differences can accumulate if two tools calculate GWP at different system levels (e.g., per process vs. per functional unit).
The discrepancies between results from different software are generated from the selection of building materials, the production process of building materials, the feedstock for material production, and energy consumption. Each software uses the same assessment method and the most aligned database due to the incompleteness of material information. Understanding these differences requires analysing the impact categories used. GWP can be prioritised because it is often the only mandatory impact indicator in green building certifications such as Leadership in Energy and Environmental Design (LEED) and Building Research Establishment Environmental Assessment Method (BREEAM), and it is the core focus of EPDs under EN 15804. The GWP is often the focus of LCA studies in the construction sector [29]. Many studies and tools focus solely on GWP, especially in early-stage design or simplified assessments. Another considers GWP the most relevant and communicable result of the early design stages [30]. In comparative software studies, GWP is often the default or primary metric used as a universal point of comparison across tools. Relying on the GWP alone can be misleading, as the analysis may miss other impact categories. Hence, the GWP is a universal benchmark for comparing environmental performance in this study [31].

5. Discussion

Thus, by their shared methodology and similar output structures, SimaPro V9.0 and openLCA V2.0 enable a high degree of comparability, considerably greater than other LCA tools with fewer impact categories or less transparent methodologies. Both tools offer comprehensive customisation options for product systems, assessment methods, and database selection. Since both utilise the ReCiPe 2016 method and cover the same midpoint impact categories, conversions between these software tools are unnecessary. In addition, both platforms provide helpful features for result interpretation: SimaPro V9.0 includes a visual tree diagram for assessing process contributions and allows straightforward export of impact results, material details, and process data into Excel, while openLCA V2.0 similarly supports Excel export and facilitates direct copying of data from its user interface. Although a detailed feature comparison is beyond this paper’s scope, these functionalities illustrate why SimaPro V9.0 and openLCA V2.0 were selected as the benchmarks for this study.
SimaPro V9.0 and openLCA V2.0 allow users to fully customise product systems, assessment methods, and databases. Their default databases use the same ReCiPe 2016 method, providing identical impact categories and comparable outcomes. As a result, no conversions are needed between SimaPro V9.0 and openLCA V2.0 results. SimaPro V9.0 produces a tree graph to show the contributions from different unit processes. Eighteen midpoint impact categories are available in ReCiPe 2016. SimaPro V9.0 can export impact categories, material contributions, and process contributions to Excel. Similarly, openLCA V2.0 exports these results to Excel, allowing direct copying from its user interface. Because openLCA uses the same assessment method, all results appear in the same units as those from SimaPro V9.0. This enables a fair comparison between the two tools and other software.
SimaPro V9.0’s powerful simulation function provides a fully customised product system, various data imports and exports, a wide range of impact categories, and an intelligible hierarchical user interface. However, it sometimes lacks full transparency, which makes it difficult to trace how LCIA results are calculated or to verify the characterisation factors applied [32]. In contrast, openLCA V2.0 is technically transparent, as users can access, view, and edit LCIA methods, flows, and databases. This transparency, however, requires more manual control to maintain consistency, which may reduce practical usability for non-experts [33]. openLCA V2.0 provides functions comparable to SimaPro V9.0 but with a more versatile interface. Its strengths lie in stability, user-friendliness, and database customisation. Nevertheless, both platforms are limited by the absence of cloud services and AI-assisted calculation.
SimaPro V9.0 and openLCA V2.0 produce consistent results if the same database, assessment method, and calculation setup are used. However, consistency does not always mean the results are accurate. Accuracy requires extra steps. Outputs should be benchmarked against reference cases, peer-reviewed studies, or experimental data. Transparent reporting of characterisation factors, aggregation methods, and database versions is also needed. This makes it easier to identify errors and compare tools. We recommend that future studies and practitioners use systematic benchmarking and cross-validation to improve the credibility and accuracy of LCA results across different software platforms. It should also be noted that the results presented in this study are based on a single timber-framed warehouse case study. While the harmonised methodology and software comparison approach are broadly applicable, the specific findings, such as the degree of result variation or dominant impact contributors, may not directly translate to buildings constructed with concrete, steel, or hybrid systems. Therefore, caution should be exercised when extrapolating these results to other building types. Expanding the analysis to include a variety of construction methods and material systems in future studies will help improve the practical relevance and generalisability of the conclusions drawn here.
The greater consistency observed between SimaPro V9.0 and openLCA V2.0 is mainly attributable to their high degree of database harmonisation, explicit control over embedded assumptions, and flexible interface design. Both tools allow users to specify or customise nearly every aspect of the product system, database selection, and assessment method, reducing the risk of hidden modelling discrepancies. These platforms minimise ambiguity in background data and characterisation factors by enabling identical databases (e.g., ecoinvent or ReCiPe 2016) and providing transparent documentation of data sources. However, despite these strengths, differences in default settings, rounding protocols, or minor variations in calculation engines can still result in inconsistencies, underscoring the importance of careful scenario definition and explicit reporting of all modelling choices. In contrast, LCA tools with limited customisation options or less transparent data handling may embed assumptions or simplifications that are not easily detected, amplifying output discrepancies. These factors help explain why SimaPro V9.0 and openLCA V2.0 deliver more consistent and interpretable results compared to less flexible software solutions.
Many tools lack transparent or detailed modelling for operational or end-of-life phases, making later stages difficult to assess reliably. Scenario uncertainty increases with broader system boundaries, especially when including end-of-life stages [16]. Differences in database coverage and impact method can cause uncertainties in LCA results by several orders of magnitude, especially when impact categories or data sources are not well aligned [17]. By limiting the boundary to cradle-to-gate, we avoided introducing uncertainty from incomplete or inconsistent data on demolition, reuse, or disposal. However, this approach means our results do not capture impacts from a building’s use, maintenance, or end-of-life. Practitioners should consider these limitations when interpreting the findings, as the full life cycle may reveal additional impacts or benefits not covered here.

6. Limitations and Future Directions

Understanding which LCA tools are most reliable and which are best suited for quick assessments is essential for practitioners. However, these questions require a holistic evaluation beyond technical result comparisons. Assessing reliability and practical suitability involves analysing each software’s features, user interface, workflow flexibility, and the quality and scope of its LCI databases. These aspects are closely linked to user experience and the application context. This paper focuses on standardising inputs and comparing output consistency across platforms. Our future research will systematically evaluate software functionalities, usability, and database strengths, which are critical for practitioners making informed decisions. Addressing the question in that context will allow us to provide a nuanced and practical answer based on a more complete set of criteria. It must be acknowledged that LCA results are influenced by location-specific factors such as transport distances and electricity mix. While this study uses a case project based in Auckland, the methodology of standardising inputs and comparing software performance can be applied in other regions. However, the absolute values of environmental impacts may differ when using regional data from other countries.
This study has several limitations. It focuses on a single timber-framed warehouse, which may not represent all building types or material options. Standardised inputs and necessary material substitutions can introduce uncertainty, especially when software tools lack exact matches. Tool settings and default database choices may also affect results and comparability. Some LCA software tools only support a limited number of impact categories, which restricts the scope of analysis. To improve consistency, future studies should document all assumptions clearly and consider using structured decision-support tools, such as flowcharts or decision matrices. The rapid development of cloud-based and AI-driven LCA platforms could enhance automation, data integration, and transparency. A unified LCI database system that allowed auto-installation and online updates between users and developers could minimise the discrepancies caused by using different versions of databases. Exploring these new technologies in future research will help address current limitations and support practitioners more effectively.
AI-driven LCA tools are transforming how environmental assessments are performed. They can significantly improve the efficiency of data processing and modelling. These tools often integrate cloud-based features, improving data sharing and collaboration. AI technologies can also enhance accuracy by learning from large datasets and reducing human error. Adopting AI-driven platforms makes LCA more accessible to a broader range of users. Studying these emerging tools will help identify their strengths and limitations. It will also support the development of best practices for their use in the construction sector. Future research in this area will be valuable for researchers and industry professionals.

7. Conclusions

This research examines how consistent and different the results were when using eight LCA software programs for a timber-framed warehouse in Auckland, New Zealand. The tools assessed were SimaPro V9.0, openLCA V2.0, LCAQuick V3.5, BCC V1.0, CCaLC2 V3.1, eTool V5.0, OCLCA, and IE4B V5.4. The study compared results across fourteen midpoint impact categories. Even when using standardised inputs and when possible, the same databases and methods, there were still notable differences. These were primarily due to differences in material selection, assumptions about production processes, feedstock sources, and how energy use is modelled. The study finds that having more databases does not continually improve software; what matters is the data’s reliability, transparency, and relevance. Quality datasets should be complete, representative, transparent, and regularly updated. Using harmonised databases and methods can improve consistency, but will not remove all differences. Standardised inputs and careful configuration are still key for fair comparison. LCAQuick V3.5 and BCC V1.0 may be easier for beginners or users who need quick results. SimaPro V9.0 and openLCA V2.0 offer more options and reliability for detailed LCAs. However, no single tool is best for all cases. The right choice depends on project needs, required impact categories, and user experience. We suggest that future research develop decision-support tools like flowcharts or matrices and expand the analysis to other building types. Emerging cloud and AI-based LCA solutions should also be considered.

Author Contributions

Conceptualization, J.G., V.V. and S.W.; Methodology, J.G., V.V. and S.W.; Software, J.G.; Validation, J.G.; Formal analysis, J.G.; Investigation, J.G.; Resources, V.V.; Data curation, J.G.; Writing—original draft, J.G.; Writing—review & editing, J.G., V.V. and S.W.; Visualization, J.G.; Supervision, V.V. and S.W.; Project administration, V.V. and S.W. All authors have read and agreed to the published version of the manuscript.

Funding

This research received no external funding.

Data Availability Statement

Data are contained within the article.

Conflicts of Interest

The authors declare no conflict of interest.

References

  1. Karunaratne, S.; Dharmarathna, D. A review of comprehensiveness, user-friendliness, and contribution for sustainable design of whole building environmental life cycle assessment software tools. Build. Environ. 2022, 212, 108784. [Google Scholar] [CrossRef]
  2. Sartori, T.G. Improving Whole Building Life Cycle Assessment Software Tools for Decision-Making. Ph.D. Thesis, Queensland University of Technology, Brisbane, Australia, 2023. [Google Scholar]
  3. Wolf, C.D.; Cordella, M.; Dodd, N. Criteria for Analysis of LCA Software Tools and Databases for Buildings. 2020. Available online: https://susproc.jrc.ec.europa.eu/product-bureau/sites/default/files/2021-10/UM3_Indicators_1-2_list_of_LCA_software_databases_v4.1.pdf (accessed on 15 April 2025).
  4. Le, K.N.; Tam, V.W.Y. Sustainable Construction Technologies: Life-Cycle Assessment; Butterworth-Heinemann: Oxford, UK, 2019. [Google Scholar]
  5. Chatty, T.; Qu, Y.; Ba-Sabaa, H.H.; Murnane, E.L. Examining the User Experience of Life Cycle Assessment Tools and Their Ability to Cater to Ecodesign in Early-Stage Product Development Practice. Proc. Des. Soc. 2021, 1, 1441–1450. [Google Scholar] [CrossRef]
  6. Andersen, C.E.; Hoxha, E.; Birgisdóttir, H.; Rasmussen, F.N. LCA models in building industry practice—How do practitioners’ assumptions affect LCA results. In IOP Conference Series: Earth and Environmental Science, 15th ed.; Institute of Physics Publishing: Bristol, UK, 2023; Volume 2600. [Google Scholar] [CrossRef]
  7. Teng, Y.; Li, C.Z.; Shen, G.Q.P.; Yang, Q.; Peng, Z. The impact of life cycle assessment database selection on embodied carbon estimation of buildings. Build. Environ. 2023, 243, 110648. [Google Scholar] [CrossRef]
  8. Konradsen, F.; Hansen, K.S.H.; Ghose, A.; Pizzol, M. Same product, different score: How methodological differences affect EPD results. Int. J. Life Cycle Assess. 2024, 29, 291–307. [Google Scholar] [CrossRef]
  9. Testa, F.; Nucci, B.; Tessitore, S.; Iraldo, F.; Daddi, T. Perceptions on LCA implementation: Evidence from a survey on adopters and nonadopters in Italy. Int. J. Life Cycle Assess. 2016, 21, 1501–1513. [Google Scholar] [CrossRef]
  10. Tecchio, P.; Gregory, J.; Olivetti, E.; Ghattas, R.; Kirchain, R. Streamlining the Life Cycle Assessment of Buildings by Structured Under-Specification and Probabilistic Triage. J. Ind. Ecol. 2019, 23, 268–279. [Google Scholar] [CrossRef]
  11. He, P.; Bui, T.T.P.; Shahzad, W.; Wilkinson, S.; Domingo, N. Towards Effective Implementation of Carbon Reduction Strategies in Construction Procurement: A Case Study of New Zealand. Buildings 2022, 12, 1570. [Google Scholar] [CrossRef]
  12. Nidhin, B.K.S.N.; Domingo, N.; Bui, T.T.P.; Wilkinson, S. Construction stakeholders’ knowledge on zero carbon initiatives in New Zealand. Int. J. Build. Pathol. Adapt. 2023, 43, 512–527. [Google Scholar] [CrossRef]
  13. Dervishaj, A.; Gudmundsson, K. From LCA to circular design: A comparative study of digital tools for the built environment. Resour. Conserv. Recycl. 2024, 200, 107291. [Google Scholar] [CrossRef]
  14. Finkbeiner, M.; Inaba, A.; Tan, R.; Christiansen, K.; Klüppel, H.-J. The New International Standards for Life Cycle Assessment: ISO 14040 and ISO 14044. Int. J. Life Cycle Assess. 2006, 11, 80–85. [Google Scholar] [CrossRef]
  15. Rosenbaum, R.K.; Hauschild, M.Z.; Boulay, A.-M.; Fantke, P.; Laurent, A.; Núñez, M.; Vieira, M. Life Cycle Impact Assessment; Springer: Cham, Germany, 2018. [Google Scholar] [CrossRef]
  16. Bamber, N.; Turner, I.; Arulnathan, V.; Li, Y.; Zargar Ershadi, S.; Smart, A.; Pelletier, N. Comparing sources and analysis of uncertainty in consequential and attributional life cycle assessment: Review of current practice and recommendations. Int. J. Life Cycle Assess. 2020, 25, 168–180. [Google Scholar] [CrossRef]
  17. Chen, X.; Matthews, H.S.; Griffin, W.M. Uncertainty caused by life cycle impact assessment methods: Case studies in process-based LCI databases. Resour. Conserv. Recycl. 2021, 172, 105678. [Google Scholar] [CrossRef]
  18. Wolf, C.D.; Hoxha, E.; Hollberg, A.; Fivet, C.; Ochsendorf, J. Database of Embodied Quantity Outputs: Lowering Material Impacts Through Engineering. J. Archit. Eng. 2020, 26, 04020016. [Google Scholar] [CrossRef]
  19. Dowdell, D.; Berg, B.; Marston, N.; Shaw, P.; Burgess, J.; Roberti, J.; White, B. New Zealand Whole-Building Whole-of-Life Framework: Development of Datasheets to Support Building Life Cycle Assessment; BRANZ: Porirua, New Zealand, 2016. [Google Scholar]
  20. Huijbregts, M.A.J.; Steinmann, Z.J.N.; Elshout, P.M.F.; Stam, G.; Verones, F.; Vieira, M.; Zijp, M.; Hollander, A.; van Zelm, R. ReCiPe2016: A Harmonised Life Cycle Impact Assessment Method at Midpoint and Endpoint Level. Int. J. Life Cycle Assess. 2017, 22, 138–147. [Google Scholar] [CrossRef]
  21. Dong, Y.; Hossain, M.U.; Li, H.; Liu, P. Developing Conversion Factors of LCIA Methods for Comparison of LCA Results in the Construction Sector. Sustainability 2021, 13, 9016. [Google Scholar] [CrossRef]
  22. Bjørn, A.; Hauschild, M.Z.; Margni, M.; Roy, P.O.; Bulle, C. A proposal to measure absolute environmental sustainability in life cycle assessment. Ecol. Indic. 2016, 63, 1–13. [Google Scholar] [CrossRef]
  23. Popowicz, M.; Katzer, N.J.; Kettele, M.; Schöggl, J.-P.; Baumgartner, R.J. Digital technologies for life cycle assessment: A review and integrated combination framework. Int. J. Life Cycle Assess. 2025, 30, 405–428. [Google Scholar] [CrossRef]
  24. Hauschild, M.Z.; Olsen, S.I.; Rosenbaum, R.K. Life Cycle Assessment: Theory and Practice; Springer: Berlin/Heidelberg, Germany, 2018. [Google Scholar]
  25. BRANZ. Environmental Product Declarations (EPDs). Available online: https://www.branz.co.nz/environment-zero-carbon-research/framework/epds/ (accessed on 15 April 2025).
  26. Sanjuan-Delmás, D.; Alvarenga, R.A.F.; Lindblom, M.; Kampmann, T.C.; van Oers, L.; Guinée, J.B.; Dewulf, J. Environmental assessment of copper production in Europe: An LCA case study from Sweden conducted using two conventional software-database setups. Int. J. Life Cycle Assess. 2022, 27, 255–266. [Google Scholar] [CrossRef]
  27. Damiani, M.; Sinkko, T.; Caldeira, C.; Tosches, D.; Robuchon, M.; Sala, S. Critical review of methods and models for biodiversity impact assessment and their applicability in the LCA context. Environ. Impact Assess. Rev. 2023, 101, 107134. [Google Scholar] [CrossRef]
  28. Iswara, A.P.; Farahdiba, A.U.; Nadhifatin, E.N.; Pirade, F.; Andhikaputra, G.; Muflihah, I.; Boedisantoso, R. A Comparative Study of Life Cycle Impact Assessment using Different Software Programs. In IOP Conference Series: Earth and Environmental Science, 1st ed.; Institute of Physics Publishing: Bristol, UK, 2020; Volume 506. [Google Scholar] [CrossRef]
  29. Simonen, K.; Huang, M.; Huang, M.; Todaro, L. Life Cycle Assessment of Buildings—A Practice Guide; The Carbon Leadership Forum: Seattle, WA, USA, 2019; Available online: https://carbonleadershipforum.org/lca-practice-guide/?utm_source=chatgpt.com (accessed on 15 April 2025).
  30. Basbagill, J.; Flager, F.; Lepech, M.; Fischer, M. Application of life-cycle assessment to early stage building design for reduced embodied environmental impacts. Build. Environ. 2013, 60, 81–92. [Google Scholar] [CrossRef]
  31. Brook, W.; Monica, H.; Kathrina, S. Embodied carbon in construction materials: A framework for quantifying data quality in EPDs. In Buildings & Cities; Ubiquity Press: London, UK, 2020; Volume 1. [Google Scholar]
  32. Herrmann, I.T.; Moltesen, A. Does It Matter Which Life Cycle Assessment (LCA) Tool You Choose?—A Comparative Assessment of Simapro and Gabi. J. Clean. Prod. 2015, 86, 163–169. [Google Scholar] [CrossRef]
  33. Silva, D.A.L.; Nunes, A.O.; Moris, V.A.d.S.; Piekarski, C.M.; Rodrigues, T.O. How Important Is the LCA Software Tool You Choose Comparative Results From Gabi, Openlca, Simapro and Umberto. In Proceedings of the CILCA 2017, Medellin, CO, USA, 12–15 June 2017; pp. 10–15. [Google Scholar]
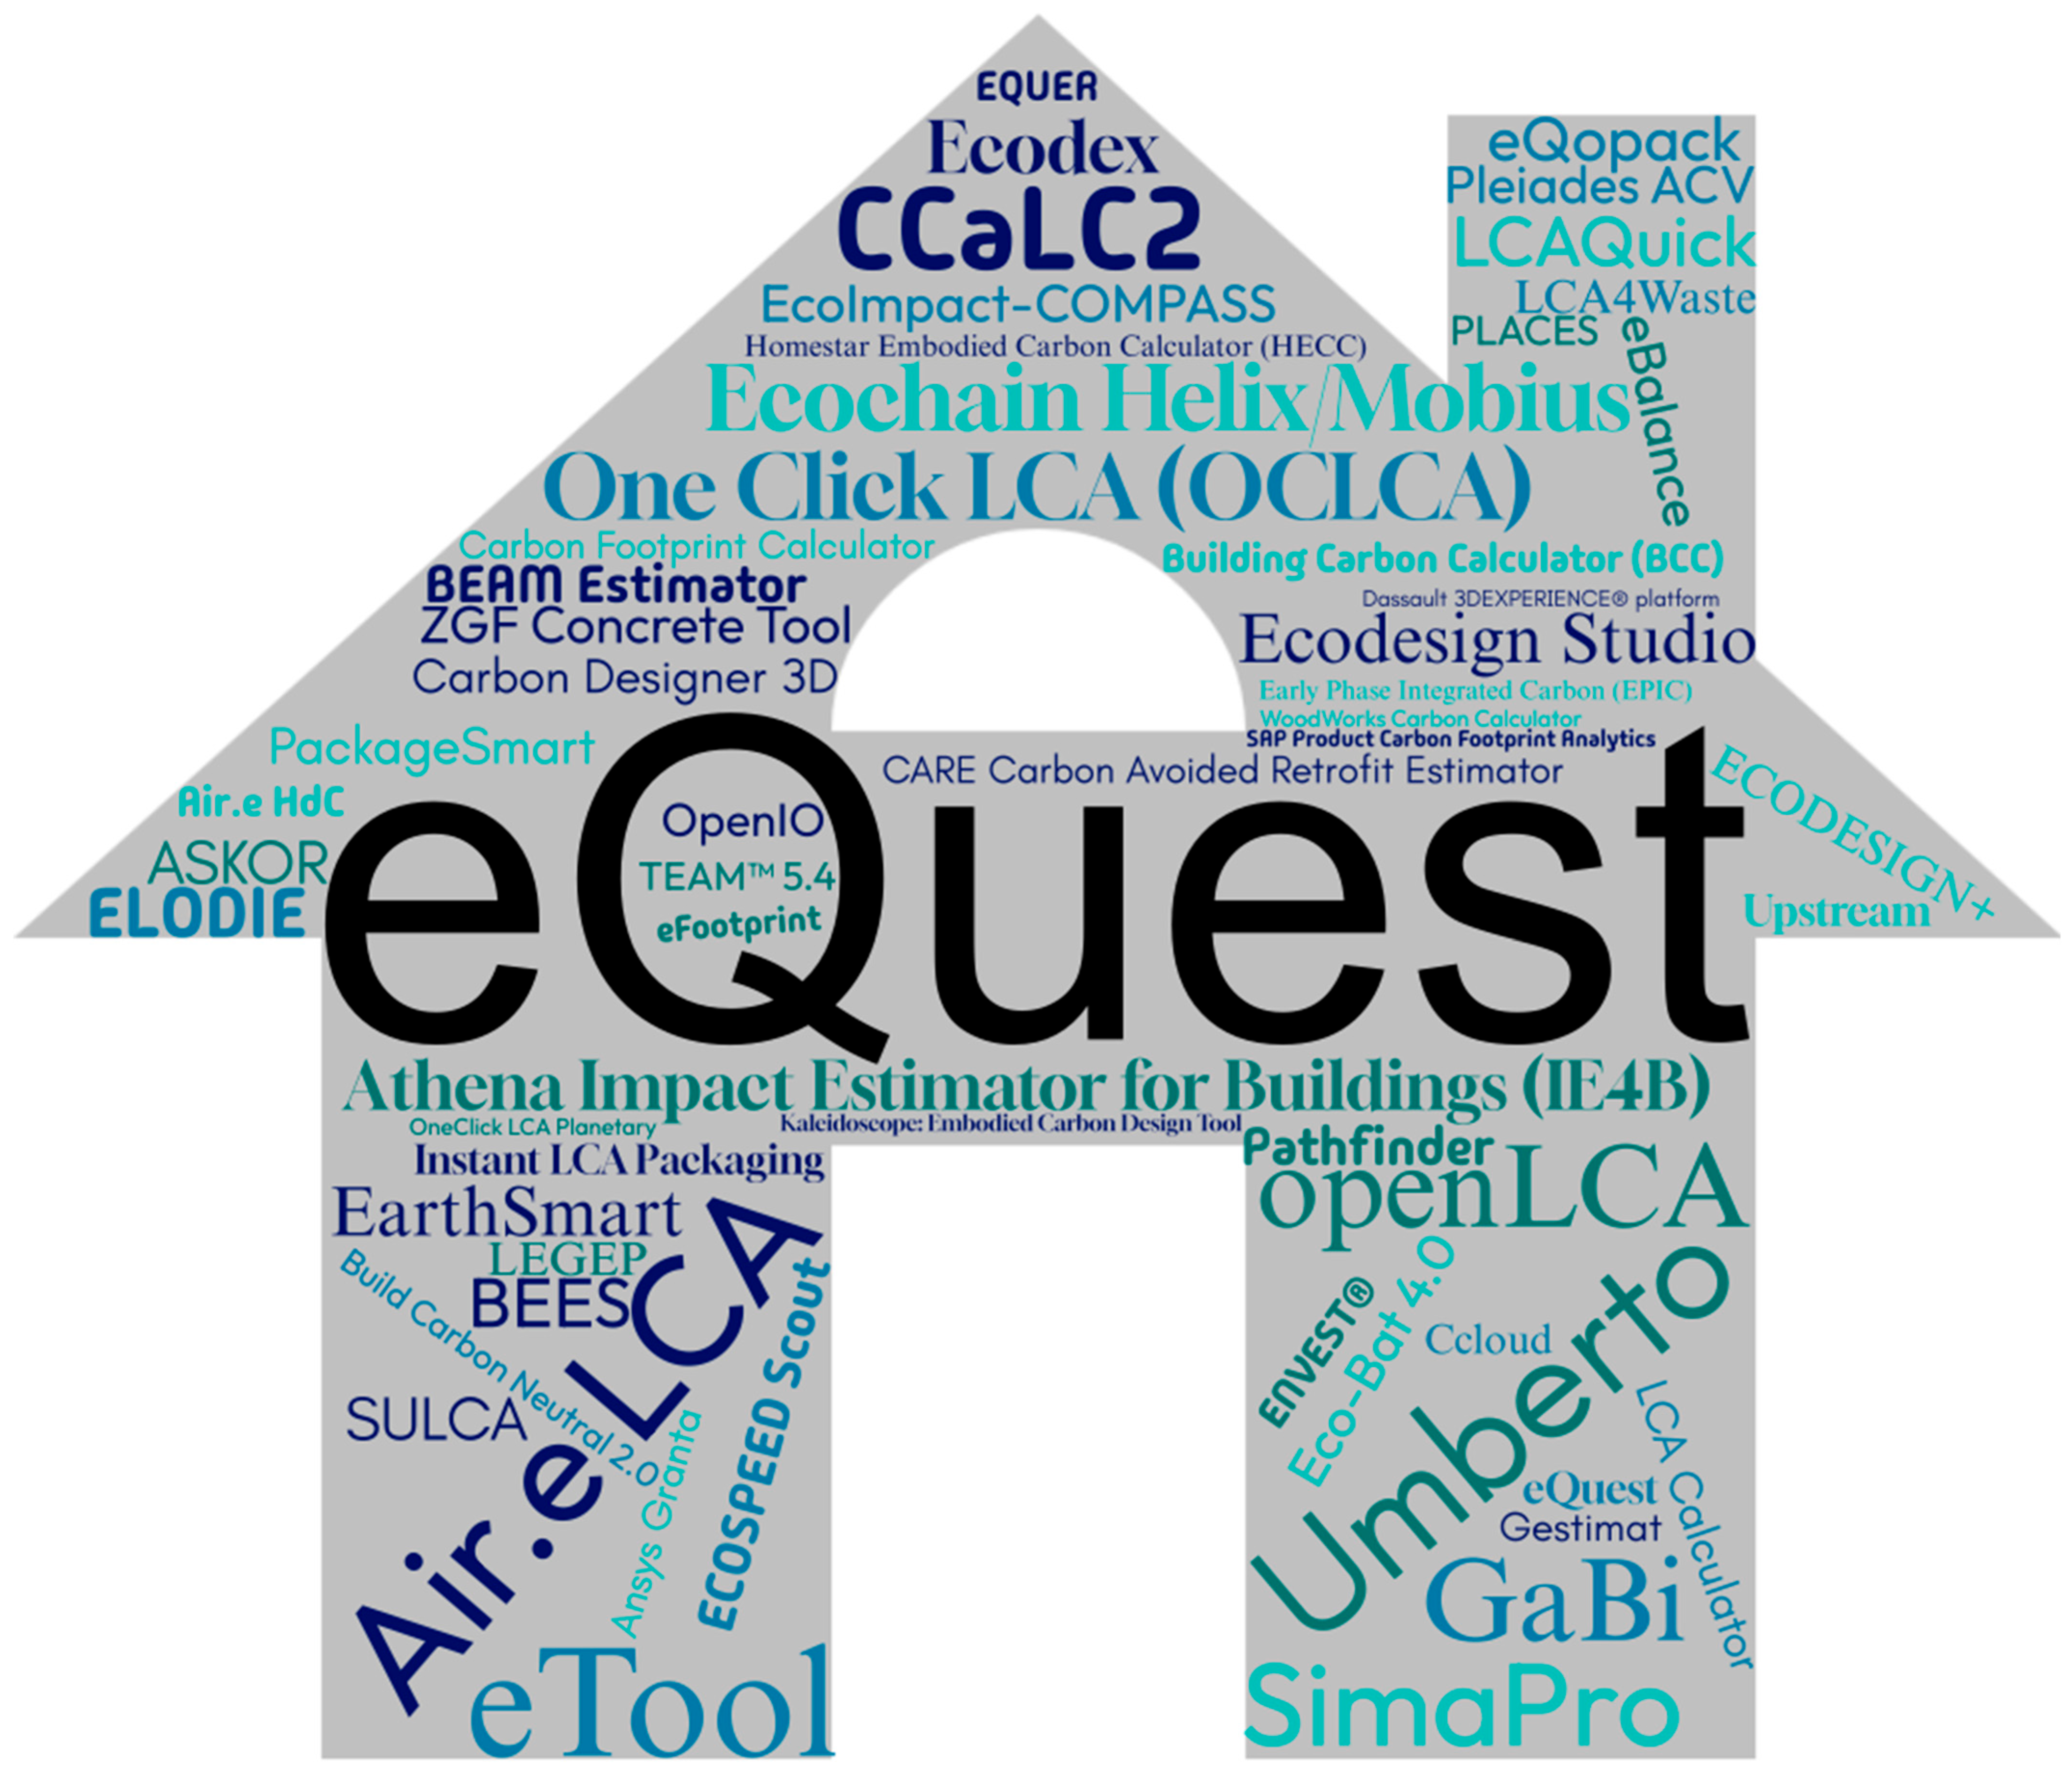
Figure 1. Visual representation of commonly used LCA software and carbon modelling platforms in the construction sector. The word cloud, shaped as a building, illustrates the diversity of tools used for environmental impact assessment.
Buildings 15 03174 g001
Figure 2. 3D model of the timber-framed warehouse used in the case study. The left image shows the structural framing with exposed foundation, columns, and framing elements. The right image presents the completed external envelope, including wall cladding, roof, roller shutters, and personal access door. This model was used to calculate material quantities and standardised inputs for LCA software analysis.
Buildings 15 03174 g002
Figure 3. Workflow for LCA software identification and selection. The flowchart illustrates the systematic process for screening, evaluating, and shortlisting LCA software tools for building simulation and comparative assessment, based on relevance to research objectives, suitability for building LCA applications, and practical availability for testing.
Buildings 15 03174 g003
Figure 4. Geographic location of the case study project in Auckland, New Zealand. The construction site (red circle) is situated within the Auckland urban area (circle in bottom left), which lies within the wider Auckland metropolitan region (grey). The inset map shows Auckland’s position on the North Island of New Zealand. These regional boundaries form the basis for assumptions on material sourcing and transportation distances in the LCA model.
Buildings 15 03174 g004
Figure 5. Systematic workflow for harmonising input data for building simulation and LCA software analysis. Steps from extracting material information to formulating a standardised input strategy aim to minimise uncertainties arising from variation in LCI databases and impact factor versions. This approach ensures that all software receive consistent, comparable inputs, enabling reliable cross-tool assessment of environmental impacts.
Buildings 15 03174 g005
Figure 6. Comparison of environmental impact results for five categories, ecotoxicity, fine particulate matter formation, fossil resource scarcity, freshwater eutrophication, and global warming potential, calculated by SimaPro V9.0 and openLCA V2.0. Results are shown in category-specific units, illustrating differences in magnitude and variation between the two LCA software tools.
Buildings 15 03174 g006
Figure 7. Comparison of impact results for human toxicity, ionising radiation, land use, marine eutrophication, and mineral resource scarcity as calculated by SimaPro V9.0 and openLCA V2.0. Values are presented in category-specific units to highlight differences between the two LCA software platforms.
Buildings 15 03174 g007
Figure 8. Comparison of ozone formation, stratospheric ozone depletion, terrestrial acidification, and water consumption results calculated by SimaPro V9.0 and openLCA V2.0. Values are presented in category-specific units, demonstrating differences in results between the two LCA software platforms.
Buildings 15 03174 g008
Figure 9. Global Warming Potential (GWP) results in kg CO2-equivalent generated by the assessed LCA software using standardised inputs for the case study building. The figure highlights significant variations between software, with values ranging from 3594.08 kg CO2 eq (Building Carbon Calculator V1.0) to 21,054.14 kg CO2 eq (LCAQuick V3.5), demonstrating the influence of software choice on environmental impact outcomes. (All results are reported in SI units, harmonised according to the ReCiPe 2016 method. For comparability, all mass-based results are presented in kilograms (kg), distances in kilometres (km), and volumes in cubic metres (m3). Results from different tools are converted to these standard units where necessary.).
Buildings 15 03174 g009
Table 1. Building material inventory: Material inventory for the timber-framed warehouse case study, detailing building components, product specifications, dimensions, quantities, and calculated total weights used as standardised inputs for LCA software. (All results are reported in SI units, harmonised according to the ReCiPe 2016 method. For comparability, all mass-based results are presented in kilograms (kg), distances in kilometres (km), and volumes in cubic metres (m3). Results from different tools are converted to these standard units where necessary.).
Building ComponentMaterialProductSizeQuantityUnitUnit WeightUnitTotal WeightUnit
FoundationConcrete17.5 MPa, column foundationCasted4.76m32240.00kg/m310,662.40kg
FramingTimber, RadiataRAD MG SG8 H3.2300 W × 50 T0.97m3510.00kg/m3493.61kg
FramingTimber, RadiataRAD MG SG8 H3.2200 W × 50 T0.06m3510.00kg/m328.56kg
FramingTimber, RadiataRAD MG SG8 H3.2150 W × 50 T0.00m3510.00kg/m31.18kg
ColumnTimber, RadiataRAD MG SG8 H3.2200 W × 50 T0.32m3475.00kg/m3152.00kg
ColumnTimber, RadiataRAD MG SG8 H3.2150 W × 50 T0.37m3475.00kg/m3174.48kg
ColumnTimber, RadiataPole SED H5 Plain150 Diameter1.02m3475.00kg/m3482.47kg
Cladding, WallColorsteel, Endura5 RIB 0.40 Colour Endura G550760 Wide Sheet170.00m23.00kg/m2510.00kg
Cladding, RoofColorsteel, Endura5 RIB 0.40 Colour Endura G550760 Wide Sheet110.00m23.00kg/m2330.00kg
Roofing, UnderlaySynthetic MaterialDriStud RU24 White/Black-faced SS Roof Underlay1250 Wide Roll131.63m20.17kg/m222.38kg
Roofing, NettingRoof Mesh, Galvanised Steel (PVC Coated)Kiwimesh Roof Safety Net1800 Wide Roll110.00m20.27kg/m229.33kg
Roof FlashingColorsteel, EnduraColour 2 and 3 Fold ENDURA Miscellaneous25.00m23.00kg/m275.00kg
ConnectorSteel, Galvanised MiscellaneousMiscellaneousMiscMiscMiscMisc200.00kg
Door, Personal AccessAluminium, Extrusions 6060-T5 AlloyPersonal Access Door860 W × 2000 H1.00each28.10each28.10kg
Door, Roller ShutterAluminium, K90 Solid Roller Door2600 W × 3000 H7.80m210.00kg/m278.00kg
Door, Roller ShutterAluminium, K90 Solid Roller Door3000 W × 3000 H9.00m210.00kg/m290.00kg
Table 2. Environmental impact results across 14 midpoint impact categories generated by eight Life Cycle Assessment (LCA) software tools using standardised inputs from the case study building. Results have been converted according to each software’s Life Cycle Impact Assessment (LCIA) method. Units remain constant when the ReCiPe 2016 Midpoint (Hierarchist) method is available. (All results are reported in SI units, harmonised according to the ReCiPe 2016 method. For comparability, all mass-based results are presented in kilograms (kg), distances in kilometres (km), and volumes in cubic metres (m3). Results from different tools are converted to these standard units where necessary).
S.NoImpact CategoriesUnitSimaProopenLCALCAQuickBCCCCaLC2eToolOCLCAIE4B
1.Ecotoxicitykg 1,4-DCB40,195.9344,349.06
2.Fine particulate matter formationkg PM2.5 eq25.3222.09 0.16 20.38
3.Fossil resource scarcitykg oil eq2758.952333.356754.98 257.5189.49 54,694.55
4.Freshwater eutrophicationkg P eq6.815.656.63 3.351.98 0.61
5.GWPkg CO2 eq12,163.469423.5321,054.143594.084760.078661.2513,088.7918,520.31
6.Human toxicitykg 1,4-DCB16,657.9920,684.28 10,350.81
7.Ionizing radiationkBq Co-60 eq953.4862.3
8.Land usem2a crop eq2528.62482.61 −57.82
9.Marine eutrophicationkg N eq0.420.35
10.Mineral resource scarcitykg Cu eq169.56123.82163.3 1804.12
11.Ozone formationkg NOx eq60.448.995.4 0.10.01 49.95
12.Stratospheric ozone depletionkg CFC11 eq000.11 0103.76 0
13.Terrestrial acidificationkg SO2 eq45.7636.05178.3 5.011.25 76
14.Water consumptionm3100.7972.43 5.89
Disclaimer/Publisher’s Note: The statements, opinions and data contained in all publications are solely those of the individual author(s) and contributor(s) and not of MDPI and/or the editor(s). MDPI and/or the editor(s) disclaim responsibility for any injury to people or property resulting from any ideas, methods, instructions or products referred to in the content.