Abstract
Against the background of traffic conflicts arising due to the highly concentrated population in high-density cities, this study aims to systematically identify the core transport needs of patients awaiting medical treatment; based on the theory of the Kano model, we construct a measurement system relating to patient transport needs when awaiting medical treatment that encompasses multiple levels. Taking 10 large general hospitals in Guangzhou as samples, this study collected data through questionnaires and auxiliary interviews, using the importance–sensitivity analysis method to accurately measure the degree of patient needs for each influencing factor of the transport environment for medical treatment. The study found that, among the primary needs (core basic needs), the perfection of public transport (which directly affects the convenience of medical care) is the core need with the highest degree of demand. Among the second-level needs (refined categorised demand levels), specifically relating to important attributes (essential needs), priority attention should be given to patient diversion, hospital–city connection, and corridor settings. As concerns the high value-added one-dimensional attributes (desired needs), focus should be placed on controlling health and safety distances and guiding the flow of medical treatment, while for high glamour attributes (glamour needs), primary consideration should be given to crowd distribution, stopping and resting, and direct access to the ground floor. The group difference analysis (grouped by emotional state, transport mode, and group type) showed that the first-level demand sensitivity ranking was highly consistent, and the second-level demand for urban connectivity, convenient transfer, and direct underground access were also common priorities. This study is the first to introduce the Kano model into the analysis of high-density urban healthcare transport systems, providing a clear basis for the grading of demand for the design of the transport environment for patients’ medical care. This is of great practical value for alleviating congestion and improving the resilience of emergency response in mega-cities in relation to medical care.
1. Introduction
Good traffic organisation is essential to ensure smooth access and enhance the patient experience [1,2,3,4,5]. In the aftermath of the COVID-19 pandemic, healthcare management organisations require hospitals to have the ability to switch between acute and emergency situations, with the need to coordinate the organisation of functions and traffic control in times of disaster. Optimising the design of hospital transport environments has also been shown to help strengthen infectious disease prevention and control and reduce public health risks [6,7]. The problem is particularly acute in high-density cities, where the urbanisation rate of China’s resident population reached 67% by 2024; the over-concentration of the population in China’s 22 mega-cities will dramatically amplify the pressure on the allocation of transport resources for healthcare [8,9]. In the face of multiple challenges such as land resource constraints, an ageing population, and surging outpatient volumes, there is an urgent need to construct a full-factor evaluation system in relation to the transport environment for patient care, as well as to identify the key influencing factors in high-density urban environments, in order to promote efficient and orderly access to healthcare for patients.
Currently, research on the indoor and outdoor traffic environment of hospitals focuses on the following three aspects: (1) Research on the influence factors of wayfinding efficiency on traffic environment. Wayfinding efficiency is a key factor in shaping the traffic environment of hospitals, and its influencing factors cover indoor signage, landscape environment, and spatial form [2,10]. However, researchers have focused more on exploring the impact of wayfinding efficiency on patients’ emotions about medical care [11]. Additionally, some studies have conducted a more in-depth exploration, systematically integrating and carefully categorising the relevant influencing factors, particularly in relation to adding key elements such as the spatial organisation of traffic and the characteristics of nodes [12]. On this basis, this study further clarifies the interactions between multiple factors such as wayfinding subjects (e.g., patients and family members), the behaviour of others and hospital management, and the traffic for medical care [13]. (2) A study of the factors influencing the transport environment on the patient experience. Patient experience requires that the hospital transport environment be designed for convenience, comfort, and healing [14,15]. The accessibility of the hospital’s transport environment should be considered in conjunction with the variability of patients’ needs due to differences in their illnesses, financial incomes, and age groups [16]. Existing studies have focused on the impact of public transport environment creation on patient psychology [17] or on the creation of impact indicators focusing on overall satisfaction with patient transport needs in the context of the healthcare experience [18]. (3) A study of the factors influencing accessibility to healthcare on the transport environment. Accessibility provides scientific support for the optimal allocation of medical facilities and has a profound impact on public health [19,20]. Along with the trend towards granularity in the new data environment, accessibility studies based on quantitative methods are increasingly focusing on meeting the core transport needs of patients [21]. In order to objectively identify the physical accessibility issues faced by patients in the healthcare process and to highlight the urgency of environmental improvements [22], studies have been conducted to establish the social link between transport organisational structure and accessibility to healthcare by deconstructing and analysing patient transport to healthcare facilities [23,24].
Existing research emphasises the need for hospital design to take into account the multidimensional factors of patient needs for medical transport and to integrate them into the environment; however, the methodology mainly relies on qualitative analysis, with insufficient techniques for combining qualitative and quantitative aspects. The research content focuses on the perspective of the medical process, with insufficient in-depth consideration of the differences between the needs of the patient body at the physiological, psychological, and behavioural levels [25,26]. The key research gaps are the lack of priority stratification (essential/desired/attractive attributes) relating to transport demand for patient medical care in high-density cities, as well as the failure to establish a correlation model between demand sensitivity and resource allocation. To this end, this study aims to use the Kano model to classify 25 transport demand attributes, determine their demand sensitivity ranking by calculating the Better–Worse coefficient, and propose a phased optimisation strategy in conjunction with the degree of importance, in order to expand the relevant theoretical and technical approaches.
2. Research Design
In this study, a two-dimensional cognitive model of the current status of patient demand characteristics for medical transport and their satisfaction is established through the Kano theoretical model. The theory was formally proposed by Noriaki Kano, a professor at Tokyo Institute of Technology and a famous quality management expert, in the 1980s in the journal; the model was inspired by Herzberg’s two-factor theory. The Kano model is based on user needs and focuses on the change in respondent satisfaction through the forward and backward questions of the same need type, i.e., having and not having a certain need. It primarily focuses on the non-linear relationship between product performance and user satisfaction, and quantifies the type of requirement needed in order to assist with decision-making [27]. Compared with traditional methods, SERVQUAL/IPA relies on the assumption of a linear correlation, which reduces needs to a proportional ‘importance–satisfaction’ relationship. The Kano model reveals the asymmetric mechanism of ‘absence triggers strong dissatisfaction’ and ‘presence brings surprises’ through five-dimensional classification (absence triggers dissatisfaction, expectation, charisma, etc.). Secondly, although AHP/GIS is good at weight allocation and spatial analysis, it ignores the dynamics and group differences in the nature of demand (e.g., elderly patients regard resting chairs as a basic need, while young people are categorised as aspirational), whereas the Kano model quantifies the Better–Worse coefficients of different groups of people through positive and negative questionnaires to provide direct guidance for the optimal allocation of resources. Thirdly, its proposed law of ‘shifting demand attributes’ (e.g., during an epidemic, the reservation system shifts from glamour to basic) can provide a decision-making framework for responding to public health emergencies.
Current Kano modelling research techniques focus on the following three levels: (1) Single Kano model application: the use of the Kano model to assess customer satisfaction by Rozaq [28] and Kumar identifies important attributes of assistive products for people with motor disabilities [29], while the work of Hu suggests optimising commercial space in the community [30]. (2) Kano modelling combined with other methods:Lu,Jiang,Jia, Chen and Wang combined the Kano model with the two-dimensional quality method, service quality, IPA, QFD, and semi-structured interviews to study visitor centre satisfaction, leisure and fishery service quality, underground atrium design, customer service, and seating comfort, respectively [31,32,33,34,35]. (3) Development of a new framework based on the Kano model: Keyvanfar developed an adaptive behavioural satisfaction index [36], Liu proposed an S-Kano model [37], and Yang developed a BERT-TCBAD-Kano-based requirement analysis methodology [38].
In healthcare service research, Wan-I Lee used the Kano model to analyse the relationship between healthcare service quality and patient satisfaction in Taiwan, finding that patients were most concerned about doctors’ nursing care [39]. Susanne Gustavsson incorporated the patient’s multiple role perspectives into the Kano application, combining the views of patients, relatives, and healthcare professionals to identify a wide range of patient needs [40]. D.C. Ferreira used the Kano model and its improved version to assess the satisfaction of Portuguese patients with the National Health System and medical appointment services in public hospitals [41]. The above studies show that the Kano model has a wide range of applications in hospital health system satisfaction improvement, as well as being applicable to the study of patient needs in transport environments. Advantages of the Kano model in the study of patient needs in the transport environment include the following: (1) Quantification of the attributes of the needs. The Kano model can quantify the qualitative needs of patient transport, scientifically assessing the extent of the needs. (2) Identification of the priorities of the needs. The Kano model can classify patient transport needs into essential needs, desired needs, glamour needs, etc., so as to accurately identify and prioritise the needs. (3) Expanding the depth of the study. The Kano model, combined with the Delphi method, QFD, two-dimensional quality method, and other research tools, can continue to expand the depth of the study of the healthcare transport environment.
The technical route of the research firstly establishes a composite evaluation index system by identifying the demand attributes of the transport environment and completing the Kano model demand questionnaire, which was determined to be comprehensive and targeted according to the pilot study and expert group discussion. Then, the data results are classified according to the initial screening of demand types. Finally, each demand attribute is classified and evaluated in a step-by-step manner using the Better–Worse coefficient of demand, importance, sensitivity, and group type difference analysis (Figure 1).
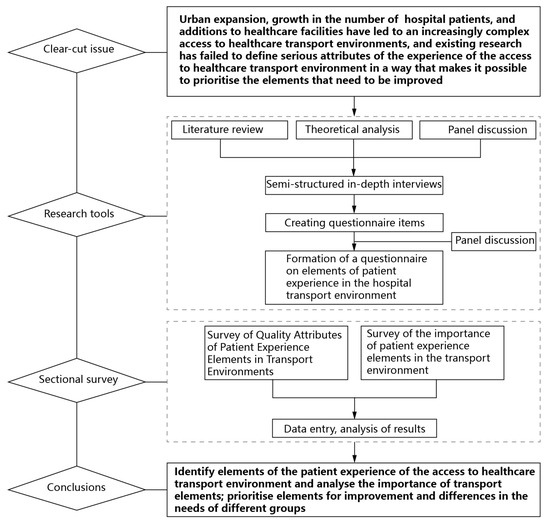
Figure 1.
Study design.
2.1. Research Sample
Guangzhou (Table 1), one of the mega-cities in China and the capital of Guangdong Province, has a resident population of 18.978 million. Although the hospital scale and the number of beds per capita are close to the level of developed countries, and the spatial distribution of tertiary-level hospitals has shown a balanced trend (based on the standard deviation ellipse analysis of GIS) (Figure 2), the combination of on-site research has revealed a problem relating to the high degree of concentration of patient access to healthcare, and the complexity of conflicts in the traffic environment remains serious. This study focuses on a sample of 10 large general hospitals with an average daily outpatient volume of more than 8000, which is highly concentrated to reflect the typical traffic dilemma of medical care under the superimposed effect of high urbanisation rates and ultra-high densities. (1) High urbanisation and population pressure in the sample area: in the sample, four hospitals are located in areas where the urbanisation rate has reached 100%, which means that all the space has been included in the built-up urban area system. The average population density is as high as 23,700 people per square kilometre, far exceeding the world’s recognised standard for densely populated areas; the areas described by the two hospitals in the sample are the city’s core areas with the largest population bases. This extreme urbanisation and high population density is the core background factor that leads to a high concentration of demand for healthcare, far exceeding that of the average area. (2) Core transport environmental problems faced by the sample hospitals: In total, 8 of the 10 sample hospitals are located in the historical old central urban area and are generally facing problems such as constraints on spatial resources (tight land use area), external traffic congestion (insufficient carrying capacity of the roads), and internal environmental pressures (crowded space for medical consultation and waiting). (3) Public health emergency attributes of the sample hospitals: The selected samples are all designated hospitals for the treatment of COVID-19 and are responsible for the emergency response to major public health emergencies; the vulnerability of their transport environments is even more pronounced in extreme cases (Figure 2).

Table 1.
Statistics on relevant information of Guangzhou’s districts.
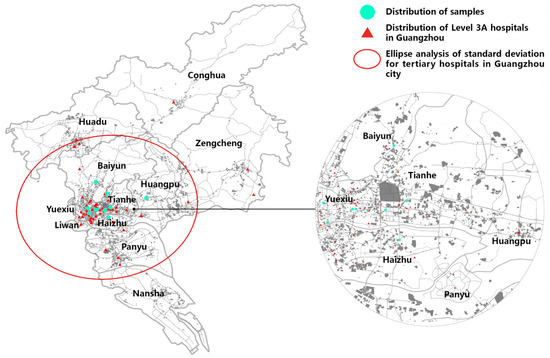
Figure 2.
Sample distribution map.
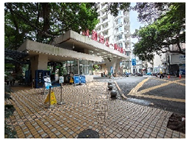
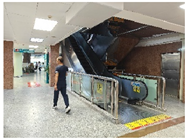
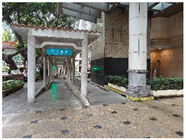
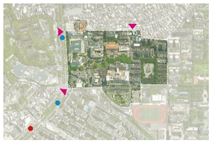
Kim pointed out that the improvement in the transport environment for medical care contributes to the psychological healing of patients, emphasising the need to build transport links between the external and internal spaces of hospitals [42]. Arakawa Martins further subdivided the exterior space of the hospital into seven functional zones (site entrance zone, vehicular and pedestrian zone, parking zone, building entrance zone, internal and external connectivity zone, external activity zone, and service zone) [43]. In summary, the samples selected for this study fully reflect the typical characteristics of patient transport needs in terms of the number of beds, site area, building density, average daily outpatient volume, and other core indicators, and are representative of the study (see Appendix A).
2.2. Survey Questionnaire Setting
2.2.1. Factors
Based on the connotative characteristics and evaluation directions of the transport needs of patients in high-density urban areas, this study systematically constructs an evaluation system based on the principles of ‘combining comprehensiveness and typicality, and balancing scientificity and feasibility’ in the selection of indicators. The logic of the study is progressive, including the following:
- a.
- Demand analysis and principle anchoring, focusing on the intrinsic connection between patient experience attributes and material attribute indicators, clarifying the evaluation objectives and selection criteria.
- b.
- Field research and qualitative mining through hospital visits and semi-structured interviews with patients’ families to clarify the pain points and key conflicts.
- c.
- Literature evidence-based initial screening indicator set, integrating existing research results to form a basic indicator pool.
- d.
- Expert multidimensional validation and optimisation, from the importance of indicator selection, feasibility, sensitivity (using a 5-point Likert scale), three-dimensional Delphi assessment, and the use of Kendall’s harmony coefficient to test the consensus degree of the indicators, to ensure that the system is scientific and reliable.
The pathway connects the four components of the evidence chain—theory–practice–literature–expert—determining the selection of indicators from theoretical derivation, empirical modification, and quantitative verification.
- (1)
- Semi-structured interviews
Through on-site interviews with ten representative samples, empirical evidence was provided for the construction of a medical transportation indicator system. First, the frequently mentioned negative evaluation items in the table (such as ‘distance from the city centre’ (11:3), ‘ground-level parking spaces’ (4:16), and ‘traffic signage’ (5:11)) directly point to the need to incorporate core indicators such as ‘location accessibility,’ ‘static traffic capacity,’ and ‘clarity of the guidance system’ into the system. Secondly, the prominent positive evaluations of ‘skywalks’ (18:12) and ‘medical streets’ (14:5) validate the idea that ‘indoor–outdoor circulation efficiency’ should be established as a key soft indicator. Furthermore, negative feedback on specific scenarios such as the ‘passenger drop-off system’ and ‘direct access to medical care from the basement’ (5:8, 3:8) requires that indicators be refined to operational levels such as ‘vertical traffic connectivity’ and ‘passenger drop-off area turnover capacity.’ This statistical table, by mapping real demands and pain points, provides data anchors and validation foundations for constructing a hierarchical (macro-level location–meso-level circulation–micro-level nodes), problem-oriented medical transportation indicator system (see Appendix B).
- (2)
- Evidence-based literature
Currently, research on the medical traffic environment involves many disciplines such as transportation, environmental behaviour and psychology, and management; an efficient evaluation index system has not yet been established. Pei research on the integration of the urban road network, hospital services, and emergency management has shown that in the face of hazardous events, the hospital traffic and healthcare system needs to have resilience characteristics [44]. Ghosh’s study determined accessibility, quality of care, safety, and services to be major influencing factors when patients choose hospitals [45]. Lather and Bayraktar sari et al. studies explore the spatial layout of hospital units and how this affects the efficiency and effectiveness of healthcare delivery [46,47]. Douglas and Jiang et al. noted that personal space, a welcoming atmosphere, a supportive environment, and access to external areas and recreational facilities are essential to a patient’s health and wellbeing [48,49]. Several studies have shown significant differences between public and private transport in terms of accessibility to healthcare, which need to be incorporated into hospital accessibility models, and their impact should be accurately measured [19,50,51]. The study of Yazdani found that the use of air transport can significantly improve evacuation requirements when epidemics are detected in hospitals [52]. Furthermore, the study of Neustatel and Ji suggested that parking problems in hospitals lead to delayed patient access, stress, and poor access experiences [53,54]. Zhang found that the size of the outpatient clinic and the number of hospital beds did not have a significant effect on the distribution of footfall according to a survey of 2443 patients in three hospitals [55]. Chen proposed that the traffic environment of outpatient buildings should focus on spatial proximity, station building relationship, and reduction in pedestrian flow interference [56]. Wei study points out the importance of designing pedestrianised transport environments for infection control [57]. Moreover, Ji solves the vehicular traffic problem involved in the delivery of medical supplies in home healthcare services by optimising the model [58]. Zou’s simulation of hospital evacuation found that hospitals should prioritise the evacuation of wheelchair users to improve the efficiency of emergency evacuation [59]. Meanwhile, Trigo and Fumihito explored transport measures to optimise emergency ambulance patient treatment times using GPS data [60,61]. Lv solved the problem of emergency vehicle networking data, improving the speed and reliability of emergency vehicle response, as well as the efficiency of emergency treatment on the way to the doctor [62]. Madelin used simulation models to optimise the internal distribution network of a hospital, suggesting specific improvements such as reducing the frequency of deliveries and optimising routes [63]. Liu and Xin optimised a medical waste transport route model using Anylogic 8.2.3 Personal Learning Edition human flow simulation software and a hybrid dynamic approach, respectively, in order to ensure the fast and safe transport of medical waste during an outbreak [64,65]. Boucherie, Richard developed a number of complex discrete event simulation tools to optimise existing logistics processes in and around hospitals [66].
Based on the characteristics of the medical transport demands of high-density urban areas, the pain points of patient demand were analysed through 10 samples of field research, and a pool of indicators was initially constructed by combining these with literature-based evidence, before being validated using the Delphi method, which measured the importance of the selected indicators (w = 0.635, χ2 = 228.597, p < 0.000), as well as the feasibility (w = 0.759, χ2 = 273.391, p < 0.000) and sensitivity (w = 0.654, χ2 = 235.401, p < 0.001) of significant consistency. Finally, a multilevel evaluation system containing 4 first-level indicators and 25 s-level indicators was determined in order to achieve the closed-loop optimisation from demand mining to the calibration of the indicator selection (Table 2).

Table 2.
Indicators of transport environmental needs for sentinel hospitals.
2.2.2. Questionnaire Setting
The questionnaire is divided into two parts. The first part comprises the basic information of the user group, including gender, age, education, income, reason for coming to the hospital, mode of transport to the hospital, travelling time needed to come to the hospital, and emotion of medical treatment, etc. The second part is the Kano questionnaire, which corresponds to the secondary indexes, with a total of 50 questions set up in both the positive and the negative questions (see Appendix C and Appendix D); this takes into account the fact that the questions are accurate in five dimensions of classification precision (matching the five dimensions of needs), logical symmetry (forward and reverse question anchoring), decision support efficiency (Better–Worse quantification), patient friendliness (low cognitive load), and data purity (avoiding neutrality traps), especially in relation to the healthcare transport study, which is faced with differentiated groups such as ageing and emergency; therefore, a 5-point Likert scale was used. Importance analysis was used to determine the importance of transport demand attributes; these attributes were further divided, with the options of the questionnaire scale corresponding to the secondary demand, as shown in Table 3.

Table 3.
Scale design.
The survey used a combination of paper and electronic questionnaires. Before the formal distribution of the questionnaire, its quality was controlled using a pre-test questionnaire (n = 30). The average completion time of a single questionnaire was 8.6 min, the rate of ambiguity of understanding the reverse questions was less than 5%, the Cronbach’s S value was 0.802, and the value of the KMO metric was 0.831. Additionally, Bartlett’s test of sphericity was 0.000, which passes the reliability and validity test. The study was officially released in May–June 2024, and the research date was selected as Monday/Saturday, with time periods of 8:00–11:30 and 14:30–17:00, respectively. The main object of the study was the group of medical practitioners located in the 10 sample hospitals. Inclusion criteria were as follows: age greater than 18–70 years old, no abnormalities in limb function, no language communication barriers, and direct consent and voluntary participation in the study. Exclusion criteria were as follows: completion of the questionnaire in less than 5 min, observation of the wrong respondents, and the use of the field random sampling method. The number of questionnaires collected should be 10 times the number of items on the Kano scale, and the total number of questionnaires should not be less than 250 [67]. The number of questionnaires distributed in each hospital was 40–50. A total of 465 questionnaires were distributed, excluding some missing questionnaires and 49 invalid questionnaires. In total, 416 valid questionnaires were recovered, and the statistical values are shown in Table 4.

Table 4.
Statistical summary of respondents’ information (n = 416).
The analysis of the statistical information of the group of people who use the medical transport environment shows that 57.06% of men use the environment and 42.94% of women use the environment, which is comparable to the ratio of the two. Among the surveyed participants, individuals holding a bachelor’s degree or higher accounted for 50.17%. Furthermore, those aged 18–40 years constituted 82.81% of the cohort, with 83.64% of this group reporting prior infection with COVID-19. The participant cohort demonstrated a sound understanding of the healthcare transportation environment under both routine and emergency scenarios. The proportion of people who need to travel to the hospital for ≤0.5 h and 0.5–1 h is 46.88% and 43.75%, respectively, and most of the patient groups choose private car, underground, and taxi as the mode of transport for medical treatment, indicating that the underground connection, parking spaces for private cars, and temporary parking for taxis should be considered as key concerns. In the group classification, patients accounted for 70.22%, indicating that the design of the hospital traffic environment should be prioritised from the perspective of the patients’ traffic demand for medical treatment. The stay time of medical groups in ≤1 h and 1–3 h accounted for 81.81%, indicating that the hospital traffic environment mainly serves the short-stay groups. The proportion of negative emotions in patients’ emotions is 49.74%, reflecting that the hospital transport environment should consider the healing nature. Florence Nightingale pointed out that a positive medical environment plays a very important role in accelerating the recovery of patients.
2.3. Statistical Methods
According to the Kano model theory (Table 5), the Hospital Transportation Environment Needs Questionnaire consists of 4 dimensions and 25 attribute elements in the form of Kano questions, with positive and negative phrasing for each question. The following 5-point Likert scale was used: satisfied = 5, deserved = 4, indifferent = 3, tolerated = 2, and dissatisfied = 1. The importance survey also used a 5-point Likert scale—very important = 5, important = 4, neutral = 3, unimportant = 2, and very unimportant = 1. The Kano model divides the need quality attributes into six categories, including must-be quality (M), one-dimensional quality (O), attractive quality (A), indifferent quality (I), reverse quality (R), and question quality (Q).

Table 5.
Kano attribute classification.
This study combines the Better–Worse coefficient calculation method proposed by Bergar et al. in order to conduct a quantitative classification analysis of user group demand. Compared with methods such as utility weighting or joint analysis, which focus on the relative weights or combined utility of attributes, this method can directly quantify the asymmetric effects of demand, objectively distinguish between demand types, and support resource allocation decisions. For a certain demand (n), statistics on the proportion of , and through the proportion of and , are derived, respectively, with the following formulas:
where the Better–Worse coefficient indicates the degree of user satisfaction or dissatisfaction when increasing or decreasing a particular type of need. is the rate of increase in satisfaction for the group of users who satisfy this need, and is the rate of decrease in satisfaction for the group of users who do not satisfy this need. Based on the value of the Better–Worse coefficient on the horizontal and vertical axes, the demand types are classified into four quadrants (Figure 3).
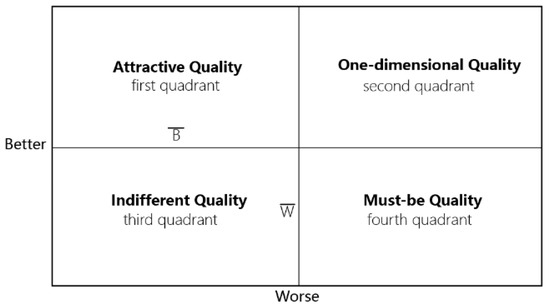
Figure 3.
Better–Worse four-quadrant plot. Notes: When > , < , the requirement is an attractive quality and is located in quadrant 1. When > , > , the requirement is a one-dimensional attribute and is located in quadrant 2. When < , < , the requirement is an indifferent quality and is located in quadrant 3. When < , > , the requirement is a must-be quality and is located in quadrant 4.
3. Results of the Study
The results of the Kano questionnaire relating to the need to use the medical transport environment were tested for validity and reliability using SPSS 26.0. The magnitude of several of these test values for the overall questionnaire is shown in the table below. The overall Cronbach S value is 0.791, of which the Cronbach S value for the positive questions is 0.877, and the Cronbach S value for the negative questions is 0.902; the questionnaire reliability is at a good level. For the validity test, the KMO measure values of the questionnaire overall, positive-oriented questions, and negative-oriented questions are between 0.8 and 0.9, and the validity is at a reasonable level; the significant probability of Bartlett’s sphere test statistic value is 0.000, which is less than 0.01, and has a reasonable correlation (Table 6).

Table 6.
Questionnaire validity and reliability tests.
3.1. Identification of Need Attributes
The attribute classification of transport demand through Better–Worse (Table 7) and the adoption of mixed-effects logistic regression to quantify the impact of clustering found an intra-group correlation coefficient ICC of 0.12, as well as a 95% confidence interval value of 0.05 to 0.18, which is less than 0.2, indicating that the difference in the transport demand of the sample hospitals in relation to seeking medical treatment is not significant. The problematic demand (Q) accounted for less than 5%, and all demands meet the attribute classification requirements. Among them, there are a total of eight items relating to must-be needs (M), including A2, A5, B4, C4, C7, C10, D1, and D2, which are the attributes that must be possessed by the hospital transport environment, or else they will directly affect the efficiency of the patient groups’ access to medical treatment. There are a total of five items relating to one-dimensional needs (O), comprising A3, C1, C2, C5, and C8, which are the patient groups that think the content should be optimised and improved. Additionally, there are a total of seven items relating to attractive needs (A)—A1, A4, B2, B3, A6, C6, and D4—indicating that the hospital transport environment can be provided, greatly improving the patients’ experience of medical treatment. Indifferent need (I) comprise a total of four items—C3, C9, D3, and D5—for which the patient group has no special need for such functions.

Table 7.
Summary of results of the Kano model analysis (n = 416).
3.2. Importance Analysis
Yang [68] introduced the importance degree into the Kano model, using a Likert scale to investigate the importance degree of each element, defining the attributes at a value higher than the average value of the importance degree as high-importance attributes, while the attributes with values lower than the average value of the importance degree are classified as low-importance attributes. These four attributes of the Kano model are subdivided into eight attributes—must-be attributes (M) contain important attributes (M-1) and required attributes (M-2); one-dimensional attributes (O) contain high-added-value one-dimensional attributes (O-1) and low-added-value one-dimensional attributes (O-2); attractive attributes (A) contain high attractive attributes (A-1) and low attractive attributes (A-2); and indifference attributes (I) contain potential attributes (I-1) and irrelevant attributes (I-2).
Summarising the results of the Kano model, B-W coefficients, and importance analysis (Figure 4), the 25 requirements are distributed as follows: nine belong to the must-be attributes, of which six are important attributes, namely, A5, C4, C7, C10, D1, and D2, while three are required attributes, namely, A2, B1, and B4; five belong to the one-dimensional attributes, of which there are four high-added-value one-dimensional attributes, namely, C1, C2, C5, and C8, as well as one low-added-value one-dimensional attribute—A3; seven are attractive attributes, of which four are high attractive attributes and three are low attractive attributes; four are indifferentiated attributes, of which two are potential attributes (D3 and D5) and two are irrelevant attributes (C3 and C9).
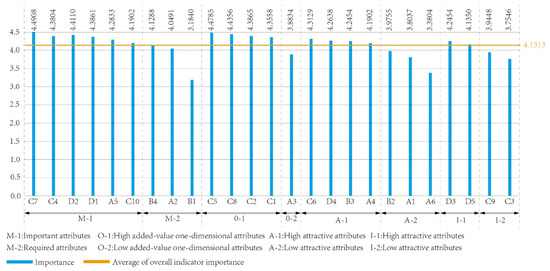
Figure 4.
Kano attributes combined with importance analysis.
3.3. Sensitivity Analysis
Transportation attributes were categorised based on the Kano model and B-W coefficients; however, it is not possible to determine the transport need elements that require improvement, as well as the priority of these improvements. Combined with Yang’s research on the perception of importance, sensitivity () [69] is introduced to calculate the quantitative indicators of each need. The content of Table 8 is divided into four quadrants (Figure 5). The mean value of the better coefficient () is 0.48, while the mean value of the Worse coefficient () is 0.52. The scores of the values are used to horizontally compare the priority of each need in the same quadrant.
Included among these, n is a need and is the sensitivity of that need; the larger the value, the more sensitive the patient group is to that attribute.
According to the values of the quadrant coordinates (Figure 6), the highest sensitivity in the first quadrant (attractive need, A-q) is A4 (public circulation), which indicates that the main entrances and plazas of the site should be reasonably organised in the hospital traffic environment in order to reduce the waiting time for patients and visitors to enter the hospital. The highest sensitivity in the second quadrant (one-dimensional need, O-q) is A3 (transport station), which indicates that taking buses is also an effective way to reach the hospital in a more developed area and increasing the number of bus routes passing through the hospital will significantly improve the experience of medical care for the patient population. The third quadrant (indifferentiated need, I-q) has the highest sensitivity at D5 (supply flow line independence), which indicates that the provision of medical supplies in the transport environment will have an indirect impact on the patient group, but the direct need is not significant. The highest sensitivity in the fourth quadrant (must-have need, M-q) was B4 (convenient pick-up and drop-off), suggesting that the lack of smooth and convenient transport routes to medical care in the private transport environment will significantly reduce the satisfaction of the patient group.
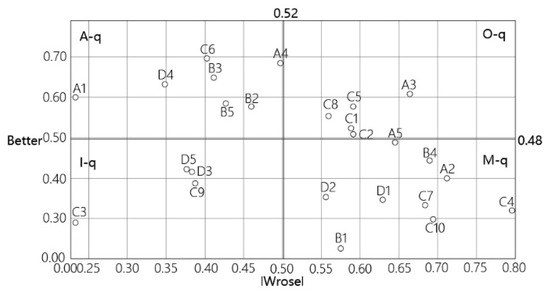
Figure 5.
Better–Worse four-quadrant plot.
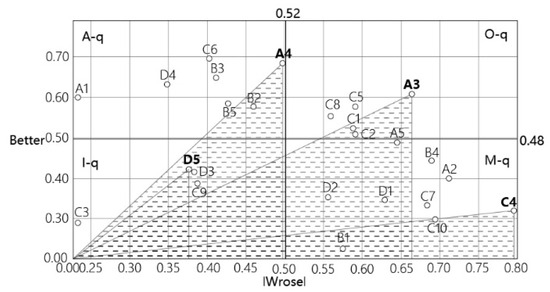
Figure 6.
Sensitivity analysis.
According to the results of the quadrant classification (Table 8), and based on the priority ordering of the Kano model attribute classification ‘M-q > O-q > A-q > I-q’, the sorting of each requirement category can be achieved, i.e., the final result is that must-be needs (C4 > A5 > C7 > C10 > D1 > D2 > B4 > A2 > B1) are prioritised over one-dimensional needs (C5 > C8 > C1 > C2 > A3) over attractive needs (A4 > C6 > B3 > D4 > B2 > A6 > A1) over indifferentiated needs (D5 > D3 > C9 > C3).

Table 8.
Sensitivity ranking.
Table 8.
Sensitivity ranking.
| Serial Number | B-W | Sensitivity | Arrange in Order | Serial Number | B-W | Sensitivity | Arrange in Order |
|---|---|---|---|---|---|---|---|
| A3 | O | 0.8986 | 1 | C10 | M | 0.7559 | 14 |
| C4 | M | 0.8597 | 2 | B2 | A | 0.7364 | 15 |
| A4 | A | 0.8457 | 3 | A6 | A | 0.7237 | 16 |
| C5 | O | 0.8237 | 4 | D4 | A | 0.7192 | 17 |
| B4 | M | 0.8180 | 5 | D1 | M | 0.7188 | 18 |
| A2 | M | 0.8152 | 6 | D2 | M | 0.6595 | 19 |
| A5 | M | 0.8071 | 7 | A1 | A | 0.6424 | 20 |
| C6 | A | 0.8024 | 8 | B1 | M | 0.6175 | 21 |
| C8 | O | 0.7870 | 9 | D5 | I | 0.5640 | 22 |
| C1 | O | 0.7854 | 10 | D3 | I | 0.5630 | 23 |
| C2 | O | 0.7806 | 11 | C9 | I | 0.5477 | 24 |
| B3 | A | 0.7665 | 12 | C3 | I | 0.3719 | 25 |
| C7 | M | 0.7605 | 13 | — | — | — | — |
In conjunction with the importance needs ranking analysis, the ranking priority of each transport need element is shown in Figure 7. Among all requirements, the essential attribute C4 (patient triage) indicates that mixing patients with different health conditions significantly increases the exposure of susceptible populations to pathogens, while mixed medical traffic delays timely treatment for critically ill patients and exacerbates medical congestion. One-dimensional attribute C5 (distance control) should be focused on, whereby clear guidance to facilities can help patients find their destination and shorten the distance to their medical treatment. Meanwhile, charismatic attribute A4 (public diversion) should be considered because hospitals experience an intensive flow of people. Considering the psychological and behavioural state of the patients, as well as the relationship between the patient’s entrance and exit, car parks and distribution plazas should be reasonably designed. At the same time, this study also found that the user group pays attention to the setting of pedestrian traffic in the hospital traffic environment, indicating that a good pedestrian environment can improve the efficiency of medical care and improve the experience of medical care.
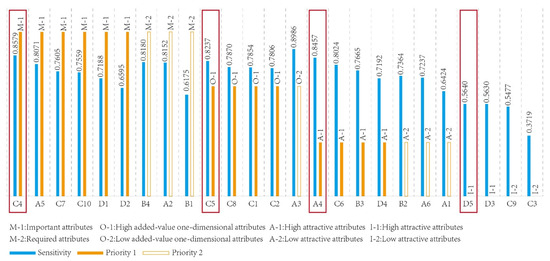
Figure 7.
Ranking of requirements combining importance and sensitivity. Note: The red box indicates the most prominent attribute among all requirement attributes.
Statistics were calculated for each sub-component of need under the first level of need (Table 9). According to the order of the mean sensitivity value, the first level of need can be obtained as follows: public transport (78.88%) > private transport (73.46%) > pedestrian transport (72.75%) > medical transport (64.49%); this reflects the higher importance of public transport in the demand for transport to healthcare compared to other levels of demand. Urban connectivity (A5) indicates that priority should be given to the hospital–urban interface in relation to the patient’s medical transport needs, avoiding thinking about the patient’s transport organisation only from within the base, understanding the patient’s medical transport needs in a fragmented way, and ignoring the continuous spatial perception of a person in medical treatment. This will lead to a decrease in the efficiency of wayfinding. Private transport (73.46%) and walking transport (72.75%) have similar mean values, and the standard deviation of the sensitivity of the second-level subcomponents of private transport is the smallest, and has the least fluctuation, which indicates that the user groups have similar patient experience needs for private transport in the transport environment of medical treatment. The convenience of pick-up and drop-off (B4) has a higher sensitivity ranking, which indicates that user groups are more concerned about driving routes and parking needs in a private transport environment. The standard deviation of the sensitivity of the secondary subitems in the pedestrian transport environment is the largest and it fluctuates the most, which may be due to the different medical conditions of the patients and the differences in cognition, leading to the existence of large differences in the transport needs of the patients. The pedestrian traffic environment is more concerned with patient triage (C4), indicating that hospitals should strictly control the traffic flow of patients with infectious diseases to prevent cross-infection. Medical traffic is significantly lower than the first three items, indicating that the user group pays less attention to flow lines that are not directly related to them, with the highest sensitivity for infectious disease area independence (D1). This conclusion further complements the conclusions of C4.

Table 9.
Comprehensive ranking of needs.
3.4. Group Variability Analysis
This study divided the statistically obtained data into three groups—medical mood, mode of transport to the hospital, and group type—and used SPSS26.0 to test the validity and reliability of the questionnaire results of the demand in the three groups (Figure 8). The significant probability of Bartlett’s sphere test statistic values was 0.000, which was less than 0.01, and the results were at a more reasonable level.
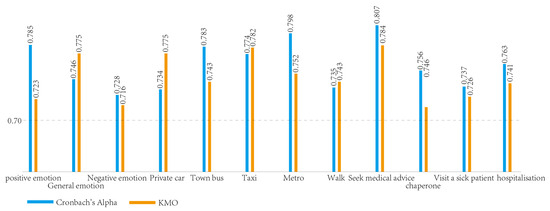
Figure 8.
Group differences in reliability and validity testing.
The top three rankings of the sensitivity of each of the secondary indicators within the group were analysed for their demand preferences (Table 10). The sensitivity rankings of public transport demand, private transport demand, and walking transport demand were generally consistent across the groups, with a more significant demand for urban connectivity (A5), convenient transfers (B4), direct underground access (B3), patient diversion (C4), and emergency and urgent care flow lines (D2).

Table 10.
Group differential needs ranking.
The medical visit mood group has a positive mood, while the general mood groups have a higher degree of need for city connectivity than negative mood patients; the negative mood patients favour the degree of need for transport frequency due to the fact that the high frequency of departures reduces the waiting time of patients, avoids misdiagnosis due to traffic delays, and relieves anxiety. In private transport, the negative emotion patient group is more concerned about the convenience of pick-up and drop-off and the importance of companionship than the other emotion patients, as the former is more concerned about direct underground access. In pedestrian transport, the patient group is more concerned about patient triage; in particular, after the COVID-19 pandemic, people’s awareness of infectious diseases has increased. For medical transport, the positive mood group is more concerned about emergency transport than the other two, and the latter is more concerned about the independence of infectious disease areas. This indicates that there is a greater demand from the user group for smooth and convenient transport flow routes for medical appointments involving acute illnesses.
The level of need for hospital–city connectivity was more pronounced in the groups of modes of transport to the hospital. This suggests that hospitals should have a friendly and continuous spatial interface with the city to reduce the waiting time and walking distance of patients and visitors to the hospital entrance and to reduce traffic congestion around the hospital. In relation to private traffic, private cars are more concerned about underground direct access than other modes of transport, indicating that private cars have higher requirements for the traffic environment of the hospital than other modes of transport; additionally, the hospital should set up an underground traffic connection area, which can be connected to the underground commercial street and should provide access to the diagnostic and treatment units through escalators and lifts. The pedestrian traffic group has a higher degree of need for patient triage, distance control, and pedestrian–vehicle separation, especially in the event of a health emergency, where patient separation and distance control are important methods of preventing and controlling the spread of viruses. In specialised medical transport, emergency and urgent care circulation is a common concern for the patient group, probably because of the need for rapid response and timely treatment in emergency medical situations.
Among group types and categories, patient groups in the public transport group were generally concerned about the frequency of transport, public evacuation, and the degree of need for the frequency of transport, indicating that the patient groups relied more on using public transport for medical treatment. In relation to private transport, the degree of need for convenient transfer is highest in the consultation and hospitalisation group, probably because this group is directly associated with the hospital and due to the idea that convenient transfer will reduce the discomfort in the process of medical treatment. Combined with the interviews, it was found that a small number of patients came from remote rural areas to seek medical treatment, and the travelling time required to come to the hospital was more than 2 h. The psychological pressure to seek medical treatment was high; therefore, convenient transport connections could improve spatial accessibility. On the other hand, it also indicated the existence of the phenomenon of the unbalanced distribution of medical resources. In pedestrian traffic, the patient group has a higher degree of need for distance control, especially the consultation group. In relation to medical traffic, the accompanying and visiting groups have a higher degree of need for the independence of the infectious disease area, because these groups have a higher need for public activity space to meet the needs of resting, walking, and socialising.
4. Discussion
The differences between this study and existing studies of patients’ transport needs for medical treatment are mainly reflected in the following three aspects. (1) Previous studies have explored the important elements of patient transport needs for medical treatment more from a single factor perspective of the transport environment for medical treatment, and have not explored patient variability from the integrated transport system perspective of the city–hospital outdoors–hospital indoors [70,71]. (2) Relative to traditional mathematical and statistical methods [72,73], the Kano model can more comprehensively determine the priority of patient transport needs for medical treatment and optimise the allocation of resources to patient transport for medical treatment by city managers and hospital administrators. (3) The Kano model can regularly reassess the phased priority evolution of patients’ medical transportation needs and make timely adjustments. Unlike previous computational models, which primarily focused on the analysis of static data [74], this research method can swiftly capture differences in patient healthcare transportation needs arising from changes in urban and hospital transportation. When optimising the actual indicators, both material foundation attributes and patient experience attributes must be optimised simultaneously. This is because the former serves as the material foundation for the latter (e.g., parking facilities influence waiting times), while the latter reveals deficiencies in facilities (e.g., ‘route efficiency’ indicates insufficient signage). Given the differing developmental foundations, priorities, and directions across regions, management requirements and control measures for hospitals must also be tailored to local conditions, as well as being adjusted and refined in accordance with the construction goals and requirements of the specific location. Additionally, the research methodology framework established in this paper holds significant implications for studying the transportation needs of users of other building types within cities.
This study has the following limitations, which need to be further improved in future research. First, in terms of methodology, although the Kano model can effectively identify patient need priorities, an increase in the number of positive and negative items in the questionnaire significantly reduces data quality. Therefore, it is necessary to optimise data reliability by streamlining the number of questions. Additionally, analyses based on 10 individual attributes indicate that the impact of individual differences on healthcare transportation needs exhibits variability. Future research may need to incorporate more diverse personal factors, such as health status, disease severity, and socioeconomic status, to enhance explanatory power. Second, in terms of sample representativeness, the current study focuses solely on the ultra-high-density urban environment of 10 hospitals in Guangzhou. Future research could include cases from differentiated regions such as low-density cities and pilot zones for tiered healthcare systems. For example, the former should prioritise enhancing parking facilities and private vehicle shuttle services, while the latter should improve public transport adaptability through cross-regional medical shuttle lines and appointment-based shuttle buses. Thirdly, in terms of research dimensions, the existing two-dimensional analysis framework of demand and importance can reflect basic cognition, but it fails to combine spatial elements such as urban land use mix and multi-modal transportation accessibility to construct a predictive model. Future research could integrate GIS spatiotemporal data analysis technology to establish a dynamic demand prediction system (introducing entropy methods to adjust indicators). Additionally, there is an insufficient exploration of the differentiated needs of special groups (such as patients transferred from other regions). It is recommended to supplement surveys of specific populations through stratified sampling and explore potential influencing factors such as appointment booking time slots, the number of accompanying persons, and emergency medical scenarios, thereby forming a more inclusive transportation service strategy. Future research could expand the regional scope, deepen the analysis of variable correlations, and introduce implementation cost calculation models to extend the conclusions to diverse urban types and complex medical scenarios, thereby providing theoretical support for refined urban medical transportation planning.
5. Conclusions
Based on the Kano model, this study systematically developed a questionnaire relating to patient transportation environment needs, which includes 4 primary indicators and 25 secondary indicators. A field survey was conducted in 10 hospitals in Guangzhou, and the Better–Worse coefficient and importance analysis were combined to define the attributes of each factor and their degree of influence. Through sensitivity ranking calculations, key priority factors were identified. The questionnaire’s reliability and validity were verified, and the study clarified the key areas for optimising transportation environment factors.
- (1)
- Prioritise the efficiency of public transport connections
Optimising public transport should be the core task of hospital transport environment renovations. Specifically, this goal should be achieved by strengthening seamless connections between hospitals and the city’s main road network and rail transit stations (e.g., by adding shuttle lines and reserving space for metro connections), while reducing investment in low-demand facilities (e.g., direct aerial passageways). Additionally, the efficiency of private vehicle traffic flows should be improved in tandem with ensuring safe pedestrian diversion designs, while strictly controlling the proportion of resources allocated to special medical transportation. It is recommended that the above content be incorporated into the Chinese Comprehensive Hospital Architectural Design Standards, explicitly stipulating that public transportation hubs must be established within a 200 metre radius of comprehensive hospitals, and that this requirement could be used as a bonus criterion in the green building evaluation system.
- (2)
- Establish a tiered response-based transportation service system
- a.
- Private transportation: Optimise drop-off and parking management to improve traffic efficiency. Set up clearly marked, time-limited ‘quick entry and exit’ drop-off zones near the hospital entrance and strictly separate them from long-term parking areas (such as underground/remote car parks). Mandatory implementation of intelligent parking guidance systems (real-time display of available parking spaces and optimal routes) should be integrated into the city’s ‘new infrastructure’ smart transportation system to effectively alleviate congestion at entrances (Figure 9).
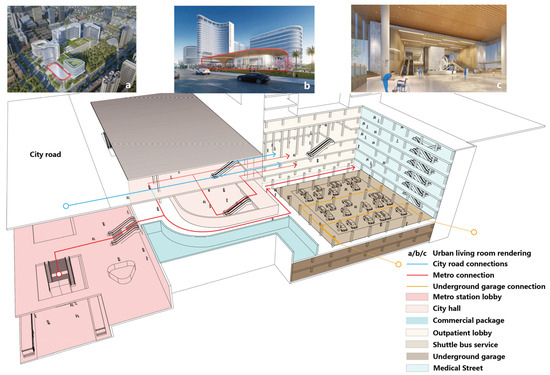 Figure 9. Hospital and urban complex transport connection map. Note: the red dotted box shows the urban living room rendering.
 - b.
- In terms of pedestrian traffic, ensure safe and comfortable walking and optimise the medical treatment process. Designated treatment hospitals (in accordance with the Chinese Construction Standards for Infectious Disease Hospitals and emergency planning) must strictly implement ‘patient segregation’ and incorporate infection control standards into hospital protocols. General hospitals should optimise pedestrian networks, add continuous sunshades and rain shelters, and install seating areas (integrated with courtyard landscaping). Implement a ‘security check exemption’ system (for non-critical areas and routine outpatient services) to streamline processes, enhance efficiency, and improve the patient experience.
- c.
- Special medical transportation focuses on core emergency support and strictly controls resource allocation. Only the ‘emergency green channel’ is retained and strengthened to ensure ambulances reach the emergency area with ‘zero delay.’ This channel must have physical isolation, dedicated entrances, and intelligent interconnection (traffic signal priority) features, and be clearly stipulated in the Comprehensive Hospital Construction Standards and local emergency regulations. Strictly control the proportion of other special transportation resources to ensure the fairness and efficiency of public medical resources, as well as prioritising core emergency needs.
- (3)
- Differentiated responses to the core demands of different groups
In terms of emotional state, priority should be given to improving public transport frequency, optimising convenient pick-up and drop-off services, and strengthening independent signage in infectious disease areas to alleviate psychological stress for patients with high anxiety and negative emotions. For patients with positive/neutral emotions, the focus should be on improving seamless connections between hospitals and urban transport networks, ensuring the smooth flow of dedicated emergency and first aid channels, and optimising direct access for private cars to core treatment areas. In response to transportation behaviour patterns, public transportation must significantly increase route density and peak-hour departure frequencies while optimising station crowd management. Private vehicles require the construction of efficient multi-level transfer zones that are directly connected to treatment units (with adequate vertical transportation), the implementation of appointment-based parking and smart guidance systems, and the provision of sufficient drop-off zones for quick exits. Pedestrian systems must strictly enforce patient-to-patient and pedestrian-to-vehicle separation, optimise pathways and environments, and strengthen distance control during emergencies. Special medical transportation must ensure that emergency and urgent care channels remain unobstructed 24/7 and that infectious disease zones have completely independent circulation routes. For different social groups, high-frequency service coverage must be ensured for public transport dependents. Convenient drop-off zones should be set up at the hospital entrance for outpatient/inpatient groups, while intra-hospital shuttle services should be improved. Scheduled shuttle buses should be established for patients in remote areas (supplemented by long-term strategies for the balanced allocation of regional medical resources); path distance control and safety for walking outpatient groups should be optimised; and the needs of accompanying visitors for independent transportation and resting spaces in infectious disease zones should be met.
- (4)
- Establish a dynamic demand assessment mechanism
Regularly monitor changes in demand for medical care and transportation modes (with a particular focus on the combined effects of negative emotions and private car use), and identify ‘urban–hospital connectivity,’ ‘internal transfer efficiency,’ and the ‘isolation of infectious disease flow lines’ as indicators for continuous optimisation.
This study provides new research insights for the development of healthcare transportation environments in cities with high urbanisation rates and population densities, validates the methodological feasibility, and systematically assesses the hierarchical structure of transportation demand guided by healthcare experience. The research findings, supported by demand priority data, propose strategies for transportation environment planning and design.
Author Contributions
Conceptualization: H.G., J.X. and W.Z.; writing—original draft: H.G. and J.X.; visualisation: J.X.; software: J.X.; methodology: H.G. and M.D.; investigation: H.G., J.X., H.Z. and X.X.; formal analysis: H.G. and J.X.; data curation: J.X., H.Z. and Y.Y.; validation: J.X.; writing—review: J.X.; editing: W.Z., H.Z. and Y.Y.; supervision: Y.Y. and M.D.; resources: H.G. and H.Z.; project administration: H.G., J.X. and W.Z.; funding acquisition: H.G. All authors have read and agreed to the published version of the manuscript.
Funding
This research received grants from the 2024 Guangdong Philosophy and Social Sciences Planning Youth Project (grant number GD24 YYS19), the 2023 Guangdong Province undergraduate teaching quality and teaching reform project (grant number 1138), the 2024 Guangdong Province Education Science Planning Project (Higher Education Special) (grant number 2024 GXJK225), the Guangdong Province General Universities Young Innovative Talent Project (grant number 2023 WQNCX122), and the 2022 project of The 14th Five-Year Plan for the Development of Philosophy and Social Sciences in Guangzhou City (grant number 2022 GZYB54).
Data Availability Statement
The data presented in this study are included in the article; further inquiries can be directed to the corresponding author.
Acknowledgments
The authors would like to express their sincere gratitude to the 15 master′s students from the School of Architecture at South China University of Technology for their invaluable assistance in data collection, as well as to the 465 respondents who participated in the questionnaire survey for this study.
Conflicts of Interest
The authors have no conflicts of interest to declare.
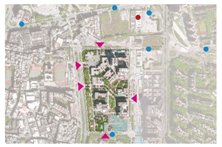
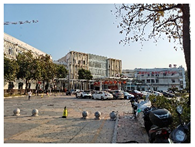
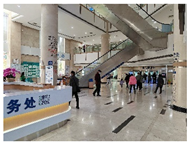
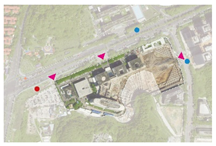
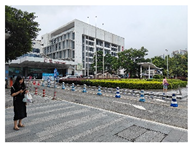
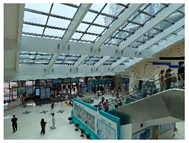
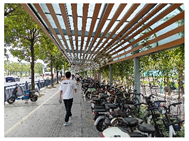
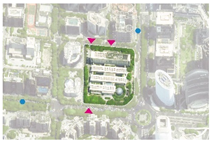
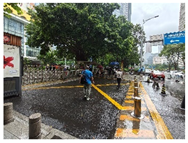
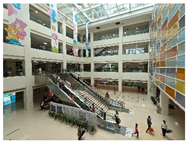
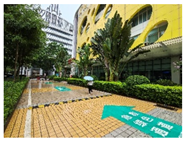
Appendix A. List of Study Samples
| S-1: Guangzhou Eighth People’s Hospital (routine sentinel hospitals). | |||
| Site plan | Entrance environment | Indoor environment | Outdoor environment |
 |  |  | 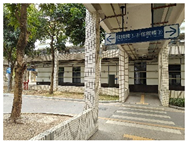 |
| CT: 2010; NB: 1100; SA: 13.34; BD: 40%; ADOV: 5000 | |||
| S-2: The First Hospital of Guangzhou Medical University (sentinel hospitals in case of an epidemic). | |||
 | 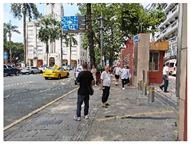 | 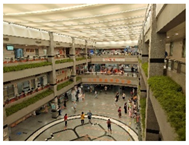 | 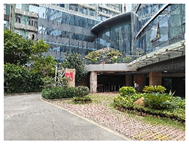 |
| CT: 1903; NB: 1500; SA: 1.01; BD: 54%; ADOV: 7500 | |||
| S-3: The Third Affiliated Hospital of Sun Yat-sen University Lingnan Campus (sentinel hospitals in case of an epidemic). | |||
 |  |  |  |
| CT: 2011; NB: 900; SA: 8.7; BD: 47%; ADOV: 4000 | |||
| S-4: Guangdong Provincial People’s Hospital (sentinel hospitals in case of an epidemic). | |||
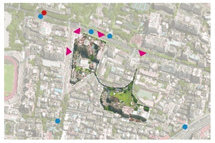 | 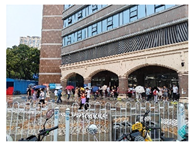 | 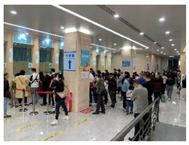 | 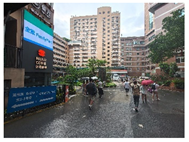 |
| CT: 1946; NB: 2500; SA: 7.71; BD: 45%; ADOV: 10000 | |||
| S-5: Guangzhou First People’s Hospital (sentinel hospitals in case of an epidemic). | |||
 |  |  |  |
| T: 1899; NB: 1600; SA: 18.05; BD: 39%; ADOV: 7500 | |||
| S-6: Nanfang Hospital, Southern Medical University (sentinel hospitals in case of an epidemic). | |||
 | 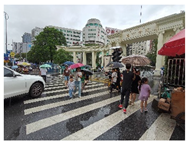 | 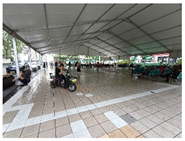 |  |
| CT: 1941; NB: 2200; SA: 20.3; BD: 35%; ADOV: 8200 | |||
| S-7: The Third Affiliated Hospital of Sun Yat-sen University (sentinel hospitals in case of an epidemic). | |||
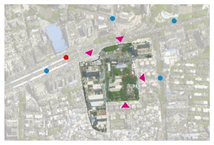 | 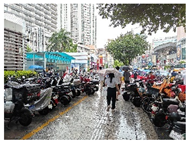 | 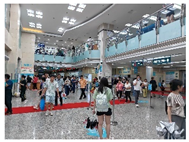 | 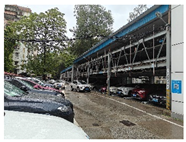 |
| CT: 1971; NB: 1800; SA: 11.0; BD: 42%; ADOV: 14000 | |||
| S-8: The First Affiliated Hospital of Sun Yat-sen University (sentinel hospitals in case of an epidemic). | |||
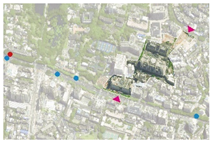 | 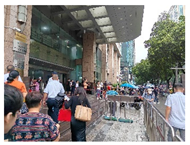 | 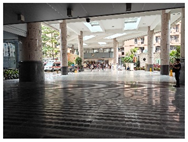 | 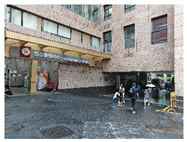 |
| CT: 1910; NB: 2200; SA: 5.65; BD: 58%; ADOV: 8500 | |||
| S-9: Guangdong Second People’s Hospital (sentinel hospitals in case of an epidemic). | |||
 |  | 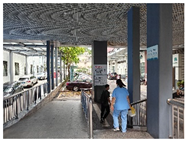 | 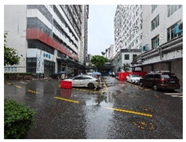 |
| CT: 1947; NB: 1500; SA: 2.0; BD: 49%; ADOV: 5000 | |||
| S-10: Guangzhou Women and Children Medical Centre (sentinel hospitals in case of an epidemic). | |||
 |  |  |  |
| CT: 2006; NB: 700; SA: 2.76; BD: 40%; ADOV: 13000 | |||
Note:  construction time: CT; number of beds: NB; site area: SA; building density: BD; average daily outpatient visitors: ADOV | |||
Appendix B. Statistical Summary of Representative Views of Respondents
| Scope of Evaluation | Environmental Factors Mentioned | Positive Evaluation | Negative Evaluation | A More Representative View of the Visit Interview |
| Planning layout | Surroundings | 5 | 4 | Beautiful natural environment |
| Distance to urban core | 11 | 3 | Hospitals are relatively conveniently located close to the city | |
| planning district | 6 | 2 | Clear zoning of infectious and general disease areas | |
| Site entrances and exits | 8 | 14 | Easy access to the campus from city roads | |
| Entrance Plaza | 6 | 8 | The entrance plaza is pleasantly scaled | |
| linking corridors | 18 | 12 | There are corridors connecting the different functional areas | |
| Site scalability | 7 | 4 | Sufficient space for hospital conversion and expansion | |
| Neighbourhood | 2 | 13 | The hospital is located in a district with a variety of neighbouring businesses | |
| Traffic organisation | loading and unloading system | 5 | 8 | Easy access to and from the hospital |
| Patient Attendance | 13 | 9 | Easy access to clinic space and examination space | |
| Visitor flow line | 3 | 5 | It’s easy for visitors to see patients | |
| Infectious Disease Patient Flow Line | 6 | 7 | Separate flow lines for patients with infectious diseases and non-crossing of flow lines in integrated wards | |
| emergency channel | 13 | 10 | Emergency and urgent care routes are independent and convenient | |
| Inpatient flow lines | 6 | 4 | Easy access for inpatients from wards to public spaces | |
| Basement direct access to medical care | 3 | 8 | Direct access to the consultation unit from the basement | |
| traffic signal | 5 | 11 | Have clear traffic signage | |
| stairlift | 8 | 8 | Floor lifts provide easy access to the patient’s desired treatment unit | |
| canteens | 13 | 7 | Easy to eat | |
| Outdoor environment | Green Configuration | 10 | 12 | The site is richly landscaped |
| rest | 14 | 9 | Sufficient outdoor space for rest and relaxation | |
| Ground level car parking spaces | 4 | 16 | Ground floor car park planning | |
| seating | 9 | 13 | Outdoor resting seats are reasonably located and sufficient in number | |
| Building Connections | 3 | 7 | Connections between buildings to facilitate patient access | |
| Outdoor platform | 4 | 2 | Outdoor public terrace to facilitate patients’ outdoor activities | |
| Indoor environment | shops | 12 | 8 | Reasonable location of the shops in the hospital |
| banks | 9 | 5 | Banks are reasonably located in hospitals | |
| Indoor seating | 13 | 7 | Appropriate distribution of seating in public event spaces | |
| colour | 8 | 5 | Hospital interior walls and ceilings in pleasant colours | |
| Interior view | 7 | 11 | Outdoor landscaping can be seen from the hospital interior | |
| Section Affiliations | 6 | 3 | Short walking distances between outpatient examinations and close functional correlation | |
| Medical Street | 14 | 5 | Easy access to medical street connections | |
| Interior entrance space | 9 | 6 | Clear layout of the entrance interior space | |
| signage | 11 | 5 | There is clear signage to facilitate patient access to different areas |
Appendix C. Forward and Reverse Setting Method for Questions
| Transport Needs | Forward Issue |
| Traffic type (A1) | Would you be satisfied if there were more modes of transport travelling to and from the hospital (e.g., special buses for medical appointments)? |
| Satisfied ☐ Only natural ☐ Not matter ☐ Tolerate ☐ Dissatisfied ☐ | |
| Traffic frequency (A2) | Would you be satisfied if the frequency of underground or bus service to and from the hospital was increased? |
| Satisfied ☐ Only natural ☐ Not matter ☐ Tolerate ☐ Dissatisfied ☐ | |
| Transport station (A3) | Would you be satisfied if the number of bus routes to reach the hospital was increased? |
| Satisfied ☐ Only natural ☐ Not matter ☐ Tolerate ☐ Dissatisfied ☐ | |
| Public evacuation (A4) | Would you be satisfied if the hospital entrance plaza was expanded? |
| Satisfied ☐ Only natural ☐ Not matter ☐ Tolerate ☐ Dissatisfied ☐ | |
| City connection (A5) | Would you be satisfied if the width of the roads around the hospital were widened? |
| Satisfied ☐ Only natural ☐ Not matter ☐ Tolerate ☐ Dissatisfied ☐ | |
| Air accessible (A6) | Would you be satisfied if the hospital had an emergency aircraft apron? |
| Satisfied ☐ Only natural ☐ Not matter ☐ Tolerate ☐ Dissatisfied ☐ | |
| Long-term parking (B1) | Would you be satisfied with an increase in the number of parking spaces at the hospital where you can park for longer periods of time? |
| Satisfied ☐ Only natural ☐ Not matter ☐ Tolerate ☐ Dissatisfied ☐ | |
| Short-term parking (B2) | Would you be satisfied with the addition of dedicated lanes for stop-and-go taxis? |
| Satisfied ☐ Only natural ☐ Not matter ☐ Tolerate ☐ Dissatisfied ☐ | |
| Direct underground (B3) | Would you be satisfied if the hospital allowed patients to take the lift directly from the underground car park up to the ground floor outpatient hall? |
| Satisfied ☐ Only natural ☐ Not matter ☐ Tolerate ☐ Dissatisfied ☐ | |
| Convenient pick-up and drop-off (B4) | Would you be satisfied if patients could take a bus straight to the lift entrances and exits of the hospital’s outpatient and inpatient departments? |
| Satisfied ☐ Only natural ☐ Not matter ☐ Tolerate ☐ Dissatisfied ☐ | |
| Pedestrian environment (C1) | Would you be satisfied if the hospital’s walking area became more comfortable and accessible? |
| Satisfied ☐ Only natural ☐ Not matter ☐ Tolerate ☐ Dissatisfied ☐ | |
| Pedestrian–vehicle separation (C2) | Would you be happy if the footpath and motorway routes within the hospital were separated for access? |
| Satisfied ☐ Only natural ☐ Not matter ☐ Tolerate ☐ Dissatisfied ☐ | |
| Patient–doctor triage (C3) | Would you be satisfied if doctors and patients entered and left the consultation unit through different entrances? |
| Satisfied ☐ Only natural ☐ Not matter ☐ Tolerate ☐ Dissatisfied ☐ | |
| Patient triage (C4) | Would you be satisfied if the entrances and exits to and from the consultation unit were separated for patients with non-communicable diseases and patients with communicable diseases? |
| Satisfied ☐ Only natural ☐ Not matter ☐ Tolerate ☐ Dissatisfied ☐ | |
| Distance control (C5) | Would you be satisfied if the walking route distance for patients to get to the doctor became shorter? |
| Satisfied ☐ Only natural ☐ Not matter ☐ Tolerate ☐ Dissatisfied ☐ | |
| Rest stop (C6) | Would you be satisfied if the hospital had landscaped gardens that catered for patient activities, family waiting and sitting needs? |
| Satisfied ☐ Only natural ☐ Not matter ☐ Tolerate ☐ Dissatisfied ☐ | |
| Sunshade and heat insulation (C7) | Would you be satisfied if there were canopies and corridors connecting the entrances and exits of the hospital’s treatment units? |
| Satisfied ☐ Only natural ☐ Not matter ☐ Tolerate ☐ Dissatisfied ☐ | |
| Guide (C8) | Would you be satisfied if the hospital put more signposts? |
| Satisfied ☐ Only natural ☐ Not matter ☐ Tolerate ☐ Dissatisfied ☐ | |
| Security check (C9) | Would you be satisfied if the number of security lanes in and out of the hospital were increased? |
| Satisfied ☐ Only natural ☐ Not matter ☐ Tolerate ☐ Dissatisfied ☐ | |
| Public evacuation (C10) | Would you be satisfied if the number of safe evacuation routes in hospitals was increased? |
| Satisfied ☐ Only natural ☐ Not matter ☐ Tolerate ☐ Dissatisfied ☐ | |
| Infectious disease area independence (D1) | Would you be satisfied if the hospital’s infectious wards were separated from the general wards? |
| Satisfied ☐ Only natural ☐ Not matter ☐ Tolerate ☐ Dissatisfied ☐ | |
| Emergency and urgent care flow line (D2) | Would you be satisfied with additional dedicated routes for transporting emergency patients? |
| Satisfied ☐ Only natural ☐ Not matter ☐ Tolerate ☐ Dissatisfied ☐ | |
| Separate clean flow lines (D3) | Would you be satisfied with the addition of dedicated routes for the delivery of medically clean items? |
| Satisfied ☐ Only natural ☐ Not matter ☐ Tolerate ☐ Dissatisfied ☐ | |
| Waste flow lines are independent (D4) | Would you be satisfied with the addition of dedicated routes for transporting medical contaminants? |
| Satisfied ☐ Only natural ☐ Not matter ☐ Tolerate ☐ Dissatisfied ☐ | |
| Supply flow line independence (D5) | Would you be satisfied with the addition of dedicated routes for the supply of hospital logistics items? |
| Satisfied ☐ Only natural ☐ Not matter ☐ Tolerate ☐ Dissatisfied ☐ |
Appendix D. Forward and Reverse Setting Method for Questions
| Transport Needs | Reverse Issue |
| Traffic type (A1) | Would you be dissatisfied if there were fewer modes of transport travelling to and from the hospital (e.g., special buses for medical appointments)? |
| Satisfied ☐ Only natural ☐ Not matter ☐ Tolerate ☐ Dissatisfied ☐ | |
| Traffic frequency (A2) | Would you be dissatisfied if the frequency of metro or bus journeys to and from the hospital were reduced? |
| Satisfied ☐ Only natural ☐ Not matter ☐ Tolerate ☐ Dissatisfied ☐ | |
| Transport station (A3) | Would you be dissatisfied if the number of bus routes arriving at the hospital was reduced? |
| Satisfied ☐ Only natural ☐ Not matter ☐ Tolerate ☐ Dissatisfied ☐ | |
| Public evacuation (A4) | Would you be dissatisfied if the size of the hospital entrance plaza was reduced? |
| Satisfied ☐ Only natural ☐ Not matter ☐ Tolerate ☐ Dissatisfied ☐ | |
| City connection (A5) | Would you be dissatisfied if the width of the roads around the hospital were narrowed? |
| Satisfied ☐ Only natural ☐ Not matter ☐ Tolerate ☐ Dissatisfied ☐ | |
| Air accessible (A6) | Would you feel dissatisfied if the hospital did not have an emergency aircraft apron? |
| Satisfied ☐ Only natural ☐ Not matter ☐ Tolerate ☐ Dissatisfied ☐ | |
| Long-term parking (B1) | Would you be dissatisfied with a reduction in the number of parking spaces at the hospital where you can park for extended periods of time? |
| Satisfied ☐ Only natural ☐ Not matter ☐ Tolerate ☐ Dissatisfied ☐ | |
| Short-term parking (B2) | Would you be dissatisfied if there were no dedicated lanes for taxis to stop and go? |
| Satisfied ☐ Only natural ☐ Not matter ☐ Tolerate ☐ Dissatisfied ☐ | |
| Direct underground (B3) | Would you be dissatisfied if the hospital could not allow patients to take the lift directly from the underground car park up to the ground floor outpatient hall? |
| Satisfied ☐ Only natural ☐ Not matter ☐ Tolerate ☐ Dissatisfied ☐ | |
| Convenient pick-up and drop-off (B4) | Would you be dissatisfied if patients could not get a direct ride to the lift entrances and exits of the hospital’s outpatient and inpatient departments? |
| Satisfied ☐ Only natural ☐ Not matter ☐ Tolerate ☐ Dissatisfied ☐ | |
| Pedestrian environment (C1) | Would you feel dissatisfied if the hospital had a poor walk-in area? |
| Satisfied ☐ Only natural ☐ Not matter ☐ Tolerate ☐ Dissatisfied ☐ | |
| Pedestrian–vehicle separation (C2) | Would you be unhappy if the footpath and motorway routes crossed each other? |
| Satisfied ☐ Only natural ☐ Not matter ☐ Tolerate ☐ Dissatisfied ☐ | |
| Patient–doctor triage (C3) | Would you be dissatisfied if doctors and patients shared entrances and exits to and from the consultation unit? |
| Satisfied ☐ Only natural ☐ Not matter ☐ Tolerate ☐ Dissatisfied ☐ | |
| Patient triage (C4) | Would you be dissatisfied if the entrances and exits to and from the consultation unit were shared between patients with non-communicable diseases and patients with communicable diseases? |
| Satisfied ☐ Only natural ☐ Not matter ☐ Tolerate ☐ Dissatisfied ☐ | |
| Distance control (C5) | Would you be dissatisfied if the walking route distances for patient visits became longer? |
| Satisfied ☐ Only natural ☐ Not matter ☐ Tolerate ☐ Dissatisfied ☐ | |
| Rest stop (C6) | Would you be dissatisfied if the hospital did not have landscaped gardens that catered for patient activities, family waiting and sitting needs? |
| Satisfied ☐ Only natural ☐ Not matter ☐ Tolerate ☐ Dissatisfied ☐ | |
| Sunshade and heat Insulation (C7) | Would you be dissatisfied if there were no canopies or corridors connecting the entrances and exits of the hospital’s treatment units? |
| Satisfied ☐ Only natural ☐ Not matter ☐ Tolerate ☐ Dissatisfied ☐ | |
| Guide (C8) | Would you be dissatisfied if the hospital cut down on some of the signposting when you were looking for the treatment unit you were going to? |
| Satisfied ☐ Only natural ☐ Not matter ☐ Tolerate ☐ Dissatisfied ☐ | |
| Security check (C9) | Would you be dissatisfied if the number of security lanes in and out of the hospital were reduced? |
| Satisfied ☐ Only natural ☐ Not matter ☐ Tolerate ☐ Dissatisfied ☐ | |
| Public evacuation (C10) | Would you be dissatisfied if the number of safe evacuation routes in a hospital was reduced? |
| Satisfied ☐ Only natural ☐ Not matter ☐ Tolerate ☐ Dissatisfied ☐ | |
| Infectious disease area independence (D1) | Would you be dissatisfied if the infectious wards and general wards of a hospital were placed in the same building, but with separate entrances and exits? |
| Satisfied ☐ Only natural ☐ Not matter ☐ Tolerate ☐ Dissatisfied ☐ | |
| Emergency and urgent care flow line (D2) | Would you be satisfied if there were fewer dedicated routes for transporting acutely ill patients? |
| Satisfied ☐ Only natural ☐ Not matter ☐ Tolerate ☐ Dissatisfied ☐ | |
| Separate clean flow lines (D3) | Would you be dissatisfied if there were fewer dedicated routes for transporting medically clean items? |
| Satisfied ☐ Only natural ☐ Not matter ☐ Tolerate ☐ Dissatisfied ☐ | |
| Waste flow lines are Independent (D4) | Would you be dissatisfied if there were fewer dedicated routes for transporting medical contaminants? |
| Satisfied ☐ Only natural ☐ Not matter ☐ Tolerate ☐ Dissatisfied ☐ | |
| Supply flow line Independence (D5) | Would you be dissatisfied if there were fewer dedicated routes for the supply of hospital logistics items? |
| Satisfied ☐ Only natural ☐ Not matter ☐ Tolerate ☐ Dissatisfied ☐ |
References
- Jia, Z.; Nourian, P.; Luscuere, P.; Wagenaar, C. Spatial decision support systems for hospital layout design: A review. J. Build. Eng. 2023, 67, 106042. [Google Scholar] [CrossRef]
- Ahmed, S.; Muhammad, I.B.; Isa, A.A.; Sani, M.A. Influence of Spatial Layout on Wayfinding Behaviour in Hospital Environment in Nigeria. J. Art Archit. Built Environ. 2020, 3, 26–44. [Google Scholar] [CrossRef]
- Wanigarathna, N.; Sherratt, F.; Price, A.; Austin, S. Design re-use: Critical application of healthcare building design evidence. Eng. Constr. Arch. Manag. 2019, 26, 350–366. [Google Scholar] [CrossRef]
- Memari, S.; Kocaturk, T.; Lozanovska, M.; Andrews, F.; Tucker, R. Future proofing for hospital building design: From research to practice. Arch. Eng. Des. Manag. 2023, 19, 681–700. [Google Scholar] [CrossRef]
- Chen, L.; Chen, T.; Lan, T.; Chen, C.; Pan, J. The Contributions of Population Distribution, Healthcare Resourcing, and Transportation Infrastructure to Spatial Accessibility of Health Care. Inq. J. Health Care Organ. Provis. Financ. 2023, 60, 00469580221146041. [Google Scholar] [CrossRef]
- Qu, G.; Liu, Z.; Ren, L.; Liu, G.; Zhang, Y.; Zhan, M.; Yan, M.; Liu, W.; Li, W. Intelligent generation method of infection risk map and management system in hospital waiting room for respiratory infectious diseases. J. Build. Eng. 2024, 96, 110571. [Google Scholar] [CrossRef]
- Beggs, C.; Knibbs, L.D.; Johnson, G.R.; Morawska, L. Environmental contamination and hospital-acquired infection: Factors that are easily overlooked. Indoor Air 2015, 25, 462–474. [Google Scholar] [CrossRef]
- Lu, X.; Cao, Y.; Wang, Z.; Wang, H.; Lange, E. Multisensory symphony: Synergistic effects of vision, audition, and olfaction on the restorative properties of hospital healing landscapes. Build. Environ. 2025, 275, 112812. [Google Scholar] [CrossRef]
- Zuo, C.; Zhang, X.; Zhao, G.; Yan, L. PCR: A Parallel Convolution Residual Network for Traffic Flow Prediction. IEEE Trans. Emerg. Top. Comput. Intell. 2025, 9, 3072–3083. [Google Scholar] [CrossRef]
- Morag, I.; Sonmez, V.; Puyvelde, A.V.; Pintelon, L. Improving wayfinding in hospitals for people with diverse needs and abilities: An exploratory approach based on multi-criteria decision making. Appl. Ergon. 2024, 114, 104149. [Google Scholar] [CrossRef]
- Jiang, S.; Allison, D.; Duchowski, A.T. Hospital Greenspaces and the Impacts on Wayfinding and Spatial Experience: An Explorative Experiment Through Immersive Virtual Environment (IVE) Techniques. HERD Health Environ. Res. Des. J. 2022, 153, 206–228. [Google Scholar] [CrossRef]
- Pouyan, A.E.; Ghanbaran, A.; Shakibamanesh, A. Impact of circulation complexity on hospital wayfinding behavior (Case study: Milad 1000-bed hospital, Tehran, Iran). J. Build. Eng. 2021, 44, 102931. [Google Scholar] [CrossRef]
- Alam, M.S.; Tabassum, N.J.; Tokey, A.I. Evaluation of Accessibility and Equity to Hospitals by Public Transport: Evidence from the Six Largest Cities of Ohio. BMC Health Serv. Res. 2023, 23, 598. [Google Scholar] [CrossRef] [PubMed]
- Tseung, V.; Verweel, L.; Harvey, M.; Pauley, T.; Walker, J. Hospital Outdoor Spaces: User Experience and Implications for Design. HERD Health Environ. Res. Des. J. 2021, 15, 256–267. [Google Scholar] [CrossRef] [PubMed]
- Feng, H.; Liu, Y.; Liu, Z.; Chi, Z.; Osmani, M. Sustainable Healing and Therapeutic Design Driven Well-Being in Hospital Environment. Buildings 2024, 149, 2731. [Google Scholar] [CrossRef]
- Du, Z.; Lin, B.; Chen, Z.; Ali, R. Psychological Impact of the Hospital Indoor Public Spaces on Patients’ Health, Assessment, and Analysis. Sci. Program. 2022, 2022, 4010643. [Google Scholar] [CrossRef]
- Liao, E.N.; Chehab, L.Z.; Ossmann, M.; Alpers, B.; Patel, D.; Sammann, A. Using Architectural Mapping to Understand Behavior and Space Utilization in a Surgical Waiting Room of a Safety Net Hospital. Int. J. Environ. Res. Public Health 2022, 19, 13870. [Google Scholar] [CrossRef]
- Qi, Y.; Yan, Y.; Lau, S.S.; Tao, Y. Evidence-Based Design for Waiting Space Environment of Pediatric Clinics—Three Hospitals in Shenzhen as Case Studies. Int. J. Environ. Res. Public Health 2021, 18, 11804. [Google Scholar] [CrossRef]
- Cui, B.; Boisjoly, G.; Wasfi, R.; Orpana, H.; Manaugh, K.; Buliung, R.; Kestens, Y.; El-Geneidy, A. Spatial Access by Public Transport and Likelihood of Healthcare Consultations at Hospitals. Transp. Res. Rec. J. Transp. Res. Board 2020, 2674, 188–198. [Google Scholar] [CrossRef]
- Pan, J.; Deng, Y.; Yang, Y.; Zhang, Y. Location-allocation modelling for rational health planning: Applying a two-step optimization approach to evaluate the spatial accessibility improvement of newly added tertiary hospitals in a metropolitan city of China. Soc. Sci. Med. 2023, 338, 116296. [Google Scholar] [CrossRef]
- Ghaffari, F.; Shabak, M.; Norouzi, N.; Fallah, S.N. Hospital salutogenic public spaces: A conceptual framework of effective perceptional environment quality components on patients′ satisfaction. Int. J. Build. Pathol. Adapt. 2021, 41, 965–987. [Google Scholar] [CrossRef]
- Weerasuriya, R.; Henderson-Wilson, C.; Townsend, M. Accessing Green Spaces Within a Healthcare Setting: A Mixed Studies Review of Barriers and Facilitators. HERD Health Environ. Res. Des. J. 2018, 12, 119–140. [Google Scholar] [CrossRef] [PubMed]
- Geng, S.; Chau, H.-W.; Yan, S.; Zhang, W.; Zhang, C. Comparative analysis of hospital environments in Australia and China using the space syntax approach. Int. J. Build. Pathol. Adapt. 2020, 39, 525–546. [Google Scholar] [CrossRef]
- Yang, Z.; Guo, Y.; Feng, X.; Zhou, Y.; Zhou, P.; Li, X.; Qian, X. Evaluating temporal variations in access to multi-tier hospitals using personal vehicles and public transit: Implications for healthcare equity. Sustain. Cities Soc. 2024, 113, 105687. [Google Scholar] [CrossRef]
- Zhang, N.; Huang, H.; Duarte, M.; Zhang, J. Dynamic population flow based risk analysis of infectious disease propagation in a metropolis. Environ. Int. 2016, 94, 369–379. [Google Scholar] [CrossRef]
- Moretti, N.; Chan, Y.-C.; Nakaoka, M.; Mukherjee, A.; Merino, J.; Parlikad, A.K. Data integration for space-aware Digital Twins of hospital operations. Autom. Constr. 2025, 176, 106276. [Google Scholar] [CrossRef]
- Kametani, T.; Nishina, K.; Suzuki, K. Attractive Quality and Must-be Quality from the Viewpoint of Environmental Lifestyle in Japan. In Frontiers in Statistical Quality Control 9; Physica-Verlag HD: Heidelberg, Germany, 2010. [Google Scholar]
- Rozag, R.; Larasati, D.M.; Tampubolon, D.H.; Ramadhani, R.; Ulkhag, M.M. An Application of the Kano Model for Assessing Customer Satisfaction of Hospital Service Quality. In Proceedings of the 2019 IEEE 6th International Conference on Industrial Engineering and Applications (ICIEA), Tokyo, Japan, 12–15 April 2019; pp. 278–283. [Google Scholar]
- Kumar, Y.; Singh, R.; Kataria, C. An approach to identify assistive technology attributes for people with locomotor disability by using a refined Kano model. J. Eng. Des. 2024, 35, 901–920. [Google Scholar] [CrossRef]
- Hu, L.; Fan, J.; Li, C.; Luo, S. Evaluation of Community Commercial Space Design Experience and Optimization Strategy Based on KANO Model. Buildings 2023, 13, 1760. [Google Scholar] [CrossRef]
- Lu, H.; Juan, Y.-K. Applying The DQI-based Kano model and QFD to develop design strategies for visitor centers in national parks. Arch. Eng. Des. Manag. 2021, 19, 215–232. [Google Scholar] [CrossRef]
- Jiang, X.; Zhang, J.; Yang, C.; Wan, R. Evaluating the service quality of insular and coastal recreational fisheries by integration of the SERVQUAL-fuzzy Kano model and importance-performance analysis. Ocean Coast. Manag. 2023, 243, 106753. [Google Scholar] [CrossRef]
- Jia, X.; Yan, B.; Wang, J.; Fang, L. Evaluation and Optimization Paths of Design Elements of Underground Building Atria Based on IPA–Kano Model. Buildings 2023, 13, 789. [Google Scholar] [CrossRef]
- Chen, C.; Zhang, C.; Xu, Z. Online Reviews-Driven Kano-QFD Method for Service Design. IEEE Trans. Eng. Manag. 2024, 71, 8153–8165. [Google Scholar] [CrossRef]
- Wang, Q.; Chen, Y. Applying a Kano-FAST integration approach to design requirements for auditorium chairs. BioResources 2024, 19, 5825–5838. [Google Scholar] [CrossRef]
- Keyvanfar, A.; Shafaghat, A.; Majid, M.Z.A. Adaptive Behavior Satisfaction Index (ABSI) Framework for Assessing Energy Efficient Building Indoor Environment: Applying Kano Model. Int. J. Civ. Eng. 2022, 20, 1415–1429. [Google Scholar] [CrossRef]
- Liu, Y.; You, T.-H.; Zou, J.; Cao, B.-B. Modelling customer requirement for mobile games based on online reviews using BW-CNN and S-Kano models. Expert Syst. Appl. 2024, 258, 125142. [Google Scholar] [CrossRef]
- Yang, Y.; Li, Q.; Li, C.; Qin, Q. User requirements analysis of new energy vehicles based on improved Kano model. Energy 2024, 309, 133134. [Google Scholar] [CrossRef]
- Lee, W.-I.; Chang, T.-H.; Chao, P.-J. The Relationship between Quality of Healthcare Service and Customer Satisfaction- an Example of Hospitals in Taiwan. J. Chin. Inst. Ind. Eng. 2007, 24, 81–95. [Google Scholar] [CrossRef]
- Gustavsson, S.; Gremyr, I.; Sarenmalm, E.K. Using an adapted approach to the Kano model to identify patient needs from various patient roles. TQM J. 2016, 28, 151–162. [Google Scholar] [CrossRef]
- Ferreira, D.C.; Marques, R.C.; Nunes, A.M.; Figueira, J.R. Patients’ satisfaction: The medical appointments valence in Portuguese public hospitals. Omega 2018, 80, 58–76. [Google Scholar] [CrossRef]
- Kim, S. Environmental Design Factors for Open Space in Healing Facilities—Focused on Ann & Robert, H. Lurie Children′s Hospital and The Nationwide Children’s Hospital. Int. J. Adv. Cult. Technol. 2021, 91, 7–15. [Google Scholar]
- Martins, B.A.; Barrie, H.; Visvanathan, R.; Daniel, L.; Martins, L.A.; Ranasinghe, D.; Wilson, A.; Soebarto, V. A Multidisciplinary Exploratory Approach for Investigating the Experience of Older Adults Attending Hospital Services. HERD Health Environ. Res. Des. J. 2020, 14, 141–163. [Google Scholar] [CrossRef]
- Pei, S.-S.; Zhai, C.-H.; Wen, W.-P.; Yu, P.; Wang, Z.-Q. A Dynamic Patients Dispatch and Treatment Model for Resilience Evaluation of Interdependent Transportation-Healthcare System. J. Earthq. Eng. 2023, 27, 4613–4638. [Google Scholar] [CrossRef]
- Ghosh, M. An empirical study on hospital selection in India. Int. J. Health Care Qual. Assur. 2015, 28, 27–39. [Google Scholar] [CrossRef]
- Lather, J.I.; Logan, T.; Renner, K.; Messner, J.I. Implementation and Evaluation of Generative Layout Options Using the Graph Theoretical Approach for a Hospital Layout Problem. J. Comput. Civ. Eng. 2020, 34, 04020014. [Google Scholar] [CrossRef]
- Sari, A.O.B.; Jabi, W. Architectural spatial layout design for hospitals: A review. J. Build. Eng. 2024, 97, 110835. [Google Scholar] [CrossRef]
- Douglas, C.H.; Douglas, M.R. Patient-friendly hospital environments: Exploring the patients’ perspective. Health Expect. 2004, 7, 61–73. [Google Scholar] [CrossRef]
- Jiang, S.; Powers, M.; Allison, D.; Vincent, E. Informing Healthcare Waiting Area Design Using Transparency Attributes: A Comparative Preference Study. HERD Health Environ. Res. Des. J. 2016, 10, 49–63. [Google Scholar] [CrossRef]
- Martin, D.; Jordan, H.; Roderick, P. Taking the bus: Incorporating public transport timetable data into health care accessibility modelling. Environ. Plan. A Econ. Space 2008, 40, 2510–2525. [Google Scholar] [CrossRef]
- Fu, X.; Qiang, Y.; Wang, J.; Zhao, X.; Hwang, F.-J.; Chen, C.-H. Urban Public Transport Accessibility to Medical Services from the Perspective of Residents’ Travel: A Hybrid Assessment Based on the Whole Process. IEEE Access 2021, 9, 8977–8989. [Google Scholar] [CrossRef]
- Yazdani, M.; Haghani, M. Hospital evacuation in large-scale disasters using limited aerial transport resources. Saf. Sci. 2023, 164, 106171. [Google Scholar] [CrossRef]
- Neustatel, D.; Schmid, T.; Zychlinski, N. Coordination of Hospital Parking and Transportation Services: A Simulation-Based Approach. In Proceedings of the 2023 Winter Simulation Conference (WSC), San Antonio, TX, USA, 10–13 December 2023; pp. 1724–1734. [Google Scholar]
- Ji, Y.; Dong, J.; Lai, Z.; Feng, Q. Optimal allocation of shared parking spaces for hospital parkers considering parking choice behavior under bounded rationality. Transp. Lett. 2022, 15, 242–253. [Google Scholar] [CrossRef]
- Zhang, M.; Yang, N. Spatial distribution of patient traffic volume in outpatient buildings of large general hospitals in China. J. Asian Arch. Build. Eng. 2022, 22, 1146–1169. [Google Scholar] [CrossRef]
- Chen, X.; Qiu, L.; Ma, H.; Jin, M.; Wang, M. Computer-aided hospital layout optimization based on patient flow analysis: A case study from China. J. Build. Eng. 2024, 88, 108899. [Google Scholar] [CrossRef]
- Wei, L.; Liu, G.; Yuan, Y.; Liu, W.; Li, W. Numerical evaluation of space form design for outpatient waiting space to reduce airborne infection risk in hospitals. J. Build. Eng. 2024, 83, 108473. [Google Scholar] [CrossRef]
- Ji, Y. Optimal Scheduling in Home Health Care. In Proceedings of the 3rd International Conference on Computer Science and Application Engineering, Sanya, China, 22–24 October 2019; pp. 1–6. [Google Scholar]
- Zou, B.; Lu, C.; Li, Y. Simulation of a hospital evacuation including wheelchairs based on modified cellular automata. Simul. Model. Pract. Theory 2020, 99, 102018. [Google Scholar] [CrossRef]
- Trigo, J.D.; Klaina, H.; Guembe, I.P.; Lopez-Iturri, P.; Astrain, J.J.; Alejos, A.V.; Falcone, F.; Serrano-Arriezu, L. Patient Tracking in a Multi-Building, Tunnel-Connected Hospital Complex. IEEE Sens. J. 2020, 20, 14453–14464. [Google Scholar] [CrossRef]
- Fukushima, F.; Moriya, T. Objective evaluation study on the shortest time interval from fire department departure to hospital arrival in emergency medical services using a global positioning system—Potential for time savings during ambulance running. IATSS Res. 2021, 45, 182–189. [Google Scholar] [CrossRef]
- Lv, J.; Li, K.; Slowik, A.; Jiang, H. Distributed Edge Intelligence for Rapid In-Vehicle Medical Emergency Response in Internet of Vehicles. IEEE Internet Things J. 2025, 12, 4750–4760. [Google Scholar] [CrossRef]
- Madelin, G.; Lahrichi, N. Modeling and improving the logistic distribution network of a hospital. Int. Trans. Oper. Res. 2019, 28, 70–90. [Google Scholar] [CrossRef]
- Liu, H.; Yao, Z.; Meijer, S. Research on transportation management model of COVID-19 medical waste: A case study in Beijing, China. Environ. Sci. Pollut. Res. 2023, 30, 120284–120299. [Google Scholar] [CrossRef]
- Xin, L.; Xi, C.; Sagir, M.; Wenbo, Z. How can infectious medical waste be forecasted and transported during the COVID-19 pandemic? A hybrid two-stage method. Technol. Forecast. Soc. Change 2023, 187, 122188. [Google Scholar] [CrossRef] [PubMed]
- Boucherie, R.J.; Hans, E.W.; Hartmann, T. Health Care Logistics and Space: Accounting for the Physical Build Environment. In Proceedings of the 2012 Winter Simulation Conference, Berlin, Germany, 9–12 December 2012; pp. 1–8. [Google Scholar]
- Brunt, P. Market Research in Travel and Tourism; Butterworth-Heinemann Ltd.: Oxford, UK, 1997. [Google Scholar]
- Yang, C.C. The refined Kano’s model and its application. Total Qual. Manag. Bus. Excell. 2007, 16, 1127–1137. [Google Scholar] [CrossRef]
- Berger, C.; Blauth, R.; Boger, D.; Bolster, C.; Walden, D. Kano’s Methods for Understanding Customer-defined Quality. Cent. Qual. Manag. J. 1993, 2, 3–35. [Google Scholar]
- Brambilla, A.; Capolongo, S. Healthy and Sustainable Hospital Evaluation—A Review of POE Tools for Hospital Assessment in an Evidence-Based Design Framework. Buildings 2019, 9, 76. [Google Scholar] [CrossRef]
- Egawa, K.; Kimura, A.; Yoda, I. Study on the Necessary Conditions for Arrangement of Medical Aid Stations in Hospital Corridor Space. AIJ J. Technol. Des. 2021, 27, 818–823. [Google Scholar] [CrossRef]
- Zheng, H.; Liu, L.; Zhang, Q.; Wang, Y.; Wei, Y. Children’s Hospital Environment Design Based on AHP/QFD and Other Theoretical Models. Buildings 2024, 14, 1499. [Google Scholar] [CrossRef]
- Zhao, Y.; Mourshed, M. Patients’ Perspectives on the Design of Hospital Outpatient Areas. Buildings 2017, 7, 117. [Google Scholar] [CrossRef]
- Cubukcuoglu, C.; Nourian, P.; Tasgetiren, M.F.; Sariyildiz, I.S.; Azadi, S. Hospital layout design renovation as a Quadratic Assignment Problem with geodesic distances. J. Build. Eng. 2021, 44, 102952. [Google Scholar] [CrossRef]
Disclaimer/Publisher’s Note: The statements, opinions and data contained in all publications are solely those of the individual author(s) and contributor(s) and not of MDPI and/or the editor(s). MDPI and/or the editor(s) disclaim responsibility for any injury to people or property resulting from any ideas, methods, instructions or products referred to in the content. |
© 2025 by the authors. Licensee MDPI, Basel, Switzerland. This article is an open access article distributed under the terms and conditions of the Creative Commons Attribution (CC BY) license (https://creativecommons.org/licenses/by/4.0/).