Article

Experimental and Numerical Bearing Capacity Analysis of Locally Corroded K-Shaped Circular Joints

1
Architectural Engineering Institute, Huzhou Vocational & Technical College, Huzhou 313002, China
2
Huzhou Key Laboratory of Green Building Technology, Huzhou 313002, China
3
Zhejiang Tianhe Architectural Design Co., Ltd., Huzhou 313002, China
4
College of Future Technologies, Hohai University, Changzhou 213022, China
*
Author to whom correspondence should be addressed.
Buildings 2025, 15(17), 3111; https://doi.org/10.3390/buildings15173111
Submission received: 25 July 2025 / Revised: 22 August 2025 / Accepted: 25 August 2025 / Published: 29 August 2025

Abstract

This study systematically investigates the influence of varying corrosion severity on the bearing capacity of K-shaped circular-section joints, with explicit consideration of weld line positioning. Four full-scale circular-section joint specimens with clearance gaps were designed to simulate localized corrosion through artificially introduced perforations, and axial static loading tests were performed to assess the degradation of structural performance. Experimental results indicate that the predominant failure mode of corroded K-joints manifests as brittle fracture in the weld-affected zone, attributable to the combined effects of material weakening and stress concentration. The enlargement of corrosion pit dimensions induces progressive deterioration in joint stiffness and ultimate bearing capacity, accompanied by increased displacement at failure. A refined finite element model was established using ABAQUS. The obtained load–displacement curve from the simulation was compared with the experimental data to verify the validity of the model. Subsequently, a parametric analysis was conducted to investigate the influence of multiple variables on the residual bearing capacity of the nodes. Numerical investigations indicate that the severity of corrosion exhibits a positive correlation with the reduction in bearing capacity, whereas web-chord members with smaller inclination angles demonstrate enhanced corrosion resistance, when θ is equal to 30 degrees, Ks decreases from approximately 0.983 to around 0.894. Thin-walled joints exhibit accelerated performance deterioration compared to thick-walled configurations under equivalent corrosion conditions. Furthermore, increased pipe diameter ratios exacerbate corrosion-induced reductions in structural efficiency, when the corrosion rate is 0.10, β = 0.4 corresponds to Ks = 0.98, and when β = 0.7, it is approximately 0.965. and distributed micro-pitting results in less severe capacity degradation than concentrated macro-pitting over the same corrosion areas.

1. Introduction

Steel tube truss structures using direct coherent connection technology are widely used in important public buildings, such as terminal buildings, high-speed railway stations, stadiums, and conference centers, due to their excellent mechanical properties, attractive appearance, and exceptional spanning capacity [1]. However, progressive corrosion damage induced by the exposure of structural members to high humidity and corrosive environments during long-term service has developed into a key factor threatening the safety of existing steel structure systems. The global industrial sector incurs losses of up to 2.5 trillion US dollars annually due to metal corrosion (NACE’s “IMPACT Global Corrosion Survey Report,” 2016 [2]), and steel structure accidents caused by corrosion occur periodically. For example, in 2022, serious corrosion of the steel roof frame rods, nodes, and support parts of a hot spring swimming pool in Zhengzhou caused insufficient strength and stability of the rods, leading to a large-scale collapse of the roof structure; in 2023, the roof cover of the gymnasium of a middle school in Qiqihar City was damaged by corrosion of some steel rods. Corrosion of some steel structure rods or the aging of node welds led to structural instability and collapse, resulting in 11 deaths.
In recent years, researchers both at home and abroad have conducted systematic studies on the mechanical properties of steel after corrosion. Kaita et al. [3,4], Zheng Shanliao et al. [5,6,7,8], and Liu Yan [9] conducted monotonic tensile tests on corroded Q235, Q345, and Q390 steels. They studied the degradation of various mechanical properties due to the degree of corrosion. Sheng et al. [10] and Yuan et al. [11] employed a mechanical drilling method to simulate localized corrosion defects, utilizing mechanical tests and numerical simulation techniques to systematically investigate the influence of corrosion damage on the mechanical properties of steel structures. They systematically examined the mechanism of corrosion damage on the mechanical properties of steel structures, elucidating the quantitative relationship between corrosion parameters and the rate of loss of material strength through the refinement of the experimental design. Wang et al. [12] and Yuan et al. [13,14] performed an experimental study on the compressive and bending mechanical properties of steel pipe columns under localized corrosion and analyzed the effects of parameters such as diameter, thickness, number, location, and material strength of the corrosion pits on the load-carrying capacity of the members by establishing a finite element model. Researchers have examined the bearing capacity of corroded steel pipe concrete members, as demonstrated in studies by Chen Mengcheng et al. [15], who performed an experimental analysis of the axial compressive bearing capacity of locally corroded circular steel pipe concrete short columns. However, despite the significant progress made by existing studies in corroded steel structures, the current results reveal notable limitations. The scope of the research primarily focuses on the degradation law of the macroscopic load-carrying capacity of beam–column members under uniform corrosion. It lacks systematic knowledge of the damage evolution mechanism of spatial nodes under the action of localized corrosion coupling. Simultaneously, the existing steel structure corrosion model generally uses a simplified two-dimensional model, and further research is needed on the residual load-carrying capacity of typical space connection structures, such as K-tube nodes [16]. At the 70th session of the United Nations General Assembly, the “2030 Agenda for Sustainable Development” was adopted. Article 12 of this agenda proposed the adoption of sustainable consumption and production patterns, emphasizing the efficient use of resources and the reduction in waste. By deeply understanding the corrosion mechanism of steel structures, extending the service life of steel structures can reduce excessive consumption and waste of steel, which is in line with the concept of efficient resource utilization.
This study examines a typical K-shaped coherent node of the roof pipe truss of a certain swimming pool, using a method that involves mechanically precise openings at coherent locations to simulate localized corrosion pit defects [17,18]. It performs static performance tests on four node specimens exhibiting varying levels of corrosion [19], utilizing high-sensitivity strain gauges in the coherent opening area and its periphery, alongside displacement gauges positioned along the chord, thereby ensuring data accuracy and completeness. The strain and displacement data are recorded in real time with the aid of a data acquisition system to ensure the accuracy and completeness of the data. Through the test, the damage mode of locally corroded K-shaped coherent nodes, as well as the node bearing capacity and deflection degradation law, are revealed. The finite element software is designed to simulate and verify the test process, exploring the influence of each changing parameter on the mechanical properties of the nodes. The results will provide valuable reference for improving the design theory of steel structure reinforcement, construction, and safety assessment. This study employed a precise mechanical hole-making method to simulate local corrosion pit defects, filling the research gap in the corrosion of K-shaped nodes in swimming pool roof pipe trusses. It holds significant practical significance for improving the assessment theory and methods of the bearing capacity of existing steel pipe intersecting nodes.

2. Materials and Methods

2.1. Test Design

Based on the mid-span joint of the upper chord of a stadium planar truss, four specimens of full-scale planar K-shaped circular pipe coherent joints (parameters shown in Table 1) were designed and fabricated, and static performance tests under axial load were performed on the specimens, respectively. Among them, specimen A1 exhibits no corrosion, and its coherent weld is complete. Specimens A2, A3-1, and A3-2 have localized pitting defects. To cross-validate the accuracy and reliability of the test results, the parallel sample testing method was adopted, and two identical specimens, A3-1 and A3-2, were produced for the same parameters. Figure 1a depicts the shape parameters of the node specimens. Each rod of the test node is made of Q235 seamless steel pipe. The chord is Ф1529 × 6 and the web is Ф89 × 4; the angle between the chord and the web is 45°, the gap g between the two web rods is 27 mm, and the connecting lugs with pin holes are set at the end of the web rods.
Figure 1b provides a schematic illustration of the specimen opening locations, where high-precision CNC machining equipment is used to open the holes accurately along the coherent line, simulating the corrosion pits of localized corrosion [20,21,22]. The shapes of the openings are all circular. When the specimens were fabricated, the holes were first opened for each rod and then assembled and welded. After fabrication, the aperture error of each open hole in the four specimens was measured, and the specific measurement data are presented in Table 2. Based on the on-site detection data of the roof truss structure of the swimming pool, including the statistical characteristics such as the depth and diameter of the corrosion pits, the size parameters of the precise mechanical drilling holes were calibrated to match the statistical characteristics of typical local corrosion pits in engineering. The field photos of the coherent area are shown in Figure 2.

2.2. Material Performance Tests

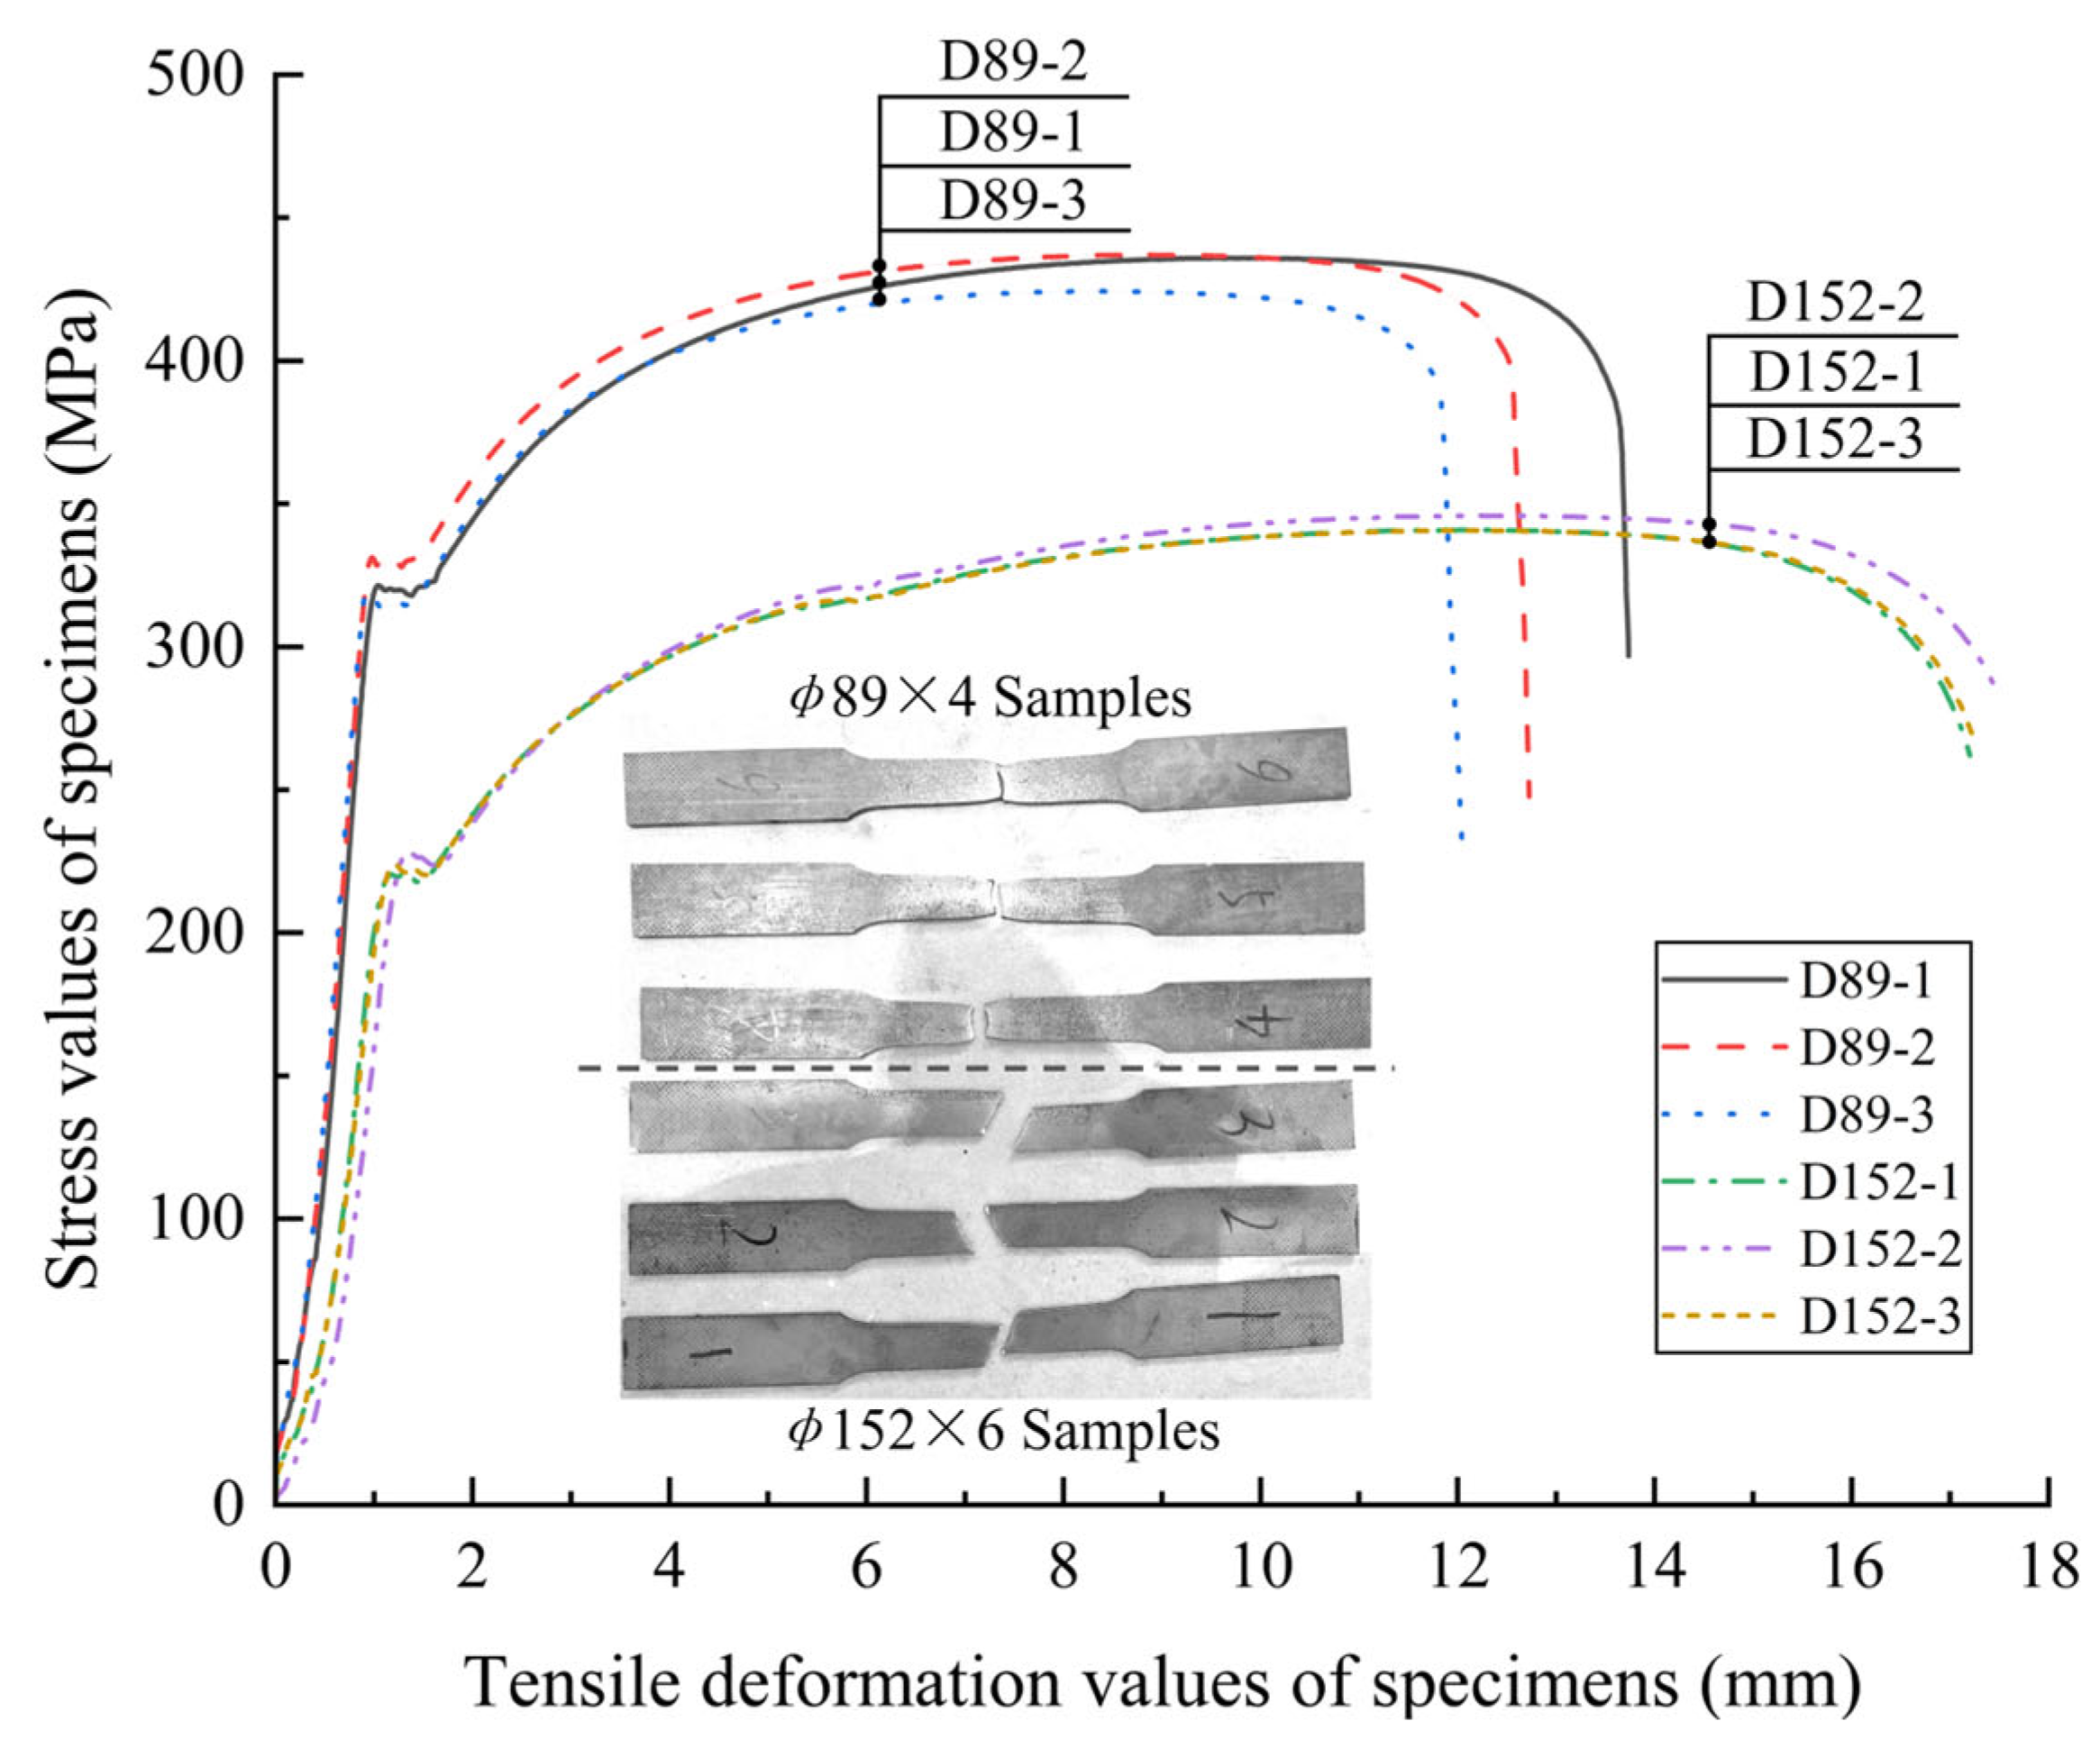
The circular steel pipe components in the specimen are processed into standard specimens by the provisions of “Tensile Test of Metallic Materials Part 1: Room Temperature Test Methods” (GB/T228.1-2021) [23]. A microcomputer-controlled electronic universal testing machine is used to conduct unidirectional tensile materiality tests on specimens of the two types of circular pipes, Ф89 × 4 and Ф152 × 6. To ensure uniform stress distribution during the test, the samples taken from the round steel pipe need to be processed into a flat plate. Figure 3 depicts the tensile fracture diagram of the material property test specimens and the stress-tensile diagram of the specimens. The main mechanical properties of the steel pipes obtained from the tests are shown in Table 3, where T, fy, fu, Es, and δ are the thickness, yield strength, tensile strength, elastic modulus, and elongation of the steel, respectively [24]. The elastic modulus Es of steel components is calculated by conducting tensile tests on standard specimens. Based on the slope of the elastic stage in the stress–strain curve, it is obtained through staged loading and averaging of multiple test results. The elongation of the steel δ is calculated according to the formula δ = (L1L0)/L0 × 100%, where L0 represents the original gauge length and L1 represents the gauge length after the joint breaks.

2.3. Test Setup and Loading Scheme

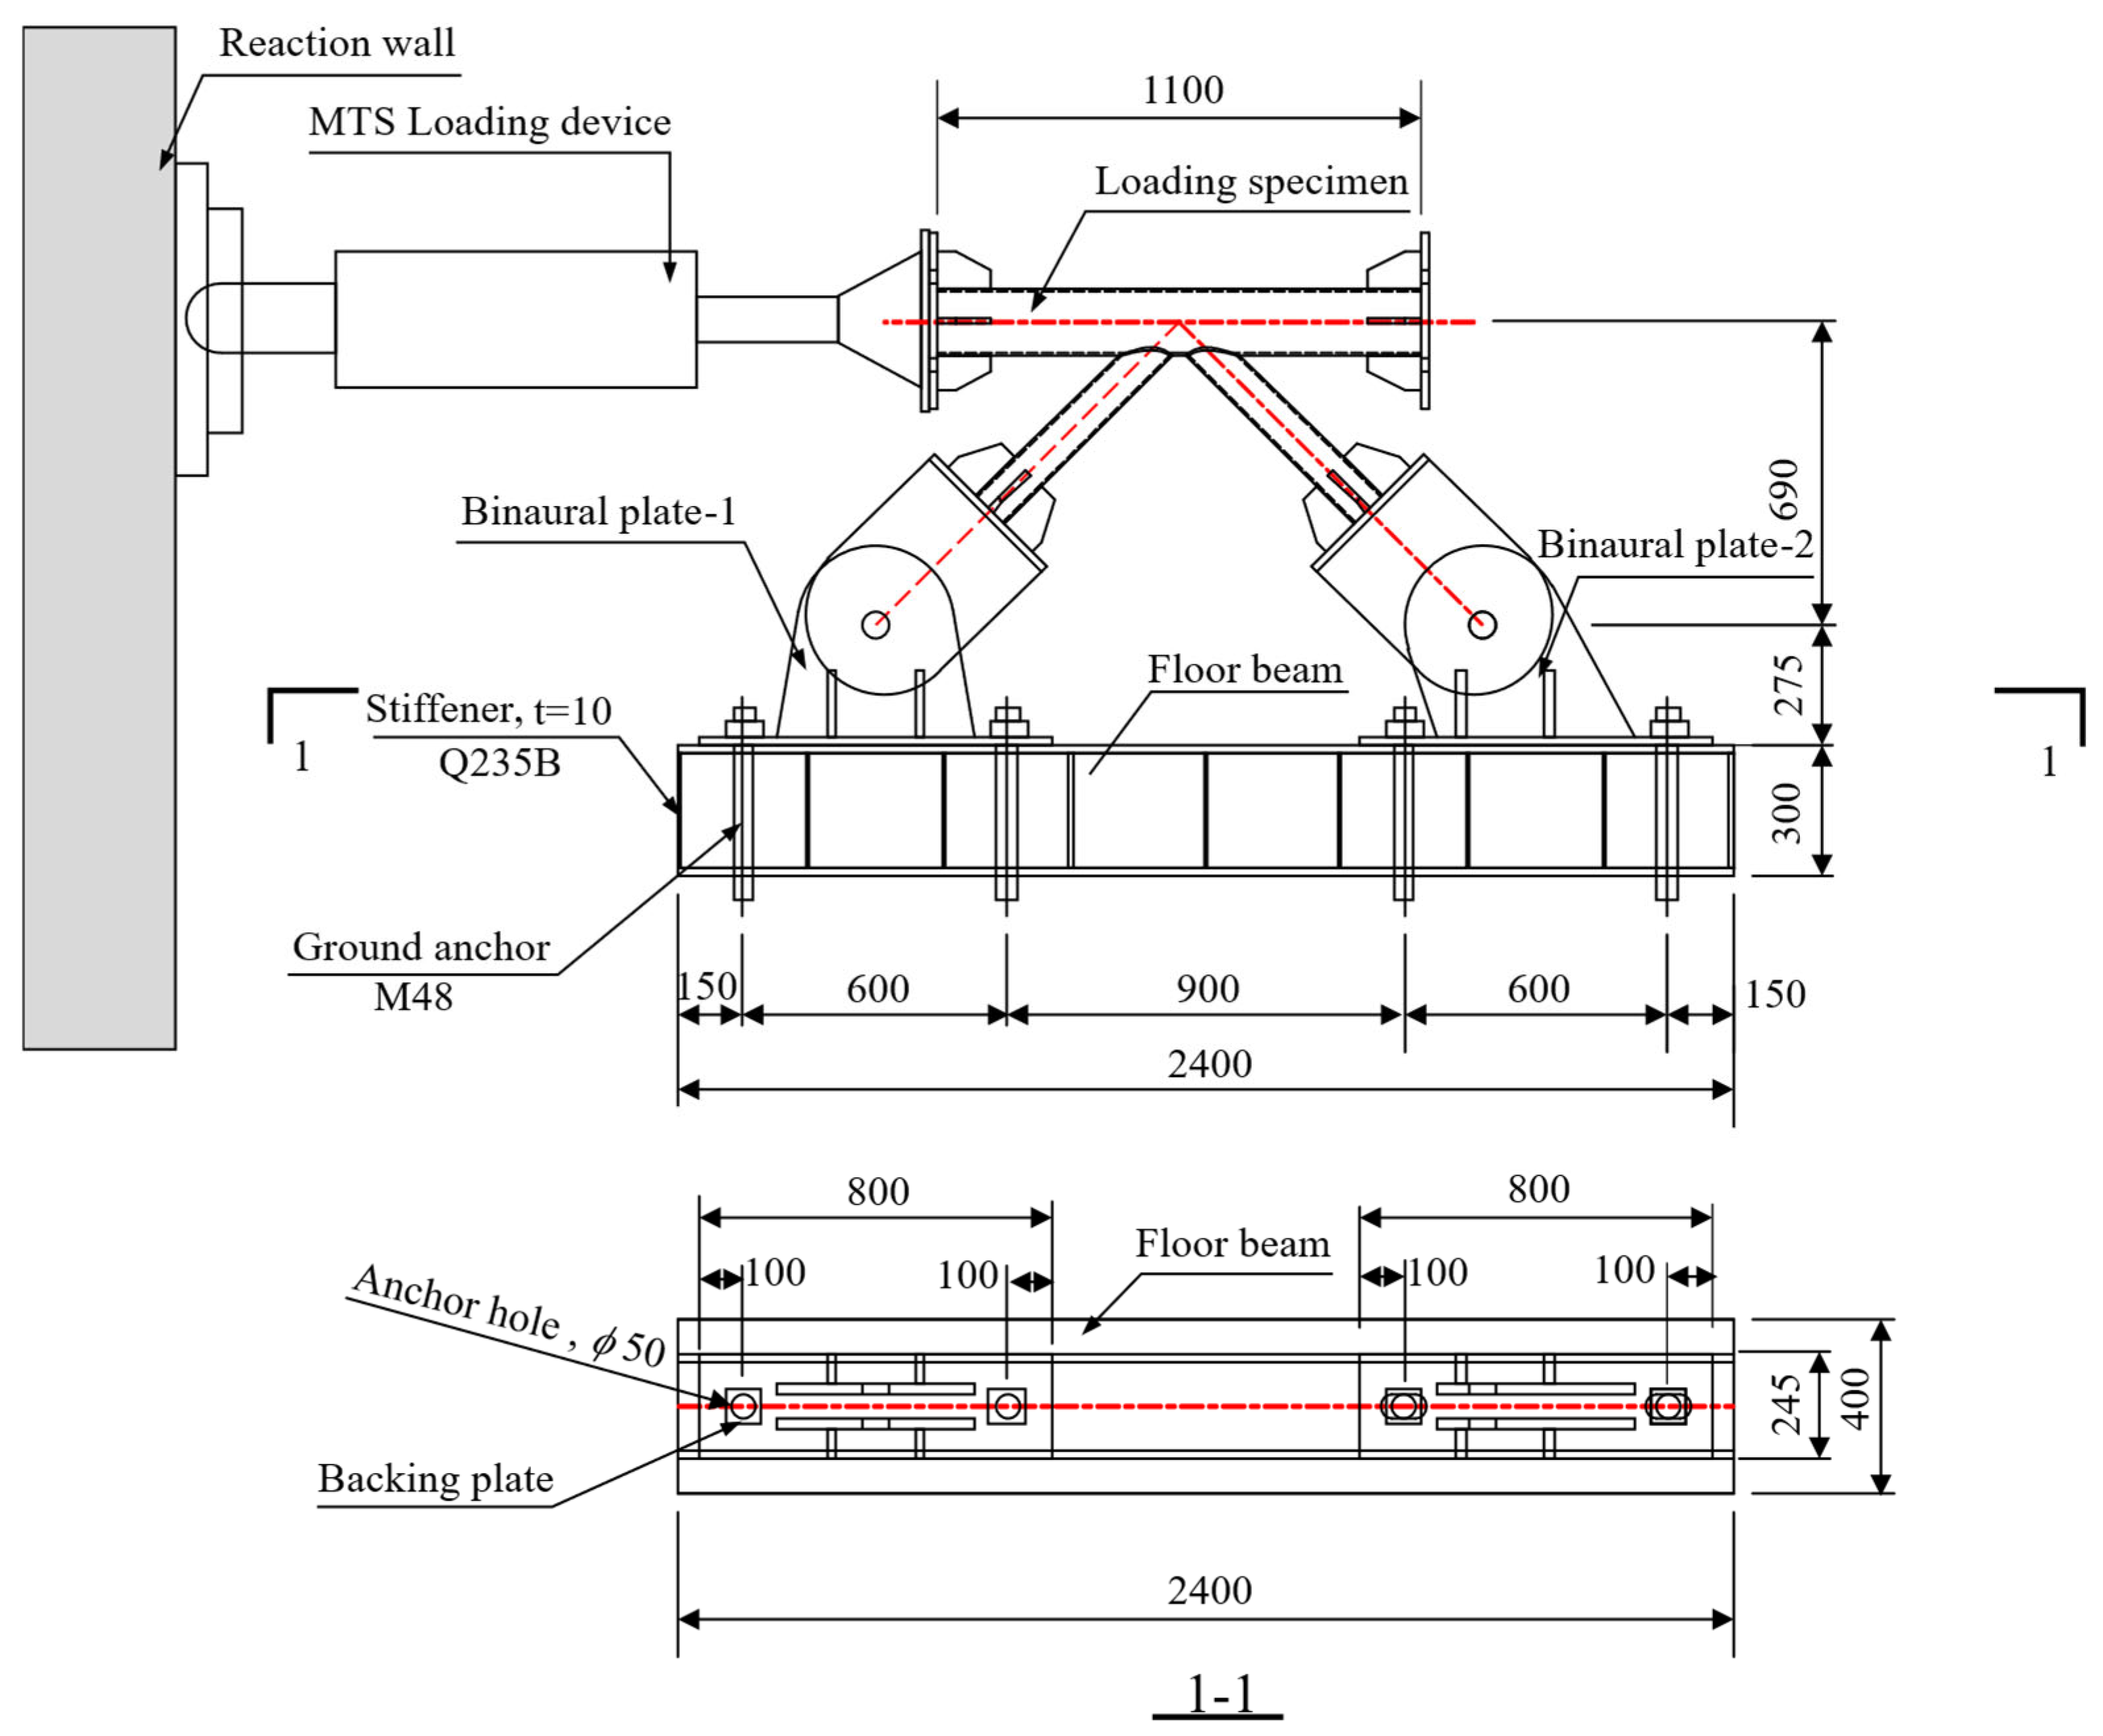
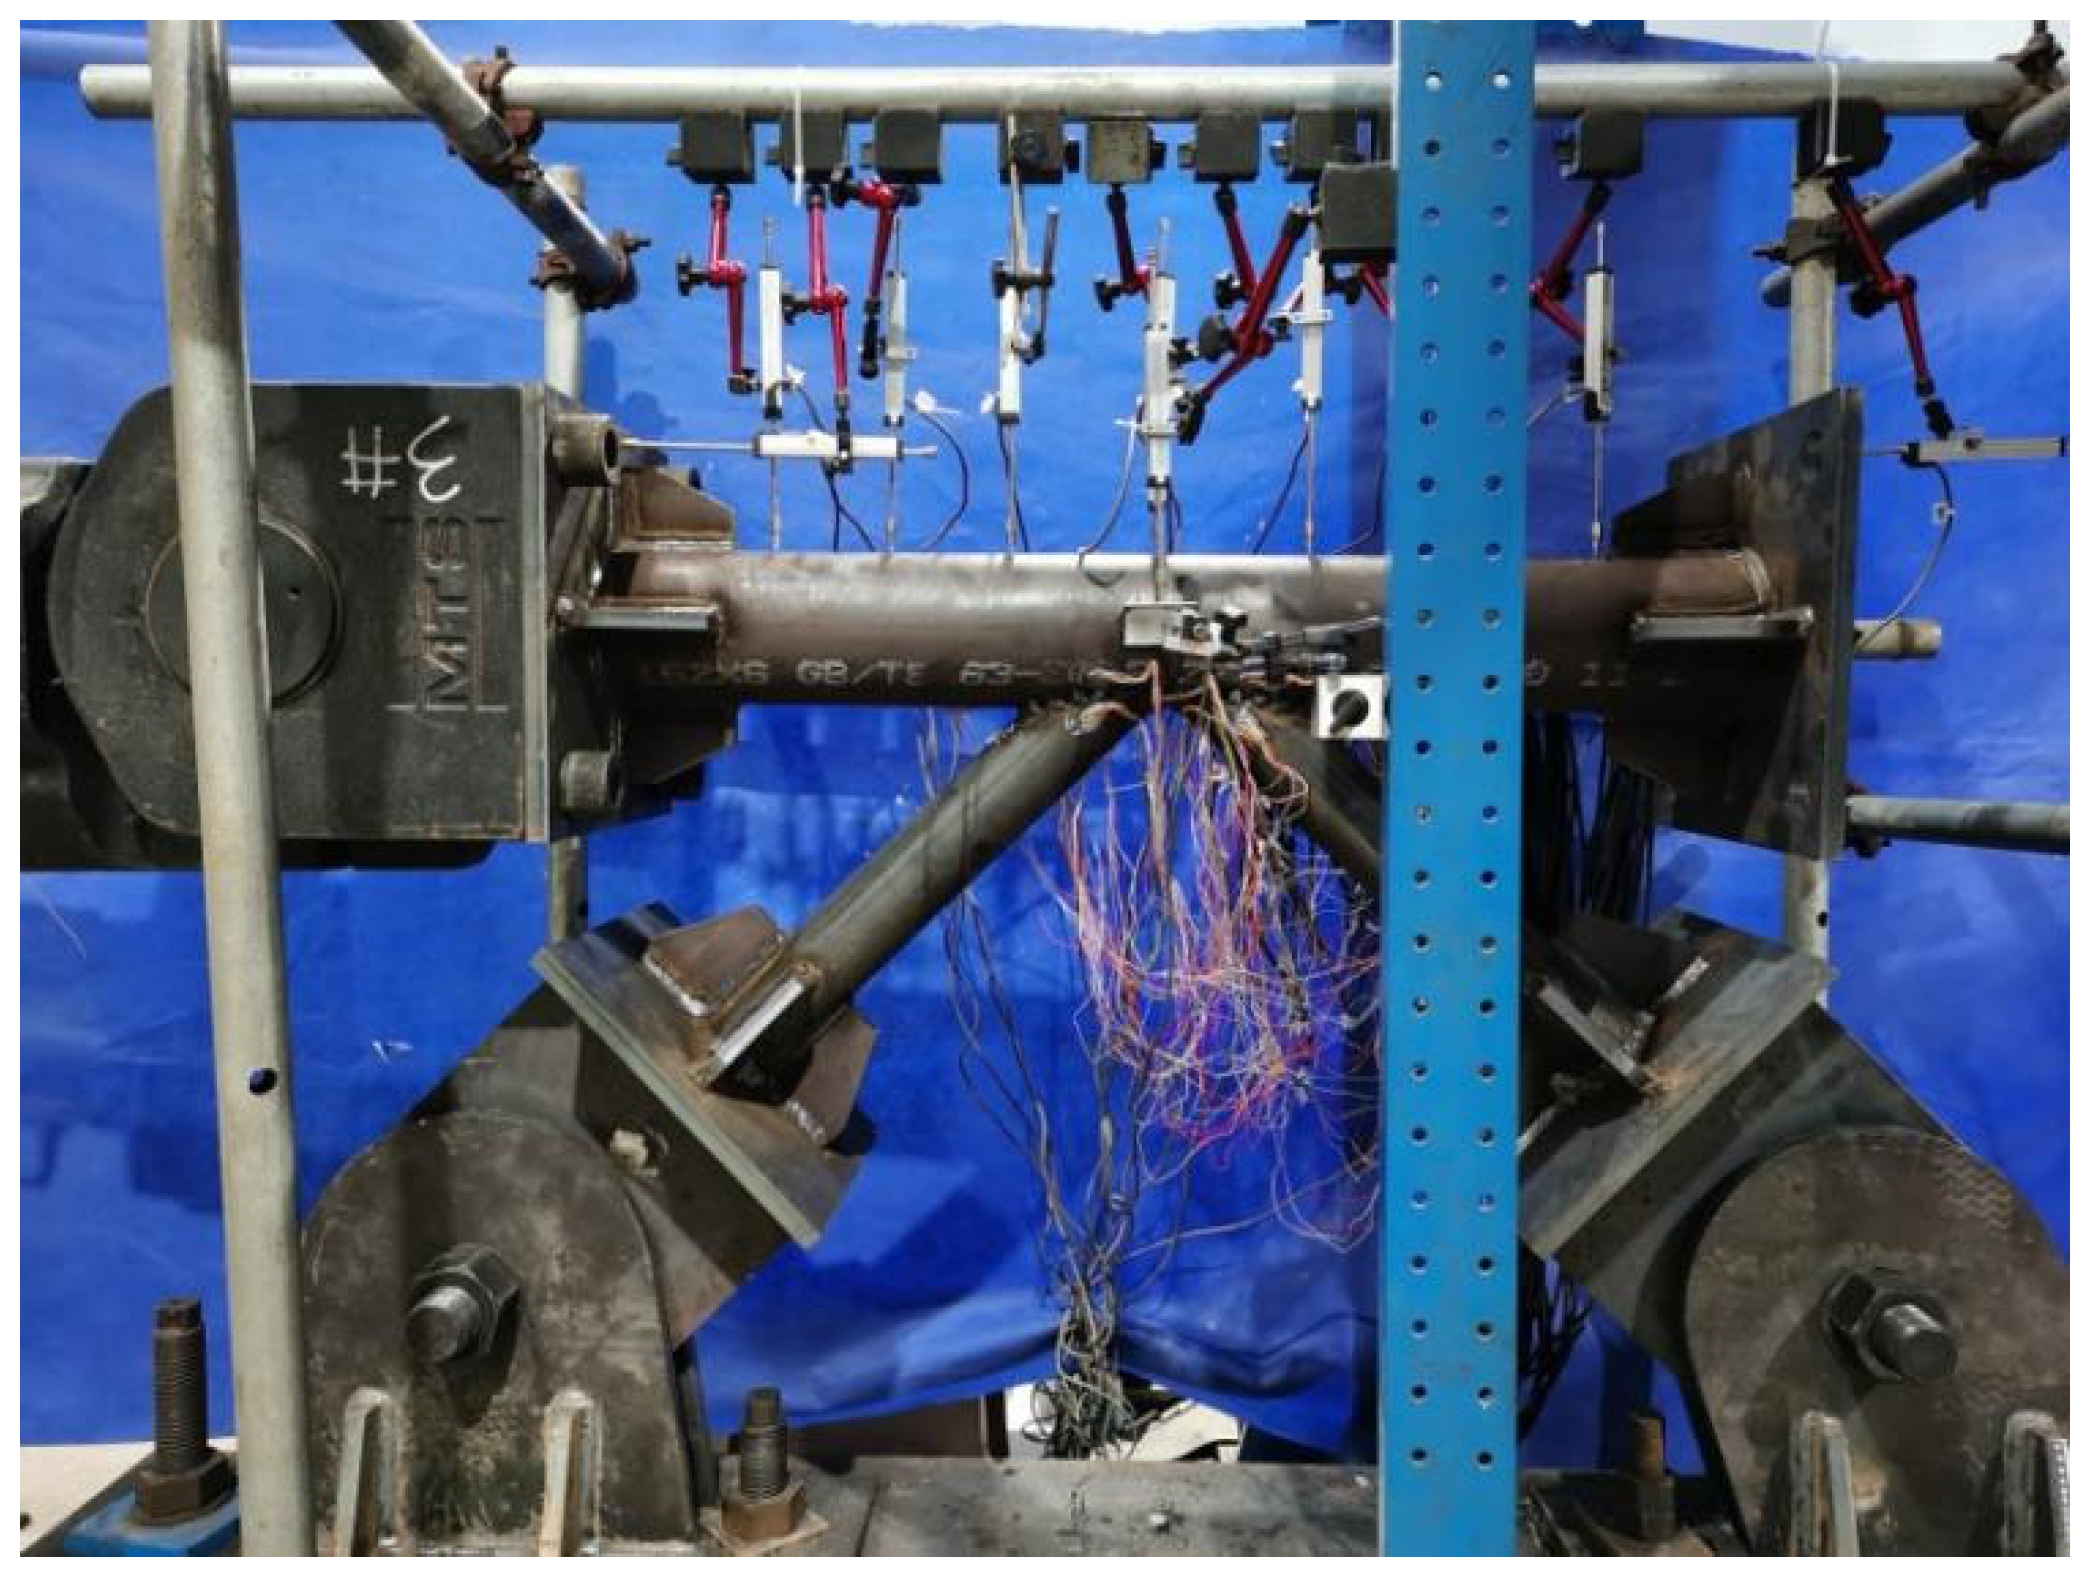
The schematic test loading device and the loaded object are illustrated in Figure 4 and Figure 5, respectively. Considering the actual situation of the structural test hall, the I-beam with lug plate support was secured to stable ground through ground anchors, and the web end of the loaded specimen was hingedly connected to the support with pins. The chord end was bolted to the horizontally placed MTS loading equipment (MTS Systems Corporation, Eden Prairie, MN, USA) through a connecting plate. The loading equipment provided the horizontal thrust, which allowed for the examination of the force at the nodes [25].
The test loading program is divided into preloading and formal loading. In the preloading phase, the force is loaded through level control, with each loading level set at 5 kN. Each level of completion of the stay lasts 120 s; check the test device and data acquisition equipment; if there is no issue, loading continues. The maximum preloading value is taken as the ultimate bearing capacity (finite element numerical simulation) at 5%, with preloading stabilized for 30 min before unloading, following the original loading rate. Subsequently, the specimen is left unloaded for 1 h to ensure sufficient elastic rebound of the component. The formal loading process is divided into two stages; the first stage involves loading from zero to the load–displacement curve, which becomes nonlinear or where the specimen shows obvious buckling; this stage is performed using the force-controlled loading method at a rate of 0.25 kN/s. Each loading stage involves loading a steady load of 10 kN, with a rate of 0.25 kN/s. The loaded specimen was then unloaded according to the original loading rate. Each stage of loading a 10 kN steady load for 120 s, after which the phenomenon of the specimen is observed and recorded. The end of the first stage marks the beginning of the second stage, which involves the displacement control method of loading at a rate of 0.3 mm/s. Each loading stage is set at 3 mm to reach the target value of the steady load, which takes 300 s or longer, until the computer terminal output of the bearing capacity shows no obvious changes. When the node area shows a distinct damage pattern, loading is halted and the test ends [26].

2.4. Nodal Zone Measurement Program

To obtain the deformation pattern of the specimen under axial force [27,28], a total of 13 sets of displacement gauges were arranged on the stringers. Among them, the displacement gauges D1~D7 were arranged at equal spacing along the upper wall of the stringers, which were used to measure the displacement curve of the stringers; D8~D11 were arranged in the lateral direction of the span of the stringers, which were used to measure the lateral and vertical displacements of the node area; D12 and D13 were arranged at the two ends of the stringers, which were used to measure the axial deformations of the stringers, respectively. The specific arrangement is shown in Figure 6.
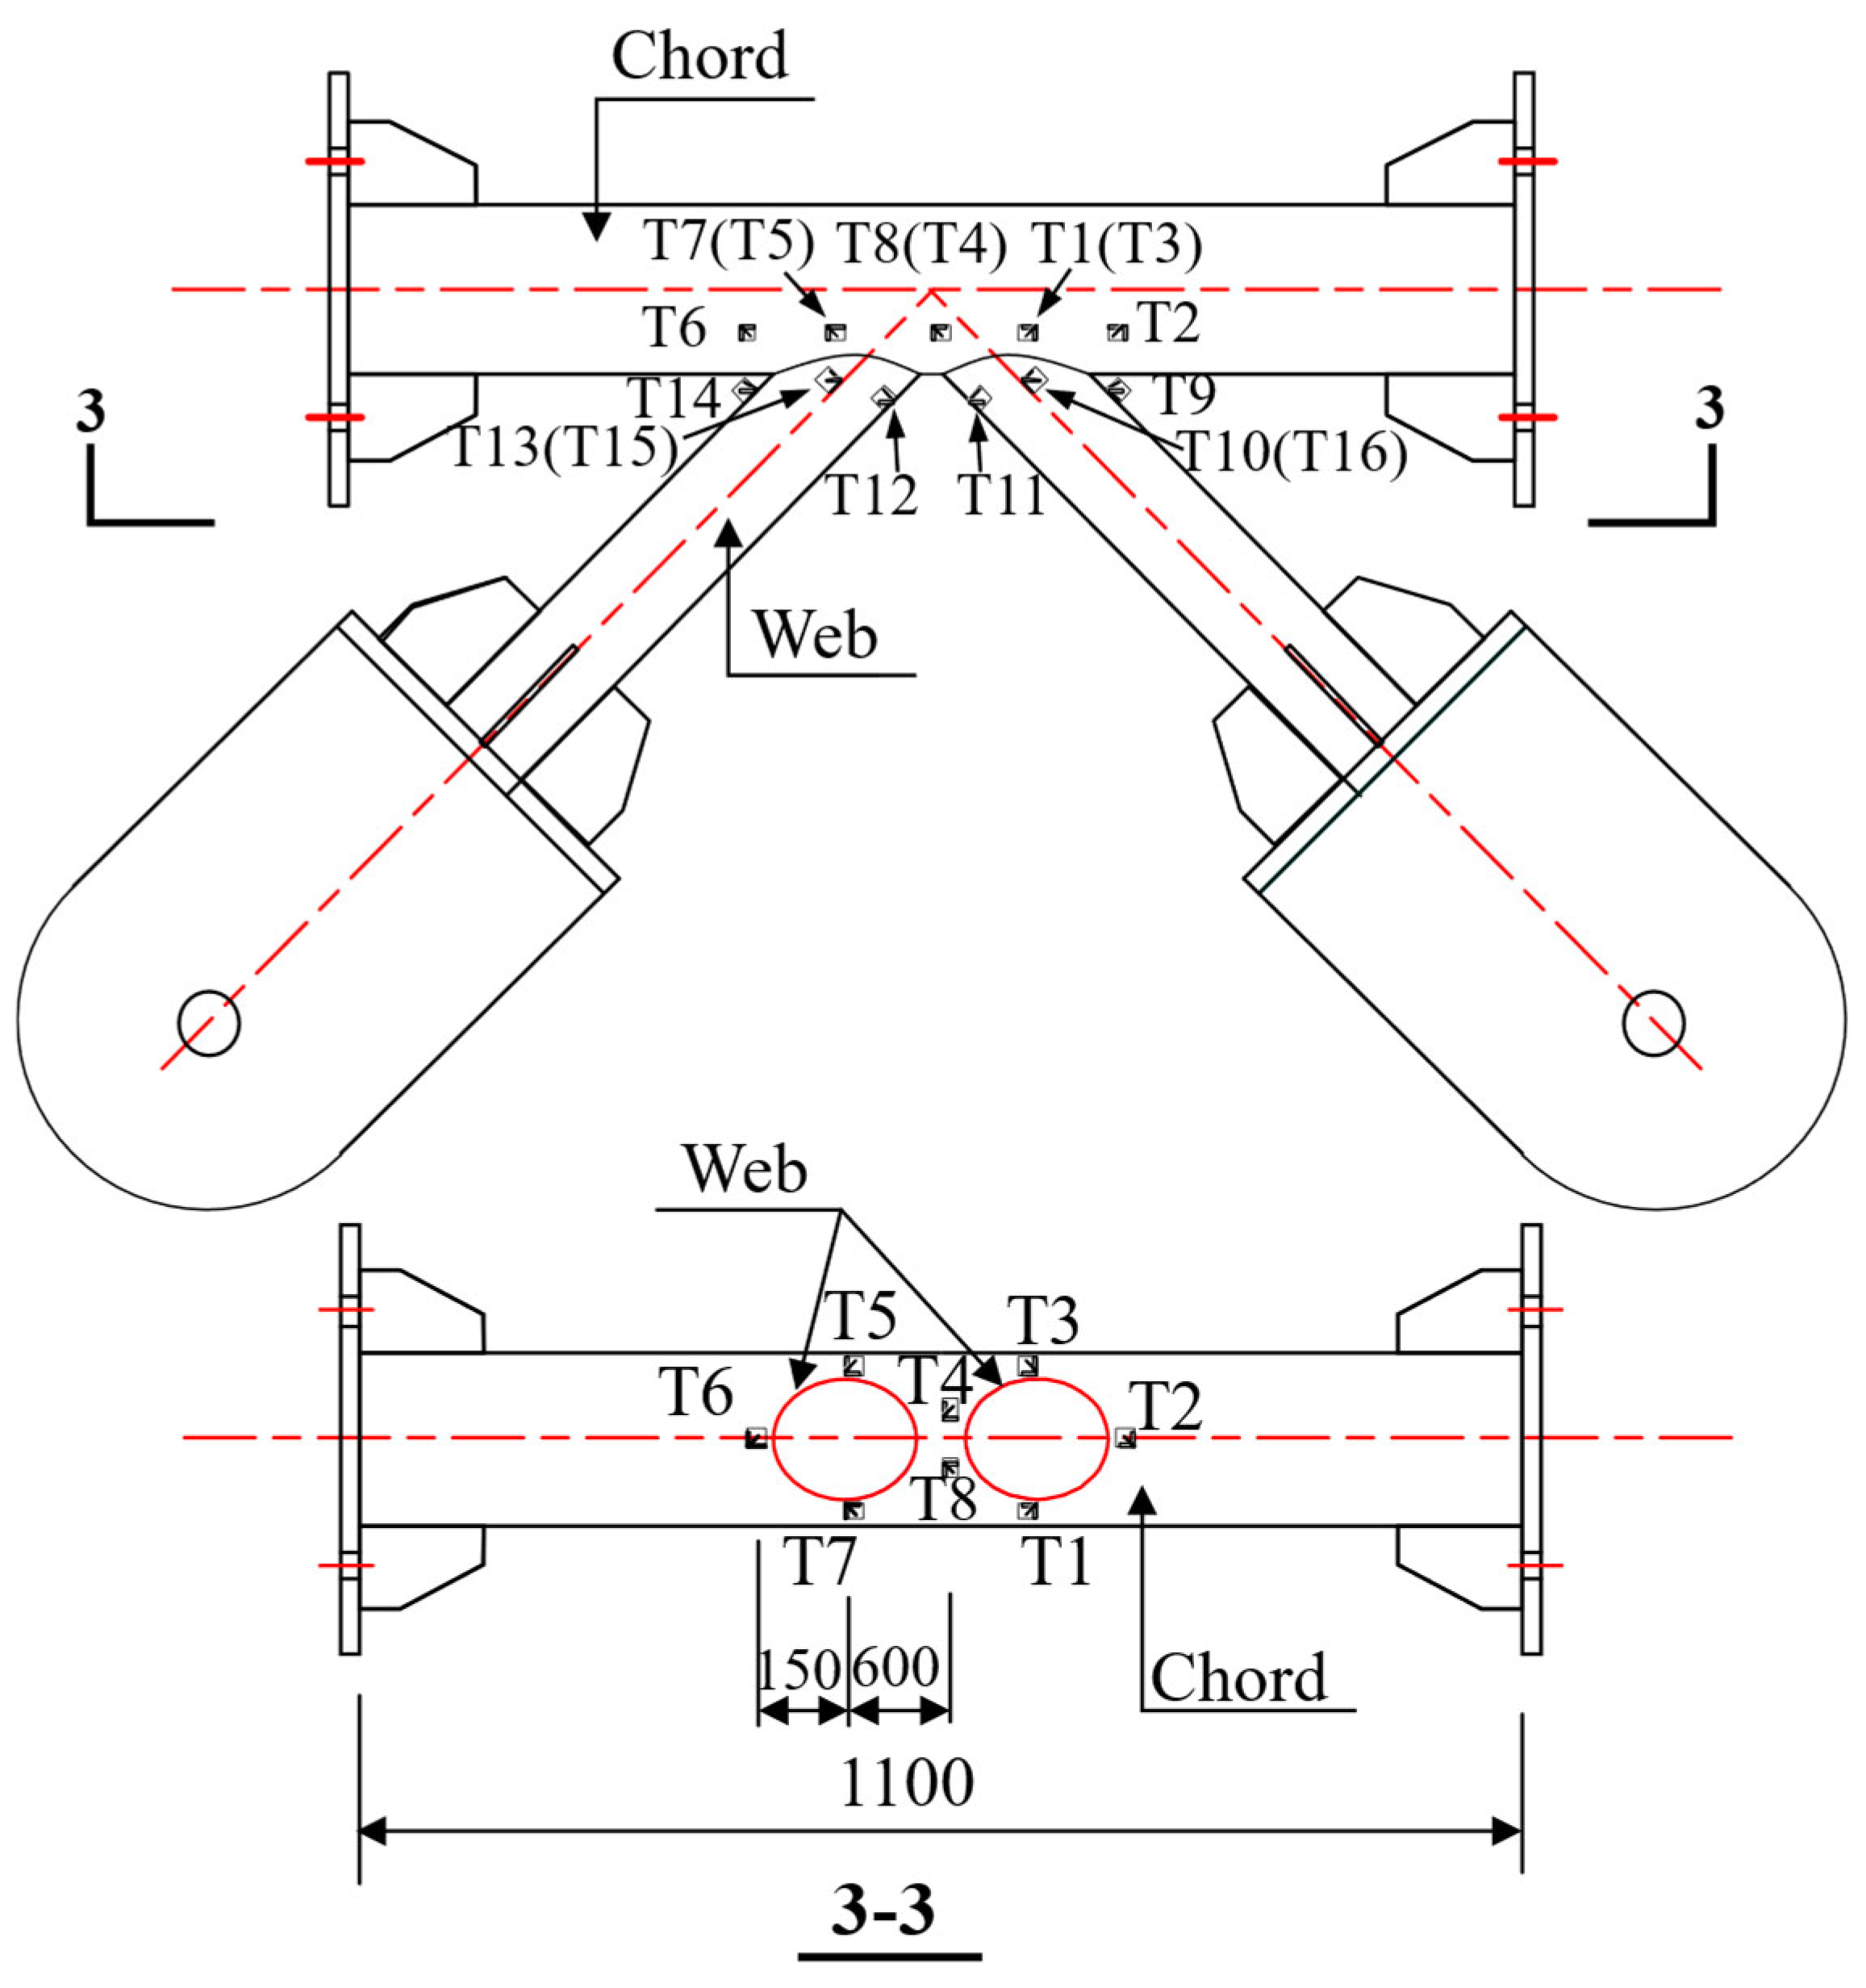
To obtain the stress distribution pattern in the node area of the specimen, especially in the stress concentration sensitive areas such as the weld joint between the chord and web and the periphery of the opening, 16 sets of strain gauges were uniformly arranged near the root, saddle, and crown points of the coherent line at a distance of 15 mm from the weld toe of the chord and web, which were used to monitor the strain distribution and changes in different directions at different locations during the loading process. Each group of strain gauges is oriented at 0° to the pipe body, 90° to the perpendicular direction to the pipe body, and 45° to the inclined strain. The model of the strain gauge is BF350-3CA, with a size of 3.2 mm × 3.1 mm and a base size of 6.9 mm × 4.1 mm. The specifications, accuracy, and arrangement of the strain gauges are illustrated in Figure 7 and Figure 8.

3. Results and Analysis of the Tests

3.1. Node Destruction Model

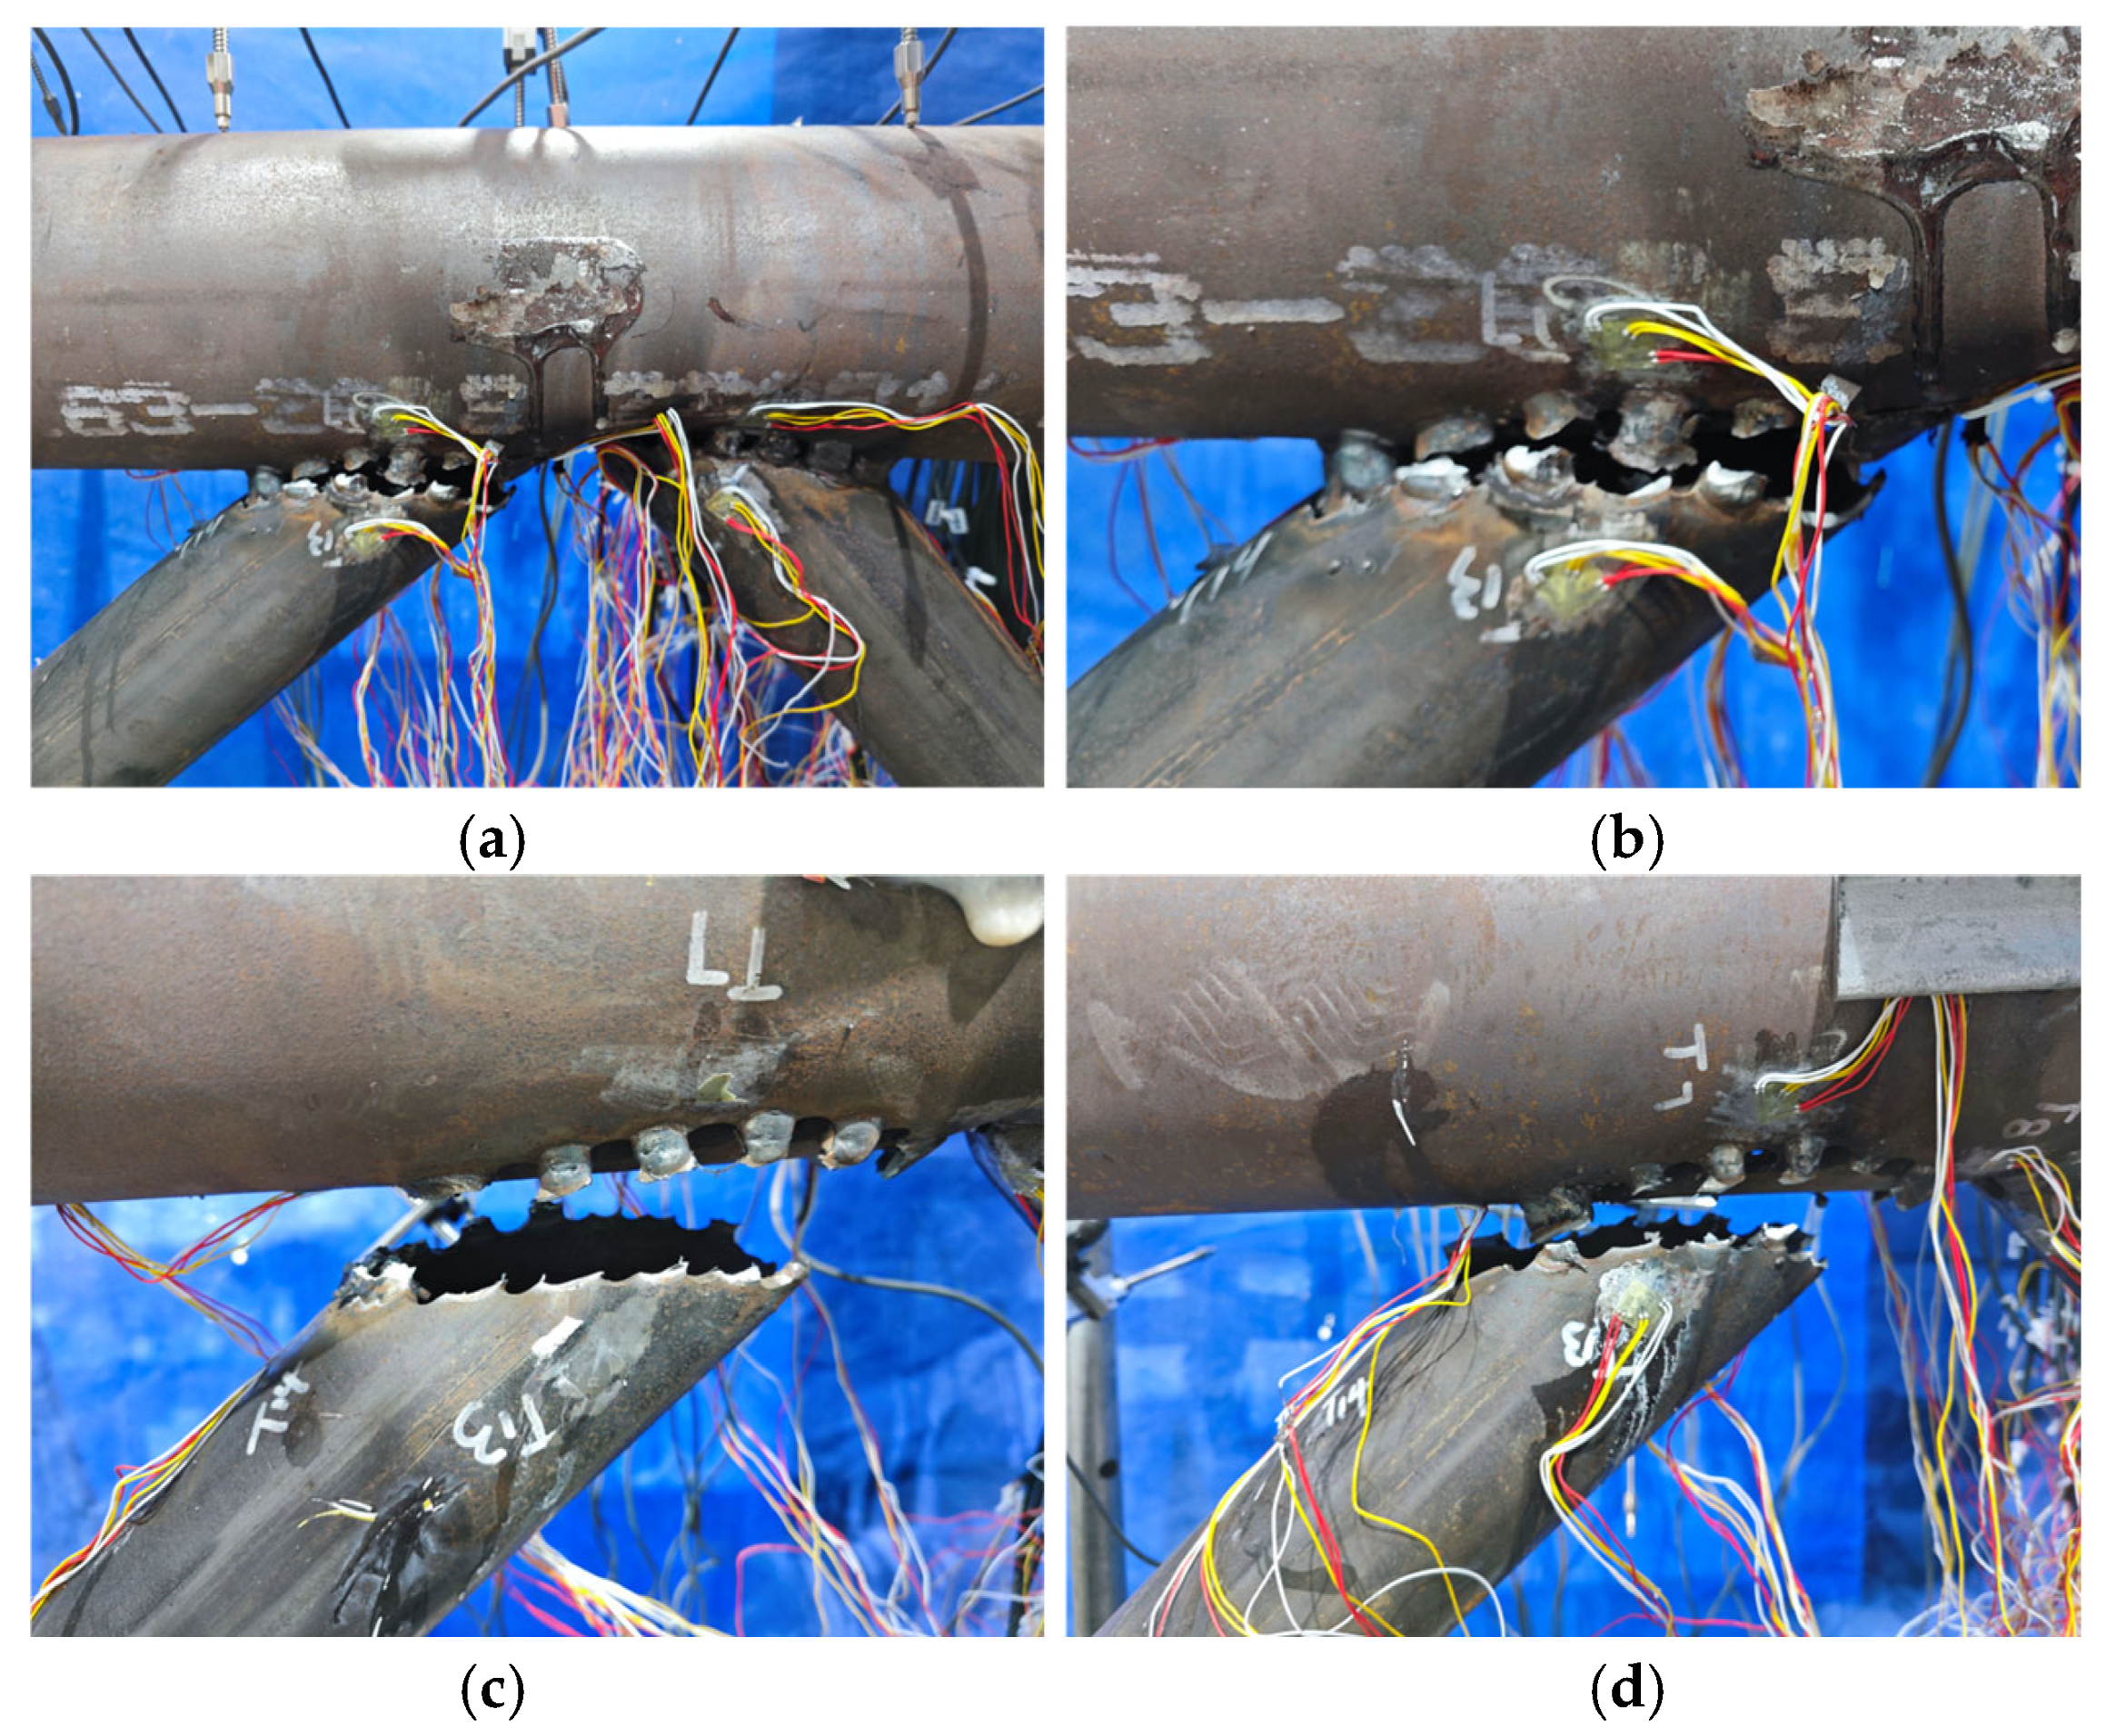
Figure 9 illustrates the damage modes of the three localized corrosion specimens, indicating that these specimens exhibit a significant difference in their damage mechanisms. Under axial load, the corrosion zone undergoes a four-stage evolutionary process characterized by linear response, strain localization, yielding, and extension, culminating in brittle fracture of the weld, attributed to the combined effects of cross-sectional weakening and stress concentration. The specific performance is as follows: the corrosion region preferentially generates strain concentration in the elastic stage; the yield range expands outward from the edge of the open hole in the elastic–plastic stage; the weld under ultimate load undergoes tensile-shear brittle fracture, accompanied by instantaneous release of energy and web dislodgement. The non-corroded specimen A1 could not record the complete damage process due to the test constraints. The finite element analysis revealed that the damage mode was local buckling of the chord wall, characterized by the plastic instability of the inner concave chord wall in the pressurized web connection area and the outer convexity of the tensile area.

3.2. Strain Data for Joints

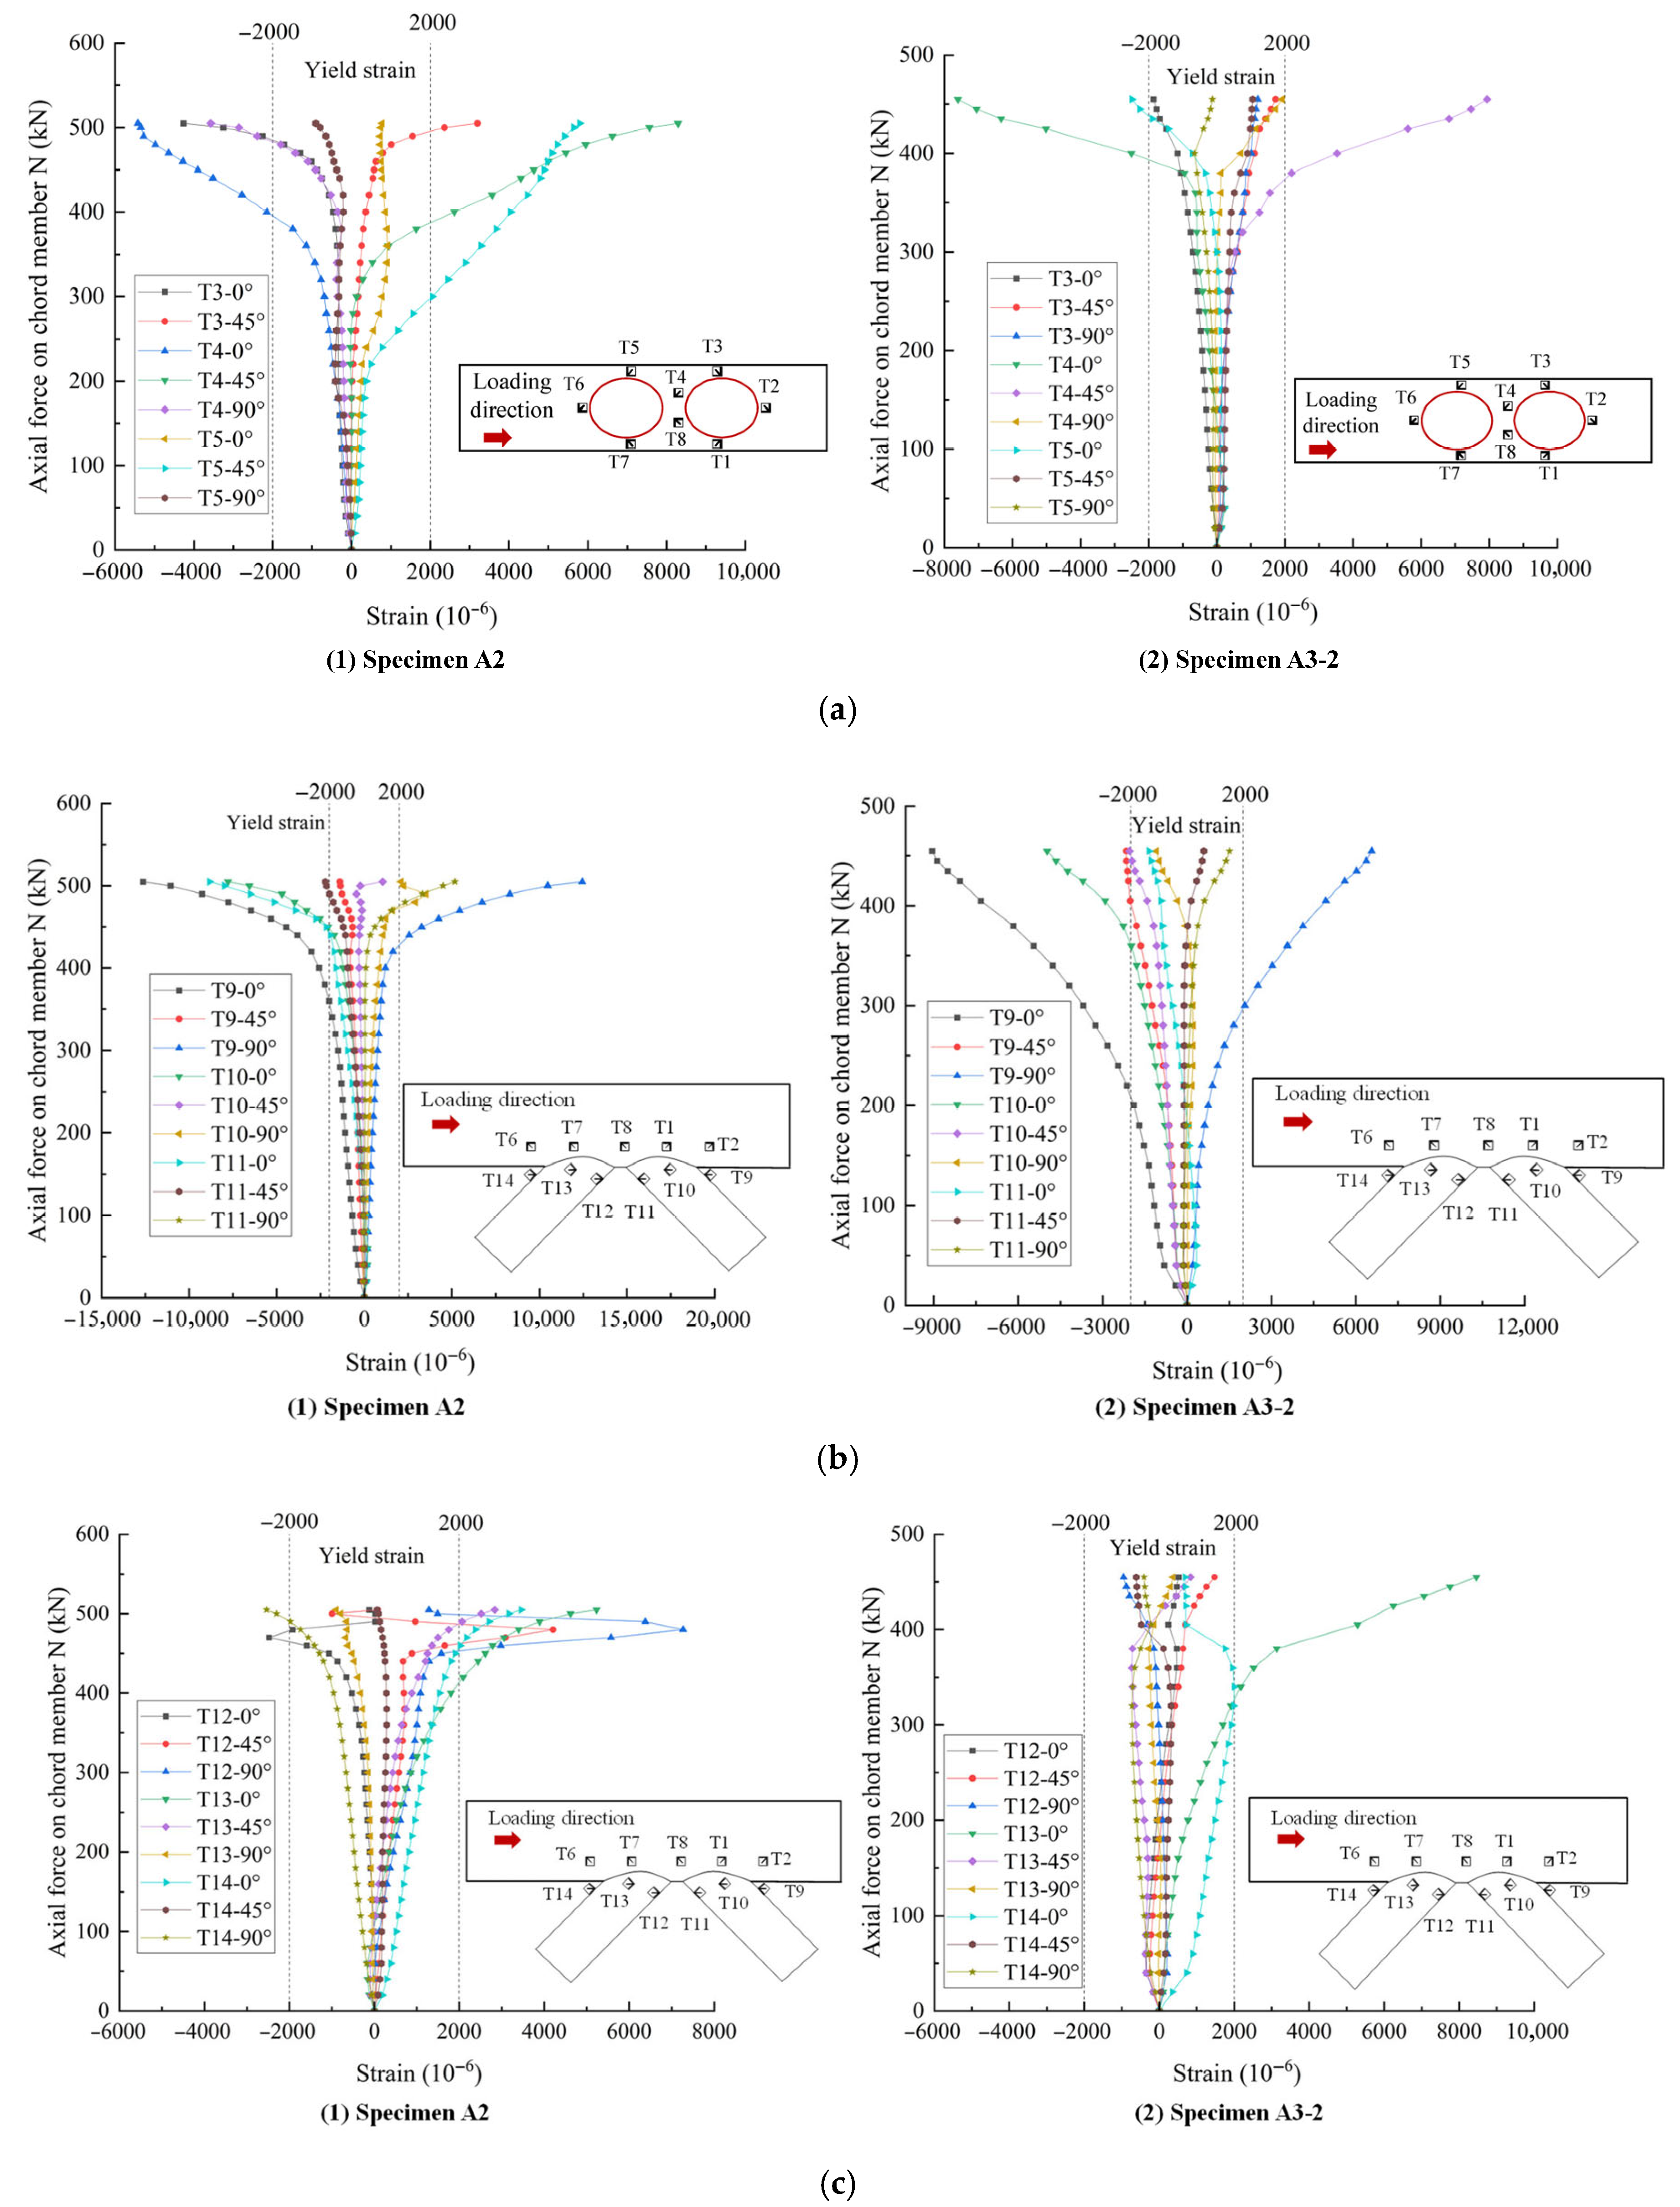
Figure 10 depicts the strain versus loading patterns of the stringers and web bars. For the chord, comparing the data in Figure 10a, it is found that the strain of T5 on the surface of the A2 specimen in the 45° direction is the first one to reach the yield limit of εy = 0.002, and then the strain of T4 in the gap region reaches the yield limit. The value of the strain continues to increase until the node reaches a point of damage. Furthermore, the load-strain diagram indicates that the strain value is low at a small load and exhibits a linear distribution with respect to the load change, indicating an elastic stage. As the load increases, the strain begins to display a dispersion shape, with the A3-2 specimen demonstrating a greater dispersion, indicating a fast increase in strain. Therefore, from the dispersion degree of the curve, it is evident that the increase in the diameter of the corrosion pit will cause the node stiffness to decrease.
Figure 10b presents the corresponding load-strain curves of the main measurement points of the stressed web. The load-strain diagrams indicate that the strain values are linearly distributed with the load changes when the load is small. With the increasing load, the strains of the stressed web bars in both specimens gradually take on a dispersed shape, in which the strain of the node surface T9 at 0°, along the web axis, reaches the yield limit of εy = 0.002 first. This indicates that the chord transferred the axial load applied by the loader to the web. The stress was more concentrated at the distal crown point of the compressed web.
Figure 10c depicts the corresponding load-strain curves of the main measurement points of the tensile web. It is observed through the load-strain diagrams that the strains of the two specimens of the tensile web at different positions are quite different, among which the strain at the node surface T13 at 0°, along the direction of the web axis, takes the lead in reaching the yield limit of εy = 0.002. The strain development is linearly increasing with the load until it reaches the nodal ultimate bearing capacity, after which obvious plasticity occurs. For the A2 specimen, at the 12th measurement point in the loading to 480 kN, its strain no longer develops and gradually rebounds until the ultimate load has not reached its yield strain.

3.3. Load-Deflection Relationship of Nodes

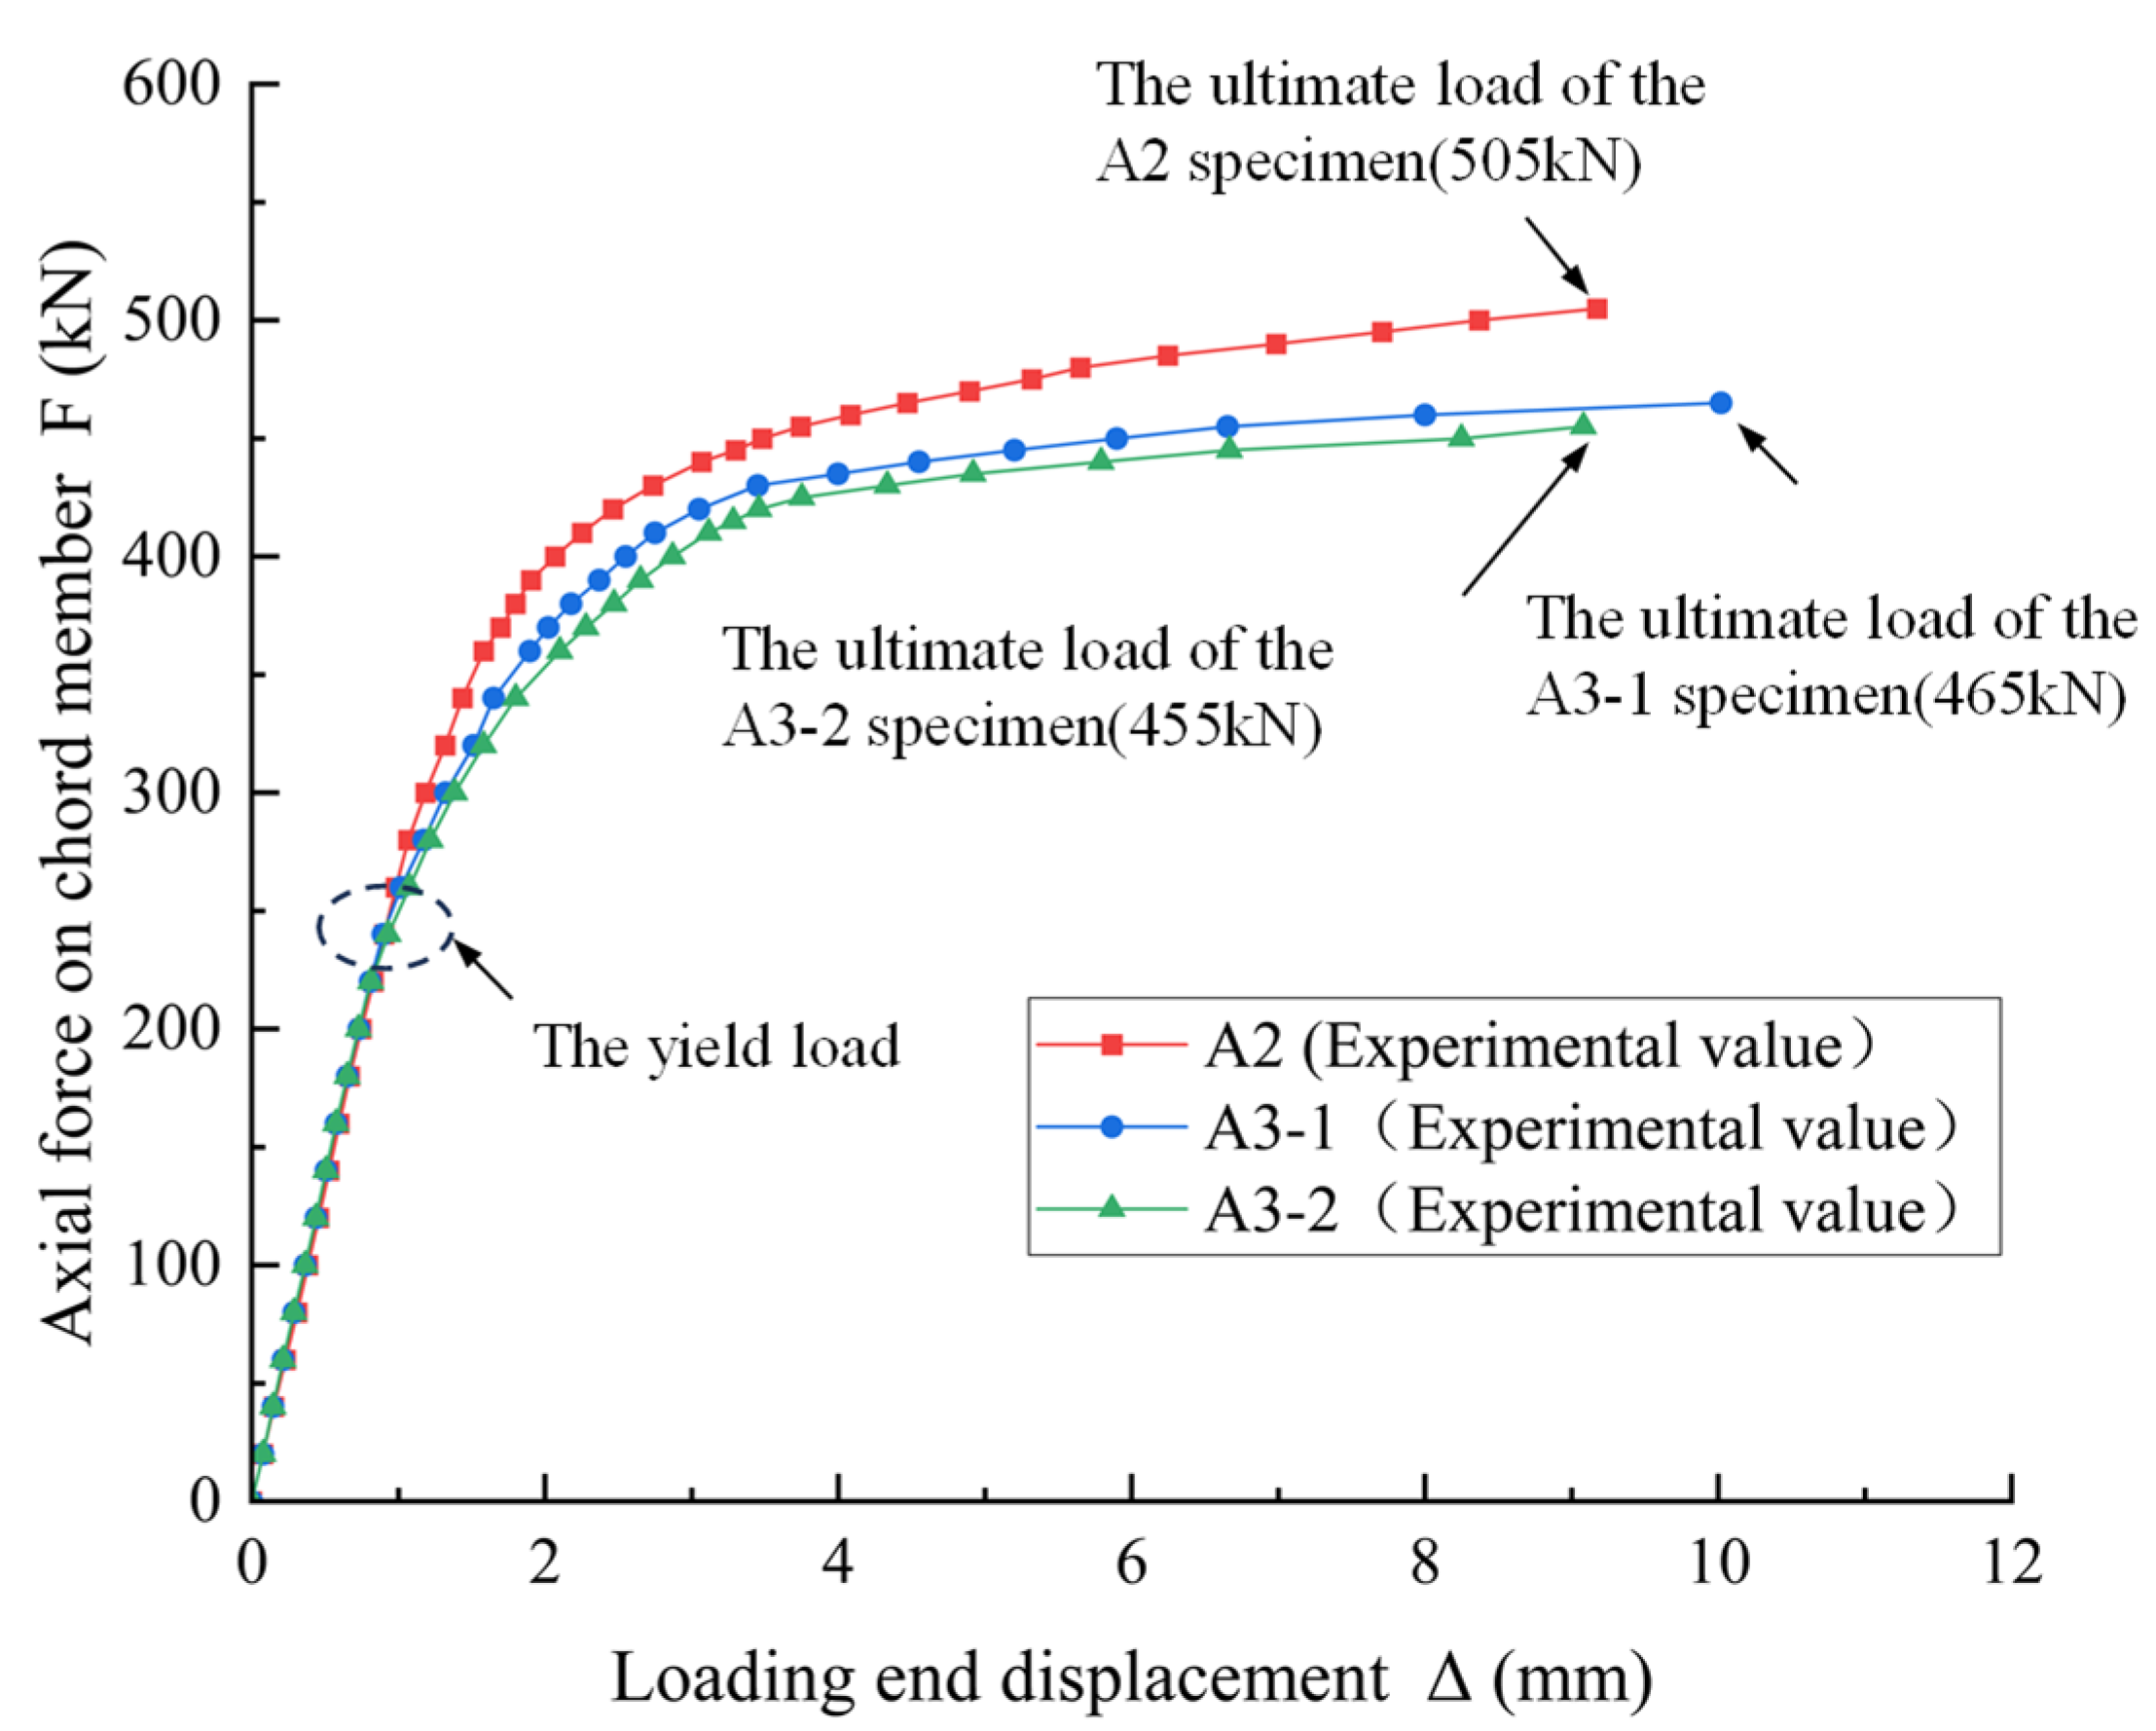
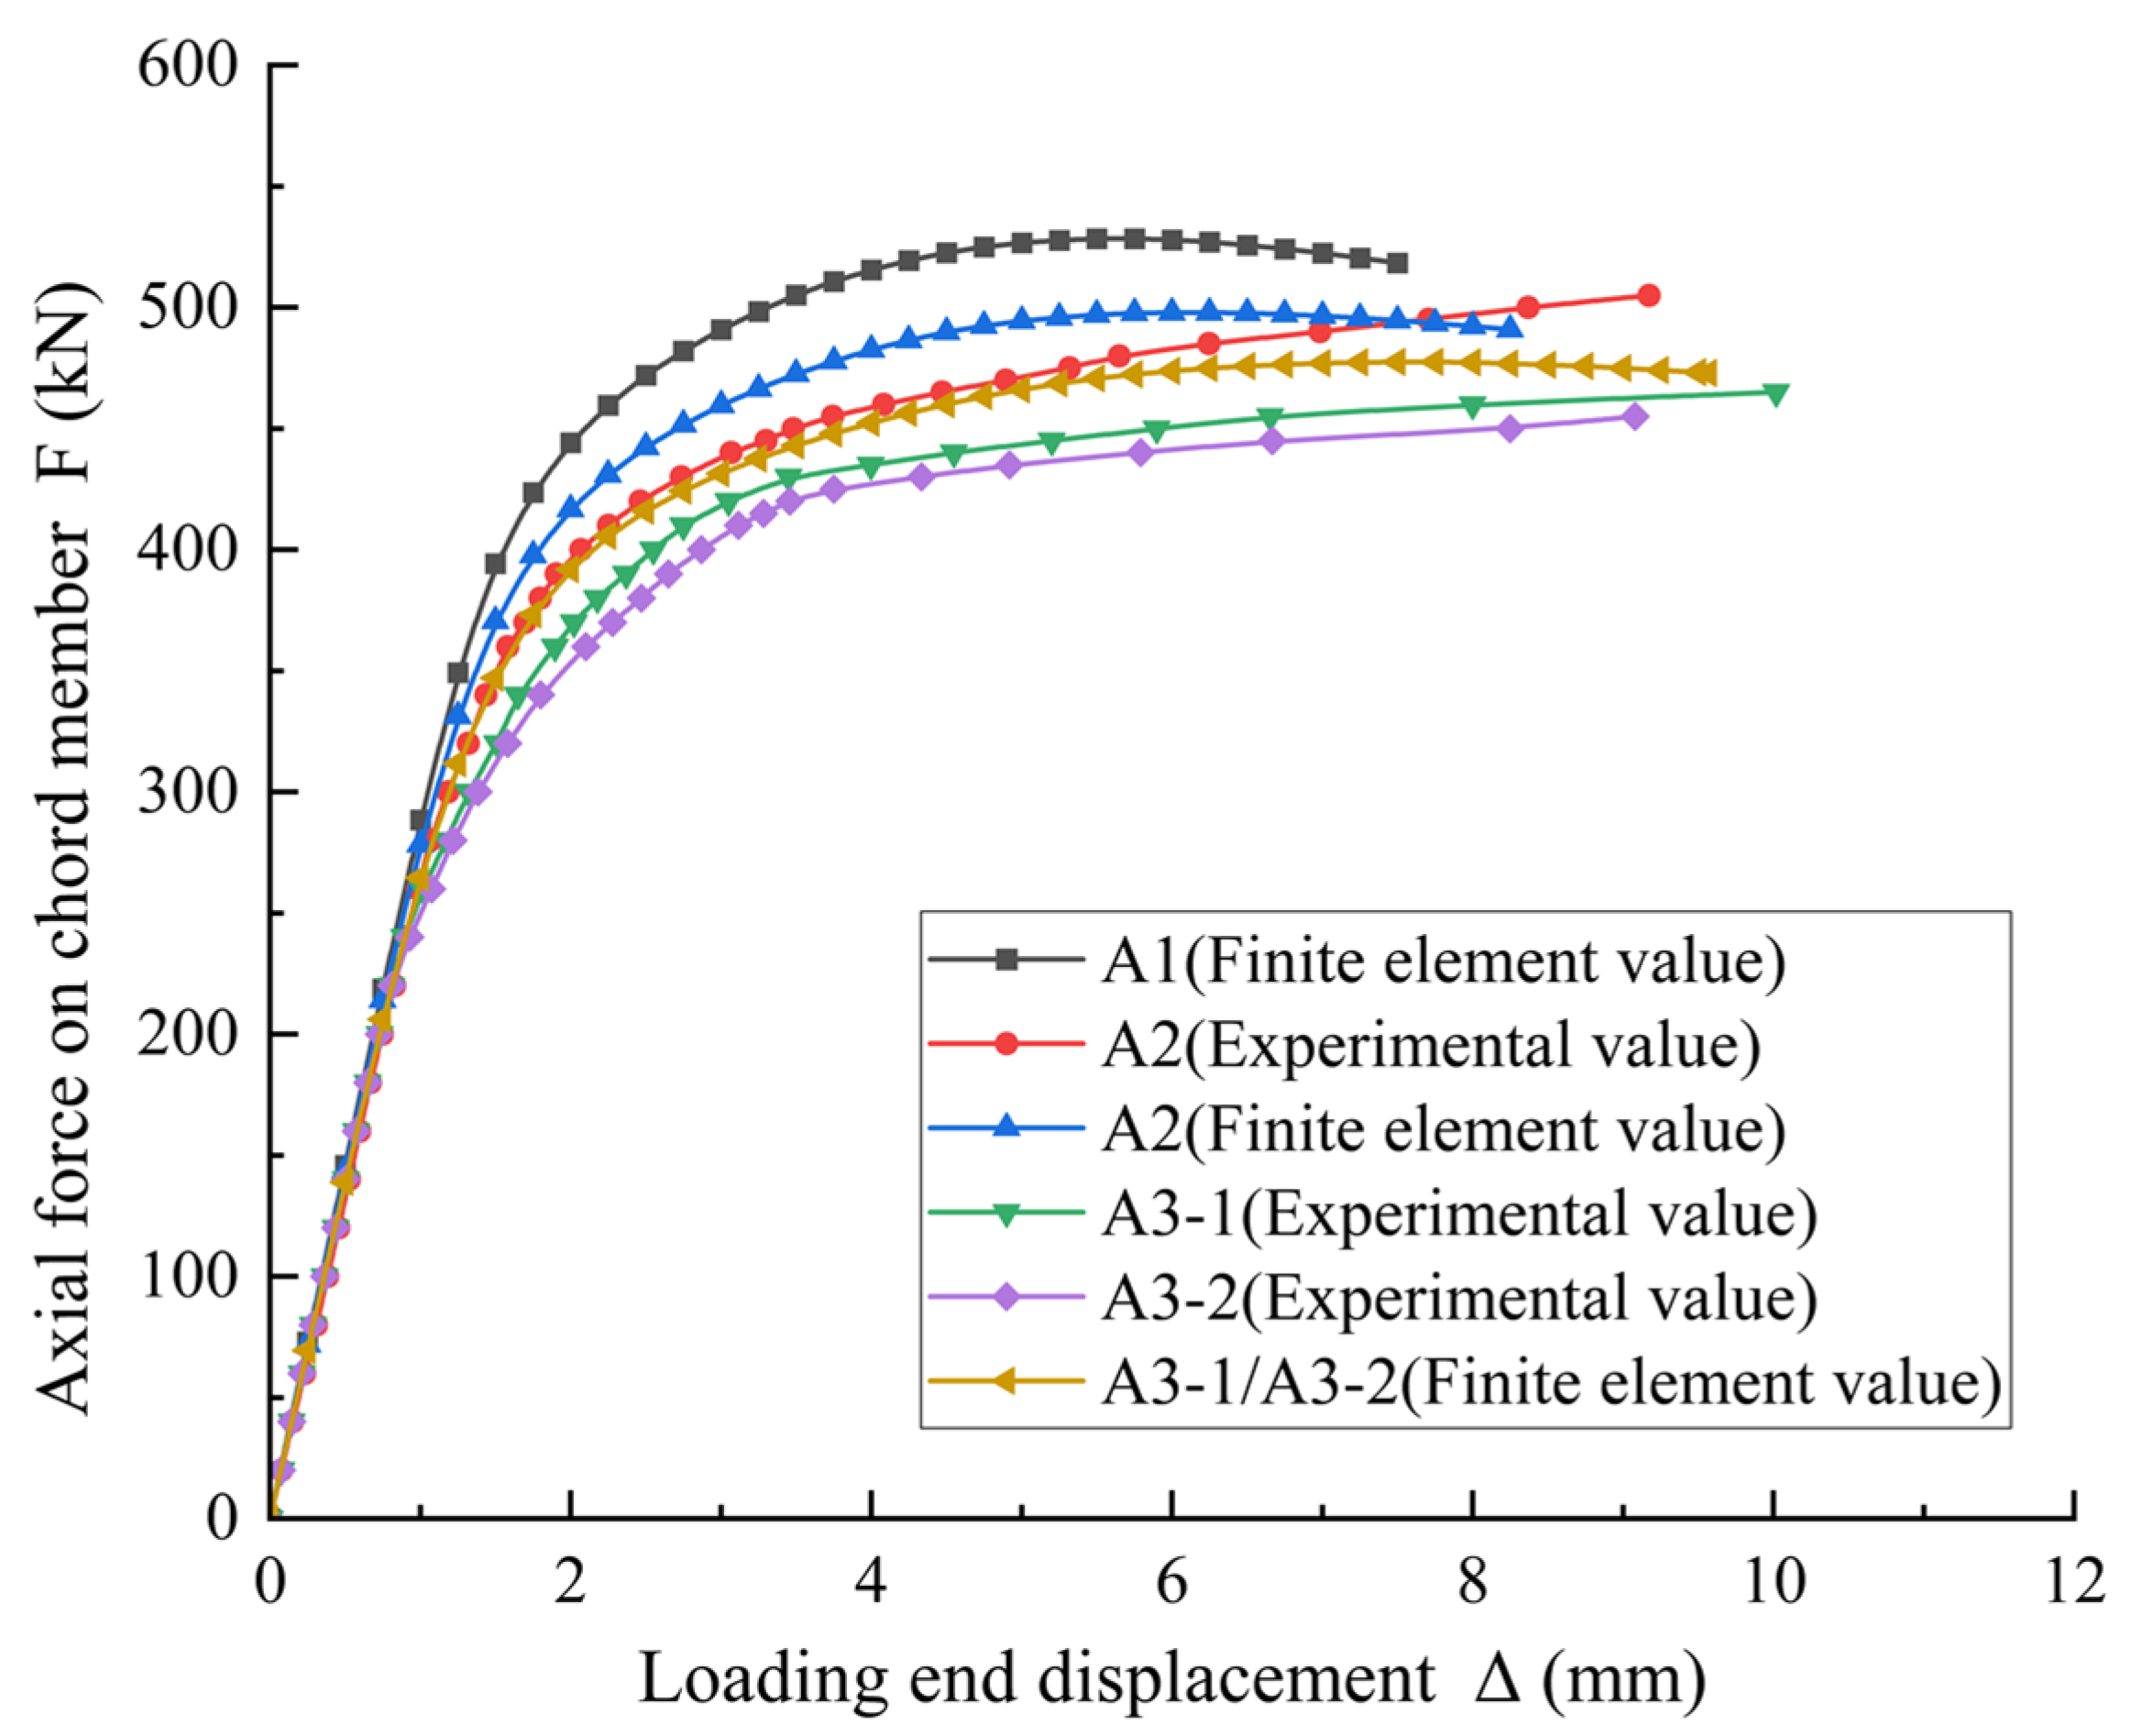
Figure 11 shows the load–displacement (F-A) curve of the stringers at the loading end, where the displacement is the reading of the displacement of the stringers in the axial direction of the displacement gauge at the loading end. The axial force-displacement curves of the chords of each specimen gradually transitioned from the elastic stage to the elastic–plastic rise. For the specimen nodes, when the applied load is less than 50% of the ultimate load capacity, the displacement of all the specimens is almost linear with the load, indicating that the specimens are in the elastic stage at this time. When the applied load reaches 80% of the ultimate load capacity, the displacement increases significantly with the change in load. Furthermore, when the applied load reaches the ultimate load capacity, the welds at the connection of the chord and the tensile web in all the specimens undergo a tensile shear-type brittle fracture. Comparing the load–displacement curves of the three specimens, it can be found that with the increase in the diameter of the opening at the coherent position from 8 mm to 12 mm, the bearing capacity of the joint is attenuated from 505 kN to about 460 kN, indicating an extremely significant tendency of attenuation. Simultaneously, the corresponding ultimate displacement also shows a significant increase in the stiffness degradation of the node, weakening its ability to resist deformation and reducing the reliability and safety margin of the structure under actual service conditions.

4. Finite Element Analysis and Discussion

4.1. Finite Element Model

Figure 12 depicts the finite element model of the K-shaped joint specimen based on ABAQUS (v6.14) [29], in which a spherical shape simulated the corrosion pit at the position of the coherence line, and the diameter of the corrosion pit was taken from the average value of the measured data in Table 2. The analytical equations of the coherence line were computed and processed using the Python programming (v3.12) language to accurately determine the corrosion pit’s position. Both the chord and web tubes are simulated by the shell unit S4R. The five degrees of freedom (d2, d3, r1, r2, r3) of the left end section of the chord are constrained to the reference point RP-1, and the axial force Nc is applied in the direction of d1 at RP-1. The three degrees of freedom (d1, d2, d3) of the end section of the web are constrained to the reference points RP-2 and RP-3 for simulating the articulated joint, respectively. Taking the maximum load at the loading end as the evaluation index, four mesh schemes are created in the intersection area (with cell sizes Δx of 8 mm, 6 mm, 4 mm, and 2 mm), and a 0.5 × Δx (i.e., 2 mm) is adopted near the corrosion pits. The convergence criterion is set such that the change rate of the evaluation index is ≤5% after two consecutive mesh refinements. Through mesh sensitivity analysis, the optimal cell size in the region of the coherent connection between the chord and web is 4 mm, which is reduced to 2 mm in the vicinity of the corrosion pit, and the cell size in the other regions is 12 mm. When the cell size is refined from 4 mm to 2 mm, the change rate of the maximum load at the loading end is 3.2%.
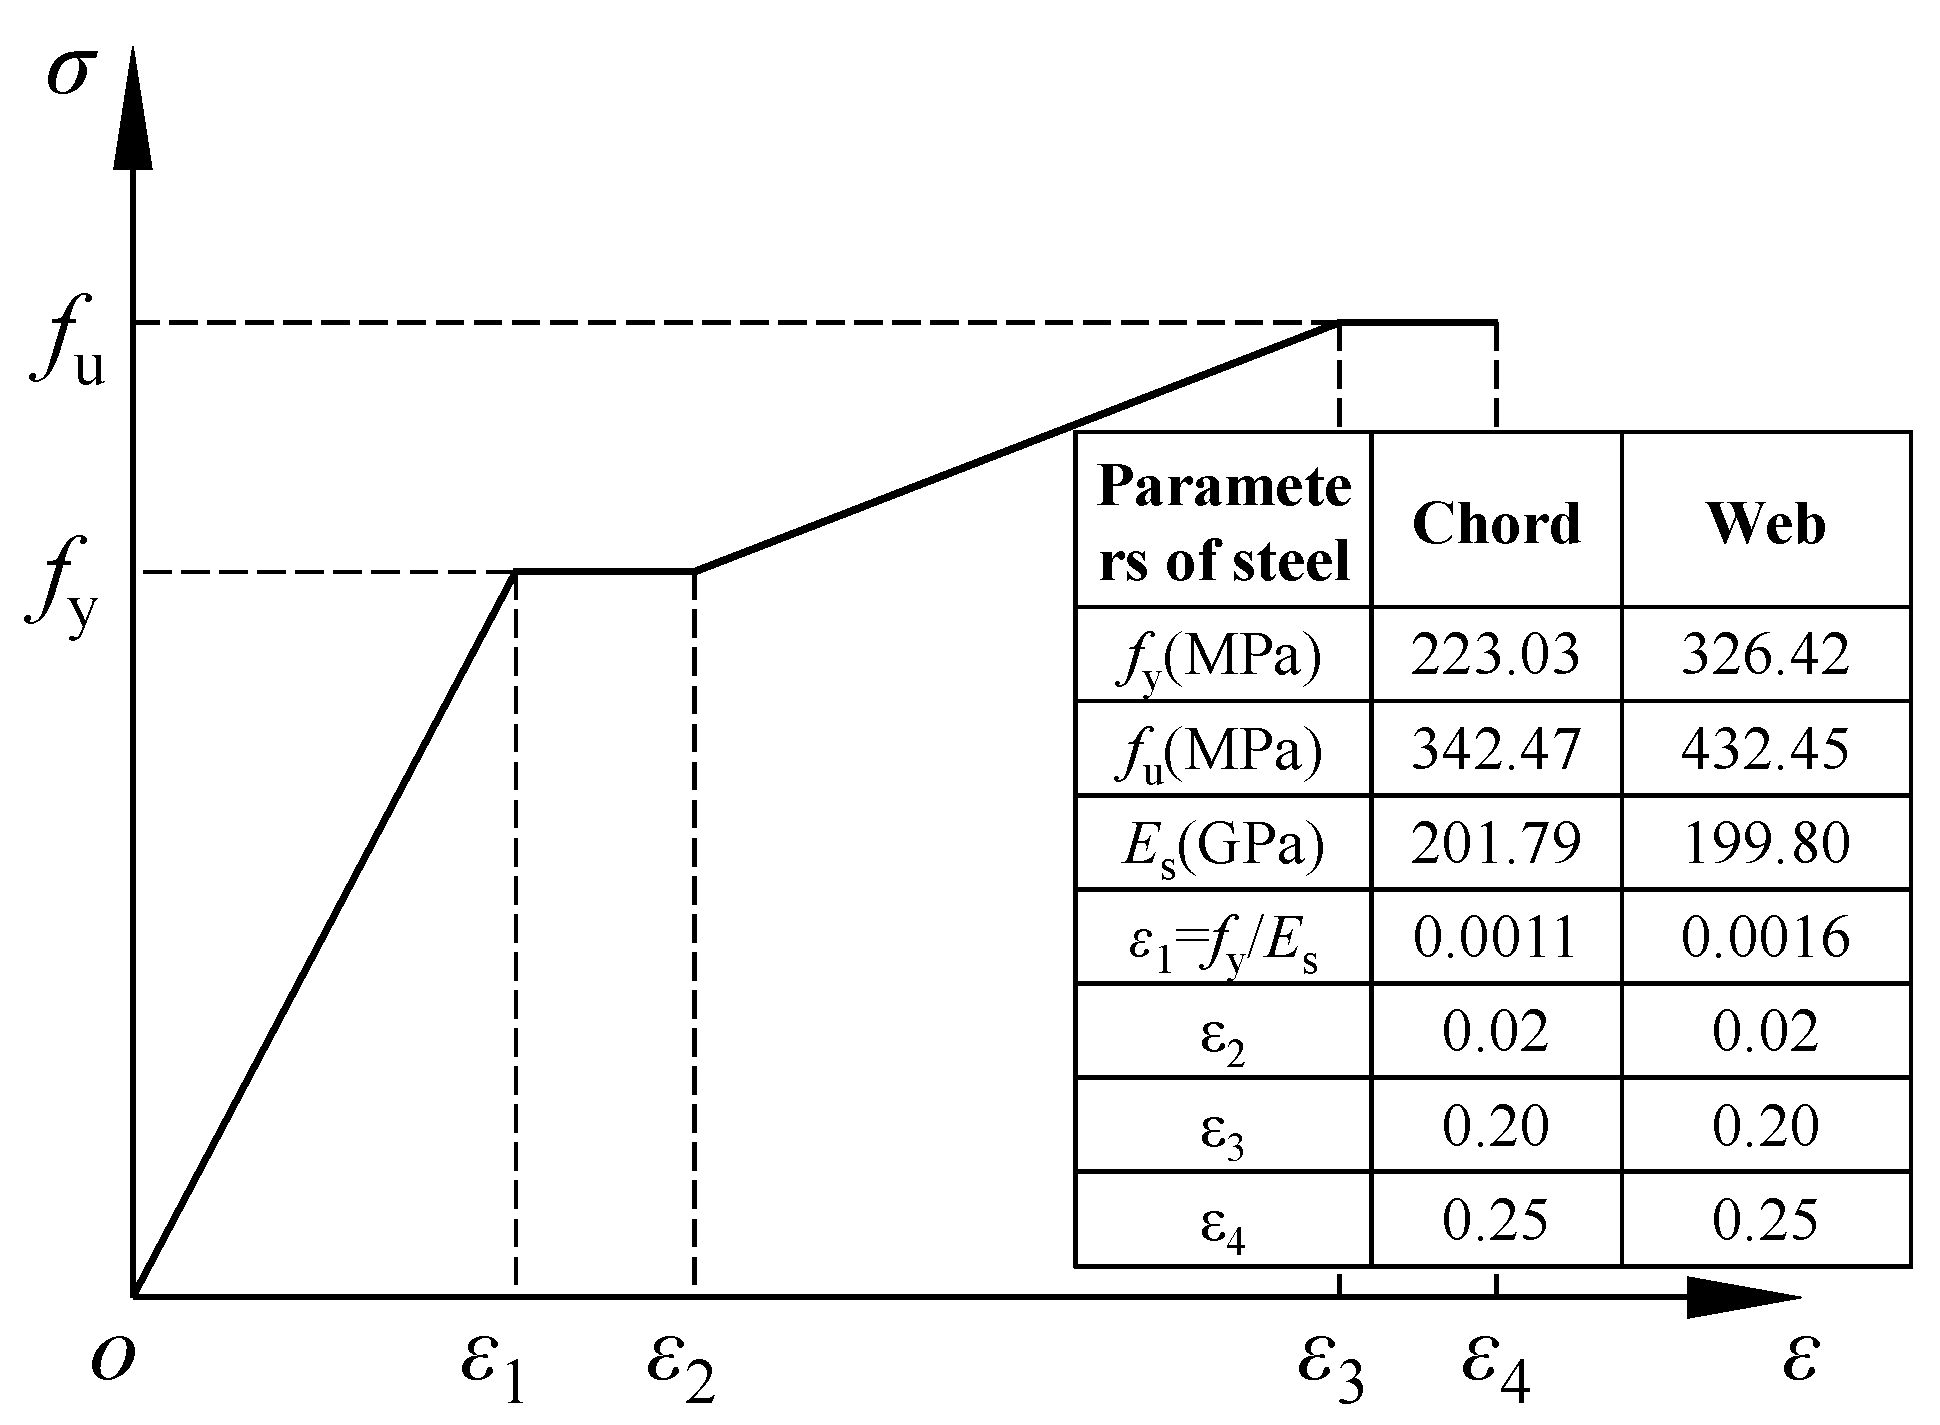
The material eigenstructure of the steel pipe in the finite element model utilizes an elasto-plastic linearly reinforced 4-fold stress–strain parameter (as shown in Figure 13), incorporating an isotropically reinforced von Mises yield criterion to account for both geometrical nonlinearities and material nonlinearities. The effects of welding and residual stresses are not considered in the simulation. The yield strength fy, ultimate strength fu, and modulus of elasticity Es of the steel in Figure 14 are taken from Table 2 in the average value, and Poisson’s ratio is taken as 0.3.

4.2. Finite Element Simulation Verification

Four nodal specimens were analyzed, and the results are shown in Table 4. It can be seen that the computational results of the finite element model are in good agreement with the test results. The average ratio of NT/NF is about 0.98, and the standard deviation is 0.03. Figure 14 depicts the typical damage modes of A2 and A3-1/A3-2 obtained by finite element analysis, which agree with the test results. Moreover, the load–displacement (F-A) curves obtained by finite element analysis agree with the test results (Figure 15). Thus, the finite element model can accurately predict the load-carrying capacity of the coherent joints of locally corroded K-shaped circular pipes.

4.3. Finite Element Parametric Analysis

A finite element parametric analysis of the nodes was conducted using ABAQUS to comprehensively study the influence of local corrosion on the residual strength of K-shaped circular pipe coherent nodes. To facilitate the analysis and comparison, the material of the steel pipe is Q355, the four-fold principal relationship is fy = 355 MPa, fu = 470 MPa, and Es = 2.06 × 10⁵ MPa; the diameter of the chord is uniformly taken as 210 mm, the tensile and compressive web cross-section parameters are the same, and the angle with the chord is the same. The length of the web and the chord are, respectively, taken as 10 times the diameter of the pipe, and the wall thickness is taken as 0.8 times the wall thickness of the chord. The wall thickness of the web rod is taken as 0.8 times the wall thickness of the chord. The corrosion pit morphology, cell type, mesh size, loading, and boundary conditions of the finite element analysis specimen are the same as those of the test specimen.
Define the expression [25] for the rust discount factor ks as follows:
k s = N u p / N u  
where Nup is the ultimate bearing capacity of the node after corrosion; Nu is the ultimate bearing capacity of the node without corrosion.
The expression for the coherent corrosion rate χs is as follows:
χ s = L H / L p
where LH is the total length occupied by the corrosion pit at a single coherent line, LH = 2 × N × RH; Lp is the length of the coherent line at the strained web.
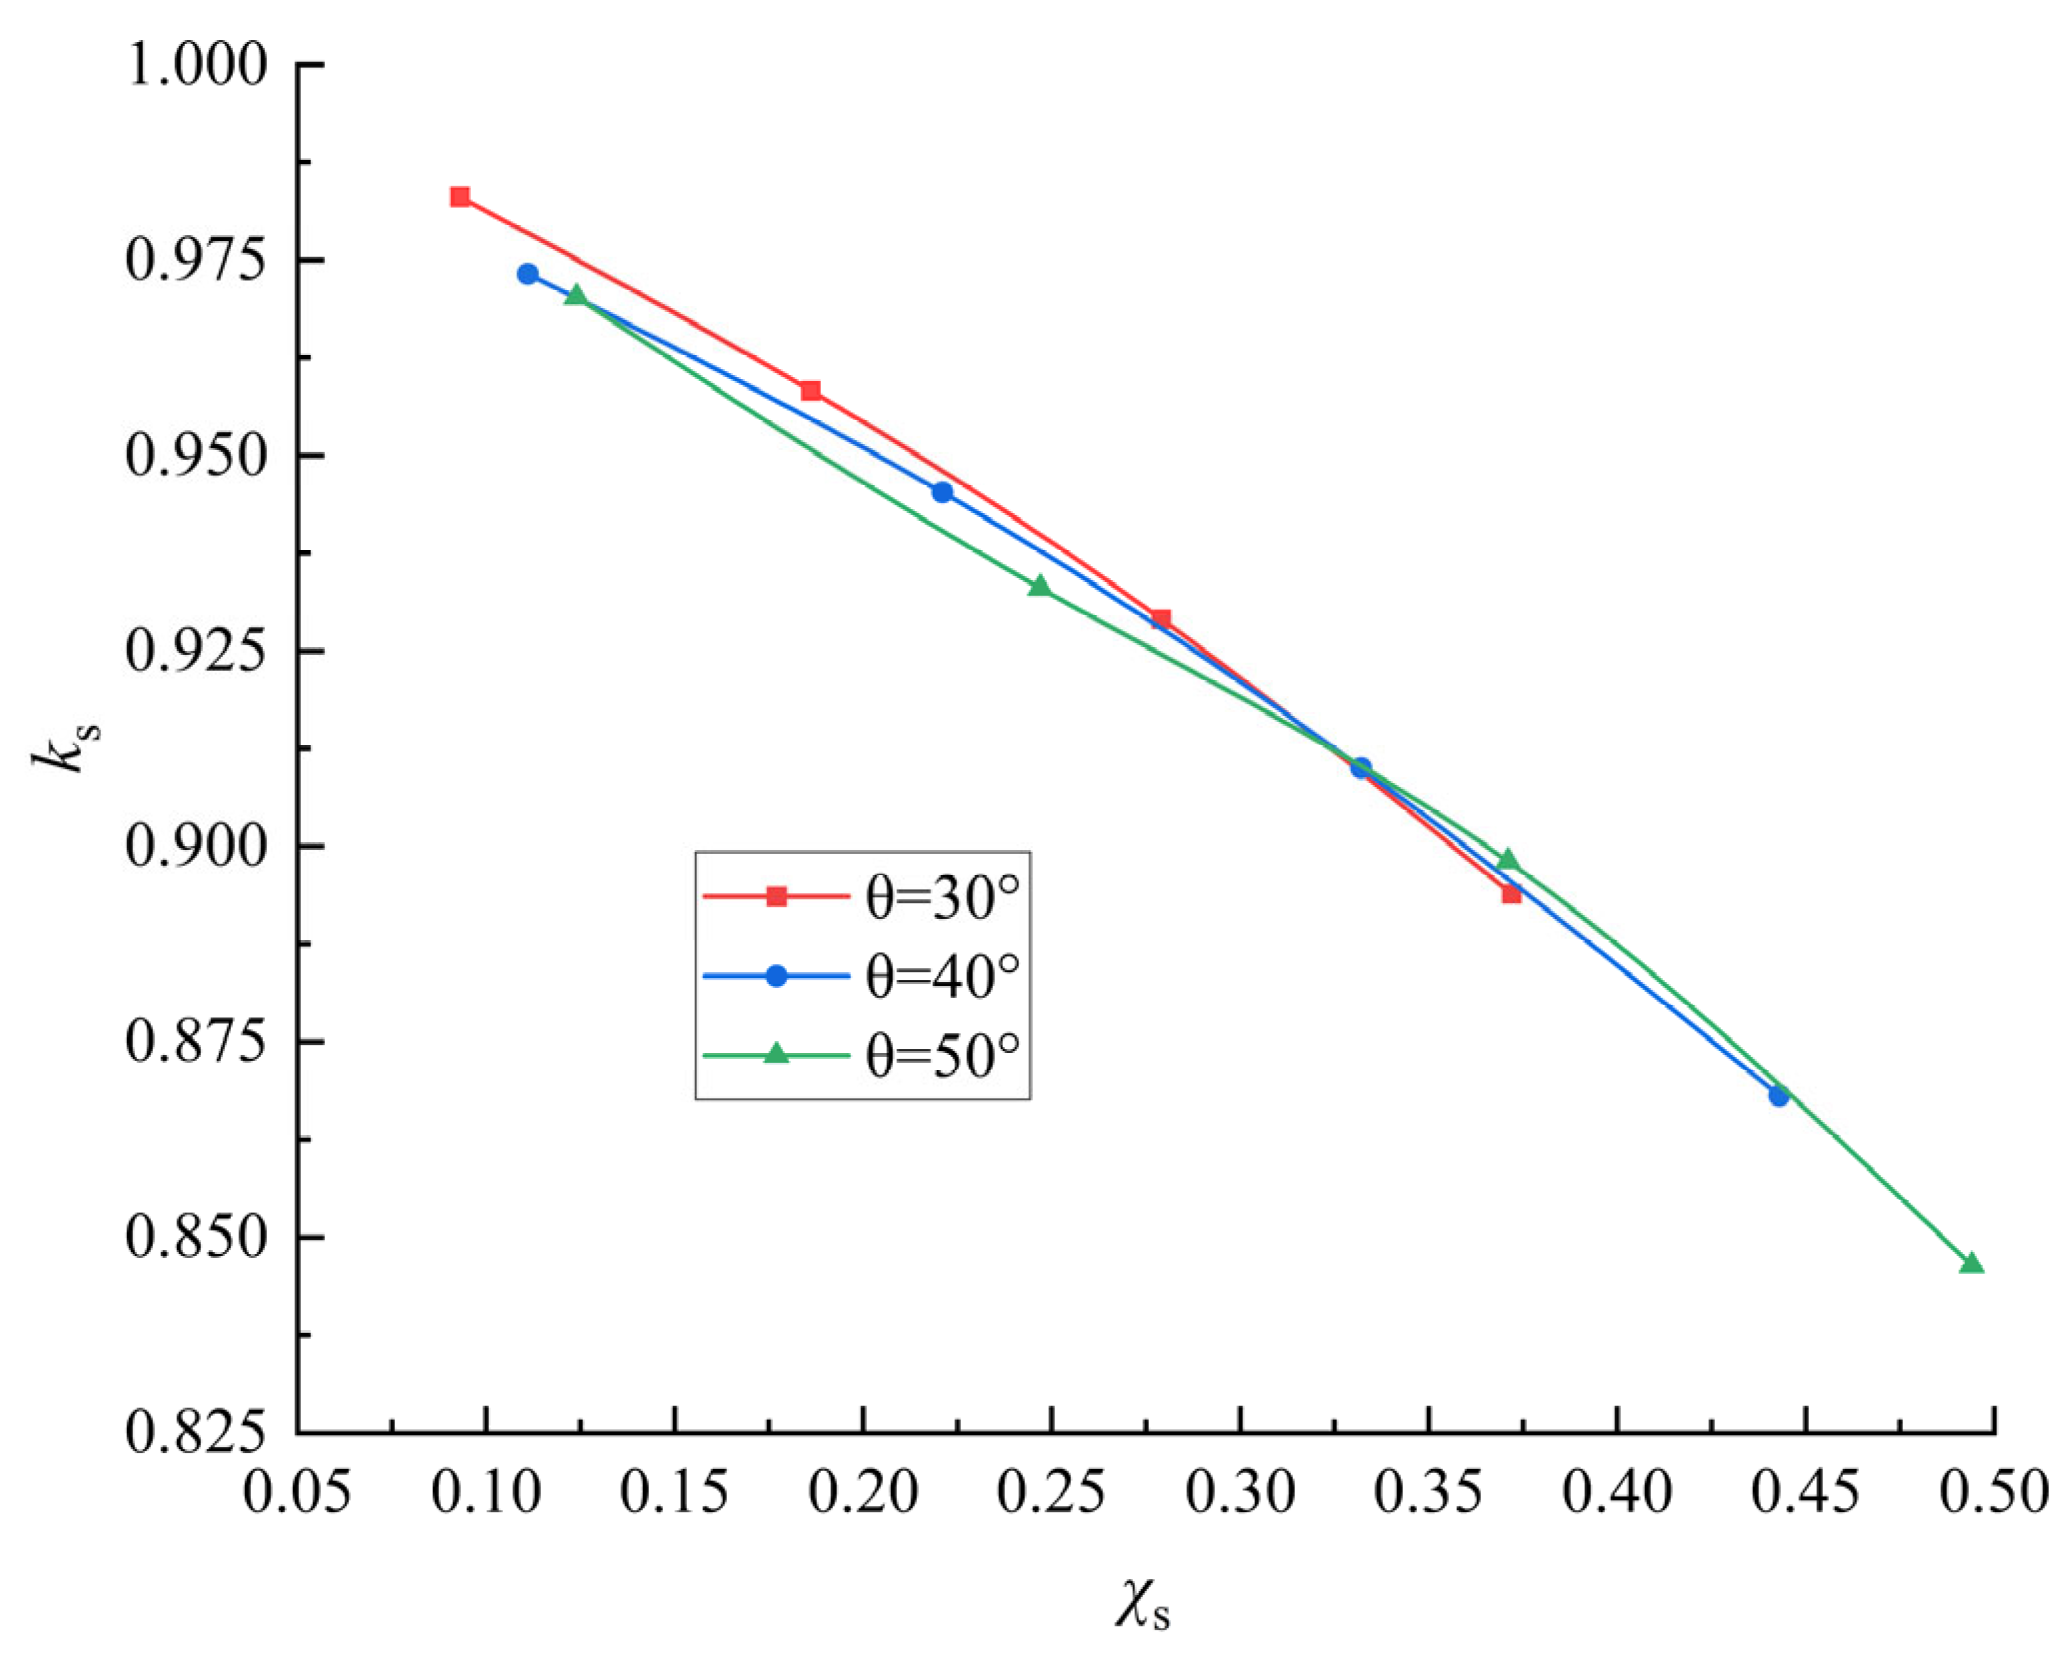
Four groups of 69 specimens were designed to investigate the variation rule of the corrosion reduction coefficient ks with the coherent corrosion rate χs under different web-chord angles θ, chord diameter-to-thickness ratio γ, and web-chord diameter ratio β, with corrosion pits extending along the thickness direction. In the parameter analysis, the geometric parameter θ with the magnitude of one is taken at three levels (30°, 40°, and 50°), the diameter-to-thickness ratio of the chord γ is taken at five levels (10, 12.5, 15, 17.5, and 20), and the diameter ratio of the ventral chord β is taken at four levels (0.4, 0.5, 0.6, and 0.7). The radius of the pothole, RH, is taken at four levels (2 mm, 4 mm, 6 mm, and 8 mm).
Considering the subsequent development of multi-model parametric analysis, the specimen numbering is unified according to the naming specification of P210p105-θ-γ-β-HAR2N12 for the sake of clarity of expression, where P denotes the outer diameter of the chord, p denotes the outer diameter of the web, H denotes the depth of the corrosion pits (HA stands for the corrosion pits penetrating through the entire wall thickness), R denotes the radius of the corrosion pits, and N denotes the total number of corrosion pits of the single web and the chord. N is the total number of pits in a single web and chord region.
(1)
The effect of the angle θ of the ventral chord clip
The results in Table 5 and Figure 16 illustrate that the corrosion discount factor, ks, exhibits a decreasing trend with increasing coherent corrosion rate, χs, for different web chord pinch angles, θ (30°, 40°, and 50°). This indicates that the effect of corrosion on the bearing capacity of nodes increases with the increase in the corrosion rate. The comparative analysis reveals that, under the same corrosion rate, the value of ks is relatively larger when the angle θ of the web chord is small (e.g., 30°), indicating that nodes with small angles have relatively stronger corrosion resistance.
(2)
Influence of the diameter-to-thickness ratio γ of the stringers
The results presented in Table 6 and Figure 17 indicate that as the diameter-to-thickness ratio γ of the chord (when the pipe wall becomes thinner) increases, the corrosion discount factor ks gradually decreases under the same corrosion rate. This signifies that the thickness of the pipe wall has a significant effect on the corrosion resistance of the node; the greater the wall thickness, the stronger the corrosion resistance. The comparative analysis reveals that ks decreases as χs increases for all values of γ, and the magnitude of the decrease grows with the increase in γ, indicating that the bearing capacity of thin-walled nodes under the action of corrosion decreases more significantly.
(3)
Influence of the pipe diameter ratio β of the ventral chord bar
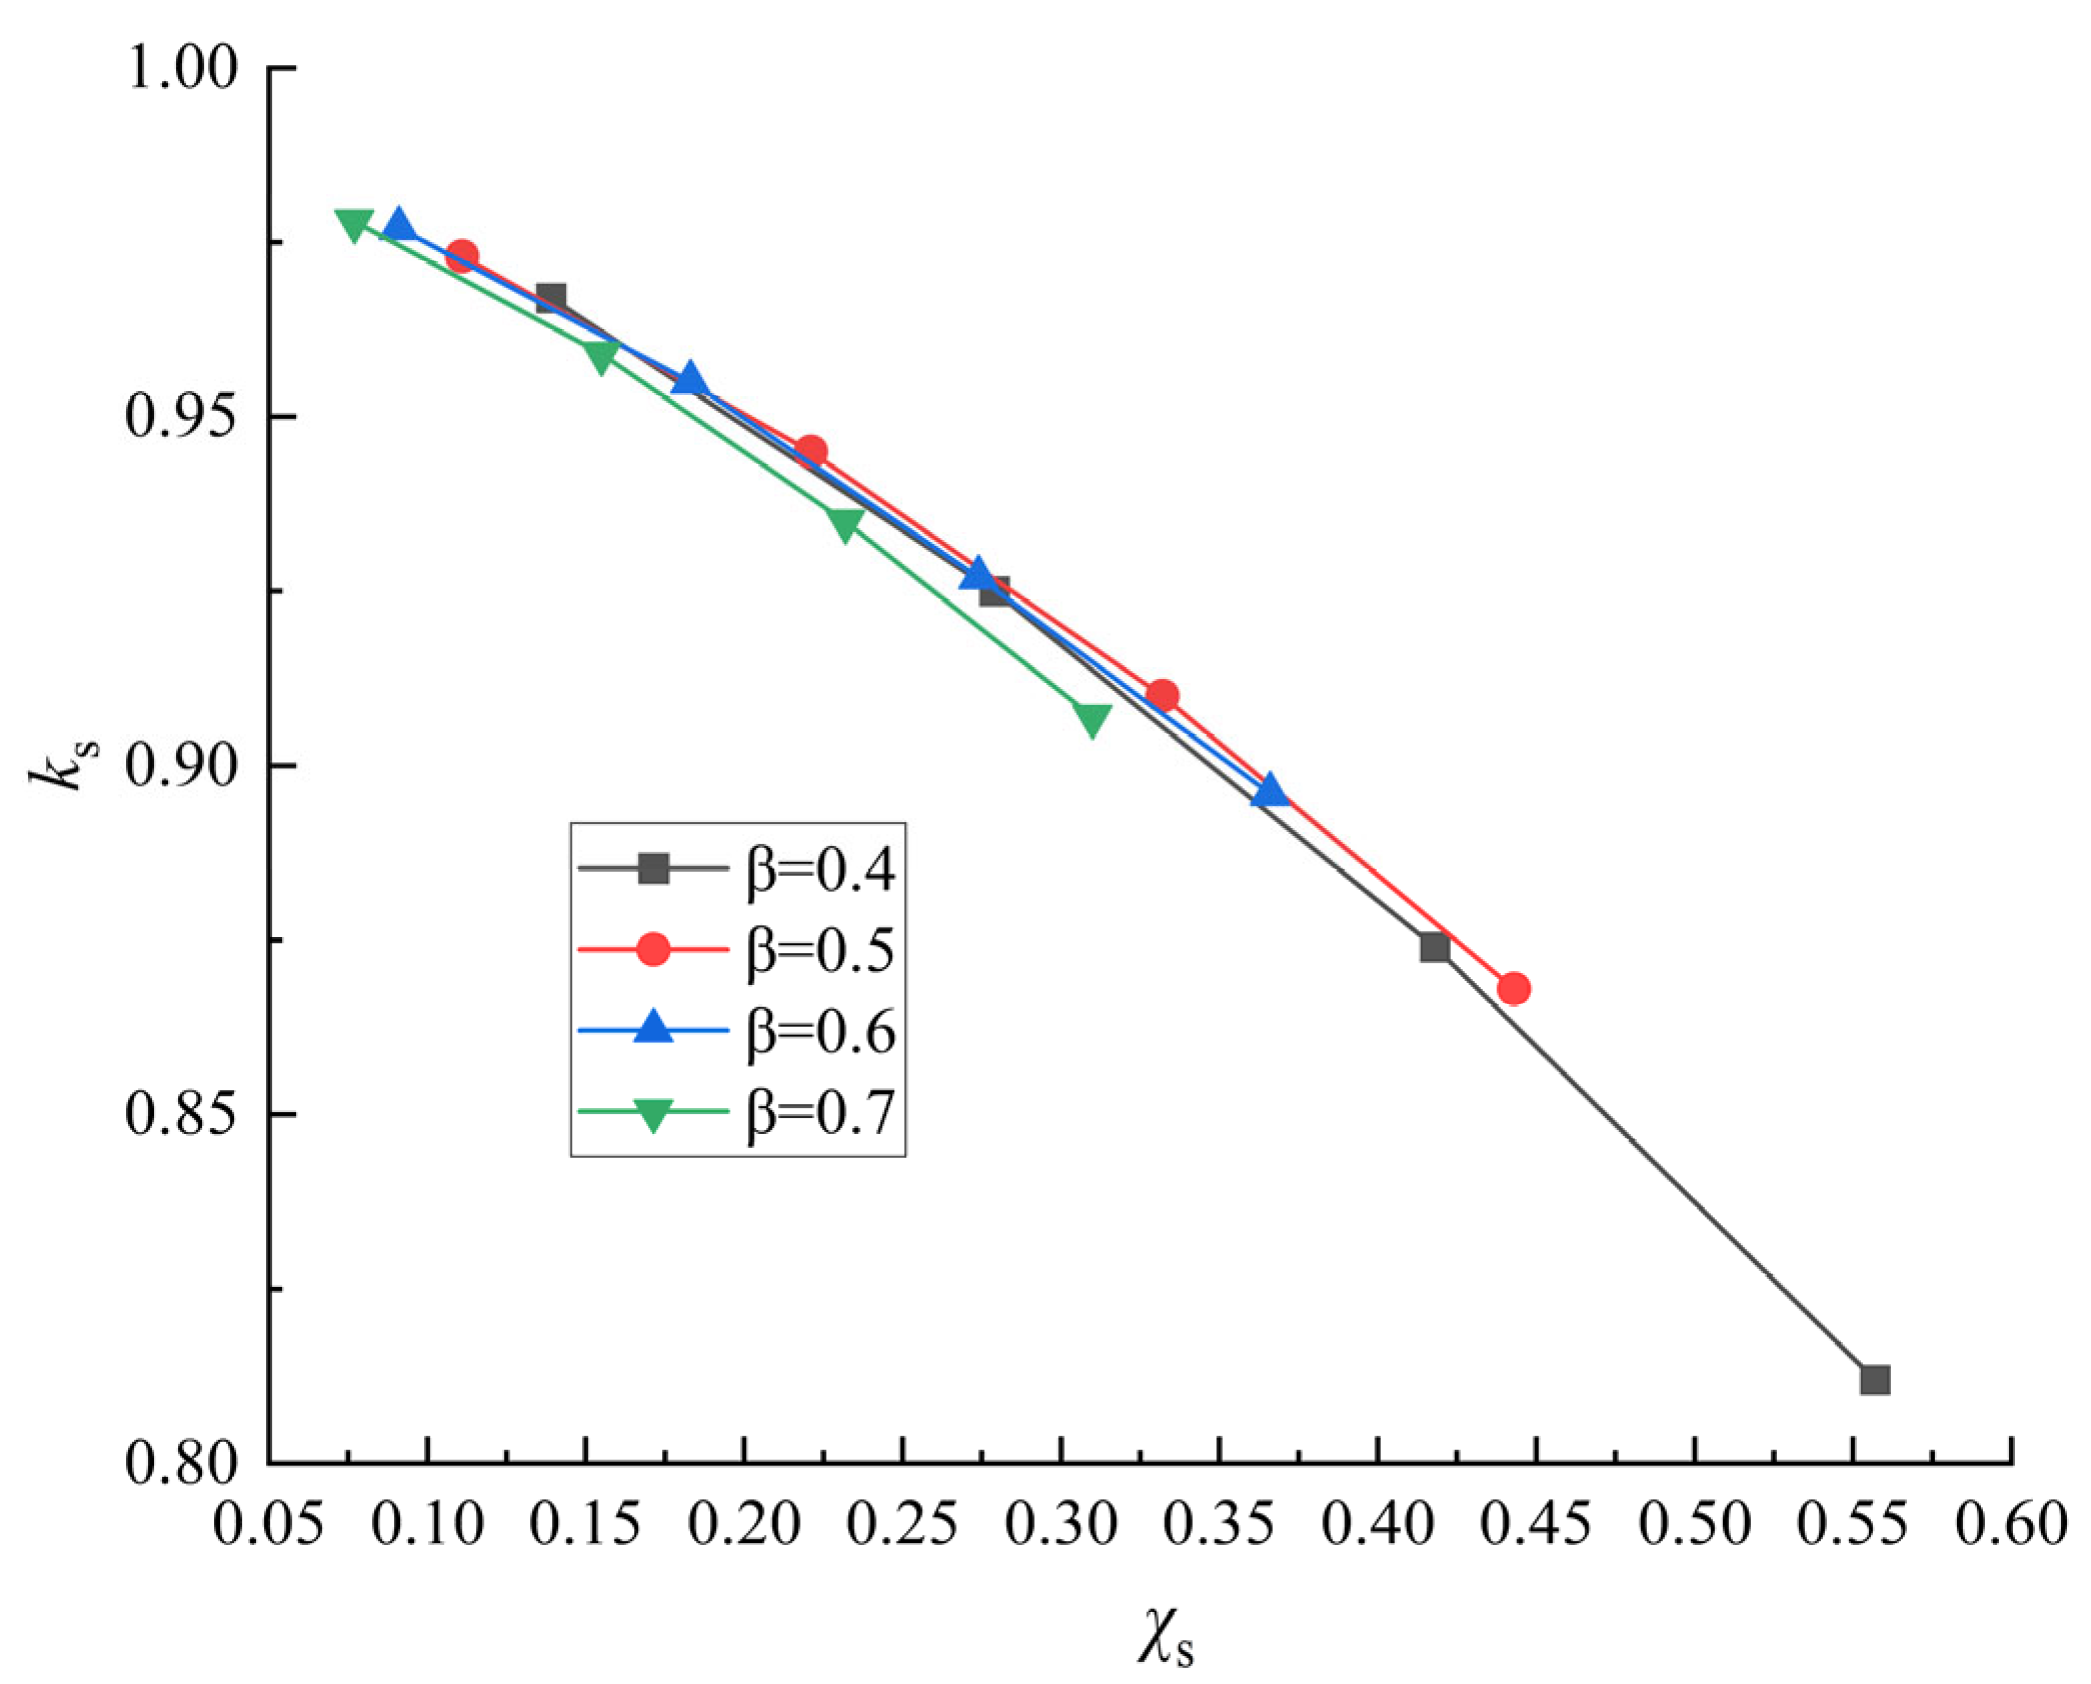
The results illustrated in Table 7 and Figure 18 indicate that the effect of the diameter ratio β of the ventral chord on the corrosion discount factor ks is more complex. At smaller values of β (0.4, 0.5), ks decreases significantly with the increase of χs, whereas at larger values of β (0.7), the decreasing trend of ks is relatively steeper, indicating that the effect of corrosion on the fold reduction coefficient is more significant at larger pipe diameter ratios, which may be related to the change in the node geometrical configuration caused by the large pipe diameter ratio, which in turn affects the force performance.
(4)
Effect of the number and diameter of corrosion pits
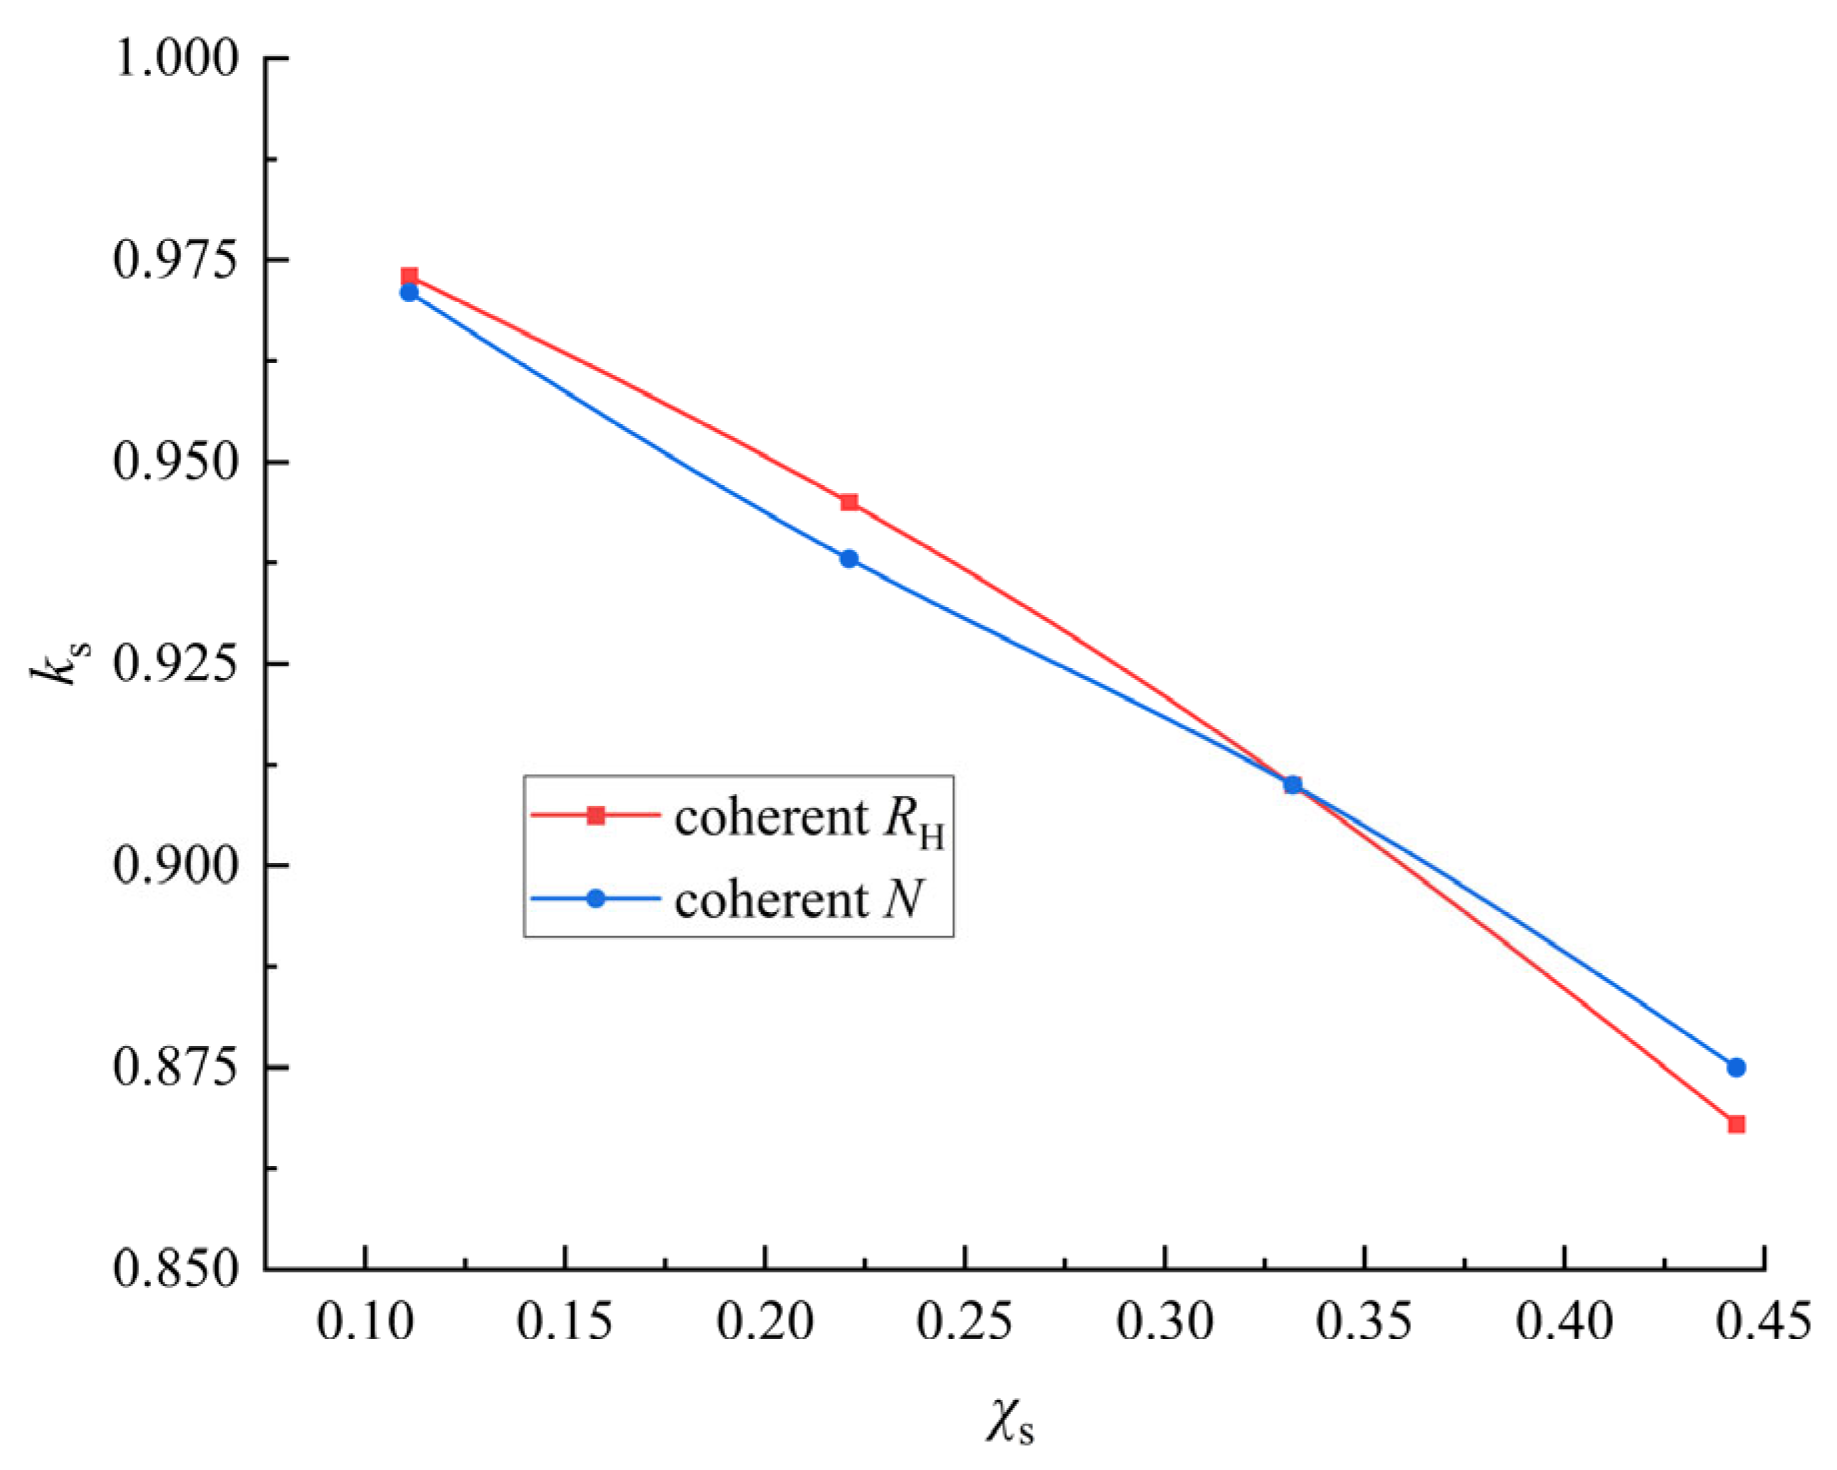
The results in Table 8 and Figure 19 indicate that, for a fixed diameter and number of corrosion pits, the corrosion discount factor, ks, decreases as the number of corrosion pits or the diameter of individual corrosion pits increases, indicating that the total corrosion area increases. This indicates that the effect of the rusted area on node-bearing capacity is cumulative. The comparative analysis reveals that, under the same total corrosion area, the effect of multiple small pits on the node bearing capacity is generally smaller than that of a few large pits, which may be attributed to the distribution of the pits and the stress concentration effect.

5. Conclusions

In this study, the effect of localized corrosion on the mechanical properties of K-shaped coherent nodes of the tube truss is investigated, and the following conclusions are drawn by carrying out the static tests of four nodes with different degrees of corrosion and combining them with finite element analysis:
(1)
Failure mode and corrosion impact. For the locally corroded nodes, the corrosion of the steel at the coherent line (simulated openings) reduced the effective bearing area and exacerbated the stress concentration. During the loading process, the node went through elastic and elasto-plastic stages. Finally, the weld at the connection between the chord and the tensile web fractured in a brittle manner, characterized by both tensile and shear failure, and the web dislodged, leading to node failure. This indicated that corrosion had caused significant damage to the mechanical properties of the node.
(2)
As the diameter of the corrosion pit increases, the node stiffness decreases, and the dispersion trend of the load-strain curve becomes increasingly pronounced. The stress concentration occurs at the crown point of the distal end of the compressed web bar, and the axial strain is the first to reach the yield limit. The strain development at different measurement points of the tensile web varies significantly.
(3)
Mechanical property degradation. When the load was less than 50% of the ultimate load capacity, the node was in the elastic stage, and a linear relationship existed between displacement and load. When the load reached 80%, the growth rate of displacement accelerated. Further, when the load reached the ultimate value, the weld between the chord and the tensile web fractured. Comparing the experimental results with the model calculation results, the average ratio is approximately 1.00, with a standard deviation of 0.06. The damage pattern and load–displacement curves are in high agreement, indicating that the model accurately predicts the load-bearing capacity of the coherent nodes in locally corroded K-shaped round tubes.
(4)
The results indicate that localized rusting significantly impacts the residual strength of the K-shaped circular pipe’s coherent nodes. The corrosion discount factor, ks, decreases with an increase in the coherent corrosion rate χs, indicating that a higher corrosion rate leads to greater loss of bearing capacity of the node. The resistance of the nodes to corrosion is weaker at smaller web chord angles θ, larger chord diameter-to-thickness ratios γ, and larger web chord tube diameter ratios β. Furthermore, an increase in the corrosion area, through an increase in the number or diameter of corrosion pits, also leads to a decrease in ks. The effect of a few large corrosion pits is usually greater than that of many small ones for the same total corrosion area.
(5)
Due to space limitations, this article only explores the impact of concentrated rust pits in the intersection area of K-shaped steel pipe joints on the degradation of their bearing capacity. However, in actual engineering, the distribution of rust pits typically exhibits significant randomness. In subsequent research, the author plans to perform an in-depth analysis of the degradation pattern of the bearing capacity of steel pipe joints caused by random pitting corrosion. Systematic research will establish a foundation for bearing capacity correction in existing standards and promote the improvement of relevant design theories and the optimization of engineering applications.

Author Contributions

Conceptualization, Y.-Q.S.; Validation, Y.-Q.S., S.-J.T. and J.-H.L.; Formal analysis, J.-K.X.; Investigation, X.-D.F.; Writing—original draft, Y.-Q.S.; Writing—review & editing, H.-L.J. All authors have read and agreed to the published version of the manuscript.

Funding

This research was supported by Huzhou Vocational & Technical College for high-level Talents (Influence of joint corrosion on safety performance of existing pipe truss structure, No. 2022GY12) and Open Fund of Huzhou Key Laboratory of Green Building Technology (No. HGB23E005).

Data Availability Statement

The original contributions presented in this study are included in the article. Further inquiries can be directed to the corresponding author.

Conflicts of Interest

Author Shu-Jing Tong was employed by the company Zhejiang Tianhe Architectural Design Co., Ltd. The remaining authors declare that the research was conducted in the absence of any commercial or financial relationships that could be construed as a potential conflict of interest.

References

  1. Shu, G.; Yu, G. Experimental study on the progressive collapse of spatial pipe truss structures. Prog. Steel Build. Struct. 2015, 17, 7. [Google Scholar]
  2. Koch, G.H.; Thompson, N.G.; Moghissi, O.; Payer, J.H.; Varney, J. IMPACT (International Measures of Prevention, Application, and Economics of Corrosion Technologies Study); Report No. OAPUS310GKOCH (AP110272); NACE International: Houston, TX, USA, 2016. [Google Scholar]
  3. Kaita, T.; Appuhamy, J.; Itogawa, K.; Ohga, M.; Fujii, K. Experimental study on remaining strength estimation of corroded wide steel plates under tensile force. Procedia Eng. 2011, 14, 2707–2713. [Google Scholar] [CrossRef]
  4. Appuhamy, J.M.R.S.; Kaita, T.; Ohga, M.; Fujii, K. Prediction of residual strength of corroded tensile steel plates. Int. J. Steel Struct. 2011, 11, 65–79. [Google Scholar] [CrossRef]
  5. Zheng, S.; Zhang, X.; Zhao, X.; Liu, Y. Experimental and restoring force model research on the seismic behavior of corroded steel frame beams in offshore atmospheric environment. Eng. Mech. 2018, 35, 98–106, 115. [Google Scholar]
  6. Bai, Y. Experimental Study and Theoretical Analysis on the Bending Behavior of Corroded Channel Steel. Master’s Thesis, Xi’an University of Architecture and Technology, Xi’an, China, 2009. [Google Scholar]
  7. Sheng, J. Study on Surface Characteristics and Mechanical Properties of Corroded H Steel Beam Under Coupling Action of Load and Underground Environment. Ph.D. Thesis, China University of Mining and Technology, Beijing, China, 2017. [Google Scholar]
  8. Yang, S.; Zheng, S.; Tian, Z.; Ming, M.; Xu, Y.; Wang, T. Mechanical properties test and cyclic constitutive model of corroded Q345B steel. Eng. Mech. 2025, 42, 206–215, 252. [Google Scholar]
  9. Liu, Y. Effect of Corrosion on Mechanical Properties of Q355 and Q390 Steel with its Application. Master’s Thesis, Harbin Institute of Technology, Harbin, China, 2023. [Google Scholar]
  10. Sheng, J.; Xia, J. Effect of simulated pitting corrosion on the tensile properties of steel. Constr. Build. Mater. 2017, 131, 90–100. [Google Scholar] [CrossRef]
  11. Yao, Y.; Yang, Y.; He, Z.; Wang, Y. Experimental study on generalized constitutive model of hull structural plate with multi-parameter pitting corrosion. Ocean Eng. 2018, 170, 407–415. [Google Scholar] [CrossRef]
  12. Wang, R.; Shenoi, R.A. Experimental and numerical study on ultimate strength of steel tubular members with pitting corrosion damage. Mar. Struct. 2019, 64, 124–137. [Google Scholar] [CrossRef]
  13. Yuan, Y.; Zhang, N.; Liu, H.; Zhao, Z.; Fan, X.; Zhang, H. Influence of random pit corrosion on axial stiffness of thin-walled circular tubes. Structures 2020, 28, 2596–2604. [Google Scholar] [CrossRef]
  14. Zhao, Z.; Zheng, C.; Zhang, J.; Liang, B.; Zhang, H. Influence of random pitting corrosion on moment capacity of thin-walled circular tubes subjected to compression force. Int. J. Press. Vessel. Pip. 2021, 189, 104260. [Google Scholar] [CrossRef]
  15. Chen, M.; Luo, S.; Huang, H.; Fang, W.; Xu, K.; Qian, W. Experimental studies on axial compressive bearing capacity of circular CFST stub columns with localized corrosion. J. Cent. South Univ. Sci. Technol. 2024, 55, 317–329. [Google Scholar]
  16. Wang, Y.; Zhang, F.; Xu, Q. Research progress of the effect of corrosion on the properties of existing steel structures. Constr. Technol. 2020, 49, 7. [Google Scholar]
  17. Guo, L.; Huang, H.; Jia, C.; Romanov, K. Axial behavior of square CFST with local corrosion simulated by artificial notch. J. Constr. Steel Res. 2020, 174, 106314. [Google Scholar] [CrossRef]
  18. Huang, H.; Guo, L.; Qu, B.; Jia, C.; Elchalakani, M. Tests of circular concrete-filled steel tubular stub columns with artificial notches representing local corrosions. Eng. Struct. 2021, 242, 112598. [Google Scholar] [CrossRef]
  19. Hou, C.; Liu, X.; Zhao, W. SCF analysis for CFST K-joints subjected to combined long-term loading and random localized corrosion. J. Build. Struct. 2023, 44, 209–219. [Google Scholar]
  20. Xu, S.; Wang, Y. Estimating the effects of corrosion pits on the fatigue life of steel plate based on the 3D profile. Int. J. Fatigue 2015, 72, 27–41. [Google Scholar] [CrossRef]
  21. Ren, S. Study on Evolutionary Process of Corrosion Pit and its Effect on the Fatigue Property of Corroded Steel. Ph.D. Thesis, Xi’an University of Architecture and Technology, Xi’an, China, 2016. [Google Scholar]
  22. Liang, X.; Sheng, J.; Wang, K. Investigation of the mechanical properties of steel plates with artificial pitting and the effects of mutual pitting on the stress concentration factor. Results Phys. 2019, 14, 102520. [Google Scholar] [CrossRef]
  23. GB/T 228.1-2021; Metallic Materials—Tensile Testing—Part 1: Method of Test at Room Temperature. Standards Press of China: Beijing, China, 2022.
  24. Zhou, L. Degradation Law and Evaluation of Axial Compression Performance of Locally Corroded X-Joints. Master’s Thesis, China University of Mining & Technology, Xuzhou, China, 2020. [Google Scholar]
  25. Zhao, W.; Zhang, J.; Hou, C. Mechanical performance analysis of concrete filled steel tubular K-joints subjected to random local corrosion. Steel Constr. 2022, 37, 10–19. [Google Scholar]
  26. Zheng, B.; Wu, B.; Zhang, K.; Wang, J.; Shu, G.; Jiang, Q. Investigations on capacity of stainless steel T- and Y-joints in circular hollow sections with axial tension in brace. J. Xi’an Univ. Arch. Technol. 2022, 54, 508–516. [Google Scholar]
  27. Gao, C.; Wang, J. Experimental study and numerical simulation for the concrete-filled steel tubular K-joint. Chin. J. Appl. Mech. 2021, 38, 38. [Google Scholar]
  28. Zhu, S.N. Analysis and Full-Scale Test Research on Ultimate Bearing Capacity of Circular Steel Pipe Intersecting Joints. Master’s Thesis, Hunan University, Changsha, China, 2003. [Google Scholar]
  29. Song, S.; Chen, J.; Xu, F.; Wang, Y. Mechanical behavior of concrete-filled K- and KK-type CHS connections. J. Build. Struct. 2021, 42, 133–142. [Google Scholar]
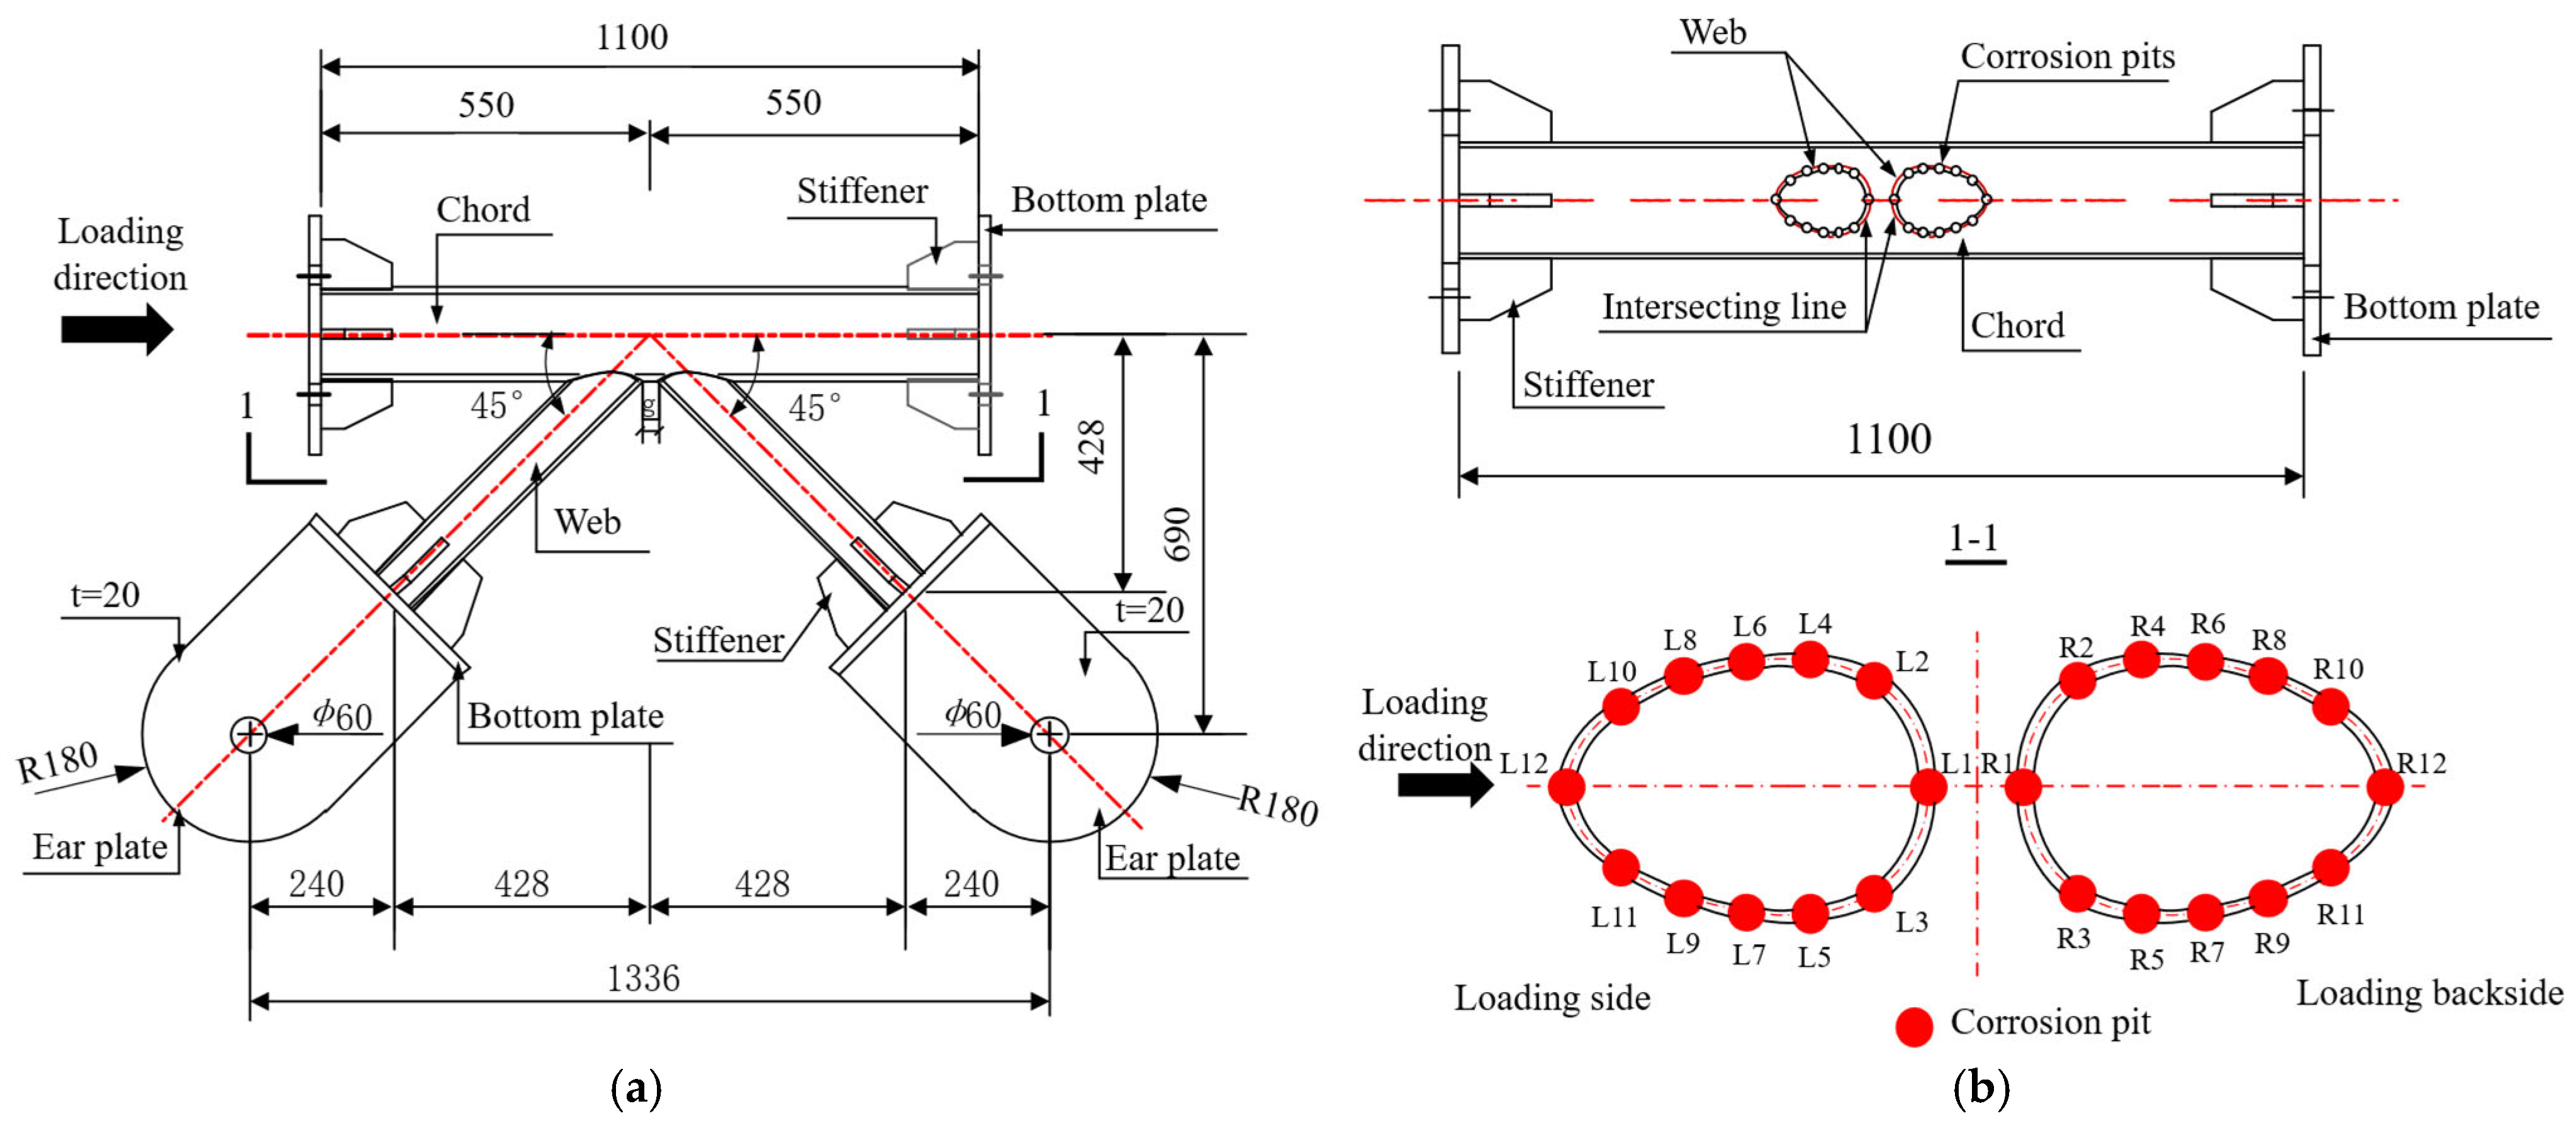
Figure 1. Model of joint (unit: mm). (a) Joint shape. (b) Diagram of the corrosion pit position.
Buildings 15 03111 g001
Figure 2. Photos of the intersecting area of the specimens.
Buildings 15 03111 g002
Figure 3. Stress-tensile diagram of the specimens.
Buildings 15 03111 g003
Figure 4. Diagrams of test rig (unit: mm).
Buildings 15 03111 g004
Figure 5. Photograph of the test rig.
Buildings 15 03111 g005
Figure 6. Arrangements of displacement transducers for K-shaped joint (unit: mm).
Buildings 15 03111 g006
Figure 7. Arrangements of the schematic diagram of the strain rosette for the K-shaped joint.
Buildings 15 03111 g007
Figure 8. Field diagram of the strain gauge in the joint area of the specimen.
Buildings 15 03111 g008
Figure 9. Field photos of three partially corroded specimens at the weld fracture. (a) Specimen A2. (b) Details of Specimen A2. (c) Details of Specimen A3-1. (d) Details of Specimen A3-2.
Buildings 15 03111 g009
Figure 10. Results of strain gauges of joints. (a) Strain at the main measuring point of the chord. (b) Strain at the main measuring point of the compression web. (c) Strain at the main measuring point of the compression web.
Buildings 15 03111 g010
Figure 11. Web axial force-displacement curve.
Buildings 15 03111 g011
Figure 12. Details of the finite element model of the joint. N* indicates that a load is applied at the constrained end in this direction. The asterisk (*) represents that the direction of the load application can be either positive or negative.
Buildings 15 03111 g012
Figure 13. Stress–strain curve of steel.
Buildings 15 03111 g013
Figure 14. Failure modes of joints in finite element modeling.
Buildings 15 03111 g014
Figure 15. Comparison of the load–displacement curves from finite element analysis and test results.
Buildings 15 03111 g015
Figure 16. The variation curve of corrosion reduction coefficient ks with the corrosion rate χs of the intersecting line under different angles θ of the abdominal chord.
Buildings 15 03111 g016
Figure 17. Under different chord diameter-to-thickness ratio γ, corrosion reduction coefficient ks changes with the corrosion rate χs of the intersecting line.
Buildings 15 03111 g017
Figure 18. Under different web chord diameter ratio β, corrosion reduction coefficient ks changes with the corrosion rate χs of the intersecting line.
Buildings 15 03111 g018
Figure 19. The variation curve of corrosion reduction coefficient ks with the corrosion rate χs of the intersecting line under different numbers and diameters of pits.
Buildings 15 03111 g019
Table 1. Parameters of specimens.
Specimen NumberChord SpecificationWeb SpecificationGap
g/mm
Diameter of
Corrosion Pit
d/mm
Depth of
Corrosion Pit
H/mm
Number of Corrosion Pits
N
Material
A1Ф152 × 6Ф89 × 427---Q235B
A2Ф152 × 6Ф89 × 4278624Q235B
A3-1Ф152 × 6Ф89 × 42712624Q235B
A3-2Ф152 × 6Ф89 × 42712624Q235B
Table 2. Measured data of each specimen corrosion pit.
Specimen NumberLoading Side (E) Corrosion Pit Diameter Measured Value (mm)
L1L2/L3L4/L5L6/L7L8/L9L10/L11L12Average
Value
Standard
Deviation
A27.307.8/7.67.3/7.48/7.27.9/7.67.2/7.68.07.580.29
A3-110.5011.1/11.510.8/10.810.9/13.111.9/10.811.1/1210.911.280.70
A3-210.2011.8/1111/10.510/11.511.6/11.711.5/11.910.011.060.69
Specimen NumberLoading Backside (W) Corrosion Pit Diameter Measured Value (mm)
R1R2/R3R4/R5R6/R7R8/R9R10/R11R12Average
Value
Standard
Deviation
A27.607.6/6.97.8/6.86.9/7.38/7.28.6/8.67.87.590.59
A3-110.3010.9/12.210.8/11.211.8/10.911.9/1111.6/10.710.111.120.62
A3-210.9012.6/13.110.8/10.911.7/10.612/1210.6/11.510.9011.470.79
Table 3. Test results of material performance.
Specimen NumberT/mmfy/MPafu/MPaEs/GPaδ/(%)
D89-13.74322.92435.96193.8423
D89-23.76331.47437.03199.7022
D89-33.76324.88424.37205.8521
Average value3.75326.42432.45199.8022
D152-15.80220.38340.84207.2529
D152-25.80226.44345.89192.4330
D152-35.78222.26340.68205.6828
Average value5.79223.03342.47201.7929
Table 4. Finite element model analysis and test strength comparison of specimens.
Nodal Specimen NumberNT
/kN
NF
/kN
NT/NFNF/NF0Corrosion Rate XSLCorrosion Pits’ Data
Quantity/Diameter
A1528.291.00.0
A2505497.851.010.9426.18%24/8 mm
A3-1465477.430.970.9038.59%24/12 mm
A3-2455477.430.950.9038.59%24/12 mm
Average value 0.980.92
Standard deviation 0.030.02
Note: “—” indicates that the accurate test results were not obtained due to errors in test operation. In the table, NT denotes the nodal load capacity obtained from the test; NF denotes the finite element ultimate load capacity; NF0 denotes the load capacity obtained from the A1 finite element analysis, and XSL denotes the ratio of the total length of the coherent line weakened by the corrosion pit to the length of the coherent line.
Table 5. Variation in corrosion discount factor ks with coherent corrosion rate χs for different web clamp angles θ.
Model Namet0
/mm
t1
/mm
θγβRH
/mm
NLp
/mm
χsNup or
Nu/kN
ks
P210p105-30-14-0.5-HAR0N07.5630140.500515.9501073.02
P210p105-40-14-0.5-HAR0N07.564000433.450741.70
P210p105-50-14-0.5-HAR0N07.565000388.460526.75
P210p105-30-14-0.5-HAR2N127.5630140.5212515.950.0931054.890.983
P210p105-30-14-0.5-HAR4N127.56412515.950.1861028.300.958
P210p105-30-14-0.5-HAR6N127.56612515.950.279996.930.929
P210p105-30-14-0.5-HAR8N127.56812515.950.372959.200.894
P210p105-40-14-0.5-HAR2N127.5640140.5212433.450.111721.880.973
P210p105-40-14-0.5-HAR4N127.56412433.450.221701.100.945
P210p105-40-14-0.5-HAR6N127.56612433.450.332674.960.910
P210p105-40-14-0.5-HAR8N127.56812433.450.443643.890.868
P210p105-50-14-0.5-HAR2N127.5650140.5212388.460.124511.080.970
P210p105-50-14-0.5-HAR4N127.56412388.460.247491.490.933
P210p105-50-14-0.5-HAR6N127.56612388.460.371473.060.898
P210p105-50-14-0.5-HAR8N127.56812388.460.494445.850.846
Table 6. Variation of corrosion discount factor ks with coherent corrosion rate χs for different chord diameter-to-thickness ratio γ.
Model Namet0/mmt1/mmθγβRH/mmNLp/mmχsNup or Nu/kNks
P210p105-40-10-0.5-HAR0N010.58.440100.500433.4501268.99
P210p105-40-12.5-0.5-HAR0N08.46.7212.500433.450889.28
P210p105-40-15-0.5-HAR0N075.61500433.450663.90
P210p105-40-17.5-0.5-HAR0N064.817.500433.450517.25
P210p105-40-20-0.5-HAR0N05.254.22000433.450416.49
P210p105-40-10-0.5-HAR2N1210.58.440100.5212433.450.1111241.610.978
P210p105-40-10-0.5-HAR4N1210.58.4412433.450.2211210.270.954
P210p105-40-10-0.5-HAR6N1210.58.4612433.450.3321168.150.921
P210p105-40-10-0.5-HAR8N1210.58.4812433.450.4431105.250.871
P210p105-40-12.5-0.5-HAR2N128.46.724012.50.5212433.450.111866.620.975
P210p105-40-12.5-0.5-HAR4N128.46.72412433.450.221842.740.948
P210p105-40-12.5-0.5-HAR6N128.46.72612433.450.332812.380.914
P210p105-40-12.5-0.5-HAR8N128.46.72812433.450.443774.230.871
P210p105-40-15-0.5-HAR2N1275.640150.5212433.450.111645.910.973
P210p105-40-15-0.5-HAR4N1275.6412433.450.221626.840.944
P210p105-40-15-0.5-HAR6N1275.6612433.450.332603.100.908
P210p105-40-15-0.5-HAR8N1275.6812433.450.443575.420.867
P210p105-40-17.5-0.5-HAR2N1264.84017.50.5212433.450.111503.270.973
P210p105-40-17.5-0.5-HAR4N1264.8412433.450.221488.030.944
P210p105-40-17.5-0.5-HAR6N1264.8612433.450.332468.990.907
P210p105-40-17.5-0.5-HAR8N1264.8812433.450.443447.540.865
P210p105-40-20-0.5-HAR2N125.254.240200.5212433.450.111405.000.972
P210p105-40-20-0.5-HAR4N125.254.2412433.450.221392.280.942
P210p105-40-20-0.5-HAR6N125.254.2612433.450.332382.270.918
P210p105-40-20-0.5-HAR8N125.254.2812433.450.443359.740.864
Table 7. Variation in corrosion discount factor ks with coherent corrosion rate χs for different web chord diameter ratio β.
Model Namet0
/mm
t1
/mm
θγβRH
/mm
NLp
/mm
χsNup or Nu/kNks
P210p105-40-14-0.5-HAR0N07.5640140.40000602.33
P210p105-40-14-0.5-HAR12N27.5640140.50000741.7
P210p105-40-14-0.5-HAR12N47.5640140.60000892.57
P210p105-40-14-0.5-HAR12N67.5640140.700001103.21
P210p105-40-14-0.5-HAR12N87.5640140.4212344.590.139582.360.967
P210p105-40-14-0.5-HAR4N67.5640140.4412344.590.279557.110.925
P210p105-40-14-0.5-HAR8N67.5640140.4612344.590.418526.470.874
P210p105-40-14-0.5-HAR12N67.5640140.4812344.590.557489.360.812
P210p105-40-14-0.5-HAR16N67.5640140.5212433.450.111721.880.973
P210p105-40-14-0.5-HAR0N07.5640140.5412433.450.221701.10.945
P210p105-40-14-0.5-HAR12N27.5640140.5612433.450.332674.960.910
P210p105-40-14-0.5-HAR12N47.5640140.5812433.450.443643.890.868
P210p105-40-14-0.5-HAR12N67.5640140.6212524.640.091871.870.977
P210p105-40-14-0.5-HAR12N87.5640140.6412524.640.183852.710.955
P210p105-40-14-0.5-HAR4N67.5640140.6612524.640.274827.830.927
P210p105-40-14-0.5-HAR8N67.5640140.6812524.640.366799.510.896
P210p105-40-14-0.5-HAR12N67.5640140.7212619.410.077752.060.978
P210p105-40-14-0.5-HAR16N67.5640140.7412619.410.1551036.320.959
P210p105-40-14-0.5-HAR0N07.5640140.7612619.410.2321031.40.935
P210p105-40-14-0.5-HAR12N27.5640140.7812619.410.3101000.150.907
Table 8. Variation in corrosion discount factor ks with coherent corrosion rate χs for different numbers and diameters of corrosion pits.
Model Namet0/mmt1/mmθγβRH/mmNLp/mmχsNup or Nu/kNks
P210p105-40-14-0.5-HAR0N07.5640140.500741.70
P210p105-40-14-0.5-HAR12N27.5640140.5122433.450.111721.880.973
P210p105-40-14-0.5-HAR12N47.5640140.5124433.450.221701.100.945
P210p105-40-14-0.5-HAR12N67.5640140.5126433.450.332674.960.910
P210p105-40-14-0.5-HAR12N87.5640140.5128433.450.443643.890.868
P210p105-40-14-0.5-HAR4N67.5640140.546433.450.111719.840.971
P210p105-40-14-0.5-HAR8N67.5640140.586433.450.221696.000.938
P210p105-40-14-0.5-HAR12N67.5640140.5126433.450.332674.960.910
P210p105-40-14-0.5-HAR16N67.5640140.5166433.450.443649.290.875
Disclaimer/Publisher’s Note: The statements, opinions and data contained in all publications are solely those of the individual author(s) and contributor(s) and not of MDPI and/or the editor(s). MDPI and/or the editor(s) disclaim responsibility for any injury to people or property resulting from any ideas, methods, instructions or products referred to in the content.