Article

Study on Physical Properties and Bearing Capacity of Quaternary Residual Sand for Building Foundations: A Case Study of Beaches in Quanzhou, China

1
Research Center of Applied Geology of China Geological Survey, Chengdu 610036, China
2
Engineering College, China University of Geosciences, Wuhan 430074, China
*
Authors to whom correspondence should be addressed.
Buildings 2025, 15(17), 3104; https://doi.org/10.3390/buildings15173104
Submission received: 4 July 2025 / Revised: 21 August 2025 / Accepted: 24 August 2025 / Published: 29 August 2025
(This article belongs to the Topic Resilient Civil Infrastructure, 2nd Edition)

Abstract

This study addresses engineering challenges associated with sandy residual deposits in the coastal zone of Quanzhou, China, characterized by high void ratios (e > 0.8), low cohesion (c < 10 kPa), and strong liquefaction tendencies induced by marine dynamic forces. Focusing on the beach sands of Shenhu Bay and Qingshan Bay, 123 in situ dynamic penetration tests and 12 laboratory physical–mechanical tests (including water content, particle gradation, relative density, and triaxial shear strength) were conducted. The correlations between the physical and mechanical properties of these coastal sandy soils and their foundation bearing capacity were systematically analyzed. Results reveal that the sands, predominantly medium-to-fine grains with 8–15% biogenic debris, are generally in a loose-to-medium dense state (relative density ~34%), with negligible cohesion. Shear strength depends primarily on the internal friction angle (28.89–37.43°). Correlation analyses show that water content (17.8–31.92%) and particle gradation parameters (uniformity coefficient Cu and curvature coefficient Cc) significantly influence bearing capacity, with bearing capacity increasing by 12.15% per 14.12% rise in water content and 35% per 0.518 increase in Cc. An improved foundation bearing capacity model based on the Prandtl–Reissner theory is proposed by integrating particle gradation and water content, tailored for beach foundations in Quanzhou. Model validation demonstrates an average error of approximately 15%, outperforming traditional models. These findings provide valuable theoretical support for assessing foundation stability in building construction projects in Quanzhou and similar coastal regions.

1. Introduction

With the rapid development of China’s coastal economy, construction intensity in coastal zones has steadily increased, causing significant changes in land-use spatial patterns [1,2] Quanzhou, located along the southeastern coast of Fujian Province, is extensively underlain by Quaternary sandy residual deposits in its coastal zone. With the continuous development of coastal tourism facilities within the beach belt, engineering construction has increasingly concentrated on beaches, where certain heavy amusement structures may require foundation bearing capacities of up to 500 kPa. However, the Quaternary sandy residual deposits extensively distributed in Quanzhou’s coastal zone face significant geotechnical challenges under the influence of the subtropical maritime monsoon climate: Quanzhou Bay is characterized by strong tidal currents and reciprocating tides [3]. Long-term marine dynamics (tides, waves) have caused structural degradation of the sandy soil layers, reflected by high void ratios (e > 0.8), low cohesion (c < 10 kPa), and pronounced liquefaction susceptibility (standard penetration test blow count N < 10). Compared with typical coastal depositional sands, these residual sandy deposits are characterized by loose structures and poor cementation, making them highly susceptible to sharp strength reductions and uneven settlement under coupled loading and cyclic dynamic forces. As a result, traditional foundation bearing capacity calculation methods in engineering exhibit error rates as high as 30–50%. In addition, sandy residual layers are highly prone to liquefaction or sliding under extreme conditions, such as typhoons, heavy rainfall, and earthquakes. Without effective reinforcement and risk assessment, overall foundation instability may occur, posing threats to the safety of superstructures. Engineering cases have shown that this risk is not merely theoretical. For instance, in 2021, the foundation of a drop tower ride in a coastal attraction triggered a safety alarm due to uneven settlement (maximum differential settlement of 12 mm), highlighting the urgent necessity of stability studies on sandy soil foundations. Therefore, systematically analyzing the correlation mechanisms between the physical–mechanical properties of sandy soils in Quanzhou’s coastal zone and their foundation bearing capacity holds significant practical importance.
Extensive domestic and international research has addressed the physical and mechanical properties of sandy soils. Ref. [4] measured the initial characteristics (particle density, shape, particle size distribution) and index properties (maximum/minimum void ratio, crushability, angle of internal friction) of approximately 200 materials. Their data analysis revealed quantitative relationships between initial characteristics and index properties, highlighting the significant influence of soil physical–chemical properties and environmental factors on mechanical behavior. Physical properties can be categorized into initial characteristics (permanent parameters such as particle density, shape, particle size distribution) and secondary characteristics (variable parameters such as void ratio and density). Ref. [5] reported that fine-grained soils in China’s Zhejiang–Fujian coastal area predominantly consist of silt and silty clay, with minor clayey silt and clay content. These soils exhibit high water content, void ratio, compressibility, and plasticity and low shear strength. Ref. [6] conducted compression tests on calcareous sands of different gradations and observed that coarse particles (5–1 mm) are significantly angular, while medium particles (1–0.25 mm) are mostly dendritic and platy. They proposed an empirical formula to evaluate compressibility based on coarse particle content. Ref. [7] proposed a unified formula for the small-strain shear modulus of sandy soils based on extreme void ratios, further strengthening the quantitative framework linking microstructural parameters to macroscopic stiffness. Ref. [8] conducted relative density tests and direct shear tests on different sand samples to determine the ultimate void ratio and shear strength parameters. Ref. [9] found that compacted silt under natural moisture shows superior physical–mechanical properties, strength, and stiffness, and that variations in water content more significantly affect strength and deformation than in undisturbed silt. Recent studies have further revealed the effects of special components and modification processes on the properties of sandy soils. For example, a research team from Hainan University (2025) [10] demonstrated through cyclic triaxial tests that the damping ratio of organic matter–dispersed sand (OMDS) can reach 17.2%, with prediction errors of the traditional Hardin–Drnevich model exceeding 35%, highlighting the significant regulatory role of organic matter on the dynamic behavior of sandy soils. Ref. [11] developed a statistical damage constitutive model for MICP-reinforced calcareous sands, showing that with every 1.5% increase in calcium carbonate content, the damage rate of sands rose by approximately 20%, accompanied by pronounced strain-softening behavior, reflecting the profound influence of biocementation processes on the structural evolution of sandy soils. Refs. [12,13] conducted biaxial tests and discrete element simulations on particle samples with different angularities. The results showed that greater angularity can induce local stress concentrations between particles, thereby increasing shear strength. In contrast, particles with lower angularity reduce local stress concentrations and may lead to interparticle sliding and shearing, resulting in reduced shear strength. Ref. [14] confirmed that dynamic penetration tests reliably estimate the deformation modulus and bearing capacity of deep foundations in large dams in western China. Ref. [15] revealed that flat and angular coral sand particles increase the internal friction angle, enhancing bearing capacity, and established quantitative relationships between bearing capacity factors and the friction angle. Ref. [16] measured the physical and mechanical properties of coastal sandy soils in Padang City, Indonesia, showing the sands to be predominantly fine, loosely packed, and poorly graded, with liquefaction risks. Ref. [17] prepared particles of different shapes using a stainless-steel crushing device and investigated the influence of particle shape on the internal friction angle. Collectively, these studies illustrate that sands with differing physical–mechanical properties exhibit distinct engineering behaviors, which are critical for safe building foundation design.
The physical and mechanical properties of sandy soils directly affect their foundation bearing capacity. Ref. [18] proposed the Terzaghi bearing capacity formula, quantifying the effect of internal friction angle on bearing capacity. Ref. [19] experimentally verified that increased cohesion significantly improves bearing capacity. Ref. [20] developed a formula indicating that well-graded sands can increase the friction angle by 2–4° due to particle interlocking, impacting bearing capacity calculations. Ref. [21] conducted experimental studies on shape and depth factors of footings in sand, demonstrating how foundation geometry significantly influences load–displacement responses and failure mechanisms. Ref. [22] showed that for clay foundations, bearing capacity decreases significantly as water content rises from optimum to the liquid limit. Relative density and internal friction angle are key mechanical parameters influencing sandy soil bearing capacity. Ref. [23] established via regression analysis of standard penetration test (SPT-N) data that when relative density rises from 30% to 70%, the internal friction angle increases by 4–6°, corresponding to a 30–40% increase in the characteristic foundation bearing capacity. Ref. [24] further analyzed the combined effects of relative density and particle morphology on the bearing capacity and collapse mechanisms of strip footings in sand, reinforcing the critical role of density–shape interaction in practical design. The Liu–Carter model [25] found that undisturbed clay’s compression modulus is 20–30% higher than that of remolded clay, with slower void ratio reduction under stress, resulting in a 15–25%-higher plastic limit load for highly structured soil, implying that highly compressible soils require a 20–30% bearing capacity reduction in their design. Ref. [26] demonstrated that every 10% increase in plasticity index raises cohesion by 3–5 kPa, while the internal friction angle slightly decreases (1–2°) for low-liquid-limit soils, with increased particle cementation near the plastic limit enhancing ultimate bearing capacity by 20–25%. Ref. [27] quantified foundation size effects on sandy soil relative density, finding that when the ratio of foundation width to average sand particle size (D50) exceeds 50, every 10% relative density increase raises the ultimate bearing capacity correction factor by 0.1–0.15, with correction errors controlled within ±12%.
However, most existing research has focused on standard or river sands, with limited data on coastal sandy soils containing biogenic debris (sand-sized particles of biological origin, primarily including fragmented shells, coral remains, and other calcareous skeletal materials. These components are typically angular to sub-angular with a high calcium carbonate content, which can modify particle shape, surface roughness, and pore structure, thereby influencing soil density, permeability, and shear strength) and salt, and a lack of comprehensive in situ testing. Ref. [28] investigated the load response and soil displacement field for a vertically loaded half-strip footing in sand, providing further insights into conventional quartz sand behavior under controlled conditions, which contrasts with the more complex nature of coastal bioclastic sands. To date, no systematic study has been reported on the physical–mechanical properties of sandy soils in the Quanzhou coastal zone. Thus, this study selects Quaternary residual sands from the beaches of Shenhu Bay and Qingshan Bay to systematically investigate their physical and mechanical properties and relationships to foundation bearing capacity, using in situ testing, laboratory experiments, and theoretical modeling. The results aim to support safe building foundation design for coastal engineering projects in Quanzhou and similar regions.

2. Overview of the Study Area

The study area is located in the southeastern part of Fujian Province, at the southeastern margin of the Eurasian Plate, adjacent to the Western Pacific Plate. It is a crucial component of the circum-Pacific continental margin tectonic activity belt and lies entirely within the Mesozoic magmatic belt of the southeastern coast. The region is characterized by intense magmatic intrusion activities, with the widespread development of intermediate-acid to acid intrusive rocks from the Middle-Late Yanshanian period as a prominent feature. The overall terrain is relatively gentle, with higher elevations in the southeastern coastal and northwestern regions, which serve as concentrated areas of monadnock tablelands, while the central and coastal areas are lower, being predominantly composed of plains and low tablelands. The northwestern monadnock area has the highest terrain. The area features diverse geomorphic types, with well-developed tectonic landforms, aeolian landforms, and coastal landforms. Aeolian landforms, “rias-type” coastal landforms, and lateritic platform landforms are particularly typical. The geomorphic outline is significantly controlled by regional structures, especially NE-trending structures, while sea-level changes and exogenic geological processes have played important roles in shaping the geomorphic types of this region. Figure 1 shows the area where sand samples were taken.
The study area is located between 24°22′–25°56′ N latitude and 117°34′–119°05′ E longitude, with the altitude mostly ranging from 10 to 100 m. The sandy beaches are mainly distributed in the 0–10 m altitude zone. The area is characterized by a subtropical maritime monsoon climate, with an average annual rainfall of approximately 1000 mm. The rainfall intensity is highest from July to August and lowest from November to January of the following year, with significant interannual variations in precipitation. The tides in the study area are of the regular semidiurnal tide type. The tidal currents are rectilinear currents, with the flow direction within coastal bays generally consistent with the trend of the bays. In the waters of the Taiwan Strait outside the coastal bays, the flood and ebb current directions are nearly northeast–southwest, which is basically consistent with the trend of the bathymetric contour lines. In the strong tide area, the tidal range is significant, with a maximum tidal range of approximately 6.52 m, an average tidal range of 4.23–4.52 m, and a minimum tidal range of approximately 1.9 m. The annual prevailing wind direction and wave direction are mainly north–northeast (NNE), northeast (NE), and south-southwest (SSW) The coastal sandy soils in the study area are mostly medium sand and fine sand, partially containing coarse sand gravel and quartz particles, and often contain biogenic debris.
The mechanical properties of Quanzhou coastal sandy soils exhibit significant regional variability and environmental sensitivity, primarily manifested in the following aspects: First, the sandy soil foundations in the Quanzhou coastal zone have long been subjected to tidal and wave actions, with the daily fluctuation amplitude of the groundwater level reaching 2–3 m. This periodic variation causes dynamic changes in the effective stress and pore water pressure of the sandy soils, thereby influencing their shear strength and bearing capacity. Studies have shown that tidal action may reduce the bearing capacity of sandy soil foundations by 20–30%, particularly during high tide, when local liquefaction of sandy soils is more likely to occur. Second, Quanzhou coastal sandy soils contain a large amount of shell debris and coral fragments, with contents ranging from 8 to 15%. These biogenic debris exhibit angular morphologies, leading to stronger particle interlocking compared to standard quartz sand. Third, significant differences exist in the properties of sandy soils across different regions of the Quanzhou coast. For example, the sandy soils along the Chongwu Coast are predominantly medium-coarse sands with high shell debris content; the sandy soils in Xisha Bay and Qingshan Bay are mainly fine sands with more coral fragments; and the sandy soils in Shenhu Bay are predominantly medium sands with more shell debris. Fourth, beach sands are generally eroded by seawater and contain high salinity, which can lead to an increase in micro-pores within the sandy soils and a decrease in mechanical strength. Such regional differences result in uneven distributions of mechanical properties and foundation bearing capacity. Previous studies have indicated that the physical and mechanical properties of sandy soils, which are key factors determining foundation bearing capacity, mainly include grain size distribution, water content, relative density, liquid limit, plastic limit, compression modulus, compression coefficient, angle of internal friction, etc. These parameters are interrelated and collectively influence the engineering performance of sandy soil foundations.

3. Test Methods

3.1. Foundation Bearing Capacity Test

Due to the fact that most beach amusement facilities adopt shallow foundations, the sandy soils on the beach serve as the main bearing stratum. Dynamic penetration has been widely applied in geotechnical engineering practices for foundation design [29,30], so the bearing capacity of sandy soils was tested with emphasis. In the in situ testing, a light dynamic penetration test (DCT) was used to obtain the bearing capacity of the beach sandy soil foundation. The light dynamic penetrometer is composed of three parts: a conical probe, a drill rod, and a drop hammer. The top of the drill rod is equipped with a conical probe and connected to the drop hammer. During operation, we first ensured that the drill rod was vertical, and then let the drop hammer freely fall from a height of 50 cm to strike the bottom of the drill rod (as shown in Figure 2). When the drill rod penetrated the soil to a depth of 30 cm, the number of hammer blows was recorded. If the number of blows reached 100 times for 30 cm penetration, or exceeded 50 times when penetrating 15 cm, the test was terminated. A total of 123 light dynamic penetration tests were conducted. The specific parameters of the light dynamic penetrometer used in this study are shown in Table 1.
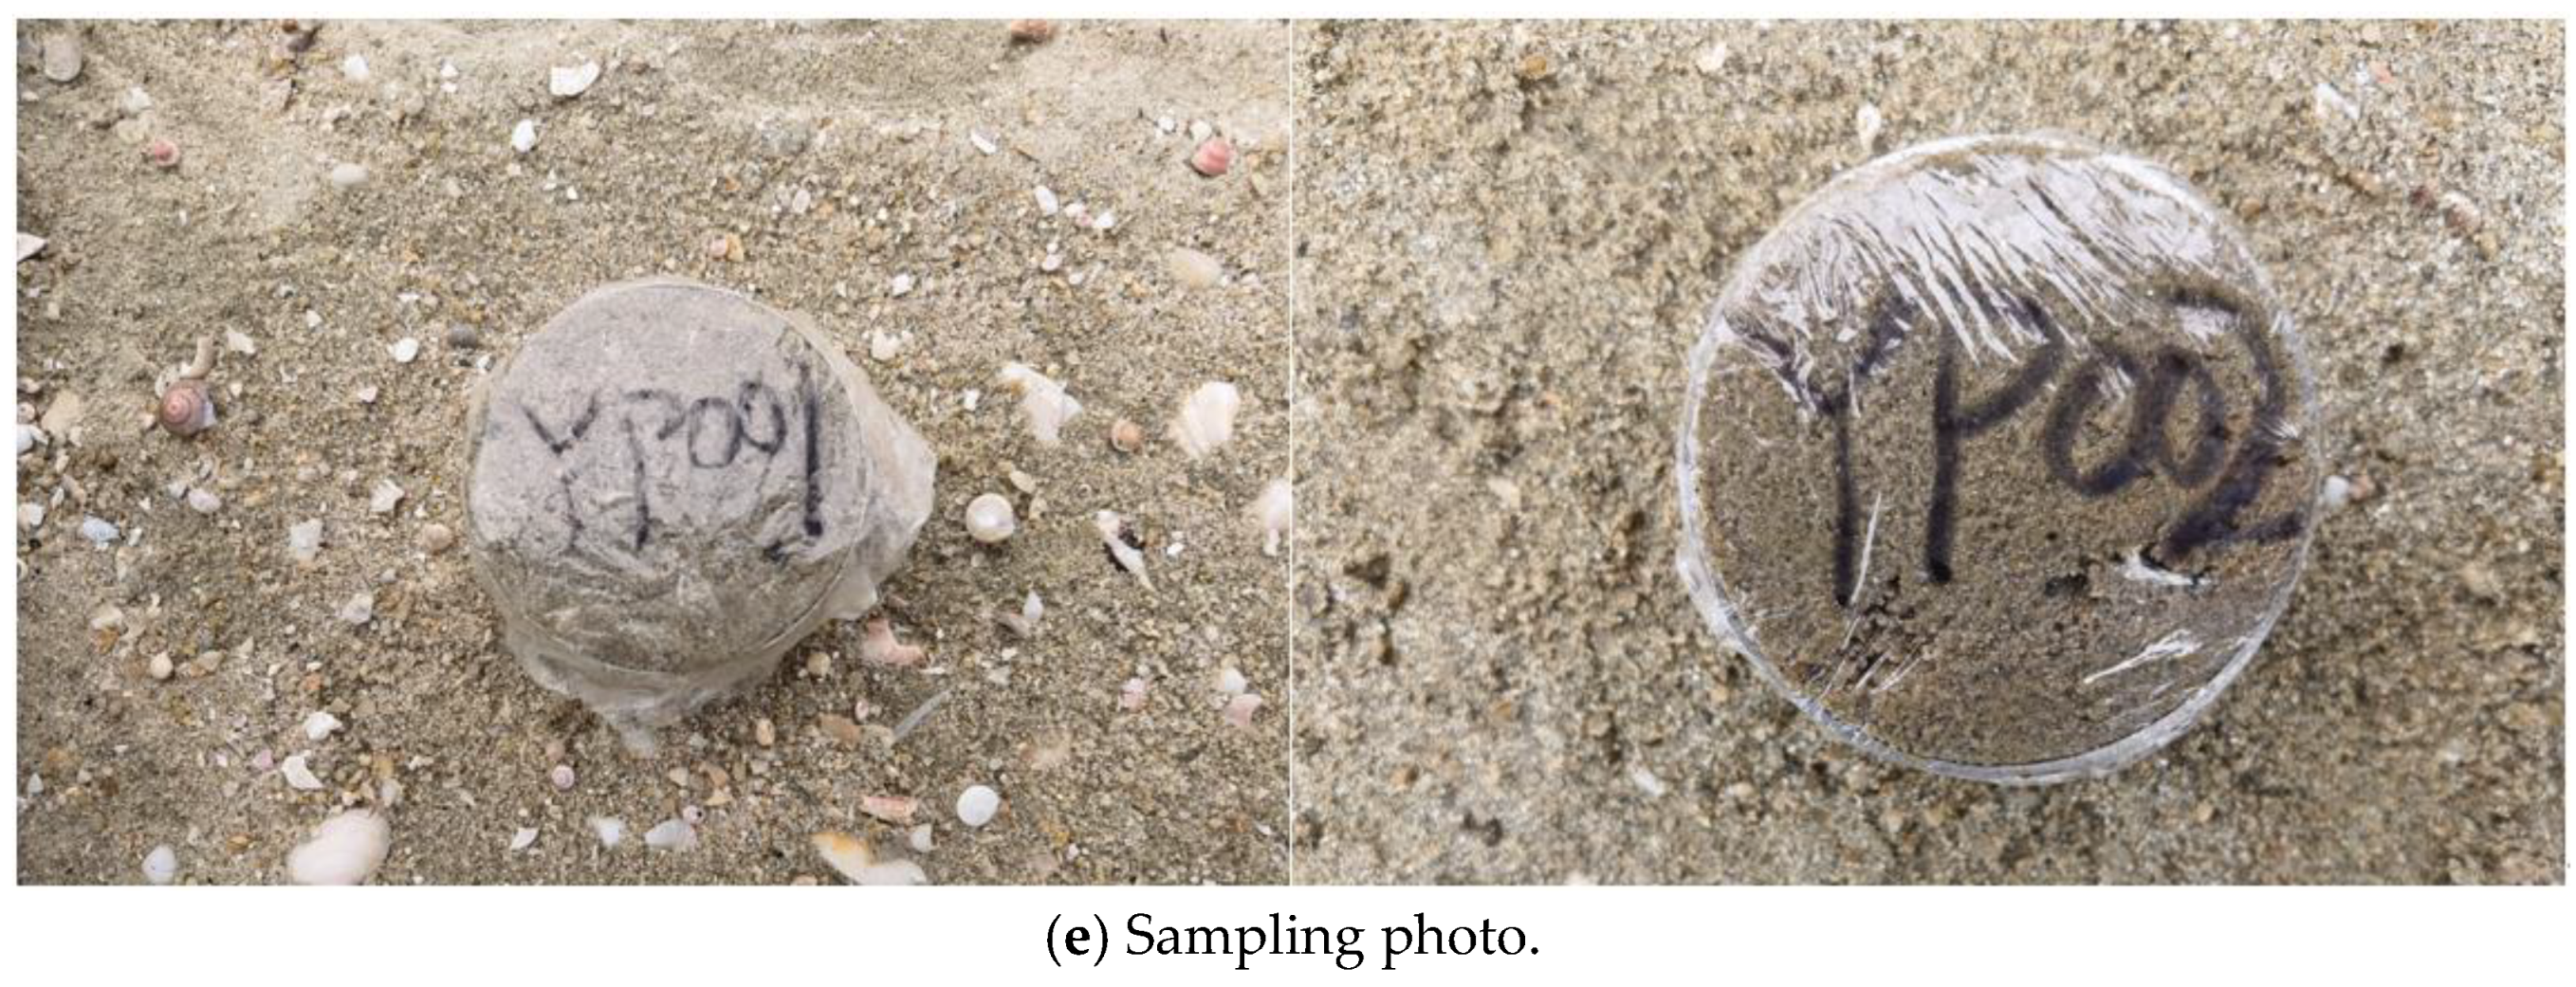
After completing the bearing capacity tests in the field, sand samples were excavated from a depth of 30 cm below the surface at different beach locations for laboratory mechanical property tests. To ensure the representativeness of the test results, the sampling areas in this study covered different positions along coastal beaches and shore zones, including the nearshore, foreshore, and inland depositional environments. Sampling Points 1–8 were located in Shenhu Bay, and Points 9–15 were located in Qingshan Bay. The geological conditions of the sampling points varied significantly, as follows: Point 1 was located in the nearshore area, where the beach surface was moist and stratification was observed in the subsurface soil; shallow footprints were left after stepping, and the sample was poorly graded medium sand. Point 2 was situated between the nearshore and the foreshore, with a water layer covering the surface; deep footprints were formed during sampling, and the pit collapsed easily; the sample was poorly graded fine sand. Point 3 was close to the shoreline, where the soil exhibited distinct stratification; the surface was moist and relatively firm, and the sample consisted of poorly graded medium-fine sand. Point 4, farther from the shoreline than Point 3, yielded fine sand samples; dynamic penetration test results indicated a density approximately twice that of Point 3, though the gradation remained poor. Points 5 and 6 were located in a dry sandy gravel area farther inland, where no footprints were left after stepping and no stratification was observed; the samples were poorly graded fine sands. Point 7, distributed parallel to Point 6, showed noticeable footprints after stepping, with no stratification observed, and the sample was poorly graded. Point 8 was sampled after ebb tide, where the surface was moist, footprints were deep, and the sample was poorly graded medium sand. Point 9 was located near the estuary of Qingshan Bay, with the surface covered by water; shallow footprints formed after stepping, and the sample was poorly graded medium sand. Points 10–15 were distributed in the coastal and inland zones of Qingshan Bay; the samples were generally poorly graded, mostly medium sand, with occasional coarse gravel and quartz particles; the surfaces were predominantly dry, and no obvious footprints were observed after stepping. Point 15 was approximately the same distance from the shoreline as Point 13-2.

3.2. Water Content Test

In this study, the oven-drying method was used to measure the water content of sandy soils. An electric thermostatic blast drying oven was selected, and the sand samples collected in the field were placed in the oven at 105 °C and dried to constant weight, so that all free water and hygroscopic water in the sand were removed. The actual water content was calculated using the following formula:
ω = m m s 1 × 100 %
where  ω is the water content (%);  m is the mass of wet sandy soil (g); and  m s is the mass of dry sandy soil (g).

3.3. Particle Size Distribution Test

In this study, the sieve analysis method was used to determine the particle size composition of sandy soils, and a particle size distribution curve of sandy soils was plotted. The test sieves used are shown in Figure 3. The test sieves were fine sieves, with aperture sizes from top to bottom being 2.0 mm, 1.0 mm, 0.5 mm, 0.25 mm, 0.1 mm, and 0.075 mm. The gradation indices, coefficient of uniformity (Cu), and coefficient of curvature (Cc) were calculated using the following formulas:
C u = d 60 d 10
C c = d 30 2 d 60 d 10
where  C u is the coefficient of uniformity,  C c is the coefficient of curvature,  d 60 is the particle size at which 60% of the soil mass is smaller than this particle size on the particle size distribution curve,  d 30 is the particle size at which 30% of the soil mass is smaller than this particle size on the particle size distribution curve, and  d 10 is the particle size at which 10% of the soil mass is smaller than this particle size on the particle size distribution curve.

3.4. Relative Density Test

The relative density test included the minimum dry density test and the maximum dry density test, where the minimum dry density test was carried out using the funnel method and cylinder method, and the maximum dry density test was conducted using the vibration hammer method. The relative density Dr was obtained using the measured minimum dry density  ρ d min and maximum dry density  ρ d max :
D r = ( ρ d ρ d min ) ρ d max ( ρ d max ρ d min ) ρ d
where  ρ d is the dry density of sandy soil under natural conditions.

3.5. Liquid and Plastic Limit Tests

The combined liquid and plastic limit test is defined as a method by which the depth of cone penetration is measured for a soil sample at three different water content states, a relationship curve between cone penetration depth and water content is plotted, and then the liquid limit and plastic limit values are obtained from the curve.

3.6. Consolidation Test

By simulating the consolidation process of soil under load, measuring the settlement and compression, the consolidation characteristics and deformation characteristics of the soil were evaluated. Soil samples were placed in a consolidometer, pressure was applied in incremental stages, settlement over time was recorded, a relationship curve between void ratio (e) and unit pressure (p) was plotted, and indicators such as compression coefficient and compression modulus were calculated.

3.7. Triaxial Shear Test

Test sand samples were placed in a triaxial pressure chamber, where different levels of confining pressure and axial pressure were applied to determine the stress–strain relationship and failure mode of the sand samples during shear, thereby evaluating the shear strength and deformation characteristics of the soil. The samples were subjected to confining pressure in the triaxial pressure chamber and underwent axial loading, with axial strain and shear force recorded. The angle of internal friction (φ) and cohesion (c) were calculated based on the test data.

4. Analysis of Test Results

4.1. Physical and Mechanical Properties

(1)
Bearing Capacity and Water Content Characteristics of Sandy Soils at Different Beach Locations.
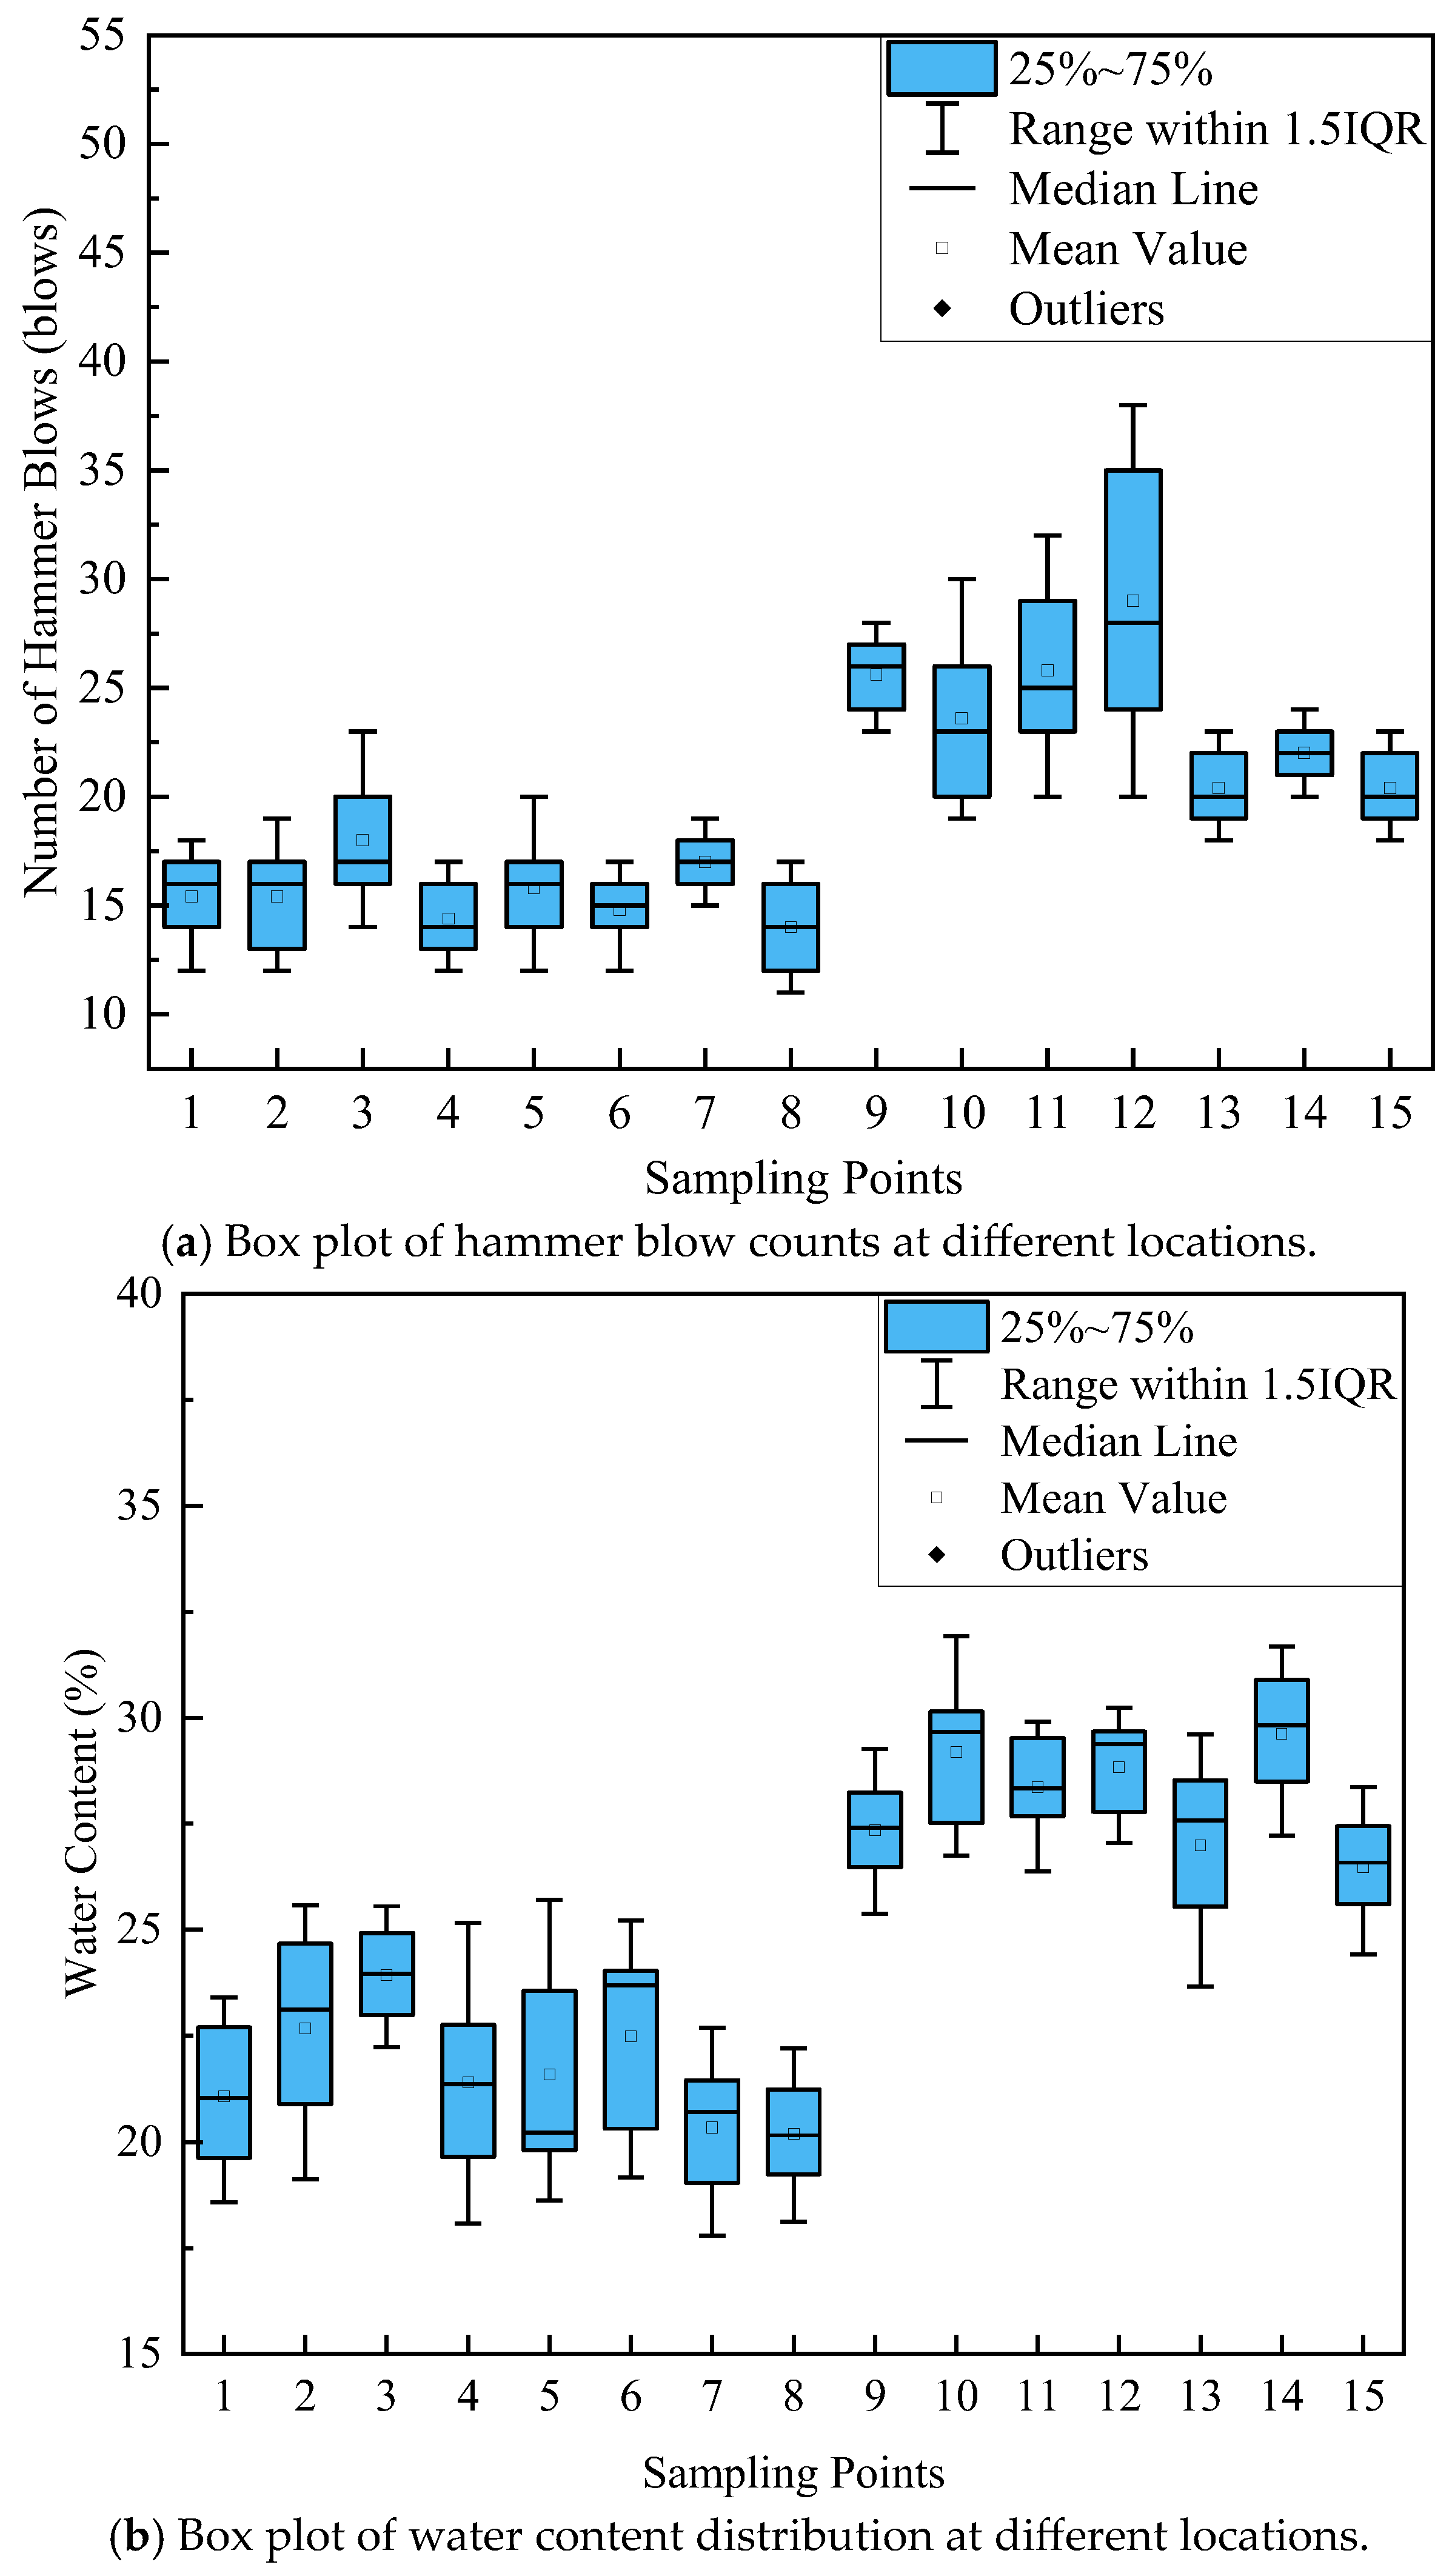
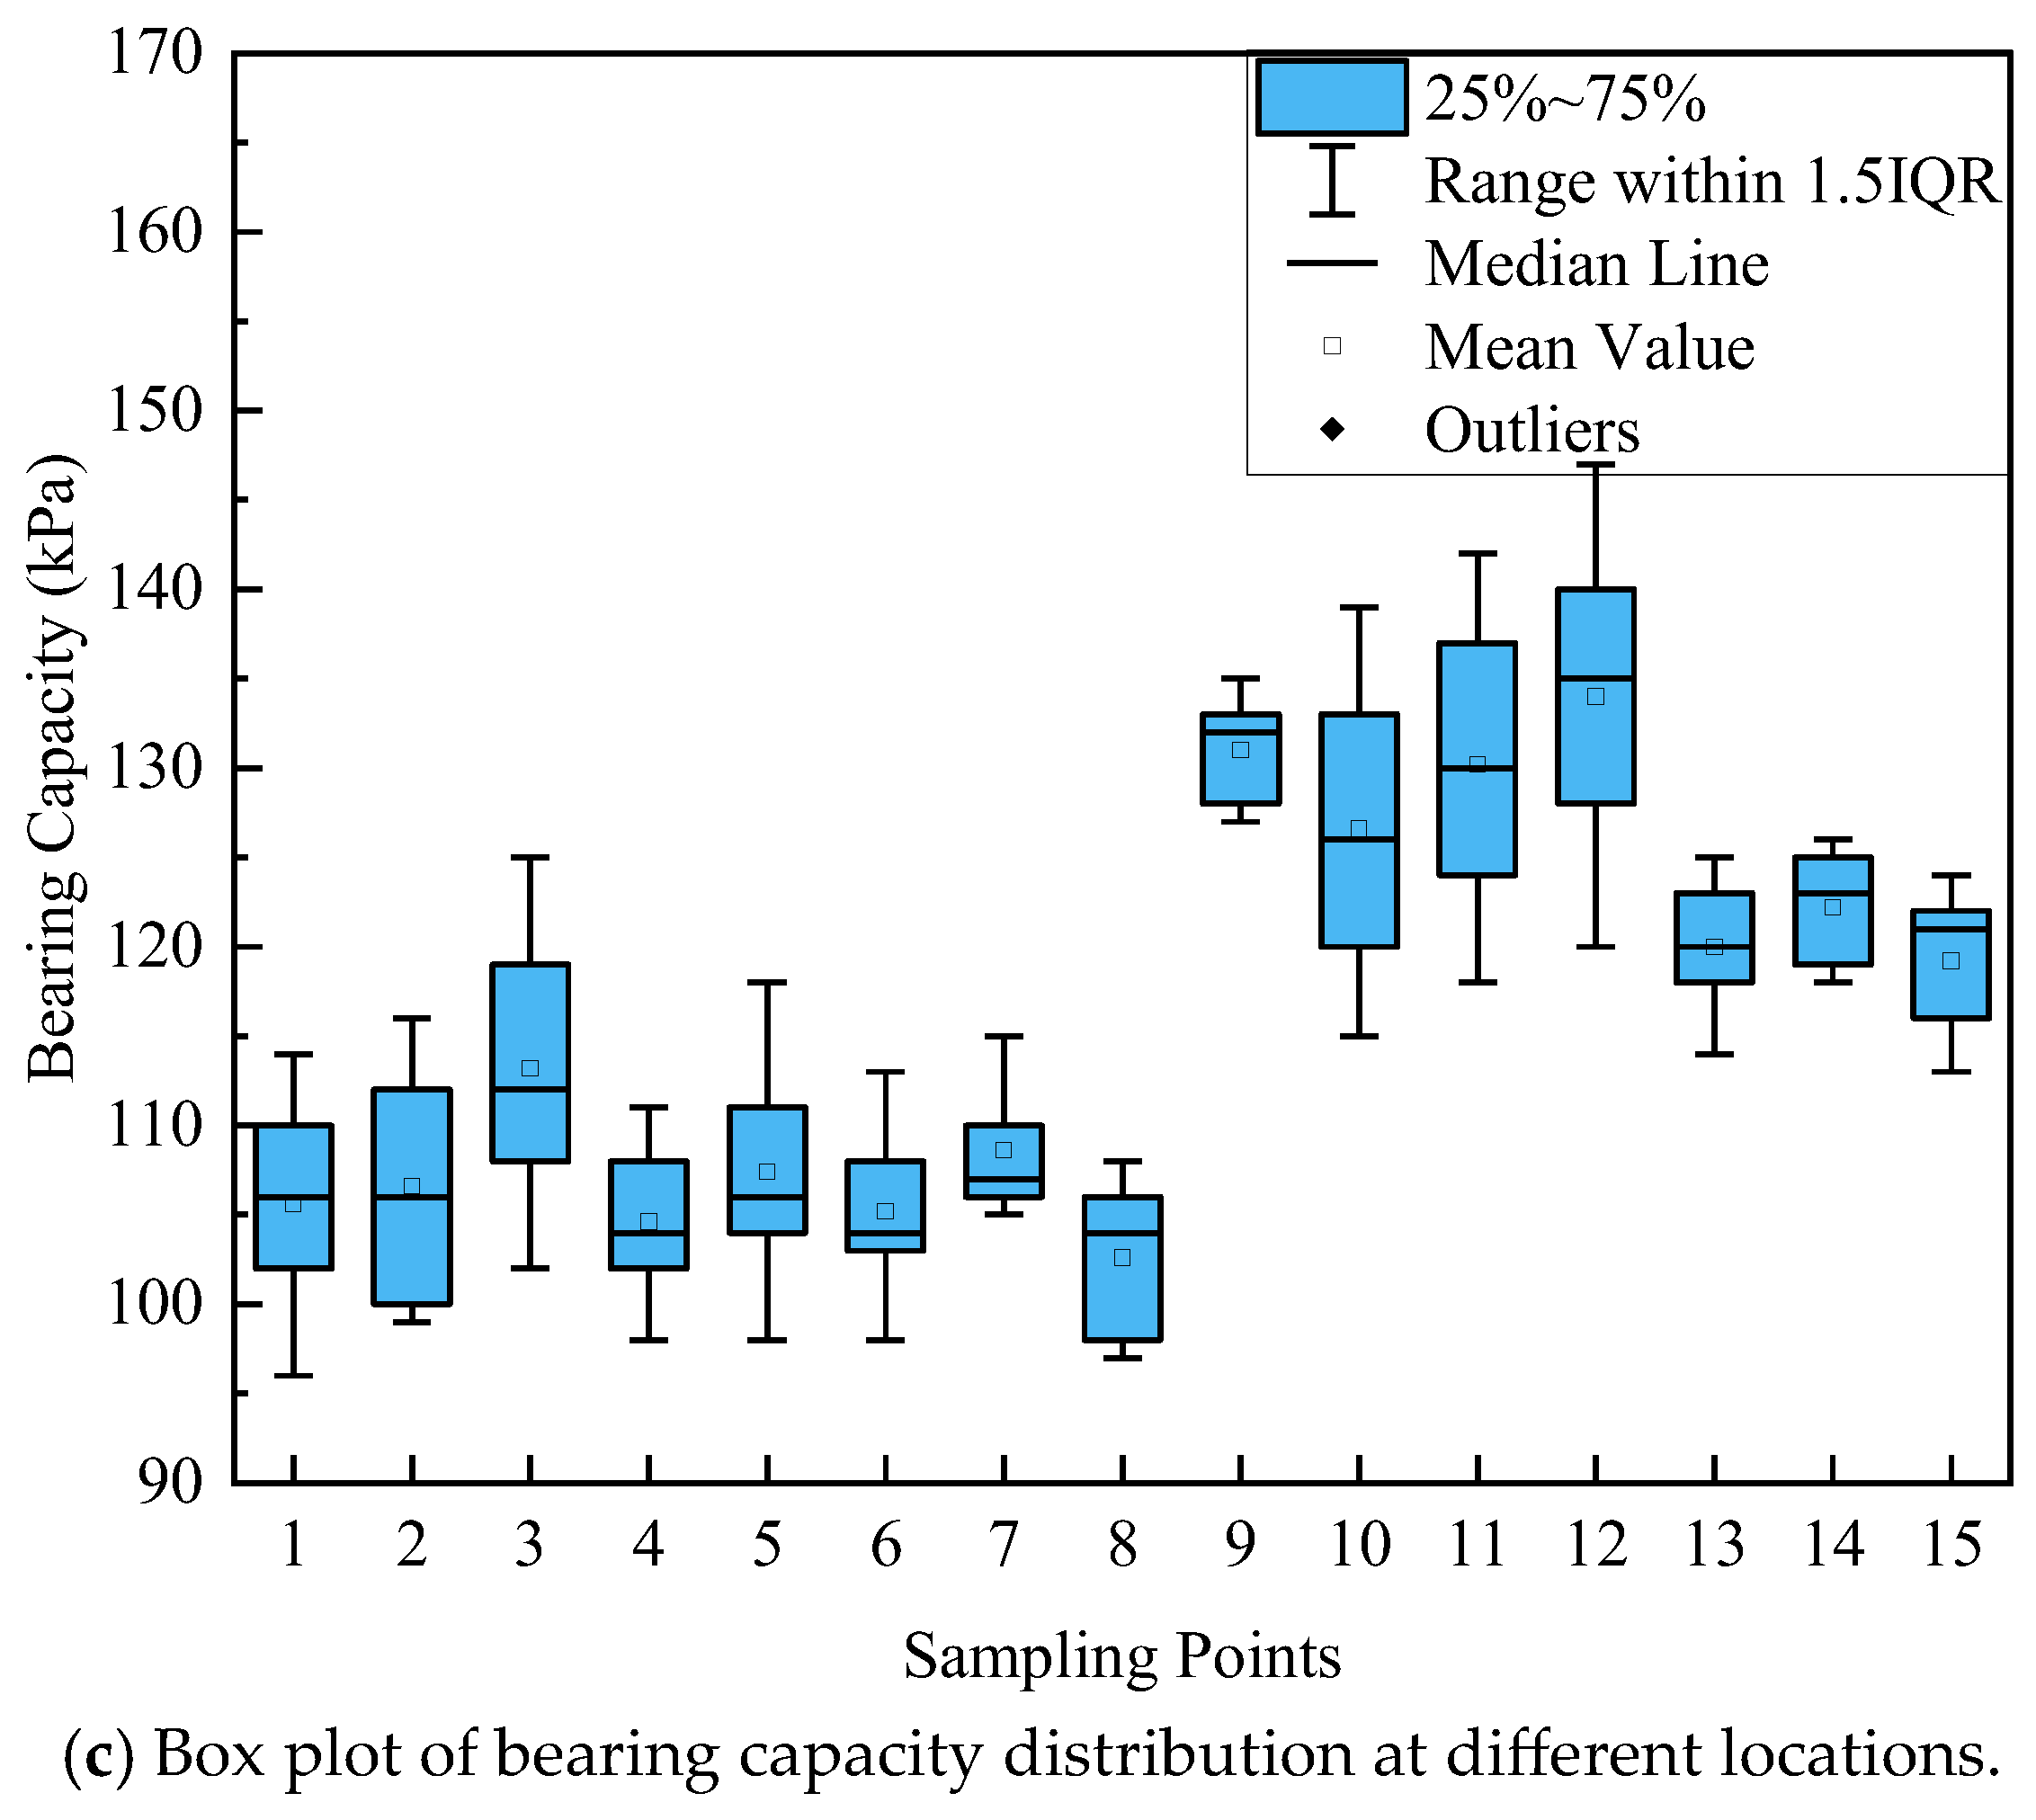
Figure 4 plots the water content and bearing capacity of sandy soils at different beach locations. As shown in Figure 4, the average number of blows from the light dynamic penetration test on Shenhu Bay beach sandy soils is 16, with an average foundation bearing capacity of 106.73 kPa and an average water content of 21.71%. The average number of blows for Qingshan Bay beach sandy soils is slightly greater than 16, with an average foundation bearing capacity of 126.17 kPa and an average water content of 28.12%. Overall, the bearing capacity of sandy soils slightly increases with increasing water content. When the water content increases from 17.8% to 31.92%, the bearing capacity increases from 107 kPa to 120 kPa, representing a 12.15% increase rate.
(2)
Particle Gradation Characteristics of Sandy Soils at Different Beach Locations.
Figure 5 shows the particle gradation characteristics of sandy soils at different beach locations. As can be seen from the figure, most Shenhu Bay samples are poorly graded medium sands, with some being poorly graded fine sands. The coefficient of uniformity Cu ranges from 1.5 to 2.018, with an average of 1.776; the coefficient of curvature Cc ranges from 0.857 to 1.145, with an average of 0.98. Shenhu Bay samples exhibit a wide range of Cu values and poor sorting, with extremely uneven gradation in some samples. The Cc values are generally low (<1.2), accompanied by discontinuous gradation curves and missing particle size segments. All Qingshan Bay samples are poorly graded medium sands, with the coefficient of uniformity Cu ranging from 1.894 to 2.269 (average 2.13) and the coefficient of curvature Cc ranging from 1.147 to 1.375 (average 1.25). Qingshan Bay samples show smaller Cu variations and slightly better sorting than Shenhu Bay samples, with higher Cc values and more continuous gradation curves, along with local coarse particle enrichment.
(3)
Relative Density Characteristics of Sandy Soils at Different Beach Locations.
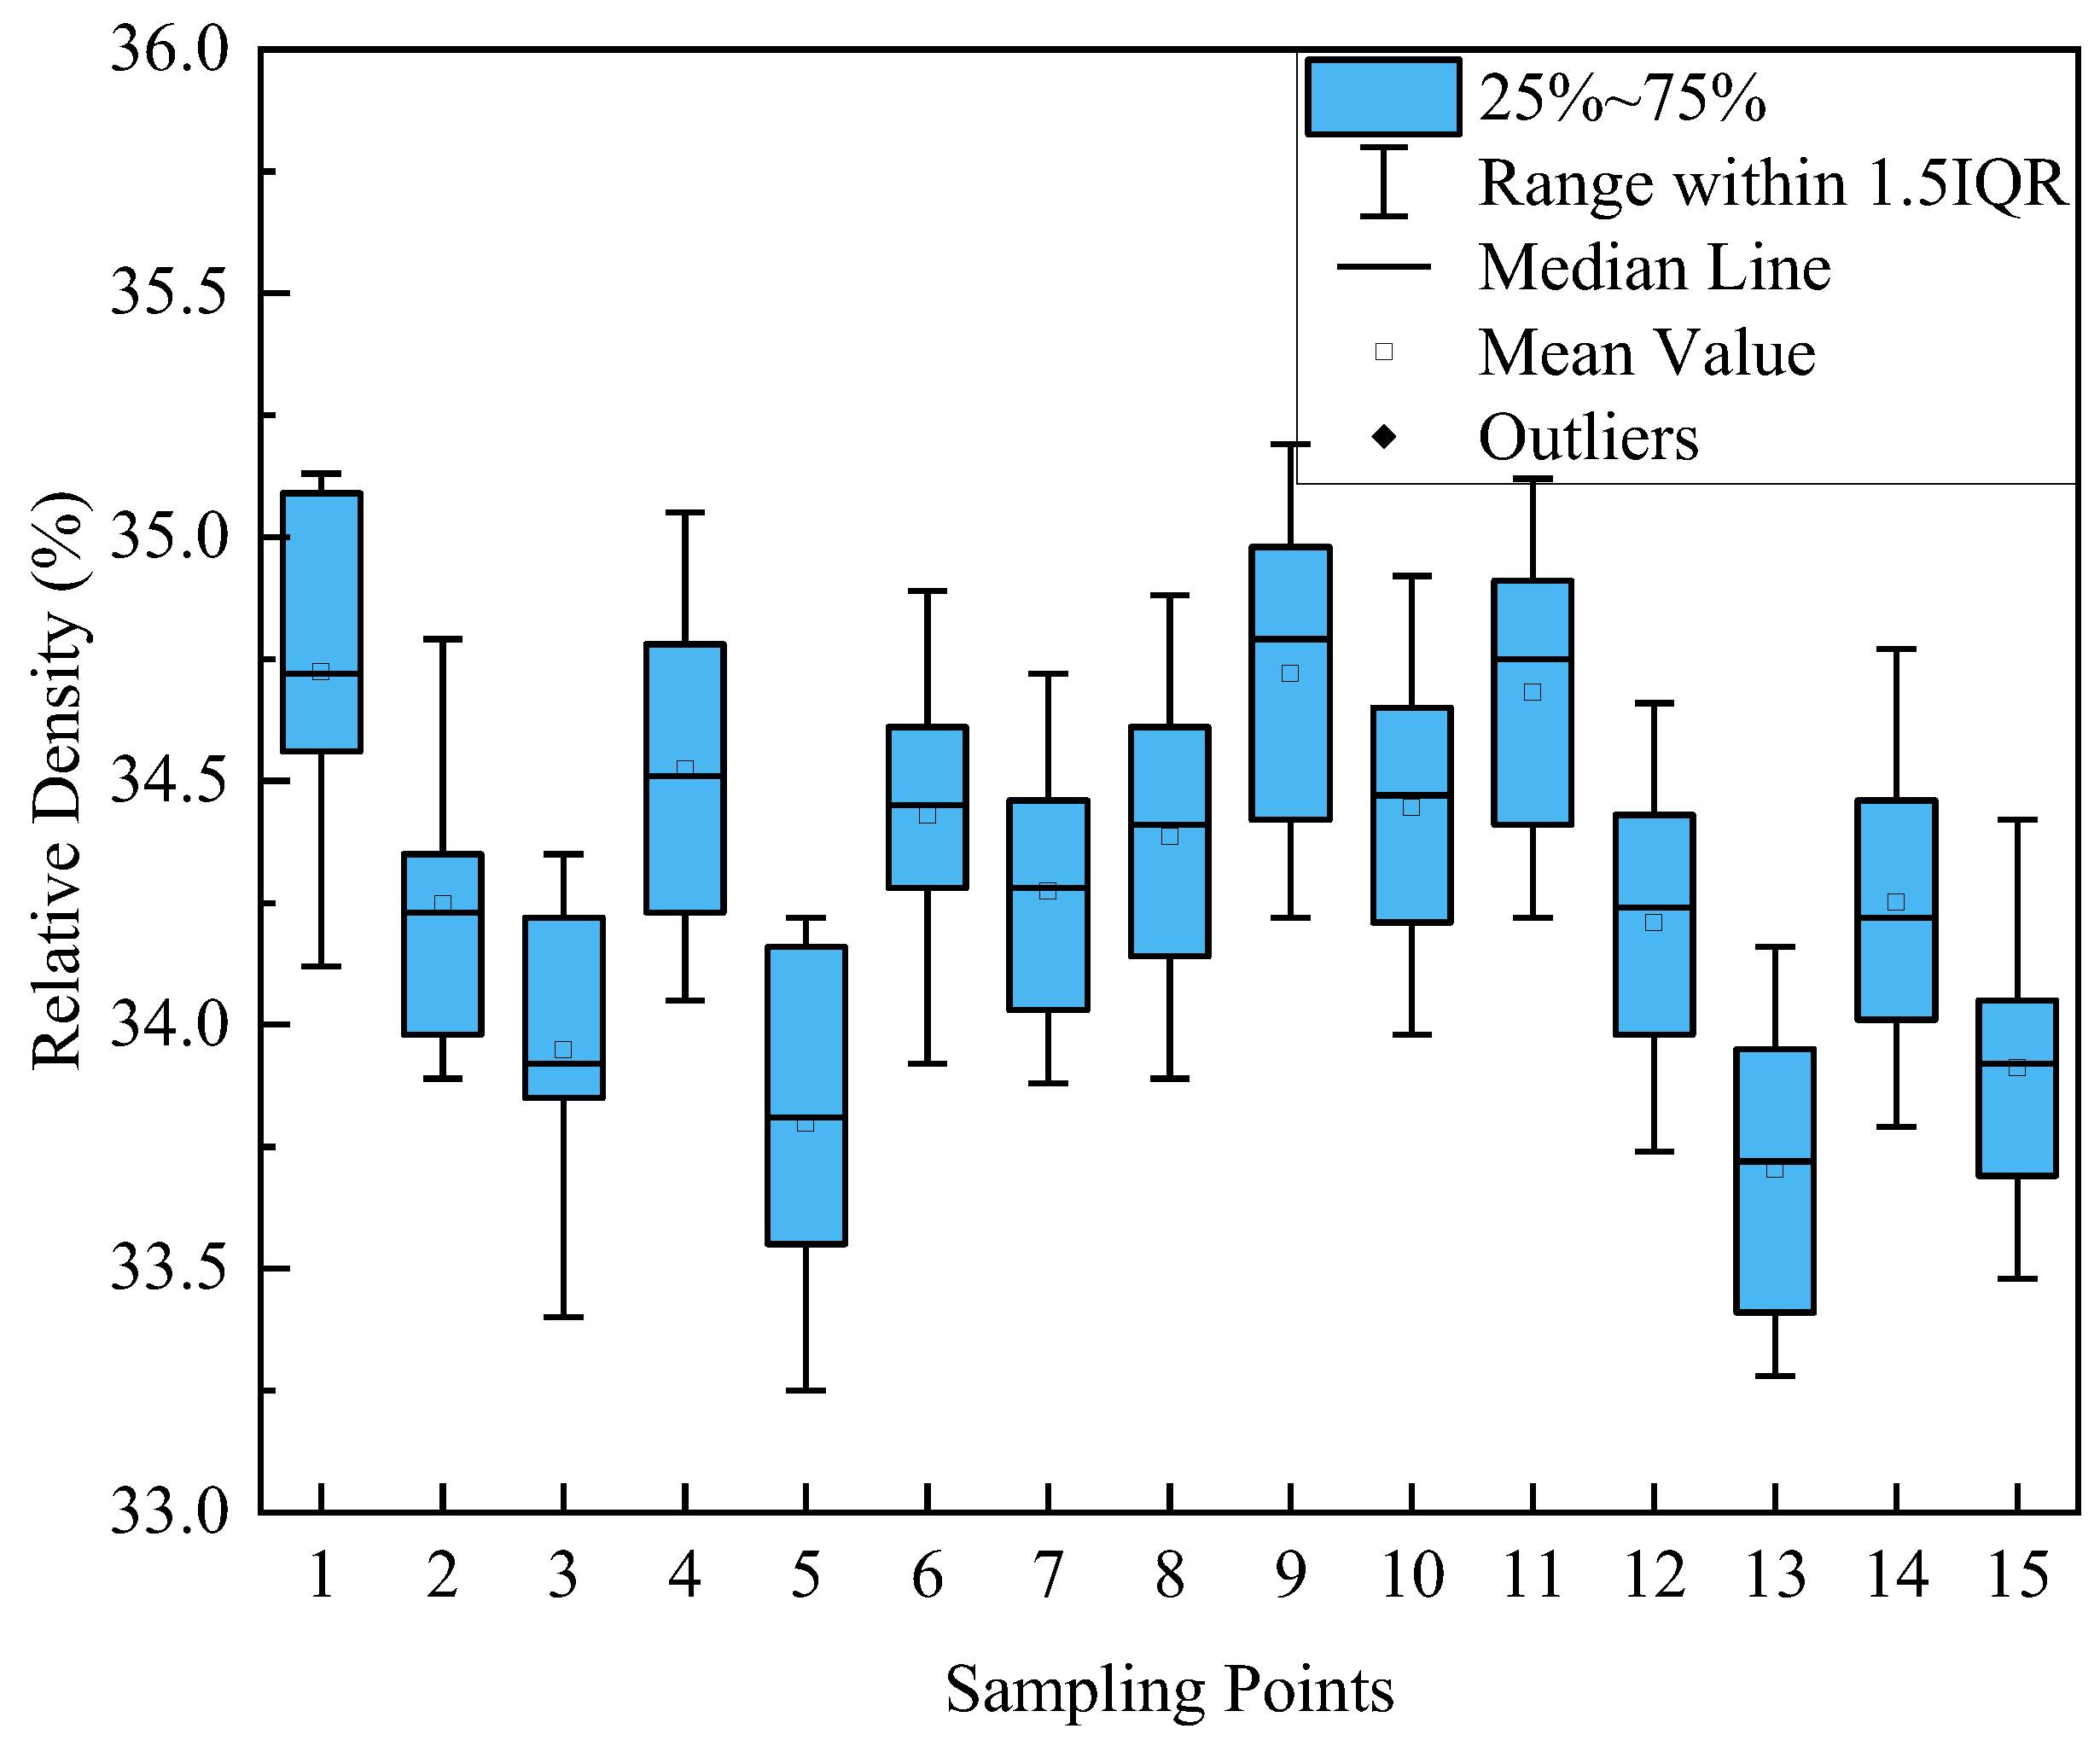
Figure 6 shows the distribution of relative density (Dr) of sandy soils at different beach locations. The relative density (Dr) of Shenhu Bay sandy soils ranges from 33.25 to 35.13%, with an average of 34.29% and a standard deviation of 0.45%. Most samples have relative densities concentrated in the 33–35% range, presenting a loose-to-medium dense state. The relative density of Qingshan Bay sandy soils ranges from 33.28 to 35.19%, with an average of 34.27% and a standard deviation of 0.49%. Most samples have relative densities concentrated in the 33–35% range, also in a loose-to-medium dense state. The average Dr values of both Shenhu Bay and Qingshan Bay are below 50%, indicating a generally low bearing capacity of natural foundations and a certain risk of sand liquefaction.
(4)
Liquid Limit and Plastic Limit Characteristics of Sandy Soils at Different Beach Locations.
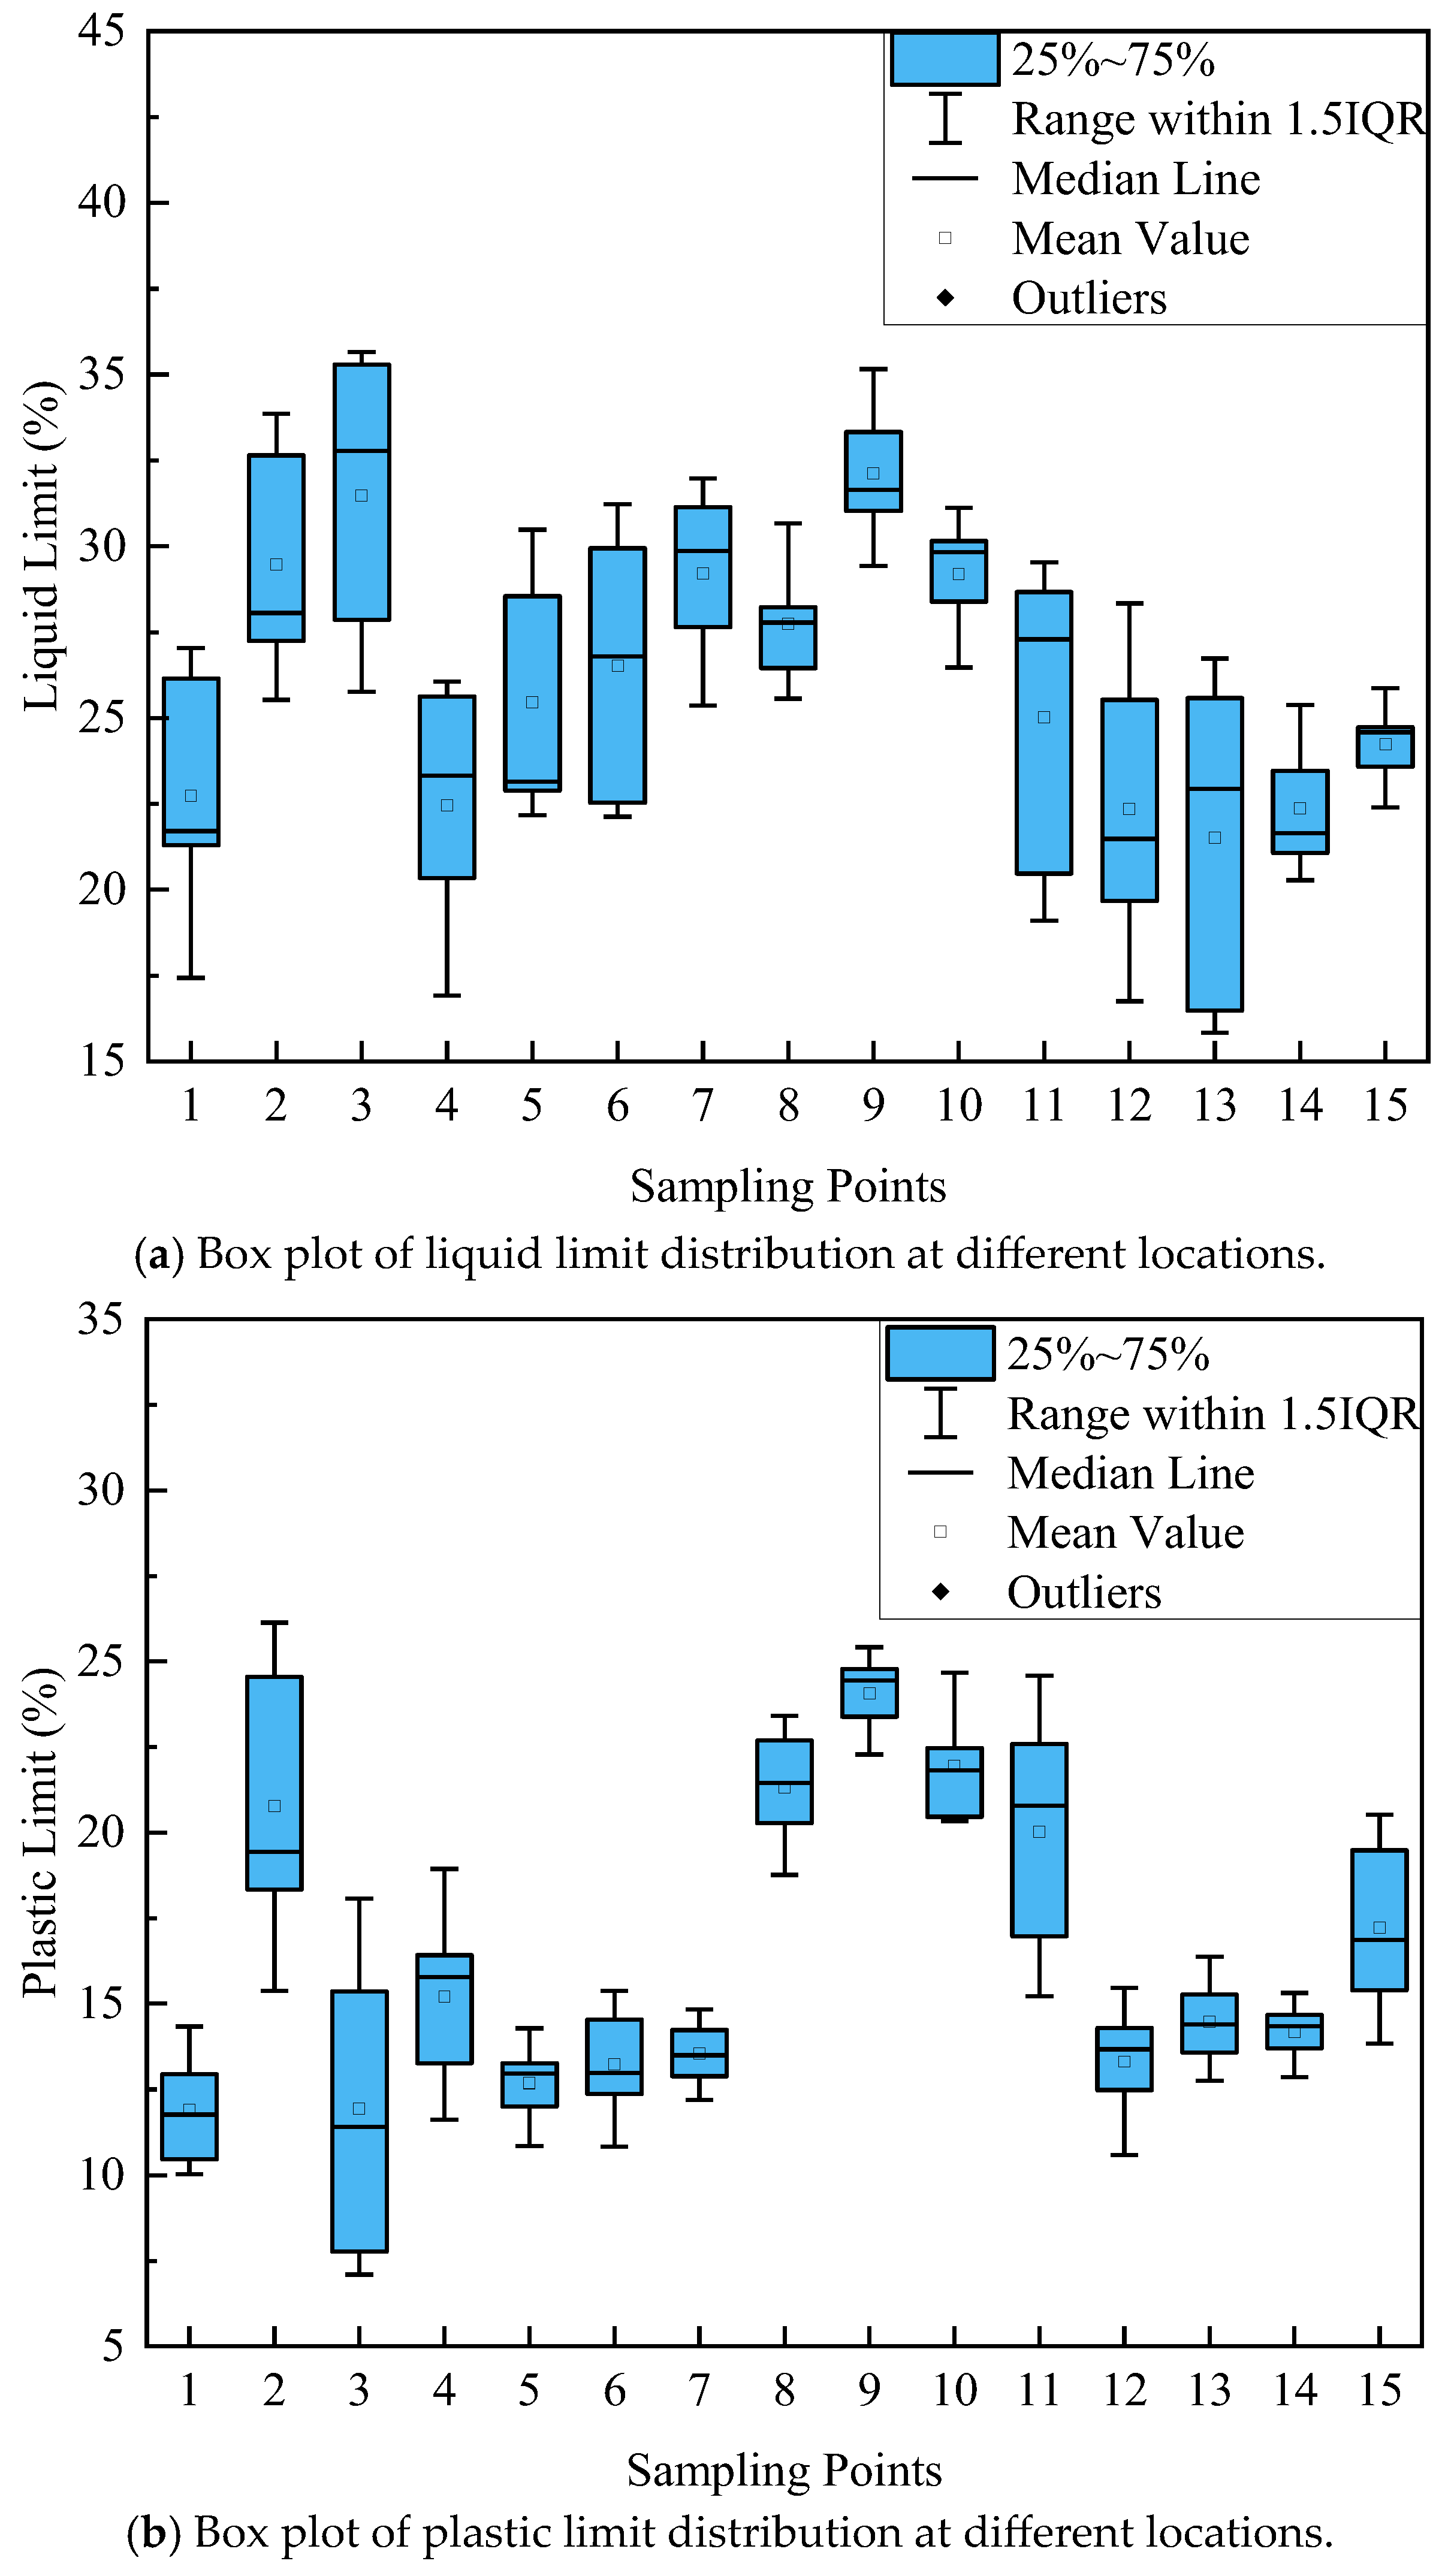
Figure 7 shows the distribution of the liquid limit (LL) and plastic limit (PL) of sandy soils at different locations. For Shenhu Bay beach sandy soils, the liquid limit (LL) ranges from 17.43 to 35.65% with an average of 26.88%, the plastic limit (PL) ranges from 7.1 to 26.14% with an average of 15.07%, and the plasticity index (PI) ranges from 3.10 to 28.19% with an average of 11.81%, belonging to low-to-medium liquid limit sandy soils. Higher PI values at some points indicate possible organic matter enrichment and strong plasticity. For Qingshan Bay, the liquid limit (LL) ranges from 15.83 to 35.16% with an average of 25.25%, the plastic limit (PL) ranges from 10.59 to 25.42% with an average of 17.89%, and the plasticity index (PI) ranges from 2.13 to 14.67% with an average of 7.37%, belonging to low-liquid-limit sandy soils. The plasticity is slightly higher than that of Shenhu Bay, with a more stable engineering performance.
(5)
Compression Modulus Characteristics of Sandy Soils at Different Beach Locations.
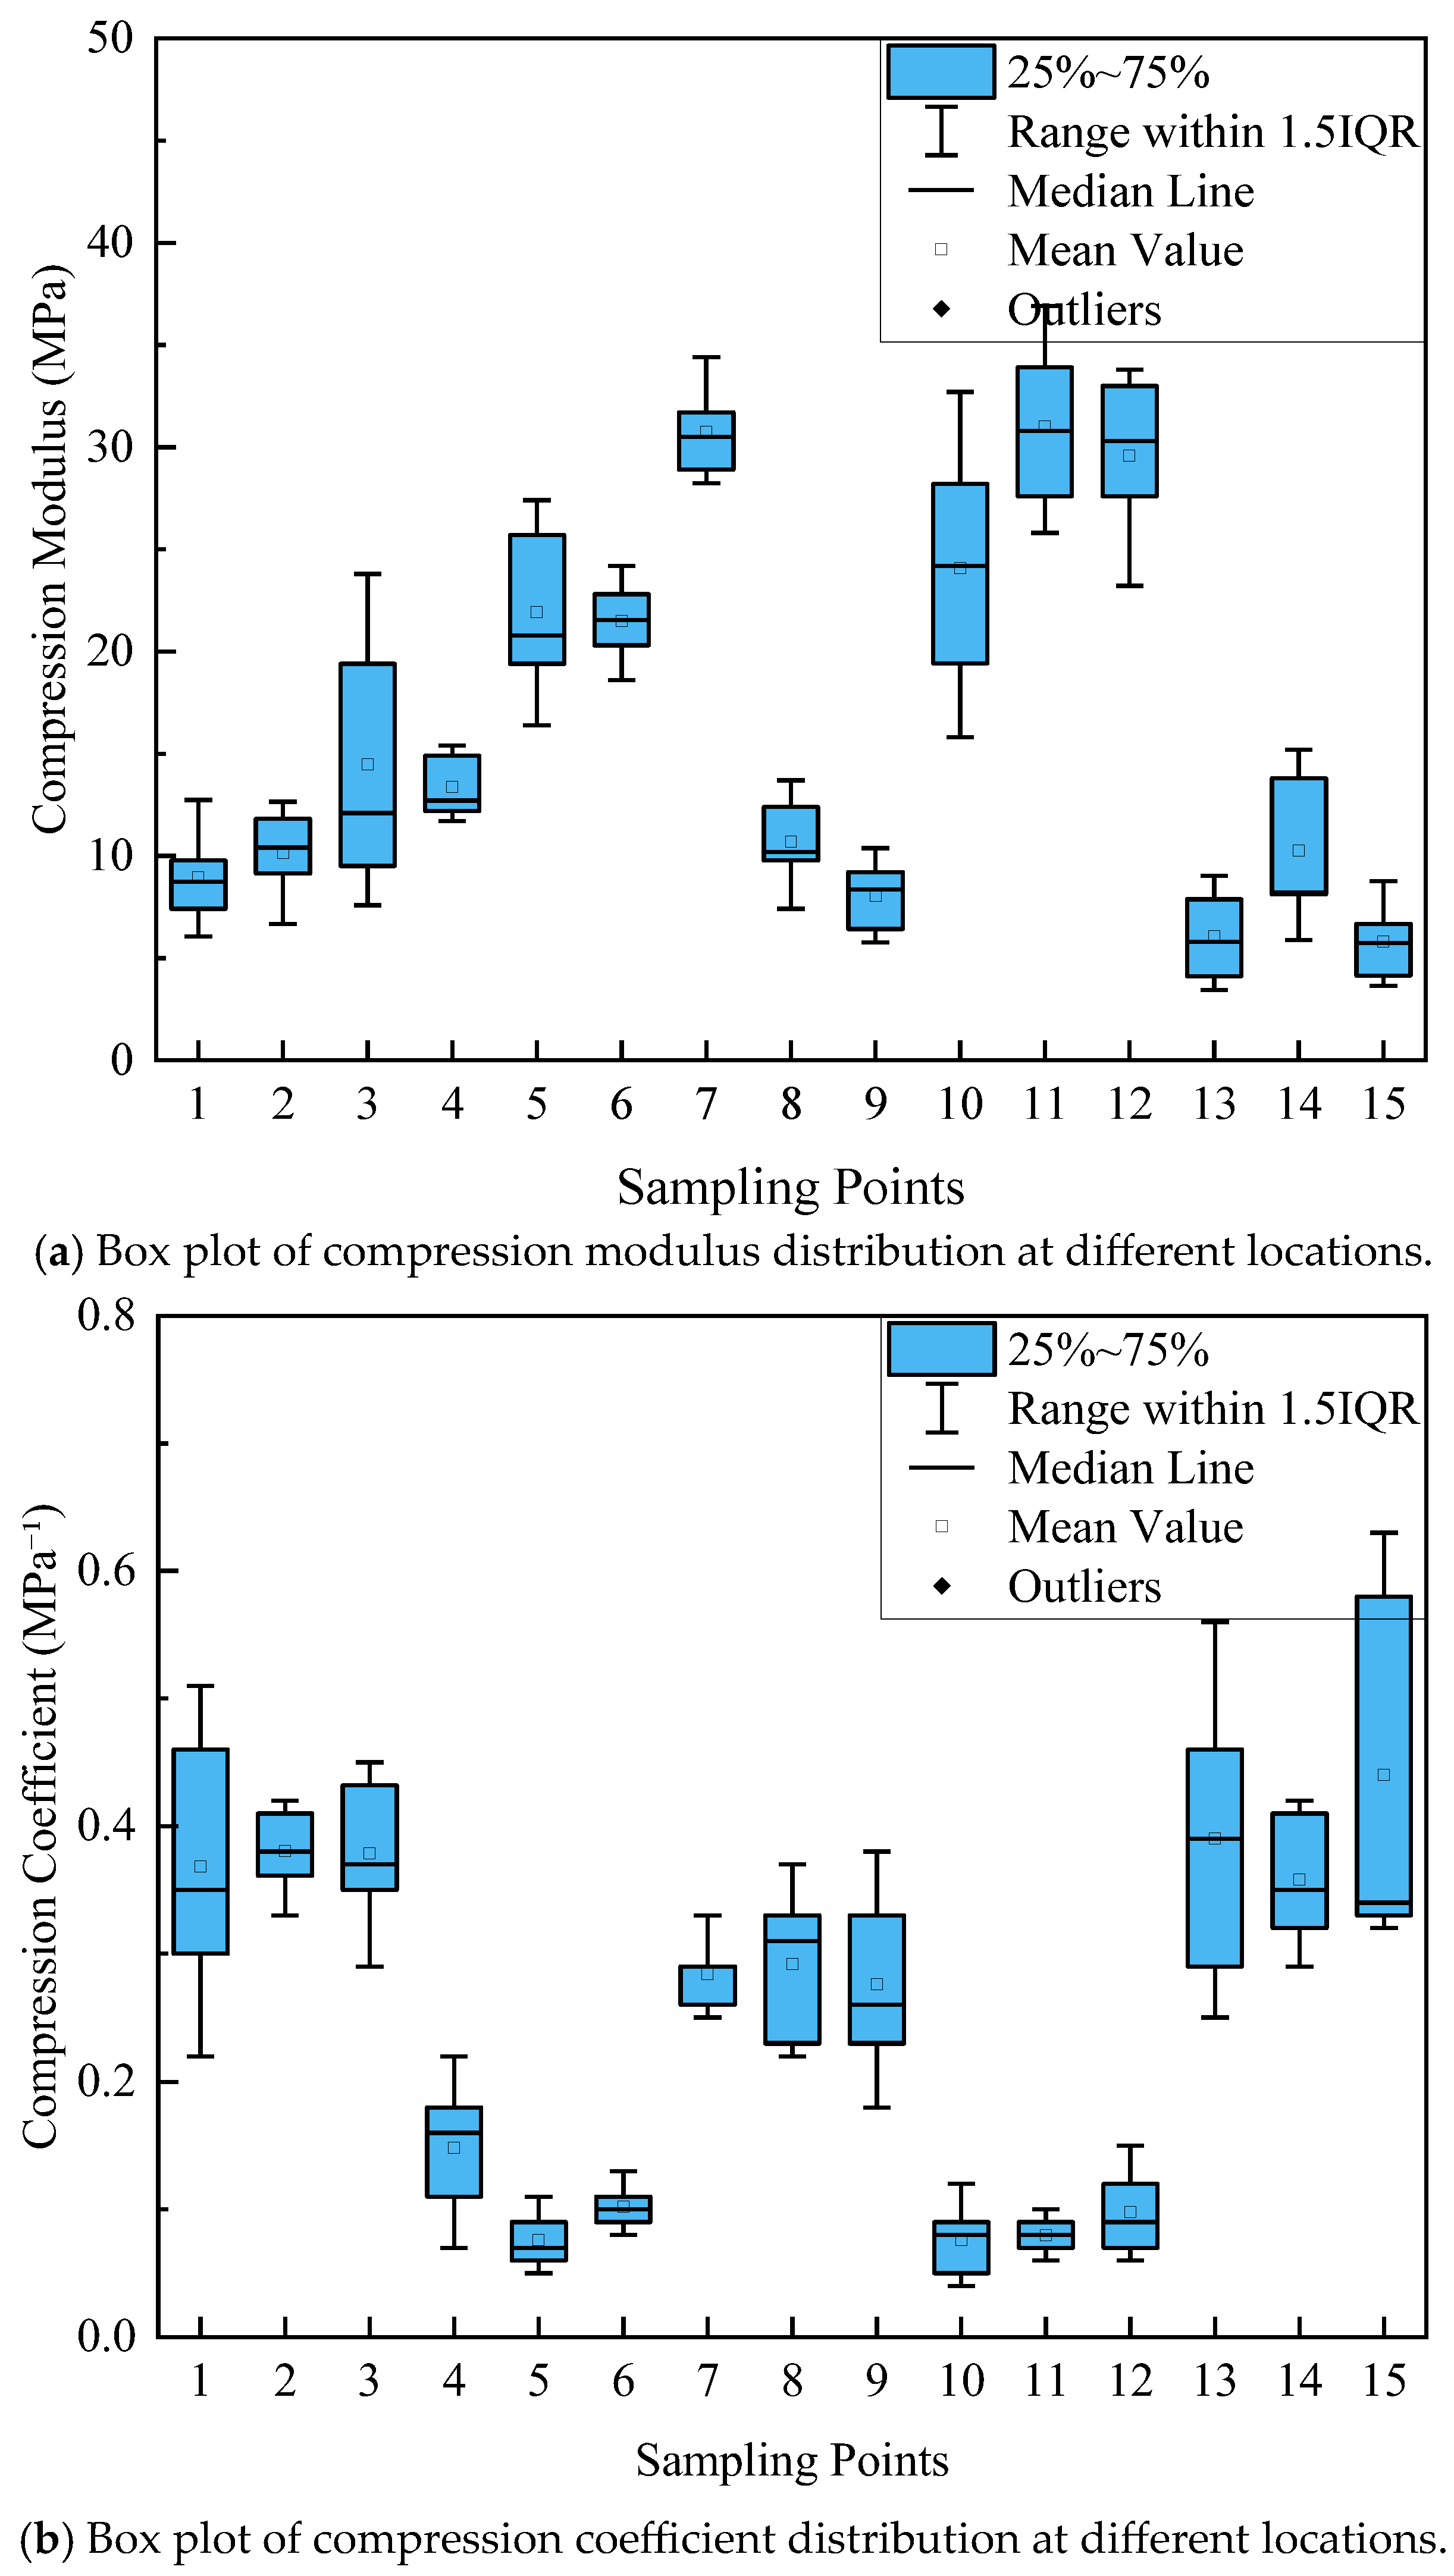
The compression modulus ES is an important index indicating the compressibility of sandy soil, which is inversely proportional to the soil’s compression coefficient αv. Figure 8 shows the distribution of the compression modulus and compression coefficient of sandy soils at different locations. For Shenhu Bay, ES ranges from 6.06 to 34.4 MPa with an average of 17.46 MPa, and αv ranges from 0.05 to 0.51 MPa−1, predominantly indicating low-to-medium compressibility; local high values reflect dense sand layers. For Qingshan Bay, ES ranges from 3.44 to 38.8 MPa with an average of 17.31 MPa, and αv ranges from 0.04 to 0.63 MPa−1, showing characteristics of high variability. Extreme high values at individual points may be due to organic matter enrichment or coarse particle accumulation, while extreme low values at individual points indicate loose density. During engineering construction, it is necessary to distinguish between different ES regions (high and low values) to select shallow or deep foundation schemes accordingly.
(6)
Shear Strength Characteristics of Sandy Soils at Different Beach Locations
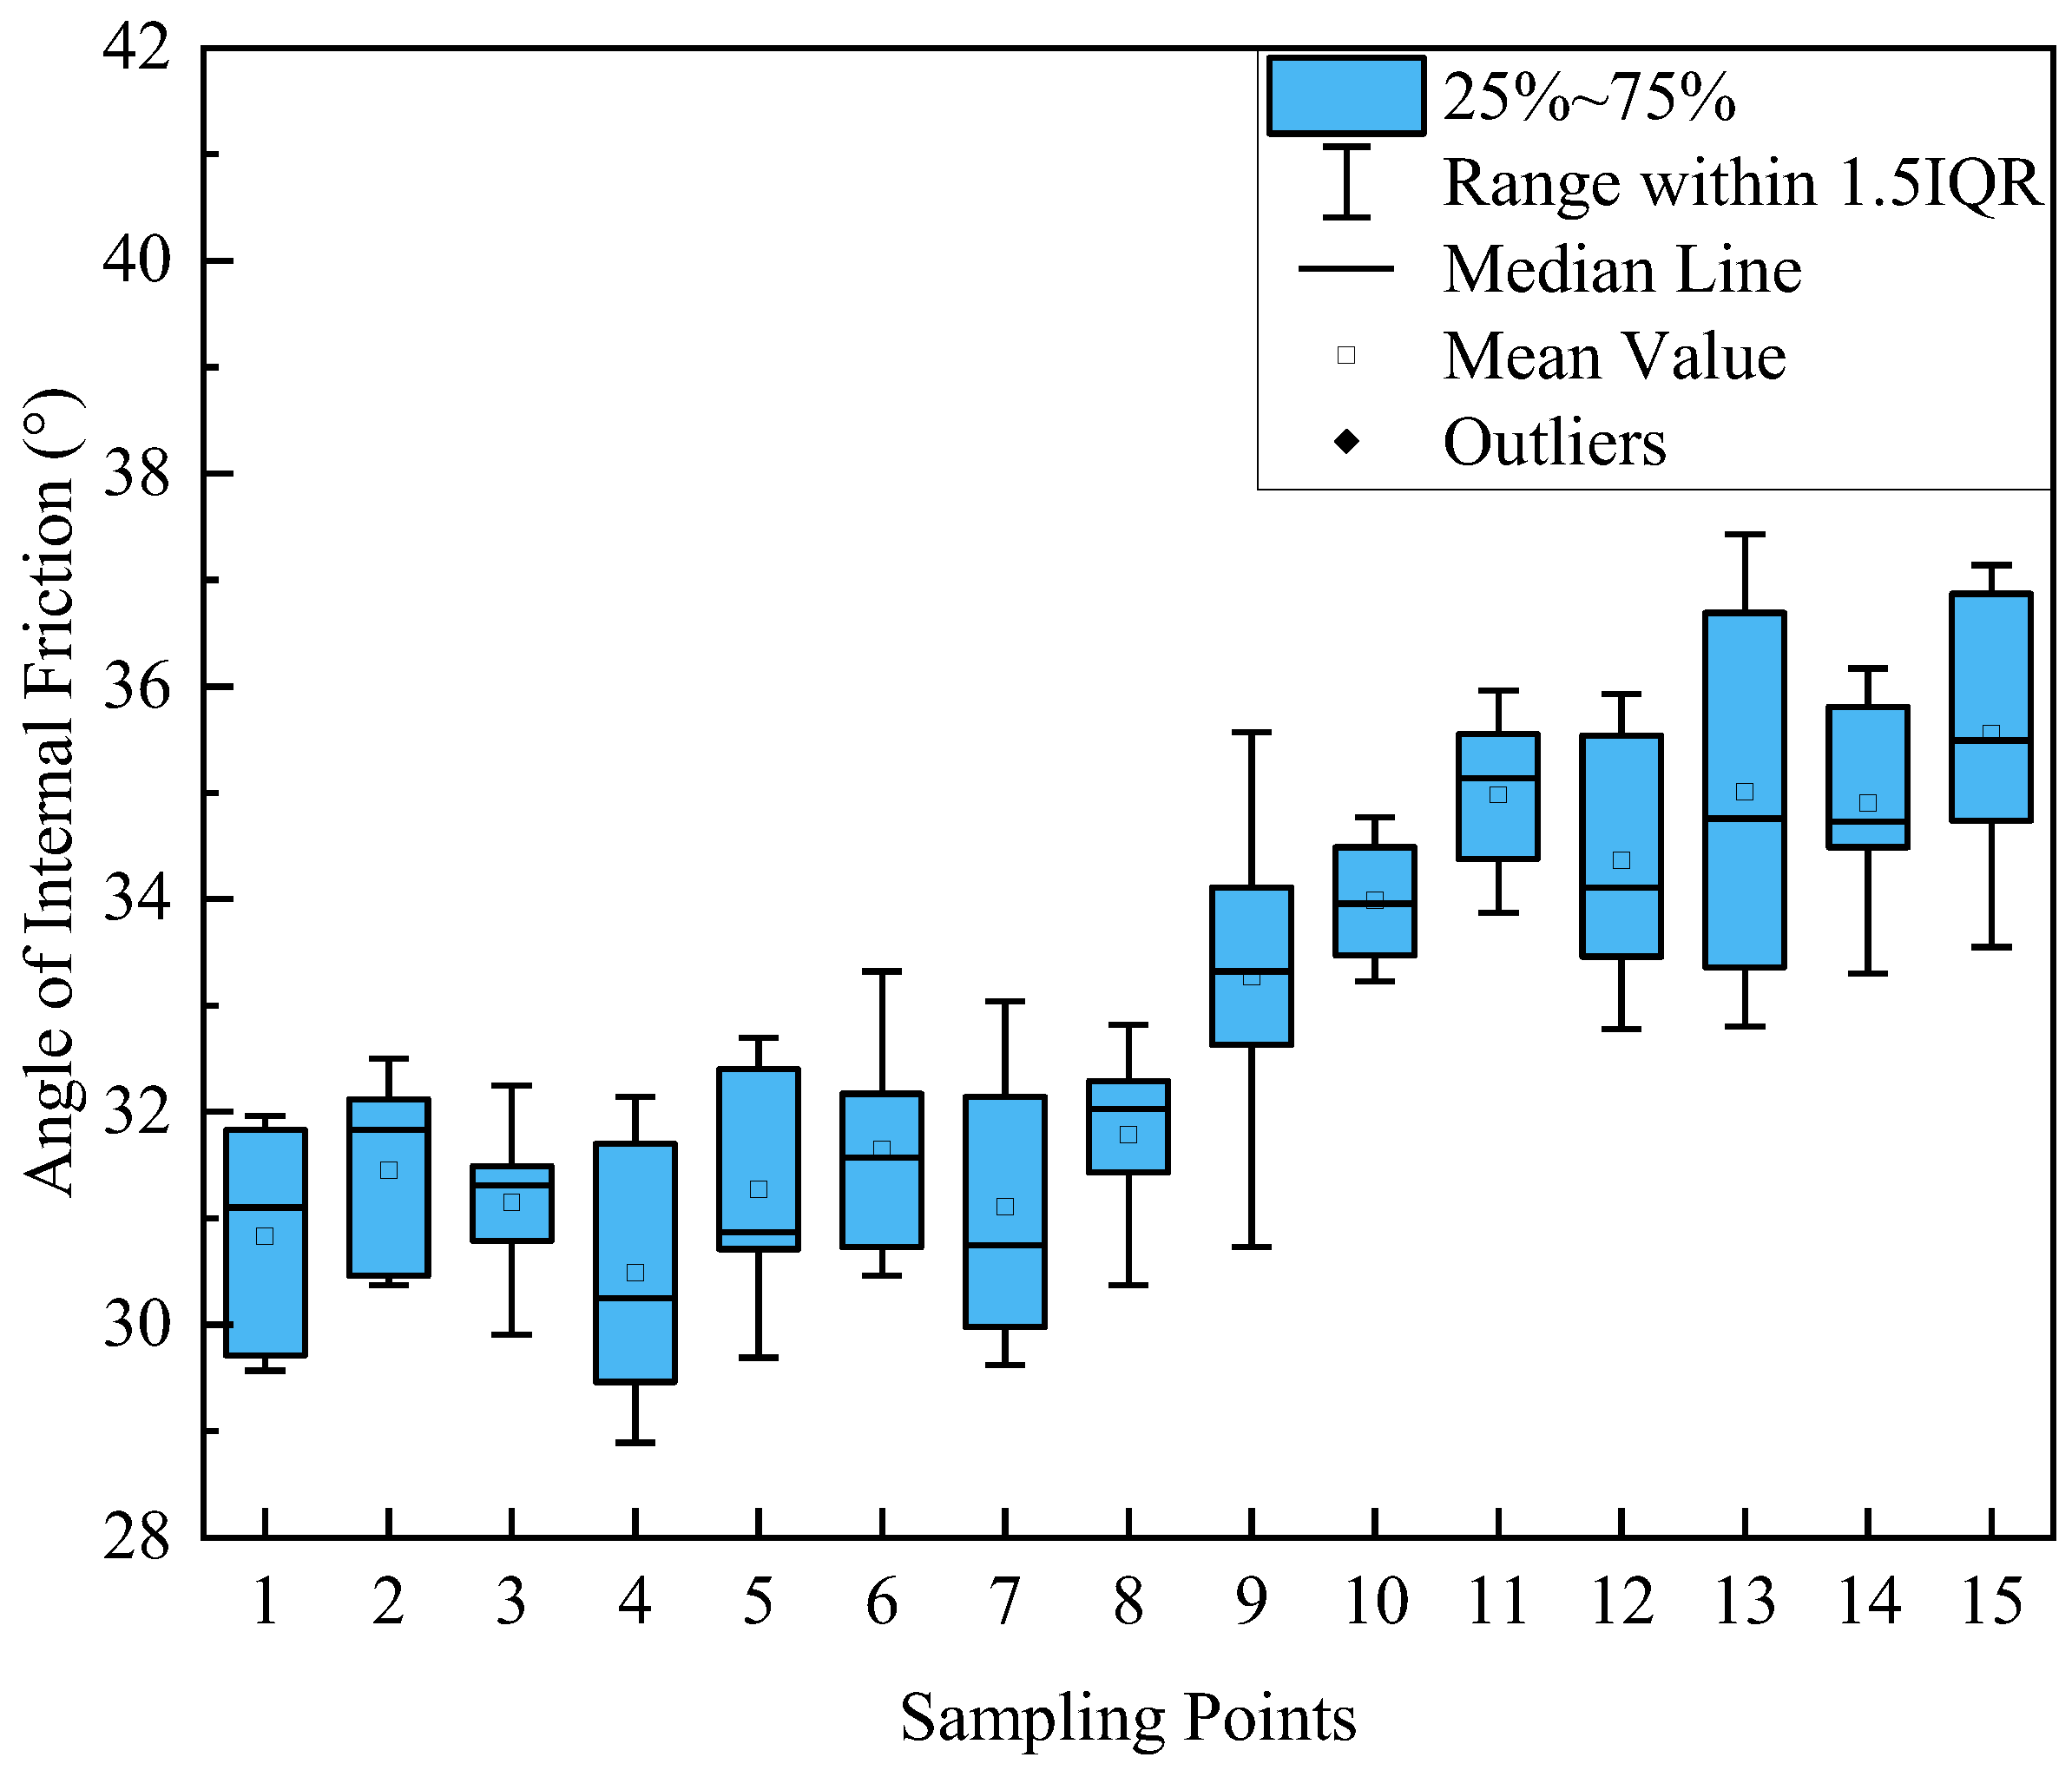
Figure 9 shows the distribution of the shear strength of sandy soils at different locations. The angle of internal friction of sandy soil samples from Shenhu Bay ranges from 28.89° to 33.32°, with an average of 31.22°. The angle of internal friction of sandy soil samples from Qingshan Bay ranges from 30.73° to 37.43°, with an average of 34.58°, which is slightly higher than that of Shenhu Bay samples. This could possibly be related to the higher coarse particle content. The cohesion of sandy soil samples from both Shenhu Bay and Qingshan Bay is zero, consistent with the non-cohesive characteristics of sandy soils, and the shear strength depends entirely on the angle of internal friction.

4.2. Correlation Between Bearing Capacity and Physical–Mechanical Indices

To identify the controlling indices affecting the bearing capacity of beach foundations, the correlations between relative density, liquid limit, plastic limit, compression modulus, compression coefficient, particle gradation, and foundation bearing capacity were analyzed. Two indices, the covariance and correlation coefficient, were used to describe the correlation between each index and the foundation bearing capacity. The covariance Cov(X,Y) was used to measure the overall error between two variables:
C o v x , y = i 1 n X i X average Y i Y average n 1
where n is the number of data points, X represents the physicomechanical property indices of sand, and Y denotes the foundation bearing capacity. If the trends of change for the two variables are consistent, the covariance is positive, indicating a positive correlation between the two variables. If the trends of change are opposite, the covariance is negative, indicating a negative correlation. If the two variables are independent of each other, the covariance is zero, indicating no correlation. The correlation coefficient is a statistical index used to reflect the degree of closeness of the relationship between variables, and its value range is between −1 and 1.
r x y = S x y S x S y
S x = X i X average 2 n 1
S y = Y i Y average 2 n 1
where rxy = 1 denotes a perfect positive linear correlation between the two variables, rxy = −1 indicates a perfect negative correlation, and rxy = 0 means the two variables are uncorrelated.
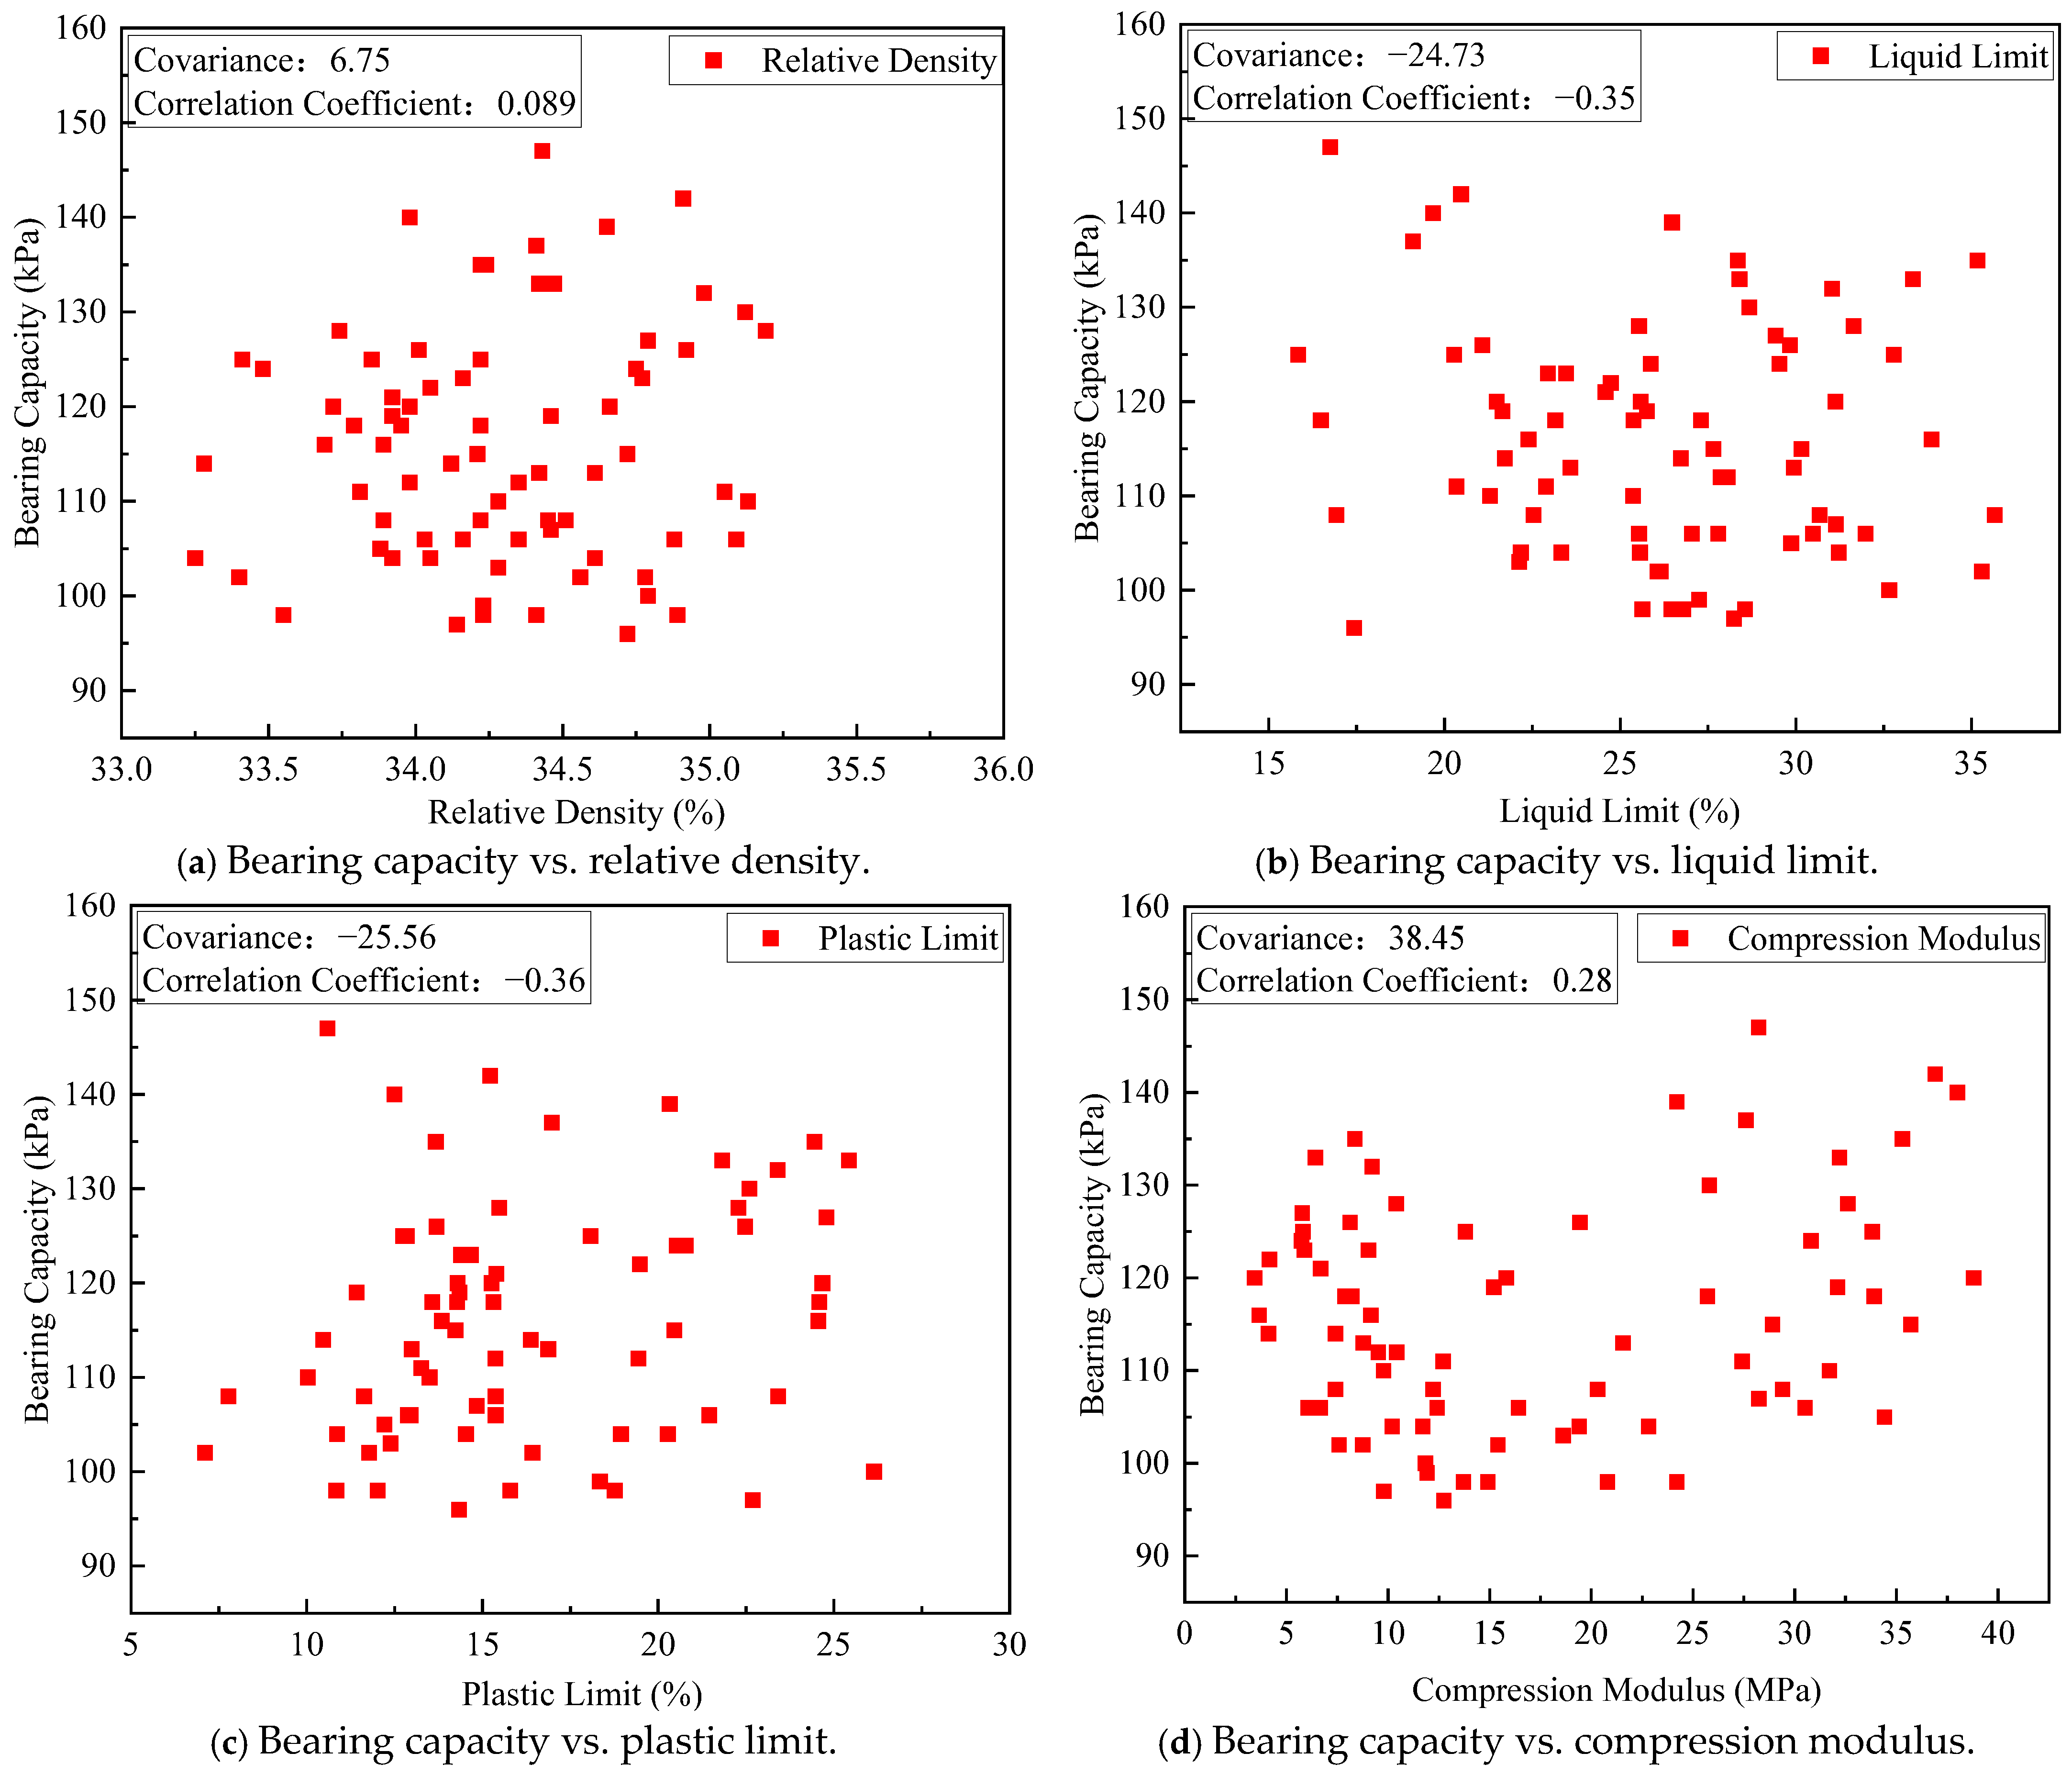
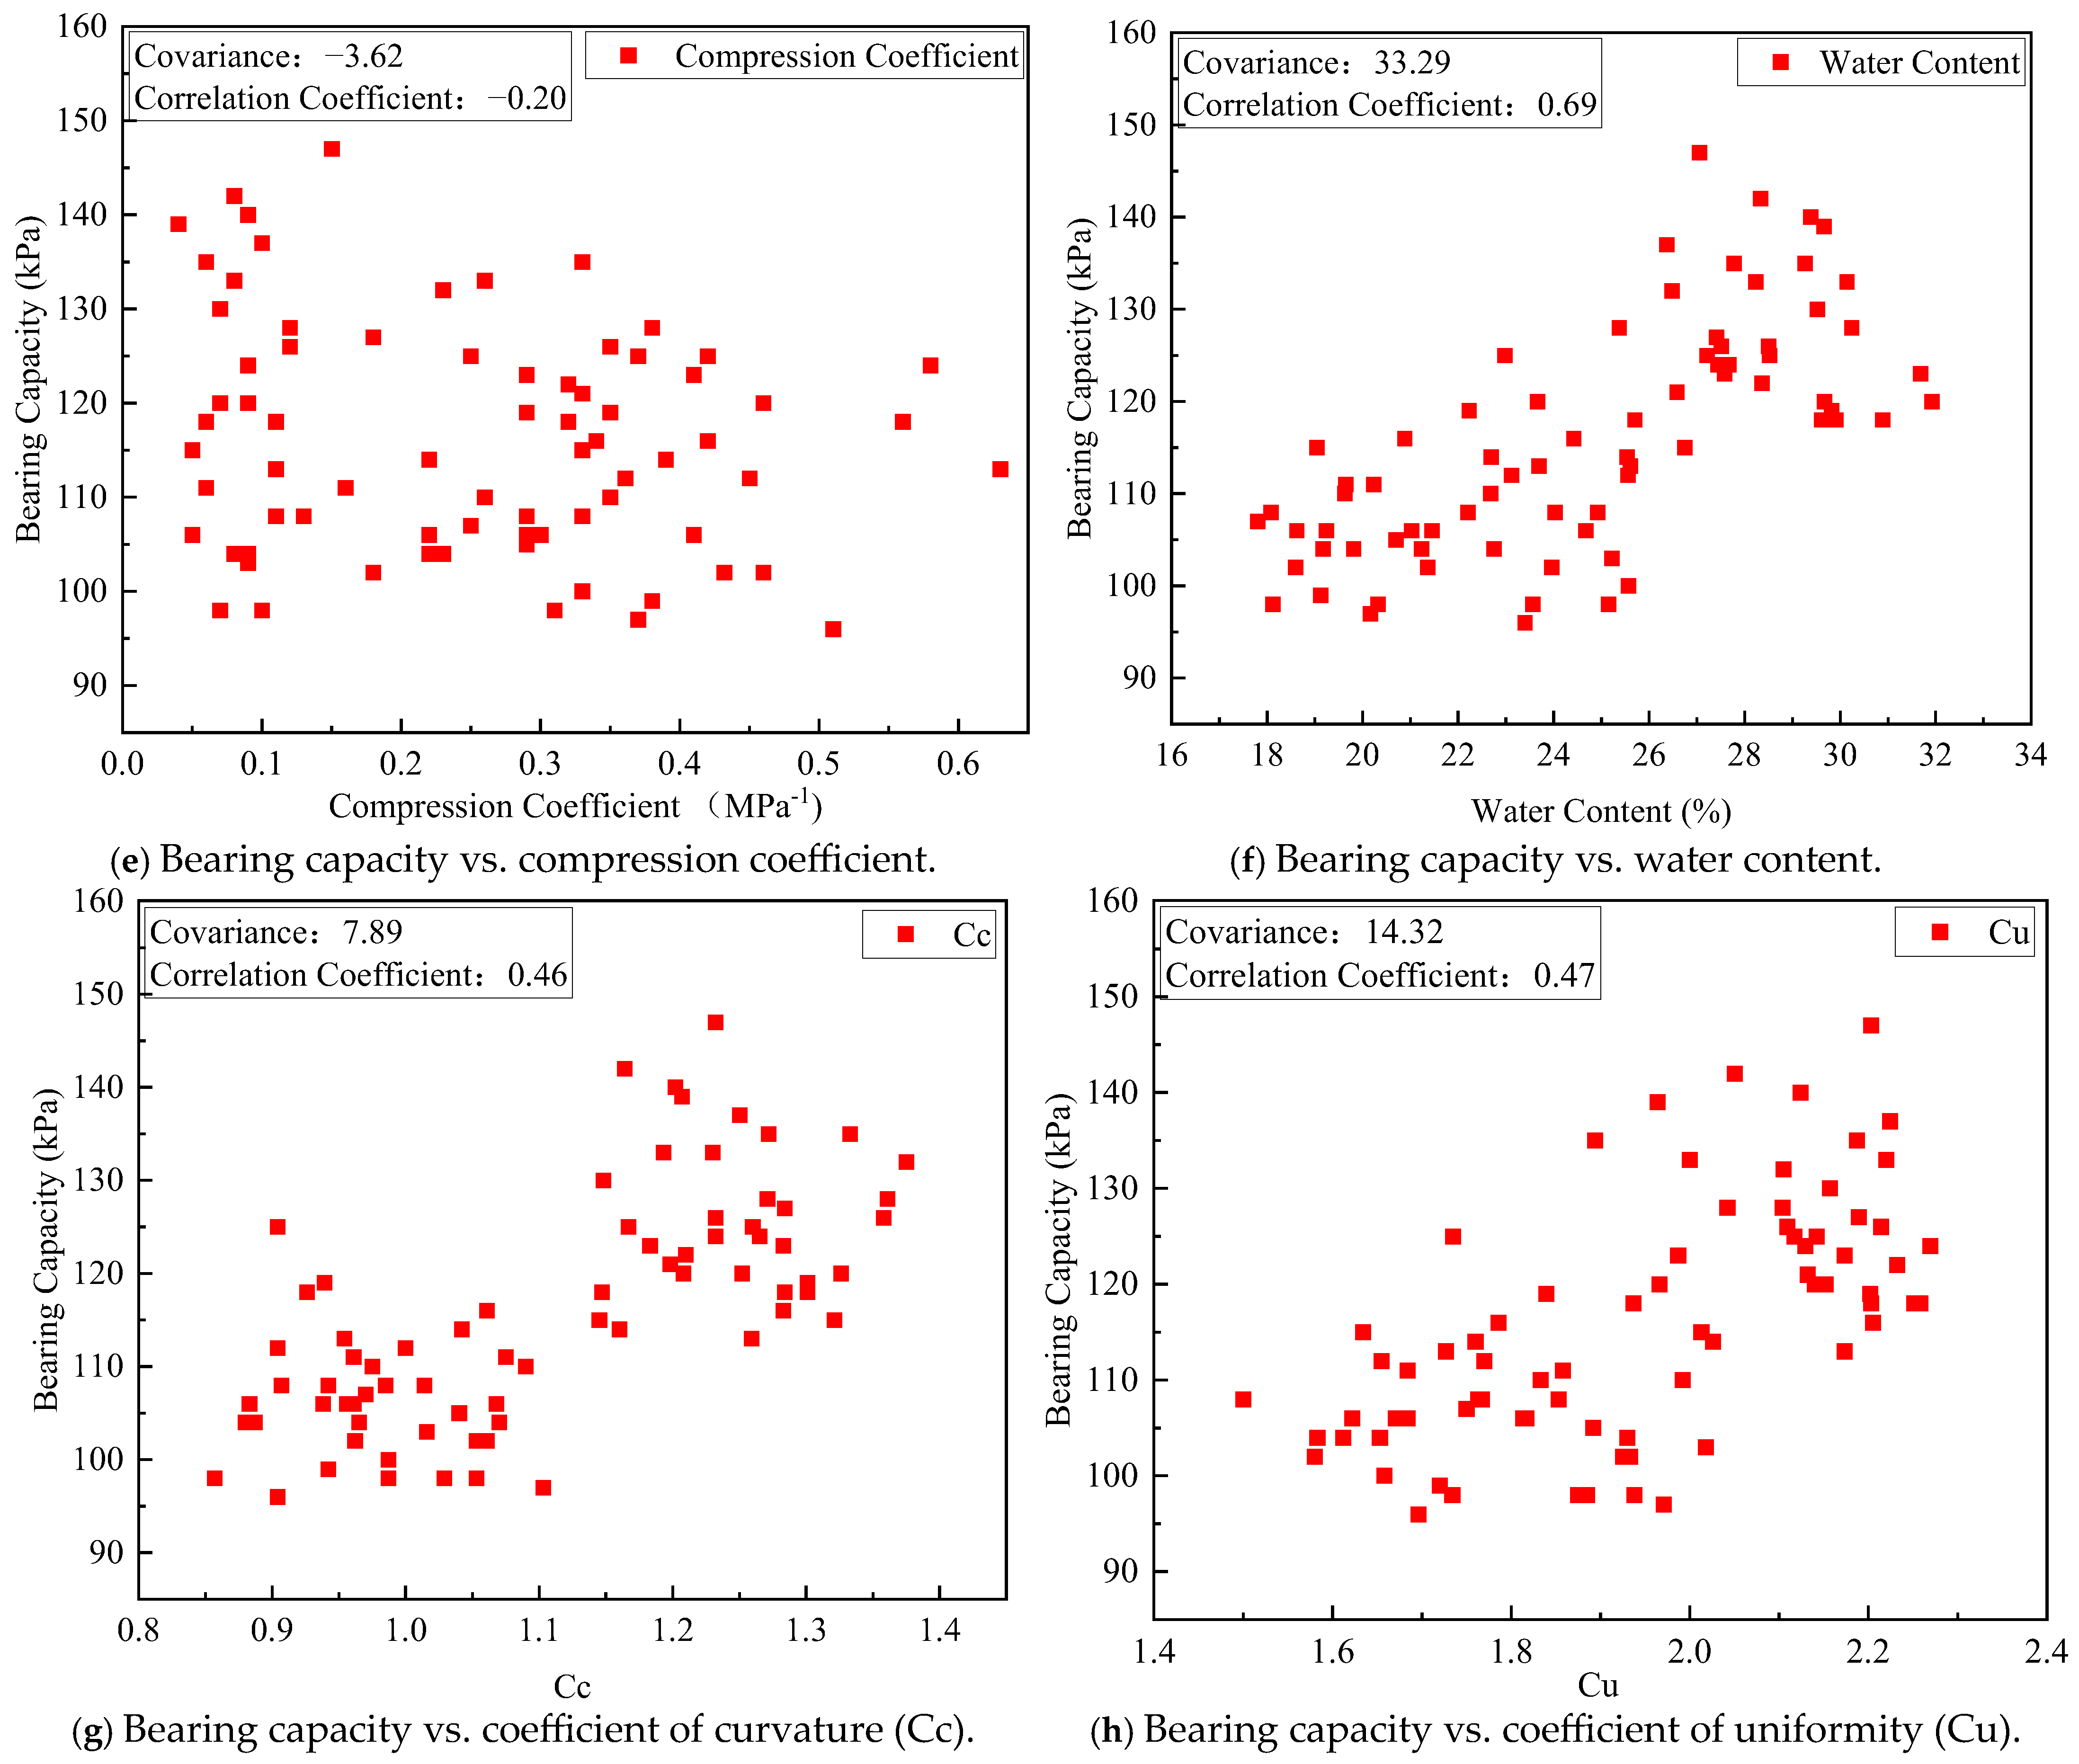
Figure 10 plots the relationships between different mechanical indices and foundation bearing capacity. Meanwhile, the covariances and correlation coefficients between each mechanical index and foundation bearing capacity were calculated. As can be seen from the figure, the relative density, liquid limit, plastic limit, compression modulus, and compression coefficient show weak correlations with foundation bearing capacity, with covariances of 6.75, −24.73, −25.56, 38.45, and −3.62, respectively; the correlation coefficients are 0.089, −0.35, −0.36, 0.28, and −0.20, respectively. The water content and particle gradation parameters Cc, Cu exhibit correlations with foundation bearing capacity, with covariances of 33.29, 7.89, and 14.32, respectively. The correlation coefficients are 0.69, 0.46, and 0.47, respectively, which falls within the medium correlation range, indicating this correlation is highly unlikely to be caused by random errors in a probabilistic sense, and thus holds practical significance for research.
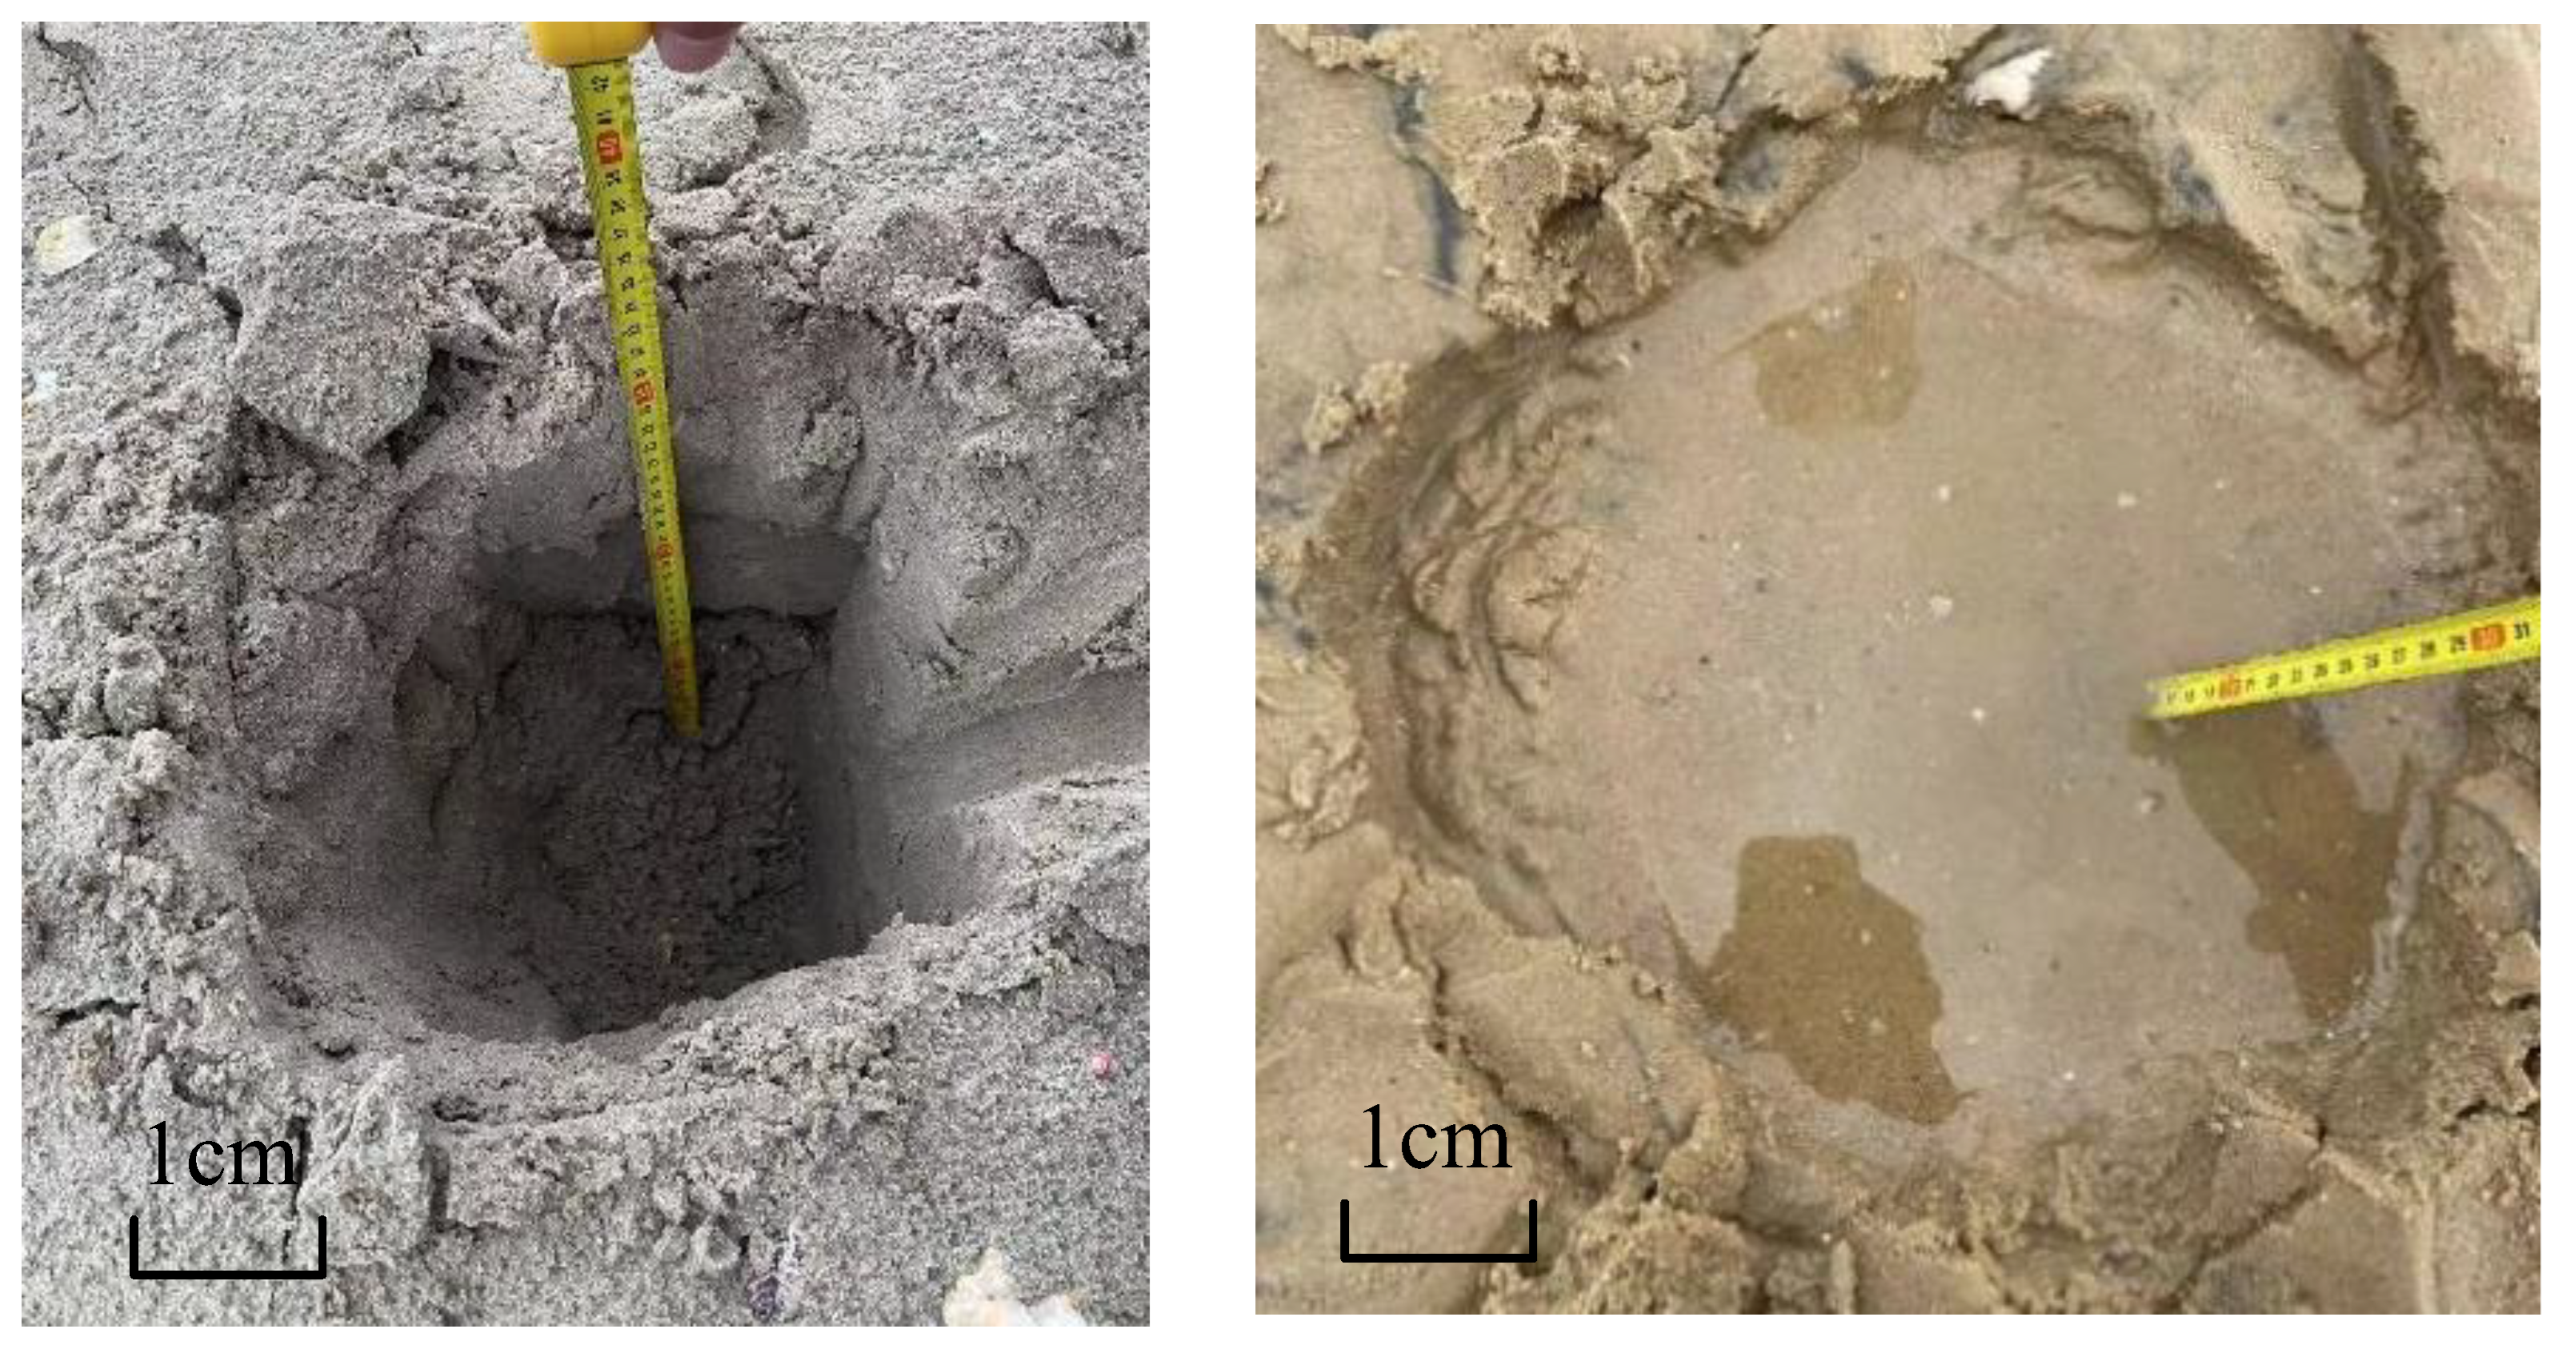
During on−site sampling, it was observed that water content has a significant impact on the bearing capacity of sandy soil, which is intuitively reflected in the depth of footprints on the beach. The depth of footprints varies across blocks with different water contents, and soil collapse was observed in pits after sampling in some high-water-content areas (as shown in Figure 11). As can be seen in Figure 10, the foundation bearing capacity increases to a certain extent with an increase in water content. However, when the water content is the same, the bearing capacity values are diverse. According to the test results of other physical and mechanical properties at the sampling points, it is speculated that this difference is caused by particle gradation. It can currently be inferred that there is a positive correlation between water content and bearing capacity, especially within a certain range of water content, where the bearing capacity of sandy soil gradually increases with an increase in water content. In the water content range of 17.8–24.92% (average water content 21.33%), the average bearing capacity is 107.41 kPa; in the range of 25.15–31.92% (average water content 27.98%), the average bearing capacity is 123.97 kPa.
Well-graded sandy soils (Cu and Cc within reasonable ranges) can provide a higher bearing capacity. This is because well-graded sandy soils form tighter particle arrangements, reducing the void ratio and improving soil density and strength. In contrast, poor gradation (such as excessively high or low Cu and Cc) leads to a decline in the bearing capacity of sandy soils. This is due to insufficient fine particles causing large soil voids or excessive coarse particles making it difficult to form adequate cementation, thereby affecting the overall bearing performance. Ref. [31] also pointed out that in well-graded sandy soil, fine particles could fill the gaps between coarse particles, forming a compact packing structure. This also increases the contact area between particles and the frictional resistance, thereby enhancing the internal friction angle and the shear strength. The particle gradation of the samples in this study exhibits good dispersity and certain characteristics of poor gradation, i.e., an imbalance between coarse and fine particles in the sandy soil, dominated by medium and fine sands with occasional coarse sands. As shown in Figure 10, when Cu increases from 1.5 to 2.269, the bearing capacity increases from 108 kPa to 124 kPa, a 0.15-fold increase; when Cc increases from 0.857 to 1.375, the bearing capacity increases from 98 kPa to 132 kPa, a 0.35-fold increase.
Under unsaturated conditions (water content < 34%), the bearing capacity of sandy soil exhibits nonlinear growth with increasing water content. When water content rises from 17.8% to 31.92%, the bearing capacity increases by 12.15%. Integrating particle gradation and density test results, this phenomenon is closely linked to changes in interparticle interactions within specific water content ranges. The increased water content alters pore water distribution, modifying stress states at particle contact points and thereby influencing soil shear strength. A positive correlation (correlation coefficients of 0.46–0.47) was observed between gradation parameters (Cu, Cc) and bearing capacity, suggesting that variations in particle arrangement compactness caused by gradation differences are critical factors modulating the effect of water content on bearing capacity.

5. Mathematical Model of Foundation Bearing Capacity

5.1. Establishment of the Model

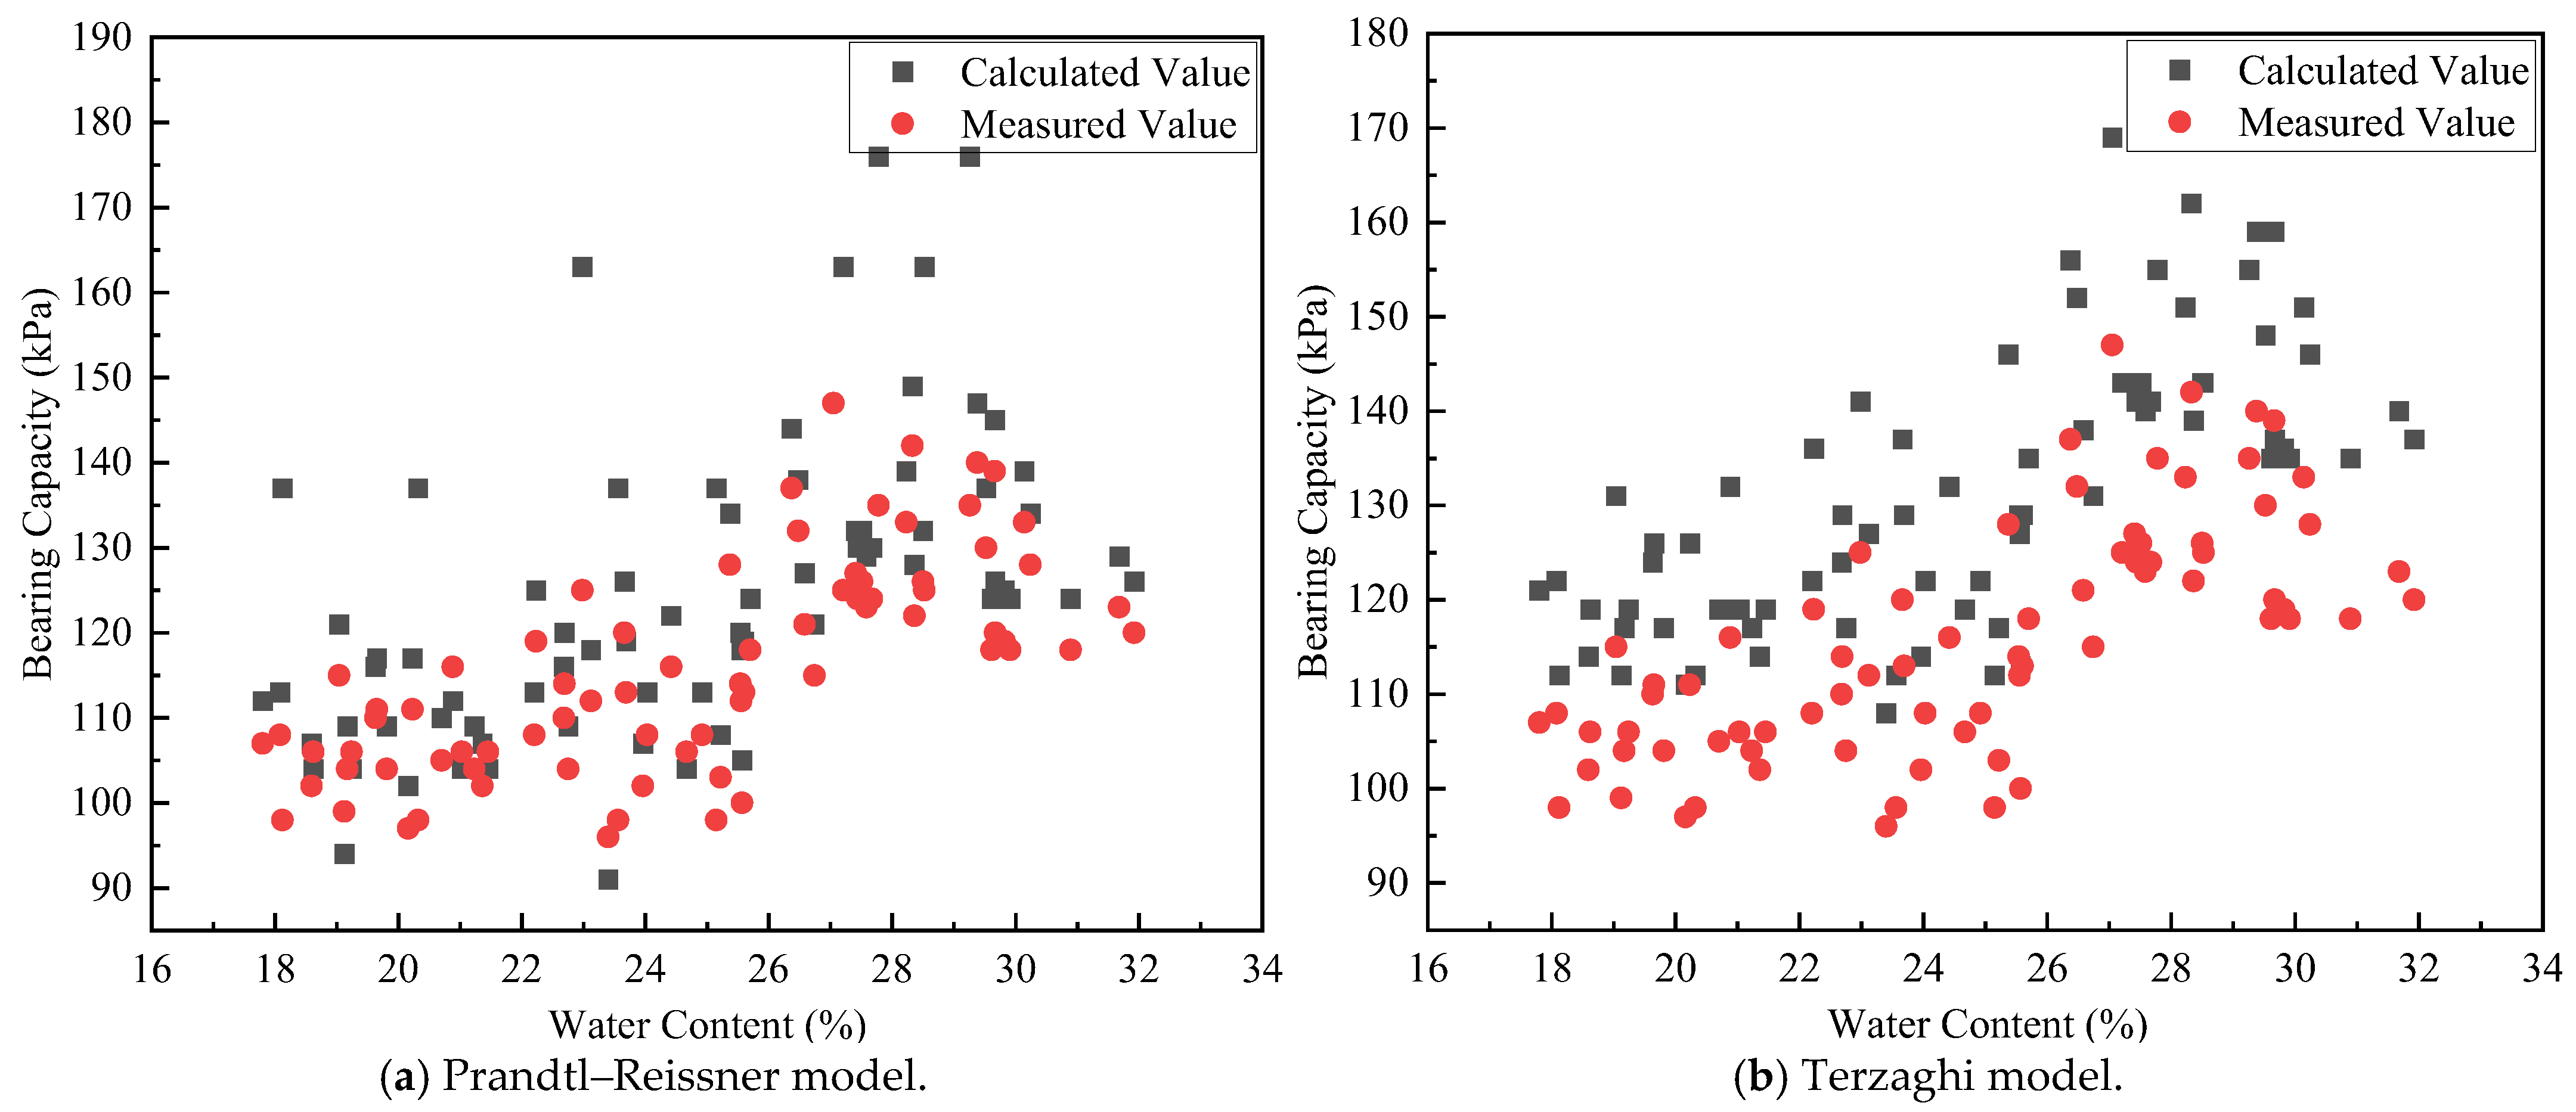
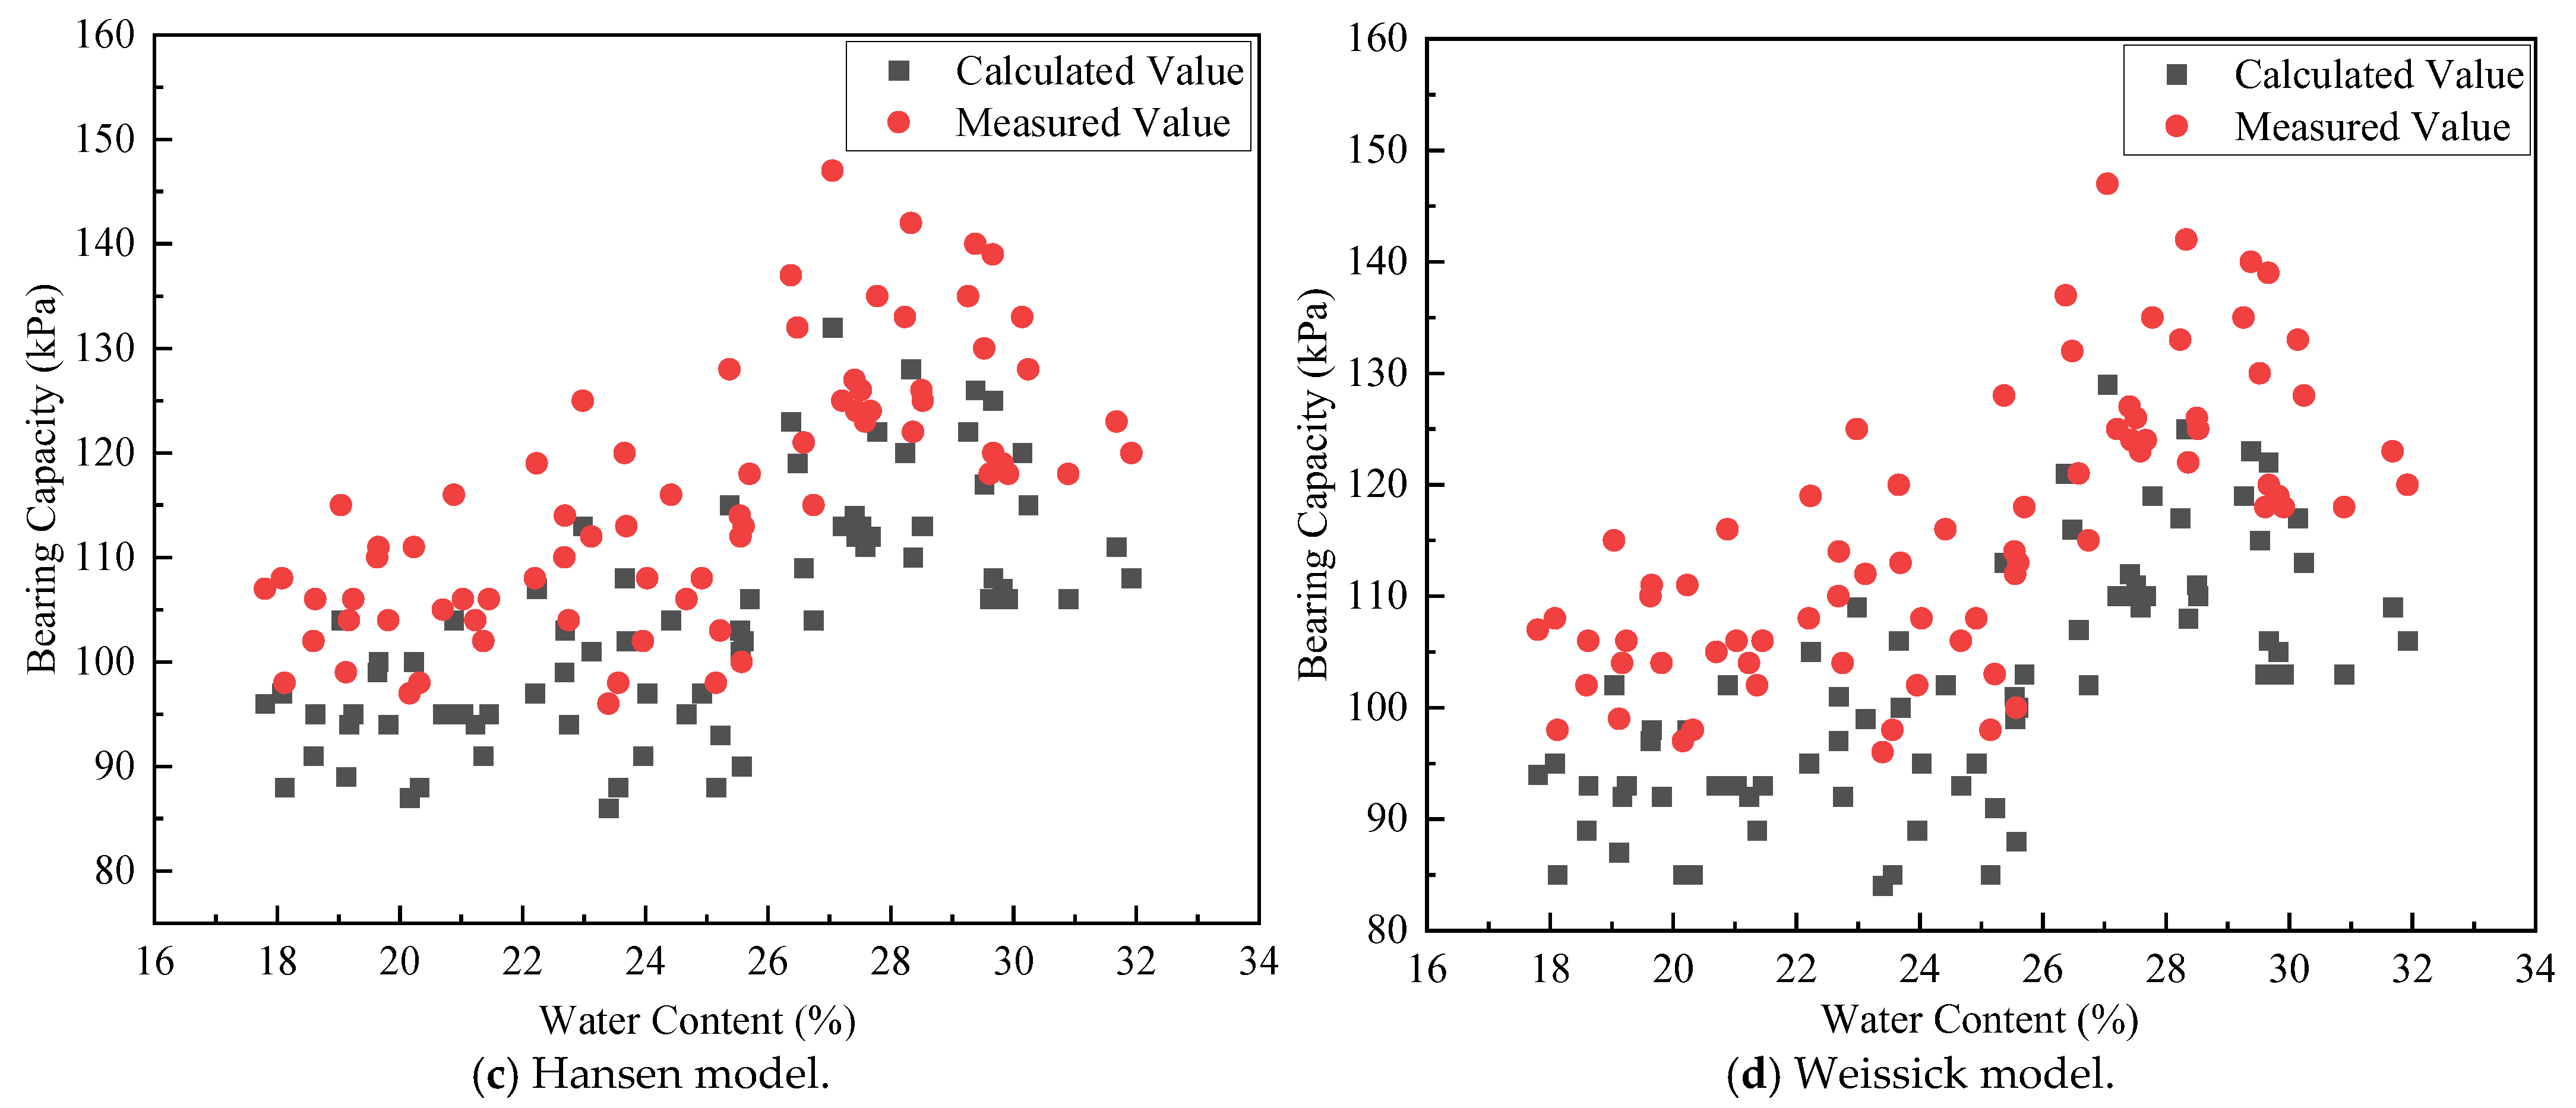
The construction of beach amusement facilities requires determining the foundation bearing capacity. Numerous classical soil mechanics formulas exist for bearing capacity calculations. To examine the applicability of different models in predicting the bearing capacity of sandy soil foundations on Quanzhou beaches, the Prandtl–Reissner model, the Terzaghi model, the Hansen model, and the Weissick model were selected for comparison. The Prandtl–Reissner model, based on Prandtl’s limit analysis theory for shallow foundations, was further developed by Reissner through the introduction of embedment depth correction and characteristic line analysis. This model assumes that the soil is an ideal elastic–plastic material and that the foundation base is perfectly smooth, with the failure mechanism derived through characteristic lines to calculate the ultimate bearing capacity. The comparison results are shown in Figure 12. As can be seen, the Terzaghi model yields significantly higher values, indicating insufficient safety; the Hansen and Weissick models produce lower calculated values; and the Prandtl–Reissner model produces results closest to the ultimate bearing capacity of sandy soils measured in tests, with the smallest error. Therefore, this study adopts the Prandtl–Reissner bearing capacity model as the basis for modification, with the aim of proposing a model better suited to predicting the foundation bearing capacity of sandy soils on Quanzhou beaches. The reason for this may be that the Prandtl–Reissner model is widely recognized as the standard theory for the bearing capacity of non-viscous soil, and it is particularly applicable to dense sandy soil and gravel soil. The Hansen model and Weissick model are applied to soft clay or situations where plastic hardening characteristics need to be taken into account. In addition, the Hansen model is derived based on the modified Cambridge model. The input of cohesion and dilatancy parameters is required. However, their applicability is limited to non-cohesive sandy soil. The Weissich model takes into account the soil hardening/softening characteristics and the non-associated flow law. The parameters are complex and require calibration with experimental data, and there is a possibility of overfitting, which may lead to errors.
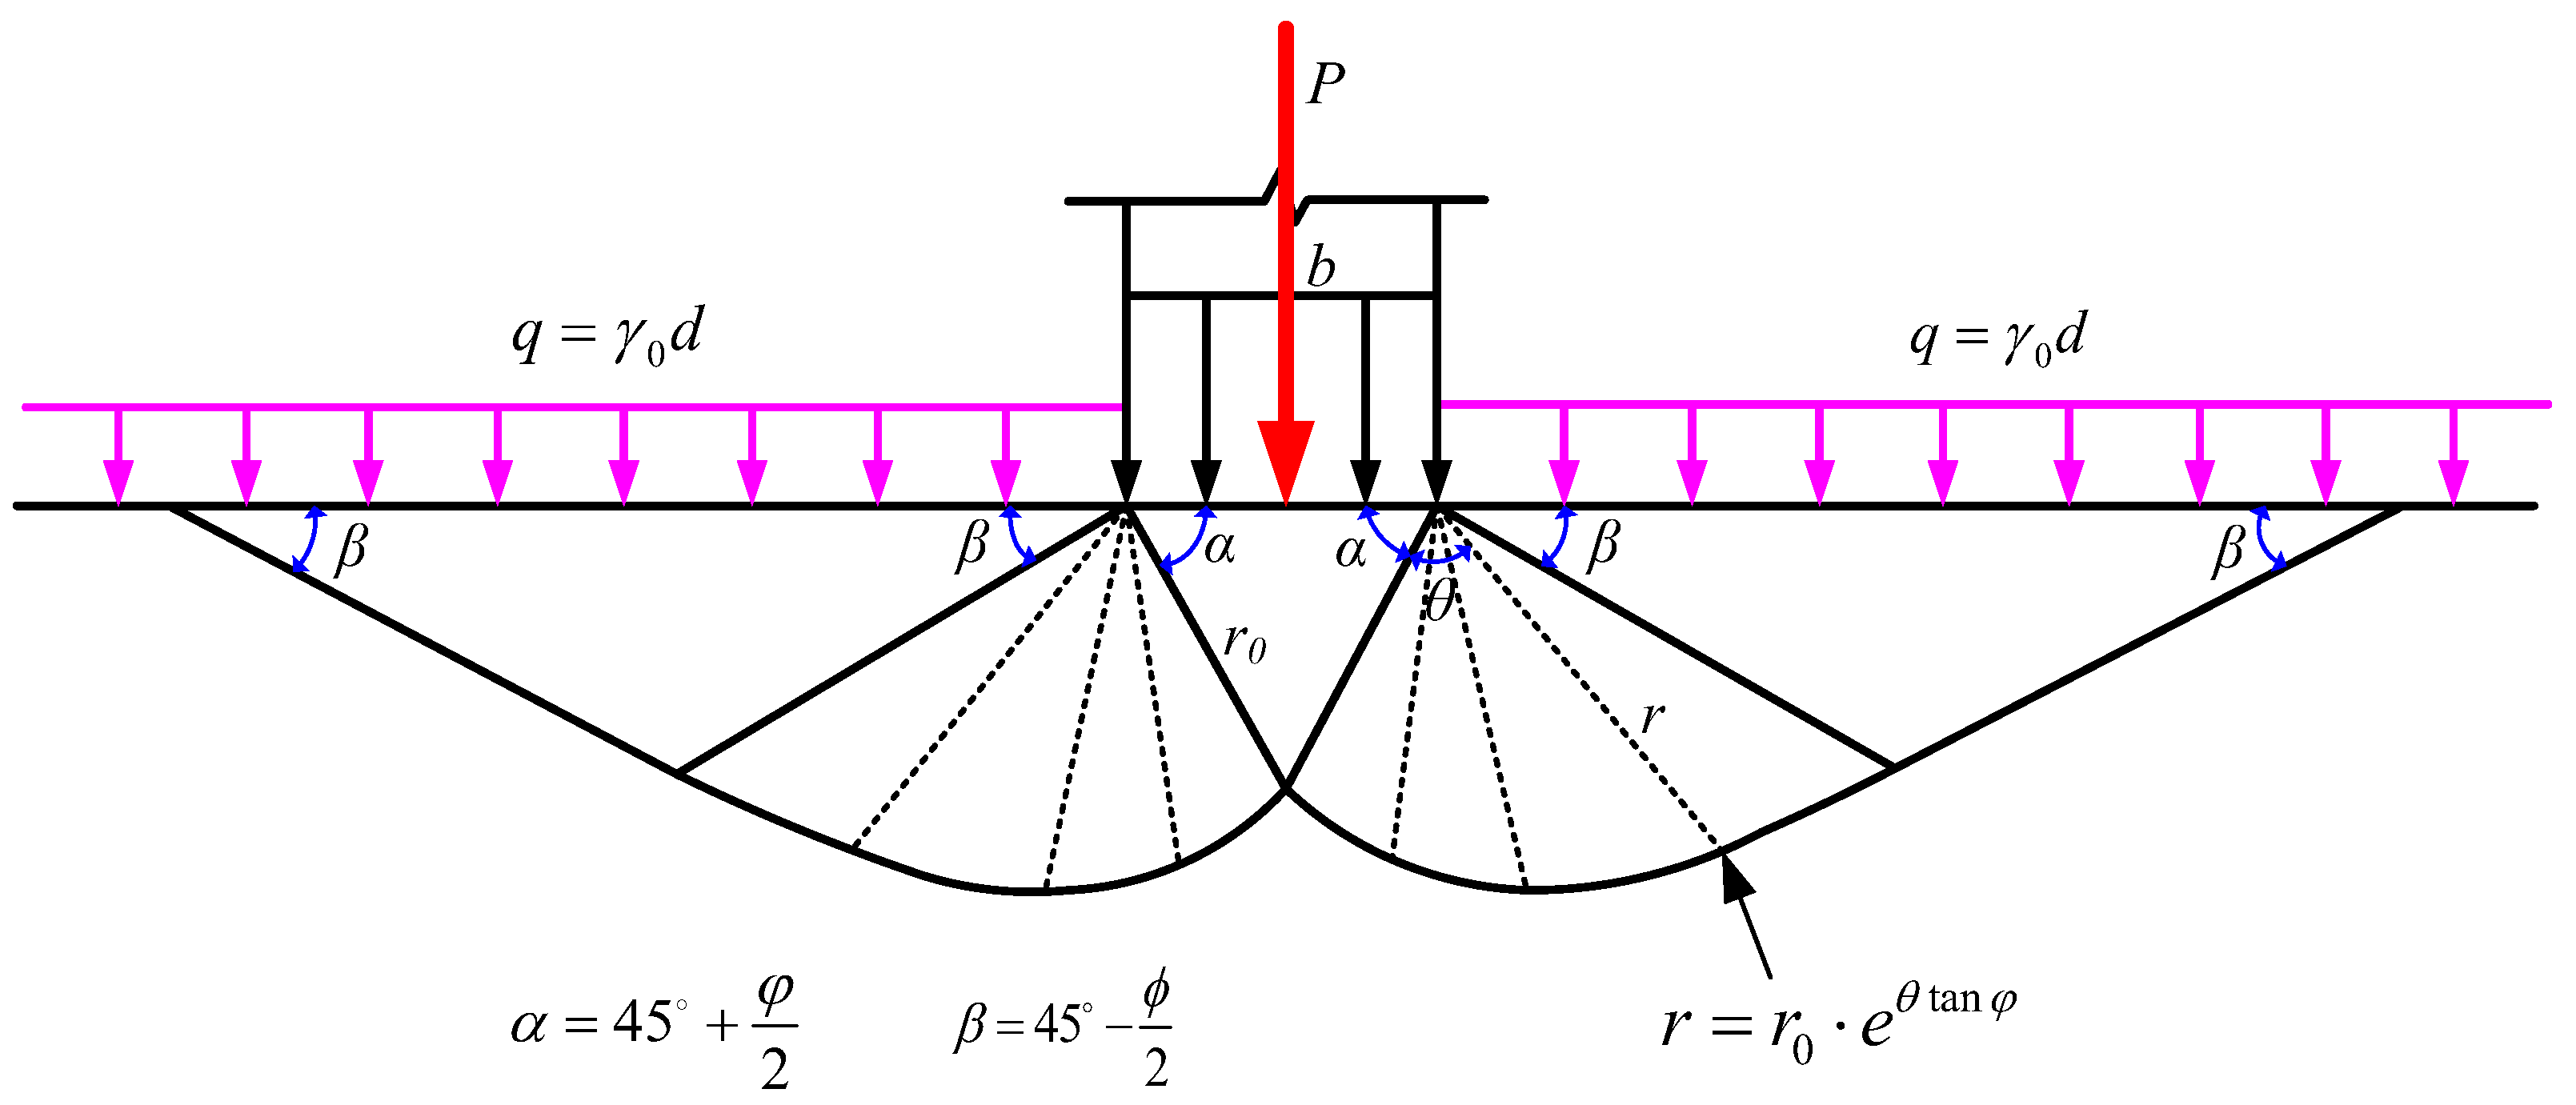
The Prandtl–Reissner model assumes a perfectly smooth foundation base and uses characteristic lines to derive the failure mode (as shown in Figure 13) and the ultimate bearing capacity calculation formula:
f u = M b γ b + M d γ m d + M c c k
where fu is the ultimate bearing capacity; ck is the cohesion; γ is the unit weight of soil below the foundation base;  γ m is the unit weight of soil above the foundation base; d is the foundation embedment depth; b is the width of the foundation base; and Mb, Md, Mc are bearing capacity factors determined by Equation (10).
M b = π 4 cot φ k + φ k π 2   M d = 1 + π cot φ k + φ k π 2   M c = π tan φ k cot φ k + φ k π 2
Due to the finding that the cohesion of coastal sand samples is essentially zero in triaxial compression tests on sandy soils, the bearing capacity formula is shown in Equation (11).
f u = 1 + π cot φ k + φ k π 2 γ b + 1 + π cot φ k + φ k π 2 γ m d
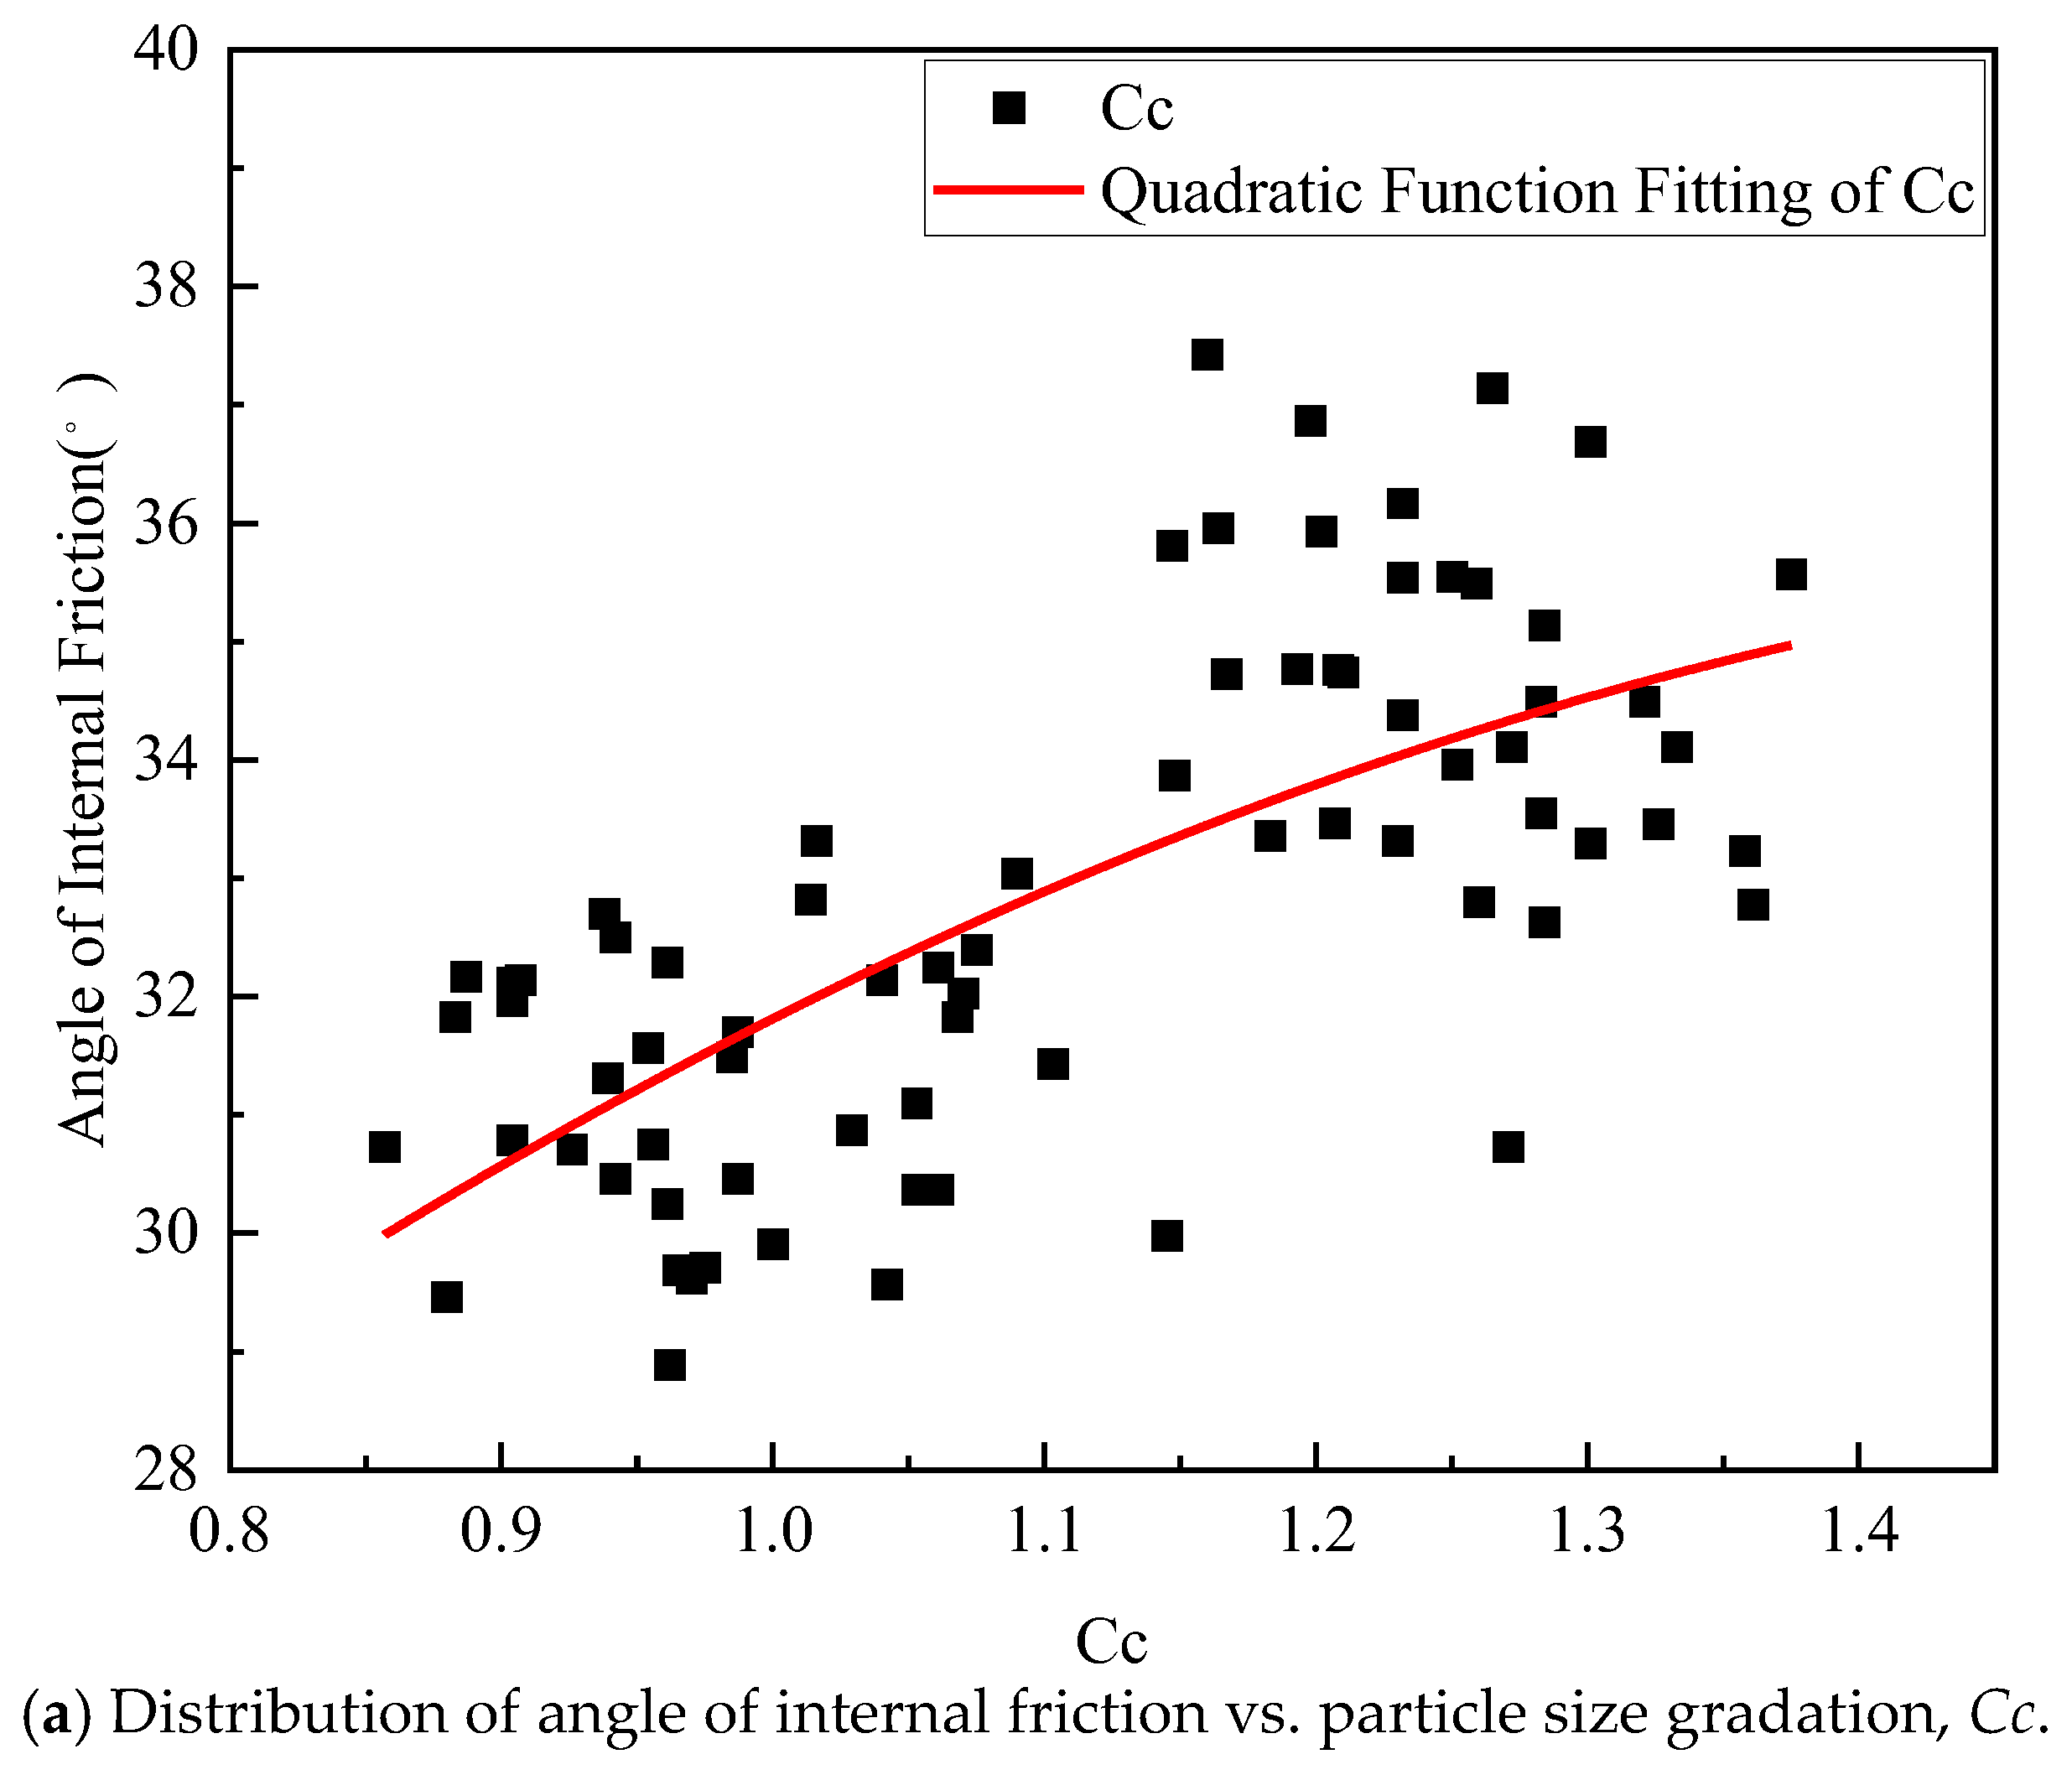
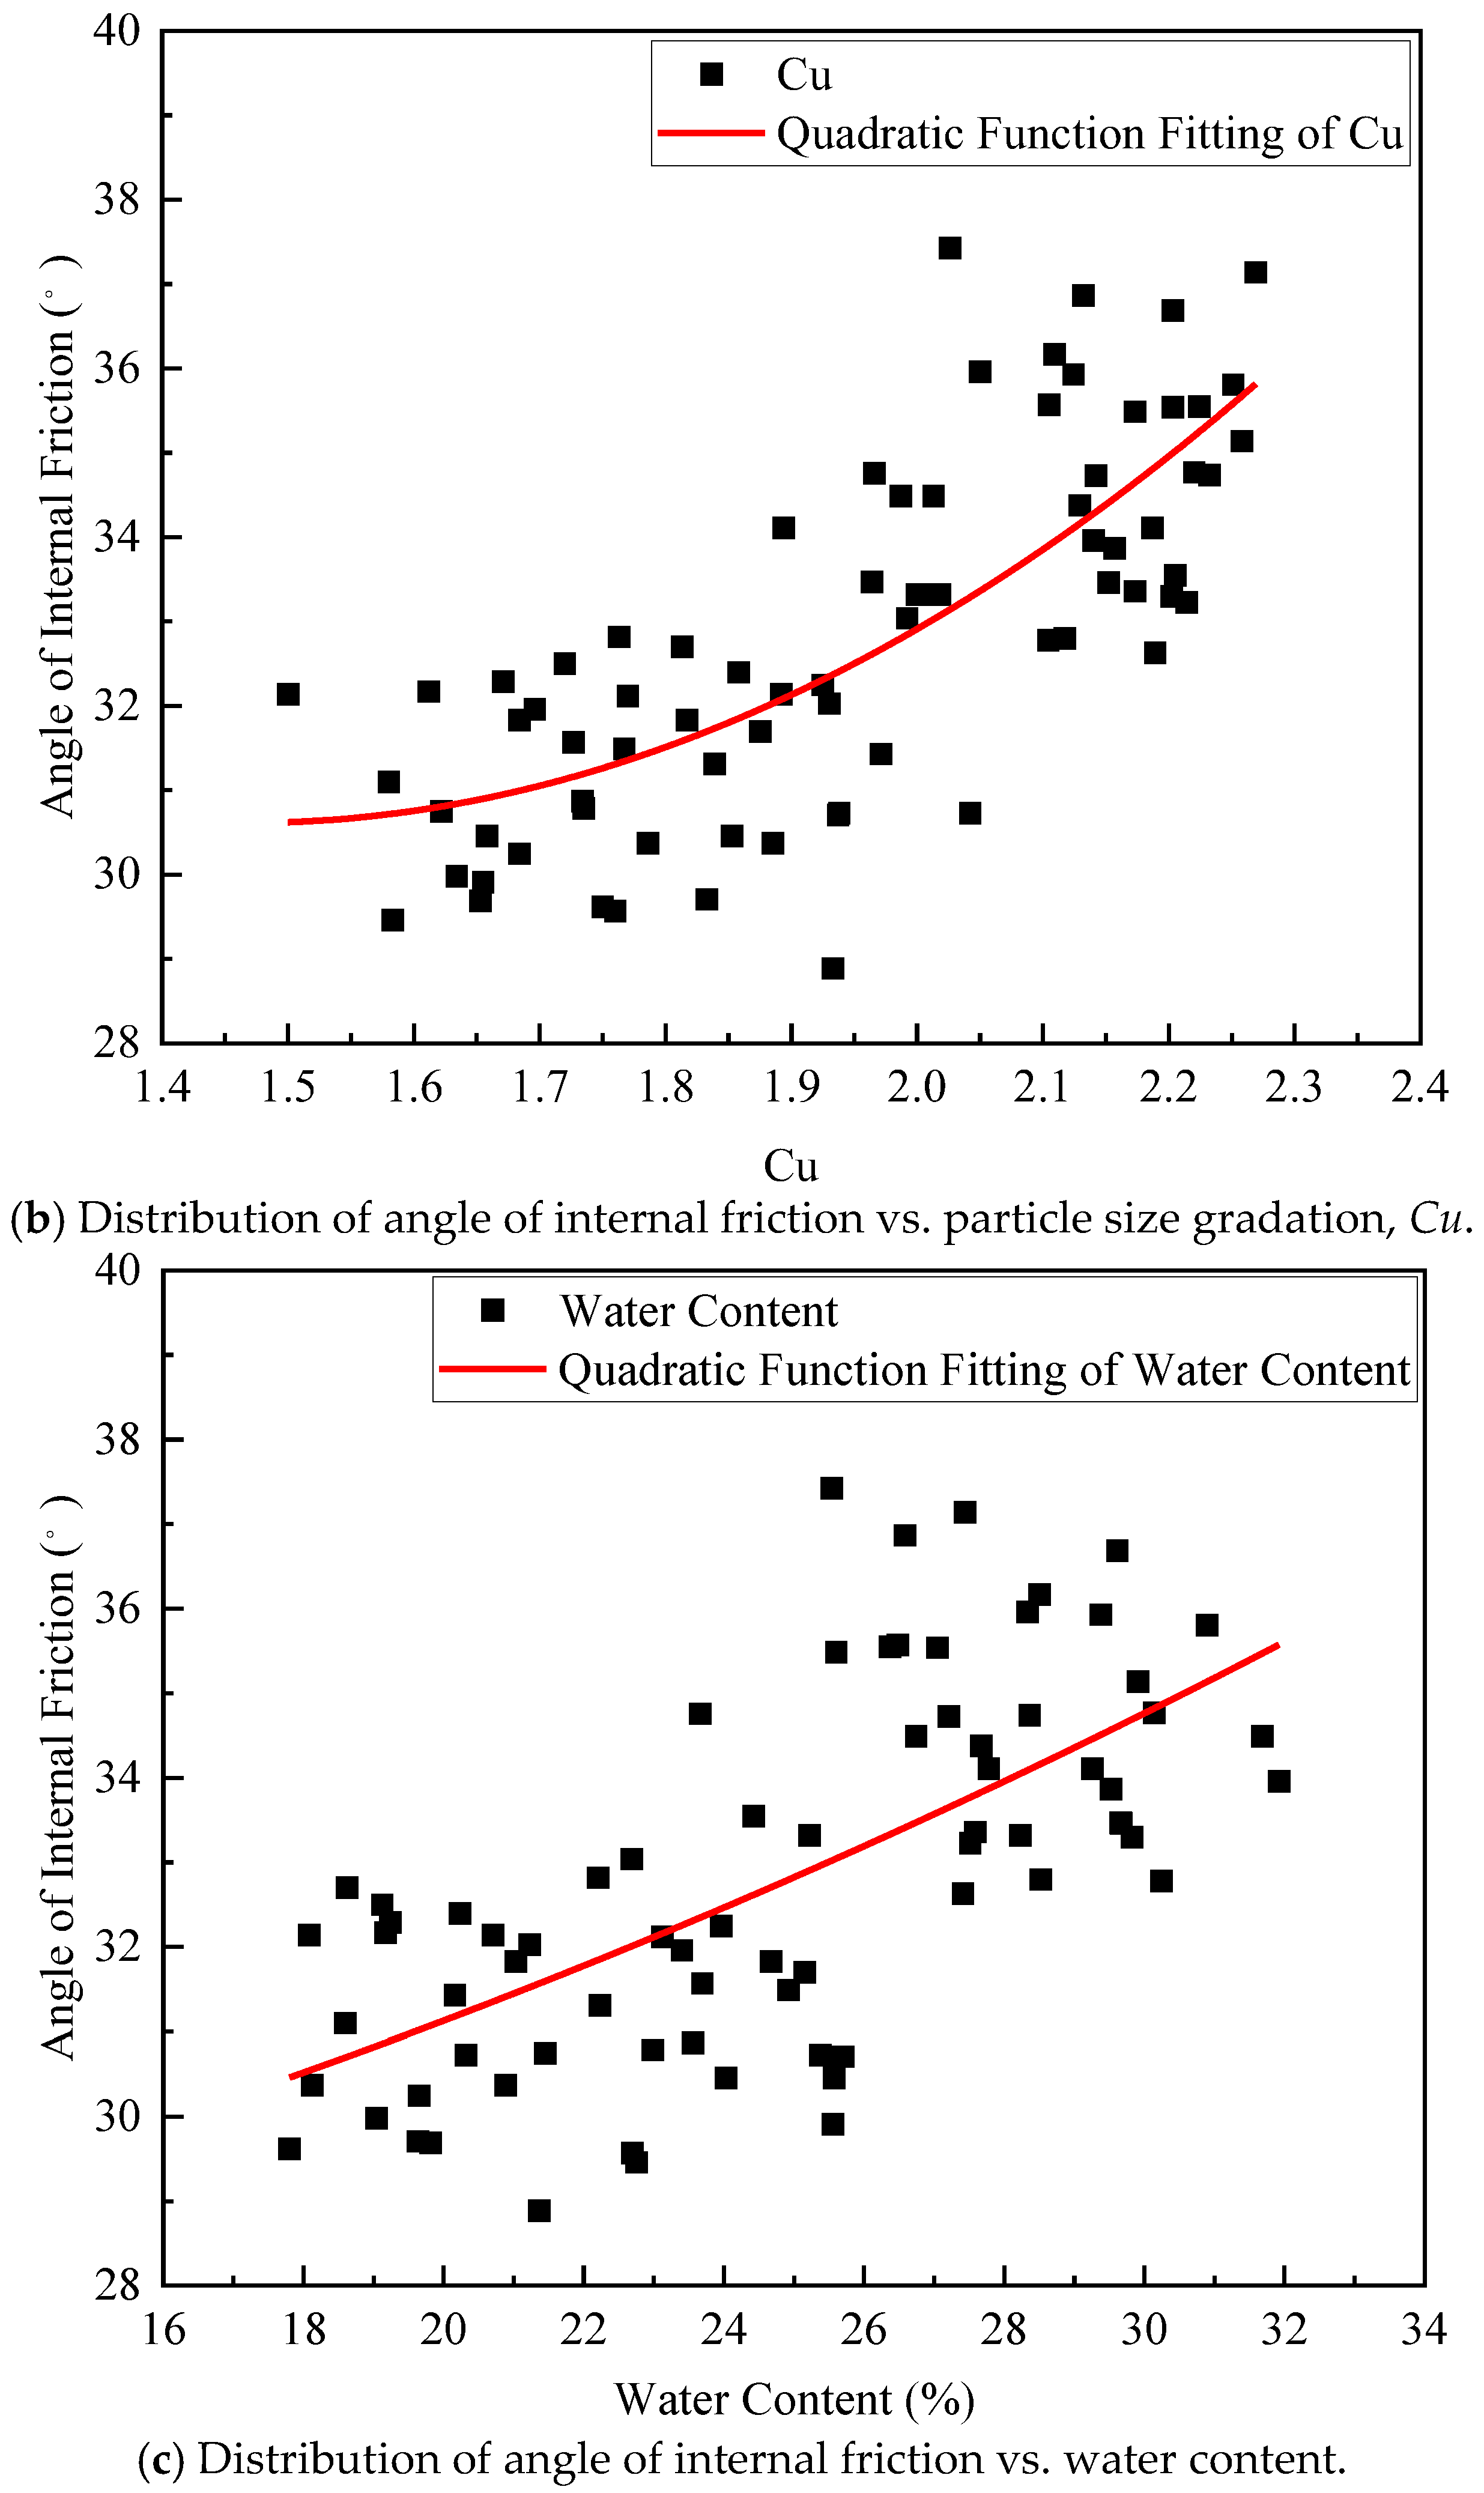
Equation (11) considers the effects of the angle of internal friction and foundation embedment depth. Since the angle of internal friction is a mechanical parameter inherent to the sandy soil, it needs to be determined through precise laboratory mechanical tests. To rapidly determine the angle of internal friction of sandy soil in the field, an attempt was made to establish a relationship between the angle of internal friction and water content as well as gradation coefficients. Figure 14 shows the relationship between the angle of internal friction ϕ and Cu, Cc, and water content. As can be seen from the figure, Cu and Cc show a positive correlation with φ. When Cu increases by 0.769, φ increases by 5°; when Cc increases by 0.518, φ increases by 4.84°. Water content also shows a positive correlation with φ: when the water content increases by 14.12%, it increases by 4.34°. Their relationship was fitted to obtain the expression for the angle of internal friction φ:
tan φ = 0.5961 0.0291 ω 0.1915 C c + 0.1220 C u + 0.5284 ω 2 + 0.0797 C c 2 0.0170 C u 2 + 0.3291 ω C c 0.0792 ω C u 0.0283 C c C u
By integrating Equations (11) and (12), a foundation bearing capacity model for shallow beach surfaces is obtained. This formula takes into account the effects of the particle gradation and water content of sandy soils, enabling the rapid determination of beach foundation bearing capacity and providing theoretical support for the site selection and design of large amusement facilities.

5.2. Validation of the Model

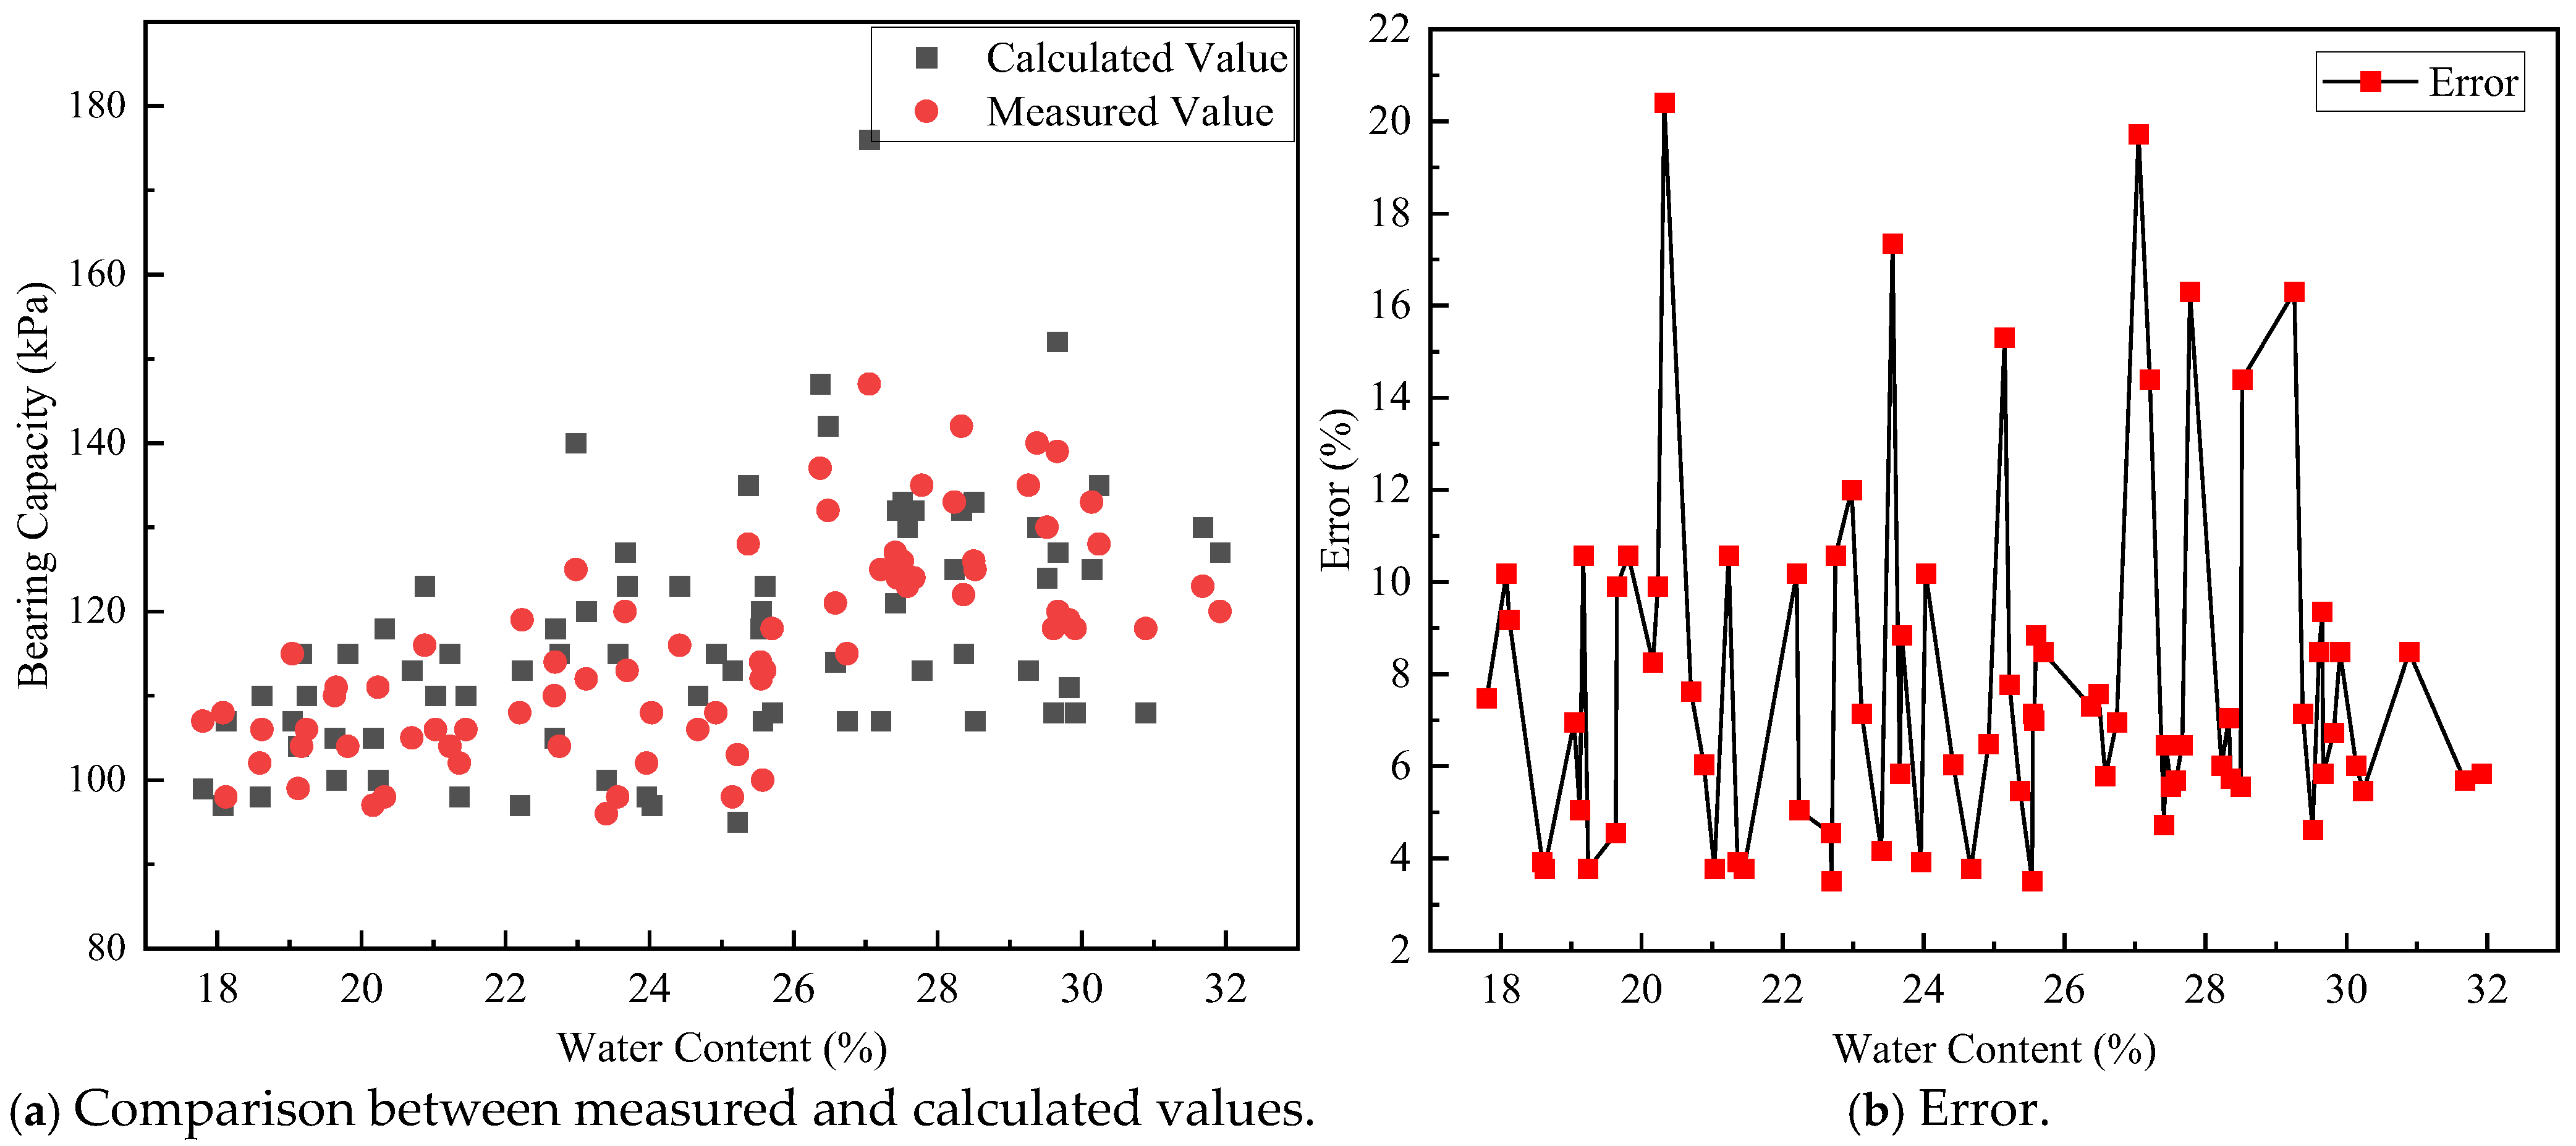
The correctness of the proposed foundation bearing capacity model was validated using in situ bearing capacity data. Figure 15a shows a comparison between the bearing capacity values calculated by the field model and the in situ-measured bearing capacity values. Since the foundation bearing capacity was obtained via dynamic penetration on-site without considering the width of the foundation base, the foundation base width b in the formula was fitted as an unknown variable. As can be seen from the figure, the measured bearing capacity values in the coastal zone are generally consistent with the calculated values from the theoretical model. Between a water content of 0 and 0.33, the theoretical calculations and measured bearing capacity increase with increasing water content. Physical and mechanical tests have shown that a water content of 0.33 is the critical point where the soil transitions from a “dry” to a “saturated” state. At this water content, the interparticle forces and pore water pressure in the soil reach equilibrium; further water addition does not significantly improve the bearing capacity and may instead cause it to decline. Therefore, 0.33 can be regarded as an approximate value for the soil’s saturated water content. The error for most points is less than 10%, with an average error of 15%. However, at certain points, the errors are larger—for example, at water contents of 20.32%, 23.56%, 25.15%, 27.05%, 27.21%, 27.78%, 28.52%, and 29.26%, the bearing capacity errors are 20.41%, 17.35%, 15.31%, 19.73%, 14.4%, 16.30%, 14.4%, and 16.30%, respectively. These errors show no discernible pattern and may be caused by on-site measurement errors. The lack of standardization in the manual operation during the on-site test and systemic error of the dynamic penetration test (DCT) make field-measured bearing capacity inaccurate. On the other hand, proposed model does not consider other factors, such as the liquid and plastic limit or relative density. The predicted bearing capacity value of the proposed model is not inaccurate. In order to improve the accuracy of the proposed model, field bearing capacity measurement and laboratory tests should be expanded. As shown in the error plot in Figure 15b, the error of the theoretical model tends to decrease slightly with increasing water content. The main reason for this is that at higher water contents, the calculation of the friction angle in the theoretical model is more accurate, leading to increased reliability of the theoretical model as the water content increases.

6. Conclusions

This paper systematically conducted physical and mechanical property tests and foundation bearing capacity measurements on Quaternary residual sand at Quanzhou Beach, China, and established a mathematical model for foundation bearing capacity. The primary conclusions are as follows:
(1)
Sandy soils in the coastal zone of Quanzhou, China, are influenced by tides, biogenic debris, and salinity, exhibiting poor gradation (Cu = 1.5–2.269), low density (relative density 33–35%), high water sensitivity (21.71–28.12%), and non-cohesiveness (cohesion = 0). Regional differences are notable: Shenhu Bay sands are dominated by finer, angular particles with stronger interparticle interlocking, while Qingshan Bay sands contain more coarse particles with better gradation uniformity. The average internal friction angle differs by 3.36°, leading to an 18.2% difference in the foundation bearing capacity, highlighting the impact of marine dynamics and sedimentary environments on soil properties.
(2)
Under unsaturated conditions (water content < 34%), the bearing capacity of sandy soil shows nonlinear growth with increasing water content. When the water content rises from 17.8% to 31.92%, the bearing capacity increases by 12.15%. This is closely related to the redistribution of pore water and changes in stress at particle contacts, which influence shear strength. The positive correlation (r = 0.46–0.47) between gradation parameters (Cu, Cc) and bearing capacity indicates that gradation-induced differences in particle compactness are key factors affecting water–strength interactions.
(3)
Considering the non-cohesiveness of coastal sandy soils, the classical L. Prandtl–Reissner model was modified. By fitting triaxial test data, relationships were established between the internal friction angle, water content, and gradation. The proposed bearing capacity model, validated by 123 groups of in situ dynamic penetration tests, achieves an average error of about 15%, outperforming traditional models such as the Terzaghi (overestimation) and Hansen (underestimation) models. In poorly graded sands, prediction accuracy is improved by over 30%, enabling the rapid determination of beach foundation capacity and providing theoretical support for coastal engineering design.
(4)
The model is mainly applicable to static loading conditions not only in Quanzhou beach sands, but also on the southeast coast of China, without considering salt–pore water interactions or complex dynamic loads (e.g., earthquakes and cyclic waves). Future research should focus on quantifying salinity–water coupling effects, investigating sandy soil behavior under cyclic and dynamic loading, and extending model validation to other coastal regions to enhance its applicability and engineering value.

Author Contributions

Conceptualization, L.S. and C.P.; methodology, C.P.; software, S.Y.; validation, L.S., C.P. and X.W.; formal analysis, F.Z.; investigation, L.S., C.P. and W.P.; resources, L.Q.; data curation, G.Z.; writing—original draft preparation, L.S. and L.Q.; writing—review and editing, F.Z. and L.Q.; visualization, X.W.; supervision, G.Z.; project administration, L.S.; funding acquisition, F.Z. All authors have read and agreed to the published version of the manuscript.

Funding

This work is supported by the project of China Geological Survey (G rant No.DD20230301701).

Data Availability Statement

Data are contained within the article.

Conflicts of Interest

The authors declare no conflicts of interest.

References

  1. Liu, J.; Kuang, W.; Zhang, Z.; Xu, X.; Qin, Y.; Ning, J.; Zhou, W.; Zhang, S.; Li, R.; Yan, C.; et al. Spatiotemporal characteristics, patterns, and causes of land-use changes in China since the late 1980s. J. Geogr. Sci. 2014, 24, 195–210. [Google Scholar] [CrossRef]
  2. Wei, B.; Li, Y.; Suo, A.; Zhang, Z.; Xu, Y.; Chen, Y. Spatial suitability evaluation of coastal zone, and zoning optimisation in ningbo, China. Ocean Coast. Manag. 2021, 204, 105507. [Google Scholar] [CrossRef]
  3. Xiao, X.; Li, Y.; Shu, F.; Wang, L.; He, J.; Zou, X.; Chi, W.; Lin, Y.; Zheng, B. Coupling relationship of human activity and geographical environment in stage-specific development of urban coastal zone: A case study of Quanzhou Bay, China (1954–2020). Front. Mar. Sci. 2022, 8, 781910. [Google Scholar] [CrossRef]
  4. Miura, K.; Maeda, K.; Furukawa, M.; Toki, S. Physical characteristics of sands with different primary properties. Soils Found. 1997, 37, 53–64. [Google Scholar] [CrossRef]
  5. Xu, Y.Q.; Li, P.Y.; Li, P.; Liu, L.J.; Cao, C.X.; Feng, X.L. Physical and mechanical properties of fine-grained soil in the Zhejiang-Fujian coastal area, China. Mar. Georesources Geotechnol. 2011, 29, 333–345. [Google Scholar] [CrossRef]
  6. Shen, Y.; Zhu, Y.; Liu, H.; Li, H.; Ge, H. Macro-meso effects of gradation and particle morphology on the compressibility characteristics of calcareous sand. Bull. Eng. Geol. Environ. 2018, 77, 1047–1055. [Google Scholar] [CrossRef]
  7. Liang, K.; Chen, G.; Du, X.; Xu, C.; Yang, J. A unified formula for small-strain shear modulus of sandy soils based on extreme void ratios. J. Geotech. Geoenviron. Eng. 2023, 149, 04022127. [Google Scholar] [CrossRef]
  8. Hentschel, M.L.; Page, N.W. Selection of descriptors for particle shape characterization. Part. Part. Syst. Charact. 2003, 20, 25–38. [Google Scholar] [CrossRef]
  9. Wang, Q.; Chen, G. The Bedrock and earth works of compacted powder land in coastal areas. J. Coast. Res. 2020, 112, 371–374. [Google Scholar] [CrossRef]
  10. Du, J.; Jiang, X.; Liu, B.; Li, T.; Jiang, N. Dynamic modulus and damping ratio of organic-matter-disseminated sand under cyclic triaxial condition. Soils Found. 2025, 65, 101616. [Google Scholar] [CrossRef]
  11. Jiang, Q.; Huang, M.; Xu, K.; Cui, M. Statistical Damage Constitutive Model of Micp-Treated Calcareous Sand. J. Eng. Geol. 2024, 32, 1526–1535. [Google Scholar]
  12. Abedi, S.; Mirghasemi, A.A. Particle shape consideration in numerical simulation of assemblies of irregularly shaped particles. Particuology 2011, 9, 387–397. [Google Scholar] [CrossRef]
  13. Hosseininia, E.S. Discrete element modeling of inherently anisotropic granular assemblies with polygonal particles. Particuology 2012, 10, 542–552. [Google Scholar] [CrossRef]
  14. Shan, S.; Pei, X.; Zhan, W. Estimating deformation modulus and bearing capacity of deep soils from dynamic penetration test. Adv. Civ. Eng. 2021, 2021, 1082050. [Google Scholar] [CrossRef]
  15. Yang, S.; Shen, Y.; Zhang, L. Influence of particle morphology on bearing capacity of coral sand foundations. J. Geotech. Geoenviron. Eng. 2021, 147, 04021076. [Google Scholar]
  16. Yuliet, R.; Pratama, A.; Sugiyanto, S. Characterization of coastal sands in Padang: Implications for liquefaction and bearing capacity. Geotech. Geol. Eng. 2023, 41, 987–1002. [Google Scholar]
  17. Shinohara, K.; Oida, M.; Golman, B. Effect of particle shape on angle of internal friction by triaxial compression test. Powder Technol. 2000, 107, 131–136. [Google Scholar] [CrossRef]
  18. Terzaghi, K. Theoretical Soil Mechanics; Wiley: Hoboken, NJ, USA, 1943. [Google Scholar]
  19. Vesic, A.S. Analysis of ultimate loads of shallow foundations: Closure of discussion of original paper J. Soil Mech. Found. Div. Jan. 1973. 1F, 6R. J. GEOTECH. ENGNG. DIV. V100, N. GT8, 1974, P949–951. Int. J. Rock Mech. Min. Sci. Geomech. Abstr. 1974, 11, A230. [Google Scholar] [CrossRef]
  20. Bolton, M.D. Discussion: The strength and dilatancy of sands. Géotechnique 1987, 37, 219–226. [Google Scholar] [CrossRef]
  21. Janabi, F.H.; Raja, R.A.; Sakleshpur, V.A.; Prezzi, M.; Salgado, R. Experimental study of shape and depth factors and deformations of footings in sand. J. Geotech. Geoenviron. Eng. 2023, 149, 04022128. [Google Scholar] [CrossRef]
  22. Vanapalli, S.K.; Mohamed, F.M.O. Bearing capacity of model footings in unsaturated soils. In Experimental Unsaturated Soil Mechanics; Springer: Berlin/Heidelberg, Germany, 2007; pp. 483–493. [Google Scholar]
  23. Mujtaba, H.; Farooq, K.; Sivakugan, N.; Das, B.M. Evaluation of relative density and friction angle based on SPT-N values. KSCE J. Civ. Eng. 2018, 22, 572–581. [Google Scholar] [CrossRef]
  24. Raja, R.A.; Sakleshpur, V.A.; Prezzi, M.; Salgado, R. Effect of relative density and particle morphology on the bearing capacity and collapse mechanism of strip footings in sand. J. Geotech. Geoenviron. Eng. 2023, 149, 04023052. [Google Scholar] [CrossRef]
  25. Liu, M.D.; Carter, J.P. Virgin compression of structured soils. Géotechnique 1999, 49, 43–57. [Google Scholar] [CrossRef]
  26. Seed, H.B.; Idriss, I.M. Simplified procedure for evaluating soil liquefaction potential. J. Soil Mech. Found. Div. 1971, 97, 1249–1273. [Google Scholar] [CrossRef]
  27. Nguyen, D.L.; Ohtsuka, S.; Hoshina, T.; Isobe, K. Discussion on size effect of footing in ultimate bearing capacity of sandy soil using rigid plastic finite element method. Soils Found. 2016, 56, 93–103. [Google Scholar] [CrossRef]
  28. Raja, R.A.; Sakleshpur, V.A.; Prezzi, M.; Salgado, R. Load response and soil displacement field for a vertically loaded strip footing on sand underlain by a stiff base. J. Geotech. Geoenviron. Eng. 2023, 149, 04023106. [Google Scholar] [CrossRef]
  29. Cao, Z.; Youd, T.L.; Yuan, X. Chinese dynamic penetration test for liquefaction evaluation in gravelly soils. J. Geotech. Geoenviron. Eng. 2013, 139, 1320–1333. [Google Scholar] [CrossRef]
  30. Issam Mohamed Abdelhamid, M.; Gabr, A.K.; Mehdi, H.A.; Arab, M. Correlating physical and mechanical properties of soil with dynamic penetration tests. J. Al-Azhar Univ. Eng. Sect. 2022, 17, 512–527. [Google Scholar] [CrossRef]
  31. Vangla, P.; Gali, M.L. Effect of particle size of sand and surface asperities of reinforcement on their interface shear behavior. Geotext. Geomembr. 2016, 44, 254–268. [Google Scholar] [CrossRef]
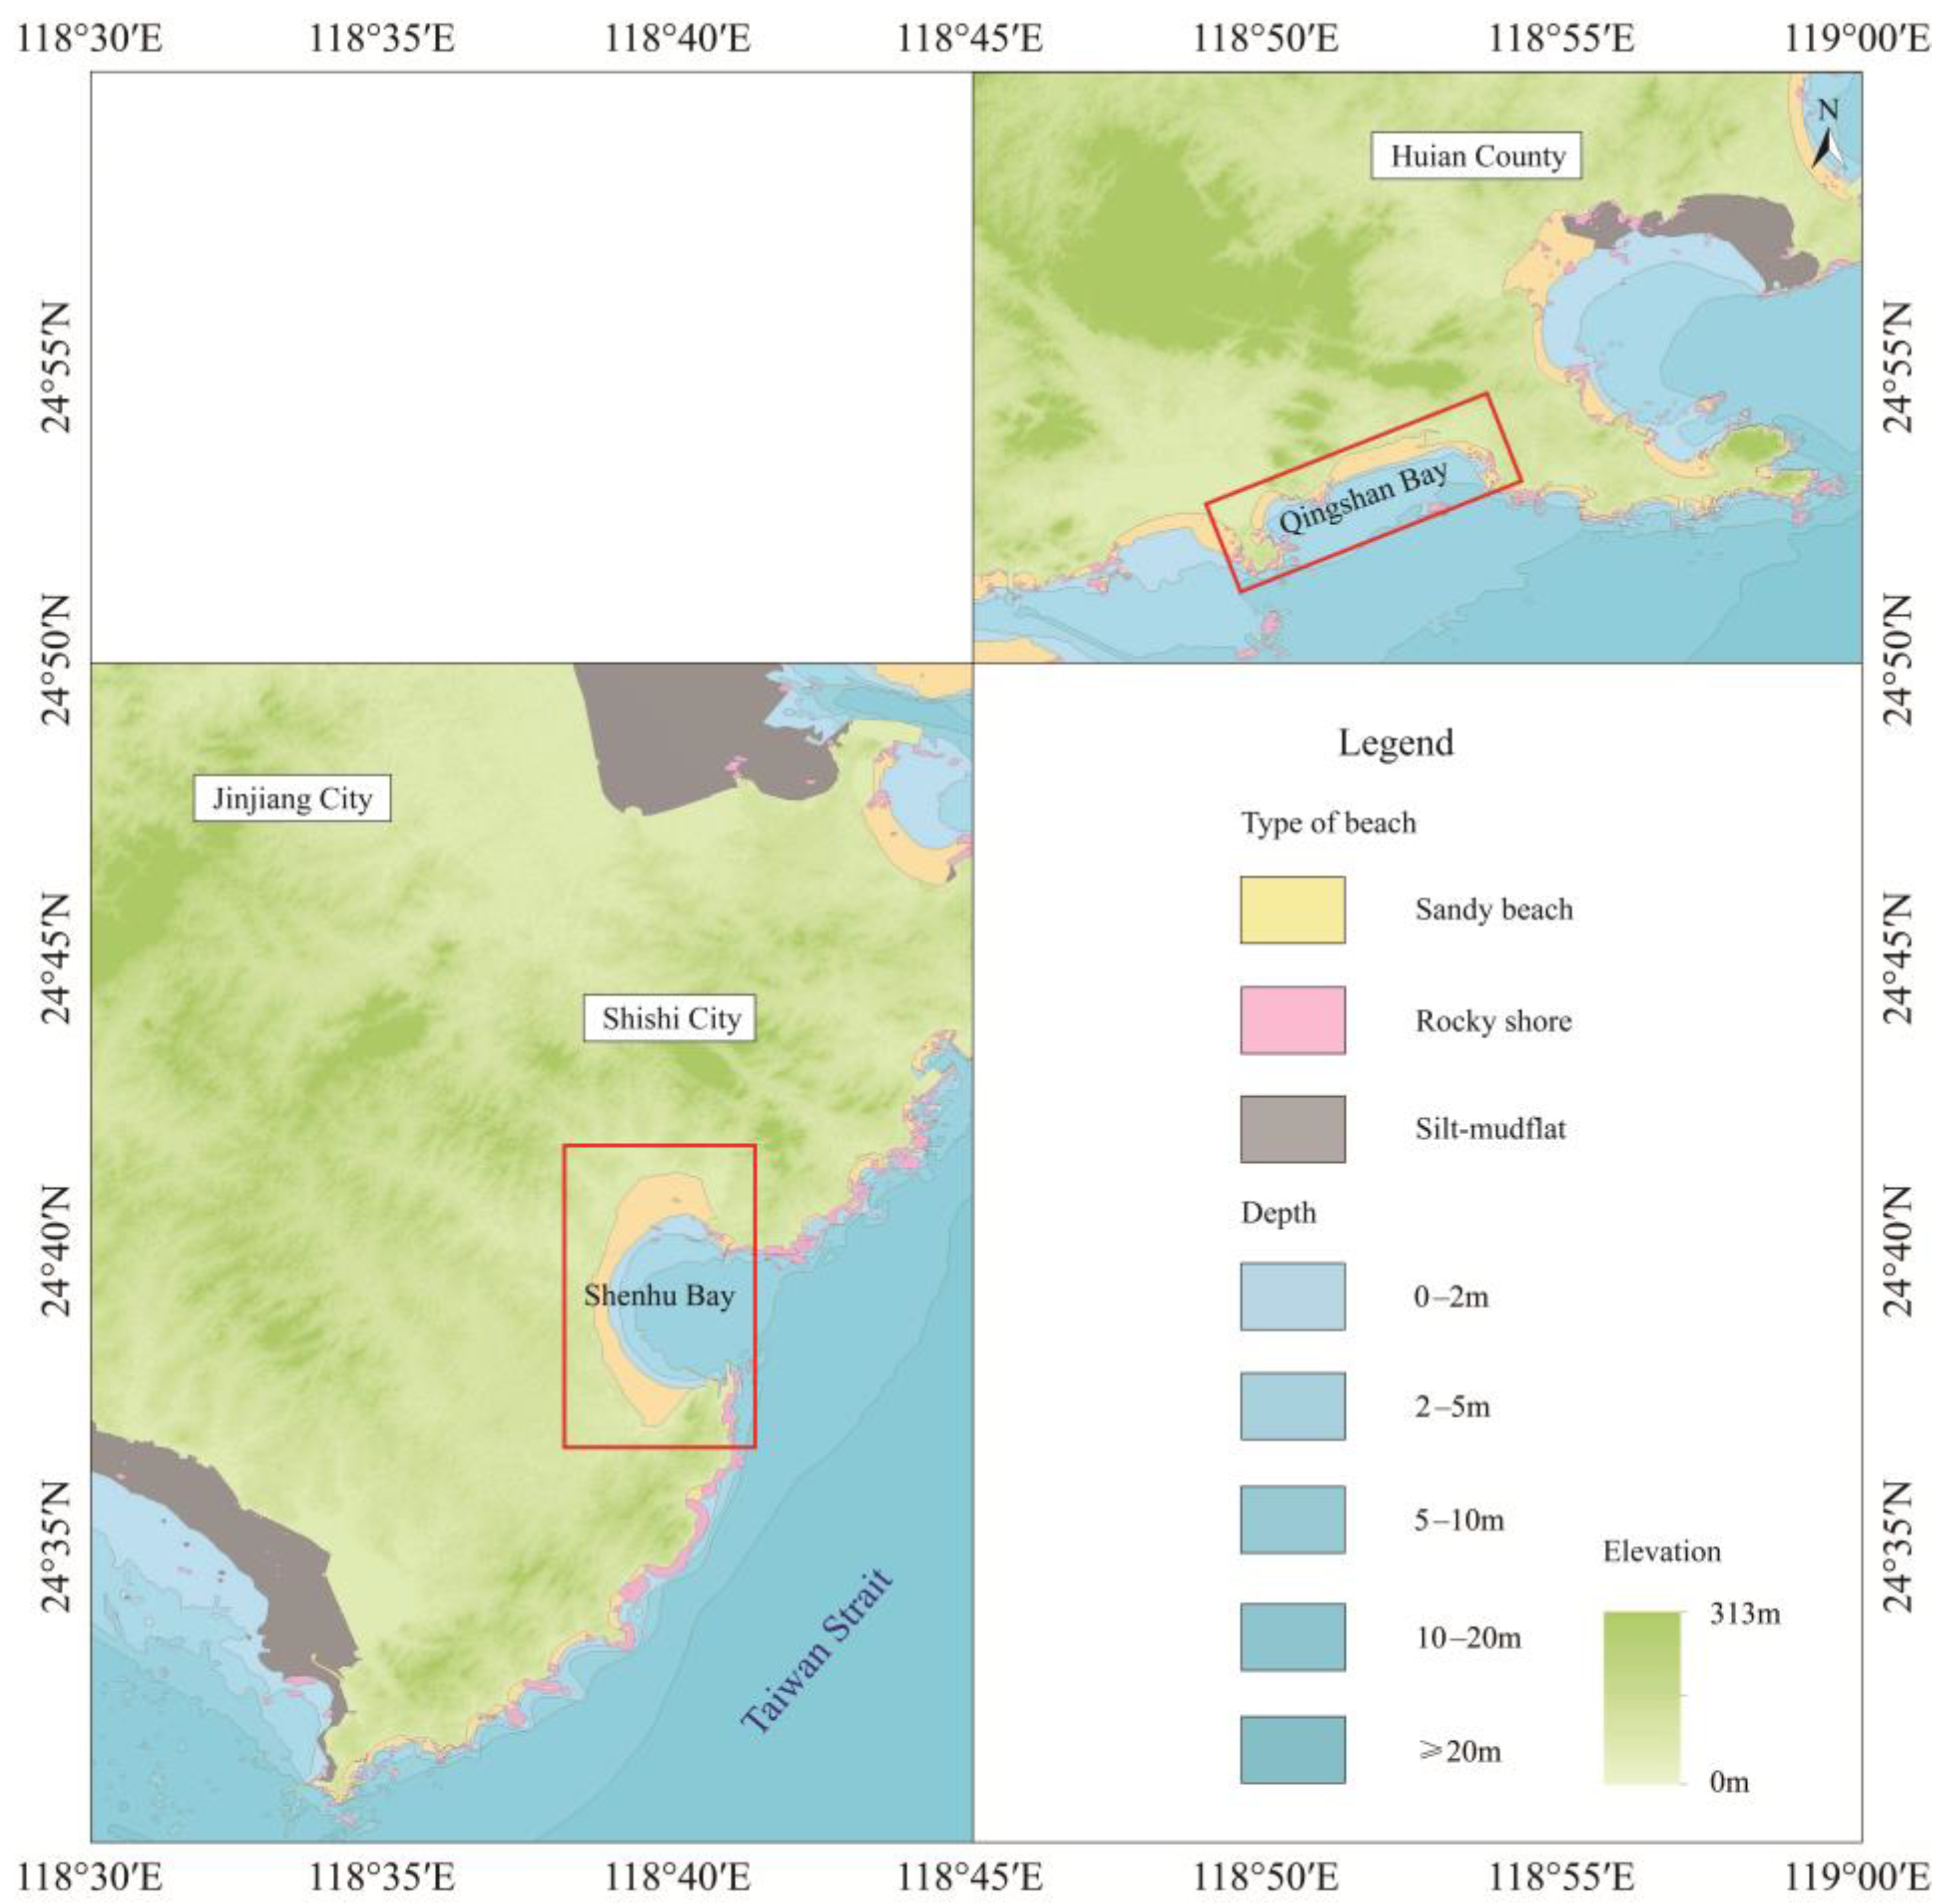
Figure 1. Geographical location of the study area.
Buildings 15 03104 g001
Figure 2. In situ dynamic penetration test and core sampling in the field.
Buildings 15 03104 g002aBuildings 15 03104 g002b
Figure 3. Instruments related to sandy soil tests.
Buildings 15 03104 g003
Figure 4. Box Plots of Water Content and Bearing Capacity Distributions at Different Locations for Beach Sandy Soils.
Buildings 15 03104 g004aBuildings 15 03104 g004b
Figure 5. Box plots of particle size gradation distributions at different locations for beach sandy soils.
Buildings 15 03104 g005
Figure 6. Box plot of relative density distribution at different locations for beach sandy soils.
Buildings 15 03104 g006
Figure 7. Box plots of liquid limit and plastic limit distributions at different locations for beach sandy soils.
Buildings 15 03104 g007
Figure 8. Box plots of compression modulus and compression coefficient distributions at different locations for beach sandy soils.
Buildings 15 03104 g008
Figure 9. Box plot of angle of internal friction distribution at different locations for beach sandy soils.
Buildings 15 03104 g009
Figure 10. Scatter plots of bearing capacity vs. mechanical indices.
Buildings 15 03104 g010aBuildings 15 03104 g010b
Figure 11. Pit conditions after sampling at sampling sites in different water content areas.
Buildings 15 03104 g011
Figure 12. Comparison of various models with actual bearing capacity.
Buildings 15 03104 g012aBuildings 15 03104 g012b
Figure 13. Failure mode of Prandtl–Reissner model.
Buildings 15 03104 g013
Figure 14. Relationship between angle of internal friction and particle size gradation vs. water content.
Buildings 15 03104 g014aBuildings 15 03104 g014b
Figure 15. Comparison between the beach sandy soil foundation bearing capacity model and measured data.
Buildings 15 03104 g015
Table 1. Technical parameters of light dynamic penetrometer.
ModelHammer WeightDrop HeightMaximum Penetration DepthMaximum Depth of Penetration HammerProbe Length
Light Dynamic Penetrometer10 kg50 cm4–6 m40 mm90 cm
Disclaimer/Publisher’s Note: The statements, opinions and data contained in all publications are solely those of the individual author(s) and contributor(s) and not of MDPI and/or the editor(s). MDPI and/or the editor(s) disclaim responsibility for any injury to people or property resulting from any ideas, methods, instructions or products referred to in the content.