Article

Neural Network-Based Prediction of Compression Behaviour in Steel–Concrete Composite Adapter for CFDST Lattice Turbine Tower

1
School of Civil Engineering, Chongqing University, Chongqing 400045, China
2
China Construction Equipment & Engineering Co., Ltd., Nanjing 210033, China
*
Author to whom correspondence should be addressed.
Buildings 2025, 15(17), 3103; https://doi.org/10.3390/buildings15173103
Submission received: 23 July 2025 / Revised: 16 August 2025 / Accepted: 27 August 2025 / Published: 29 August 2025
(This article belongs to the Section Building Structures)

Abstract

The prestressed concrete-filled double skin steel tube (CFDST) lattice tower has emerged as a promising structural solution for large-capacity wind turbine systems due to its superior load-bearing capacity and economic efficiency. The steel–concrete composite adapter (SCCA) is a key component that connects the upper tubular steel tower to the lower lattice segment, transferring axial loads. However, the compressive behaviour of the SCCA remains underexplored due to its complex multi-shell configuration and steel–concrete interaction. This study investigates the axial compression behaviour of SCCAs through refined finite element simulations, identifying diagonal extrusion as the typical failure mode. The analysis clarifies the distinct roles of the outer and inner shells in confinement, highlighting the dominant influence of outer shell thickness and concrete strength. A sensitivity-based parametric study highlights the significant roles of outer shell thickness and concrete strength. To address the high cost of FE simulations, a 400-sample database was built using Latin Hypercube Sampling and engineering-grade material inputs. Using this dataset, five neural networks were trained to predict SCCA capacity. The Dropout model exhibited the best accuracy and generalization, confirming the feasibility of physics-informed, data-driven prediction for SCCAs and outperforming traditional empirical approaches. A graphical prediction tool was also developed, enabling rapid capacity estimation and design optimization for wind turbine structures. This tool supports real-time prediction and multi-objective optimization, offering practical value for the early-stage design of composite adapters in lattice turbine towers.

1. Introduction

The prestressed concrete-filled double skin steel tube (CFDST) lattice tower is a promising structural solution for large-capacity wind turbine systems. It offers superior load-bearing capacity and economic efficiency [1]. In this hybrid system, a tubular steel segment is installed at the top of the tower. It facilitates standardized connections with the nacelle and optimizes the overall dynamic behaviour of the structure [2,3,4]. The adapter connects the upper tubular steel tower to the lower lattice segment, transferring axial loads.
In earlier designs, reinforced concrete (RC) adapters were commonly used for this purpose. However, these adapters often exhibited cracking, limited fatigue resistance, and poor adaptability to complex joint geometries. Notably, while steel–concrete composite adapters (SCCAs) have proven effective in large-scale structures such as cable-stayed bridges and high-rise buildings [5,6,7,8], the load transfer path in wind turbine towers differs fundamentally from the combined bending–shear–torsion demands in these other applications. These shortcomings have driven the development of steel–concrete composite adapters (SCCAs), which offer superior mechanical performance and construction efficiency [9,10]. Like CFDST columns, SCCAs incorporate inner and outer steel tubes with a concrete core, offering enhanced axial strength and ductility, and significantly outperforming traditional RC adapters in terms of compressive performance and fatigue resistance [11,12,13]. Unlike conventional tubular-hybrid towers that use axisymmetric ring-shaped SCCAs, lattice-hybrid towers require polygonal SCCAs to interface with angular lattice connections—posing unique challenges in corner stress mitigation and asymmetric confinement.
The structure of the prestressed CFDST lattice wind turbine tower system is illustrated in Figure 1, showing the spatial arrangement of the lattice columns, the adapter, and the upper steel segment. The adapter comprises concentric inner and outer steel shells, which are filled with high-strength concrete and prestressed by internal tendons anchored to a base plate. The corner columns of the lattice tower are connected to the outer steel shell via flanged joints, while the upper tubular steel segment is attached through the inner shell. To improve load-bearing capacity and structural stability, the sealed annular cavity between the steel shells is fully filled with concrete.
Although this adapter has been adopted in engineering practice, its axial compressive behaviour under ultimate loading conditions remains insufficiently understood. This is particularly critical given that the adapter is directly responsible for transferring vertical loads from the nacelle and upper tower to the supporting lattice columns. An inadequate understanding of its compression performance could compromise the structural safety and serviceability of the entire hybrid tower system [9,10,14].
A substantial body of work has investigated the axial compression behaviour of CFDST columns and stub columns, focusing on factors such as steel–concrete interface behaviour, bearing capacity, wall thickness, and material strength [15,16,17,18,19,20,21,22,23,24,25,26]. However, most of the existing research has concentrated on standardized column elements under idealized boundary conditions, with limited attention paid to structural configurations involving multi-shell components, prestressing effects, or embedded connections—features that are central to the behaviour of SCCAs. Moreover, the steel-concrete interactions of such components under complex stress distributions remain largely unexplored [27,28,29]. These factors introduce significant deviations from ideal column behaviour and must be considered to ensure reliable performance of lattice tower adapters. Further investigation is therefore essential to understand how such multi-shell, highly integrated configurations influence axial compressive performance under practical loading scenarios.
Additionally, accurately calculating the axial bearing capacity of SCCAs is crucial for the design and structural integrity of hybrid wind turbine towers. Traditional analytical methods, such as simple superposition theory, unified theory, and pseudo-concrete theory [30,31,32,33], struggle to capture the nonlinear, multi-parameter interactions arising from the SCCA’s complex configuration. Even numerical simulation becomes computationally expensive when modelling multi-shell confinement and prestressing [28], while full-scale testing remains costly and time-consuming. To address these challenges, this study proposes the use of a neural network model to predict the compressive bearing capacity of SCCAs. Neural networks offer fast and accurate prediction capability, especially for composite structures with coupled parameters and nonlinear behaviour. Previous studies have demonstrated their effectiveness in similar structural contexts, supporting their application as a practical alternative to traditional methods [34,35,36,37,38].
The SCCA’s axial compressive behaviour remains insufficiently understood due to its complex multi-shell structure and steel–concrete interactions. To overcome the limitations of traditional theoretical and experimental approaches, this study proposes a data-driven framework to evaluate the axial compressive behaviour of steel–concrete composite adapters (SCCAs) in prestressed CFDST lattice wind turbine towers. Refined finite element (FE) simulations are first conducted to reveal the deformation characteristics, stress development, and failure modes under axial loading. Guided by sensitivity analysis, a Latin Hypercube Sampling (LHS) strategy is used to construct a well-stratified parametric database of 400 samples. Based on this dataset, multiple neural network models are trained to predict the compressive capacity of SCCAs. The optimal model is then applied to enable rapid structural evaluation and assist in multi-objective design optimization.
The remainder of this paper is organized as follows: Section 2 presents the finite element modelling approach and validation; Section 3 describes the sensitivity analysis and database generation; Section 4 develops and evaluates the neural network models and introduces the graphical prediction tool and its applications; and Section 5 concludes the work with key findings and implications.

2. Model and Compression Behaviour of SCCA

The SCCA is modelled in a refined manner using ABAQUS 2021, where axial displacement is applied to simulate the axial compression conditions and analyse the SCCA’s stress mode. This approach enables the evaluation of failure patterns, load-displacement curves, and other characteristics of axial compressive bearing capacity, facilitating the selection and optimization of sensitive parameters.

2.1. Modelling

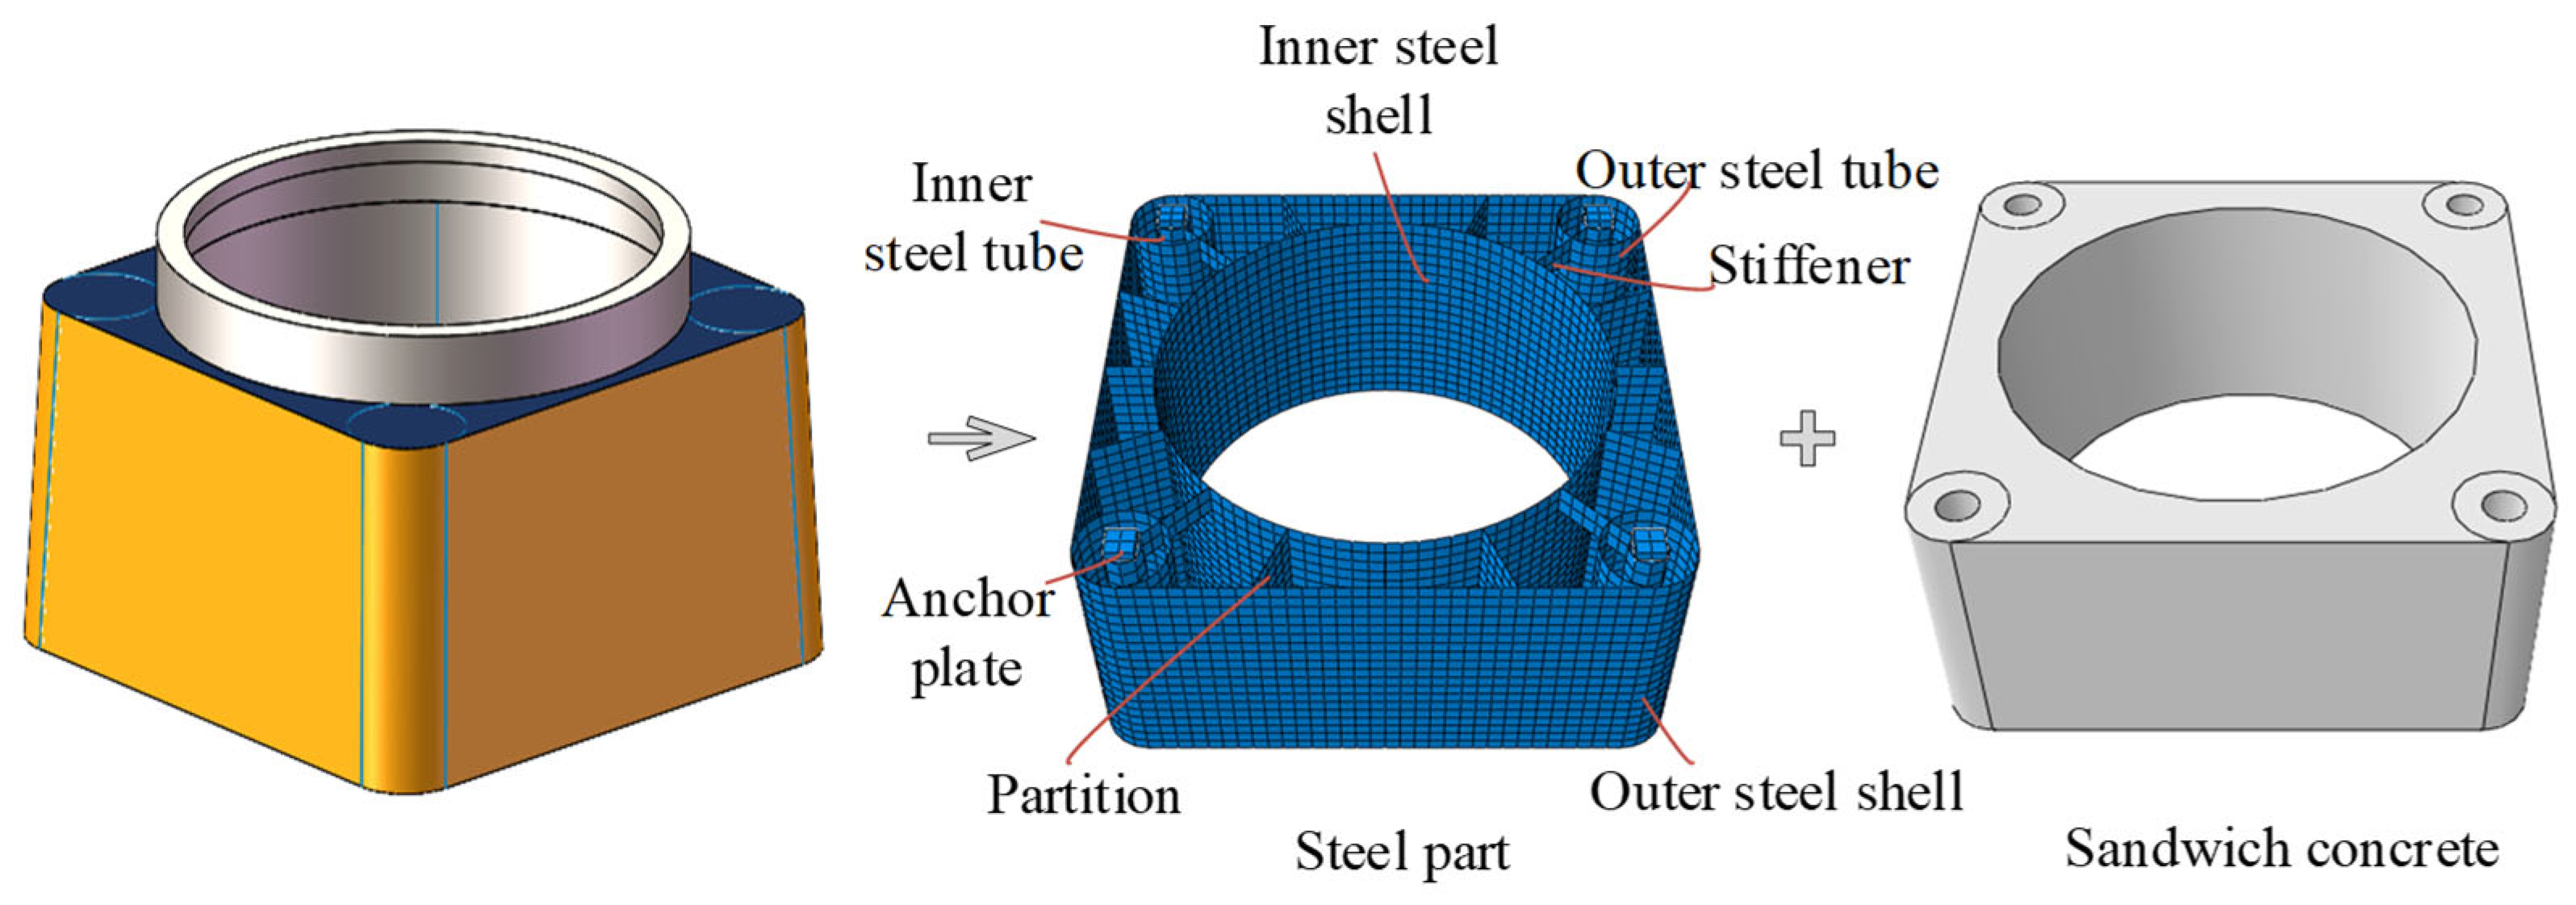
The steel section is constituted by inner and outer tubes, shells, stiffeners, and partition (Figure 2). As the primary focus is on the compressive behaviour of the composite structure of the SCCA, the SCCA model is simplified by omitting the effects at the connection between the corner columns and the SCCA, as well as disregarding the connection between the inner shell and the tubular steel segments during model establishment.
The steel material is represented using an ideal elastic–plastic model with an elastic modulus (Es) of 206,000 MPa, a Poisson’s ratio (μs) of 0.3, and a yield strength (fy) of 295 MPa, which can be mathematically expressed as follows:
σ s = E s ε s , ε s f y E s f y , ε s > f y E s
where σs and εs respectively denote the steel stress and strain.
The selection of the uniaxial stress–strain curve for concrete must consider the structural configuration of the SCCA. For SCCAs, the transverse deformation of the concrete is constrained by the outer steel tube, allowing the concrete to be considered as having similar material characteristics to the core concrete of the CFST members. Therefore, the concrete damage plasticity (CDP) model in ABAQUS [39], which employs a unique yield function and non-associated flow potential to effectively capture the irrecoverable plastic damage of concrete under low confining pressures, particularly during crushing [40], was utilized, with concrete parameters provided by Tao [21]. The parameters in the model were determined by Equations (2)–(4):
ψ = 56.3 ( 1 ξ ) ξ 0.5 6.672 e 7.4 4.64 + ξ ξ > 0.5
f b 0 / f c = 1.5 ( f c ) 0.075
K c = 5.5 5 + 2 ( f c ) 0.075
where fc is the concrete compressive strength; ψ is the dilation angle; e0 is the flow potential eccentricity; (fb0/fc′) is the ratio of biaxial and uniaxial compressive strength; and Kc is the compressive meridian. The flow potential eccentricity (e) is 0.1, the viscosity parameter (γ) is 0.0005, and according to ACI 318 [41], the concrete’s elastic modulus (Ec) and Poisson’s ratio (μc) were specified as 4730 f c and 0.2.
The CDP model requires definition of the concrete’s uniaxial compression and tension behaviours. Han [42] and Liu [43] adjusted the peak strain and descending phase of the stress–strain curve to account for tube confinement in composite members, resulting in a finite element-compatible confined concrete model (Equation (5)):
y = 2 x x 2 ( x 1 ) x β 0 x 1 2 + x ( x > 1 )
where x = ε ε 0 ,   y = σ σ 0 ;   σ 0 = f c ,   f c is the compressive strength of the concrete cylinder (MPa); ε 0 = ε c + 800 × ξ 0.2 × 10 6 ;   β 0 = 2.36 × 10 5 [ 0.25 × ( ξ 0.5 ) 7 ] f c 0.7 0.5 0.12 ;   = A s 0 f y 0 A ce f ck .
Additionally, the concrete damage model requires a uniaxial tensile stress–strain relationship. This study adopts the Equation (6) proposed by Shen [44]:
y = 1.2 x 0.2 x 2 ( x 1 ) x 0.31 σ p 2 x 1 1.7 + x ( x > 1 )
where x = ε c ε p ; y = σ c σ p ; σ p = 0.26 ( 1.25 f c ) 2 / 3 ; ε p = 43.1 σ p ( μ ε ) .
Shell elements (S4R) were used for the steel tubes and stiffeners, and solid elements (C3D8R) for concrete. A mesh sensitivity study comparing 150 mm, 100 mm, and 75 mm meshes showed that the failure mode remained unchanged and the ultimate axial capacity varied by less than 2%; therefore, a 100 mm mesh was adopted to balance accuracy and computational efficiency. Welded connections among steel members were modelled using Tie constraints, while the outer and inner steel tubes and stiffeners were embedded in the concrete via the Embedded Region technique to capture composite action and confinement effects.
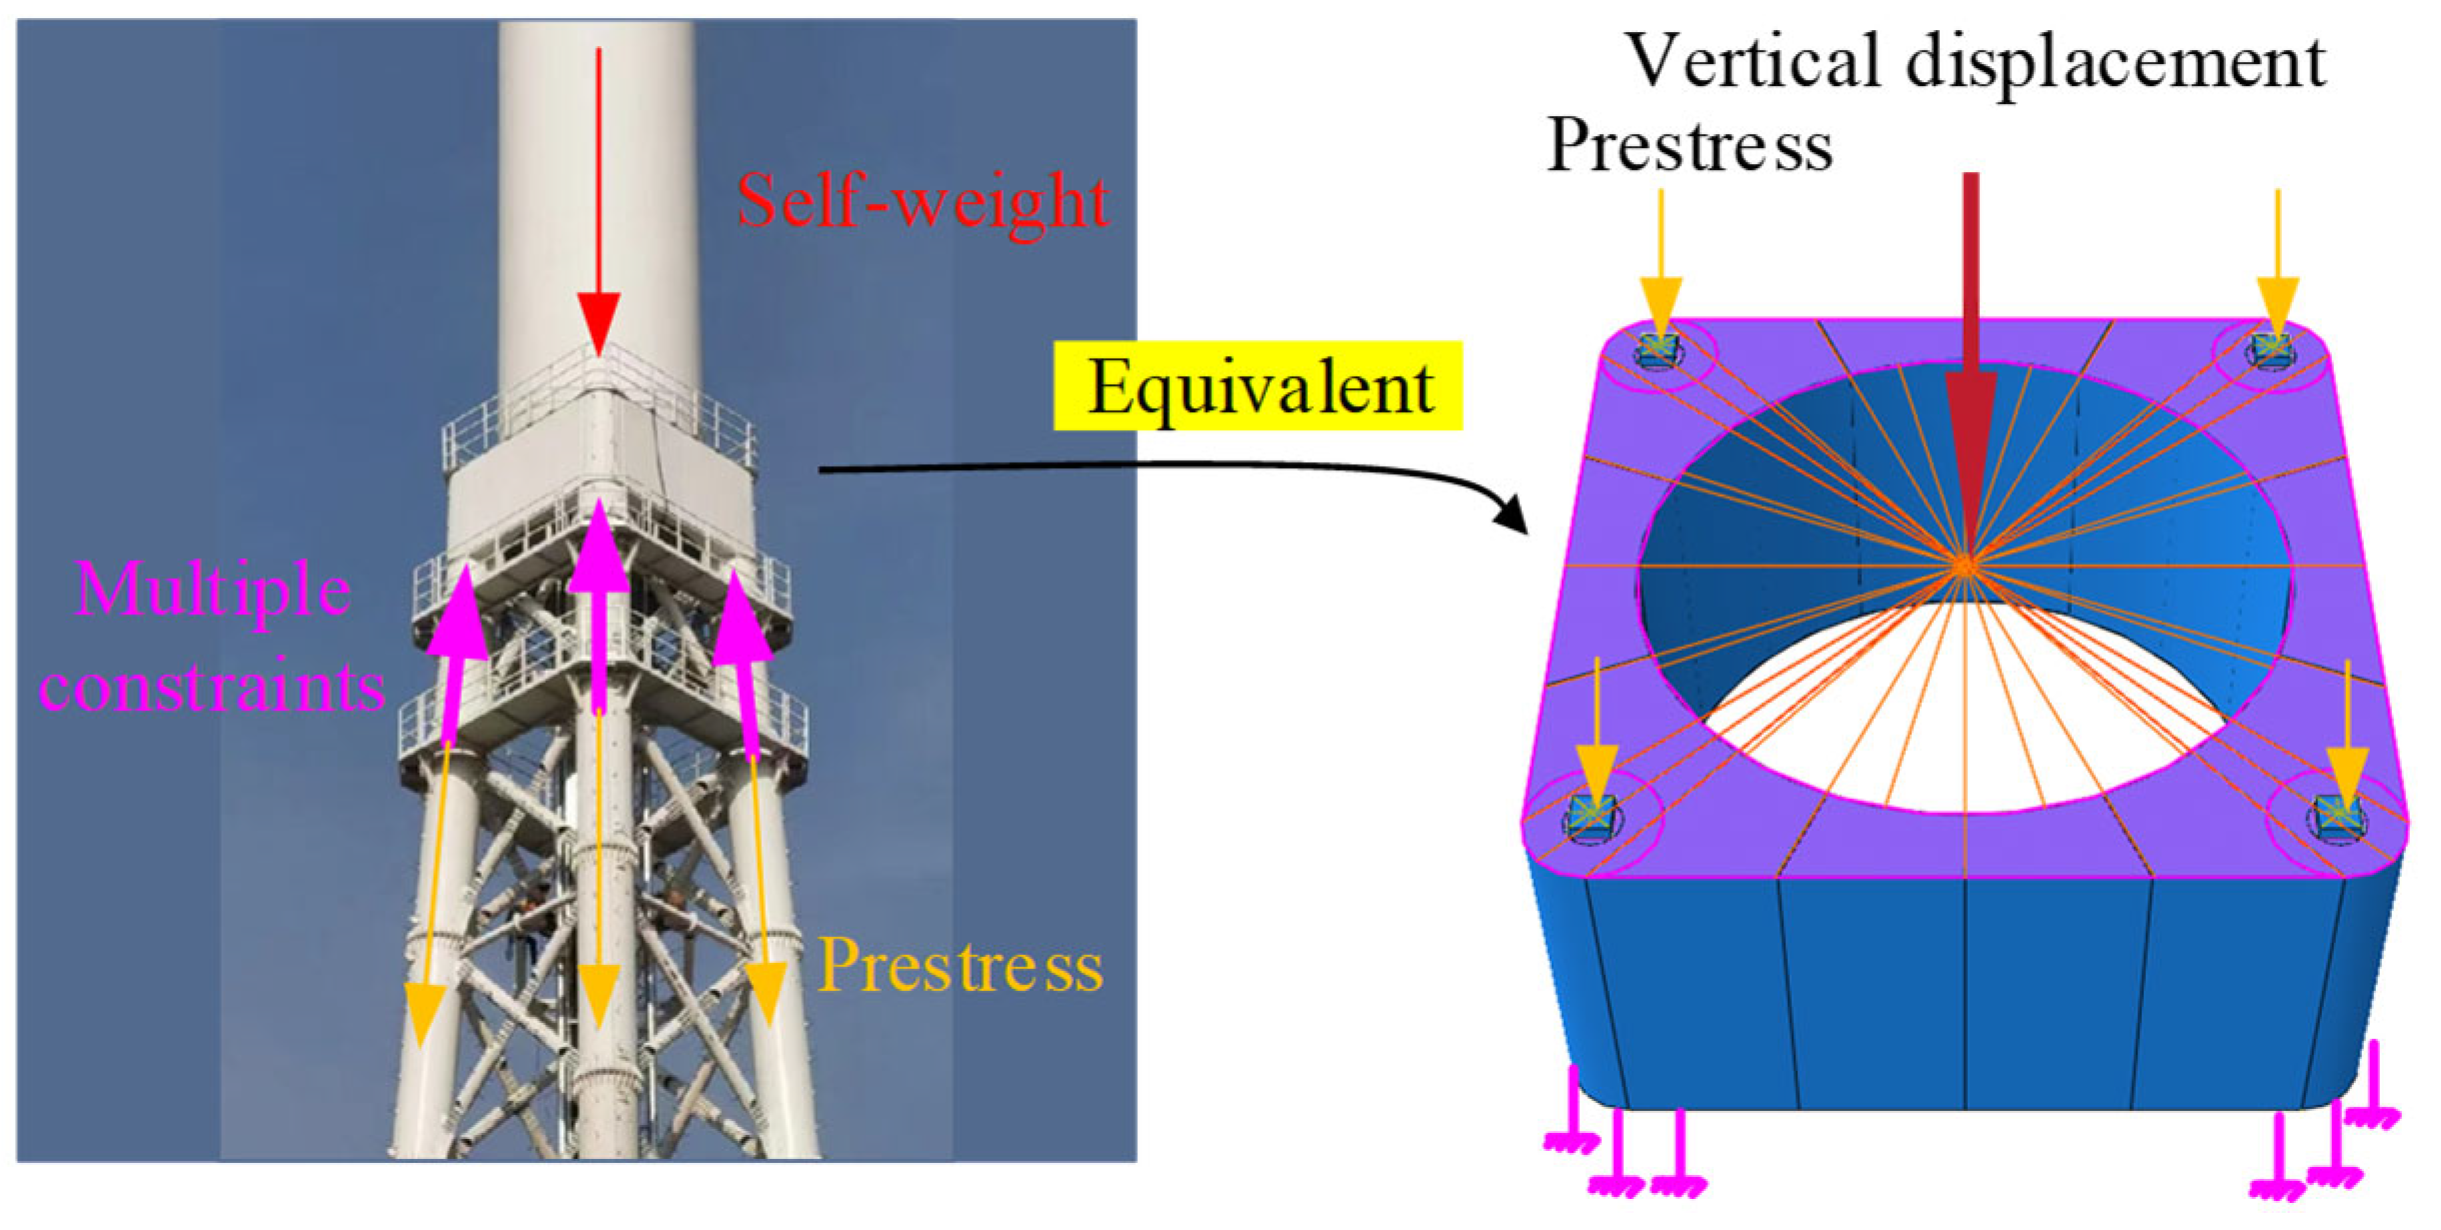
Figure 3 illustrates the method for the visualization setup of the boundary conditions. The bottom ends were fully restrained. The top interface of the sandwiched concrete is coupled to its central point, where axial compression is induced by applying a downward vertical displacement. This displacement-controlled loading ensures uniform compression of the SCCA while preventing unintended eccentricity or rotational effects, closely representing the actual axial load transfer in hybrid tubular lattice towers. Prestress is applied at the central point of the anchor plate on the upper section of the inner steel tube, serving as a vertical load of 11.5 kN, selected based on the bearing capacity of the lattice tower.

2.2. Structural Response and Failure Mechanism

2.2.1. Load–Displacement Behaviour

The load–displacement curve is depicted in Figure 4, with point O denoting the initial 0.2 mm displacement caused by the application of prestress. The corresponding deformation patterns at each stage—OA, AB, and BC—are illustrated in Figure 5 (U1 horizontal, units: mm).
In the OA stage, the system behaves in a linear-elastic manner. The steel remains fully elastic, and the confined concrete deforms compatibly without signs of cracking. No significant out-of-plane deformation is observed in the shells at this stage. Point A denotes the proportional limit, where initial yielding and minor deviation from linearity appear.
In the AB stage, plastic deformation gradually develops in both materials. The steel begins yielding, and the sandwich concrete exhibits increasing lateral pressure under confinement, leading to localized plasticity. Outward bulging of the outer shell and inward displacement of the inner shell become visible. By point B, the system reaches its ultimate capacity, accompanied by global buckling in the shells and progressive concrete damage.
In the BC stage, the bearing capacity of the structure undergoes degradation. The concrete experiences severe crushing, and both shells show intensified local buckling—especially near the top region where radial extrusion is concentrated. Despite this, the load-bearing capacity decreases gradually rather than abruptly, owing to the residual strength maintained by the steel confinement.
Thus, this curve can be summarized as a typical load–displacement relationship, with points A, B, and C representing three critical states. Point A marks the proportional limit, determined using the geometrical method [29]. Point B corresponds to the ultimate point, indicating the maximum bearing capacity. Point C is defined as the failure point, with its load value set at 85% of the ultimate capacity.

2.2.2. Stress–Strain Distribution and Failure Mechanism

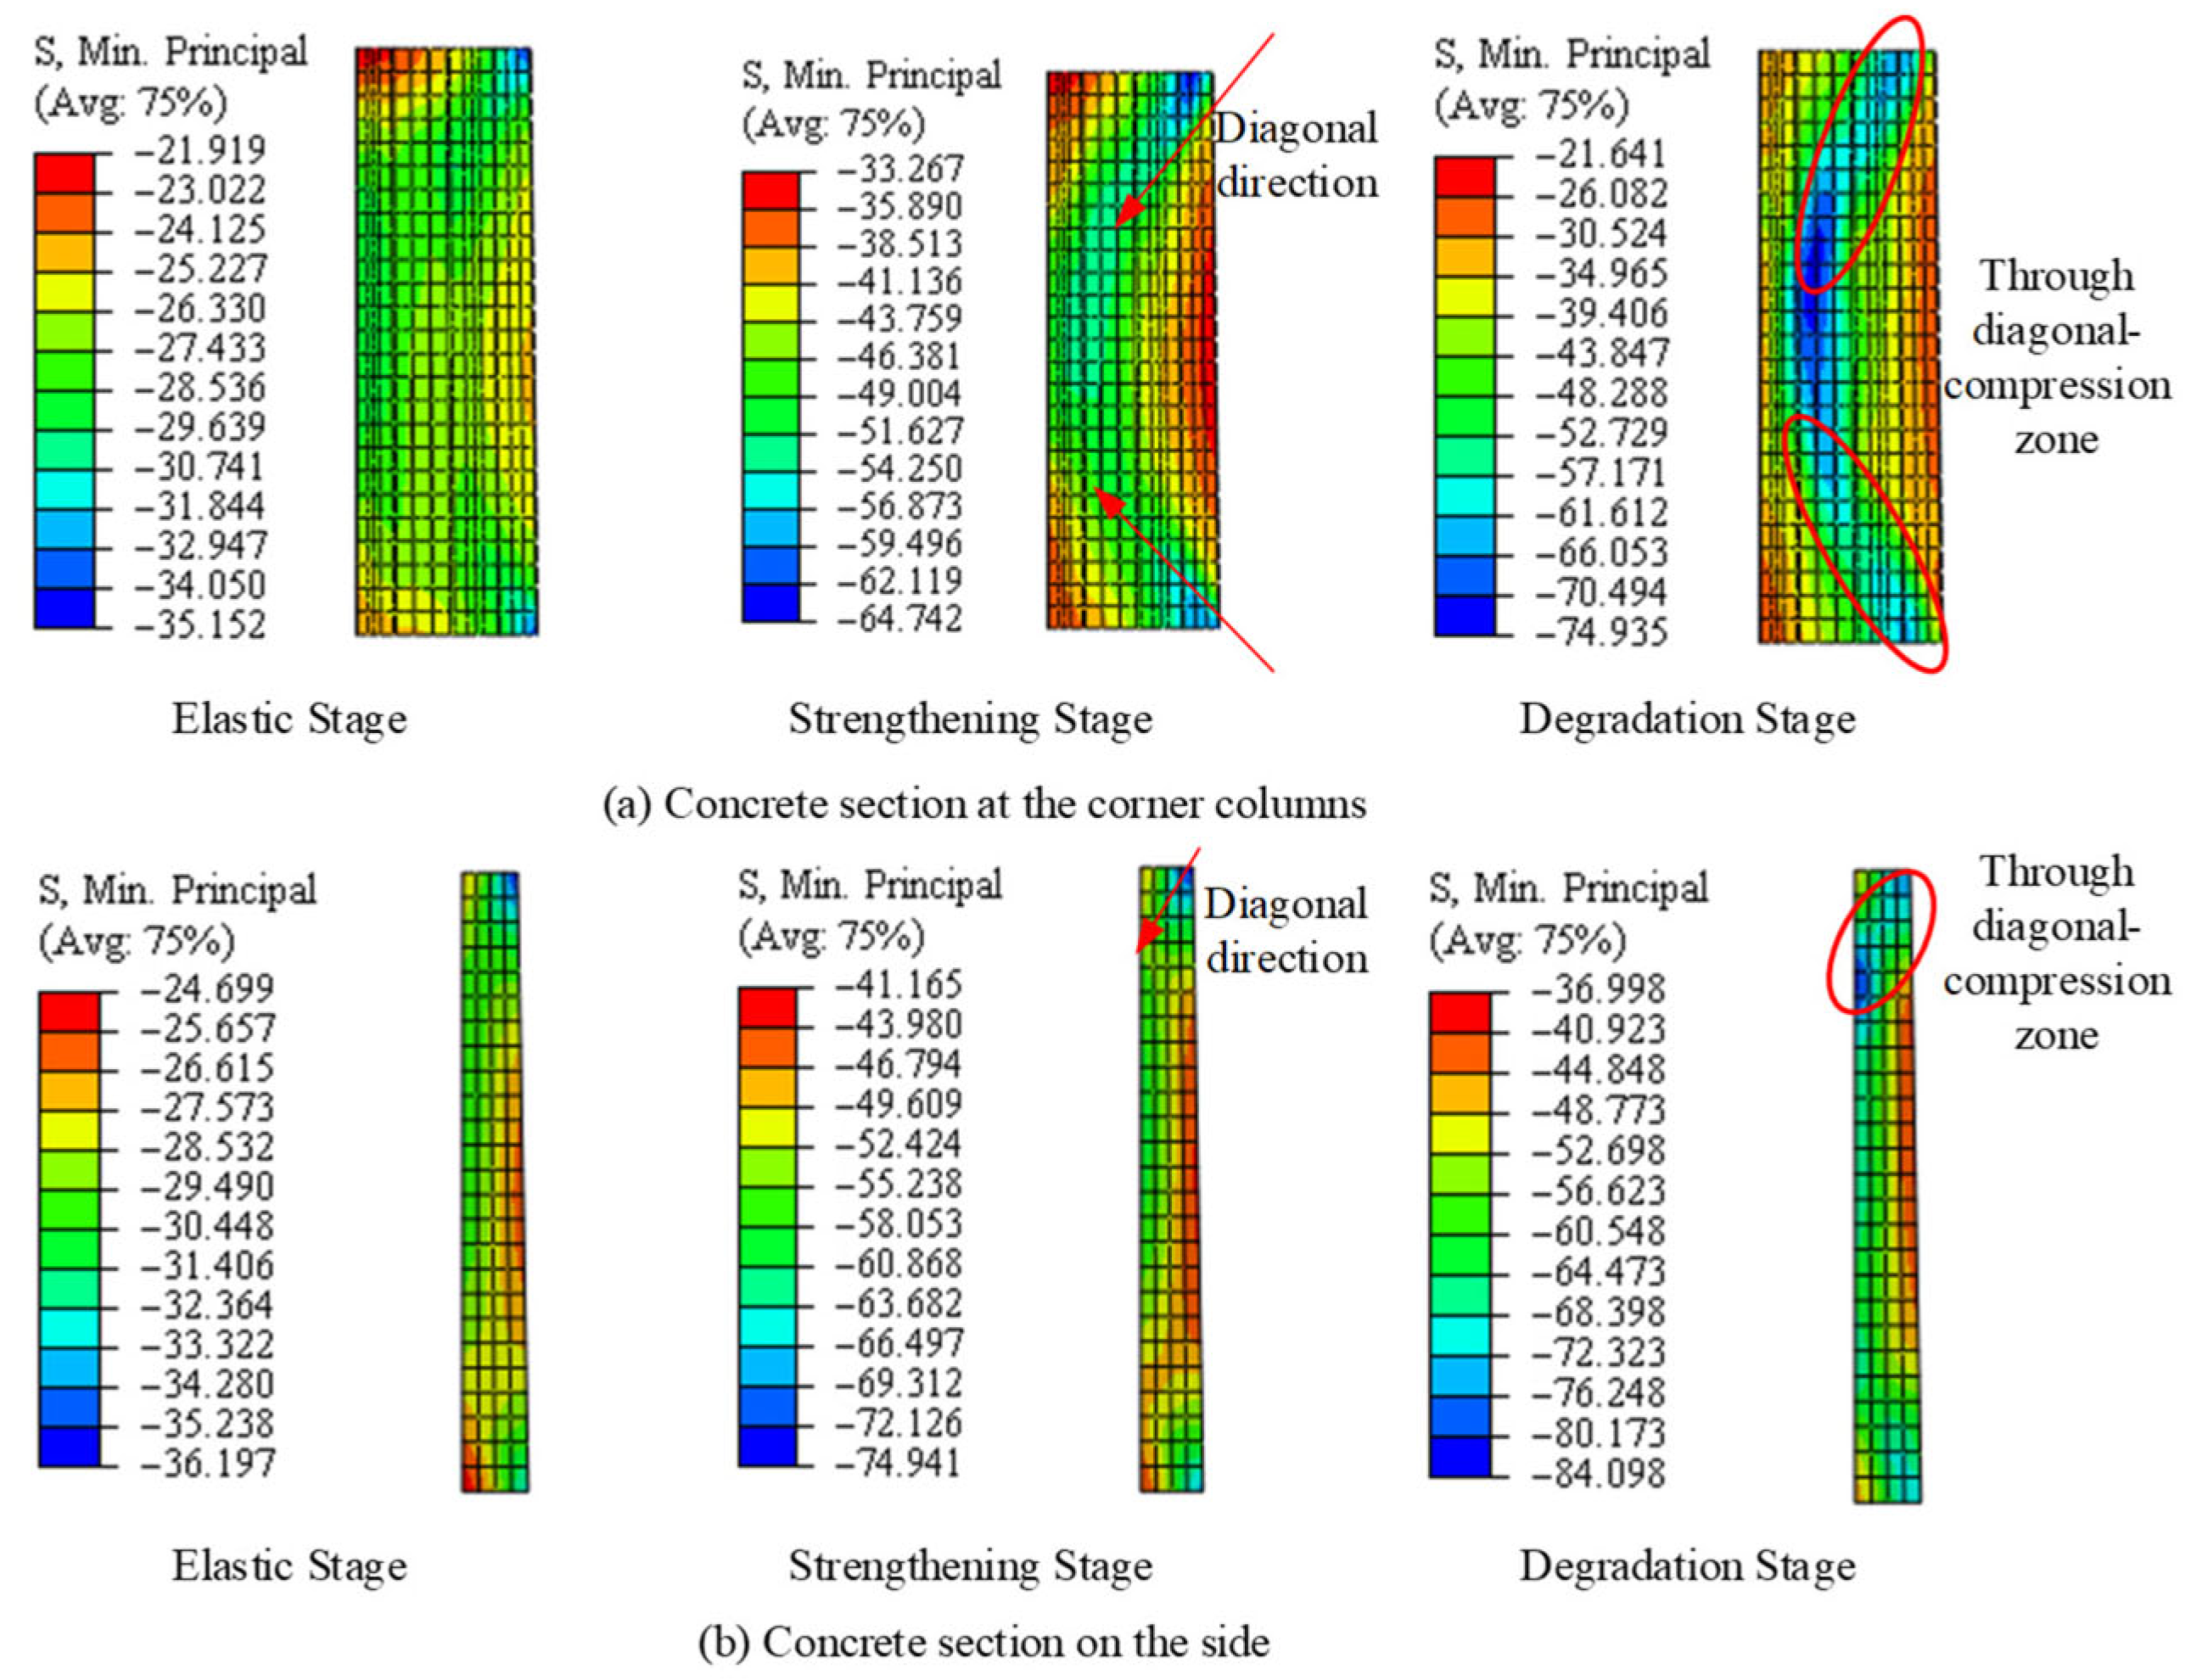
Due to its rectangular geometry, the SCCA exhibits distinct load-bearing behaviour in the side and corner zones. Figure 6 shows that, under axial compression, diagonal compressive stress paths form in the sandwich concrete. In the corner regions, stress is relatively uniform and extends diagonally from the upper and lower boundaries toward the centre. In contrast, the side regions experience peak compressive stress near the top, with weaker constraint from the outer shell. As loading progresses, these high-stress zones shift inward, and concrete crushing initiates along the diagonal.
The strain distribution, shown in Figure 7, further highlights these regional differences. On the sides, outward extrusion of concrete leads to pronounced local buckling of the outer shell near the top, while the inner shell remains relatively unaffected. In the corners, concrete initially deforms outward, but increasing confinement from the surrounding steel induces inward extrusion toward the adapter’s core. Peak strain is observed at mid-height of the inner shell, accompanied by inward buckling.
The interaction between the steel and sandwich concrete can be summarized as follows: the confinement force of the SCCA is concentrated at the corners and decreases toward the mid-sides, resulting in uneven confinement across different regions—a behaviour similar to that of square CFDST columns [45]. These interactions lead to a characteristic diagonal extrusion failure mode. The side zones are prone to localized crushing and shell buckling, while the corners benefit from stronger multidirectional confinement, enhancing ductility and delaying failure. Ultimately, both regions form diagonal compression bands, resulting in core crushing of concrete and localized steel buckling.

2.3. Parametric Analysis of Influential Factors

While structural mechanism analysis reveals the general failure modes of the SCCA, it does not quantify the influence of individual design parameters on axial compressive performance. To address this, a parametric study is conducted to identify key factors affecting load-bearing capacity and to support subsequent database construction.
The investigated parameters include material strengths and sectional dimensions of both steel and concrete components. Global dimensions such as diameter and total cross-sectional area are held constant due to transportation and assembly constraints in large-capacity wind turbine towers, and are therefore not considered in this parametric study. Specific focus is given to the outer shell thickness (tos), inner shell radius-to-thickness ratio (Dis/tis), and the dimensions of the partition and inner tube, which significantly affect the confinement of sandwich concrete.
The outer shell thickness (tos) significantly affects the axial performance of the SCCA. As shown in Figure 8, increasing tos leads to a linear improvement in both axial stiffness and ultimate load capacity (Nu). When tos increases from 6 mm to 34 mm, Nu rises by approximately 35%. This improvement is mainly due to enhanced confinement from the thicker shell, which delays local buckling and mitigates outward deformation of the sandwich concrete. Therefore, optimizing tos is an effective strategy to improve both strength and ductility in SCCA design.
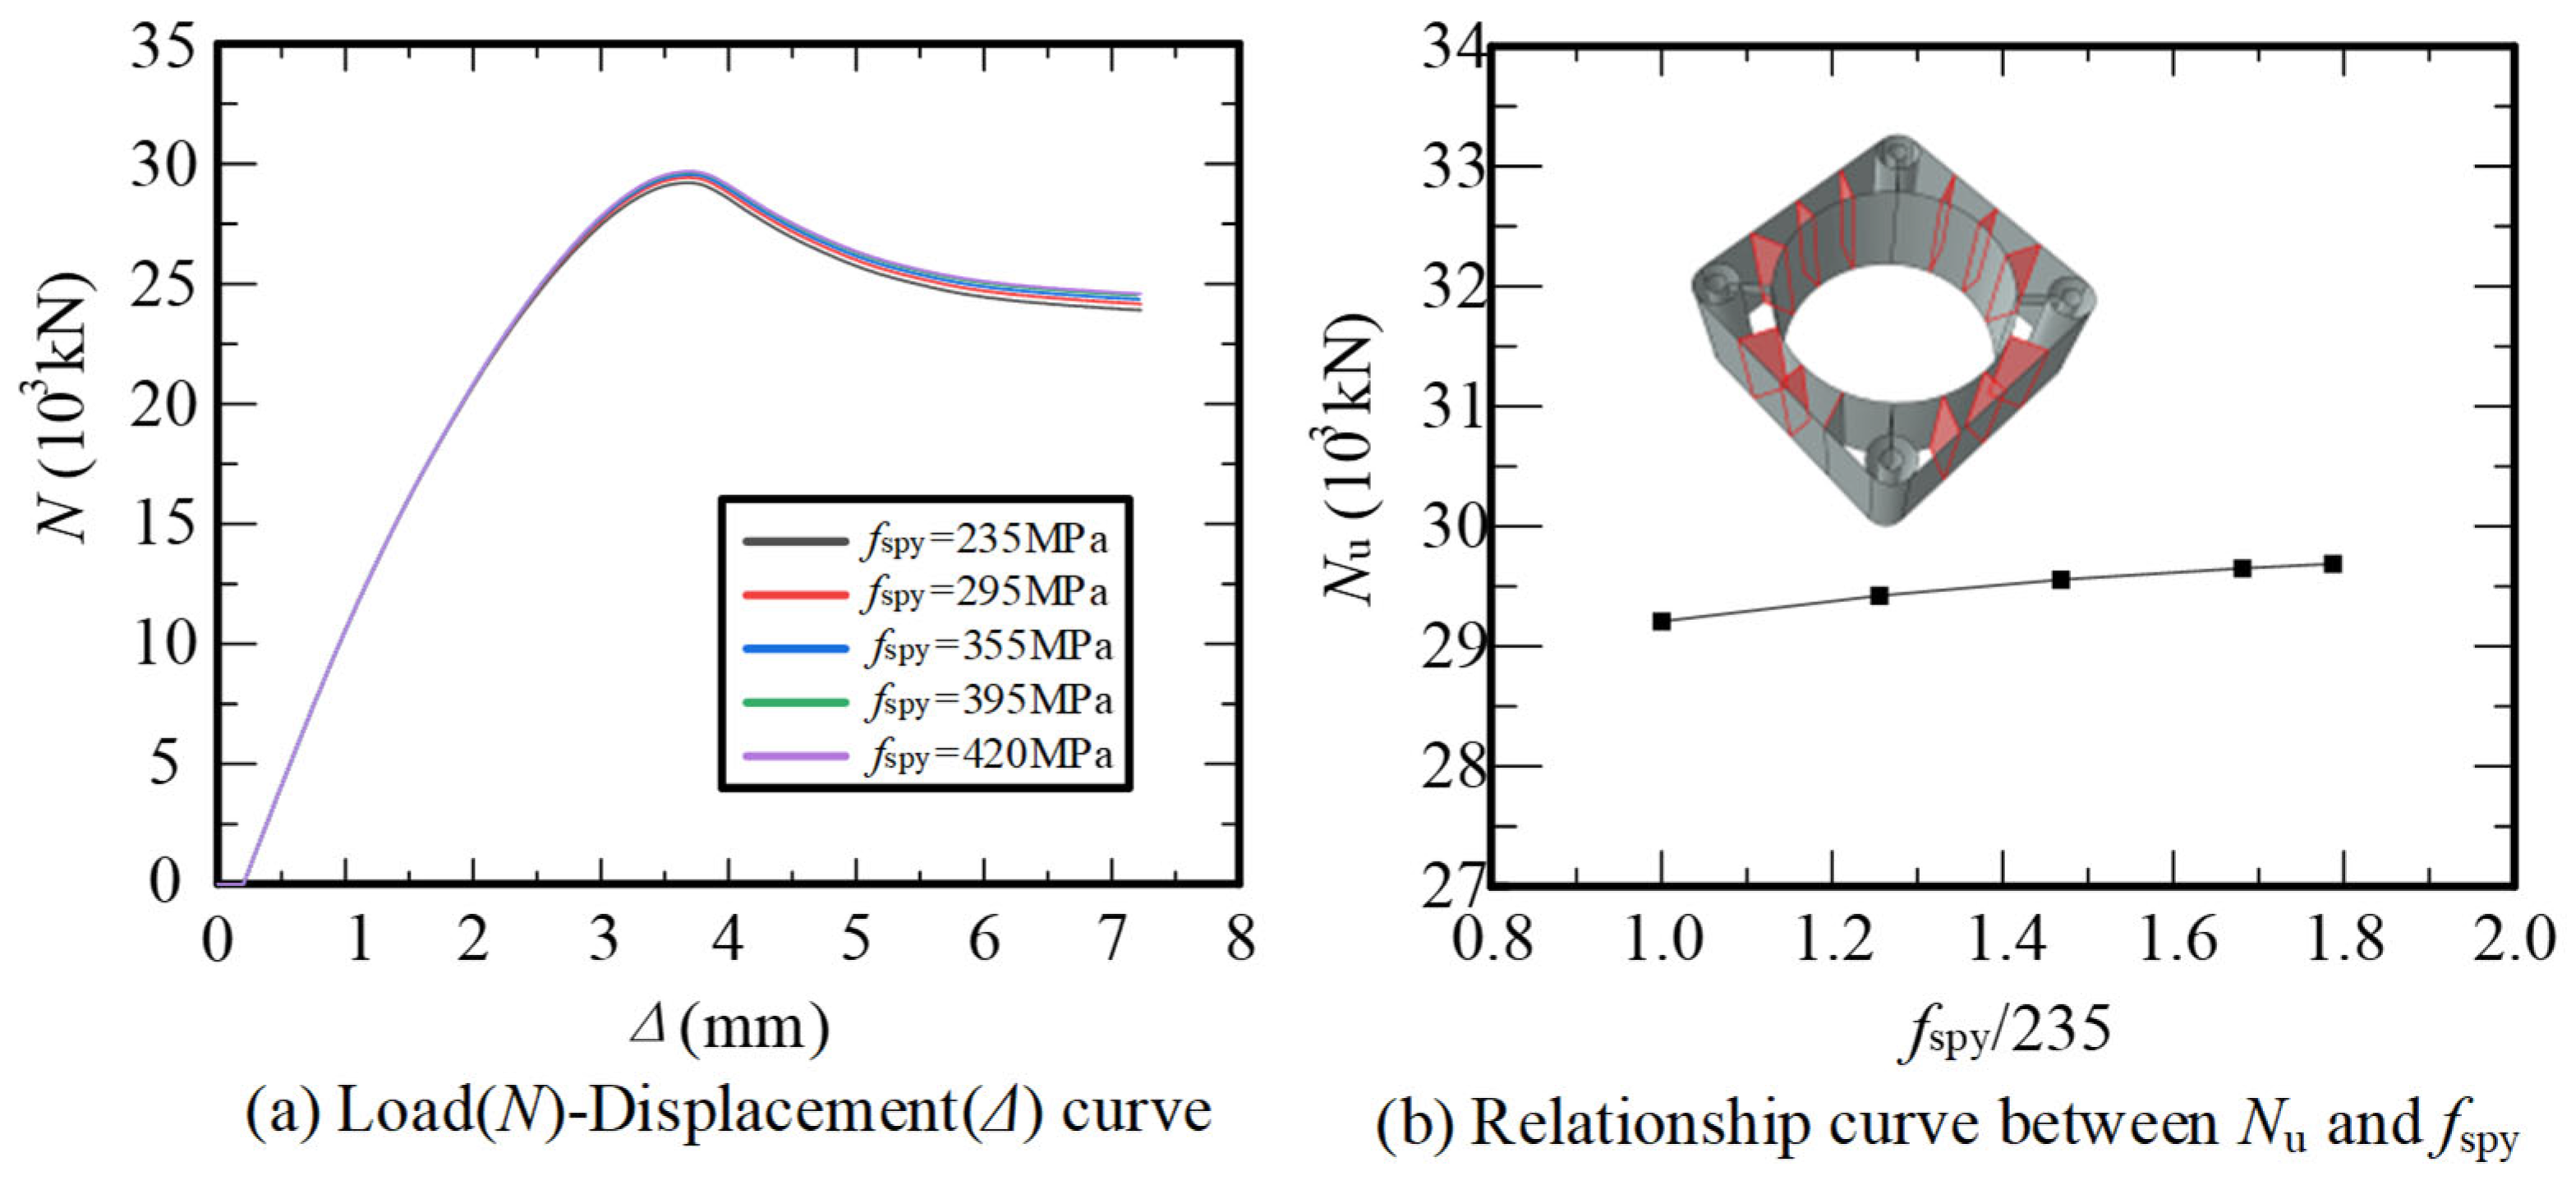
The outer shell strength (fosy) influences the axial capacity of the SCCA primarily through its direct load-bearing contribution. As shown in Figure 9, increasing fosy from 235 MPa to 420 MPa results in approximately a 10% rise in Nu, while axial stiffness remains unchanged. This limited improvement stems from the fact that fosy has a minimal effect on the confinement of the sandwich concrete. Compared to tos, strengthening the outer shell yields significantly less benefit, indicating that enhancing thickness is a more effective strategy for improving axial performance.
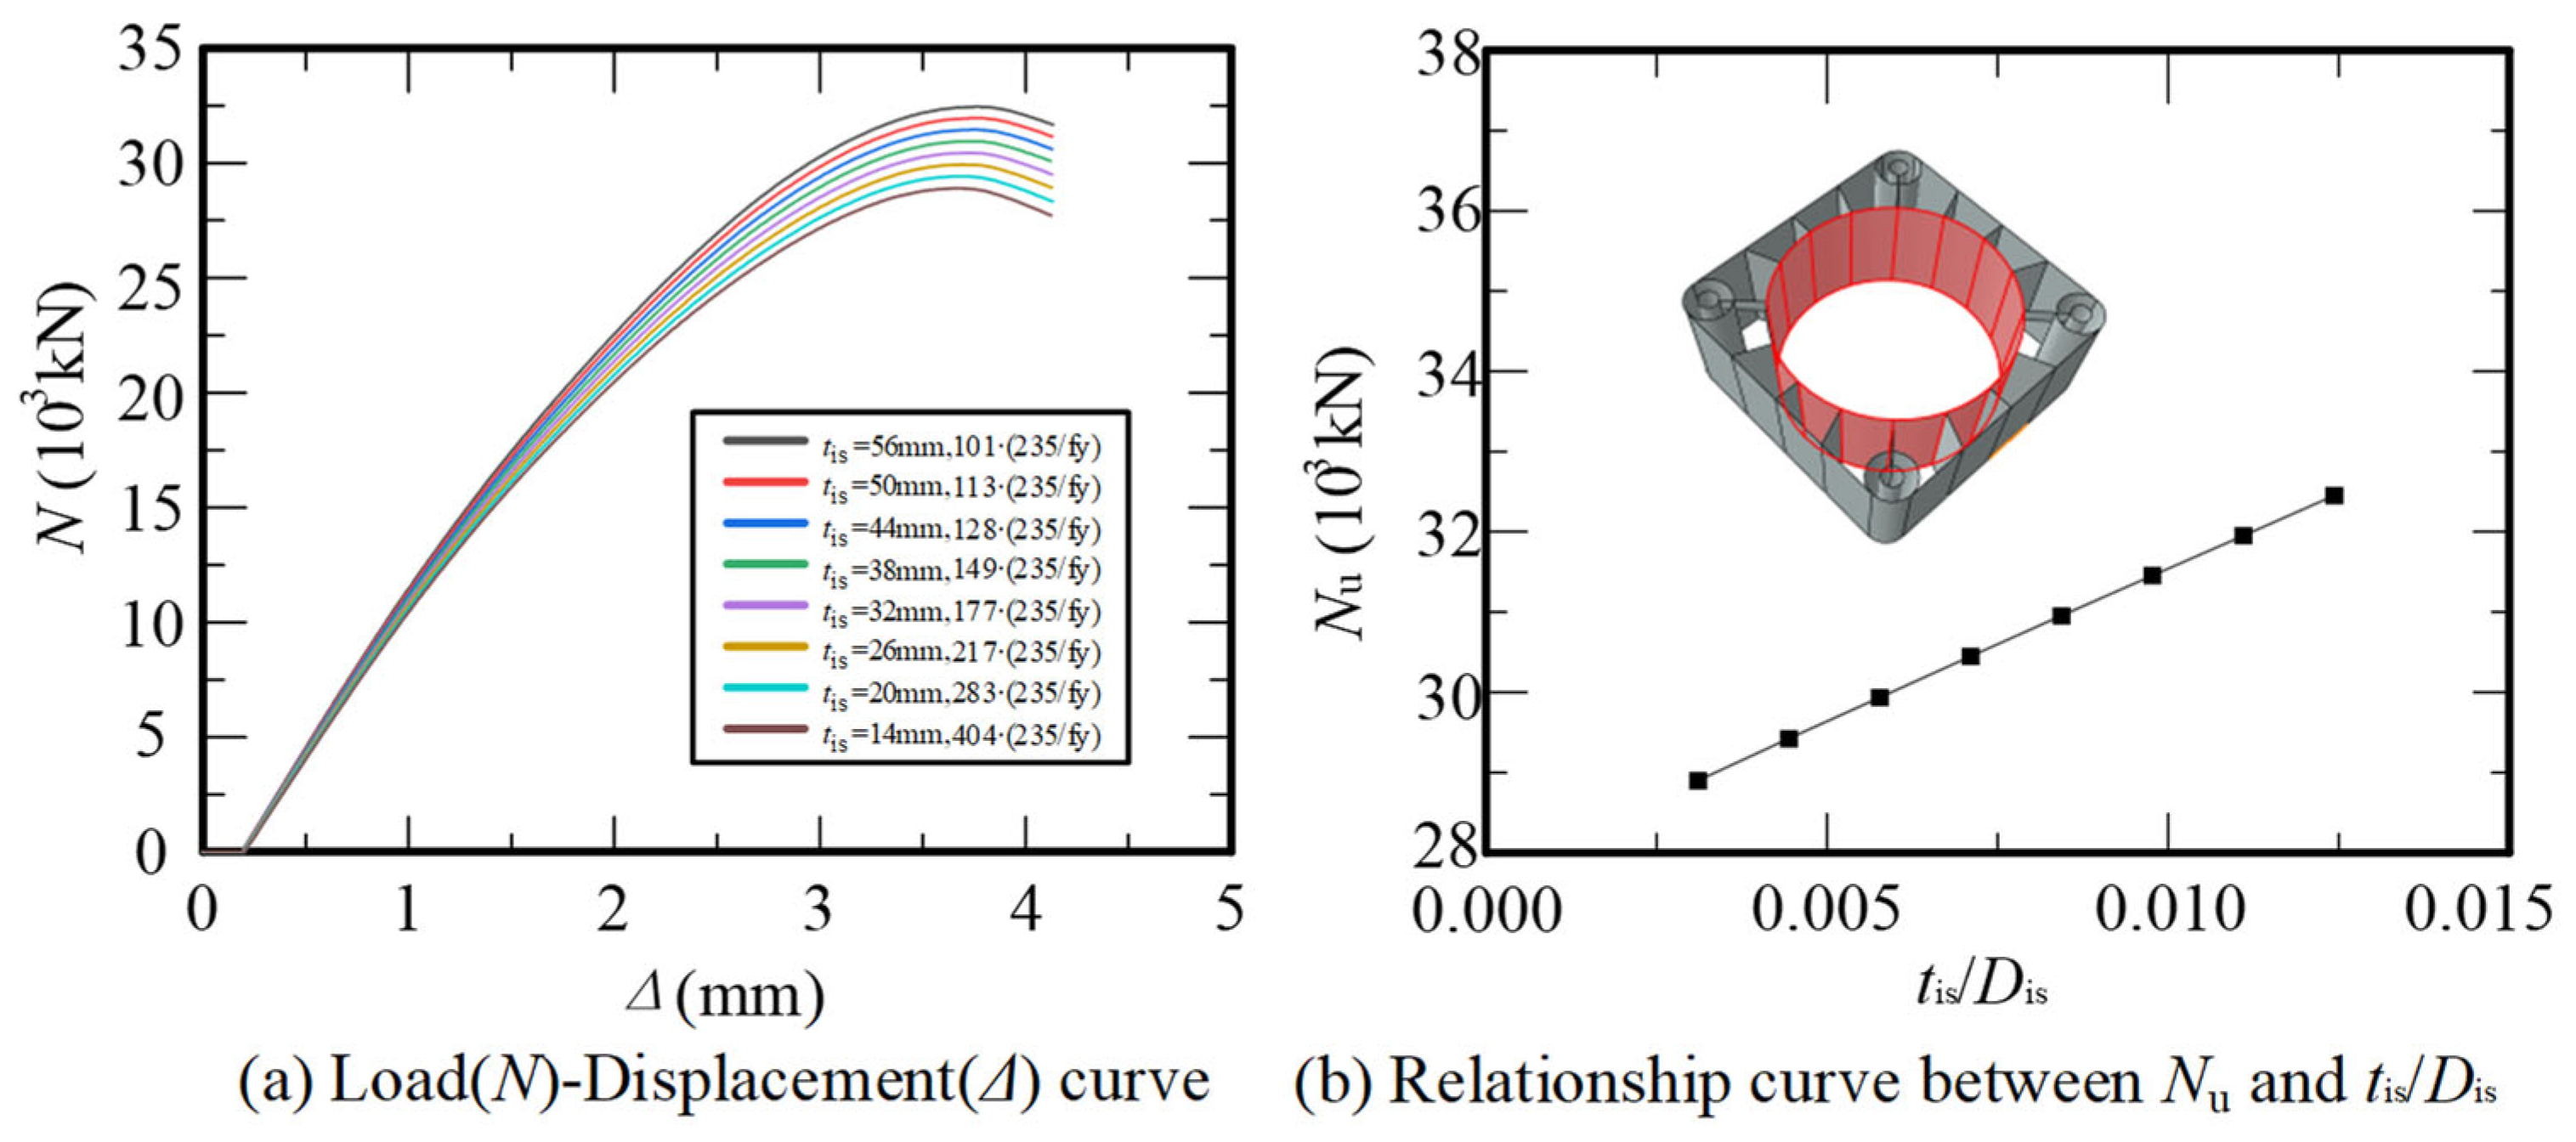
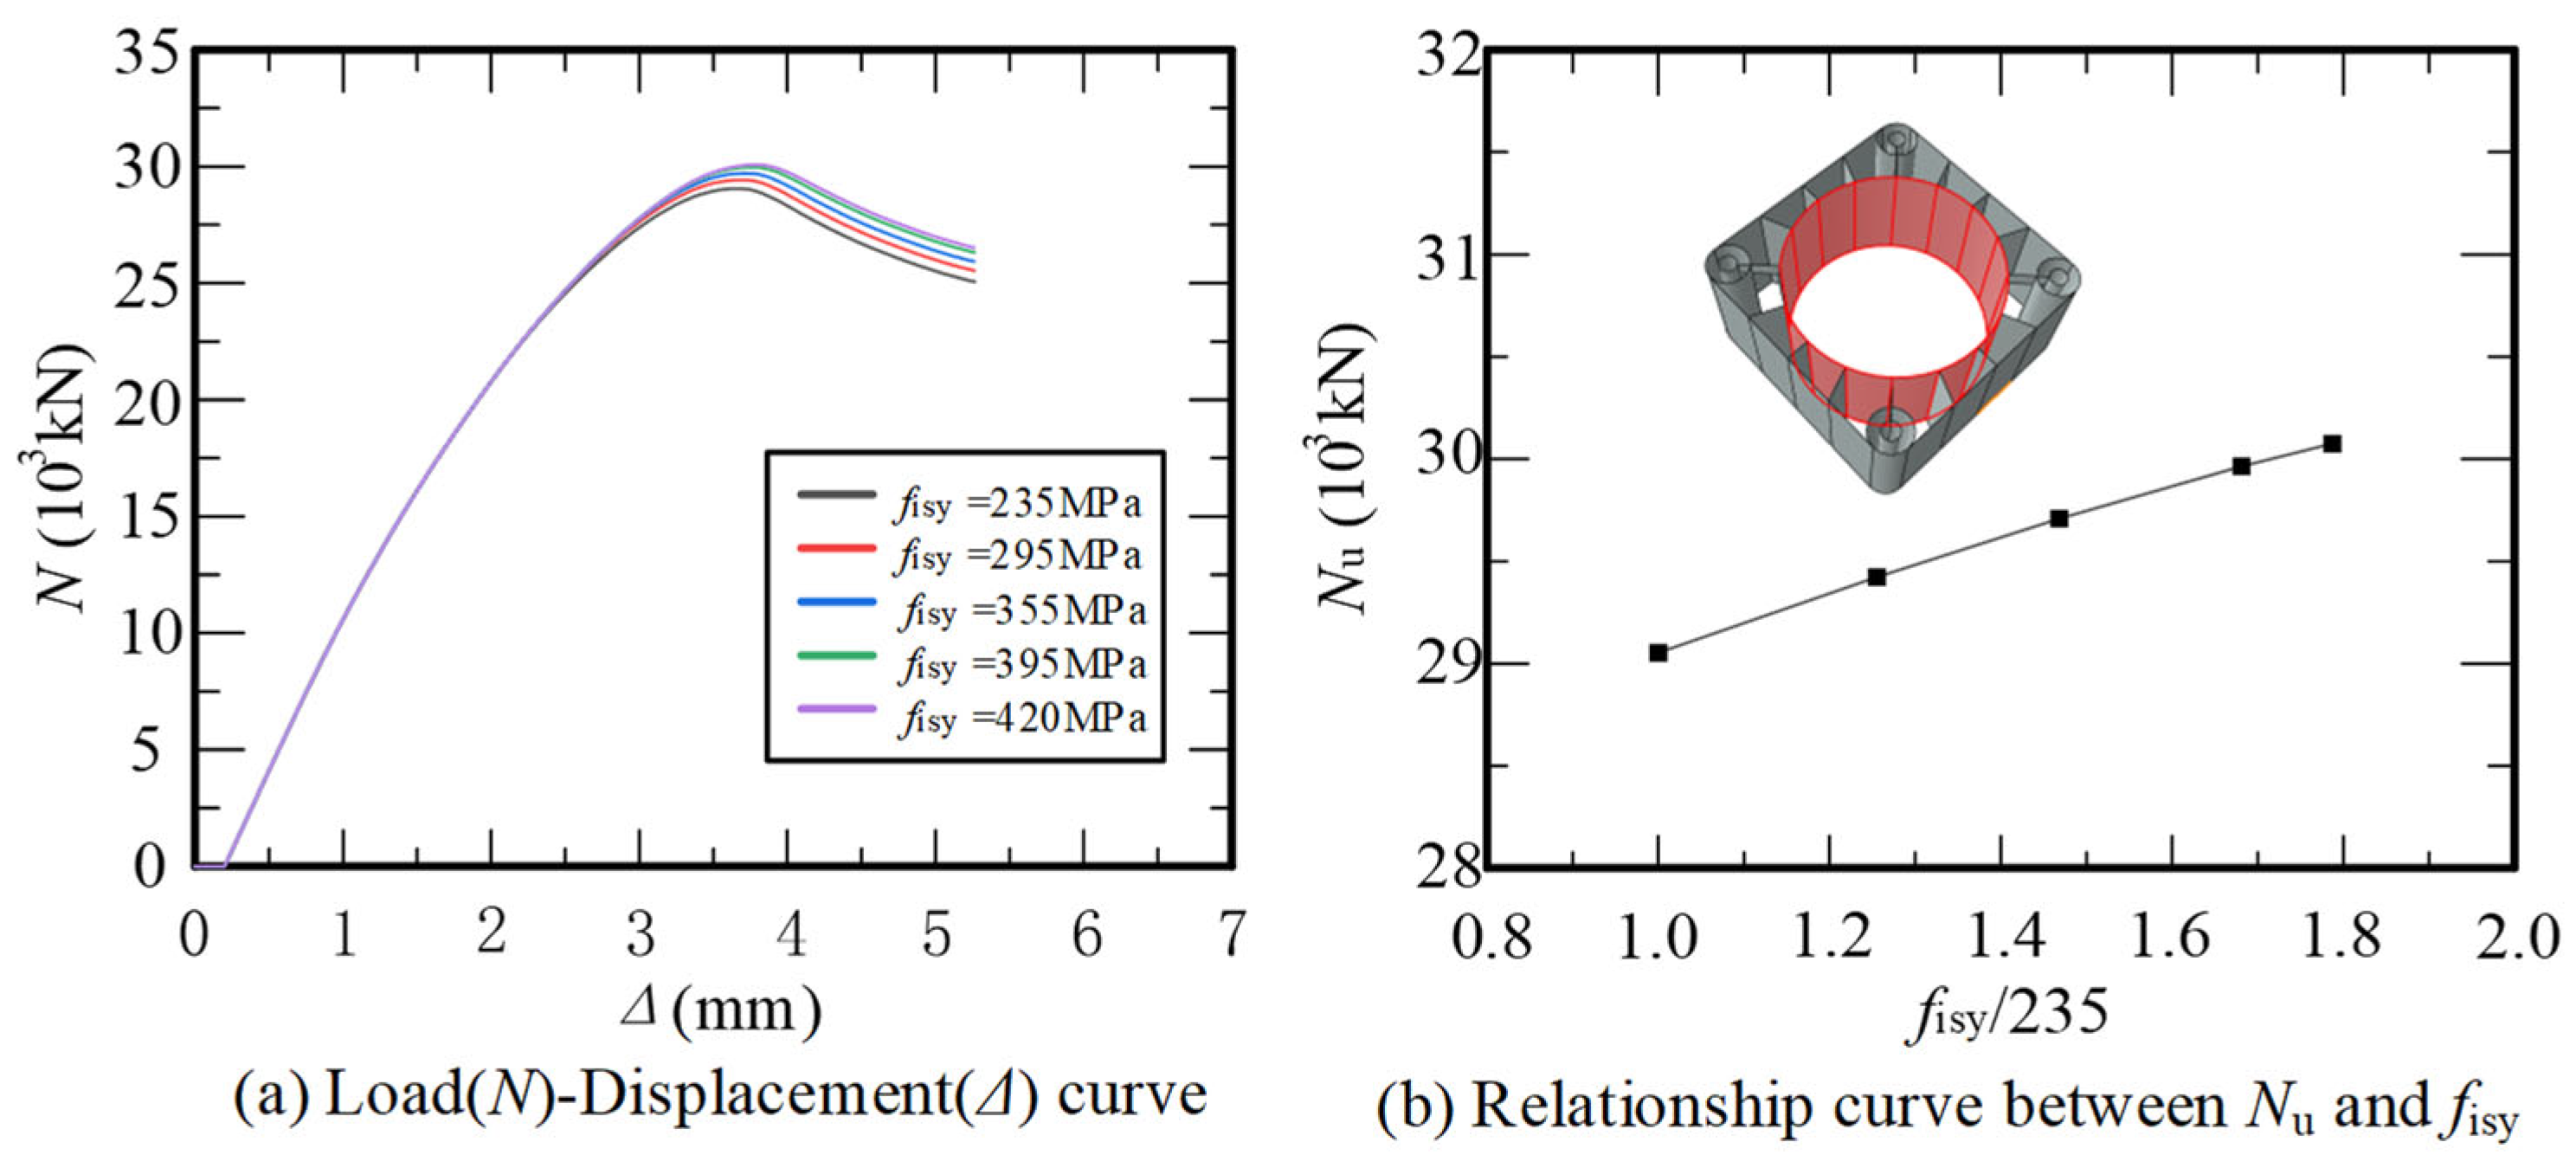
The inner shell radius-to-thickness ratio (Dis/tis) and strength (fisy) have a moderate influence on the performance of the SCCA. As shown in Figure 10 and Figure 11, reducing Dis/tis or increasing fisy leads to slight improvements in both stiffness and ultimate capacity. For example, decreasing Dis/tis from 404·235/ fisy to 101·235/ fisy raises Nu by only 18%. This is because the inner shell provides limited confinement—the concrete tends to extrude outward, making the outer shell the dominant confining element. Therefore, while the inner shell contributes to structural stability, its effect on axial capacity is secondary, and its design can be optimized more conservatively compared to the outer shell.
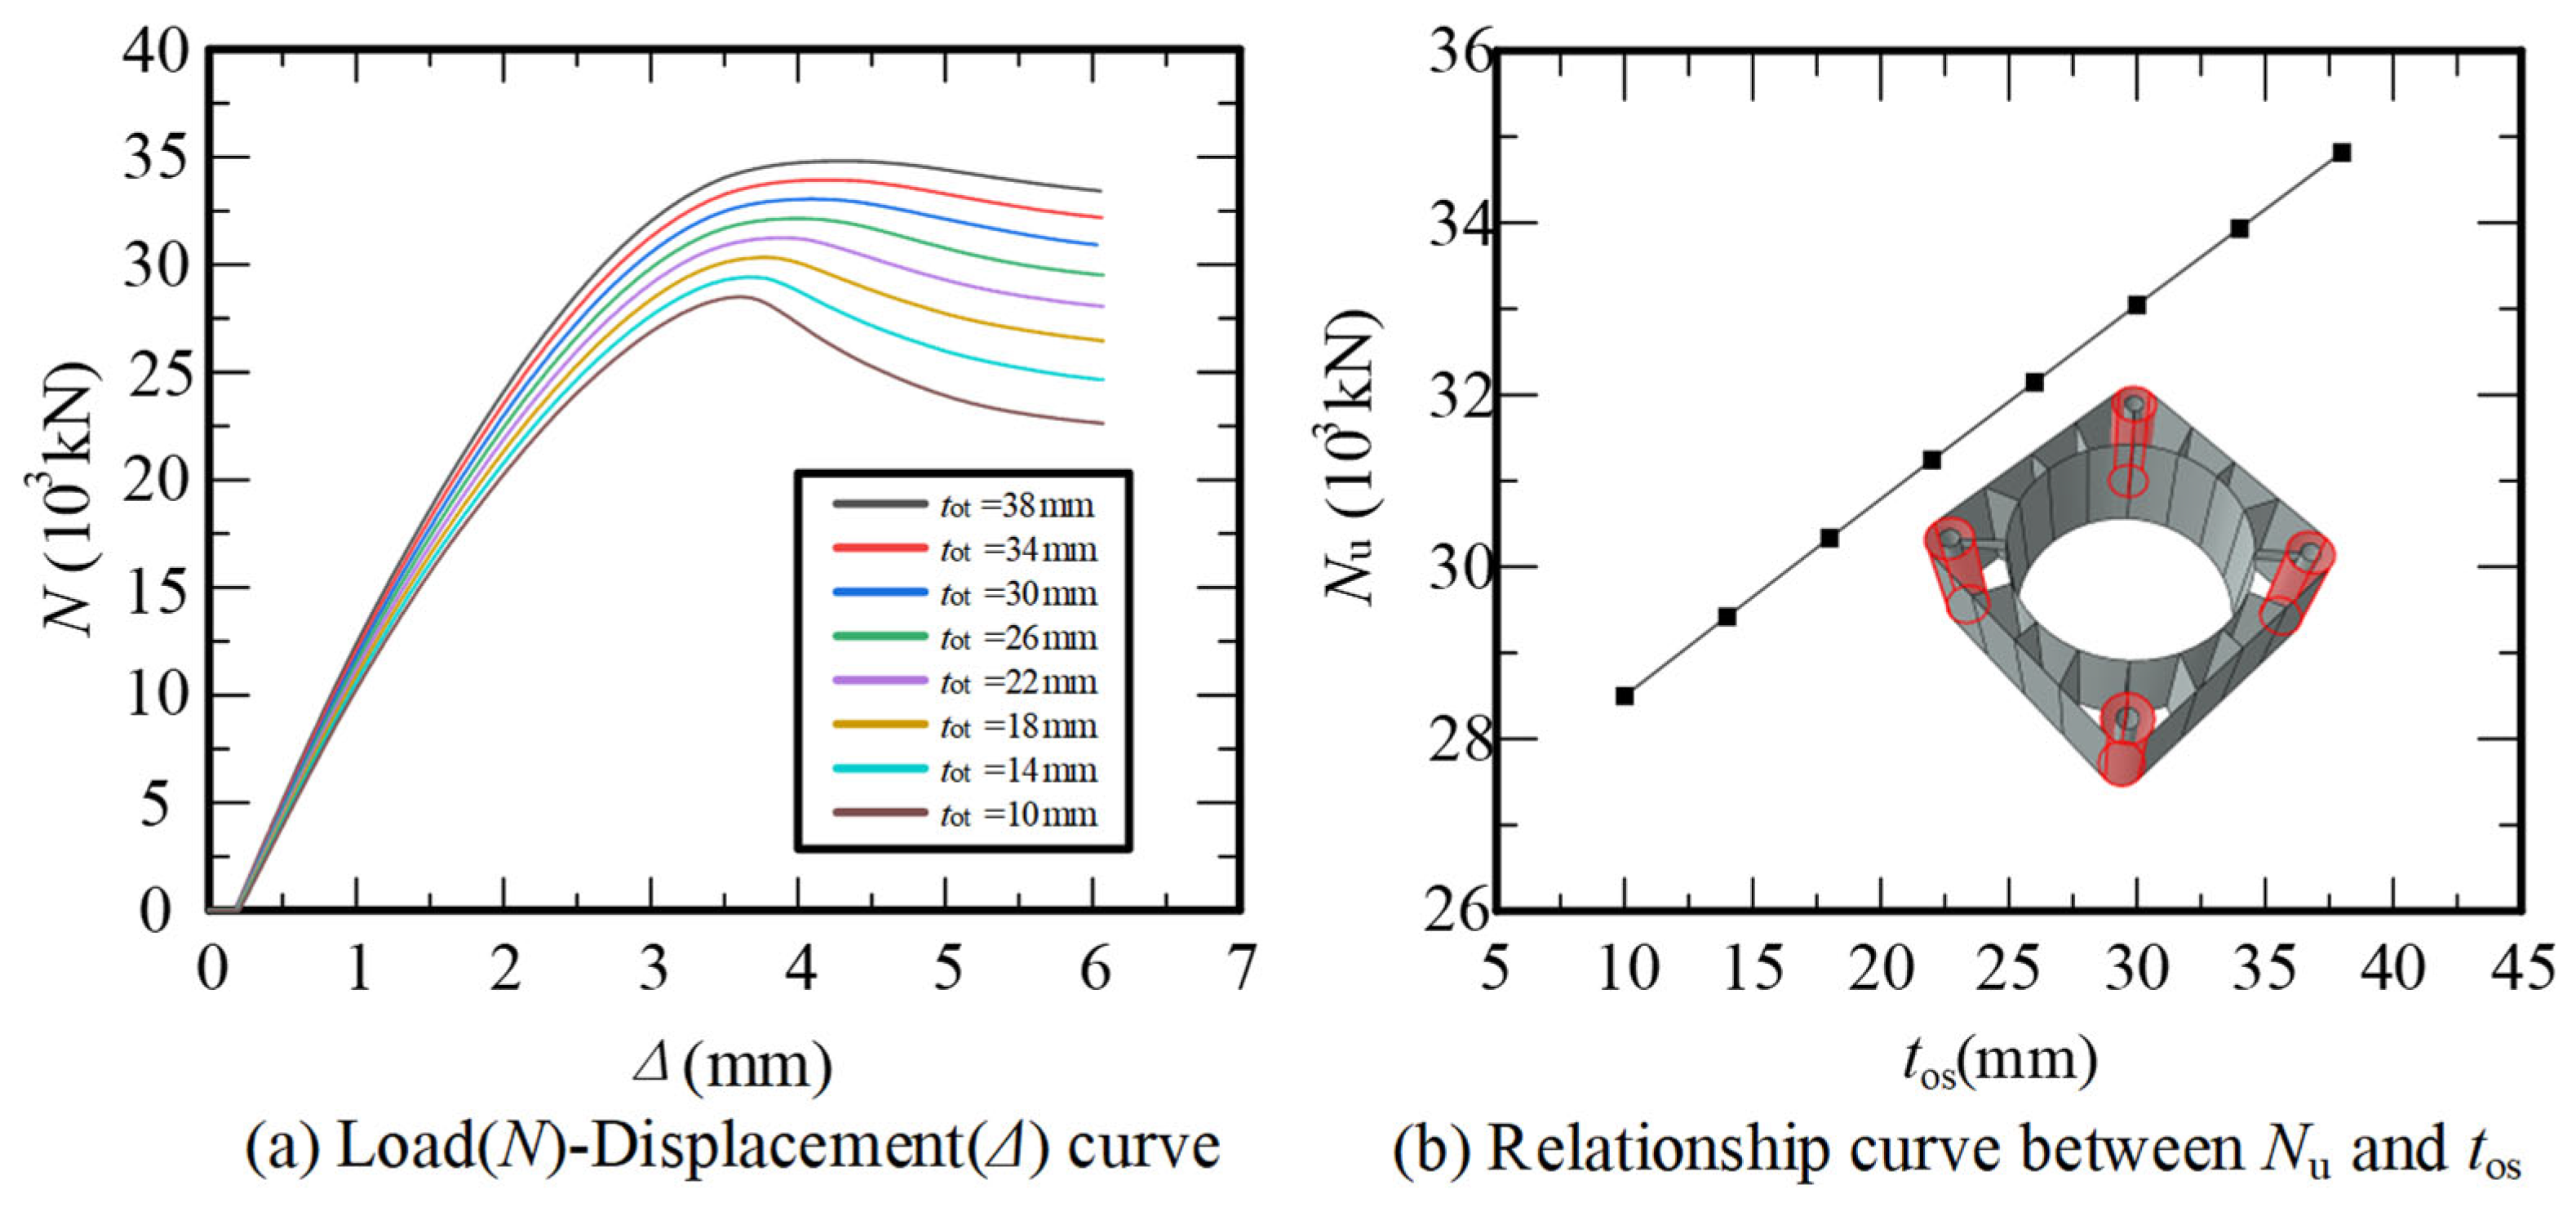
The outer tube thickness (tot) significantly enhances both axial capacity and stiffness of the SCCA, while its strength (foty) has minimal influence. As shown in Figure 12 and Figure 13, increasing tot leads to a linear rise in Nu and stiffness, whereas changes in foty produce negligible improvement. Compared to the inner shell, the outer tube exerts stronger confinement on the corner sandwich concrete, effectively delaying diagonal crushing and improving ductility. Therefore, tot should be prioritized in design for both strength and deformation resistance, while increasing foty offers limited benefit and may not be cost-effective.
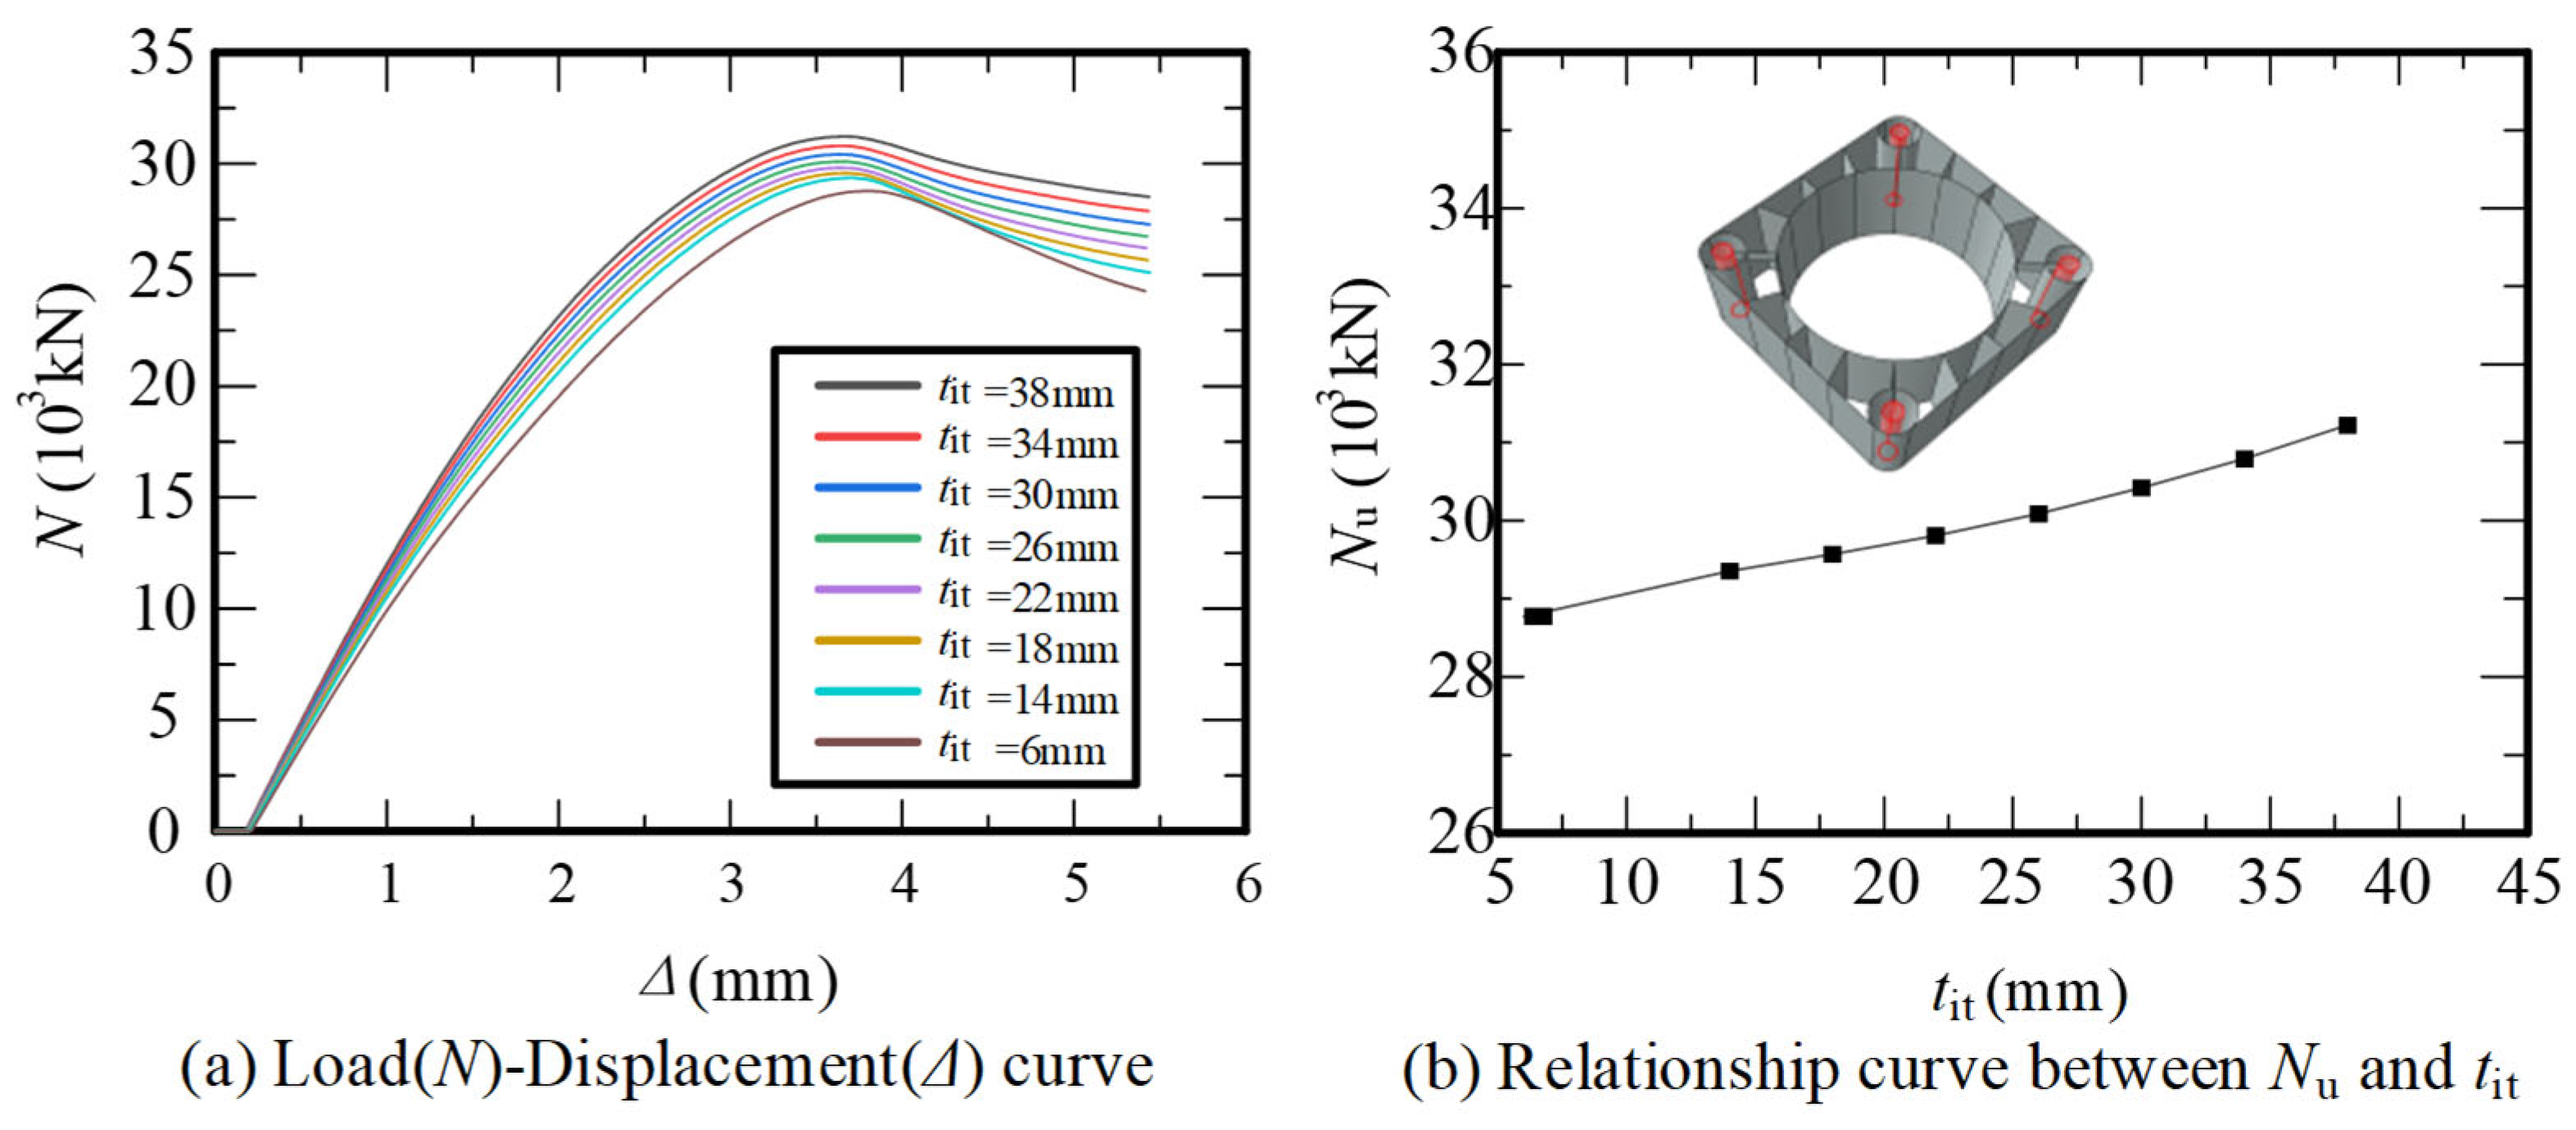
The inner tube thickness (tit) and strength (fity) have a limited impact on the axial capacity of the SCCA. As shown in Figure 14 and Figure 15, increasing tit from 6 mm to 38 mm yields only a 10% improvement in Nu, while fity shows similarly minor effects. This is because the inner tube mainly functions as a prestressing duct rather than a load-bearing or confining element. Its reduced thickness or strength does not trigger local failure. Hence, tit and fity can be conservatively designed to reduce material consumption, while optimization efforts should focus on more structurally influential components like the outer shell and outer tube.
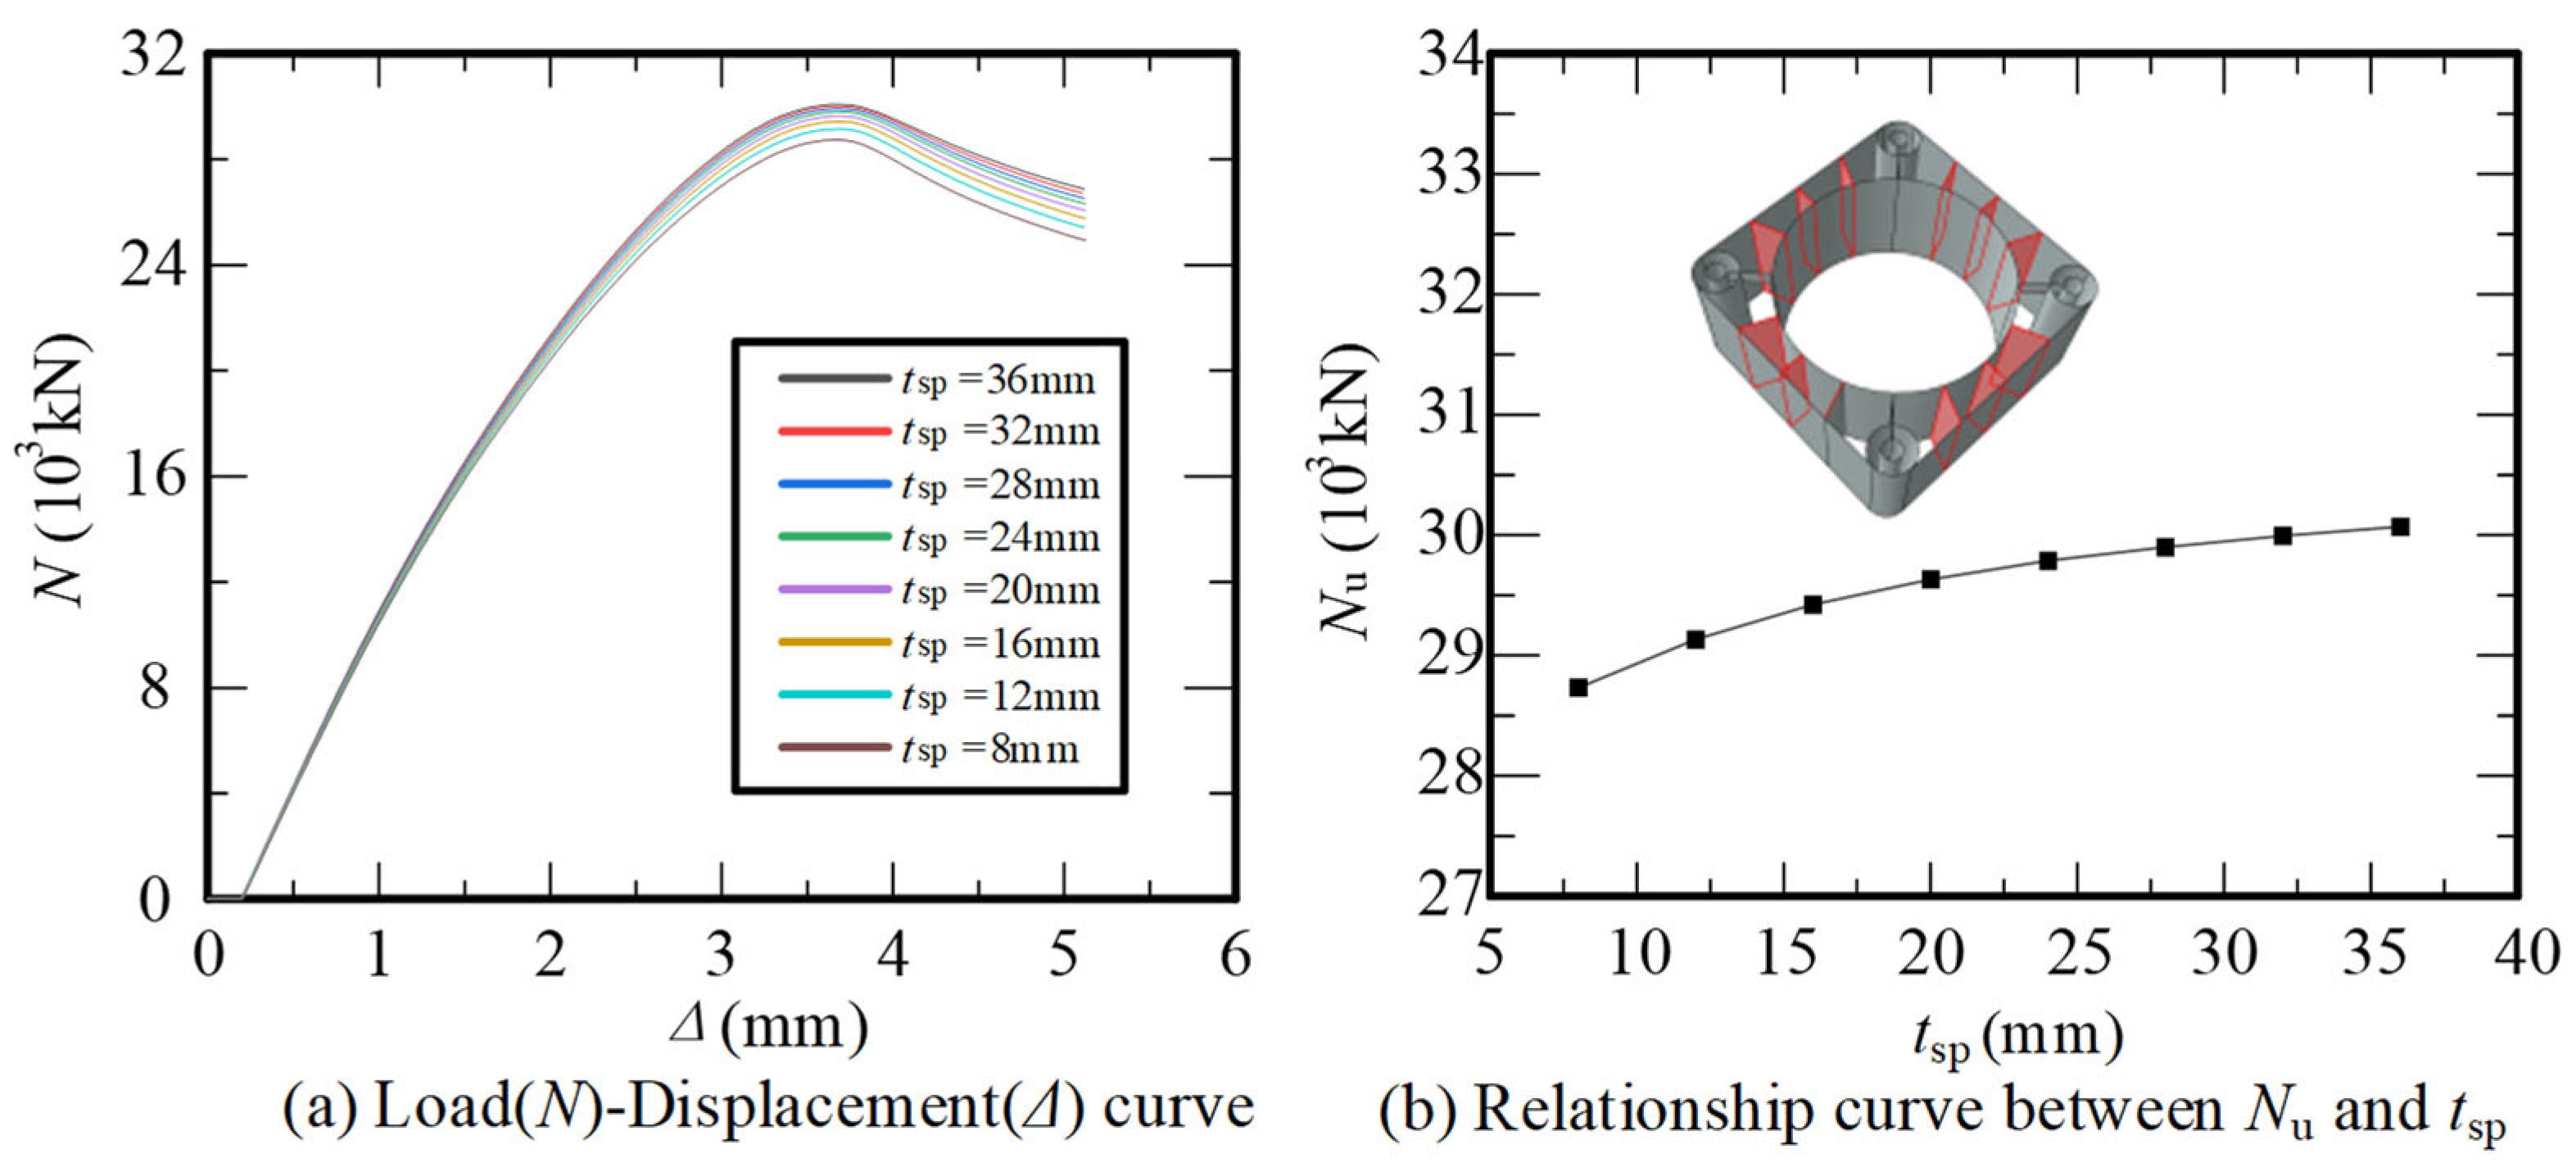
The partition thickness (tsp) and strength (fspy) exert minimal influence on the capacity of the SCCA. As shown in Figure 16 and Figure 17, increasing tsp from 8 mm to 36 mm results in only a 4% improvement in Nu, with similarly limited gains from fspy. This is because the partition does not directly confine the concrete and contributes little to axial load resistance. Its primary function lies in structural fabrication and assembly. Therefore, excessive increases in tsp or fspy are not justified, and these parameters can be conservatively designed to reduce cost without compromising performance.
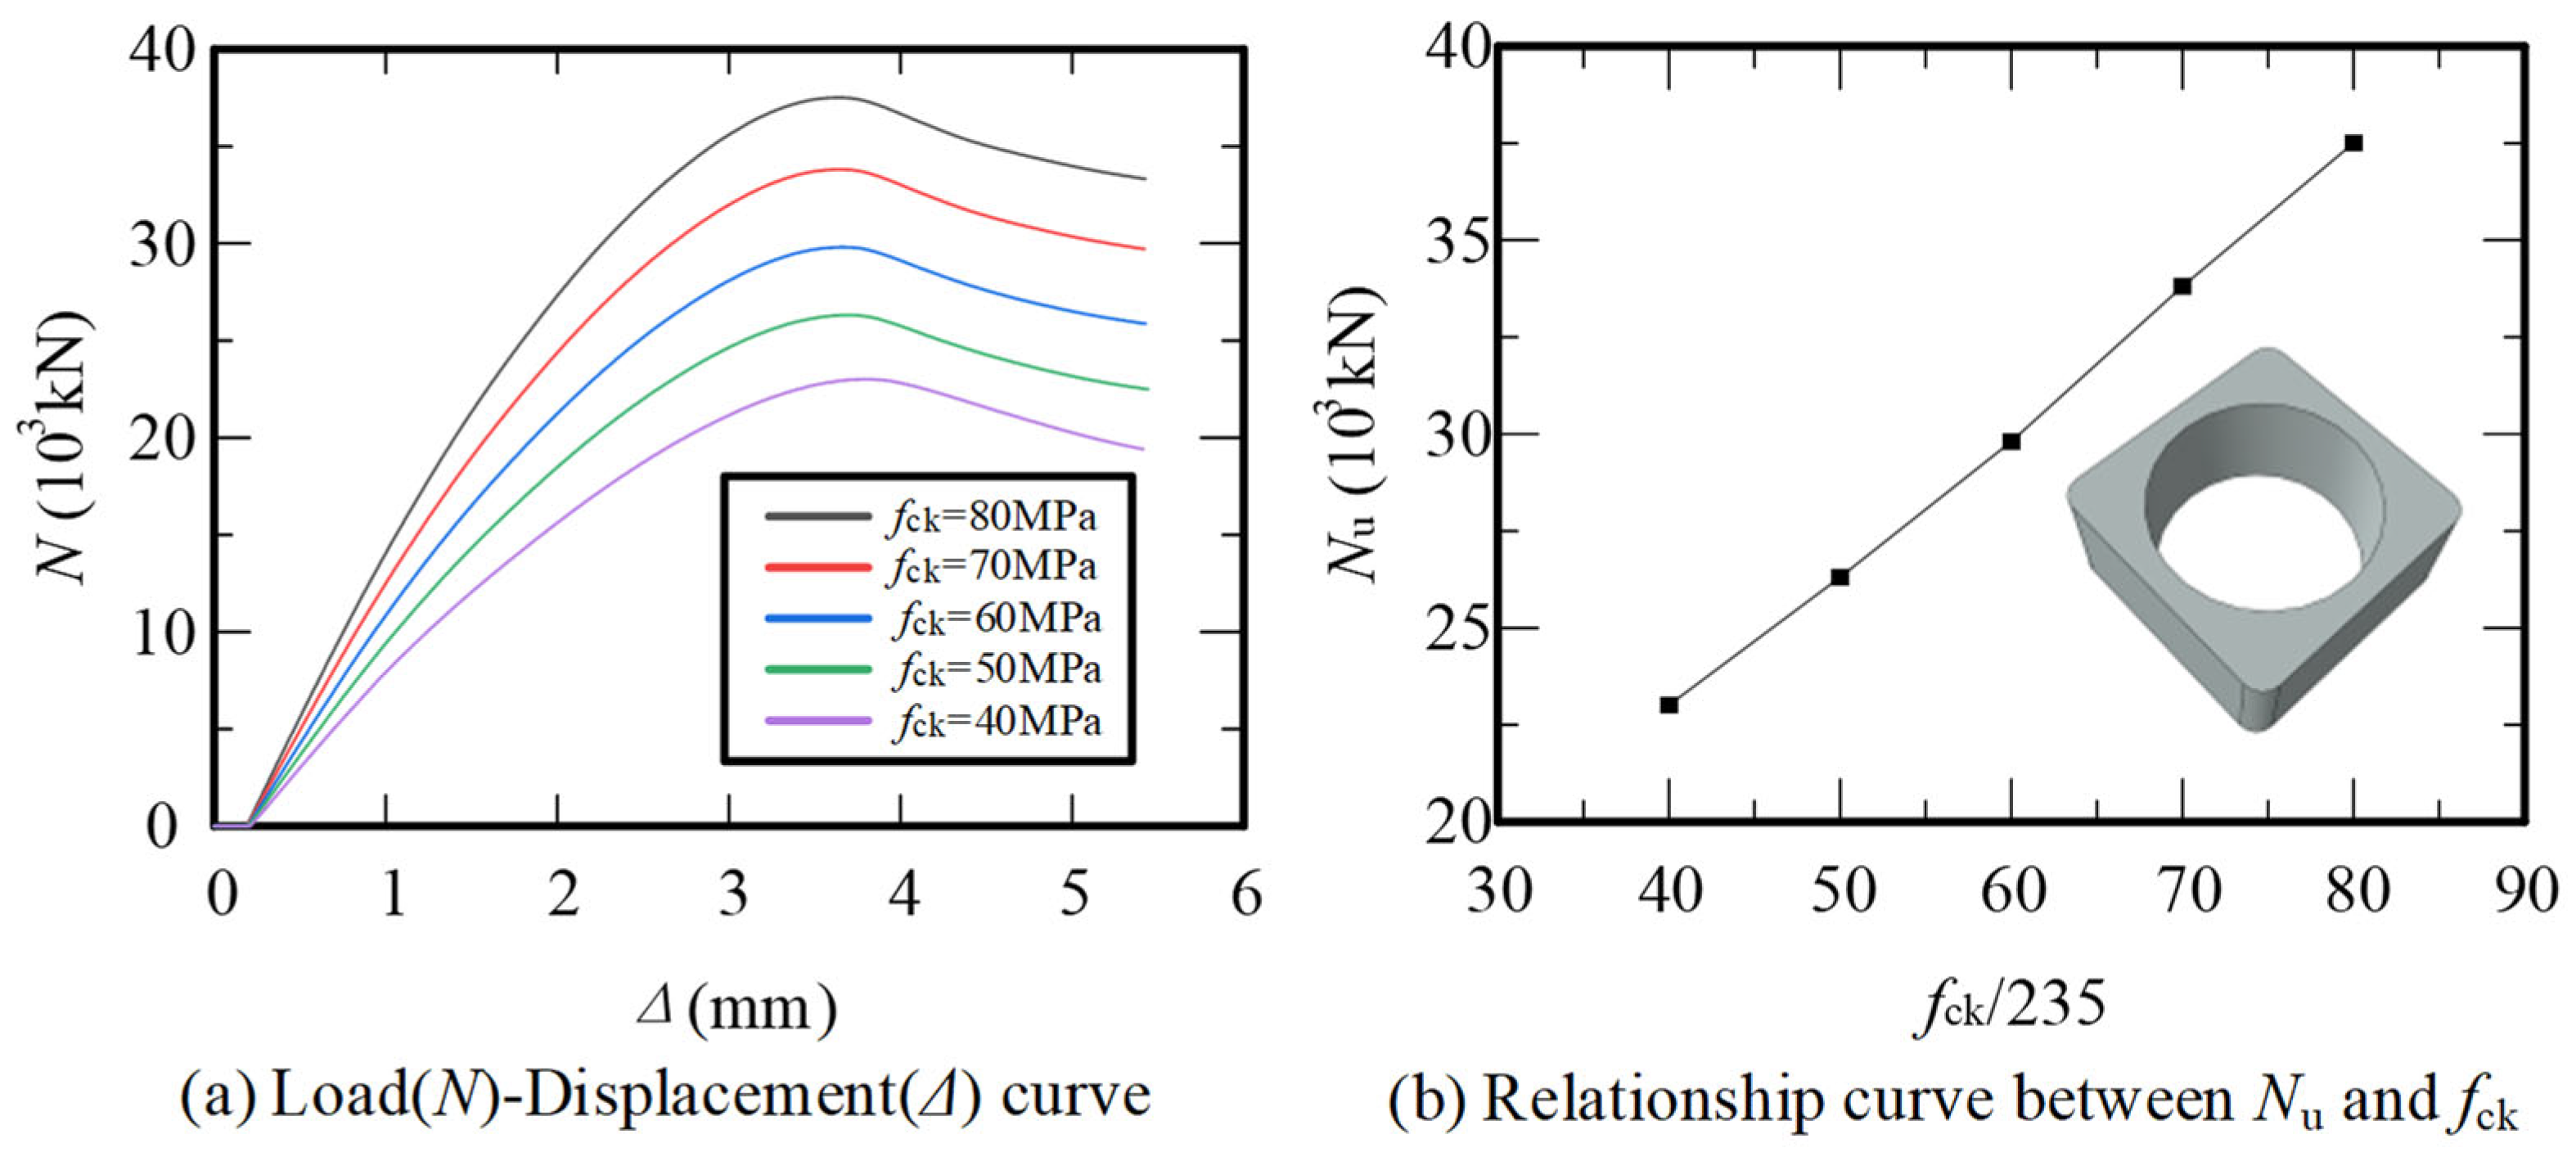
The concrete strength (fck) has the most significant impact on the axial capacity of the SCCA. As shown in Figure 18a, increasing fck from 40 MPa to 80 MPa results in a substantial 63% rise in Nu, along with improved axial stiffness. This is because the sandwich concrete primarily resists axial load, and its crushing marks the onset of failure. High-strength concrete markedly enhances load-bearing performance. Therefore, fck should be treated as a critical design parameter, and its optimization—within practical and economic limits—offers the most effective path to improving SCCA capacity.
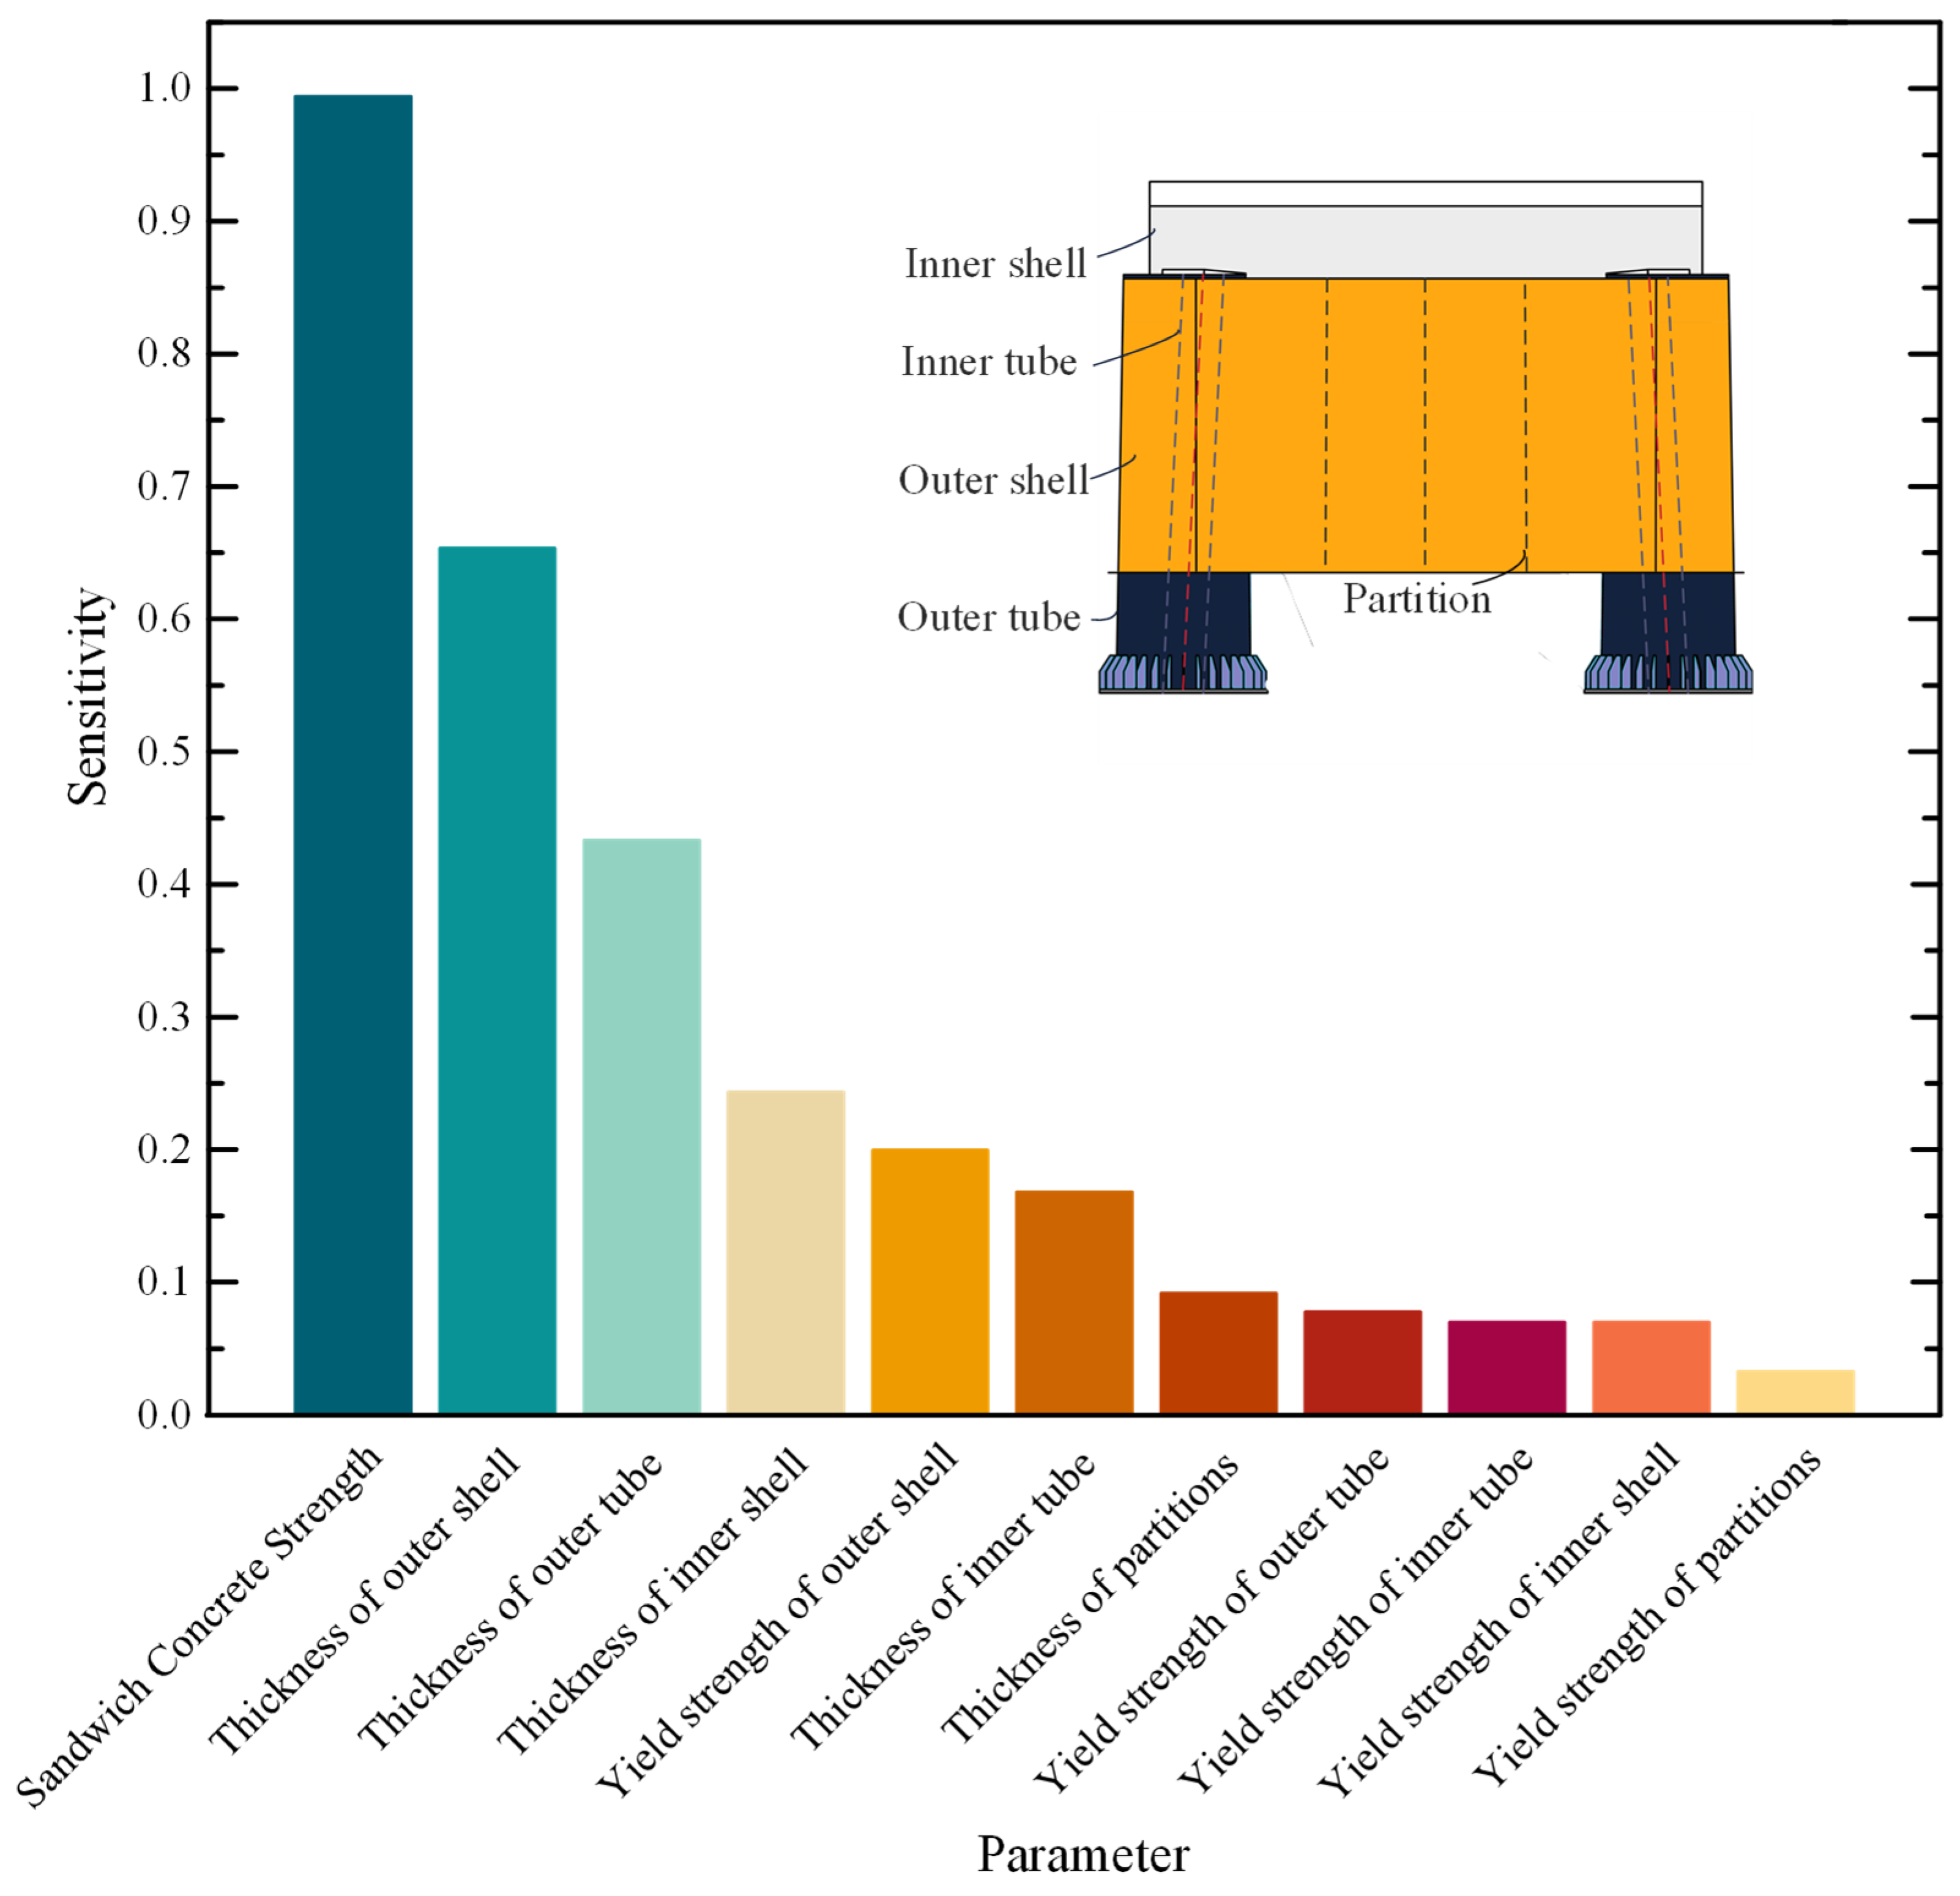
This study highlights several key parameters—particularly concrete strength (fck), outer shell thickness (tos), and outer tube thickness (tot)—as having a significant impact on the axial performance of the SCCA. In contrast, other parameters show limited influence. These findings not only inform structural optimization priorities but also guide the selection of sensitive variables for the construction of the machine learning database. By focusing sampling efforts on high-impact parameters, the dataset can more effectively capture the nonlinear relationships between design inputs and structural response, improving the accuracy and generalizability of the predictive model developed.

3. Database Establishment for the Axial Capacity of SCCA

Accurate capacity prediction is essential for the design of turbine towers, yet traditional methods struggle to reflect the nonlinear confinement mechanisms in SCCAs. To address the limitations of FE simulations—namely their high computational cost and complex modelling procedures prone to errors—a data-driven approach based on neural networks is adopted to predict the axial bearing capacity of the SCCA. This approach requires a well-structured parametric database to provide sufficient training data.

3.1. Variable Selection

Key variables were selected based on the sensitivity analysis presented in the preceding chapter. These parameters not only govern the mechanical performance but also affect the generalization ability and prediction accuracy of the neural network model. Given the “one-variable-at-a-time” design—where each parameter varies independently while others remain fixed—traditional correlation analysis or VIF checks are unnecessary. Instead, to evaluate the relative importance of each parameter on the axial compression capacity, a sensitivity analysis is conducted. This method captures how much the output (bearing capacity) responds to changes in individual input parameters under controlled conditions.
To eliminate the influence of differing physical units and scales, all parameters and axial compression capacities were normalized to a range between 0 and 1 using min-max normalization, as shown in Equation (7):
x norm = x x min x max x min
Specifically, the sensitivity index was calculated as the ratio of the response range in normalized capacity (yi) to the corresponding input range of the normalized parameter (xi), as shown in Equation (8):
Sensitivity i = y max ( i ) y min ( i ) x max ( i ) x min ( i )
As shown in Figure 19, the sandwich concrete strength exhibits the highest sensitivity, underscoring its dominant contribution to axial load resistance. Additionally, the thicknesses of various steel components—particularly the outer and inner shells—also demonstrate notable influence, reflecting their role in providing confinement and enhancing overall stiffness. In contrast, parameters such as partition yield strength and thickness show minimal sensitivity due to their limited involvement in axial force transmission.
Based on the sensitivity results, high-sensitivity parameters should be sampled more densely to ensure adequate resolution during model training. Low-sensitivity parameters can be sampled more coarsely to reduce redundancy. By concentrating data points in regions with greater structural response sensitivity, the neural network can learn more nuanced relationships, leading to better generalization and higher predictive accuracy across varying design configurations. This strategy is particularly effective in high-dimensional structural problems, where uniform sampling may lead to under-representation of key features and unnecessary data inflation.

3.2. Sampling Strategy

For the multi-parameter model predicting axial compression capacity, Latin Hypercube Sampling (LHS) was employed as the parameter sampling strategy. This method ensures more comprehensive coverage of critical parameter variations, enabling the neural network to effectively learn their influence on axial compressive capacity [46]. Each parameter domain [a, b] is divided into n equal probability intervals (Equation (9)):
I i = a + i 1 n ( b a ) , a + i n ( b a ) , i = 1 , 2 , , n
From each interval Ii, one sample is randomly drawn. For a problem with k parameters and n samples, this yields the Latin hypercube sample matrix (Equation (10)):
X = x 11 x 12 x 1 k x 21 x 22 x 2 k x n 1 x n 2 x n k
To demonstrate the parameter sampling strategy, the outer steel shell thickness and partition thickness are presented as examples (Table 1). Among the 400 finite element models, the outer steel shell thickness—a high-sensitivity parameter—is sampled more densely, ranging from 10 mm to 42 mm in eight stratified levels. In contrast, the partition thickness, with lower sensitivity, is sampled more coarsely across four levels within the 8–32 mm range. For material properties such as concrete and steel strength, sampling was based on standard engineering grades.
To efficiently support the sampling strategy established, a batch finite element modelling workflow was developed using Python 3.8 and ABAQUS (Figure 20). A total of 400 SCCA models were automatically generated, with input parameters derived from Latin Hypercube Sampling (LHS) and engineering-grade material specifications. For each parameter combination, Python scripts were used to define model geometry, assign material properties, apply boundary conditions, and generate ABAQUS .inp files. Following simulation, custom Python post-processing scripts extracted axial compressive responses from the resulting .odb files. These outputs were then compiled into a structured and scalable dataset, forming a robust foundation for training and validating neural network models aimed at predicting compressive capacity.

3.3. Dataset Statistics

A total of 400 finite element samples were generated based on the parameter sampling strategy defined in the previous section. To verify the quality of the generated dataset, histograms were plotted for all input variables. As shown in Figure 21, each parameter demonstrates an approximately uniform distribution within its assigned range, confirming the successful execution of the stratified sampling strategy. High-sensitivity variables—such as the thicknesses of outer and inner shells—exhibit finer grouping intervals, enhancing local resolution where learning precision is most critical.
The resulting axial compression capacities, computed via the Python 3.8–ABAQUS 2021 batch modelling workflow, are shown in Figure 21h to follow a near-normal distribution. This reflects a balanced representation of structural performance outcomes, avoiding overconcentration at the tails and ensuring diversity across load-bearing scenarios. Such distribution characteristics are beneficial for data-driven modelling, as they enhance both the training stability and generalization ability of the neural network.
Overall, the dataset structure—with uniform parameter coverage, stratified sensitivity-aware resolution, and well-distributed capacity outcomes—provides a robust foundation for the subsequent development of a neural network model to predict the axial capacity of SCCA structures.

4. Prediction and Application Based on Neural Networks

Building upon the established parametric database, this section develops a data-driven prediction framework for the axial compressive capacity of SCCA structures. Given the complex confinement mechanisms and nonlinear parameter interactions inherent to multi-shell steel–concrete composites, traditional design formulas are insufficient, and finite element simulations remain computationally intensive for iterative design tasks.
Neural networks have demonstrated strong potential in predicting the bearing capacity of multi-parameter steel–concrete composite structures [47,48,49,50], offering rapid convergence and robust generalization. In this study, various neural network models are developed to predict the axial compressive bearing capacity of the SCCA. The model with the best performance is then applied to optimize the design of the SCCA, considering cost, quality, and structural performance.

4.1. Models Used

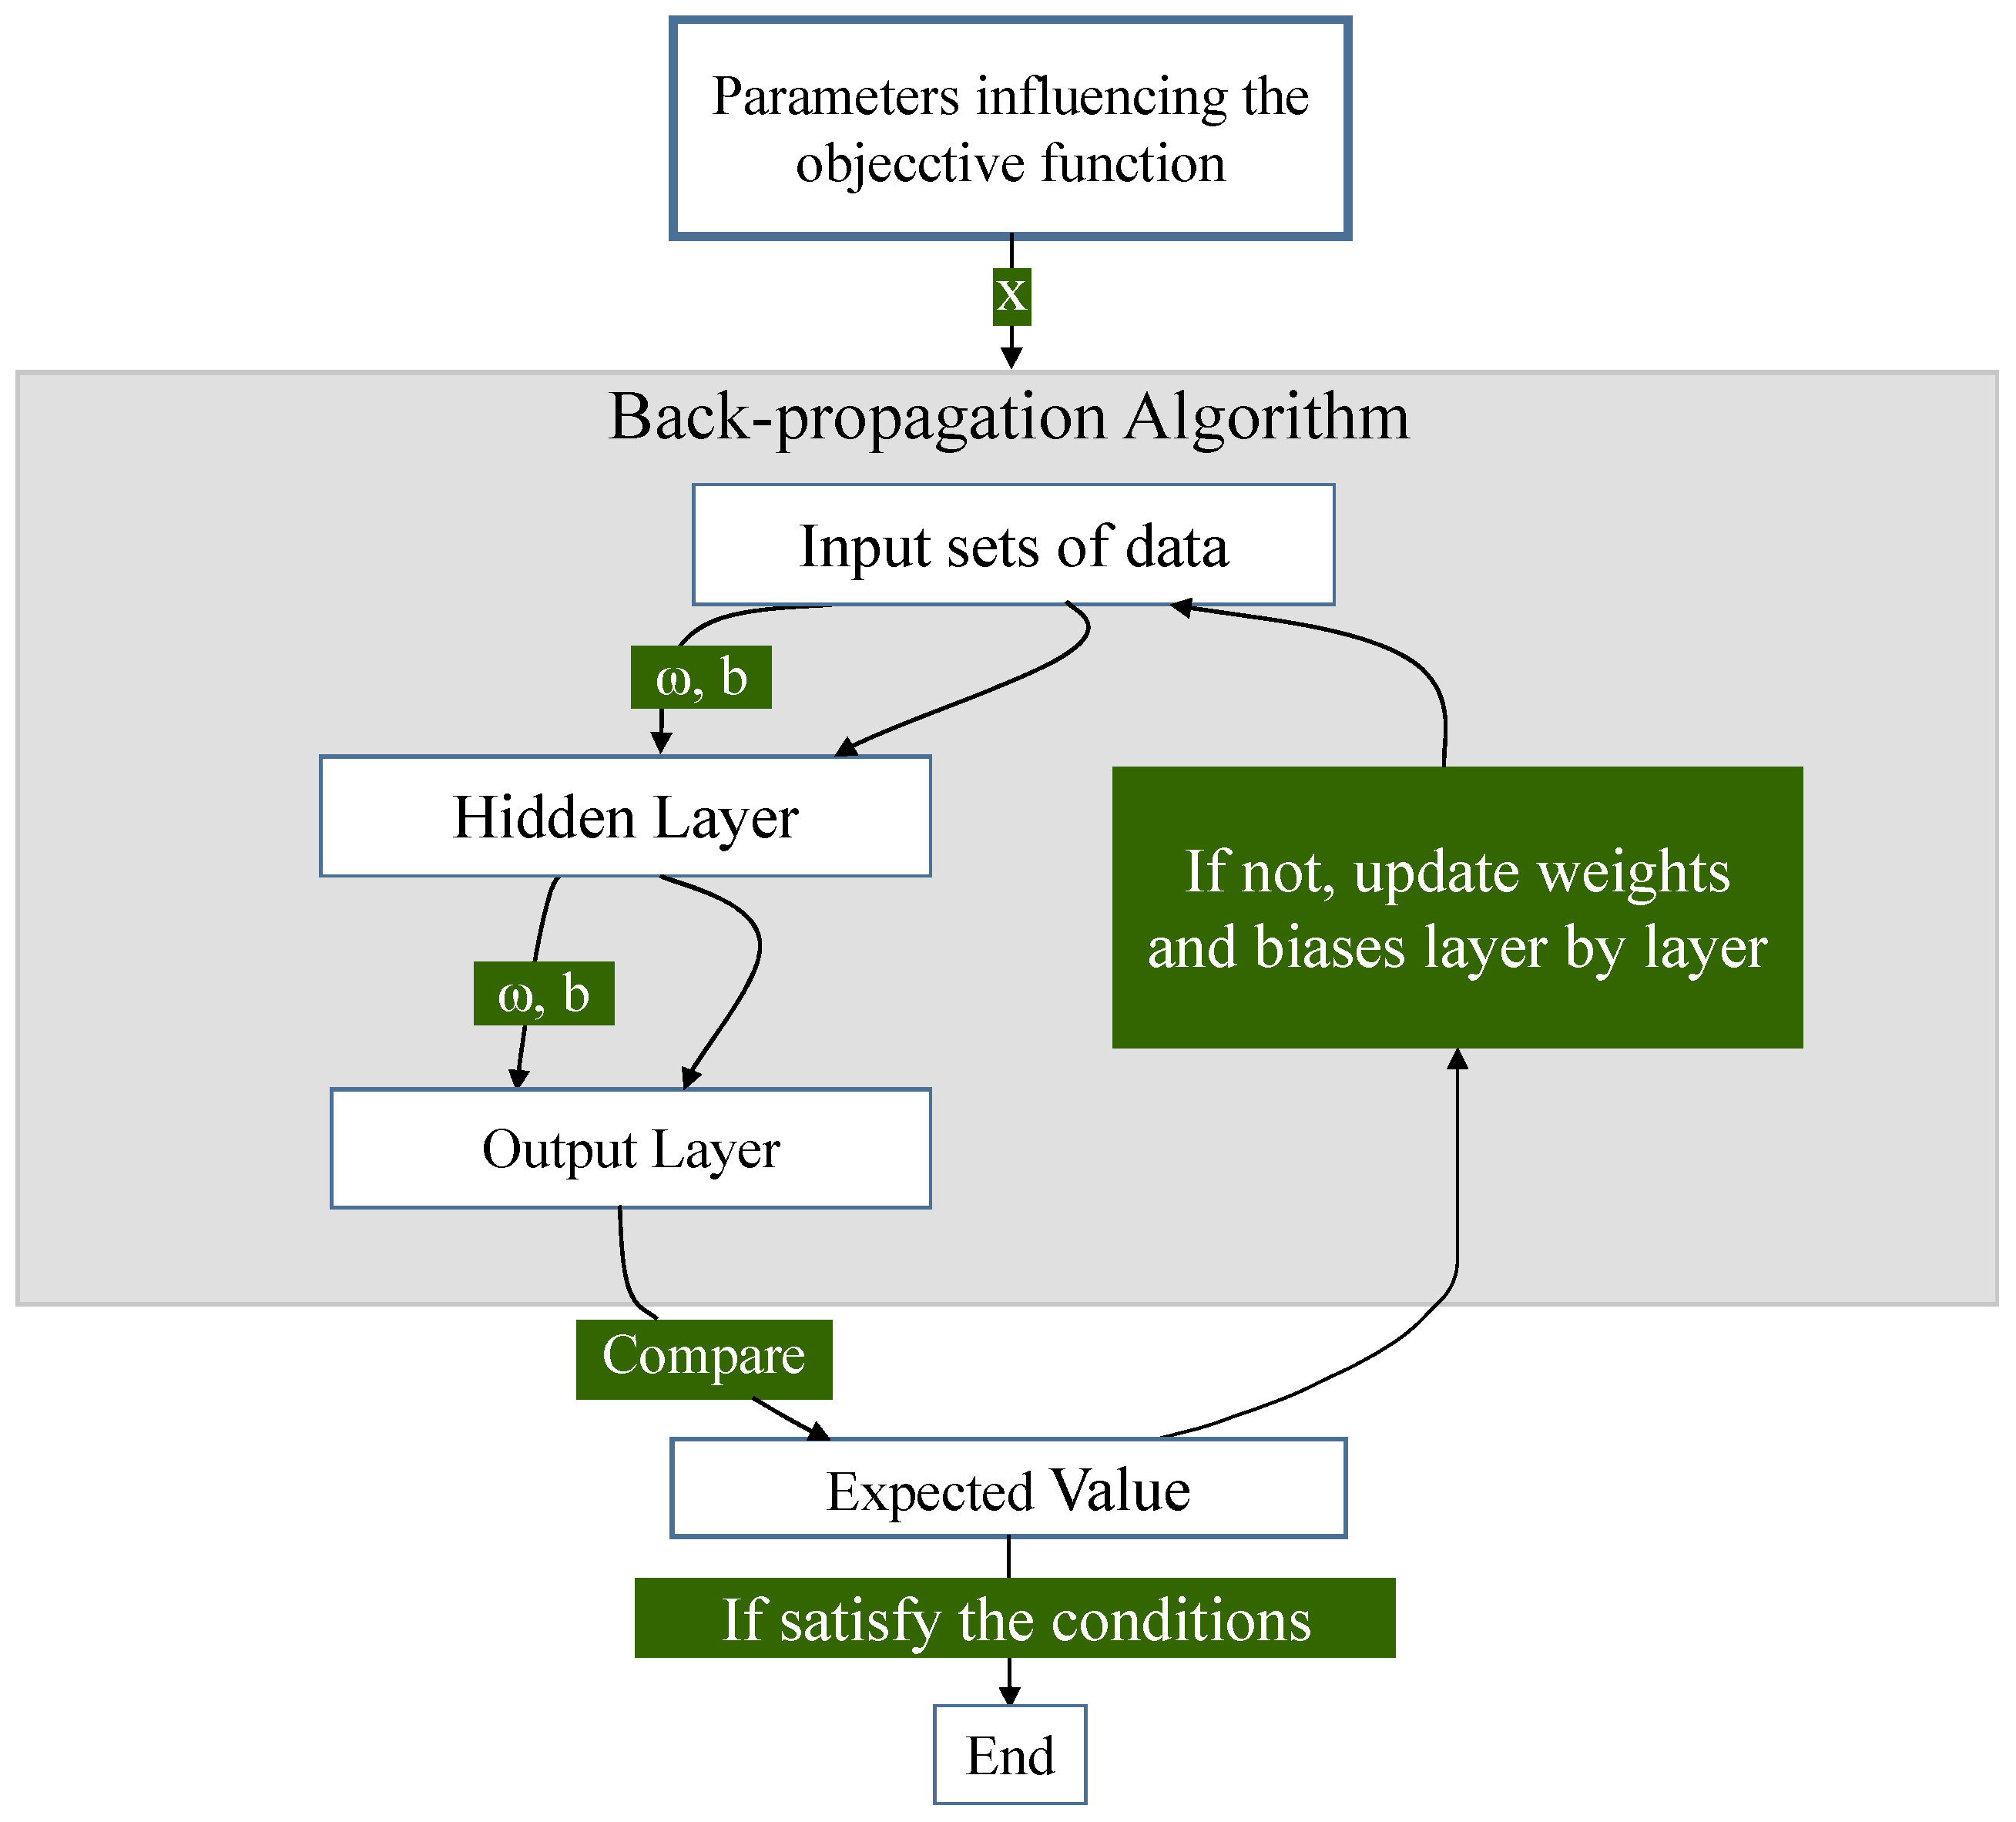
The neural network is a multilayer feedforward network that employs the error back-propagation algorithm [51]. The neural network computes the output error through forward propagation and determines the gradients layer by layer. It employs the gradient descent algorithm to update weights (ω) and biases (b), thereby minimizing the loss function. Its algorithmic process is illustrated in Figure 22.
To enhance the predictive accuracy of the SCCA’s bearing capacity, neural network models with different algorithms are employed, including normal neural network, SGD, Adam, Dropout, and OSS, each offering distinct characteristics and advantages. In developing these neural network models, it is assumed that the input features and output targets are drawn from the same underlying distribution, and that the available dataset is sufficient to capture the key nonlinear interactions.
The principle of SGD (Stochastic Gradient Descent) [52] lies in utilizing the stochastic gradient descent algorithm, where weights are updated iteratively based on the gradients of individual samples or small batches. This process gradually optimizes the loss function to achieve the training objectives of the model.
Adam (Adaptive Moment Estimation) is a first-order gradient-based stochastic optimization method proposed by Diederik P. Kingma and Jimmy Ba [53], which is based on adaptive moment estimation. It adjusts the learning rate dynamically by calculating the exponentially weighted averages of the gradient’s mean and variance. Adam offers rapid convergence and strong adaptability, making it ideal for high-dimensional optimization problems, such as SCCA bearing capacity prediction. However, it is prone to overfitting and may exhibit weaker generalization, potentially underperforming simpler optimization algorithms like SGD in tasks with limited datasets.
Dropout, proposed by Geoffrey Hinton and Nitish Srivastava [54], is a regularization method that reduces overfitting and enhances generalization by randomly deactivating a subset of neurons during training. Its principle is that, during training, Dropout “shuffles the lineup” by randomly disabling neurons, ensuring the network does not overly rely on any single neuron. Given the limited size of the SCCA dataset, the Dropout technique effectively prevents overfitting in the neural network when predicting compressive bearing capacity, thereby improving prediction accuracy.
OSS (Optimal Stopping Strategy) [55,56] is a widely used neural network training method designed to halt training at the optimal point for the predictive model. Given the limited size of the SCCA dataset and the high number of input neurons, the early stopping method effectively prevents overfitting and conserves computational resources, reducing the time cost associated with large datasets required for SCCA optimization. However, it is worth noting that combining Dropout with OSS in a neural network may cause the randomness of Dropout to interfere with the accurate assessment of validation loss trends, making this model unsuitable for the current study.

4.2. Neural Network Modelling

Based on the parametric study, the dataset consists of 400 input–target pairs corresponding to 11 parameters. These parameters include geometric features such as the thickness of the inner and outer steel tubes, inner and outer steel shells, partitions, as well as material properties such as the strength of the steel and concrete. The output neuron represents the ultimate compressive bearing capacity.
To ensure effective training and validation, the dataset is randomly divided into two groups: 75% for training and 25% for an independent validation set, on which all performance metrics (e.g., MSE, R2) are evaluated to assess model generalization. This hold-out validation strategy was adopted instead of k-fold cross-validation to maintain an entirely unseen evaluation set, preserve sufficient training samples, and avoid excessive computational cost.
Determining neural network parameters is crucial to ensure good generalization, convergence, fault tolerance, stability, and robustness. To quantitatively compare the predictive performance of models under different parameter settings, Mean square error (MSE), as shown in Equation (11), is used to evaluate and optimize model performance under different parameters.
MSE = 1 n i = 1 n ( y i y ^ i ) 2
where y i denotes the compressive capacity determined via finite element analysis, y ^ i represents the bearing capacity forecast by the model, and n indicates the number of samples.
Multiple experiments are conducted on key hyperparameters, including the number of hidden layers, the number of hidden neurons, batch size, learning rate, and optimizer. By comparing performance based on Mean Square Error (MSE), the final parameter configuration is determined, as shown in Table 2.

4.3. Evaluation Metrics

To quantitatively compare the predictive performance of different neural network models, four typical evaluation metrics are employed: coefficient of determination (R2), mean absolute error (MAE), root mean square error (RMSE), and coefficient of variation (CV). Each metric provides unique insights into the model’s prediction accuracy, robustness, and generalization capability.
(1) Coefficient of determination (R2):
R 2 = 1 i = 1 n ( y i y ^ i ) 2 i = 1 n ( y i y ¯ i ) 2
where y i denotes the compressive capacity determined via finite element analysis, y ^ i represents the bearing capacity forecast by the model, y ¯ i signifies the mean value of y i , and n indicates the number of samples. R2 describes the correlation between predicted and actual values, ranging from 0 to 1, with values closer to 1 indicating better performance.
(2) Mean absolute error (MAE):
MAE = 1 n i = 1 n y i y ^ i
MAE measures the average magnitude of prediction errors, providing a straightforward evaluation of the model’s accuracy. Unlike RMSE, it is less sensitive to outliers. The optimal value for MAE is zero.
(3) Root mean square error (RMSE):
RMSE = 1 n i = 1 n y i y ^ i 2
RMSE emphasizes larger errors by squaring them, making it particularly effective for detecting significant deviations between predictions and actual observed values. The optimal value for RMSE is zero.
(4) Coefficient of variation (CV):
CV = i = 1 n y i y ^ i y ¯ i 2 n / y ¯ i
CV measures the relative dispersion of prediction errors and is particularly useful for comparing different models with varying scales or measurement units. A lower CV indicates better model performance.
Taken together, these four metrics constitute a complementary evaluation system. R2 reflects the overall correlation between predicted and actual values, MAE and RMSE provide robust and sensitive measures of error magnitude, and CV ensures comparability across different scales. This integrated framework enables a more balanced and reliable assessment of model performance.

4.4. Performance of the Established Models

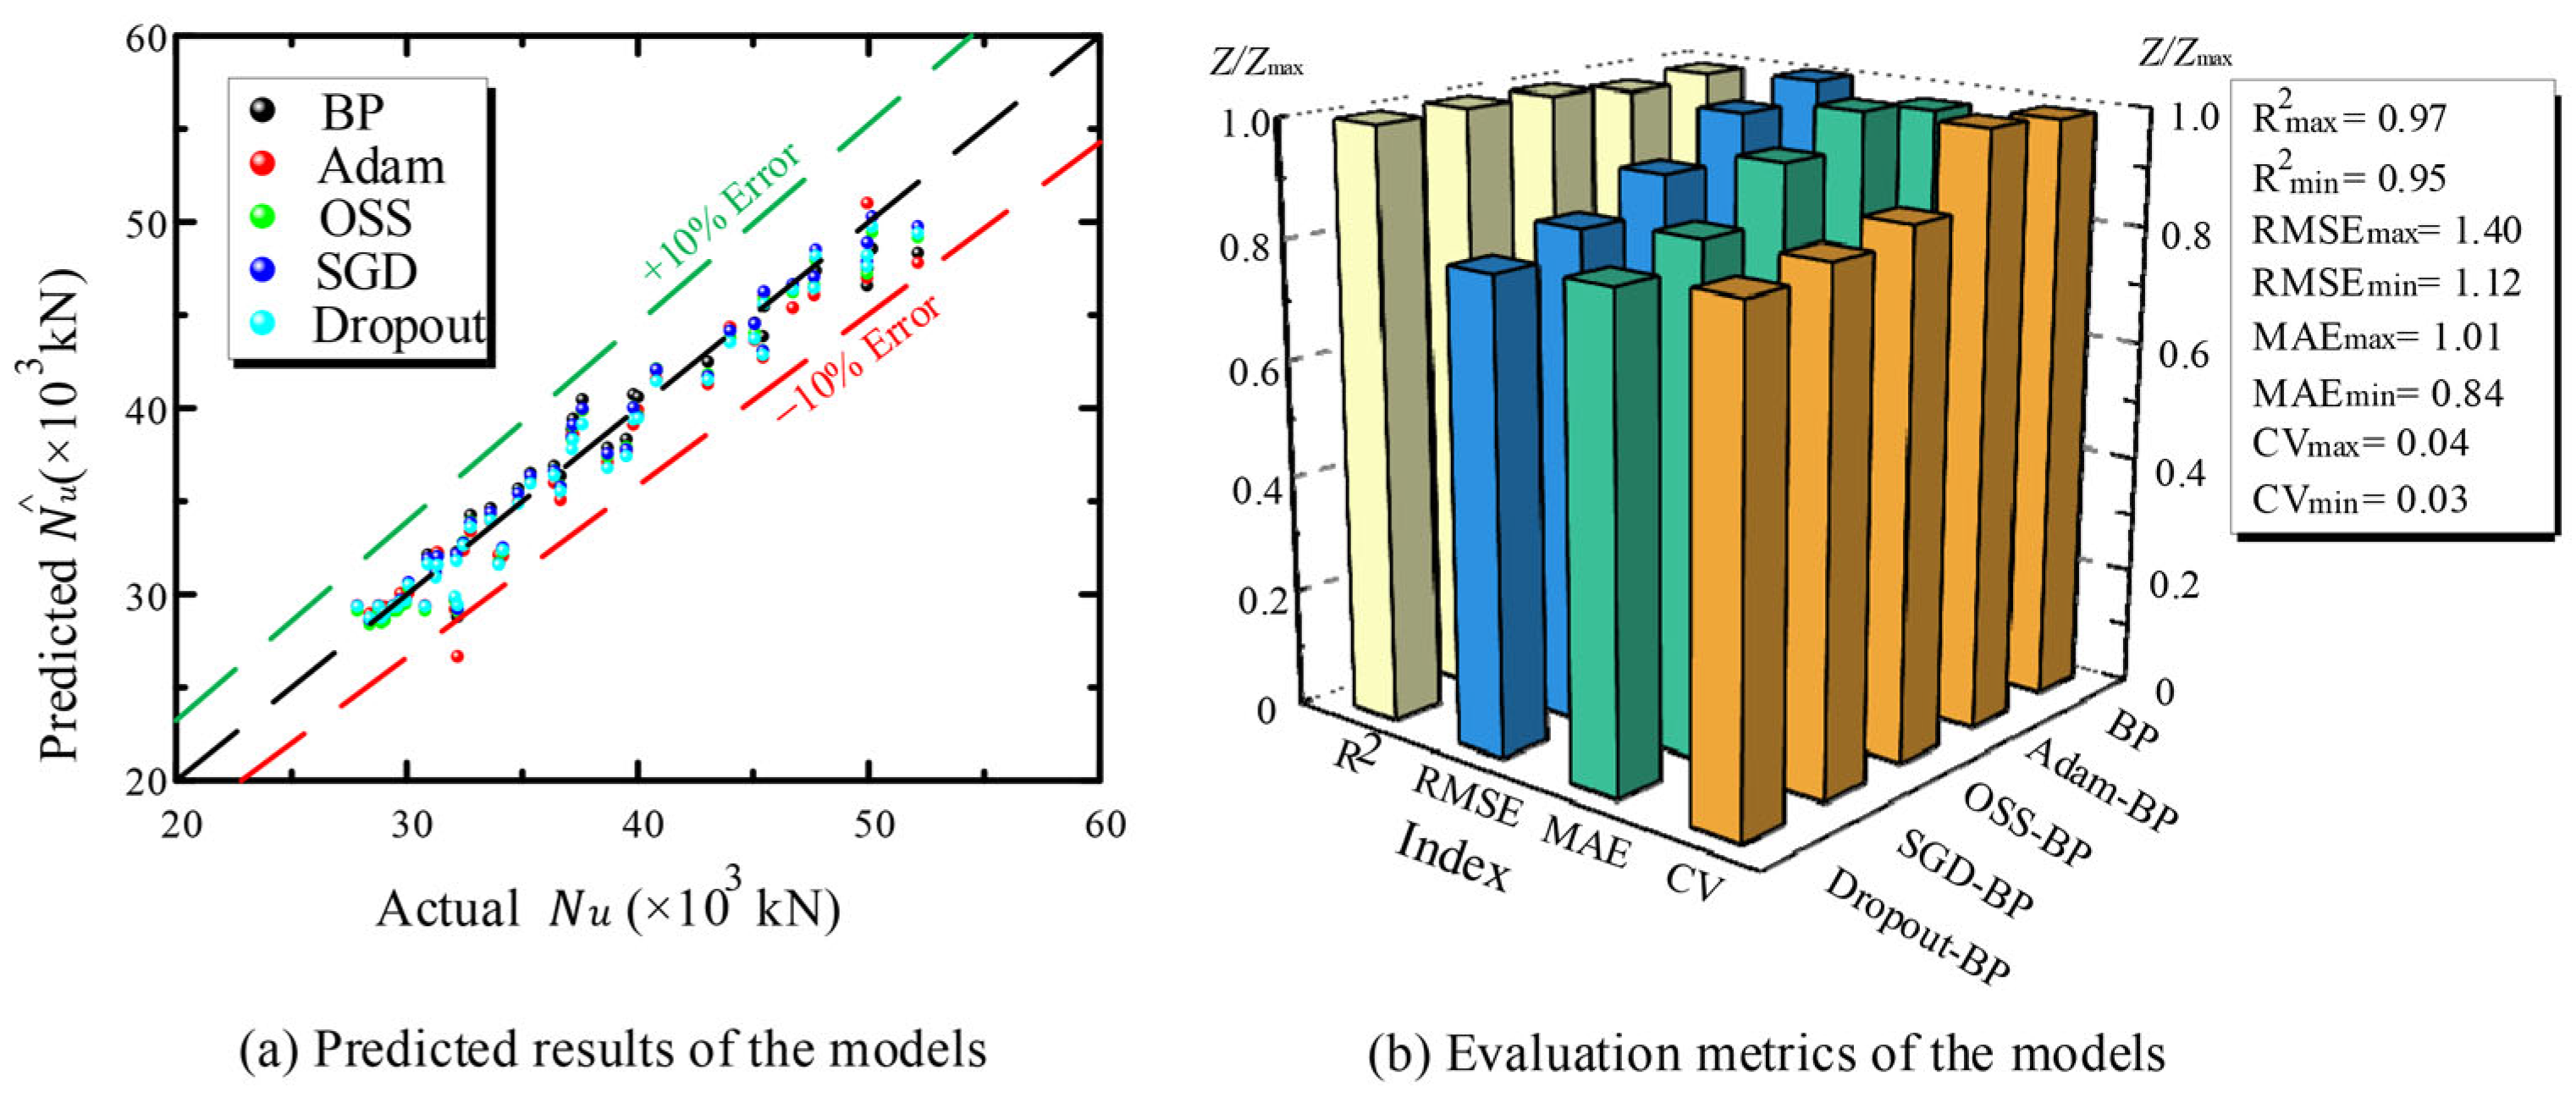
The performance of each model is compared using the above metrics. Figure 23 illustrates the comparison between the predicted and actual values for models, along with the normalized evaluation metrics. The normalization is achieved by dividing each metric value Z by its maximum Zmax. This enables a consistent and intuitive comparison across different error indicators.
As illustrated in Figure 23a, all models exhibit a strong correlation between the predicted and actual axial compressive capacities, with most data points falling within the ±10% error bounds. Notably, the Dropout model demonstrates the closest fit to the ideal diagonal, achieving an R2 value of 0.97. This indicates a high level of accuracy and generalization, making it particularly effective in capturing nonlinear parameter interactions under limited data conditions.
Figure 23b provides a normalized comparison of evaluation metrics—R2, RMSE, MAE, and CV—across all five models. The Dropout model consistently outperforms its counterparts across all indices, reflecting its robustness in handling complex structural behaviour while suppressing overfitting. This superior performance is primarily attributed to the Dropout technique, which randomly deactivates neurons during training, thereby enhancing the network’s resilience and promoting more generalized feature learning.
The OSS model also performs well due to its early stopping strategy, which helps effectively prevent overfitting and ensures stable and reliable training. However, compared to Dropout, its performance is slightly lower, possibly due to limited exposure to diverse data representations during training. Still, it consistently outperforms the Adam model across all evaluation metrics.
The SGD model delivers stable and acceptable results, slightly outperforming OSS in terms of RMSE and CV. This can be explained by its stochastic gradient updates, which allow the model to explore diverse local minima and avoid premature convergence, thus improving robustness on moderate-sized datasets.
In contrast, the Adam model exhibits the weakest performance, especially in MAE and CV. Although Adam is typically known for its rapid convergence and adaptive learning rates, it appears to suffer from overfitting and local noise sensitivity in this small-to-moderate data context. This suggests that Adam’s fast convergence may not be ideal when data coverage is sparse or parameter interactions are highly nonlinear.
In summary, the Dropout model demonstrates the best overall balance between accuracy, stability, and generalization. It effectively leverages the high-quality, stratified parametric dataset to capture the underlying structural behaviour of the SCCA, offering a practical and efficient alternative to traditional formula-based or computationally expensive simulation approaches.
Furthermore, for the Dropout model, a near-boundary hold-out test—conducted using samples within the top and bottom 5% of each parameter range—yielded only a slight reduction in predictive accuracy, with an R2 of 0.96 compared to 0.97 for the full validation set, confirming the model’s robustness near the edges of the training domain. In addition, the Dropout model offers a substantial computational advantage: generating a prediction takes less than 0.5 s on a standard desktop, compared with approximately 6 h required to set up, run, and post-process a single FE simulation, thus enabling rapid design iterations.

4.5. Application in Design Scheme

Typically, the superiority of the design for SCCA hinges on three key criteria: compression bearing capacity, cost, and mass. The compression bearing capacity ensures structural safety and reliability; cost reflects overall economic feasibility; mass influences various practical engineering challenges such as transportation and lifting. Therefore, optimizing the SCCA design involves carefully adjusting steel and concrete parameters to achieve the best possible balance among these criteria.
To facilitate such multi-objective design optimization, a neural network-based prediction tool was developed in this study. Compared to traditional finite element analysis, the trained neural network significantly improves efficiency by instantly predicting the axial load-bearing capacity based on key design parameters. A graphical user interface (GUI) has also been built, allowing users to input structural dimensions and material strengths to obtain real-time predictions (Figure 24).
In addition to single-point prediction, the neural network model also enables design space exploration. Within the tool, users can specify constraints such as minimum required capacity, or upper limits on cost or mass. The model then filters and projects the feasible designs from the parametric dataset. These design points are analysed statistically and visually represented in a 3D scatter plot (Figure 25a), and further narrowed down via 2D projections based on constraints. For instance, when limiting the structural mass to 80 tons, only designs satisfying this constraint are retained, and the optimal solution is selected by evaluating the trade-offs among all criteria, as illustrated in Figure 25b.

5. Conclusions

In this study, a data-driven prediction framework was established to evaluate the axial compressive bearing capacity of Steel–Concrete Composite Adapter (SCCA) structures. To overcome the limitations of traditional empirical formulas and the computational cost of finite element simulations, a well-structured parametric database was developed using a hybrid sampling strategy. Based on this dataset, a series of neural network models were trained, tested, and applied. The main findings are summarized as follows:
(1) Under axial compression, the SCCA exhibits diagonal extrusion failure in the sandwich concrete, with corner regions experiencing more uniform stress. The outer shell offers primary confinement, while the inner shell limits concrete outflow. This failure pattern informed the sensitivity analysis, which identified concrete strength and outer shell thickness as key parameters—supporting the development of a physics-informed neural network prediction model.
(2) A well-structured database of 400 samples was established using Latin Hypercube Sampling and engineering-grade inputs. This ensured uniform, stratified parameter coverage, especially for key variables. The resulting axial capacities follow a near-normal distribution, providing a representative, high-quality dataset that significantly improves the training efficiency and generalization performance of neural network models.
(3) Five neural network models, including SGD, Adam, Dropout, and OSS, were developed to predict Nu. Among them, the Dropout model demonstrated the highest accuracy, highlighting the smoothness of the Nu dataset and confirming the linearity of the relationship between parameters. The Dropout model provides an effective tool for predicting Nu under axial compressive loading conditions, addressing limitations of traditional formulas in capturing the nonlinear behaviour of SCCAs.
(4) A user-friendly graphical interface (UI) was developed for real-time predictions of the SCCA’s axial compressive capacity. This tool allows users to input design parameters and receive immediate results. Additionally, it supports multi-objective optimization, enabling the selection of optimal designs based on axial load capacity, cost, and mass constraints, making it a valuable tool for practical design applications.
(5) This study demonstrates the feasibility and advantages of combining LHS-based database generation with neural networks for composite structural systems. The proposed method not only improves computational efficiency but also ensures high prediction reliability, offering practical value for early-stage design optimization of SCCA towers in wind energy infrastructure.

Author Contributions

Conceptualization, S.-C.W. and J.-Z.Z.; methodology, S.-C.W.; software, J.-Z.Z.; validation, Y.-S.L.; formal analysis, H.W.; investigation, Y.-S.L.; resources, Y.-J.D.; data curation, H.W.; writing—original draft preparation, S.-C.W.; writing—review and editing, J.-Z.Z.; visualization, S.-C.W.; supervision, H.W., Y.-J.D. and C.-P.W.; project administration, C.-P.W.; funding acquisition, J.-Z.Z. All authors have read and agreed to the published version of the manuscript.

Funding

This research was funded by National Key Research and Development Program of China (2024YFF0505400), Fundamental Research Funds for the Central Universities (2024CDJYXTD-005), China Postdoctoral Science Foundation (2024M763871) and Chongqing Science and Technology Bureau (2024NSCQ-JQX0096).

Acknowledgments

The authors gratefully acknowledge the financial support provided by the National Key Research and Development Program of China (2024YFF0505400), Fundamental Research Funds for the Central Universities (2024CDJYXTD-005), China Postdoctoral Science Foundation (2024M763871) and Chongqing Science and Technology Bureau (2024NSCQ-JQX0096).

Conflicts of Interest

Authors Yong-Jun Duan and Cheng-Po Wang are employed by the company "China Construction Equipment & Engineering Co., Ltd.". The remaining authors declare no conflicts of interest. The authors declare that the research was conducted in the absence of any commercial or financial relationships that could be construed as a potential conflict of interest.

References

  1. Jin, K.-Y.; Zhou, X.-H.; Hu, C.; Wang, Y.-H.; Lan, Y.-S.; Zhou, Y. Axial Hysterestic Behavior of Prestressed CFDST Columns for Lattice-Type Wind Turbine Towers. Thin Walled Struct. 2024, 205, 112565. [Google Scholar] [CrossRef]
  2. LaNier, M.W. LWST Phase I Project Conceptual Design Study: Evaluation of Design and Construction Approaches for Economical Hybrid Steel/Concrete Wind Turbine Towers, National Renewable Energy Laboratory, June 28, 2002–July 31, 2004; Report No. NREL/SR-500-36777; National Renewable Energy Lab.: Golden, CO, USA, 2005; p. 15011444. [Google Scholar]
  3. Stavridou, N.; Koltsakis, E.; Baniotopoulos, C.C. Lattice and Tubular Steel Wind Turbine Towers. Comparative Structural Investigation. Energies 2020, 13, 6325. [Google Scholar] [CrossRef]
  4. Zhou, Z.; Chen, C.; Shen, X.; Zhou, X.; Hua, X. Conceptual Design of a Prestressed Precast UHPC-Steel Hybrid Tower to Support a 15 MW Offshore Wind Turbine. Eng. Struct. 2024, 321, 118939. [Google Scholar] [CrossRef]
  5. Gu, Y.-W.; Nie, X.; Liu, Y.-F.; Duan, S.-K.; Fan, J.-S. Experimental and Numerical Study of Steel-to-Concrete Joint Section in Hybrid Cable-Stayed Bridges. J. Constr. Steel Res. 2021, 187, 106982. [Google Scholar] [CrossRef]
  6. Yao, Y.; Yan, M.; Shi, Z.; Wang, Y.; Bao, Y. Mechanical Behavior of an Innovative Steel–Concrete Joint for Long-Span Railway Hybrid Box Girder Cable-Stayed Bridges. Eng. Struct. 2021, 239, 112358. [Google Scholar] [CrossRef]
  7. Yang, S.; Pu, Q.; Shi, Z.; Hong, Y. Mechanical Behavior of Steel–Concrete Composite Joints in Railway Hybrid Cable-Stayed Bridges. J. Constr. Steel Res. 2020, 173, 106242. [Google Scholar] [CrossRef]
  8. Liew, J.Y.R.; Chua, Y.S.; Dai, Z. Steel Concrete Composite Systems for Modular Construction of High-Rise Buildings. Structures 2019, 21, 135–149. [Google Scholar] [CrossRef]
  9. Ren, W.; Deng, R.; Zhou, X.-H.; Wang, Y.-H.; Cao, F.; Jin, K.-Y. Compressive Behavior of the Steel–Concrete Composite Adapter for Wind Turbine Hybrid Towers. Eng. Struct. 2023, 280, 115703. [Google Scholar] [CrossRef]
  10. Ren, W.; Deng, R.; Zhou, X.-H.; Cao, F.; Wang, Y.-H.; Jin, K.-Y.; Lan, Y.-S.; Luo, W. Steel-Concrete Composite Adapter for Wind Turbine Hybrid Towers: Mechanism and Ultimate Capacity Prediction under Compression. Structures 2023, 56, 104922. [Google Scholar] [CrossRef]
  11. Vernardos, S.; Gantes, C. Experimental Behavior of Concrete-Filled Double-Skin Steel Tubular (CFDST) Stub Members under Axial Compression: A Comparative Review. Structures 2019, 22, 383–404. [Google Scholar] [CrossRef]
  12. Hu, Y.; Zhao, J.; Zhang, D.; Chen, C. Experimental Seismic Performance of CFDST- Steel Beam Frames with Different Construction Details. J. Constr. Steel Res. 2019, 162, 105736. [Google Scholar] [CrossRef]
  13. Yan, X.-F.; Zhao, Y.-G.; Lin, S.; Zhang, H. Confining Stress Path-Based Compressive Strength Model of Axially Compressed Circular Concrete-Filled Double-Skin Steel Tubular Short Columns. Thin Walled Struct. 2021, 165, 107949. [Google Scholar] [CrossRef]
  14. Jin, K.-Y.; Zhou, X.-H.; Ren, W.; Wang, Y.-H.; Luo, W. Research on Hexagonal Concrete-Filled Steel Tubular Transition Pieces for Wind Turbine Hybrid Towers under Axial Compression. Thin Walled Struct. 2024, 200, 111956. [Google Scholar] [CrossRef]
  15. Xu, F.; Chen, J.; Jin, W. Experimental Investigation of Thin-Walled Concrete-Filled Steel Tube Columns with Reinforced Lattice Angle. Thin Walled Struct. 2014, 84, 59–67. [Google Scholar] [CrossRef]
  16. Liang, W.; Dong, J.; Wang, Q. Mechanical behaviour of concrete-filled double-skin steel tube (CFDST) with stiffeners under axial and eccentric loading. Thin Walled Struct. 2019, 138, 215–230. [Google Scholar] [CrossRef]
  17. Ekmekyapar, T. Hussein Ghanim Hasan The influence of the inner steel tube on the compression behaviour of the concrete filled double skin steel tube (CFDST) columns. Mar. Struct. 2019, 66, 197–212. [Google Scholar] [CrossRef]
  18. Li, W.; Chen, B.; Han, L.-H. Dennis Lam Experimental study on the performance of steel-concrete interfaces in circular concrete-filled double skin steel tube. Thin Walled Struct. 2020, 149, 106660. [Google Scholar] [CrossRef]
  19. Cheng, Z.; Wang, F.; Zhang, D. Analytical model for axially compressed circular concrete-filled double skin steel tubes (CFDSTs): Insights from concrete non-uniformly confined states. Thin Walled Struct. 2023, 192, 111106. [Google Scholar] [CrossRef]
  20. Huang, H.; Han, L.-H.; Tao, Z.; Zhao, X.-L. Analytical Behaviour of Concrete-Filled Double Skin Steel Tubular (CFDST) Stub Columns. J. Constr. Steel Res. 2010, 66, 542–555. [Google Scholar] [CrossRef]
  21. Pagoulatou, M.; Sheehan, T.; Dai, X.; Lam, D. Finite element analysis on the capacity of circular concrete-filled double-skin steel tubular (CFDST) stub columns. Eng. Struct. 2014, 72, 102–112. [Google Scholar] [CrossRef]
  22. Li, W.; Cai, Y.-X. Performance of CFDST stub columns using high-strength steel subjected to axial compression. Thin Walled Struct. 2019, 141, 411–422. [Google Scholar] [CrossRef]
  23. Yang, B.; Shen, L.; Chen, K.; Feng, C.; Lin, X.; Elchalakani, M.; Xu, S. Mechanical Performance of Circular Ultrahigh-Performance Concrete–Filled Double Skin High-Strength Steel Tubular Stub Columns under Axial Compression. J. Struct. Eng. 2022, 148, 04021298. [Google Scholar] [CrossRef]
  24. Shi, Y.-L.; Ji, S.-H.; Wang, W.-D.; Xian, W.; Fan, J.-H. Axial compressive behaviour of tapered CFDST stub columns with large void ratio. J. Constr. Steel Res. 2022, 191, 107206. [Google Scholar] [CrossRef]
  25. Ma, Y.; Yang, Z.; Liu, Y.; Liu, J.; Zhao, W.; Qiu, R.; Chen, X.; Qiao, Y.; Deng, Y. Flexural Behavior of Rectangular Concrete Filled Steel Tubular (RCFST) Composite Truss Bridge. Structures 2025, 72, 108260. [Google Scholar] [CrossRef]
  26. Wang, J.; Ke, K.; Yam, M.C.H.; Teng, M.; Wang, W. Improving Structural Robustness of Steel Frame Buildings by Enhancing Floor Deck Connections. J. Constr. Steel Res. 2023, 204, 107842. [Google Scholar] [CrossRef]
  27. Bai, W.; Li, Y.; Ji, J.; Liu, Y.; Zhang, L.; Wang, R.; Jiang, L.; He, L. Axial Compression Behavior of Symmetrical Full-Scale Concrete Filled Double Skin Steel Tube Stub Columns. Symmetry 2022, 14, 223. [Google Scholar] [CrossRef]
  28. Dong, Z.; Peng, H.; Wang, K.; Liu, T. Performance of Prefabricated Hollow Concrete-Filled Steel Tube Bracings on Transverse Bending: Experimental and Numerical Analyses. J. Mar. Sci. Eng. 2023, 11, 2009. [Google Scholar] [CrossRef]
  29. Zhang, W.; Liu, A.; Xiong, Q.; Wu, W. Research on the Seismic Performance of Novel Side-Plate Reinforced Beam-Column Composite Joints. J. Constr. Steel Res. 2024, 222, 108935. [Google Scholar] [CrossRef]
  30. Architectural Institute of Japan. Recommendations for Design and Construction of Concrete Filled Steel Tubular Structures; Architectural Institute of Japan: Tokyo, Japan, 1997. [Google Scholar]
  31. ANSI/AISC 360-10; Specification for Structural Steel Buildings. American Institute of Steel Construction (AISC-ANSI): Chicago, IL, USA, 2010.
  32. Han, L.-H.; Lam, D.; Nethercot, D. Design Guide for Concrete-Filled Double Skin Steel Tubular Structures; CRC Press: Boca Raton, FL, USA, 2018; ISBN 0-429-44041-3. [Google Scholar]
  33. Johnson, R.P.; Anderson, D. Designers' Guide to EN 1994-1-1: Eurocode 4: Design of Composite Steel and Concrete Structures: General Rules and Rules for Buildings; Thomas Telford: London, UK, 2004. [Google Scholar]
  34. Wang, C.; Chan, T.-M. Machine Learning (ML) Based Models for Predicting the Ultimate Strength of Rectangular Concrete-Filled Steel Tube (CFST) Columns under Eccentric Loading. Eng. Struct. 2023, 276, 115392. [Google Scholar] [CrossRef]
  35. Nguyen, Q.H.; Ly, H.-B.; Tran, V.Q.; Nguyen, T.-A.; Phan, V.-H.; Le, T.-T.; Pham, B.T. A Novel Hybrid Model Based on a Feedforward Neural Network and One Step Secant Algorithm for Prediction of Load-Bearing Capacity of Rectangular Concrete-Filled Steel Tube Columns. Molecules 2020, 25, 3486. [Google Scholar] [CrossRef]
  36. Nguyen, H.Q.; Ly, H.-B.; Tran, V.Q.; Nguyen, T.-A.; Le, T.-T.; Pham, B.T. Optimization of Artificial Intelligence System by Evolutionary Algorithm for Prediction of Axial Capacity of Rectangular Concrete Filled Steel Tubes under Compression. Materials 2020, 13, 1205. [Google Scholar] [CrossRef]
  37. Wang, Y.; Liu, Z.Q.; Zhang, M. Prediction of Mechanical Behavior of Concrete Filled Steel Tube Structure Using Artificial Neural Network. Appl. Mech. Mater. 2013, 368–370, 1095–1098. [Google Scholar] [CrossRef]
  38. Liu, X.; Dangi, S.K.; Yang, Z.; Song, Y.; Sun, Q.; Wang, J. Study on Compression Bearing Capacity of Tapered Concrete-Filled Double-Skin Steel Tubular Members Based on Heuristic-Algorithm-Optimized Backpropagation Neural Network Model. Buildings 2024, 14, 3375. [Google Scholar] [CrossRef]
  39. Hibbitt, K. ABAQUS/Standard User’s Manual, Version 6.4.1.; Hibbitt, Karlsson, & Sorensen Inc.: Pawtucket, RI, USA, 2003. [Google Scholar]
  40. Smith, M. ABAQUS/Standard User’s Manual, Version 6.9.; Hibbitt, Karlsson, & Sorensen Inc.: Pawtucket, RI, USA, 2009. [Google Scholar]
  41. American Concrete Institute. Building Code Requirements for Structural Concrete (ACI 318-05) and Commentary (ACI 318R-05); American Concrete Institute: Farmington Hills, MI, USA, 2005. [Google Scholar]
  42. Han, L.-H.; Yao, G.-H.; Tao, Z. Performance of Concrete-Filled Thin-Walled Steel Tubes under Pure Torsion. Thin Walled Struct. 2007, 45, 24–36. [Google Scholar] [CrossRef]
  43. Liu, W. Research on Mechanism of Concrete-Filled Steel Tubes Subjected to Local Compression. Ph.D. Thesis, Fuzhou University, Fuzhou, China, 2005; pp. 64–65. [Google Scholar]
  44. Shen, J.M.; Wang, C.Z.; Jiang, J.J. Finite Element Analysis on Reinforced Concrete and the Ultimate Analysis on Slab and Shell; Tsinghua University Press: Beijing, China, 1993. [Google Scholar]
  45. Han, L.H.; Tao, Z.; Huang, H.; Zhao, X.L. Concrete-filled double skin (SHS outer and CHS inner) steel tubular beam-columns. Thin Walled Struct. 2004, 42, 1329–1355. [Google Scholar] [CrossRef]
  46. Helton, J.C.; Davis, F.J.; Johnson, J.D. A Comparison of Uncertainty and Sensitivity Analysis Results Obtained with Random and Latin Hypercube Sampling. Reliab. Eng. Syst. Saf. 2005, 89, 305–330. [Google Scholar] [CrossRef]
  47. Du, H.; Pan, J.; Shen, H.; Dong, J. Numerical Analysis of Flexural Behavior of Prestressed Steel-Concrete Continuous Composite Beams Based on BP Neural Network. Comput. Intell. Neurosci. 2022, 2022, 5501610. [Google Scholar] [CrossRef]
  48. Ahmadi, M.; Naderpour, H.; Kheyroddin, A. Utilization of Artificial Neural Networks to Prediction of the Capacity of CCFT Short Columns Subject to Short Term Axial Load. Arch. Civ. Mech. Eng. 2014, 14, 510–517. [Google Scholar] [CrossRef]
  49. Hou, C.; Zhou, X.-G. Strength Prediction of Circular CFST Columns through Advanced Machine Learning Methods. J. Build. Eng. 2022, 51, 104289. [Google Scholar] [CrossRef]
  50. Duong, T.H.; Le, T.T.; Le, M.V. Practical Machine Learning Application for Predicting Axial Capacity of Composite Concrete-Filled Steel Tube Columns Considering Effect of Cross-Sectional Shapes. Int. J. Steel Struct. 2023, 23, 263–278. [Google Scholar] [CrossRef]
  51. Rumelhart, D.E.; Hinton, G.E.; Williams, R.J. Learning Representations by Back-Propagating Errors. Nature 1986, 323, 533–536. [Google Scholar] [CrossRef]
  52. Robbins, H.; Monro, S. A Stochastic Approximation Method. Ann. Math. Stat. 1951, 22, 400–407. [Google Scholar] [CrossRef]
  53. Kingma, D.P. Adam: A Method for Stochastic Optimization. arXiv 2014, arXiv:14126980. [Google Scholar]
  54. Srivastava, N.; Hinton, G.; Krizhevsky, A.; Sutskever, I.; Salakhutdinov, R. Dropout: A Simple Way to Prevent Neural Networks from Overfitting. J. Mach. Learn. Res. 2014, 15, 1929–1958. [Google Scholar]
  55. Shen, R.; Gao, L.; Ma, Y.-A. On Optimal Early Stopping: Over-Informative versus under-Informative Parametrization. arXiv 2022, arXiv:2202.09885. [Google Scholar]
  56. Raskutti, G.; Wainwright, M.J.; Yu, B. Early Stopping and Non-Parametric Regression: An Optimal Data-Dependent Stopping Rule. J. Mach. Learn. Res. 2014, 15, 335–366. [Google Scholar]
Figure 1. Lattice tower and adapter.
Buildings 15 03103 g001
Figure 2. Structural layout of SCCA.
Buildings 15 03103 g002
Figure 3. Boundary conditions of the SCCA.
Buildings 15 03103 g003
Figure 4. Load–displacement curve.
Buildings 15 03103 g004
Figure 5. Stages of the load–displacement curve.
Buildings 15 03103 g005
Figure 6. Stress distribution in corner and side regions of sandwich concrete.
Buildings 15 03103 g006
Figure 7. Strain localization and deformation patterns in steel shells.
Buildings 15 03103 g007
Figure 8. Influence of thickness of outer shell on axial compression capacity.
Buildings 15 03103 g008
Figure 9. Influence of yield strength of outer shell on axial compression capacity.
Buildings 15 03103 g009
Figure 10. Influence of radius–thickness ratio of inner shell on axial compression capacity.
Buildings 15 03103 g010
Figure 11. Influence of yield strength of inner shell on axial compression capacity.
Buildings 15 03103 g011
Figure 12. Influence of thickness of outer tube on axial compression capacity.
Buildings 15 03103 g012
Figure 13. Influence of yield strength of outer tube on axial compression capacity.
Buildings 15 03103 g013
Figure 14. Influence of thickness of inner tube on axial compression capacity.
Buildings 15 03103 g014
Figure 15. Influence of yield strength of inner tube on axial compression capacity.
Buildings 15 03103 g015
Figure 16. Influence of thickness of steel partitions on axial compression capacity.
Buildings 15 03103 g016
Figure 17. Influence of yield strength of steel partitions on axial compression capacity.
Buildings 15 03103 g017
Figure 18. Influence of concrete strength on axial compression capacity.
Buildings 15 03103 g018
Figure 19. Parameter sensitivity analysis.
Buildings 15 03103 g019
Figure 20. Python–ABAQUS secondary development modelling system.
Buildings 15 03103 g020
Figure 21. Histograms of input parameters and output capacities.
Buildings 15 03103 g021
Figure 22. Algorithmic process of neural network.
Buildings 15 03103 g022
Figure 23. Performance of the established models.
Buildings 15 03103 g023
Figure 24. GUI screenshot.
Buildings 15 03103 g024
Figure 25. 3D scatter plot of criteria.
Buildings 15 03103 g025
Table 1. Sampling scheme based on parameter sensitivity.
ParameterSensitivity LevelRange
(mm/MPa)
Sampling GroupsSampling Basis
Thickness of Outer ShellHigh[10, 42]8LHS
Thickness of Outer TubeModerate[10, 40]6LHS
Thickness of Inner ShellHigh[14, 54]8LHS
Thickness of Inner TubeModerate[10, 34]6LHS
Thickness of PartitionsLow[8, 32]4LHS
Steel Yield StrengthLow[40, 80]5Engineering Grades
Concrete StrengthHigh[235, 420]5Engineering Grades
Table 2. Basic parameters of neural networks.
ParametersNotationValue and Description
Neurons in input layerninput11
Number of hidden layersnlayer2
Neurons in hidden layersnneuron64, 32
Neurons in output layernoutput1
Cost functionMSEMean square error
Activation functionfhiddenSigmoid
Batch sizeB2
Learning Rate (Initial)η0.01
Disclaimer/Publisher’s Note: The statements, opinions and data contained in all publications are solely those of the individual author(s) and contributor(s) and not of MDPI and/or the editor(s). MDPI and/or the editor(s) disclaim responsibility for any injury to people or property resulting from any ideas, methods, instructions or products referred to in the content.