Article

Concrete Mixture Cold Joint Prevention and Control System

1
CCCC Fourth Harbor Engineering Co., Ltd., No. 368 Lijiao Road, Haizhu District, Guangzhou 510290, China
2
College of Water Conservancy and Hydropower Engineering, Hohai University, Nanjing 210098, China
*
Author to whom correspondence should be addressed.
Buildings 2025, 15(17), 3096; https://doi.org/10.3390/buildings15173096
Submission received: 27 July 2025 / Revised: 19 August 2025 / Accepted: 22 August 2025 / Published: 28 August 2025
(This article belongs to the Section Building Materials, and Repair & Renovation)

Abstract

To resolve the issue of cold joints forming in concrete during the construction process, this study has developed a control system with visual prevention capabilities. By utilizing the improved YOLO11-LP license plate recognition system, we record license plate information and calculate the supply time of the mixture. Based on the structural characteristics of the belt conveyor, laser ranging technology, and GNSS-RTK positioning technology, an algorithm is proposed to determine the operating status of the belt conveyor, calculate the position and area of the mixed material, and record the pouring and compaction time. This algorithm is suitable for parameter acquisition equipment throughout the entire process of mixture pouring. The developed software system is based on the parameters calculated by the pouring process time calculation model, combined with the cold joint prevention and control threshold of the mixture, and feeds back the construction warning information to the site through a visual model. The application proves that the developed preventive control system helps to avoid the formation of cold joints in the mixture.

1. Introduction

Concrete, as one of the most widely used materials in modern construction engineering, directly affects the durability and safety of the structure. However, due to negligence in on-site management during the construction process, discontinuous construction on site resultes in long intervals between concrete pouring in different areas of the structure, and the interval between pouring new and old concrete exceeds the initial setting time of the old concrete, leading to the formation of weak bonding surfaces between the new and old concrete, namely cold joints [1,2,3,4]. The presence of cold joints can cause changes in the porosity of concrete, which not only directly affects the mechanical properties of concrete but also increases durability issues such as chloride ion penetration [5,6], thus reducing the actual service life of concrete buildings [7,8].
In fact, the pouring interval is the main reason for the formation of cold joints and an important factor affecting the mechanical properties and durability of the cold joint interface [9]. Zhao et al. [10] studied the influence of factors such as pouring interval and cold joint position on the mechanical properties of cold joint concrete. The results showed that with the increase in pouring interval, the elastic modulus and splitting tensile strength of concrete decreased linearly and exponentially, respectively. Ji et al. [11] studied the damage mechanism of concrete under different pouring intervals. The research results showed that the adhesion force and internal friction angle of the cold joint interface were logarithmically related to the pouring interval, and the longer the pouring interval, the lower the concrete performance. Therefore, strictly controlling the pouring interval of concrete during the construction process can prevent the formation of cold joints. However, the pouring position and pouring time during the construction process mainly depend on the subjective control of workers during the construction period. These parameters have significant randomness, making it impossible to control the pouring time interval, which will lead to the formation of concrete cold joints.
In recent years, with the development of information technology and intelligent sensors, solutions for similar construction problems have emerged in civil engineering construction [12,13]. Tian et al. [14] attempted to use Global Navigation Satellite Systems (GNSS) to track the vibration trajectory of concrete. Zhong et al. [15] used Global Navigation Satellite Systems (GNSS) to collect real-time data on compaction process parameters. This positioning data is used to evaluate the construction quality of the entire building area and provide timely feedback to workers, thereby achieving effective control of construction quality [16]. Pehlivan [17] used a robotic total station (RTS) and GNSS to determine the relative displacement of tower structure motion. Liu et al. [18] proposed a cyclic operation network (CYCLONE) simulation model for component storage and hoisting to calculate the on-site transportation time of precast concrete. Liu et al. [19] used EDEM to simulate the transportation and unloading process of fresh concrete and established the relationship between surface energy and mixing time. Zhang et al. [20] developed a regression model to predict the shear strength of cold-jointed concrete. Deng et al. [21] used BP and CFD simulations to determine the flow parameters of concrete slurry and determine the pouring interval time. However, existing research on intelligent construction mostly focuses on the control of single processes, such as concrete vibration and compaction, and some studies focus on performance evaluation after the formation of cold joints. There are still significant shortcomings in the dynamic supervision of cold joint formation during the entire process of concrete pouring.
Existing research has mostly focused on the analysis of performance degradation patterns after the formation of cold joints, or on intelligent exploration of single construction processes, such as vibration trajectory and transportation time. However, none of them have achieved a collaborative collection of key parameters and dynamic warning of cold joint risks throughout the entire process of concrete production, transportation, pouring, and vibration. The core innovation of this study lies in the first proposal of an integrated solution that integrates multiple technologies, such as YOLO11-LP license plate recognition, laser ranging, and GNSS-RTK positioning. A full process parameter acquisition algorithm covering automatic calculation of mixing material feeding time, accurate measurement of fabric position and area, and dynamic recording of pouring and compaction time was constructed. Based on this, a visual model-based cold joint warning and feedback control mechanism was developed, achieving a technological leap from “post evaluation” of cold joints to “process prevention”, providing a solution for intelligent prevention and control of cold joints in concrete construction, and contributing to the long-term stable operation of concrete structures.

2. Acquisition Algorithms of the Entire Pouring Process Parameters

Cold joint refers to the phenomenon in the pouring process of a mixture, where the interval between pouring layers at different times is too long, or waiting for vibration causes damage to the initially set structural layer, leading to defects in the joint surface. Obviously, the spatial and temporal control of the preparation, transportation, pouring, and vibration processes in the warehouse will directly affect the probability and severity of the formation of cold joints in the joint surface of layered pouring. Due to the lack of corresponding acquisition algorithms and supporting sensors, it is difficult to calculate the pouring time and location in the current manual pouring construction. However, improper calculation of pouring time and position can lead to cold joints in the structure of the mixture, which is not conducive to the long-term stable operation of the mixture. Therefore, the acquisition of data throughout the entire process of pouring the mixture is a key step in preventing and controlling the occurrence of cold joints in the mixture.

2.1. Calculation Model for the Whole Process Time of Mixture Pouring

The pouring process of concrete mixture usually involves multiple continuous processes, including material production, transportation, pouring, and vibration, as shown in Figure 1. The accumulated process time from the outlet to the completion of vibration can be referred to as the total process time T of pouring the mixture.
In the process of concrete construction, the specific time parameters for each process include the following: Supply time (TA), which is the total time it takes for the concrete mixture to be loaded and transported from the mixing station to the unloading port for unloading; Pouring time (TB) refers to the duration during which the mixture is transported by the belt conveyor system from the discharge port to the discharge port; Coverage time (TC) refers to the time required for the mixture of the next pouring layer (purple area in Figure 1) to completely cover the current pouring layer (green area in Figure 1) along the pouring path; Vibration time (TD) is the duration of the compaction operation after the next layer of mixed material is covered. These time parameters together constitute the complete process sequence system for pouring concrete mixtures. Therefore, Equation (1) for the entire process time T of pouring the mixture is defined as follows:
T = T A + T B + T C + T D
where TA is the supply time, TB is the pouring time, TC is the coverage time, and TD is the vibration time.
However, the pouring stage, covering stage, and vibration stage together constitute the core process of the mixture construction stage. As shown in Figure 1, these three stages have significant spatial synergy, all completed continuously at the same position on the warehouse surface, and the time of the three stages can be calculated together. Therefore, Equation (2) for the entire pouring process time T is simplified as follows:
T = T A + T S
where TS is the mixture pouring and vibrating stage.

2.2. Acquisition of Supply Time

The time for the mixture transport vehicle to load from the mixing station and unload from the discharge port is the supply time. Manual recording of time is inefficient and subject to human interference, making it difficult to accurately collect the supply time of the mixture. Therefore, it is necessary to record the license plate information and the time of the transport vehicle at the loading and unloading points.

2.2.1. Calculation of Supply Time

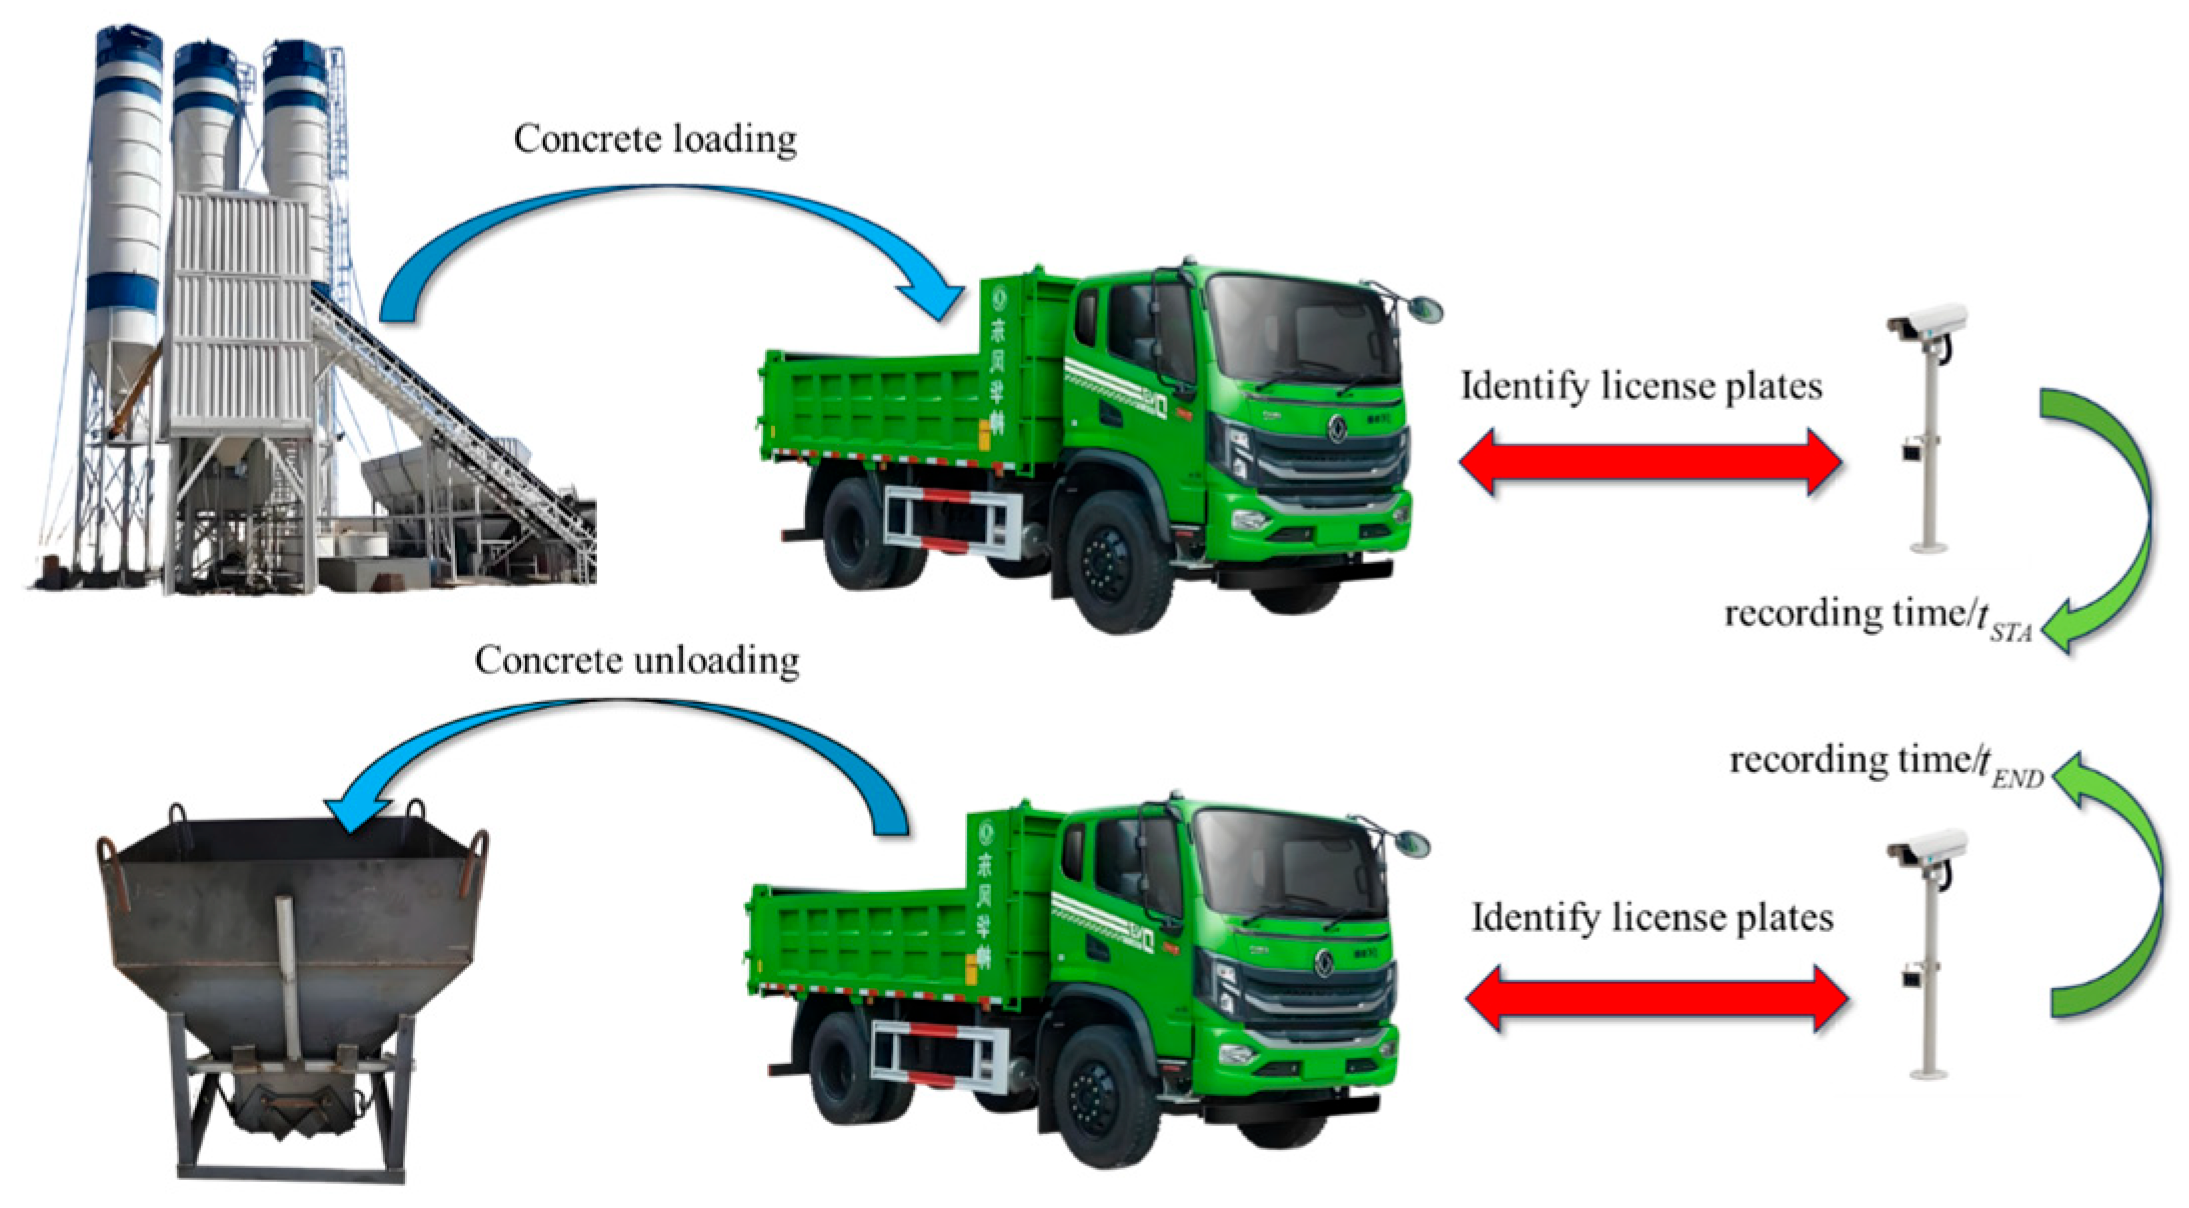
To ensure real-time and accurate acquisition of the supply time of the mixture. As shown in Figure 2, cameras are installed at the loading and unloading ports, respectively, to accurately identify license plate information and time. The supply time can be decomposed into the loading time tSTA and the unloading time tEND, and the supply time of the mixture can be calculated using Equation (3).
T A = t E N D t S T A
where TA is the supply time, tSTA is the loading time of the mixture, and tEND is the unloading time of the mixture.

2.2.2. License Plate Recognition System Based on YOLO11

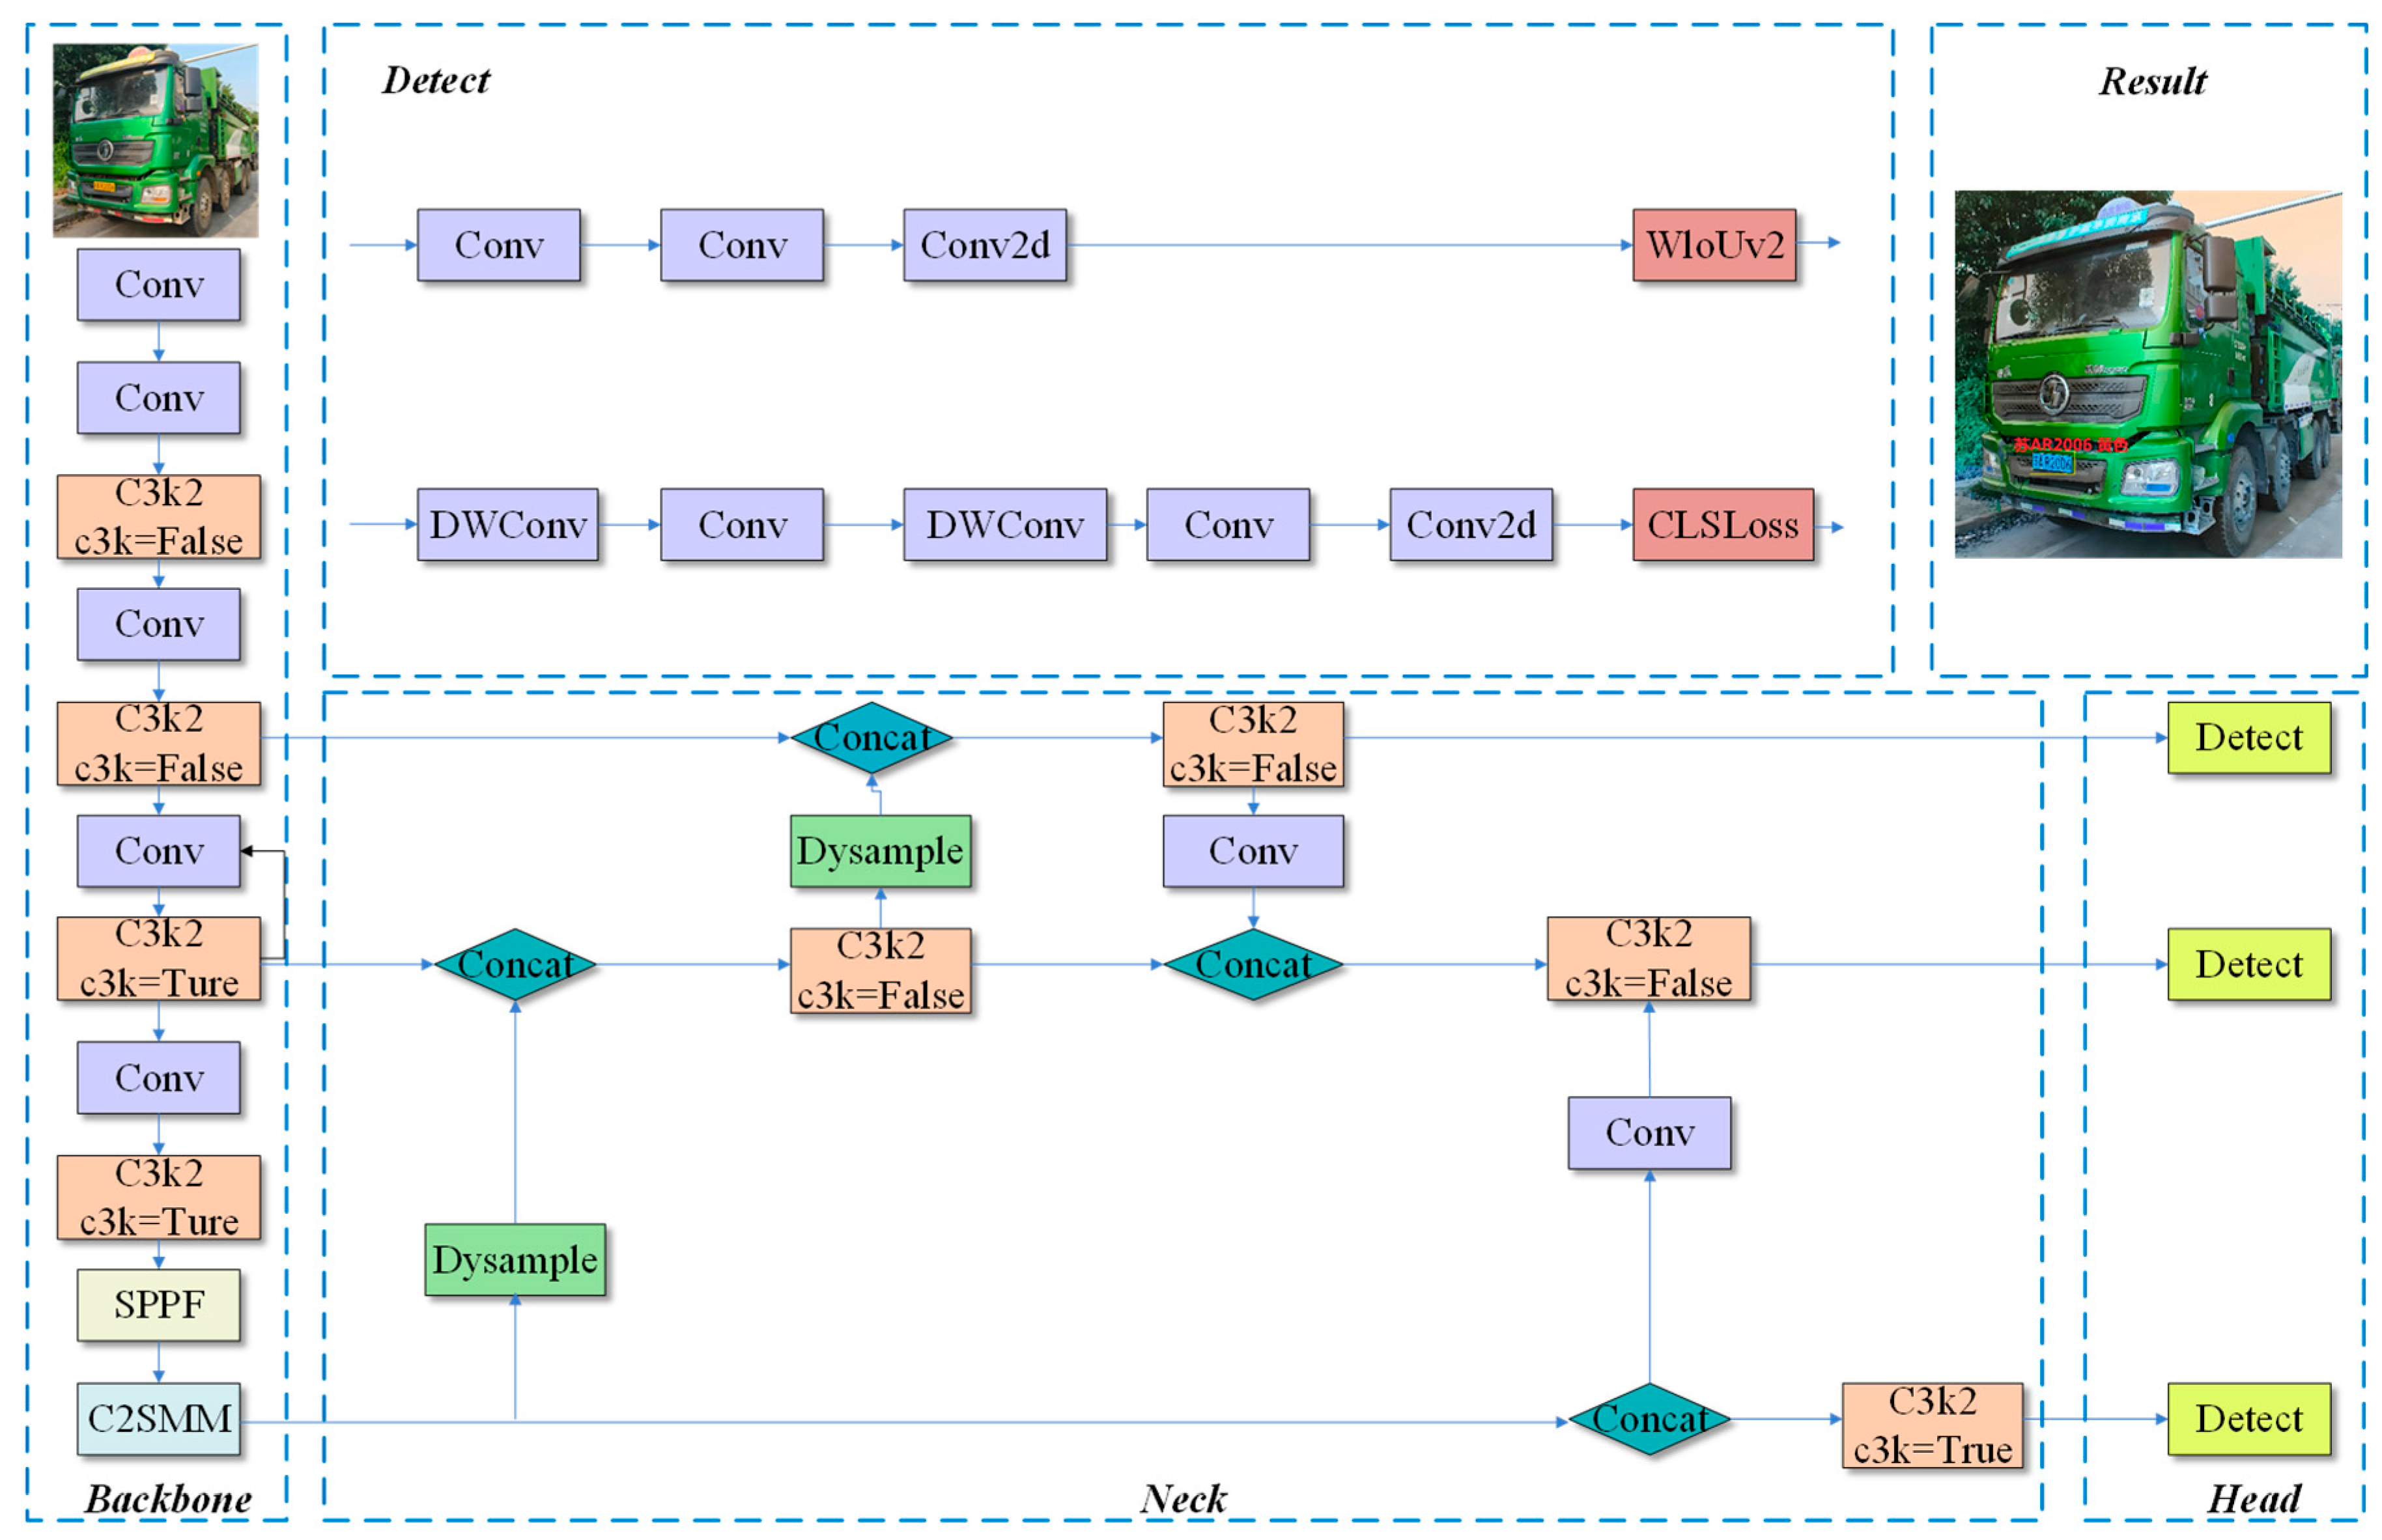
The workflow of license plate recognition mainly includes license plate localization and character recognition. At present, traditional image processing methods for license plate detection usually rely on features such as color, texture, and edges to achieve localization and recognition [22]. However, during the construction process, the license plates of the mixture transport vehicles are prone to low resolution, stains, and obstructions, which seriously affect the recognition performance. It is difficult to accurately predict license plate information using traditional image recognition methods and datasets. To address these issues, we propose a license plate detection method based on an improved YOLO11, called YOLO11-LP (Improved license plate recognition model based on YOLO11), with the model architecture shown in Figure 3. Firstly, in order to improve the model’s ability to detect occluded license plates, the C2SMM module was introduced to replace the original C2PSA module. Secondly, the WIoUv2 loss function is introduced to replace the original CioU loss function, solving the problem of slow convergence in the later stages of training.
In license plate detection, occlusion becomes an important factor affecting the accuracy of the model [23]. When the license plate is obstructed by concrete and dust, YOLO11 may not be able to accurately recognize the position or characters of the license plate, resulting in detection errors. This article proposes an improved C2PSA module called C2SMM, which replaces the attention mechanism in the PSABlock module with a Spatial Enhanced Attention Module (SEAM) [24]. The experimental results show that the improved YOLO11 model effectively handles concrete and dust occlusion in complex environments. The network architecture of the C2PSS module and the SEAM module is shown in Figure 4.
YOLO11 uses CIoU as the default loss function, which cannot be dynamically adjusted based on sample quality or training difficulty. However, the target of license plate detection is very small, and due to factors such as occlusion and adverse weather conditions, the quality is usually low or difficult, resulting in a negative impact on the overall detection accuracy of the neural network when calculating the static CIoU loss. To address the limitations of CIoU, researchers introduced the WIoUv2 loss function [25]. WIoUv2 enhances the model’s ability to focus on difficult samples while reducing the impact of simple samples on the loss function, as shown in Equation (4):
L = ( L I o U * L I o U ¯ ) γ L I o U R W I o U
where ( L I o U * L I o U ¯ ) γ is the Focusing coefficient, and γ is a hyperparameter used to adjust the focus coefficient value. L I o U * and L I o U ¯ calculations follow Equation (5), and R W I o U calculation follows Equation (6), where * represents that its value will be continuously updated based on each target detection during the training process.
L I o U = 1 A b o x B b o x A b o x B b o x
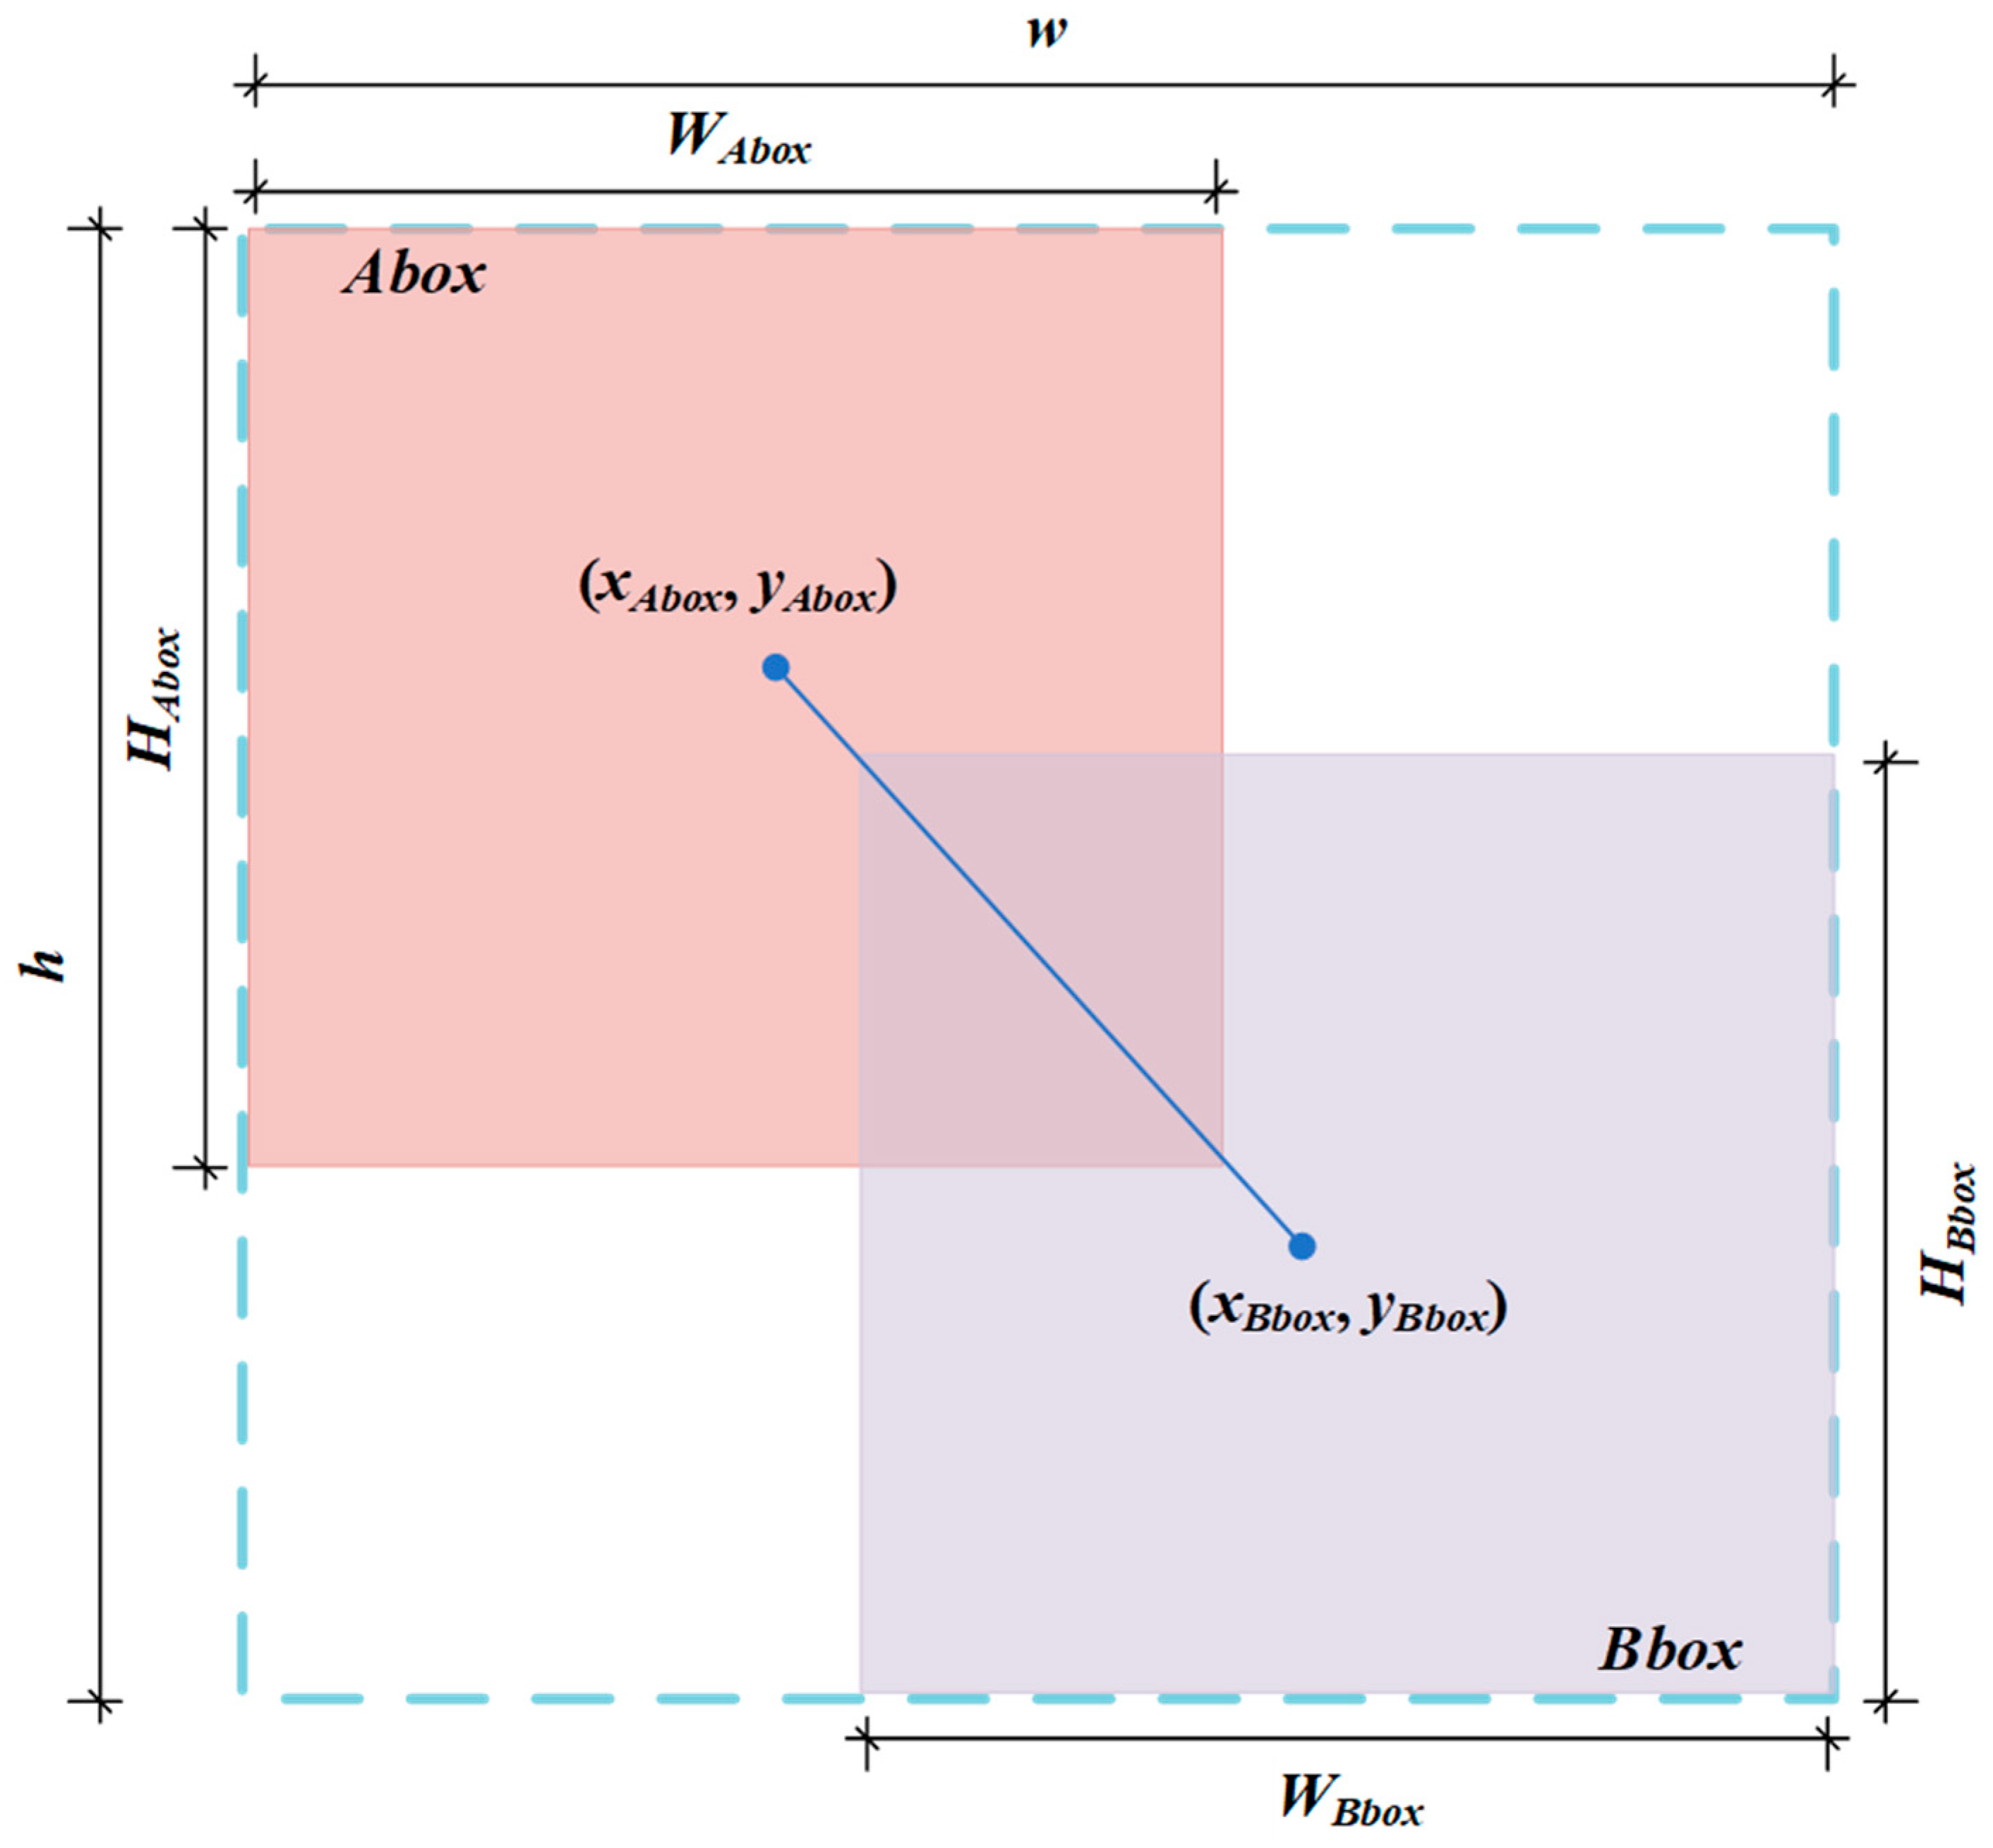
Equation (5) represents the complement of the intersection and the ratio of the predicted frame to the target frame. As shown in Figure 5, the Abox and Bbox in Equation (5) refer to the red predicted frame in the upper left corner and the purple target frame in the lower right corner, respectively.
R W I o U = exp ( ( x A b o x x B b o x ) 2 + ( y A b o x y B b o x ) 2 ( w 2 + h 2 ) * )
Among them, (xAbox, yAbox) and (xBbox, yBbox) represent the center coordinates of the predicted bounding box and the target bounding box, respectively, as shown in Figure 5. The values of w and h represent the width and height of the minimum bounding box of the predicted and target bounding boxes, as shown by the blue dashed boxes in Figure 5.
The application of ( L I o U * L I o U ¯ ) γ and R W I o U in WIoUv2 enables the model to better optimize complex samples, thereby improving the overall performance of bounding box regression. It is particularly suitable for handling low-resolution, small targets, occluded license plates, and multi-scale challenge samples in license plate detection. In addition, it also helps to converge the model more effectively in the later training stage, which contributes to the overall enhancement in regression performance.
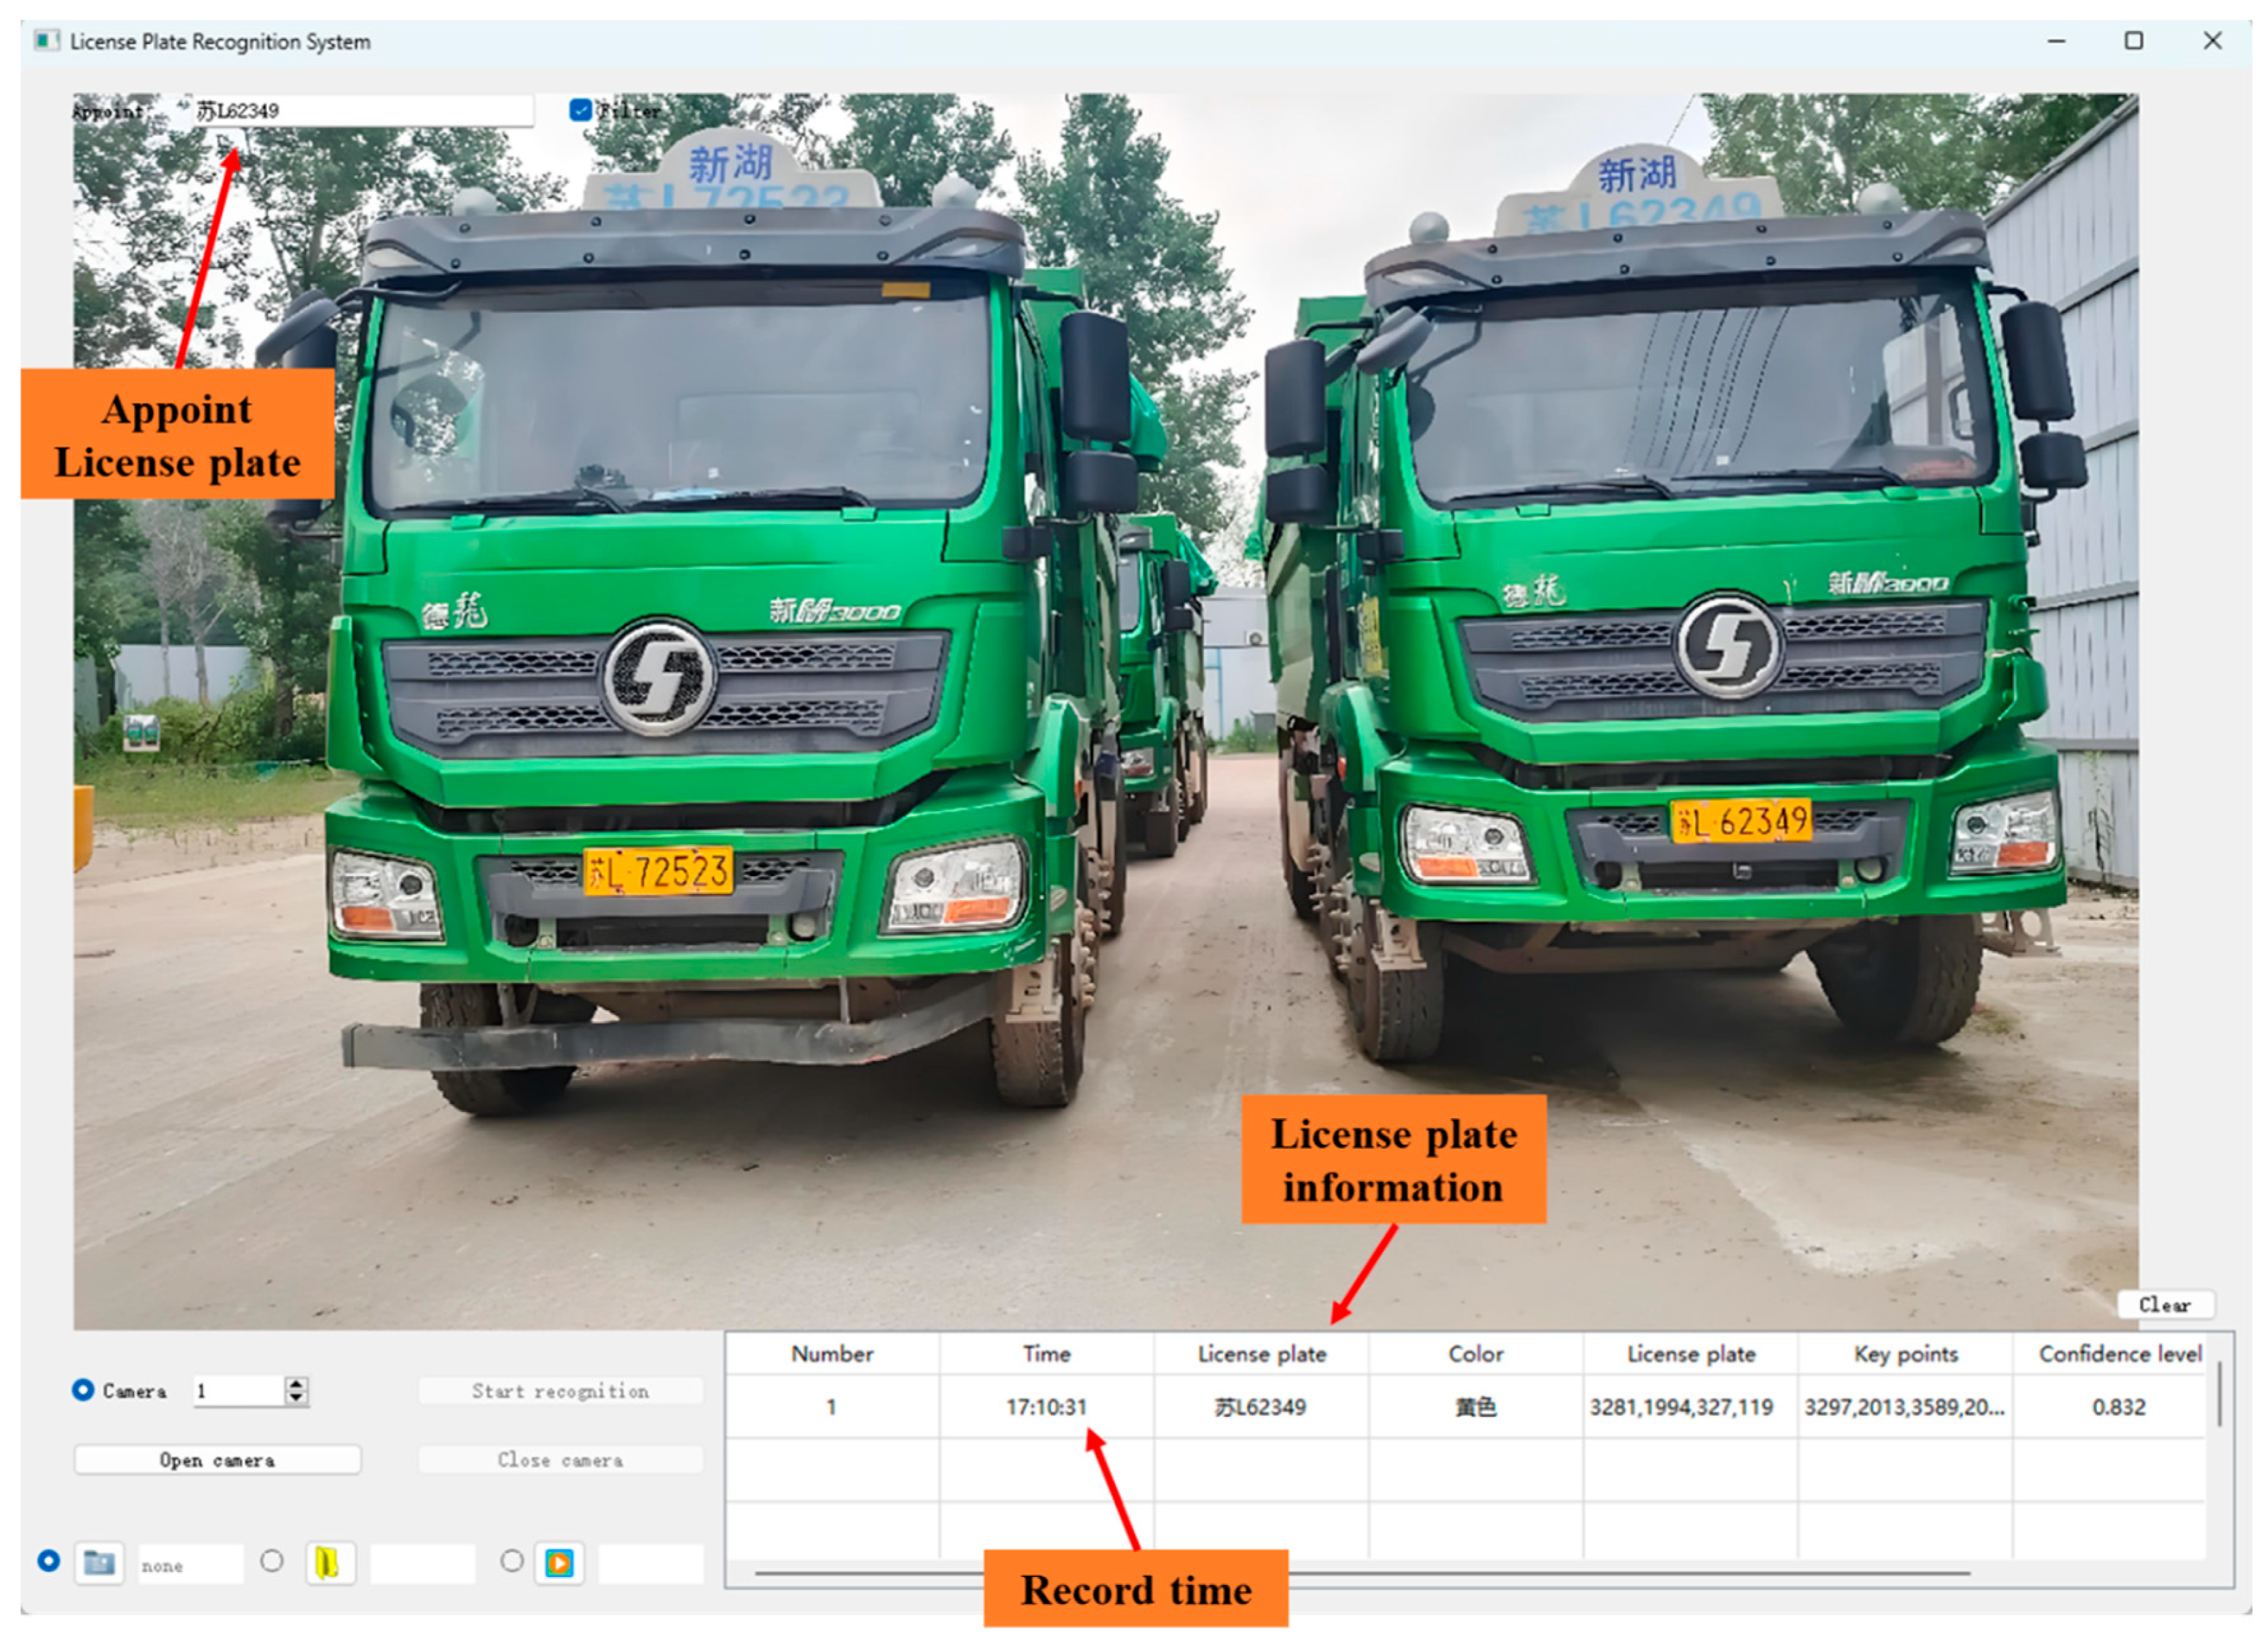
The above algorithm can accurately recognize license plate information, but the calculation of supply time still requires real-time recording of the loading time tSTA and unloading time tEND of the transport vehicle. In practical engineering scenarios, due to the complex condition of construction site vehicles, the system inevitably collects invalid license plate data of non-mixed material transport vehicles, resulting in database redundancy and low data transmission efficiency. Therefore, combined with the above license plate recognition algorithm, we provide a license plate recognition system that adds timestamp marking and the function of specifying license plates. By simply importing the license plate information of the on-site mixture transport vehicle, the acquisition of the mixture supply time can be completed. Figure 6 shows the license plate recognition system.
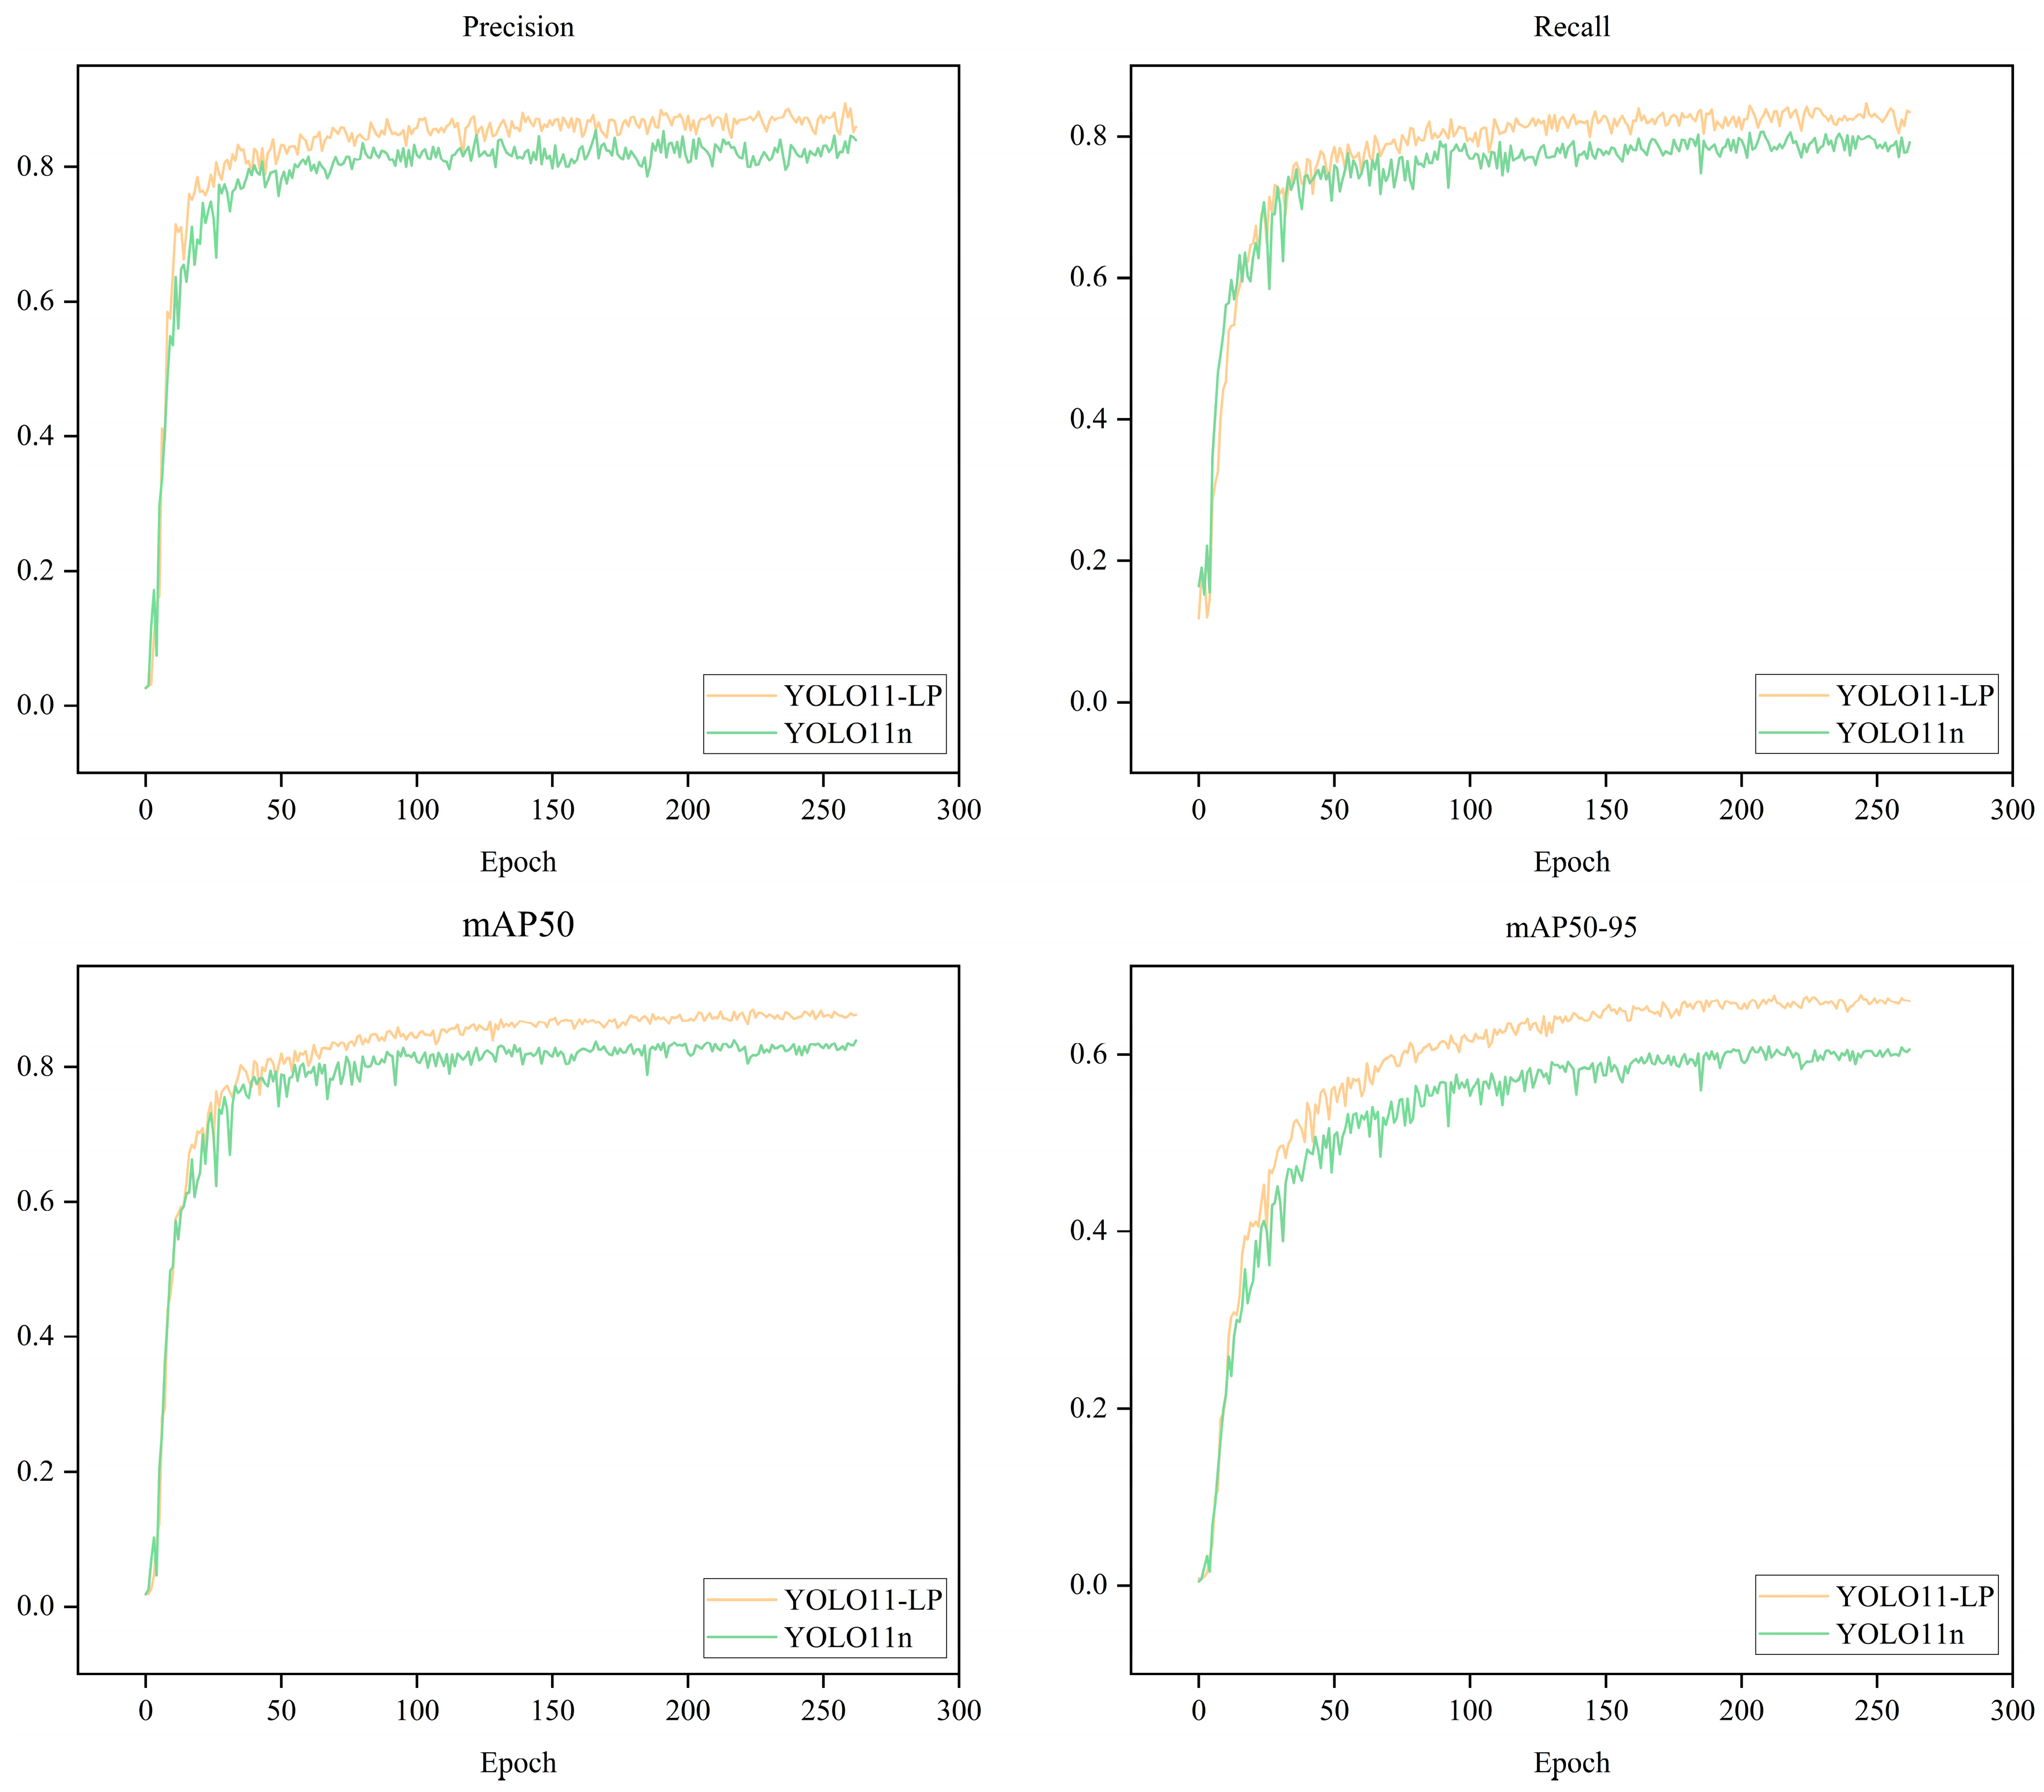
In order to verify the effectiveness of the improved model, this paper compared YOLO11n [26] with the YOLO11-LP model proposed in this paper based on the same training dataset, and evaluated the performance advantages and disadvantages of the YOLO11-LP model. Figure 7 shows a comparison of accuracy, recall, and mAP results. The results indicate that in the Precision metric, YOLO11-LP consistently outperforms YOLO11n (green curve), indicating better accuracy in predicting positive cases. The comparison of mAP50 indicators further confirms that YOLO11-LP has a stronger recognition ability for easily detectable targets. The mAP50-95 index is particularly prominent, with YOLO11-LP leading steadily by about 2–5%. This index covers the IoU threshold of 0.5–0.95 and is sensitive to difficult-to-detect objects such as small targets and occluded targets, fully demonstrating that YOLO11-LP is more suitable for complex tasks such as vehicle occlusion and small-sized identification in concrete construction scenes. Although the overall overlap of the recall curve is high, YOLO11-LP has smaller fluctuations in the later stage, reflecting its better predictive stability.

2.3. Acquisition of Pouring and Vibrating Time

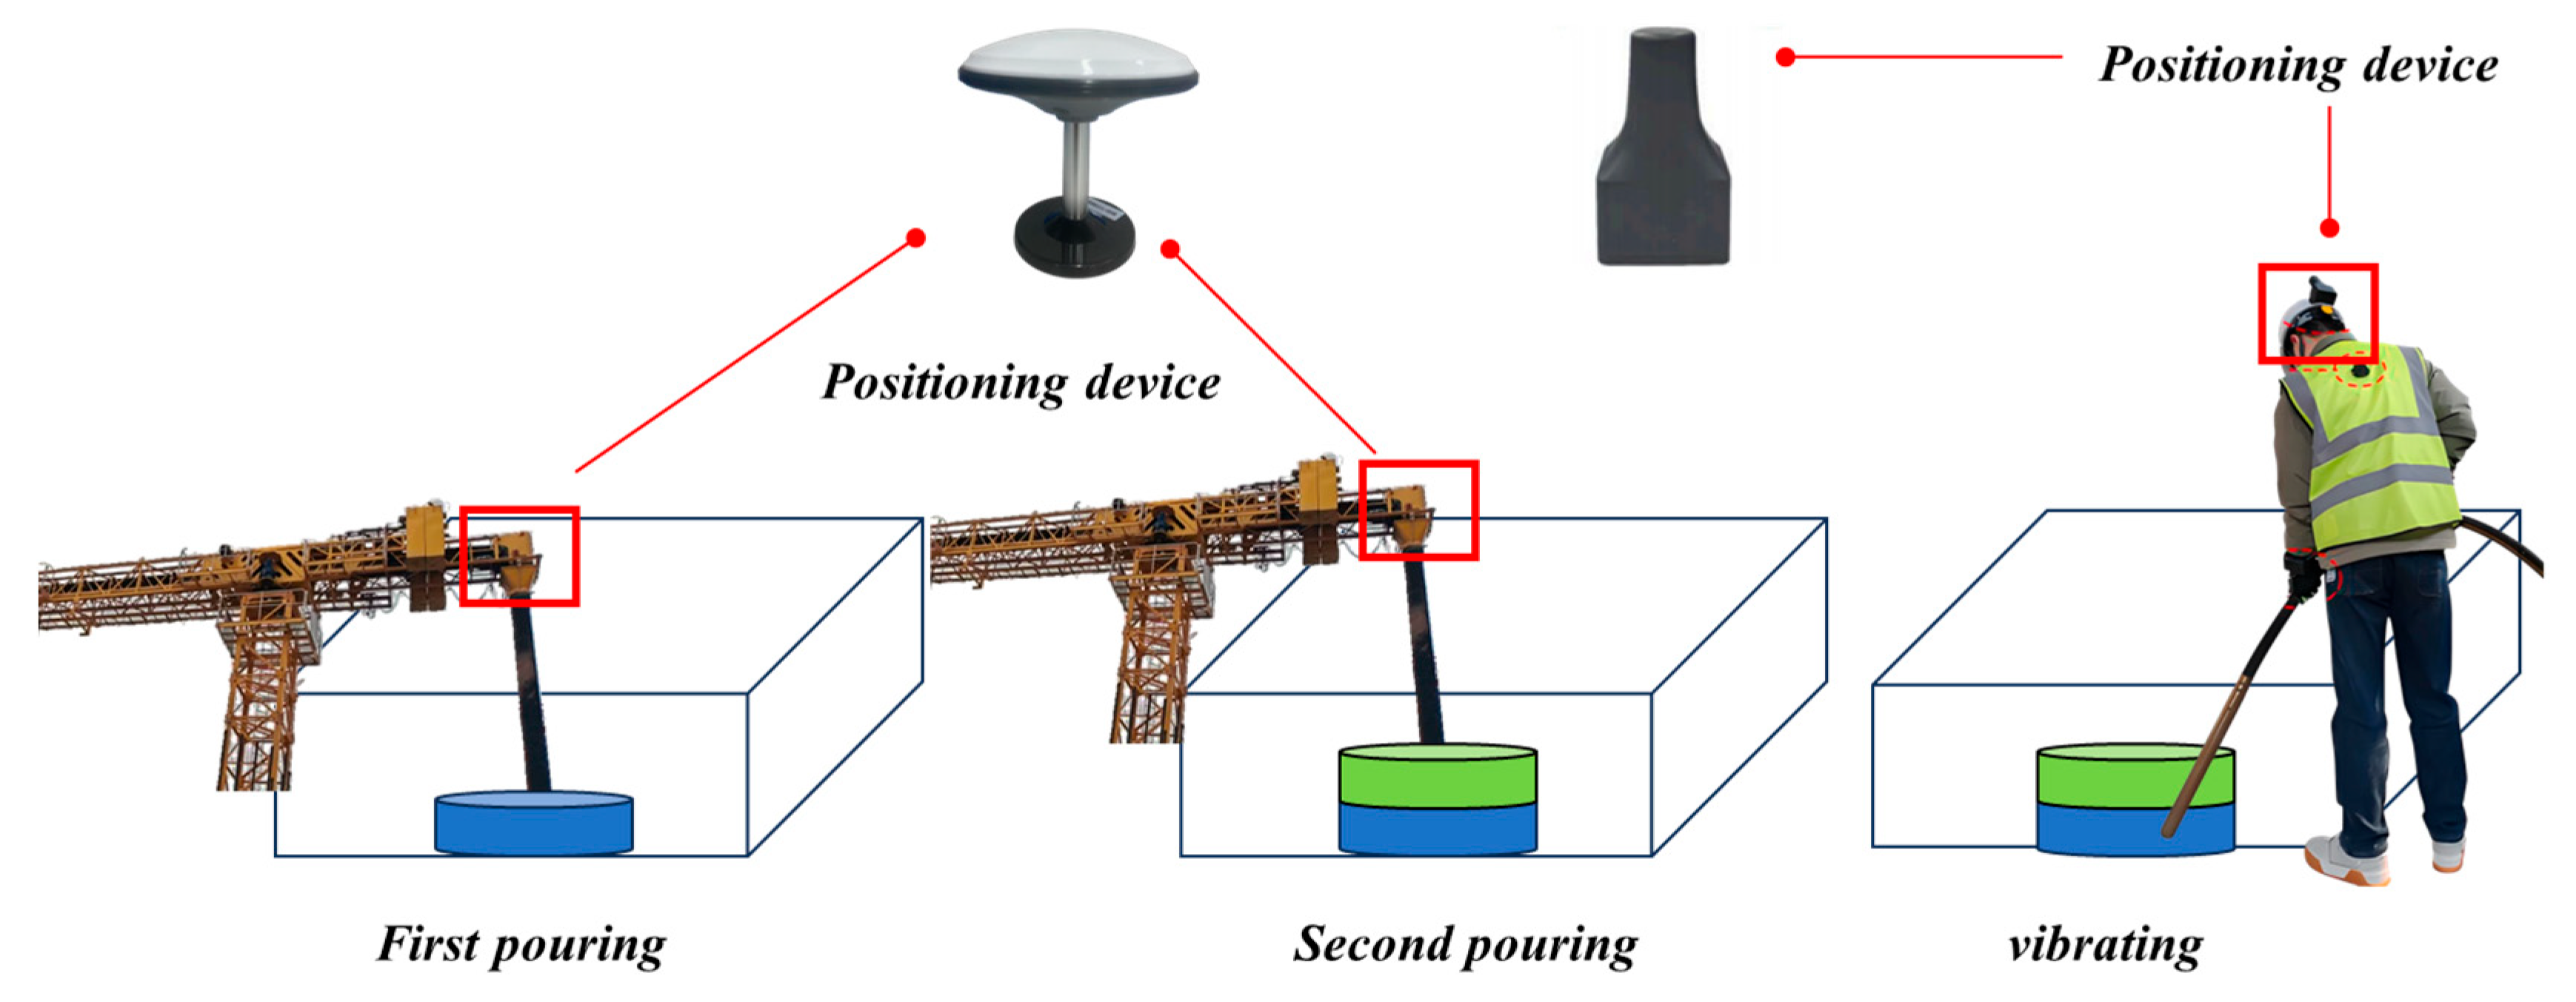
The pouring and vibrating time of the mixture refers to the time interval between the discharge of the mixture and the completion of the next layer of covering and compacting. As shown in the figure, RTK positioning devices are installed at the discharge outlet and the top of the vibrating head. For the first fabric (blue area in Figure 8), the positioning device at the discharge port records the current position coordinates in real time. The second fabric (green area in Figure 8) covers the first fabric area, and the positioning device at the discharge port records the position coordinates in real time. Finally, when the construction personnel operate the vibrating rod, the positioning device on their head synchronously collects the precise coordinates of the vibrating point. When the coordinates of these three positions completely coincide, it indicates that the mixture in the blue area has completed the complete pouring process, and the system will record the time when the vibration is completed. Based on the unloading time of the mixture described in Section 2.2.1, the actual pouring and compacting time of the mixture at that location can be accurately calculated. Equation (7) is defined as follows.
T S = t W t E N D
where TS is the mixture pouring and vibrating time, tW is the time after the fabric is vibrated twice in the area, and tEND is the unloading time of the mixture.

2.4. Acquisition of Pouring Position and Area

In the construction of concrete mixture pouring, the flat and layered pouring process is a key technology to ensure the quality of the project. Its core is to pour the concrete mixture layer by layer and fully vibrate it to ensure that each pouring layer can meet the design requirements for compactness and uniformity. However, in the actual construction process, the mixture is usually discharged from the discharge port and gradually spreads to form a certain range of pouring area after vibration operation. To accurately evaluate and control the pouring quality, it is necessary to accurately calculate the pouring position and area of the mixture. Based on this, a precise calculation of pouring position and area is achieved through the following algorithm.

2.4.1. Calculation of Pouring Position

The pouring position of the mixture is highly random and concentrated, and the flat and layered pouring process will control the uniform layering height of the mixture. Therefore, only two-dimensional position coordinates need to be collected to describe the spatial pouring characteristics of the mixture. As shown in Figure 9, RTK positioning antennas are deployed at key positions at the discharge port of the pouring machine, which can obtain the plane coordinates (X, Y) of the mixed material landing point in real time.

2.4.2. Calculation of Pouring Area

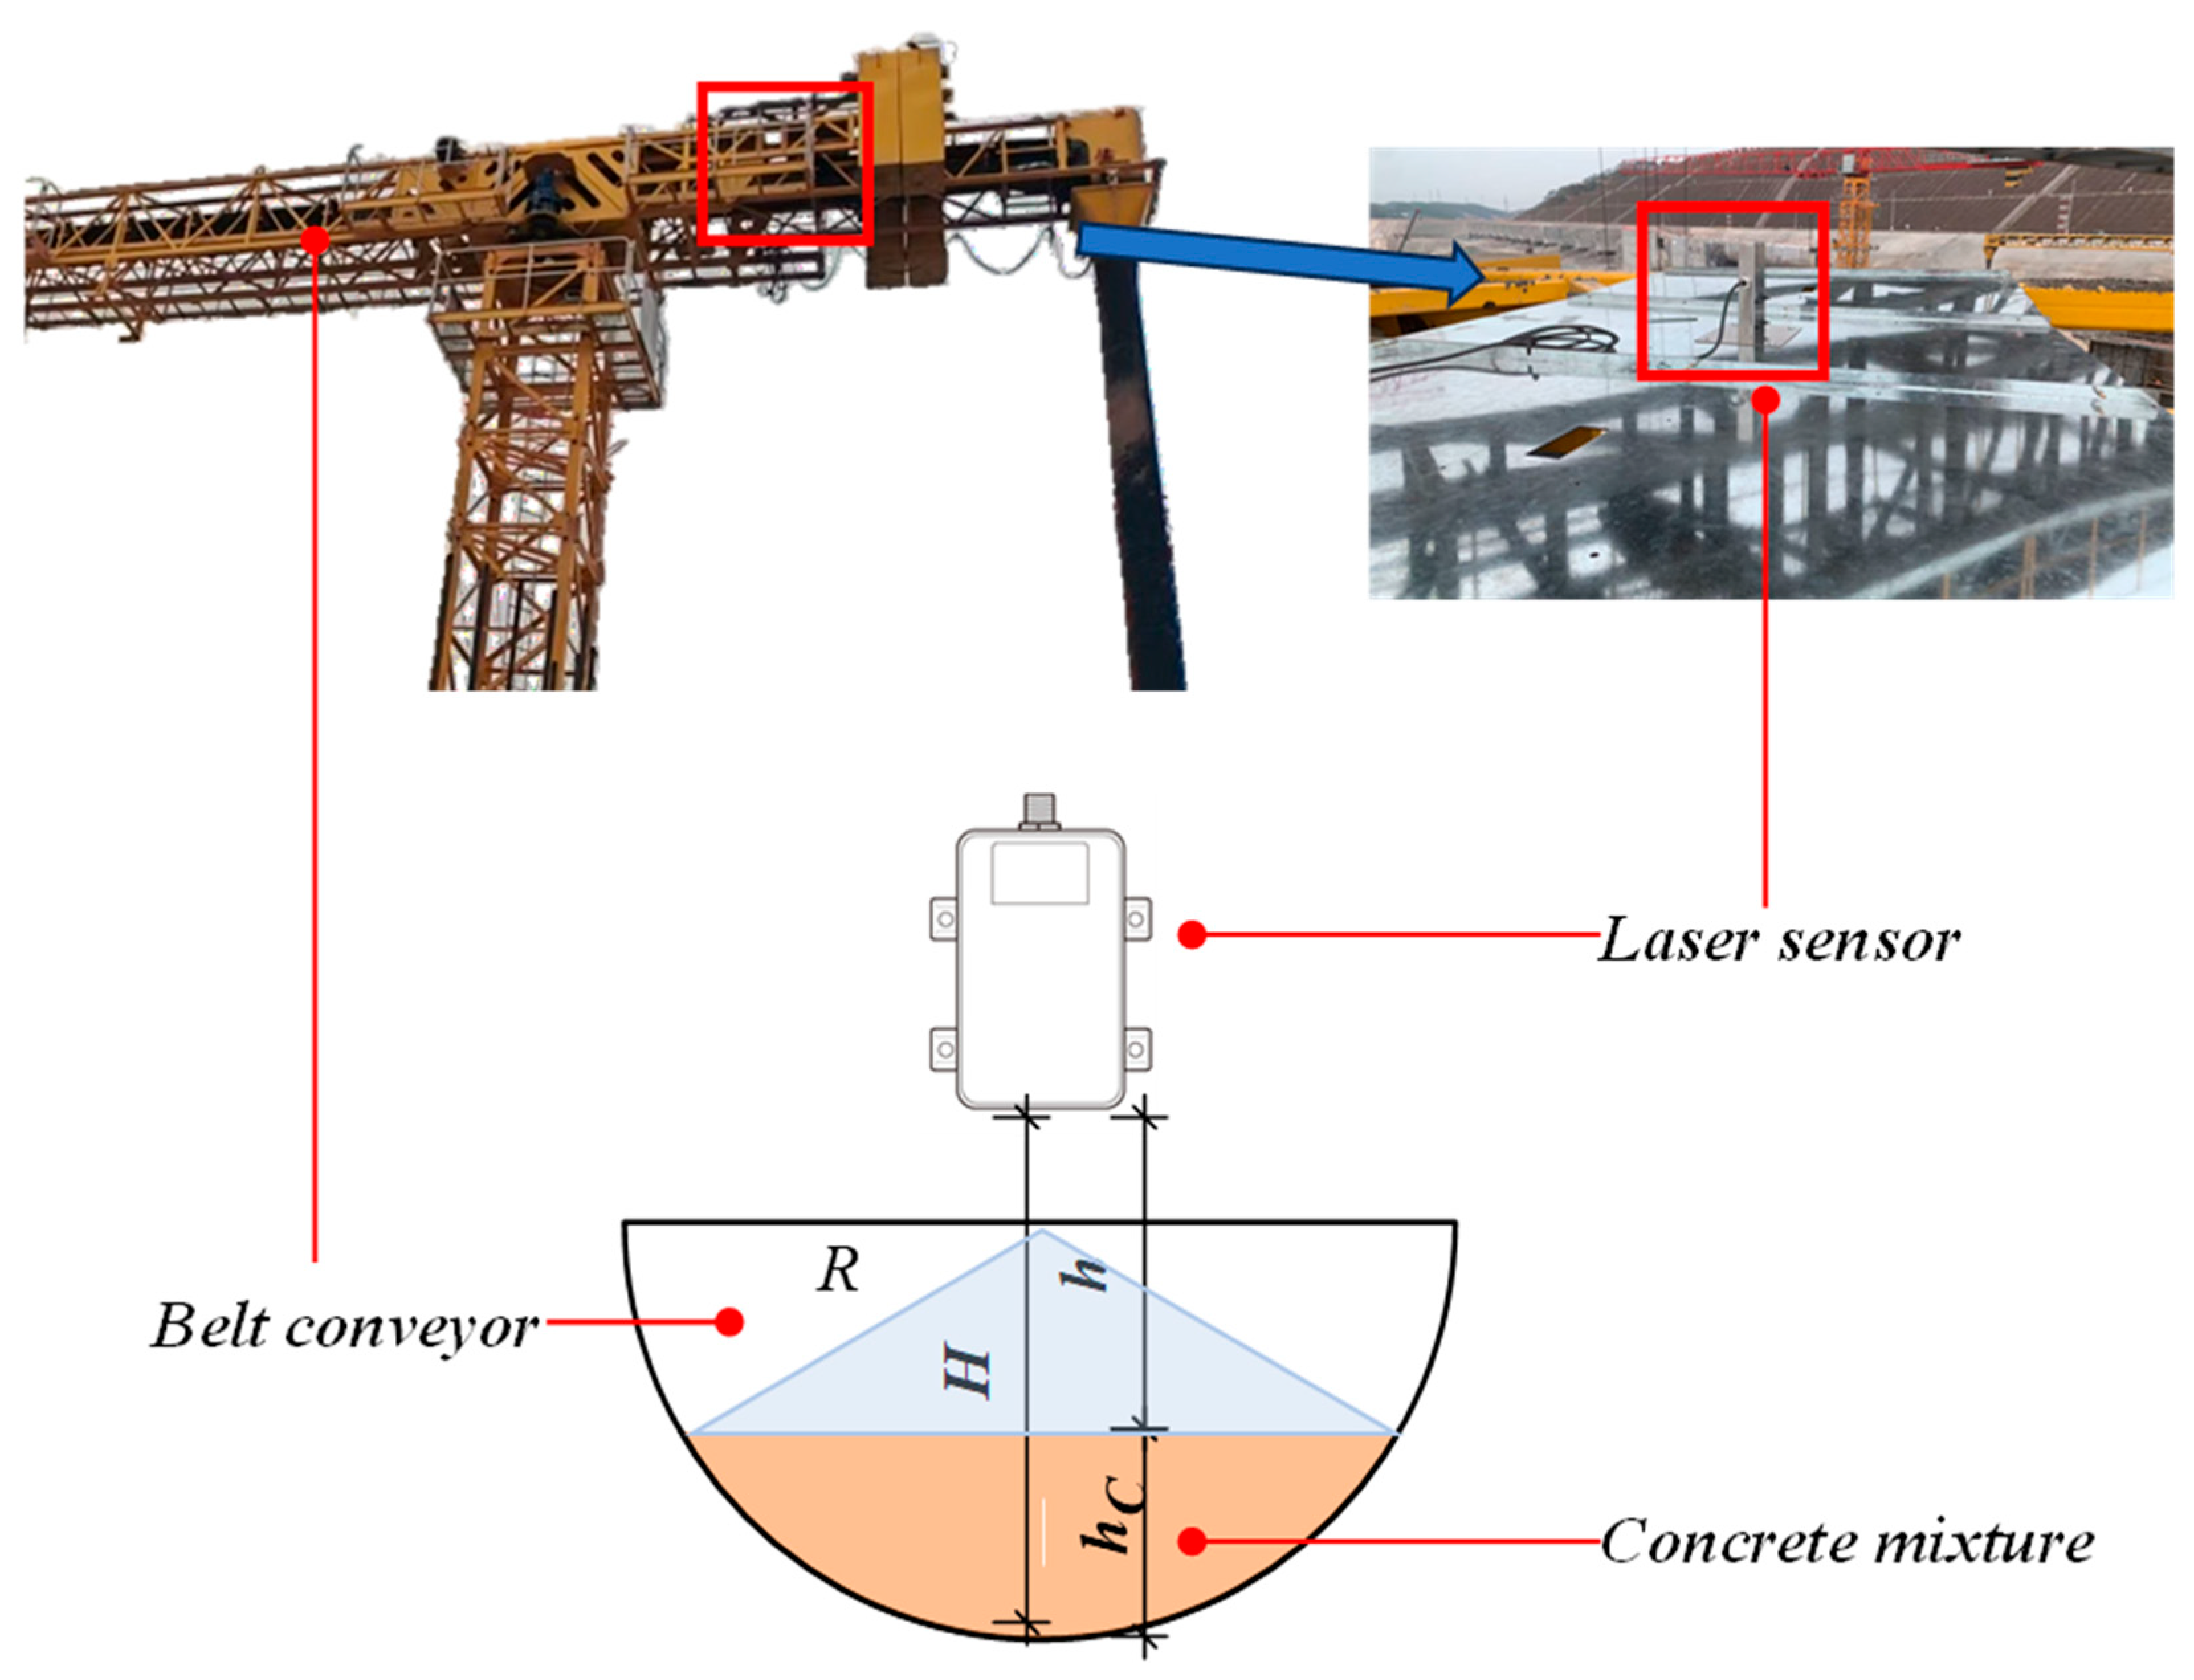
The calculation of the pouring area of the mixture needs to be based on the calculation of the pouring volume. For this purpose, a laser sensor (as shown in Figure 10) was installed at the discharge port of the pouring machine to collect real-time data on the height of concrete mixture accumulation and calculate the pouring volume of the mixture based on the geometric parameters of the cross-section.
As shown in Figure 10, the belt conveyor adopts a semi-circular cross-section design, and the laser sensor is vertically installed above the belt. Among them, the fixed distance from the sensor to the bottom of the belt is H, while the real-time measurement distance from the sensor to the concrete surface is defined as the dynamic parameter h.
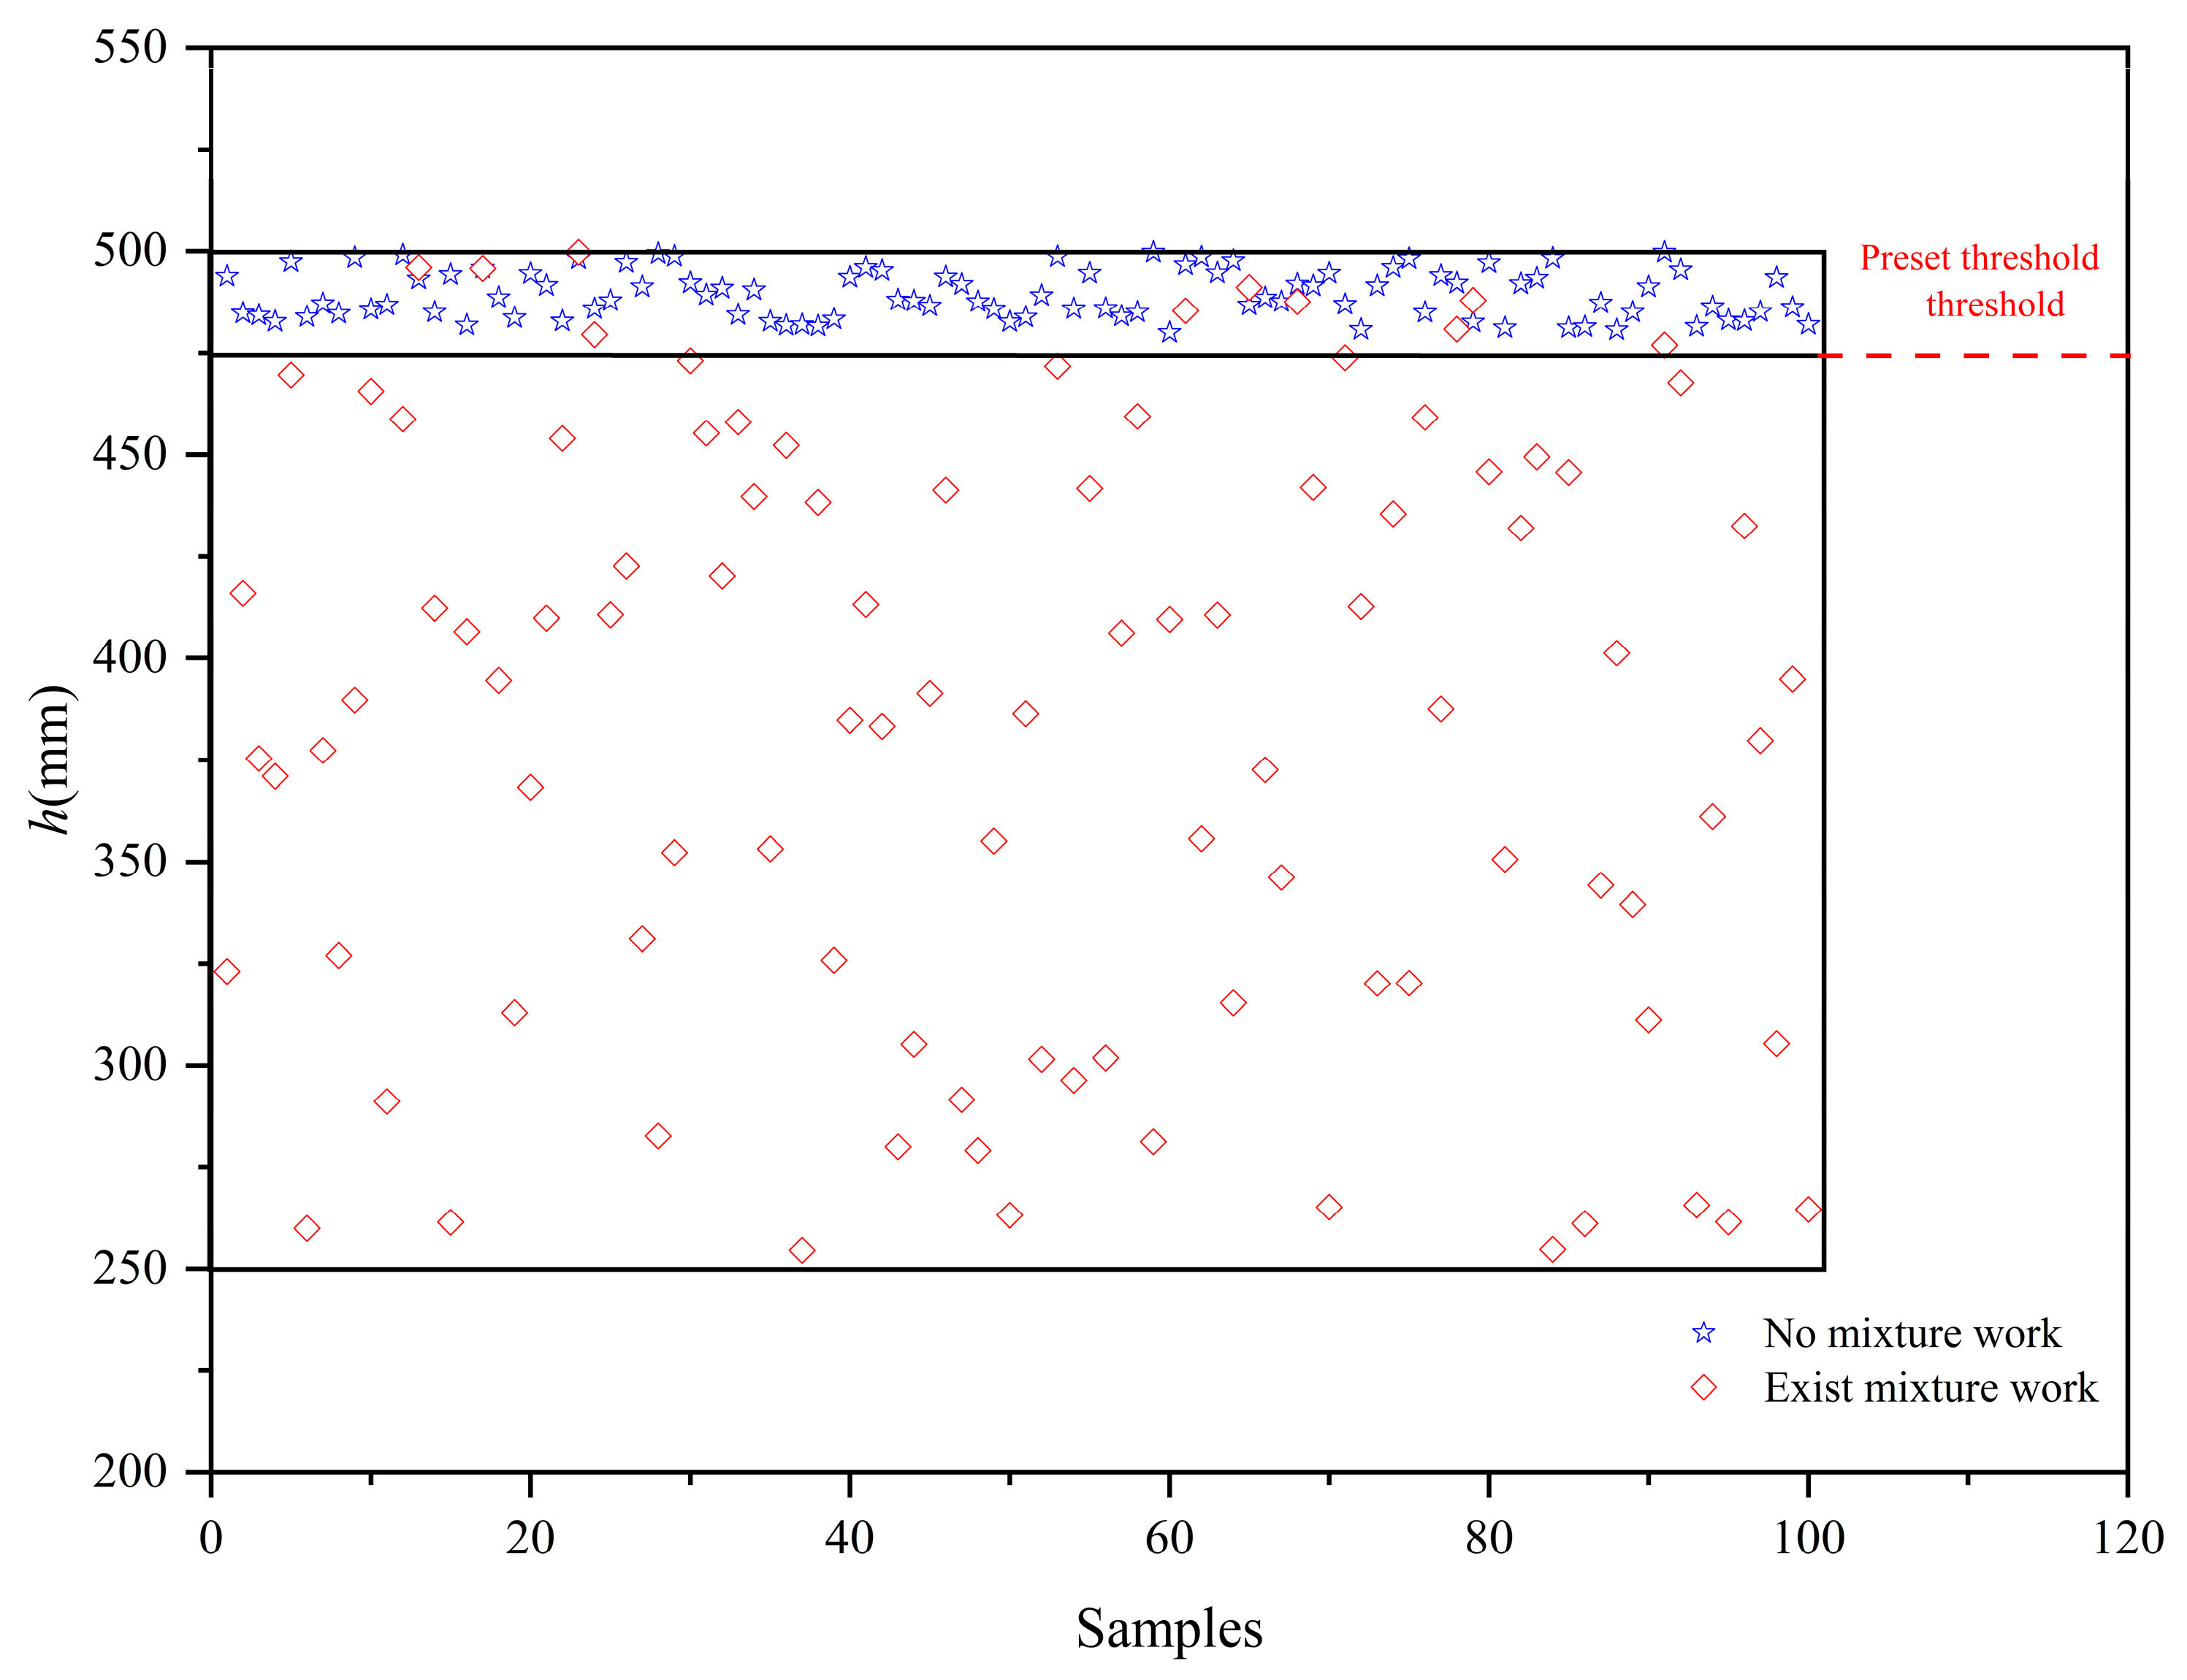
Before measuring the volume of the mixture, it is necessary to determine the operating status of the belt conveyor. To accurately determine the operating status of the belt conveyor, the dynamic parameter h is compared with the preset threshold hy, and the optimal threshold hy is determined through a large number of experiments (experimental data are shown in Figure 11). When h is greater than or equal to hy, the system determines it to be in the “material work” state. When h is less than hy, it is judged as a “no material work” state, as shown in Equation (8):
No   mixture ,   h h y Exist   mixture ,   h < h y
where h is the real-time measurement distance from the sensor to the concrete surface, and hy is the preset threshold.
When the operating state of the belt conveyor is in the “material working” state, calculate the cross-sectional area of the concrete mixture. According to geometric principles, the calculation Equation (9) for the cross-sectional area A of the concrete mixture is as follows:
A = R 2 × arccos [ ( R h C ) / R ] ( R h C ) × ( R 2 ( R h C ) 2 )
h C = H h
where A is the cross-sectional area of the concrete mixture, R is the radius of the belt, hC is the real-time stacking thickness of the concrete mixture, and H is the fixed distance from the laser sensor to the bottom of the belt.
The calculation of the volume of the concrete mixture can be achieved through the integral method of cross-sectional area, and its Equation (11) is defined as follows:
V = ( A × v ) d t
where V is the calculated volume of the concrete mixture, and v is the conveyor speed of V.
Considering the loose characteristics of concrete mixtures during belt transportation and the detection frequency of laser sensors, a correction factor needs to be introduced into the actual volume calculation to establish a dynamic correction model. Revised volume calculation, Equation (12), is as follows:
V C = i = 1 n k ( i ) × A ( i ) × 1 f
k = V R V
where VC is the corrected volume of the mixture, VR is the true volume of the mixture, k is the model correction coefficient, n is the total number of laser sensor detections, i is the i-th monitoring by the laser sensor, and f is the detection frequency of the laser sensor.
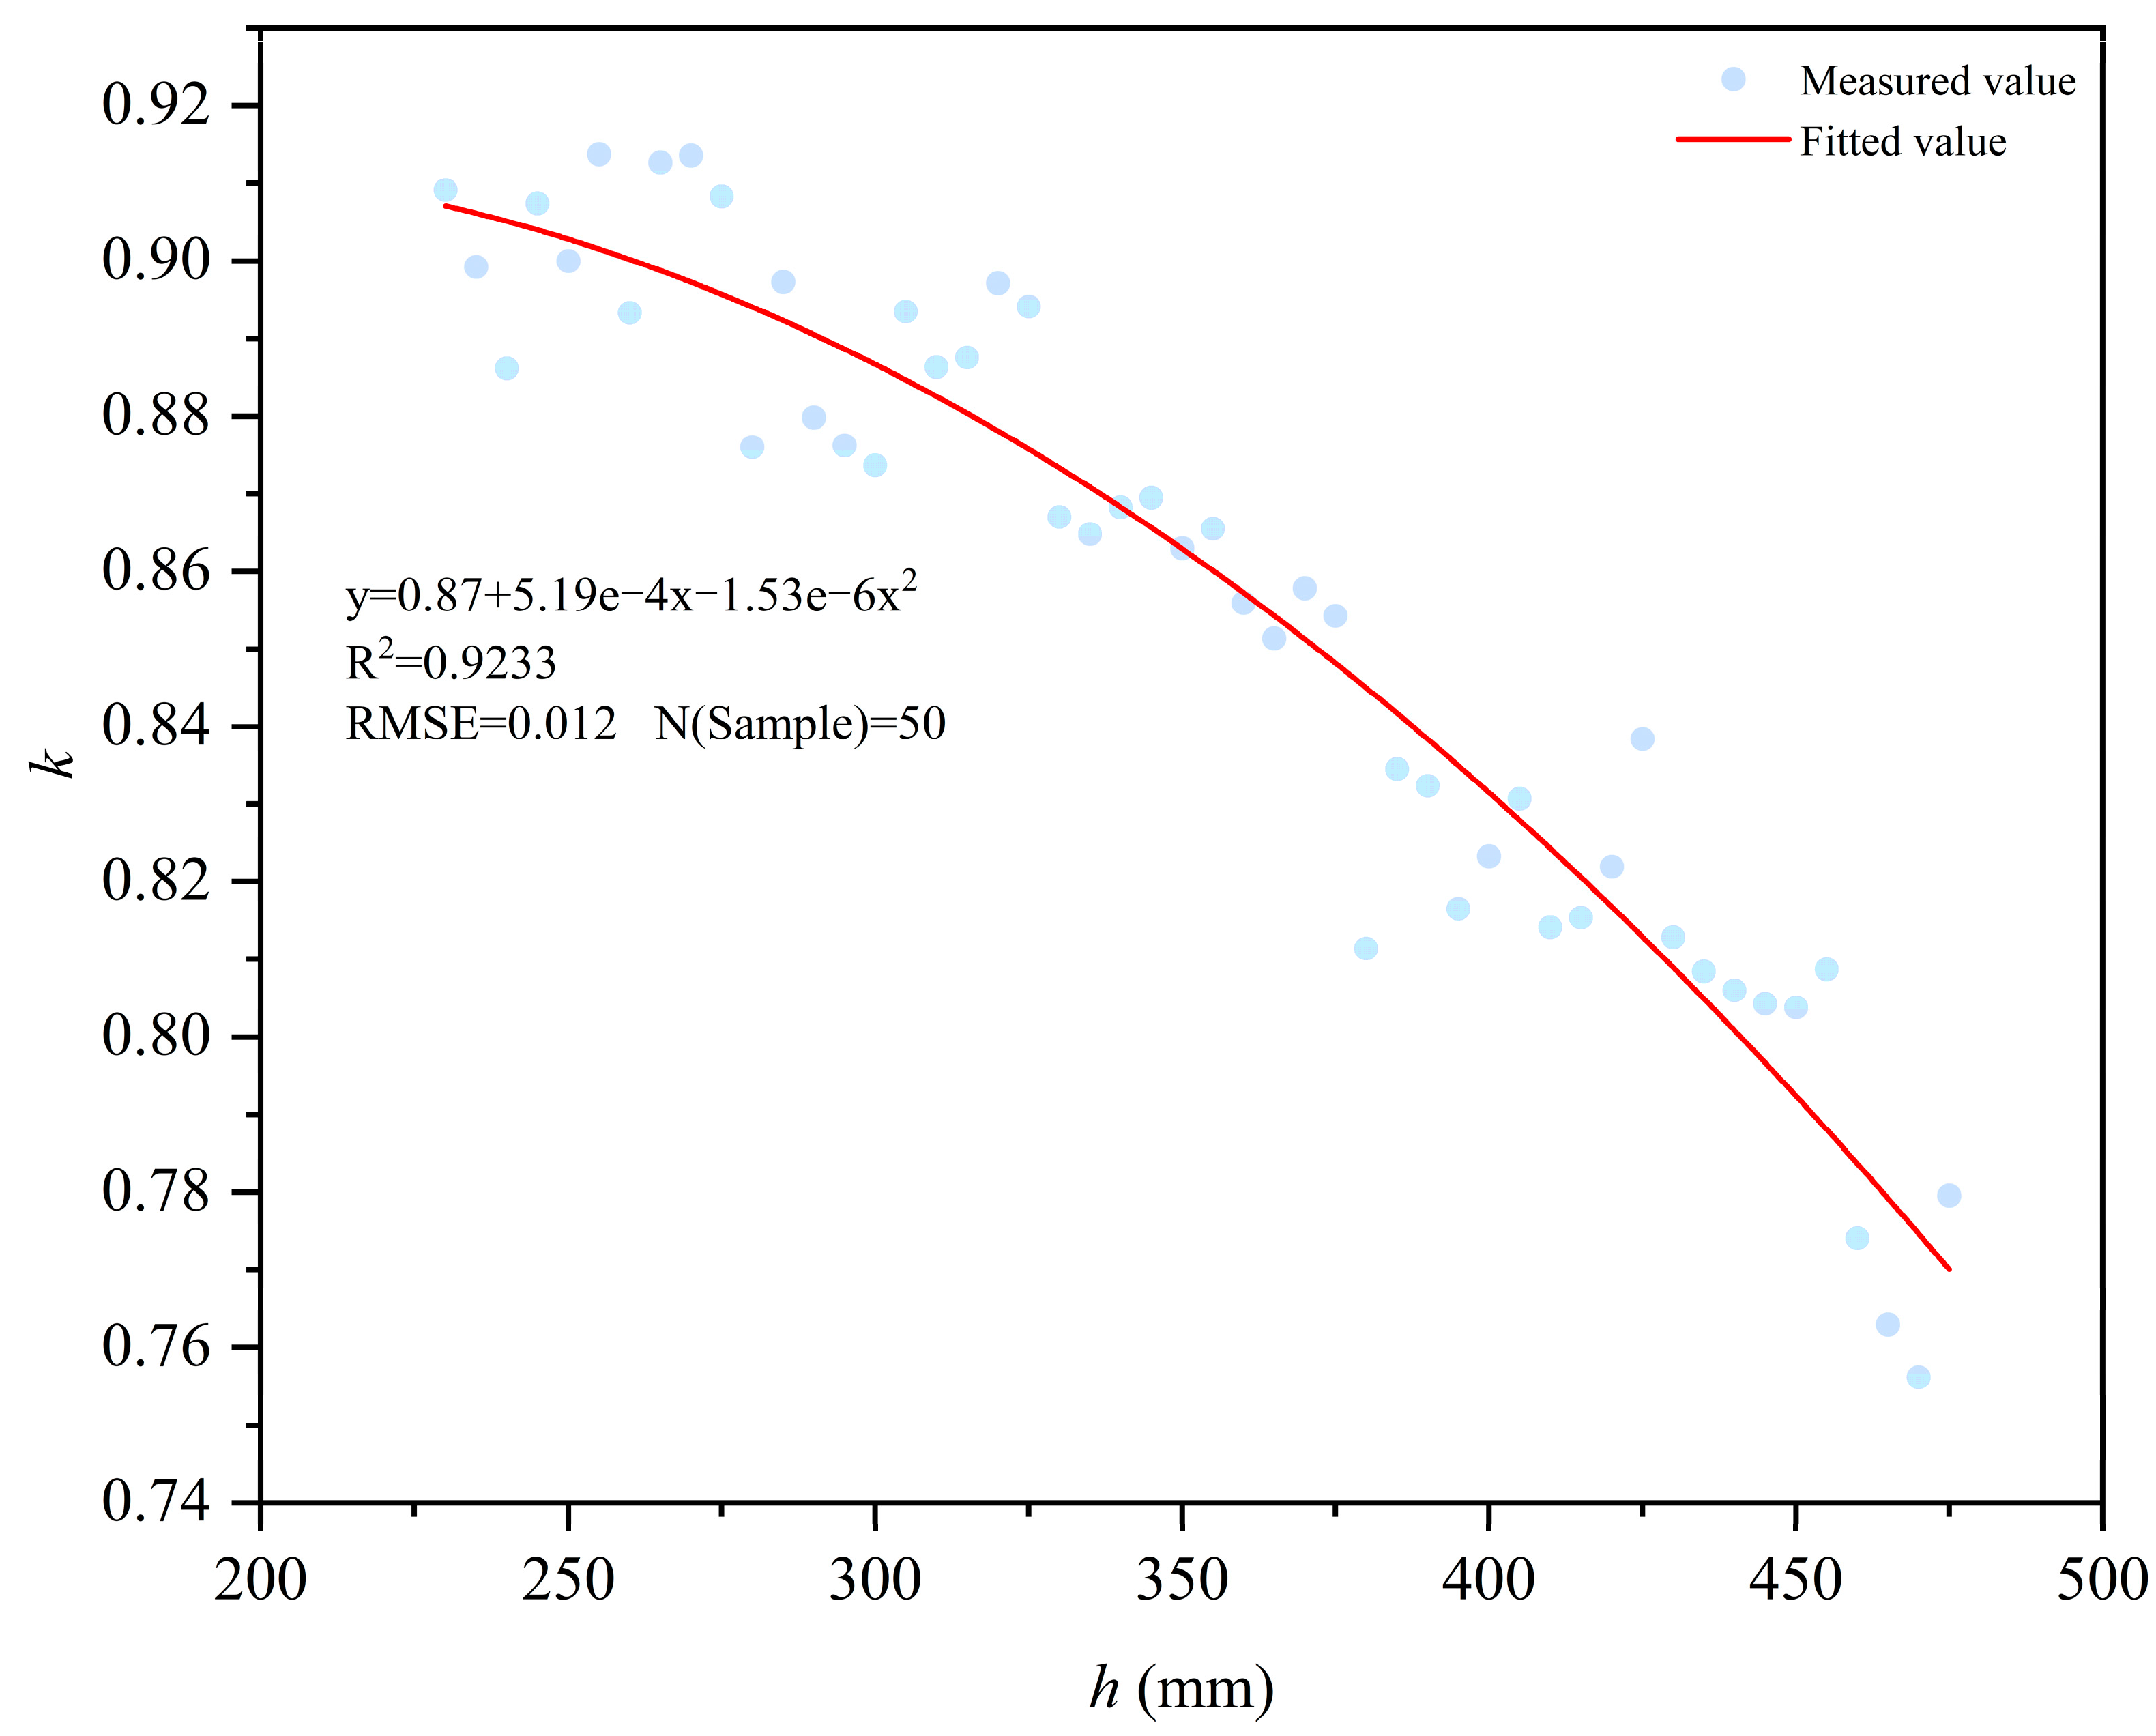
The reasonable determination of the correction factor k is a key step in ensuring the accuracy of the calculation of the volume of the mixture. Therefore, multiple sets of mixed material height data were collected using laser sensors, and the theoretical calculation results of Equation (11) were systematically compared and analyzed with the measured data of standard containers. Based on Equation (12), a quantitative relationship model between the correction coefficient k and the detection height h was established. As shown in Figure 12, the experimental results indicate that the correction coefficient k is significantly negatively correlated with the detection height h, and increases monotonically as h decreases. The relationship between the two conforms to a polynomial model, and its goodness of fit is good (RMSE = 0.012, R2 = 0.9233), indicating that the model can accurately characterize the k-h relationship.
To ensure the accuracy of the calculation of the pouring area of the mixture, it is necessary to strictly adopt the method of leveling and layering, accurately control the consistent pouring height of each layer, and combine with the pouring volume VC described in the previous section to calculate the actual area of the mixture. Equation (14) is defined as:
A K = V C H D
where AK is the diffusion area of the mixture, and HD is the height of the pouring layers of the mixture.

3. Development of Cold Joint Prevention and Control System

It is necessary to develop equipment that matches the parameters by using the aforementioned acquisition algorithms to collect real-time pouring process parameters of the mixture. These devices are mainly used to obtain the license plate information of transport vehicles, the time for feeding and pouring the mixture, the pouring area, and the location of the mixture. Then, these parameters are transmitted to the developed software system to achieve the prevention and control of cold joints in the incoming mixture.

3.1. Data Acquisition and Transmission System

The acquisition of the pouring position, supply time, pouring, and vibration time of the mixture is composed of corresponding equipment and acquisition algorithms. This algorithm is divided into two parts: positioning calculation of the pouring area of the mixture, and calculation of the entire pouring process time. Therefore, the corresponding equipment includes cameras, positioning devices, and laser sensors. This system will provide on-site workers with a reasonable construction sequence and calculate parameters to prevent the formation of cold joints in the mixture.

3.1.1. Regional Positioning Device

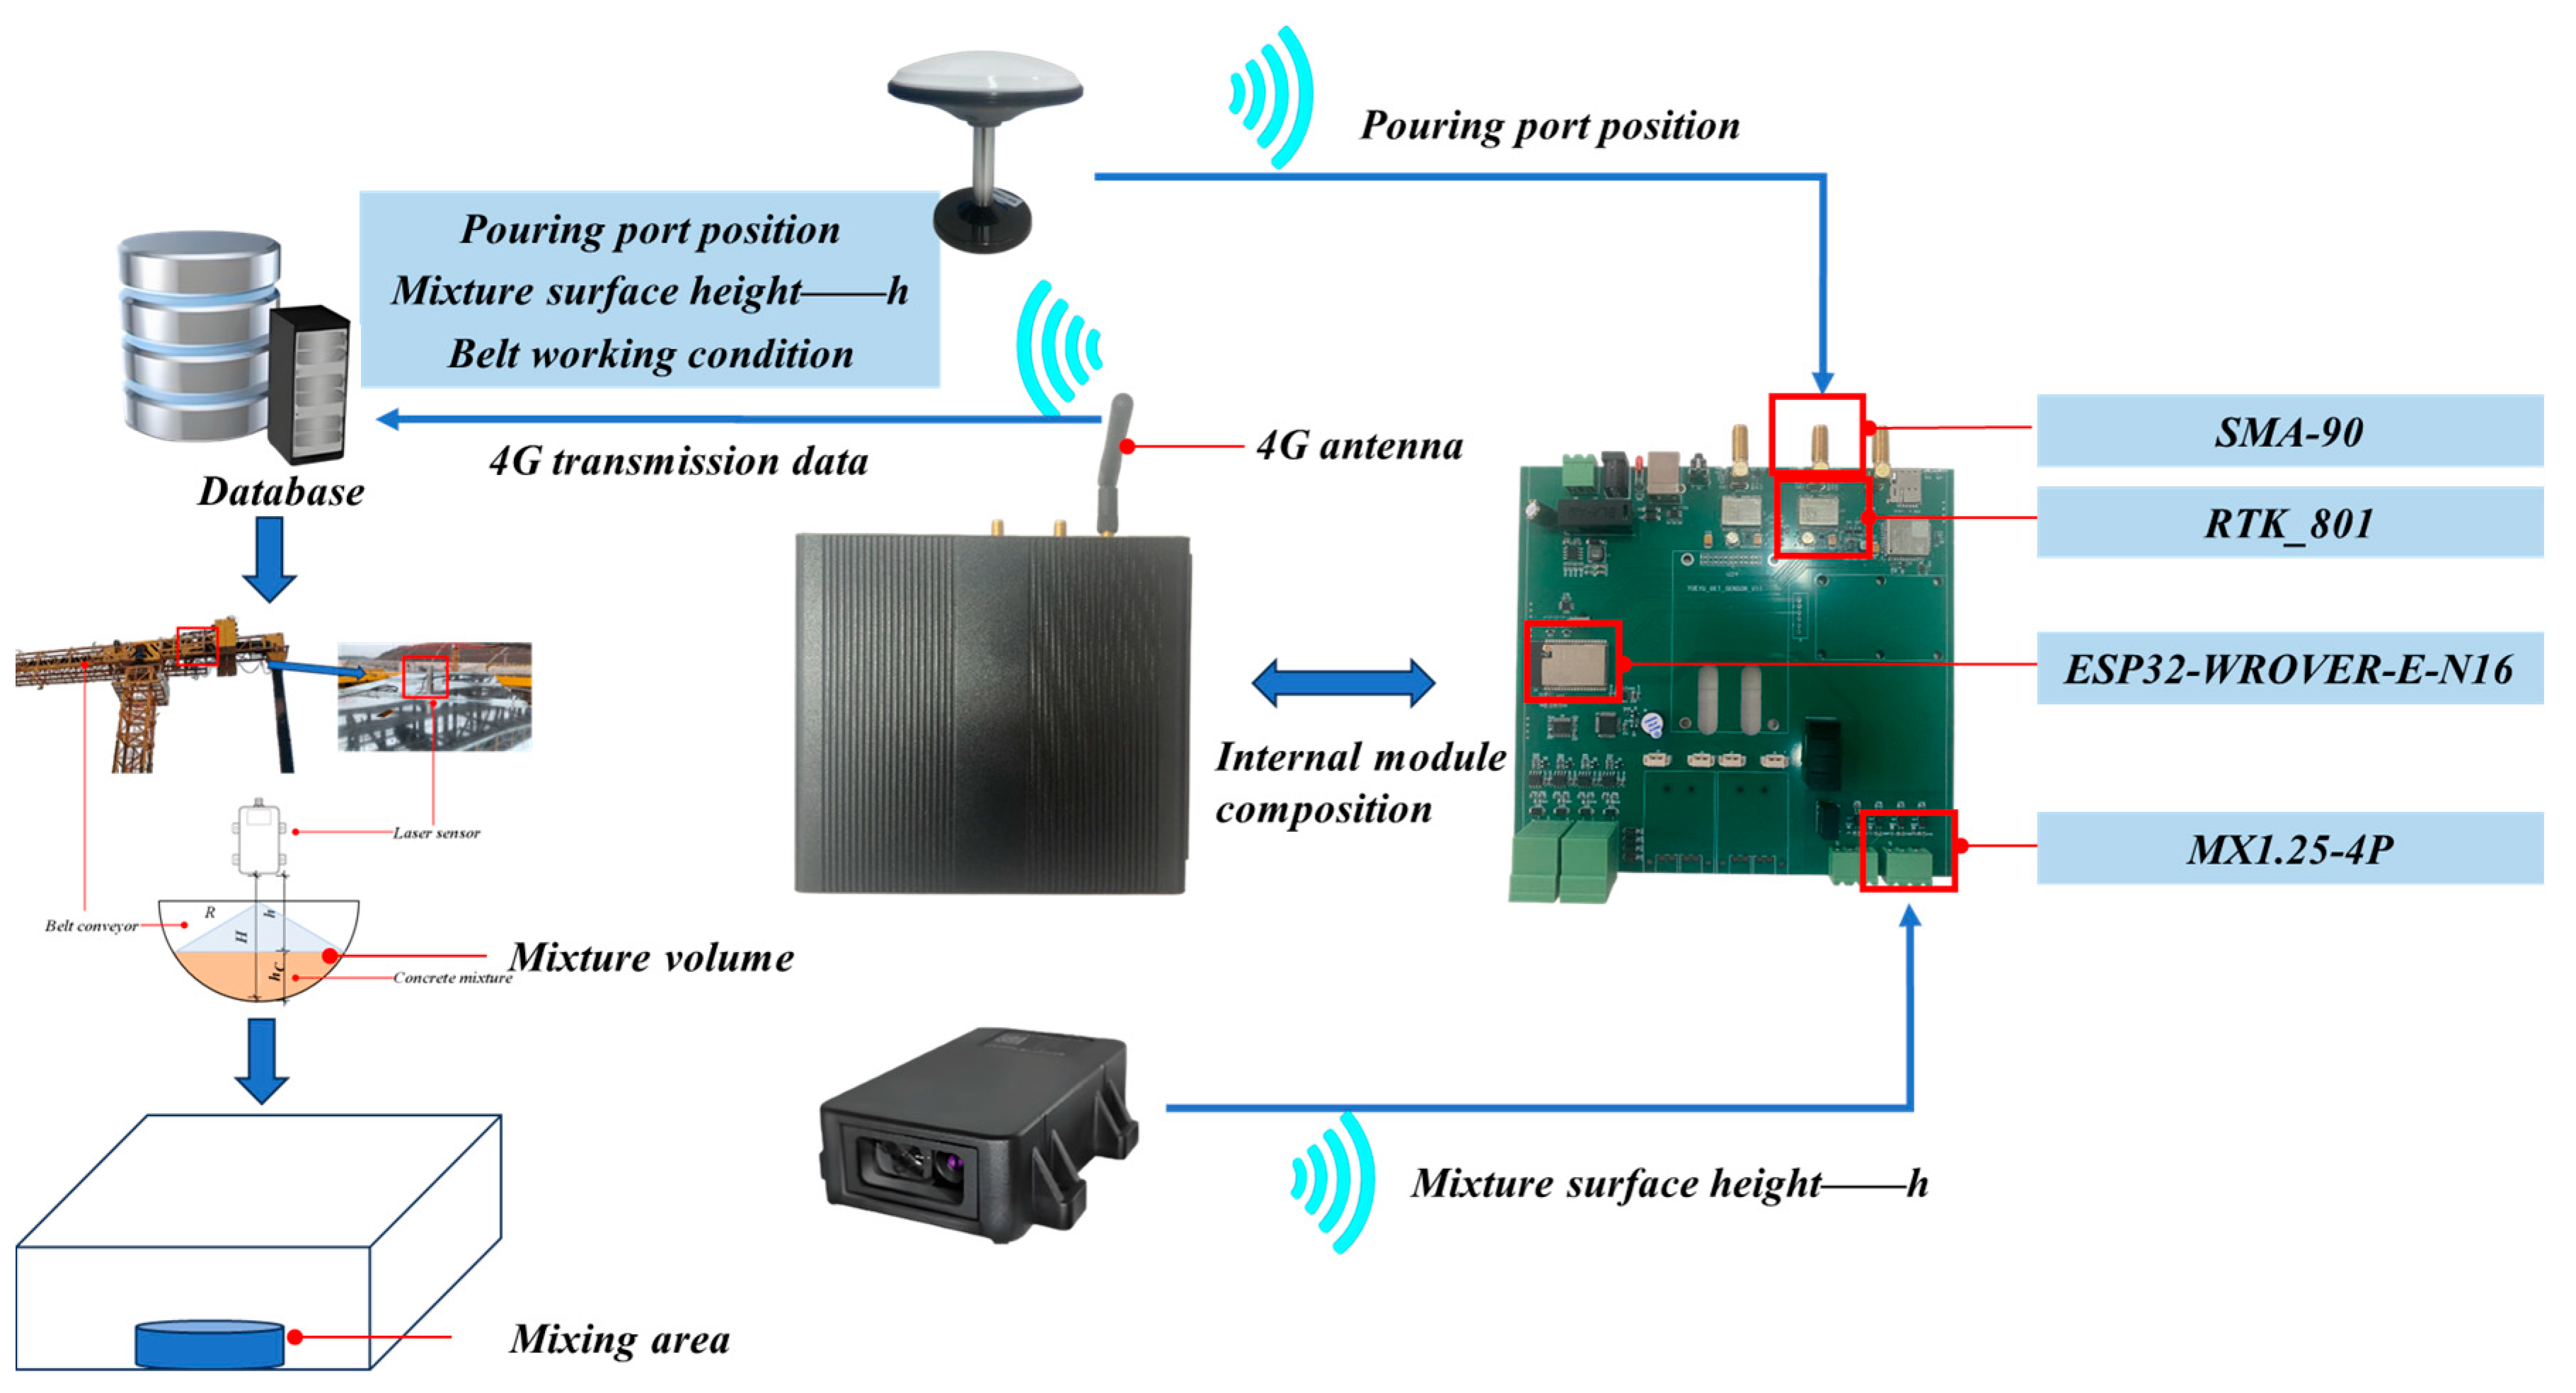
A high-precision pouring area positioning device has been developed, which collects corresponding calculation parameters to obtain real-time information on the pouring area and position during the construction process. As shown in Figure 13, the device adopts a modular design and is mainly composed of three core components: a GNSS-RTK (Global Navigation Satellite System—Real-Time Kinematic, a real-time dynamic differential technology of global navigation satellite system that can achieve centimeter-level precise positioning of construction positions) positioning antenna, which is installed at a key position of the discharge port; an industrial grade laser sensor, which is integrated at the discharge port and synchronously monitors the conveyor status and the surface height of the mixture; and a main control box, which is equipped with advanced algorithms to fuse and transmit multi-source data.
GNSS-RTK technology, with its centimeter-level high-precision positioning capability, has become one of the core technologies for construction site positioning. Based on the principle of this positioning technology, we have developed a real-time pouring point positioning device for the pouring process of concrete mixtures. The GNSS-RTK receiver obtains real-time geodetic coordinates (latitude and longitude) of the discharge port, and the positioning data is transmitted to the main control box through SMA-90.
As shown in Figure 13, the main control box uses the ESP32-WROVER-E-N16 chip as the main control MCU. The chip is based on the FreeRTOS real-time operating system and receives and calculates satellite raw data through the RTK-801 chip, completing accurate calculation of the latitude and longitude coordinates of the discharge port.
Considering that rectangular coordinate systems are commonly used in practical engineering applications, and the discharge port positioning model is based on the Gaussian Kruger projection plane coordinate system, the system has established a transformation model between the WGS-84 geodetic coordinate system and the Gaussian plane coordinate system. This model converts the calculated latitude and longitude coordinates into engineering-applicable N-E (northeast) plane coordinates through steps such as central meridian selection and Gaussian projection forward calculation.
As shown in Figure 13, the laser sensor collects real-time surface height data of the mixture, which is transmitted to the main control system through the MX1.25-4P interface. The main control system accurately identifies the “material working” status of the belt conveyor through intelligent algorithms.
The main control device integrates GNSS-RTK positioning data, mixture surface height data, and belt conveyor operation status together, and then transmits them to the cloud database for accessing the software system using 4G modules. Finally, these collected parameters are combined with the pouring area and position calculation model to obtain the location of the mixture area.

3.1.2. Time Acquisition Device

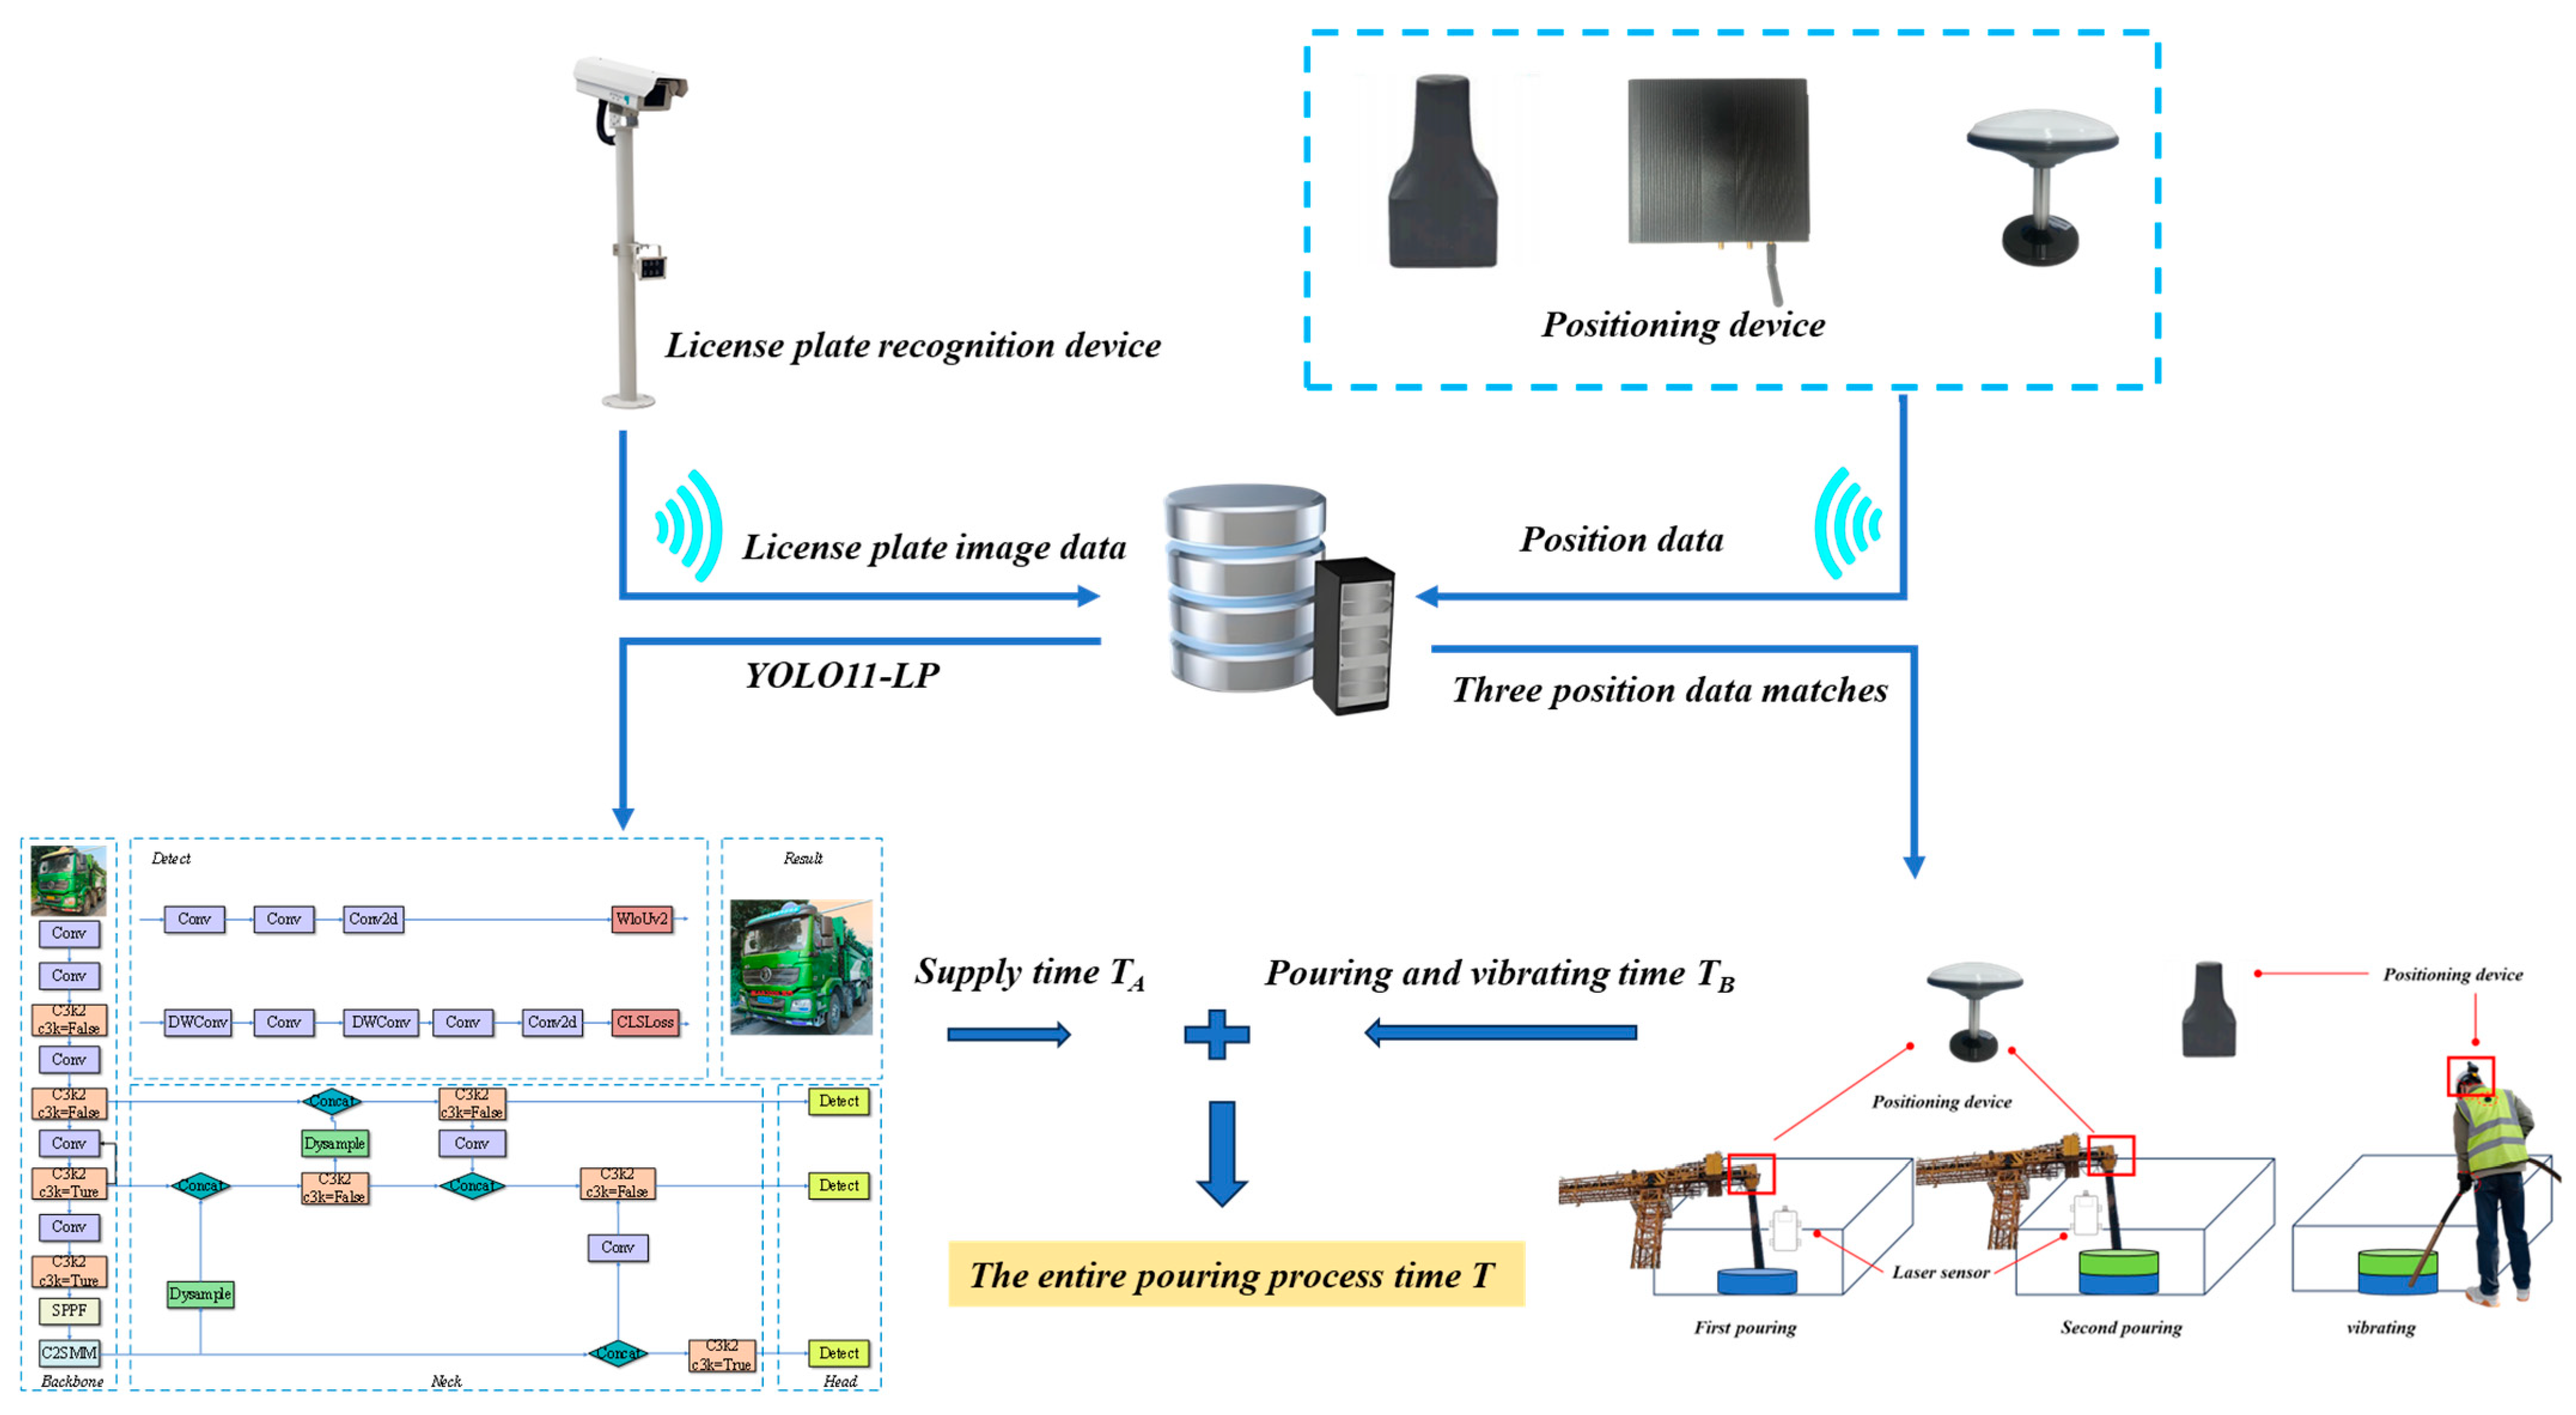
We have developed a device for collecting the entire pouring process time of the mixture, which can obtain real-time information on the pouring process time by collecting the supply time and pouring time of the mixture. As shown in Figure 14, the device adopts a modular design and mainly consists of three core components: a dual end license plate recognition system deployed at the mixing station and construction site, which automatically records the precise time of loading and unloading of transport vehicles based on machine vision technology; a high-precision GNSS-RTK positioning system that collects real-time spatial coordinates and timestamps of the discharge port and vibration operation; and a main control box, which is equipped with advanced algorithms to fuse and transmit multi-source data.
As shown in Figure 14, the high-definition camera installed at the mixing station uses the YOLO11-LP deep learning algorithm to recognize the license plate of the transport vehicle in real time, and transmits the recognition result and timestamp to the cloud server through a 4G network. The supply time of the mixture is calculated using Equation (3).
The system adopts a dual-node GNSS-RTK high-precision positioning scheme: one node is fixedly installed at the discharge port, and the other node is integrated on the top of the vibrating worker’s head. Two positioning terminals record real-time location coordinates and synchronously transmit them to the cloud server through a 4G module. The cloud server uses a spatial location matching algorithm to automatically record the timestamp and calculate the pouring operation duration based on Equation (7) when the coordinates of the vibration point are detected entering the pouring area. Finally, based on the data of the supply time and pouring time of the mixture, the server combines Equation (2) to calculate the entire pouring process time.

3.2. Cold Joint Prevention and Control System

3.2.1. Selection of Cold Joint Threshold

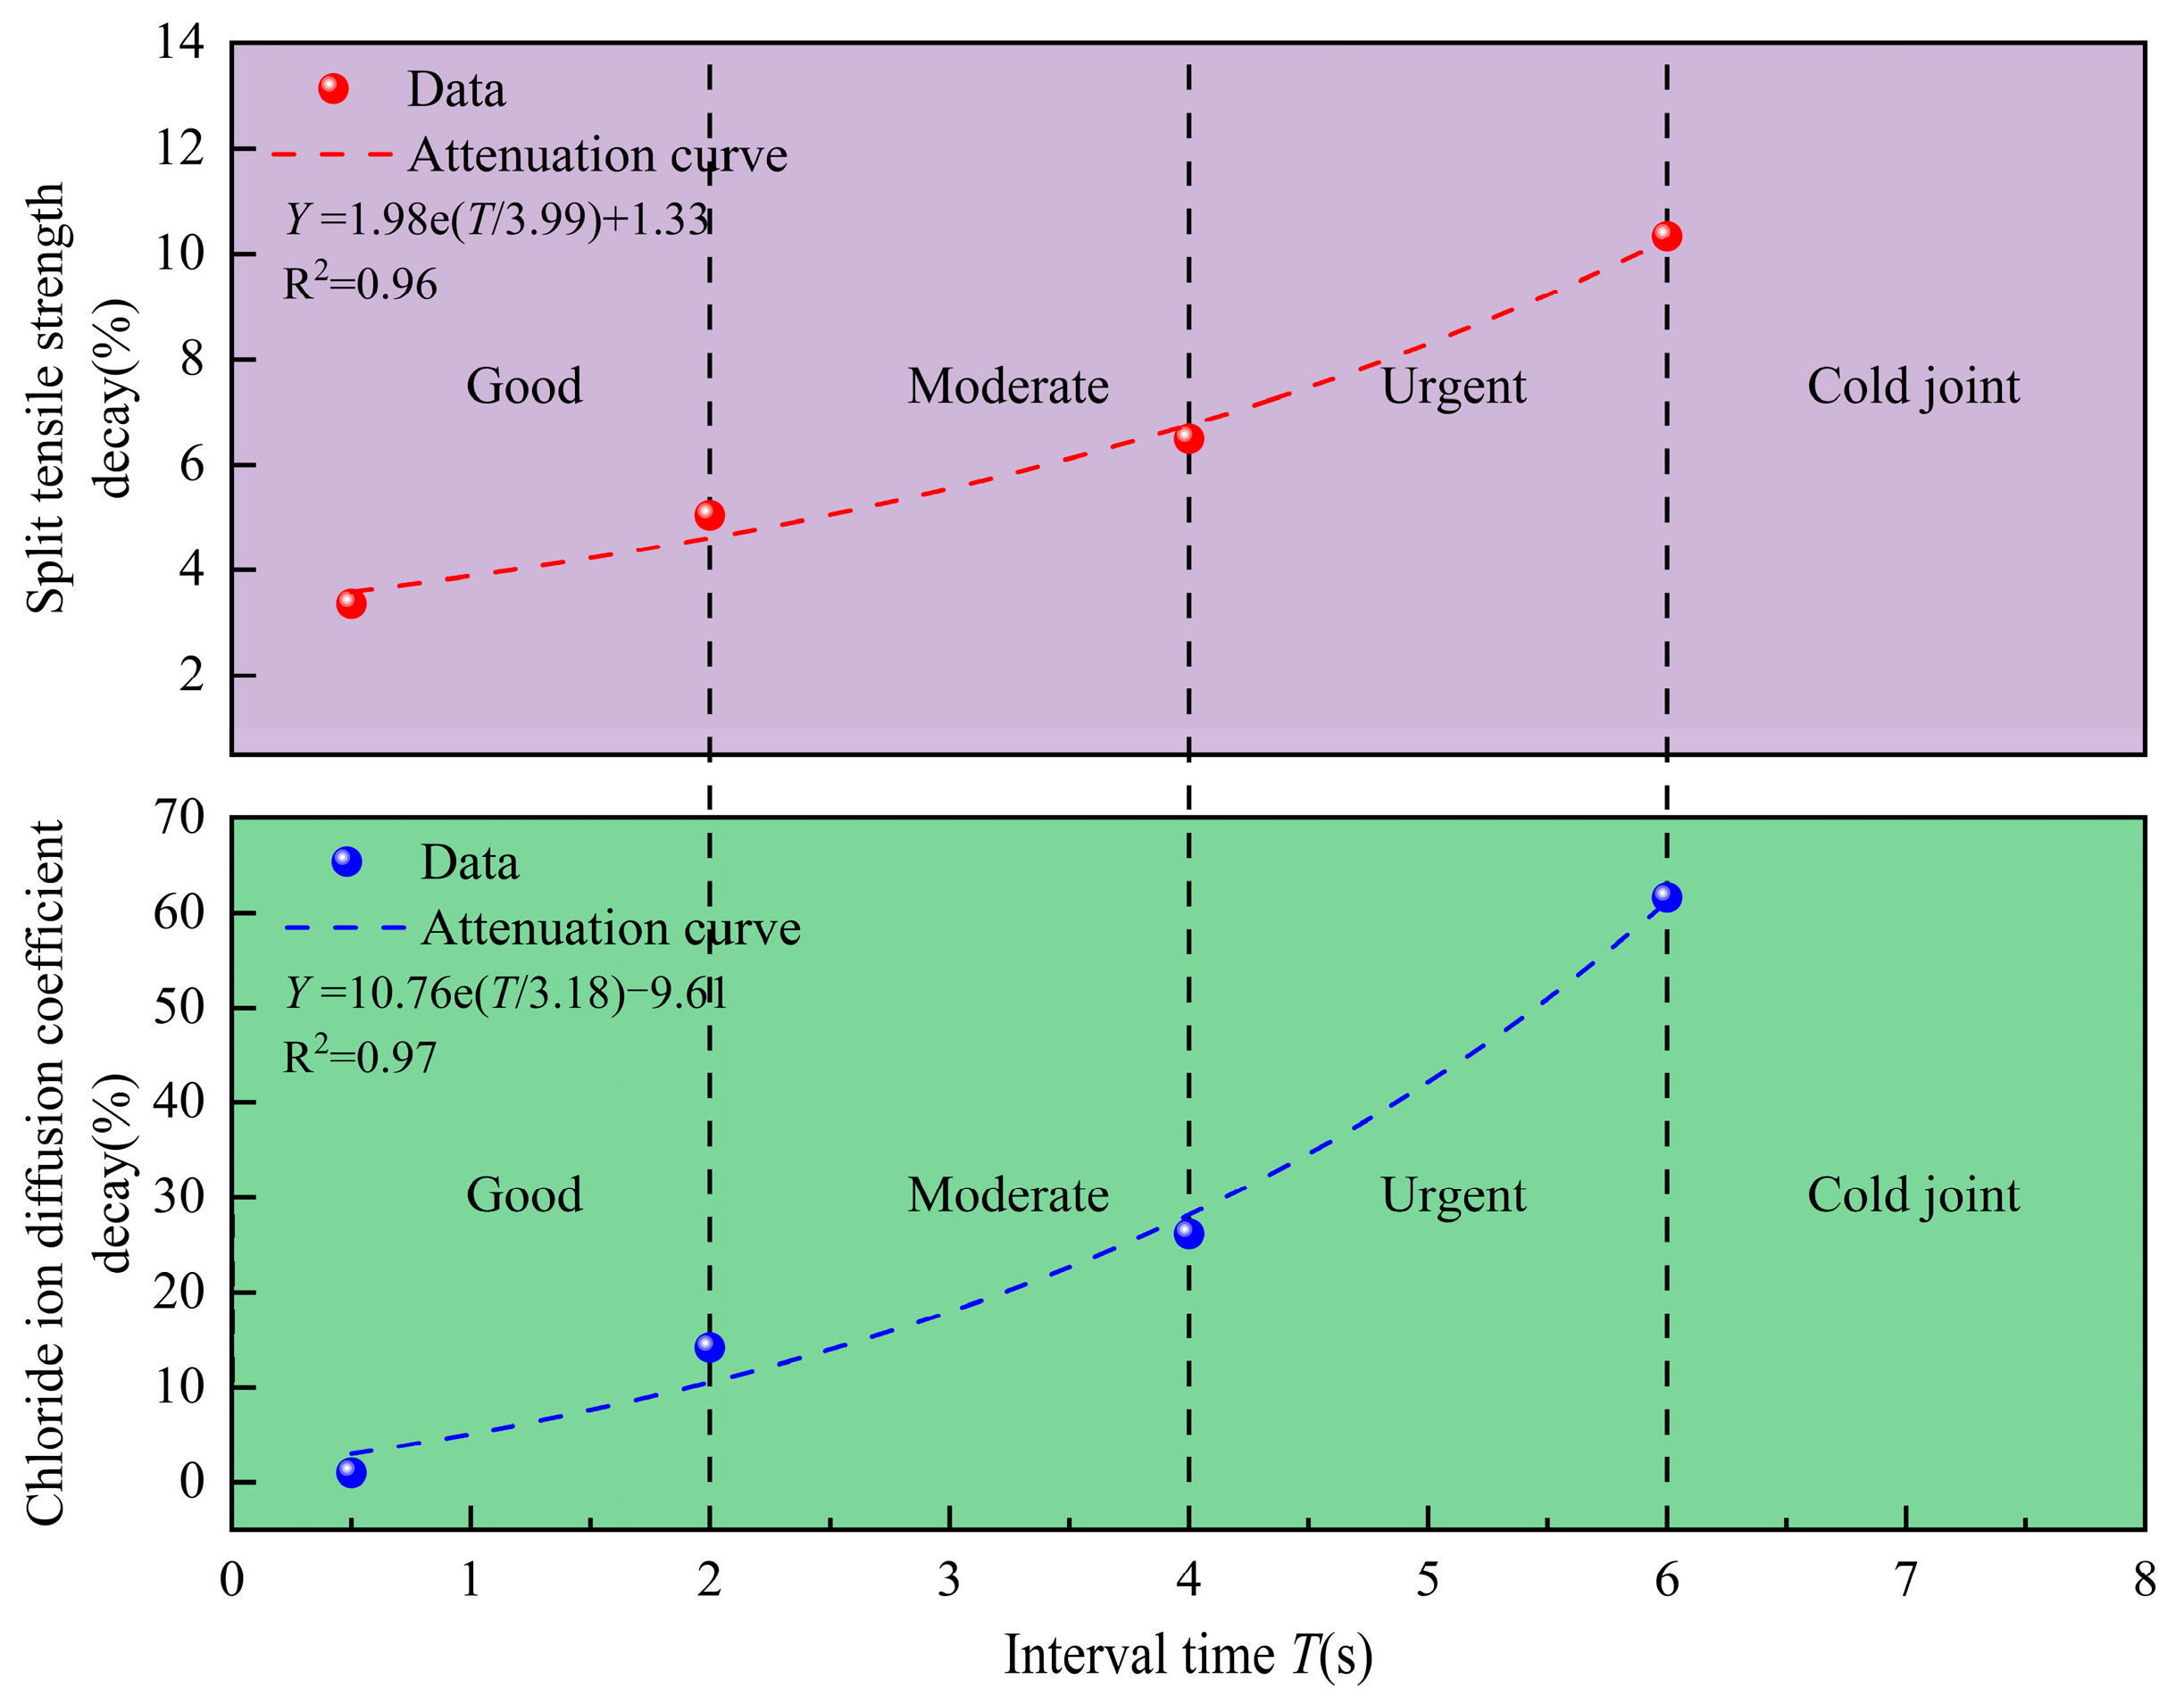
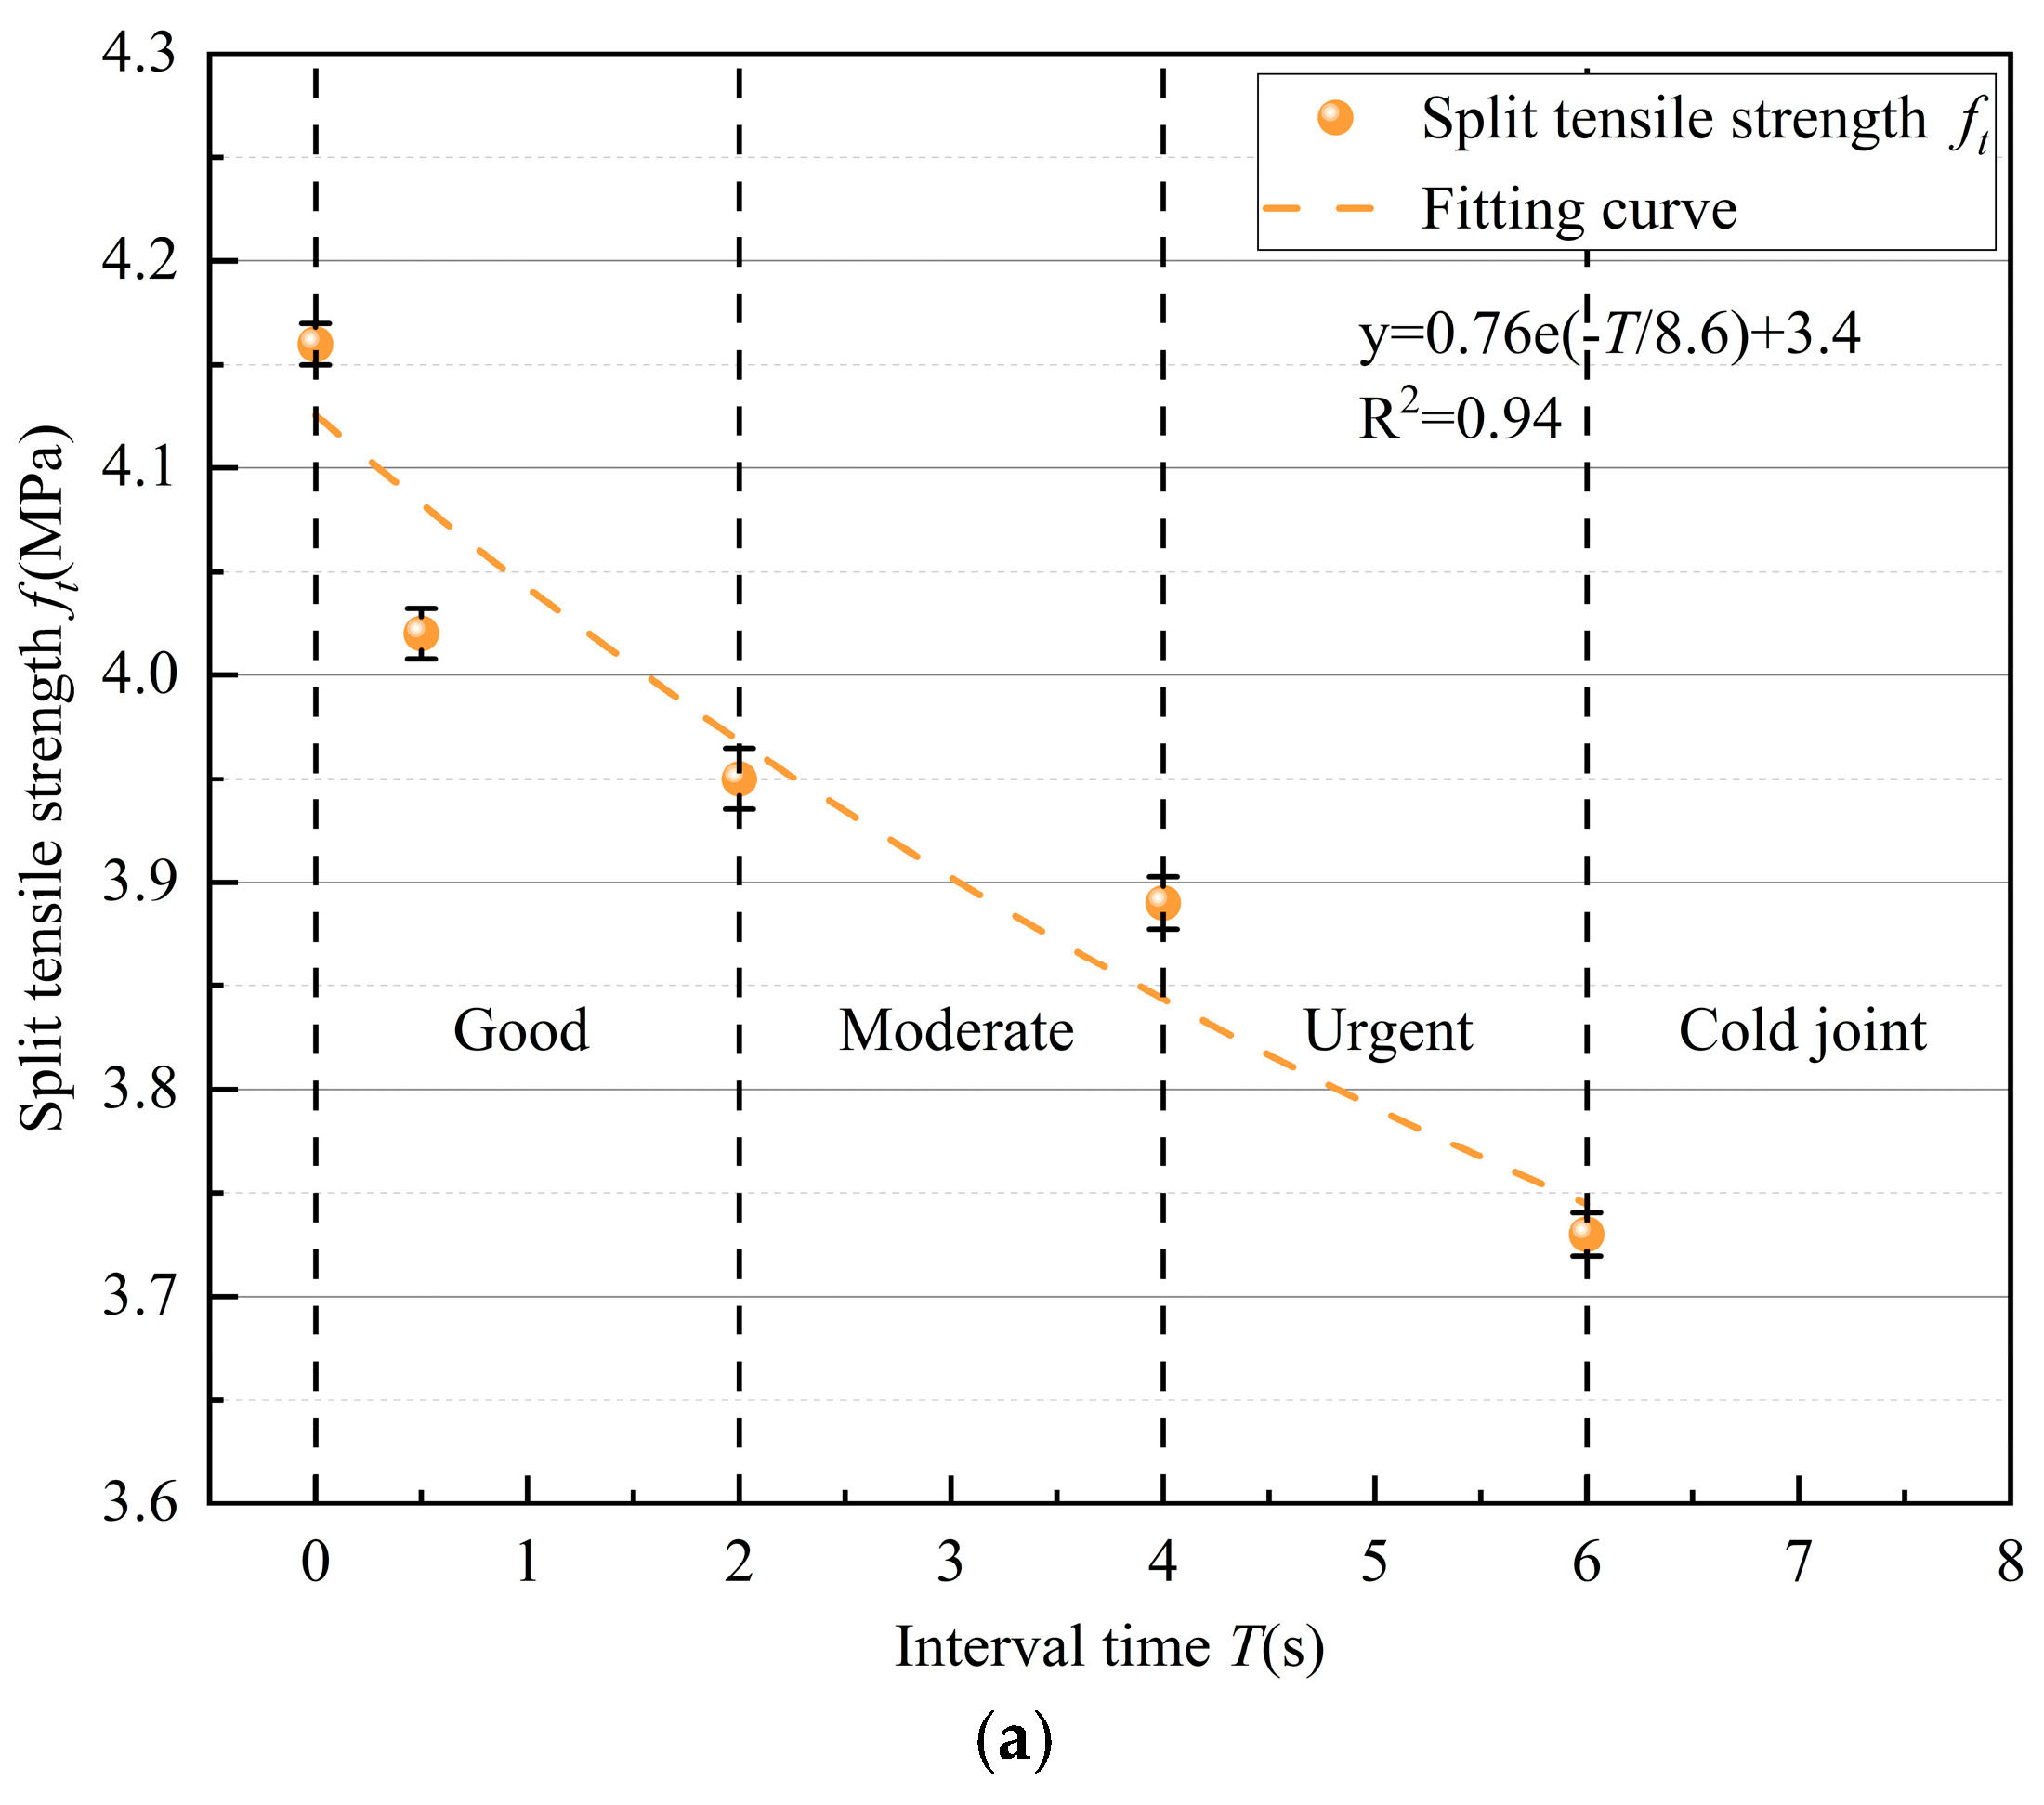
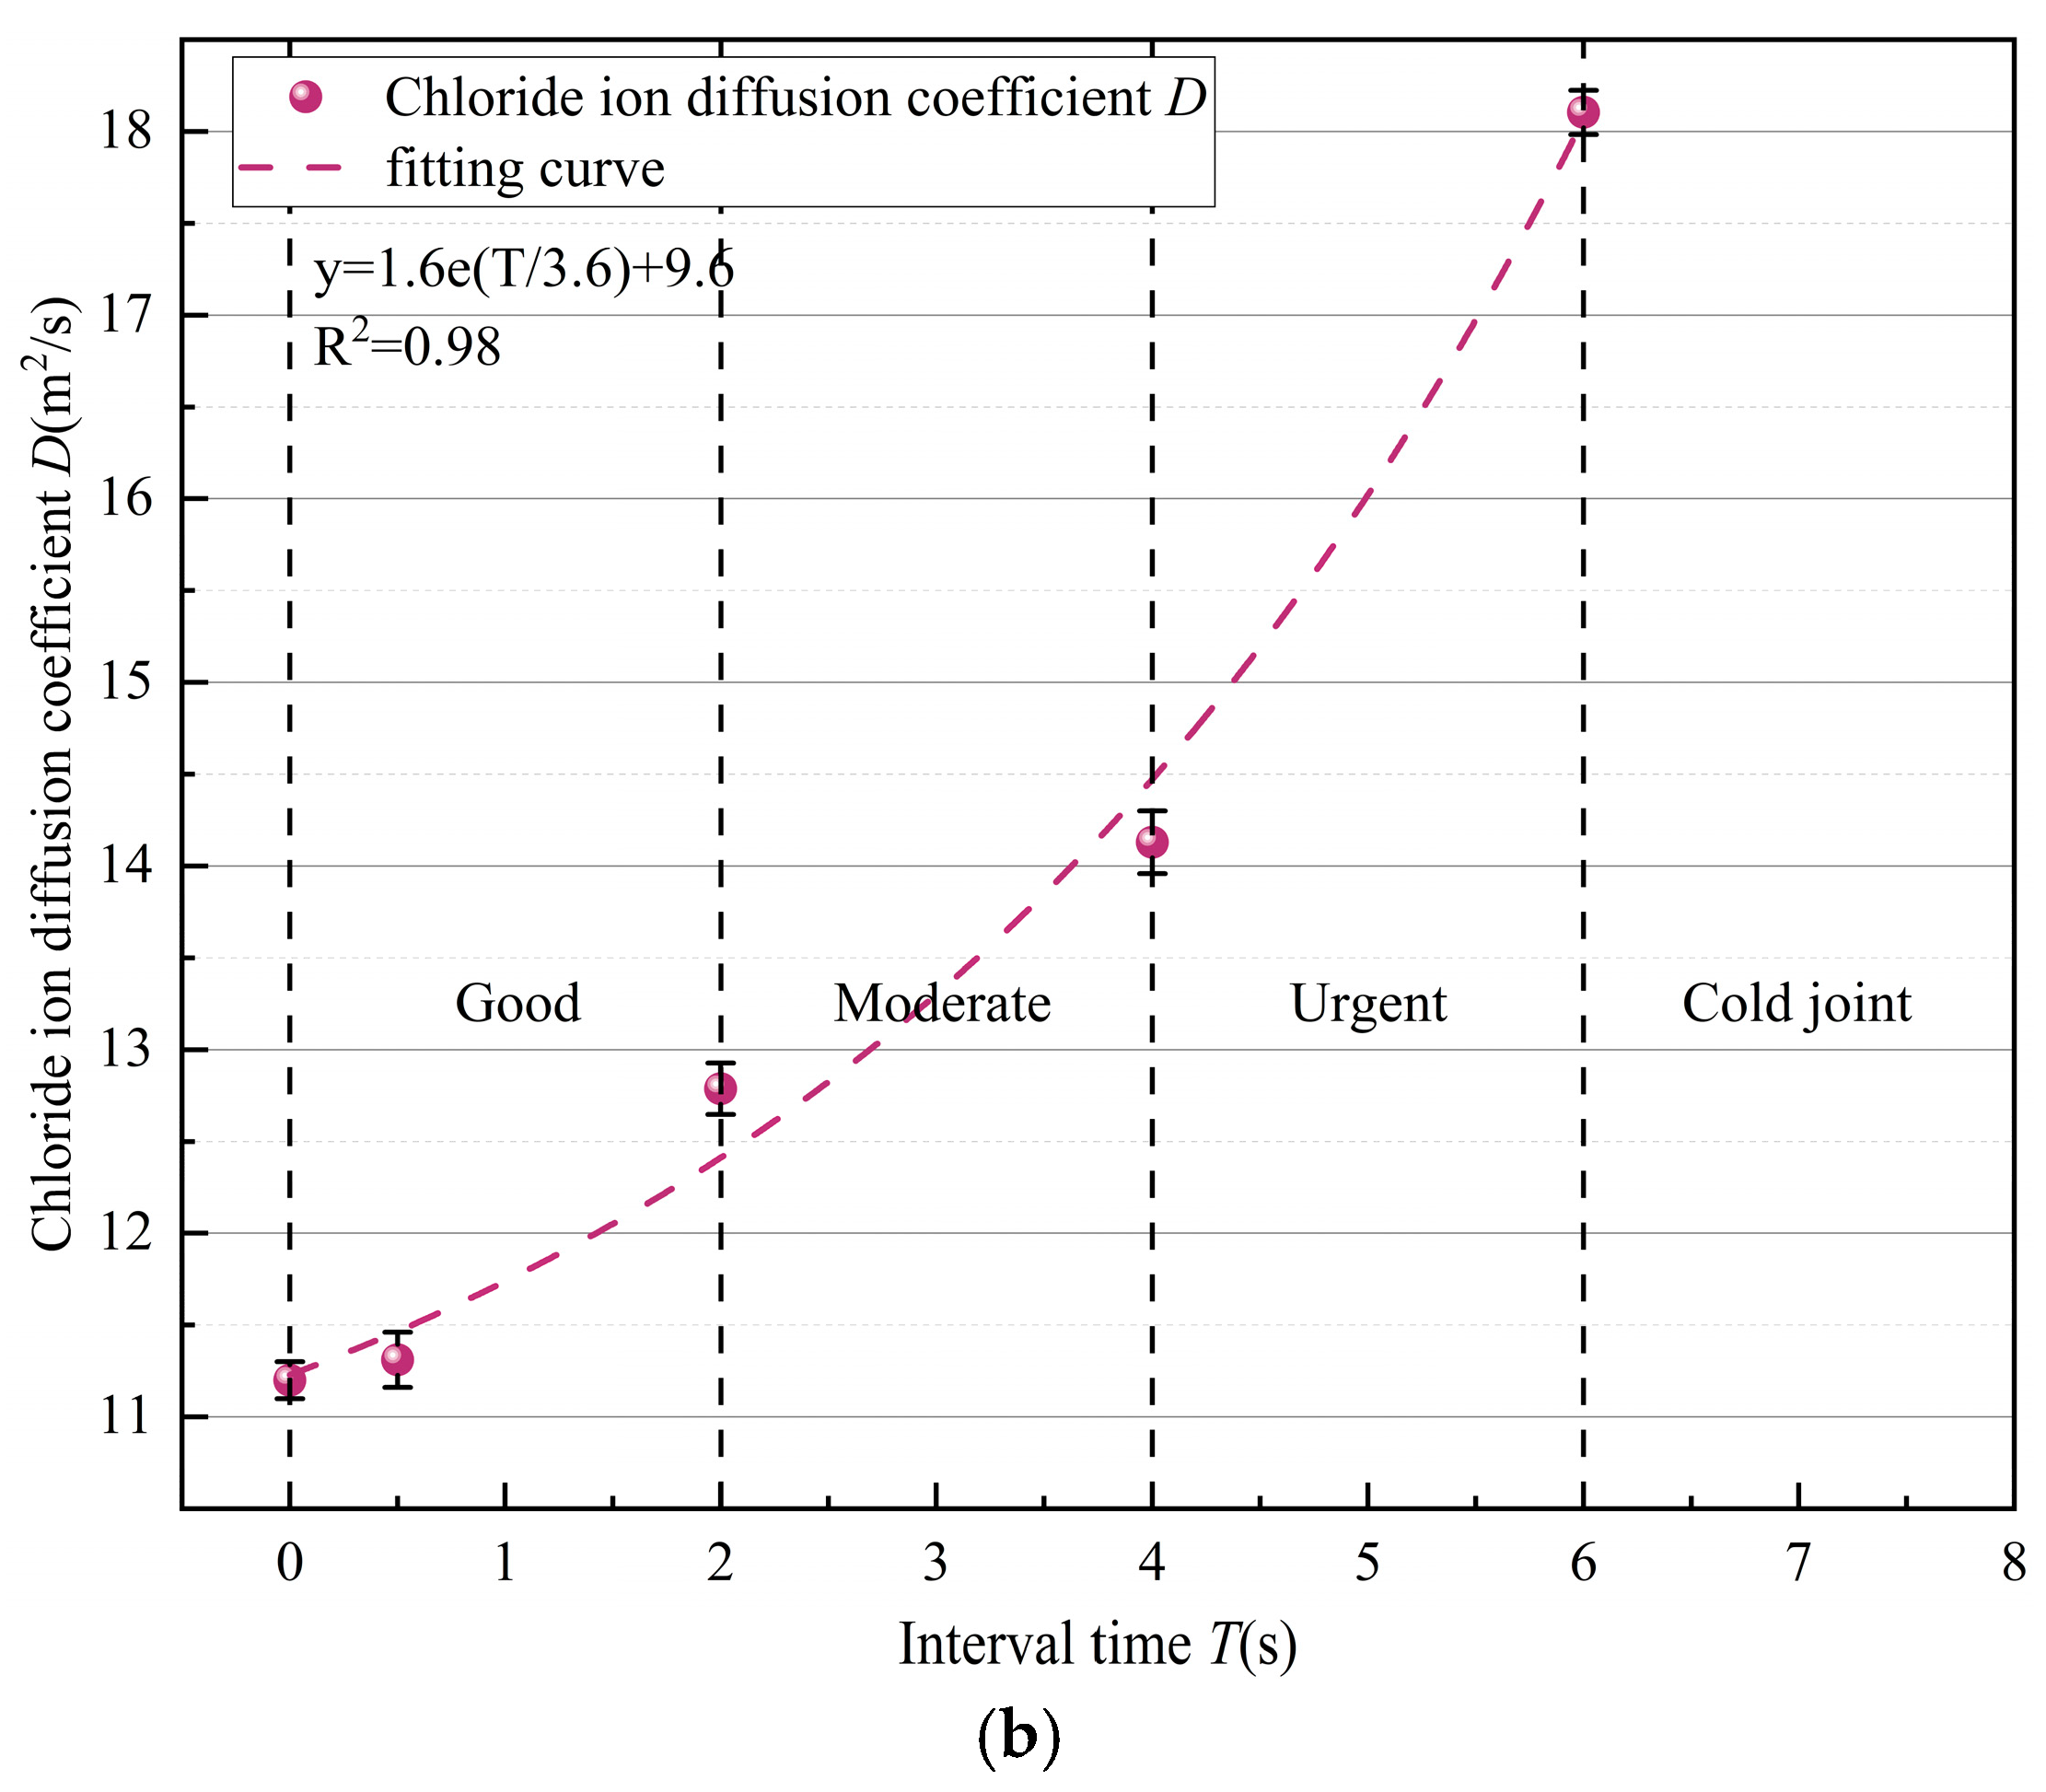
The setting of cold joint prevention and control threshold indicators for mixtures aims to improve construction quality and reduce the probability of cold joint occurrence. Specifically, when pouring the lower layer mixture, the optimal pouring scheme can be selected based on the threshold index, and the selection of the threshold needs to be calibrated through experiments. The experimental research results show that there is a strong correlation between pouring interval time and concrete performance, with splitting tensile strength decreasing exponentially with increasing interval time (R2 ≥ 0.94), and chloride ion diffusion coefficient increasing exponentially with increasing interval time (R2 ≥ 0.98). Based on this rule, the pouring interval is divided into four sections—good, moderate, severe, and cold joint—providing a quantitative basis for construction decision-making.
In order to select the appropriate cold joint prevention and control threshold for the mixture, the initial setting time of the mixture in Table 1 was measured in the laboratory using a mixture penetration resistance tester, which was 6 h. Based on the initial setting time of the experimental mixture, five sets of mixture samples containing cold joints were set up in this experiment. The corresponding pouring intervals for the samples are 0 h, 0.5 h, 2 h, 4 h (before the initial setting time of the mixture), and 6 h (the initial setting time of the mixture) [9]. The sample group numbers are T0, T0.5, T2, T4, and T6. The size of the specimen used for concrete mechanical performance testing is 150 × 150 × 150 mm3. The concrete resistance to chloride ion penetration test uses cylindrical specimens with a diameter of 100 mm and a height of 50 mm, using a coring machine. Table 1 lists the grouping, size, and experimental content of the samples.
The mold used for pouring the mixture is a prefabricated plastic mold. Before pouring the mixture into the mold, apply release oil to both sides of the plastic mold to facilitate the subsequent release of the mixture sample. In the laboratory, mix the raw materials according to the proportions shown in Table 2, mix the raw materials according to the proportions shown in Table 2, and pour them into the mold twice. Pour half of the mixture each time and compact it with a vibration table. After the set interval, use the same mixing ratio to fill the other half of the mold with fresh mixture and vibrate it, and promptly level the pouring surface. After demoulding, the sample is placed in the curing room for standard curing, with a curing period of 28 days. After curing, mechanical strength tests and chloride ion diffusion coefficient measurements are conducted.
The cement used in this experiment is Portland cement. The mineral mixture consists of grade I fly ash and S95 slag powder. The anti-corrosion enhancer is JS-HGCPA. The particle size pouring of the fine aggregate is shown in Figure 15. The coarse aggregate is granite crushed stone (Figure 15), which is graded into three levels, namely 5–20 mm, 20–40 mm, and 40–80 mm. After mixing with various blending ratios, the bulk density is compared, and the blending ratio with the highest bulk density is selected. The final blending ratio is 5–20 mm: 30%, 20–40 mm: 30%, 40–80 mm: 40%. The water is laboratory tap water, using high-performance polycarboxylate superplasticizer. The mixing ratio is shown in Table 2.
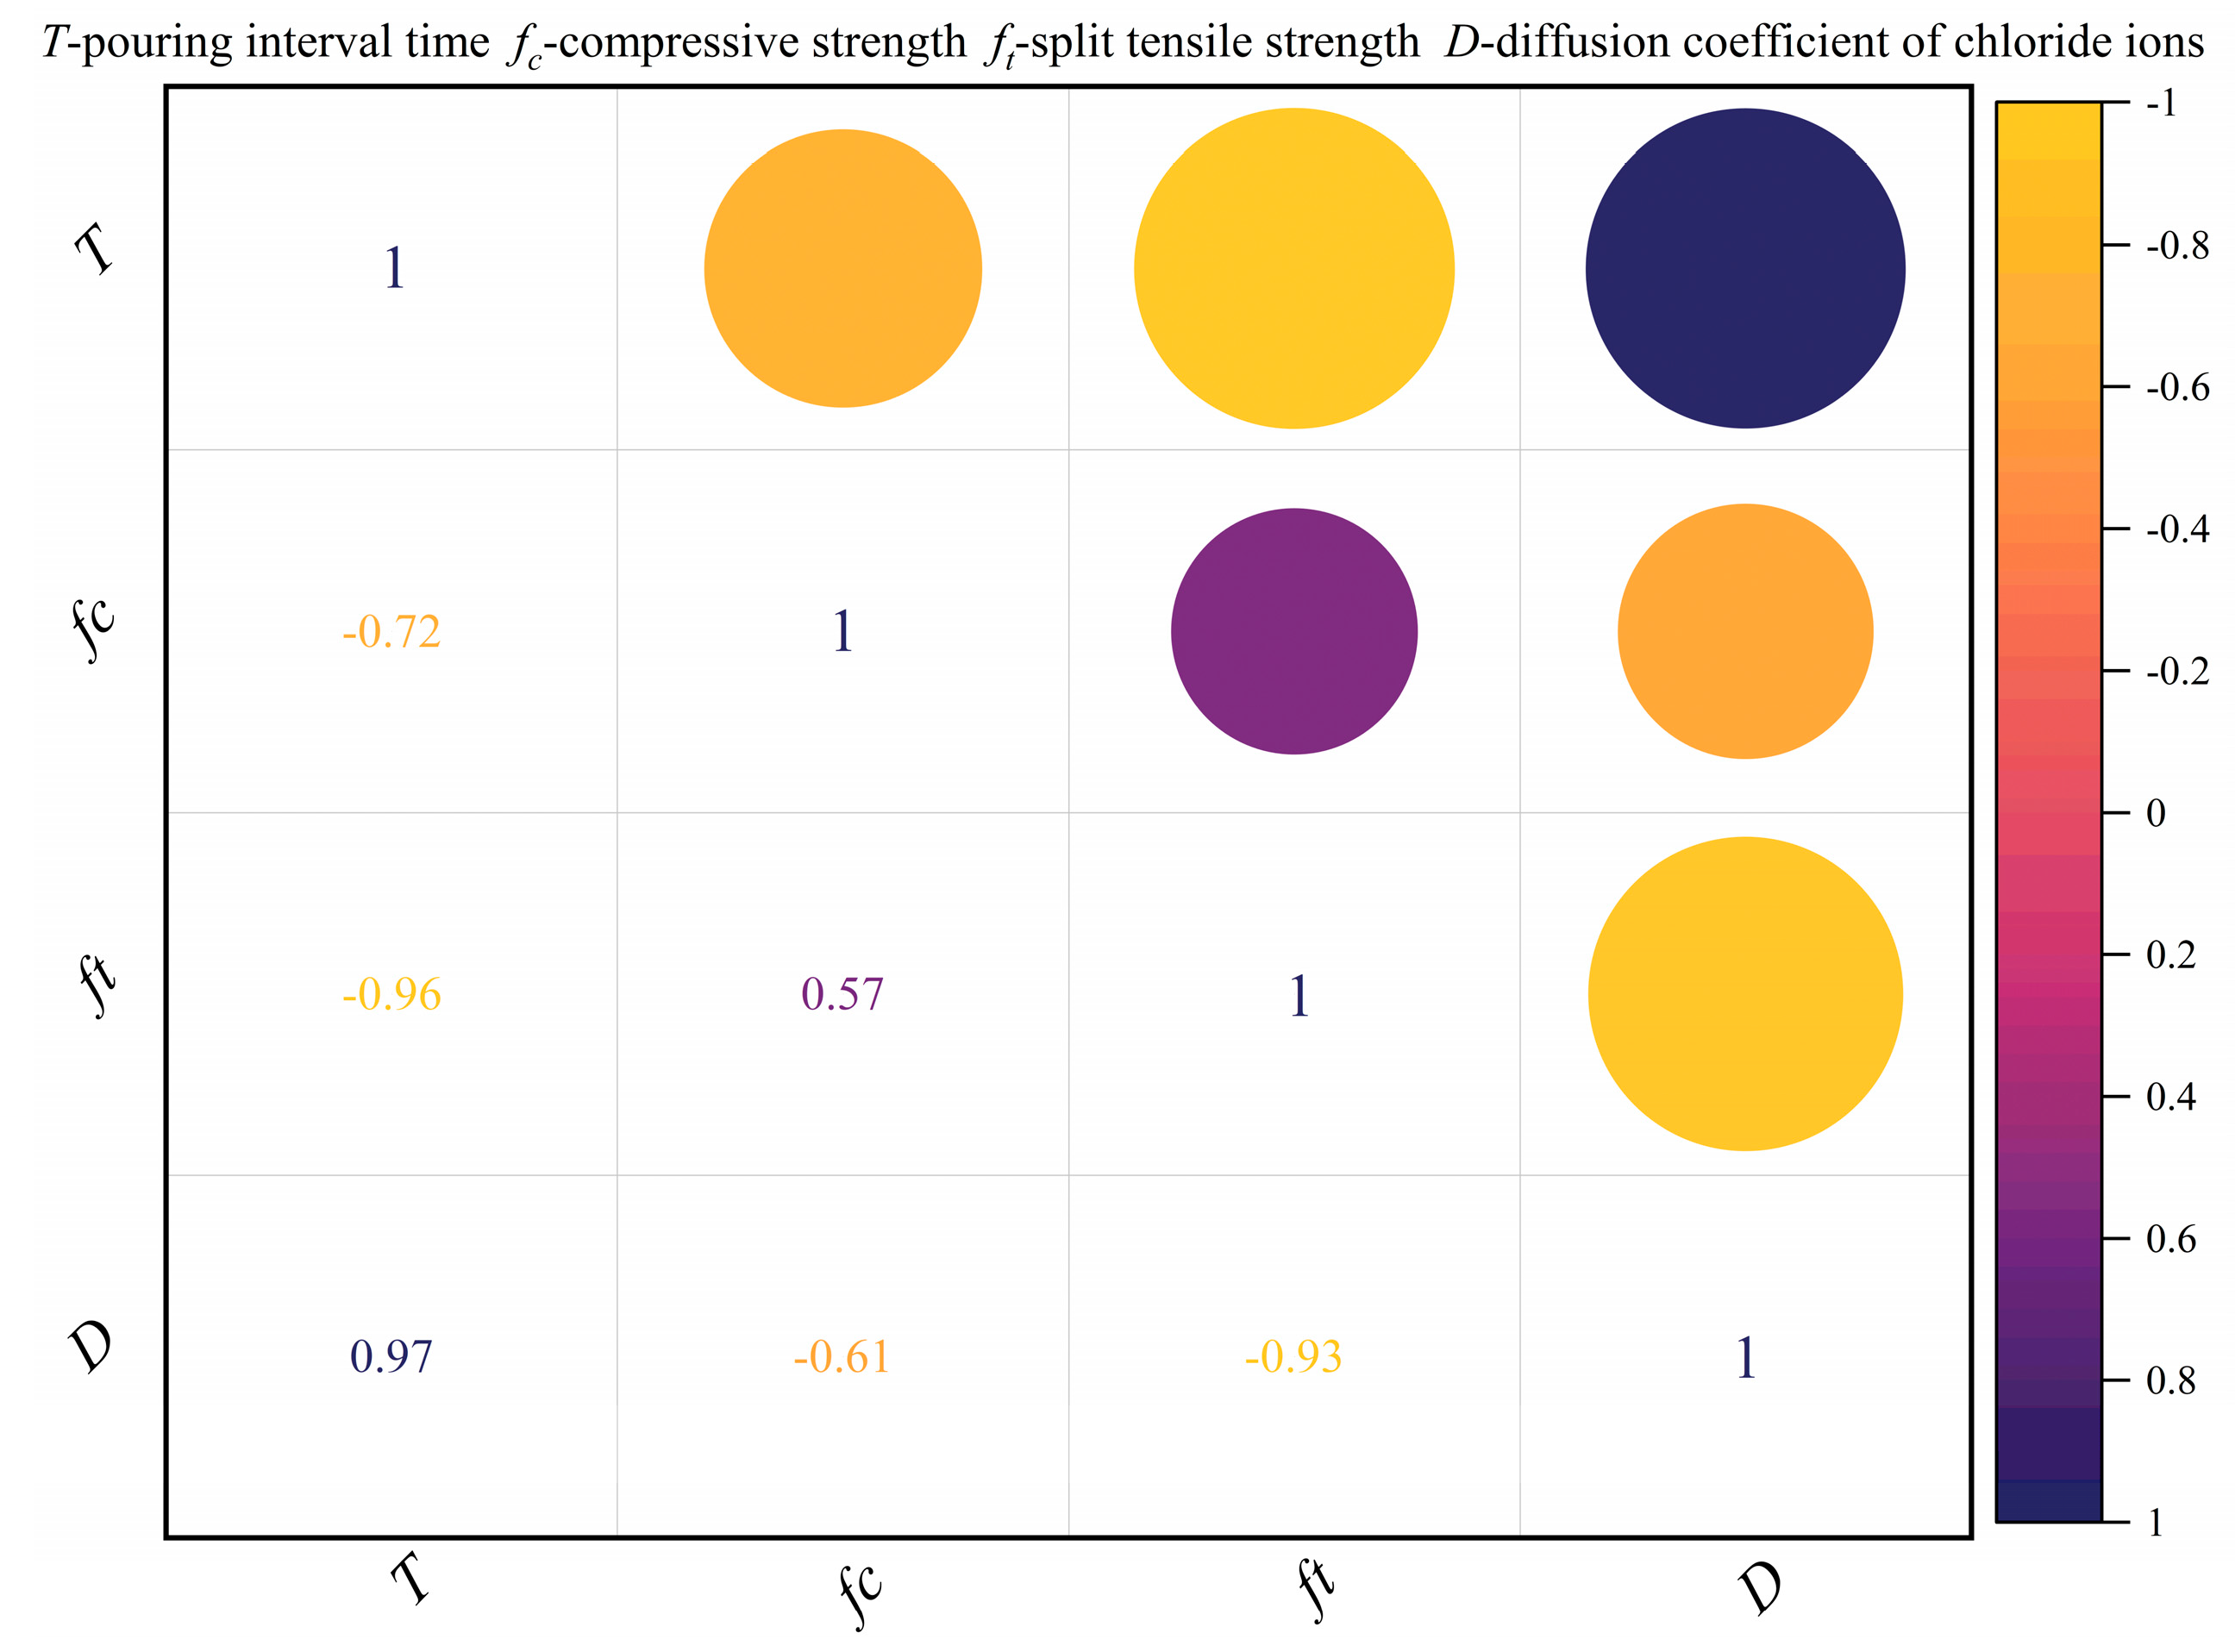
The experimental results indicate that the performance of the cold joint mixture is closely related to the interval time between the front and rear pouring layers. As shown in Table 3, Table 4 and Figure 16, the correlation coefficient between compressive strength and interval time is −0.72, but its p-value is 0.169 (greater than the significance level of 0.05), and the 95% confidence interval crosses zero values ([−0.98, 0.443]), indicating that there is no significant correlation between the two. In contrast, there is a highly significant negative correlation between the splitting tensile strength and the interval time (r = −0.96, p = 0.01), with a 95% confidence interval of [−0.997, −0.505], excluding zero values, indicating a significant negative correlation between the two. In addition, there is a strong positive correlation between the diffusion coefficient of chloride ions and the interval time (r = 0.97, p = 0.006), with a 95% confidence interval of [0.619, 0.998], also excluding zero values, indicating a significant positive correlation between the two. Therefore, the splitting tensile strength and chloride ion diffusion coefficient are selected as the threshold indicators for cold joint prevention and control of the mixture.
Based on the experimental results, the threshold interval for concrete cold joints is set, as shown in Figure 17. It is divided into four intervals according to the decay of concrete performance: good (0–2 h), moderate (2–4 h), severe (4–6 h), and cold joints (>6 h). These four intervals provide a decision-making basis for the timing of pouring the lower layer of concrete, thereby optimizing the construction plan.
As shown in Figure 18, with the increase in pouring interval time, the performance of the mixture shows a clear stage-wise decay characteristic, gradually deteriorating from the initial good state until the formation of cold joints. Specifically, the diffusion coefficient of chloride ions shows a monotonically increasing trend with interval time (R2 ≥ 0.98), while the tensile strength shows a regular decreasing trend (R2 ≥ 0.94), and both trends follow an exponential function relationship. Moreover, when the interval time exceeds the critical threshold (t ≥ 6 h), the performance parameters will enter the rapid degradation zone, and the interfacial bonding performance of the mixture will significantly decrease, leading to a sharp increase in the risk of cold joints.

3.2.2. Cold Joint Prevention Visualization System

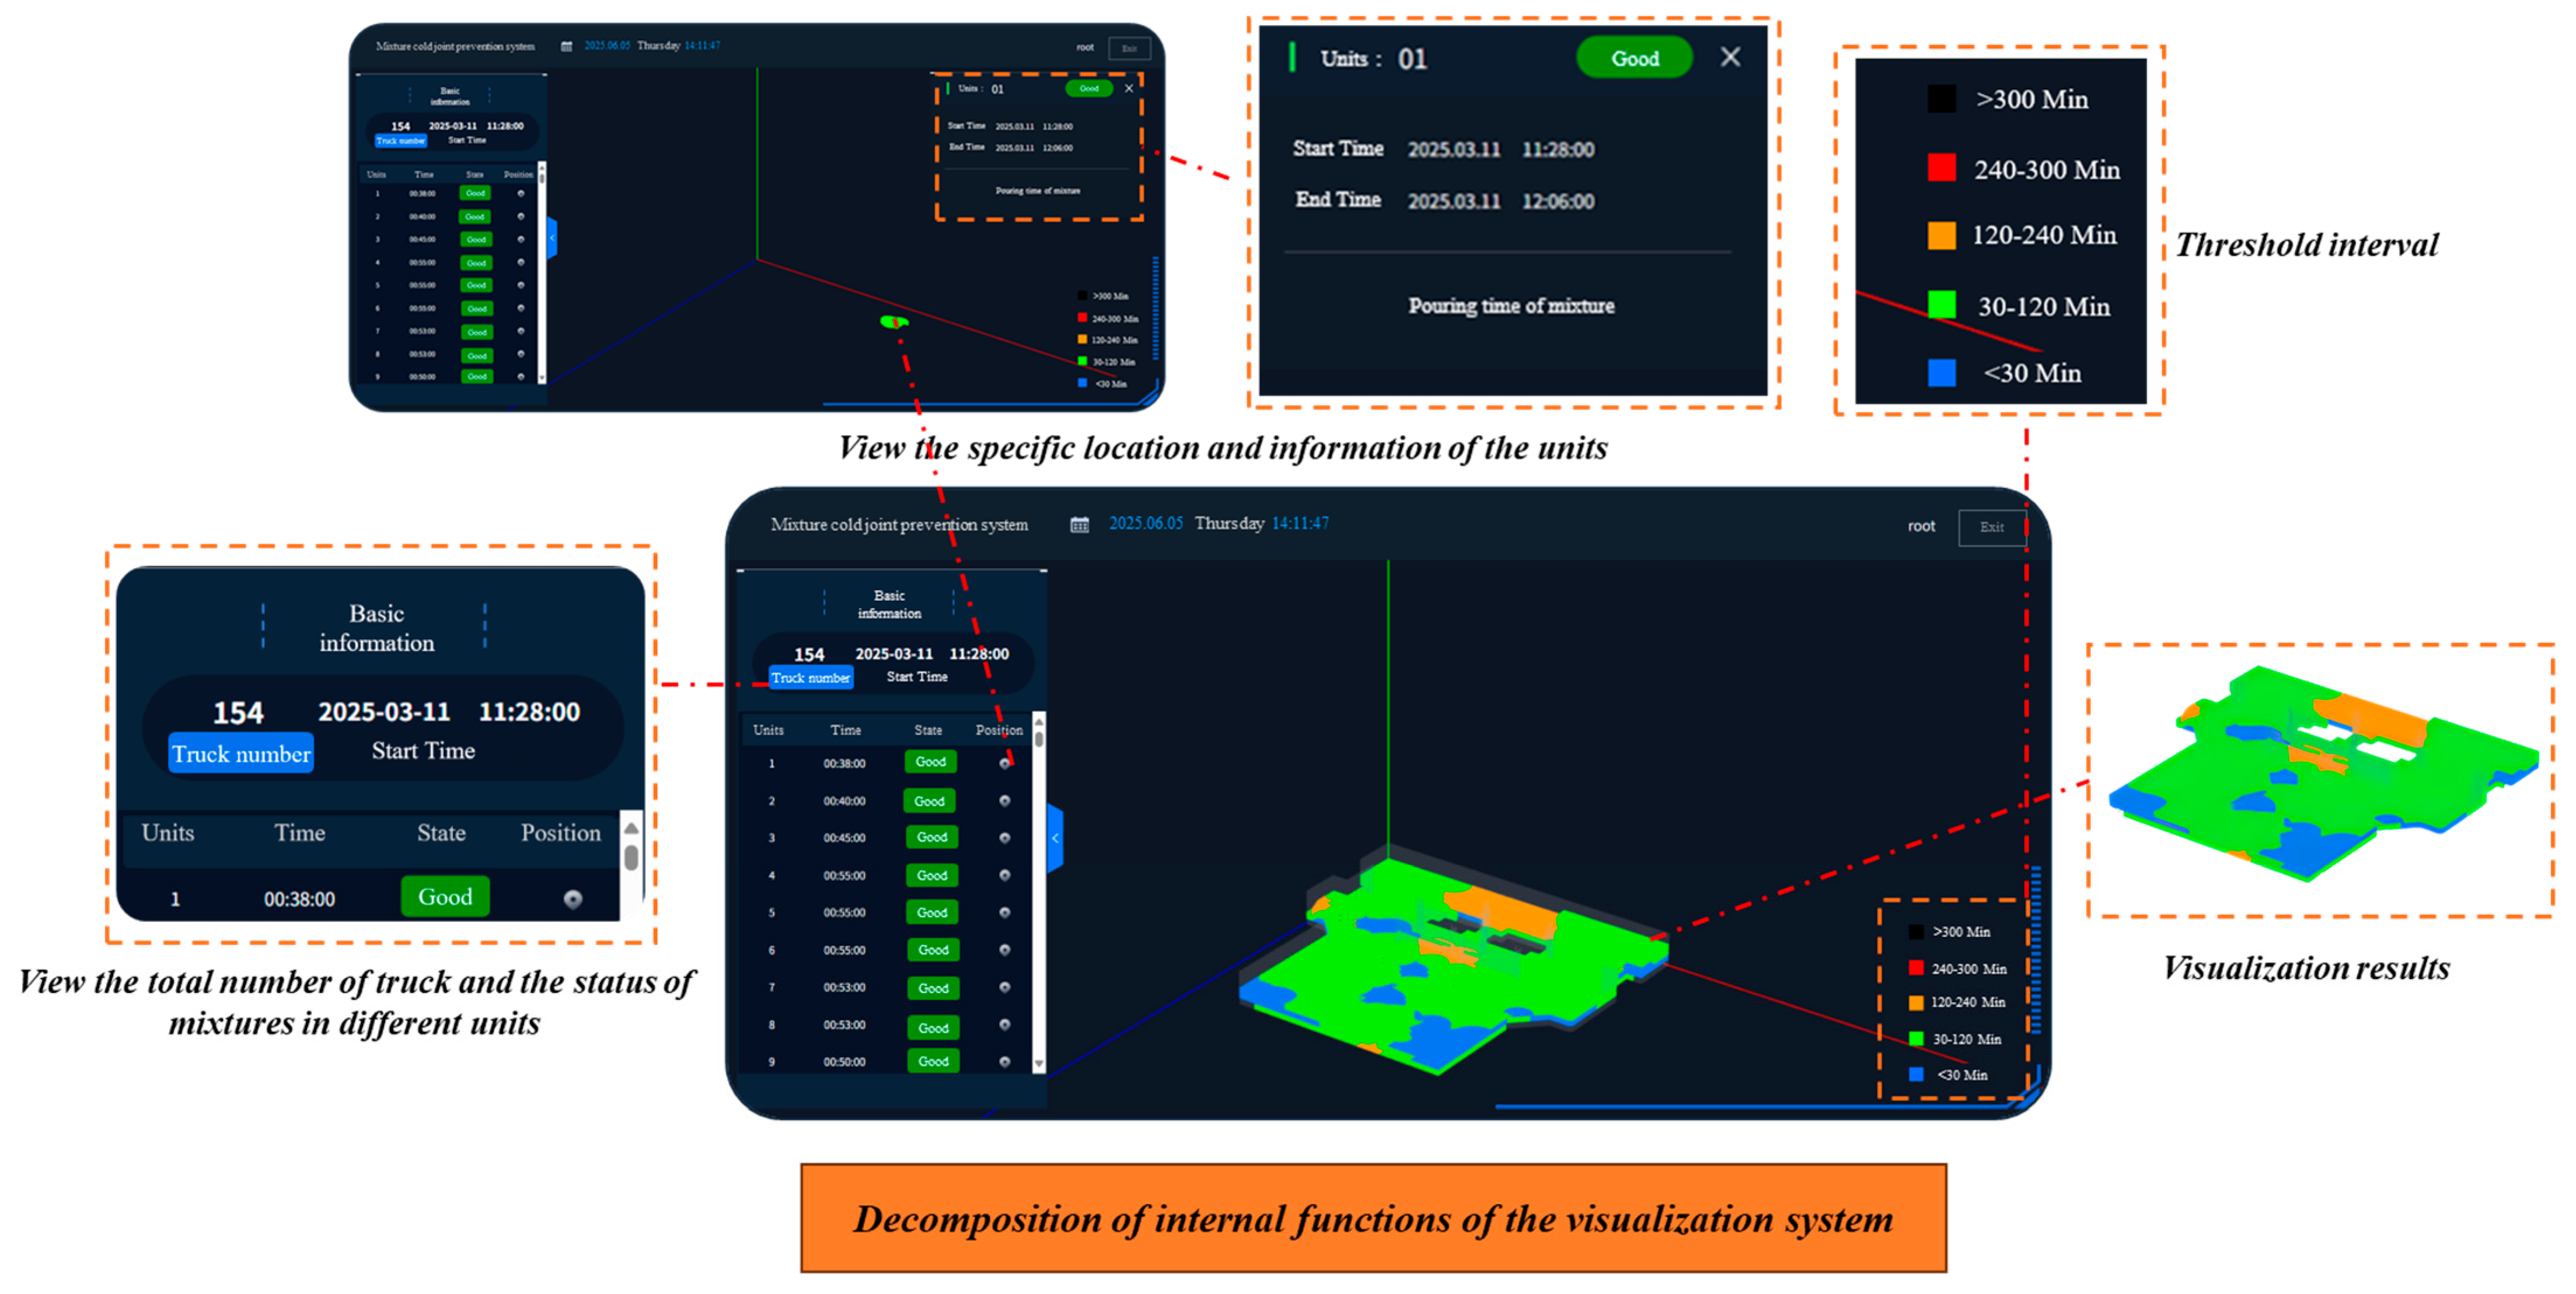
This visualization system is developed based on the B/S architecture, using the PHP language to calculate the pouring time of the mixture, and using WebGL to develop the visualization of the 3D model [27]. In terms of model implementation, the system achieved Boolean operations and cutting functions with the main model by establishing fine grid cells of 5 cm × 5 cm × 10 cm in three-dimensional space [28]. Each grid cell is associated with a key time parameter (T), which accurately records the time of the entire process of pouring the mixture at the corresponding position. In addition, the system has preset a cold joint prevention threshold for the mixture to control the pouring plan of the mixture. By real-time matching the time parameters (T) of each unit with preset threshold intervals, different color attributes are assigned to grid cells based on different threshold intervals, achieving the development of a visualized overall structure pouring process time pouring system.
In order to accurately visualize the time pouring of the entire process of pouring the mixture, the mapping relationship between the coordinate system and the physical building coordinate system (WGS-84 coordinate system based on GNSS measurement) [29]. Due to the flat and layered pouring process, ensuring a constant pouring height (Z value) for each layer, alignment between the two coordinate systems can be achieved through only plane coordinate conversion.
Select at least two non-collinear control points in both the 3D model and the actual construction site, and record their plane coordinates in the two coordinate systems. Use the Helmholtz transform to calculate the coordinate system transformation parameters, as shown in Equation (15):
X i M Y i M = A B B A X i G Y i G + C D
where ( X i M , Y i M ) and ( X i G , Y i G ) respectively represent the coordinates of the i-th point in the three-dimensional model coordinate system and WGS84 coordinate system; A, B, and (C, D) represent the rotation angle, scaling parameter, and translation parameter of the coordinate system, respectively.
Based on the real-time coordinates (X, Y) of the mixed material landing point obtained in Section 2.4, after coordinate transformation, the system automatically constructs a three-dimensional pouring unit model with this point as the center. The specific implementation process is as follows: Firstly, based on the calculated fabric area AK in Section 2.4, the system determines the radius of the pouring area and generates a circular projection surface. Subsequently, it extends along the vertical direction according to the preset control height HD, forming a standardized cylindrical spatial unit. Each unit is matched in real time with the preset threshold interval of the system based on its pouring process time parameter T, and automatically assigned corresponding color attributes, as shown in Figure 19.
Taking the construction of concrete ship locks as an example, on-site construction workers can directly use the webpage to query the pouring time of the structure. The visualization system webpage and functions are shown in Figure 20. After loading a construction section model of the ship lock into the system, the system will cut the model. Each layer of the model consists of several units, and five different colors are used to represent the pouring time of units at different positions of the mixture. When the unit displays black, the concrete mixture has already set and requires cold joint treatment. When the unit displays red, the concrete mixture is about to set, and priority should be given to pouring and vibrating the next layer of concrete mixture. In the initial state, all units are set to a semi-transparent color, which can visually distinguish between areas that have not been poured and areas that have been poured. Construction workers can use the toolbar on the left to quickly view the fabric time and location of different units.

3.2.3. On-Site Application

To verify the applicability of the system in practical engineering environments, this study conducted comprehensive on-site performance testing. The test results show that the core algorithm modules of the system (including license plate recognition, spatial positioning, and volume calculation, etc.) can stably control the total processing time within the range of 45–55 s when completing the full process calculation from data collection to warning output. It is worth noting that the system has low hardware resource requirements and can operate stably on the construction site. These characteristics fully meet the low latency and high stability requirements for real-time monitoring systems in the concrete pouring process, confirming that the system has good practical application value and feasibility for promotion in various engineering sites.
Under the standard operating condition of an ambient temperature of 22 °C, the actual application effect of the ship lock test section (Figure 21) shows that the cold joint control model established by the system exhibits excellent construction control performance. Specifically, the pouring unit time in the core area is controlled within the optimal range of 30–120 min, and the pouring time in special structural areas (such as edge areas and around the collection well) is maintained within the safety threshold of 120–240 min. It is worth noting that there were no high-risk points exceeding the initial setting critical value of concrete (360 min) in the entire construction section, and the incidence of cold joint defects was zero. Specifically, the system collects real-time time data throughout the entire process, combined with a dynamic threshold warning mechanism, to ensure that each construction unit completes the process connection within the optimal time window, thereby avoiding the occurrence of cold joint defects.

4. Discussions

Although the developed mixture cold joint prevention and control system has demonstrated good convenience and accuracy in data collection and real-time monitoring, its practical application effect still highly relies on the standardized operation of construction personnel. The system requires workers to strictly follow the uniform layering process for pouring construction; only in this way can the accuracy of model positioning and the optimization of prevention and control effects be ensured. However, in practical engineering, due to the complex and ever-changing construction environment, relying solely on manual operation is difficult to ensure absolute construction uniformity. Therefore, future research will focus on optimizing the pouring position algorithm, further improving the system’s automatic monitoring ability for concrete coverage area and pouring uniformity, thereby reducing dependence on manual operation and achieving more accurate and reliable cold joint prevention and control.
This study calibrated the cold joint prevention and control threshold of three graded concrete under laboratory standard curing conditions, providing fundamental data for cold joint prevention and control. However, there are significant differences between the actual engineering environment and laboratory conditions. External factors such as temperature, wind speed, humidity, and changes in construction processes may affect the initial setting characteristics of concrete, thereby altering the critical threshold for cold joint formation. To enhance the engineering applicability of the cold joint prevention and control system, future research will focus on conducting concrete performance tests under multiple environmental conditions, systematically studying the influence of different environmental parameters on the initial setting time, and establishing a dynamic prediction model for cold joint prevention and control thresholds based on big data analysis to achieve refined pouring control in different construction environments, thereby ensuring the accuracy and reliability of prevention and control measures in practical engineering.

5. Conclusions

Controlling the pouring time of the mixture is a key step in improving the mechanical properties, chloride ion resistance, and avoiding cold joints of concrete. In order to solve the problem of cold joints in the mixture caused by subjective control of the pouring process parameters by workers, this paper developed a cold joint prevention and control system for the mixture. The following conclusions have been drawn regarding the acquisition algorithm and equipment for pouring process parameters, as well as the evaluation and visualization software in the system.
(1) By improving the YOLO11-LP model (integrating the C2SMM module and the WIoUv2 loss function), a license plate recognition system is established to obtain the license plate information and the supply time of the mixed material transport vehicle. At the same time, based on the structural characteristics of the belt conveyor, laser ranging technology, and GNSS-RTK positioning technology, an algorithm was proposed to determine the operating status of the belt conveyor, calculate the position and area of the mixed material, and record the pouring and compaction time.
(2) Developed a parameter acquisition device suitable for the entire process of mixing and pouring, collecting calculation parameters during the pouring process. These devices include license plate recognition systems, laser sensors, discharge outlets, and vibration head positioning devices. By combining acquisition algorithms, real-time acquisition and transmission of pouring process parameters can be achieved.
(3) Developed a cold joint prevention and control system for mixtures to obtain pouring process parameters at the construction site. The system is based on an energy-pouring process time calculation model to calculate the pouring time, and uses a visual model to provide feedback information based on the cold joint prevention threshold of the mixture to assist construction personnel in dynamically adjusting the pouring sequence. This not only significantly reduces the probability of cold joints but also improves the mechanical properties and durability of concrete, providing an innovative solution for quality control of large-scale projects.

Author Contributions

Conceptualization, L.H.; methodology, L.H. and L.Y.; software, L.H., Z.T. and L.Y.; validation, L.H.; formal analysis, L.H. and Z.T.; investigation, L.H., Z.T. and L.Y.; resources, L.H. and Z.T.; data curation, L.H., Z.T. and L.Y.; writing—original draft preparation, L.H. and Z.T.; writing—review and editing, L.H.; visualization, Z.T. and H.Q.; supervision, L.H. and H.Q.; project administration, L.H. and H.Q.; funding acquisition, L.H. All authors have read and agreed to the published version of the manuscript.

Funding

This work was funded by the Guangxi Major Science and Technology Project (Grant No. 2023AA14004).

Data Availability Statement

The data presented in this study are available on request from the corresponding author. The data are not publicly available due to privacy concerns.

Conflicts of Interest

Authors Liping He, Linjiang Yu, Huidong Qu were employed by the company CCCC Fourth Harbor Engineering Co., Ltd. The remaining authors declare that the research was conducted in the absence of any commercial or financial relationships that could be construed as a potential conflict of interest.

References

  1. Deng, H.; Fu, H.; Li, H.; Shi, Y.; Huang, Z. Fracture performance and fracture characteristics of concrete members with cold joints: Numerical simulation. Theor. Appl. Fract. Mech. 2023, 125, 103868. [Google Scholar] [CrossRef]
  2. Deng, H.; Fu, H.; Zhao, Y.B.; Shi, Y.; Huang, X. Using acoustic emission parameters to study damage and fracture characteristics of concrete with different pour intervals cold joints. Theor. Appl. Fract. Mech. 2022, 122, 103601. [Google Scholar] [CrossRef]
  3. Koh, T.H.; Kim, M.K.; Yang, K.H.; Yoon, Y.S.; Kwon, S.J. Service life evaluation of RC T-girder under carbonation considering cold joint and loading effects. Constr. Build. Mater. 2019, 226, 106–116. [Google Scholar] [CrossRef]
  4. Wang, X.Y.; Dong, S.F.; Ashour, A.; Han, B.G. Bond of nanoinclusions reinforced concrete with old concrete: Strength, reinforcing mechanisms and prediction model. Constr. Build. Mater. 2021, 283, 122741. [Google Scholar] [CrossRef]
  5. Yang, H.M.; Lee, H.S.; Yang, K.H.; Ismail, M.A.; Kwon, S.J. Time and cold joint effect on chloride diffusion in concrete containing GGBFS under various loading conditions. Constr. Build. Mater. 2018, 167, 739–748. [Google Scholar] [CrossRef]
  6. Oh, K.S.; Mun, J.M.; Kwon, S.J. Chloride Diffusion Coefficients in Cold Joint Concrete with GGBFS. J. Korea Inst. Struct. Maint. Insp. 2016, 20, 44–49. [Google Scholar] [CrossRef]
  7. Feng, P.; Bullard, J.W.; Miao, C. A model of phase stability, microstructure and properties during leaching of portland cement binders. Cem. Concr. Compos. 2014, 49, 9–19. [Google Scholar] [CrossRef]
  8. Men, B.; Qin, Y.; Zhang, X.W.; Wu, J.J.; Liang, D.; Li, M.; Zhou, H. Investigation on the change of shear strength of concrete with cold joint under the action of sulfate dry–wet cycles. J. Build. Eng. 2023, 73, 106770. [Google Scholar] [CrossRef]
  9. Fu, H.L.; Deng, H.S.; Zhang, J.B.; Shi, Y.; Huang, X.Q. Experimental analysis of influence of pouring interval on fracture performance of concrete structures with cold joints. Theor. Appl. Fract. Mech. 2022, 118, 103289. [Google Scholar] [CrossRef]
  10. Zhao, C.Y.; Lei, M.F.; Jia, C.J.; Liu, J.; Zhang, Y.; Cui, Z.D.; Lu, G.Y. Effects of cold joints on concrete mechanical properties and tunnel service performance. Struct. Concr. 2025. [Google Scholar] [CrossRef]
  11. Ji, W.Z.; Qin, Y.; Zhang, X.W.; Zhou, H.; Liang, D. Degradation mechanisms of concrete cold joint surfaces under sulfate cycles and varying pouring intervals. J. Build. Eng. 2024, 86, 108882. [Google Scholar] [CrossRef]
  12. Li, Q.B.; Ma, R.; Hu, Y.; Huang, F.Z.H.; Shen, Y.Y.; Zhou, S.W.; Ma, J.G.; An, Z.Z.; Guo, G.W. A review of intelligent dam construction techniques. J. Tsinghua Univ. (Sci. Technol.) 2022, 62, 1252–1269. [Google Scholar]
  13. Glaser, S.D.; Shoureshi, R.A.; Pescovitz, D. Frontiers in sensors and sensing systems. Smart Struct. Syst. 2005, 1, 103–120. [Google Scholar] [CrossRef]
  14. Tian, Z.H.; Sun, X.; Su, W.H.; Li, D.X.; Yang, B.; Bian, C.; Wu, J. Development of real-time visual monitoring system for vibration effects on fresh concrete. Autom. Constr. 2018, 98, 61–71. [Google Scholar] [CrossRef]
  15. Zhong, D.H.; Li, X.C.; Cui, B.; Wu, B.P.; Liu, Y.X. Technology and application of real-time compaction quality monitoring for earth-rockfill dam construction in deep narrow valley. Autom. Constr. 2018, 90, 23–38. [Google Scholar] [CrossRef]
  16. Liu, D.H.; Li, Z.L.; Lian, Z.H. Compaction quality assessment of earth-rock dam materials using roller-integrated compaction monitoring technology. Autom. Constr. 2014, 44, 234–246. [Google Scholar] [CrossRef]
  17. Pehlivan, H. Identification of structural displacements utilizing concurrent robotic total station and GNSS measurements. Smart Struct. Syst. 2022, 30, 411–420. [Google Scholar]
  18. Liu, D.H.; Li, X.; Chen, J.J.; Jin, R. Real-Time Optimization of Precast Concrete Component Transportation and Storage. Adv. Civ. Eng. 2020, 2020, 5714910. [Google Scholar] [CrossRef]
  19. Liu, L.; Cao, G.D.; Shi, Y.H.; Jiang, S.Q.; Deng, D.Q. Effect of time-dependence on the concrete transportation process. Powder Technol. 2024, 437, 119535. [Google Scholar] [CrossRef]
  20. Zhong, Z.Q.; Zhao, S.X.; Xia, J.; Luo, Q.R.; Zhou, Q.L.; Yang, S.H.; He, F.; Yao, Y. Regression prediction model for shear strength of cold joint in concrete. Structures 2024, 68, 107168. [Google Scholar] [CrossRef]
  21. Deng, H.S.; Fu, H.L.; Wu, Y.M.; Zhao, Y.B.; Cao, G.Q.; Feng, W. Lining cold joint defect formation mechanism and pouring interval judgement method. J. Build. Eng. 2025, 104, 112403. [Google Scholar] [CrossRef]
  22. Plataniotis, A.N.; Venetsanopoulos, A.N. Color Image Processing and Applications; Springer: Berlin/Heidelberg, Germany, 2000. [Google Scholar]
  23. Davix, X.A.; Christopher, S.C.; Judson, D. Detection of the vehicle license plate using a kernel density with default search radius algorithm filter. Optik 2020, 218, 164689. [Google Scholar] [CrossRef]
  24. Zhou, H.Y.; Xia, H.F.; Fan, C.L.; Lan, T.X.; Liu, Y.; Yang, Y.T.; Shen, Y.X.; Yu, W. Intelligent Detection Method for Surface Defects of Particleboard Based on Super-Resolution Reconstruction. Forests 2024, 15, 2196. [Google Scholar] [CrossRef]
  25. Zhu, R.Z.; He, Q.Y.; Jin, H.; Han, Y.; Jiang, K.J. License Plate Detection Based on Improved YOLOv8n Network. Electronics 2025, 14, 2065. [Google Scholar] [CrossRef]
  26. Huang, Y.; Wang, D.; Wu, B.; An, D. NST-YOLO11: ViT Merged Model with Neuron Attention for Arbitrary-Oriented Ship Detection in SAR Images. Remote Sens. 2024, 16, 4760. [Google Scholar] [CrossRef]
  27. Li, J.J.; Tian, Z.H.; Sun, X.; Ma, Y.S.; Liu, H.R.; Lu, H. Modeling vibration energy transfer of fresh concrete and energy distribution visualization system. Constr. Build. Mater. 2022, 354, 129210. [Google Scholar] [CrossRef]
  28. Zhang, X.Y.; Gracanin, D. An approach to WebGL based distributed virtual environments. In Proceedings of the 18th International ACM Symposium on 3D Web Technologies, San Sebastian, Spain, 20 June 2013. [Google Scholar]
  29. Liu, J.C.; Xu, W.; Jiang, T.; Han, X.F. Development of an Attitude Transformation Method From the Navigation Coordinate System to the Projection Coordinate System. IEEE Geosci. Remote Sens. Lett. 2020, 17, 1318–1322. [Google Scholar] [CrossRef]
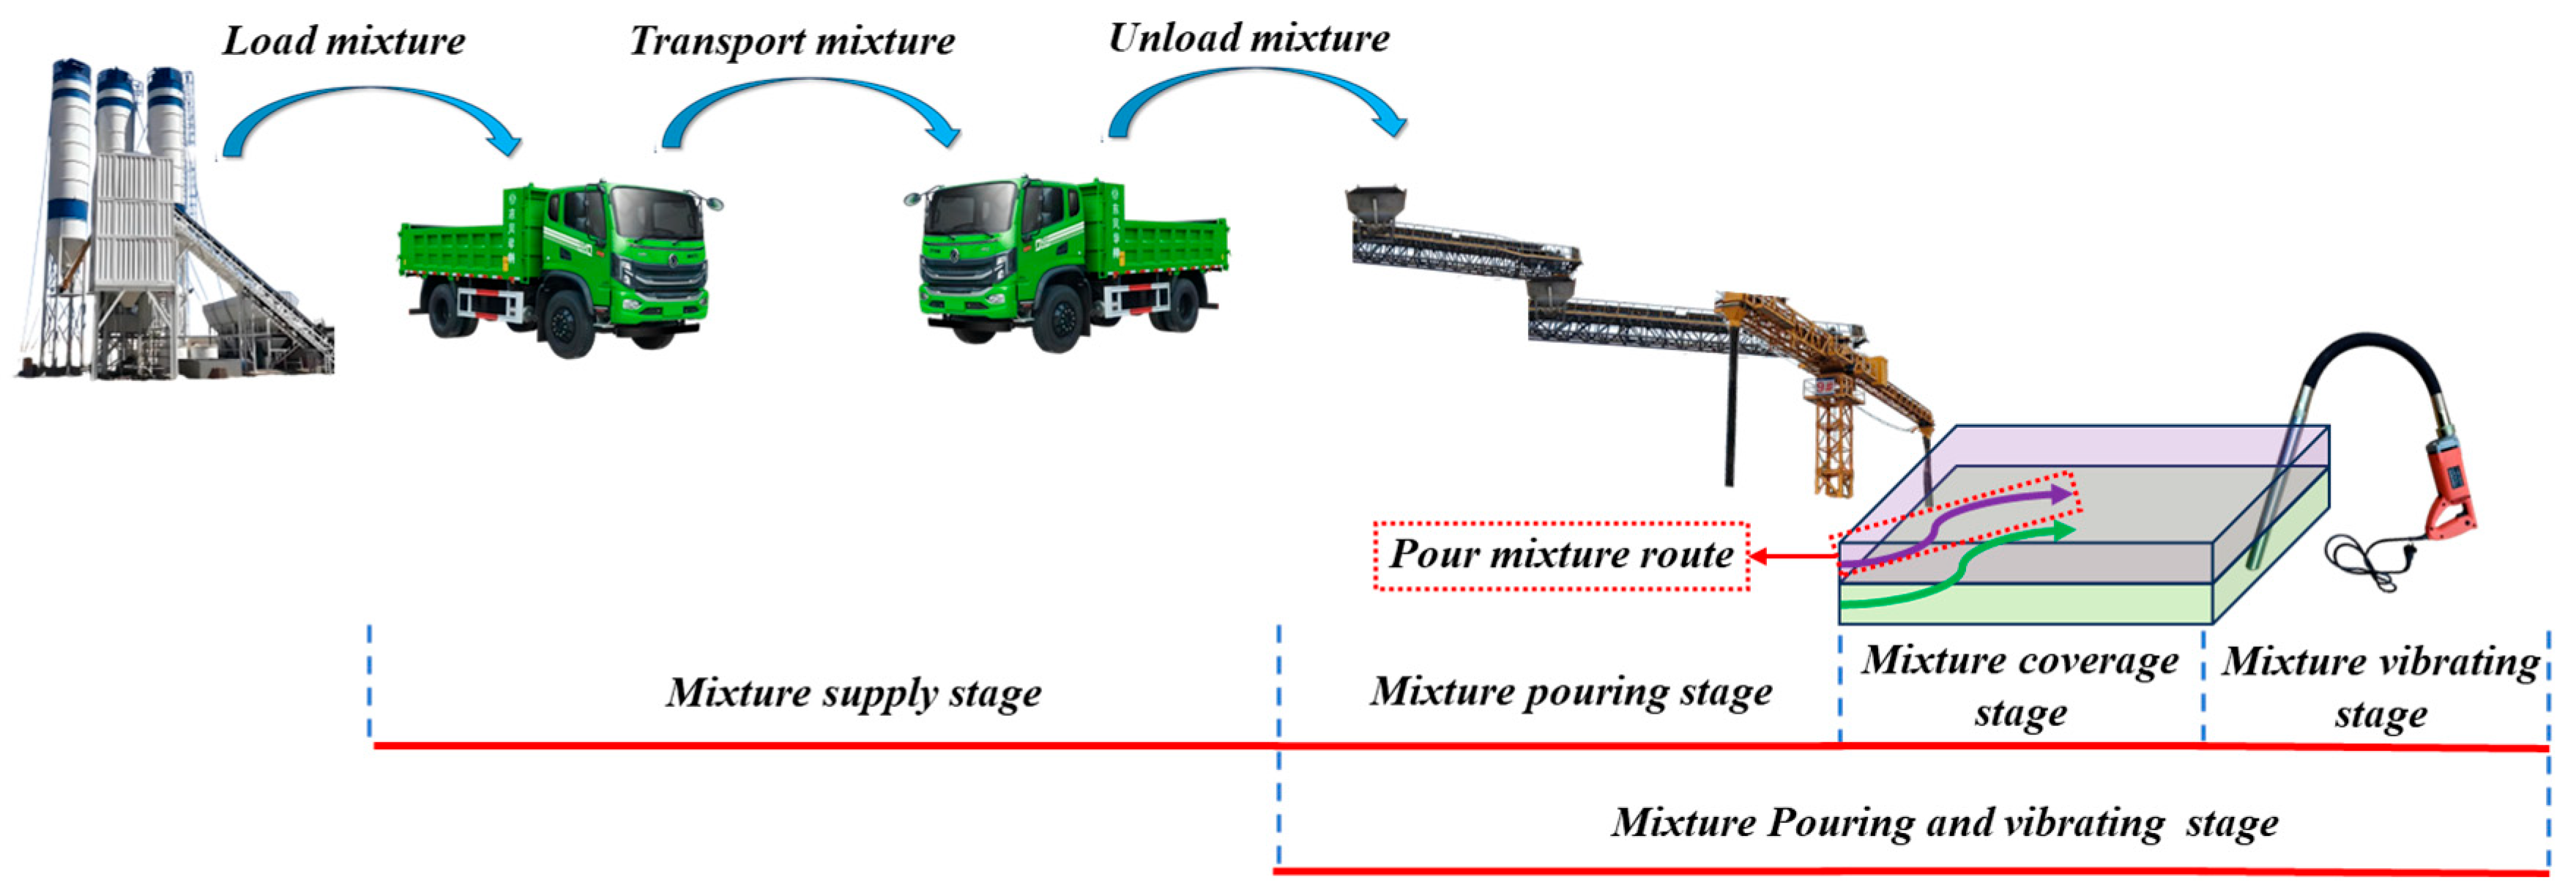
Figure 1. Pouring process of the concrete mixture.
Buildings 15 03096 g001
Figure 2. Collection process of the supply time.
Buildings 15 03096 g002
Figure 3. Model Architecture of YOLO11-LP.
Buildings 15 03096 g003
Figure 4. Network architecture of the C2PSS module and the SEAM module.
Buildings 15 03096 g004
Figure 5. Schematic diagram of WIoUv2-related parameters.
Buildings 15 03096 g005
Figure 6. License Plate Recognition System.
Buildings 15 03096 g006
Figure 7. Precision, recall, and mAP results of different YOLO models.
Buildings 15 03096 g007
Figure 8. Positioning device for the pouring and vibrating stage of the mixture.
Buildings 15 03096 g008
Figure 9. Pouring positioning device.
Buildings 15 03096 g009
Figure 10. Mixture volume testing test.
Buildings 15 03096 g010
Figure 11. Threshold judgment of mixture.
Buildings 15 03096 g011
Figure 12. Relationship between the correction coefficient k and the height h detected by the laser sensor.
Buildings 15 03096 g012
Figure 13. Equipment and principle for collecting pouring area position data.
Buildings 15 03096 g013
Figure 14. Time acquisition equipment and principle for the entire pouring process.
Buildings 15 03096 g014
Figure 15. Particle size pouring of Fine aggregate and Coarse aggregate.
Buildings 15 03096 g015
Figure 16. Analysis of the correlation between the interval time and the performance of the pouring layer of the mixture.
Buildings 15 03096 g016
Figure 17. Performance decay curve of concrete at different pouring intervals.
Buildings 15 03096 g017
Figure 18. Calibration interval for the cold joint threshold of the mixture. (a) Relationship between splitting strength and interval time; (b) Relationship between chloride ion diffusion coefficient and interval time.
Buildings 15 03096 g018aBuildings 15 03096 g018b
Figure 19. Visual Process Diagram.
Buildings 15 03096 g019
Figure 20. Visualization system webpage and functions.
Buildings 15 03096 g020
Figure 21. Cold joint control model after pouring completion.
Buildings 15 03096 g021
Table 1. Test specimens.
SpecimenPouring
Interval (h)
StageSizeTest Method
T0-10Normal150 × 150 × 150Mechanical properties
T0-2Φ100 × 50chloride-ion penetration resistance
T0.5-10.5Initial setting150 × 150 × 150Mechanical properties
T0.5-2Φ100 × 50chloride-ion penetration resistance
T2-12150 × 150 × 150Mechanical properties
T2-2Φ100 × 50chloride-ion penetration resistance
T4-14150 × 150 × 150Mechanical properties
T4-2Φ100 × 50chloride-ion penetration resistance
T6-16After initial setting150 × 150 × 150Mechanical properties
T6-2Φ100 × 50chloride-ion penetration resistance
Table 2. Mix proportion of concrete specimens (kg/m3).
GradeMix Proportion(kg/m3)
CementFly AshMineral PowderCPAFine AggregateCoarse AggregateWaterWater Reducer
C3014156562876413571184.5
Table 3. Test result.
Interval Time (S)Split Tensile Strength (MPa)Compressive Strength (MPa)Chloride Ion Diffusion Coefficient (MPa)
04.1658.611.2
0.54.0259.211.3106
23.9558.312.7874
43.8958.114.1293
63.7358.218.1041
Table 4. Correlation analysis parameters between different variables and the interval time.
VariableCorrelation Coefficient (r)p-Value95% CIInterpretation
Compressive strength−0.720.169[−0.98, 0.443]No significant correlation
Split tensile strength−0.960.01[−0.997, −0.505]Significant negative correlation
Chloride ion diffusion coefficient0.970.006[0.619, 0.998]Significant positive correlation
Disclaimer/Publisher’s Note: The statements, opinions and data contained in all publications are solely those of the individual author(s) and contributor(s) and not of MDPI and/or the editor(s). MDPI and/or the editor(s) disclaim responsibility for any injury to people or property resulting from any ideas, methods, instructions or products referred to in the content.