Article

Research on Seismic Performance of Assembled Steel–Concrete Composite Joints in the Top Layer of Subway Station Under High Axial Compression Ratio

1
School of Architecture and Civil Engineering, Xi’an University of Science and Technology, Xi’an 710054, China
2
PowerChina Northwest Engineering Corporation Limited, Xi’an 710065, China
*
Author to whom correspondence should be addressed.
Buildings 2025, 15(17), 3083; https://doi.org/10.3390/buildings15173083
Submission received: 24 July 2025 / Revised: 20 August 2025 / Accepted: 26 August 2025 / Published: 28 August 2025
(This article belongs to the Section Building Structures)

Abstract

In view of the adverse effect of the failure mode of the “strong beam and weak column” at the top-layer joint of subway stations on structural seismic performance under high axial compression ratio, a novel assembled steel–concrete composite (ASCC) beam–column joint for the top-layer is proposed in this paper, and its seismic performance is studied through cyclic loading tests and finite element analysis. The findings indicate that, in comparison to the reinforced concrete joint, the yield bearing capacity, ultimate bearing capacity, and ductility of the ASCC joint exhibit increases of approximately 46%, 13% and 40%, respectively, demonstrating superior seismic performance and a “strong column and weak beam” failure mode of the ASCC joint. The impact of parameters including the steel tube thickness, length of the lower steel tube, high axial compression ratio, and bolt quantity on the seismic performance of ASCC joints was further examined using a validated finite element model. Parametric investigations reveal that the ASCC joints with greater steel tube thickness, longer length of lower steel tube, and more bolts demonstrate significant improvements in load-bearing capacity, lateral displacement resistance, and energy dissipation capacity. A value of 0.80 can be recommended as the new high axial compression ratio upper limit of the current code. It is suggested that under the proposed new high axial compression ratio upper limit, the steel tube thickness should be 1–2% of the column diameter, while the length of the lower steel tube should be 1/3 of the length of the lower column, with more bolts restricting the deformation of the extended plates as the design and construction of joints better suit practical engineering applications.

1. Introduction

Rapid development in subway construction has coincided with the ongoing expansion of urban developments. Due to its benefits of rapidity, timeliness, security, comfort, and substantial capacity, it occupies a significant position in urban transit [1,2]. In recent years, people often refer to the design method of aboveground structures or perceive subway stations as underground structures, which exhibit superior seismic performance compared to aboveground structures, without accounting for seismic design in the seismic design process of subway stations. However, since the 1995 Kobe earthquake inflicted significant damage on Dakai Station, the seismic performance of subway stations has garnered increasing interest [3,4,5]. During an earthquake, the top-layer joint initially bends and sustains damage, creating a plastic hinge. Consequently, the majority of the weight from the overlying soil on the top plate is transferred to the middle column, leading to an excessive axial compression ratio in the column. Finally, the top beam–column joints are compromised, resulting in partial collapse of the subway station [6,7]. Therefore, the joint subjected to seismic activity is typically the most susceptible element within the entire structural system [8,9]; while evaluating the seismic performance of subway station, particular emphasis should be placed on the seismic performance of top-layer joints.
The damage from multiple earthquakes indicates that the failure of joints frequently leads to the destruction of the whole structure. By analyzing the failure mechanism of Dakai Station, it was found that the design of the middle column of Dakai Station is weak, and the section size is small, which leads to the failure of the top-layer joint in the process of earthquake damage, and the “strong beam and weak column” is formed. Recent research on assembled joints in subway stations has primarily concentrated on the seismic behavior and design methods of middle-layer joints in China. Liu et al. [10,11] investigated the assembled concrete subway station, conducting experiment on the seismic performance of essential joints. This study offers a valuable reference for seismic design, which reveals that assembled composite joints can markedly enhance the seismic behavior of subway stations. In contrast to conventional joints, top-layer joints exhibit increased complexity owing to the unique structural design characterized by the “strong beam and weak column” approach. The current study on the seismic performance of top-layer joints remains insufficient and fails to align with the design principle of “strong beam and weak column”, as stipulated in the existing code.
Studying the connection form and seismic performance of joints to develop new beam–column joints, so that the structure can be transformed from “strong beam and weak column” to “strong column and weak beam” [12,13,14], is critical. Currently, numerous scholars have suggested employing bolted connections as a novel form of assembled composite joints, featuring bolted hole connection structures or steel composite structures, to enhance the ductility and deformation resistance of the joints [15,16,17]. Kazemi et al. [18] investigated the mechanical properties of concrete-timber-filled steel tubes (CTFST) based on the ensemble machine learning models, facilitating the prediction of essential design curves. Through experiments and finite element simulation, Koloo et al. [19] studied the influence of geometric size and connection configuration on the performance of concrete-filled steel tube (CFST) joints and understood the key parameters affecting the performance of CFST joints under reversed cyclic loading. Ding et al. [20,21,22,23] introduced a precast concrete beam–column joint with bolt connection, demonstrating effective seismic behavior and energy dissipation capacity. Liu et al. [24] enhanced this approach, demonstrating that the revised bolted assembled joints exhibit favorable assembly efficiency and post-disaster repair rates. Qu [25] and Rong et al. [26] introduced a novel assembly joint connected by CFST column and H-shaped steel beam, which satisfied the relevant design criteria and seismic provisions by analyzing the seismic performance. Khador et al. [27] performed a quasi-static test on the joints of CFST columns and outer diaphragm H-shaped steel beams. The findings indicated that decreasing the preload of the bolt would cause the slip of the connection to surpass the operational limit of the joint but simultaneously enhancing the energy dissipation. Li and Han [28,29,30] investigated the seismic behavior of composite joint connected by CFST column and steel beam under cyclic loading, which exhibited favorable seismic performance. Zhu et al. [31] introduced a new self-centering CFST column joint to steel beams, which maintained effective reset capability and energy dissipation capacity, demonstrating both reasonableness and feasibility by experiment and numerical simulation. Therefore, when considering the seismic design of subway stations, through the rational use of assembled composite joints, the seismic design and seismic performance of assembled top-layer joints of subway stations are studied and analyzed, which can provide ideas for exploring ways to improve the seismic design of subway stations and improve the seismic performance of subway stations.
This study focuses on the context of a subway station in Xi’an, integrating the structural configuration of the beam–slab–column joints associated with the project. Cyclic loading tests were conducted on the “strong beam and weak column” top-layer joints to investigate the seismic performance of these joints. The finite element method was employed to simulate and analyze the seismic performance of ASCC joints, considering various steel tube thicknesses and the lengths of lower steel tube.

2. Materials and Methods Experimental Programs

2.1. Specimen Design

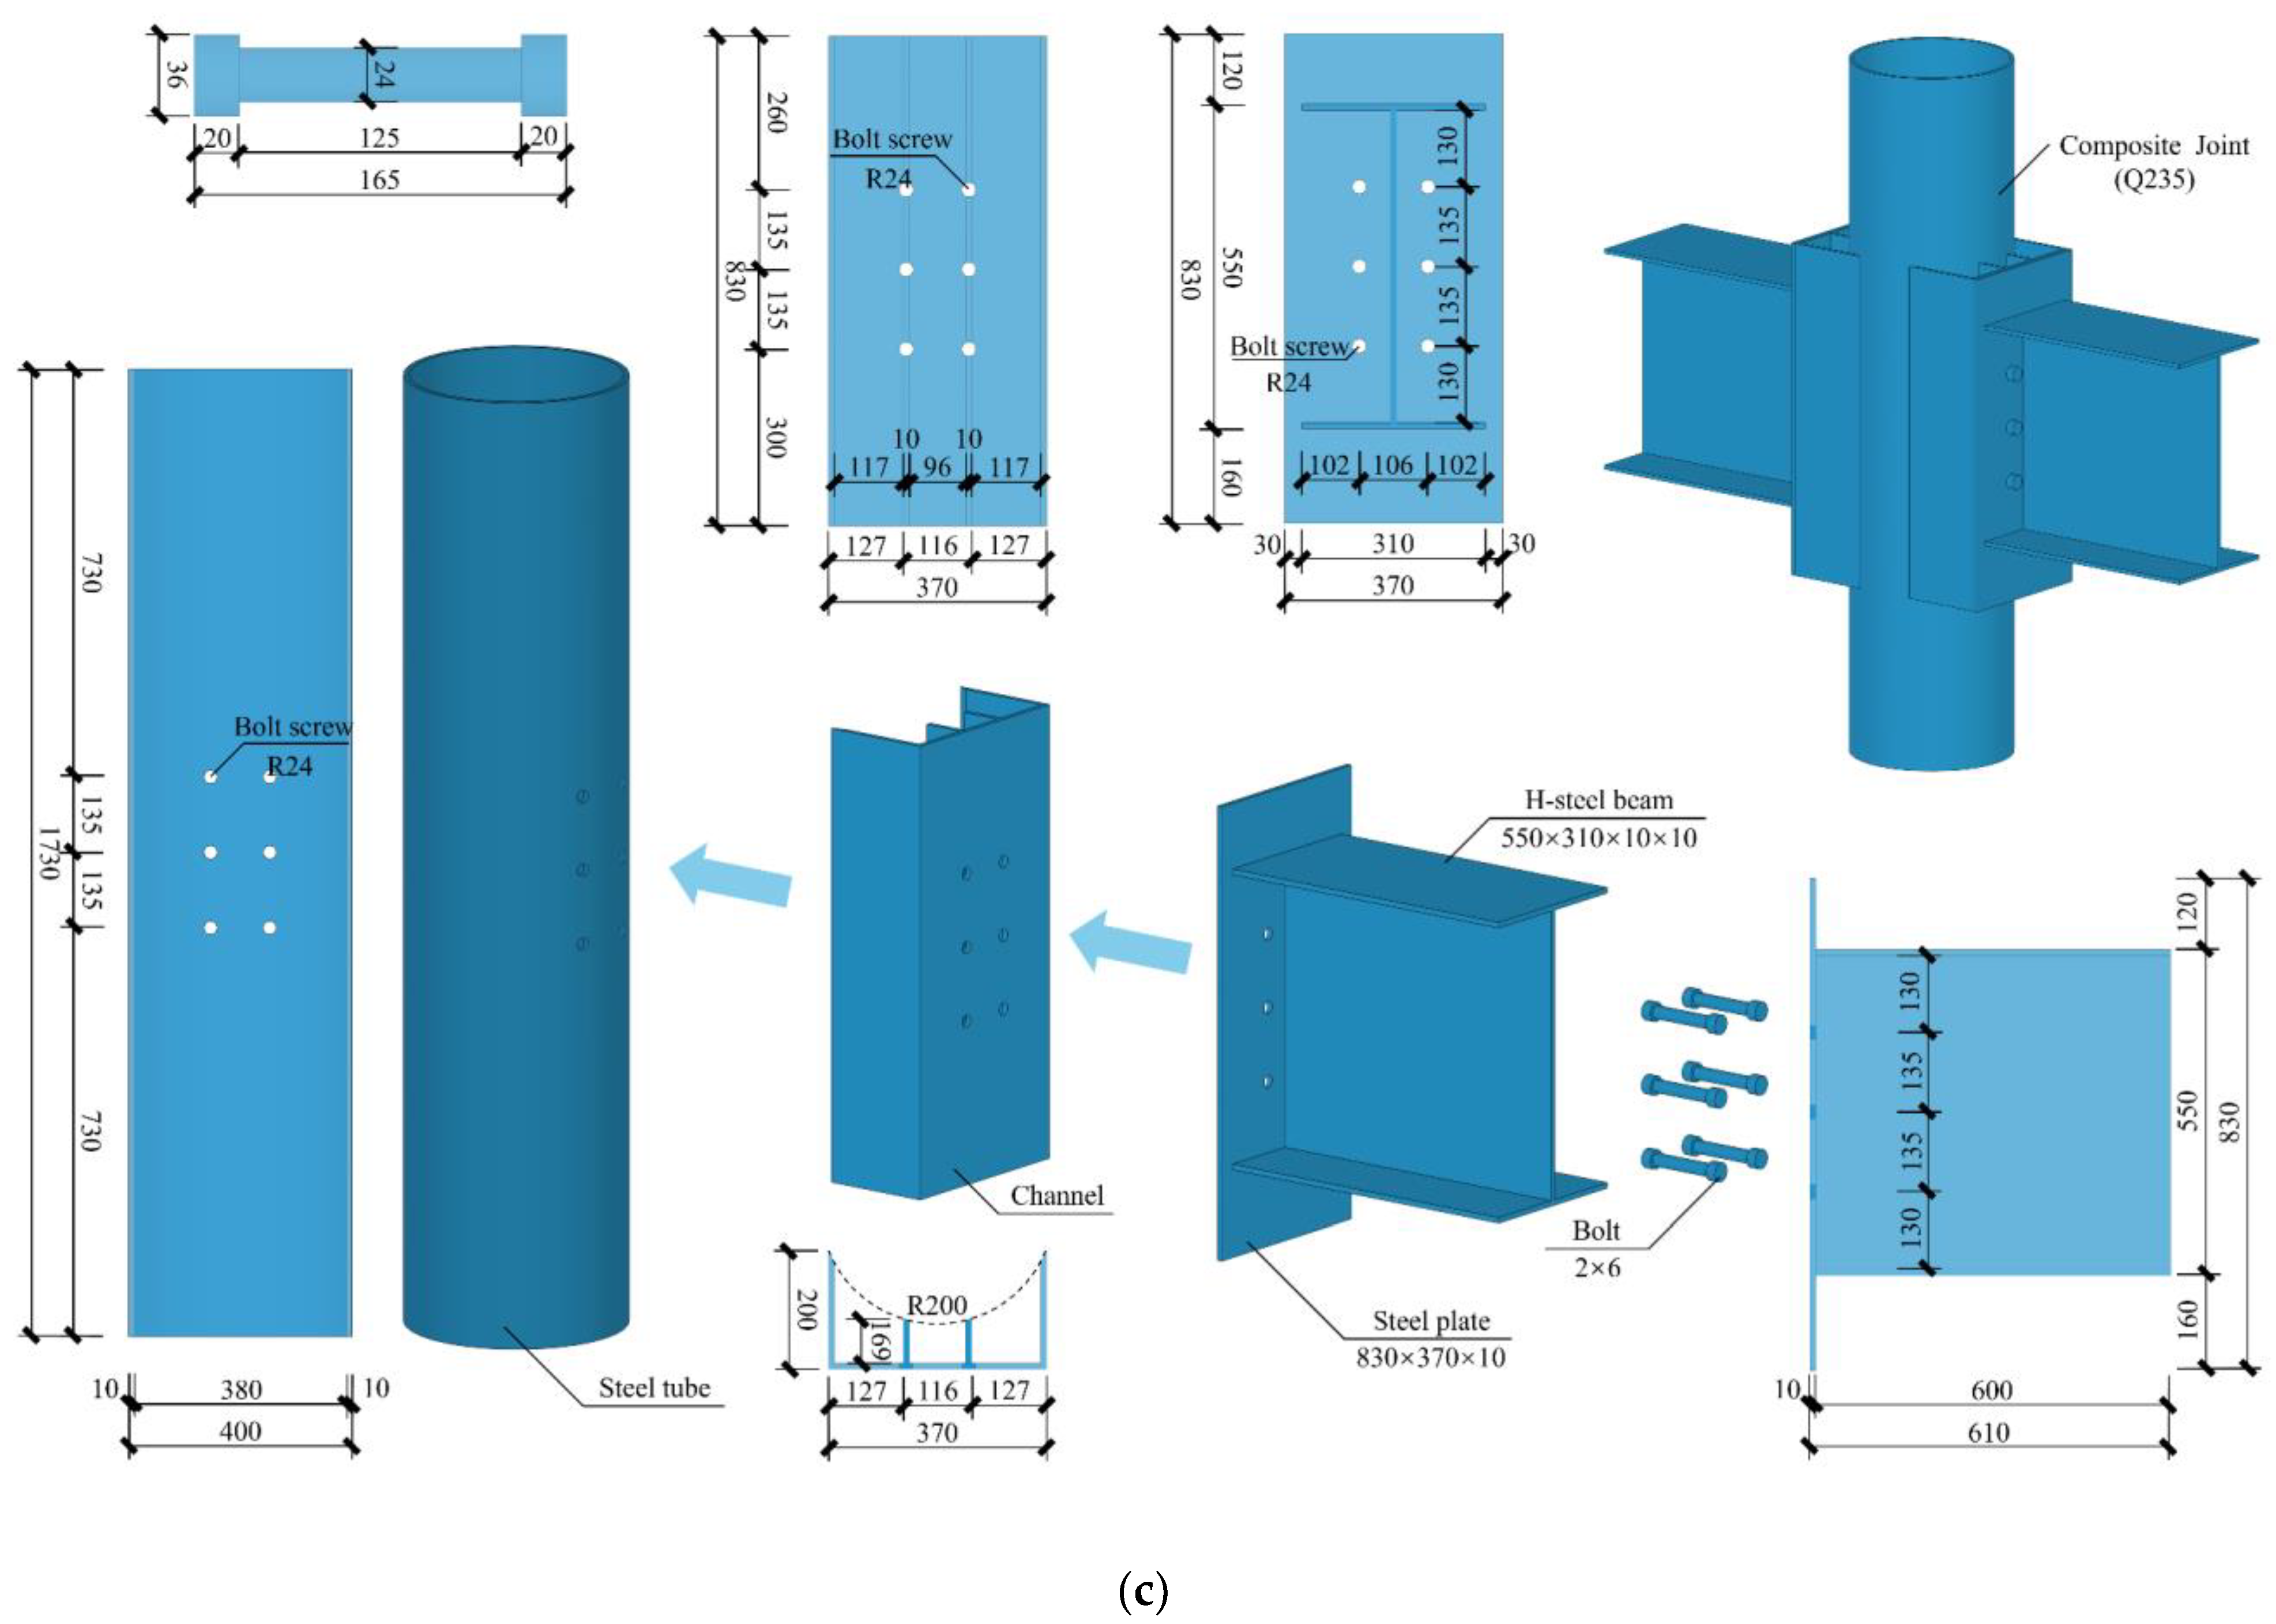
Two 1/3 scale beam–slab–column top-layer joints including reinforced concrete frame joint (TLJ-1) and assembled steel–concrete composite (ASCC) joint (TLJ-2) are designed in accordance with the Chinese codes [32] and experimentally tested under a constant axial load and a cyclically reversed load. To authentically reflect the seismic performance of joints of the prototype structure, the scale specimens ensured that the corresponding joints of the prototype structure have the same axial compression ratio, reinforcement ratio and the same bending capacity ratio of column and beam (Mcu/Mbu) in the section design process, and meet the requirements of the anchorage structure of the reinforcements in the two joints. The dimensions and reinforcement details of TLJ-1 and TLJ-2 are presented in Figure 1a,b and Table 1. In the experiment, TLJ-1 represented the beam–slab–column joint with an identical reinforcement ratio to the station prototype. The concrete column has a height of 2480 mm, and the diameter of the column section is 400 mm. The cross-section of inverted T-shaped concrete beam is 400 mm × 730 mm with the 330 mm thickness of slab. TLJ-2 was the ASCC joint using a circular CFST column and steel members joined by using high-strength grade bolts with a preload of 225 kN. The detailed dimensions are shown in Figure 1c.
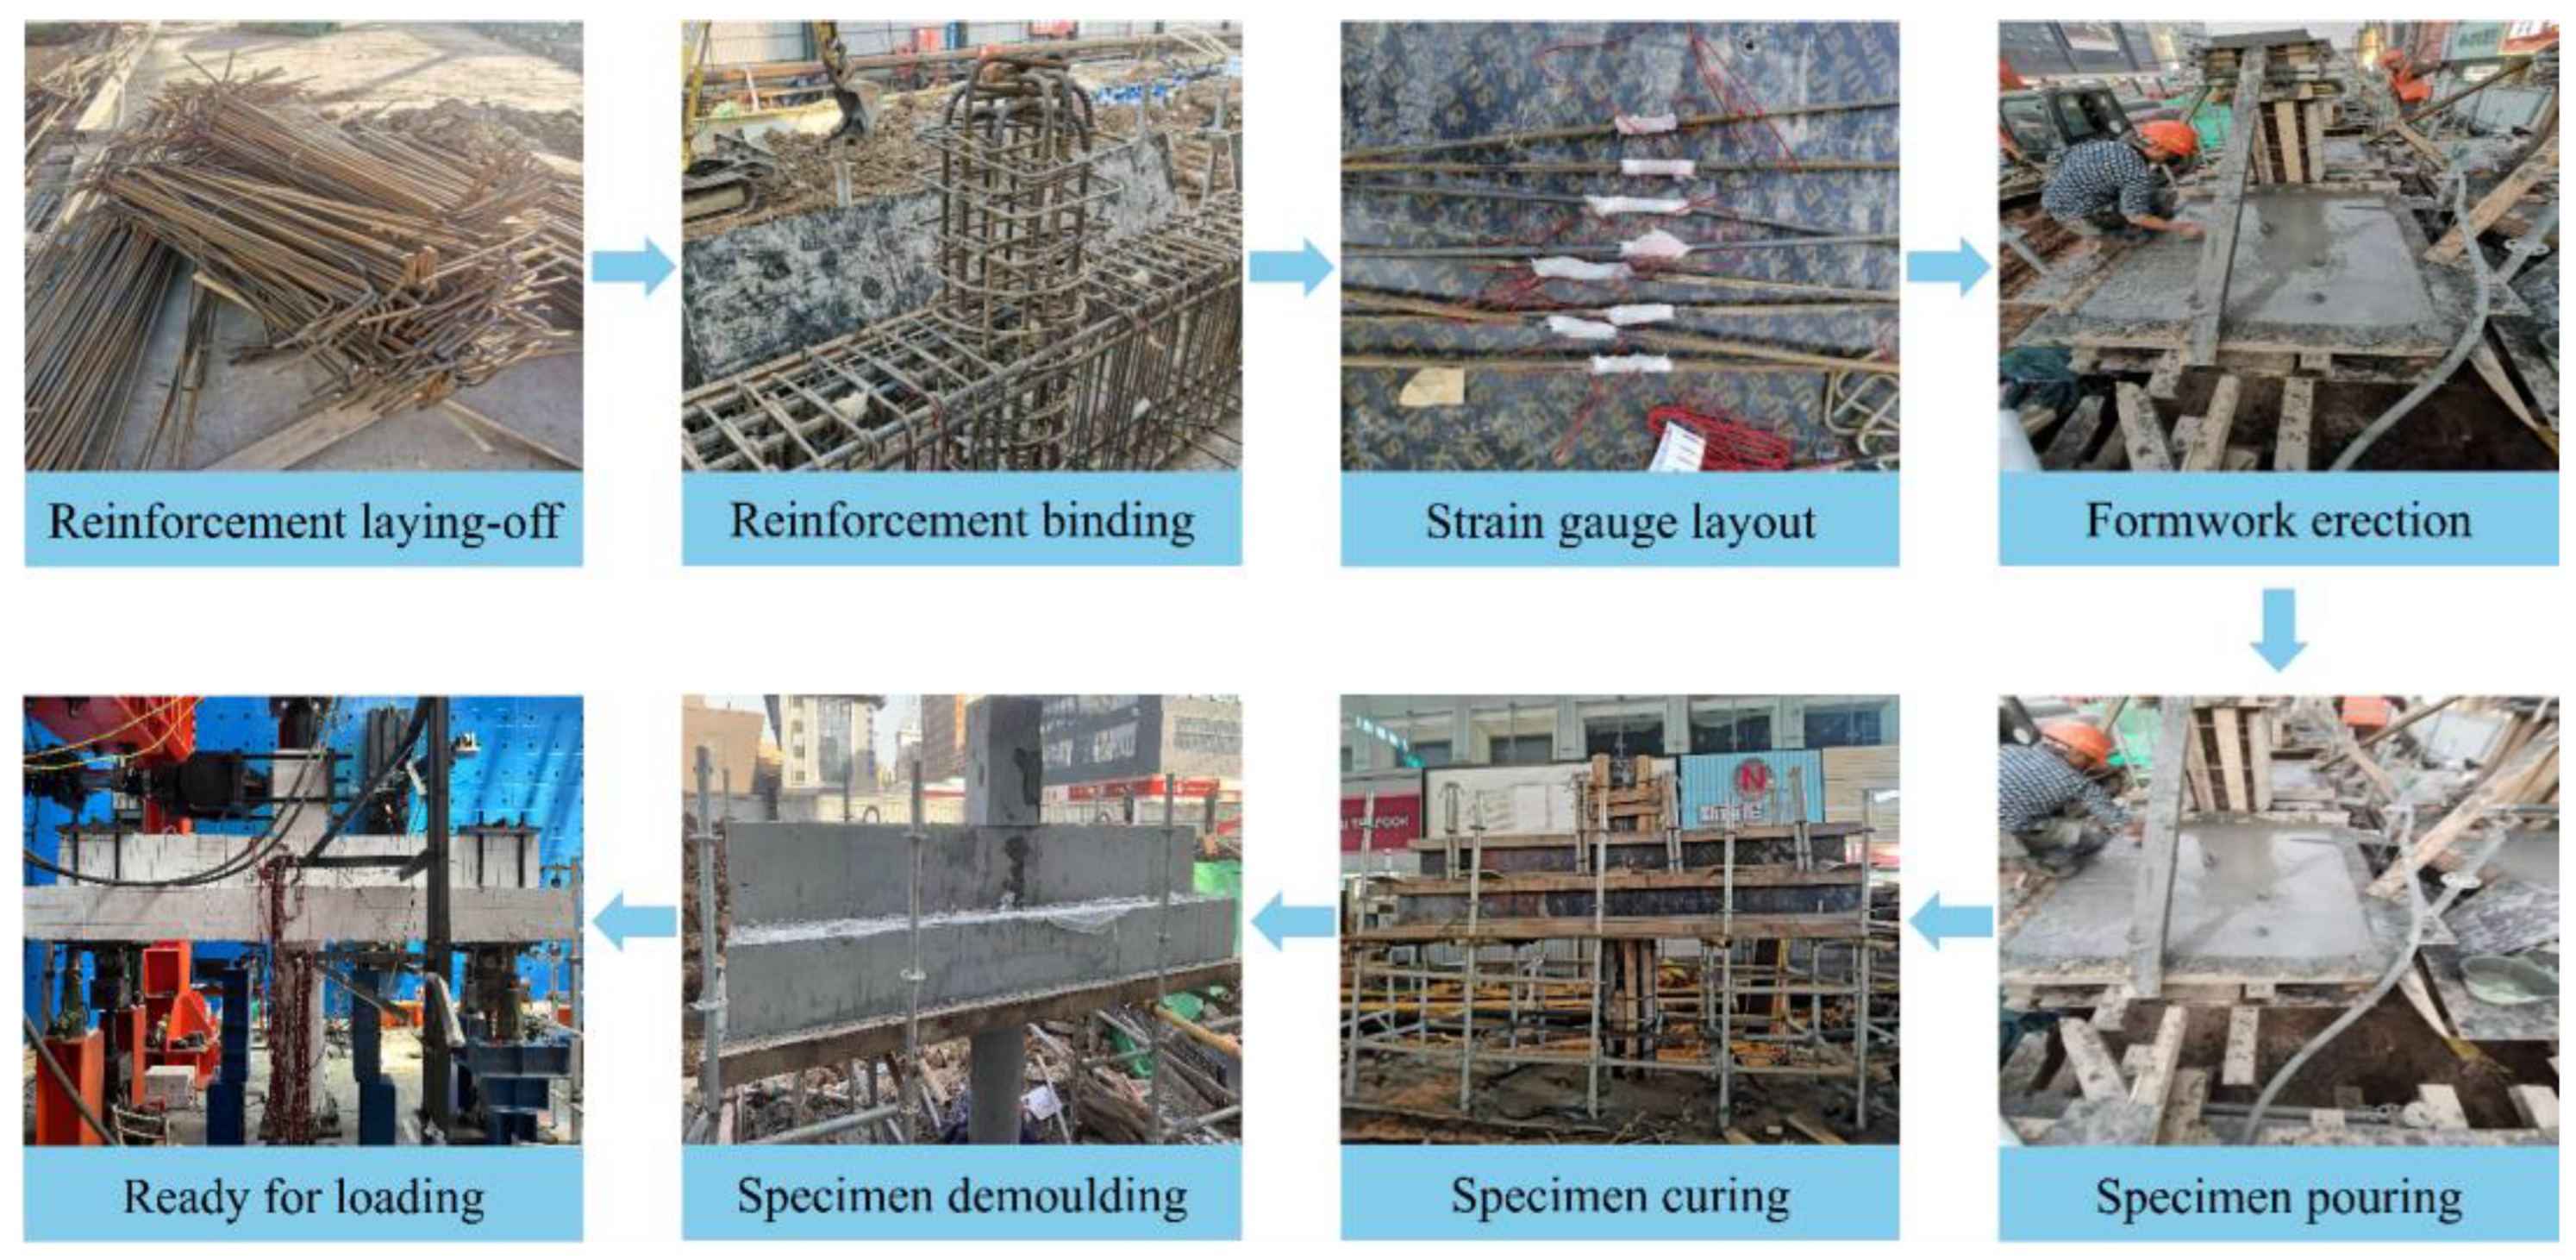
The specimen fabrication process, as illustrated in Figure 2, comprised four principal stages. First, steel reinforcements were cut and shaped, then the assembly of reinforcement cages was carried out with integrated strain gauge installation. After the template was built and the concrete was poured, finally the specimen was maintained.

2.2. Material Properties

Typically, column damage can significantly compromise the integrity of the entire structural system. Compared to beams, columns require higher bearing capacity. Consequently, based on the actual situation of the subway station, beams of specimen TLJ-1 and TLJ-2 were constructed using C35 concrete, while columns were made of C50 concrete in strict adherence to the specifications [33,34]. The interfacial zone between precast components and post-poured concrete was intentionally textured with surface roughening treatment to enhance bond strength. The bolts were high-strength grade 10.9 bolts. Reinforcement was implemented using HRB400 steel for reinforcing bars and HPB300 for stirrups, with steel components fabricated from Q235B steel. Detailed material property characteristics are comprehensively presented in Table 2 and Table 3 [35].

2.3. Experimental Device and Loading Scheme

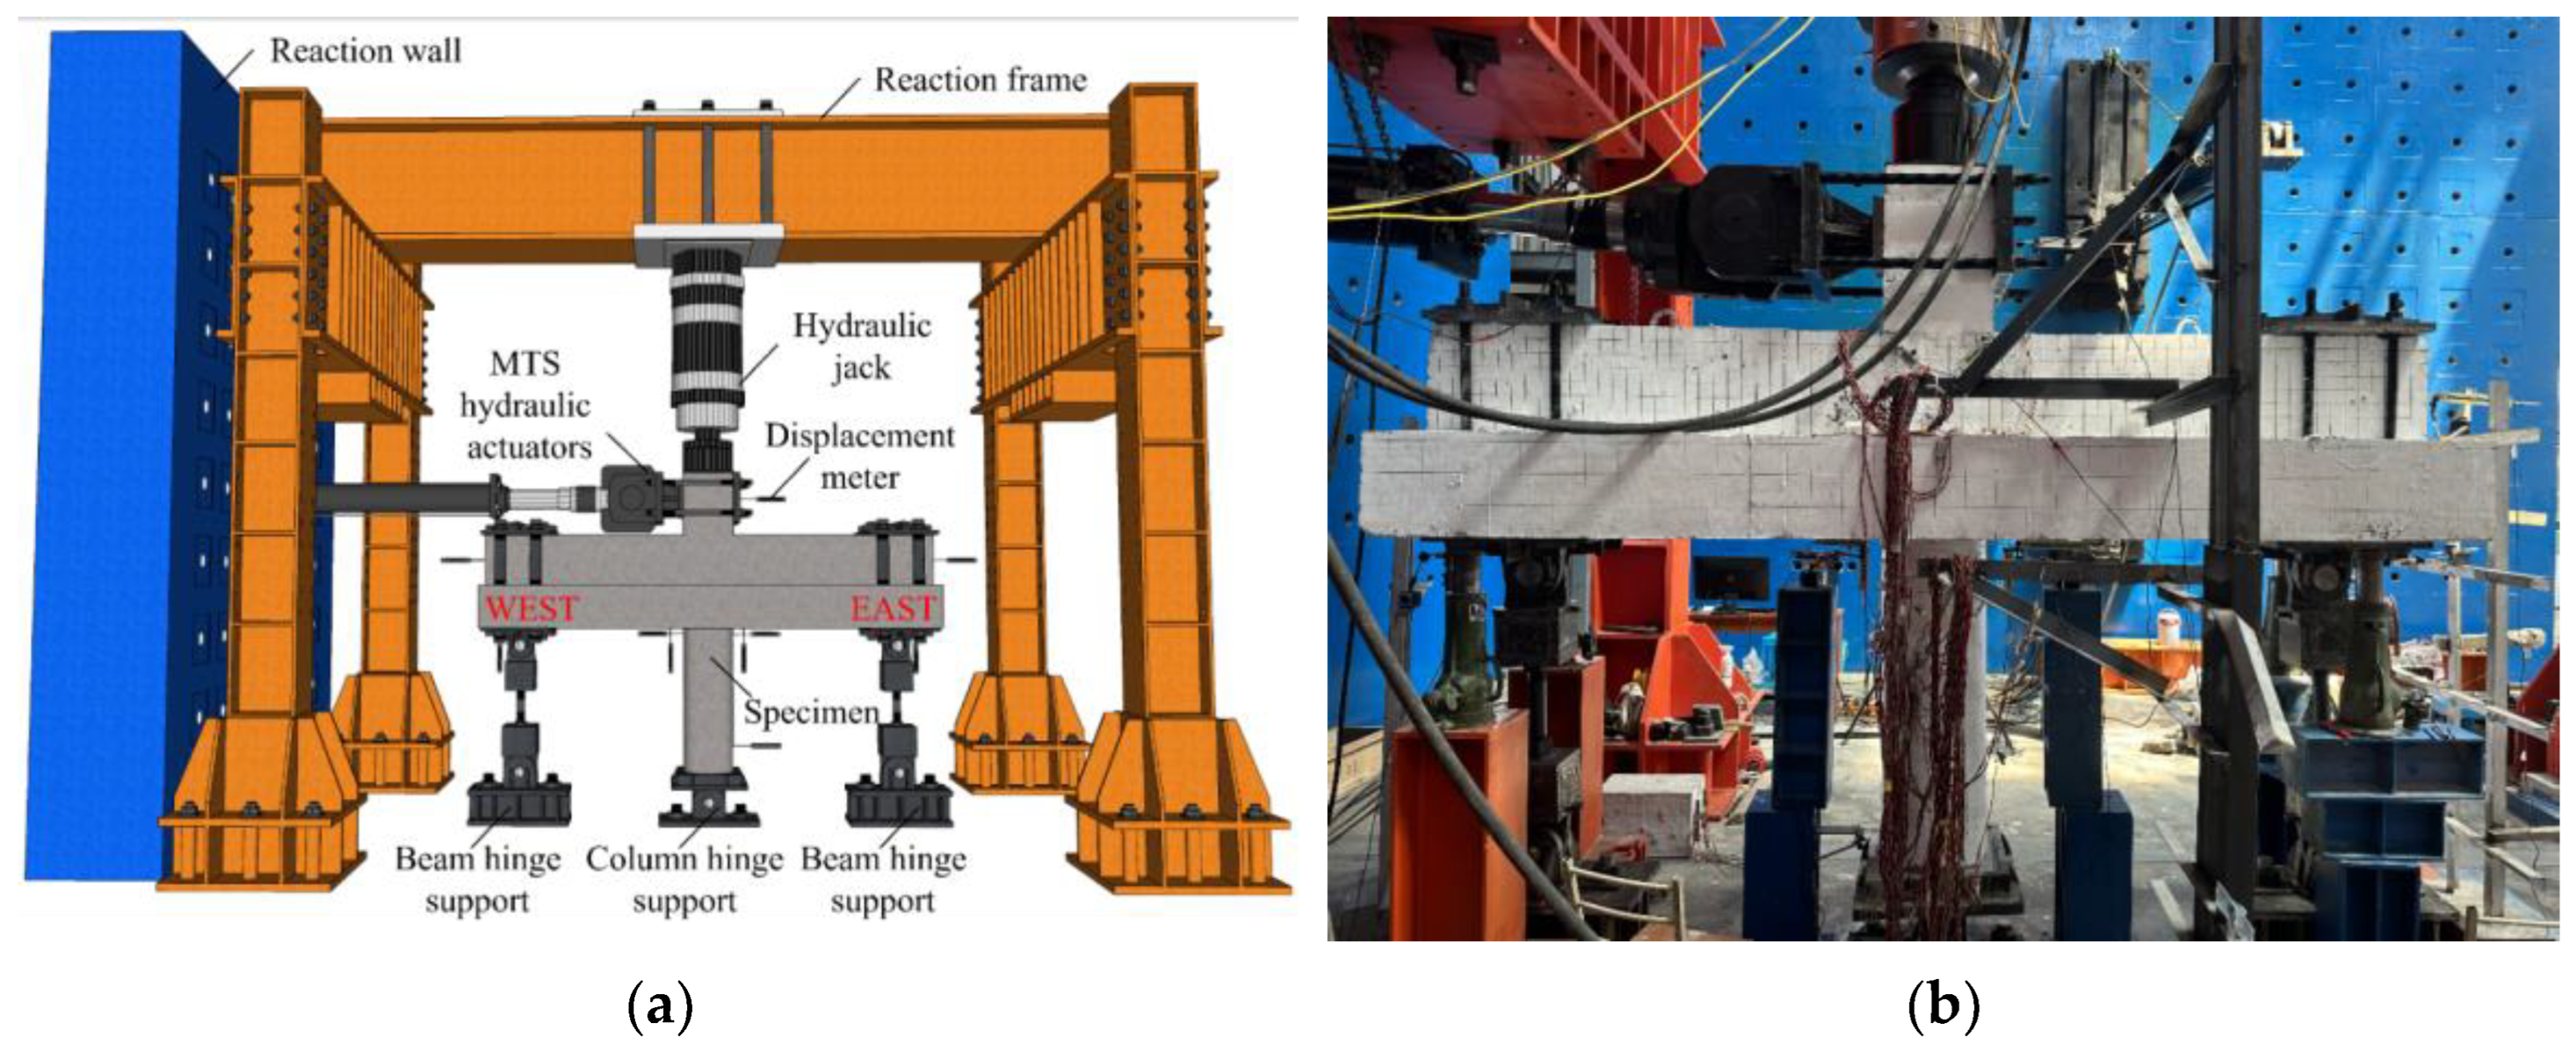
Cyclic loading tests were performed in the Structural Laboratory of Xi’an University of Science and Technology on beam–column specimens extracted from inflection points of a prototype frame structure. The experimental configuration, as shown in Figure 3, incorporated a 500 mm extended column head at the top-layer joint to ensure precise alignment and force transfer during testing.
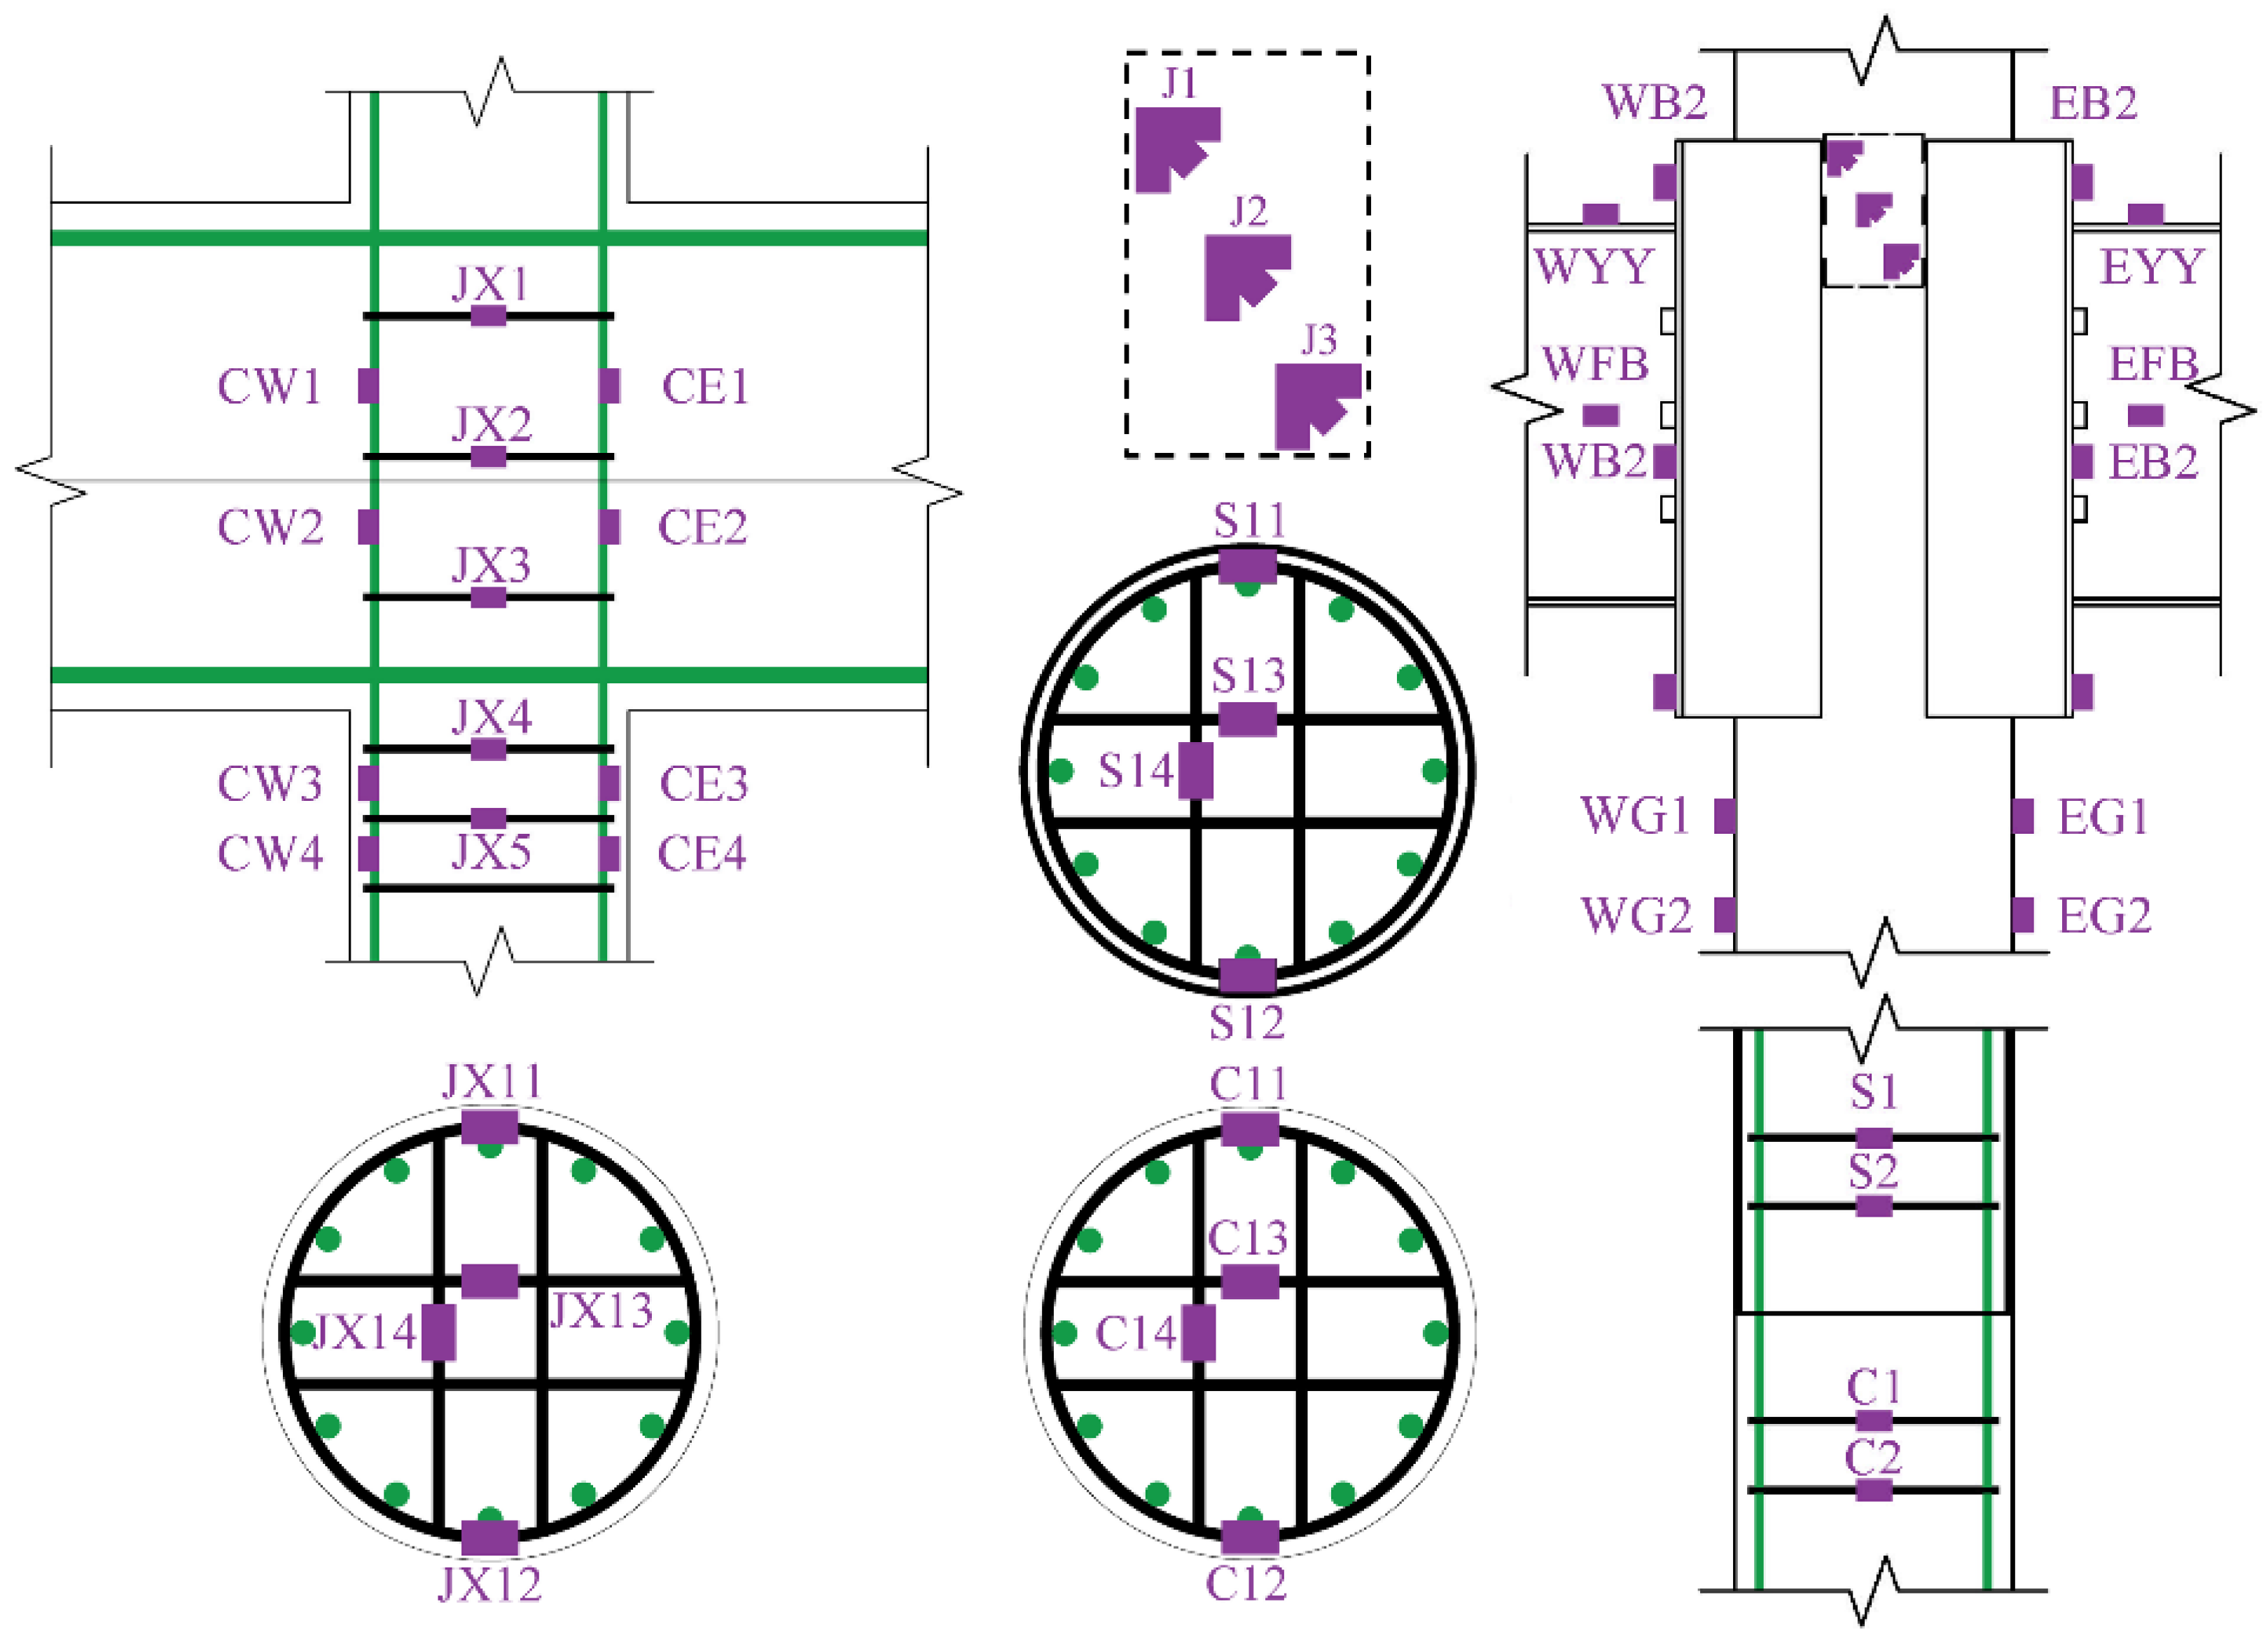
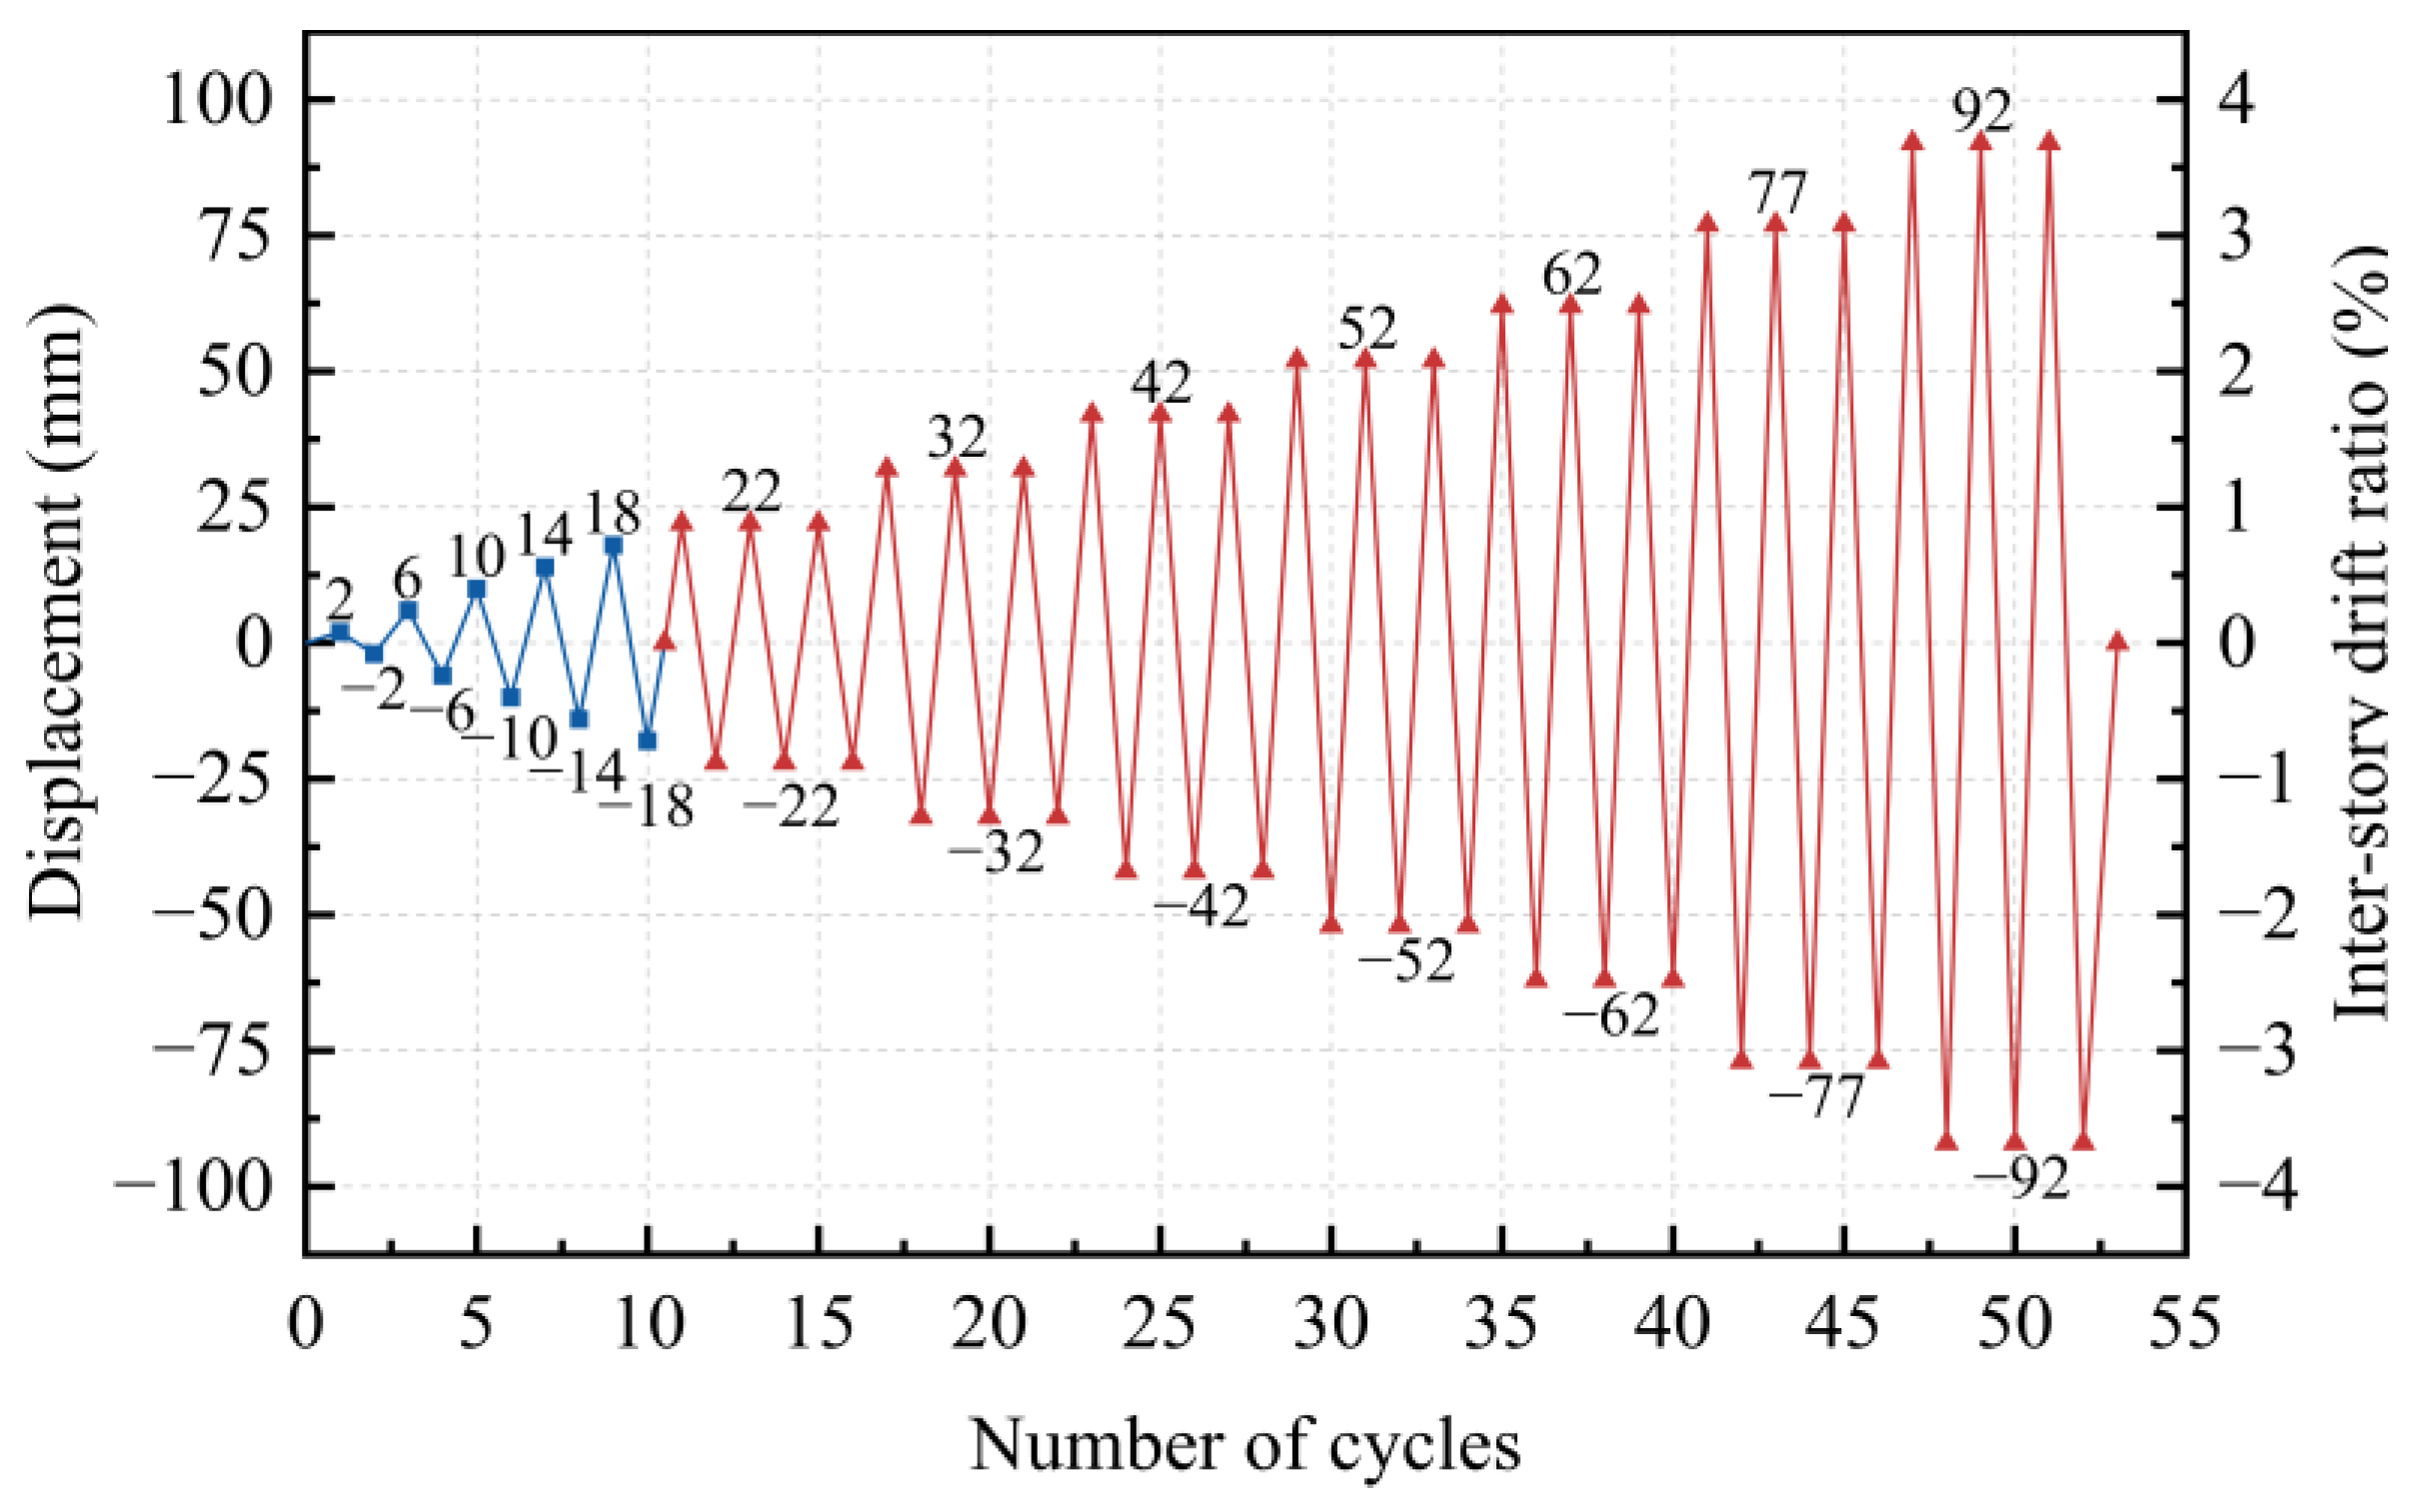
To truly reflect the seismic performance of the beam–column joints of the prototype structure, the joint specimens used in the test were cut from the inflection points of the beams and columns of the actual frame structure. The axial load was maintained at 2050 kN (corresponding to the axial compression ratio of 0.75) through hydraulic jacks to simulate complex geostatic stresses induced by substantial overburden in underground metro station structures and precisely measured using an external pressure sensor, while cyclic horizontal displacements were imposed using an MTS servo-controlled actuator. Horizontal loads and displacement data at the column ends were monitored by load transducers and displacement transducers installed on the actuator. In addition, strain responses measured by carefully attached strain gauges at designated locations were automatically collected and recorded by the MTS acquisition system to investigate the mechanical performance and deformation behavior of top-layer joints, as illustrated in Figure 4. Upon reaching specified displacement levels, crack variations and widths were meticulously documented using the crack observation instrument. The hinged supports were installed at the end of beams, while the sliding support was installed at the hydraulic jack on the top of the column to simulate vertical and horizontal hinged behavior at the inflection point. And the fixed hinged support was installed at the bottom of the column to ensure that the boundary conditions and load conditions are equivalent to the actual structure. Specimens underwent preloading protocols prior to formal testing, and the cyclic loading scheme adopted in the test is presented in Figure 5. The experimental loading scheme strictly adhered to Chinese codes [36], and all specimens underwent preloading procedures prior to formal testing. Cyclic loading was administered at a controlled rate of 0.2 mm/s to ensure loading continuity and uniformity during repeated cycles. The test was terminated when specimens reached their ultimate bearing capacity, when the load decreased below 85% of the peak load (Pmax), or when specimens demonstrated incapacity to sustain the applied loads.

3. Experimental Results

3.1. Experimental Phenomena

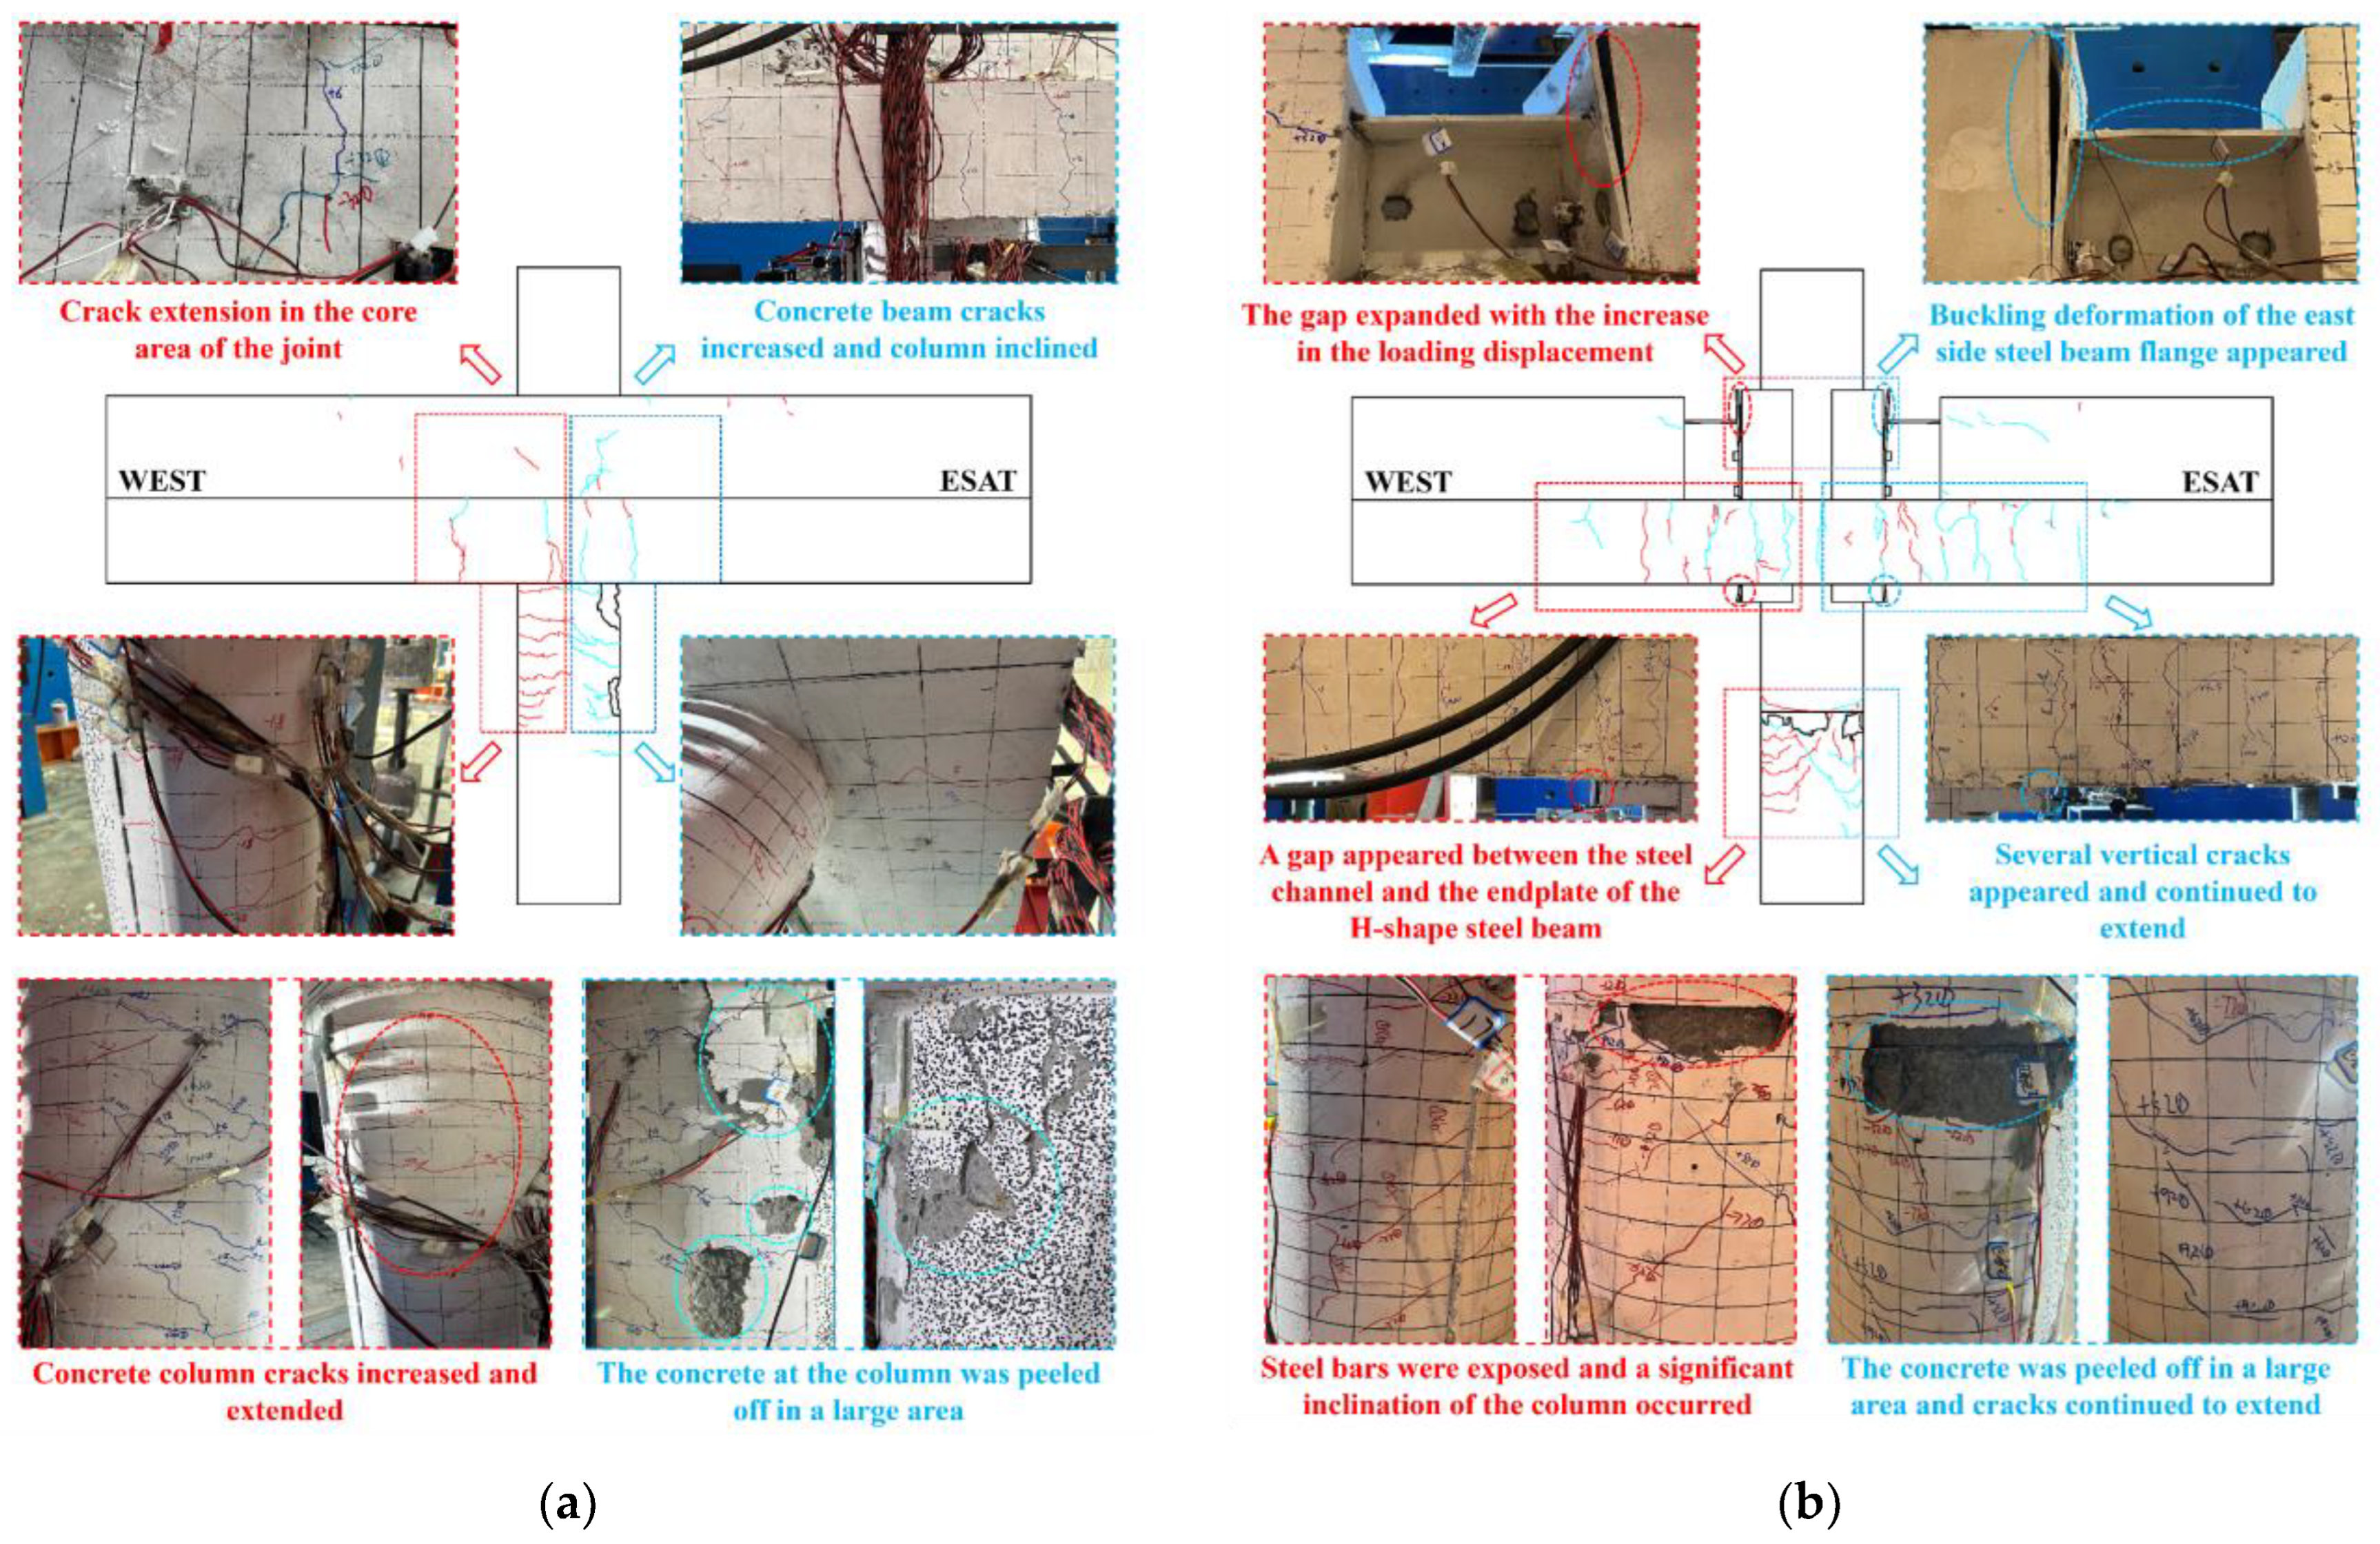
Figure 6a depicts the crack development and damage progression of specimen TLJ-1. During elastic loading phases, no significant deformations were observed. As loading progressed, horizontal cracks initially appeared in the concrete column, with crack widths not exceeding 0.05 mm. At a load displacement of 200 kN, minor oblique cracks emerged at the beam terminus. The first diagonal crack developed when the load displacement reached 22 mm. With continued loading, multiple lateral cracks propagated on the concrete column, with pre-existing cracks progressively widening. At this stage, the maximum column crack width increased to approximately 0.6 mm. Upon approaching the ultimate bearing capacity, several column cracks continued to extend downward, while beam cracks enlarged without substantial width variation. Notably, a significant concrete spalling occurred on the column surface, exposing the underlying reinforcement and stirrups. A significant sound was produced at a load displacement of 42 mm, spalling with internal reinforcement fracture and extensive concrete crushing, exhibiting the final failure mode of “strong beam and weak column”.
Figure 6b illustrates the crack development and failure modes of specimen TLJ-2. Initial observations revealed multiple vertical cracks along the edge of the concrete slab, with a maximum width of approximately 0.03 mm. As the load displacement increased, a gap formed between the steel channel and the H-shaped steel beam end plate, progressively widening. At a load displacement of 32 mm, oblique and horizontal cracks (approximately 20 cm long) emerged at the interface between the lower concrete column and the steel tube, with crack widths of around 0.05 mm. By 52 mm load displacement, additional oblique cracks appeared at the junction of the concrete beam and steel tube, measuring approximately 0.06 mm in width. At 77 mm load displacement, crack propagation continued, accompanied by significant concrete crushing and spalling at the lower column–steel tube interface. Notably, buckling deformation of the east-side steel beam flange became prominent, forming a plastic hinge. Upon reaching 92 mm load displacement, reinforcement exposure and column tilting occurred, with the bearing capacity dropping below 85% of Pmax, thereby concluding the test with the final failure mode of “strong column and weak beam”.
Within the context of post-earthquake structural resilience, priority should be given to concentrating damage in replaceable components, which facilitates the restoration of damaged members while preserving primary structural integrity. Analysis of the TLJ-2 joint reveals that during loading, damage was predominantly localized in the H-shaped steel beam. Consequently, targeted redesign or replacement of prefabricated components in critical damage zones would enable rapid restoration of joint functionality after the earthquake.

3.2. Hysteresis Curve

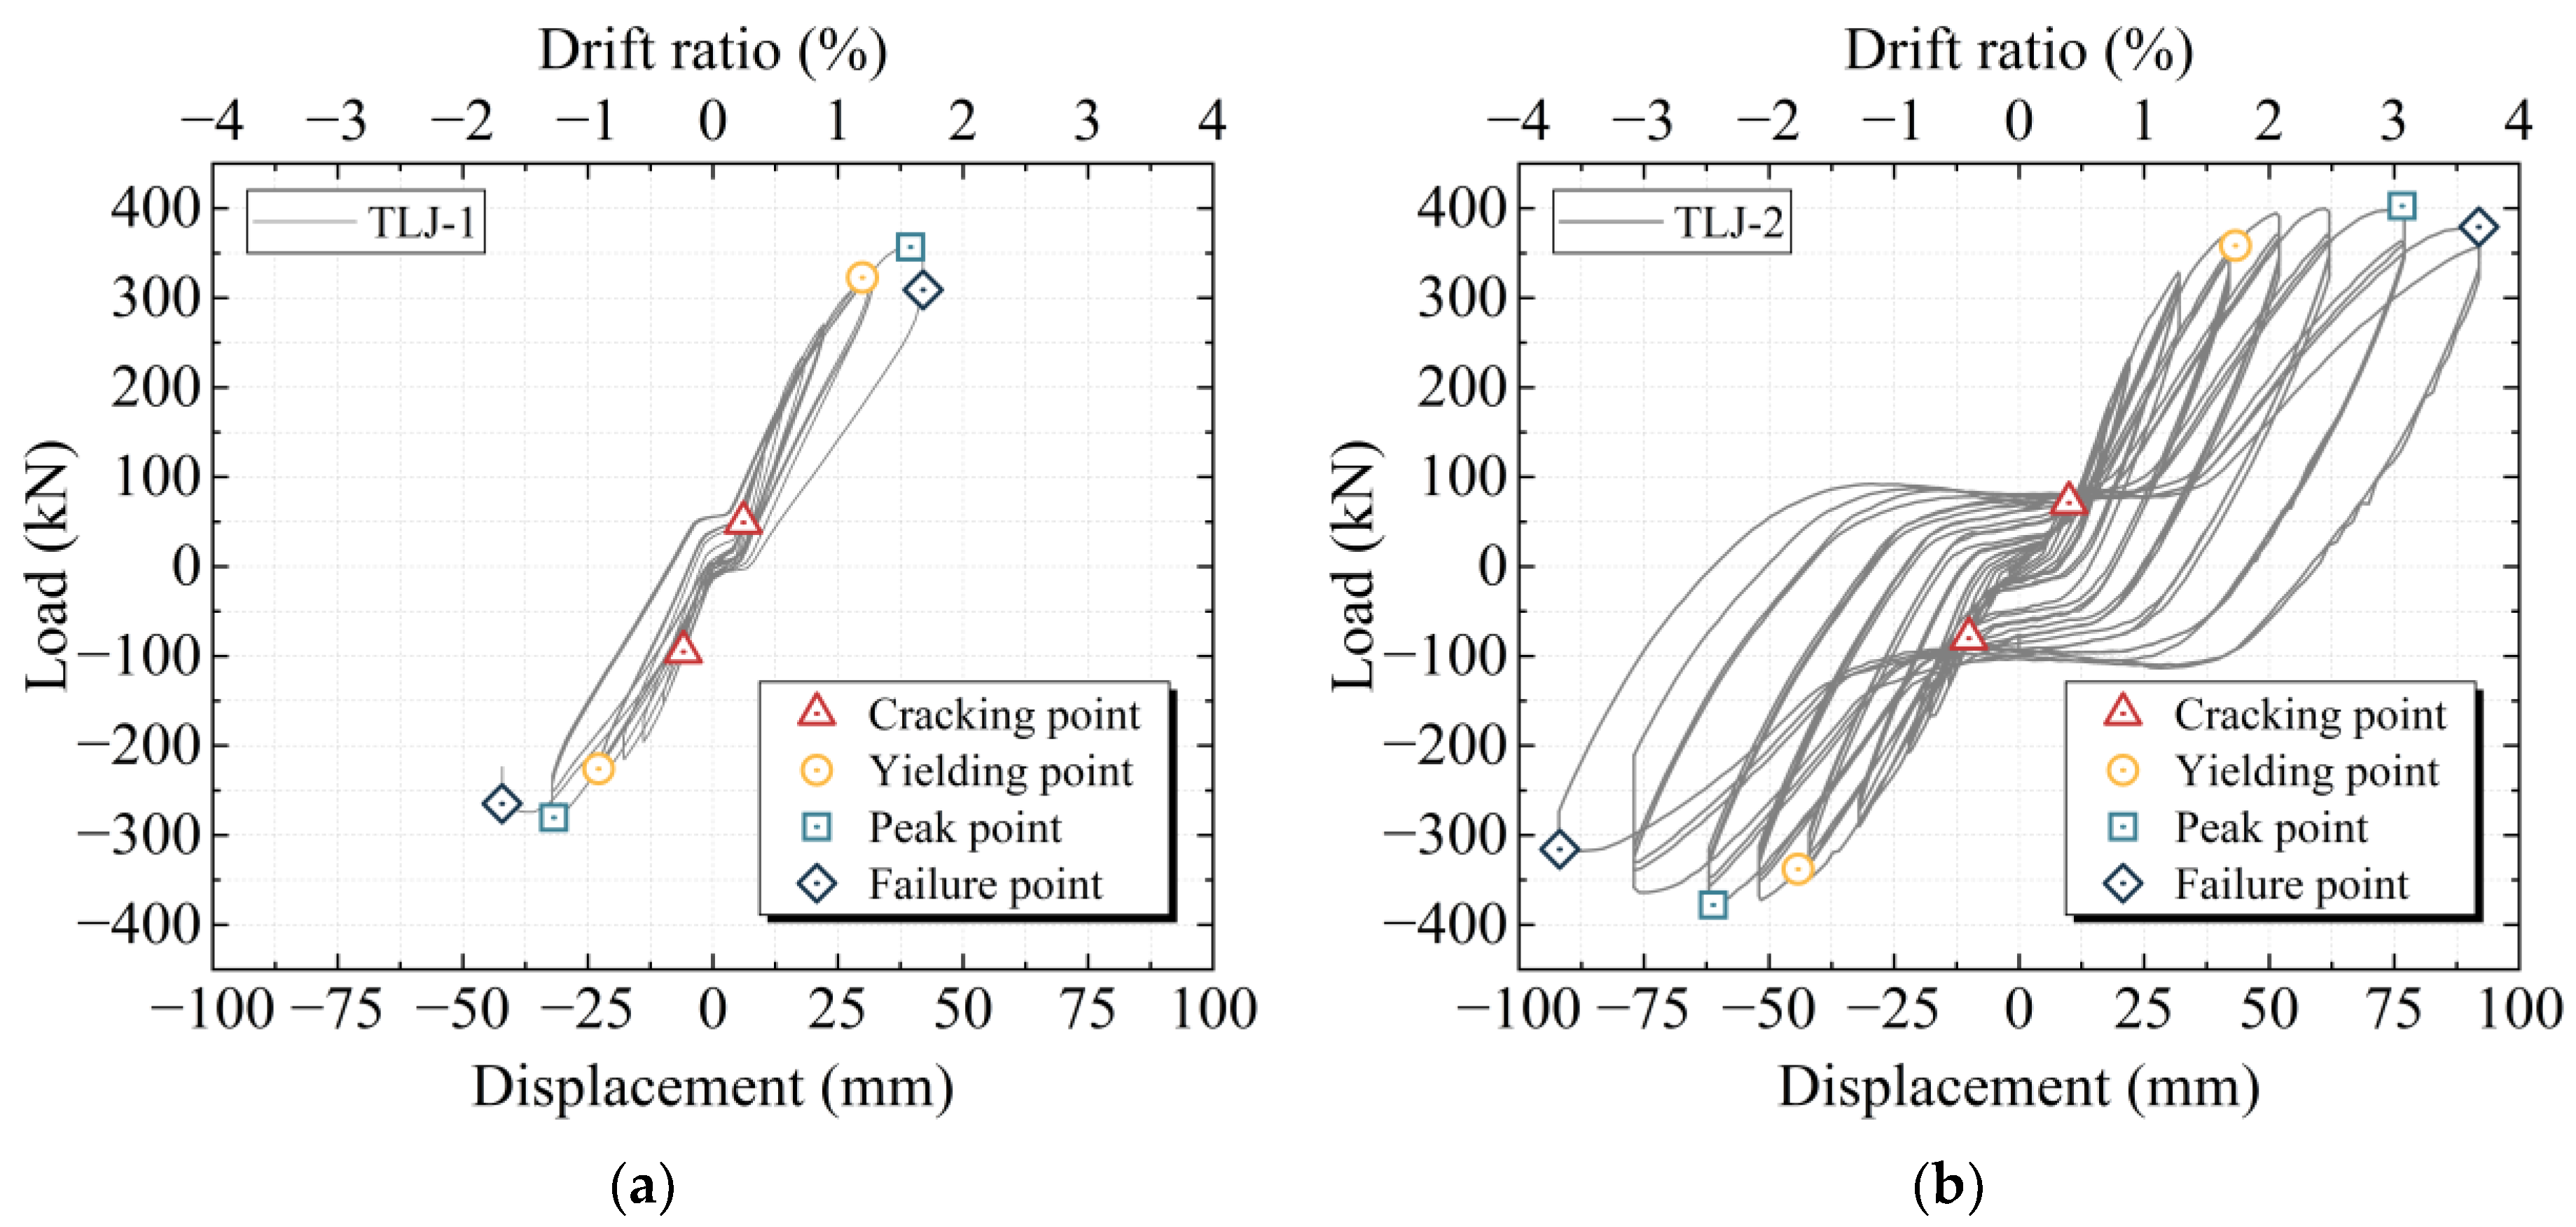
Hysteresis curves serve as a critical methodology for evaluating the seismic performance of specimens TLJ-1 and TLJ-2. Figure 7a,b depict the hysteresis curves at the column top of both specimens. The hysteresis characteristics of the top-layer beam–column joints (TLJ-1 and TLJ-2) exhibited significant similarities. During the initial loading stages, the hysteresis loops displayed narrow widths and limited areas. As the loading displacement increased, progressive crack propagation within the specimens led to a gradual reduction in both positive and negative stiffness. The hysteresis curves of TLJ-1 and TLJ-2 exhibited robust profiles, marked by a distinct “pinch” phenomenon. For the reinforced concrete frame joint TLJ-1, the “pinch” phenomenon attributed to bond-slip mechanisms under cyclic loading conditions. While for the ASCC joint TLJ-2, under the dual influence of bond-slip mechanisms and bolt slippage due to the serious deformation of the extended plates, the hysteresis curves also exhibited the “pinch” phenomenon. In the final loading phase, the hysteresis loops underwent morphological transformation, transitioning from a spindle-like shape to an anti-S-shaped profile, signifying a critical structural response. Due to the dimensional variations in steel members and concrete cracks causing cumulative and irreversible damage, which contributes to the observed asymmetry in hysteresis curves. Notably, the implementation of steel members connections at the ASCC joint significantly enhanced the specimens’ stiffness, ultimate bearing capacity, and hysteresis loop area, particularly for top-layer joints designed under the “strong column and weak beam” principle.

3.3. Skeleton Curve

The skeleton curves were extracted through characteristic point connection method [10] based on hysteretic curves measured at the column top of joint specimens. As illustrated in Figure 8, specimens TLJ-1 and TLJ-2 demonstrate comparable evolutionary patterns in their skeleton curves. The comparative analysis reveals that specimen TLJ-1 attained its yield stage earlier, with quantified yield parameters of Δy = 29.697 mm and Fy = 318.476 kN, as shown in Table 4. In contrast, specimen TLJ-2 exhibited enhanced yield performance, demonstrating 45.8% greater yield displacement and 17.9% higher yield load compared to TLJ-1. Notably, the ultimate bearing capacity Fu differentiation became more pronounced in the post-yield phase. The recorded Fu values reached 356.864 kN for TLJ-1 and 402.564 kN for TLJ-2, representing a 12.8% enhancement in load-carrying capacity. This performance improvement can be attributed to the steel member connections, which contributed to 46% and 13% increments in yield capacity and ultimate capacity, respectively. Furthermore, the ASCC joint exhibited superior post-peak behavior, maintaining stable load resistance characteristics after reaching ultimate load capacity.

3.4. Ductility

The ductility performance of specimens TLJ-1 and TLJ-2 was quantitatively assessed through the ductility coefficient calculated according to Equation (1) [37].
μ = Δuy
Comparative analysis under equivalent coaxial pressure ratios revealed a marked enhancement in the ductility characteristics of specimen TLJ-2 relative to TLJ-1 (Table 4). Specifically, the average ductility coefficient of TLJ-2 demonstrated a 40% increase compared to TLJ-1. This significant improvement in deformation capacity can be attributed to the strategic implementation of steel member connections in specimen TLJ-2. The elastoplastic inter-story drift ratio θp at joint failure deformation serves as a validated metric for assessing seismic deformation capacity and verifying serviceability compliance. According to the current codes, the elastoplastic inter-story drift ratio limits are specified as θp = 1/250 for underground structures [38], and specified as θp = 1/50 for above ground structures [32]. Experimental results demonstrate that the elastoplastic inter-story drift ratios of TLJ-1 and TLJ-2 are 1/59 and 1/27, respectively. Deformation verification confirms the seismic deformation capacity of TLJ-1 satisfies underground structural requirements despite failing above-ground standards. Crucially, the semi-rigid connected ASCC joint TLJ-2 exhibits superior deformation capacity, complying the requirements of seismic deformation in both codes of underground structure and aboveground structure. Owing to the synergistic interactions including the yield deformation and controlled interfacial slippage occurring at high-strength bolts, steel members, and channel steels, which effectively redistributed stress concentrations while maintaining structural integrity, thereby optimizing the plastic deformation capacity of joints.

3.5. Strength Degradation

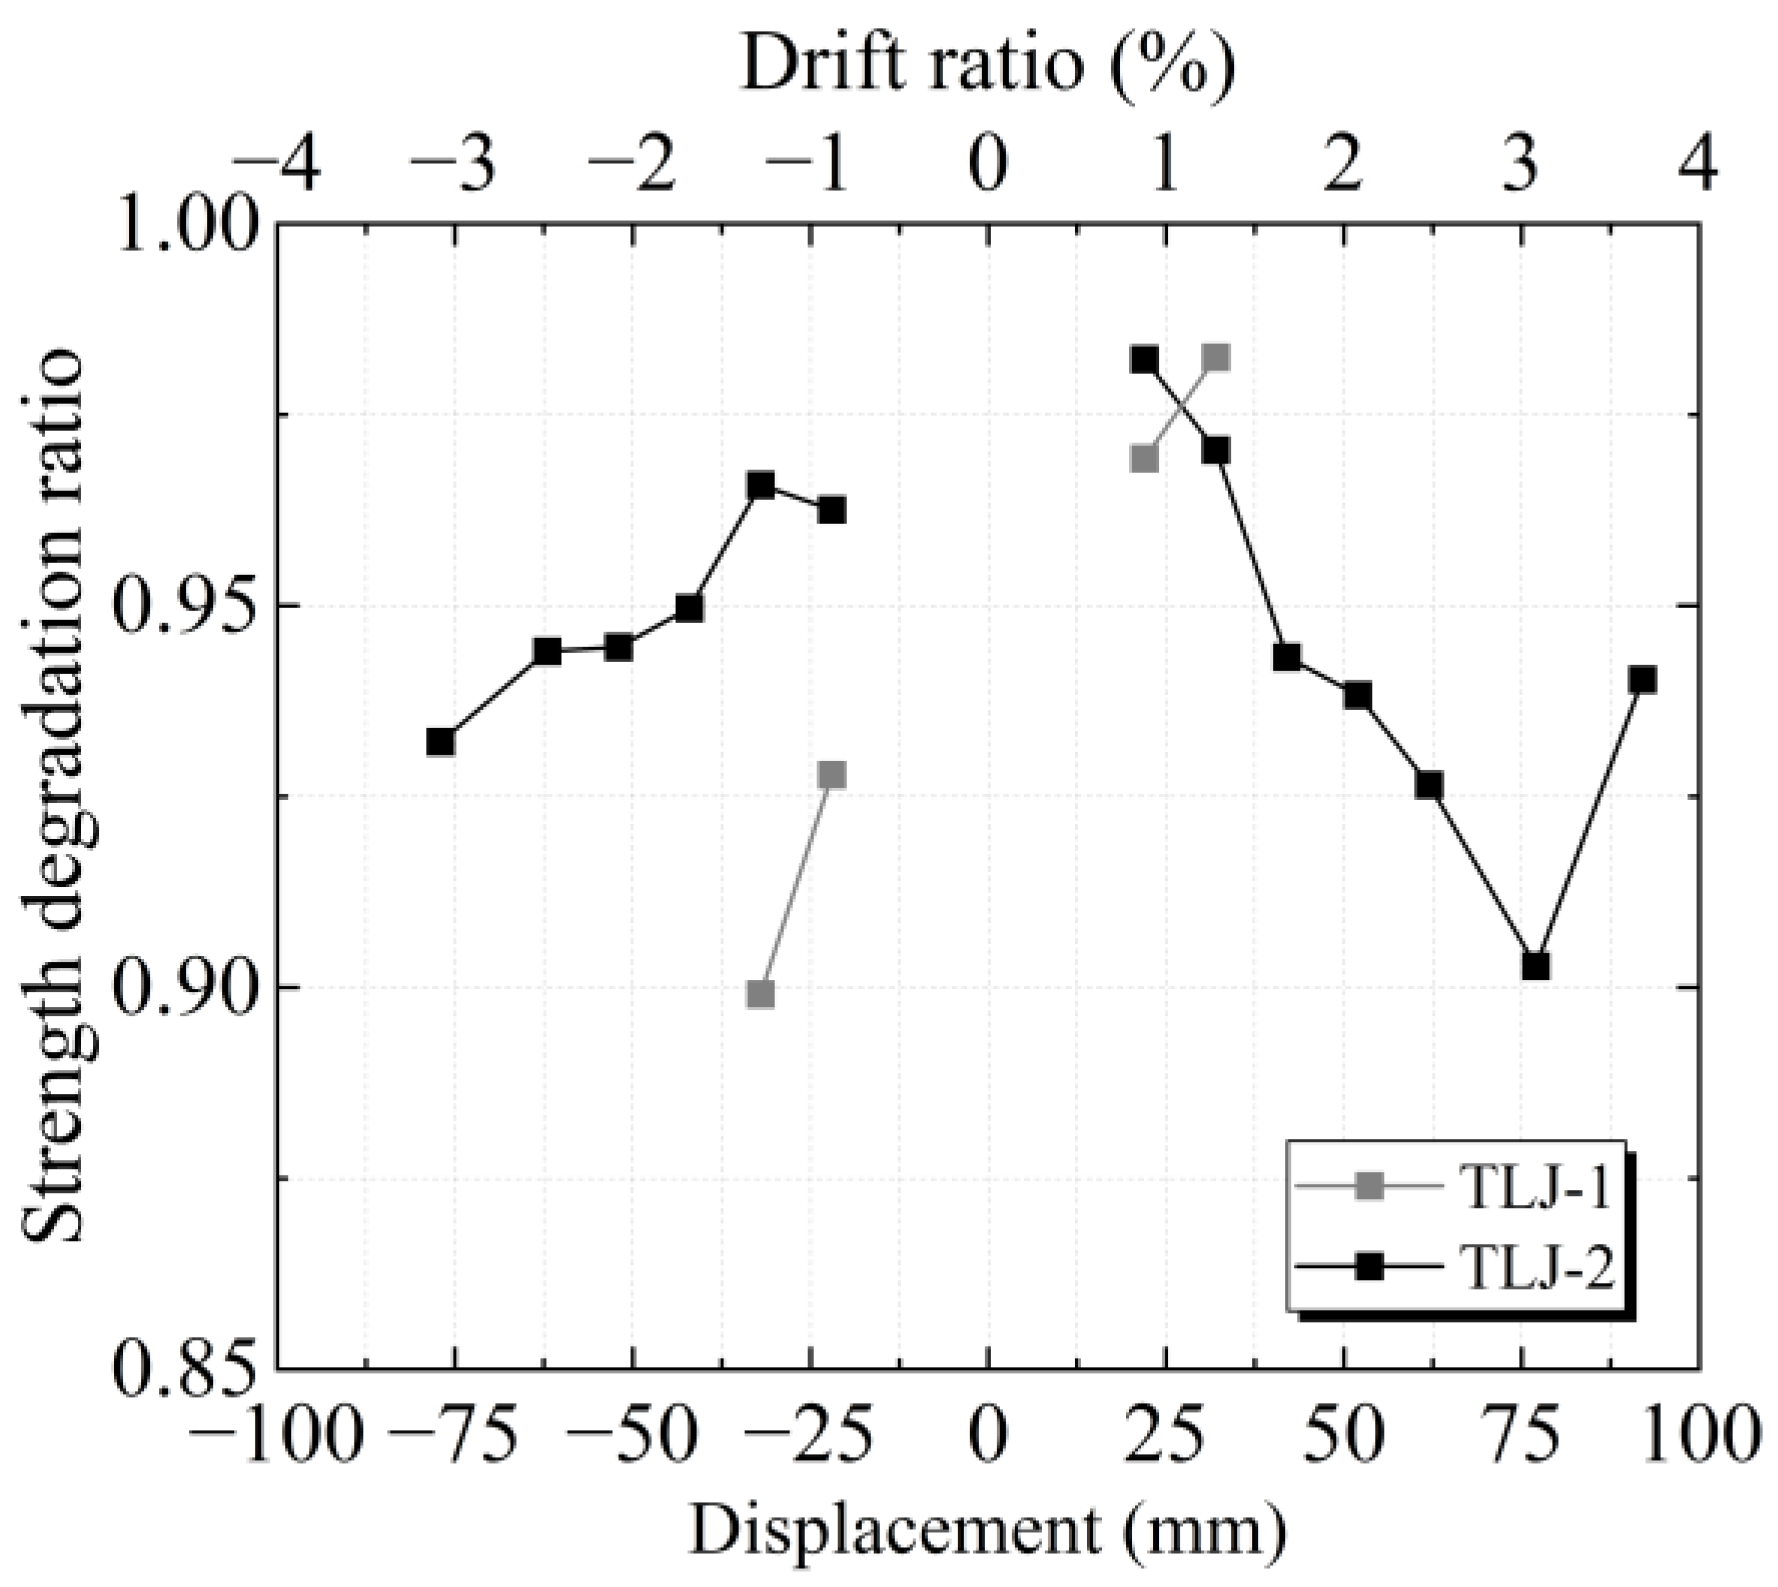
Strength degradation, characterized by the progressive reduction in structural resistance under equivalent loading magnitudes during cyclic sequences, represents a critical performance metric for evaluating the cyclic behavior of beam–column joints through the strength degradation ratio. The strength degradation ratio is defined as the ratio between second cycle and preceding cycle load capacities at identical displacement amplitudes, and Figure 9 shows the strength degradation ratio of each specimen at different displacement loading stages.
TLJ-1 and TLJ-2 joint specimens experienced rapid failure at displacements of +42 mm and −92 mm, respectively, without undergoing cyclic loading and were therefore excluded from the strength degradation analysis. Both specimens demonstrated strength degradation ratios exceeding 0.85, indicating that the joints maintained relatively stable load-bearing capacity under column-top cyclic loading. The observed failures primarily originated from localized component damage, while the overall strength of the joint is still guaranteed when the component is destroyed.
For the joint specimen TLJ-2, a notable reduction in strength degradation ratio occurred at approximately +22 mm displacement. After yielding, the joint exhibited significant plastic deformation accompanied by marked load-bearing capacity decline. The strength degradation ratio of TLJ-2 decreased substantially upon reaching peak load but subsequently recovered rapidly, which reflects the change conditions in strength of the joint to coordinated stress deformation among components and bearing contact within bolt holes after the slip phenomenon of high-strength bolts was detected. Notably, the TLJ-2 joint maintained a strength degradation ratio above 0.90 throughout testing, demonstrating that the steel member connection effectively constrained the joint zone concrete. This constraint mechanism delayed the failure of concrete, mitigated damage in the joint area, and enhanced the strength retention capability of the joint. These observations confirm the reliable load-bearing performance of joints under column-top cyclic loading.

3.6. Stiffness Degradation

This stiffness degradation curve, defined as the ratio of tangent stiffness for each cycle to the initial tangent stiffness at a given displacement, was utilized to evaluate specimen damage progression, as shown in Equation (2).
KT = dP/dΔ
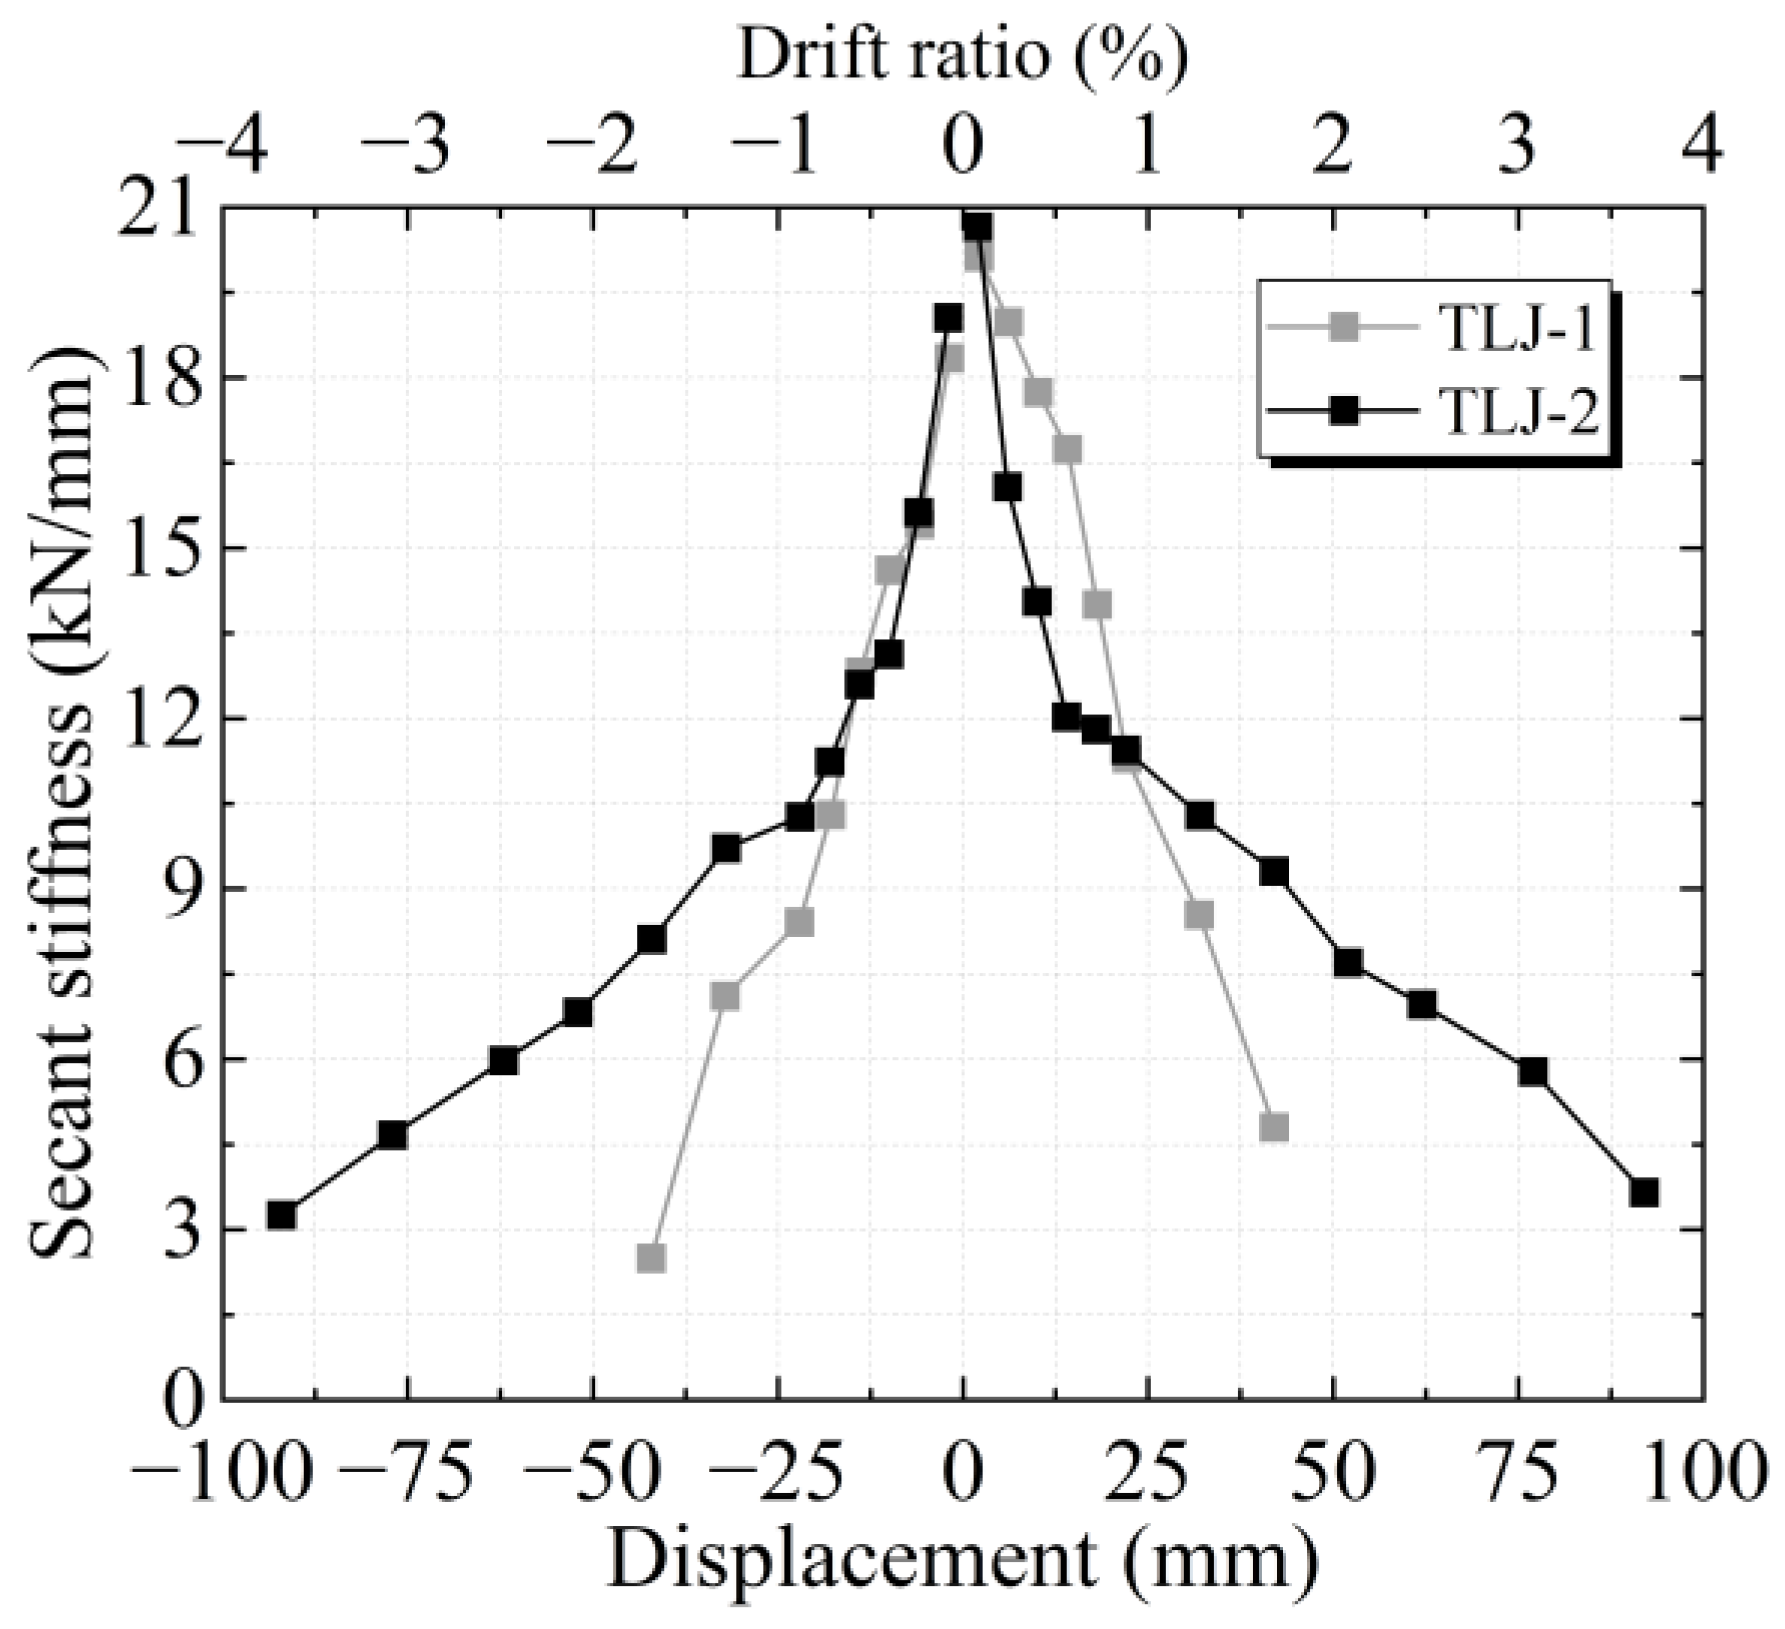
Comparative analysis of stiffness degradation curves (Figure 10) disclosed distinct phase-dependent characteristics: Specimen TLJ-2 exhibited a precipitous reduction in stiffness degradation coefficient during initial cyclic loading, transitioning to a gradual attenuation pattern with load escalation. Both specimens TLJ-1 and TLJ-2 demonstrated similar stiffness degradation patterns and excellent lateral displacement resistance. At the peak displacement condition of TLJ-1, TLJ-2 exhibited 4.38% greater load-bearing capacity and 93.99% higher stiffness than TLJ-1. The combined influence of reinforcement bond-slip effects and bolt slippage caused an elongated slip segment in the hysteresis curve of TLJ-2, resulting in a significantly more pronounced “pinch” phenomenon. The implementation of semi-steel connections significantly enhanced joint stiffness, resulting in a slightly higher stiffness degradation rate in TLJ-1 compared to TLJ-2. These results demonstrate that steel member connections provide superior lateral movement resistance and enhanced energy dissipation capabilities for the joints.

3.7. Energy Dissipation Capacity

The energy dissipation capacity of the specimens, quantified by the enclosed area of hysteresis curves, served as a crucial indicator of seismic performance. Three parameters were employed to characterize the energy dissipation of specimens TLJ-1 and TLJ-2: energy dissipation per cycle (Ei), total energy dissipation (Etotal), and equivalent viscous damping coefficient (he).
During the elastic phase, the relationship between he and cycle number remained relatively constant, indicating minimal energy dissipation as specimens maintained elastic behavior (Figure 11a). With increasing column top displacement, all specimens entered the yield phase, accompanied by a rapid increase in he values. Specimen TLJ-1, having the highest initial tangent stiffness, reached the energy-consuming condition first but exhibited reduced energy dissipation capacity. Despite improved plastic deformation performance, the specimens showed some variation in cyclic energy dissipation capacity.
Figure 11b demonstrates the stepwise progression of energy dissipation per cycle Ei for specimens TLJ-1 and TLJ-2. Although specimen TLJ-1 experienced cracking and abrupt column tilting leading to test termination, both specimens exhibited substantially increased energy dissipation capacity with progressive loading. At constant displacement, energy dissipation capacity slightly decreased with increasing cycle number due to stiffness deterioration. However, the ASCC joint demonstrated significantly higher energy consumption compared to the reinforced concrete joint.
Total energy dissipation (Etotal), represented by the hysteresis loop envelope area under loading, showed similar cumulative patterns for both specimens. During the elastic phase, Etotal values increased gradually for both specimens, followed by accelerated growth during the elastoplastic phase with increasing cycle numbers. Figure 11c shows that specimen TLJ-1 exhibited lower Etotal values at failure compared to specimen TLJ-2 at failure. At the peak displacement condition of TLJ-1, the Etotal of TLJ-1 and TLJ-2 was 30.395 kJ and 29.373 kJ, respectively. Due to the reinforcement bond-slip effects and bolt slippage, the Etotal of TLJ-2 was slightly lower than TLJ-1. During the failure phase, the TLJ-1 joint experienced greater steel strain than specimen TLJ-2 under loading conditions, with loading ultimately terminated due to sudden column inclination in specimen TLJ-1. These results indicate that the implementation of steel member connections substantially enhances the energy dissipation capacity of ASCC top-layer joints.

3.8. Strain Analysis

3.8.1. Column Longitudinal Reinforcement Strain Distribution

Given that crack development in TLJ-1 and TLJ-2 predominantly occurred within the lower concrete column regions, the analysis primarily focused on column longitudinal reinforcement strains. Comparative analysis adopts strain data from the peak points during the first cycle of each loading level in the loading phase, with column longitudinal reinforcement strain distributions illustrated in Figure 12.
During initial positive and negative loading cycles, strain gauge measurements changed minor. Progressive loading induced gradual strain increases in gauges CW3 and CW4 positioned at the lower concrete column, ultimately reaching yield levels. As shown in Figure 12a,b, subsequent gauge failure during later loading stages resulted in abrupt strain value discontinuities. While core zone longitudinal reinforcement exhibited progressive strain without occurring yielding, which is consistent with the experimental phenomenon in the TLJ-1 joint core during testing.
The TLJ-2 joint demonstrated continuous strain increase in both CFST column and concrete column longitudinal reinforcements under alternating loading directions, as shown in Figure 12c,d. The strain of the concrete column longitudinal reinforcement increases faster and reaches the yield in the middle and later stages of loading. Whereas CFST column longitudinal reinforcement has not reached the yield throughout, which originated from load redistribution due to the steel tube assumed the predominant load.

3.8.2. Column Stirrup Strain Distribution

The joint stirrup design presented in this study consists of external circular stirrups and internal well-shaped stirrups. Comparative analysis revealed that the strain variation patterns of external stirrups were consistent with internal stirrups. Therefore, this section focuses on the external circular stirrups to analyze stirrup strain within the joint core region at the first cyclic peak displacement.
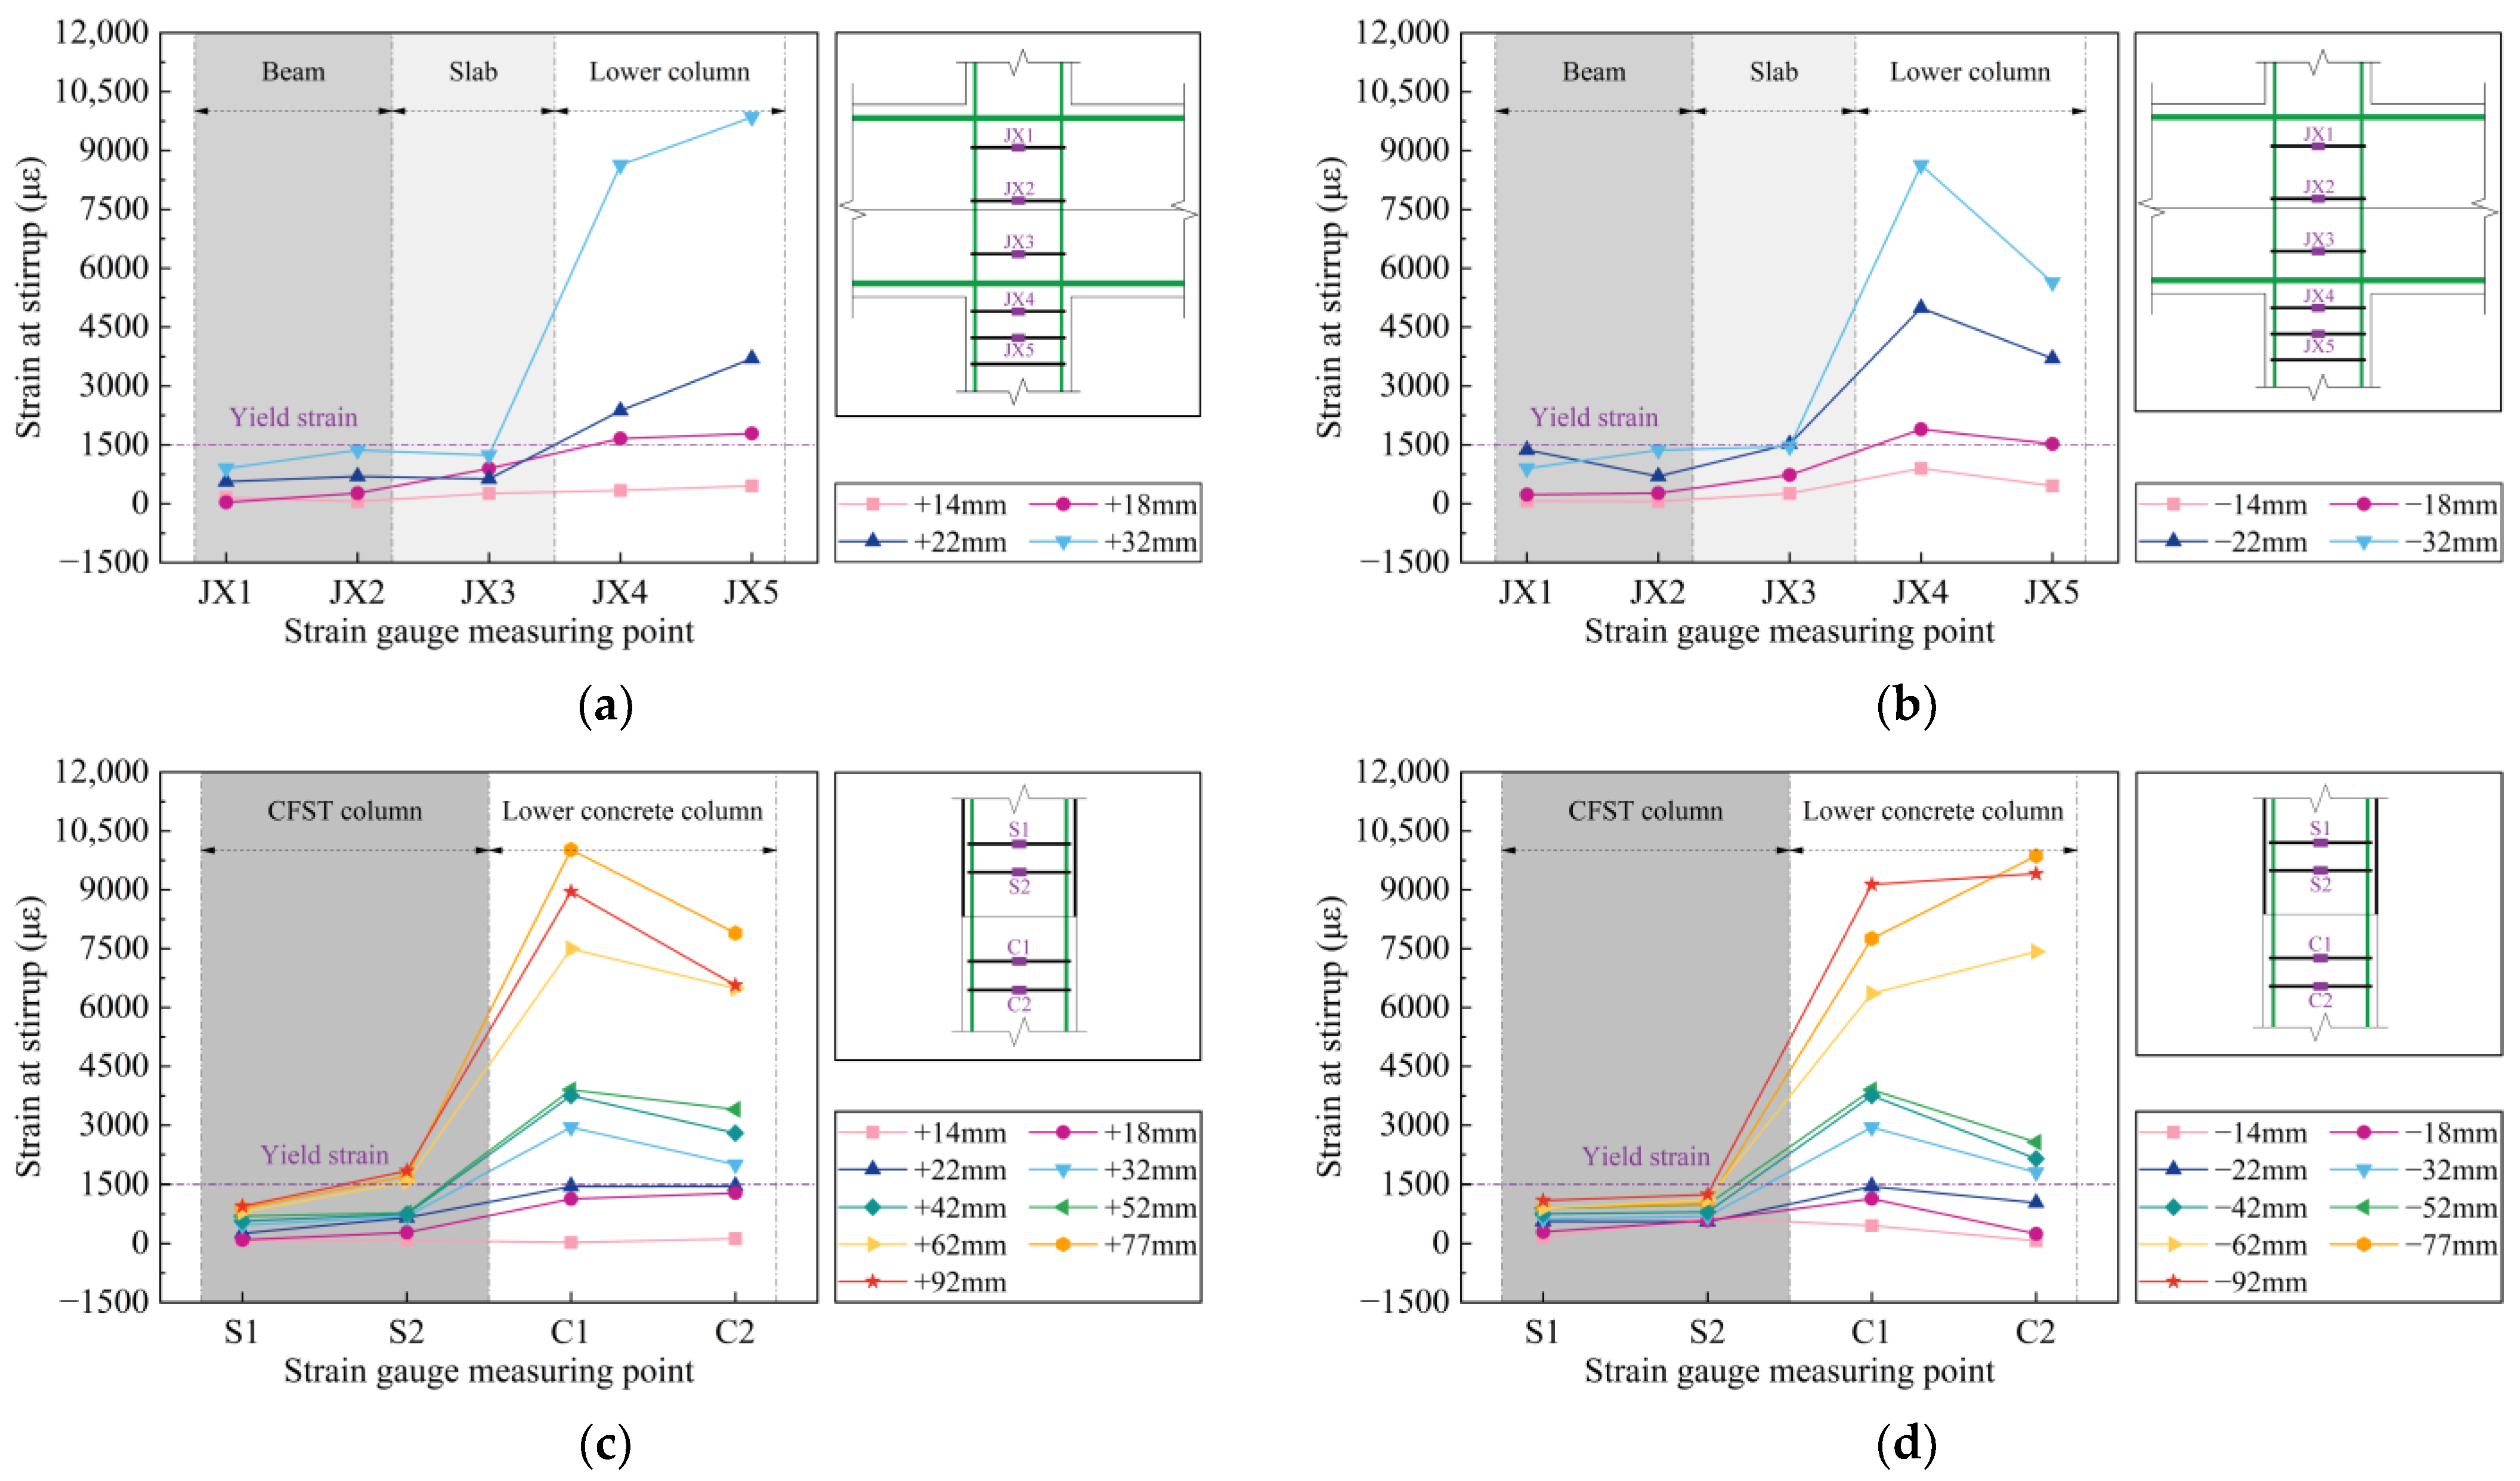
As observed from the positive and negative strain curves at the mid-height of outer limb stirrups in top-layer joint TLJ-1 presented in Figure 13a,b, the stirrup strain at the inverted T-shaped concrete beam-slab exhibited minor growth before the displacement reached 18 mm. The crack development was limited owing to low tensile stress in stirrups, while stirrups beneath the core area had already yielded prior to peak load attainment. When displacement increased to 22 mm, the first diagonal crack emerged in the joint, triggering rapid strain growth in stirrups as they began to sustain partial tensile stresses, ultimately leading to failure of the concrete column under the joint core area. During final loading stages, stirrup strains demonstrated approximately linear growth with increasing crack widths, showing similar development patterns under both positive and negative loading directions.
Figure 13c,d illustrates the strain development in stirrups at both the CFST column and concrete column under the top-layer joint TLJ-2. Similarly, stirrups in the lower concrete column yielded at approximately 32 mm displacement, followed by continuous strain accumulation. Subsequent loading stages caused stirrup exposure and strain gauge failure in the lower concrete column. In contrast, stirrups in the CFST column either yielded after peak load or maintained elastic behavior throughout loading, attributable to the superior confinement effect provided by the external steel tube that prevented full strength utilization of stirrups in the CFST column.
Both joints exhibited significant stirrup deformation and rapid strain growth during later loading phases. Comparative analysis reveals that TLJ-1 experienced concrete column failure under the joint core with complete stirrup yielding, while TLJ-2 demonstrated accelerated strain growth leading to yielding at the interface between the CFST column and the lower concrete column. The steel member connection in the top-layer joint effectively mitigates column damage under the joint core areas, thereby enhancing the load-bearing capacity of the top-layer joint.

3.8.3. Steel Member Strain Distribution

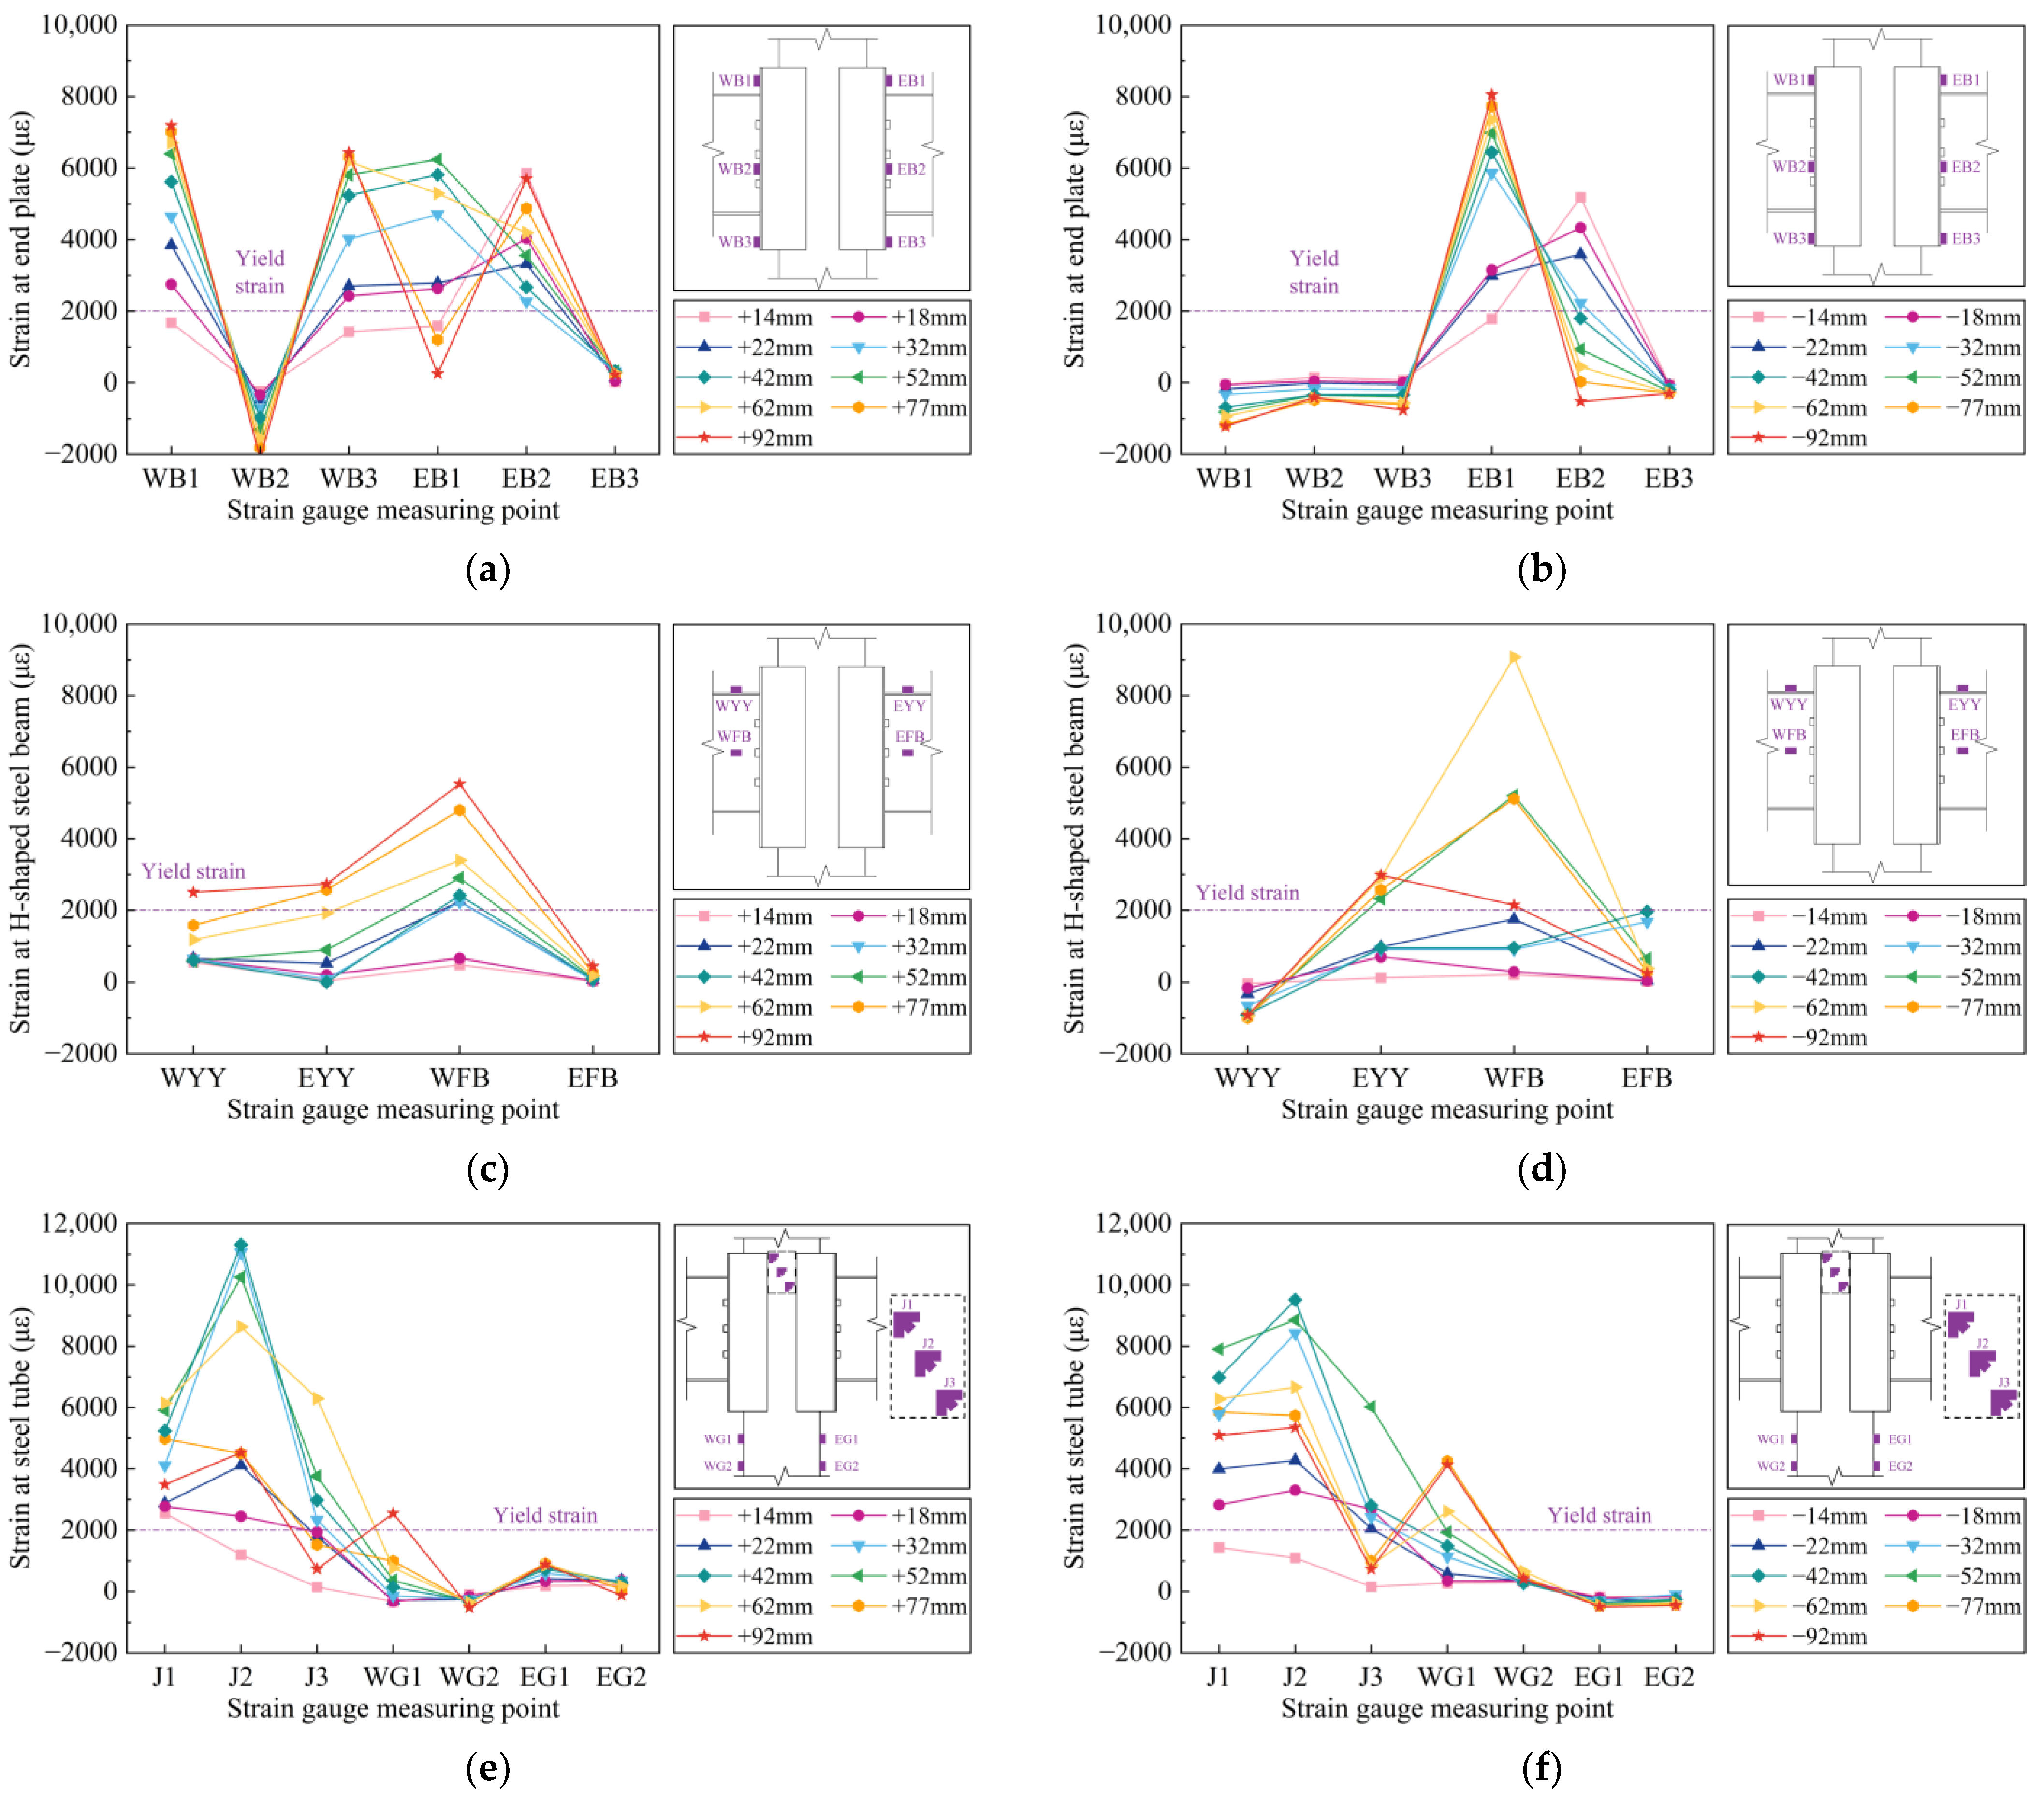
Strain gauges were installed on the steel member connection at different locations. Figure 14 presents the strain distribution curves of steel members in top-layer joint TLJ-2 under various positive and negative displacements. When the displacement reached 18 mm, separation and deformation were observed between the H-shaped steel beam end plate and the steel channel. Consequently, the end steel plate reached yield strain, with significant deformation and continuous strain accumulation under increasing displacement. However, the central section of the end steel plate was connected by high-strength bolts to enhance flexural resistance and remained in the elastic stage throughout loading, as illustrated in Figure 14a,b. Under sustained loading and deformation of the end steel plate, buckling occurred in both the top flange and web plate of the H-shaped steel beams. The strain at corresponding locations attained yield strain during the later loading stage, as shown in Figure 14c,d. Figure 14e,f displays the strain distribution on the steel tube column surface under positive and negative displacements. Results indicate that strains at measurement points J1, J2, and J3 in the joint core region reached yield strain during intermediate loading stages, following similar development patterns. At measurement point WG1, located on the lower surface of the top-layer joint core region, strain achieved yield strain in the later loading stage, while other measurement points maintained relatively low strain values. This observation confirms the effective constraint provided by the steel tube, with most column surfaces remaining in the elastic stage throughout testing, consistent with experimental observations.

4. Finite Element Analysis

4.1. Finite Element Analysis Models

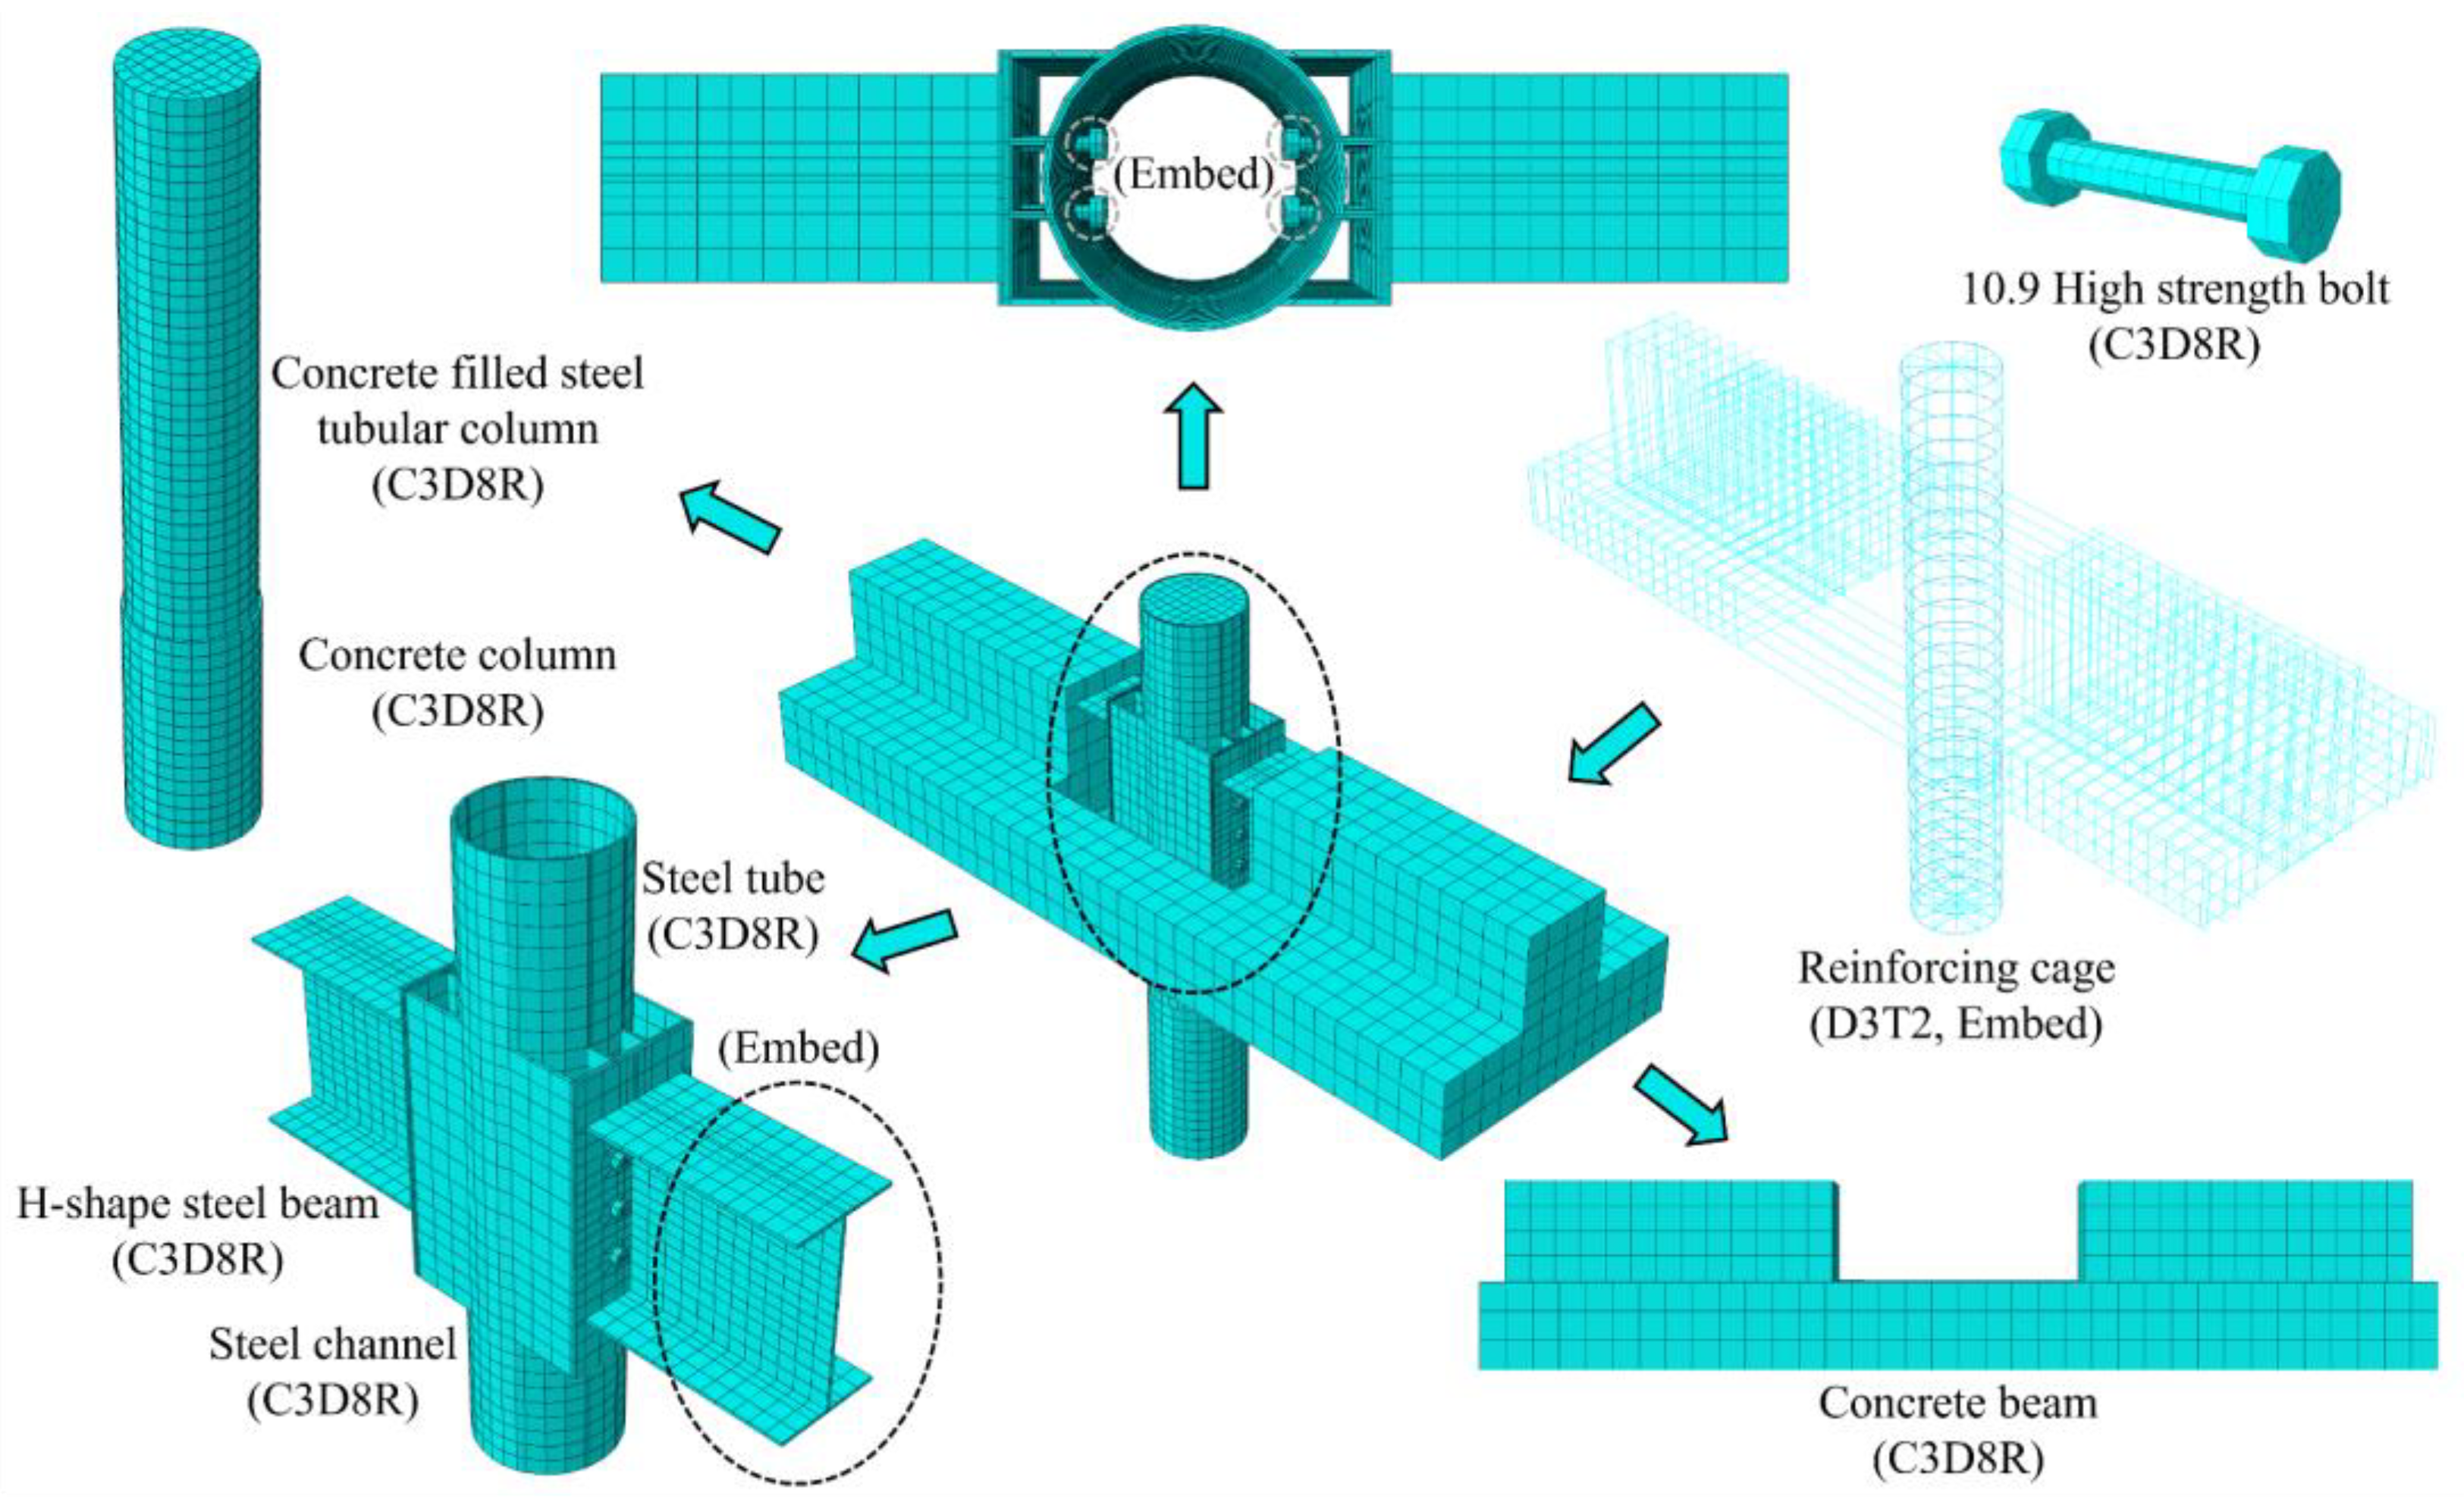
To efficiently reduce experimental costs and duration, ASCC joint specimen TLJ-2 was numerically simulated using finite element software ABAQUS 2023. Eight-node brick elements with reduced integration (C3D8R) were used to model concrete beams, CFST columns, bolts, H-shaped steel beams, and steel channels, while reinforcements and stirrups were modeled using two-node linear three-dimensional truss elements (T3D2). A refined mesh was employed in the connection region to enhance the calculation accuracy for top-layer joint specimens. Therefore, the grid size was set as 10 mm at the joint and 50–100 mm in the unstressed area. Figure 15 shows the finite element model details of specimen TLJ-2 (TLJ-3).
In the finite element modeling of ASCC joint, distinct contact interactions were implemented to simulate the mechanical behavior of components. The “Embedded Region” contact was applied to integrate reinforcement elements directly into the joint region, while H-shaped steel beams and high-strength bolts were partially embedded into the concrete beam and CFST column, respectively. For welded connections in the steel members, the “Tie Constraint” contact was adopted to simulate the welding areas. For other contact surfaces, the “Surface-to-surface” contact was utilized in the contact regions, employing “Coulomb friction” and “Hard contact” to simulate the tangential and normal contact characteristics of the contact surface, respectively, and permitting either contact or separation without interpenetration. Accounting for surface roughness effects, the friction coefficients were specified as 0.6 for steel–concrete interfaces and 0.3 for steel–steel contact surfaces [31].

4.2. Material Properties

The Concrete Damaged Plasticity (CDP) model was adopted to simulate the plastic behavior of concrete beams and circular CFST columns under cyclic loading conditions, and the constitutive relationships of corresponding concrete were established, respectively [39,40]. The plastic parameters were defined as shown in Table 5. Based on material tests in Section 2.2, the Von Mises yield criterion was applied to simulate the plastic behavior of the Q235B steel members, while the high-strength bolts, reinforcements, and stirrups were represented using a simplified bilinear relationship.

4.3. Boundary Conditions and Load Loading

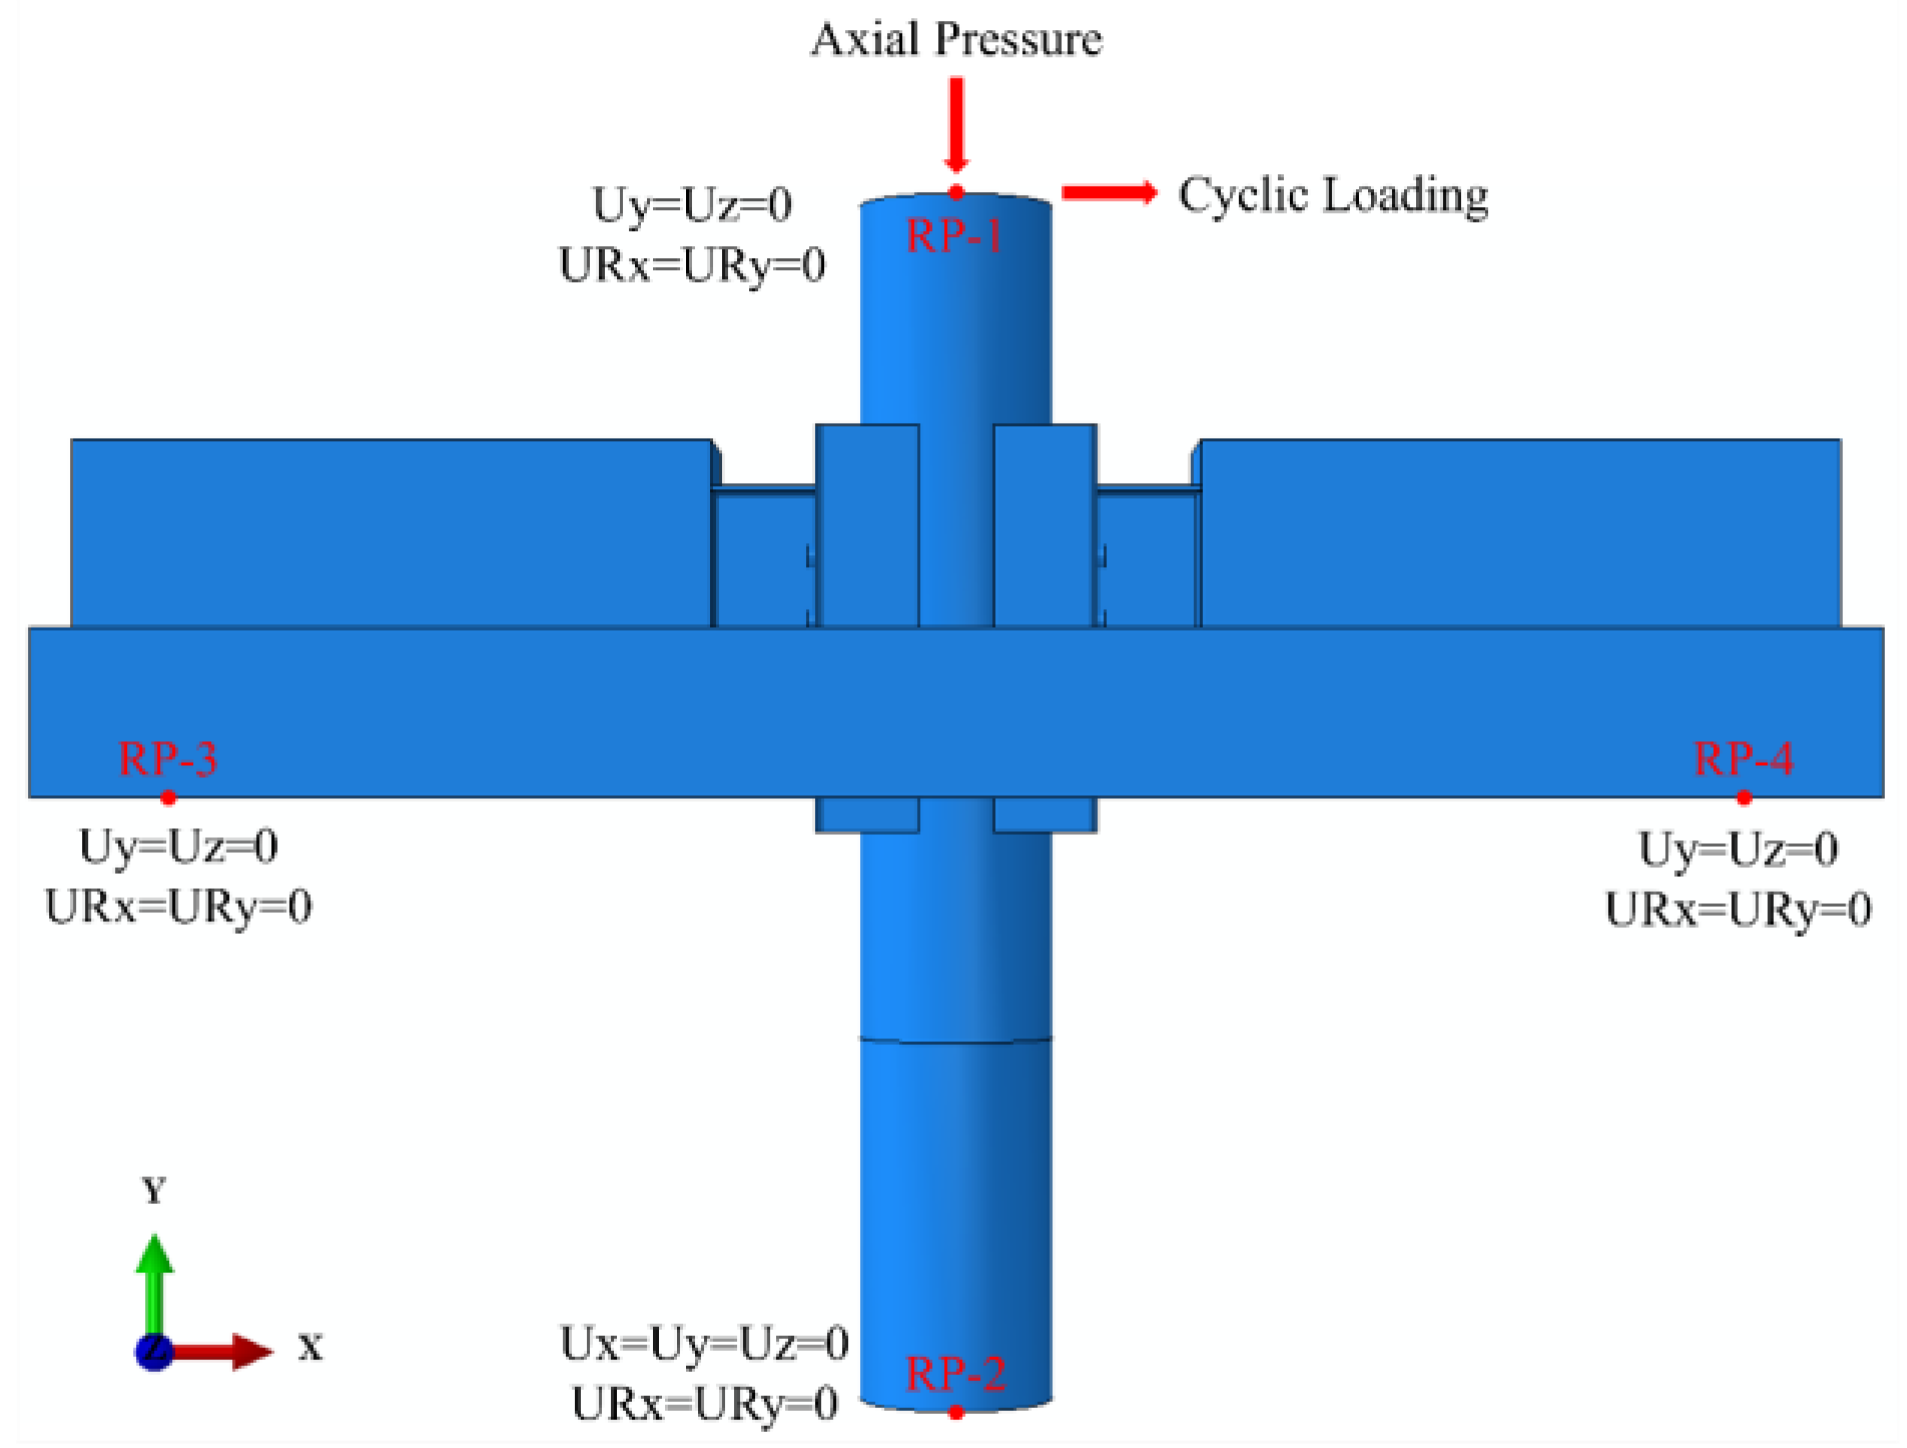
Based on the experimental loading system configuration, corresponding boundary conditions were systematically implemented at both ends of the CFST columns and concrete beams in the FEM. The coupling points RP1 and RP2 were established at the top and the bottom of the column, respectively, while the coupling points RP3 and RP4 were established at both ends of the beam. As shown in Figure 16, the corresponding displacement constraints and rotation constraints were set at the coupling points.
For bolted connections, a preload of 225 kN was applied to the 10.9 high-strength bolts by applying the “Bolt” load with constant pretension maintained throughout analysis steps [41]. Furthermore, a load-controlled vertical loading protocol was applied at the RP1 for initial application of design axial compression to predetermined values (2050 kN), followed by low-cycle displacement loading.

4.4. Verification of Finite Element Results

4.4.1. Hysteresis Curve

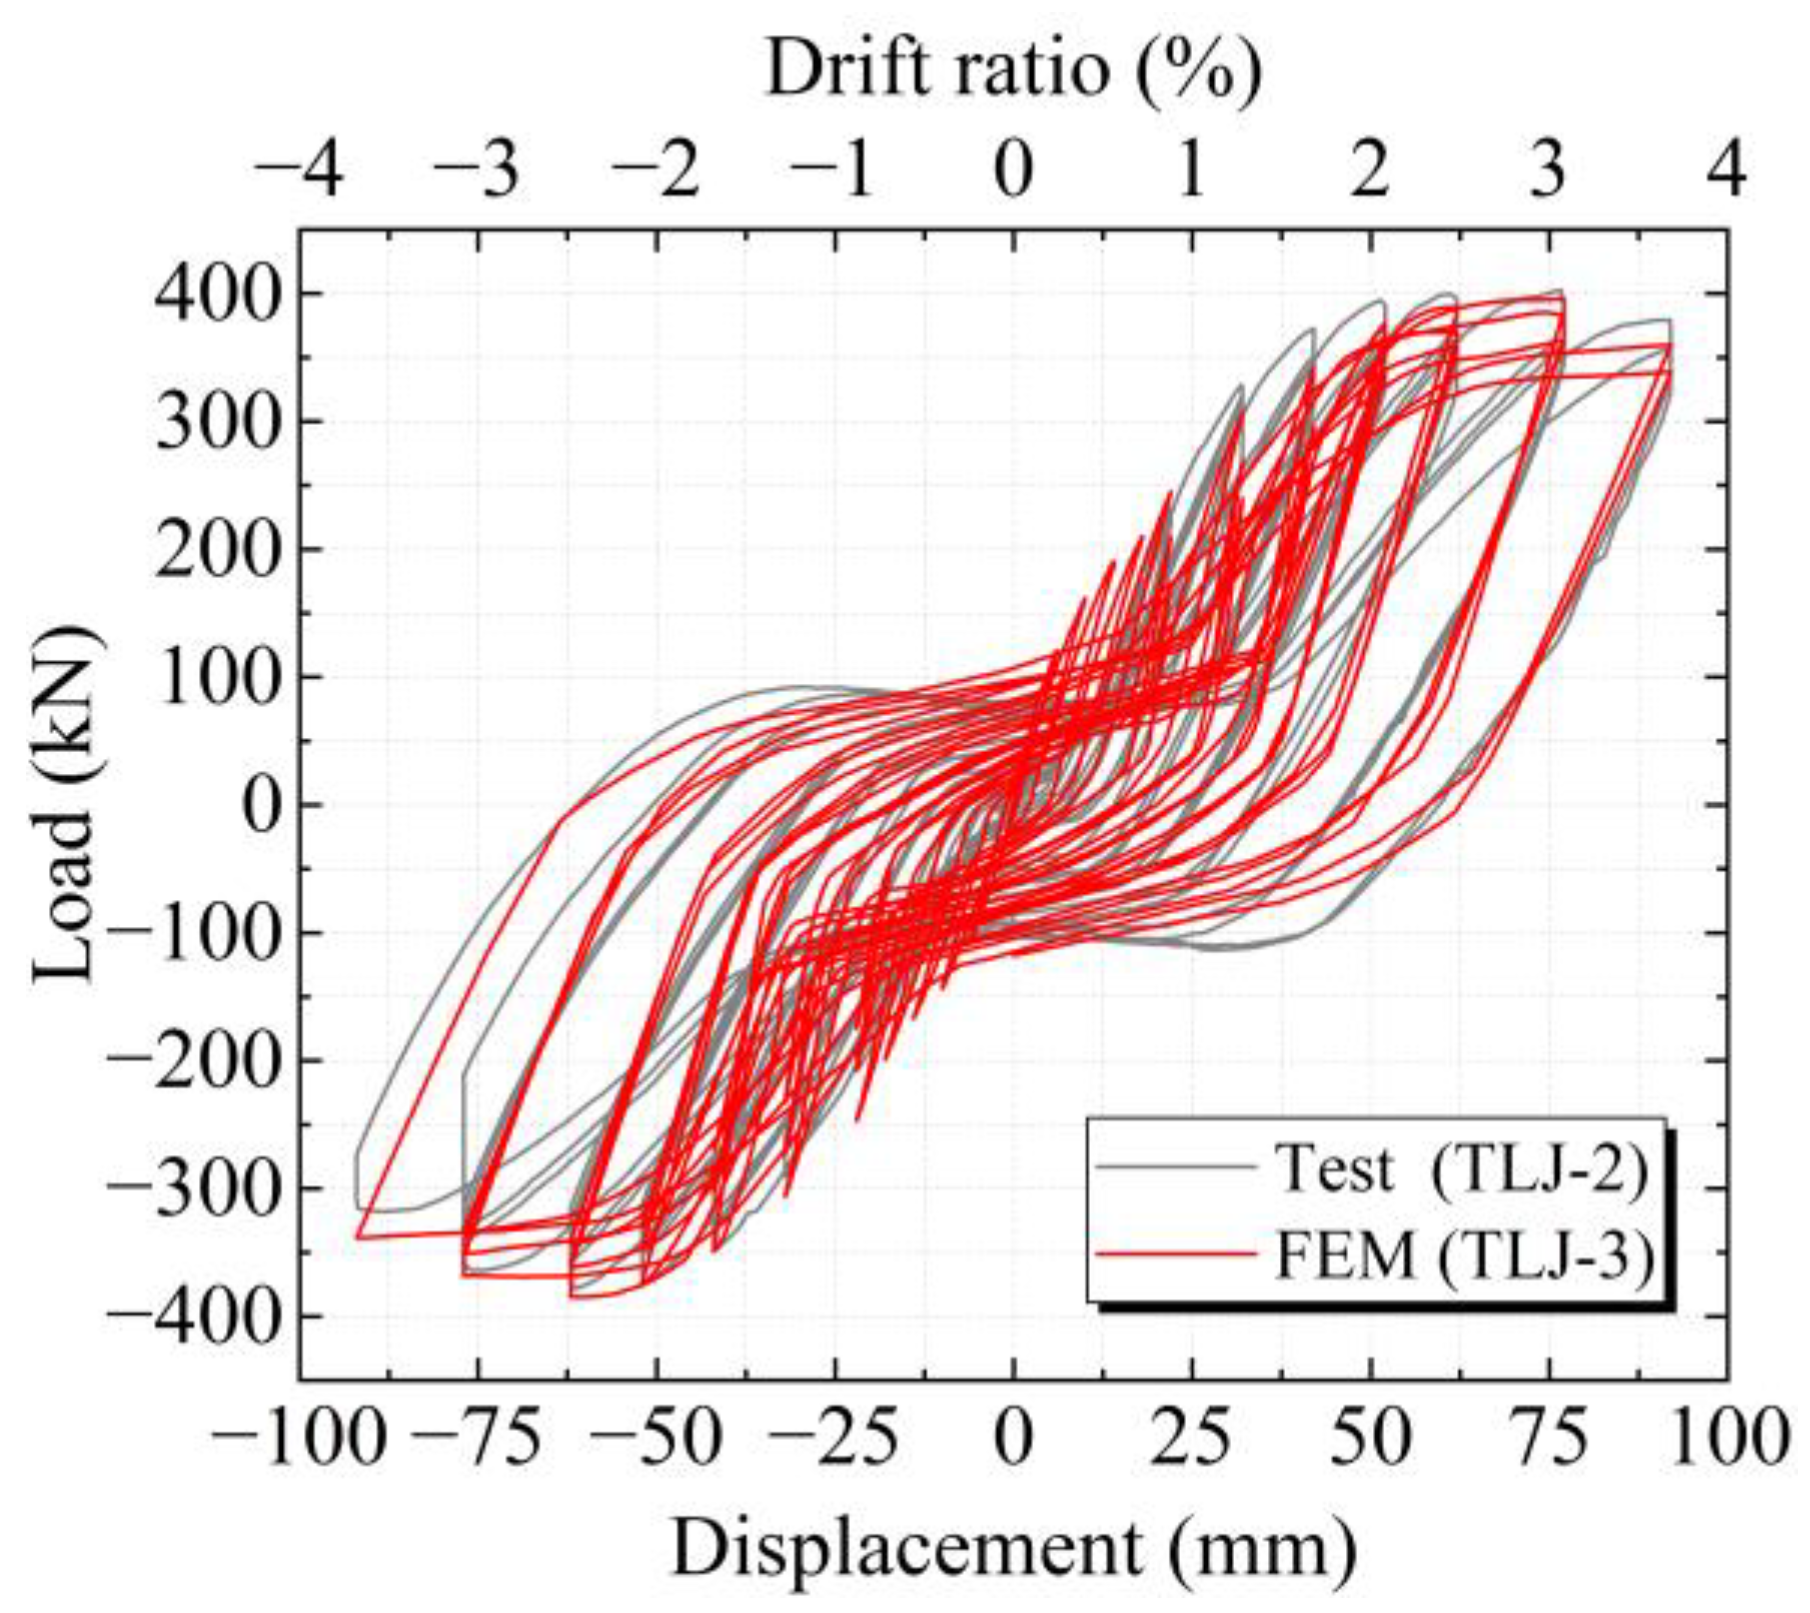
The hysteresis and skeleton curves of TLJ-3 simulated using ABAQUS are compared with experimental results (specimen TLJ-2) in Figure 17. Notably, from the hysteresis curves of the specimen joint, the comparison indicates that initial stiffness of TLJ-3 was slightly higher than that of specimen TLJ-2. Nevertheless, the disparity in the ultimate bearing capacity was insignificant. The “pinch” effect in the numerical simulation closely matched the experimental hysteresis curve, indicating acceptable discrepancies.

4.4.2. Crack Patterns

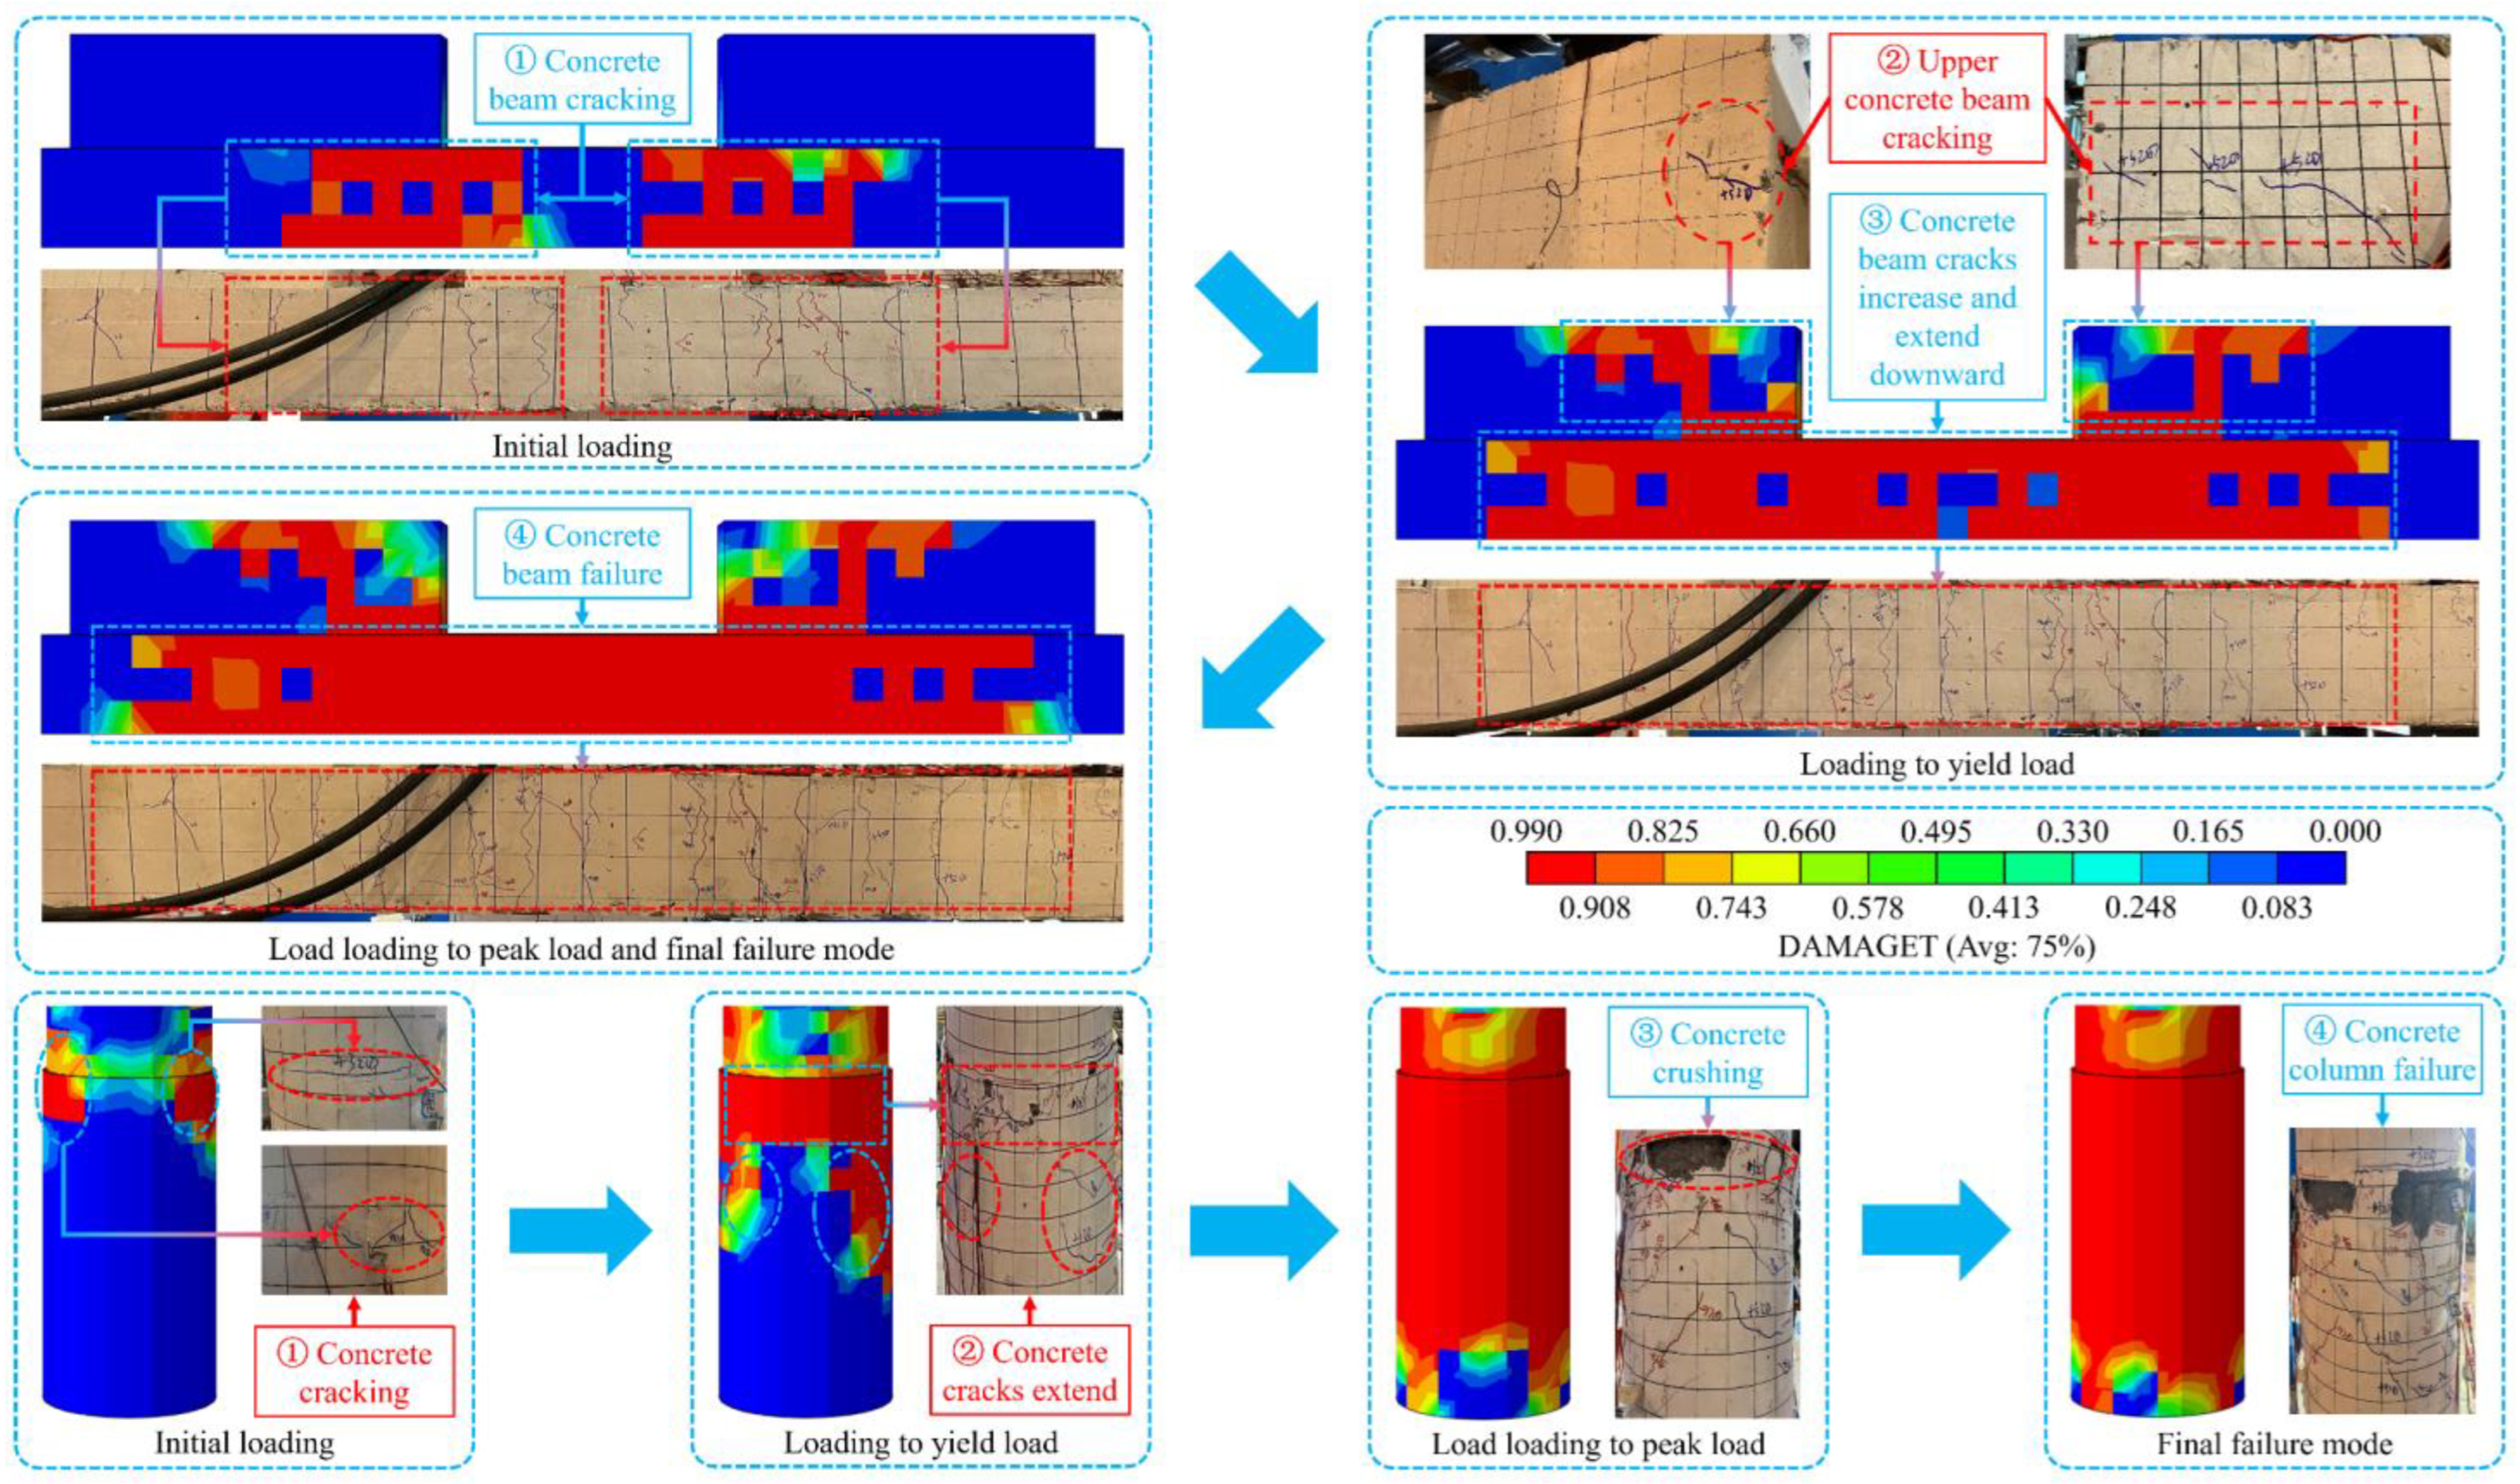
The concrete tensile damage development distribution cloud diagram can efficiently analyze the development trend of concrete cracks. Figure 18 exhibits the crack development patterns in both the inverted T-shaped concrete beam and concrete column of the ASCC joint. In the initial loading stage, multiple solid elements at the mid flange of the concrete beam reached damage, indicating that many cracks emerged. During the yield stage, the solid elements at the flange of the inverted T-shaped concrete beam were impending complete failure. More cracks appeared, and the original cracks extended, indicating that the inverted T-shaped concrete beam was close to failure. When the load reached the peak load, structural failure occurred until the end of the test. Compared with the lower concrete column, in the initial loading stage, there were few solid element failures at the interface between the lower concrete column and the steel tube. During the yield stage, the failure of the solid elements at the junction of the lower concrete column and lower steel tube increased, indicating that there were more cracks and the original cracks extended. However, the concrete lower column has not yet reached a complete failure state. When the load reached the peak load, the lower concrete column impended complete failure, with the concrete spalling phenomenon of the lower column observed during the test. With the end of the test loading, structural failure occurred with severe concrete spalling and reinforcement exposure.
The finite element simulation accurately replicated the experimental “strong column and weak beam” failure mode. The finite element simulation accurately replicated the experimental “strong column and weak beam” failure mode. Concrete tensile damage development distribution of concrete members exhibited strong correlation with observed crack progression across all loading stages, validating the reliability of FEM.

4.4.3. Failure Mode

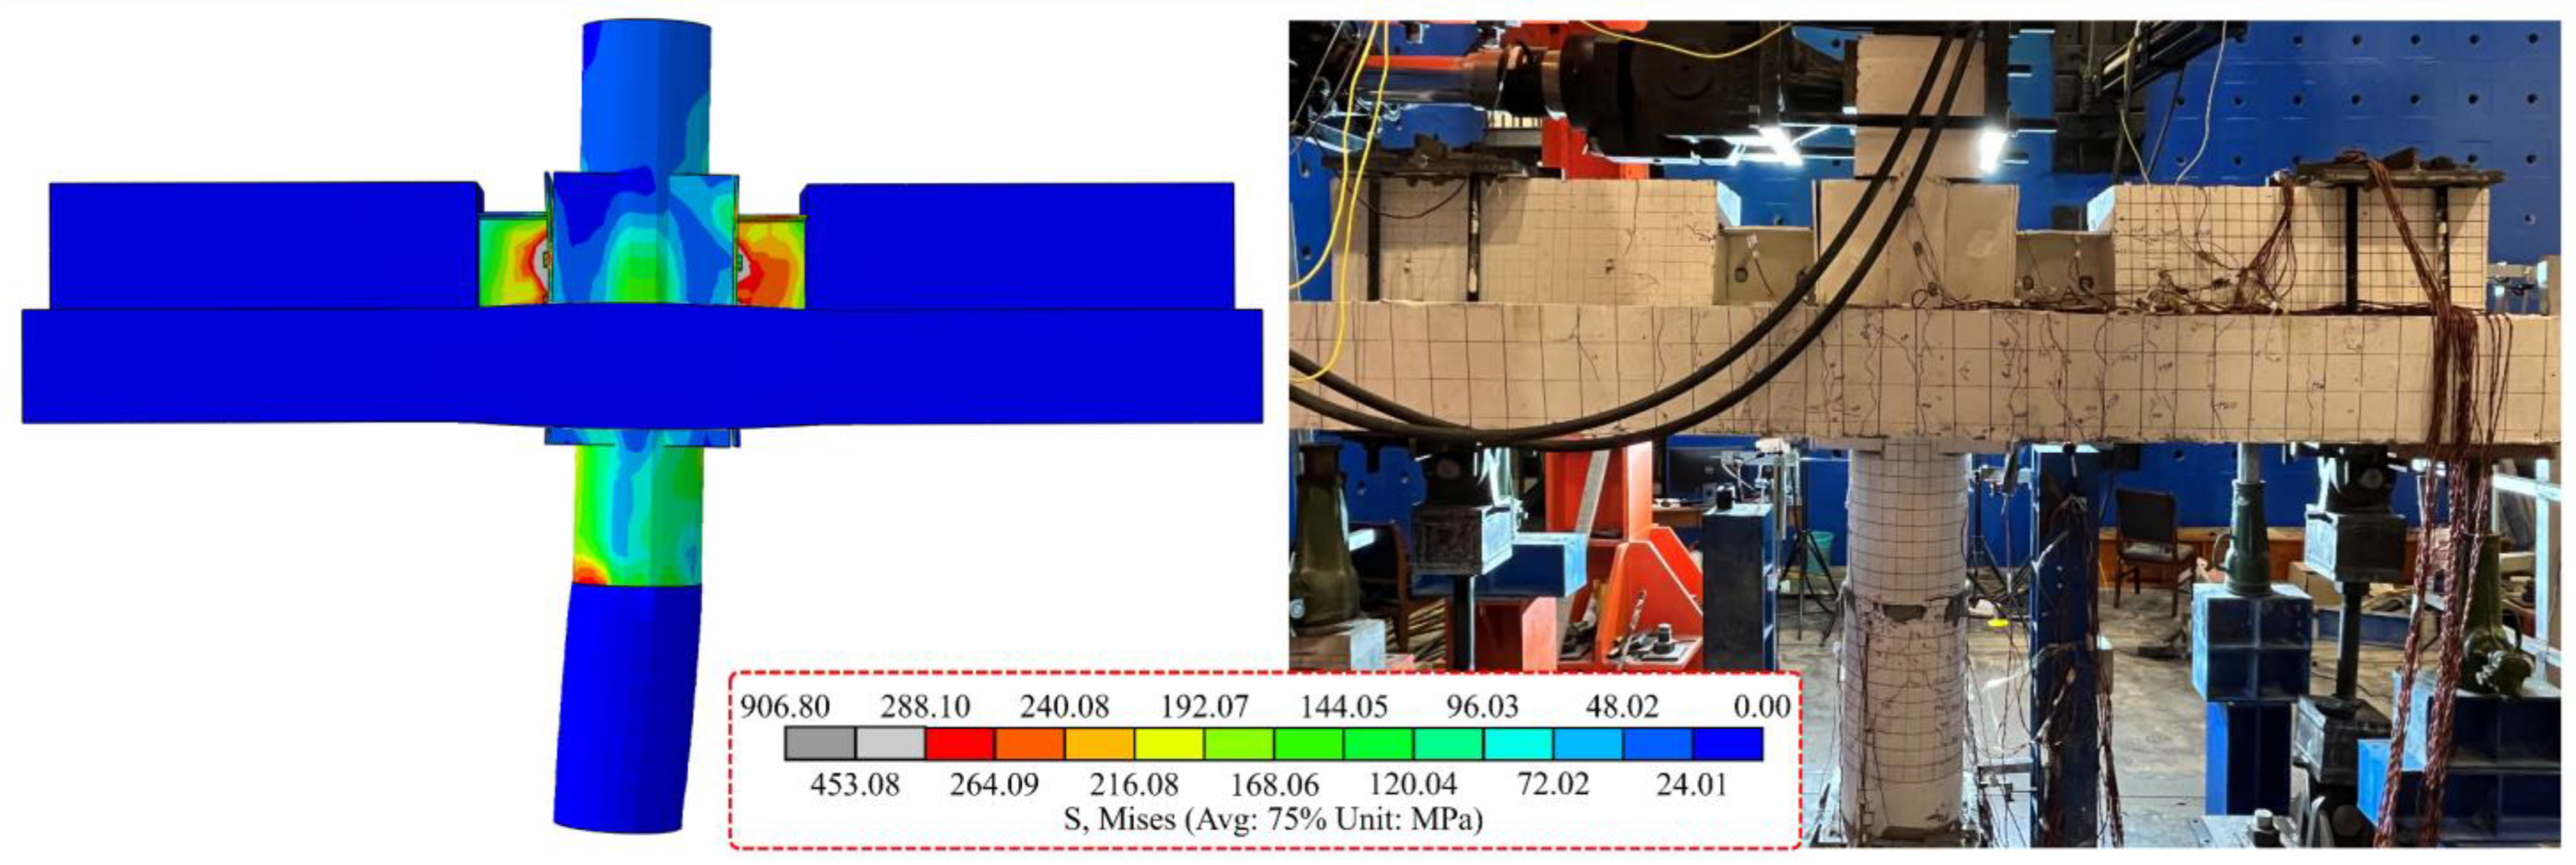
Figure 19 presents the stress distribution cloud diagram of TLJ-3, demonstrating a validated “strong column and weak beam” failure mode. The simulated failure progression initiated with pronounced flange buckling in the concrete inverted-T beam. Subsequent displacement increases caused sequential plastic hinge formation at both the upper flange of the H-shaped steel beam and the lower concrete column, followed by serious failure with concrete spalling and reinforcement exposure. Comparing the results of finite element analysis, the stress and deformation of each part are consistent.
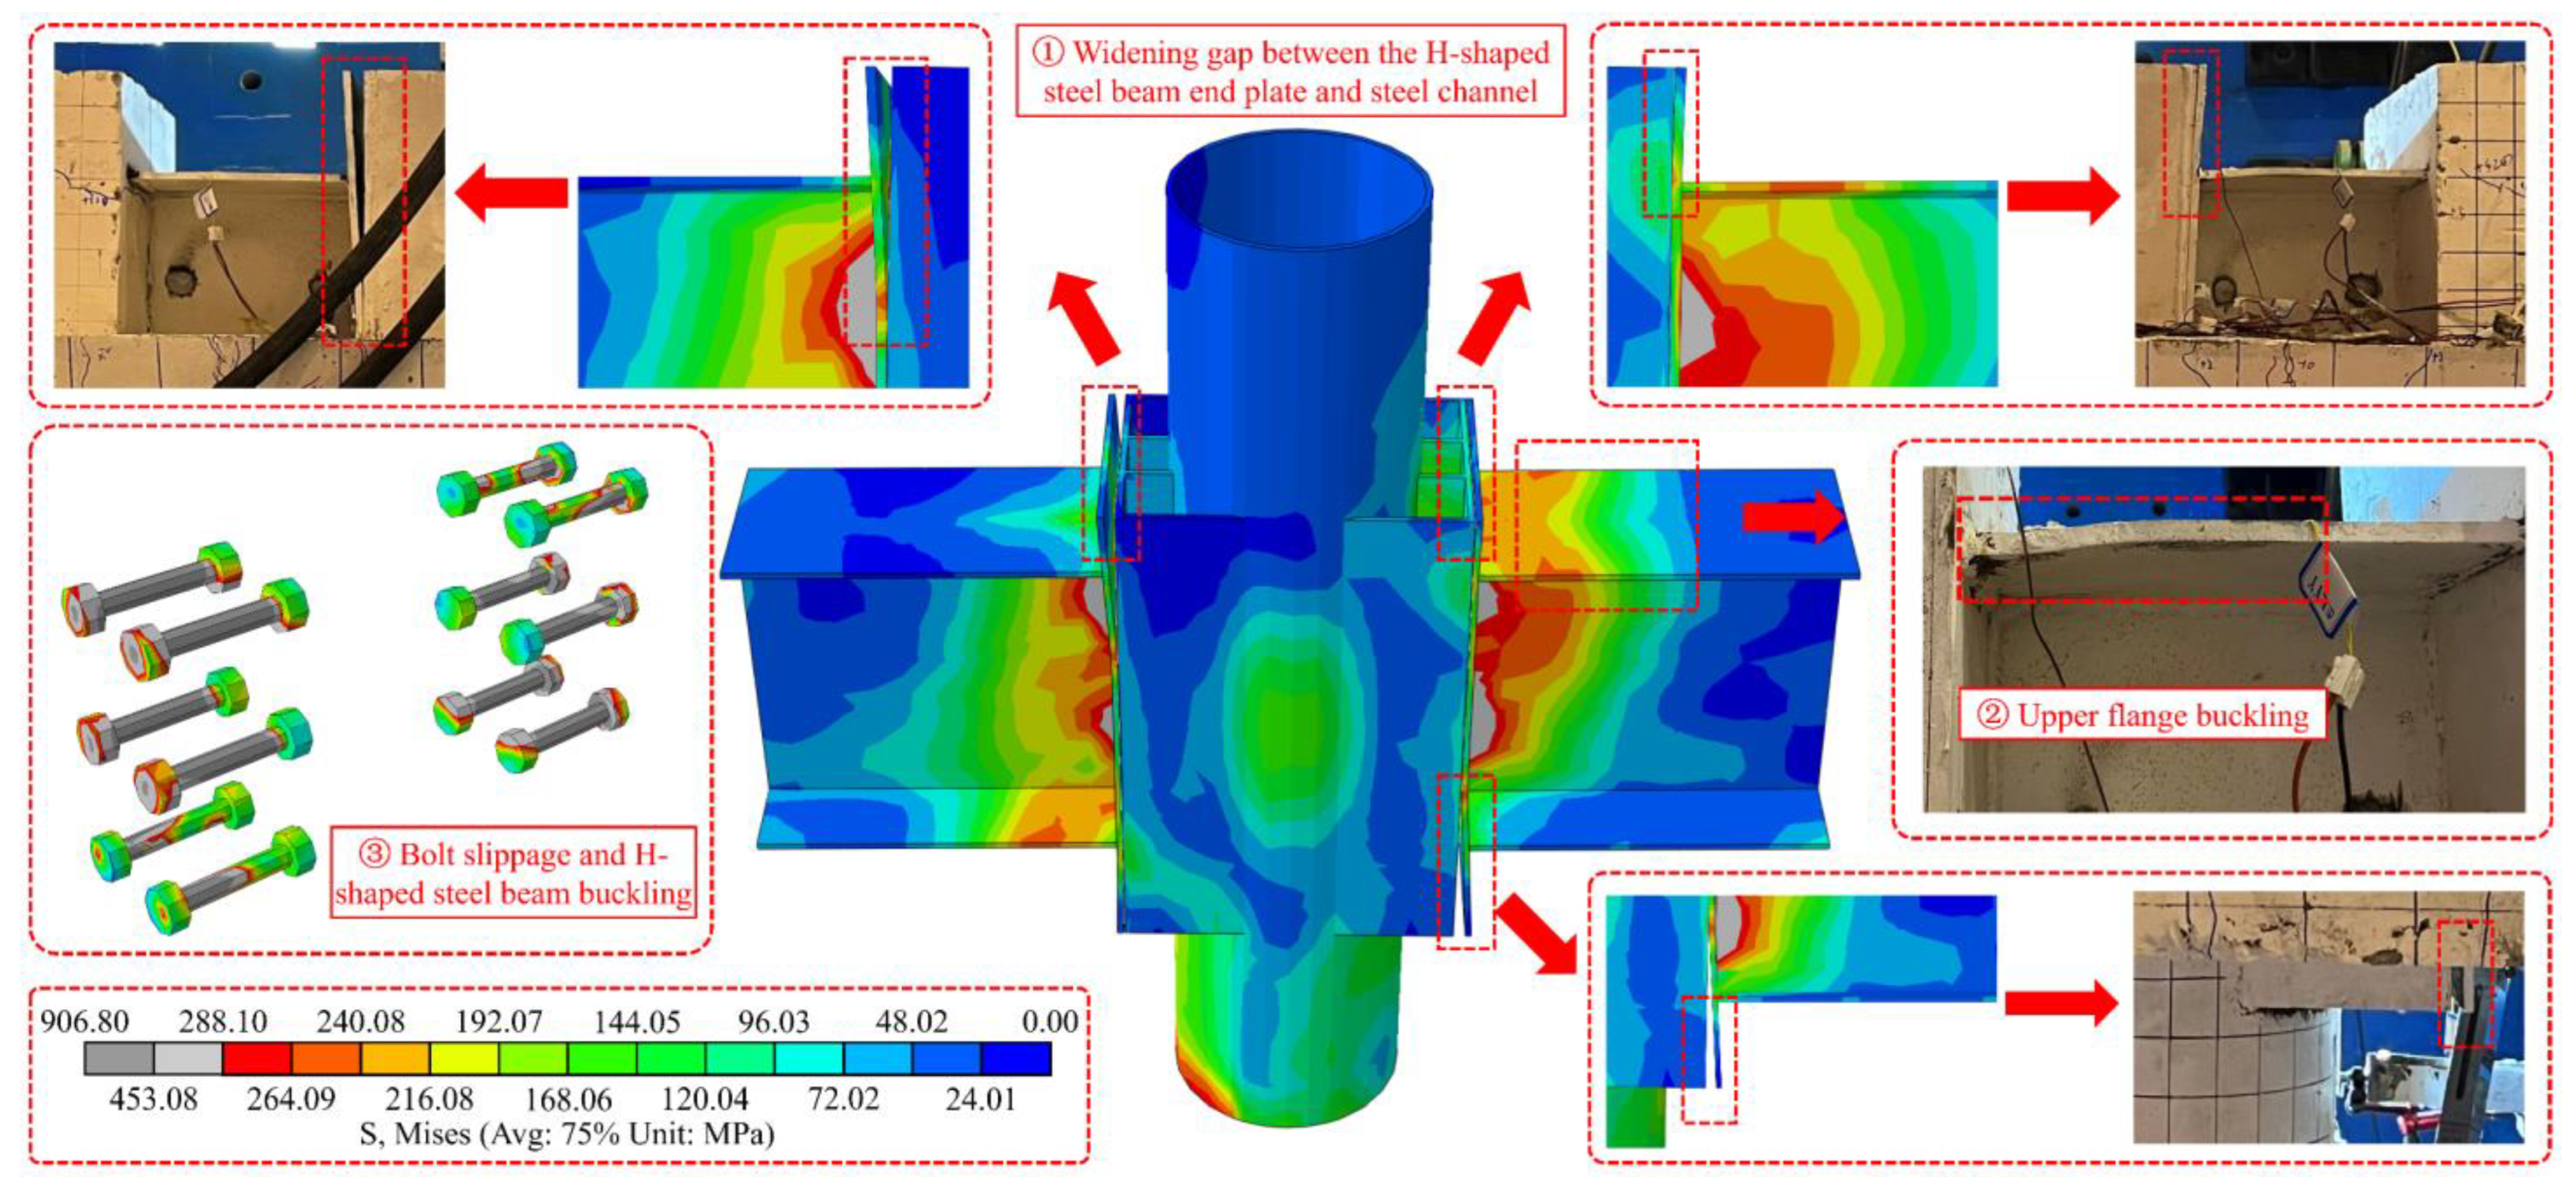
Figure 20 presents the stress distribution cloud diagram for steel members in specimen TLJ-3. FEM results show that the end plate of the H-shaped steel beam yields, and the upper and lower extended steel plates form large gaps with the steel channel. The upper flange yielding deformation developed in the H-shaped steel beam. High stress zones are located around bolt holes in both end plates of the H-shaped steel beam and steel channels, and bolt yielding confirmed at maximum stress concentration, reaching 906.8 MPa. Severe steel plate deformation combined with bolt yielding induced the bolt slippage at the joint. Accelerated stiffness degradation during the cyclic loading process after unloading, resulting in larger displacement under minor lateral load variations, and notable stress concentrations were identified in the lower steel tube end. Validation analysis confirmed excellent agreement between finite element simulation results and experimental observations.
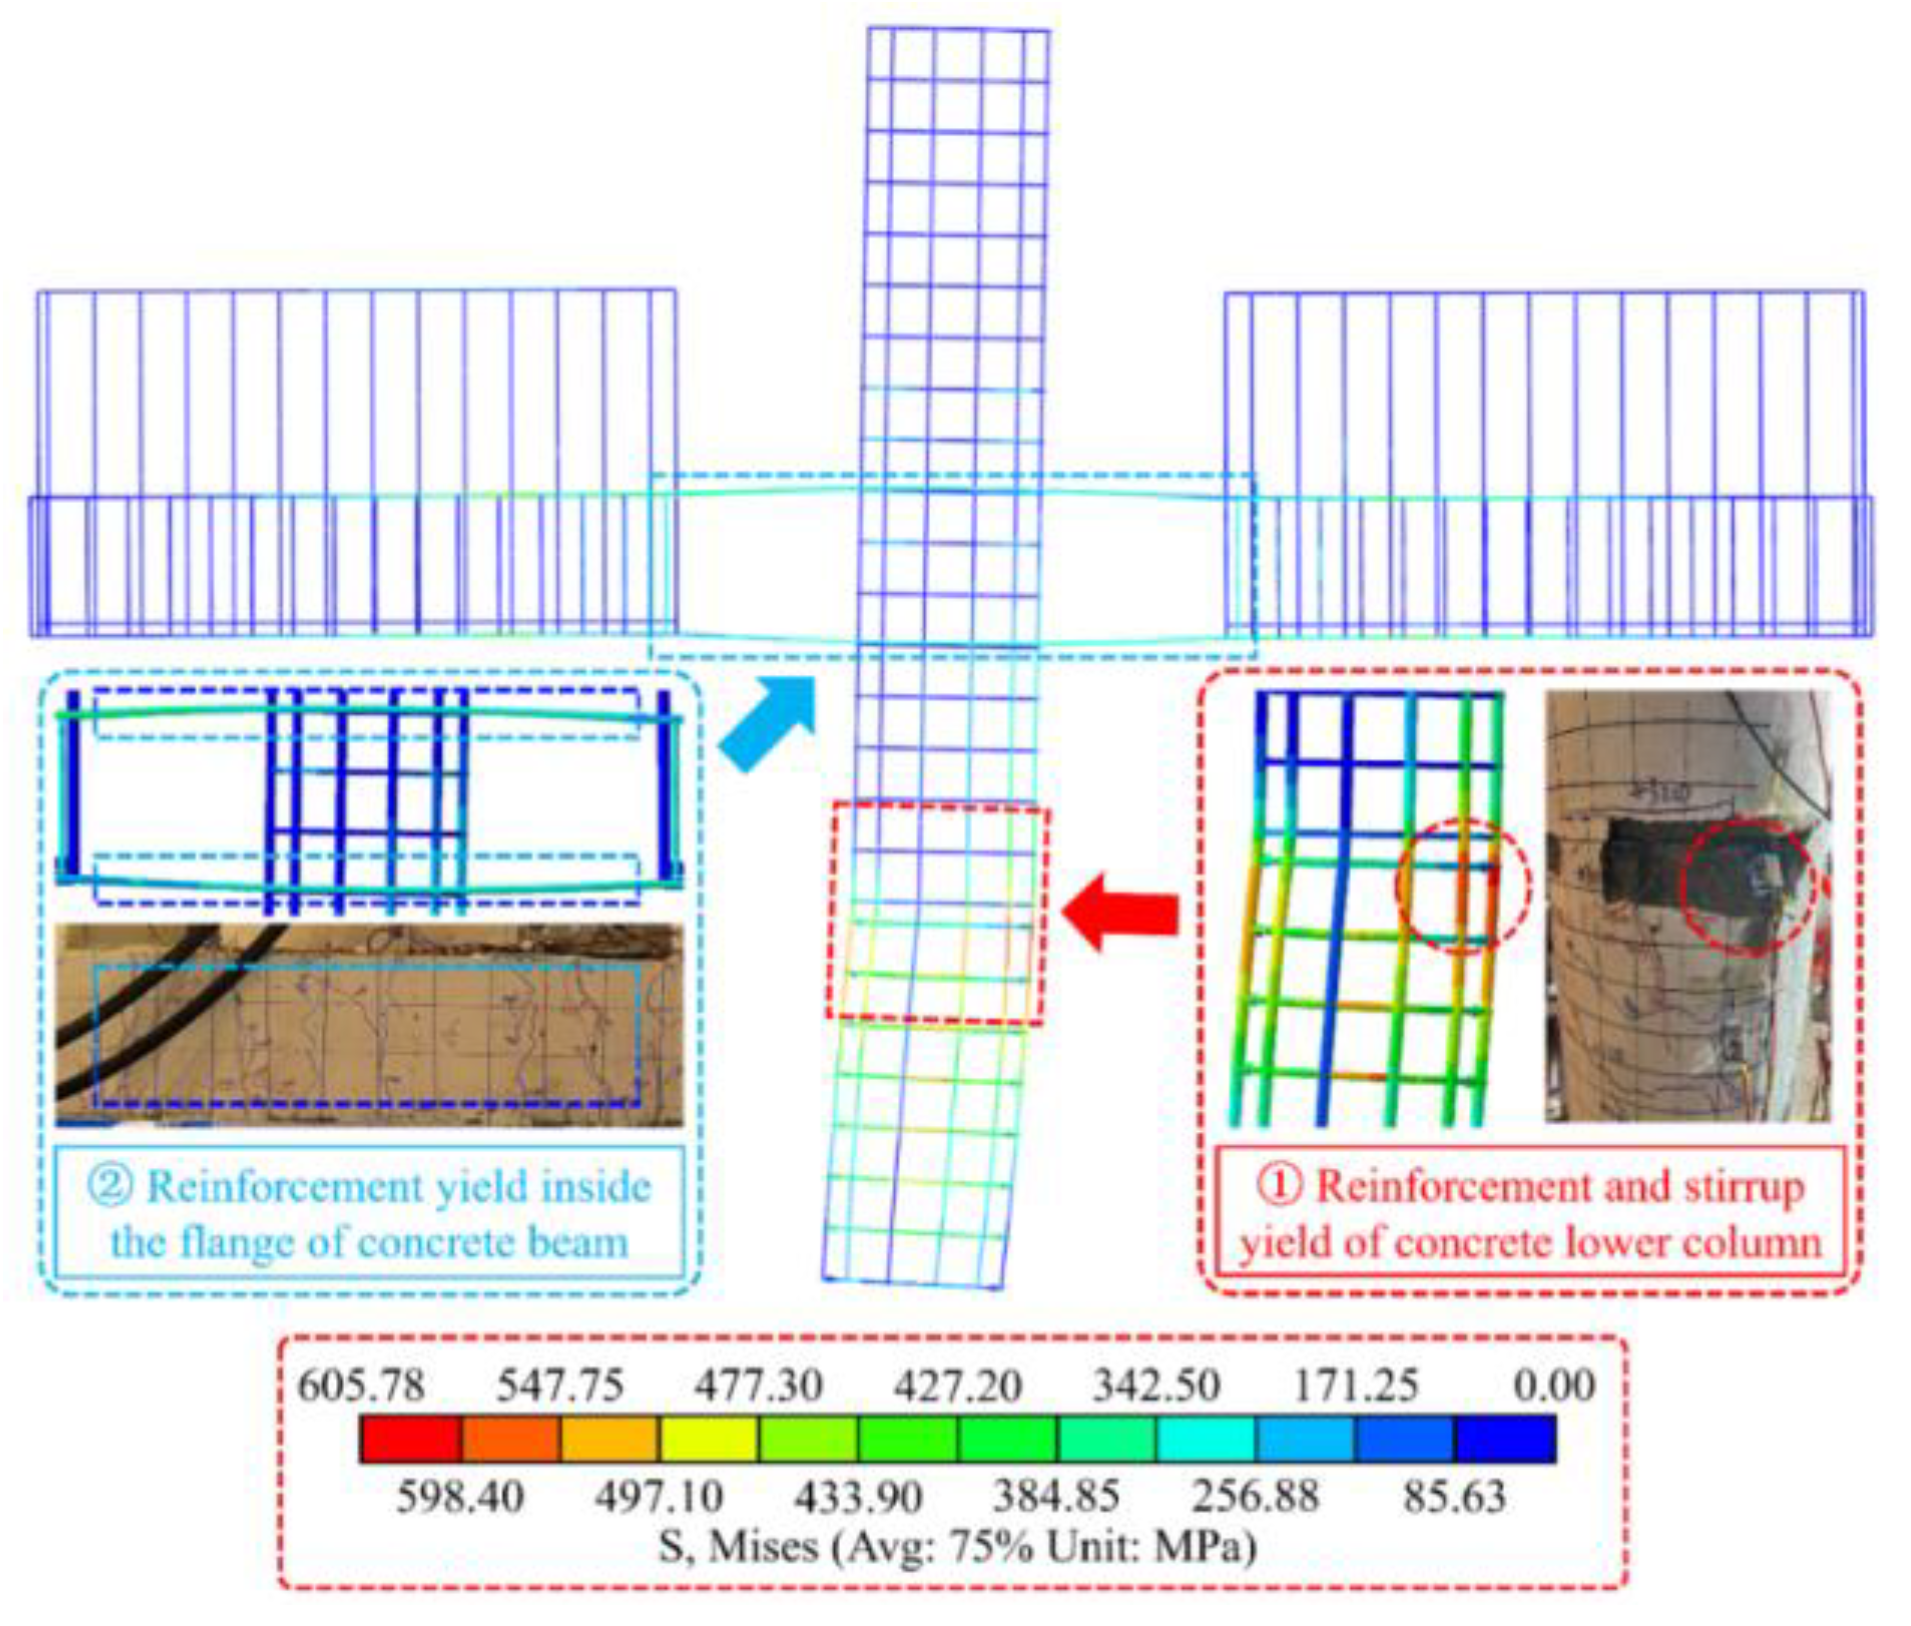
Figure 21 presents stress distribution contours of internal reinforcement in TLJ-3. The stirrups in concrete inverted-T beams and CFST columns remained below yield stress, while those in the lower concrete column reached yield strength, and the stress of some stirrups has exceeded the ultimate stress. Longitudinal reinforcement exhibited yielding at the midspan flange of concrete inverted-T beams, with maximum stress occurring at steel–concrete interfaces in lower concrete columns (589.8 MPa), approaching the ultimate tensile strength (598.4 MPa), which demonstrated strong correlation with experimental strain measurements.
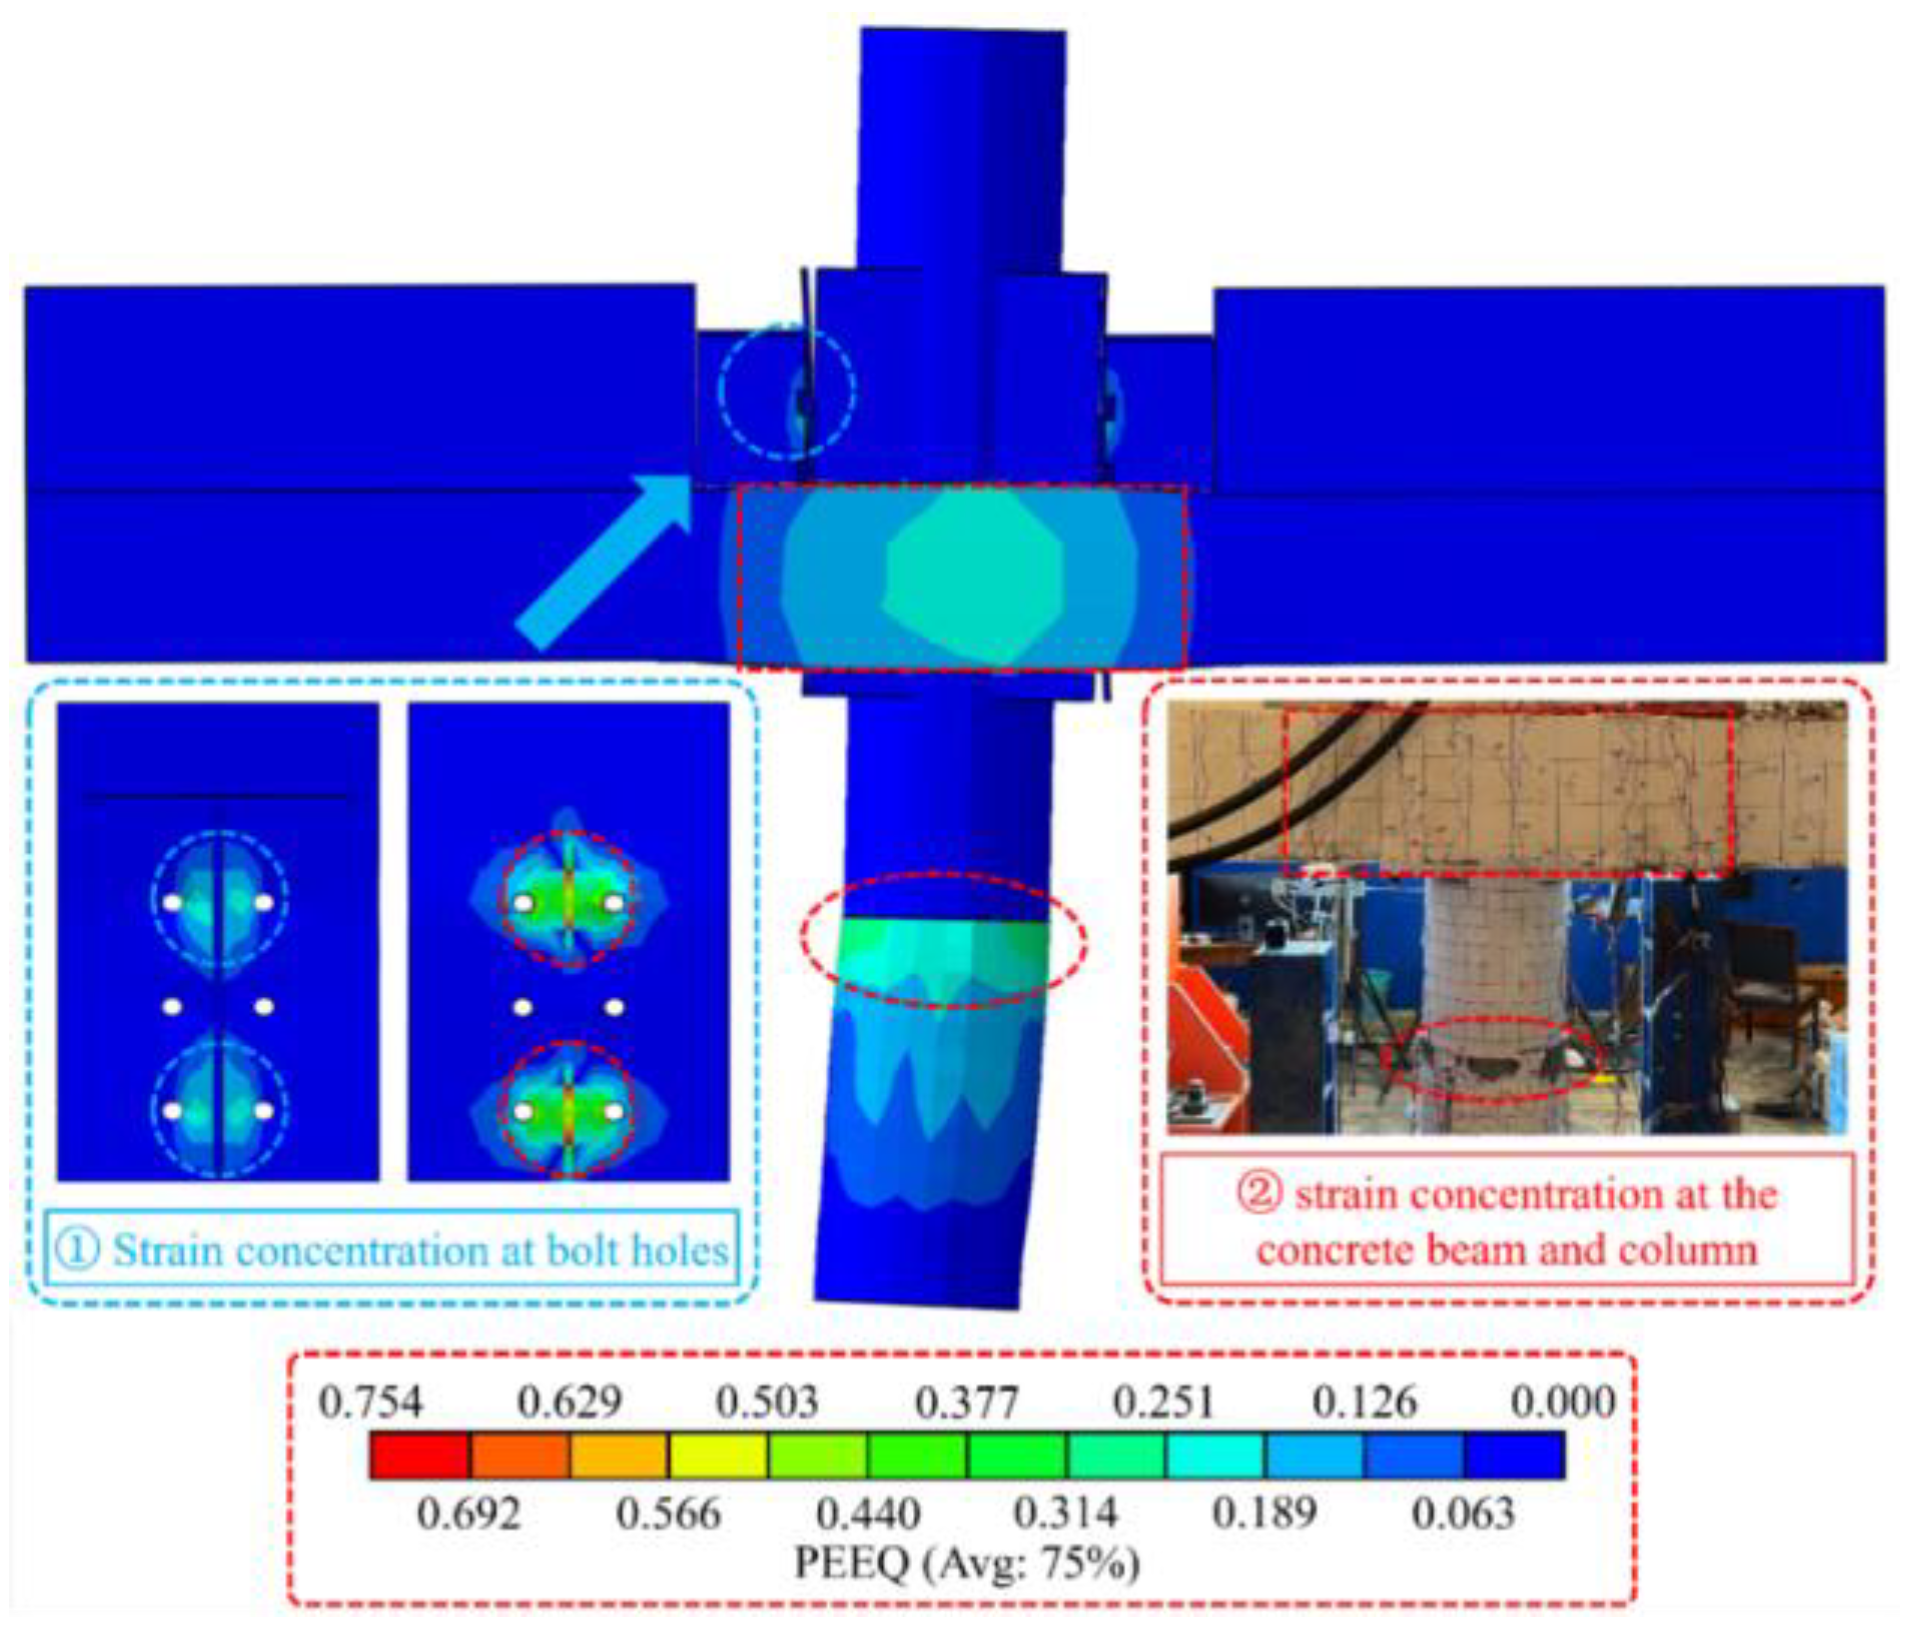
Figure 22 presents the stress distribution cloud diagram for steel members in specimen TLJ-3. FEM results show that the end plate of the H-shaped steel beam yields, and the upper and lower extended steel plates form large gaps with the steel channel. The upper flange yielding deformation developed in the H-shaped steel beam. High stress zones are located around bolt holes in both end plates of the H-shaped steel beam and steel channels, and bolt yielding confirmed at maximum stress concentration, reaching 906.8 MPa. Severe steel plate deformation combined with bolt yielding induced the bolt slippage at the joint. Accelerated stiffness degradation during the cyclic loading process after unloading, resulting in larger displacement under minor lateral load variations, and notable stress concentrations were identified in the lower steel tube end. Validation analysis confirmed excellent agreement between finite element simulation results and experimental observations.

5. Seismic Performance Analysis

5.1. Hysteresis Curve

This section presents a numerical investigation into the effects of four critical parameters on the seismic performance of ASCC top-layer joints. The study aims to establish optimal dimensional configurations and quantify their effects through comparative analysis of multiple parametric models. Utilizing the FEM introduced in Section 4, TLJ-3 was chosen as the foundational model, maintaining identical material properties and geometric characteristics to specimen TLJ-2. Details parameters of the FEM are shown in Table 6.
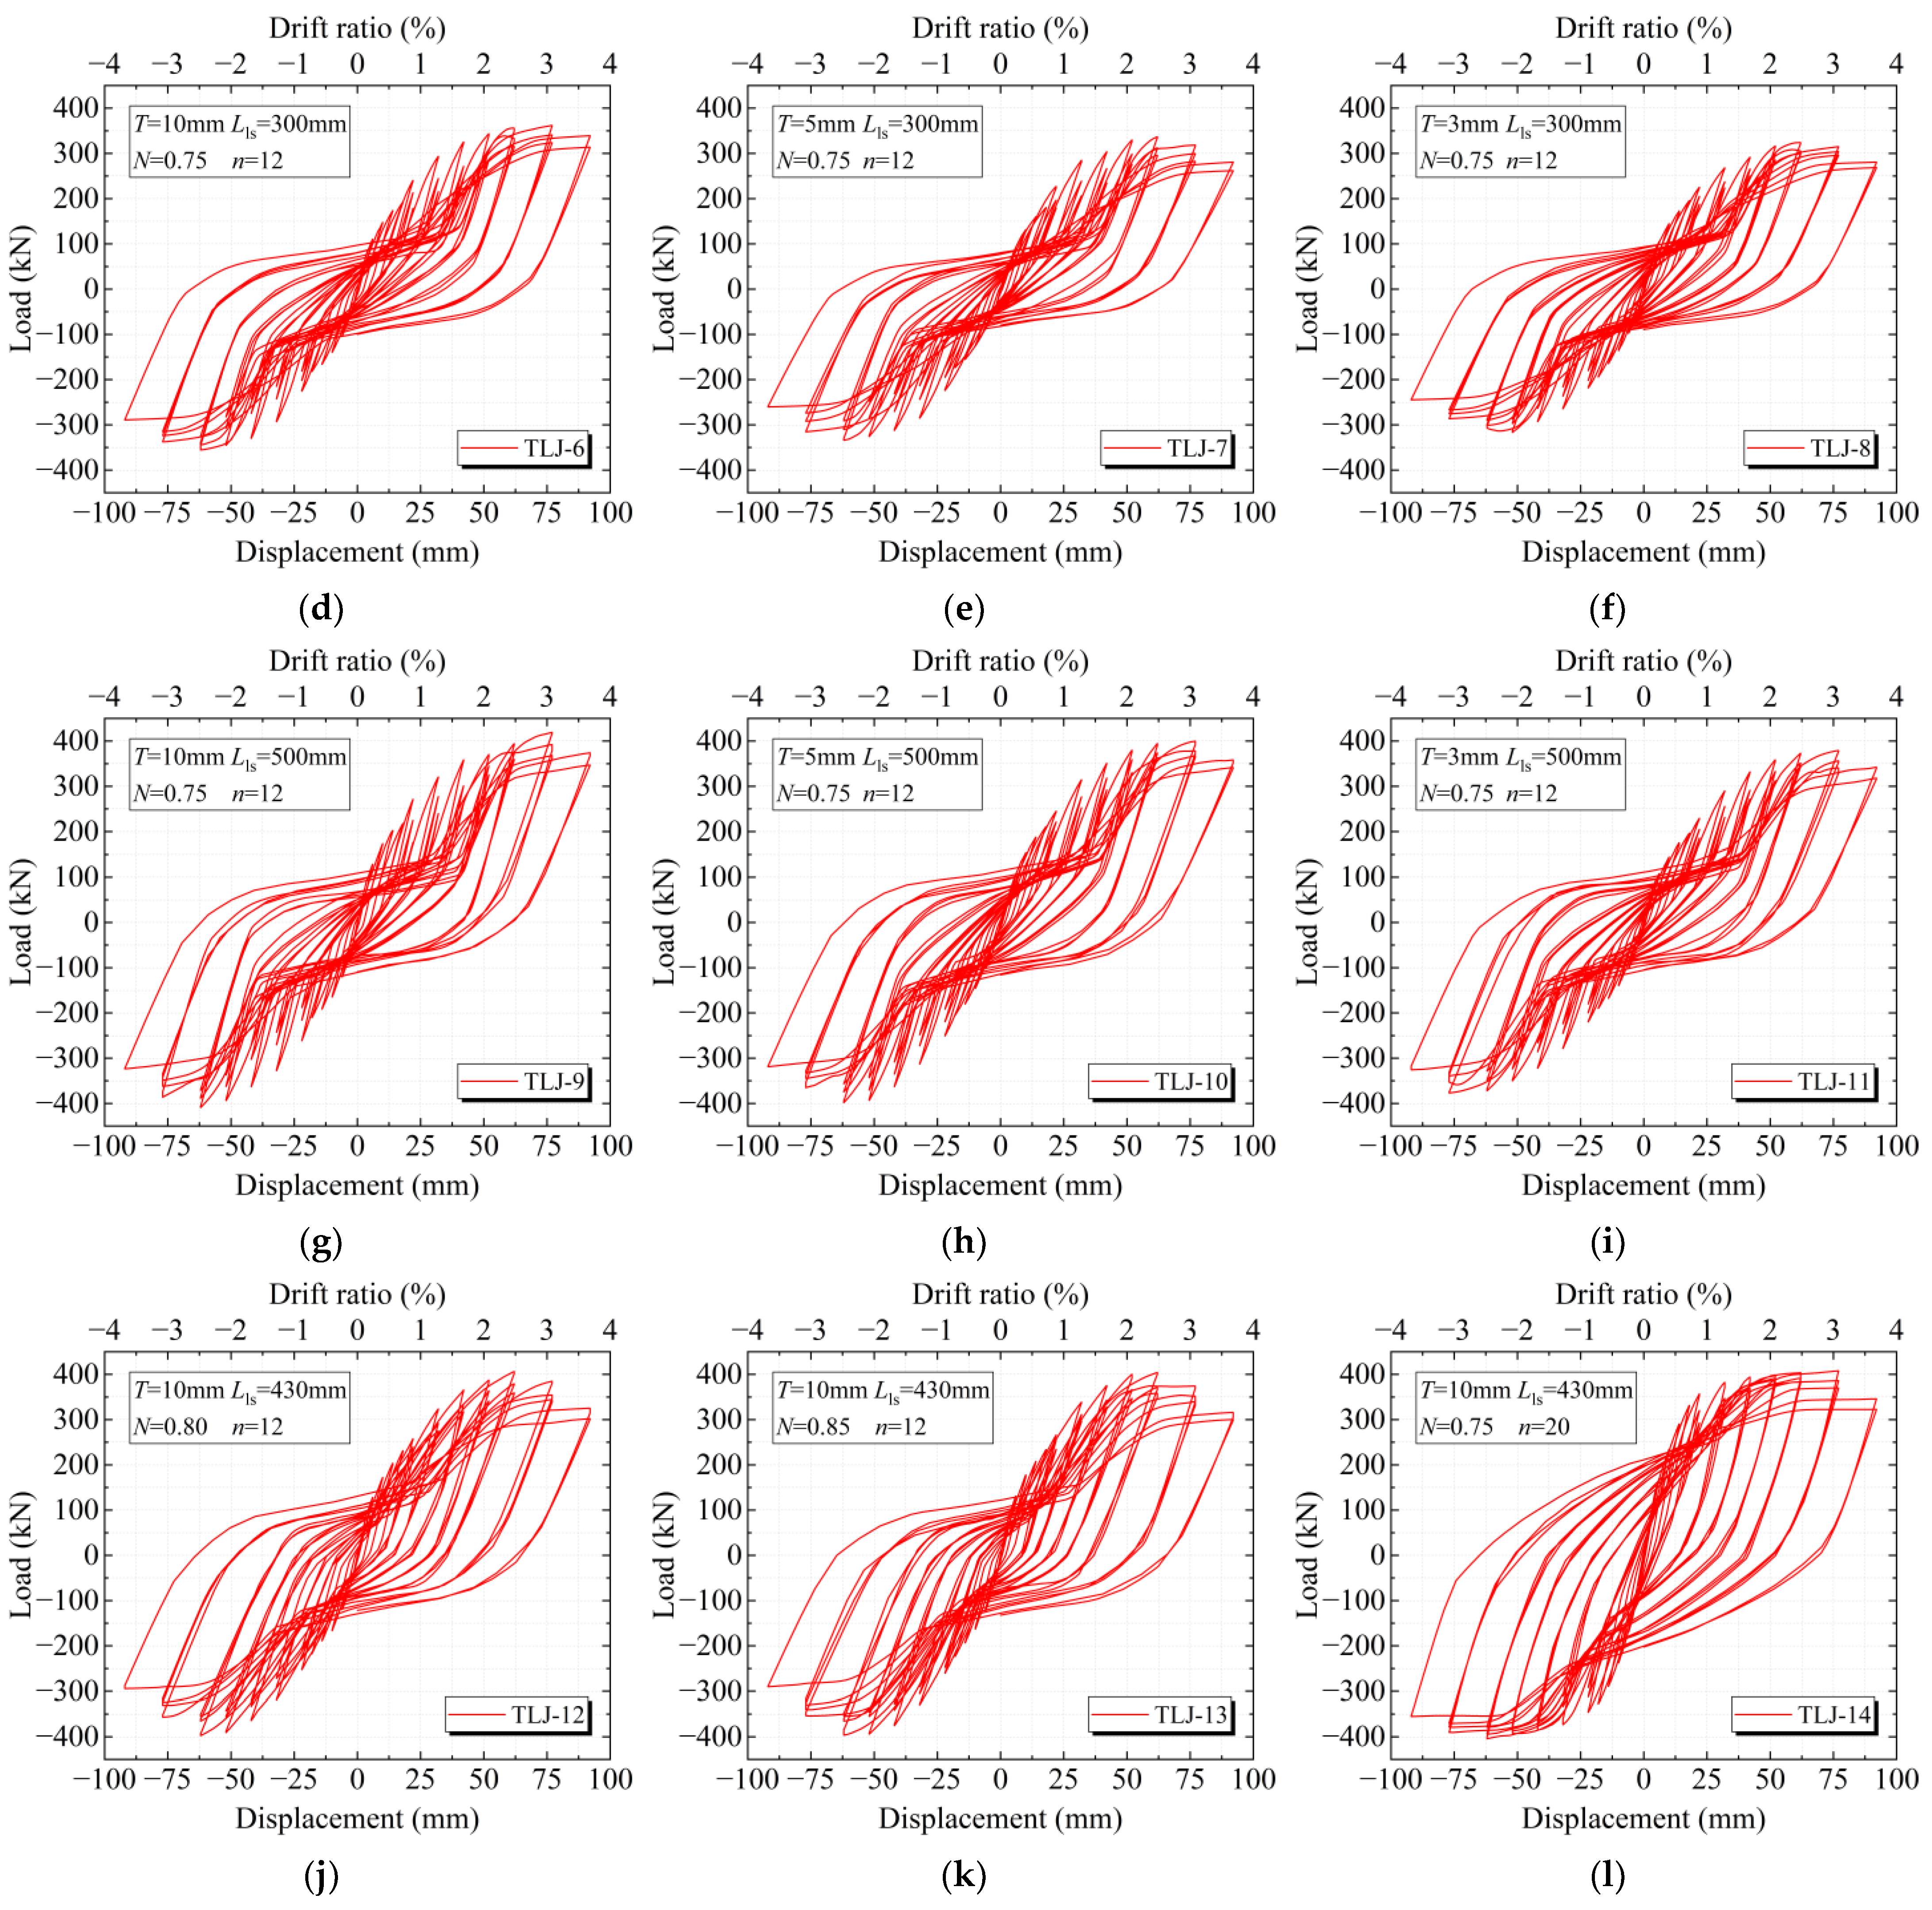
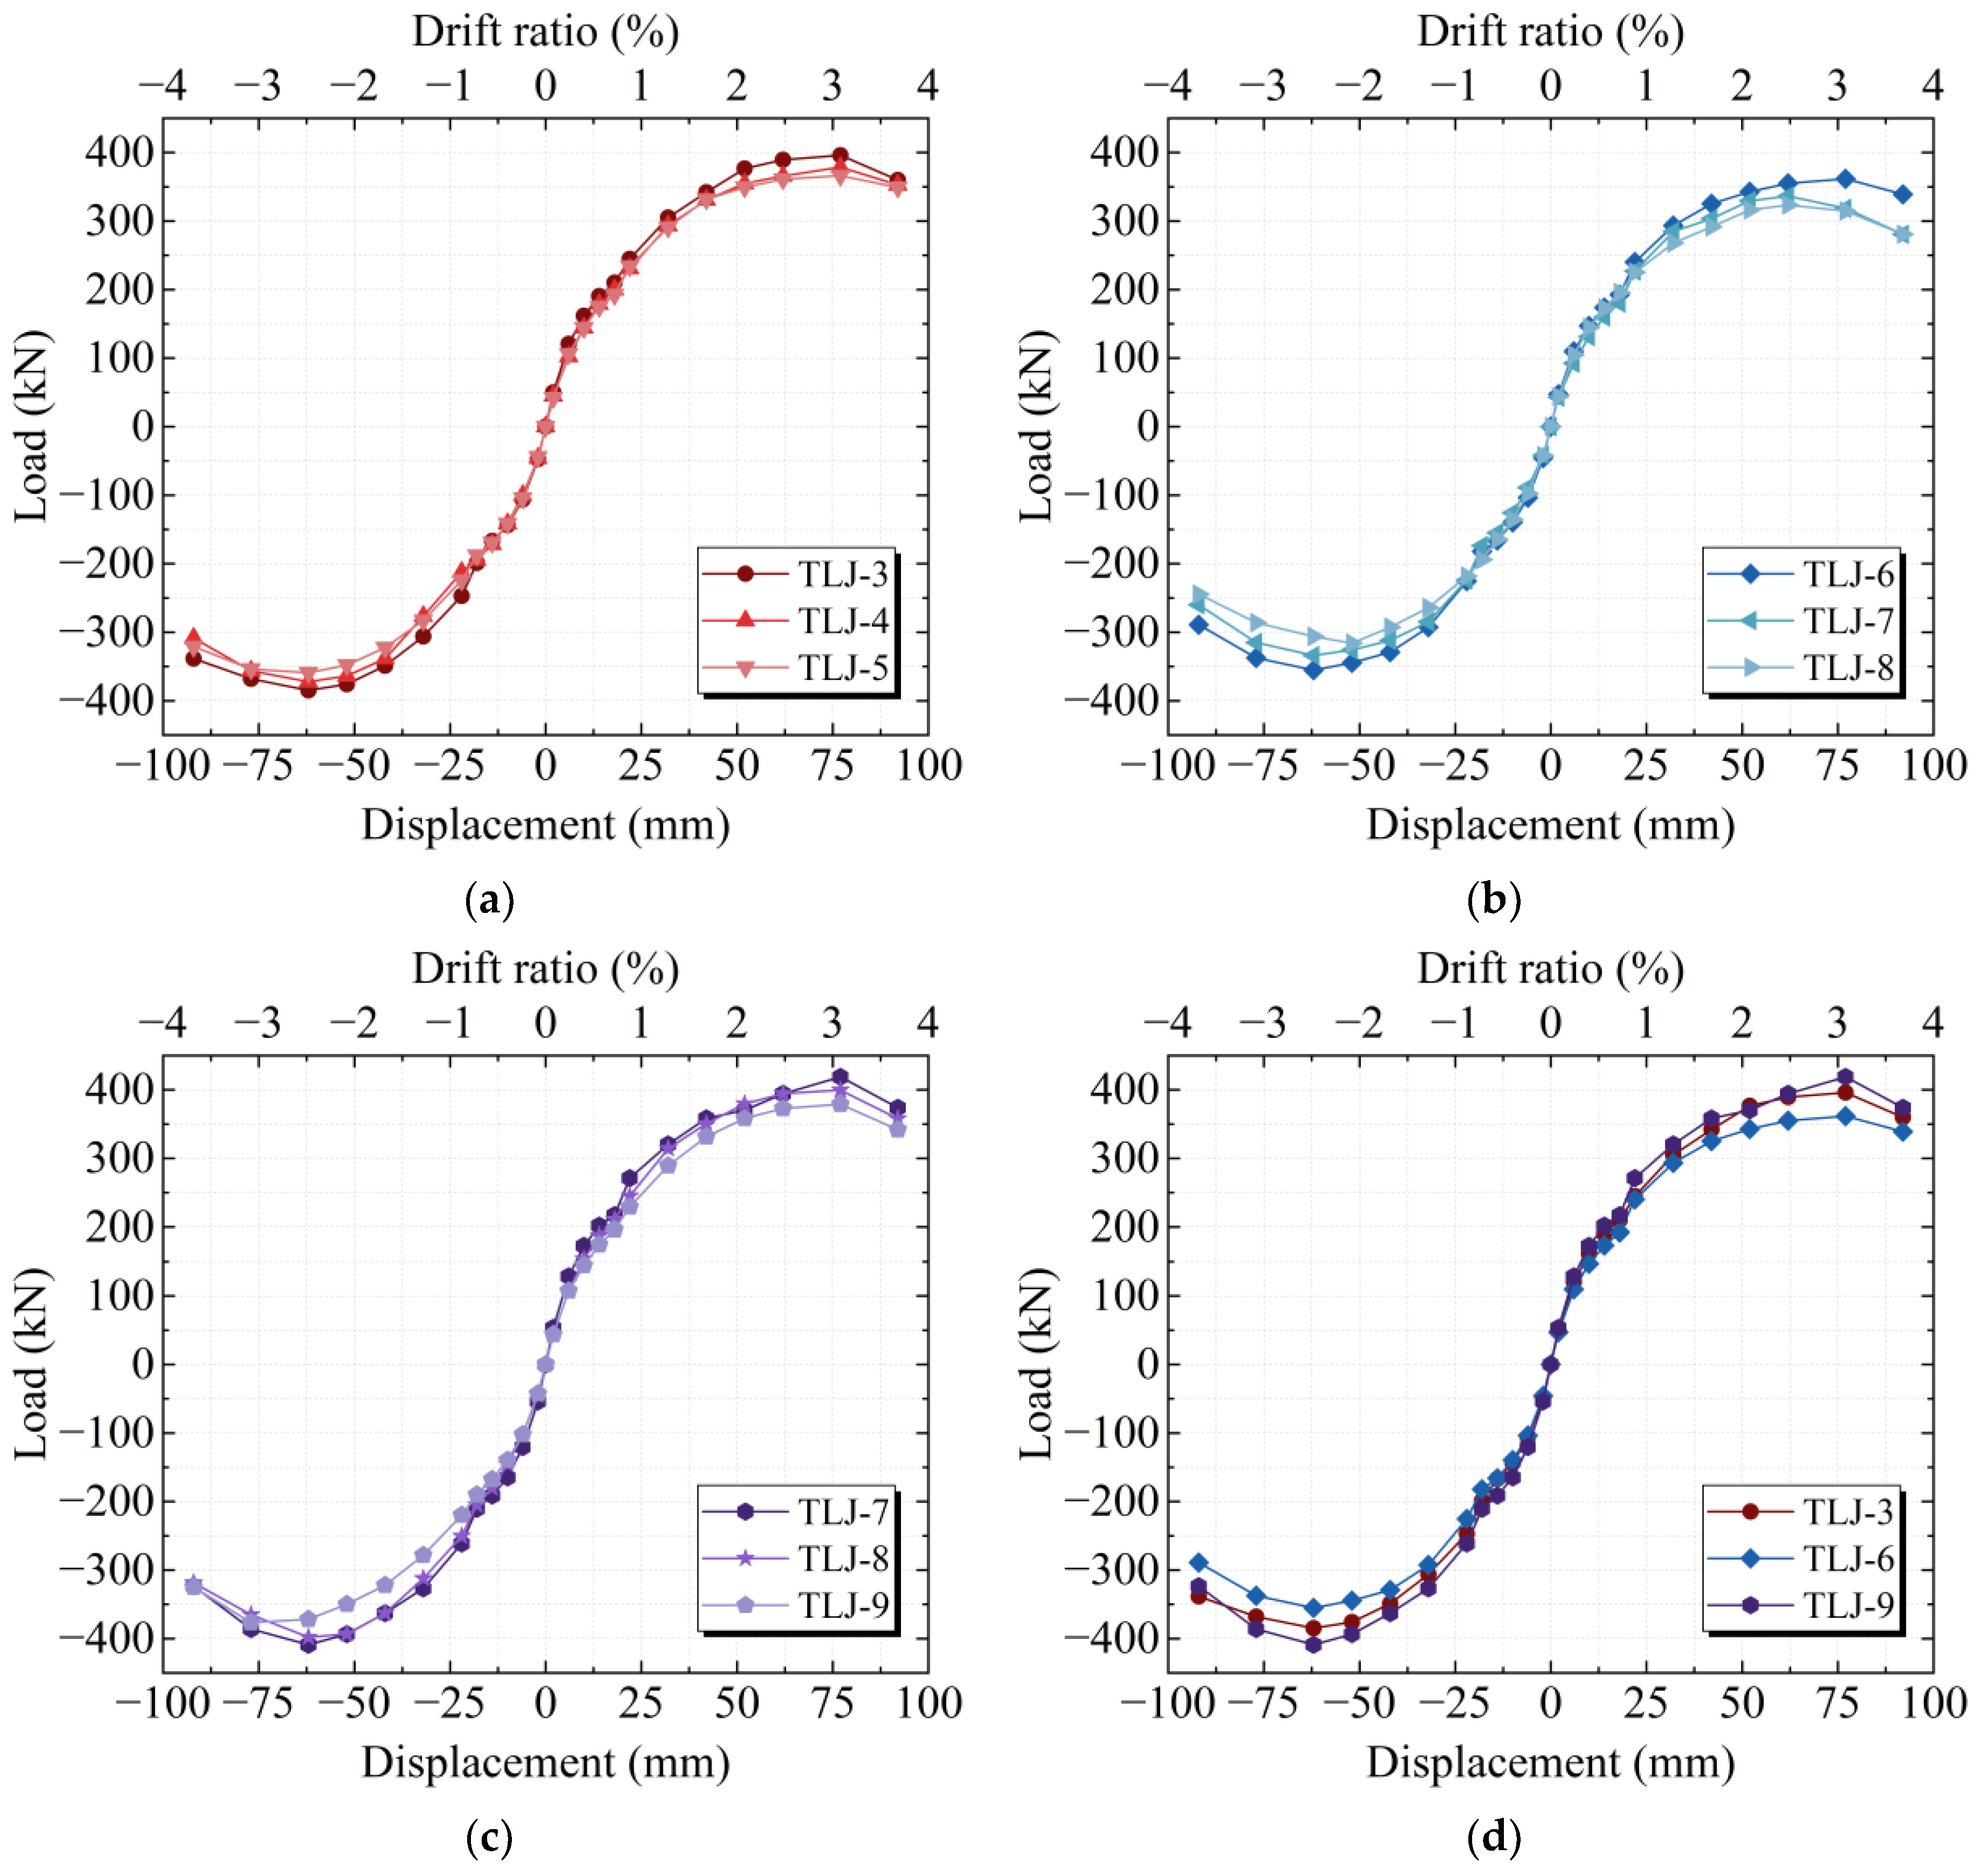
The variable parameters were steel tube thickness (T = 10, 5, 3), lower steel tube length (Lls = 430, 300, 500), axial compression ratio (N = 0.75, 0.80, 0.85), and bolt quantity (n = 12, 20). Through systematic parameter variation, this investigation specifically examines the influence of four variable parameters on the hysteretic behavior of ASCC top-layer joints. Twelve hysteresis curves of TLJ-3 through TLJ-14 are exhibited in Figure 23.
During the initial loading stage, TLJ-3–TLJ-13 exhibited minor global deformation with spindle-shaped hysteretic loops. With progressive cyclic loading increments, the hysteretic behavior transitioned to inverse S-shaped configurations due to reinforcement bond-slip effects, which manifested extended slip segments accompanied by a progressive reduction in slope. In contrast, specimen TLJ-14 demonstrated distinct behavior. With increasing cyclic load, its hysteresis loops maintained a relatively full shape, evolving from an initial spindle shape to a bow-shaped profile. This difference in TLJ-14 is attributed to the increased bolt quantities n. Bolts connecting the extended steel plates of the H-shaped steel beams to the steel channels effectively restricted deformation of the extended plates. This restraint ensured the overall stiffness of the specimen during cyclic loading, thereby significantly mitigating the “pinch” effect caused by bolt slippage. The bow-shaped hysteresis loops indicate that some slip influence remained; however, as bolt slippage was largely constrained, this influence primarily stemmed from reinforcement bond-slip. Consequently, TLJ-14 exhibited superior plastic deformation capacity and demonstrated enhanced seismic performance compared to the other specimens.

5.2. Skeleton Curve and Ductility Analysis

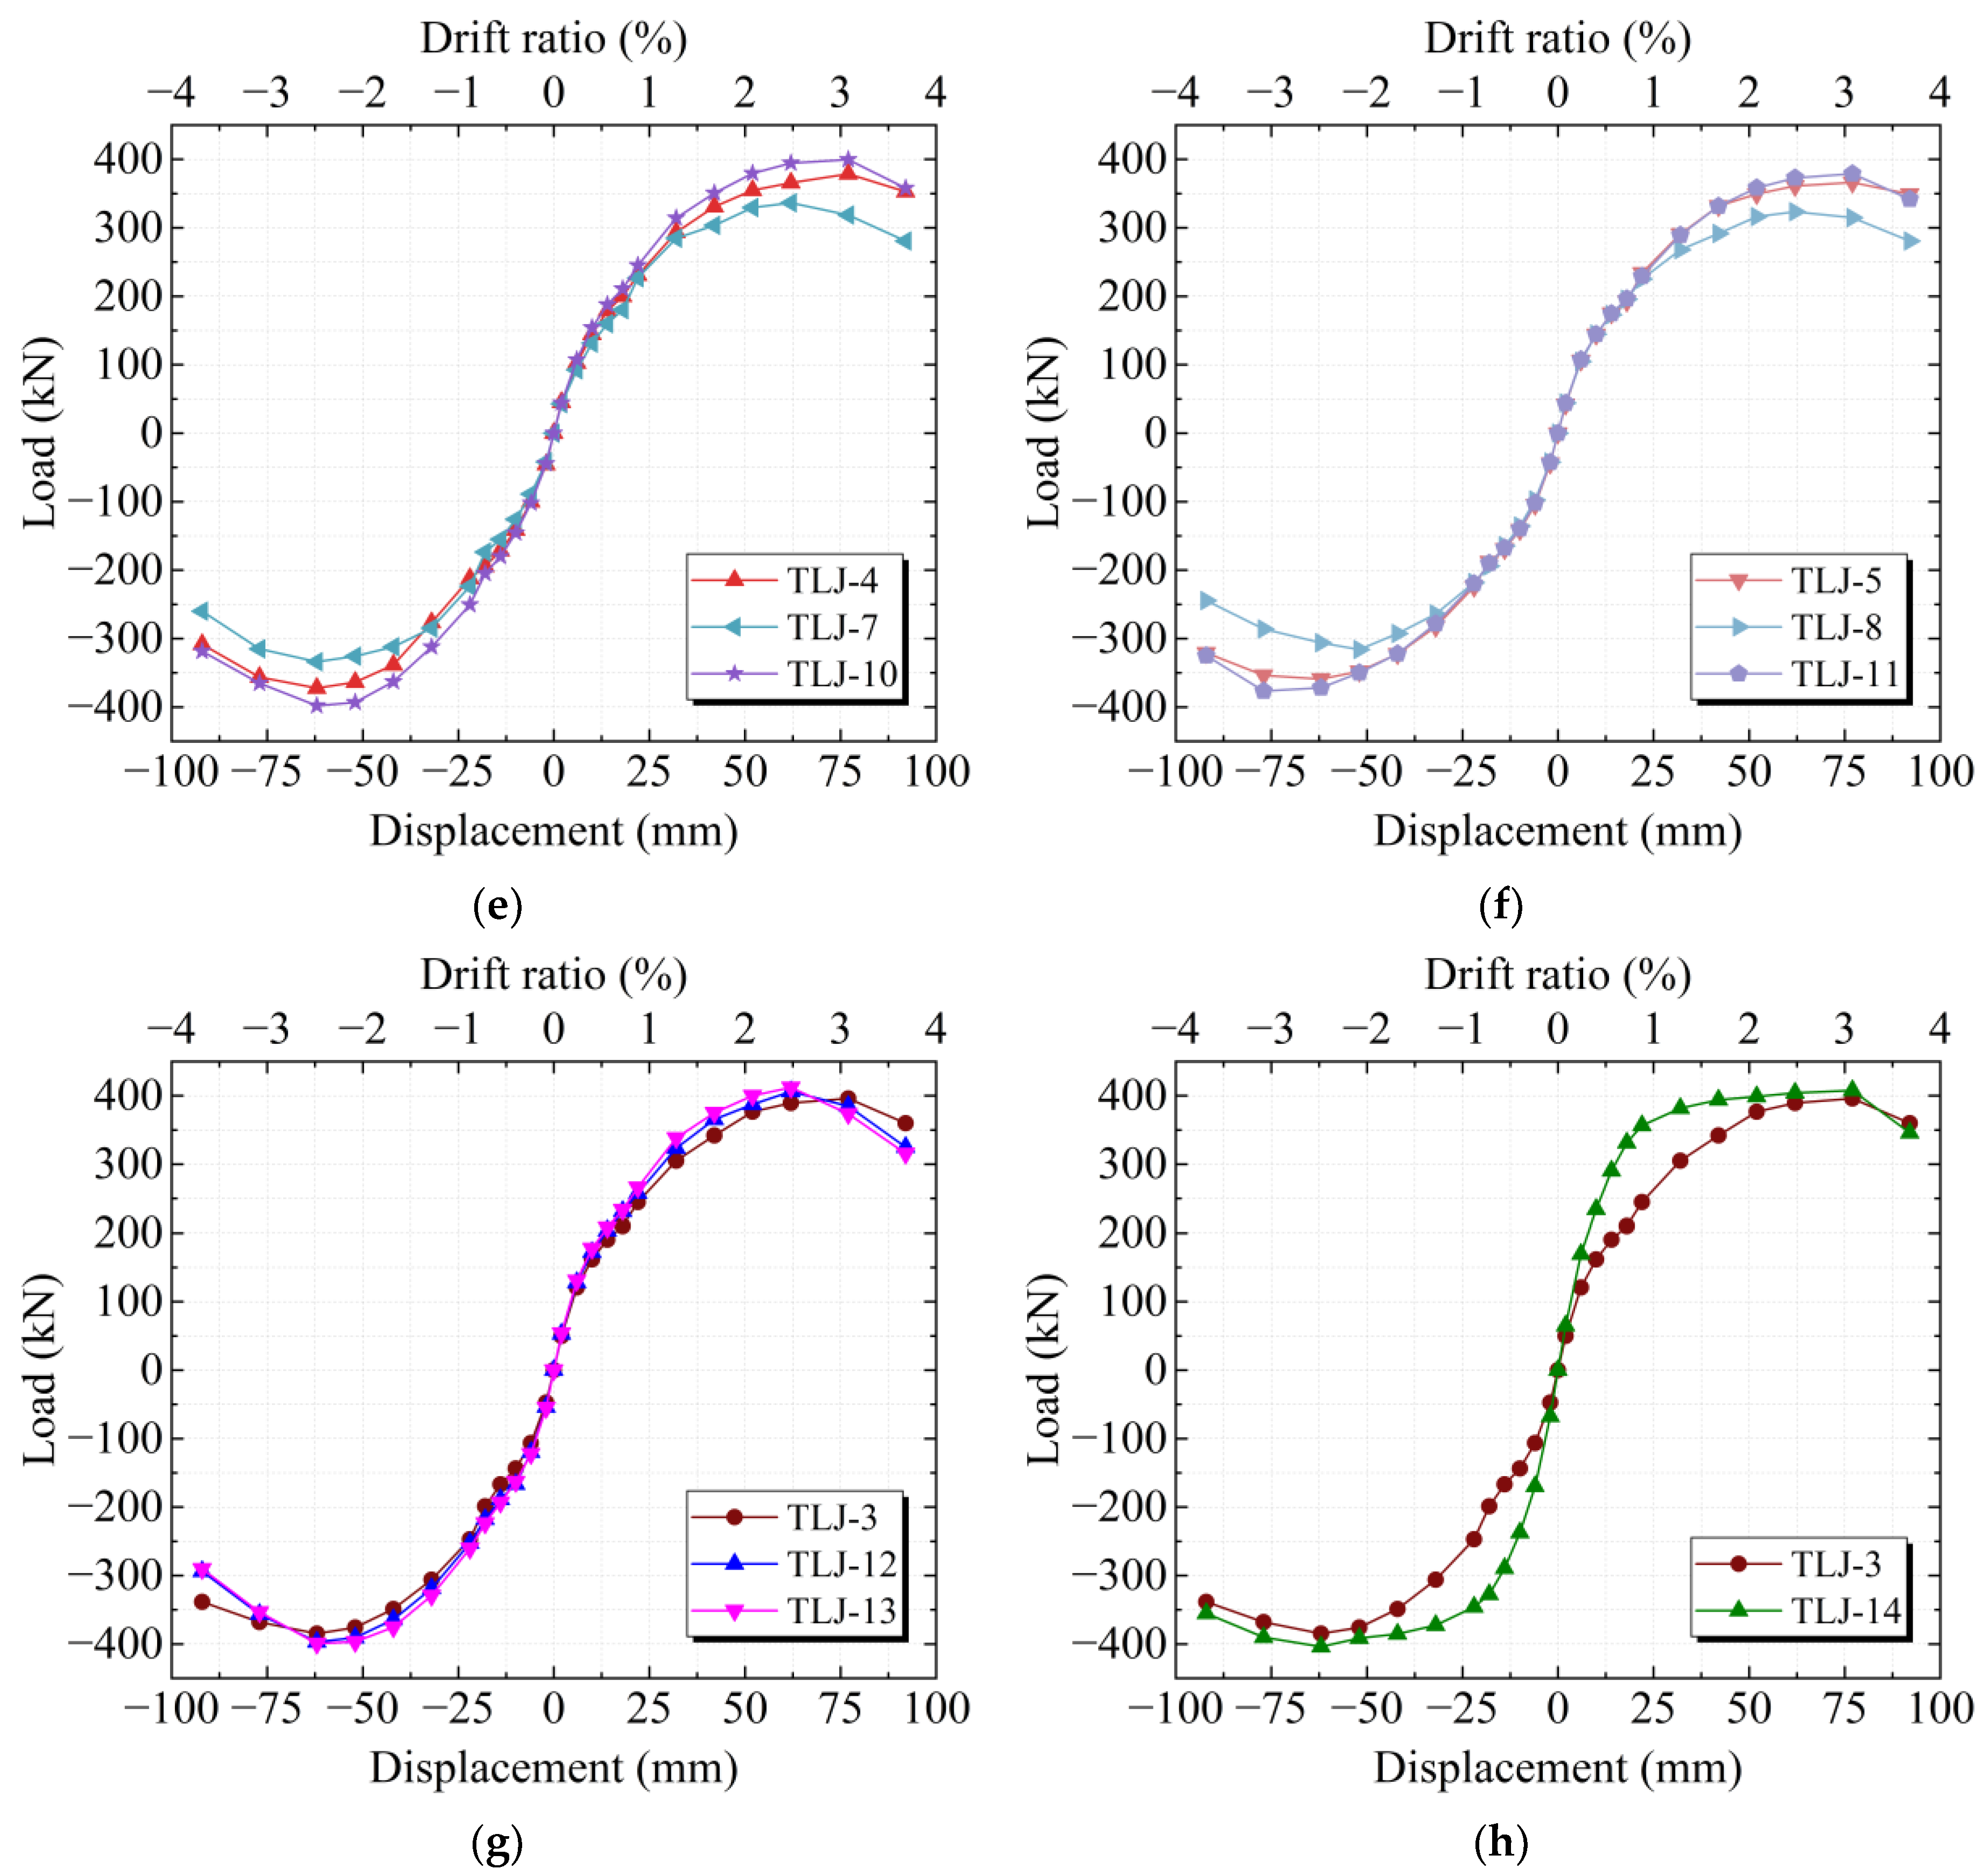
The skeleton curves were extracted from the nine hysteresis curves, which were subsequently divided into six groups based on identical parameters T and Lls for comparative analysis, as shown in Figure 24 and Table 7. Comparing the simulated skeleton curves of FEM under the same Lls indicates that decreasing T had a minor impact on yield bearing capacity, and the enhancement of T leads to a significant improvement in the ultimate bearing capacity of ASCC joints. Specifically, when the steel tube thickness T increases from 3 mm to 10 mm, the ultimate bearing capacity of ASCC joints exhibits 6–12% enhancement, as shown in Figure 24a–c.
Figure 24d–f shows the comparison of skeleton curves of ASCC joints with different lower steel tube lengths under all other parameters remaining constant. Numerical simulations reveal that the peak displacement and load-bearing capacity of joint models exhibit progressive reduction with decreasing Lls values. For instance, parametric analysis demonstrates a 15–20% enhancement in peak load capacity when Lls increases from 300 mm to 500 mm. These findings confirm that enlarging Lls dimensions significantly improves the ultimate strength of ASCC joints, with comparative studies indicating its superior influence on seismic performance relative to parameter T.
FEM results demonstrate that parametric variations in T and Lls induce minor divergence in ductility coefficient for ASCC joints, ranging between 2.236 and 2.594. This observation suggests that modifications to T and Lls parameters exert limited influence on the overall deformation capacity of the ASCC joints. Notably, finite element analysis demonstrates a 51–76% enhancement in ductility for the proposed ASCC joints when benchmarked against conventional reinforced concrete frame joint TLJ-1, which collectively validates the superior energy dissipation capacity and overall deformation behavior of ASCC joints.
Based on the specimen TLJ-3, specimens TLJ-12 and TLJ-13 were designed with high axial compression ratios of 0.80 and 0.85, respectively. As shown in Figure 24g, the skeleton curves of three specimens followed a similar trend. As N increased from 0.75 to 0.80 and 0.85, the skeleton curves exhibited a slight increase in yield load and peak load, while decreases were observed in yield displacement, peak displacement, ultimate displacement, and ductility. Compared to the model with an N of 0.75, the ductility of TLJ-12 (N = 0.80) and TLJ-13 (N = 0.85) decreased by 2.54% and 11.33%, respectively. These results indicate that a high axial compression ratio diminishes the ductility and deformation capacity of the ASCC joints. This detrimental effect can be attributed to the increased initial stiffness associated with higher N. During reverse loading, greater work is required to overcome the elevated axial compressive force. Consequently, the strengthening phase of the bearing capacity was shortened, leading to the attainment of the peak load shortly after yielding. Subsequently, the degradation of bearing capacity became more pronounced with increasing axial load, resulting in reduced connection ductility. Therefore, from the deformation perspective, the ductility of ASCC joints exhibits only a marginal difference between axial compression ratios of 0.75 and 0.80, suggesting acceptable deformation capacity within this range. However, at the higher axial compression ratio of 0.85, additional detailing measures are necessary for ASCC joints to ensure adequate seismic performance.
Figure 24h compares the skeleton curves of specimen TLJ-14 (featuring five rows of bolts) with the basic joint TLJ-3. During the initial loading phase, TLJ-14 exhibited higher initial stiffness and yielded earlier than TLJ-3, attributable to the increased bolt quantity n. This demonstrates that increasing the n enhances the initial stiffness of the ASCC joint, consequently improving the load-bearing capacity significantly. Comparison of the skeleton curves reveals that TLJ-14 exhibited slight increases in yield load, peak load, and ultimate load compared to TLJ-3. Furthermore, the ductility coefficient of TLJ-14 with five rows of bolts reached 4.924, representing a 108.38% increase over that of TLJ-3 (with three rows of bolts). These results demonstrate that the bolt quantity n significantly influences the ductility and deformation capacity of the ASCC joints. Utilizing additional bolts to restrain the extended plates of the H-shaped beam enhances the structural integrity of the joints, which enables the ASCC joints to fully develop the inherent ductility and deformation capacity, thereby achieving the more desirable failure mode.

5.3. Stiffness Degradation

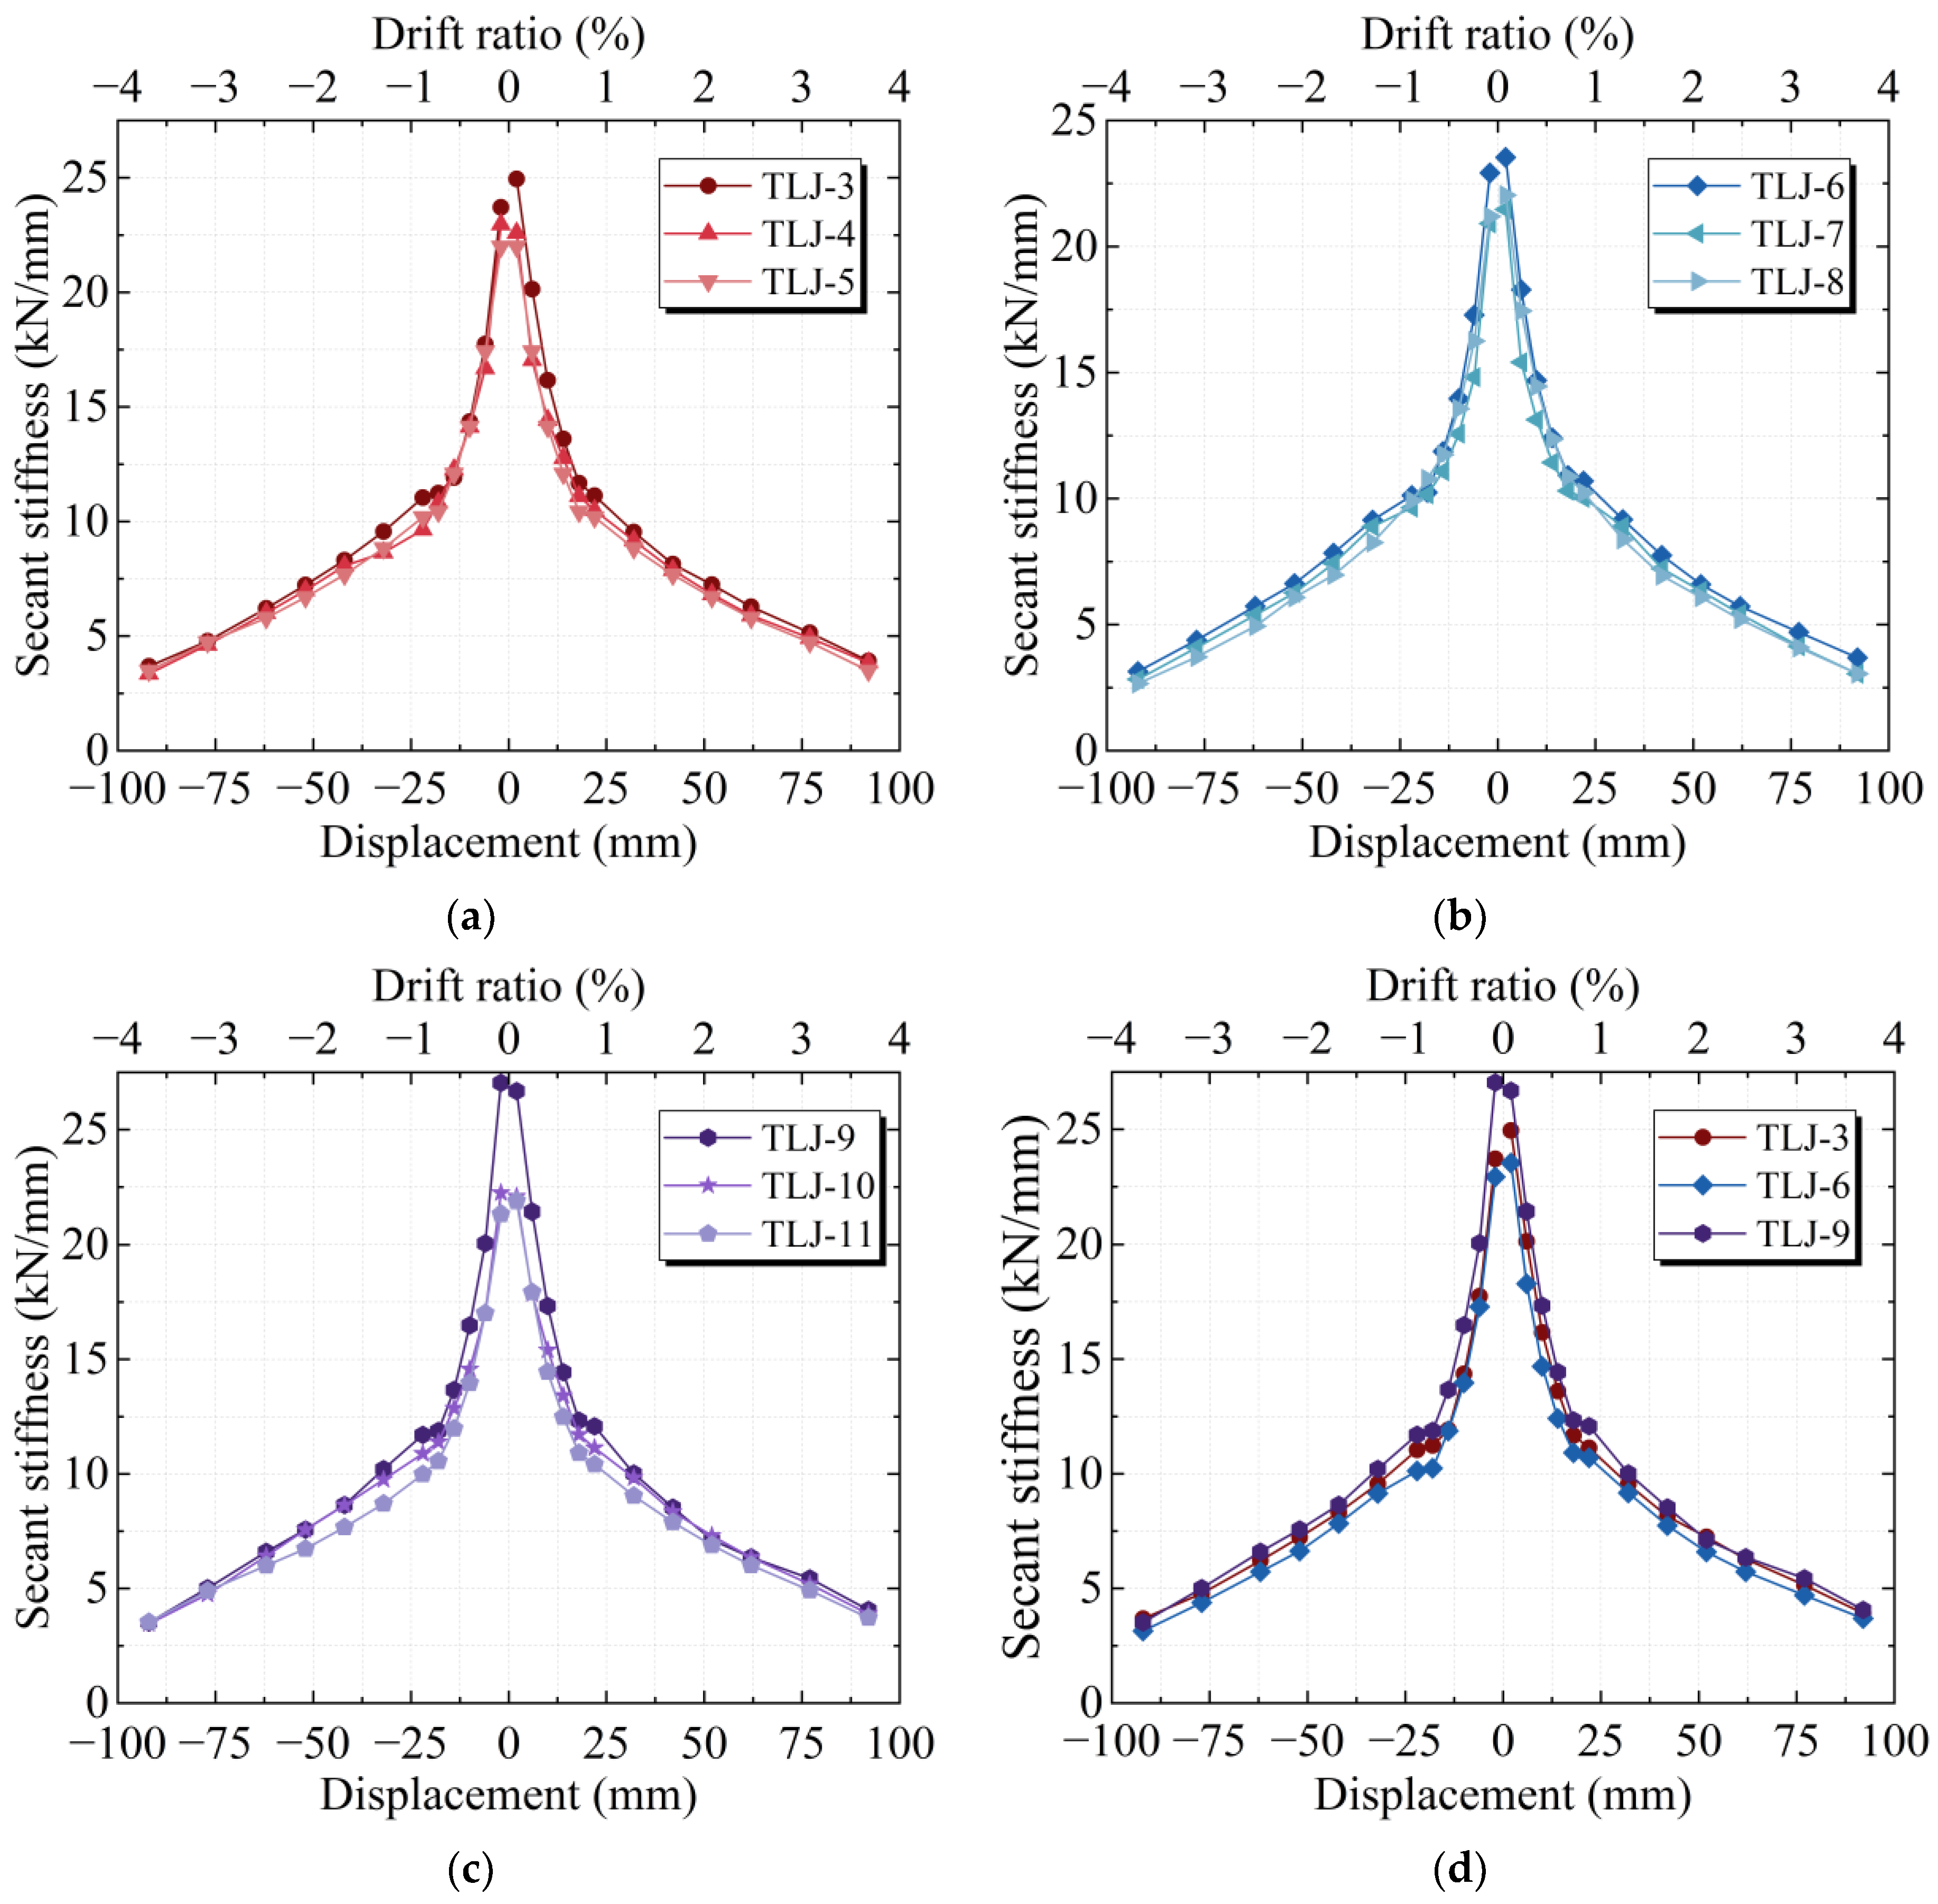
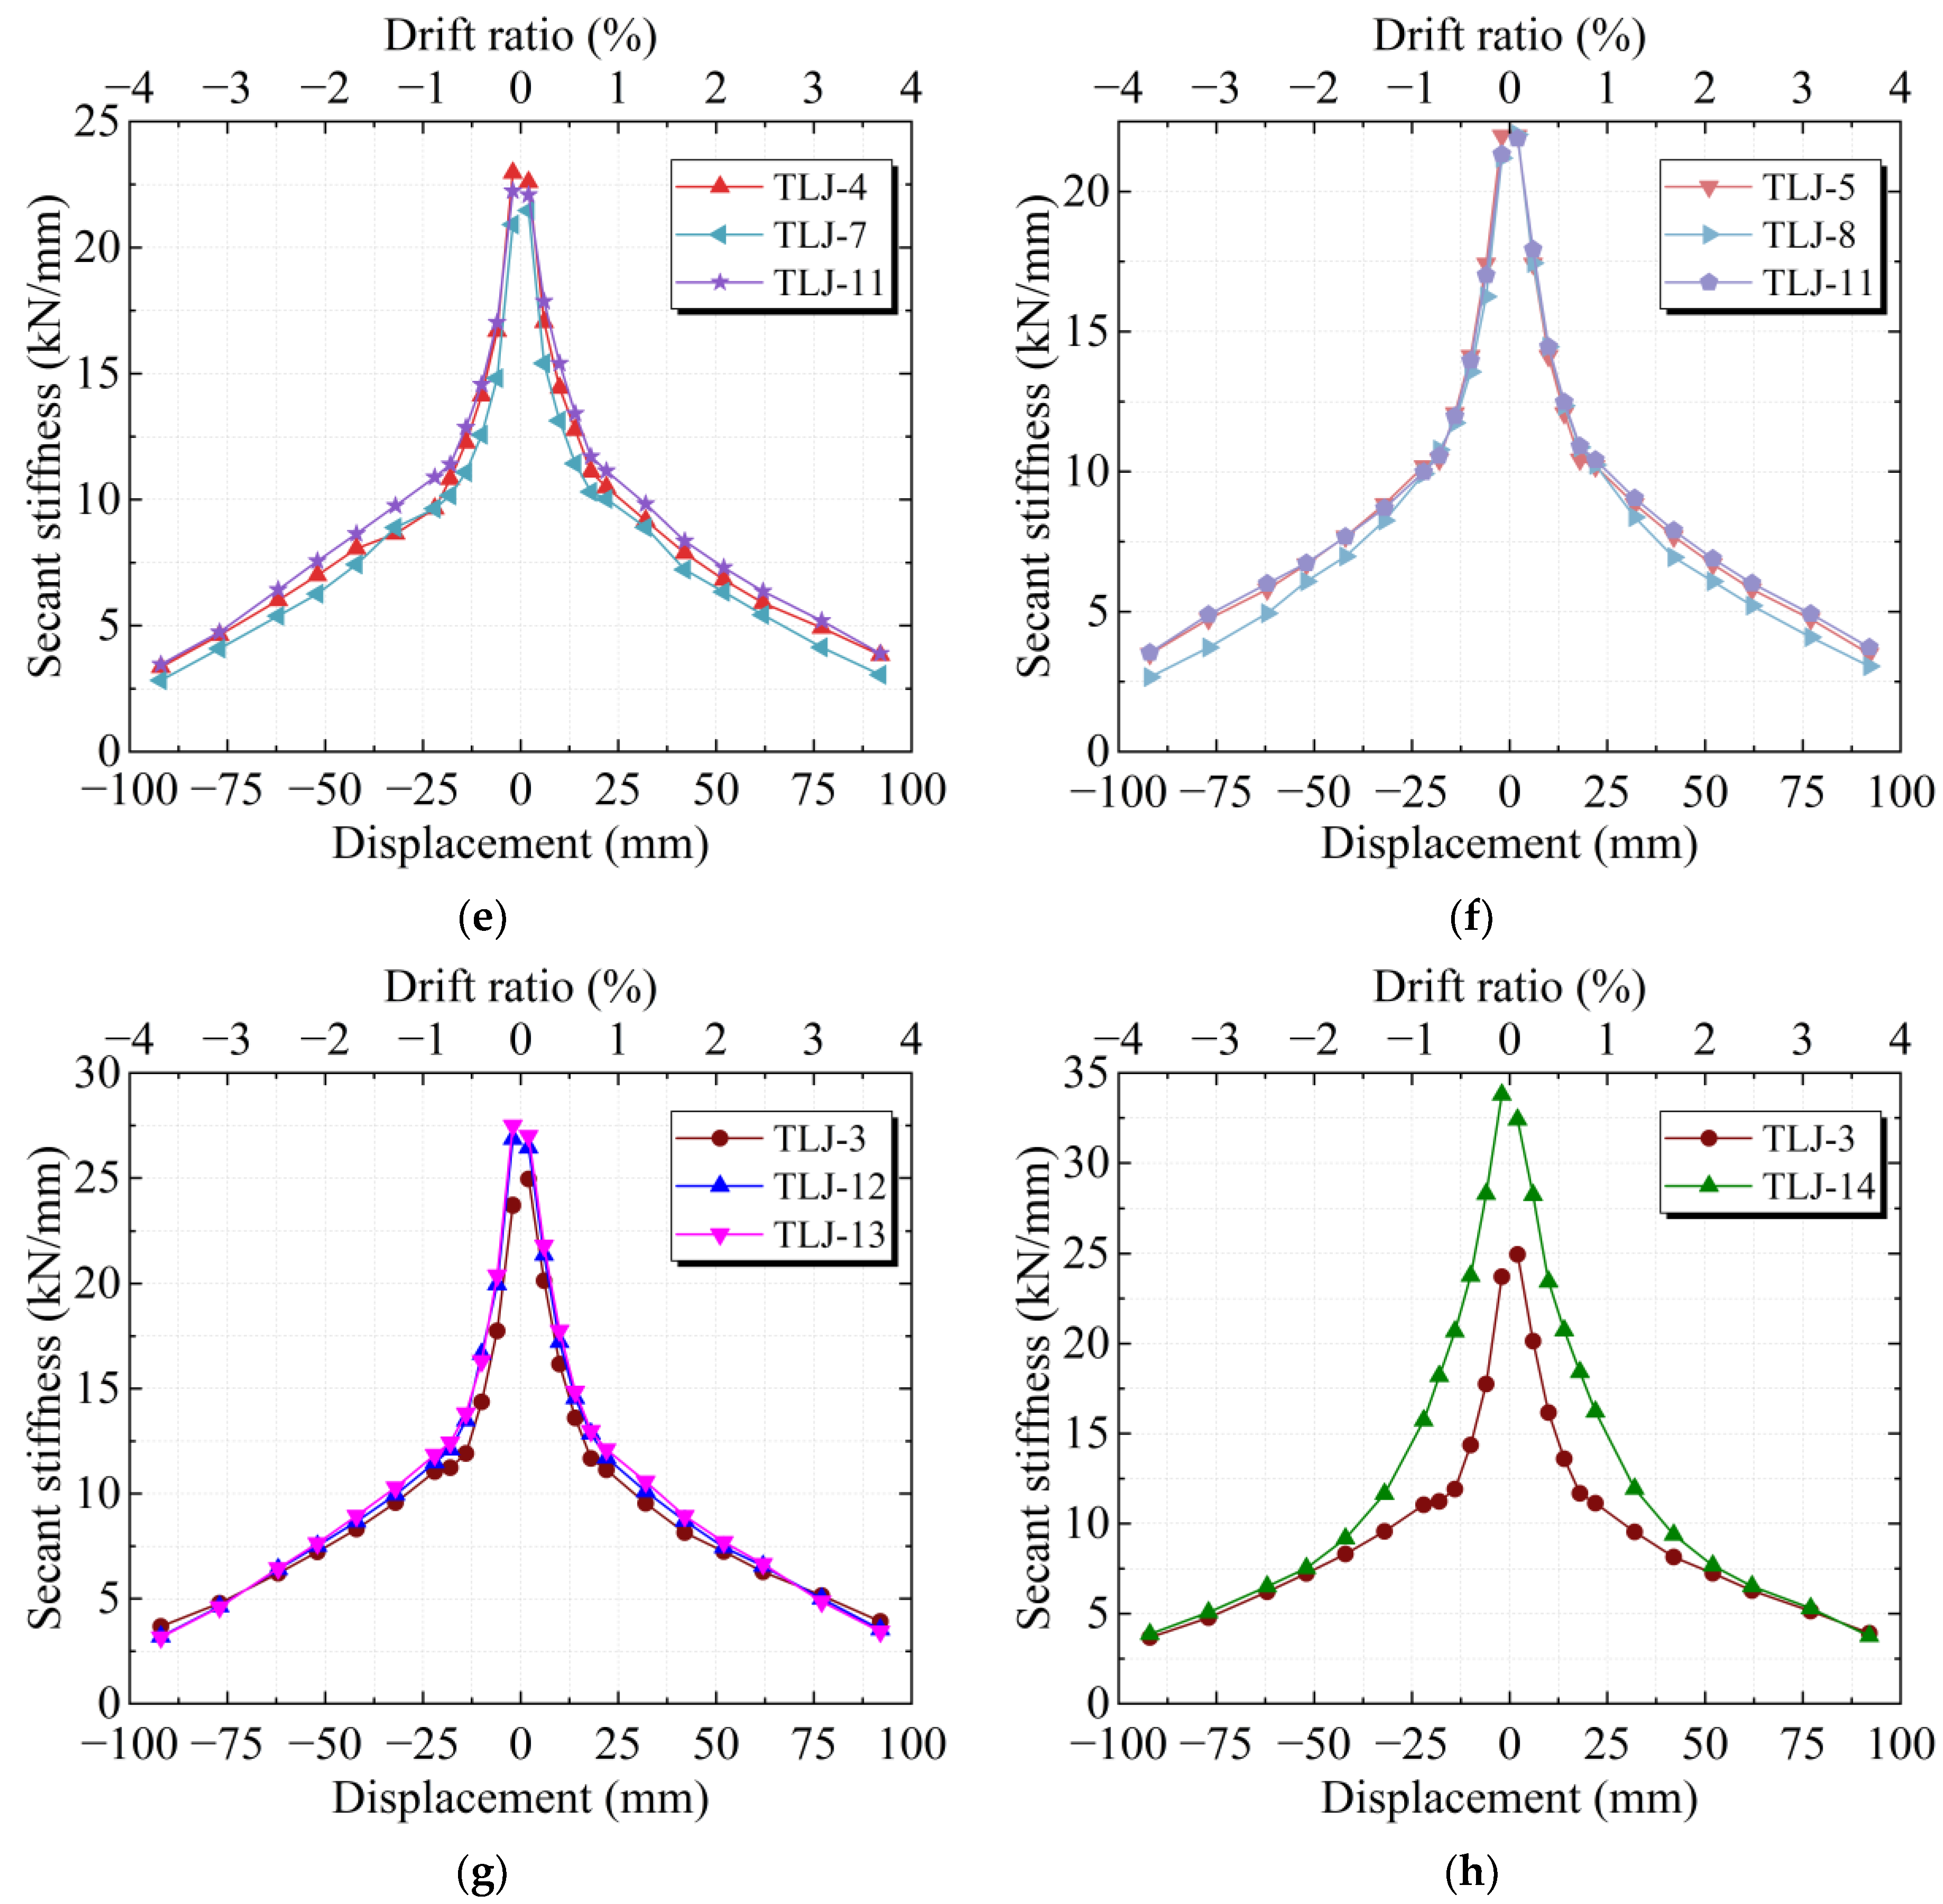
The stiffness degradation characteristics of twelve FEM joints, as depicted in Figure 17, exhibit consistent behavioral patterns. During the initial loading phase (displacement below 18 mm), a sharp stiffness reduction was observed. Comparative analysis TLJ-3–TLJ-11 reveals accelerated initial stiffness degradation rates in ASCC joints with extended lower steel tube lengths and increased steel tube thickness, with specimen TLJ-9 in particular demonstrating the most rapid deterioration, as illustrated in Figure 25a–f.
As the loading persisted, pronounced plastic deformation occurred at bolted connections and endplates of the H-shaped beam, which effectively resulted in a reduction in the stiffness loss, demonstrating the influence of parametric variations in T and Lls on the global stiffness degradation patterns. All curves ultimately converge during the post-yielding phase, confirming the superior lateral displacement resistance inherent to the ASCC joints.
Figure 25g presents the stiffness degradation curves of ASCC joints under varying high axial compression ratios N. These curves exhibit similar overall trends. During the initial loading cycles, the initial stiffness of the ASCC joints increased with higher axial compression ratios. In the later loading stages, the curves gradually stabilized. However, the rate of stiffness degradation became more pronounced in the later stages as the axial compression ratio increased. Figure 25h depicts the stiffness degradation curves of ASCC joints with different bolt quantity n. The ASCC joint employing a greater number of bolts (TLJ-14) maintained higher structural integrity, resulting in superior initial stiffness. The curves also stabilized during the later loading stages. All twelve specimens confirmed the inherent superiority of ASCC joints in maintaining lateral resistance.

5.4. Energy Dissipation Capacity

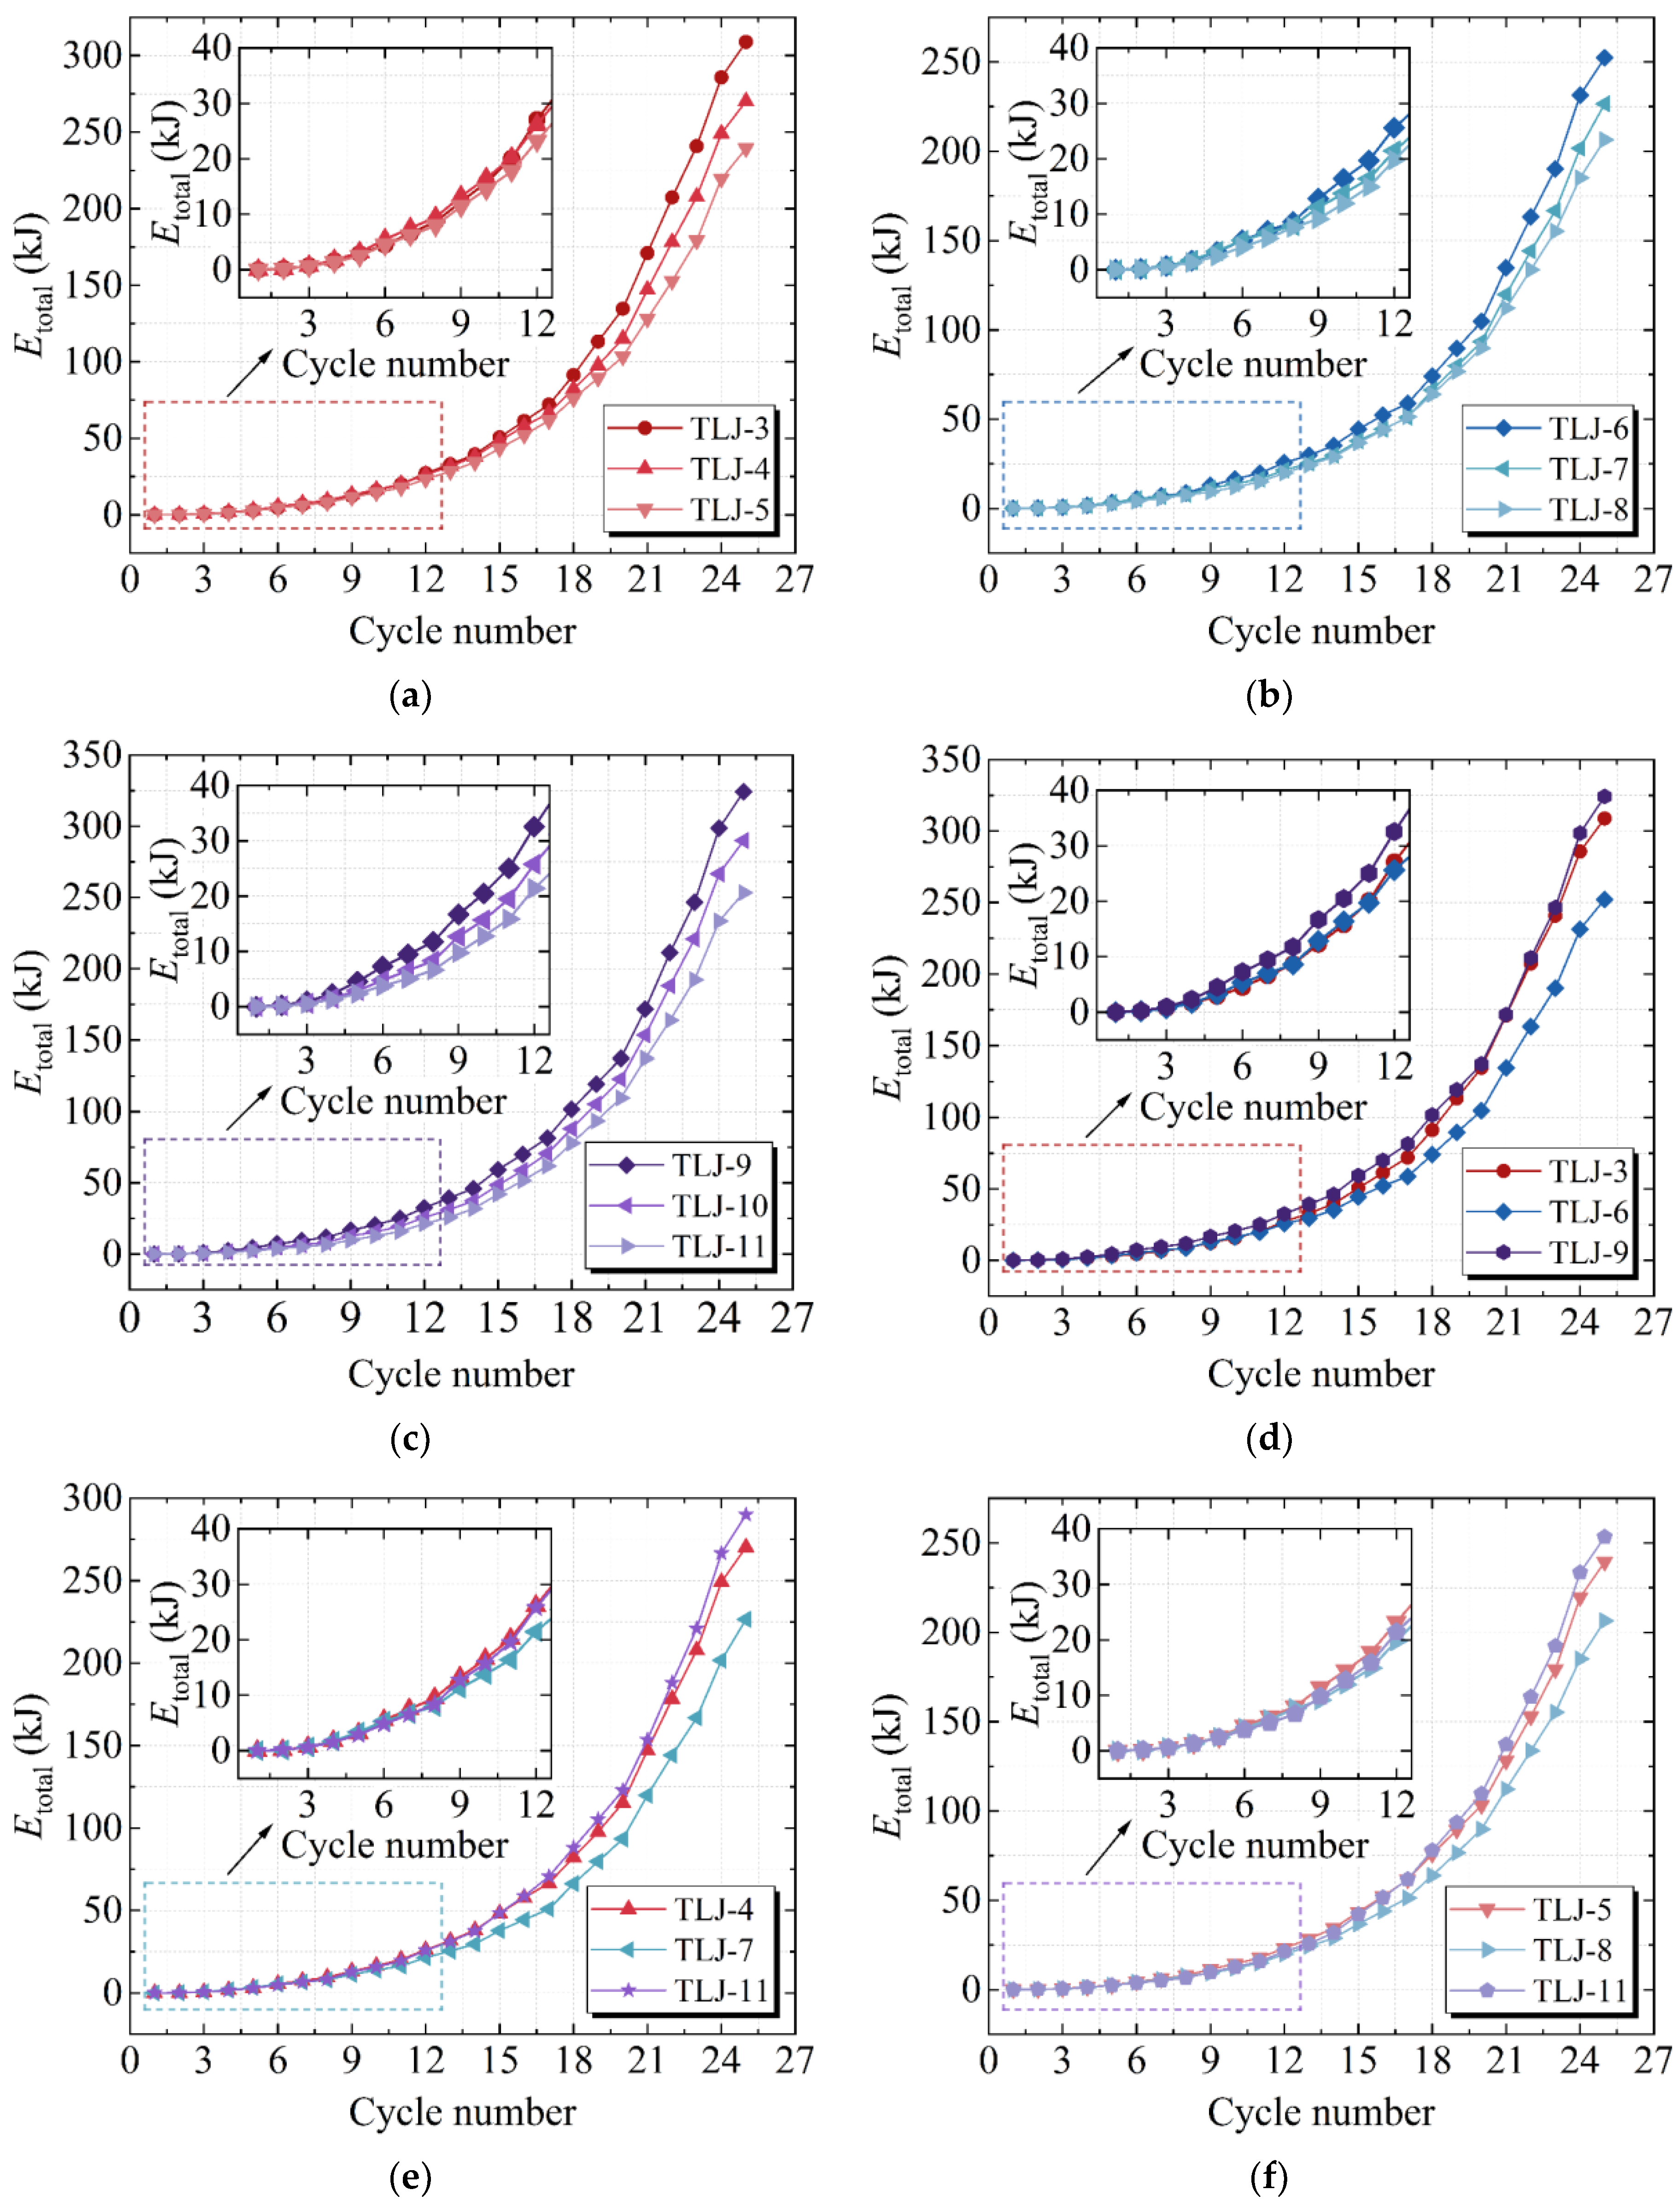
Figure 26 delineates the cumulative energy dissipation of twelve FEM joints under cyclic loading, analyzing parametric influences of T, Lls, N and n. For FEM joints with constant Lls values, all curves exhibit a gradual ascending trend during initial loading phases (below yield displacement). As the displacement increased, FEM results reveal that the ASCC joints with greater T values exhibit superior energy dissipation capacity. The FEM joints with 10 mm steel tube thickness (TLJ-3, TLJ-6, and TLJ-9) have better bearing capacity than other joints under each comparison group, which has an 11–14% and 22–29% increase in cumulative energy absorption compared to FEM joints with 5 mm and 3 mm steel tube thicknesses, respectively, which confirms that augmenting T effectively enhances the energy dissipation capacity of ASCC joints, as shown in Figure 26a–c.
Parametric analysis of lower steel tube length (Lls) reveals minor divergence in energy dissipation curves during initial loading phases. However, post-yield displacement analysis demonstrates enhanced energy dissipation capacity in ASCC joints with extended Lls values, attributable to increased stiffness improving bearing capacity and downward migration of steel–concrete interfaces mitigating slippage in lower concrete columns. As quantified in Figure 26d–f, FEM joints TLJ-9, TLJ-10, and TLJ-11 (Lls = 500 mm) exhibit 5–7% and 23–29% cumulative energy dissipation improvements relative to FEM joints with 430 mm and 300 mm lengths of lower steel tube, respectively. These results confirm that augmenting Lls effectively optimizes hysteretic energy dissipation capacity of ASCC joints.
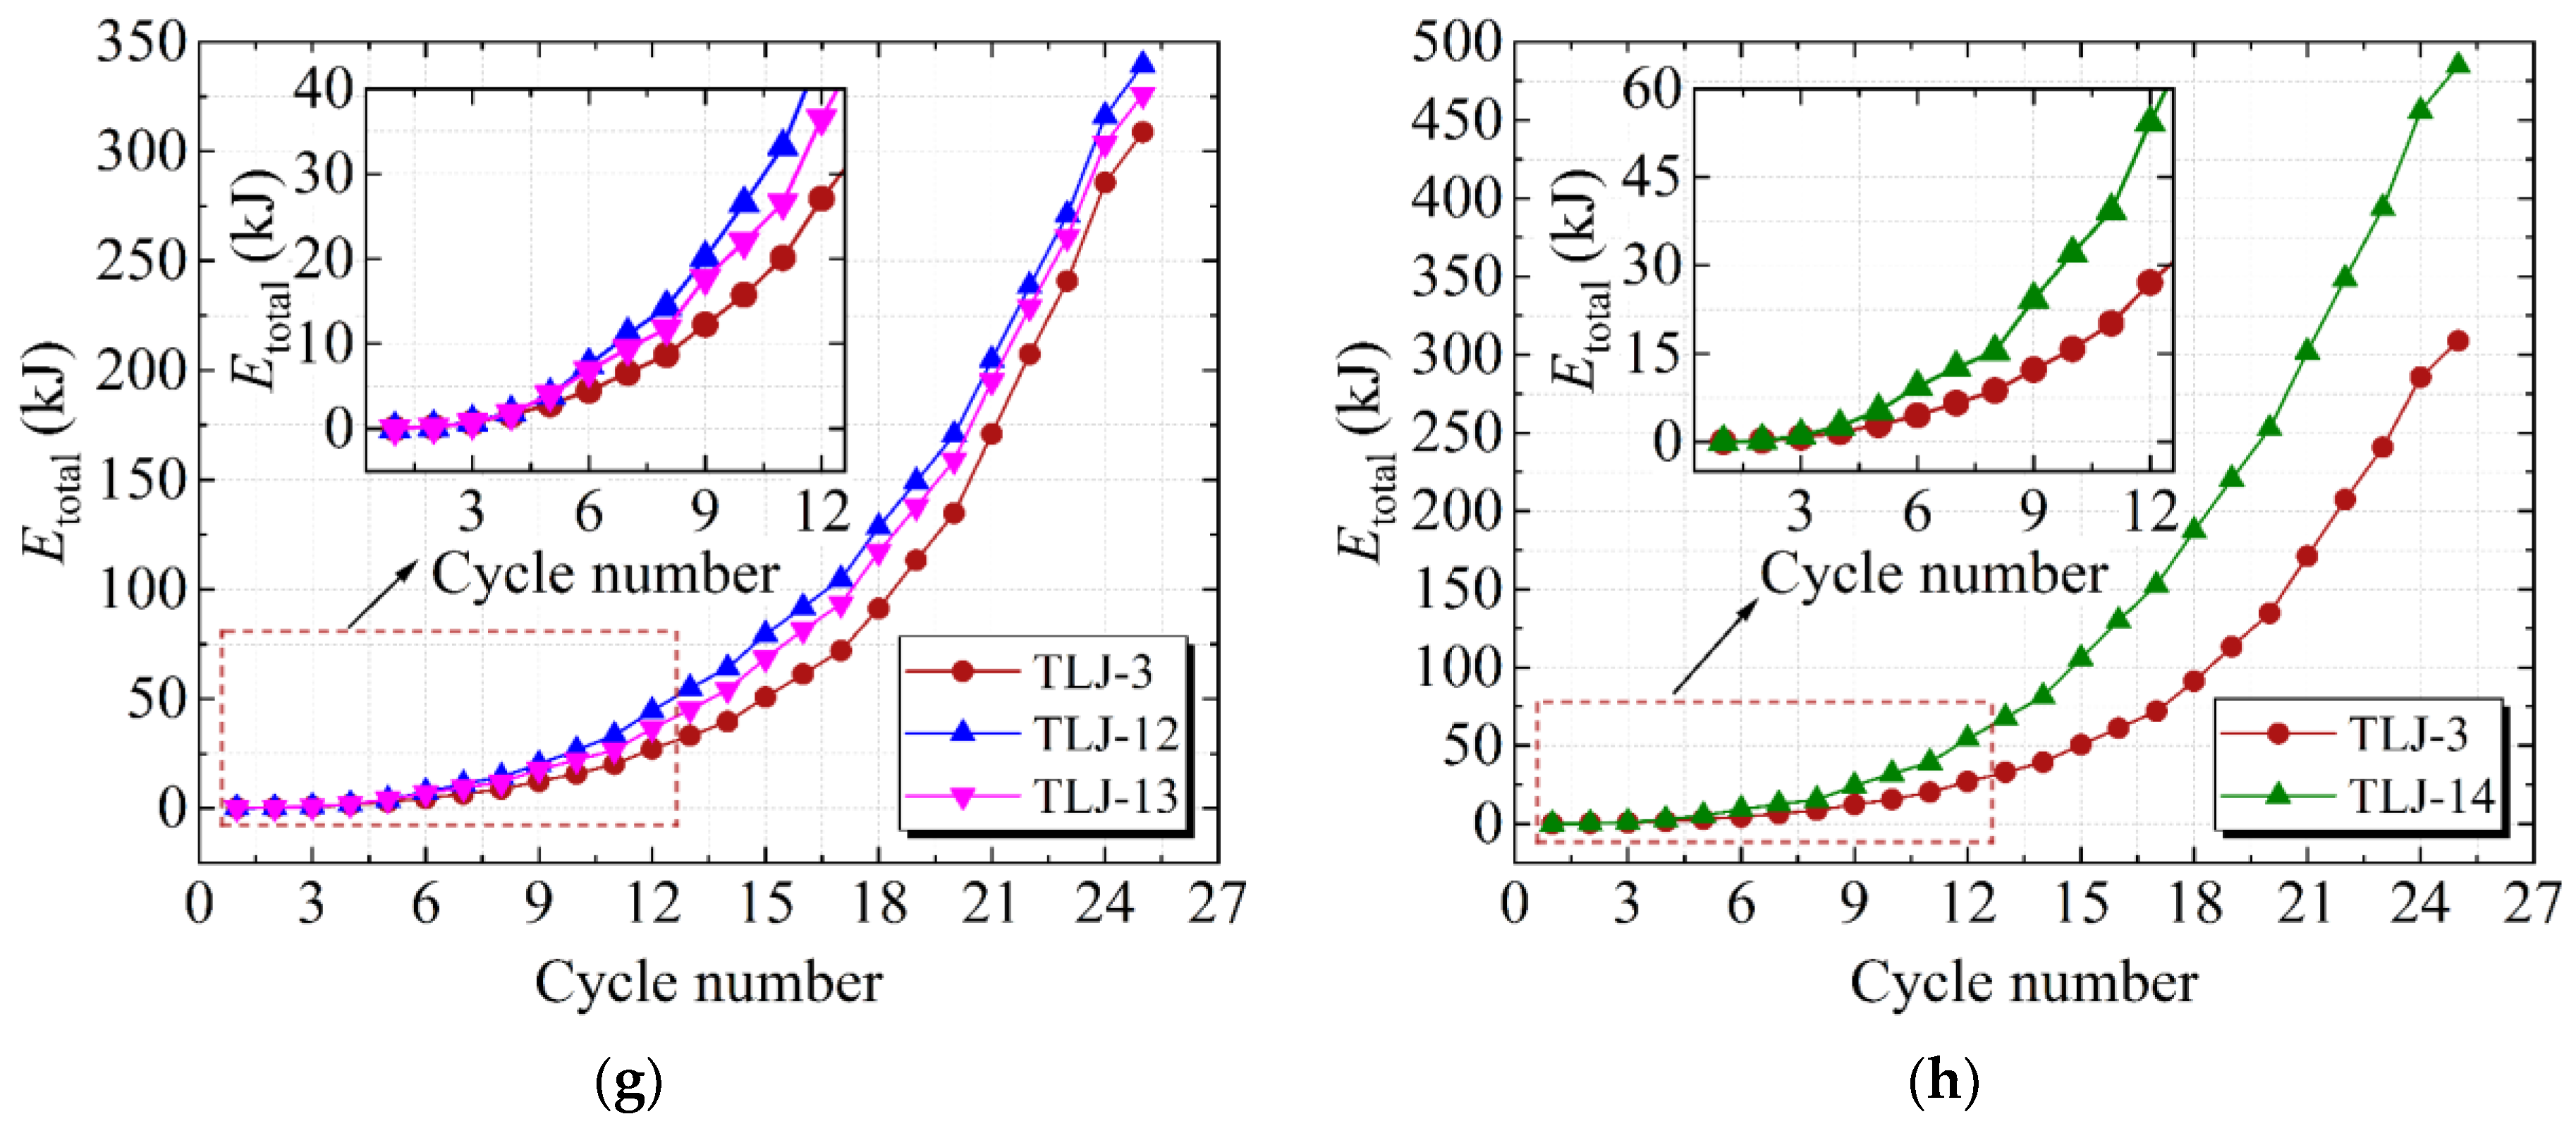
Figure 26g illustrates the cumulative energy dissipation curves for ASCC joints (TLJ-3, TLJ-12, and TLJ-13) under different high axial compression ratios N. As shown, the cumulative energy dissipation of TLJ-12 (N = 0.80) and TLJ-13 (N = 0.85) increased by 9.95% and 5.50%, respectively, compared to TLJ-3 (N = 0.75). However, the excessive N of 0.85 in TLJ-13 induced earlier compressive failure in the lower reinforced concrete column. The premature failure resulted in slightly lower cumulative energy dissipation for TLJ-13 relative to TLJ-12. Therefore, based on energy dissipation capacity, the high axial compression ratio of 0.80 can be recommended as the upper limit for ASCC joints under high axial compression ratio conditions.
Figure 26h compares the cumulative energy dissipation curves of specimen TLJ-14 (with five rows of bolts) and the basic specimen TLJ-3. Analysis reveals that TLJ-14 achieved a cumulative energy dissipation of 484.866 kJ, representing a 56.98% increase compared to TLJ-3. The enhancement of energy dissipation capacity is primarily attributed to the additional row of bolts installed at the mid-height of both sides of the H-shaped steel beam extended plates, connecting them to the steel channels, which significantly restricted the deformation of the extended plates. Consequently, the pronounced bolt slippage and associated “pinch” effect observed in TLJ-3, which resulted from yielding of the extended plates, were substantially mitigated in TLJ-14. The restraint provided by the increased number of bolts effectively preserved the overall connection stiffness during unloading–reloading cycles. These findings demonstrate that increasing the bolt quantity n optimizes the hysteretic energy dissipation capacity of ASCC joints.

6. Conclusions

This paper proposes experimental investigations of a novel assembled steel–concrete composite (ASCC) top-layer joint. Compared with the reinforced concrete frame joint, low cyclic loading tests and finite element analysis were conducted to investigate the seismic performance of the ASCC top-layer joint exhibiting “strong beam and weak column” characteristics under high axial compression ratio. Finite element simulations of ASCC top-layer joints with varying steel tube thicknesses (T), lower steel tube lengths (Lls), axial compression ratios (N), and bolt quantity (n) were performed using ABAQUS. The main conclusions are as follows:
(1)
Compared to reinforced concrete joint exhibited “strong beam and weak column” characteristics, the ASCC joint demonstrated superior seismic performance and “strong column and weak beam” failure mode, with improvements of approximately 46%, 13%, and 40% in yield bearing capacity, peak bearing capacity, and ductility, respectively.
(2)
During low cyclic loading tests, both joints showed comparable energy dissipation characteristics in the initial loading phase. The implementation of steel member connections enhanced the energy dissipation capacity of the top-layer joint. The finite element analysis results showed good agreement with experimental findings, providing a foundation for subsequent parametric studies of ASCC top-layer joints.
(3)
Parametric analysis was conducted through finite element modeling to investigate the influence of steel tube thicknesses (T), lower steel tube lengths (Lls), axial compression ratios (N), and bolt quantity (n) on the mechanical behavior of ASCC joints. The numerical simulations reveal that under the condition of 0.80 as the upper limit of high axial compression ratio, specimens with increased steel tube thickness, extended lower steel tube length, and bolt quantity demonstrate significant improvements in load-bearing capacity, lateral displacement resistance, and energy dissipation capacity.
(4)
For practical engineering applications, the optimal joint parameters were determined to be steel tube thickness at 1–2% of the column diameter and lower steel tube length at 1/3 of the lower column length, with more bolts restricting the deformation of the extended plates. The value of 0.80 can be recommended as the new high axial compression ratio upper limit of the current code.
(5)
The results presented in this study can be used in the design and construction of top-layer beam–column joints in subway stations. Furthermore, future research can be conducted to derive the theoretical model and bearing capacity formula of this new structure.

Author Contributions

Conceptualization, H.L. and J.Q.; methodology, H.L. and S.W.; software, H.L. and G.X.; validation, H.L. and Q.Q.; formal analysis, L.L. and Y.Z.; investigation, Q.Q.; resources, J.Q.; data curation, Y.Z.; writing—original draft preparation, H.L.; writing—review and editing, H.L.; visualization, G.X.; supervision, S.W.; project administration, L.L.; funding acquisition, J.Q. All authors have read and agreed to the published version of the manuscript.

Funding

This research was funded by the Natural Science Basic Research Program of Shaanxi Province (Grant No. 2018JM5167), the National Natural Science Foundation of China (Grant No. 51808443), and the Key Research and Development Program of Shaanxi Province (Grant 2024SF-ZDCYL-05-12).

Data Availability Statement

Data underlying the results presented in this paper are not publicly available at this time but may be obtained from the corresponding author upon reasonable request.

Acknowledgments

The financial support received from the funding organizations is gratefully acknowledged.

Conflicts of Interest

Author Leilei Li is employed by the PowerChina Northwest Engineering Corporation Limited. The remaining authors declare that the research was conducted in the absence of any commercial or financial relationships that could be construed as a potential conflict of interest.

References

  1. Chen, J.N.; Xu, C.S.; El Naggar, H.M.; Du, X.L. Seismic response analysis of rectangular prefabricated subway station structure. Tunn. Undergr. Sp. Tech. 2023, 131, 104795. [Google Scholar] [CrossRef]
  2. Chen, J.N.; Xu, C.S.; Du, X.L.; Han, R.B.; El Naggar, H.M. Physical and numerical modeling of seismic soil-structure interaction of prefabricated subway station structure. Eng. Struct. 2023, 290, 116364. [Google Scholar] [CrossRef]
  3. Liu, Z.Q.; Chen, Z.Y.; Huang, Y.; Fan, Y.F. Seismic performance evaluation of a metro station structure under multi-source random conditions based on probability density evolution method. Soil. Dyn. Earthq. Eng. 2024, 179, 108509. [Google Scholar] [CrossRef]
  4. Ma, C.; Zhao, Y.Q.; Dong, H.H.; Lu, D.C.; Du, X.L. Comparative study on the seismic performance of subway stations using reinforced concrete cast-in-place columns and truncated columns. Soil. Dyn. Earthq. Eng. 2023, 169, 107862. [Google Scholar] [CrossRef]
  5. Ma, C.; Lu, D.C.; Gao, H.; Du, X.L.; Qi, C.Q. Seismic performance improvement of underground frame structures by changing connection type between sidewalls and slab. Soil. Dyn. Earthq. Eng. 2021, 149, 106851. [Google Scholar] [CrossRef]
  6. Iida, H.; Hiroto, T.; Yoshida, N.; Iwafuji, M. Damage to Daikai subway station. Soils. Found. 1996, 36, 283–300. [Google Scholar] [CrossRef]
  7. Zhuang, H.Y.; Cheng, S.G.; Chen, G.X. Numerical simulation and analysis of earthquake damages of Dakai metro station caused by Kobe earthquake. Rock. Soil. Mech. 2008, 29, 245–250. [Google Scholar] [CrossRef]
  8. Bird, J.F.; Bommer, J.J. Earthquake losses due to ground failure. Eng. Geol. 2004, 75, 147–179. [Google Scholar] [CrossRef]
  9. Van de Lindt, J.W.; Goh, G.H. Effect of earthquake duration on structural reliability. Eng. Struct. 2004, 26, 1585–1597. [Google Scholar] [CrossRef]
  10. Liu, H.T.; Xu, C.S.; Du, X.L. Seismic response analysis of assembled monolithic subway station in the transverse direction. Eng. Struct. 2020, 219, 110970. [Google Scholar] [CrossRef]
  11. Liu, H.T.; Wang, Z.Y.; Du, X.L.; Shen, G.Q. The seismic behaviour of precast concrete interior joints with different connection methods in assembled monolithic subway station. Eng. Struct. 2021, 232, 111799. [Google Scholar] [CrossRef]
  12. Belleri, A.; Brunesi, E.; Nascimbene, R.; Pagani, M.; Riva, P. Seismic performance of precast Industrial facilities following major earthquakes in the Italian territory. J. Perform. Constr. Fac. 2015, 29, 04014135. [Google Scholar] [CrossRef]
  13. Brunesi, E.; Nascimbene, R.; Bolognini, D.; Bellotti, D. Experimental investigation of the cyclic response of reinforced precast concrete framed structures. PCI J. 2015, 60, 57–79. [Google Scholar] [CrossRef]
  14. Guerrero, H.; Rodriguez, V.; Escobar, J.A.; Alcocer, S.M.; Bennetts, F.; Suarez, M. Experimental tests of precast reinforced concrete beam-column connections. Soil. Dyn. Earthq. Eng. 2019, 125, 105743. [Google Scholar] [CrossRef]
  15. Zhang, Y.; Zhu, P.; Shi, J.Q. Flexural behavior of precast UHPC beam with prestressed bolted hybrid joint. Eng. Struct. 2020, 206, 110100. [Google Scholar] [CrossRef]
  16. Liu, J.; Xue, Y.T.; Wang, C.K.; Nie, J.G.; Wu, Z.H. Experimental investigation on seismic performance of mechanical joints with bolted flange plate for precast concrete column. Eng. Struct. 2021, 216, 110729. [Google Scholar] [CrossRef]
  17. Jiang, H.B.; Qiu, H.X.; Sun, J.; Yang, Y. Behavior of steel–concrete composite bolted connector in precast reinforced concrete shear wall. Adv. Struct. Eng. 2019, 22, 2572–2582. [Google Scholar] [CrossRef]
  18. Kazemi, F.; Asgarkhani, N.; Ghanbari-Ghazijahani, T.; Jankowski, R. Ensemble machine learning models for estimating mechanical curves of concrete-timber-filled steel tubes. Eng. Appl. Artif. Intel. 2025, 156, 111234. [Google Scholar] [CrossRef]
  19. Koloo, F.A.; Badakhshan, A.; Fallahnejad, H.; Jamkhaneh, M.E.; Ahmadi, M. Investigation of proposed concrete filled steel tube connections under reversed cyclic loading. Int. J. Steel. Struct. 2018, 18, 163–177. [Google Scholar] [CrossRef]
  20. Ding, K.W.; Liu, J.H.; Ma, W.; Liu, Y.L. Experimental study on seismic performances of a new type of fabricated semi-rigid beam-to-column connection. China Civ. Eng. J. 2021, 54, 1–7+56. [Google Scholar] [CrossRef]
  21. Ding, K.W.; Liu, J.H.; Ren, J.W.; Ma, W. Dynamic Responses of Cellular Metal-Filled Steel Beam-Column Joint Under Impact Loading. J. Shanghai Jiaotong Univ. (Sci.) 2020, 25, 384–393. [Google Scholar] [CrossRef]
  22. Ding, K.W.; Ye, Y.; Ma, W. Seismic performance of precast concrete beam-column joint based on the bolt connection. Eng. Struct. 2021, 232, 111884. [Google Scholar] [CrossRef]
  23. Ding, K.W.; Chen, D.; Liu, Y.L.; Xia, S. Theoretical and experimental study on mechanical behavior of laminated slabs with new type joints. China Civ. Eng. J. 2015, 48, 64–69. [Google Scholar] [CrossRef]
  24. Liu, J.H.; Liu, Y.L.; Yu, D.H. Experimental and Numerical Studies on the Seismic Performance of New Assembled Concrete Frame Beam–Column Joints. Buildings 2023, 13, 329. [Google Scholar] [CrossRef]
  25. Qu, X.S.; Xie, Y.N.; Sun, G.J.; Liu, Q.W.; Wang, H. Seismic Behavior of Assembly Joint with CFST Column and H-shaped Steel Beam. KSCE J. Civ. Eng. 2022, 27, 670–683. [Google Scholar] [CrossRef]
  26. Rong, X.; Zhang, X.W.; Li, Y.Y.; Du, Y.S.; Zhang, J.X.; Shi, X. Seismic Behavior of Top-Weld Bottom-Bolt Joints Between CFST Columns and H-Beams. Arabian. J. Sci. Eng. 2022, 47, 12585–12603. [Google Scholar] [CrossRef]
  27. Khador, M.; Chan, T.M. Cyclic behaviour of external diaphragm joint to CHS column with built-in replaceable links. Steel. Constr. 2016, 9, 331–338. [Google Scholar] [CrossRef]
  28. Li, W.; Han, L.H. Seismic performance of CFST column to steel beam joint with RC slab: Joint model. J. Constr. Steel. Res. 2012, 73, 66–79. [Google Scholar] [CrossRef]
  29. Li, W.; Han, L.H. Seismic performance of CFST column to steel beam joints with RC slab: Analysis. J. Constr. Steel. Res. 2011, 67, 127–139. [Google Scholar] [CrossRef]
  30. Han, L.H.; Li, W. Seismic performance of CFST column to steel beam joint with RC slab: Experiments. J. Constr. Steel. Res. 2010, 66, 1374–1386. [Google Scholar] [CrossRef]
  31. Zhu, L.H.; Ning, Q.J.; Zhao, C.; Ji, C.R.; Pan, X.B.; Han, W. Seismic performance of self-centering circular concrete-filled steel tubular column to steel beam connection with web friction device. Structures 2021, 34, 1843–1857. [Google Scholar] [CrossRef]
  32. GB 50011-2010; Code for Seismic Design of Buildings. China Architecture & Building Press: Beijing, China, 2010.
  33. GB/T 50081-2019; Standard for Test Methods of Concrete Physical and Mechanical Properties. China Architecture & Building Press: Beijing, China, 2019.
  34. GB 55008-2021; General Code for Concrete Structures. China Architecture & Building Press: Beijing, China, 2021.
  35. GB/T 228.1-2021; Metallicmaterials-Tensiletesting-Part1: Method of Test at Room Temperature. State Administration for Market Regulation: Beijing, China, 2021.
  36. JGJ/T 101-2015; Specification for Seismic Test of Buildings. China Architecture & Building Press: Beijing, China, 2015.
  37. Stoakes, C.D.; Fahnestock, L.A. Cyclic Flexural Testing of Concentrically Braced Frame Beam-Column Connections. J. Struct. Eng. 2011, 137, 739–747. [Google Scholar] [CrossRef]
  38. GB/T 51336-2018; Standard for Seismic Design of Underground Structures. China Architecture & Building Press: Beijing, China, 2018.
  39. GB 50010-2010; Code for Design of Concrete Structures. China Architecture & Building Press: Beijing, China, 2015.
  40. Han, L.H. Theory of Concrete-Filled Steel Tubular Structures; Springer Nature Singapore: Singapore, 2024. [Google Scholar]
  41. GB 50017-2017; Steel Structure Design Standards. China Architecture & Building Press: Beijing, China, 2017.
Figure 1. Schematic diagram of top-layer beam–column joints (mm): (a) TLJ-1; (b) TLJ-2; (c) Details of steel member connection.
Buildings 15 03083 g001aBuildings 15 03083 g001b
Figure 2. Experimental process.
Buildings 15 03083 g002
Figure 3. Experimental configuration: (a) experimental setup, (b) loading device diagram.
Buildings 15 03083 g003
Figure 4. Arrangement of strain gauges.
Buildings 15 03083 g004
Figure 5. Loading system for TLJ-1 and TLJ-2.
Buildings 15 03083 g005
Figure 6. Cracking development patterns and damage modes of specimens (failure state): (a) TLJ-1, (b) TLJ-2.
Buildings 15 03083 g006
Figure 7. Hysteretic curve of TLJ-1 and TLJ-2: (a) TLJ-1, (b) TLJ-2.
Buildings 15 03083 g007
Figure 8. Skeleton curve of TLJ-1 and TLJ-2.
Buildings 15 03083 g008
Figure 9. Strength degradation curves of TLJ-1 and TLJ-2.
Buildings 15 03083 g009
Figure 10. Stiffness degradation curves of TLJ-1 and TLJ-2.
Buildings 15 03083 g010
Figure 11. Energy dissipation curves of TLJ-1 and TLJ-2: (a) equivalent viscous damping; (b) energy dissipated in each cycle; (c) energy accumulated.
Buildings 15 03083 g011
Figure 12. Strain at column longitudinal reinforcement of TLJ-1 and TLJ-2: (a) TLJ-1 (positive); (b) TLJ-1 (negative); (c) TLJ-2 (positive); (d) TLJ-2 (negative).
Buildings 15 03083 g012aBuildings 15 03083 g012b
Figure 13. Strain at stirrup of TLJ-1 and TLJ-2: (a) TLJ-1 (positive); (b) TLJ-1 (negative); (c) TLJ-2 (positive); (d) TLJ-2 (negative).
Buildings 15 03083 g013
Figure 14. Strain at steel members of TLJ-2: (a) end plate of H-shaped steel beam (positive); (b) end plate of H-shaped steel beam (negative); (c) upper flange and web of H-shaped steel beam (positive); (d) upper flange and web of H-shaped steel beam (negative); (e) steel tube in core area of TLJ-2 (positive); (f) steel tube in core area of TLJ-2 (negative).
Buildings 15 03083 g014
Figure 15. Details of finite element model of specimen TLJ-2 (TLJ-3).
Buildings 15 03083 g015
Figure 16. Schematic diagram of coupling points.
Buildings 15 03083 g016
Figure 17. Comparisons of hysteretic behavior between simulation and experiment results.
Buildings 15 03083 g017
Figure 18. Finite element analysis results: cloud diagram of concrete tensile damage distribution.
Buildings 15 03083 g018
Figure 19. Finite element analysis results: cloud diagram of TLJ-3 failure stress distribution.
Buildings 15 03083 g019
Figure 20. Cloud diagram of steel members stress distribution of TLJ-3.
Buildings 15 03083 g020
Figure 21. Cloud diagram of reinforcement cage stress distribution of TLJ-3.
Buildings 15 03083 g021
Figure 22. Cloud diagram of equivalent plastic strain distribution of specimen TLJ-3.
Buildings 15 03083 g022
Figure 23. Hysteretic curves of FEM (TLJ-3~TLJ-14): (a) TLJ-3; (b) TLJ-4; (c) TLJ-5; (d) TLJ-6; (e) TLJ-7; (f) TLJ-8; (g) TLJ-9; (h) TLJ-10; (i) TLJ-11; (j) TLJ-12; (k) TLJ-13; (l) TLJ-14.
Buildings 15 03083 g023aBuildings 15 03083 g023b
Figure 24. Comparison of skeleton curves (TLJ-3~TLJ-14): (a) TLJ-3~TLJ-5; (b) TLJ-6~TLJ-8; (c) TLJ-9~TLJ-11; (d) TLJ-3, TLJ-6, and TLJ-9; (e) TLJ-4, TLJ-7, and TLJ-10; (f) TLJ-5, TLJ-8, and TLJ-11; (g) TLJ-3, TLJ-12, and TLJ-13; (h) TLJ-3 and TLJ-14.
Buildings 15 03083 g024aBuildings 15 03083 g024b
Figure 25. Comparison of secant stiffness degradation curves (TLJ-3~TLJ-14): (a) TLJ-3~TLJ-5; (b) TLJ-6~TLJ-8; (c) TLJ-9~TLJ-11; (d) TLJ-3, TLJ-6, and TLJ-9; (e) TLJ-4, TLJ-7, and TLJ-10; (f) TLJ-5, TLJ-8, and TLJ-11; (g) TLJ-3, TLJ-12, and TLJ-13; (h) TLJ-3 and TLJ-14.
Buildings 15 03083 g025aBuildings 15 03083 g025b
Figure 26. Comparison of energy dissipation curves (TLJ-3~TLJ-14): (a) TLJ-3~TLJ-5; (b) TLJ-6~TLJ-8; (c) TLJ-9~TLJ-11; (d) TLJ-3, TLJ-6, and TLJ-9; (e) TLJ-4, TLJ-7, and TLJ-10; (f) TLJ-5, TLJ-8, and TLJ-11; (g) TLJ-3, TLJ-12, and TLJ-13; (h) TLJ-3 and TLJ-14.
Buildings 15 03083 g026aBuildings 15 03083 g026b
Table 1. Characteristics of test specimens.
SpecimenElementSection Size/mmLongitudinal ReinforcementLongitudinal Reinforcement Ratio/%Transverse
Reinforcement
Transverse
Reinforcement Ratio/%
StirrupStirrup
Reinforcement Ratio
Axial
Compression Ratio
Mcu/MbuBoundary
Conditions
TLJ-1Beam400 × 7306C22(4 + 2)
/4C22
1.30A12@801.28A12@800.860.750.326Hinge support
Slab300 × 1200A12@800.86A12@801.35
ColumnØ40012C182.43\\A10@1001.95Sliding (top)
/Fix hinge
(bottom) support
TLJ-2Beam400 × 7306C22(4 + 2)
/4C22
1.30A12@801.28A12@800.860.750.326Hinge support
Slab300 × 1200A12@800.86A12@801.35
ColumnØ40012C182.43\\A10@100
/200
0.28Sliding (top)
/Fix hinge
(bottom) support
Table 2. Mechanical properties of concrete.
MaterialsStrengthfcu/MPafc/MPaEc/MPaυ
ConcreteC3535.7127.113.11 × 1040.2
C5050.9038.693.39 × 1040.2
Table 3. Mechanical properties of reinforcement, steel, and bolt.
MaterialsGradeDiameter or Thickness/mmfy/MPafu/MPaEc/MPa
ReinforcementHRB40012427.2603.12.03 × 105
18477.3655.02.08 × 105
22433.9598.42.12 × 105
HPB30010342.5497.12.10 × 105
SteelQ23510288.1453.72.14 × 105
Bolt10.924903.41010.22.11 × 105
Table 4. Ductility coefficient of TLJ-1 and TLJ-2.
Specimen NumberDirectionFy/kNy/mmFp/kNp/mmFu/kNu/mm μ _ Etotal/kJStiffness
Degradation
Rate Rsd
TLJ-1Positive318.47629.697356.86439.526356.86439.5261.47830.3950.239
Negative−235.643−22.832−280.315−31.787−274.375−37.0810.136
TLJ-2Positive375.68343.354402.56476.624370.01992.0252.067272.6460.280
Negative−352.785−43.529−377.865−61.138−321.185−87.5520.314
Table 5. Plastic parameter of CDP.
Dilation AngleEccentricityfb0/fc0KViscosity Parameter
300.11.160.666670.0005
Table 6. Parameter variables of FEM (TLJ-3~TLJ-14).
Finite Element ModelParameter
Steel Tube Thickness T (mm)Lower Steel Tube Length Lls (mm)Axial Compression Ratio NBolt Quantity n
TLJ-3104300.7512 (3 rows)
TLJ-454300.7512 (3 rows)
TLJ-534300.7512 (3 rows)
TLJ-6103000.7512 (3 rows)
TLJ-753000.7512 (3 rows)
TLJ-833000.7512 (3 rows)
TLJ-9105000.7512 (3 rows)
TLJ-1055000.7512 (3 rows)
TLJ-1135000.7512 (3 rows)
TLJ-12104300.8012 (3 rows)
TLJ-13104300.8512 (3 rows)
TLJ-14104300.7520 (5 rows)
Table 7. Comparative analysis of simulation results (TLJ-3~TLJ-14).
Specimen NumberDirectionFy/kNy/mmFp/kNp/mmFu/kNu/mm μ _ Etotal/kJStiffness
Degradation
Rate Rsd
TLJ-3Positive332.81839.477396.02677359.836922.363308.8760.206
Negative−331.419−37.915−384.898−68.955−338.464−90.8320.262
TLJ-4Positive326.19240.702378.79276.984352.71991.9222.241270.1800.218
Negative−323.914−39.651−372.412−62−308.515−91.4200.262
TLJ-5Positive315.78938.106366.14077349.239922.372239.3340.226
Negative−312.874−39.483−364.545−77−320.980−91.9960.215
TLJ-6Positive310.24137.293361.69476.654339.06391.8172.435252.2370.200
Negative−309.579−36.516−355.157−62−289.055−91.9870.250
TLJ-7Positive291.93636.863336.59561.959280.74289.0102.390226.5090.253
Negative−294.709−35.573−333.915−62−283.828−85.4500.258
TLJ-8Positive273.02434.142324.00861.903280.73191.9872.594206.3970.237
Negative−268.234−33.372−316.494−51.988−269.020−83.2140.287
TLJ-9Positive357.69441.840419.15176.997374.02791.9792.240324.2390.204
Negative−348.070−37.797−408.910−62−347.574−86.2230.244
TLJ-10Positive346.15740.705404.19676.996373.79091.8832.236289.9330.235
Negative−343.258−38.582−398.093−62−318.518−85.2550.289
TLJ-11Positive324.93140.374378.96761.966342.24991.9962.268253.3490.225
Negative−323.013−40.766−376.650−76.880−325.678−91.9910.229
TLJ-12Positive343.92036.885406.24162345.30486.9052.303334.6190.238
Negative−338.063−36.253−397.104−62−337.539−81.5490.248
TLJ-13Positive357.67137.282404.11262350.29583.0222.102342.8610.234
Negative−351.874−36.885−396.341−62−339.440−80.3430.246
TLJ-14Positive337.50518.973407.75677346.56391.7954.924484.8660.193
Negative−329.120−18.367−403.802−62−355.197−920.163
Disclaimer/Publisher’s Note: The statements, opinions and data contained in all publications are solely those of the individual author(s) and contributor(s) and not of MDPI and/or the editor(s). MDPI and/or the editor(s) disclaim responsibility for any injury to people or property resulting from any ideas, methods, instructions or products referred to in the content.