Article

Optimizing Subway HVAC Control Strategies for Energy Savings Using Dymola Simulation

1
Guangzhou Metro Design and Research Institute Co., Ltd., Yuncheng North 2nd Road, Baiyun District, Guangzhou 510420, China
2
School of Mechanical Engineering, Tongji University, No. 1239 Siping Rd, Yangpu District, Shanghai 200092, China
*
Author to whom correspondence should be addressed.
Buildings 2025, 15(17), 3064; https://doi.org/10.3390/buildings15173064
Submission received: 2 July 2025 / Revised: 17 August 2025 / Accepted: 22 August 2025 / Published: 27 August 2025

Abstract

Water distribution and pumping systems consume a large share of energy in metro HVAC operations and remain a major challenge to energy-efficient performance. This study, grounded in a practical metro project, investigates four control strategies for chilled water systems, focusing on chiller sequencing, pump frequency modulation, and variable flow regulation. A dynamic system model was developed using Dymola to simulate and evaluate the performance of each strategy. The results indicate that Strategy 2, which integrates real-time outdoor weather parameters into the frequency control logic, enhances operational stability and maintainability while achieving a 4.42% reduction in total energy consumption compared to the baseline. Strategy 4 employs a genetic algorithm to optimize chiller load distribution, resulting in improved system efficiency and energy savings of up to 8.62%. Further analysis reveals that chillers account for approximately 80% of the system’s total energy consumption, underscoring their central importance in system-wide energy optimization. Additionally, cooling towers show significant energy-saving potential under low wet-bulb temperatures. A 1 °C decrease in wet-bulb temperature results in an estimated 7% reduction in energy use. These findings offer quantitative insights and practical guidance for the low-carbon optimization of metro chilled water systems.

1. Introduction

As urbanization accelerates, metro systems have become a cornerstone of modern public transport. In 2023, China’s urban rail transit consumed 24.98 billion kWh of electricity, up 9.59% from the previous year [1]. Among metro energy uses, the HVAC system is a dominant contributor, accounting for 30–50% of total consumption [2]. Yet its efficiency still lags behind systems in Europe and the Americas [3]. Given China’s dual-carbon goal, improving the energy performance of metro HVAC systems is both urgent and necessary.
A promising direction lies in the use of digital twins: virtual replicas of physical systems that enable real-time interaction and predictive control. Lee [4] emphasized that digital twins bridge simulation and operation by calibrating models with live sensor data, enabling dynamic system optimization. Schicktanz et al. [5] used Modelica to simulate temperature profiles and thermal loads in HVAC systems, achieving close agreement with measured data, thus verifying the platform’s physical accuracy. Huang [6] applied Dymola to model a conventional chiller plant in Washington, D.C., reporting simulation errors of less than 5%, confirming its reliability for real-world replication. Vering et al. [7] modeled energy recovery ventilation systems using Modelica and improved accuracy through manual parameter tuning, showcasing its adaptability for component-level calibration. Together, these studies underscore Dymola’s strength as a digital twin platform, with multi-domain compatibility and support for FMI-based integration.
At the core of digital twin intelligence lies the integration of advanced optimization algorithms. Kusiak et al. [8] used machine learning to model nonlinear relationships in HVAC control, achieving a 7% reduction in energy use via Particle Swarm Optimization. Wang Lihui [9] reported energy savings of 16.8% and 26.8% for compressors and water systems, respectively, using genetic algorithms. Alberto et al. [10] reached similar conclusions, affirming that evolutionary algorithms generally outperform rule-based control. Hu et al. [11] introduced a Flower Pollination Algorithm for optimal chiller loading, achieving 12–27% energy savings. Chen et al. [12] developed a data-driven pump staging strategy that saved up to 15% energy in building systems. These methods reveal the potential of algorithm-guided control to maximize energy efficiency. These methods reveal the potential of algorithm-guided control to maximize energy efficiency. As demonstrated by Qingang Zhang, digital twins provide an effective testbed for such control strategies, enabling safe, scalable experimentation prior to real-world deployment [13].
While these techniques show promise in general HVAC applications, their transferability to metro environments remains limited. Most digital, twin-based optimization efforts have so far targeted above-ground buildings with relatively stable loads. For instance, Borja-Conde [14] proposed a model predictive control (MPC) strategy for multi-chiller systems in commercial buildings, achieving 5.19% energy savings. However, such approaches rely heavily on accurate load forecasts and lack adaptability to the sharp fluctuations and tighter safety constraints typical of metro operations.
Furthermore, studies targeting HVAC control in metro contexts remain limited. Guan et al. [15] found that ventilation and air conditioning consumed 46% of total metro electricity in a representative Chinese city, with chillers and pumps accounting for 29%. Seo and Lee [16] observed that chillers operating under 50% load ran more than half the time, wasting energy due to low COP. Abou-Ziyan et al. [17] improved chiller performance by adjusting compressor numbers based on environmental conditions, achieving up to 33% performance gains. Huang Sen et al. [18] evaluated load distribution, equipment staging, and hybrid strategies, confirming that combined approaches yield the most savings. Wang et al. [19] designed a rule-based control system for Beijing subways, achieving 20–38% savings, though it lacked adaptive intelligence.
Sun et al. [20] demonstrated that simulation models calibrated with historical data can effectively mirror system behavior. Still, their studies focused on generic HVAC systems, leaving metro-specific constraints underexplored. Ga-Yeong Lee [4] also stressed that for HVAC twins to be useful, simulation models must be dynamically responsive and interoperable with control algorithms.
To fill this gap, this study proposes a high-fidelity digital twin model of a metro chilled water system developed in Dymola using real-world parameters. Four control strategies were evaluated, targeting chiller sequencing, pump frequency regulation, and flow optimization. A genetic algorithm was embedded within the digital twin to dynamically optimize switching points, with energy consumption as the objective function. The results aim to enhance both the accuracy and adaptability of metro HVAC control and offer a practical pathway toward real-time predictive optimization in underground transit environments.

2. Methodology

2.1. Genetic Algorithm Optimization

This study adopted a genetic algorithm (GA) to optimize the system’s dynamic operation, with a focus on minimizing total energy consumption during the simulation period. The GA determined optimal control parameters, including load-switching points and set temperatures, based on real-time operating data obtained from simulation.
(1) Encoding strategy
A real-valued encoding scheme was used to ensure that each individual in the population represented a unique control strategy for the metro HVAC water system. In the context of this study, an individual refers to a specific combination of control parameters, i.e., a candidate solution generated and evaluated by the genetic algorithm. Each individual was encoded as a chromosome consisting of four genes, corresponding to key operational variables:
  • cooling pump flow rate;
  • chiller load-switching point;
  • chilled water outlet temperature;
  • cooling tower outlet temperature.
This encoding enabled the algorithm to efficiently search for the optimal set of parameters that minimized system energy consumption.
(2) Objective function and fitness function
The objective function was defined as the total electrical energy consumption of the system over the simulation period:
m i n   f = m i n ( E e l   _ c o n s )
where f is the objective function and E e l _ c o n s is the total energy consumption of the system.
To guide the evolution process, a fitness function was defined as the inverse of the objective function:
F j = 1 f
where F j is the fitness of individual j . Lower energy consumption yielded higher fitness, increasing the individual’s likelihood of selection in the next generation.
Selection was carried out using a roulette wheel (proportional selection) mechanism, where the probability of selecting individual j was given by
P j = F j F j
where P j is the probability that individual j in the population is selected.
A random number between 0 and 1 was drawn for each new individual and the corresponding probability segment determined which parent was selected. As a result, individuals with higher fitness were more likely to be retained and propagated.
(3) Crossing probabilities and variance probabilities
At the same time, in order to improve the global search ability of the genetic algorithm, which could make the crossover probability and variance probability update automatically with the fitness F during the iterative calculation process, it was necessary to introduce the expectation E X and variance D X of the fitness F first (see Equations (4) and (5)).
E X = F 1 + F 2 + + F n n
D X = F 1 2 + F 2 2 + + F n 2 n E X 2
where n is the number of individuals in the population, F n is the match fitness, E X is the expectation, and D X is the variance of the fitness.
As the genetic algorithm was computed iteratively, the highly adapted individuals in the offspring were copied and retained and the poorly adapted individuals were eliminated. As a result, the overall fitness of the population gradually increased and the E X gradually increased, while the individuals that could be retained gradually became more and more similar individuals with higher fitness and the D X gradually decreased.
Through the expectation E X and variance   D X of the fitness F , the population similarity coefficient ρ could be introduced:
ρ = E X + 1 D X
As mentioned earlier, as the genetic algorithm was computed iteratively, E X gradually increased and D X gradually decreased, so the population similarity coefficient ρ gradually increased, indicating an increase in the similarity of individuals in the population. Through the population similarity coefficient ρ , the crossover probability P c and the variation probability P m could be improved (see Equations (7) and (8)).
P c = 1 1 + e h 1 / ρ 0.15
P m = h 2 6 1 + e 1 / ρ
where P c is the crossover probability, P m is the variation probability, h 1 is an adjustable constant, h 1 0 , + , and h 2 is an adjustable constant, h 2 0 , 1 .
As the population similarity coefficient ρ increased, the crossover probability P c decreased and the mutation probability P m increased, which was more similar to the actual biological evolution process, and, in this way, the improvement of the crossover and mutation probabilities could be achieved.
(4) Single-point crossover operator
We performed a single-point crossover operation on the chromosomes of two neighboring individuals with improved crossover probability P c by randomly selecting the crossover position from which they would be exchanged with each other.
(5) Single-point variational operator
With an improved mutation probability P m mutating on every bit of all individuals in the parent generation, the mutation property allowed the solution process to randomly search the entire space in which the solution could exist, and, therefore, a globally optimal solution could be found to some extent.
(6) Algorithm flow
The flowchart of the algorithm is shown in Figure 1.
(1) Initialization: Read the original model parameters to define the initial individual. Generate a population of size n = 50 by randomly sampling additional individuals.
(2) Fitness Evaluation: Evaluate each individual’s fitness based on the defined objective and penalty functions.
(3) Selection: Select parent individuals using the roulette wheel (proportional) selection method, where selection probability is proportional to fitness.
(4) Crossover and Mutation: Apply crossover and mutation operators to the selected parents using adaptive probabilities to generate offspring.
(5) Evolution: Repeat the genetic operations iteratively. If the best fitness value remains unchanged for 10 consecutive generations, early convergence is assumed. Otherwise, the process continues until the maximum number of generations is reached (max step = 100).
(6) Termination: Output the individual with the optimal fitness as the final solution.
This adaptive GA framework improves convergence stability and search efficiency by dynamically adjusting genetic parameters based on population similarity. It is particularly suitable for complex, nonlinear HVAC system optimization under varying operational conditions.

2.2. Mathematical Modeling of Water System Equipment

This study took an actual project at a metro station in Guangzhou City as the research background to specify the chosen control strategy and increase the feasibility and practical significance of the subsequent simulation scheme. The main equipment of the water system in the metro station is shown in Table 1.
The chiller generated chilled water to absorb heat from the building. The pumps circulated this chilled water to the load and also circulated condenser water between the chiller and the cooling tower. The cooling tower rejected the heat from the condenser water loop to the atmosphere.
The mathematical models of physical components such as chillers, cooling towers, and pumps were based on Dymola’s standard water system libraries. Their modeling principles are briefly summarized below:
  • Chiller
This simulation used a vapor compression chiller model to control the chiller by targeting the temperature at the evaporator outlet, taking into account the dynamics through the heat exchanger volume and heat loss.
The cooling power of the chiller was calculated based on the target temperature:
Q ˙ c o o l = m ˙ e v c p T e v , i n T target  
where
Q ˙ c o o l —chiller cooling power, W;
m ˙ e v —chiller water flow rate, kg/s;
c p —Specific heat capacity at constant pressure, J/kg;
T e v , i n —chiller inlet temperature, °C;
T target —the target temperature of the chiller, °C.
This was subject to a maximum heat flow rate determined by a user-defined cooling power table and a minimum heat flow rate determined by the product of the cooling power output and the partial load table.
The heat flow rate of the condenser was calculated by means of an energy balance:
Q ˙ heat = Q ˙ cool + f p P e l
where
Q ˙ heat —heat flow from the condenser, W;
f p —proportion of compressor electrical energy that is transferred from heat to condenser;
P e l —compressor energy consumption, W.
  • Pump
This was a simple pump model that produced a constant mass flow rate based on specified parameters or a variable mass flow rate when using a mass flow input, with energy requirements calculated based on rated power consumption. When the pump model was in variable speed mode, the power consumption was calculated by the following:
P e l = m ˙ m ˙ nom f e l P e l , n o m
where
m ˙ —mass flow rate, kg/s;
m ˙ nom —the rated flow rate of the pump, kg/s;
f e l —efficiency correction factor for part-load operation from 0.35 ~ 0.8.
  • Cooling towers
The model calculated the power requirements for the blower and pump heater as well as water consumption and wastewater. The fluid was cooled directly using ambient air. The heat flow from the fluid to the air stream was
Q ˙ = η c w T i n , w T b u l b
where
Q ˙ —heat flow, W;
T b u l b —outdoor air wet-bulb temperature, °C;
T i n , w —cooling tower inlet water temperature, °C;
η —cooling tower efficiency;
c w —the specific heat capacity of water, J/kg.
The cooling efficiency of the tower at constant blower speed or stepless variation of speed was calculated as
η = k 1 e x p m ˙ a i r L i d m ˙ w
where
k —characteristic constants, depending on the type of cooling tower;
m ˙ a i r —mass flow rate of air, kg/s;
m ˙ w —mass flow rate of water, kg/s;
L i d —minimum air–water ratio.
We derived the minimum necessary air–water ratio L i d :
L i d = h i n , w h out , w h out , air h in , air h out , w x out x in
where
h i n , w , h out , w —the enthalpy of saturated air corresponding to the water temperature in the cooling tower inlet and outlet, J/kg;
h in , air , h out , air —the enthalpy of air inlet and outlet of the cooling tower, J/kg;
x in , x out —humidity content of air-side inlet and outlet, g/kg (DA).
The outlet air enthalpy was equal to the saturated air enthalpy and the outlet water temperature was the corresponding wet-bulb temperature.
The cooling tower coefficient k was a characteristic constant depending on the type of cooling tower. In the variable blower speed mode, the cooling efficiency of the cooling tower was calculated as
η = T i n , w T target T i n , w T bulb
where
T i n , w —cooling tower inlet water temperature, °C;
T target —cooling tower target temperature, °C;
T bulb —outdoor air wet-bulb temperature, °C.
We considered the lower and upper boundaries:
η min = k 1 exp m ˙ min L i d m i n , w
η max = k 1 exp m ˙ max L i d m i n , w
where
m ˙ min —minimum air flow, kg/s;
m ˙ max —maximum air flow, kg/s;
m ˙ i n , w —cooling tower inlet water flow, kg/s.
When ambient natural convection could be satisfied to reduce the cooling water to the target temperature, the blower was switched off and the minimum mass flow rate m_flow_off represented the effect of natural convection.
m ˙ a i r = log 1 η k m ˙ i n , w L i d
The cooling tower blower energy consumption was calculated as follows:
P e l = P el , nom m ˙ m ˙ nom f power
where
P e l —cooling tower blower energy consumption, W;
P el , nom —rated energy consumption of the blower, W;
f power —correction factor for blowers, taking values from 1 ~ 3;
m ˙ nom —rated mass flow rate, kg/s;
m ˙ —actual mass flow rate, kg/s;

2.3. Establishment of a Simulation Scheme for Practice-Based Control Strategies

Based on the research objectives of water system control strategy optimization, combined with the actual project, this study established a total of four water system control schemes.
Scheme 1.  
Variable flow rate, constant temperature difference system with rough number control, and upper and lower limit control.
A ventilation air-conditioning water system is often set as the number of chiller units for a control strategy with a load conversion point of 50%, that is, for two sets of the same capacity of a chiller combination system, when the system load is more than 50%, the primary and secondary unit loads are equal, and when the system load is less than 50%, all loads are by the primary unit. Scheme 1 adopted a rough number of units for the control strategy, which was set as the benchmark scheme for this study.
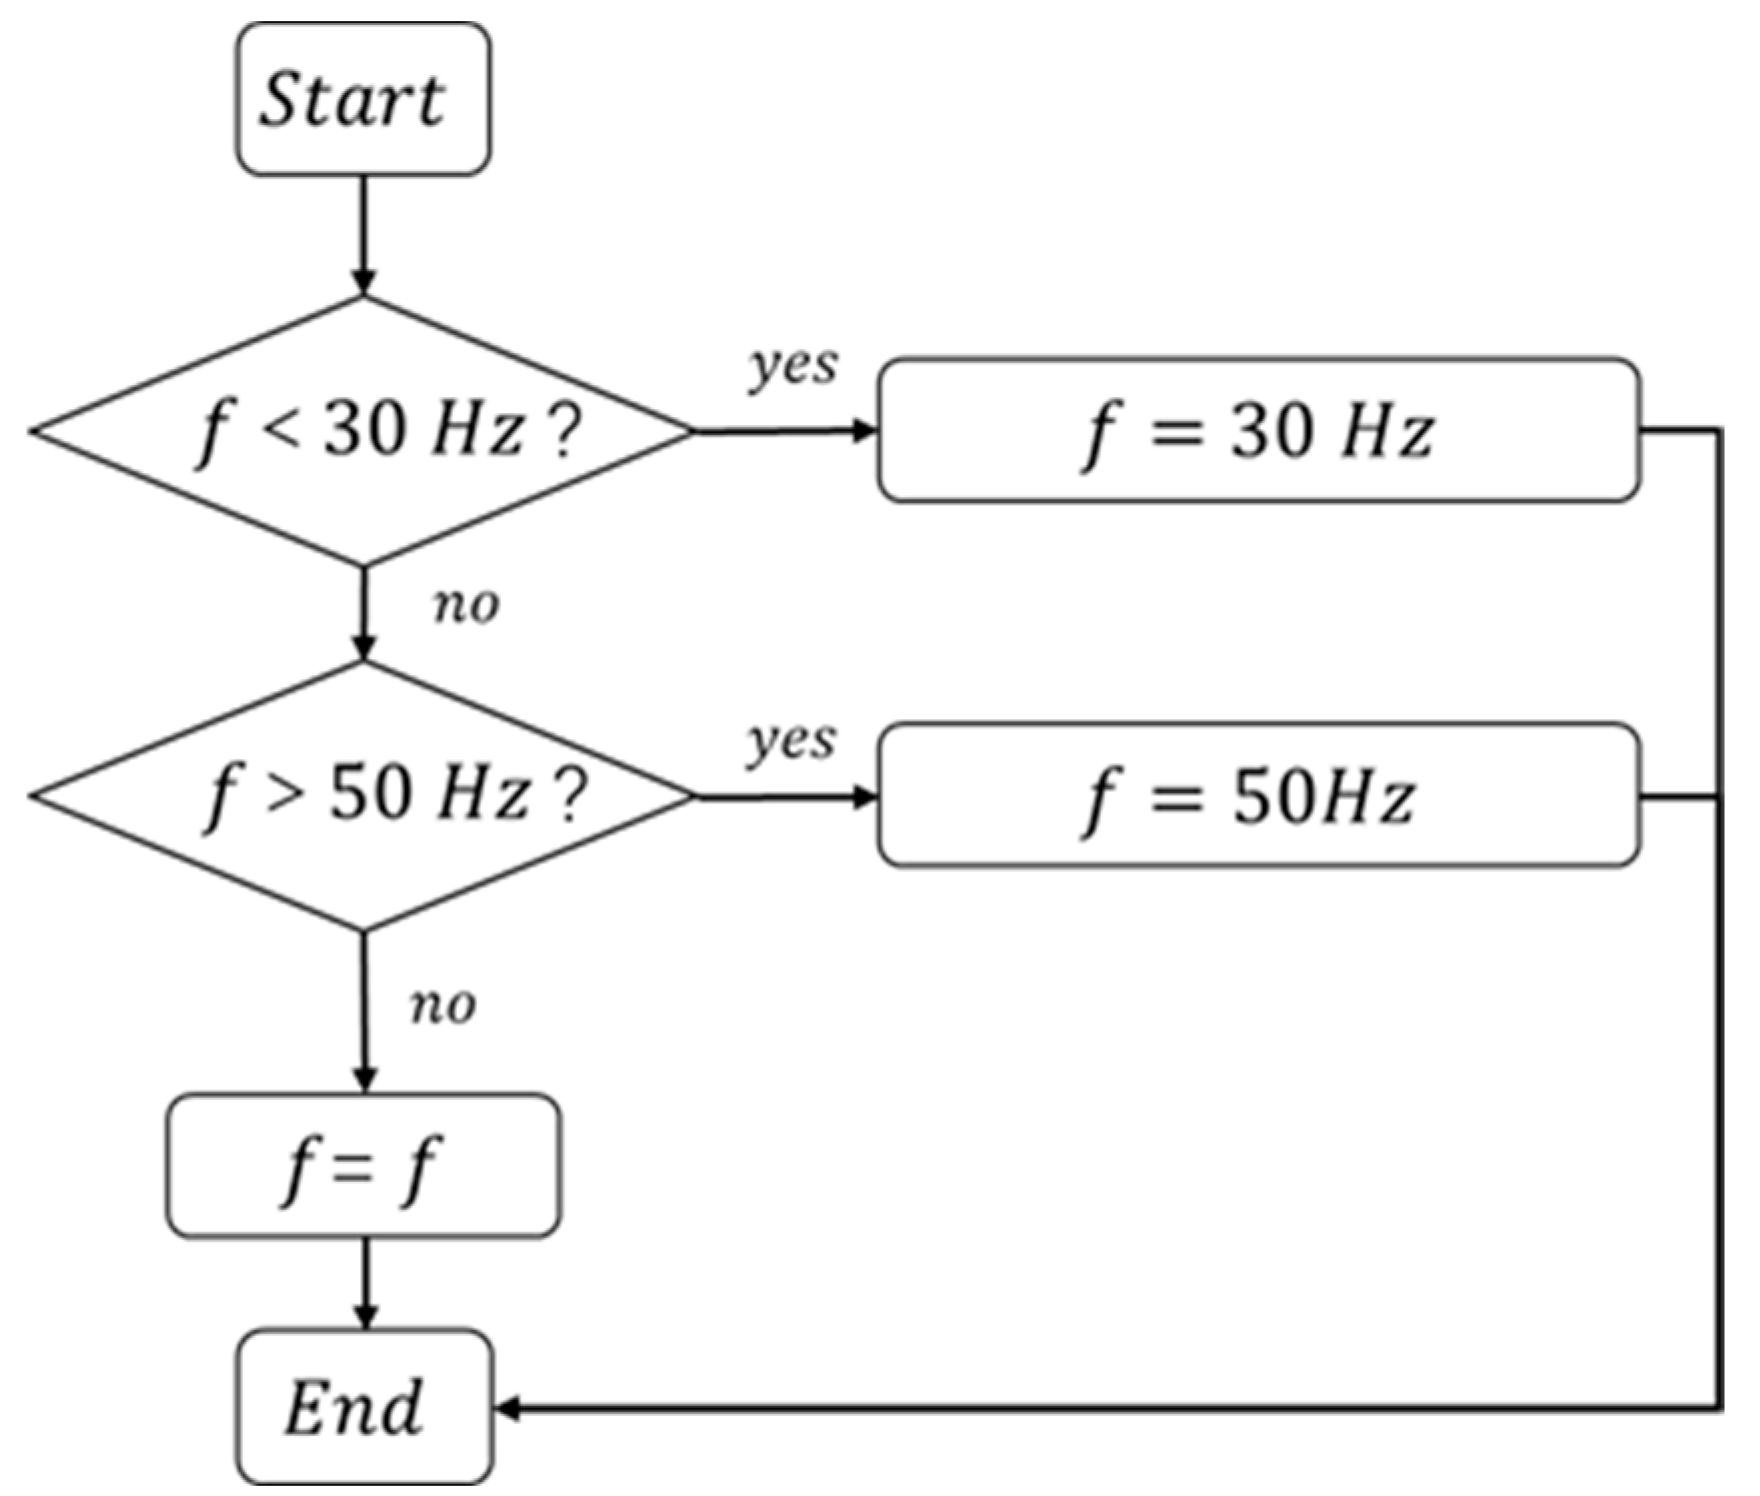
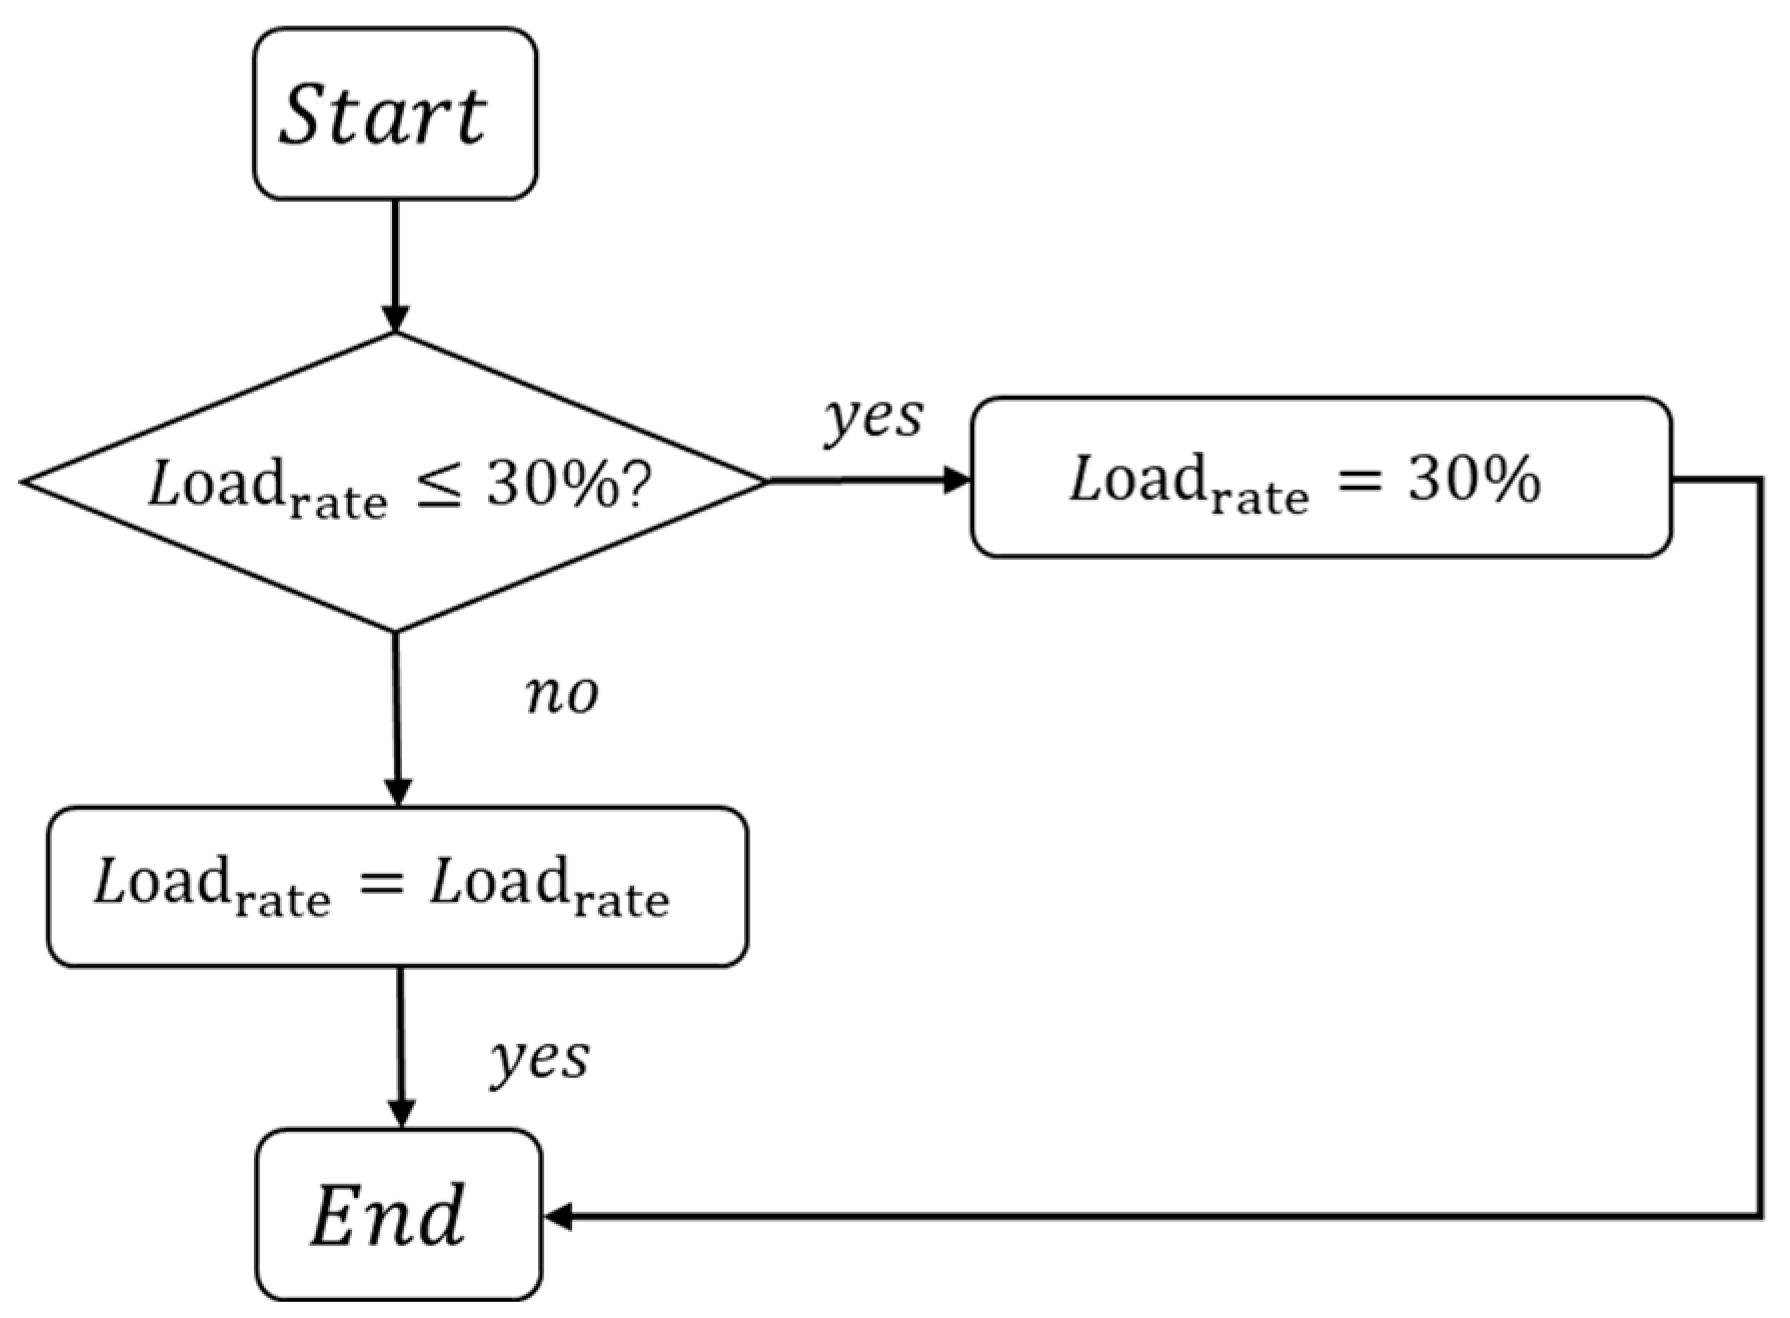
At the same time, taking into account the actual project chiller and pump frequency control for the safe and efficient operation of the equipment, to provide protection, in this study, the chiller and pumps were frequency-controlled, and their control logic is shown in Figure 2 and Figure 3.
In Figure 2, the frequency control range of the chilled water pump was set from 30 Hz to 50 Hz. When the pump frequency was lower than 30 Hz, the bypass valve opening was controlled by differential pressure bypass to increase the bypass flow rate and maintain the frequency until the actual differential pressure converged to the set value of constant differential pressure. When the pump frequency was higher than 50 Hz, the frequency was maintained by gradually closing the bypass valve and reducing the bypass flow. When the frequency of the chilled water pump was at a normal value, the differential pressure bypass device did not activate its own regulation function, the bypass valve was kept fully closed, and the pump operated according to the actual frequency, which realized the efficient operation of the pump.
In Figure 3, L o a d r a t e is the actual load rate of the chiller; 30% was the lower limit of the operation of a single chiller. In order to ensure the good performance of the chiller unit, the control system detected the load rate of the chiller unit time by time; when the single load rate was lower than 30%, the unit was controlled to run at the lowest load rate set value to ensure its stability; when the single load rate was higher than the set value, the chiller unit ran according to the actual load rate.
Scheme 2.  
Variable flow constant temperature difference system with actual number of units control and upper and lower limit control.
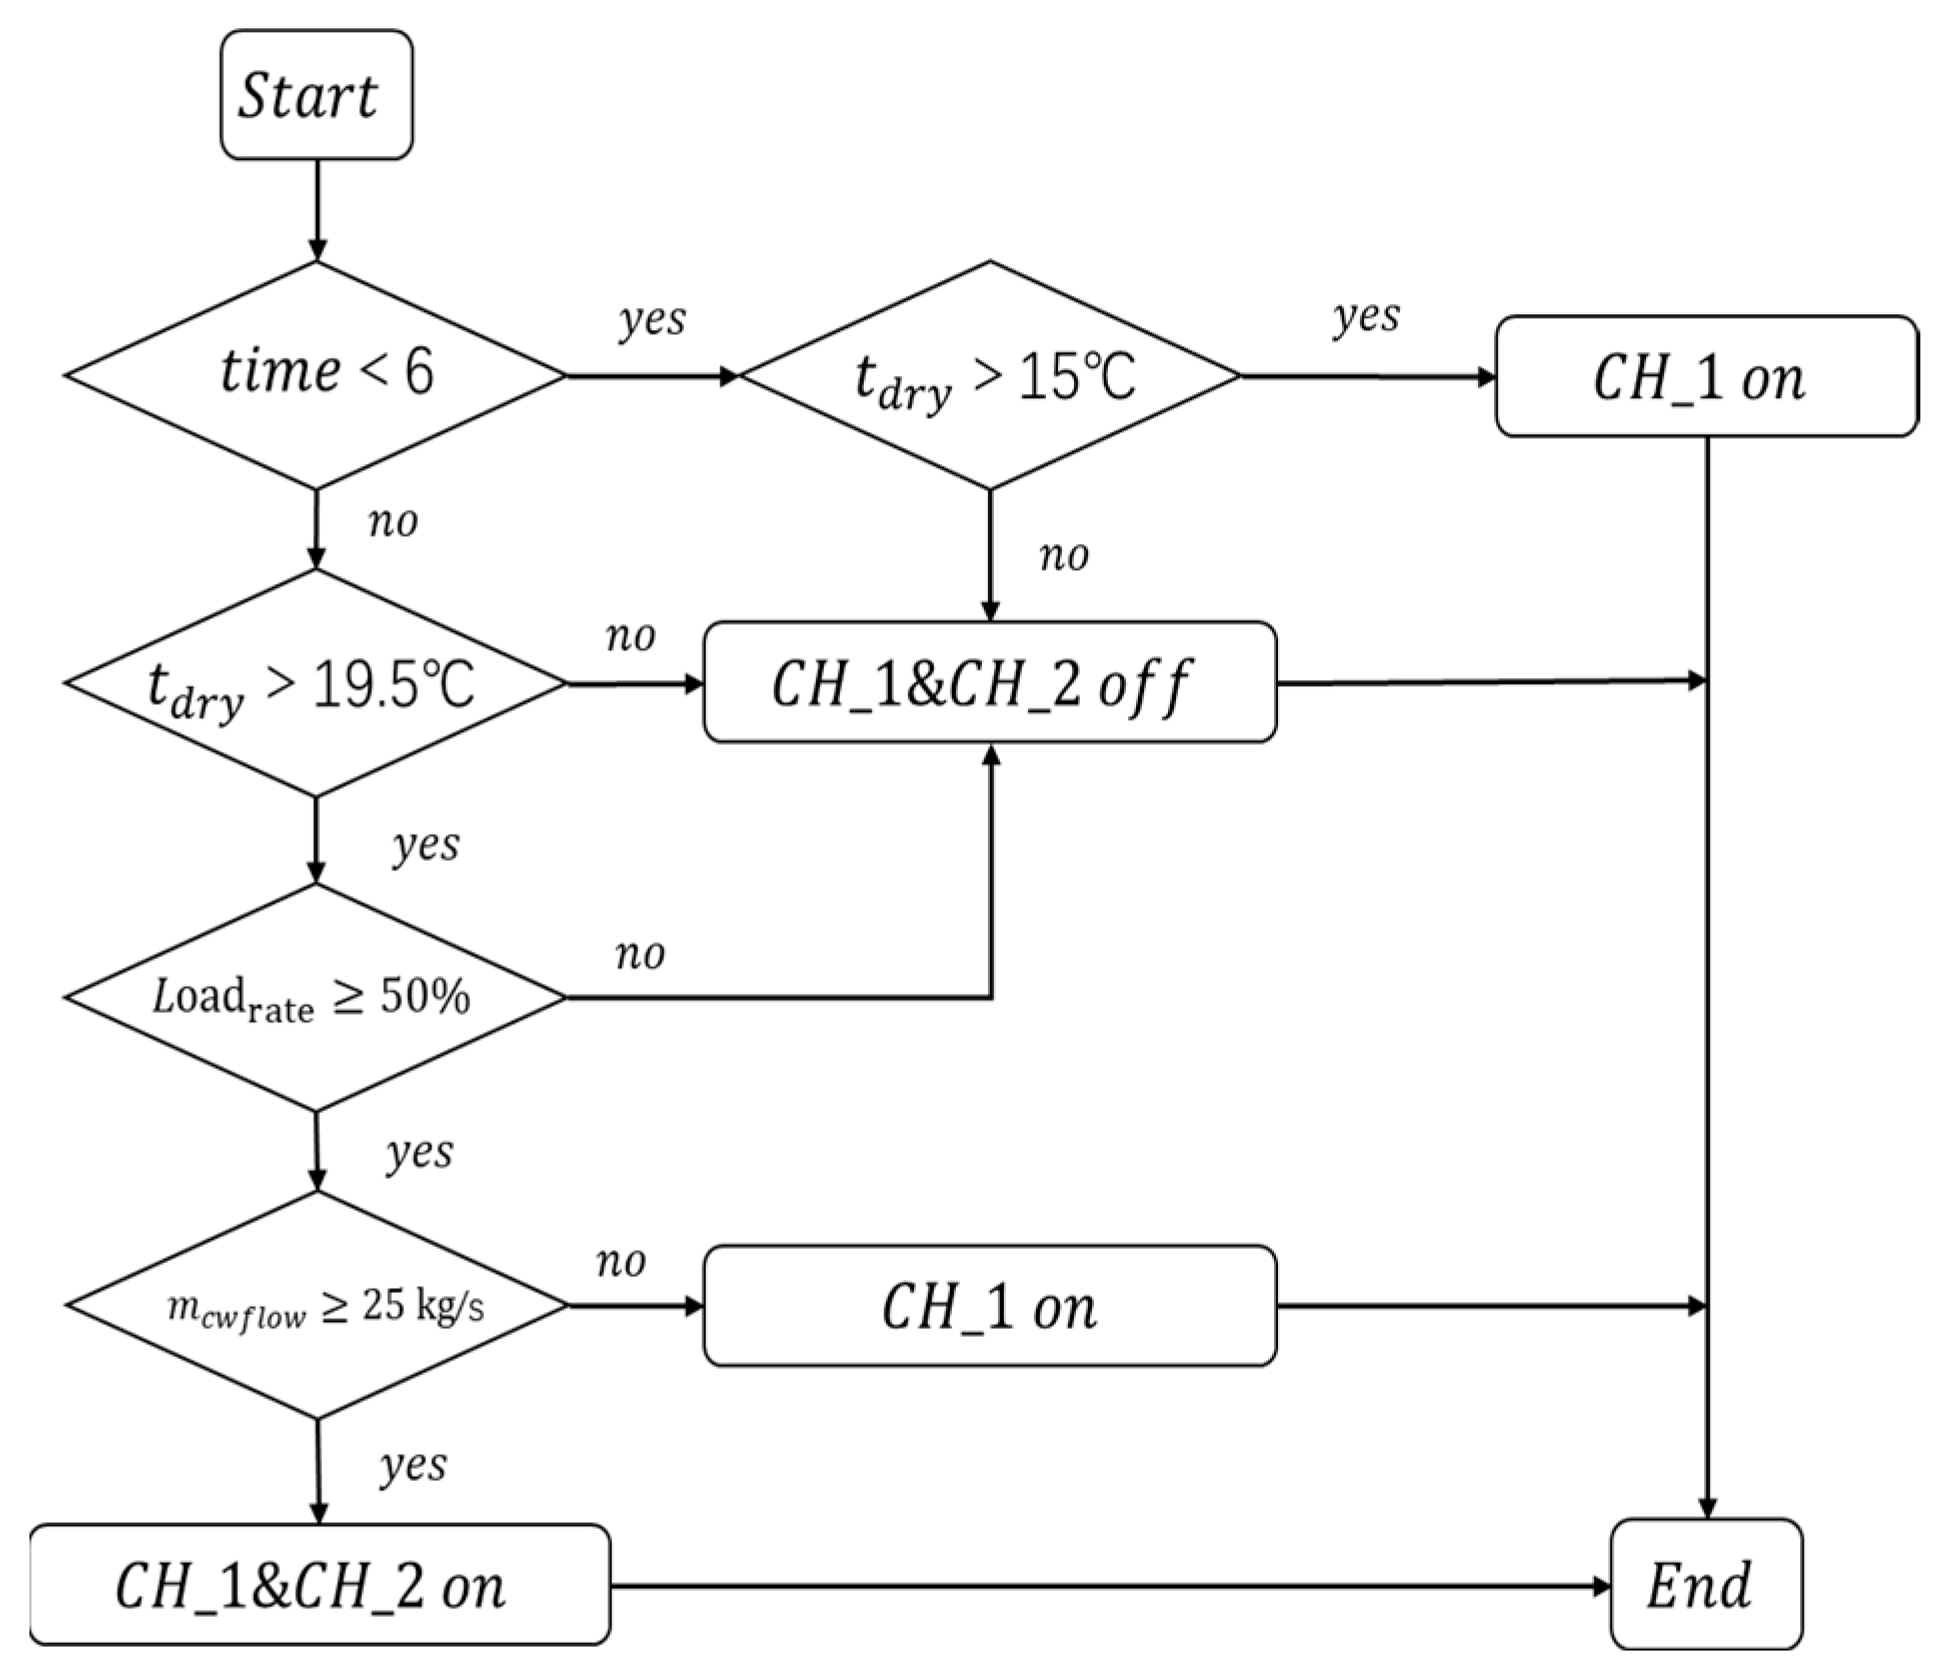
According to the actual metro project in Guangzhou, the actual load rate of the chiller unit, the system operation schedule, and the temperature were used as the basis for the number of units controlled. The number of units control strategy of Scheme 1 was further optimized to obtain Scheme 2, the control logic of which is shown in Figure 4.
This scheme took into full consideration the operating characteristics of the underground as a basis for further determining the temperature setting of the chiller, the operating schedule, and the actual load rate. The small system ran all day long and the large system was set from 06:00 to 24:00 due to the influence of passengers’ travelling, so 06:00 was chosen as one of the control nodes for starting and stopping the equipment. The load was affected by the terminal dry-bulb temperature. When the small system was started alone, it was set to start the second unit at over 15 °C; when the large and small systems were running at the same time, it was set to start at over 19.5 °C. At the same time, in order to further improve the energy efficiency of the system, when the actual load rate of a single chiller exceeded 60 per cent, the second chiller was started.
Scheme 3.  
Variable flow constant temperature difference system with actual number of units control and no upper or lower limit control.
Scheme 3 was designed to evaluate the impact of removing upper and lower operational limits on system performance. It was based on Scheme 2 but removed the control constraints on chiller load and pump frequency. The control logic for the number of operating chillers remained consistent with actual metro station operation.
This scheme served as an academic sensitivity analysis. In real applications, chillers operating below 30% load or pumps running below 30 Hz may experience stall, surge, or a significant drop in efficiency. These risks limit the practical feasibility of such a strategy. Therefore, Scheme 3 was not intended for direct engineering applications but rather to reveal the theoretical influence of boundary conditions on energy consumption outcomes.
Scheme 4.  
Genetic Algorithm Optimized Constant Temperature Difference Variable Flow Rate System with Number of Units Control and Upper and Lower Limit Control of Equipment Operation.
On the basis of Scheme 2, the control strategy for the number of chiller units was optimized by the genetic algorithm, with the objective of minimizing annual system energy consumption.

2.4. Dynamic Simulation Modeling of Water Systems Based on Dymola

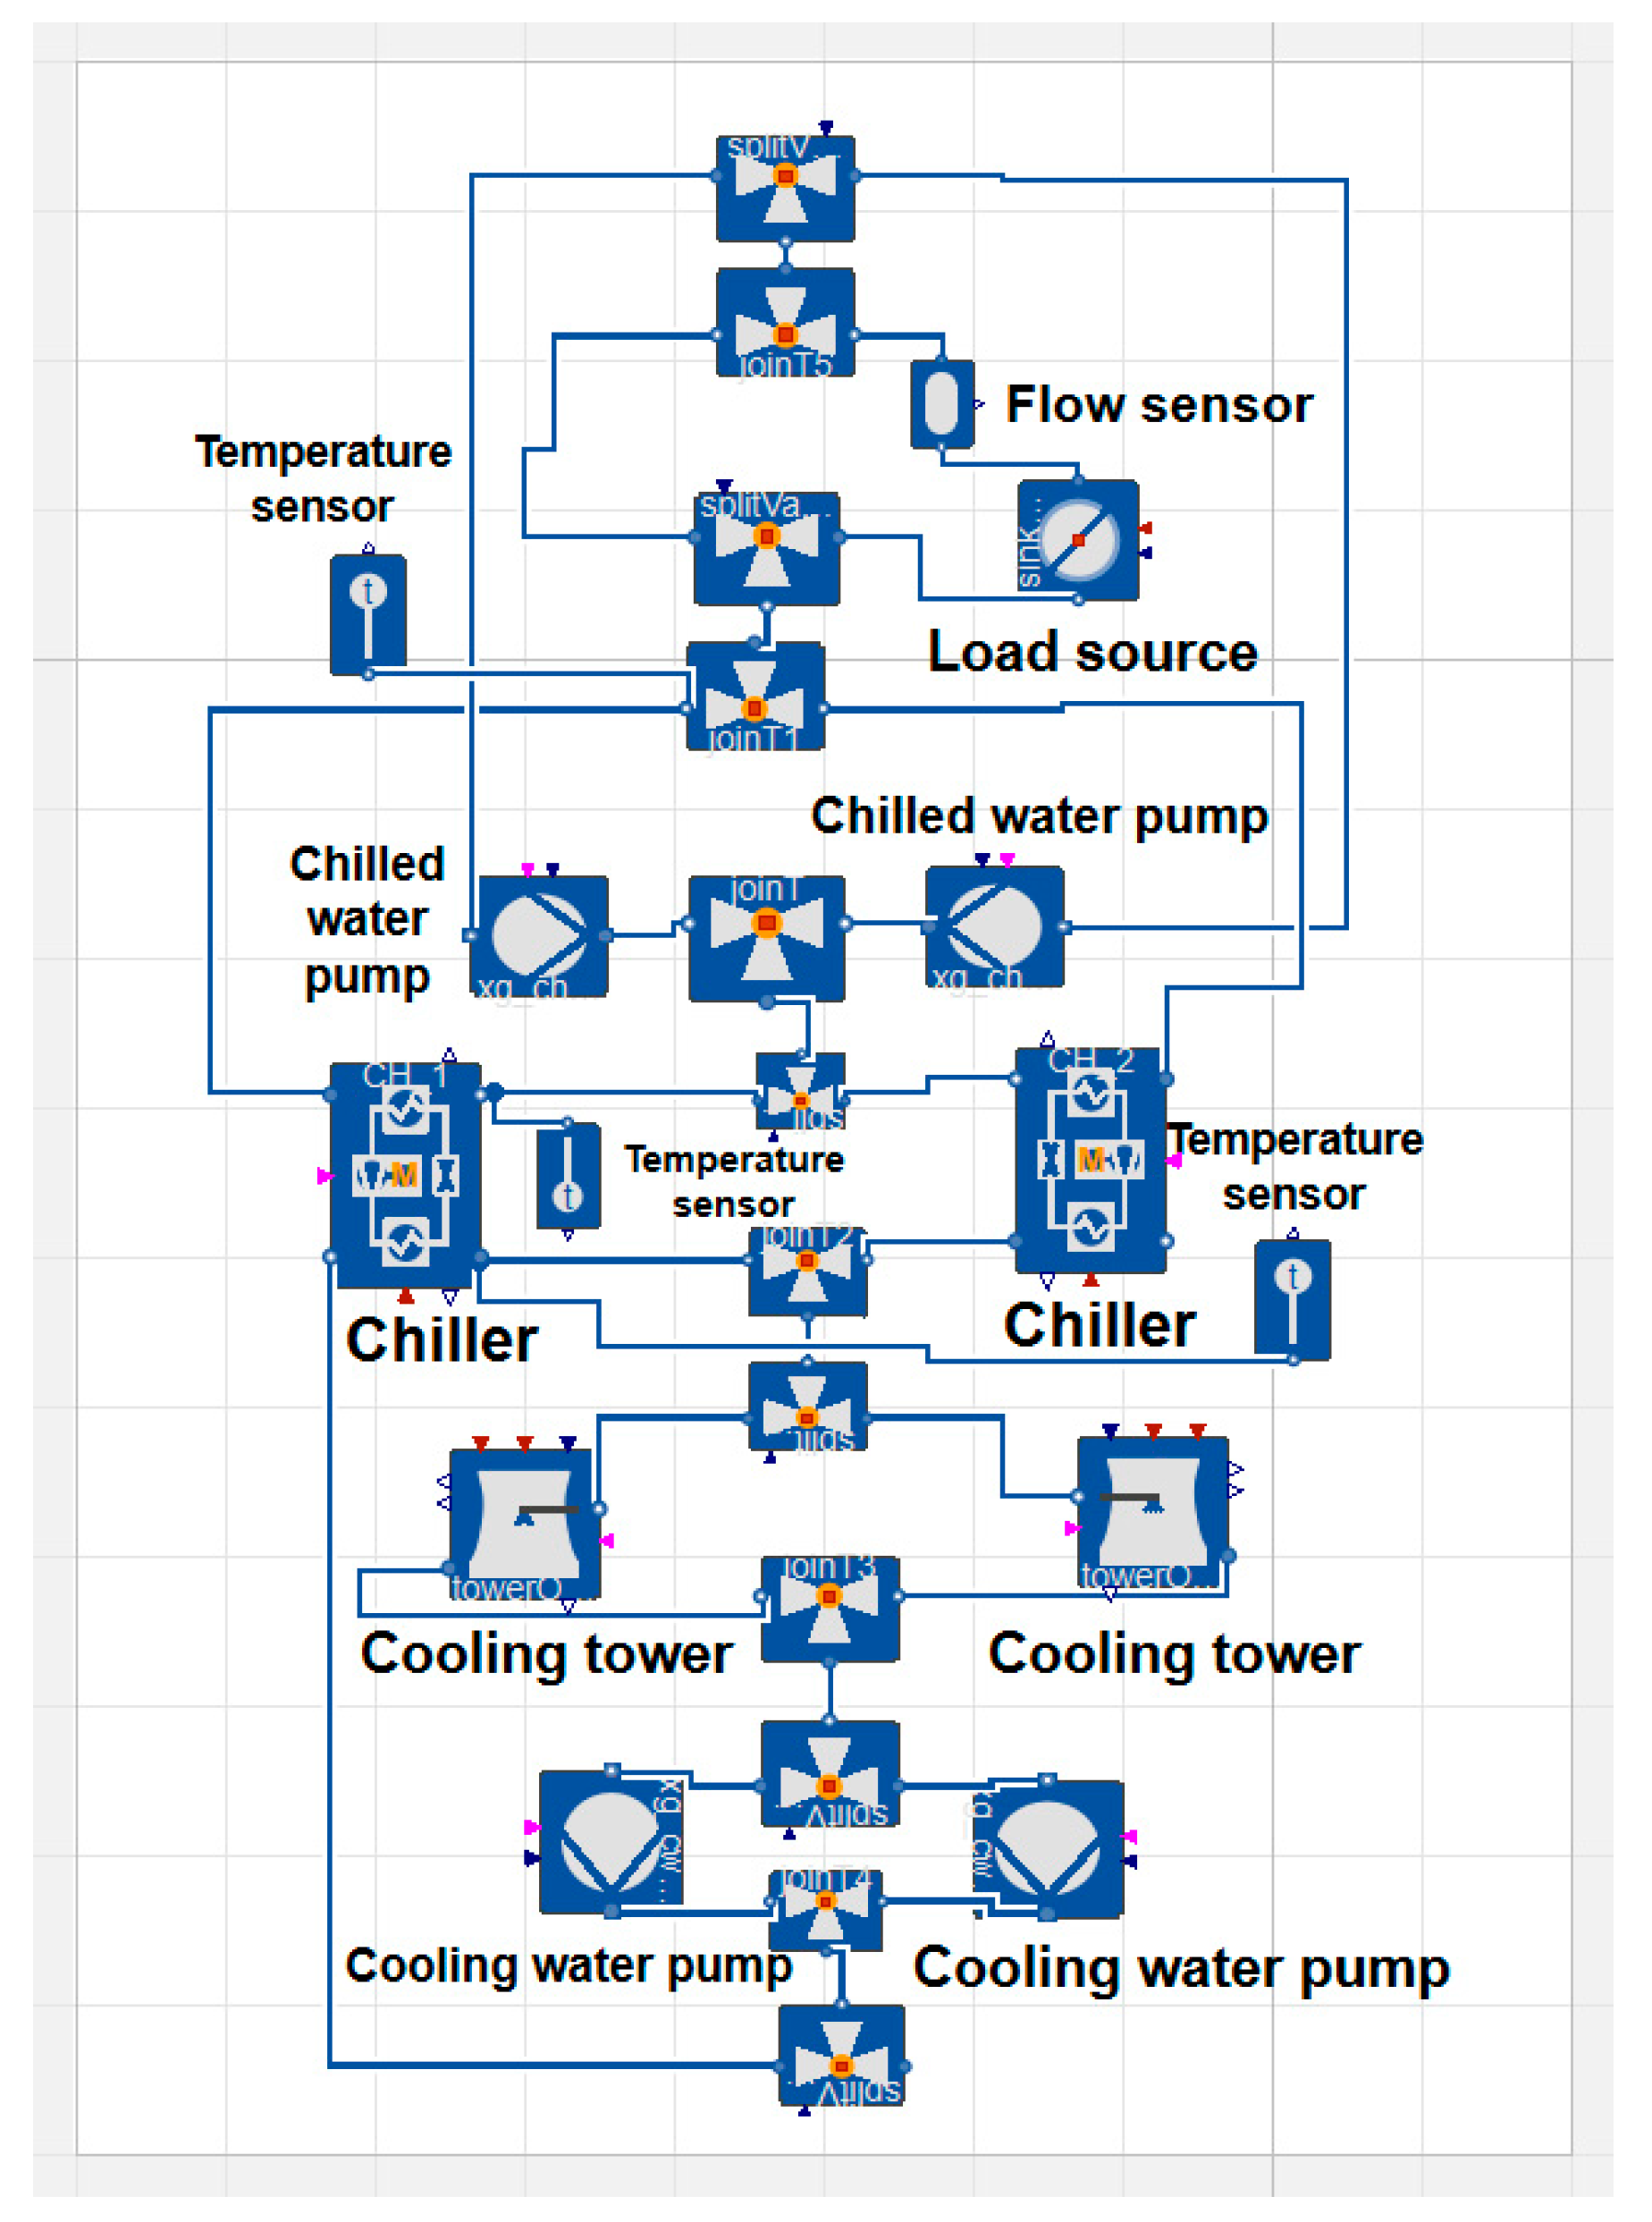
The Dymola layout of the metro station water system model is shown in Figure 5. Each control scheme, as described in Section 2.3, utilized this model as the foundation for implementing different equipment control strategies. The data used in the simulation process are summarized in Table 2, for which the hourly load data of the metro were obtained by EnergyPlus v9.4 load simulation software through 3D modeling and the setting of internal and external disturbance parameters. The rest of the data are from the actual project.
At the same time, in order to further explore the energy saving space of the air conditioning system of the metro station and explore the role and advantages of the technical path of full-scene joint simulation based on the idea of digital twin, based on Scheme 3, Scheme 4 incorporated a genetic algorithm designed in MATLAB R2022b and achieved joint simulation with Dymola 2023 through its Python 3.9 interface, aiming to further optimize the chiller unit number control strategy for the target metro station. Among them, the upper and lower limits based on the real project of the system operating parameters are summarized in Table 3.
Taking the cooling water pump flow rate as an example, its upper and lower limits [10, 50] and step size 5 indicated that it could take 10, 15, 20, …, 45, 50, a total of 9 values, and the rest of the parameters were the same. Therefore, there were a total of 9 × 6 × 5 × 5 = 1350 combinations of the four parameters, generated by Python code as the setup parameter value. The corresponding total system energy consumption was obtained by simulation to form the dataset. The dataset was fitted using a multivariate regression and a genetic algorithm was invoked to find the best parameter combinations; finally, the optimization results were obtained.

3. Results and Analysis

Based on the constructed model and the joint simulation platform, the system and equipment operation data for each scheme were obtained and analyzed from the following perspectives. Among them, the upper and lower limit analysis primarily compares Case 2 and Case 3.

3.1. Simulation Validation and Error Analysis

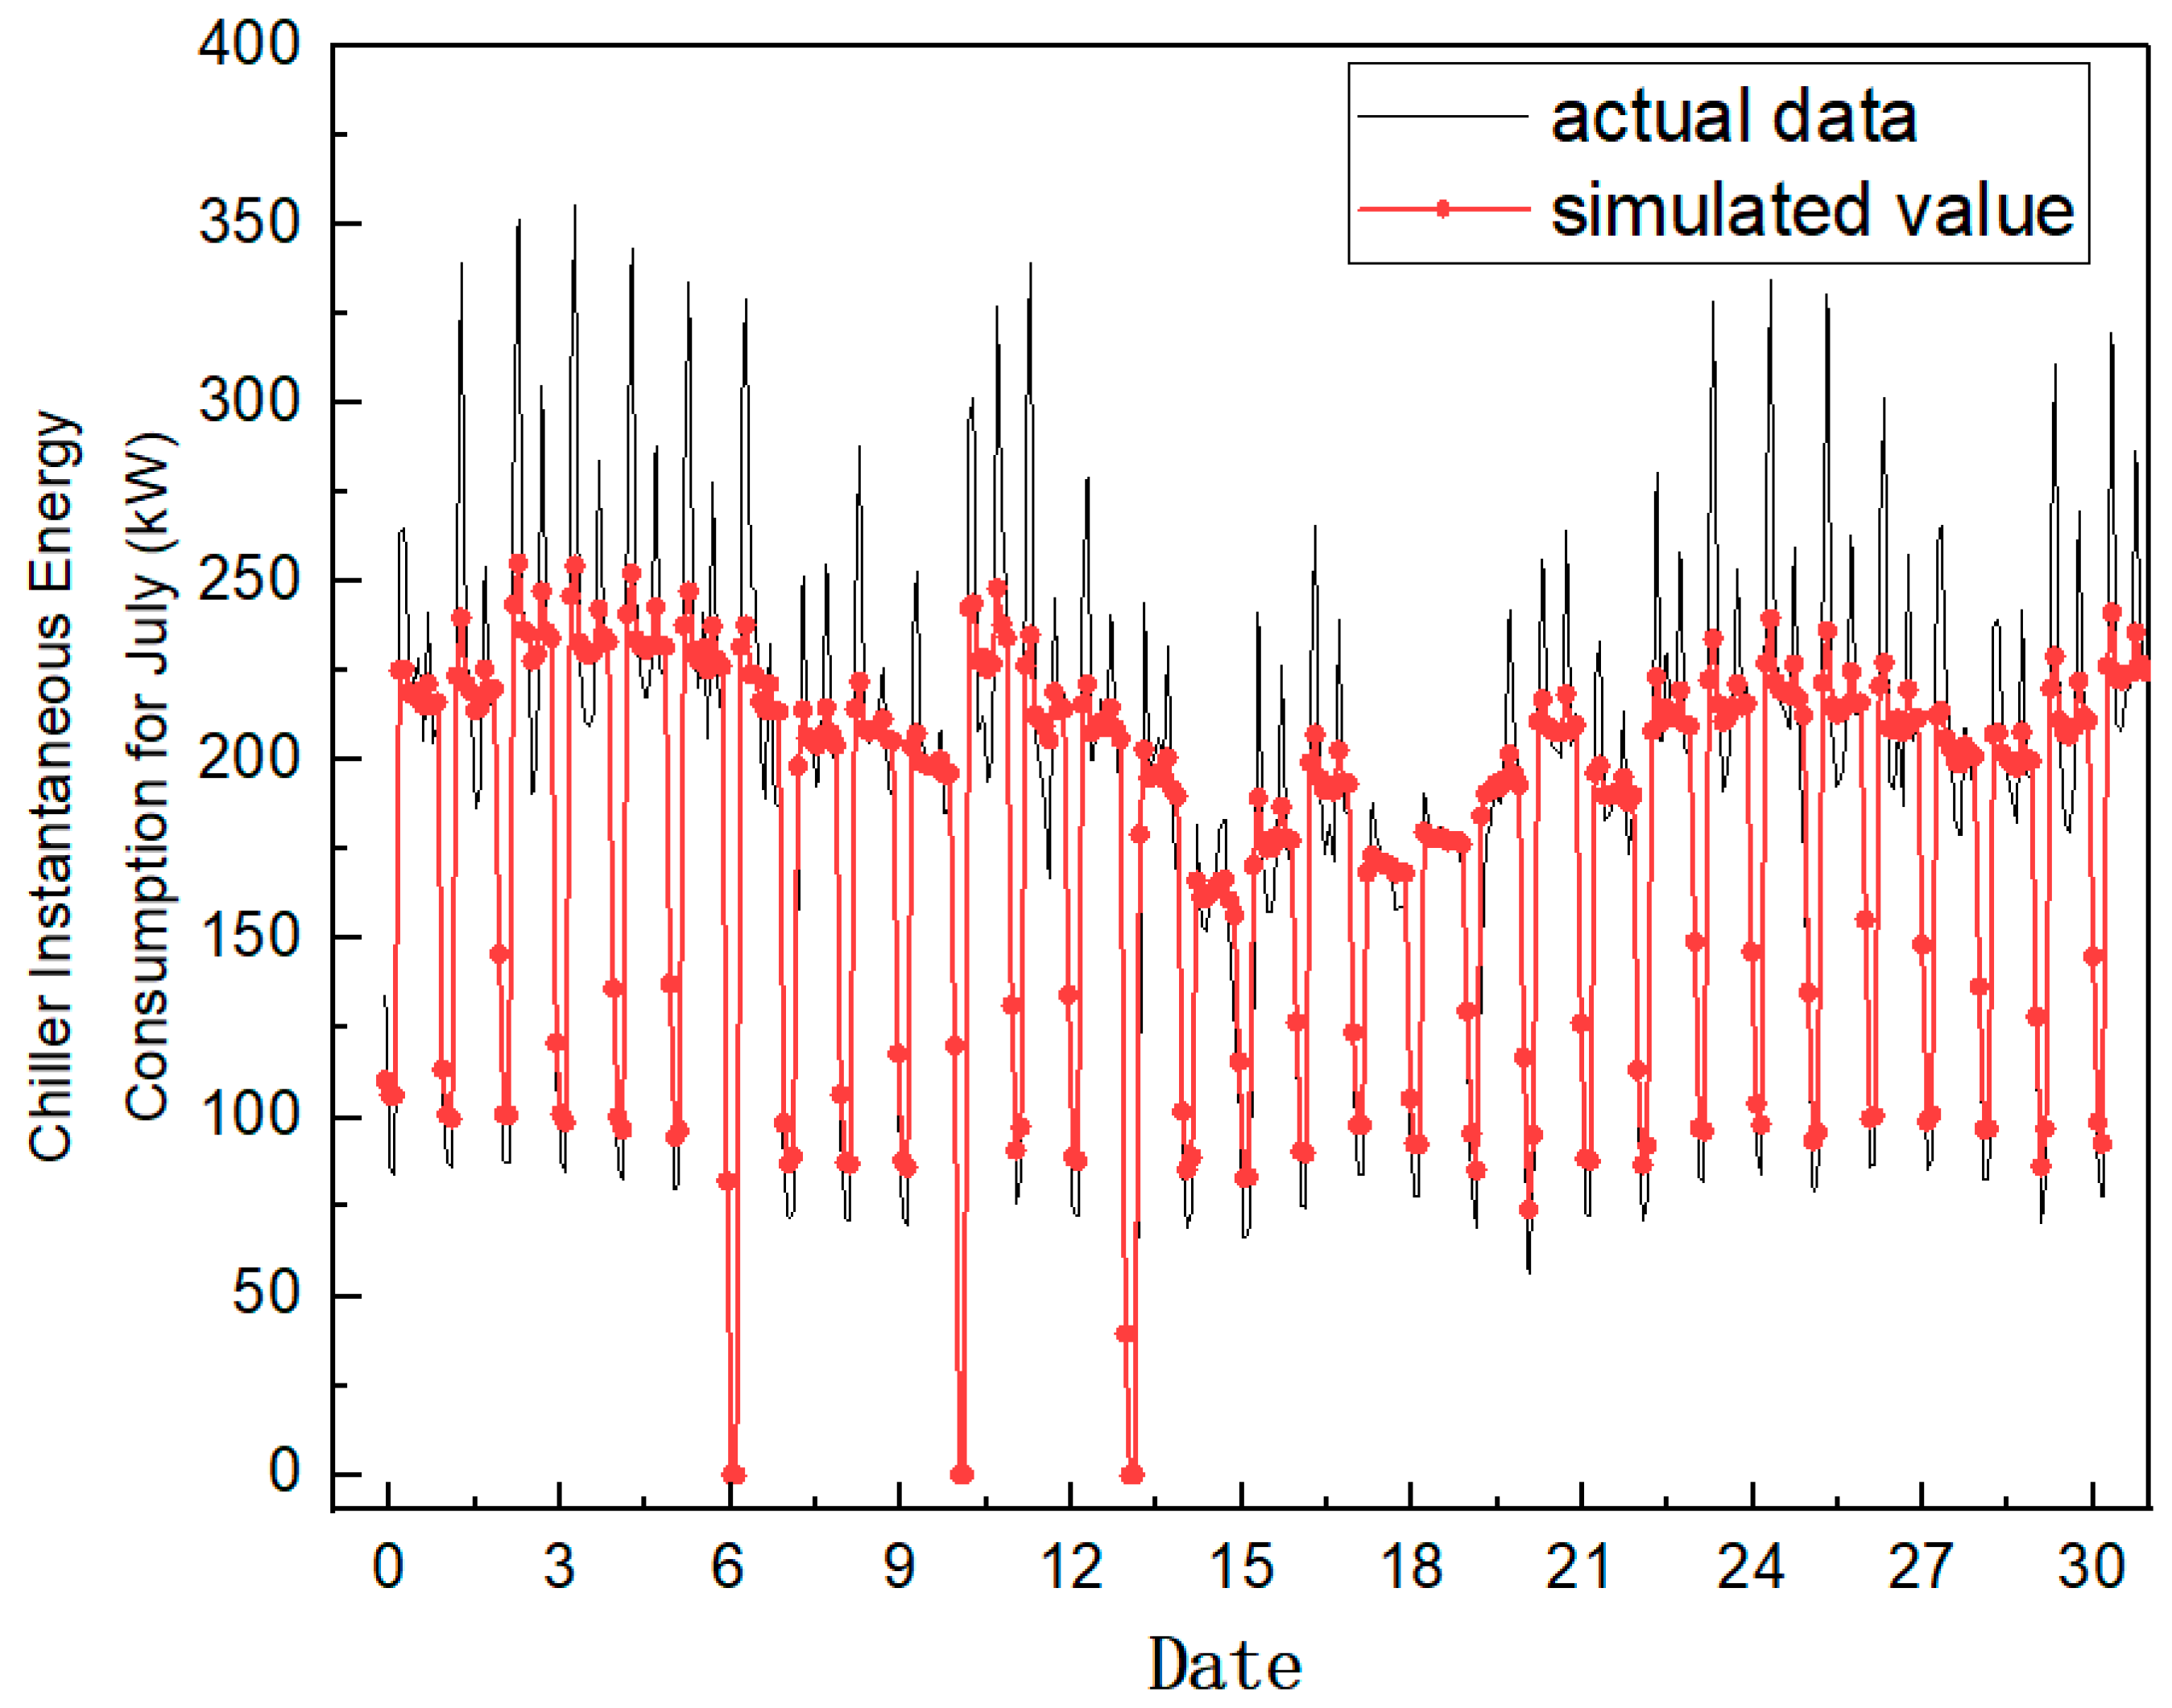
To ensure consistency with the system’s actual operation period, the simulation output was set to match the real-world operational timeframe from March to November. Energy consumption data of individual equipment and the overall chilled water system under Scheme 1 were extracted and compared with the measured data collected from the metro station in July. Taking the chiller’s operating energy consumption as an example, the deviation between the simulated and measured results is illustrated in Figure 6.
The data showed that for more than 85% of the hours, the error between their calculated and simulated values was within 15%, increasing the credibility of the simulated values. Most of the points where the error was greater than 15% occurred between 24:00 and 06:00 the next day, when the small system was running alone. The chiller supply was smaller in this time period; thus, the relative error became larger. From the general trend of the data, it can be seen that the change in the simulated value from the wave peak was relatively gentle compared with the measured value, and the span of energy consumption within a day was smaller, reflecting the difference between the measured and simulated values. In terms of total comparison, the error of its total energy consumption was controlled within 4%. Since the focus of this paper is on the total annual energy consumption of each scenario, the simulation data is still of reference value.
While the baseline model achieved good agreement with measured data, several system-level limitations should be acknowledged:
  • First, the control strategy assumes ideal conditions. It does not account for common real-world factors such as actuator delays, control hysteresis, or sensor noise. These factors may compromise control stability and responsiveness, particularly under variable load conditions.
  • Second, the model relies on standard weather datasets rather than high-resolution or site-specific environmental data. This may reduce the accuracy of short-term load forecasts, especially during transitional seasons when outdoor conditions can change rapidly.
  • Third, while the baseline model was validated against measured data from a representative month—with the simulation error kept below 5%—it has not yet been tested across a full year or under a wider range of operating scenarios. As a result, the generalizability of the findings remains limited.
Despite these constraints, the model offers a robust foundation for evaluating control strategies. It also offers valuable insight into control optimization for metro HVAC systems. Future research will focus on integrating real-time operational data and extending validation efforts to improve the model’s accuracy and practical relevance.

3.2. Analysis of Cumulative Energy Consumption of Systems and Equipment

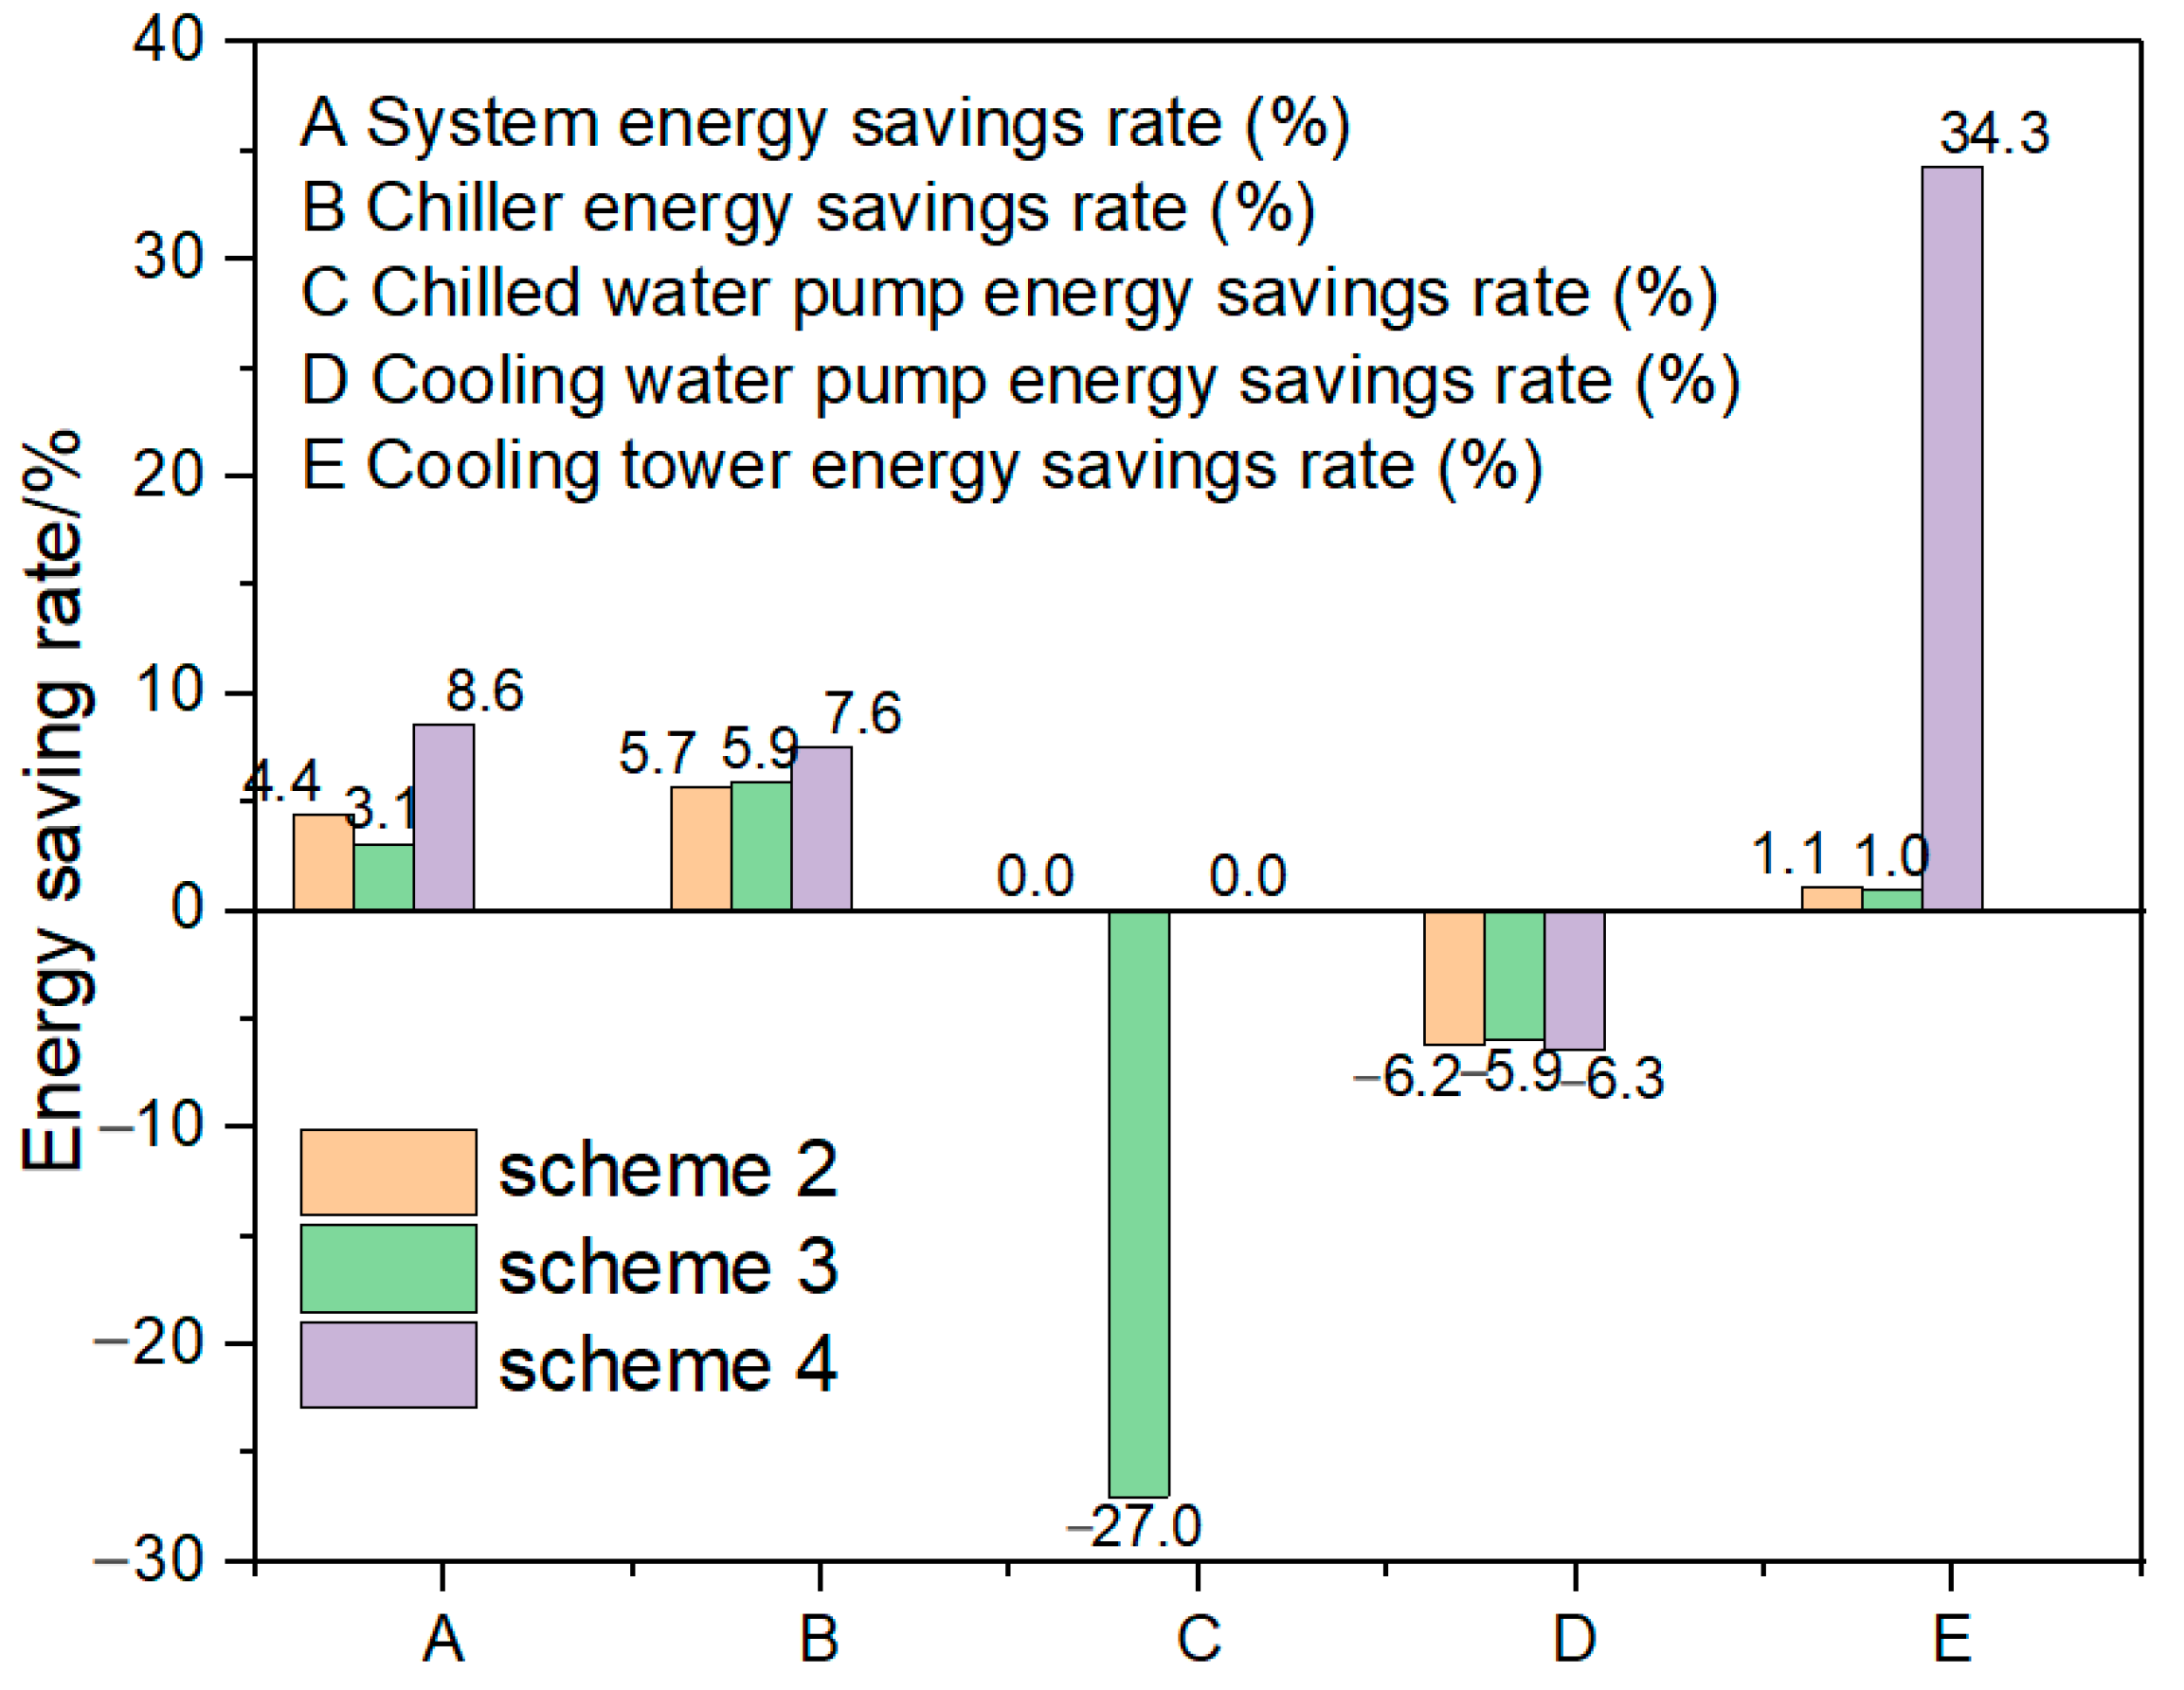
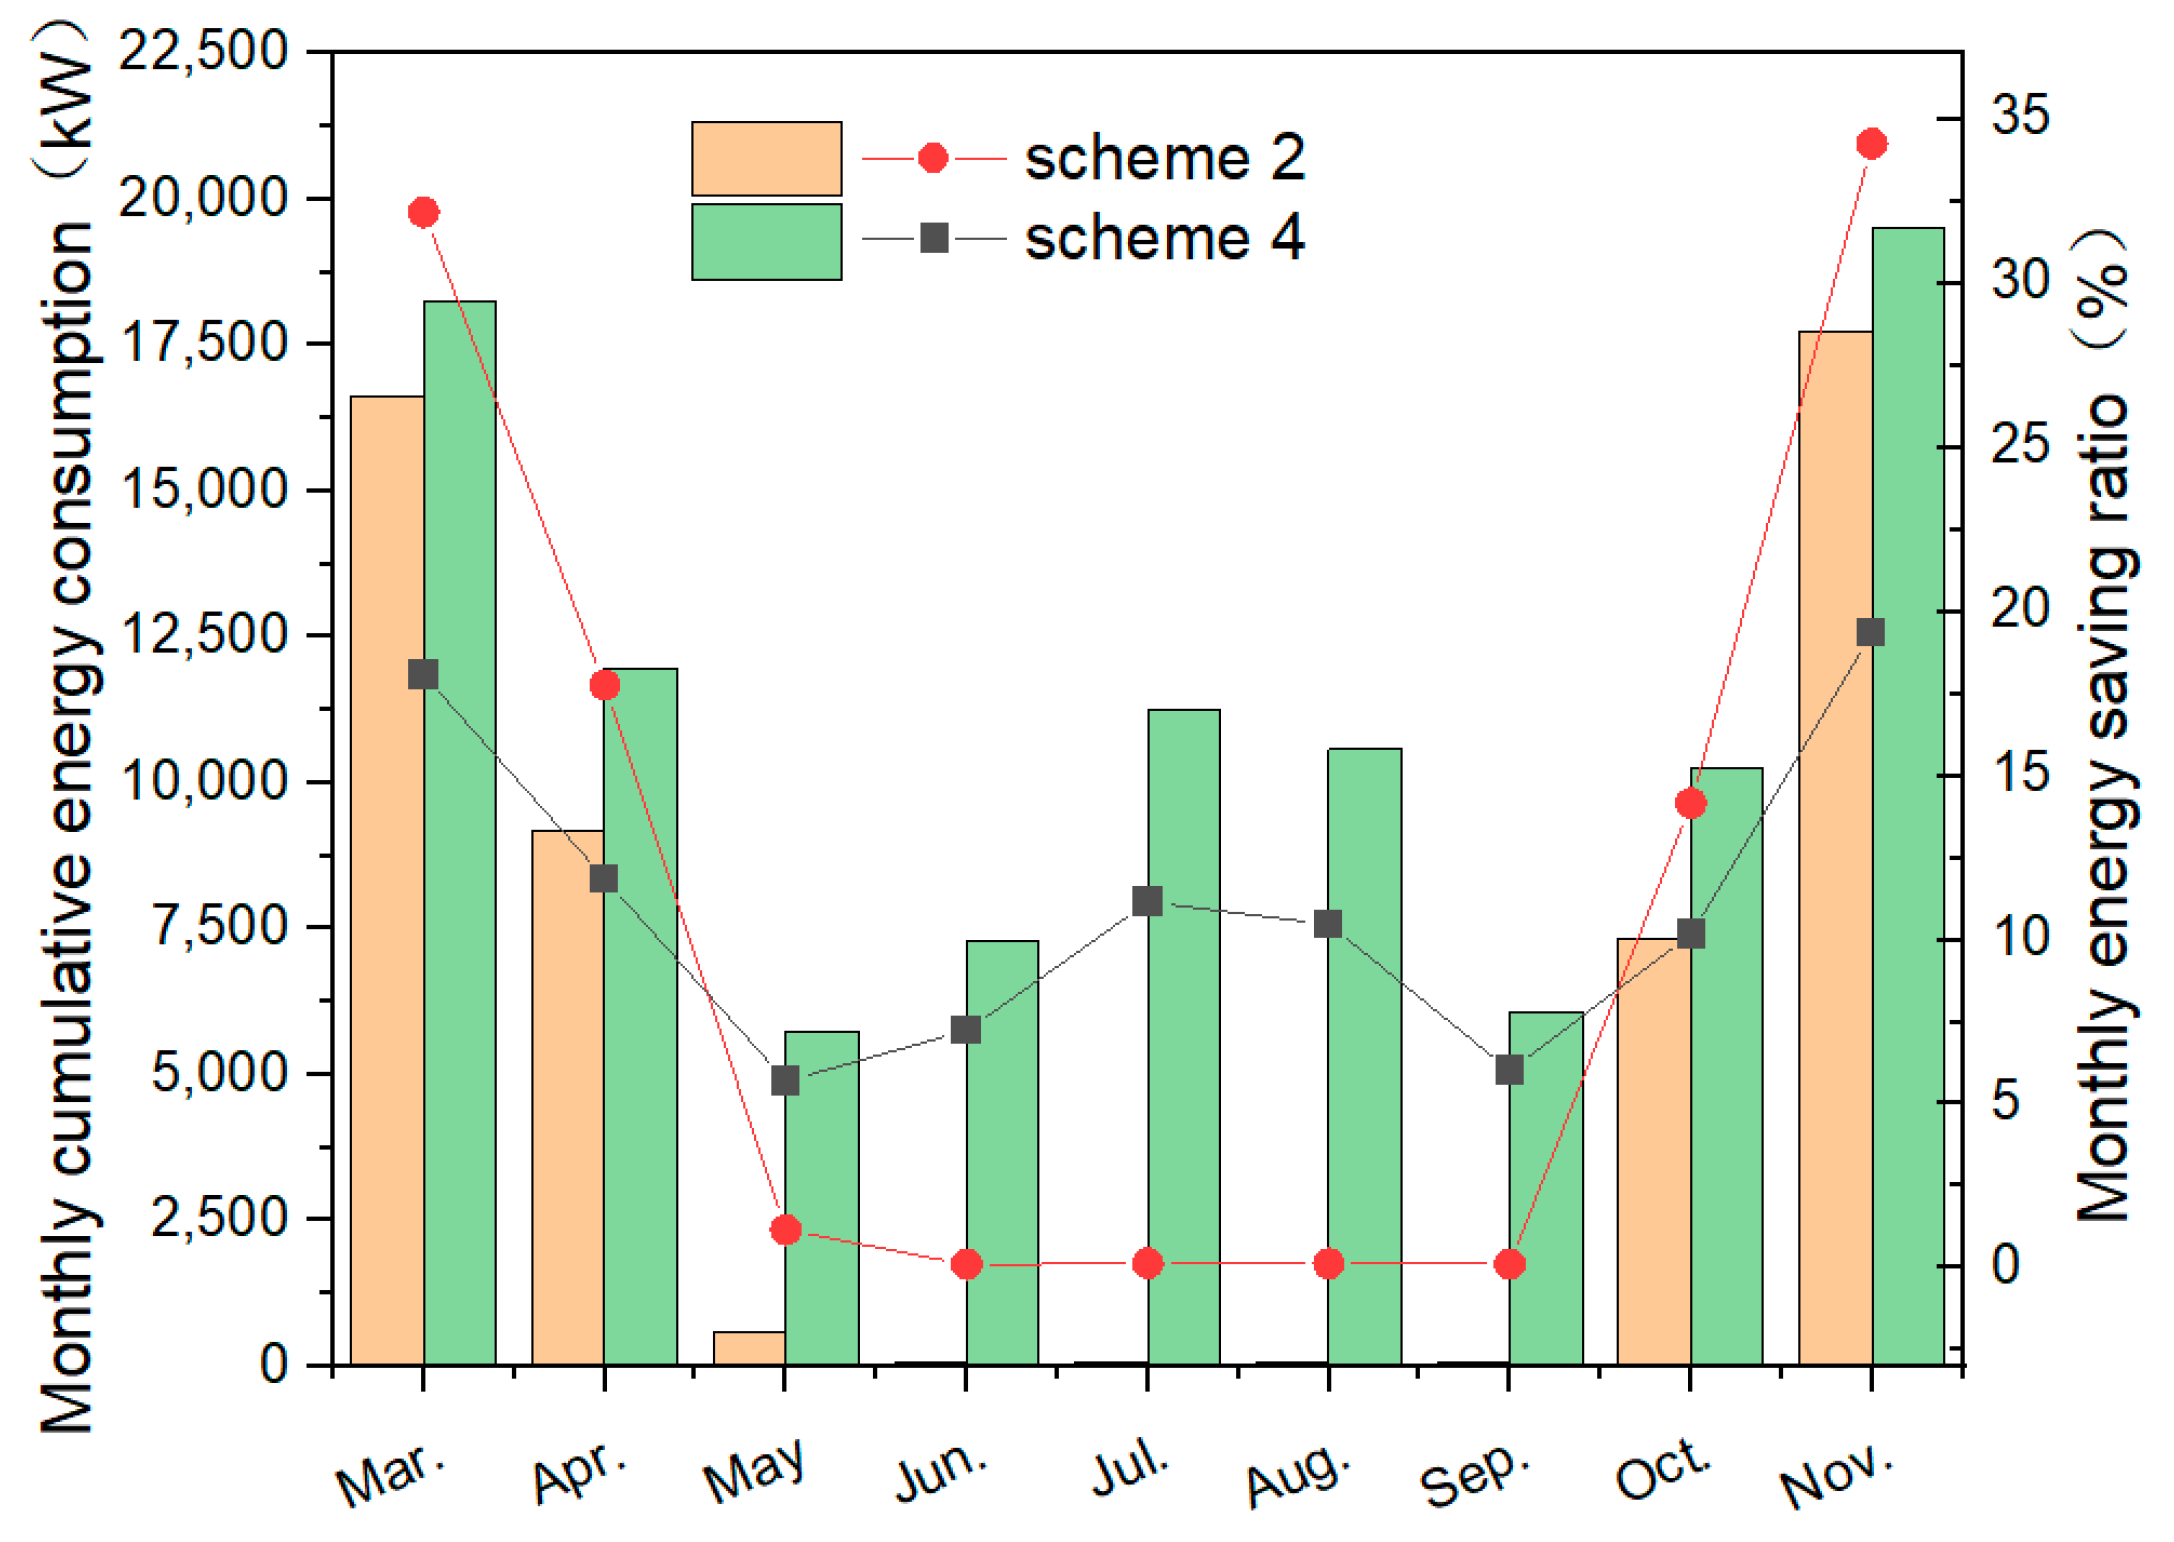
According to the genetic algorithm results, when the cooling water pump flow rate was 15 kg/s, the load-switching point was 50%, the chiller’s cold-end outlet temperature was 9 °C, and the set temperature of the cooling tower outlet was 30 °C. Scheme 4 achieved the lowest total system energy consumption in the operation period. The total energy consumption of the system during the operation period of the four schemes and the cumulative energy consumption of each equipment are listed in Table 4. The percentage of energy consumption of each piece of equipment during the operation period and the energy savings rate of each piece of equipment of each scheme are shown in Figure 7 and Figure 8, respectively. The monthly energy savings and the percentage of energy savings for each month of the operating period for Schemes 2 and 4 are also plotted, as shown in Figure 9.
Schemes 2, 3, and 4 achieved total energy savings of 4.42%, 3.10%, and 8.62%, respectively, compared to the baseline (Scheme 1). Scheme 2 introduced real-time outdoor weather data into the chiller sequencing logic. By tailoring control to actual system conditions, it outperformed traditional strategies based solely on engineering heuristics. The results underscore the value of site-specific, data-driven control design. These outcomes align with earlier studies on genetic algorithm (GA)-based optimization in HVAC systems. For instance, Wang et al. [9] reported energy savings of 16.8% for compressors and 26.8% for water systems in office buildings using a GA approach. The 8.62% reduction seen in this metro-focused study is lower, but it reflects the more conservative operational constraints typical in rail transit, highlighting its practical feasibility. Scheme 3 removed frequency control from key components such as pumps and chillers. As illustrated in Figure 3, this led to increased annual energy use compared to Scheme 2. The result confirms that frequency regulation not only improves energy efficiency but also contributes to safer and more stable equipment operation. Scheme 4 built upon Scheme 2 by applying a genetic algorithm to jointly optimize multiple parameters: pump flow, chiller switching points, chilled water outlet temperature, and cooling tower outlet temperature. This integrated strategy delivered the greatest savings, demonstrating that coordinated multi-variable control is essential for unlocking deeper energy reductions in metro HVAC systems.
Figure 7 illustrates that the energy consumption of the chiller was always much higher than that of other equipment in all schemes, ranging from 78.91% (Scheme 3) to 82.06% (Scheme 4), which were the main pieces of energy-consuming equipment in the system, further emphasizing that optimizing the chiller’s operation strategy was crucial for overall energy savings. Among them, Scheme 4 optimized the energy consumption of other equipment while enabling the chiller to reach the highest energy consumption percentage of 82.06%, which was an increase compared to Scheme 1 (81.12%) and Scheme 3 (78.91%). This may have been due to the fact that Scheme 4 improved the operational efficiency of the chiller plant by optimizing the operation of the cooling water pumps (5.56%), chilled water pumps (5.75%), and cooling towers (8.93%) so that the chiller plant load was more concentrated. This strategy further optimized the energy distribution of the overall system and achieved better energy savings.
As shown in Figure 8, Scheme 4 delivered the best overall energy savings, mainly due to its superior performance in cooling tower optimization. The chiller maintained stable energy savings across all schemes and remained the primary contributor to system efficiency. Notably, Scheme 3 exhibited a −27.0% energy savings rate for the chilled water pump, indicating significant inefficiency. This was due to the absence of frequency control and bypass regulation, causing the pump to operate at fixed high speed regardless of load, especially under low-demand conditions. In contrast, Scheme 2 and Scheme 4 incorporated frequency control and operational bounds, enabling dynamic adjustment and avoiding excessive pump energy use.
Internal loads in the metro station—such as equipment, lighting, and human activity—remain relatively steady throughout the year. Most fluctuations in system load are caused by external factors, especially changes in outdoor weather. As shown in Figure 9, Scheme 4 focused on system variables that are more responsive to these external conditions, such as pump flow rates and temperature setpoints. While Scheme 2 achieved slightly higher savings percentages in March and November, Scheme 4 consistently delivered greater absolute energy savings. In July and August—when cooling demand was at its peak—Scheme 4 reduced energy use by more than 13%, clearly outperforming Scheme 2. This suggests that Scheme 4 is better at optimizing system behavior during both mild transitional months and hot summer periods. Its advantage lies in the use of a genetic algorithm. By dynamically adjusting multiple parameters at once, the system can react more effectively to real-time changes in the environment. This coordinated control helps maximize equipment efficiency. Although full-year operational data are not yet available for comparison, the baseline model was validated using real data from a representative month. The error remained within 5%, indicating good alignment between simulation and reality. Taken together, these results suggest that Scheme 4 offers a strong, practical approach for saving energy in metro HVAC systems, one that adapts well to actual operating conditions.

3.3. Impact of Equipment Frequency Upper and Lower Control Limits

By comparing Schemes 2 and 3, we explore the factors influencing the deviation from the lower operational bound.
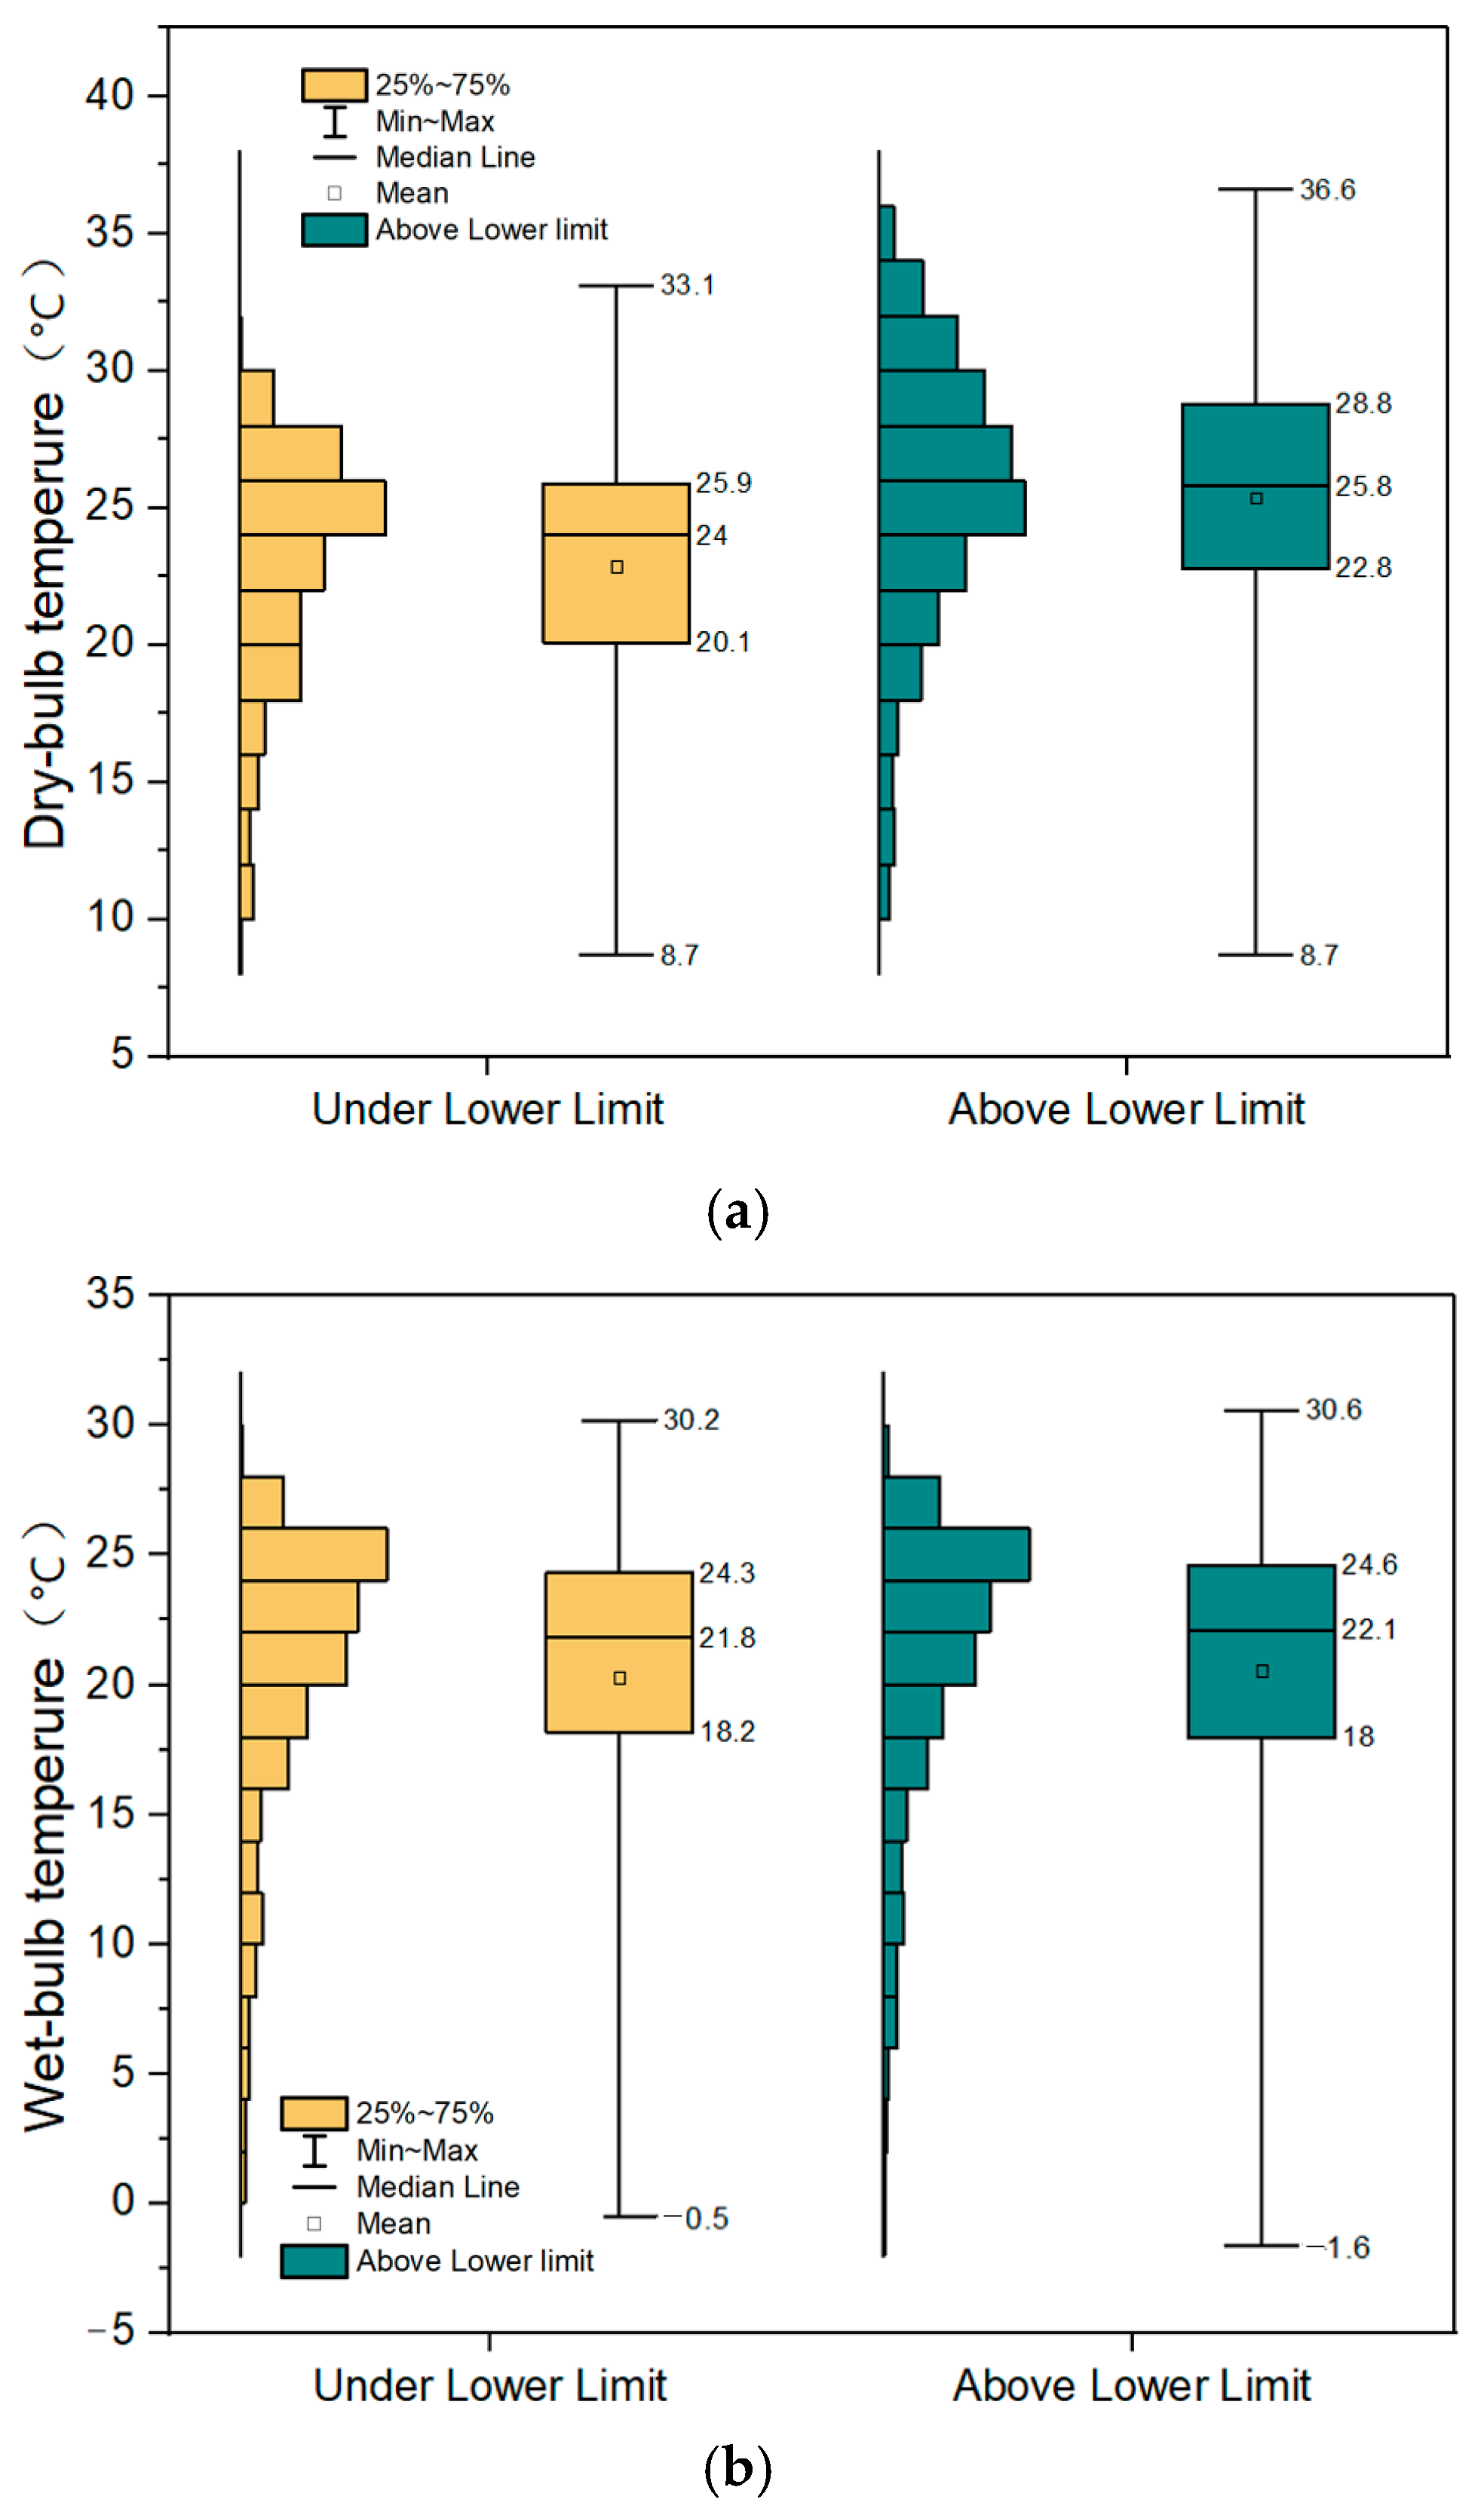
Combined with Figure 10, it can be observed that the wet-bulb temperatures at the moment when the chilled water pump broke through the lower limit and when it did not were 30.7 °C and 32.2 °C, respectively, which was a larger temperature difference compared with 24.4 °C and 27.9 °C for dry-bulb temperatures. The difference in the span range of the data distribution between 25% and 75% of the wet-bulb temperature, breaking through the lower limit and not breaking through the lower limit, was 6.1 °C and 6.6 °C, respectively, which was closer to the dry-bulb humidity compared to 5.8 °C and 6 °C, respectively. Whether the chilled water pump broke through the lower limit of the corresponding wet-bulb temperature range, the difference was smaller than that for the dry-bulb temperature. This indicated that wet-bulb temperature had less influence on the chilled water pump breaking through the lower limit. The dry-bulb temperature directly affected the size of the fresh air load introduced into the metro station. Since the chilled water pump was more closely related to the load side, the operating status of the chilled water pump was more closely related to the dry-bulb temperature, and this conclusion is supported by the data.
As shown in Figure 11, the difference between the median dry-bulb temperature corresponding to the chilled water pump breaking through the lower limit and not breaking through the lower limit was 1.8 °C. For the cooling water pump, the corresponding difference was 5.2 °C. Similarly, the difference in median wet-bulb temperature for the chilled water pump was 0.3 °C, while, for the cooling water pump, it was 3.9 °C. The distribution of wet- and dry-bulb temperatures corresponding to whether or not the lower limit was breached for cooling water pumps was more obvious than that for chilled water pumps, i.e., the influence of outdoor parameters on cooling water pumps was more prominent. Cooling water pumps work in conjunction with cooling towers, which need to exchange heat with the outdoor air to cool the cooling water, so cooling water pumps are more closely associated with outdoor meteorological parameters than chilled water pumps.
Figure 12 illustrates that by comprehensively comparing whether chillers, chilled water pumps, and cooling water pumps exceeded their lower operating limits under various weather parameters, the following relationships could be observed: chilled water pumps were closely correlated with the load side and the fresh air load was more influenced by the outdoor dry-bulb temperature; cooling water pumps and cooling towers associated with a close relationship between the impact of the outdoor dry and wet-bulb temperatures of the cooling water heat transfer were related; and chiller-integrated treatment of chilled water and cooling water was more complex. It was complicated and difficult to judge and analyze directly.

3.4. Quantitative Relationship Between Cooling Water Flow Rate, Outdoor Wet-Bulb Temperature, and Cooling Tower Energy Consumption

The analysis of the lower limit of cooling water pumps showed that the operation status of cooling water pumps was more affected by environmental parameters than that of chilled water pumps. At the same time, the cooling tower energy consumption was highly correlated with the outdoor wet-bulb temperature, so it was relevant to consider the role of outdoor wet-bulb temperature alongside the influence of cooling water flow when studying the cooling tower energy consumption. In this study, the relationship between cooling water flow rate, outdoor wet-bulb temperature, and cooling tower energy consumption was fitted based on the simulation data of Scheme 3.
This scheme was specifically selected for the purpose of this analysis. Our objective was to establish the fundamental performance characteristics of the cooling tower system, independent of any specific operational control strategy. While alternative schemes that were considered incorporated artificial constraints such as upper and lower operational limits, Scheme 3 allowed the system to operate across its full physical range. This provided a comprehensive and unbiased dataset, which is essential for developing a universally applicable model that reflects the equipment’s intrinsic behavior.
In the model, the starting and stopping of both cooling water pumps and cooling towers were controlled in synchronization with the chiller, i.e., when a chiller was running, only one cooling tower and one cooling water pump were switched on. In order to ensure the reliability of the fitting results and maintain consistency with the fitting of the chilled water system, the operating conditions of a single cooling water pump or a single cooling tower were excluded from analysis, and the relationship between the cooling water flow rate and the energy consumption of the cooling tower under the conditions of synchronous operation of the two cooling water pumps was only simulated.
We obtained the fitting function
f ( x , y )   = 8.7143   +   1.4273 x   +   13.3478 y   0.3047 x 2   + 1.4165 x y   + 8.2043 y 2 +   0.0617 x 3 0.1184 x 2 y   +   0.4570 x y 2   +   1.5562 y 3
where x is the cooling water flow rate, kg/s; y is the outdoor wet-bulb temperature, °C; f is the cooling tower energy consumption, kW; and the R-squared value of the goodness of fit is 0.9788, indicating a high goodness of fit. Figure 13 and Figure 14 reveal clear operational trends: energy consumption increases with both higher cooling water flow rates and rising outdoor wet-bulb temperatures. These established relationships are crucial for proactive energy management. For instance, the model allowed us to quantify that a 1 °C increase in outdoor wet-bulb temperature results in an approximate 7% increase in tower energy consumption. This insight can be directly used for energy forecasting and budgeting. Furthermore, the model serves as a dynamic baseline for healthy system operation. In a building management system, the predicted energy consumption from this function can be continuously compared against real-time metered data. A significant and sustained deviation can automatically trigger an alert, indicating potential equipment faults such as fan degradation, nozzle clogging, or scaling, thus enabling predictive maintenance. This transforms the model from a descriptive tool into a diagnostic one. Finally, the observation that energy consumption approaches zero at low CWF and ts, indicating the potential for fan-free natural cooling, highlights its utility in developing advanced control logic that can switch between mechanical and natural cooling modes to maximize energy savings, especially under low-temperature conditions where the energy-saving potential is greatest.

4. Conclusions

This study investigated energy-saving strategies for metro chilled water systems using a physics-based digital twin built in Dymola. Four control schemes were tested under real-world conditions, focusing on chiller sequencing, pump frequency modulation, and load-switching optimization. The key findings are as follows:
(1)
Energy-saving performance: Schemes 2, 3, and 4 reduced total system energy use by 4.42%, 3.10%, and 8.62%, respectively, compared to the baseline. Scheme 2 integrated real-time outdoor weather data into frequency control logic, improving both efficiency and system stability. Scheme 4 went a step further. It used a genetic algorithm to optimize pump flow, load-switching points, and water outlet temperatures. This coordinated control delivered the greatest energy savings, underscoring the advantages of intelligent, multi-parameter optimization.
(2)
Equipment energy profiles: Chillers were responsible for nearly 80% of total system consumption, confirming their central role in HVAC energy use. Cooling tower demand varied with outdoor wet-bulb temperature, dropping sharply in cooler conditions. Cooling water pump loads fluctuated with seasonal weather, reflecting the system’s sensitivity to ambient conditions.
(3)
Implications for system control: These results highlight the value of digital, twin–based adaptive control. Unlike fixed-rule strategies, intelligent models can respond to changing environmental conditions in real time. The findings support a broader shift toward data-informed, model-supported control approaches, critical for improving operational resilience and advancing the decarbonization of metro HVAC systems.

Author Contributions

Conceptualization, Y.Z.; Methodology, Y.Z.; Software, H.Z.; Investigation, Y.Z., Y.L., D.W., H.L., X.Z., X.Q. and H.Z. All authors have read and agreed to the published version of the manuscript.

Funding

This research received no external funding.

Data Availability Statement

The original contributions presented in this study are included in the article. Further inquiries can be directed to the corresponding author.

Acknowledgments

The authors would like to thank the Guangdong Provincial Department of Housing and Urban–Rural Development for the support of the 2024 Scientific and Technological Innovation Plan Project, project number 2024-R38-00489.

Conflicts of Interest

Authors Yihao Zhu, Yanping Luo, Dijun Wang, Hui Luo, Xiaoqing Zhong, Xu Qin were employed by the company Guangzhou Metro Design and Research Institute Co., Ltd. The remaining author declares that the research was conducted in the absence of any commercial or financial relationships that could be construed as a potential conflict of interest.

References

  1. Wang, F.; Liang, S.; Feng, A. Statistics and development analysis of urban rail transit in China in 2023. Tunn. Constr. 2024, 44, 393–400. [Google Scholar]
  2. Su, X.; Huang, Y.; Wang, L.; Tian, S.; Luo, Y. Operating optimization of air-conditioning water system in a subway station using data mining and dynamic system models. J. Build. Eng. 2021, 44, 103379. [Google Scholar] [CrossRef]
  3. Yu, Y.; You, S.; Zhang, H.; Ye, T.; Wang, Y.; Wei, S. A review on available energy saving strategies for heating, ventilation and air conditioning in underground metro stations. Renew. Sustain. Energy Rev. 2021, 141, 110788. [Google Scholar] [CrossRef]
  4. Lee, G.-Y.; Noh, Y.; Kang, Y.-J.; Kim, N.; Park, N.; Oh, B.; Choi, G. Digital twin model calibration of HVAC system using adaptive domain Nelder-Mead method. Energy Build. 2025, 330, 115340. [Google Scholar] [CrossRef]
  5. Schicktanz, M.; Nunez, T. Modelling of an adsorption chiller for dynamic system simulation. Int. J. Refrig. 2009, 32, 588–595. [Google Scholar] [CrossRef]
  6. Huang, S.; Zuo, W.; Sohn, M.D. Improved cooling tower control of legacy chiller plants by optimizing the condenser water set point. Build. Environ. 2017, 111, 33–46. [Google Scholar] [CrossRef]
  7. Vering, C.; Mehrfeld, P.; Nurenberg, M. Unlocking Potentials of Building Energy Systems’ Operational Efficiency: Application of Digital Twin Design for HVAC systems. In Proceedings of the 16th International Building Performance Simulation Association (IBPSA), Rome, Italy, 2–4 September 2019. [Google Scholar]
  8. Kusiak, A.; Li, M.; Tang, F. Modeling and optimization of HVAC energy consumption. Appl. Energy 2010, 87, 3092–3102. [Google Scholar] [CrossRef]
  9. Wang, L. Energy-Saving Control Method of Building Central Air Conditioning Based on Genetic Algorithm. Adv. Multimed. 2022, 2022, 8738871. [Google Scholar] [CrossRef]
  10. Garcès-Jimènez, A.; Gómez Pulido, J.M.; Gallego-Salvador, N.; García-Tejedor, Á.J. Genetic and swarm algorithms for optimizing the control of building hvac systems using real data: A comparative study. Mathematics 2021, 9, 2181. [Google Scholar] [CrossRef]
  11. Hu, Y.; Qin, L.; Li, S.; Li, X.; Li, Y.; Sheng, W. A novel energy saving framework based on optimal chiller loading and parameter optimization for HVAC: A case study for subway station. J. Build. Eng. 2025, 101, 111887. [Google Scholar] [CrossRef]
  12. Chen, Z.; Zhang, J.; Xiao, F.; Xu, K.; Chen, Y. Physically consistent data-driven optimal sequencing strategy for variable speed pumps in large building chiller plants. Build. Environ. 2025, 281, 113177. [Google Scholar] [CrossRef]
  13. Zhang, Q.; Long, W.; Wang, R.; Cao, Z.; Wang, Z.; Yan, Y.; Wen, Y. CAPER: Dual-level physics-data fusion with modular metamodels for reliable generalization in predictive digital twins. Appl. Energy 2025, 398, 126393. [Google Scholar] [CrossRef]
  14. Borja-Conde, J.A.; Nadales, J.M.; Ordonez, J.G.; Fele, F.; Limon, D. Efficient management of HVAC systems through coordinated operation of parallel chiller units: An economic predictive control approach. Energy Build. 2024, 304, 113879. [Google Scholar] [CrossRef]
  15. Guan, B.; Liu, X.; Zhang, T.; Xia, J. Energy consumption of subway stations in China: Data and influencing factors. Sustain. Cities Soc. 2018, 43, 451–461. [Google Scholar] [CrossRef]
  16. Seo, B.M.; Lee, K.H. Detailed analysis on part load ratio characteristics and cooling energy saving of chiller staging in an office building. Energy Build. 2016, 119, 309–322. [Google Scholar] [CrossRef]
  17. Abou-Ziyan, H.Z.; Alajmi, A.F. Effect of load-sharing operation strategy on the aggregate performance of existed multiple-chiller systems. Appl. Energy 2014, 135, 329–338. [Google Scholar] [CrossRef]
  18. Huang, S.; Zuo, W.; Sohn, M.D. Amelioration of the cooling load based chiller sequencing control. Appl. Energy 2016, 168, 204–215. [Google Scholar] [CrossRef]
  19. Wang, Y.; Feng, H.; Xi, X. Monitoring and autonomous control of Beijing Subway HVAC system for energy sustainability. Energy Sustain. Dev. 2017, 39, 1–12. [Google Scholar] [CrossRef]
  20. Sun, K.; Hong, T.; Taylor-Lange, S.C.; Piette, M.A. A pattern-based automated approach to building energy model calibration. Appl. Energy 2016, 165, 214–224. [Google Scholar] [CrossRef]
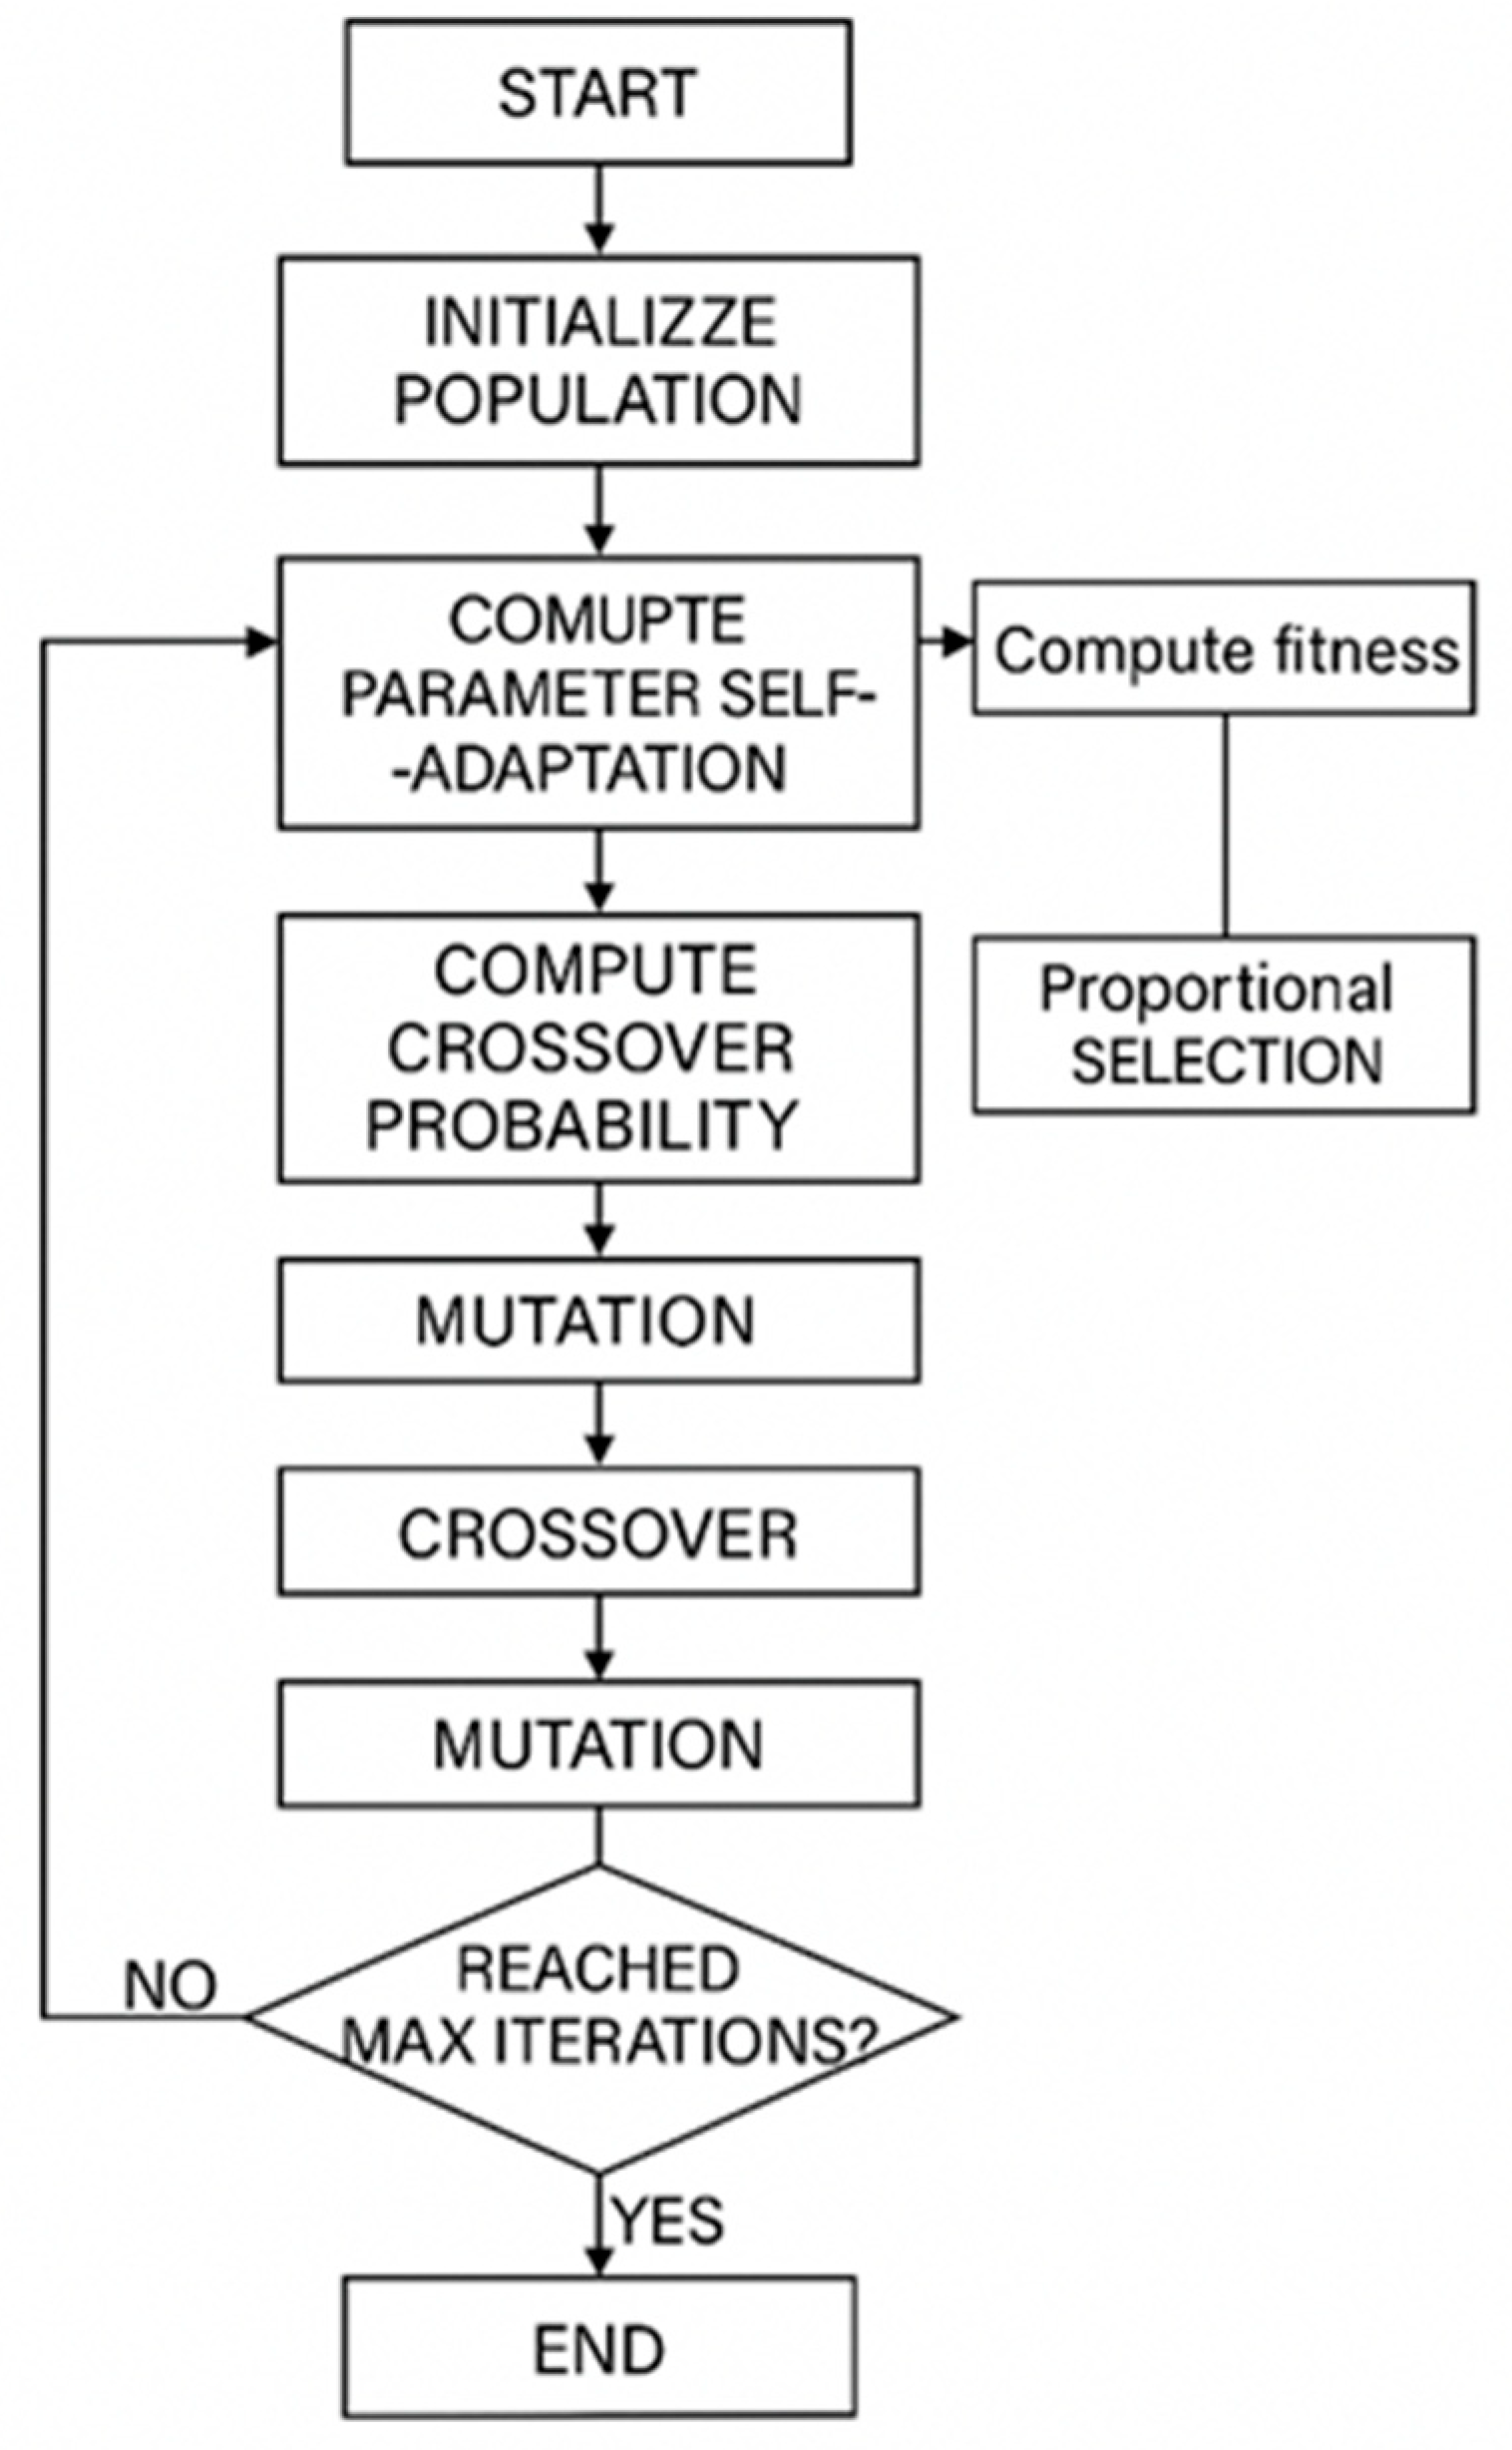
Figure 1. Flowchart of genetic algorithm.
Buildings 15 03064 g001
Figure 2. Lower limit control of chilled water pump.
Buildings 15 03064 g002
Figure 3. Lower limit control of the chiller unit.
Buildings 15 03064 g003
Figure 4. Chiller unit staging control strategy.
Buildings 15 03064 g004
Figure 5. Dymola layout of the model for the water system presented in this paper.
Buildings 15 03064 g005
Figure 6. Chiller instantaneous energy consumption for July.
Buildings 15 03064 g006
Figure 7. Energy consumption proportion of each device over the operation period.
Buildings 15 03064 g007
Figure 8. Energy savings contribution by equipment type.
Buildings 15 03064 g008
Figure 9. Monthly energy savings and proportion over the operation period.
Buildings 15 03064 g009
Figure 10. (a) Comparison of dry-bulb temperatures under lower-limit and non-lower-limit conditions for the chilled water pump. (b) Comparison of wet-bulb temperatures under lower-limit and non-lower-limit conditions for the chilled water pump.
Buildings 15 03064 g010
Figure 11. (a) Comparison of dry-bulb temperatures under lower-limit and non-lower-limit conditions for the cooling water pump. (b) Comparison of wet-bulb temperatures under lower-limit and non-lower-limit conditions for the cooling water pump.
Buildings 15 03064 g011
Figure 12. (a) Comparison of dry-bulb temperatures under lower-limit and non-lower-limit conditions for the chiller unit. (b) Comparison of wet-bulb temperatures under lower-limit and non-lower-limit conditions for the chiller unit.
Buildings 15 03064 g012
Figure 13. (a) Relationship between cooling tower energy consumption (OP) and cooling water flow rate (CWF). (b) Relationship between cooling tower energy consumption (OP) and outdoor wet-bulb temperature (ts).
Buildings 15 03064 g013
Figure 14. Fitted surface plot of cooling tower energy consumption (OP) versus cooling water flow rate (CWF) and outdoor wet-bulb temperature (ts).
Buildings 15 03064 g014
Table 1. Main equipment specifications.
EquipmentQuantitiesKey Parameters
Chiller2Cooling capacity: 1233 kW; Power: 211 kW; Chilled water temperature: 14/7 °C; Cooling water temperature: 32/37 °C
Cooling water pumps2Flow rate: 243.7 m3/h; Head: 24 m; Power: 22 kW
Chilled water pump2Flow rate: 151.3 m3/h; Head: 23 m; Power: 15 kW
Cooling tower2Water flow rate: 370 m3/h; Power: 11 kW
Table 2. Summary of required input data.
ParametricSource
Hourly loads during metro operationEnergyPlus
Equipment parametersActual project
Indoor dry-bulb temperature
Timetable for the operation of the system
Outdoor dry- and wet-bulb temperature
Table 3. Upper and lower limits of system operating parameters.
ParametricLower LimitUpper LimitStep Size
Cooling water pump flow (kg/s)10505
Load-switching point (%)50755
Chiller cold end outlet set temperature (°C)591
Cooling tower outlet set temperature (°C)27311
Table 4. Cumulative energy consumption comparison of systems and equipment.
Cumulative Energy ConsumptionScheme 1Scheme 2Scheme 3Scheme 4
Chiller energy consumption (kW)949,438893,415894,974877,654
Chilled water pump energy consumption (kW)63,07580,08263,06763,077
Cooling water (kW)61,45565,10265,25065,350
Cooling towers (kW)96,48995,56495,41263,438
Total system energy consumption (kW)1,170,4561,118,7041,134,1631,069,519
Disclaimer/Publisher’s Note: The statements, opinions and data contained in all publications are solely those of the individual author(s) and contributor(s) and not of MDPI and/or the editor(s). MDPI and/or the editor(s) disclaim responsibility for any injury to people or property resulting from any ideas, methods, instructions or products referred to in the content.