Article

Research on the Impact of Cavity Insertion on the Daylight Environment of Sports Buildings

1
School of Architecture and Urban Planning, Shenyang Jianzhu University, Shenyang 110168, China
2
Key Laboratory of Regional Architecture and Human Settlements Science of Cold Area in Liaoning Province, Shenyang 110168, China
*
Author to whom correspondence should be addressed.
Buildings 2025, 15(17), 3057; https://doi.org/10.3390/buildings15173057
Submission received: 2 July 2025 / Revised: 15 August 2025 / Accepted: 16 August 2025 / Published: 27 August 2025
(This article belongs to the Section Building Energy, Physics, Environment, and Systems)

Abstract

The sports center is a new type of sports building with high participation and high lighting energy consumption. A typical building model is constructed and analyzed by combining Rhino Grasshopper and Ecotect simulation software, and the passive strategy of placing cavities is used to reduce the lighting energy consumption and improve the lighting coefficient, which is beneficial to the health and visual comfort of users. Data analysis revealed that built-in cavities are effective at increasing the average illuminance of the underlying space. For spaces with glare, using skin cavities significantly reduces the possibility of discomforting glare. In the architectural design of the sports center, the form, size, number, material, and other factors of the cavity should be carefully considered to meet the demand for daylighting and improve the comfort of the indoor light environment, which provides a valuable reference for the architectural design of the sports center.

1. Introduction

Daylight is an indispensable part of architectural design; in addition to meeting the basic visual needs of people, it also regulates the human body rhythms to ensure health [1,2] as a non-visual effect of light. Several studies have shown that people prefer the comfort of daylight [3,4]. The building of a sports center usually has the characteristics of large space, high height, and related functions overlapping each other, which leads to a space–lighting coefficient decrease; the difficulty of daylighting increases, and it is difficult for daylight to be transmitted to the interior of the building center [5]. Using only artificial lighting will increase electricity consumption and incur ancillary costs. Now that urban development has shifted from the phase of incremental construction to the phase of quality improvement, building design should make use of passive design methods, such as daylighting instead of artificial lighting, to reduce the energy demand of buildings. Therefore, we propose a design strategy to improve the evaluation of the light environment of sports centers by using passive building design methods.

2. Literature Review

Through the in-depth study of architectural bionics, Li Gang et al. proposed the concept of the architectural cavity, which exists as a spatial manifestation of the atrium, wind well, and patio in the building [6,7]. Reasonable insertion of the cavity can play its passive, no energy consumption characteristics. With the increasing complexity of space combinations inside buildings, studies by Han Pei et al. [8], Mei Hongyuan et al. [9,10], Xia Baishu et al. [11], Cao Tianji et al. [12], Li Baofeng et al. [13,14], Shi Xiaomei et al. [15], and Jiwon Park et al. [16] have investigated and found that cavities can improve the indoor comfort of the wind environment and the thermal environment by using different methods. American architect Stephen Holl, Japanese architect Toyo Ito, and others have taken the cavity as an original starting point and integrated the strategy of cavity improvement of the interior environment into the whole process of architectural design [17]. Zhang Lingling et al. [18] proposed that the cavities in large-space buildings can be divided into skin cavity structure, built-in cavity structure, and symbiotic cavity structure, which realizes the passive design that designers can dominate. Double-skin façade: as a type of cavity structure, compared with traditional building facades, double-layer-skin buildings reduce the level of sunlight, prevent glare, and enhance the even distribution of light in the interior space of the building [19]. In general, the side interface lighting can radiate to a range of 4~6 m from the window, which can satisfy the space with a depth of about 12 m to get the ideal daylighting in an ideal situation [20]. However, the depth of a large building is usually much deeper than 12 m, so the central area of a large building becomes inaccessible to daylight. Designers can set up cavities inside the building organism to improve the internal light environment of the building space. When a certain depth scale is reached, the built-in cavity can fully introduce natural elements such as daylight into the core of the building, increasing the contact area between the building and nature without affecting the overall shape of the building, dynamically guiding the environment through the layout and number of built-in cavity structures. For the study of the light environment, the cavity plays the role of a ‘light channel’: the opening of the cavity facing the room is the exit of the light in this well, and the wall around this well determines the amount of light that can be obtained from the rooms around the atrium [21]. Two manifestations of the cavity are mainly studied: the atrium and the light well. Lighting studies for light wells have focused on the optimization of the internal parameters of the cavity [22,23], with Adel Nasab et al. concluding that the optimization of key parameters such as window proportions, reflective surfaces, and cross-sectional forms can significantly increase daylight penetration by up to 40%, whilst at the same time decreasing the building’s energy consumption for lighting [24]. By changing the surface optical properties of the light well, Antoine Bugeat et al. [23] concluded that slight changes in diffuse reflection can have a significant impact on lighting conditions, and the use of mirrors can also improve lighting effects. Ali Goharian et al. [25] improved the lighting efficiency of the light well by optimizing the daylight reflector on the light well. By optimizing the geometry of light well structures, and if the structure aligns with the direction and path of the sun’s rays, it can provide better reflective performance and develop a standardized solution [26]. Studies on atriums have focused on the relationship between different variations in ARs or SARs of atrium skylights and indoor light environment parameters [27,28]. In atriums without direct sunlight, an increase in the area ratio of skylights has a positive effect on the daylighting in the room [29]. The average lighting coefficient in the room increases with the increase in the reflectivity of the atrium interior walls [30]. The cavity enables effective light supplementation of the interior walkways and atrium ground floor space, which greatly improves the efficiency of light utilization in the interior space [31]. To meet indoor lighting requirements, the width-to-height ratio of atriums is generally around 1:3. Smaller courtyards work on the same principle as light pipe systems, with skylights at the top of the cavity serving as lighting devices. These are highly efficient at transmitting energy and allow sunlight to enter transparently. Gao Yunong et al. [32] studied the optimization of daylighting–thermal performance balance through a multi-objective parametric method to resolve the inherent conflict between environmental quality and energy efficiency in atrium design. The visual effect of light meets the visual needs of the human body, while the non-visual effect affects people’s emotions, sleep quality, alertness, and even health. Zeng Yunyi et al. [33] proposed an optimal light output workflow that considers non-visual lighting requirements to ensure that under favorable daylight conditions, additional non-visual requirements will not increase lighting energy consumption. Jin ling et al. [34] control the amount of natural light by controlling sunshade devices under different artificial lighting environments, exploring the relationship between natural light and artificial light, and conclude that compared with simple artificial lighting, comprehensive lighting under sunny conditions can significantly increase circadian rhythm stimulation, thereby improving daytime work efficiency. Xu Junli et al. [35] proposed a refined healthy classroom light environment design strategy by setting different window-to-wall ratios and artificial lighting parameters to provide healthy environmental support for young people.
This study evaluates two widely used types of cavities, skin cavities and built-in cavities, which are usually used to supplement daylighting and reduce glare. By placing the cavities, we can convert direct light into reflected and diffused light, thus effectively supplementing the lighting in backlit or shadowed areas. The main research contents of this paper are (1) the modeling of skin cavities and built-in cavities and the simulation calculation of the light environment and (2) the prediction model of the influence of the proportion of cavities on the light environment of a building. The results of the study can help architects to optimize the light environment by adopting passive design strategies in design or renovation.

3. Methods

3.1. Investigation

This study selects Liaoning Province as a representative research area for cold regions, which encompass Northeast China, Inner Mongolia, Xinjiang, Tibet, and Qinghai, spanning photoclimatic zones I–IV. We conducted a survey on the basic information of the users and the venue. Typical photoclimatic characteristics of cold regions include low solar radiation intensity, reduced solar altitude angles, and short daylight duration, resulting in significant disadvantages for daylight utilization. Shenyang exhibits representative photoclimatic characteristics, with the Shenyang Sports Center serving as the simulation subject. The Shenyang Sports Center, located at 61 Nansanma Road, Heping District, serves youth and public fitness needs with a 2000-person capacity and annual attendance of approximately 800,000. Facilities include badminton, table tennis, basketball, fitness training, fencing, and yoga venues.

3.1.1. Survey I: User Situation

Questionnaire research was used to investigate the basic information and preferences of users of 10 sports centers in Liaoning region, and as of 15 April 2024, 280 questionnaires were distributed, and 262 valid questionnaires were recovered, with an effective recovery rate of 93.57%, and the questionnaire results were valid. An offline questionnaire was used to distribute the questionnaire to users of sports spaces in 10 representative sports centers. This subjective evaluation questionnaire was designed with reference to some scholars’ questionnaires, which consisted of three parts: users’ basic information, evaluation scale of the light environment, and their personal preferences. For the missing or unclear answers in the questionnaire, further interviews will be conducted in the process of questionnaire recovery to ensure that the evaluation subjects can understand and answer the questions correctly, to improve the validity of the questionnaire, and also to ensure the reliability and validity of the study. Through the collation and analysis of the questionnaire results, the following conclusions were obtained:
(1)
Sports type preference: the number of people who choose badminton is the largest among all sports, accounting for 24.62%; the second is table tennis, accounting for 21.95%, which accounts for the most among small-space sports; the third is basketball, accounting for 18.51%, as in Figure 1.
(2)
Users’ time preference: a survey of users’ preference for the time when they can use daylighting was conducted, and it was found that the number of people who chose the afternoon was higher than that of the morning, and the number of people who chose 14:00 was the highest, accounting for 24.05%, which was the time chosen for the simulation of the present study.
(3)
Indoor light environment: illumination is low, the utilization of daylighting is low, and the space where the illumination meets the requirements has been evaluated as producing glare.

3.1.2. Survey II: Sports Center Venues

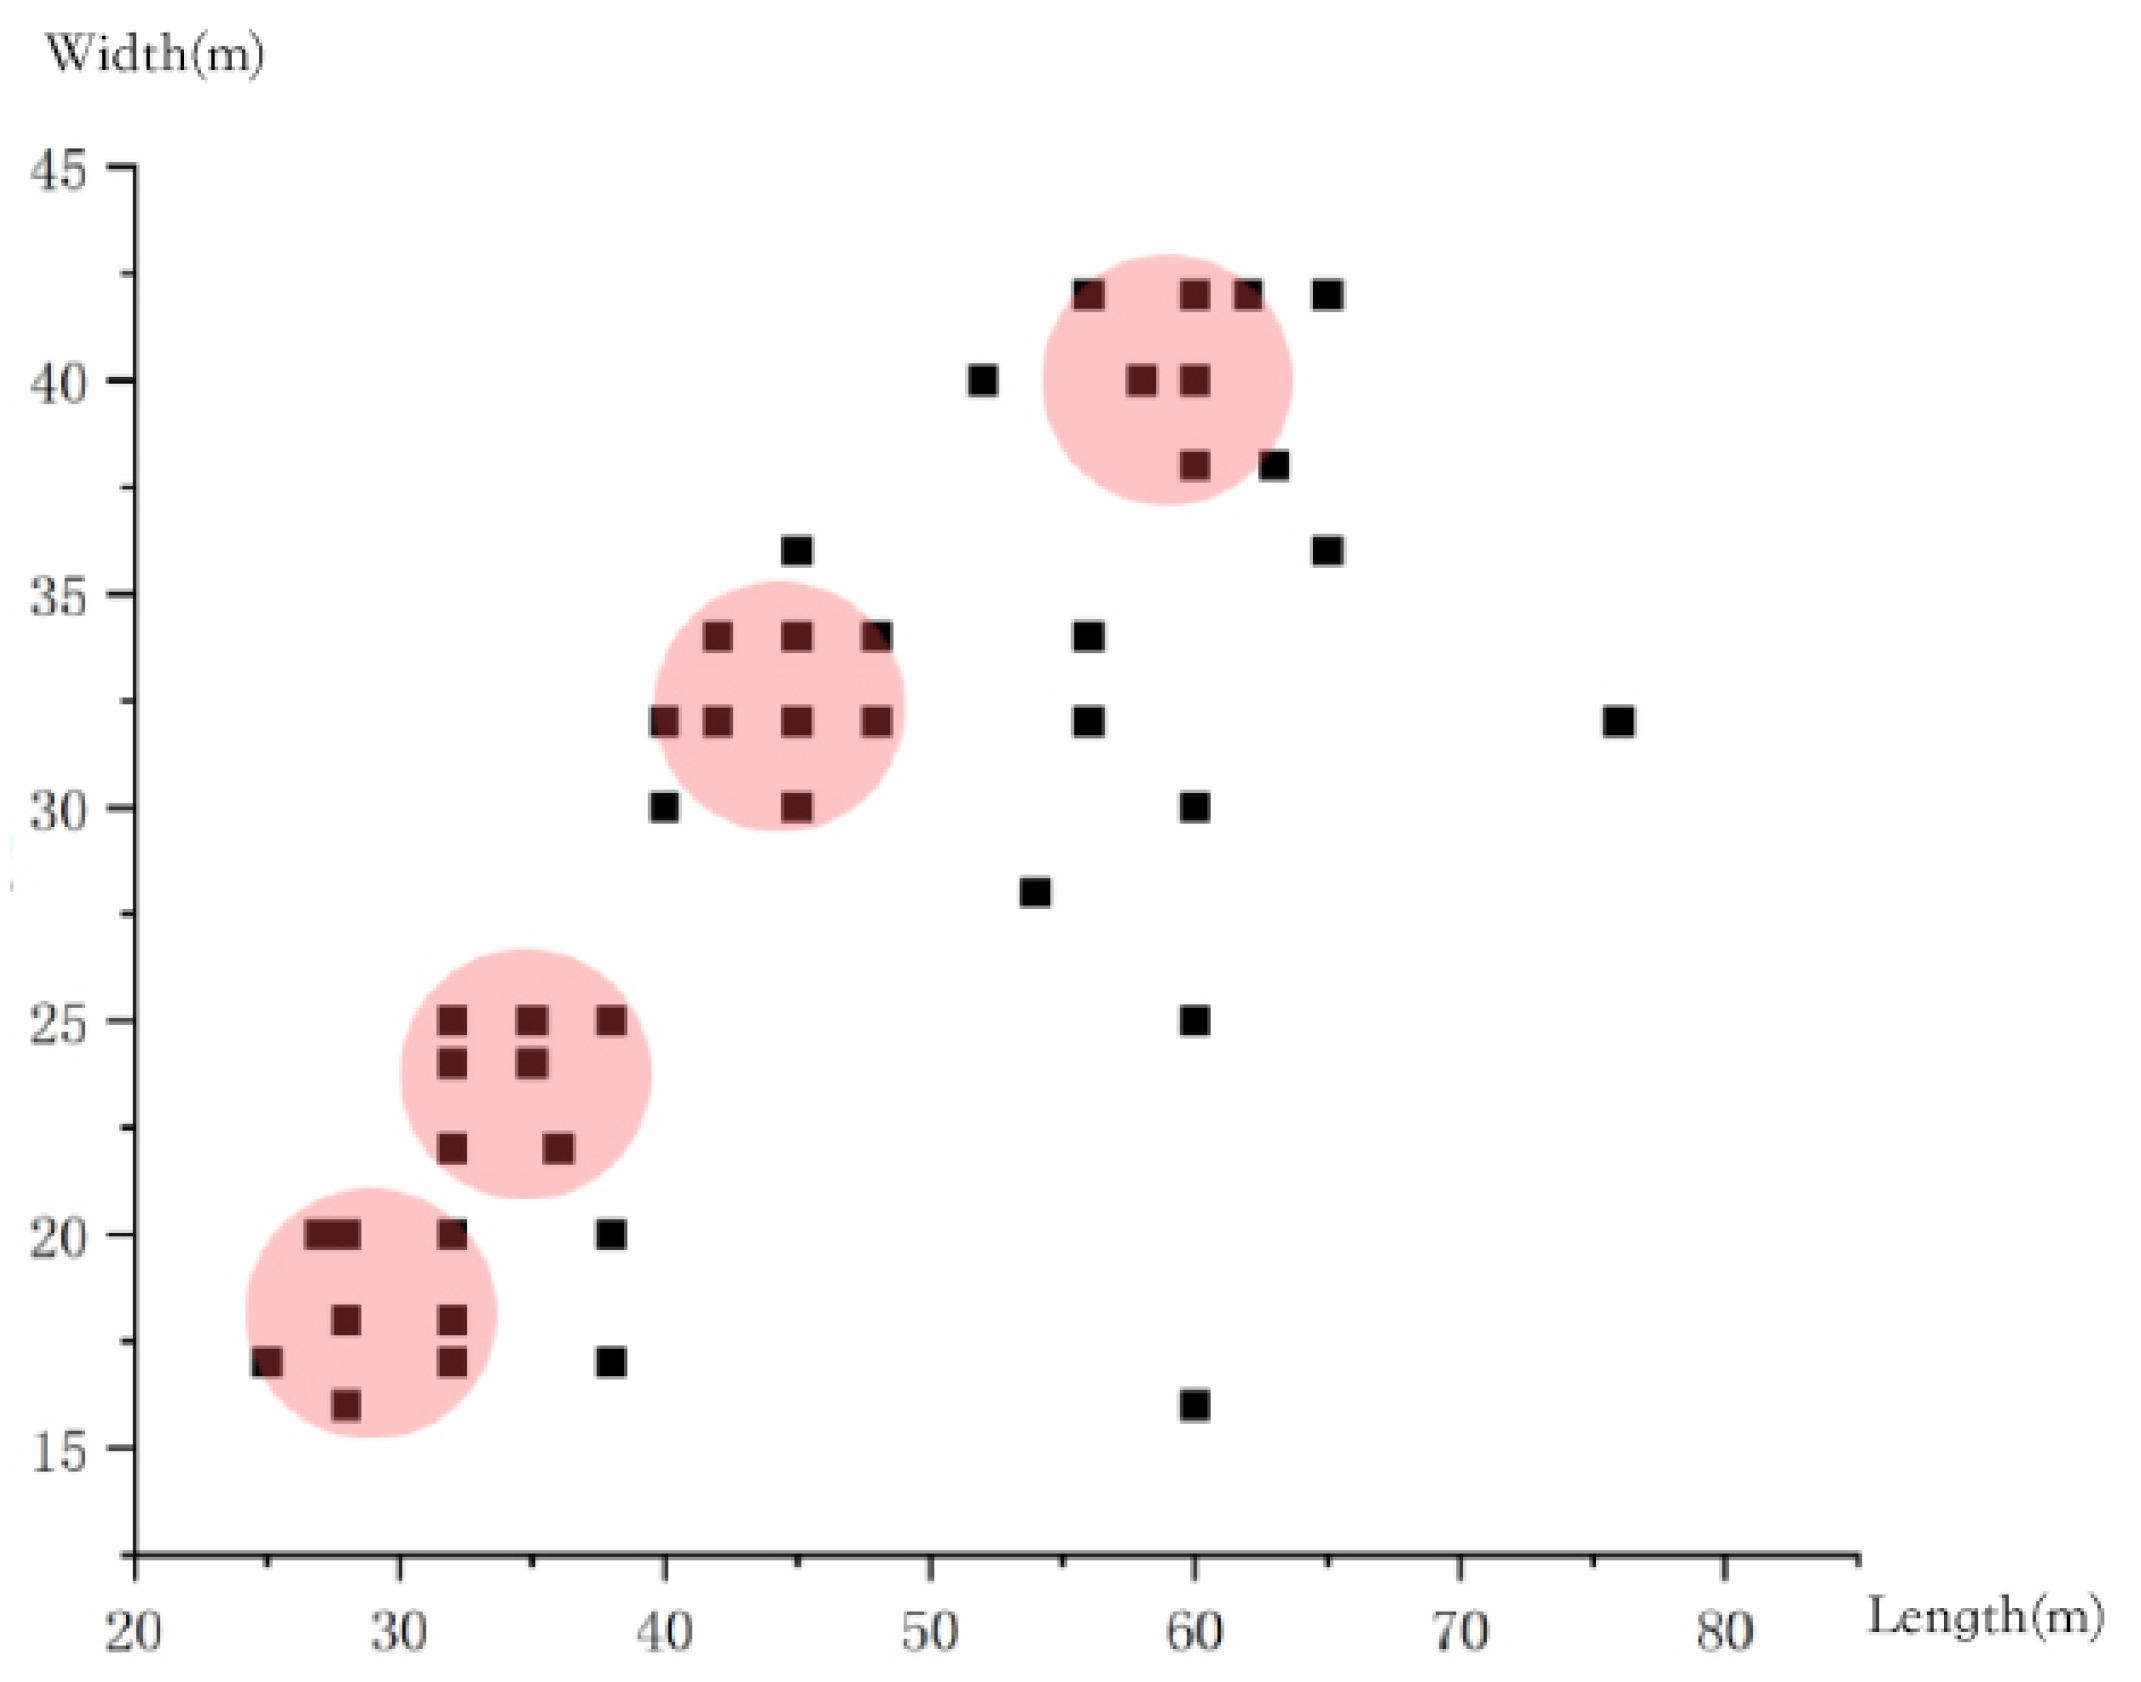
In the statistics of the length and width of 45 venues in 13 sports centers within Liaoning Province, the X-axis in Figure 2 represents the long side size of the sports center venue’s plane, and the Y-axis represents the short side size. As can be seen from the figure, the long side of the sports center’s venue ranges from 25.4 m to 76 m, and the short side ranges from 16 m to 42 m.
Four concentrated areas of scattered points were extracted from the figure. The largest concentrated area is almost all on the top floor and is a space with top lighting. Therefore, we selected the venues in the three areas with smaller planar dimensions to simulate the daylight environment.
There are 21 south-facing venues, accounting for 46.67% of all venues, 16 north-facing venues, accounting for 35.56%, and 17.78% of venues are east–west oriented. From the research cases, it is found that most of the south-facing venues to avoid excessive direct sunlight and glare occurring near the windows will use certain shading means to alleviate the above problems, such as the use of indoor sunshades, glass paste blue coating, etc., and thus even during the daytime indoor lighting is also needed to assist. Therefore, this paper chooses the south-oriented venues as the research object.

3.2. Hierarchical Analysis Method

Select the hierarchical analysis method (AHP) to construct an evaluation index system that can comprehensively and truly reflect indoor light comfort. First of all, the 10 indicators that have a relatively large impact on the daylight environment are selected, and the weight of each evaluation indicator is determined. In addition to selecting basic indicators such as basic illuminance and illuminance uniformity to evaluate the light environment, the useful daylight illuminance (UDI) is suitable for long-term and concise evaluation, retaining a large amount of important information on the illuminance time series. It provides information about the level of useful daylight, as well as trends that may reflect glare and excessive solar overload [36]. According to the statistical collection of the review [37], approximately 34 visual comfort indices populate the existing scientific literature and lighting standards. Almost half of these indices are used for assessing or predicting glare, such as the CIE Glare Index (CGI), Uniform Glare Rating (UGR), Visual Comfort Probability (VCP), Daylight Glare Index (DGI), and Daylight Glare Probability (DGP). Among them, DGI and DGP are the most widely used discomfort glare indicators for daylight conditions [38,39]. The Daylight Glare Probability (DGP) has a strong correlation with subjective glare perception and is more robust than the Daylight Glare Index (DGI) [40].
To determine the weights of each indicator, 18 experts and scholars in the field of indoor light environment were invited as participants, and the light environment indicators were evaluated through offline questionnaire surveys. Survey respondents performed pairwise comparisons of criteria represented by the matrix’s row and column headers. When one factor demonstrated substantially stronger importance than another, a value of ‘7’ was recorded in the corresponding cell; conversely, ‘1/7’ indicated the inverse relationship (Table 1). Following data collection, matrix consistency verification was performed. Where significant inconsistencies emerged, weights were returned to respondents for re-evaluation. This iterative refinement process mitigated random scoring errors, ultimately yielding validated pairwise comparison matrices representing expert judgments of factor importance. The process is shown in Figure 3.
Finally, the results of the importance of the factors given by the questionnaire were analyzed and calculated to obtain the average judgment matrix. This paper chooses to use the sum-product method to calculate the weights of the judgment matrix, and after the consistency test then determines the weights of the indicators and selects the indicators with higher weights for evaluating the light environment of the sports center.
The relative weights of evaluation criteria were computed using the summation-by-parts technique, following standard Analytic Hierarchy Process (AHP) methodology. Criteria exceeding consistency thresholds (CR < 0.10) were subsequently selected for the indoor luminous comfort assessment framework. Criterion level judgment matrix and its weight value are shown in Table 2.
Table 2. Criterion level judgment matrix and its weight value.
Evaluation IndicatorsJudgment MatrixWeights WConsistency Verification
B11530.6333CI = 0.0018
CR = 0.0035 < 0.1
B21/511/30.1062
B31/3310.2605
S 11 = i = 1 3 b i 1 = 1 + 1 / 5 + 1 / 3 = 1.5333
S 21 = i = 1 3 b i 2 = 5 + 1 + 3 = 9
S 31 = i = 1 3 b i 3 = 3 + 1 / 3 + 1 = 4.3333
  • Normalizing all the elements yields the matrix P:
    P = 0.6522 0.5556 0.6923 0.1304 0.1111 0.1062 0.2174 0.3333 0.2605
  • Sum the matrix P by rows:
    a 1 = 0.6522 + 0.5556 + 0.6923 = 1.9000 a 2 = 0.1304 + 0.1111 + 0.0769 = 0.3185 a 3 = 0.2174 + 0.3333 + 0.2308 = 0.7815
  • Normalize the vectors a = 1.9000 0.3185 0.7815 T to obtain the indicator weights W = 0.6333 0.1062 0.2605 T .
  • Calculate the maximum eigenvalue λmax:
    B W = 1 5 3 1 / 5 1 1 / 3 1 / 3 3 1 × 0.6333 0.1062 0.2605 = 1.9456 0.3197 0.7901
    λ max = 1 3 i = 1 3 ( B W ) i w i = 1 3 ( 1.9456 0.6333 + 0.3197 0.1062 + 0.7901 0.2605 ) = 3.0387
  • Consistency verification:
      C R = λ max - n n 1 R I = 3.0387 3 3 1 R I = 0.0372 < 0.1 ,   C R = λ max - n n 1 = 0.0194 , n = 3 ;   therefore ,   R I = 0.58 .
The weight derivation process and consistency verification for evaluation metrics at the alternative level follow identical methodologies to those employed at the criterion level. Therefore, computational procedures for alternative-level indicator weights are not reiterated herein. Therefore, the indicators with the top four indicator weight values are selected as the target indicators of this paper, i.e., useful daylight illuminance, discomfort glare probability, illuminance, and uniformity of daylighting.

4. Simulation Scheme

4.1. Determination of Typical Space

In recent years, light simulation has been shown to have better accuracy [28,41]. To evaluate the effect of the cavity on the light environment of the building, Autodesk Ecotect and Grasshopper software [Ladybug Tools 1.6.0] were selected. To ensure the reliability of the model, the Shenyang City Sports Center located in Shenyang, Liaoning Province, China, was chosen as a practical example for the comparison between simulation and actual measurement. Shenyang City is in the northeast of China, in the middle of Liaoning. Shenyang is a Type III light climate zone, and the outdoor design illuminance is shown in Table 3. We used the CIE overcast sky model in calculating the average illuminance.
Lighting measurement of illuminance meter for TES1332A model, resolution 0.1 lx, range 200,000 lx. The accuracy is in accordance with the provisions in the national standards GB/T 5700-2023 [42].
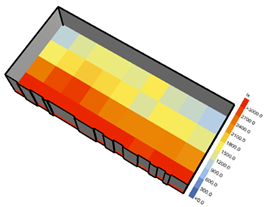
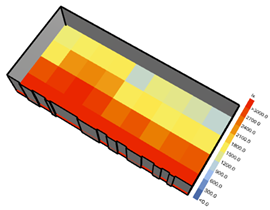
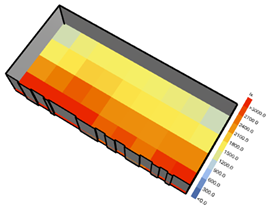
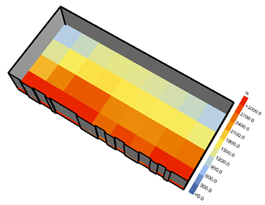
There are no buildings, trees, or other obstructions around the Shenyang Sports Center building. The venues contain a variety of fitness projects, covering a variety of scales of space. Floors one to three of the venues have side window lighting, and floor four has a combination of side window lighting and skylight lighting. The various venues in the building have regular façade windows and simple interior decoration, which can minimize the impact of other factors on indoor illuminance. Selecting the Shenyang City Sports Center, the size of the ground floor of the C hall table-tennis court is 25.2 × 16.8 m, with a height of 8 m, and 24 measurement points are arranged, as in Figure 4a. The first floor of the badminton hall is 37.8 × 16.8 m, with a height of 8 m, and 36 measurement points are arranged, as in Figure 4b.
Measurements were made at moments when there was no direct sunlight in the test room, during which all air-conditioning and artificial lighting systems were switched off, and outdoor windows were kept half open. The 10th, 14th, and 16th of April 2024 were chosen as the dates of measurement, and the time of measurement was chosen as 10:00–14:00 every day. To reduce the error, three measurements were taken each time, and the average value was taken as the illuminance value of the point at that moment. A comparison of simulation and measurement is shown in Table 4.
To verify the accuracy of the simulated values relative to the measured values, the relative error rates between the measured and simulated values were counted, and the average deviation between the estimated and actual values was calculated by calculating the MBE error. According to ASHRAE Guideline 14-2014 [43], the MBE error is calculated as follows:
MBE = i = 1 n ( Xi Yi ) i = 1 n Xi
where Xi is the measured data of model i, Yi is the simulated data of model i, and n is the total number of calculated values.
Among the 180 sets of data, 52% of the simulated values have a relative error rate of less than 10% with the measured values, 77% have a relative error rate of less than 20%, and three sets of values have a relative error rate of more than 40%, with the minimum value of the relative error rate being 0.12%. Since a daylighting simulation error within 20–30% is considered acceptable [44,45], it is calculated that the daylighting simulation error is only about 12%, which is an acceptable error range.

4.2. Model Setting for Built-In Cavities

National standards (GB50189-2015) stipulate that the window-to-wall ratio (WWR) for any single façade of public buildings in cold regions must not exceed 0.60 [46], while in other climatic zones, the maximum permitted WWR is 0.70. When the WWR is below 0.40, the visible light transmittance (τv) of glazing materials should be ≥ 0.60; for WWR ≥ 0.40, τv must be ≥ 0.40. In cold regions—where balancing daylight utilization, thermal insulation, and energy efficiency is critical—the optimal WWR range is 0.2–0.4. Accordingly, this study selects a representative cold-region case and adopts a WWR of 0.40 to maximize daylighting performance in simulations. According to preliminary research on sports centers, it was found that most sports venues have light-colored wooden floors or plastic floors on the ground, the walls are painted with white latex paint, and the ceiling material is white latex paint or a steel structure, which is in line with the requirements of the relevant norms, and through research on sports centers in the same climate zone, it was determined that the spatial model adopted in this study has the following characteristics:
The glazing system employs double-glazed units with τv = 0.7. Climate file selected for simulation in Shenyang, Liaoning Province, China:
·
Building size: 36 m × 24 m × 8 m, 48 m × 32 m × 8 m, 54 m × 36 m × 8 m;
·
Lighting Orientation: South direction;
·
Single façade window to wall ratio: 0.4.
Other parameters are shown in Table 5.
In this paper, the core type built-in cavity is selected for simulation calculation, and the illumination simulation is shown in Figure 5.

4.3. Model Setting for Skin Cavity

According to the existing case studies on skin cavities in buildings, it is found that the width of skin cavities is mostly concentrated at 10% or less. In this study, different widths of skin cavities and different spatial patterns of skin cavities are selected for simulation to study the relationship between the influence of skin cavities on the light environment.

5. Results

5.1. Impact of Built-In Cavities on the Light Environment

5.1.1. Area Ratio of Cavity

The ratio of cavity skylight area to roof area is hereafter abbreviated as AR (Area Ratio). For cross-building comparisons, percentage-based metrics are preferable due to their independence from absolute physical scales [34]. A reference measurement plane was established at 0.75 m above floor level, representing horizontal illuminance conditions. National building codes (GB50189-2015) stipulate that the light-transmitting roof area shall not exceed 20% of the total roof surface [46]; consequently, the AR parameter range was defined as 0–20% for this study.
After all the simulations were completed, the obviously incorrect outliers were first deleted, and all valid data were integrated. With the increase in AR, the average illuminance in the sports ground also increases, and the uniformity of daylighting with the cavity is also significantly improved compared with no cavity, and the uniformity also rises slightly with the increase in AR. The average illuminance and uniformity of daylighting increase with the increase in AR, and with the larger total floor area of the building, the worse the average illuminance and uniformity of daylighting, and so the improvement of the light environment is especially necessary for the large space.
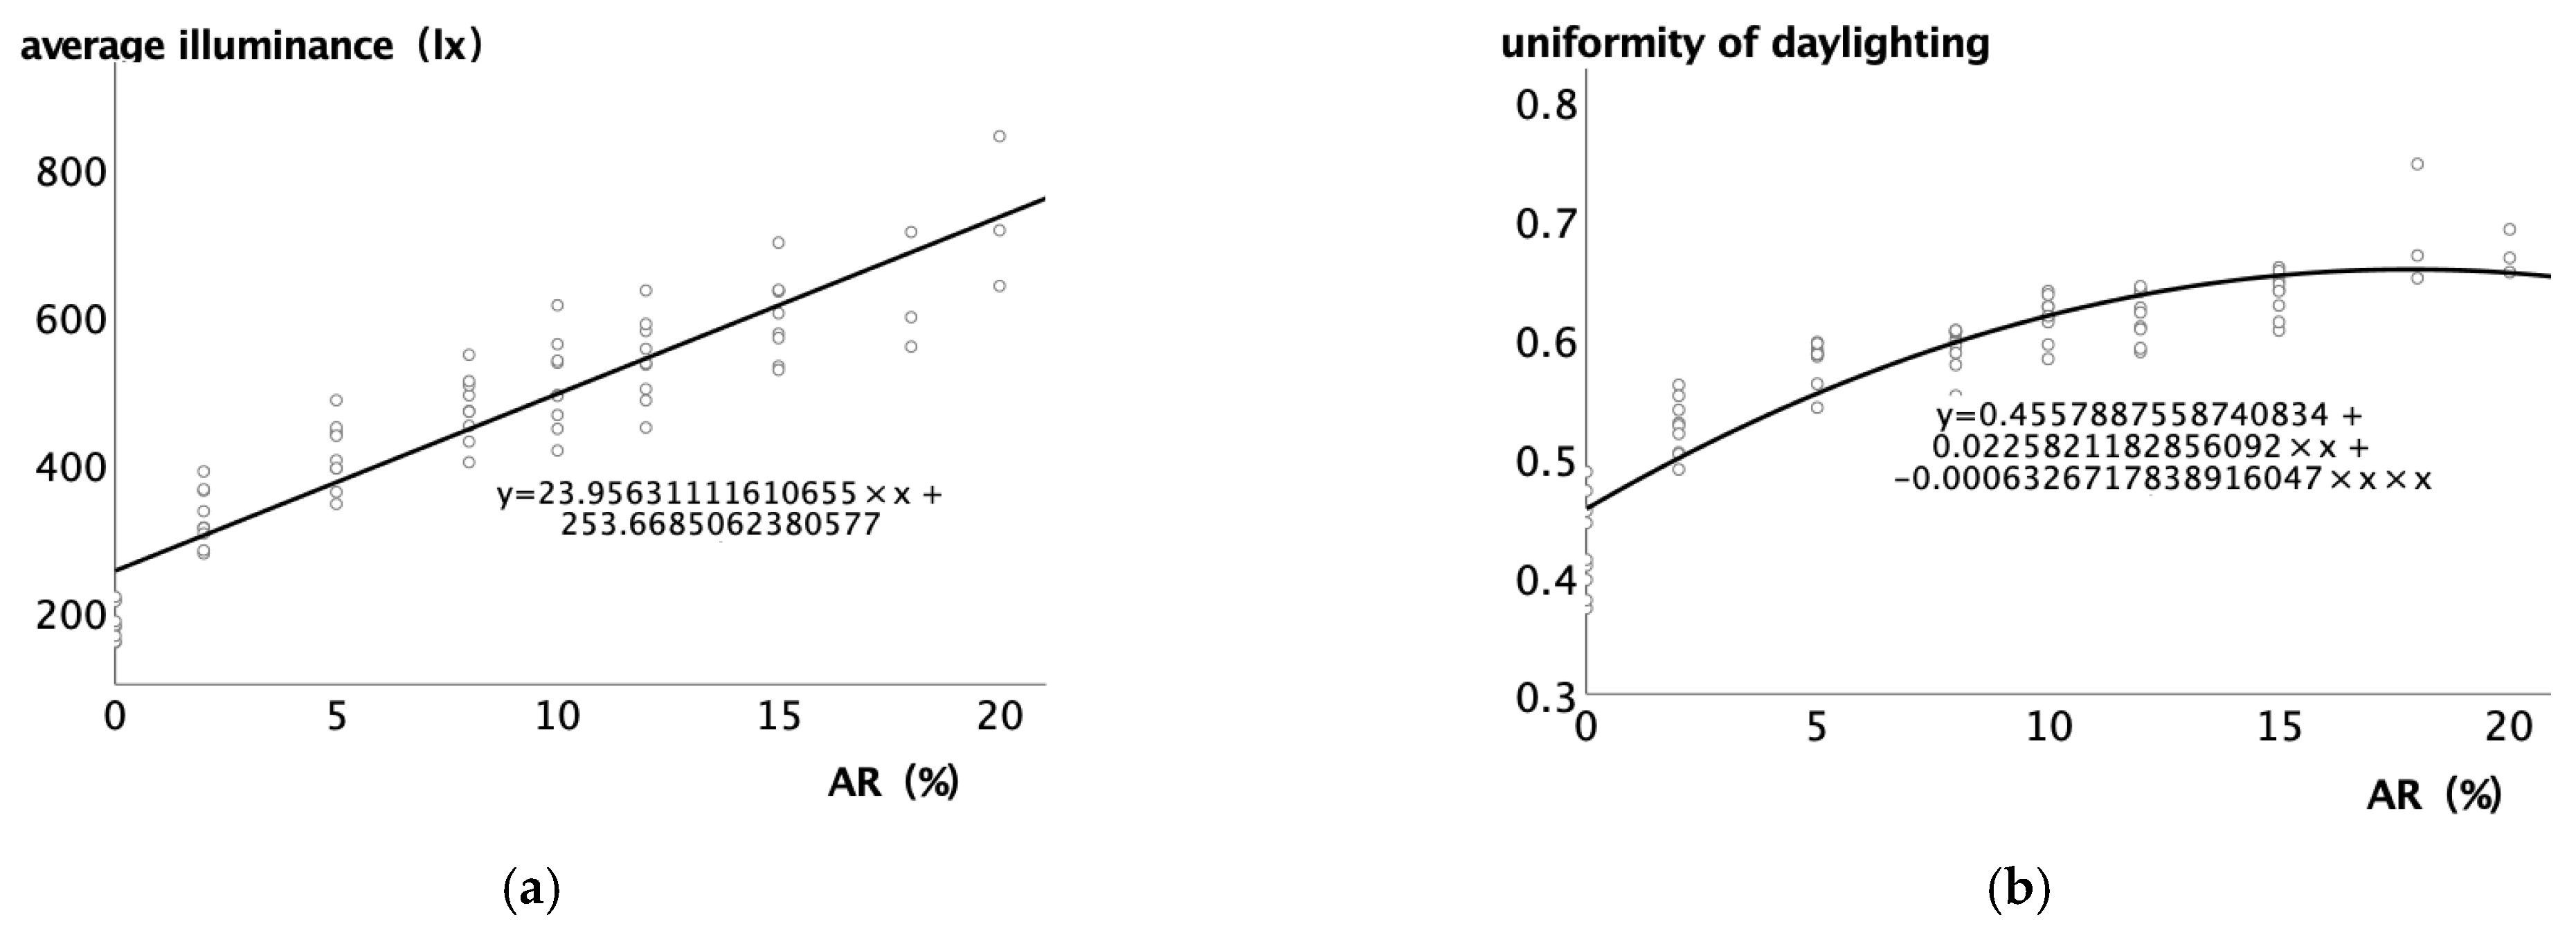
After finding the general trend of the data as a whole, we used SPSS software [IBM SPSS Statistics 25] to correlate the data of AR and average illuminance and uniformity of daylighting to determine whether there is a real correlation between the two. Spearman correlation analysis showed that AR was strongly correlated with average illuminance and illuminance uniformity. The data were fitted by regression analysis, and the equation with the largest R2 was selected as the linear fitting equation. The fitted curves for the proportion of built-in cavity area and illumination change are shown in Figure 6a, with R2 = 0.844, and the fitted curves for the proportion of built-in cavity area and illumination uniformity are shown in Figure 6b, with R2 = 0.829.
According to the fitting equation, it can be learnt that AR is linearly and positively correlated with the average illuminance; i.e., a 1% increase in the area of the core-type single built-in cavity insertion results in a 24 lx increase in the average illuminance; the illuminance uniformity shows a tendency to increase and then flatten out. As the cavity area increases, the area near the window increases, and the high illuminance area increases. Therefore, both DGP and UDI are slightly increased and need to be combined with other means such as the skin cavity to avoid glare.

5.1.2. The Effect of the Number of Cavities on the Light Environment

In considering whether increasing the number of cavities can have a positive effect on the light environment with the same AR, we conducted further simulations of the model. The AR was selected to be 5% and 8%, and the number of cavities was selected to be 1, 2, and 4 for the simulation, and the simulation data of the cavity part are shown in Table 6.
While more cavities increase average illuminance, they exhibit lower uniformity than a single-cavity configuration. Therefore, when illuminance requirements are met, a single cavity provides superior lighting performance over multiple cavities.

5.1.3. Influence of Built-In Cavity Space Morphology

The study compared only the two shapes, circular and square, and found that both square and circular cavities were able to increase the average illuminance inside the space, and that the circular shape was slightly better than the square light well, but the difference was not significant, similar to the conclusions of other scholars’ studies [44].

5.1.4. The Relationship Between Cavity Illuminance Attenuation and Room Area

Through the simulation of a typical building, we found that when the room size aspect ratio is unchanged, and different room core-cavities are placed, the impact of the average illuminance attenuation for each layer is similar. For the analysis of a single cavity, the attenuation of the average illuminance of each floor within four floors is similar, so we can explore the relationship between the proportion of cavity insertion and the average attenuation of illuminance per floor. As the built-in cavity insertion area ratio increases, the attenuation value of illuminance per layer also increases.
The data were correlated by SPSS software, and Spearman correlation analysis was used because some of the data were not approximately normally distributed. From the data analysis, it was concluded that the AR of a single cavity has a strong correlation with the average per-layer attenuated illuminance value, and as the AR increases, the average per-layer attenuated illuminance value also increases. Through the regression curve we can conclude that as the AR increases by 1%, the average attenuated illuminance value per floor also increases by 6.4 lx. The average illuminance of each floor can be deduced from this data, and no correlation with the room area is found.

5.2. Skin Cavity

5.2.1. Effect of the Width of the Skin Cavity on the Light Environment

According to the existing case studies on the skin cavity of buildings, the width of the skin cavity is mostly within 30% of the room depth. In this simulation, when the lighting area and lighting height are certain, the daylight environment simulation is carried out for three different scales of the arena of the sports center, and the relationship between the cavity width and the light environment index is analyzed.
(1)
Impact on Useful Daylight Illuminance (UDI)
Analysis reveals that UDI values in all three venue sizes initially increase and then decrease as skin cavity width expands, indicating a strong correlation. Regression models show wider cavities reduce interior solar radiation and average illuminance. However, an optimal cavity width exists that maximizes UDI performance.
(2)
Daylighting uniformity
Cavity width demonstrates strong correlation with illuminance uniformity across summer solstice (clear sky) and winter solstice (overcast) conditions. Since cavity design primarily controls direct glare, we specifically examined uniformity under clear summer solstice conditions. Uniformity responses varied across venue scales, seasons, and weather scenarios as cavity width increased.
(3)
Daylight Glare Probability
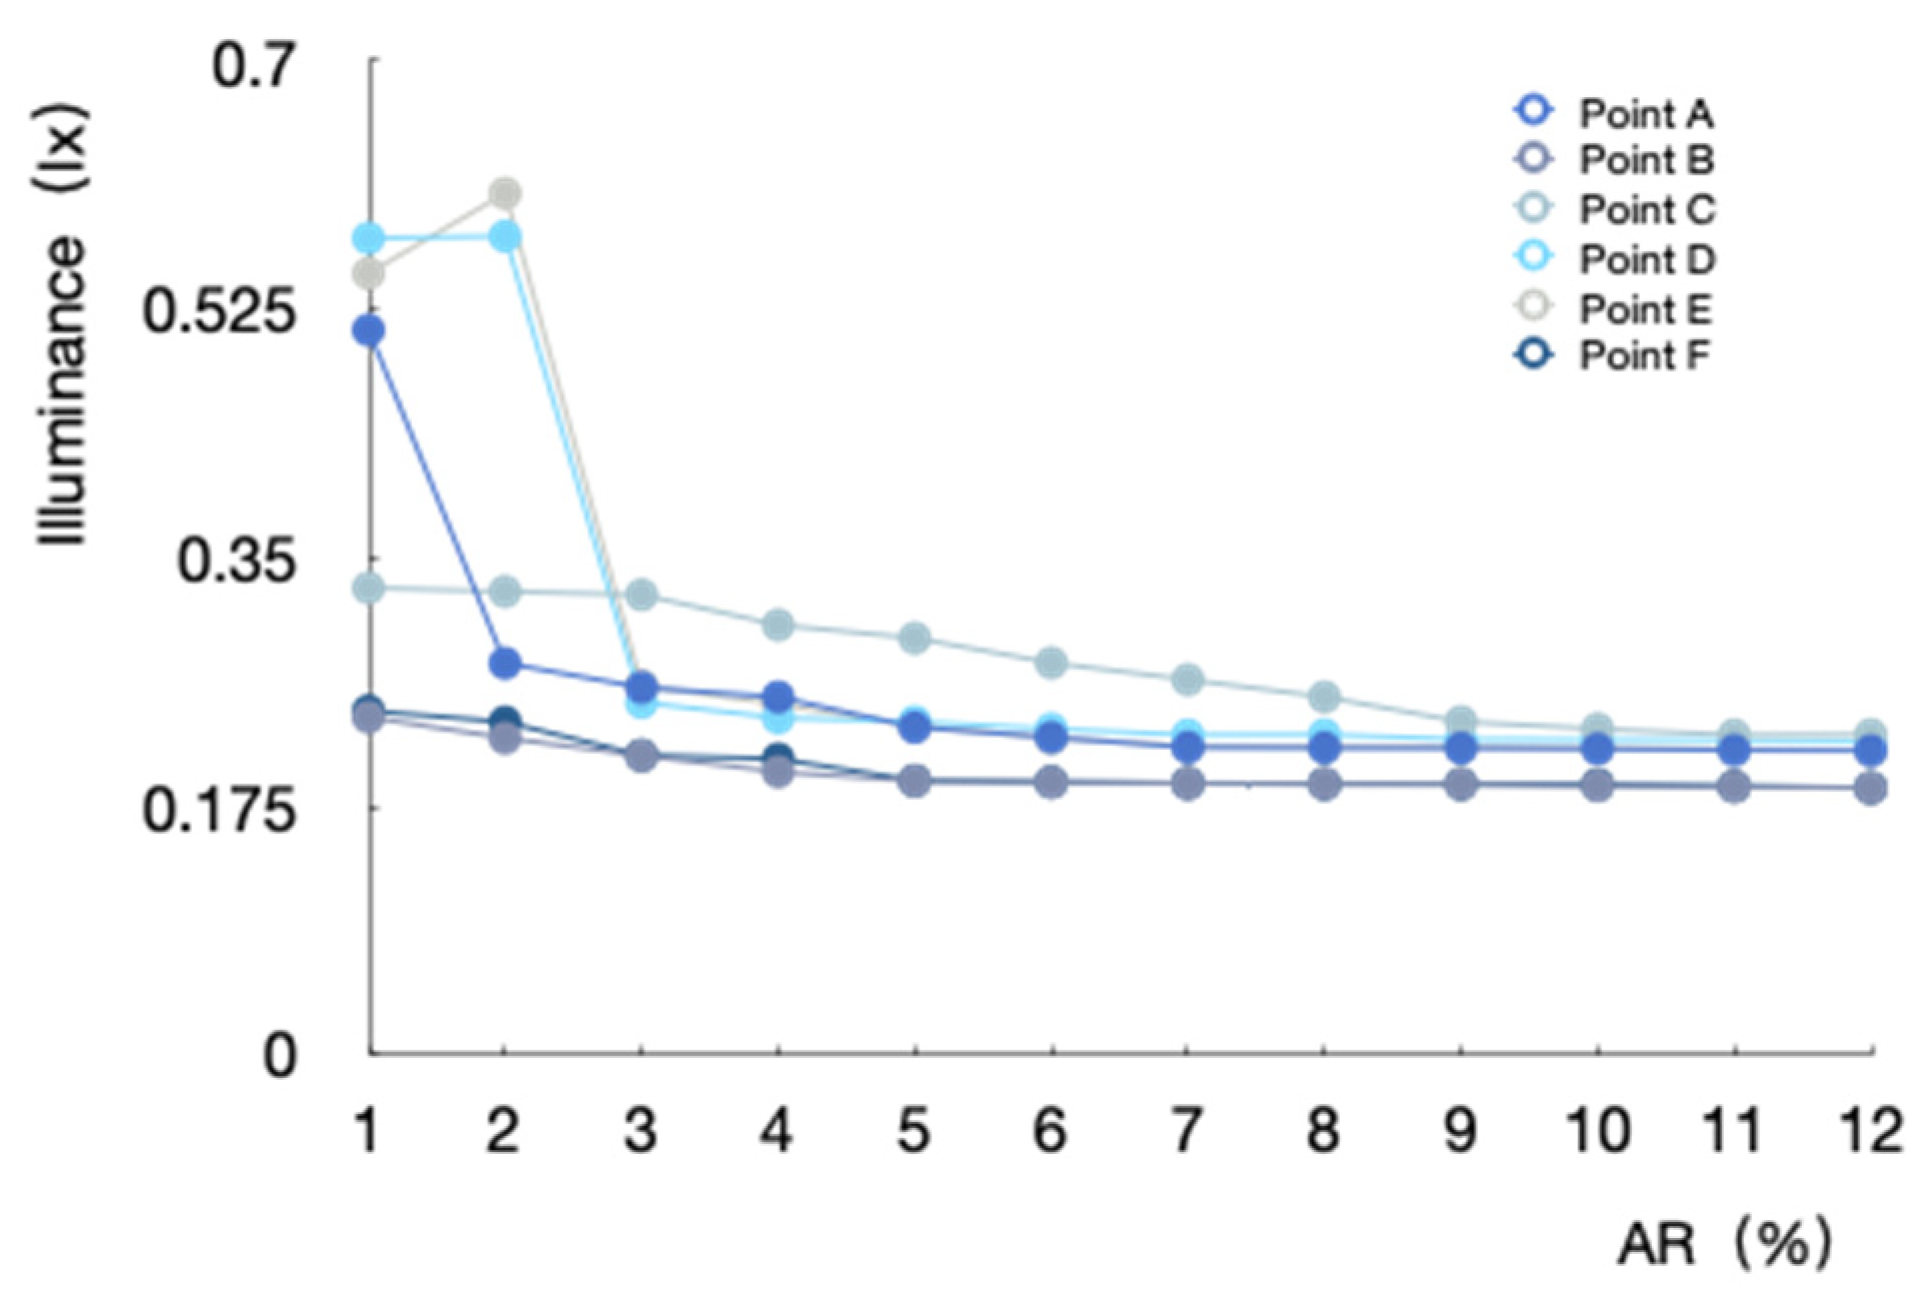
Increasing cavity width consistently reduced glare probability at all measurement points. The effect was most pronounced when DGP exceeded 0.35 (indicating perceptible glare), with significant reduction achieved at 3% cavity-to-depth ratios (Figure 7). This width threshold effectively minimizes glare occurrence.

5.2.2. Influence of the Spatial Morphology of the Skin Cavity

(1)
Impact on Useful Daylight Illuminance (UDI)
Standard practice employs perforated metal or acrylic panels for folded-plate and wave-type cavity skins. To minimize perforation rate interference, this study used acrylic panels with fixed cavity width (15% of room depth) while testing three morphologies: flat, folded-plate, and wave-type.
Baseline UDI (without cavity): 70.33%. Comparative results: flat cavity: 72.88%; folded-plate: 72.77%; wave-type: 72.78%. A 0.1% variation indicates morphology has negligible impact on UDI (100–2000 lx range).
(2)
Daylighting uniformity
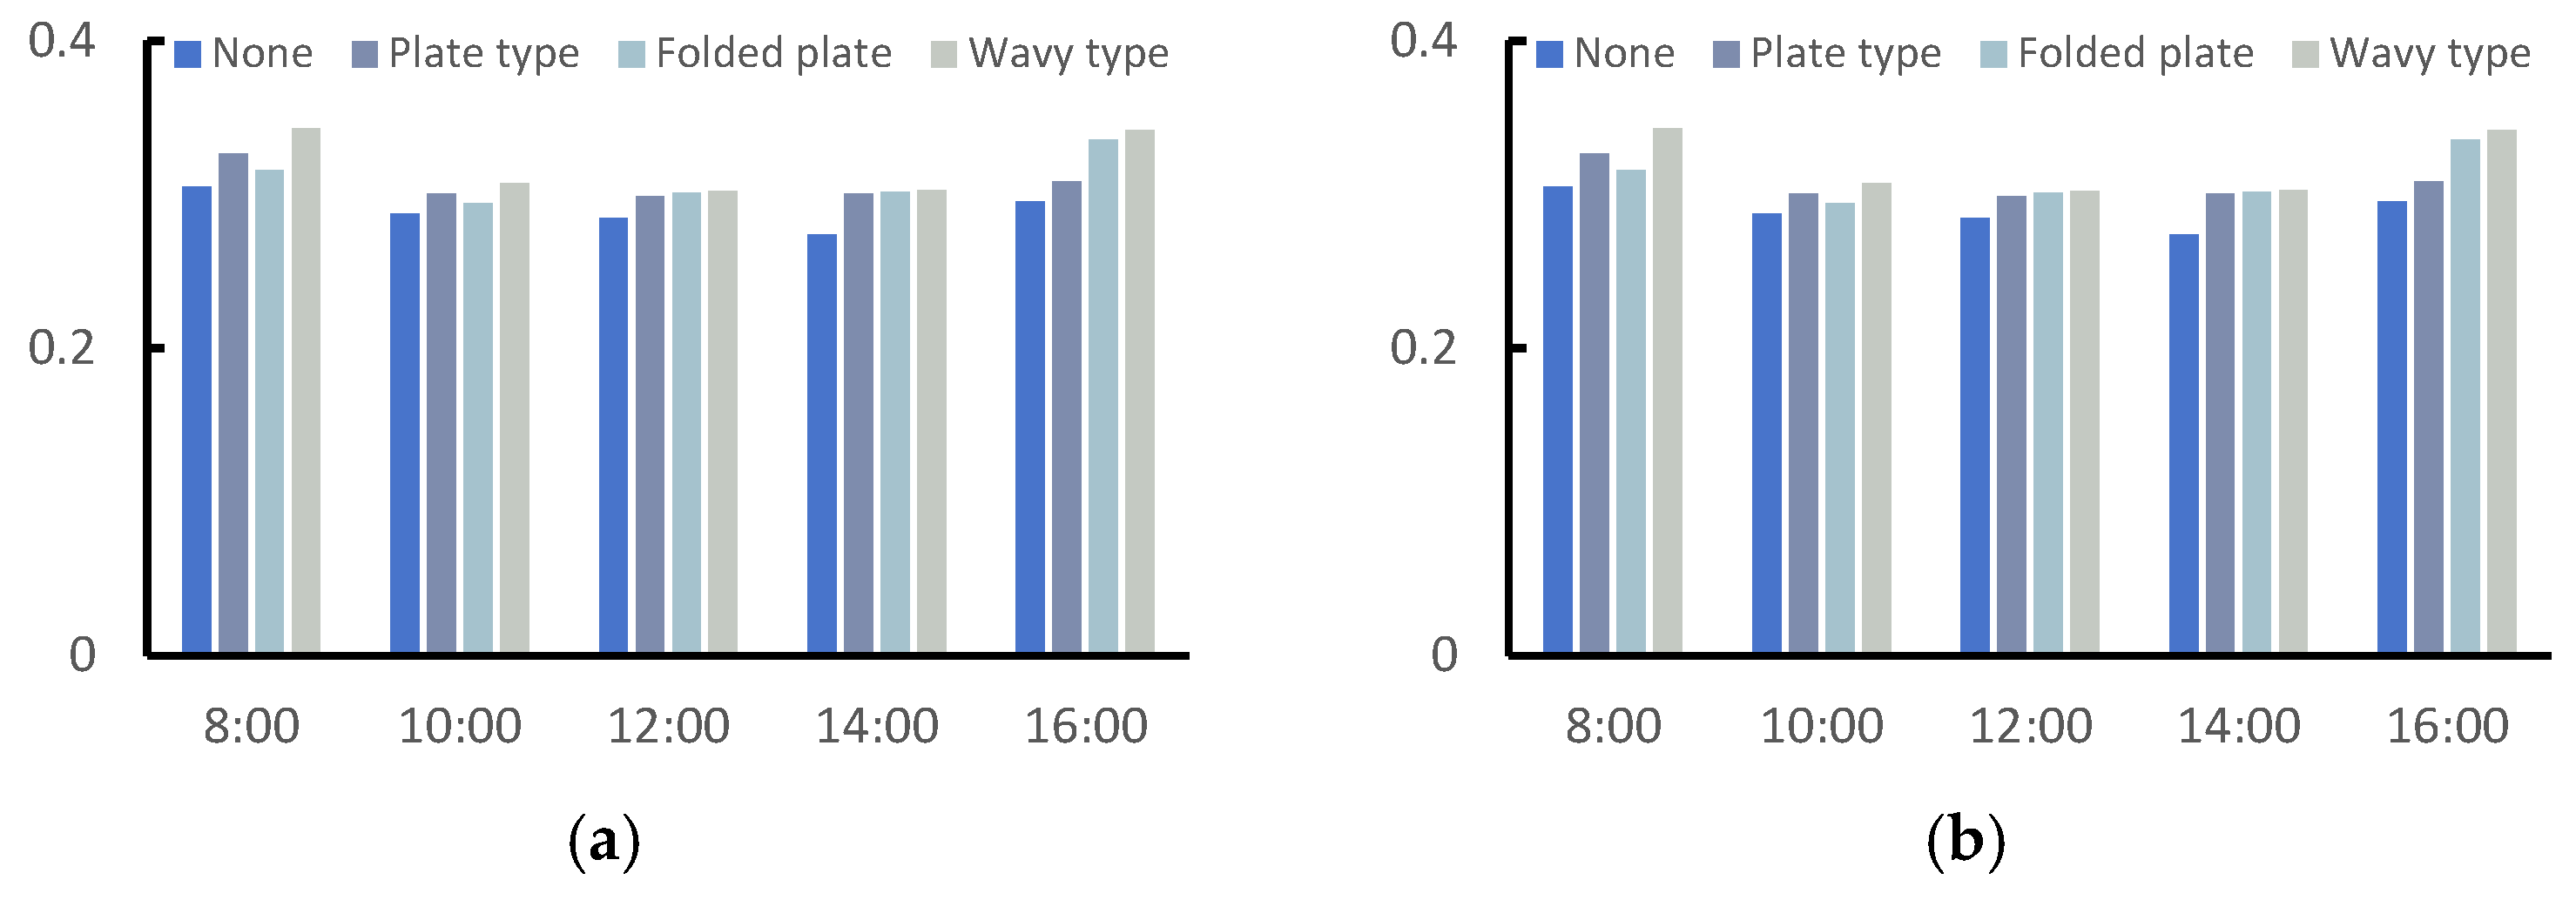
All cavity morphologies improved illumination uniformity (Figure 8). Wave-type cavities demonstrated the greatest enhancement, followed by folded-plate configurations. The reason is these two types of skin cavities can change the angle of the light into the room, so that light diffusion occurs, which in turn affects the uniformity of lighting in the room. Uniformity improvements became statistically insignificant under overcast conditions.
(3)
Daylight Glare Probability
The six measurement points in the sports ground were selected for glare simulation, and it was concluded that the three spatial morphologies of the skin cavity outer skin could effectively reduce the value of DGP, and the degree of reduction of the average value of DGP among the three remained consistent. Therefore, the different spatial morphologies of the skin cavity outer skin can effectively control the occurrence of indoor glare, among which the folded-plate-type skin cavity has the greatest degree of reduction. The larger the value of DGP when there is no cavity, the more obvious the degree of reduction after increasing the skin cavity.
In summary, implementing any of the three skin cavity morphologies yields approximately 3.6% improvement in Useful Daylight Illuminance (UDI 100–2000 lx), with statistically indistinguishable performance differences between configurations. All morphologies enhanced lighting uniformity under extreme winter solstice conditions (both clear and overcast skies), though wave-type cavities demonstrated superior uniformity optimization. Similarly, each configuration effectively reduced Daylight Glare Probability (DGP) values across measurement points, with no operationally significant variation in glare control efficacy between forms. Consequently, while cavity morphology selection shows minimal differential impact on UDI and glare metrics, wave-type designs deliver measurably better illuminance uniformity performance for athletic facilities.

6. Discussion

6.1. Application Simulation

Lower floors (1–3) contain medium/small sports halls utilizing side-window daylighting, while the fourth-floor arena combines side windows and skylights in the Shenyang Sports Center. However, all spaces rely primarily on artificial lighting due to glare management strategies. Even at noon, shading devices remain deployed to prevent glare, resulting in visual disconnection from the outdoors and poor daylight quality. Consequently, our simulation prioritizes glare mitigation through skin cavity integration.
Simulation analysis employed three key metrics: Useful Daylight Illuminance (UDI), illuminance uniformity, and Daylight Glare Probability (DGP). For precision, we set simulation grid dimensions at 0.5 m × 0.5 m × 0.75 m height. Material specifications include wooden flooring, white ceilings, white plaster walls, and standard glazing throughout all venues.
(1)
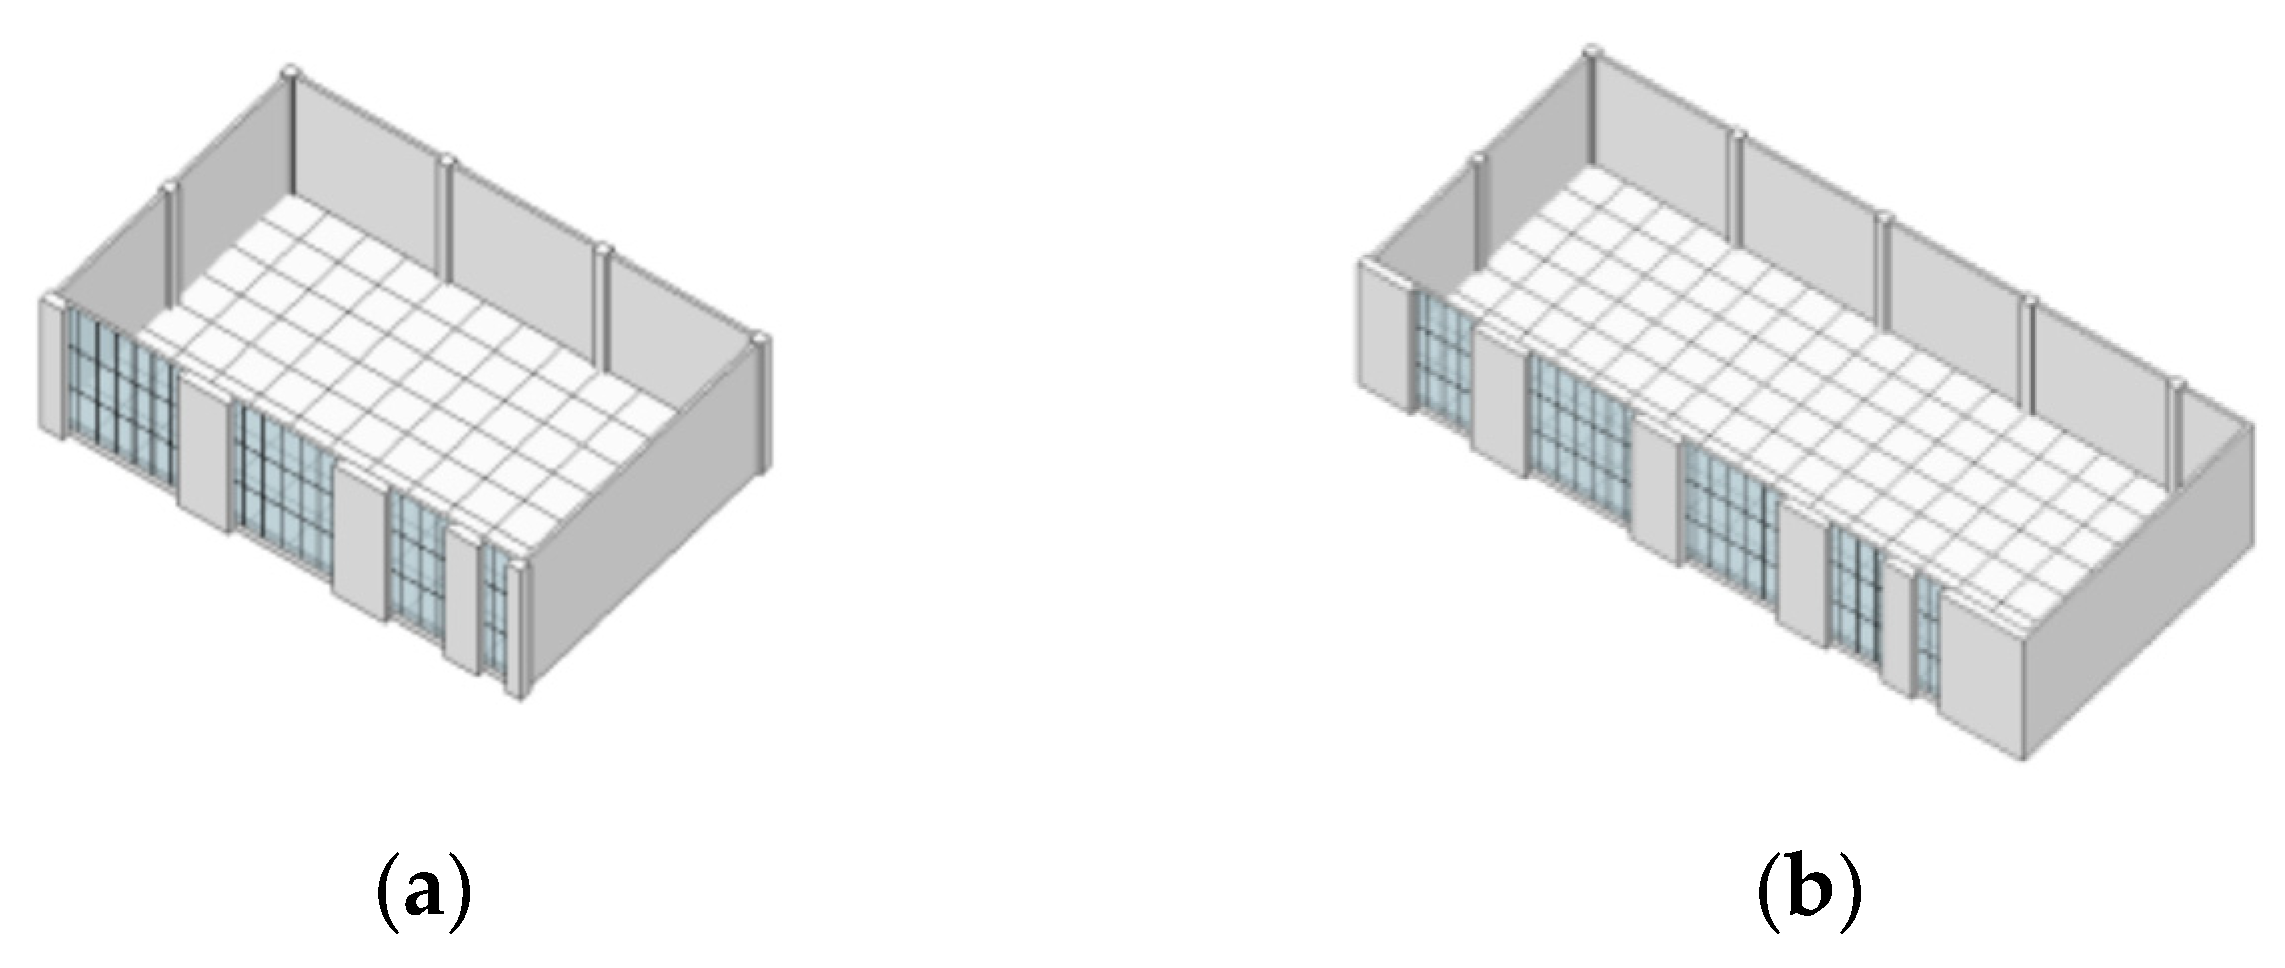
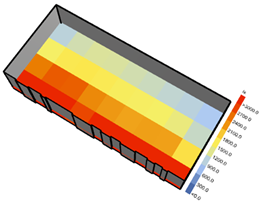
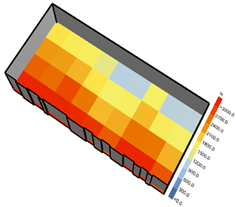
Set the cavity width to 15% of the room width. The comparison of the models before and after insertion is shown in Figure 9.
Table 7 describes the effective daylight illuminance in the second-floor badminton hall and third-floor fitness center of Shenyang Sports Center after implementing a skin cavity. Prior to the installation, the average Useful Daylight Illuminance (UDI100–2000lx) values were 77.54% and 81.80%, respectively. Post-installation, these values increased to 84.26% and 86.65%, representing improvements of 8.67% and 5.93% in mean UDI performance.
Both venues exhibited enhanced illuminance uniformity. For the badminton hall under Clear Summer Solstice and Overcast Winter Solstice conditions, uniformity coefficients rose to 0.2336 (15.37% increase) and 0.1384 (12.06% increase), respectively. The fitness center achieved values of 0.2157 (11.54% increase) and 0.1190 (8.18% increase). Discomfort glare at six measurement points was significantly mitigated compared to pre-retrofit conditions.
(2)
With an inner-skin window-to-wall ratio (WWR) of 0.5 and other parameters held constant, was saw the following:
Effective daylight illuminance further increased to 83.62% (badminton hall, +6.08%) and 83.35% (fitness center, +1.55%). While illuminance uniformity decreased by approximately 6% at 08:00 and 14:00 on Clear Summer Solstice Days, it improved during all other times on such days and throughout Heavy Overcast Winter Solstice Days. Composite uniformity gains across both extreme sky conditions were as follows: badminton hall +3.10% (Summer Solstice)/+11.69% (Winter Solstice); fitness center: +8.66% (Summer Solstice)/+15.22% (Winter Solstice). Discomfort glare control remained consistently effective.

6.2. Limitations

(1)
The established evaluation system for light comfort does not take into account the non-visual effects and physiological parameters, and a more complex evaluation system can be established in the future to study the influence of the cavity on daylight comfort in depth.
(2)
All of the optimization tests are based on computer platforms, and there is a certain error with the actual performance of the building, although the error is within the controllable range. The model was simplified in three dimensions due to the simulation time, and only the climatic conditions of one region were simulated, whereas the actual building is much more complex than the simulation, and the detailed design and other details will have a minor impact on the daylighting environment. Subsequent research could explore different effects in other climatic conditions.

7. Conclusions

(1)
Built-in Cavity Analysis
Through literature synthesis, cavities are classified into built-in cavities and skin cavities. Simulations of three representative models demonstrate that built-in cavities effectively enhance average illuminance and daylight uniformity in indoor functional zones. Regression analysis indicates that a 1% increase in core built-in cavity area increases average illuminance by 24 lx. At identical area ratios (ARs), higher cavity quantities correlate with increased illuminance but reduced uniformity. Consequently, single-cavity configurations outperform multi-cavity systems, supporting the use of singular core cavities for optimal illuminance. Comparative simulations of circular versus square cross-sections reveal marginally superior performance for circular cavities, though statistically insignificant. The light intensity in the cavity decreases gradually from the top downwards as the bottom space becomes further away from the skylight. For the area of the ground floor space near the core built-in cavity, the cavity is its lighting facade. When all the walls of the cavity are made of high-transmittance materials, the larger the area of the cavity, the greater the attenuation of illumination at each level. The higher the proportion of solid walls in the cavity, the greater the reflective capacity. Therefore, the real and imaginary settings of the internal walls of the cavity should be reasonably distributed according to the demand for light in each room.
(2)
Skin Cavity Analysis
Skin cavity simulations reveal that increasing cavity width initially elevates Useful Daylight Illuminance (UDI), peaking before declining, while daylight uniformity increases monotonically. Glare probability at six measurement points decreases concomitantly. Notably, under high glare-risk conditions (DGP > 0.35), glare index reduction intensifies with cavity width. Optimal cavity width should not exceed 20% of room depth. Comparative analysis of flat-plate, folded-plate, and wave-shaped configurations shows negligible differences in UDI and glare control. However, wave-shaped cavities marginally improve uniformity. Skin cavities significantly enhance annual luminous performance, particularly under extreme weather, by increasing illuminance uniformity, improving UDI, and reducing glare.
In the architectural design, various factors such as the form, size, number, and material of the cavity should be considered to meet the demand for good daylight to reduce lighting energy consumption, and the parameters and ratios should be carefully adjusted according to the actual conditions to improve the lighting effect and the comfort of the indoor light environment. By adjusting the position, shape, and material of the cavity space, the cavity space can adapt to the needs of different parts of the building. With the development of science and technology, the study of cavities can make the enhancement of architectural aesthetics and the discovery of the cultural characteristics of cold places as the design goal.

Author Contributions

Conceptualization, Y.H.; Methodology, K.L. and Y.H.; Software, K.L. and H.L.; Formal analysis, K.L., Y.W. and H.L.; Investigation, K.L. and Y.W.; Resources, Y.H. and Y.W.; Data curation, K.L., Y.W. and H.L.; Writing—original draft, K.L., Y.W. and H.L.; Writing—review & editing, K.L. and Y.H.; Visualization, K.L. and Y.W.; Supervision, Y.H.; Project administration, Y.H.; Funding acquisition, Y.H. All authors have read and agreed to the published version of the manuscript.

Funding

This research was funded by the National Natural Science Foundation of China (Grant No. 52278030) and Basic Research Projects of Higher Education Institutions in Liaoning Province (Grant No. JYTZD2023160).

Data Availability Statement

The original contributions presented in this study are included in the article. Further inquiries can be directed to the corresponding author.

Conflicts of Interest

The authors declare no conflicts of interest.

Abbreviations

EwExternal illuminance (lx)
EnIndoor illumination (lx)
EsDesign illuminance of exterior daylight (lx)
E1Critical illuminance of exterior daylight (lx)
CDaylight factor (%)
KDaylight climate coefficient
KcWindow width coefficient for side lighting, as the ratio of window width to room width
GcWindow height factor for side lighting, i.e., the ratio of window height to floor height
τvVisible light transmittance
ρpReflection ratio of the ceiling
ρqThe reflection ratio of the wall
ρdReflectance ratio of the floor
ARArea ratio of cavity skylight to roof

References

  1. Zeng, Y.; Sun, H.; Lin, B.; Zhang, Q. Non-visual effects of office light environment: Field evaluation, model comparison, and spectral analysis. Build. Environ. 2021, 197, 107859. [Google Scholar] [CrossRef]
  2. Hao, L.; Cao, Y.; Cui, Z.; Zeng, K.; Shao, R. Research trends and application Prospects of light and health. J. Light. Eng. 2017, 28, 1–15+23. [Google Scholar]
  3. Kim, W.; Kim, J.T. The Scope of the Glare Light Source of the Window with Non-uniform Luminance Distribution. Indoor Built Environ. 2011, 20, 54–64. [Google Scholar] [CrossRef]
  4. Nazzal, A.A. A new evaluation method for daylight discomfort glare. Int. J. Ind. Ergon. 2005, 35, 295–306. [Google Scholar] [CrossRef]
  5. Lu, S.; Xie, X.; Li, L.; Wei, D. Single to compound: Research on the design of stacked gymnasium based on National fitness. Urban Constr. 2017, 112–115. [Google Scholar] [CrossRef]
  6. Li, G.; Wu, Y.; Li, B. From “skin” to “cavity organ”: An interpretation of ecological strategies in three foreign architectural examples. J. Archit. 2004, 3, 51–53. [Google Scholar]
  7. Li, G.; Xiang, B. Typology of architectural cavities. Archit. J. 2006, 11, 18–21. [Google Scholar]
  8. Xu, H. Based on analysis of energy flow cascading sports building type cavity space research. Central China Build. 2023, 41, 37–43. [Google Scholar] [CrossRef]
  9. Han, P. Research on Cold-Adapted Design of Buildings in Cold Regions based on Bioclimatic Adaptation. Ph.D. Thesis, Harbin Institute of Technology, Harbin, China, 2017. [Google Scholar]
  10. Han, P.; Mei, H. Ecological Design of buffer cavities in cold regions. Architect 2015, 56–65. [Google Scholar]
  11. Bai, X.; Xia, B.; Zhang, N.; Feng, X. Natural ventilation under the guide of large space building cavity embedded study. J. Archit. Art 2022, 28, 92–95. [Google Scholar] [CrossRef]
  12. Cao, T. Research on Architectural Cavity Design Based on Indoor Thermal Environment Enhancement. Master’s Thesis, Southeast University, Nanjing, China, 2018. [Google Scholar]
  13. Li, B. “Double skin” curtain wall type analysis and application prospect. Archit. J. 2001, 11(28–31+2–3), 2–31. [Google Scholar]
  14. Li, B. A Study on the Design Strategy of Building Skin Adaptable to the Climate of Hot Summer and Cold Winter Region. Ph.D. Thesis, Tsinghua University, Beijing, China, 2005. [Google Scholar]
  15. Shi, X. Office Space Optimization Strategy Based on Cavity thermal buffer Effect in hot summer and Cold Winter. Master’s Thesis, Southeast University, Nanjing, China, 2019. [Google Scholar]
  16. Park, J.; Lee, K.H.; Lee, S.H.; Hong, T. Benefits assessment of cool skin and ventilated cavity skin: Saving energy and mitigating heat and grid stress. Build. Environ. 2024, 247, 111027. [Google Scholar] [CrossRef]
  17. Wang, J.; Wang, Y. Where is “green”?—Comparative Reflections on the architectural design schemes of Toyo ITO and Steven Hall. Archit. Cult. 2020, 7, 237–239. [Google Scholar]
  18. Zhang, F.; Zhang, L.; Li, Q. Cavity Guidance and Control Technology for Green Design of large space Buildings. Architects 2020, 3, 85–90. [Google Scholar]
  19. Barbosa, S.; Alberto, K.C.; Piroozfar, P. Natural daylighting through double skin façades: A review. Archit. Eng. Des. Manag. 2025, 21, 231–251. [Google Scholar] [CrossRef]
  20. Zhang, Y.; Tao, S.; Meng, X. Research on optimization design of architectural form in deep depth of cold region based on natural lighting. Urban Archit. 2018, 23, 88–89. [Google Scholar] [CrossRef]
  21. He, H. Analysis of Patio. Master’s Thesis, Chongqing University, Chongqing, China, 2018. [Google Scholar]
  22. Ahadi, A.A.; Saghafi, M.R.; Tahbaz, M. The study of effective factors in daylight performance of light-wells with dynamic daylight metrics in residential buildings. Sol. Energy 2017, 155, 679–697. [Google Scholar] [CrossRef]
  23. Bugeat, A.; Beckers, B.; Fernández, E. Improving the daylighting performance of residential light wells by reflecting and redirecting approaches. Sol. Energy 2020, 207, 1434–1444. [Google Scholar] [CrossRef]
  24. Nasab, S.M.R.A.; Teimourtash, S. Improving daylight performance of residential light wells in dry-cold climate: Optimization and sensitivity analysis. Sol. Energy 2023, 264, 112048. [Google Scholar] [CrossRef]
  25. Goharian, A.; Mahdavinejad, M.; Bemanian, M.; Daneshjoo, K. Designerly optimization of devices (as reflectors) to improve daylight and scrutiny of the light-well’s configuration. Build. Simul. 2022, 15, 933–956. [Google Scholar] [CrossRef]
  26. Goharian, A.; Daneshjoo, K.; Yeganeh, M. Standardization of methodology for optimizing the well aperture as device (reflector) for light-wells; A novel approach using Honeybee & Ladybug plugins. Energy Rep. 2022, 8, 3096–3114. [Google Scholar] [CrossRef]
  27. Xiao, W.; Zhong, W.; Wu, H.; Zhang, T. Multiobjective optimization of daylighting, energy, and thermal performance for form variables in atrium buildings in China’s hot summer and cold winter climate. Energy Build. 2023, 297, 113476. [Google Scholar] [CrossRef]
  28. Rastegari, M.; Pournaseri, S.; Sanaieian, H. Daylight optimization through architectural aspects in an office building atrium in Tehran. J. Build. Eng. 2021, 33, 101718. [Google Scholar] [CrossRef]
  29. Wu, P.; Zhou, J.; Li, N. Influences of atrium geometry on the lighting and thermal environments in summer: CFD simulation based on-site measurements for validation. Build. Environ. 2021, 197, 107853. [Google Scholar] [CrossRef]
  30. Guo, Y. Research on the Influence Mechanism of Natural Lighting in Atrium Space. Master’s Thesis, Hebei University of Technology, Tianjin, China, 2019. [Google Scholar]
  31. Qiu, W.; Huang, Y. Environmental Energy regulation and cavity integration: Teaching and Research building design of a university’s Nantong Innovation Base. Cent. China Archit. 2023, 41, 51–55. [Google Scholar] [CrossRef]
  32. Gao, Y.; Zhao, S.; Huang, Y.; Pan, H. Multi-Objective Optimization of Daylighting–Thermal Performance in Cold-Region University Library Atriums: A Parametric Design Approach. Energies 2025, 18, 1184. [Google Scholar] [CrossRef]
  33. Zeng, Y.; Sun, H.; Lin, B. Optimized lighting energy consumption for non-visual effects: A case study in office spaces based on field test and simulation. Build. Environ. 2021, 205, 108238. [Google Scholar] [CrossRef]
  34. Jin, L.; Xue, P.; Zhang, L.; Wang, J.; Shi, J.; Liang, Q.; Cao, X.; Xu, N.; Liao, J. Visual and non-visual effects of integrated lighting based on spectral information. Build. Environ. 2023, 242, 110617. [Google Scholar] [CrossRef]
  35. Xu, J.; Li, L.; Zhang, L. Health performance driven classroom integrated light environment simulation evaluation and optimization—A typical middle school classroom in Suzhou as an example. New Archit. 2024, 3, 84–89. [Google Scholar]
  36. Nabil, A.; Mardaljevic, J. Useful daylight illuminances: A replacement for daylight factors. Energy Build. 2006, 38, 905–913. [Google Scholar] [CrossRef]
  37. Carlucci, S.; Causone, F.; De Rosa, F.; Pagliano, L. A review of indices for assessing visual comfort with a view to their use in optimization processes to support building integrated design. Renew. Sustain. Energy Rev. 2015, 47, 1016–1033. [Google Scholar] [CrossRef]
  38. Suk, J.Y. Luminance and vertical eye illuminance thresholds for occupants’ visual comfort in daylit office environments. Build. Environ. 2019, 148, 107–115. [Google Scholar] [CrossRef]
  39. Van den Wymelenberg, K.; Inanici, M. A critical investigation of common lighting design metrics for predicting human visual comfort in offices with daylight. LEUKOS 2014, 10, 145–164. [Google Scholar] [CrossRef]
  40. Tian, Z.; Zhao, Y.; Fang, J.; Kong, Z. A study of daylight glare evaluation with prism daylighting redirecting fenestrations. J. Build. Eng. 2023, 71, 106428. [Google Scholar] [CrossRef]
  41. Gentile, N.; Dubois, M.-C. Field data and simulations to estimate the role of standby energy use of lighting control systems in individual offices. Energy Build. 2017, 155, 390–403. [Google Scholar] [CrossRef]
  42. GB/T 5700-2023; Methods of Lighting Measurement. China Standards Press: Beijing, China, 2023.
  43. ASHRAE Guideline 14-2014; Measurement of Energy, Demand, and Water Savings. ASHRAE: Atlanta, GA, USA, 2014.
  44. Reinhart, C.F.; Andersen, M. Development and validation of a Radiance model for a translucent panel. Energy Build. 2006, 38, 890–904. [Google Scholar] [CrossRef]
  45. Lakhdari, K.; Sriti, L.; Painter, B. Parametric optimization of daylight, thermal and energy performance of middle school classrooms, case of hot and dry regions. Build. Environ. 2021, 204, 108173. [Google Scholar] [CrossRef]
  46. GB 50189-2015; Design Standard for Energy Efficiency of Public Buildings. China Architecture & Building Press: Beijing, China, 2015.
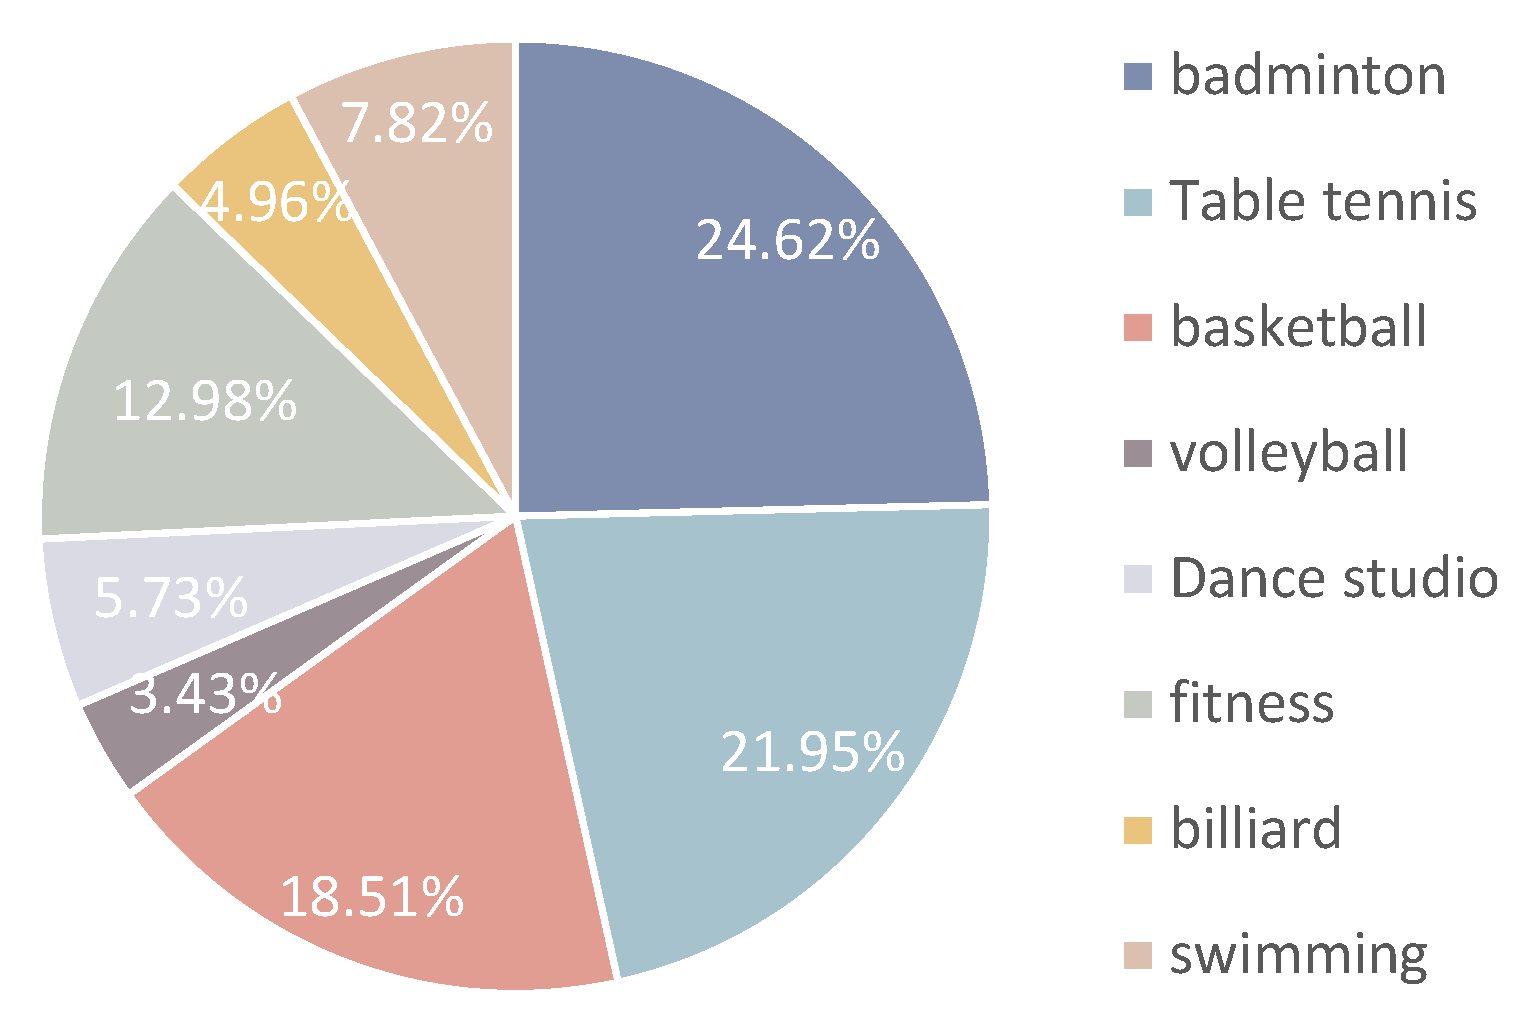
Figure 1. Exercise type preferences of users of sports centers.
Buildings 15 03057 g001
Figure 2. Sports center site dimension statistics.
Buildings 15 03057 g002
Figure 3. Questionnaire flowchart.
Buildings 15 03057 g003
Figure 4. Map of test points at the venue. (a) Table-tennis court. (b) Badminton court.
Buildings 15 03057 g004
Figure 5. Illumination simulation model.
Buildings 15 03057 g005
Figure 6. Fitting curves for built-in cavities with different ARs. (a) Average illuminance. (b) Daylighting uniformity.
Buildings 15 03057 g006
Figure 7. Effect of skin cavity width on the probability of discomfort glare.
Buildings 15 03057 g007
Figure 8. The effect of different skin cavity space patterns on uniformity of daylighting. (a) Standard Overcast Sky. (b) Standard Clear Sky.
Buildings 15 03057 g008
Figure 9. Insert the skin cavity model. (a) Before insertion. (b) After insertion.
Buildings 15 03057 g009
Table 1. A-B judgment matrix.
AkB1B2Bm
B1b11b12b1m
B2b21b22b2m
Bmbm1bm2bmm
Table 3. K value of light climate coefficient.
Photoclimatic ZoneIII
K value0.850.90
Es (lx)18,00016,500
E1 (lx)60005500
Table 4. Comparison of illumination between the measurements and simulations.
TimesMeasured Illuminance DiagramSimulated Illumination Chart
10:00Buildings 15 03057 i001Buildings 15 03057 i002
11:00Buildings 15 03057 i003Buildings 15 03057 i004
12:00Buildings 15 03057 i005Buildings 15 03057 i006
13:00Buildings 15 03057 i007Buildings 15 03057 i008
14:00Buildings 15 03057 i009Buildings 15 03057 i010
Table 5. Partial parameterization of the model.
Number of FloorsτvρpρqρdGcKc
40.70.70.70.50.6250.64
Table 6. Partial simulation data for multiple cavity insertion under different ARs.
AR0%5%2.5% × 21.25% × 48%4% × 22% × 4
36 m × 24 m
Average illuminance (lx)214362507615491576678
Illumination uniformity0.490.560.480.490.60.530.52
UDI74.572.471.870.271.570.068.7
48 m × 32 m
Average illuminance (lx)177312442496450505590
Illumination uniformity0.470.540.450.360.60.460.46
UDI77.676.576.075.475.675.474
54 m × 36 m
Average illuminance (lx)156277417465401481666
Illumination uniformity0.440.50.440.450.60.460.39
UDI77.077.377.37676.577.176.2
Table 7. Simulation of illumination uniformity in Shenyang Sports Center.
TimeBadminton Hall on the Second FloorFitness Center on the Third Floor
Clear Summer Solstice DayOvercast Winter Solstice DayClear Summer Solstice DayOvercast Winter Solstice Day
8:000.33470.13830.34540.1135
10:000.17280.14040.17120.1250
12:000.14130.13820.11230.1244
14:000.18970.13750.15380.1166
16:000.32970.13760.30010.1156
Disclaimer/Publisher’s Note: The statements, opinions and data contained in all publications are solely those of the individual author(s) and contributor(s) and not of MDPI and/or the editor(s). MDPI and/or the editor(s) disclaim responsibility for any injury to people or property resulting from any ideas, methods, instructions or products referred to in the content.